UNITED STATES
SECURITIES AND EXCHANGE COMMISSION
Washington, D.C. 20549
FORM 10-K/A
(Amendment No. 1)
FORM 10-K(Mark One)
☒ ANNUAL REPORT PURSUANT TO SECTION 13 OR 15(d) OF THE SECURITIES EXCHANGE ACT OF 1934
For the fiscal year ended December 31, 2021
Or
☐ TRANSITION REPORT PURSUANT TO SECTION 13 OR 15(d) OF THE SECURITIES EXCHANGE ACT OF 1934
For the transition period from to
Commission File Number 001-37503
B. RILEY FINANCIAL, INC.
(Exact name of registrant as specified in its charter)
| Delaware | 27-0223495 | |
(State or Other Jurisdiction of Incorporation or Organization) | (I.R.S. Employer Identification No.) | |
|
| |
| (Address of | (Zip Code) |
(818) 884-3737
(310) 966-1444
(Registrant’s telephone number, including area code)
Securities registered pursuant to Section 12(b) of the Act: None
| Title of each class | Trading Symbol(s) | Name of each exchange on which registered | ||
| Common Stock, par value $0.0001 per share | RILY | Nasdaq Global Market | ||
| Depositary Shares, each representing a 1/1000th fractional interest in a 6.875% share of Series A Cumulative Perpetual Preferred Stock | RILYP | Nasdaq Global Market | ||
| Depositary Shares, each representing a 1/1000th fractional interest in a 7.375% share of Series B Cumulative Perpetual Preferred Stock | RILYL | Nasdaq Global Market | ||
| 6.50% Senior Notes due 2026 | RILYN | Nasdaq Global Market | ||
| 6.375% Senior Notes due 2025 | RILYM | Nasdaq Global Market | ||
| 6.75% Senior Notes due 2024 | RILYO | Nasdaq Global Market | ||
| 6.00% Senior Notes due 2028 | RILYT | Nasdaq Global Market | ||
| 5.50% Senior Notes due 2026 | RILYK | Nasdaq Global Market | ||
| 5.25% Senior Notes due 2028 | RILYZ | Nasdaq Global Market | ||
| 5.00% Senior Notes due 2026 | RILYG | Nasdaq Global Market |
Securities registered pursuant to Section 12(g) of the Act:
Common Stock, par value $0.0001 per share
(Title of Class)
None
Indicate by check mark if the registrant is a well-known seasoned issuer, as defined in Rule 405 of the Securities Act.
Yes: ☐☒ No ☒☐
Indicate by check mark if the registrant is not required to file reports pursuant to Section 13 or Section 15(d) of the Act.
Yes: ☐ No☒
Indicate by check mark whether the registrantregistrant: (1) has filed all reports required to be filed by Section 13 or 15(d) of the Securities Exchange Act of 1934 during the preceding 12 months (or for such shorter period that the registrant was required to file such reports), and (2) has been subject to such filing requirements for the past 90 days. Yes:Yes ☒ No ☐
Indicate by check mark whether the registrant has submitted electronically and posted on its corporate Website, if any, every Interactive Data File required to be submitted and posted pursuant to Rule 405 of Regulation S-T (§232.405 of this chapter) during the preceding 12 months (or for such shorter period that the registrant was required to submit and post such files). Yes:Yes ☒ No ☐
Indicate by check mark if disclosure of delinquent filers pursuant to Item 405 of Regulation S-K (§ 229.405 of this chapter) is not contained herein, and will not be contained, to the best of registrant’s knowledge, in definitive proxy or information statements incorporated by reference in Part III of this Form 10-K or any amendment to this Form 10-K. ☐
Indicate by check mark whether the registrant is a large accelerated filer, an accelerated filer, a non-accelerated filer, a smaller reporting company or an emerging growth company. See the definitions of “large accelerated filer,”filer”, “accelerated filer,” “smaller reporting company,”company” and “emerging growth company” in Rule 12b-2 of the Exchange Act. (Check one)
| Large accelerated filer | ☒ | Accelerated filer | ☐ |
Non-accelerated filer | ☐ | Smaller reporting company | ☐ |
| Emerging growth company |
If an emerging growth company, indicate by check mark if the registrant has elected not to use the extended transition period for complying with any new or revised financial accounting standards provided pursuant to Section 13(a) of the Exchange Act. ☐
Indicate by check mark whether the registrant has filed a report on and attestation to its management’s assessment of the effectiveness of its internal control over financial reporting under Section 404(b) of the Sarbanes-Oxley Act (15 U.S.C. 7262(b)) by the registered public accounting firm that prepared or issued its audit report. ☒
Indicate by check mark whether the registrant is a shell company (as defined in Rule 12b-2 of the Exchange Act). Yes:Yes ☐ No ☒
The aggregate market value of the registrant’s common stock held by non-affiliates, based on the closing price of the registrant’s common stock as reported on the NASDAQ Global Market on June 30, 2017,2021, the last business day of the registrant’s most recently completed second fiscal quarter, was approximately $326.4$1,499.7 million. For purposes of this calculation, it has been assumed that all shares of the registrant’s common stock held by directors, executive officers and stockholders beneficially owning ten percent or more of the registrant’s common stock are held by affiliates. The treatment of these persons as affiliates for purposes of this calculation is not conclusive as to whether such persons are, in fact, affiliates of the registrant.
The numberAs of May 2, 2022, there were 27,928,234 shares outstanding of the registrant’s common stock, as of March 7, 2018 was 26,634,158.par value $0.0001 per share, outstanding.
DOCUMENTS INCORPORATED BY REFERENCE
Portions of the definitive Proxy Statement relating to the registrant’s 20182022 Annual Meeting of Stockholders are incorporated by reference into Part III of this Annual Report.Report on Form 10-K to the extent stated herein. Such proxy statement will be filed with the Securities and Exchange Commission within 120 days of the registrant’s fiscal year ended December 31, 2021.
EXPLANATORY NOTE
We are filing this amendment to our Annual Report on Form 10-K for the year ended December 31, 2021, as filed with the Securities and Exchange Commission on February 25, 2022 (the “Original Form 10-K”), solely to correct an error in the content of Marcum LLP’s (“Marcum”) Report Of Independent Registered Public Accounting Firm On Internal Control Over Financial Reporting (the “ICFR Opinion”). The ICFR Opinion in the Original Form 10-K inadvertently omitted an explanatory paragraph which should have described the exclusion of National Holdings Corporation from Marcum’s audit of internal control over financial reporting. An ICFR Opinion with the explanatory paragraph is included in the Amended Form 10-K.
B. RILEY FINANCIAL, INC.
INDEX TO ANNUAL REPORT ON FORM 10-K
FOR THE FISCAL YEAR ENDED DECEMBER 31, 20172021
i
PART I
This Annual Report on Form 10-K (this “Annual Report”) contains forward-looking statements regarding our business, financial condition, results of operations and prospects. Words such as “expect,” “anticipate,” “intend,” “plan,” “believe,” “seek,” “may,” “will,” “should,” “could,” “future,” “likely,” “predict,” “project,” “potential,” “continue,” “estimate” and similar expressions are generally intended to identify forward-looking statements but are not exclusive means of identifying forward-looking statements in this Annual Report. You should not place undue reliance on such forward-looking statements, which are based on the information currently available to us and speak only as of the date on which this Annual Report was filed with the Securities and Exchange Commission (the “SEC”). Because these forward-looking statements involve known and unknown risks and uncertainties, there are important factors that could cause actual results, events or developments to differ materially from those expressed or implied by these forward-looking statements, including our plans, objectives, expectations and intentions and other factors discussed in “Part I—Item 1A. Risk Factors” contained in this Annual Report. Risk factors that could cause actual results to differ from those contained in the forward-looking statements include but are not limited to risks related to: volatility in our revenues and results of operations; changing conditions in the financial markets; our ability to generate sufficient revenues to achieve and maintain profitability; the short term nature of our engagements; the accuracy of our estimates and valuations of inventory or assets in “guarantee” based engagements; competition in the asset management business; potential losses related to our auction or liquidation engagements; our dependence on communications, information and other systems and third parties; potential losses related to purchase transactions in our auction and liquidations business; the potential loss of financial institution clients; potential losses from or illiquidity of our proprietary investments; changing economic and market conditions; potential liability and harm to our reputation if we were to provide an inaccurate appraisal or valuation; potential mark-downs in inventory in connection with purchase transactions; failure to successfully compete in any of our segments; loss of key personnel; our ability to borrow under our credit facilities as necessary; failure to comply with the terms of our credit agreements; our ability to meet future capital requirements; our ability to realize the benefits of our completed and proposed acquisitions, including our ability to achieve anticipated opportunities and operating cost savings, and accretion to reported earnings estimated to result from completed and proposed acquisitions in the time frame expected by management or at all; the possibility that our proposed acquisition of magicJack VocalTec Ltd. (“magicJack”) does not close when expected or at all; our ability to promptly and effectively integrate our business with that of magicJack if such transaction closes; the reaction to the magicJack acquisition of our and magicJack’s customers, employees and counterparties; and the diversion of management time on acquisition-related issues. We undertake no obligation to publicly update or revise any forward-looking statements, whether as a result of new information, future events or otherwise.
Except as otherwise required by the context, references in this Annual Report to “the “the Company,” “B. Riley,” “B. Riley Financial,” “we,” “us” or “our” refer to the combined business of B. Riley Financial, Inc. and all of its subsidiaries.
Item 1. BUSINESS
General
B. Riley Financial, Inc. (NASDAQ: RILY) and its subsidiaries provide collaborative(“B. Riley” or the “Company”) is a diversified financial services platform and solutions through several operatingopportunistically invests in companies or assets with attractive risk-adjusted return profiles to benefit its shareholders. Through its affiliated subsidiaries, including:B. Riley provides a full suite of investment banking, corporate finance research, sales, and trading, as well as advisory, valuation, and wealth management, services. The Company’s major business lines include:
| ● | B. Riley |
| ● |
| ● | National Holdings Corporation (“National”), which provides wealth management, brokerage, insurance brokerage, tax preparation and advisory services, was acquired in February 2021. |
| ● | B. Riley Capital Management, |
| that includes B. Riley Asset Management, an advisor to and/or manager of certain private |
| B. Riley |
| ● |
We also pursue a strategy of investing in or acquiring companies which we believe have attractive investment return characteristics. On July 1, 2016, we acquired United Online, Inc. (“UOL”) as part of our principal investment strategy.
| ● | B. Riley Principal Investments, which identifies attractive investment opportunities and seeks to control or influence the operations of our portfolio company investments to deliver financial and operational improvements that will maximize the Company’s free cash flow, and therefore, shareholder returns. The team concentrates on opportunities presented by distressed companies or divisions that exhibit challenging market dynamics. Representative transactions include recapitalization, direct equity investment, debt investment, active minority investment and buyouts. |
| ● | Communications consist of United Online, Inc. (“UOL” or “United Online”), which was acquired in July 2016, magicJack VocalTec Ltd. (“magicJack”), which was acquired in November 2018, a 40% equity interest in Lingo Management, LLC (“Lingo”), which was acquired in November 2020, and a mobile virtual network operator business (“Marconi Wireless”), which was acquired in October 2021. Upon receipt of certain regulatory approvals, the Company has the right to acquire an additional 40% equity interest in Lingo. The following briefly describes each such business: |
| o | UOL is a communications company that offers consumer subscription services and products, consisting of Internet access services and devices under the NetZero and Juno |
| o | magicJack is a Voice over IP (“VoIP”) cloud-based technology and services and wireless mobile communications provider. |
| o | Lingo is a global cloud/UC and managed service provider. |
| o | Marconi Wireless is a mobile virtual network operator business that provides mobile phone voice, text, and data services and devices. |
| ● | BR Brand Holding (“BR Brands”), in which the Company owns a majority interest, provides licensing of certain brand trademarks. BR Brands owns the assets and intellectual property related to licenses of six brands: Catherine Malandrino, English Laundry, Joan Vass, Kensie Girl, Limited Too and Nanette Lepore as well as investments in the |
We are headquartered in Los Angeles with over 44 offices in major cities throughout the United States including New York, Chicago, Boston, Atlanta, Dallas, Memphis, and Metro Washington D.C., West Palm Beach, and Boca Raton.
During the fourth quarter of 2020, the Company realigned its segment reporting structure to reflect organizational management changes. Under the new structure, the valuation and appraisal businesses are reported in the Financial Consulting segment and our bankruptcy, financial advisory, forensic accounting, and real estate consulting businesses that were previously reported in the Capital Markets segment are now reported as part of the Financial Consulting segment. In conjunction with the new reporting structure, the Company recast its segment presentation for all periods presented. During the first quarter of 2021, in connection with the acquisition of National on February 25, 2021, the Company further realigned its segment reporting structure to reflect organizational management changes in the Company’s wealth management business and created a new Wealth Management segment that was previously reported as part of the Capital Markets segment in 2020. In conjunction with the new reporting structures, the Company recast its segment presentation for all periods presented.
For financial reporting purposes, we classify our businesses into foursix operating segments: (i) capital markets,Capital Markets, (ii) auctionWealth Management, (iii) Auction and liquidation, (iii) valuationLiquidation, (iv) Financial Consulting, (v) Principal Investments – Communications, and appraisal and (iv) principal investments - United Online.(vi) Brands.
Capital Markets Segment. Our capital marketsCapital Markets segment provides a full array of investment banking, corporate finance, financial advisory, research, securities lending wealth management,and sales and trading services to corporate, institutional, and high net worthindividual clients. Our corporate finance and investment banking services include merger and acquisitions as well as restructuring advisory services to public and private companies, initial and secondary public offerings, and institutional private placements. In addition, we trade equity securities as a principal for our account, including investments in funds managed by our subsidiaries. Our capital marketsCapital Markets segment also includes our asset management businesses that manage various private and public funds for institutional and individual investors.
Wealth Management Segment. Our Wealth Management segment provides wealth management and tax services to corporate and high net worth clients. We offer comprehensive wealth management services for corporate businesses that include investment strategies, executive services, retirement plans, lending & liquidity resources, and settlement solutions. Our wealth management services for individual client services provide investment management, education planning, retirement planning, risk management, trust coordination, lending & liquidity solutions, legacy planning, and wealth transfer. In addition, we supply market insights to provide unbiased guidance to make important financial decisions. Wealth management resources include market views from our investment strategists and B. Riley Securities’ proprietary equity research.
Auction and Liquidation Segment.Segment. Our auctionAuction and liquidationLiquidation segment utilizes our significant industry experience, a scalable network of independent contractors and industry-specific advisors to tailor our services to the specific needs of a multitude of clients, logistical challenges, and distressed circumstances. Furthermore, ourOur scale and pool of resources allow us to offer our services across North AmericanAmerica as well as parts of Europe, Asia, and Australia. Our auctionAuction and liquidationLiquidation segment operates through two main divisions, retail store liquidations and wholesale and industrial assets dispositions. Our wholesale and industrial assets dispositiondispositions division operates through limited liability companies that are controlled by us.
Valuation and Appraisal Segment.Financial Consulting Segment. Our valuation and appraisalFinancial Consulting segment provides valuation and appraisal services to law firms, corporations, financial institutions, lenders, and private equity firms and other providers of capital.firms. These services primarily include the valuation of assets (i) for purposes of determiningbankruptcy, financial advisory, forensic accounting, litigation support, operations management consulting, real estate consulting, and monitoring the value of collateral securing financial transactions and loan arrangements and (ii) in connection with potential business combinations. Our valuation and appraisal services. Our Financial Consulting segment operates through limited liability companies that are wholly owned or majority owned by us.
Principal Investments - United OnlineCommunications Segment. Our principal investmentsPrincipal Investments - United OnlineCommunications segment consists of businesses which have been acquired primarily for attractive investment return characteristics. Currently, this segment includes, among other investments, UOL, a company that offersthrough which we provide consumer Internet access, magicJack, through which we provide VoIP communication and related product and subscription services, consisting of Internet access under the NetZero and Juno brands. Internet access includes paid dial-up,Marconi Wireless, through which we provide mobile broadband and DSL subscription services. We also offer email, Internet security, web hostingphone services and other services.devices.
Brands Segment. Our Brands segment consists of our brand investment portfolio that is focused on generating revenue through the licensing of trademarks and is held by BR Brands.
Recent Developments
On February 17, 2017,January 19, 2022, we entered intoacquired FocalPoint Securities, LLC, an Agreementindependent investment bank based in Los Angeles. The acquisition is expected to significantly expand B. Riley Securities’ mergers and Planacquisitions (“M&A”) advisory business and enhance its debt capital markets and financial restructuring capabilities. Founded in 2002, FocalPoint specializes in M&A, private capital advisory, financial restructuring, and special situation transactions. The firm includes approximately 50 investment banking professionals with deep industry specialization in high-growth sectors such as aerospace and defense, industrials, business services, consumer, healthcare, and technology/media/telecom. Our acquisition of MergerFocalPoint builds upon the momentum and proven execution capabilities of both firms and is in line with our stated intent to expand capabilities in M&A advisory and fixed income. This combination provides strategic and financial sponsor clients with access to both firms’ proven execution capabilities and a full suite of end-to-end services from a single platform.
On January 30, 2020, the World Health Organization (“WHO”) announced a global health emergency because of a new strain of coronavirus (the “FBR Merger Agreement”“COVID-19 outbreak”) with FBR & Co. (“FBR”), pursuant to which FBR was to merge with and into. In March 2020, the Company (orWHO classified the COVID-19 outbreak as a subsidiarypandemic, based on the rapid increase in exposure globally. During the fourth quarter of 2021, the full impact of the Company),COVID-19 outbreak continued to evolve, with the Company (or its subsidiary) asemergence of variant strains and breakthrough infections becoming prevalent both in the surviving corporation (the “FBR Merger”). On May 1, 2017,U.S. and worldwide. As the CompanyU.S. economy recovers, aided by stimulus packages and FBR filed a registration statement forfiscal and monetary policies, inflation has been rising at historically high rates, and the planned FBR Merger.Federal Reserve has signaled that it will begin increasing the target federal funds effective rate. The shareholdersimpact of the CompanyCOVID-19 outbreak and FBR approvedthese related matters on our results of operations, financial position and cash flows will depend on future developments, including the acquisition on June 1, 2017, customary closing conditions were satisfiedduration and spread of the outbreak and related advisories and restrictions and the acquisition was completed on June 1, 2017. Subject tosuccess of vaccines and natural immunity in controlling the termspandemic. These developments and conditionsthe impact of the FBR Merger Agreement, each outstanding share of FBR common stock (“FBR Common Stock”) was converted intoCOVID-19 outbreak on the right to receive 0.671 of a share of our common stock. The total acquisition consideration for FBR was estimatedfinancial markets and the overall economy continue to be $73.5 million, which includeshighly uncertain and cannot be predicted. If the issuancefinancial markets and/or the overall economy continue to be impacted, our results of approximately 4,831,633 shares of our common stock with an estimated fair value of $71.0 million (based on the closing price of our common stock on June 1, 2017)operations, financial position and restricted stock awards with a fair value of $2.5 million attributable to the service period prior to June 1, 2017. We believe that the acquisition of FBR will allow us to benefit from investment banking, corporate finance, securities lending, research, and sales and trading services provided by FBR and planned synergies from the elimination of duplicate corporate overhead and management functions with us.cash flows may be materially adversely affected.
On May 17, 2017, we entered into a Merger Agreement with Wunderlich Investment Company, Inc., a Delaware corporation (“Wunderlich”), and a Wunderlich Stockholder Representative (the “Stockholder Representative”), collectively (the “Wunderlich Merger Agreement”). Pursuant to the Wunderlich Merger Agreement, customary closing conditions were satisfied and the acquisition was completed on July 3, 2017. We also entered into a registration rights agreement with certain shareholders of Wunderlich (the “Registration Rights Agreement”) on July 3, 2017. The Registration Rights Agreement provides the Wunderlich shareholder signatories with the right to notice of and, subject to certain conditions, the right to register shares of our common stock in certain future registered offerings of shares of our common stock. In connection with the acquisition Wunderlich on July 3, 2017, the total consideration of $65.1 million included $29.7 million of cash and the issuance of approximately 1,974,812 shares of the Company’s common stock with an estimated fair value of $31.5 million and 821,816 newly issued common stock warrants with an estimated fair value of $3.9 million.
On November 9, 2017, the Company entered into an Agreement and Plan of Merger with B. R. Acquisition Ltd., an Israeli corporation and wholly-owned subsidiary of the Company (“Merger Sub”), and magicJack VocalTec Ltd., an Israeli corporation (“magicJack”), pursuant to which Merger Sub will merge with and into magicJack, with magicJack continuing as the surviving corporation and as an indirect subsidiary of the Company. Subject to the terms and conditions of the Agreement and Plan of Merger, each outstanding share of magicJack will be converted into the right to receive $8.71 in cash without interest, representing approximately $143.5 million in aggregate merger consideration. The closing of the transaction is subject to the receipt of certain regulatory approvals, the approval of the magicJack shareholder’s and the satisfaction of other closing conditions. It is anticipated that the acquisition of magicJack will close in the first half of 2018.
During the year ended December 31, 2017, we implemented costs savings measures taking into account the planned synergies as a result of the acquisitions of FBR and Wunderlich which included a reduction in force for some of the corporate executives of FBR and Wunderlich and a restructuring to integrate FBR and Wunderlich’s operations with our operations. These initiatives resulted in restructuring charges of $11.7 million during the year ended December 31, 2017. Restructuring charges included $3.3 million related to severance and accelerated vesting of restricted stock awards to former corporate executives of FBR and Wunderlich and $5.0 million of severance, accelerated vesting of stock awards to employees and $3.4 million of lease loss accruals for the planned consolidation of office space related to operations in the Capital Markets segment.
B. Riley FBRSecurities
Investment Banking and Corporate Finance
B. Riley FBR’sSecurities’ investment banking professionals provide equity and debt capital raising, merger and acquisition, financial advisory and restructuring advisory services to both private and publicly traded companies. Those services include:include follow-on public offerings, debt and equity private placements, debt refinancings,refinancing, corporate debt and equity security repurchases, and buy-side and sell-side representation, divestitures/carveouts, leveraged buyouts, management buyouts, strategic alternatives reviews, fairness opinions, valuations, return-of-capital advisory, hostile/activist advisory, and options trading programs.
Sales, Trading and Corporate Services
Our sales and trading professionals distribute B. Riley Securities’ proprietary equity research products to our institutional investor clients and high net worth individuals. B. Riley FBRSecurities sales and trading also sells the securities of companies in which B. Riley FBRSecurities acts as an underwriter and executes equity trades on behalf of clients. We maintain active trading relationships with substantially all major institutional money managers. Our equity and fixed income traders make markets in approximately 150over 1,000 securities. B. Riley FBRSecurities also conducts securities lending activities which involves the borrowing and lending of equity and fixed income securities. Our corporate services include retail orders, block trades, Rule 144 transactions, cashless exercise of options, and corporate equity repurchase programs.
Equity Research
Our equity research is focused on fundamentals-based research. Our research focuses on an in-depth analysis of earnings, cash flow trends, balance sheet strength, industry outlook, and strength of management that involves extensive meetings with key management, competitors, channel partners and customers. We provide research on all sizes of firms; however, our research primarily focuses on small and mid-cap stocks that are under-followed by Wall Street. Our analysts regularly communicate their findings through Research Updates and daily Morning Notes.
Our research department includes research analysts maintaining coverage on a variety of companies in a variety of industry sectors. Our research department annually organizes non-deal road shows for issuers in our targeted industries. To provide our institutional clients access to management teams of companies
Proprietary Trading
We engage in trading activities for strategic investment purposes (i.e. proprietary trading) utilizing the firm’s capital. Proprietary trading activities include investments in public and private stock and debt securities.
B. Riley Securities is reported in our coverage universe and others, our research department has held 18 consecutive annual institutional investor conferences.
Capital Markets segment for financial reporting purposes.
B. Riley Capital Management
We provide investment management services under our subsidiary, B. Riley Capital Management, LLC, an SEC registered investment advisor. Thewhich is a registered investment advisor that manages one mutual fund and certain other private investment funds, including a fund of funds. All of the funds managed typically invest in both public and private equity and debt. Investors in the various funds include institutional, high net worth, and individual investors. GACP is the general partner of GACP I, L.P. and GACP II, L.P., a direct lending fundfunds managed by WhiteHawk Capital Partners, L.P. pursuant to an investment advisory services agreement, that providesprovide senior secured loans and second lien secured loan facilities to middle market public and private U.S. companies.
Proprietary Trading
We engage in trading activities for strategic investment purposes (i.e. proprietary trading) utilizing the firm’s capital. Proprietary trading activities include investments in public and private stock and debt securities. In 2010, the federal government passed the Dodd-Frank Wall Street Reform and Consumer Protection Act (“Dodd-Frank”). Dodd-Frank significantly restructures and intensifies regulation in the financial services industry and includes a section referred to as the “Volcker Rule”. The Volcker Rule provides for a limitation on proprietary trading and investments by certain bank holding companies. We are not a bank holding company and, as a result, the limitations applicable to bank holding companies regarding proprietary trading and investment in the Volcker Rule do not apply to us.
The business described above for B. Riley FBRCapital Management is reported in our capital marketsCapital Markets segment for financial reporting purposes.
Wunderlich Securities
B. Riley Wealth Management and National
Wealth Management
Wunderlich providesB. Riley Wealth Management and National provide comprehensive wealth management and brokerage services to individuals and families, corporations and non-profit organizations, including qualified retirement plans, trusts, foundations and endowments. Our financial advisors provide a broad range of investments and services to our clients, including financial planning services. Establishedservices, insurance brokerage, and tax preparation.
B. Riley Wealth Management and National are reported in 1996our Wealth Management segment for financial reporting purposes.
B. Riley Advisory Services
Financial Advisory Services
B. Riley Advisory Services provides consulting services to shareholders, creditors and headquartered in Memphis, Tennessee, Wunderlich became a wholly-owned subsidiarycompanies which includes expert witness, bankruptcy, due diligence, financial advisory, forensic accounting, litigation support, and crisis management. These services are primarily composed of the former Glass Ratner business.
The financial advisory services business of B. Riley Financial, Inc., in July 2017 and its operations are includedAdvisory Services compliments the restructuring services provided by B. Riley Securities.
The financial advisory services business of B. Riley Advisory Services is reported in our Financial Consulting segment for financial reporting purposes.
Valuation and Appraisal
Our appraisal teams provide independent appraisals to financial institutions, lenders, private equity firms and other providers of capital markets segment.for estimated liquidation values of assets. These teams include experts specializing in particular industry niches and asset classes. We provide valuation and appraisal services across four general categories:
Great American GroupConsumer and Retail Inventory. Representative types of appraisals and valuations include inventory of specialty apparel retailers, department stores, jewelry retailers, sporting goods retailers, mass and discount merchants, home furnishing retailers and footwear retailers.
Wholesale and Industrial Inventory. Representative types of appraisals and valuations include inventory held by manufacturers or distributors of automotive parts, chemicals, food and beverage products, wine and spirits, building and construction products, industrial products, metals, paper and packaging.
Machinery and Equipment. Representative types of asset appraisals and valuations include a broad range of equipment utilized in manufacturing, construction, transportation and healthcare.
Intangible Assets. Representative types of asset appraisals and valuations include intellectual property, goodwill, brands, logos, trademarks and customer lists.
We provide valuation and appraisal services on a pre-negotiated flat fee basis.
The valuation and appraisal services business of B. Riley Advisory Services described above is reported in our Financial Consulting segment for financial reporting purposes.
Operations Management Services
Our Operations Management Services teams work with companies to fix troubled operations by improving their profitability, cash flow and enterprise value. Focus areas include due diligence, acquisitions, executive management, launch coordination, lean six sigma design and implementation, purchasing and inventory management, and quality systems. These services are reported in our Financial Consulting segment for financial reporting purposes.
B. Riley Retail Solutions
Retail Store Liquidations and Wholesale and Industrial Liquidations
We enable our clients to quickly and efficiently dispose of under-performing assets and generate cash from excess inventory by conducting or assisting in retail store closings, going out of business sales, bankruptcy sales and fixture sales. Financial institution and other capital providers rely on us to maximize recovery rates in distressed asset sales and in retail bankruptcy situations. Additionally, healthy, mature retailers utilize our proven inventory management and strategic disposition solutions, relying on our extensive network of retail professionals, to close unproductive stores and dispose of surplus inventory and fixtures as existing stores are updated.
We often conduct large retail liquidations that entail significant capital requirements through collaborative arrangements with other liquidators. By entering into an agreement with one or more collaborators, we are able to bid on larger engagements that we could not conduct on our own due to the significant capital outlay involved, number of independent contractors required or financial risk associated with the particular engagement. We act as the lead partner in many of the collaborative arrangements that we enter into, meaning that we have primary responsibility for the due diligence, contract negotiation and execution of the engagement.
We design and implement customized disposition programs for our clients seeking to convert excess wholesale and industrial inventory and operational assets into capital. We dispose of a wide array of assets including, among others, equipment related to transportation, heavy mobile construction, energy exploration and services, metal fabrication, food processing, semiconductor fabrication, and distribution services. We manage projects of all sizes and scopes across a variety of asset categories. We believe that our databases of information regarding potential buyers that we have collected from past transactions and engagements, our nationwide name recognition and experience with alternative distribution channels allow us to provide superior wholesale and industrial disposition services.
Great American GroupB. Riley Retail Solutions provides the foregoing services to clients on a guarantee, fee or outright purchase basis.
Guarantee.When providing services on a guarantee basis, we guarantee the client a specific recovery often expressed as a percentage of retail inventory value or wholesale inventory cost or, in the case of machinery or equipment, a set dollar amount. This guarantee is often required to be supported by a letter of credit, a cash deposit or a combination thereof. Cash deposits are typically funded in part with available cash together with short term borrowings under our credit facilities. Often when we provide auction or liquidation services on a guarantee basis, we do so through a collaborative arrangement with other service providers. In this situation, each collaborator agrees to provide a certain percentage of the guaranteed amount to the client through a combination of letters of credit, cash and financing. If we are engaged individually, we receive 100% of the net profit, less debt financing fees, sale related expenses (if any) and any share of the profits due to the client as a result of any profit sharing arrangement entered into based on a pre-negotiated formula. If the engagement was conducted through a collaborative arrangement, the profits or losses are divided among us and our partner or partners as set forth in the agreement governing the collaborative arrangement. If the net sales proceeds after expenses are less than the guarantee, we, together with our partners if the engagement was conducted through a collaborative arrangement, are responsible for the shortfall and will recognize a loss on the engagement.
Fee.Fee. When we provide services on a fee basis, clients pay a pre-negotiated flat fee for the services provided, a percentage of asset sales generated or a combination of both.
Outright Purchase.Purchase. When providing services on an outright purchase basis, we purchase the assets from the client and typically sell them at auction, orderly liquidation, through a third-party broker or, less frequently, as augmented inventory in conjunction with another liquidation that we are conducting. In an outright purchase, we take, together with any collaboration partners, title to the assets and absorb the profit or loss associated with the asset disposition.
The retail store liquidations and wholesale and industrial asset dispositions business of Great American GroupB. Riley Retail Solutions described above is reported in our auctionAuction and liquidationLiquidation segment for financial reporting purposes.
ValuationB. Riley Real Estate
We work with real estate owners and Appraisal
tenants through all stages of the real estate life cycle. Our valuation and appraisal teams provide independent appraisals toreal estate advisors advise companies, financial institutions, lenders, private equity firmsinvestors, family offices and other providersindividuals on real estate projects worldwide.
Acquisitions and Sales
We engage in a variety of capital for estimated liquidation values of assets. These teams include experts specializing in particular industry nichesacquisition strategies, including purchasing real estate and asset classes.mortgages. We provide valuationequity and appraisal services across five general categories:“rescue” capital and participate in joint ventures.
Auctions
As bankruptcy auction professionals, we represent debtors in lease restructuring and renegotiations and the sale of real property.
Consumer
Financial Advisory Services
We represent stakeholders in out-of-court restructurings, loan sales, lease renegotiation and Retail Inventory. Representative types of appraisalsrestructuring, strategic investing and valuations include inventory of specialty apparel retailers, department stores, jewelry retailers, sporting goods retailers, massmanaging difficult refinancing transactions.
Liquidations and discount merchants, home furnishing retailersLoan Sales
We execute real estate liquidations and footwear retailers.
Wholesaleloan sale transactions in various market segments on both the “buy” side and Industrial Inventory. Representative types of appraisalsthe “sell” side.
Principal Investments and valuations include inventory held by manufacturers or distributors of automotive parts, chemicals, foodFinancing
We maintain strategic relationships with institutional investors and beverage products, winehigh net worth clients that are seeking real estate investments that are opportunistic, value-added and spirits, buildingtraditional. Our strategic partners look to us to identify, underwrite, structure and construction products, industrial products, metals, paper and packaging.close these principal investment transactions.
Machinery and Equipment. Representative types of asset appraisals and valuations include a broad range of equipment utilized in manufacturing, construction, transportation and healthcare.
Intangible Assets. Representative types of asset appraisals and valuations include intellectual property, goodwill, brands, logos, trademarks and customer lists.
We provide valuation and appraisalB. Riley Real Estate services on a pre-negotiated flat fee basis.
The valuation and appraisal services business of Great American Group described above is reported in our valuation and appraisalFinancial Consulting segment for financial reporting purposes.
B. Riley Principal Investments
Principal Investments
B. Riley Principal Investments - United Onlineidentifies attractive investment opportunities and seeks to control or influence the operations of our investments to deliver financial and operational improvements to its portfolio companies in order to maximize the Company’s free cash flow, and therefore, shareholder returns. Our team concentrates on opportunities presented by distressed companies or divisions that exhibit challenging market dynamics. Representative transactions include recapitalization, direct equity investment, debt investment, active minority investment and buyouts.
Venture Capital
B. Riley Venture Capital invests in late-stage private growth companies with a path towards public markets. We are not a venture fund; rather, investments are made off-balance sheet and syndicated across our institutional, banking and retail client base.
Communications
We acquired UOL on July 1, 2016 asAs part of our principal investment strategy.communications strategy, we acquired UOL in July 2016; we acquired magicJack in November 2018; we acquired a 40% equity interest in Lingo in November 2020; and we acquired Marconi Wireless in October 2021. Upon receipt of certain regulatory approvals, we have the right with the ability to acquire an additional 40% equity interest in Lingo. UOL’s primary pay service is Internet access, offered under the NetZero and Juno brands. Internet access includes dial-up service, mobile broadband and DSL. magicJack is a VoIP cloud-based technology and services and wireless mobile communications provider and the inventor of the magicJack devices. Lingo is a global cloud/UC and managed service provider. Marconi Wireless is a mobile virtual network operator that provides mobile phone voice, text, and data services and devices.
Internet AccessThe Principal Investment and Venture Capital businesses described above are reported in our Capital Markets segment and our Communications businesses are reported in our Principal Investments – Communications segment for financial reporting purposes.
Brands
Our Internet access services consistbrand investment portfolio focuses on generating revenue through the licensing of dial-up, mobile broadbandtrademarks. The Company holds a majority ownership interest in BR Brands, which owns the assets and intellectual property related to a much lesser extent, DSL services. Our dial-up Internet access services are provided on both a freelicenses of six brands: Catherine Malandrino, English Laundry, Joan Vass, Kensie Girl, Limited Too and pay basis,Nanette Lepore as well as investments in the Hurley and Justice brands with the free services subjectBluestar. The Company intends to hourly and other limitations. Basic pay dial-up Internet access services include accelerated dial-up Internet access and an email account. Our Internet access services are also bundled with additional benefits, including antivirus software and enhanced email storage, although we also offer each of these features and certain other value-added features as stand-alone pay services. We offer mobile broadband devices for sale in connection with our mobile broadband services. We also generate revenuesgrow licensing revenue from the resale of telecommunications to third parties. Over the past several years revenues from paid subscription services have declined year over year as a result of a declinebrand holdings in partnership with Bluestar by leveraging its extensive relationships and strategic partnerships in the numberretail sector. The Company intends to pursue future acquisitions of paid subscribersconsumer brands, intellectual property, trademarks and licenses, and participate in select transactions as an equity owner.
The brand businesses described above are reported in our Brands segment for our services. Management believes the decline in paid subscriber accounts is primarily attributable to the industry trends of consumers switching from dial-up Internet access to high speed Internet access such as cable and DSL. Management expects revenues in the principal investments - United Online segment to continue to decline year over year.financial reporting purposes.
Advertising and other revenue
Customers
Advertising and other revenues are primarily derived from various advertising, marketing and media-related initiatives. The majority of our advertising and other revenues include advertising revenues from search placements, display advertisements and online market research associated with our Internet access and email services.
Customers
We serve retail, corporate, capital provider and individual customers across our services lines. The services provided to these customers were under short-term liquidation contracts that generally do not exceed a period of six months. There were no recurring revenues from year-to-year in connection with the services we performed under these contracts.
B. Riley FBRSecurities
We are engaged by corporate customers, including publicly held and privately owned companies, to provide investment banking, corporate finance,restructuring advisory,research and sales and trading services. We also provide corporate finance, research, wealth management, and sales and trading services to high net worth individuals. We maintain client relationships with companies in the consumer goods, consumerindustrials, energy, financial services, defense, industrialshealthcare, real estate, strategy, and technology industries.
WunderlichB. Riley Capital Management
Investors in the various funds of B. Riley Capital Management include institutional, high net worth, and individual investors.
B. Riley Wealth Management and National
We act as financial wealth management advisors to individuals, families, small businesses, non-profit organizations, and qualified retirement plans. Our investment services are primarily comprised of asset management services to meet the financial plans, financial goals and needs of our customers. We service our customers through a network of 2542 branch offices located in 1614 states primarily located in the Mid-west and Southern section of the United States.
Great American GroupB. Riley Advisory Services
We provide specialty financial advisory services to companies, shareholders, creditors and investors on complex business problems and critical board level agenda items including transaction advisory and due diligence, fraud investigations, corporate litigation, business valuations, crisis management and bankruptcy. We provide bankruptcy and restructuring services, forensic accounting and litigation support, valuation services, and real estate consulting. Additionally, we are engaged by financial institutions, lenders, private equity firms and other capital providers, as well as professional service providers, to provide valuation and appraisal services. We have extensive experience in the appraisal and valuation of retail and consumer inventories, wholesale and industrial inventories, machinery and equipment, intellectual property and real estate.
B. Riley Retail Solutions
Our retail auctionAuction and liquidationLiquidation clients include financially healthy retailers as well as distressed retailers, bankruptcy professionals, financial institution workout groups and a wide range of professional service providers. Some retail segments in which we specialize include apparel, arts and crafts, department stores, discount stores, drug / health and beauty, electronics, footwear, grocery stores, hardware / home improvement, home goods and linens, jewelry, office / party supplies, specialty stores, and sporting goods. We also provide wholesale and industrial auction services and customized disposition programs to a wide range of clients.
B. Riley Real Estate
Our Real Estate clients include real property owners and tenants in a wide variety of sectors and include both healthy and distressed businesses.
B. Riley Principal Investments
B. Riley Principal Investments serves businesses seeking capital investment, including debt or equity financing.
We are engaged by financial institutions, lenders, private equity firms and other capital providers, as well as professional service providers, to provide valuation and advisory services. We have extensive experience in the appraisal and valuation of retail and consumer inventories, wholesale and industrial inventories, machinery and equipment, intellectual property and real estate. We maintain ongoing client relationships with major asset based lenders including Bank of America, JPMorgan Chase, and Wells Fargo.
United Online
Our Internet access services are available to customers, which are primarily comprised of individuals, in more than 12,000 cities across the U.S. and Canada. Generally, our Internet access customers also subscribe to value-added features that include antivirus software and enhanced email storage. Our advertising customers primarily include business customers that market products and services over the Internet.
magicJack
magicJack provides complete phone service for home, enterprise and while traveling for retailers, wholesalers or directly to customer over the period associated with the access right period. The Company provides customers with an ability to make and receive telephone calls through their smart phones, add a second phone number to their smart phone and purchase prepaid minutes to place telephone calls through the magicJack device or mobile apps to locations outside of the U.S. and Canada.
Marconi Wireless
Our mobile phone services and products are available to customers, which are primarily comprised of individuals, located throughout the U.S. The Company obtains the mobile services it provides to customers from a major mobile carrier.
Brands
Our brand investment portfolio focuses on generating revenue through the licensing of trademarks. The Company holds a majority ownership interest in BR Brand, which owns the assets and intellectual property related to licenses of six brands: Catherine Malandrino, English Laundry, Joan Vass, Kensie Girl, Limited Too and Nanette Lepore as well as an investment in the Hurley and Justice Brands with Bluestar Alliance LLC (“Bluestar”). The Company intends to grow licensing revenue from the brand holdings in partnership with Bluestar by leveraging its extensive relationships and strategic partnerships in the retail sector. The Company intends to pursue future acquisitions of consumer brands, intellectual property, trademarks and licenses, and participate in select transactions as an equity owner.
Competition
B. Riley FBRSecurities, B. Riley Capital Management, B. Riley Wealth Management and WunderlichNational, and B. Riley Advisory Services
We face intense competition for our capital marketsCapital Markets services. Since the mid-1990s, there has been substantial consolidation among U.S. and global financial institutions. In particular, a number of large commercial banks, insurance companies and other diversified financial services firms have merged with other financial institutions or have established or acquired broker-dealers. During 2008, the failure or near-collapse of a number of very large financial institutions led to the acquisition of several of the most sizeable U.S. investment banking firms, consolidating the financial industry to an even greater extent. Currently, our competitors are other investment banks, bank holding companies, brokerage firms, merchant banks and financial advisory firms. Our focus on our target industries also subjects us to direct competition from a number of specialty securities firms and smaller investment banking boutiques that specialize in providing services to these industries.
The industry trend toward consolidation has significantly increased the capital base and geographic reach of many of our competitors. Our larger and better-capitalized competitors may be better able than we are to respond to changes in the investment banking industry, to recruit and retain skilled professionals, to finance acquisitions, to fund internal growth and to compete for market share generally. Many of these firms have the ability to offer a wider range of products than we do, including loans, deposit-taking and insurance, in addition to brokerage, asset management and investment banking services, all of which may enhance their competitive position relative to us. These firms also have the ability to support investment banking and securities products with commercial banking, insurance and other financial services revenues in an effort to gain market share, which could result in downward pricing pressure in our businesses. In particular, the trend in the equity underwriting business toward multiple book runners and co-managers has increased the competitive pressure in the investment banking industry and has placed downward pressure on average transaction fees.
As we seek to expand our asset management business, we face competition in the pursuit of investors for our investment funds, in the identification and completion of investments in attractive portfolio companies or securities, and in the recruitment and retention of skilled asset management professionals.
Great American GroupOther Business Lines
We also face intense competition forin our auction and liquidation and valuation and appraisal services.other service areas. While some competitors are unique to specific service offerings, some competitors cross multiple service offerings. A number of companies provide services or products to the auctionRetail Solutions and liquidation and valuation and appraisalreal estate markets, and existing and potential clients can, or will be able to, choose from a variety of qualified service providers. Some of our competitors may even be able to offer discounts or other preferred pricing arrangements. In a cost-sensitive environment, such arrangements may prevent us from acquiring new clients or new engagements with existing clients. Some of our competitors may be able to negotiate secure alliances with clients and affiliates on more favorable terms, devote greater resources to marketing and promotional campaigns or to the development of technology systems than us. In addition, new technologies and the expansion of existing technologies with respect to the online auction business may increase the competitive pressures on us. We must also compete for the services of skilled professionals. There can be no assurance that we will be able to compete successfully against current or future competitors, and competitive pressures we face could harm our business, operating results and financial condition.
We face competition for our retail services from traditional liquidators as well as Internet-based liquidators such as overstock.com and eBay. Our wholesale and industrial services competitors include traditional auctioneers and fixed site auction houses that may specialize in particular industries or geographic regions as well as other large, prestigious or well-recognized auctioneers. We also face competition and pricing pressure from the internal remarketing groups of our clients and potential clients and from companies that may choose to liquidate or auction assets and/or excess inventory without assistance from service providers like us. We face competition for our valuation and appraisal servicesRetail Solutions businesses from large accounting, consulting and other professional service firms as well as other valuation, appraisalfinancial consulting and advisory firms. We face competition for our Real Estate Services from large real estate brokerage and advisory firms.
United Online
The U.S. market for Internet and broadband services is highly competitive. We compete with numerous providers of broadband services, as well as other dial-up Internet access providers. Our principal competitors for broadband services include, among others, local exchange carriers, wireless and satellite service providers, cable service providers, and broadband resellers. These competitors include established providers such as AT&T, Verizon, Sprint and T-Mobile. Our principal dial-up Internet access competitors include established online service and content providers, such as AOL and MSN, and independent national Internet service providers, such as EarthLink. We believe the primary competitive factors in the Internet access industry are speed, price, coverage area, ease of use, scope of services, quality of service, and features. Our dial-up Internet access services do not compete favorably with broadband services with respect to certain of these factors, including, but not limited to, speed.
magicJack and Marconi Wireless
The principal competitors for our products and services include the traditional telephone service providers, such as AT&T, Inc., CenturyLink, Inc. and Verizon Communications Inc., which provide telephone service using the public switched telephone network. Certain of these traditional providers have also added, or are planning to add, broadband telephone services to their existing telephone and broadband offerings. We also face, or expect to face, competition from cable companies, such as Cablevision Systems Corp., Charter Communications, Inc., Comcast Corporation, Cox Communications, Inc. and Time Warner Cable (a division of Time Warner Inc.), which offer broadband telephone services to their existing cable television and broadband offerings. Further, wireless providers, including AT&T Mobility, Inc., Sprint Corporation, T-Mobile USA Inc., and Verizon Wireless, Inc. offer services that some customers may prefer over wireline-based service. In the future, as wireless companies offer more minutes at lower prices, their services may become more attractive to customers as a replacement for broadband or wireline-based phone service.
We face competition on magicJack device sales from Apple, Samsung, Motorola and other manufacturers of smart phones, tablets and other handheld wireless devices. Also, we compete against established alternative voice communication providers, such as Vonage, Google Voice, Ooma, and Skype, which is another non-interconnected voice provider, and may face competition from other large, well-capitalized Internet companies. In addition, we compete with independent broadband telephone service providers.
Brands
Our brand investment portfolio competes with companies that own other brands and trademarks, as these companies could enter into similar licensing arrangements with retailers and wholesalers in the United States and internationally. These arrangements could be with our existing retail and wholesale partners, thereby competing with us for consumer attention and limited floor or rack space in the same stores in which our branded products are sold and vying with us for the time and resources of the retailers and wholesale licensees that manufacture and distribute our products. These companies may be able to respond more quickly to changes in retailer, wholesaler and consumer preferences and devote greater resources to brand acquisition, development and marketing. We may not be able to compete effectively against these companies.
Regulation
As a participant in the financial services industry, we are subject to complex and extensive regulation of most aspects of our business by U.S. federal and state regulatory agencies, self-regulatory organizations and securities exchanges. The laws, rules and regulations comprising the regulatory framework are constantly changing, as are the interpretation and enforcement of existing laws, rules and regulations. The effect of any such changes cannot be predicted and may direct the manner of our operations and affect our profitability.
Our broker-dealer subsidiaries are subject to regulations governing every aspect of the securities business, including the execution of securities transactions; capital requirements; record-keeping and reporting procedures; relationships with customers, including the handling of cash and margin accounts; the experience of and training requirements for certain employees; and business interactions with firms that are not members of regulatory bodies.
Our broker-dealer subsidiaries are registered with the SEC and are members of FINRA. FINRA is a self-regulatory body composed of members such as our broker-dealer subsidiaries that have agreed to abide by the rules and regulations of FINRA. FINRA may expel, fine and otherwise discipline member firms and their employees. Our broker-dealer subsidiaries are licensed as broker-dealers in all 50 states in the U.S., requiring us to comply with the laws, rules and regulations of each such state. Each state may revoke the license to conduct securities business, fine and otherwise discipline broker-dealers and their employees. We are also registered with NASDAQ and must comply with its applicable rules.
Our broker-dealer subsidiaries are also subject to the SEC’s Uniform Net Capital Rule, Rule 15c3-1, which may limit our ability to make withdrawals of capital from our broker-dealer subsidiaries. The Uniform Net Capital Rule sets the minimum level of net capital a broker-dealer must maintain and also requires that a portion of its assets be relatively liquid. In addition, our broker-dealer subsidiaries are subject to certain notification requirements related to withdrawals of excess net capital.
We are also subject to the USA PATRIOT Act of 2001 (the Patriot Act), which imposes obligations regarding the prevention and detection of money-laundering activities, including the establishment of customer due diligence and customer verification, and other compliance policies and procedures. The conduct of research analysts is also the subject of rule-making by the SEC, FINRA and the federal government through the Sarbanes-Oxley Act. These regulations require certain disclosures by, and restrict the activities of, research analysts and broker-dealers, among others. Failure to comply with these requirements may result in monetary, regulatory and, in the case of the USA Patriot Act, criminal penalties.
Our asset management subsidiaries, B. Riley Capital Management, LLC and B. Riley Wealth Management, are SEC-registered investment advisers, and accordingly subject to regulation by the SEC. Requirements under the Investment Advisors Act of 1940 include record-keeping, advertising and operating requirements, and prohibitions on fraudulent activities.
We are subject to federal and state consumer protection laws, including regulations prohibiting unfair and deceptive trade practices. In addition, numerous states and municipalities regulate the conduct of auctions and the liability of auctioneers. We and/or our auctioneers are licensed or bonded in the following states where we conduct, or have conducted, retail, wholesale or industrial asset auctions: California, Florida, Georgia, Illinois, Massachusetts, Ohio, South Carolina, Texas, Virginia and Washington. In addition, we are licensed or obtain permits in cities and/or counties where we conduct auctions, as required. If we conduct an auction in a state where we are not licensed or where reciprocity laws do not exist, we will work with an auctioneer of record in such state.
As We and/or our real estate professionals are licensed in Illinois, California, Florida and Georgia. When we conduct real estate activities that require licensure in a participant in the financial services industry,state where we are subject to complex and extensive regulationnot licensed or where reciprocity laws do not exist, we will work with a broker of most aspects of our business by U.S. federal and state regulatory agencies, self-regulatory organizations and securities exchanges. The laws, rules and regulations comprising the regulatory framework are constantly changing, as are the interpretation and enforcement of existing laws, rules and regulations. The effect of anyrecord in such changes cannot be predicted and may direct the manner of our operations and affect our profitability.state.
B. Riley FBR and Wunderlich, our broker-dealer subsidiaries, are subject to regulations governing every aspect of the securities business, including the execution of securities transactions; capital requirements; record-keeping and reporting procedures; relationships with customers, including the handling of cash and margin accounts; the experience of and training requirements for certain employees; and business interactions with firms that are not members of regulatory bodies.
B. Riley FBR and Wunderlich are registered as securities broker-dealers with the SEC and are members of FINRA. FINRA is a self-regulatory body composed of members such as our broker-dealer subsidiary that have agreed to abide by the rules and regulations of FINRA. FINRA may expel, fine and otherwise discipline member firms and their employees. B. Riley FBR and Wunderlich are licensed as broker-dealers in 50 states in the U.S., requiring us to comply with the laws, rules and regulations of each such state. Each state may revoke the license to conduct securities business, fine and otherwise discipline broker-dealers and their employees. We are also registered with NASDAQ and must comply with its applicable rules.
B. Riley FBR and Wunderlich are also subject to the SEC’s Uniform Net Capital Rule, Rule 15c3-1, which may limit our ability to make withdrawals of capital from our broker-dealer subsidiaries. The Uniform Net Capital Rule sets the minimum level of net capital a broker-dealer must maintain and also requires that a portion of its assets be relatively liquid. In addition, B. Riley FBR and Wunderlich are subject to certain notification requirements related to withdrawals of excess net capital.
We are also subject to the USA PATRIOT Act of 2001 (the Patriot Act), which imposes obligations regarding the prevention and detection of money-laundering activities, including the establishment of customer due diligence and customer verification, and other compliance policies and procedures. The conduct of research analysts is also the subject of rule-making by the SEC, FINRA and the federal government through the Sarbanes-Oxley Act. These regulations require certain disclosures by, and restrict the activities of, research analysts and broker-dealers, among others. Failure to comply with these requirements may result in monetary, regulatory and, in the case of the USA Patriot Act, criminal penalties.
Our asset management subsidiaries, B. Riley Capital Management, LLC and Wunderlich are SEC-registered investment advisers, and accordingly subject to regulation by the SEC. Requirements under the Investment Advisors Act of 1940 include record-keeping, advertising and operating requirements, and prohibitions on fraudulent activities.
Various regulators, including the SEC, FINRA and state securities regulators and attorneys general, are conducting both targeted and industry-wide investigations of certain practices relating to the financial services industry, including marketing, sales practices, valuation practices, asset managers, and market and compensation arrangements. These investigations, which have been highly publicized, have involved mutual fund companies, broker-dealers, hedge funds, investors and others.
In addition, the SEC staff has conducted studies with respect to soft dollar practices in the brokerage and asset management industries and proposed interpretive guidance regarding the scope of permitted brokerage and research services in connection with soft dollar practices
In July 2010, Congress enacted Dodd-Frank. Dodd-Frank institutes a wide range of reforms that will impact financial services firms and requires significant rule-making. In addition, the legislation mandates multiple studies, which could result in additional legislative or regulatory action. Many of the provisions of Dodd-Frank are subject to further rulemaking procedures and studies and will take effect over several years. As a result, we cannot assess the impact of these new legislative and regulatory changes on our business at the present time.
UOL is subject to a number of international, federal, state, and local laws and regulations, including, without limitation, those relating to taxation, bulk email or “spam,” advertising, user privacy and data protection, consumer protection, antitrust, export, and unclaimed property. In addition, proposed laws and regulations relating to some or all of the foregoing, as well as to other areas affecting our businesses, are continuously debated and considered for adoption in the U.S. and other countries, and such laws and regulations could be adopted in the future. For additional information, see “Risk Factors,” which appears in Item 1A of this Annual Report on Form 10-K.
Employees
magicJack provides broadband telephone services using VoIP technology as well as resells mobile services. In the United States, the Federal Communications Commission (“FCC” or the “Commission”) has asserted limited statutory jurisdiction and regulatory authority over the operations and offerings of providers of broadband telephone services, such as magicJack that offer non-interconnected VoIP services. The scope of the FCC regulations applicable to magicJack’s broadband telephone operations and resold mobile services may change. Some of magicJack’s operations are also subject to regulation by state public utility commissions.
Human Capital
As of December 31, 2017,2021, we had 8331,406 full time employees. Weemployees who comprise a diverse team, including seasoned experts in our various lines of business. Since our inception, our human capital focus has been to gather top talent, with the expertise to lead in every sector, creating a group of collaborative, innovative and independent thinkers who adopt a unique approach to serving our clients and customers. Management appreciates, and never takes for granted, that without the expertise and dedication of our talented professionals, our firm would cease to exist. In that regard, we are not a partydedicated to any collective bargaining agreements.our people above all else. We have never experiencedmade a commitment to provide the direction, support and resources needed for our team members to succeed both professionally and personally.
An entrepreneurial spirit is the epitome of the B. Riley culture. We thrive in a collaborative environment and our culture is one that empowers the individual to grow and succeed through mentorship and that celebrates successes. We work stoppage or striketo attract talent that will mesh with our entrepreneurial, collaborative, and fast-passed environment. Junior staff members have a unique opportunity to learn at a rapid pace from accessible leaders who are all recognized experts across several practices and sectors.
In 2019, we launched our Ambassador program to help build intra and inter-organizational relationships, facilitate collaborative knowledge sharing, and to identify and support emerging leaders. Each of our major functional groups hand-pick rising stars to serve as the “face” of that group. Ambassadors are selected based on their demonstration that they are highly motivated for growth at the firm. This leadership development program is one example of how we work to provide development opportunities to our employees and expand their networks within the B. Riley platform.
We strive to attract a diverse group of candidates within our firm and support the expansion of diversity within the industries in which we operate. By participating in targeted job fairs and similar events we seek out diverse talent to recruit to our firm. We partner with a nonprofit foundation to develop industry education programs that support developing diverse leaders as they prepare to embark upon their careers, and we look forward to expanding our efforts.
We offer competitive compensation and benefits to support our employees’ wellbeing and reward strong performance. Our pay for performance compensation philosophy is designed to reward employees for achievement and to align employee interests with the firm’s long-term growth. Our benefits program includes healthcare, wellness initiatives, retirement offerings, paid time off and flexible leave arrangements. We also offer all employees access to our employee assistance program, and support flexible employment arrangements, such as remote work that empower individuals to pursue a work/life balance model that provides personal flexibility while supporting high level of productivity and client service.
Workplace health and safety is a vital aspect of running our business. We believe that relations withsafety must always be an integral part of any function or service performed, and the protection of our employees, are good.
Acquisition of MK Capital
On February 2, 2015,visitors and event attendees is our utmost priority. We have a business continuity plan in place that allow us to respond to threats to our health and safety, while ensuring that we completedcan continue to provide quality service to our clients and shareholders at all times. During the purchase of allCOVID-19 pandemic that began in early 2020, we adopted a work-from-home policy for our professionals designed to safeguard our employees’ health and safety without a disruption to client service, which has, periodically, required personnel to work from home during acute phases of the membership interests ofMK Capital Advisors, LLC (“MK Capital”),pandemic, and has otherwise permitted a wealth management business with operations primarily in New York, pursuantvoluntary return to a purchase agreement we entered into with MK Capitalthe office based on January 2, 2015. The aggregate purchase price forlocal conditions. We continuously monitor the acquisition, including contingent consideration paid in February 2016 and February 2017 upon the satisfaction of certain conditions, was $5.0 million in cash and 666,666 shares of our common stock. We subsequently changed the name of MK Capital to B. Riley Wealth Management.
Acquisition of FBR
On June 1, 2017, we acquired allevolution of the outstanding common stock ofFBR, a mid-sized investment bank with operations primarily in Washington D.C and New York, pursuant to the FBR Merger Agreement dated February 17, 2017. The aggregate purchase price for the acquisition was $73.5 million in a stock transaction through the issuance of 4,831,633 shares ofCOVID-19 pandemic as it affects our common stock. The acquisition of FBR is accounted for using the purchase method of accounting. The Company believes that the acquisition of FBR will allow the Company to benefit from investment banking, corporate finance, securities lending, research, and sales and trading services provided by FBR and planned synergies from the elimination of duplicate corporate overhead and management functions with the Company. Upon completion of the acquisition, we integrated and merged the investment banking operations of BRC with and into FBR and changed the name of FBR to B. Riley FBR in the fourth quarter of 2017. In connection with the acquisition and integration of these operations we recorded a restructuring charge of $9.7 million during the year ended December 31, 2017.personnel.
Acquisition of WunderlichAvailable Information
On May 17, 2017, the Company entered into a Merger Agreement (the “Wunderlich Merger Agreement”) with Wunderlich, a Delaware Corporation. Pursuant to the Wunderlich Merger Agreement, customary closing conditions were satisfied and the acquisition was completed on July 3, 2017. In connection with the Wunderlich acquisition on July 3, 2017, the total consideration of $65,118 paid to Wunderlich shareholders was comprised of (a) cash in the amount of $29,737; (b) 1,974,812 newly issued shares of the Company’s common stock at closing which were valued at $31,495 for accounting purposes determined based on the closing market price of the Company’s shares of common stock on the acquisition date on July 3, 2017; and (c) 821,816 newly issued common stock warrants with an estimated fair value of $3,886. The common stock and common stock warrants issued includes 387,365 common shares and 167,352 common stock warrants that are held in escrow and subject to forfeiture to indemnify the Company for certain representations and warranties in connection with the acquisition. The Company believes that the acquisition of Wunderlich will allow the Company to benefit from wealth management, investment banking, corporate finance, and sales and trading services provided by Wunderlich. The acquisition of Wunderlich is accounted for using the purchase method of accounting. The Company also entered into a registration rights agreement with certain shareholders of Wunderlich (the “Registration Rights Agreement”) on July 3, 2017 for the shares issued in connection with the Wunderlich Merger Agreement. The Registration Rights Agreement provides the Wunderlich shareholders with the right to notice of and, subject to certain conditions, the right to register shares of the Company’s common stock in certain future registered offerings of shares of the Company’s common stock. In connection with the acquisition of Wunderlich we recorded a restructuring charge of $1.5 million during the year ended December 31, 2017.
Other
We were incorporated in Delaware in May 2009 as a subsidiary of Alternative Asset Management Acquisition Corp. (“AAMAC”). On July 31, 2009, we closed a transaction pursuant to which (i) the members of Great American Group, LLC contributed to us all of their membership interests in Great American Group, LLC, and (ii) AAMAC merged with and into our wholly-owned subsidiary. As a result of such transactions, Great American Group, LLC and AAMAC became our wholly-owned subsidiaries. Following the acquisition of B. Riley and Co. Inc. in June 2014, we changed our name from Great American Group, Inc. to B. Riley Financial, Inc. in November 2014.
Available Information
2009. We maintain a website atwww.brileyfin.com. We file reports with the SEC, and make available, free of charge,The information on or through our website ouris not a part of, or incorporated in, this Annual Report. We file annual reports on Form 10-K, quarterly reports on Form 10-Q, current reports on Form 8-K, proxy and information statements, among other reports and filings, with the SEC, and make available, free of charge, on or through our website, such reports and filings and amendments to those reportsthereto filed or furnished pursuant to Section 13(a) or 15(d) of the Securities Exchange Act of 1934, as amended (the “Exchange Act”), as soon as reasonably practicable after we electronically file such material with, or furnish it to, the SEC. The informationpublic may obtain copies of these reports and filings and any amendments thereto at the SEC’s Internet site, www.sec.gov. Our Board has adopted a Code of Business Conduct and Ethics that applies to all of our directors, officers and employees. The Code of Business Conduct and Ethics is available for review on our website is not a partat http://ir.brileyfin.com/corporate-governance. Each of our directors, employees and officers, including our Chief Executive Officer, Chief Financial Officer and Chief Accounting Officer, and all of our other principal executive officers, are required to comply with the Code of Business Conduct and Ethics. Any changes to or incorporated in, this Annual Report.waiver of our Code of Business Conduct and Ethics for senior financial officers, executive officers or Directors will be posted on that website.
Item 1A. RISK FACTORSRisk Factors.
Given the nature of our operations and services we provide, and as described in more detail below, a wide range of factors could materially affect our operations and profitability. Changes in competitive, market and economic conditions also affect our operations. The risks and uncertainties described below are not the only risks and uncertainties facing us. Additional risks and uncertainties not presently known or that are currently considered to be immaterial may also materially and adversely affect our business operations or stock price. If any
Summary Risk Factors
Some of the following risks or uncertainties occurs,factors that could materially and adversely affect our business, financial condition, or operating results could materially suffer.of operations and cash flows include, but are not limited to, the following:
| ● | Our revenues and results of operations are volatile and difficult to predict. |
| ● | Conditions in the financial markets and general economic conditions, including the ongoing COVID-19 pandemic, have impacted and may continue to impact our ability to generate business and revenues, which may cause significant fluctuations in our stock price. |
| ● | Climate change could have a material negative impact on us and our customers and counterparties. |
| ● | Our exposure to legal liability is significant and could lead to substantial damages. |
| ● | Financial services firms have been subject to increased scrutiny over the last several years, increasing the risk of financial liability and reputational harm resulting from adverse regulatory actions. |
| ● | Our failure to maintain effective internal control over financial reporting in accordance with Section 404 of the Sarbanes-Oxley Act could have a material adverse effect on our financial condition, results of operations and business and the price of our common stock and other securities. |
| ● | We may enter into new lines of business, make strategic investments or acquisitions or enter into joint ventures, each of which may result in additional risks and uncertainties for our business. |
| ● | Our corporate finance and strategic advisory engagements are singular in nature and do not generally provide for subsequent engagements. |
| ● | We have made and may make principal investments in relatively high-risk, illiquid assets that often have significantly leveraged capital structures, and we may fail to realize any profits from these activities for a considerable period of time or lose some or all of the principal amount we invest in these activities. |
| ● | We are exposed to credit risk from a variety of our activities, including loans, lines of credit, guarantees and backstop commitments, and we may not be able to fully realize the value of the collateral securing certain of our loans. |
| ● | We may incur losses as a result of “guarantee” based engagements that we enter into in connection with our auction and liquidation solutions business. |
| ● | We depend on financial institutions as primary clients for our financial consulting business. Consequently, the loss of any financial institutions as clients may have an adverse impact on our business. |
| ● | The asset management business is intensely competitive. |
| ● | Poor investment performance may decrease assets under management and reduce revenues from and the profitability of our asset management business. |
| ● | Our communications businesses compete against large companies, many of whom have significantly more financial and marketing resources, and our business will suffer if we are unable to compete successfully. |
| ● | Dial-up and DSL pay accounts may decline faster than expected and adversely impact our business. |
| ● | The failure of our licensees to sell products that generate royalties to us, to pay us royalties pursuant to their license agreements with us, or to renew these agreements could negatively affect our results of operations and financial condition. |
| ● | We operate in highly competitive industries. Some of our competitors may have certain competitive advantages, which may cause us to be unable to effectively compete with or gain market share from our competitors. |
| ● | Security breaches and other disruptions could compromise our information and expose us to liability, which would cause our business and reputation to suffer. |
| ● | Anti-takeover provisions under our charter documents and Delaware law could delay or prevent a change of control and could also limit the market price of our stock. |
| ● | Because of their significant stock ownership, some of our existing stockholders will be able to exert control over us and our significant corporate decisions. |
| ● | Our common stock price may fluctuate substantially, and your investment could suffer a decline in value. |
| ● | We may not pay dividends regularly or at all in the future. |
| ● | Our level of indebtedness, and restrictions under such indebtedness, could adversely affect our operations and liquidity. |
Risks Related to Global and Economic Conditions
Our revenues and results of operations are volatile and difficult to predict.
Our revenues and results of operations fluctuate significantly from quarter to quarter, due to a number of factors. These factors include, but are not limited to, the following:
| ● | Our ability to attract new clients and obtain additional business from our existing client base; |
| ● | The number, size and timing of mergers and acquisition transactions, capital raising transactions and other strategic advisory services where we act as an adviser on our |
| ● | The extent to which we acquire assets for resale, or guarantee a minimum return thereon, and our ability to resell those assets at favorable prices; |
| ● | Variability in the mix of revenues from the |
| ● | The rate of decline we experience from our dial-up and DSL Internet access pay accounts in our UOL business as customers continue to migrate to broadband access which provides faster Internet connection and download speeds offered by our competitors; |
| ● | The rate of growth of new service areas; |
| ● | The types of fees we charge clients, or other financial arrangements we enter into with clients; and |
| ● | Changes in general economic and market |
We have limited or no control over some of the factors set forth above and, as a result, may be unable to forecast our revenues accurately. For example, our investment banking revenues are typically earned upon the successful completion of a transaction, the timing of which is uncertain and beyond our control. A client’s acquisition transaction may be delayed or terminated because of a failure to agree upon final terms with the counterparty, failure to obtain necessary regulatory consents or board or stockholder approvals, failure to secure necessary financing, adverse market conditions or unexpected financial or other problems in the business of a client or a counterparty. If the parties fail to complete a transaction on which we are advising or an offering in which we are participating, we will earn little or no revenue from the contemplated transaction.
We rely on projections of revenues in developing our operating plans for the future and will base our expectations regarding expenses on these projections and plans. If we inaccurately forecast revenues and/or earnings, or fail to accurately project expenses, we may be unable to adjust our spending in a timely manner to compensate for these inaccuracies and, as a result, may suffer operating losses and such losses could have a negative impact on our financial condition and results of operations. If, for any reason, we fail to meet company, investor or analyst projections of revenue, growth or earnings, the market price of the common stock could decline and you may lose all or part of your investment.
Conditions in the financial markets and general economic conditions, including the ongoing COVID-19 pandemic, have impacted and may continue to impact our ability to generate business and revenues, which may cause significant fluctuations in our stock price.
Our business has in the past, and may in the future, be materially affected by conditions in the financial market and general economic conditions, such as the level and volatility of interest rates, investor sentiment, the availability and the cost of credit, the U.S. mortgage market, the U.S. real estate market, volatile energy prices, consumer confidence, unemployment, and geopolitical issues. Further, certain aspects of our business are cyclical in nature and changes in the current economic environment may require us to adjust our sales and marketing practices and react to different business opportunities and modes of competition. If we are not successful in reacting to changing economic conditions, we may lose business opportunities which could harm our financial condition. For example, we are more likely to conduct auctions and liquidations in connection with insolvencies and store closures during periods of economic downturn relative to periods of economic expansion. Conversely, during an economic downturn, financial institutions that provide asset-based loans typically reduce the number of loans made, which reduces their need for our valuation and appraisal services.
In addition, weakness or disruption in equity markets and diminished trading volume of securities could adversely impact our sales and trading business in the future. Any industry-wide declines in the size and number of underwritings and mergers and acquisitions transactions could also have an adverse effect on our investment banking revenues. Reductions in the trading prices for equity securities tend to reduce the transaction value of investment banking transactions, such as underwriting and mergers and acquisitions transactions, which in turn may reduce the fees we earn from these transactions. Market conditions may also affect the level and volatility of securities prices and the liquidity and value of investments in our funds and proprietary inventory, and we may not be able to manage our business’s exposure to these market conditions. In addition to these factors, deterioration in the financial markets or economic conditions could materially affect our investment banking business in other ways, including the following:
| ● | Our opportunity to act as underwriter or placement agent could be adversely affected by a reduction in the number and size of capital raising transactions or by competing |
| ● | The number and size of mergers and acquisitions transactions or other strategic advisory services where we act as adviser could be adversely affected by continued uncertainties in valuations related to asset quality and creditworthiness, volatility in the equity markets, and diminished access to financing. |
| ● | Market volatility could lead to a decline in the volume of transactions that we execute for our customers and, therefore, to a decline in the revenue we receive from commissions and spreads. |
| ● | We may experience losses in securities trading activities, or as a result of write-downs in the value of securities that we own, as a result of deteriorations in the businesses or creditworthiness of the issuers of such securities. |
| ● | We may experience losses or write downs in the realizable value of our proprietary investments due to the inability of companies we invest in to repay their borrowings. |
| ● | Our access to liquidity and the capital markets could be limited, preventing us from making proprietary investments and restricting our sales and trading businesses. |
| ● | We may incur unexpected costs or losses as a result of the bankruptcy or other failure of companies for which we have performed investment banking services to honor ongoing obligations such as indemnification or expense reimbursement agreements. |
| ● | Sudden sharp declines in market values of securities can result in illiquid markets and the failure of counterparties to perform their obligations, which could make it difficult for us to sell securities, hedge securities positions, and invest funds under management. |
| ● | As an introducing broker to clearing firms, we are responsible to the clearing firm and could be held liable for the defaults of our customers, including losses incurred as the result of a customer’s failure to meet a margin call. When we allow customers to purchase securities on margin, we are subject to risks inherent in extending credit. This risk increases when a market is rapidly declining and the value of the collateral held falls below the amount of a customer’s indebtedness. If a customer’s account is liquidated as the result of a margin call, we are liable to our clearing firm for any deficiency. |
| ● | Competition in our investment banking, sales, and trading businesses could intensify as a result of the increasing pressures on financial services companies and larger firms competing for transactions and business that historically would have been too small for them to consider. |
| ● | Market volatility could result in lower prices for securities, which may result in reduced management fees calculated as a percentage of assets under management. |
| ● | Market declines could increase claims and litigation, including arbitration claims from customers. |
| ● | Our industry could face increased regulation as a result of legislative or regulatory initiatives. Compliance with such regulation may increase our costs and limit our ability to pursue business opportunities. |
| ● | Government intervention may not succeed in improving the financial and credit markets and may have negative consequences for our business. |
It is difficult to predict how long the current financial market and economic conditions related to the ongoing COVID-19 pandemic will continue, whether they will further deteriorate and if they do, which of our business lines will be adversely affected. If one or moreWe are currently being impacted by the ongoing COVID-19 pandemic, including with respect to the above-described risks. While we are continuing to monitor the spread of COVID-19 and related risks, the rapid development and fluidity of situation precludes any prediction as to its ultimate impact on us. However, if the spread continues, such impact could grow and our business, financial condition, results of operations and cash flows could be materially adversely affected.
Global economic and political uncertainty, including as a result of COVID-19 pandemic, could adversely affect our revenue and results of operations.
As a result of the foregoinginternational nature of our business, we are subject to the risks occurs,arising from adverse changes in global economic and political conditions. Uncertainty about the effects of current and future economic and political conditions, including acts of war, aggression or terrorism, on us, our revenuescustomers, suppliers and partners makes it difficult for us to forecast operating results and to make decisions about future investments. Deterioration in economic conditions in any of the countries in which we do business could result in reductions in sales of our products and services and could cause slower or impaired collections on accounts receivable, which may adversely impact our liquidity and financial condition.
The ongoing COVID-19 pandemic has caused severe disruptions in the U.S. and global economies, which has impacted the business, activities, and operations of our customers, as well as our business and operations. Through 2021, the U.S. and other economies have been impacted by supply chain disruptions, labor shortages and high inflation, and in late 2021 the Federal Reserve signaled that it will likely begin increasing the target range for the federal funds rate in response to the increasing inflation. While many of the restrictions on commercial activity and public gatherings and events that characterized the earlier stages of the pandemic have been lifted or are winding down, there can be no assurances that there will not be additional quarantines, business shutdowns, and reduction in business activity and financial transactions as a result of a resurgence in the virus or new variants. The return of unfavorable economic conditions may also make it more difficult for us to access the capital markets, use the capital markets for our clients or otherwise obtain additional financing.
The continuation of the COVID-19 pandemic, or a significant outbreak of another contagious disease or other severe public health crisis, could negatively impact the availability of key personnel necessary to conduct our business, and the business and operations of our third-party service providers who perform critical services for our business. Pandemics, epidemics, future highly infectious or contagious diseases, or other severe public health crisis could cause a material adverse effect on our business, financial condition, results of operations and cash flow. Among the factors outside our control that are likely to decline and, if we were unable to reduce expenses ataffect the same pace,impact the COVID-19 pandemic will ultimately have on our profit margins could erode.business are:
| ● | the pandemic’s course and severity; |
| ● | the direct and indirect results of the pandemic, such as recessionary economic trends, including with respect to employment, wages and benefits and commercial activity; |
| ● | political, legal and regulatory actions and policies in response to the pandemic, including the effects of restrictions on commerce or other public activities, moratoria and other suspensions of evictions or rent and related obligations; |
| ● | the timing, magnitude and effect of any continued or additional public spending, directly or through subsidies, or the winding-down of the same, and the resultant direct and indirect effects on commercial activity and incentives of employers and individuals to resume or increase employment, wages and benefits and commercial activity; |
| ● | the timing and availability of direct and indirect governmental support for various financial assets, and possible related distortions in market values and liquidity for such assets whose markets have or are assumed to have government support versus possibly similar assets that do not; |
| ● | the likely longer-term effects of increased government spending on inflation and the interest rate environment and borrowing costs for non-governmental parties; |
| ● | the ability of our employees and our third-party vendors to work effectively during the course of the pandemic; |
| ● | potential longer-term shifts toward telecommuting and telecommerce; and |
| ● | geographic variation in the severity and duration of the COVID-19 pandemic, including in states such as New York and California where high percentages of our clients, customers and personnel are located. |
We focus principally on specificcertain sectors of the economy in our investment banking operations, and deterioration in the business environment in these sectors or a decline in the market for securities of companies within these sectors could harm our business.
We focus principally on five target industries in our investment banking operations: consumer goods, consumer services, defense, industrials and technology. Volatility in the business environment in thesethe industries in which our clients operate or in the market for securities of companies within these industries could adversely affect our financial results and the market value of our common stock. The business environment for companies in some of these industries has been subject to high levels of volatility in recent years, and our financial results have consequently been subject to significant variations from year to year. The market for securities in each of our target industries may also be subject to industry-specific risks. For example, we have research, investment banking and principal investments focused in the areas of defense. This sector has been subject to U.S. Department of Defense budget cuts as well as by disruptions in the financial markets and downturns in the general economy. The consumer goods and services sectors are subject to consumer spending trends, which have been volatile, to mall traffic trends, which have been down, to the availability of credit, and to broader trends such as the rise of Internet retailers. The consumer goods and services sector was severely impacted by the ongoing COVID-19 pandemic, which has resulted in mandatory store closures of uncertain duration due to social distancing measures, stay-at-home work restrictions and the closing of non-essential businesses imposed to control the pandemic. Emerging markets have driven the growth of certain consumer companies but emerging market economies are fragile, subject to wide swings in GDP, and subject to changes in foreign currencies. The technology industry has been volatile, driven by evolving technology trends, by technological obsolescence, by enterprise spending, and by changes in the capital spending trends of major corporations and government agencies around the world.
Our investment banking operations focus on various sectors of the economy, and we also depend significantly on private company transactions for sources of revenues and potential business opportunities. Most of these private company clients are initially funded and controlled by private equity firms. To the extent that the pace of these private company transactions slows or the average transaction size declines due to a decrease in private equity financings, difficult market conditions in our target industries or other factors, our business and results of operations may be harmed.
Underwriting and other corporate finance transactions, strategic advisory engagements and related sales and trading activities in our target industries represent a significant portion of our investment banking business. This concentration of activity in our target industries exposes us to the risk of declines in revenues in the event of downturns in these industries.
Our corporate finance and strategic advisory engagements are singular in nature and do not generally provide for subsequent engagements.
Our investment banking clients generally retain us on a short-term, engagement-by-engagement basis in connection with specific corporate finance, merger and acquisition transactions (oftenindustries, such as an advisor in company sale transactions) and other strategic advisory services, rather than on a recurring basis under long-term contracts. As these transactions are typically singular in nature and our engagements with these clients may not recur, we must seek new engagements when our current engagements are successfully completed or are terminated. As a result, high activity levels in any period are not necessarily indicative of continued high levels of activity in any subsequent period. If we are unable to generate a substantial number of new engagements that generate fees from new or existing clients, our business, results of operations and financial condition could be adversely affected.
The asset management business is intensely competitive.
Over the past several years, the size and number of asset management funds, including hedge funds and mutual funds, has continued to increase. If this trend continues, it is possible that it will become increasingly difficult for our funds to raise capital. More significantly, the allocation of increasing amounts of capital to alternative investment strategies by institutional and individual investors leads to a reduction in the size and duration of pricing inefficiencies. Many alternative investment strategies seek to exploit these inefficiencies and, in certain industries, this drives prices for investments higher, in either case increasing the difficulty of achieving targeted returns. In addition, if interest rates were to rise or there were to be a prolonged bull market in equities, the attractiveness of our funds relative to investments in other investment products could decrease. Competition is based on a variety of factors, including:
We compete in the asset management business with a large number of investment management firms, private equity fund sponsors, hedge fund sponsors and other financial institutions. A number of factors serve to increase our competitive risks, as follows:
These and other factors could reduce our earnings and revenues and adversely affect our business. In addition, if we are forced to compete with other alternative asset managers on the basis of price, we may not be able to maintain our current base management and incentive fee structures. We have historically competed primarily on the performance of our funds, and not on the level of our fees relative to those of our competitors. However, there is a risk that fees in the alternative investment management industry will decline, without regard to the historical performance of a manager, including our managers. Fee reductions on our existing or future funds, without corresponding decreases in our cost structure, would adversely affect our revenues and distributable earnings.
Poor investment performance may decrease assets under management and reduce revenues from and the profitability of our asset management business.
Revenues from our asset management business are primarily derived from asset management fees. Asset management fees are generally comprised of management and incentive fees. Management fees are typically based on assets under management, and incentive fees are earned on a quarterly or annual basis only if the return on our managed accounts exceeds a certain threshold return, or “highwater mark,” for each investor. We will not earn incentive fee income during a particular period, even when a fund had positive returns in that period, if we do not generate cumulative performance that surpasses a highwater mark. If a fund experiences losses, we will not earn incentive fees with regard to investors in that fund until its returns exceed the relevant highwater mark.
In addition, investment performance is one of the most important factors in retaining existing investors and competing for new asset management business. Investment performance may be poor as a result of the current or future difficult market or economic conditions, including changes in interest rates or inflation, terrorism or political uncertainty, our investment style, the particular investments that we make, and other factors. Poor investment performance may result in a decline in our revenues and income by causing (i) the net asset value of the assets under our management to decrease, which would result in lower management fees to us, (ii) lower investment returns, resulting in a reduction of incentive fee income to us, and (iii) investor redemptions, which would result in lower fees to us because we would have fewer assets under management.
To the extent our future investment performance is perceived to be poor in either relative or absolute terms, the revenues and profitability of our asset management business will likely be reduced and our ability to grow existing funds and raise new funds in the future will likely be impaired.
The historical returns of our funds may not be indicative of the future results of our funds.
The historical returns of our funds should not be considered indicative of the future results that should be expected from such funds or from any future funds we may raise. Our rates of returns reflect unrealized gains, as of the applicable measurement date, which may never be realized due to changes in marketrising inflation and other conditions not in our control that may adversely affect the ultimate value realized from the investments in a fund. The returns of our funds may have also benefited from investment opportunities and general market conditions that may not repeat themselves, and there can be no assurance that our current or future funds will be able to avail themselves of profitable investment opportunities. Furthermore, the historical and potential future returns of the funds we manage also may not necessarily bear any relationship to potential returns on our common stock.
interest rates.
Our asset management clients may generally redeem their investments, which could reduce our asset management fee revenues.
Our asset management fund agreements generally permit investors to redeem their investments with us after an initial “lockup” period during which redemptions are restricted or penalized. However, any such restrictions may be waived by us. Thereafter, redemptions are permitted at specified intervals. If the return on the assets under our management does not meet investors’ expectations, investors may elect to redeem their investments and invest their assets elsewhere, including with our competitors. Our management fee revenues correlate directly to the amount of assets under our management; therefore, redemptions may cause our fee revenues to decrease. Investors may decide to reallocate their capital away from us and to other asset managers for a number of reasons, including poor relative investment performance, changes in prevailing interest rates which make other investments more attractive, changes in investor perception regarding our focus or alignment of interest, dissatisfaction with changes in or a broadening of a fund’s investment strategy, changes in our reputation, and departures or changes in responsibilities of key investment professionals. For these and other reasons, the pace of redemptions and corresponding reduction in our assets under management could accelerate. In the future, redemptions could require us to liquidate assets under unfavorable circumstances, which would further harm our reputation and results of operations.
We are subject to risks in using custodians.
Our asset management subsidiary and its managed funds depend on the services of custodians to settle and report securities transactions. In the event of the insolvency of a custodian, our funds might not be able to recover equivalent assets in whole or in part as they will rank among the custodian’s unsecured creditors in relation to assets which the custodian borrows, lends or otherwise uses. In addition, cash held by our funds with the custodian will not be segregated from the custodian’s own cash, and the funds will therefore rank as unsecured creditors in relation thereto.
We may suffer losses if our reputation is harmed.
Our ability to attract and retain customers and employees may be diminished to the extent our reputation is damaged. If we fail, or are perceived to fail, to address various issues that may give rise to reputational risk, we could harm our business prospects. These issues include, but are not limited to, appropriately dealing with market dynamics, potential conflicts of interest, legal and regulatory requirements, ethical issues, customer privacy, record-keeping, sales and trading practices, and the proper identification of the legal, reputational, credit, liquidity and market risks inherent in our products and services. Failure to appropriately address these issues could give rise to loss of existing or future business, financial loss, and legal or regulatory liability, including complaints, claims and enforcement proceedings against us, which could, in turn, subject us to fines, judgments and other penalties. In addition, our capital markets operations depend to a large extent on our relationships with our clients and reputation for integrity and high-caliber professional services to attract and retain clients. As a result, if a client is not satisfied with our services, it may be more damaging in our business than in other businesses.
Our capital markets operations are highly dependent on communications, information and other systems and third parties, and any systems failures could significantly disrupt our capital markets business.
Our data and transaction processing, custody, financial, accounting and other technology and operating systems are essential to our capital markets operations. A system malfunction (due to hardware failure, capacity overload, security incident, data corruption, etc.) or mistake made relating to the processing of transactions could result in financial loss, liability to clients, regulatory intervention, reputational damage and constraints on our ability to grow. We outsource a substantial portion of our critical data processing activities, including trade processing and back office data processing. We also contract with third parties for market data and other services. In the event that any of these service providers fails to adequately perform such services or the relationship between that service provider and us is terminated, we may experience a significant disruption in our operations, including our ability to timely and accurately process transactions or maintain complete and accurate records of those transactions.
Adapting or developing our technology systems to meet new regulatory requirements, client needs, expansion and industry demands also is critical for our business. Introduction of new technologies present new challenges on a regular basis. We have an ongoing need to upgrade and improve our various technology systems, including our data and transaction processing, financial, accounting, risk management and trading systems. This need could present operational issues or require significant capital spending. It also may require us to make additional investments in technology systems and may require us to reevaluate the current value and/or expected useful lives of our technology systems, which could negatively impact our results of operations.
Secure processing, storage and transmission of confidential and other information in our internal and outsourced computer systems and networks also is critically important to our business. We take protective measures and endeavor to modify them as circumstances warrant. However, our computer systems, software and networks may be vulnerable to unauthorized access, computer viruses or other malicious code, inadvertent, erroneous or intercepted transmission of information (including by e-mail), and other events that could have an information security impact. If one or more of such events occur, this potentially could jeopardize our or our clients’ or counterparties’ confidential and other information processed and stored in, and transmitted through, our computer systems and networks, or otherwise cause interruptions or malfunctions in our, our clients’, our counterparties’ or third parties’ operations. We may be required to expend significant additional resources to modify our protective measures or to investigate and remediate vulnerabilities or other exposures, and we may be subject to litigation and financial losses that are either not insured against or not fully covered through any insurance maintained by us.
A disruption in the infrastructure that supports our business due to fire, natural disaster, health emergency (for example, a disease pandemic), power or communication failure, act of terrorism or war may affect our ability to service and interact with our clients. If we are not able to implement contingency plans effectively, any such disruption could harm our results of operations.
The growth of electronic trading and the introduction of new technology in the markets in which our market-making business operates may adversely affect this business and may increase competition.
The continued growth of electronic trading and the introduction of new technologies is changing our market-making business and presenting new challenges. Securities, futures and options transactions are increasingly occurring electronically, through alternative trading systems. It appears that the trend toward alternative trading systems will continue to accelerate. This acceleration could further increase program trading, increase the speed of transactions and decrease our ability to participate in transactions as principal, which would reduce the profitability of our market-making business. Some of these alternative trading systems compete with our market-making business and with our algorithmic trading platform, and we may experience continued competitive pressures in these and other areas. Significant resources have been invested in the development of our electronic trading systems, which includes our at-the-market business, but there is no assurance that the revenues generated by these systems will yield an adequate return on the investment, particularly given the increased program trading and increased percentage of stocks trading off of the historically manual trading markets.
Pricing and other competitive pressures may impair the revenues of our sales and trading business.
We derive a significant portion of our revenues for our investment banking operations from our sales and trading business. There has been intense price competition and trading volume reduction in this business in recent years. In particular, the ability to execute trades electronically and through alternative trading systems has increased the downward pressure on per share trading commissions and spreads. We expect these trends toward alternative trading systems and downward pricing pressure in the business to continue. We believe we may experience competitive pressures in these and other areas in the future as some of our competitors seek to obtain market share by competing on the basis of price or by using their own capital to facilitate client trading activities. In addition, we face pressure from our larger competitors, which may be better able to offer a broader range of complementary products and services to clients in order to win their trading business. These larger competitors may also be better able to respond to changes in the research, brokerage and investment banking industries, to compete for skilled professionals, to finance acquisitions, to fund internal growth and to compete for market share generally. As we are committed to maintaining and improving our comprehensive research coverage in our target sectors to support our sales and trading business, we may be required to make substantial investments in our research capabilities to remain competitive. If we are unable to compete effectively in these areas, the revenues of our sales and trading business may decline, and our business, results of operations and financial condition may be harmed.
Some of our large institutional sales and trading clients in terms of brokerage revenues have entered into arrangements with us and other investment banking firms under which they separate payments for research products or services from trading commissions for sales and trading services, and pay for research directly in cash, instead of compensating the research providers through trading commissions (referred to as “soft dollar” practices). In addition, we have entered into certain commission sharing arrangements in which institutional clients execute trades with a limited number of brokers and instruct those brokers to allocate a portion of the commission directly to us or other broker-dealers for research or to an independent research provider. If more of such arrangements are reached between our clients and us, or if similar practices are adopted by more firms in the investment banking industry, it may further increase the competitive pressures on trading commissions and spreads and reduce the value our clients place on high quality research. Conversely, if we are unable to make similar arrangements with other investment managers that insist on separating trading commissions from research products, volumes and trading commissions in our sales and trading business also would likely decrease.
Larger and more frequent capital commitments in our trading and underwriting businesses increase the potential for significant losses.
Certain financial services firms make larger and more frequent commitments of capital in many of their activities. For example, in order to win business, some investment banks increasingly commit to purchase large blocks of stock from publicly traded issuers or significant stockholders, instead of the more traditional marketed underwriting process in which marketing is typically completed before an investment bank commits to purchase securities for resale. We may participate in this activity and, as a result, we may be subject to increased risk. Conversely, if we do not have sufficient regulatory capital to so participate, our business may suffer. Furthermore, we may suffer losses as a result of the positions taken in these transactions even when economic and market conditions are generally favorable for others in the industry.
We may increasingly commit our own capital as part of our trading business to facilitate client sales and trading activities. The number and size of these transactions may adversely affect our results of operations in a given period. We may also incur significant losses from our sales and trading activities due to market fluctuations and volatility in our results of operations. To the extent that we own assets, i.e., have long positions, in any of those markets, a downturn in the value of those assets or in those markets could result in losses. Conversely, to the extent that we have sold assets we do not own, i.e., have short positions, in any of those markets, an upturn in those markets could expose us to potentially large losses as we attempt to cover our short positions by acquiring assets in a rising market.
We have made and may make principal investments in relatively high-risk, illiquid assets that often have significantly leveraged capital structures, and we may fail to realize any profits from these activities for a considerable period of time or lose some or all of the principal amount we invest in these activities.
We may purchase equity securities and, to a lesser extent, debt securities, in venture capital, seed and other high risk financings of early-stage, pre-public or “mezzanine stage”, distressed situations and turnaround companies, as well as funds or other collective investment vehicles. We risk the loss of capital we have invested in these activities.
We may use our capital, including on a leveraged basis in proprietary investments in both private company and public company securities that may be illiquid and volatile. The equity securities of a privately-held entity in which we make a proprietary investment are likely to be restricted as to resale and may otherwise be highly illiquid. In the case of fund or similar investments, our investments may be illiquid until such investment vehicles are liquidated. We expect that there will be restrictions on our ability to resell the securities of any such company that we acquire for a period of at least six months after we acquire those securities. Thereafter, a public market sale may be subject to volume limitations or dependent upon securing a registration statement for an initial and potentially secondary public offering of the securities. We may make principal investments that are significant relative to the overall capitalization of the investee company and resales of significant amounts of these securities might be subject to significant limitations and adversely affect the market and the sales price for the securities in which we invest. In addition, our principal investments may involve entities or businesses with capital structures that have significant leverage. The large amount of borrowing in the leveraged capital structure increases the risk of losses due to factors such as rising interest rates, downturns in the economy or deteriorations in the condition of the investment or its industry. In the event of defaults under borrowings, the assets being financed would be at risk of foreclosure, and we could lose our entire investment.
Even if we make an appropriate investment decision based on the intrinsic value of an enterprise, we cannot assure you that general market conditions will not cause the market value of our investments to decline. For example, an increase in interest rates, a general decline in the stock markets, or other market and industry conditions adverse to companies of the type in which we invest and intend to invest could result in a decline in the value of our investments or a total loss of our investment.
In addition, some of these investments are, or may in the future be, in industries or sectors which are unstable, in distress or undergoing some uncertainty. Further, the companies in which we invest may rely on new or developing technologies or novel business models, or concentrate on markets which are or may be disproportionately impacted by pressures in the financial services and/or mortgage and real estate sectors, have not yet developed and which may never develop sufficiently to support successful operations, or their existing business operations may deteriorate or may not expand or perform as projected. Such investments may be subject to rapid changes in value caused by sudden company-specific or industry-wide developments. Contributing capital to these investments is risky, and we may lose some or all of the principal amount of our investments. There are no regularly quoted market prices for a number of the investments that we make. The value of our investments is determined using fair value methodologies described in valuation policies, which may consider, among other things, the nature of the investment, the expected cash flows from the investment, bid or ask prices provided by third parties for the investment and the trading price of recent sales of securities (in the case of publicly-traded securities), restrictions on transfer and other recognized valuation methodologies. The methodologies we use in valuing individual investments are based on estimates and assumptions specific to the particular investments. Therefore, the value of our investments does not necessarily reflect the prices that would actually be obtained by us when such investments are sold. Realizations, if any, at values significantly lower than the values at which investments have been reflected on our balance sheet would result in loses of potential incentive income and principal investments.
We may experience write downs of our investments and other losses related to the valuation of our investments and volatile and illiquid market conditions.
In our proprietary investment activities, our concentrated holdings, illiquidity and market volatility may make it difficult to value certain of our investment securities. Subsequent valuations, in light of factors then prevailing, may result in significant changes in the values of these securities in future periods. In addition, at the time of any sales and settlements of these securities, the price we ultimately realize will depend on the demand and liquidity in the market at that time and may be materially lower than their current fair value. Any of these factors could require us to take write downs in the value of our investment and securities portfolio, which may have an adverse effect on our results of operations in future periods.
Our underwriting and market-making activities may place our capital at risk.
We may incur losses and be subject to reputational harm to the extent that, for any reason, we are unable to sell securities we purchased as an underwriter at the anticipated price levels. As an underwriter, we also are subject to heightened standards regarding liability for material misstatements or omissions in prospectuses and other offering documents relating to offerings we underwrite. Further, even though underwriting agreements with issuing companies typically include a right to indemnification in favor of the underwriter for these offerings to cover potential liability from any material misstatements or omissions, indemnification may be unavailable or insufficient in certain circumstances, for example if the issuing company has become insolvent. As a market maker, we may own large positions in specific securities, and these undiversified holdings concentrate the risk of market fluctuations and may result in greater losses than would be the case if our holdings were more diversified.
Our businesses, profitability and liquidity may be adversely affected by deterioration in the credit quality of, or defaults by, third parties who owe us money, securities or other assets or whose securities or obligations we hold.
The amount and duration of our credit exposures have been increasing over the past year, as have the breadth and size of the entities to which we have credit exposures. We are exposed to the risk that third parties that owe us money, securities or other assets will not perform their obligations. These parties may default on their obligations to us due to bankruptcy, lack of liquidity, operational failure or other reasons. Declines in the market value of securities can result in the failure of buyers and sellers of securities to fulfill their settlement obligations, and in the failure of our clients to fulfill their credit obligations. During market downturns, counterparties to us in securities transactions may be less likely to complete transactions. In addition, particularly during market downturns, we may face additional expenses defending or pursuing claims or litigation related to counterparty or client defaults.
Our businesses may be adversely affected by the disruptions in the credit markets, such as those due to the COVID-19 pandemic and its effects, including reduced access to credit and liquidity and higher costs of obtaining credit.
In the event existing internal and external financial resources do not satisfy our needs, we would have to seek additional outside financing. The availability of outside financing will depend on a variety of factors, such as our financial condition and results of operations, the availability of acceptable collateral, market conditions, the general availability of credit, the volume of trading activities, and the overall availability of credit to the financial services industry.industry, all of which may be negatively impacted due to the effects of the COVID-19 pandemic, which may include increased inflation and rising interest rates.
Widening credit spreads, as well as significant declines in the availability of credit, could adversely affect our ability to borrow on an unsecured basis. Disruptions in the credit markets could make it more difficult and more expensive to obtain funding for our businesses. If our available funding is limited or we are forced to fund our operations at a higher cost, these conditions may require us to curtail our business activities and increase our cost of funding, both of which could reduce our profitability, particularly in our businesses that involve investing and taking principal positions.
Liquidity, or ready access to funds, is essential to financial services firms, including ours. Failures of financial institutions have often been attributable in large part to insufficient liquidity. Liquidity is of particular importance to our sales and trading business, and perceived liquidity issues may affect the willingness of our clients and counterparties to engage in sales and trading transactions with us. Our liquidity could be impaired due to circumstances that we may be unable to control, such as a general market disruption or an operational problem that affects our sales and trading clients, third parties, or us. Further, our ability to sell assets may be impaired if other market participants are seeking to sell similar assets at the same time.
Our clients engaging us with respect to mergers and acquisitions often rely on access to the secured and unsecured credit markets to finance their transactions. The lack of available credit and the increased cost of credit could adversely affect the size, volume and timing of our clients’ merger and acquisition transactions—particularlytransactions-particularly large transactions—andtransactions-and adversely affect our investment banking business and revenues.
Climate change could have a material negative impact on us and our customers and counterparties, and our efforts to address concerns relating to climate change could result in damage to our reputation.
We have experienced lossesOur business, as well as the operations and may not maintain profitability.
Our profitability in each reporting period isactivities of our customers and counterparties, could be negatively impacted by climate change. Climate change presents both immediate and long-term risks to us and our customers and these risks are expected to increase over time. Climate change may cause extreme weather events that disrupt operations at one or more of our primary locations, which may negatively affect our ability to service and interact with our clients, adversely affect the numbervalue of our investments, and sizereduce the availability of retail liquidationinsurance. Climate change and capital markets engagementsthe transition to a less carbon-dependent economy may also have a negative impact on the operations or financial condition of our clients and counterparties, which may decrease revenues from those clients and counterparties and increase the credit risk associated with loans and other credit exposures to those clients and counterparties. In addition, climate change may impact the broader economy, including through disruptions to supply chains.
Climate change also exposes us to transition risks associated with the transition to a less carbon-dependent economy. Transition risks may result from changes in policies; laws and regulations; technologies; and/or market preferences to address climate change. Such changes could materially, negatively impact our business, results of operations, financial condition and/or our reputation, in addition to having a similar impact on our customers and counterparties.
For example, our reputation and client relationships may be damaged as a result of our involvement, or our clients’ involvement, in certain industries or projects associated with causing or exacerbating climate change, as well as any decisions we perform on a quarterly or annual basis. It is possible that we will experience losses with respectmake to our current operations as we continue to expandconduct or change our operations. In addition,activities in response to considerations relating to climate change.
New regulations or guidance relating to climate change, as well as the perspectives of regulators, stockholders, employees and other stakeholders regarding climate change, may affect whether and on what terms and conditions we engage in certain activities or offer certain products. The risks associated with, and the perspective of regulators, shareholders, employees and other stakeholders regarding, climate change are continuing to evolve rapidly, which can make it difficult to assess the ultimate impact on us of climate change-related risks and uncertainties, and we expect that our operating expensesclimate change-related risks will increase over time.
Risks Related to Legal Liability, Risk Management, Finance and Accounting
Our exposure to legal liability is significant, and could lead to substantial damages.
We face significant legal risks in our businesses. These risks include potential liability under securities laws and regulations in connection with our capital markets, asset management and other businesses. The volume and amount of damages claimed in litigation, arbitrations, regulatory enforcement actions and other adversarial proceedings against financial services firms have increased in recent years. We also are subject to claims from disputes with our employees and our former employees under various circumstances. Risks associated with legal liability often are difficult to assess or quantify and their existence and magnitude can remain unknown for significant periods of time, making the amount of legal reserves related to these legal liabilities difficult to determine and subject to future revision. Legal or regulatory matters involving our directors, officers or employees in their individual capacities also may create exposure for us because we may be obligated or may choose to indemnify the affected individuals against liabilities and expenses they incur in connection with such matters to the extent thatpermitted under applicable law. In addition, like other financial services companies, we grow our business. Wemay face the possibility of employee fraud or misconduct. The precautions we take to prevent and detect this activity may not be able to generate sufficient revenues to maintain profitability.
Because of their significant stock ownership, some of our existing stockholderseffective in all cases and there can be no assurance that we will be able to exert control over usdeter or prevent fraud or misconduct. Exposures from and our significant corporate decisions.
Our executive officers, directors and their affiliates own or control, in the aggregate, approximately 23.4% of our outstanding common stock as of December 31, 2017. In particular, our Chairman and Chief Executive Officer, Bryant R. Riley, owns or controls, in the aggregate, 4,262,561 shares of our common stock or 16.0% of our outstanding common stock as of December 31, 2017. These stockholders are ableexpenses incurred related to exercise influence over matters requiring stockholder approval, such as the election of directors and the approval of significant corporate transactions, including transactions involving an actual or potential change of control of the company or other transactions that non-controlling stockholders may not deem to be in their best interests. This concentration of ownership may harm the market price of our common stock by, among other things:
We may incur losses as a result of “guarantee” based engagements that we enter into in connection with our auction and liquidation solutions business.
In many instances, in order to secure an engagement, we are required to bid for that engagement by guaranteeing to the client a minimum amount that such client will receive from the sale of inventory or assets. Our bid is based on a variety of factors, including: our experience, expertise, perceived value added by engagement, valuation of the inventory or assets and the prices we believe potential buyers would be willing to pay for such inventory or assets. An inaccurate estimate of any of the aboveforegoing actions or inaccurate valuationproceedings could have a negative impact on our results of the assets or inventory could result in us submitting a bid that exceeds the realizable proceeds from any engagement. If the liquidation proceeds, net of direct operating expenses, are less than the amount we guaranteed in our bid, we will incur a loss. Therefore, in the event that the proceeds, net of direct operating expenses, from an engagement are less than the bid, the value of the assets or inventory decline in value prior to the disposition or liquidation, or the assets are overvalued for any reason, we may suffer a lossoperations and our financial condition andcondition. In addition, future results of operations could be adversely affected.
Losses dueaffected if reserves relating to any auction or liquidation engagement may cause us to become unable to make payments due to our creditors and may cause us to default on our debt obligations.
We have three engagement structures for our auction and liquidation services: (i) a “fee” based structure under which we are compensated for our role in an engagement on a commission basis, (ii) purchase on an outright basis (and take title to) the assets or inventory of the client, and (iii) “guarantee” to the client that a certain amount will be realized by the client upon the sale of the assets or inventory based on contractually defined terms in the auction or liquidation contract. We bear the risk of loss under the purchase and guarantee structures of auction and liquidation contracts. If the amount realized from the sale or disposition of assets, net of direct operating expenses, does not equal or exceed the purchase price (in purchase transaction), we will recognize a loss on the engagement, or should the amount realized, net of direct operating expenses, not equal or exceed the “guarantee,” we are still required to pay the guaranteed amount to the client.
We could incur losses in connection with outright purchase transactions in which we engage as part of our auction and liquidation solutions business.
When we conduct an asset disposition or liquidation on an outright purchase basis, we purchase from the client the assets or inventory to be sold or liquidated and therefore, we hold title to any assets or inventory that we are not able to sell. In other situations, we may acquire assets from our clients if we believe that we can identify a potential buyer and sell the assets at a premium to the price paid. We store these unsold or acquired assets and inventory until they can be sold or, alternatively, transported to the site of a liquidation of comparable assets or inventory that we are conducting. If we are forced to sell these assets for less than we paid, orlegal liabilities are required to transport and store assets multiple times, the related expenses could have a material adverse effect on our resultsbe increased or legal proceedings are resolved in excess of operations.
We depend on financial institutions as primary clients for our valuation and appraisal business. Consequently, the loss of any financial institutions as clients may have an adverse impact on our business.
A majority of the revenue from our valuation and appraisal business is derived from engagements by financial institutions. As a result, any loss of financial institutions as clients of our valuation and advisory services, whether due to changing preferences in service providers, failures of financial institutions or mergers and consolidations within the finance industry, could significantly reduce the number of existing, repeat and potential clients, thereby adversely affecting our revenues. In addition, any larger financial institutions that result from mergers or consolidations in the financial services industry could have greater leverage in negotiating terms of engagements with us, or could decide to internally perform some or all of the valuation and appraisal services which we currently provide to one of the constituent institutions involved in the merger or consolidation or which we could provide in the future. Any of these developments could have a material adverse effect on our valuation and appraisal business.
established reserves.
We may face liability or harm to our reputation as a result of a claim that we provided an inaccurate appraisal or valuation and our insurance coverage may not be sufficient to cover the liability.
We could face liability in connection with a claim by a client that we provided an inaccurate appraisal or valuation on which the client relied. Any claim of this type, whether with or without merit, could result in costly litigation, which could divert management’s attention and company resources and harm our reputation. Furthermore, if we are found to be liable, we may be required to pay damages. While our appraisals and valuations are typically provided only for the benefit of our clients, if a third party relies on an appraisal or valuation and suffers harm as a result, we may become subject to a legal claim, even if the claim is without merit. We carry insurance for liability resulting from errors or omissions in connection with our appraisals and valuations; however, the coverage may not be sufficient if we are found to be liable in connection with a claim by a client or third party.
We could be forced to mark down the value of certain assets acquired in connection with outright purchase transactions.
In most instances, inventory is reported on the balance sheet at its historical cost; however, according to U.S. Generally Accepted Accounting Principles, inventory whose historical cost exceeds its market value should be valued conservatively, which dictates a lower value should apply. Accordingly, should the replacement cost (due to technological obsolescence or otherwise), or the net realizable value of any inventory we hold be less than the cost paid to acquire such inventory (purchase price), we will be required to “mark down” the value of such inventory held. If the value of any inventory held on our balance sheet is required to be written down, such write down could have a material adverse effect on our financial position and results of operations.
We operate in highly competitive industries. Some of our competitors may have certain competitive advantages, which may cause us to be unable to effectively compete with or gain market share from our competitors.
We face competition with respect to all of our service areas. The level of competition depends on the particular service area and, in the case of our asset and liquidation services, the category of assets being liquidated or appraised. We compete with other companies and investment banks to help clients with their corporate finance and capital needs. In addition, we compete with companies and online services in the bidding for assets and inventory to be liquidated. The demand for online solutions continues to grow and our online competitors include other e-commerce providers, auction websites such as eBay, as well as government agencies and traditional liquidators and auctioneers that have created websites to further enhance their product offerings and more efficiently liquidate assets. We expect the market to become even more competitive as the demand for such services continues to increase and traditional and online liquidators and auctioneers continue to develop online and offline services for disposition, redeployment and remarketing of wholesale surplus and salvage assets. In addition, manufacturers, retailers and government agencies may decide to create their own websites to sell their own surplus assets and inventory and those of third parties.
We also compete with other providers of valuation and advisory services. Competitive pressures within the valuation and appraisal services market, including a decrease in the number of engagements and/or a decrease in the fees which can be charged for these services, could affect revenues from our valuation and appraisal services as well as our ability to engage new or repeat clients. We believe that given the relatively low barriers to entry in the valuation and appraisal services market, this market may become more competitive as the demand for such services increases.
Some of our competitors may be able to devote greater financial resources to marketing and promotional campaigns, secure merchandise from sellers on more favorable terms, adopt more aggressive pricing or inventory availability policies and devote more resources to website and systems development than we are able to do. Any inability on our part to effectively compete could have a material adverse effect on our financial condition, growth potential and results of operations.
We compete with specialized investment banks to provide financial and investment banking services to small and middle-market companies. Middle-market investment banks provide access to capital and strategic advice to small and middle-market companies in our target industries. We compete with those investment banks on the basis of a number of factors, including client relationships, reputation, the abilities of our professionals, transaction execution, innovation, price, market focus and the relative quality of our products and services. We have experienced intense competition over obtaining advisory mandates in recent years, and we may experience pricing pressures in our investment banking business in the future as some of our competitors seek to obtain increased market share by reducing fees. Competition in the middle-market may further intensify if larger Wall Street investment banks expand their focus to this sector of the market. Increased competition could reduce our market share from investment banking services and our ability to generate fees at historical levels.
We also face increased competition due to a trend toward consolidation. In recent years, there has been substantial consolidation and convergence among companies in the financial services industry. This trend was amplified in connection with the unprecedented disruption and volatility in the financial markets during the past several years, and, as a result, a number of financial services companies have merged, been acquired or have fundamentally changed their respective business models. Many of these firms may have the ability to support investment banking, including financial advisory services, with commercial banking, insurance and other financial services in an effort to gain market share, which could result in pricing pressure in our businesses.
UOL competes with numerous providers of broadband, mobile broadband and DSL services, as well as other dial-up Internet access providers, many of whom are large and have significantly more financial and marketing resources. The principal competitors for UOL’s mobile broadband and DSL services include, among others, local exchange carriers, wireless and satellite service providers, and cable service providers.
If we are unable to attract and retain qualified personnel, we may not be able to compete successfully in our industry.
Our future success depends to a significant degree upon the continued contributions of senior management and the ability to attract and retain other highly qualified management personnel. We face competition for management from other companies and organizations; therefore, we may not be able to retain our existing personnel or fill new positions or vacancies created by expansion or turnover at existing compensation levels. Although we have entered into employment agreements with key members of the senior management team, there can be no assurances such key individuals will remain with us. The loss of any of our executive officers or other key management personnel would disrupt our operations and divert the time and attention of our remaining officers and management personnel which could have an adverse effect on our results of operations and potential for growth.
We also face competition for highly skilled employees with experience in our industry, which requires a unique knowledge base. We may be unable to recruit or retain other existing technical, sales and client support personnel that are critical to our ability to execute our business plan.
We frequently use borrowings under credit facilities in connection with our guaranty engagements, in which we guarantee a minimum recovery to the client, and outright purchase transactions.
In engagements where we operate on a guaranty or purchase basis, we are typically required to make an upfront payment to the client. If the upfront payment is less than 100% of the guarantee or the purchase price in a “purchase” transaction, we may be required to make successive cash payments until the guarantee is met or we may issue a letter of credit in favor of the client. Depending on the size and structure of the engagement, we may borrow under our credit facilities and may be required to issue a letter of credit in favor of the client for these additional amounts. If we lose any availability under our credit facilities, are unable to borrow under credit facilities and/or issue letters of credit in favor of clients, or borrow under credit facilities and/or issue letters of credit on commercially reasonable terms, we may be unable to pursue large liquidation and disposition engagements, engage in multiple concurrent engagements, pursue new engagements or expand our operations. We are required to obtain approval from the lenders under our existing credit facilities prior to making any borrowings thereunder in connection with a particular engagement. Any inability to borrow under our credit facilities, or enter into one or more other credit facilities on commercially reasonable terms may have a material adverse effect on our financial condition, results of operations and growth.
Defaults under our credit agreements could have an adverse impact on our ability to finance potential engagements.
The terms of our credit agreements contain a number of events of default. Should we default under any of our credit agreements in the future, lenders may take any or all remedial actions set forth in such credit agreement, including, but not limited to, accelerating payment and/or charging us a default rate of interest on all outstanding amounts, refusing to make any further advances or issue letters of credit, or terminating the line of credit. As a result of our reliance on lines of credit and letters of credit, any default under a credit agreement, or remedial actions pursued by lenders following any default under a credit agreement, may require us to immediately repay all outstanding amounts, which may preclude us from pursuing new liquidation and disposition engagements and may increase our cost of capital, each of which may have a material adverse effect on our financial condition and results of operations.
If we cannot meet our future capital requirements, we may be unable to develop and enhance our services, take advantage of business opportunities and respond to competitive pressures.
We may need to raise additional funds in the future to grow our business internally, invest in new businesses, expand through acquisitions, enhance our current services or respond to changes in our target markets. If we raise additional capital through the sale of equity or equity derivative securities, the issuance of these securities could result in dilution to our existing stockholders. If additional funds are raised through the issuance of debt securities, the terms of that debt could impose additional restrictions on our operations or harm our financial condition. Additional financing may be unavailable on acceptable terms.
We are subject to net capital and other regulatory capital requirements; failure to comply with these rules would significantly harm our business.
BRC, our broker-dealer subsidiary, is subject to the net capital requirements of the SEC, FINRA, and various self-regulatory organizations of which it is a member. These requirements typically specify the minimum level of net capital a broker-dealer must maintain and also mandate that a significant part of its assets be kept in relatively liquid form. Failure to maintain the required net capital may subject a firm to limitation of its activities, including suspension or revocation of its registration by the SEC and suspension or expulsion by FINRA and other regulatory bodies, and ultimately may require its liquidation. Failure to comply with the net capital rules could have material and adverse consequences, such as:
In addition, a change in the net capital rules or the imposition of new rules affecting the scope, coverage, calculation, or amount of net capital requirements, or a significant operating loss or any large charge against net capital, could have similar adverse effects.
Furthermore, BRC is subject to laws that authorize regulatory bodies to block or reduce the flow of funds from it to B. Riley Financial, Inc. As a holding company, B. Riley Financial, Inc. depends on dividends, distributions and other payments from its subsidiaries to fund dividend payments, if any, and to fund all payments on its obligations, including debt obligations. As a result, regulatory actions could impede access to funds that B. Riley Financial, Inc. needs to make payments on obligations, including debt obligations, or dividend payments. In addition, because B. Riley Financial, Inc. holds equity interests in the firm’s subsidiaries, its rights as an equity holder to the assets of these subsidiaries may not materialize, if at all, until the claims of the creditors of these subsidiaries are first satisfied.
We may incur losses as a result of ineffective risk management processes and strategies.
We seek to monitor and control our risk exposure through operational and compliance reporting systems, internal controls, management review processes and other mechanisms. Our investing and trading processes seek to balance our ability to profit from investment and trading positions with our exposure to potential losses. While we employ limits, hedging transactions, and other risk mitigation techniques, those techniques and the judgments that accompany their application cannot anticipate economic and financial outcomes or the specifics and timing of such outcomes. Thus, we may, in the course of our investment and trading activities, incur losses, which may be significant.
In addition, we are investing our own capital in our funds and funds of funds as well as principal investing activities, and limitations on our ability to withdraw some or all of our investments in these funds or liquidate our investment positions, whether for legal, reputational, illiquidity or other reasons, may make it more difficult for us to control the risk exposures relating to these investments.
Our risk management policies and procedures may leave us exposed to unidentified or unanticipated risks.
Our risk management strategies and techniques may not be fully effective in mitigating our risk exposure in all market environments or against all types of risk. We seek to manage, monitor and control our operational, legal and regulatory risk through operational and compliance reporting systems, internal controls, management review processes and other mechanisms; however, there can be no assurance that our procedures will be fully effective. Further, our risk management methods may not effectively predict future risk exposures, which could be significantly greater than the historical measures indicate. In addition, some of our risk management methods are based on an evaluation of information regarding markets, clients and other matters that are based on assumptions that may no longer be accurate. A failure to adequately manage our growth, or to effectively manage our risk, could materially and adversely affect our business and financial condition.
We are exposed to the risk that third parties that owe us money, securities or other assets will not perform their obligations. These parties may default on their obligations to us due to bankruptcy, lack of liquidity, operational failure, and breach of contract or other reasons. We are also subject to the risk that our rights against third parties may not be enforceable in all circumstances. As an introducing broker, we could be held responsible for the defaults or misconduct of our customers. These may present credit concerns, and default risks may arise from events or circumstances that are difficult to detect, foresee or reasonably guard against. In addition, concerns about, or a default by, one institution could lead to significant liquidity problems, losses or defaults by other institutions, which in turn could adversely affect us. If any of the variety of instruments, processes and strategies we utilize to manage our exposure to various types of risk are not effective, we may incur losses.
Our common stock price may fluctuate substantially,failure to deal appropriately with conflicts of interest could damage our reputation and your investment could suffer a decline in value.adversely affect our business.
The market priceAs we have expanded the number and scope of our common stockbusinesses, we increasingly confront potential conflicts of interest relating to our and our funds’ and clients’ investment and other activities. Certain of our funds have overlapping investment objectives, including funds which have different fee structures, and potential conflicts may arise with respect to our decisions regarding how to allocate investment opportunities among ourselves and those funds. For example, a decision to acquire material non-public information about a company while pursuing an investment opportunity for a particular fund gives rise to a potential conflict of interest when it results in our having to restrict the ability of the Company or other funds to take any action.
In addition, there may be volatileconflicts of interest regarding investment decisions for funds in which our officers, directors and could fluctuate substantially dueemployees, who have made and may continue to many factors, including, among other things:
In addition,make significant personal investments in a variety of funds, are personally invested. Similarly, conflicts of interest may exist or develop regarding decisions about the stock market in general has experienced extreme price and volume fluctuations that have often been unrelated or disproportionate toallocation of specific investment opportunities between the operating performance of those companies. These broad market factors may materially harm the market price of our common stock, regardless of our operating performance.
There is a limited market for our common sharesCompany and the trading pricefunds.
We also have potential conflicts of interest with our common sharesinvestment banking and institutional clients including situations where our services to a particular client or our own proprietary or fund investments or interests conflict or are perceived to conflict with a client. It is subjectpossible that potential or perceived conflicts could give rise to volatility.
Our common shares began trading on the over-the-counter bulletin board in August 2009,investor or client dissatisfaction or litigation or regulatory enforcement actions. Appropriately dealing with conflicts of interest is complex and we obtained approval to listdifficult and trade our shares on The NASDAQ Stock Market LLC’s NASDAQ Capital Market on July 16, 2015. On November 16, 2016, we began trading our shares on the NASDAQ Stock Market LLC’s NASDAQ Global Market. Trading of our common stock has in the past been highly volatile with low trading volume and an active trading market for shares of our common stock may not develop. In such case, selling shares of our common stock mayreputation could be difficult because the limited trading market for our shares could result in lower prices and larger spreads in the bid and ask prices of our shares, as well as lower trading volume. Further, the market price of shares of our common stock could continue to fluctuate substantially. Additionally,damaged if we are not ablefail, or appear to maintain our listing on NASDAQ, then our common stock will again be quoted for trading on an over-the-counter quotation system and may be subjectfail, to more significant fluctuations in stock price and trading volume and large bid and ask price spreads.
Our amended and restated certificate of incorporation authorizes our board of directors to issue new series of preferred stock that may have the effect of delaying or preventing a change of control, which could adversely affect the value of your shares.
Our amended and restated certificate of incorporation provides that our board of directors will be authorized to issue from time to time, without further stockholder approval, up to 1,000,000 shares of preferred stock indeal appropriately with one or more series and to fixpotential or alter the designations, preferences, rights and any qualifications, limitationsactual conflicts of interest. Regulatory scrutiny of, or restrictionslitigation in connection with, conflicts of the shares of each series, including the dividend rights, dividend rates, conversion rights, voting rights, rights of redemption, including sinking fund provisions, redemption price or prices, liquidation preferences and the number of shares constituting any series or designations of any series. Such shares of preferred stock could have preferences over our common stock with respect to dividends and liquidation rights. We may issue additional preferred stock in ways which may delay, defer or prevent a change of control of our company without further action by our stockholders. Such shares of preferred stock may be issued with voting rights that may adversely affect the voting power of the holders of our common stock by increasing the number of outstanding shares having voting rights, and by the creation of class or series voting rights.
Anti-takeover provisions under our charter documents and Delaware law could delay or prevent a change of control and could also limit the market price of our stock.
Our amended and restated certificate of incorporation and our bylaws, as amended, contain provisions that could delay or prevent a change of control of our company or changes in our board of directors that our stockholders might consider favorable. We are also governed by the provisions of Section 203 of the Delaware General Corporate Law, which may prohibit certain business combinations with stockholders owning 15% or more of our outstanding voting stock. The foregoing and other provisions in our amended and restated certificate of incorporation, our bylaws, as amended, and Delaware law could make it more difficult for stockholders or potential acquirers to obtain control of our board of directors or initiate actions that are opposed by the then-current board of directors, including delaying or impeding a merger, tender offer, or proxy contest or other change of control transaction involving our company. Any delay or prevention of a change of control transaction or changes in our board of directors could prevent the consummation of a transaction in which our stockholders could receive a substantial premium over the then current market price for their shares.
Our ability to use net loss carryovers to reduce our taxable income may be limited.
As a result of the common stock offering that was completed on June 5, 2014, the Company had a more than 50% ownership shift in accordance with Section 382 of the Internal Revenue Code of 1986, as amended (the “Code”). Accordingly, the Company may be limited to the amount of net operating loss that may be utilized in future taxable years depending on the Company’s actual taxable income. As a result of the acquisition of UOL on July 1, 2016, the historical net operating losses of UOL are limited to offset income we generate post acquisition. As of December 31, 2017, the Company believes that the net operating loss that existed as of the more than 50% ownership shift will be utilized in future tax periods before the loss carryforwards expire and it is more-likely-than-not that future taxable earnings will be sufficient to realize its deferred tax assets and has not provided an allowance. However, to the extent that the Company is unable to utilize such net operating loss, it mayinterest would have a material adverse effect on our financial conditionreputation, which would materially adversely affect our business in a number of ways, including as a result of redemptions by our investors from our hedge funds, an inability to raise additional funds and resultsa reluctance of operations.
counterparties to do business with us.
Financial services firms have been subject to increased scrutiny over the last several years, increasing the risk of financial liability and reputational harm resulting from adverse regulatory actions.
Firms in the financial services industry have been operating in a difficult regulatory environment which we expect will become even more stringent in light of recent well-publicized failures of regulators to detect and prevent fraud. The industry has experienced increased scrutiny from a variety of regulators, including the SEC, the NYSE, FINRA and state attorneys general. Penalties and fines sought by regulatory authorities have increased substantially over the last several years. This regulatory and enforcement environment has created uncertainty with respect to a number of transactions that had historically been entered into by financial services firms and that were generally believed to be permissible and appropriate. We may be adversely affected by changes in the interpretation or enforcement of existing laws and rules by these governmental authorities and self-regulatory organizations. Each of the regulatory bodies with jurisdiction over us has regulatory powers dealing with many aspects of financial services, including, but not limited to, the authority to fine us and to grant, cancel, restrict or otherwise impose conditions on the right to carry on particular businesses. For example, a failure to comply with the obligations imposed by the Exchange Act on broker-dealers and the Investment Advisers Act of 1940 on investment advisers, including record-keeping, advertising and operating requirements, disclosure obligations and prohibitions on fraudulent activities, or by the Investment Company Act of 1940, could result in investigations, sanctions and reputational damage. We also may be adversely affected as a result of new or revised legislation or regulations imposed by the SEC, other U.S. or foreign governmental regulatory authorities or FINRA or other self-regulatory organizations that supervise the financial markets. Substantial legal liability or significant regulatory action against us could have adverse financial effects on us or cause reputational harm to us, which could harm our business prospects.
In addition, financial services firms are subject to numerous conflicts of interests or perceived conflicts. The SEC and other federal and state regulators have increased their scrutiny of potential conflicts of interest. We have adopted various policies, controls and procedures to address or limit actual or perceived conflicts and regularly review and update our policies, controls and procedures. However, appropriately addressing conflicts of interest is complex and difficult and our reputation could be damaged if we fail, or appear to fail, to appropriately address conflicts of interest. Our policies and procedures to address or limit actual or perceived conflicts may also result in increased costs and additional operational personnel. Failure to adhere to these policies and procedures may result in regulatory sanctions or litigation against us. For example, the research operations of investment banks have been and remain the subject of heightened regulatory scrutiny which has led to increased restrictions on the interaction between equity research analysts and investment banking professionals at securities firms. Several securities firms in the U.S. reached a global settlement in 2003 and 2004 with certain federal and state securities regulators and self-regulatory organizations to resolve investigations into the alleged conflicts of interest of research analysts, which resulted in rules that have imposed additional costs and limitations on the conduct of our business.
Asset management businesses have experienced a number of highly publicized regulatory inquiries which have resulted in increased scrutiny within the industry and new rules and regulations for mutual funds, investment advisors and broker-dealers. We areOur subsidiary, B. Riley Capital Management, LLC, is registered as an investment advisor with the SEC and the regulatory scrutiny and rulemaking initiatives may result in an increase in operational and compliance costs or the assessment of significant fines or penalties against our asset management business, and may otherwise limit our ability to engage in certain activities. In addition, the SEC staff has conducted studies with respect to soft dollar practices in the brokerage and asset management industries and proposed interpretive guidance regarding the scope of permitted brokerage and research services in connection with soft dollar practices. The SEC staff has indicated that it is considering additional rulemaking in this and other areas, and we cannot predict the effect that additional rulemaking may have on our asset management or brokerage business or whether it will be adverse to us. In addition, Congress is currently considering imposing new requirements on entities that securitize assets, which could affect our credit activities. It is impossible to determine the extent of the impact of any new laws, regulations or initiatives that may be proposed, or whether any of the proposals will become law. Compliance with any new laws or regulations could make compliance more difficult and expensive and affect the manner in which we conduct business.
Financial reforms and related regulations may negatively affect our business activities, financial position and profitability.
The Dodd-Frank Wall Street Reform and Consumer Protection Act (the “Dodd-Frank Act”) instituted a wide range of reforms that have impacted and will continue to impact financial services firms and continues to require significant rule-making. In addition, the legislation mandates multiple studies, which could result in additional legislative or regulatory action. The legislation and regulation of financial institutions, both domestically and internationally, include calls to increase capital and liquidity requirements; limit the size and types of the activities permitted; and increase taxes on some institutions. FINRA’s oversight over broker-dealers and investment advisors may be expanded, and new regulations on having investment banking and securities analyst functions in the same firm may be created. ManyCertain of the provisions of the Dodd-Frank Act remain subject to further rule making procedures and studies and will continue to take effect over several years.studies. As a result, we cannot assess the full impact of all of these legislative and regulatory changes on our business at the present time. However, these legislative and regulatory changes could affect our revenue, limit our ability to pursue business opportunities, impact the value of assets that we hold, require us to change certain of our business practices, impose additional costs on us, or otherwise adversely affect our businesses. If we do not comply with current or future legislation and regulations that apply to our operations, we may be subject to fines, penalties or material restrictions on our businesses in the jurisdiction where the violation occurred. Accordingly, such legislation or regulation could have an adverse effect on our business, results of operations, cash flows or financial condition.
If we cannot meet our future capital requirements, we may be unable to develop and enhance our services, take advantage of business opportunities and respond to competitive pressures.
We may need to raise additional funds in the future to grow our business internally, invest in new businesses, expand through acquisitions, enhance our current services or respond to changes in our target markets. If we raise additional capital through the sale of equity or equity derivative securities, the issuance of these securities could result in dilution to our existing stockholders. If additional funds are raised through the issuance of debt securities, the terms of that debt could impose additional restrictions on our operations or harm our financial condition. Additional financing may be unavailable on acceptable terms.
Our failureability to deal appropriatelyuse net loss carryovers to reduce our taxable income may be limited.
As a result of the common stock offering that was completed on June 5, 2014, the Company had a more than 50% ownership shift in accordance with conflictsSection 382 of interestthe Internal Revenue Code of 1986, as amended (the “Code”). Accordingly, the Company may be limited to the amount of net operating loss that may be utilized in future taxable years depending on the Company’s actual taxable income. As a result of the acquisition of UOL on July 1, 2016, the historical net operating losses of UOL are limited to offset income we generate post acquisition. As of December 31, 2019, the Company believes that the net operating loss that existed as of the more than 50% ownership shift will be utilized in future tax periods before the loss carryforwards expire and it is more-likely-than-not that future taxable earnings will be sufficient to realize its deferred tax assets and has not provided an allowance. However, to the extent that the Company is unable to utilize such net operating loss, it may have a material adverse effect on our financial condition and results of operations.
The tax benefits, grants and other incentives available to us require us to continue to meet various conditions and may be terminated, repaid or reduced in the future, which could damageincrease our reputationcosts and taxes.
The Israeli government currently provides major tax and capital investment incentives to domestic companies, as well as grant and loan programs relating to research and development and marketing and export activities. In recent years, the Israeli Government has reduced the benefits available under these programs and the Israeli Governmental authorities have indicated that the government may in the future further reduce, seek repayment or eliminate the benefits of those programs. magicJack currently takes advantage of these programs. There is no assurance that we will continue to meet the conditions of such benefits and programs or that such benefits and programs would continue to be available to us in the future. If we fail to meet the conditions of such benefits and programs or if they are terminated or further reduced, it could have an adverse effect on our business, operating results and financial condition.
Changes in tax laws or regulations, or to interpretations of existing tax laws or regulations, to which we are subject could adversely affect our business.financial condition and cash flows.
As we have expandedWe are subject to taxation in the numberUnited States and scope of our businesses, we increasingly confront potential conflicts of interest relating to ourin some foreign jurisdictions. Our financial condition and our funds’ and clients’ investment and other activities. Certain of our funds have overlapping investment objectives, including funds which have different fee structures, and potential conflicts may arise with respect to our decisions regarding how to allocate investment opportunities among ourselves and those funds. For example, a decision to acquire material non-public information about a company while pursuing an investment opportunity for a particular fund gives rise to a potential conflict of interest when it results in our having to restrict the abilitycash flows are impacted by tax policy implemented at each of the Companyfederal, state, local and international levels. We cannot predict whether any changes to tax laws or other fundsregulations, or to takeinterpretations of existing tax laws or regulations, will be implemented in the future or whether any action.
In addition, there may be conflicts of interest regarding investment decisions for funds in which our officers, directors and employees, who have made and may continue to make significant personal investments in a variety of funds, are personally invested. Similarly, conflicts of interest may exist or develop regarding decisions about the allocation of specific investment opportunities between the Company and the funds.
We also have potential conflicts of interest with our investment banking and institutional clients including situations where our services to a particular client or our own proprietary or fund investments or interests conflict or are perceived to conflict with a client. It is possible that potential or perceived conflicts could give rise to investor or client dissatisfaction or litigation or regulatory enforcement actions. Appropriately dealing with conflicts of interest is complex and difficult and our reputation could be damaged if we fail, or appear to fail, to deal appropriately with one or more potential or actual conflicts of interest. Regulatory scrutiny of, or litigation in connection with, conflicts of interestsuch changes would have a material adverse effect on our reputation, which would materiallyfinancial condition and cash flows. However, future changes to tax laws or regulations, or to interpretations of existing tax laws or regulations, could increase our tax burden or otherwise adversely affect our business in a number of ways, including as a result of redemptions by our investors from our hedge funds, an inability to raise additional fundsfinancial condition and a reluctance of counterparties to do business with us.cash flows.
Our exposurefailure to legal liability is significant, and could lead to substantial damages.
We face significant legal risksmaintain effective internal control over financial reporting in our businesses. These risks include potential liability under securities laws and regulations in connectionaccordance with our capital markets, asset management and other businesses. The volume and amount of damages claimed in litigation, arbitrations, regulatory enforcement actions and other adversarial proceedings against financial services firms have increased in recent years. We also are subject to claims from disputes with our employees and our former employees under various circumstances. Risks associated with legal liability often are difficult to assess or quantify and their existence and magnitude can remain unknown for significant periods of time, making the amount of legal reserves related to these legal liabilities difficult to determine and subject to future revision. Legal or regulatory matters involving our directors, officers or employees in their individual capacities also may create exposure for us because we may be obligated or may choose to indemnify the affected individuals against liabilities and expenses they incur in connection with such matters to the extent permitted under applicable law. In addition, like other financial services companies, we may face the possibility of employee fraud or misconduct. The precautions we take to prevent and detect this activity may not be effective in all cases and there can be no assurance that we will be able to deter or prevent fraud or misconduct. Exposures from and expenses incurred related to anySection 404 of the foregoing actions or proceedingsSarbanes-Oxley Act could have a negative impactmaterial adverse effect on our financial condition, results of operations and business and the price of our common stock and other securities.
The Sarbanes-Oxley Act and the related rules require our management to conduct an annual assessment of the effectiveness of our internal control over financial condition. In addition, futurereporting and require a report by our independent registered public accounting firm addressing our internal control over financial reporting. To comply with Section 404 of the Sarbanes-Oxley Act, we are required to document formal policies, processes and practices related to financial reporting that are necessary to comply with Section 404. Such policies, processes and practices are important to ensure the identification of key financial reporting risks, assessment of their potential impact and linkage of those risks to specific areas and activities within our organization.
If we fail for any reason to comply with the requirements of Section 404 in a timely manner, our independent registered public accounting firm may, at that time, issue an adverse report regarding the effectiveness of our internal control over financial reporting. Matters impacting our internal controls may cause us to be unable to report our financial information on a timely basis and thereby subject us to adverse regulatory consequences, including sanctions by the SEC or violations of applicable stock exchange listing rules. There could also be a negative reaction in the financial markets due to a loss of investor confidence in us and the reliability of our financial statements. Any such event could adversely affect our financial condition, results of operations and business, and result in a decline in the price of our common stock and other securities.
We may suffer losses if our reputation is harmed.
Our ability to attract and retain customers and employees may be diminished to the extent our reputation is damaged. If we fail, or are perceived to fail, to address various issues that may give rise to reputational risk, we could harm our business prospects. These issues include, but are not limited to, appropriately dealing with market dynamics, potential conflicts of interest, legal and regulatory requirements, ethical issues, customer privacy, record-keeping, sales and trading practices, and the proper identification of the legal, reputational, credit, liquidity and market risks inherent in our products and services. Failure to appropriately address these issues could give rise to loss of existing or future business, financial loss, and legal or regulatory liability, including complaints, claims and enforcement proceedings against us, which could, in turn, subject us to fines, judgments and other penalties. In addition, our Capital Markets operations depend to a large extent on our relationships with our clients and reputation for integrity and high-caliber professional services to attract and retain clients. As a result, if a client is not satisfied with our services, it may be adversely affected if reserves relating to these legal liabilities are required to be increased or legal proceedings are resolvedmore damaging in excess of established reserves.our business than in other businesses.
Misconduct by our employees or by the employees of our business partners could harm us and is difficult to detect and prevent.
There have been a number of highly publicized cases involving fraud or other misconduct by employees in the financial services industry in recent years, and we run the risk that employee misconduct could occur at our firm. For example, misconduct could involve the improper use or disclosure of confidential information, which could result in regulatory sanctions and serious reputational or financial harm. It is not always possible to deter misconduct and the precautions we take to detect and prevent this activity may not be effective in all cases. Our ability to detect and prevent misconduct by entities with which we do business may be even more limited. We may suffer reputational harm for any misconduct by our employees or those entities with which we do business.
We may not pay dividends regularly or at all in the future.
From time to time, we may decide to pay dividends which will be dependent upon our financial condition and results of operations. Our Board of Directors may reduce or discontinue dividends at any time for any reason it deems relevant and there can be no assurances that we will continue to generate sufficient cash to pay dividends, or that we will continue to pay dividends with the cash that we do generate. The determination regarding the payment of dividends is subject to the discretion of our Board of Directors, and there can be no assurances that we will continue to generate sufficient cash to pay dividends, or that we will pay dividends in future periods.
Security breaches and other disruptions could compromise our information and expose us to liability, which would cause our business and reputation to suffer.
In the ordinary course of our business, we collect and store sensitive data, including intellectual property, our proprietary business information and that of our customers, clients and business partners, and personally identifiable information of our employees, in our servers and on our networks. The secure processing, maintenance and transmission of this information is critical to our operations and business strategy. Despite our security measures, our information technology and infrastructure may be vulnerable to attacks by hackers or breached due to employee error, malfeasance or other disruptions. Any such breach could compromise our networks and the information stored there could be accessed, publicly disclosed, lost or stolen. Any such access, disclosure or other loss of information could result in legal claims or proceedings, liability under laws that protect the privacy of personal information, and regulatory penalties. In addition, such a breach could disrupt our operations and the services we provide to our clients, damage our reputation, and cause a loss of confidence in our services, which could adversely affect our business and our financial condition.
We may enter into new lines of business, make strategic investments or acquisitions or enter into joint ventures, each of which may result in additional risks and uncertainties for our business.
We may enter into new lines of business, make future strategic investments or acquisitions and enter into joint ventures. As we have in the past, and subject to market conditions, we may grow our business by increasing assets under management in existing investment strategies, pursue new investment strategies, which may be similar or complementary to our existing strategies or be wholly new initiatives, or enter into strategic relationships, or joint ventures. In addition, opportunities may arise to acquire or invest in other businesses that are related or unrelated to our current businesses.
To the extent we make strategic investments or acquisitions, enter into strategic relationships or joint ventures or enter into new lines of business, we will face numerous risks and uncertainties, including risks associated with the required investment of capital and other resources and with combining or integrating operational and management systems and controls and managing potential conflicts. Entry into certain lines of business may subject us to new laws and regulations with which we are not familiar, or from which we are currently exempt, and may lead to increased litigation and regulatory risk. If a new business generates insufficient revenues, or produces investment losses, or if we are unable to efficiently manage our expanded operations, our results of operations will be adversely affected, and our reputation and business may be harmed. In the case of joint ventures, we are subject to additional risks and uncertainties in that we may be dependent upon, and subject to liability, losses or reputational damage relating to, systems, controls and personnel that are not under our control.
Risks Related to Our Capital Markets Activities
Our corporate finance and strategic advisory engagements are singular in nature and do not generally provide for subsequent engagements.
Our investment banking clients generally retain us on a short-term, engagement-by-engagement basis in connection with specific corporate finance, merger and acquisition transactions (often as an advisor in company sale transactions) and other strategic advisory services, rather than on a recurring basis under long-term contracts. As these transactions are typically singular in nature and our engagements with these clients may not recur, we must seek new engagements when our current engagements are successfully completed or are terminated. As a result, high activity levels in any period are not necessarily indicative of continued high levels of activity in any subsequent period. If we are unable to generate a substantial number of new engagements that generate fees from new or existing clients, our business, results of operations afterand financial condition could be adversely affected.
Our Capital Markets operations are highly dependent on communications, information and other systems and third parties, and any systems failures could significantly disrupt our capital markets business.
Our data and transaction processing, custody, financial, accounting and other technology and operating systems are essential to our capital markets operations. A system malfunction (due to hardware failure, capacity overload, security incident, data corruption, etc.) or mistake made relating to the acquisitionsprocessing of FBRtransactions could result in financial loss, liability to clients, regulatory intervention, reputational damage and Wunderlichconstraints on our ability to grow. We outsource a substantial portion of our critical data processing activities, including trade processing and back office data processing. We also contract with third parties for market data and other services. In the event that any of these service providers fails to adequately perform such services or the relationship between that service provider and us is terminated, we may experience a significant disruption in our operations, including our ability to timely and accurately process transactions or maintain complete and accurate records of those transactions.
Adapting or developing our technology systems to meet new regulatory requirements, client needs, expansion and industry demands also is critical for our business. Introduction of new technologies present new challenges on a regular basis. We have an ongoing need to upgrade and improve our various technology systems, including our data and transaction processing, financial, accounting, risk management and trading systems. This need could present operational issues or require significant capital spending. It also may require us to make additional investments in technology systems and may require us to reevaluate the current value and/or expected useful lives of our technology systems, which could negatively impact our results of operations.
Secure processing, storage and transmission of confidential and other information in our internal and outsourced computer systems and networks also is critically important to our business. We take protective measures and endeavor to modify them as circumstances warrant. However, our computer systems and software are subject to unauthorized access, computer viruses or other malicious code, inadvertent, erroneous or intercepted transmission of information (including by e-mail), and other events that have had an information security impact. If one or more of such events occur, this potentially could jeopardize our or our clients’ or counterparties’ confidential and other information processed and stored in, and transmitted through, our computer systems and networks, or otherwise cause interruptions or malfunctions in our, our clients’, our counterparties’ or third parties’ operations. We may be affectedrequired to expend significant additional resources to modify our protective measures or to investigate and remediate vulnerabilities or other exposures, and we may be subject to litigation and financial losses that are either not insured against or not fully covered through any insurance maintained by factors different from thoseus.
A disruption in the infrastructure that affectedsupports our independentbusiness due to fire, natural disaster, health emergency (for example, the ongoing COVID-19 pandemic), power or communication failure, act of terrorism or war may affect our ability to service and interact with our clients. If we are not able to implement contingency plans effectively, any such disruption could harm our results of operations. Due to the ongoing COVID-19 pandemic, many businesses, including ours, have shifted largely to telecommuting. While we continue to evaluate the situation and invest in our operations.technological infrastructure, the duration and effects of this shift are uncertain, but could make our operations more vulnerable.
OurThe growth of electronic trading and the introduction of new technology in the markets in which our market-making business operates may adversely affect this business and may increase competition.
The continued growth of electronic trading and the introduction of new technologies is changing our market-making business and presenting new challenges. Securities, futures and options transactions are increasingly occurring electronically, through alternative trading systems. We expect that the trend toward alternative trading systems will continue to accelerate. This acceleration could further increase program trading, increase the speed of transactions and decrease our ability to participate in transactions as principal, which would reduce the profitability of our market-making business. Some of these alternative trading systems compete with our market-making business and with our algorithmic trading platform, and we may experience continued competitive pressures in these and other areas. Significant resources have been invested in the development of our electronic trading systems, which includes our at-the-market business, but there is no assurance that the revenues generated by these systems will yield an adequate return on the investment, particularly given the increased program trading and increased percentage of stocks trading off of the historically manual trading markets.
Pricing and other competitive pressures may impair the revenues of our sales and trading business.
We derive a significant portion of our revenues for our investment banking operations from our sales and trading business. There has been intense price competition and trading volume reduction in this business in recent years. In particular, the ability to execute trades electronically and through alternative trading systems has increased the downward pressure on per share trading commissions and spreads. We expect these trends toward alternative trading systems and downward pricing pressure in the business to continue. We experience competitive pressures in these and other areas in the future as some of eachour competitors seek to obtain market share by competing on the basis of FBRprice or by using their own capital to facilitate client trading activities. In addition, we face pressure from our larger competitors, many of whom are better able to offer a broader range of complementary products and Wunderlich differservices to clients in certain respectsorder to win their trading business. These larger competitors may also be better able to respond to changes in the research, brokerage and accordingly,investment banking industries, to compete for skilled professionals, to finance acquisitions, to fund internal growth and to compete for market share generally. As we are committed to maintaining and improving our comprehensive research coverage in our target sectors to support our sales and trading business, we may be required to make substantial investments in our research capabilities to remain competitive. If we are unable to compete effectively in these areas, the revenues of our sales and trading business may decline, and our business, results of operations and financial condition may be harmed.
Some of our large institutional sales and trading clients in terms of brokerage revenues have entered into arrangements with us and other investment banking firms under which they separate payments for research products or services from trading commissions for sales and trading services, and pay for research directly in cash, instead of compensating the research providers through trading commissions (referred to as “soft dollar” practices). In addition, we have entered into certain commission sharing arrangements in which institutional clients execute trades with a limited number of brokers and instruct those brokers to allocate a portion of the combined companycommission directly to us or other broker-dealers for research or to an independent research provider. If more of such arrangements are reached between our clients and us, or if similar practices are adopted by more firms in the market priceinvestment banking industry, we expect that would increase the competitive pressures on trading commissions and spreads and reduce the value our clients place on high quality research. Conversely, if we are unable to make similar arrangements with other investment managers that insist on separating trading commissions from research products, volumes and trading commissions in our sales and trading business also would likely decrease.
Larger and more frequent capital commitments in our trading and underwriting businesses increase the potential for significant losses.
Certain financial services firms make larger and more frequent commitments of capital in many of their activities. For example, in order to win business, some investment banks increasingly commit to purchase large blocks of stock from publicly traded issuers or significant stockholders, instead of the combined company’s common sharesmore traditional marketed underwriting process in which marketing is typically completed before an investment bank commits to purchase securities for resale. We have participated in this activity and expect to continue to do so and, as a result, we are subject to increased risk. Conversely, if we do not have sufficient regulatory capital to so participate, our business may be affected by factors differentsuffer. Furthermore, we may suffer losses as a result of the positions taken in these transactions even when economic and market conditions are generally favorable for others in the industry.
We may increasingly commit our own capital as part of our trading business to facilitate client sales and trading activities. The number and size of these transactions may adversely affect our results of operations in a given period. We may also incur significant losses from those that affected our independentsales and trading activities due to market fluctuations and volatility in our results of operations. To the extent that we own assets, i.e., have long positions, in any of those markets, a downturn in the value of those assets or in those markets could result in losses. Conversely, to the extent that we have sold assets we do not own, i.e., have short positions, in any of those markets, an upturn in those markets could expose us to potentially large losses as we attempt to cover our short positions by acquiring assets in a rising market.
Our underwriting and market making activities may place our capital at risk.
We may incur losses and be subject to reputational harm to the extent that, for any reason, we are unable to sell securities we purchased as an underwriter at the anticipated price levels. As an underwriter, we also are subject to heightened standards regarding liability for material misstatements or omissions in prospectuses and other offering documents relating to offerings we underwrite. Further, even though underwriting agreements with issuing companies typically include a right to indemnification in favor of the underwriter for these offerings to cover potential liability from any material misstatements or omissions, indemnification may be unavailable or insufficient in certain circumstances, for example if the issuing company has become insolvent. As a market maker, we may own large positions in specific securities, and these undiversified holdings concentrate the risk of market fluctuations and may result in greater losses than would be the case if our holdings were more diversified.
We are subject to net capital and other regulatory capital requirements; failure to comply with these rules would significantly harm our business.
Our broker-dealer subsidiaries are subject to the net capital requirements of the SEC, FINRA, and various self-regulatory organizations of which they are members. These requirements typically specify the minimum level of net capital a broker-dealer must maintain and also mandate that a significant part of its assets be kept in relatively liquid form. Failure to maintain the required net capital may subject a firm to limitation of its activities, including suspension or revocation of its registration by the SEC and suspension or expulsion by FINRA and other regulatory bodies, and ultimately may require its liquidation. Failure to comply with the net capital rules could have material and adverse consequences, such as:
| ● | limiting our operations that require intensive use of capital, such as underwriting or trading activities; or |
| ● | restricting us from withdrawing capital from our subsidiaries when our broker-dealer subsidiaries have more than the minimum amount of required capital. This, in turn, could limit our ability to implement our business and growth strategies, pay interest on and repay the principal of our debt and/or repurchase our shares. |
In addition, a change in the net capital rules or the imposition of new rules affecting the scope, coverage, calculation, or amount of net capital requirements, or a significant operating loss or any large charge against net capital, could have similar adverse effects.
Furthermore, our broker-dealer subsidiaries are subject to laws that authorize regulatory bodies to block or reduce the flow of funds from it to B. Riley Financial, Inc. As a holding company, B. Riley Financial, Inc. depends on dividends, distributions and other payments from its subsidiaries to fund dividend payments, if any, and to fund all payments on its obligations, including debt obligations. As a result, regulatory actions could impede access to funds that B. Riley Financial, Inc. needs to make payments on obligations, including debt obligations, or dividend payments. In addition, because B. Riley Financial, Inc. holds equity interests in the firm’s subsidiaries, its rights as an equity holder to the assets of these subsidiaries may not materialize, if at all, until the claims of the creditors of these subsidiaries are first satisfied.
Risks Related to our Principal Investments Activities
The combined companyWe have made and may make principal investments in relatively high-risk, illiquid assets that often have significantly leveraged capital structures, and we may fail to realize any profits from these activities for a considerable period of time or lose some or all of the principal amount we invest in these activities.
From time to time, we use our capital, including on a leveraged basis, in proprietary investments in both private company and public company securities that may be illiquid and volatile. The equity securities of a privately-held entity in which we make a proprietary investment are likely to be restricted as to resale and are otherwise typically highly illiquid. In the case of fund or similar investments, our investments may be illiquid until such investment vehicles are liquidated. We expect that there will be restrictions on our ability to resell the securities that we acquire for a period of up to one year after we acquire those securities. Thereafter, a public market sale may be subject to volume limitations or dependent upon securing a registration statement for an initial and potentially secondary public offering of the securities. We may make principal investments that are significant relative to the overall capitalization of the investee company and resales of significant amounts of these securities might be subject to significant limitations and adversely affect the market and the sales price for the securities in which we invest. In addition, our Principal Investments may involve entities or businesses with capital structures that have significant leverage. The large amount of borrowing in the leveraged capital structure increases the risk of losses due to factors such as rising inflation, interest rates, downturns in the economy or deteriorations in the condition of the investment or its industry. In the event of defaults under borrowings, the assets being financed would be at risk of foreclosure, and we could lose our entire investment.
Even if we make an appropriate investment decision based on the intrinsic value of an enterprise, we cannot assure you that general market conditions will not cause the market value of our investments to decline. For example, a further increase in inflation, interest rates, a general decline in the stock markets, such as the recent declines in the stock markets due to the anticipated benefitsrising interest rate environment, or other market and industry conditions adverse to companies of the type in which we invest and intend to invest could result in a decline in the value of our acquisitionsinvestments or a total loss of FBRour investment.
In addition, some of these investments are, or may in the future be, in industries or sectors which are unstable, in distress or undergoing some uncertainty. Further, the companies in which we invest may rely on new or developing technologies or novel business models, or concentrate on markets which are or may be disproportionately impacted by pressures in the financial services and/or mortgage and Wunderlich.
The successreal estate sectors, have not yet developed and which may never develop sufficiently to support successful operations, or their existing business operations may deteriorate or may not expand or perform as projected. Such investments may be subject to rapid changes in value caused by sudden company-specific or industry-wide developments. Contributing capital to these investments is risky, and we may lose some or all of the acquisitionsprincipal amount of FBR and Wunderlich will depend on,our investments. There are no regularly quoted market prices for a number of the investments that we make. The value of our investments is determined using fair value methodologies described in valuation policies, which may consider, among other things, the combined company’s ability to combinenature of the businessesinvestment, the expected cash flows from the investment, bid or ask prices provided by third parties for the investment and the trading price of us, FBRrecent sales of securities (in the case of publicly-traded securities), restrictions on transfer and Wunderlich. If the combined company is not able to successfully achieve this objective, the anticipated benefits of each merger may not be realized fully, or at all, or may take longer to realize than expected.
Priorother recognized valuation methodologies. The methodologies we use in valuing individual investments are based on estimates and assumptions specific to the consummationparticular investments. Therefore, the value of acquisitions, we and each of FBR and Wunderlich operated independently. It is possibleour investments does not necessarily reflect the prices that would actually be obtained by us when such investments are sold. Realizations, if any, at values significantly lower than the integration process or other factors couldvalues at which investments have been reflected on our balance sheet would result in the loss or departureloses of key employees, the disruption of the ongoing business of us, FBR or Wunderlich, or inconsistencies in standards, controls, procedurespotential incentive income and policies. It is also possible that clients, customers and counterparties of us, FBR or Wunderlich could choose to discontinue their relationships with the combined company because they prefer doing business with an independent company or for any other reason, which would adversely affect the future performance of the combined company. These transition matters could have an adverse effect on us for an undetermined amount of time after the consummation of the acquisitions of FBR and Wunderlich. Principal Investments.
We may experience difficulties in realizing the expected benefitsare exposed to credit risk from a variety of the acquisitionour activities, including loans, lines of UOL.
Our ability to achieve the benefits we anticipate from the acquisition of UOL will depend in large part upon whether we are able to achieve expected cost savings, manage UOL’s businesscredit, guarantees and execute our strategy in an efficientbackstop commitments, and effective manner. Because our business and the business of UOL differ, we may not be able to manage UOL’s business smoothlyfully realize the value of the collateral securing certain of our loans.
We are generally exposed to the risk that third parties that owe us money, securities or successfullyother assets will fail to meet their obligations to us due to numerous causes, including bankruptcy, lack of liquidity, or operational failure, among others. Additionally, when we guarantee or backstop the obligations of third parties, we are exposed to the risk that our guarantee or backstop may be called by the holder following a default by the primary obligor, which could cause us to incur significant losses, and, when our obligations are secured, expose us to the processrisk that the holder may seek to foreclose on collateral pledged by us.
We incur credit risk through loans, lines of achieving expected cost savingscredit, guarantees and backstop commitments issued to or on behalf of businesses and individuals, and other loans collateralized by a variety of assets, including securities. Our credit risk and credit losses can increase if our loans or investments are concentrated among borrowers or issuers engaged in the same or similar activities, industries, or geographies, or to borrowers or issuers who as a group may take longer than expected.be uniquely or disproportionately affected by economic or market conditions. The deterioration of an individually large exposure, for example due to natural disasters, health emergencies or pandemics (like the ongoing COVID-19 pandemic), acts of terrorism or war, severe weather events or other adverse economic events, could lead to additional loan loss provisions and/or charges-offs, or credit impairment of our investments, and subsequently have a material impact on our net income and regulatory capital.
The amount and duration of our credit exposures have been increasing over the past year, as have the breadth and size of the entities to which we have credit exposures.
We permit our clients to purchase securities on margin. During periods of steep declines in securities prices, the value of the collateral securing client margin loans may fall below the amount of the purchaser’s indebtedness. If weclients are unable to manage the operations of UOL’s business successfully,provide additional collateral for these margin loans, we may incur losses on those margin transactions. This may cause us to incur additional expenses defending or pursuing claims or litigation related to counterparty or client defaults.
Although a substantial amount of our loans to counterparties are protected by holding security interests in the assets or equity interests of the borrower, we may not be unableable to fully realize the cost savingsvalue of the collateral securing our loans due to one or more of the following factors:
| ● | Our loans may be unsecured, therefore our liens on the collateral, if any, are subordinated to those of the senior secured debt of the borrower, if any. As a result, we may not be able to control remedies with respect to the collateral. |
| ● | The collateral may not be valuable enough to satisfy all of the obligations under our secured loan, particularly after giving effect to the repayment of secured debt of the borrower that ranks senior to our loan. |
| ● | Bankruptcy laws may limit our ability to realize value from the collateral and may delay the realization process. |
| ● | Our rights in the collateral may be adversely affected by the failure to perfect security interests in the collateral. |
| ● | The need to obtain regulatory and contractual consents could impair or impede how effectively the collateral would be liquidated and could affect the value received. |
| ● | Some or all of the collateral may be illiquid and may have no readily ascertainable market value. The liquidity and value of the collateral could be impaired as a result of changing economic conditions, competition, and other factors, including the availability of suitable buyers. |
We may experience write downs of our investments and other anticipated benefitslosses related to the valuation of our investments and volatile and illiquid market conditions.
In our proprietary investment activities, our concentrated holdings, illiquidity and market volatility may make it difficult to value certain of our investment securities. Subsequent valuations, in light of factors then prevailing, may result in significant changes in the values of these securities in future periods. In addition, at the time of any sales and settlements of these securities, the price we expectultimately realize will depend on the demand and liquidity in the market at that time and may be materially lower than their current fair value. Any of these factors could require us to achievetake write downs in the value of our investment and securities portfolio, which may have an adverse effect on our results of operations in future periods.
Risks Related to our Auction and Liquidation Activities
We may incur losses as a result of “guarantee” based engagements that we enter into in connection with our auction and liquidation solutions business.
In many instances, in order to secure an engagement, we are required to bid for that engagement by guaranteeing to the UOL acquisition. Asclient a minimum amount that such client will receive from the sale of inventory or assets. Our bid is based on a variety of factors, including: our experience, expertise, perceived value added by engagement, valuation of the inventory or assets and the prices we believe potential buyers would be willing to pay for such inventory or assets. An inaccurate estimate of any of the above or inaccurate valuation of the assets or inventory could result in us submitting a bid that exceeds the realizable proceeds from any engagement. If the liquidation proceeds, net of direct operating expenses, are less than the amount we guaranteed in our businessbid, we will incur a loss. Therefore, in the event that the proceeds, net of direct operating expenses, from an engagement are less than the bid, the value of the assets or inventory decline in value prior to the disposition or liquidation, or the assets are overvalued for any reason, we may suffer a loss and our financial condition and results of operations could be adversely affectedaffected.
Losses due to any auction or liquidation engagement may cause us to become unable to make payments due to our creditors and may cause us to default on our debt obligations.
We have three engagement structures for our auction and liquidation services: (i) a “fee” based structure under which we are compensated for our role in an engagement on a commission basis, (ii) purchase on an outright basis (and take title to) the assets or inventory of the client, and (iii) “guarantee” to the client that a certain amount will be realized by the client upon the sale of the assets or inventory based on contractually defined terms in the auction or liquidation contract. We bear the risk of loss under the purchase and guarantee structures of auction and liquidation contracts. If the amount realized from the sale or disposition of assets, net of direct operating expenses, does not equal or exceed the purchase price (in purchase transaction), we will recognize a loss on the engagement, or should the amount realized, net of direct operating expenses, not equal or exceed the “guarantee,” we are still required to pay the guaranteed amount to the client.
We could incur losses in connection with outright purchase transactions in which we engage as part of our auction and liquidation solutions business.
When we conduct an asset disposition or liquidation on an outright purchase basis, we purchase from the client the assets or inventory to be sold or liquidated and therefore, we hold title to any assets or inventory that we are not able to sell. In other situations, we may acquire assets from our clients if we believe that we can identify a potential buyer and sell the assets at a premium to the price paid. We store these unsold or acquired assets and inventory until they can be sold or, alternatively, transported to the site of a liquidation of comparable assets or inventory that we are conducting. If we are forced to sell these assets for less than we paid, or are required to transport and store assets multiple times, the related expenses could have a material adverse effect on our results of operations.
We could be forced to mark down the value of certain assets acquired in connection with outright purchase transactions.
In most instances, inventory is reported on the balance sheet at its historical cost; however, according to U.S. Generally Accepted Accounting Principles, inventory whose historical cost exceeds its market value should be valued conservatively, which dictates a lower value should apply. Accordingly, should the replacement cost (due to technological obsolescence or otherwise), or the net realizable value of any inventory we hold be less than the cost paid to acquire such inventory (purchase price), we will be required to “mark down” the value of such inventory held. If the value of any inventory held on our balance sheet is required to be written down, such write down could have a material adverse effect on our financial position and results of operations.
We frequently use borrowings under credit facilities in connection with our guaranty engagements, in which we guarantee a minimum recovery to the client, and outright purchase transactions.
In engagements where we operate on a guaranty or purchase basis, we are typically required to make an upfront payment to the client. If the upfront payment is less than 100% of the guarantee or the purchase price in a “purchase” transaction, we may be required to make successive cash payments until the guarantee is met or we may issue a letter of credit in favor of the client. Depending on the size and structure of the engagement, we may borrow under our credit facilities and may be required to issue a letter of credit in favor of the client for these additional amounts. If we lose any availability under our credit facilities, are unable to borrow under credit facilities and/or issue letters of credit in favor of clients, or borrow under credit facilities and/or issue letters of credit on commercially reasonable terms, we may be unable to pursue large liquidation and disposition engagements, engage in multiple concurrent engagements, pursue new engagements or expand our operations. We are required to obtain approval from the lenders under our existing credit facilities prior to making any borrowings thereunder in connection with a particular engagement. Any inability to borrow under our credit facilities, or enter into one or more other credit facilities on commercially reasonable terms may have a material adverse effect on our financial condition, results of operations and growth.
Defaults under our credit agreements could have an adverse impact on our ability to finance potential engagements.
The terms of our credit agreements contain a number of events of default. Should we default under any of our credit agreements in the future, lenders may take any or all remedial actions set forth in such credit agreement, including, but not limited to, accelerating payment and/or charging us a default rate of interest on all outstanding amounts, refusing to make any further advances or issue letters of credit, or terminating the line of credit. As a result of our reliance on lines of credit and letters of credit, any default under a credit agreement, or remedial actions pursued by lenders following any default under a credit agreement, may require us to immediately repay all outstanding amounts, which may preclude us from pursuing new liquidation and disposition engagements and may increase our cost of capital, each of which may have a material adverse effect on our financial condition and results of operations.
Risks Related to Our Financial Consulting Activities
We depend on financial institutions as primary clients for our financial consulting business. Consequently, the loss of any financial institutions as clients may have an adverse impact on our business.
A majority of the revenue from our financial consulting business is derived from engagements by financial institutions. As a result, any loss of financial institutions as clients of our valuation and advisory services, whether due to changing preferences in service providers, failures of financial institutions or mergers and consolidations within the finance industry, could significantly reduce the number of existing, repeat and potential clients, thereby adversely affecting our revenues. In addition, any larger financial institutions that result from mergers or consolidations in the financial services industry could have greater leverage in negotiating terms of engagements with us, or could decide to internally perform some or all of the financial consulting services which we currently provide to one of the constituent institutions involved in the merger or consolidation or which we could provide in the future. Any of these developments could have a material adverse effect on our financial consulting business.
We may face liability or harm to our reputation as a result of a claim that we provided an inaccurate appraisal or valuation and our insurance coverage may not be sufficient to cover the liability.
We could face liability in connection with a claim by a client that we provided an inaccurate appraisal or valuation on which the client relied. Any claim of this type, whether with or without merit, could result in costly litigation, which could divert management’s attention and company resources and harm our reputation. Furthermore, if we are found to be liable, we may be required to pay damages. While our appraisals and valuations are typically provided only for the benefit of our clients, if a third party relies on an appraisal or valuation and suffers harm as a result, we may become subject to a legal claim, even if the claim is without merit. We carry insurance for liability resulting from errors or omissions in connection with our appraisals and valuations; however, the coverage may not be sufficient if we are found to be liable in connection with a claim by a client or third party.
Risks Related to our Asset Management Business
The asset management business is intensely competitive.
Over the past several years, the size and number of asset management funds, including hedge funds and mutual funds, has continued to increase. If this trend continues, it is possible that it will become increasingly difficult for our funds to raise capital. More significantly, the allocation of increasing amounts of capital to alternative investment strategies by institutional and individual investors leads to a reduction in the size and duration of pricing inefficiencies. Many alternative investment strategies seek to exploit these inefficiencies and, in certain industries, this drives prices for investments higher, in either case increasing the difficulty of achieving targeted returns. In addition, when inflation or interest rates rise or there is a prolonged bear market in equities, the attractiveness of our funds relative to investments in other investment products could decrease. Competition is based on a variety of factors, including:
| ● | investment performance; |
| ● | investor perception of the drive, focus and alignment of interest of an investment manager; |
| ● | quality of service provided to and duration of relationship with investors; |
| ● | business reputation; and |
| ● | level of fees and expenses charged for services. |
We compete in the asset management business with a large number of investment management firms, private equity fund sponsors, hedge fund sponsors and other financial institutions. A number of factors serve to increase our competitive risks, as follows:
| ● | investors may develop concerns that we will allow a fund to grow to the detriment of its performance; |
| ● | some of our competitors have greater capital, lower targeted returns or greater sector or investment strategy specific expertise than we do, which creates competitive disadvantages with respect to investment opportunities; |
| ● | some of our competitors may perceive risk differently than we do which could allow them either to outbid us for investments in particular sectors or, generally, to consider a wider variety of investments; |
| ● | there are relatively few barriers to entry impeding new asset management firms, and the successful efforts of new entrants into our various lines of business, including former “star” portfolio managers at large diversified financial institutions as well as such institutions themselves, will continue to result in increased competition; and |
| ● | other industry participants in the asset management business continuously seek to recruit our best and brightest investment professionals away from us. |
These and other factors could reduce our earnings and revenues and adversely affect our business. In addition, if we are forced to compete with other alternative asset managers on the basis of price, we may not be able to maintain our current base management and incentive fee structures. We have historically competed primarily on the performance of our funds, and not on the level of our fees relative to those of our competitors. However, there is a risk that fees in the alternative investment management industry will decline, without regard to the historical performance of a manager, including our managers. Fee reductions on our existing or future funds, without corresponding decreases in our cost structure, would adversely affect our revenues and distributable earnings.
Poor investment performance may decrease assets under management and reduce revenues from and the market priceprofitability of our asset management business.
Revenues from our asset management business are primarily derived from asset management fees. Asset management fees are generally comprised of management and incentive fees. Management fees are typically based on assets under management, and incentive fees are earned on a quarterly or annual basis only if the return on our managed accounts exceeds a certain threshold return, or “highwater mark,” for each investor. We will not earn incentive fee income during a particular period, even when a fund had positive returns in that period, if we do not generate cumulative performance that surpasses a highwater mark. If a fund experiences losses, we will not earn incentive fees with regard to investors in that fund until its returns exceed the relevant highwater mark.
In addition, investment performance is one of the most important factors in retaining existing investors and competing for new asset management business. Investment performance may be poor as a result of the current or future difficult market or economic conditions, including changes in interest rates, with increases anticipated in 2022, or inflation, which has been an ongoing concern during 2021 and into 2022, acts of war, aggression or terrorism, widespread outbreaks of disease, such as the ongoing COVID-19 pandemic, or political uncertainty, our investment style, the particular investments that we make, and other factors. Poor investment performance may result in a decline in our revenues and income by causing (i) the net asset value of the assets under our management to decrease, which would result in lower management fees to us, (ii) lower investment returns, resulting in a reduction of incentive fee income to us, and (iii) investor redemptions, which would result in lower fees to us because we would have fewer assets under management.
To the extent our future investment performance is perceived to be poor in either relative or absolute terms, the revenues and profitability of our asset management business will likely be reduced and our ability to grow existing funds and raise new funds in the future will likely be impaired.
The historical returns of our funds may not be indicative of the future results of our funds.
The historical returns of our funds should not be considered indicative of the future results that should be expected from such funds or from any future funds we may raise. Our rates of returns reflect unrealized gains, as of the applicable measurement date, which may never be realized due to changes in market and other conditions not in our control that may adversely affect the ultimate value realized from the investments in a fund. The returns of our funds may have also benefited from investment opportunities and general market conditions that may not repeat themselves, and there can be no assurance that our current or future funds will be able to avail themselves of profitable investment opportunities. Furthermore, the historical and potential future returns of the funds we manage also may not necessarily bear any relationship to potential returns on our common stock could be negatively impacted.stock.
UOL competesWe are subject to risks in using custodians.
Our asset management subsidiary and its managed funds depend on the services of custodians to settle and report securities transactions. In the event of the insolvency of a custodian, our funds might not be able to recover equivalent assets in whole or in part as they will rank among the custodian’s unsecured creditors in relation to assets which the custodian borrows, lends or otherwise uses. In addition, cash held by our funds with the custodian will not be segregated from the custodian’s own cash, and the funds will therefore rank as unsecured creditors in relation thereto.
We manage debt investments that involve significant risks and potential additional liabilities.
GACP I., L.P. and GACP II, L.P., both direct lending funds of which our wholly owned subsidiary GACP is the general partner, and which are managed by WhiteHawk Capital Partners, L.P. pursuant to an investment advisory services agreement, may invest in secured debt issued by companies that have or may incur additional debt that is senior to the secured debt owned by the fund. In the event of insolvency, liquidation, dissolution, reorganization or bankruptcy of any such company, the owners of senior secured debt (i.e., the owners of first priority liens) generally will be entitled to receive proceeds from any realization of the secured collateral until they have been reimbursed. At such time, the owners of junior secured debt (including, in certain circumstances, the fund) will be entitled to receive proceeds from the realization of the collateral securing such debt. There can be no assurances that the proceeds, if any, from the sale of such collateral would be sufficient to satisfy the loan obligations secured by subordinate debt instruments. To the extent that the fund owns secured debt that is junior to other secured debt, the fund may lose the value of its entire investment in such secured debt.
In addition, the fund may invest in loans that are secured by a second lien on assets. Second lien loans have been a developed market for a relatively short period of time, and there is limited historical data on the performance of second lien loans in adverse economic circumstances. In addition, second lien loan products are subject to intercreditor arrangements with the holders of first lien indebtedness, pursuant to which the second lien holders have waived many of the rights of a secured creditor, and some rights of unsecured creditors, including rights in bankruptcy, which can materially affect recoveries. While there is broad market acceptance of some second lien intercreditor terms, no clear market standard has developed for certain other material intercreditor terms for second lien loan products. This variation in key intercreditor terms may result in dissimilar recoveries across otherwise similarly situated second lien loans in insolvency or distressed situations. While uncertainty of recovery in an insolvency or distressed situation is inherent in all debt instruments, second lien loan products carry more risks than certain other debt products.
Risks Related to Our Communications Businesses
We compete against large companies, many of whom have significantly more financial and marketing resources, and our business will suffer if we are unable to compete successfully.
UOL competesWe compete with numerous providers of broadband, mobile broadband and DSL services, as well as other dial-up Internet access providers, many of whom are large and have significantly more financial and marketing resources. TheOur principal competitors for UOL’s mobile broadband and DSL services include, among others, local exchange carriers, wireless and satellite service providers, and cable service providers. These competitors include established providers such as AT&T, Verizon, Sprint, and T-Mobile. UOL’s principal dial-up Internet access competitors include established online service and content providers, such as AOL and MSN, and independent national Internet service providers, such as EarthLink and its PeoplePC subsidiary. Dial-up Internet access services do not compete favorably with broadband services with respect to connection speed and do not have a significant, if any, price advantage over certain broadband services. In addition, there are a number of mobile virtual network operators, some of which focus on pricing as their main selling point. Certain portions of the U.S., primarily rural areas, currently have limited or no access to broadband services. However, the U.S. government has indicated its intention to facilitate the provision of broadband services to such areas. Such expansion of the availability of broadband services will increase the competition for Internet access subscribers in such areas and will likely adversely affect the UOL business. In addition to competition from broadband, mobile broadband, and DSL providers, competition among dial-up Internet access service providers is intense and neither UOL’s pricing nor the features of UOL’s services providesprovide us with a significant competitive advantage, if any, over certain of UOL’s dial-up Internet access competitors. We expect that competition, particularly with respect to price, for broadband, mobile broadband, and DSL services, as well as dial-up Internet access services, will continue and may materially and adversely impact our business, financial condition, results of operations, and cash flows.
Dial-up and DSL pay accounts may decline faster than expected and adversely impact our business.
A significant portion of UOL’s revenues and profits come from dial-up Internet and DSL access services and related services and advertising revenues. UOL’s dial-up and DSL Internet access pay accounts and revenues have been declining and are expected to continue to decline due to the continued maturation of the market for dial-up and DSL Internet access, competitive pressures in the industry and limited sales efforts. Consumers continue to migrate to broadband access, primarily due to the faster connection and download speeds provided by broadband access. Advanced applications such as online gaming, music downloads and videos require greater bandwidth for optimal performance, which adds to the demand for broadband access. The pricing for basic broadband services has been declining as well, making it a more viable option for consumers. In addition, the popularity of accessing the Internet through tablets and mobile devices has been growing and may accelerate the migration of consumers away from dial-up Internet access. The number of dial-up Internet access pay accounts has been adversely impacted by both a decrease in the number of new pay accounts signing up for UOL’s services, as well as the impact of subscribers canceling their accounts, which we refer to as “churn.” Churn has increased from time to time and may increase in the future. If we experience a higher than expected level of churn, it will make it more difficult for us to increase or maintain the number of pay accounts, which could adversely affect our business, financial condition, results of operations, and cash flows.
We expect UOL’s dial-up and DSL Internet access pay accounts to continue to decline. As a result, related services revenues and the profitability of this segment may decline. The rate of decline in these revenues may continue to accelerate.
We may not be able to consistently make a high level of expense reductions in the future. Continued declines in revenues relating to the UOL business, particularly if such declines accelerate, will materially and adversely impact the profitability of this business.
Failure to maintain or grow advertising revenues from UOL, including as a result of failing to increase or maintain the number of subscribers for UOL’s services, could have a negative impact on advertising profitability.
Advertising revenues are a key component of revenues and profitability from UOL. UOL’s services currently generate advertising revenues from search placements, display advertisements and online market research associated with Internet access and email services. Factors that have caused, or may cause in the future, UOL’s advertising revenues to fluctuate include, without limitation, changes in the number of visitors to UOL’s websites, active accounts or consumers purchasing our services and products, the effect of, changes to, or terminations of key advertising relationships, changes to UOL’s websites and advertising inventory, changes in applicable laws, regulations or business practices, including those related to behavioral or targeted advertising, user privacy, and taxation, changes in business models, changes in the online advertising market, changes in the economy, advertisers’ budgeting and buying patterns, competition, and changes in usage of UOL’s services. Decreases in UOL’s advertising revenues are likely to adversely impact our profitability. Further, our successful operation and management of UOL, including the ability to generate advertising revenues for UOL’s services, will depend in part upon our ability to increase or maintain the number of subscribers for UOL’s services. A decline in the number of subscribers using UOL’s services could result in decreased advertising revenues, and decreases in advertising revenues would adversely impact our profitability. The failure to increase or maintain the number of subscribers for UOL’s services could have a material adverse effect on advertising revenues and our profitability.
Interruption or failure of the network, information systems or other technologies essential to the UOL businessour communications businesses could impair our ability to provide services relating to the UOL business,serve our customers, which could damage our reputation and harm our operating results.
Our successful operation of the UOL businessour communications businesses depends on our ability to provide reliable service. Many of UOL’sour products are services are supported by data centers. UOL’s network, data centers, central offices and those of UOL’snetwork infrastructure maintained and operated by third-party service providers which are vulnerable to damage or interruption from fires, earthquakes, hurricanes, tornados, floods and other natural disasters, terrorist attacks, power loss, capacity limitations, telecommunications failures, software and hardware defects or malfunctions, break ins, sabotage and vandalism, human error and other disruptions that are beyond our control. Some of the systems serving the UOL businessour communications businesses are not fully redundant, and our disaster recovery or business continuity planning may not be adequate. The UOL businessOur communications businesses could also experience interruptions due to cable damage, theft of equipment, power outages, inclement weather and service failures of third-party service providers. The occurrence of any disruption or system failure or other significant disruption to business continuity may result in a loss of business, increase expenses, damage to reputation for providing reliable service, subject us to additional regulatory scrutiny or expose us to litigation and possible financial losses, any of which could adversely affect our business, results of operations and cash flows.
We may be accused of infringing upon the intellectual property rights of third parties, which is costly to defend and could limit our ability to use certain technologies in the future.
From time to time third parties have alleged that UOL infringes on their intellectual property rights, including patent rights. We may be unaware of filed patent applications and of issued patents that could be related to the products and services we acquired in the UOL acquisition. These claims are often made by patent holding companies that are not operating companies. The alleging parties generally seek royalty payments for prior use as well as future royalty streams. Defending against disputes, litigation or other legal proceedings, whether or not meritorious, may involve significant expense and diversion of management’s attention and resources from other matters. Due to the inherent uncertainties of litigation, we may not prevail in these actions. Both the costs of defending lawsuits and any settlements or judgments against us could adversely affect our results of operations and cash flows.
If there are events or circumstances affecting the reliability or security of the Internet, access to the websites related to the UOL businesscommunications businesses and/or the ability to safeguard confidential information could be impaired causing a negative effect on the financial results of our business operations.
Our website infrastructure and the website infrastructure of UOL may be vulnerable to computer viruses, hacking or similar disruptive problems caused by customers, other Internet users, other connected Internet sites, and the interconnecting telecommunications networks. Such problems caused by third-parties could lead to interruptions, delays or cessation of service to the customers of the UOL products and services.our customers. Inappropriate use of the Internet by third-parties could also potentially jeopardize the security of confidential information stored in our computer system, which may deter individuals from becoming customers. There can be no assurance that any such measures would not be circumvented in future. Dealing with problems caused by computer viruses or other inappropriate uses or security breaches may require interruptions, delays or cessation of service to customers, which could have a material adverse effect on our business, financial condition and results of operations.
The UOL business processes, stores and uses personal information and other data, which subjects us to governmental regulation and other legal obligations related to privacy, and our actual or perceived failure to comply with such obligations could harm our business.
The UOL business receives, stores and processes personal information and other customer data, and UOL enables customers to share their personal information with each other and with third parties. There are numerous federal, state and local laws around the world regarding privacy and the storing, sharing, use, processing, disclosure and protection of personal information and other customer data, the scope of which are changing, subject to differing interpretations, and may be inconsistent between countries or conflict with other rules. We will generally comply with industry standards and are and will be subject to the terms of privacy policies and privacy-related obligations to third parties. We will strive to comply with all applicable laws, policies, legal obligations and industry codes of conduct relating to privacy and data protection, to the extent possible. However, it is possible that these obligations may be interpreted and applied in a manner that is inconsistent from one jurisdiction to another and may conflict with other rules or UOL’s practices. Any failure or perceived failure to comply with UOL’s privacy policies, privacy-related obligations to customers or other third parties, or privacy-related legal obligations, or any compromise of security that results in the unauthorized release or transfer of personally identifiable information or other customer data, may result in governmental enforcement actions, litigation or public statements against us by consumer advocacy groups or others and could cause customers to lose trust in us, which could have an adverse effect on our business. Additionally, if third parties we work with, such as customers, vendors or developers, violate applicable laws or policies, such violations may also put our customers’ information at risk and could in turn have an adverse effect on our business.
Our marketing efforts for UOL’s businessour communications businesses may not be successful or may become more expensive, either of which could increase our costs and adversely impact our business, financial condition, results of operations, and cash flows.
We rely on relationships for our UOL business with a wide variety of third parties, including Internet search providers such as Google, social networking platforms such as Facebook, Internet advertising networks, co-registration partners, retailers, distributors, television advertising agencies, and direct marketers, to source new memberscustomers and to promote or distribute our services and products. In addition, in connection with the launch of new services or products for our UOL business,communications businesses, we may spend a significant amount of resources on marketing. With any of our brands, services, and products, if our marketing activities are inefficient or unsuccessful, if important third-party relationships or marketing strategies, such as Internet search engine marketing and search engine optimization, become more expensive or unavailable, or are suspended, modified, or terminated, for any reason, if there is an increase in the proportion of consumers visiting our websites or purchasing our services and products by way of marketing channels with higher marketing costs as compared to channels that have lower or no associated marketing costs, or if our marketing efforts do not result in our services and products being prominently ranked in Internet search listings, our business, financial condition, results of operations, and cash flows could be materially and adversely impacted.
Our UOL business iscommunications businesses are dependent on the availability of telecommunications services and compatibility with third-party systems and products.
Our UOL businesscommunications businesses substantially dependsdepend on the availability, capacity, affordability, reliability, and security of our telecommunications networks.networks operated by third parties. Only a limited number of telecommunications providers offer the network and data services we currently require for our UOL business,services, and we purchase most of our telecommunications services from a few providers. Some of our telecommunications services are provided pursuant to short-term agreements that the providers can terminate or elect not to renew. In addition, some telecommunications providers may cease to offer network services for certain less populated areas, which would reduce the number of providers from which we may purchase services and may entirely eliminate our ability to purchase services for certain areas.
Currently, our mobile broadband service of our UOL business is entirely dependent upon services acquired from one service provider, and the devices required by the provider can be used for only such provider’s service. If we are unable to maintain, renew or obtain a new agreement with the telecommunications provider on acceptable terms, or the provider discontinues its services, our business, financial condition, results of operations, and cash flows could be materially and adversely affected. Sprint, which owns Clearwire, ceased using WiMAX technology on the Clearwire network. This affected our mobile broadband subscribers for our UOL business that utilized the Clearwire network.
Our dial-up Internet access services of our UOL business also rely on their compatibility with other third-party systems, products and features, including operating systems. Incompatibility with third-party systems and products could adversely affect our ability to deliver our services or a user’s ability to access our services and could also adversely impact the distribution channels for our services. Our dial-up Internet access services are dependent on dial-up modems and an increasing number of computer manufacturers, including certain manufacturers with whom we have distribution relationships, do not pre-load their new computers with dial-up modems, requiring the user to separately acquire a modem to access our services. We cannot assure you that, as the dial-up Internet access market declines and new technologies emerge, we will be able to continue to effectively distribute and deliver our services.
Government regulations could adversely affect our business or force us to change our business practices .practices.
The services that are provided by UOLwe provide are subject to varying degrees of international, federal, state and local laws and regulation, including, without limitation, those relating to taxation, bulk email or “spam,” advertising (including, without limitation, targeted or behavioral advertising), user privacy and data protection, consumer protection, antitrust, export, and unclaimed property ..property. Compliance with such laws and regulations, which in many instances are unclear or unsettled, is complex. New laws and regulations, such as those being considered or recently enacted by certain states, the federal government, or international authorities related to automatic-renewal practices, spam, user privacy, targeted or behavioral advertising, and taxation, could impact our revenues or certain of our business practices or those of our advertisers. Moreover, distribution partners or customers may require us, or we may otherwise deem it necessary or advisable, to alter our products to address actual or anticipated changes in the regulatory environment. Our inability to alter our products to address these requirements and any regulatory changes could have a material adverse effect on our business, financial condition, and operating results.
UOL resellsThe current regulatory environment for broadband telephone services is developing and therefore uncertain. The United States and other countries have begun to assert regulatory authority over broadband telephone service and are continuing to evaluate how broadband telephone service will be regulated in the future. Both the application of existing rules to us and our competitors and the effects of future regulatory developments are uncertain. Future legislative, judicial or other regulatory actions could have a negative effect on our business, which may involve significant compliance costs and require that we restructure our service offerings, exit certain markets, or increase our prices to recover our regulatory costs, any of which could cause our services to be less attractive to customers.
Regulatory and governmental agencies may determine that we should be subject to rules applicable to certain broadband telephone service providers or seek to impose new or increased fees, taxes, and administrative burdens on broadband telephone service providers. We also may change our product and service offerings in a manner that subjects us to greater regulation and taxation. We are faced, and may continue to face, difficulty collecting such charges from our customers and/or carriers, and collecting such charges may cause us to incur legal fees. We may be unsuccessful in collecting all of the regulatory fees owed to us. The imposition of any such additional regulatory fees, charges, taxes and regulations on VoIP communications services could materially increase our costs and may limit or eliminate our competitive pricing advantages.
We offer our magicJack products and services in other countries, and therefore could also be subject to regulatory risks in each such foreign jurisdiction, including the risk that regulations in some jurisdictions will prohibit us from providing our services cost-effectively or at all, which could limit our growth. Currently, there are several countries where regulations prohibit us from offering service. In addition, because customers can use our services almost anywhere that a broadband Internet access services offered by other parties pursuantconnection is available, including countries where providing broadband telephone service is illegal, the governments of those countries may attempt to wholesale agreements with those providers. In an order released in March 2015, the Federal Communications Commission (the “FCC”) classified retail broadband Internet access services as telecommunications services subject to regulation under Title II of the Communications Act. That ruling is subject to a pending appeal. The classification of retail broadband Internet access services as telecommunications services means that providersassert jurisdiction over us. Violations of these laws and regulations could result in fines, criminal sanctions against us, our officers or our employees, and prohibitions on the conduct of our business. Any such violations could include prohibitions on our ability to offer our products and services are subjectin one or more countries, could delay or prevent potential acquisitions, expose us to the general requirement that their charges, practicessignificant liability and classifications for telecommunications services be “justregulation and reasonable,”could also materially damage our reputation, our brand, our international expansion efforts, our ability to attract and that they refrain from engagingretain employees, our business and our operating results. Our success depends, in any “unjust or unreasonable discrimination” with respectpart, on our ability to their charges, practices or classifications. However, the FCC has not determined what, if any, regulations will apply to wholesale broadband Internet access services,anticipate these risks and it is uncertain whether it will adopt requirements that will be favorable or unfavorable to us. It is also possible that the classification of retail broadband Internet access services will be overturned on appeal, that Congress will adopt legislation reversing that decision, or that a future FCC will reverse that decision.manage these difficulties.
Broadband Internet access is also currently classified by the FCC as an “information service.” While current policy exemptsthis classification means that broadband Internet access services (butare not all broadband services) from contributingsubject to the Universal Service Fund (“USF”), contributions, Congress andor the FCC may consider expandingexpand the USF contribution baseobligations to include broadband Internet access services. If broadband Internet access providers become subject to USF contribution obligations, theyit would likely impose a USF surcharge on end users. Such a surcharge will raise the effective cost of our broadband services to UOL’s customers, which could adversely affect customer satisfaction and have an adverse impact on our revenues and profitability.
We are faced, and may continue to face, difficulty collecting regulatory charges from our customers and/or carriers and collecting such charges may cause us to incur legal fees. We may be unsuccessful in collecting all the regulatory fees owed to us. The imposition of any such additional regulatory fees, charges, taxes and regulations on our services could materially increase our costs and may limit or eliminate our competitive pricing advantages.
Failure to make proper payments for federal USF contributions, FCCremit regulatory fees, or other amountscharges and taxes mandated by federal and state regulations; failure to maintain proper state tariffs and certifications; failure to comply with federal, state or local laws and regulations; failure to obtain and maintain required licenses, franchises and permits; imposition of burdensome license, franchise or permit requirements for us to operate in public rights-of-way; and imposition of new burdensome or adverse regulatory requirements could limit the types of services we provide or the terms on which we provide these services.
We cannot predict the outcome of any ongoing legislative initiatives or administrative or judicial proceedings or their potential impact upon the communications and information technology industries generally or upon the UOL businessour communications businesses specifically. Any changes in the laws and regulations applicable to UOL,our communications businesses, the enactment of any additional laws or regulations, or the failure to comply with, or increased enforcement activity by regulators of, such laws and regulations, could significantly impact our services and products, our costs, or the manner in which we or our advertisers conduct business, all of which could adversely impact our business, financial condition, results of operations, and cash flows and cause our business to suffer.
The FCC and some states require us to obtain prior approval of certain major merger and acquisition transactions, such as the acquisition of control of another telecommunications carrier. Delays in obtaining such approvals could affect our ability to close proposed transactions in a timely manner and could increase our costs and increase the risk of non-consummation of some transactions.
The market in which our communications businesses participate is highly competitive and if we do not compete effectively, our operating results may be harmed by loss of market share and revenues.
The communications industry is highly competitive. We face intense competition from traditional telephone companies, wireless companies, cable companies and alternative voice communication providers and manufacturers of communication devices.
Competitors for our products and services include telecommunications carriers, such as AT&T, Inc., Lumen and Verizon, which provide telephone service using the public switched telephone network, as well as broadband telephone services. We also face competition from cable companies, such as Cablevision, Charter, Comcast, and Cox Communications, which offer broadband telephone services to their existing cable television and broadband customers. Further, wireless providers, including AT&T, T-Mobile, and Verizon Wireless offer services that some customers may prefer over wireline-based broadband voice service.
We face competition on magicJack device sales from Apple, Samsung and other manufacturers of smart phones, tablets and other handheld wireless devices. Also, we compete against established alternative voice communication providers, such as Vonage, Google Voice, Ooma, and Skype, some of which are part of established, well-capitalized technology companies. In addition, we compete with independent broadband telephone service providers.
Increased competition may result in our competitors using aggressive business tactics, including providing financial incentives to customers, selling their products or services at a discount or loss, offering products or services similar to our products and services on a bundled basis at a discounted rate or no charge, announcing competing products or services combined with aggressive marketing efforts, and asserting intellectual property rights or claims, irrespective of their validity.
We may be unsuccessful in protecting our proprietary rights or may have to defend ourselves against claims of infringement, which could impair or significantly affect our business.
Our means of protecting our proprietary rights may not be adequate and our competitors may independently develop technology that is similar ours. Legal protections afford only limited protection for our technology. The laws of many countries do not protect our proprietary rights to as great an extent as do the laws of the United States. Despite our efforts to protect our proprietary rights, unauthorized parties have in the past attempted, and may in the future attempt, to copy aspects of our products or to obtain and use information that it regards as proprietary. Third parties may also design around our proprietary rights, which may render our protected products less valuable if the design around is favorably received in the marketplace. In addition, if any our products or the technology underlying our products is covered by third-party patents or other intellectual property rights, we could be subject to various legal actions.
We cannot assure you that our products do not infringe intellectual property rights held by others or that they will not in the future. Third parties may assert infringement, misappropriation, or breach of license claims against us from time to time. Such claims could cause us to incur substantial liabilities and to suspend or permanently cease the use of critical technologies or processes or the production or sale of major products. Litigation may be necessary to enforce our intellectual property rights, to protect our trade secrets, to determine the validity and scope of the proprietary rights of others, or to defend against claims of infringement or invalidity, misappropriation, or other claims. Any such litigation could result in substantial costs and diversion of our resources, which in turn could materially adversely affect our business and financial condition. Moreover, any settlement of or adverse judgment resulting from such litigation could require us to obtain a license to continue to use the technology that is the subject of the claim, or otherwise restrict or prohibit our use of the technology. Any required licenses may not be available to us on acceptable terms, if at all. If we attempt to design around the technology at issue or to find another provider of suitable alternative technology to permit it to continue offering applicable software or product solutions, our continued supply of software or product solutions could be disrupted or our introduction of new or enhanced software or products could be significantly delayed.
Increases in credit card processing fees and high chargeback costs would increase our operating expenses and adversely affect our results of operations, and an adverse change in, or the termination of, our relationship with any major credit card company would have a severe, negative impact on our business.
A significant number of our communications customers purchase its products through our websites and pay for our communications products and services using credit or debit cards. The major credit card companies or the issuing banks may increase the fees that they charge for transactions using their cards. An increase in those fees would require us to either increase the prices we charge for our products, or suffer a negative impact on our profitability, either of which could adversely affect our business, financial condition and results of operations.
We have potential liability for chargebacks associated with the transactions we process, or that are processed on our behalf by merchants selling our products. If a customer returns his or her products at any time, or claims that our product was purchased fraudulently, the returned product is “charged back” to magicJack or its bank, as applicable. If we or our sponsoring banks are unable to collect the chargeback from the merchant’s account, or, if the merchant refuses or is financially unable, due to bankruptcy or other reasons, to reimburse the merchant’s bank for the chargeback, we bear the loss for the amount of the refund paid.
We are vulnerable to credit card fraud, as we sell communications products and services directly to customers through our website. Card fraud occurs when a customer uses a stolen card (or a stolen card number in a card-not-present-transaction) to purchase merchandise or services. In a traditional card-present transaction, if the merchant swipes the card, receives authorization for the transaction from the card issuing bank and verifies the signature on the back of the card against the paper receipt signed by the customer, the card issuing bank remains liable for any loss. In a fraudulent card-not-present transaction, even if the merchant or we receive authorization for the transaction, we or the merchant are liable for any loss arising from the transaction. Because sales made directly from our websites are card-not-present transactions, we are more vulnerable to customer fraud. We are also subject to acts of consumer fraud by customers that purchase our products and services and subsequently claim that such purchases were not made.
In addition, as a result of high chargeback rates or other reasons beyond our control, the credit card companies or issuing bank may terminate their relationship with us, and there are no assurances that it will be able to enter into a new credit card processing agreement on similar terms, if at all. Upon a termination, if our credit card processor does not assist it in transitioning its business to another credit card processor, or if we were not able to obtain a new credit card processor, the negative impact on the liquidity of our communications businesses likely would be significant. The credit card processor may also prohibit us from billing discounts annually or for any other reason. Any increases in the credit card fees paid by our communications businesses could adversely affect our results of operations, particularly if we elect not to raise our service rates to offset the increase. The termination of our ability to process payments on any major credit or debit card, due to high chargebacks or otherwise, would significantly impair our ability to operate our business.
Flaws in our technology and systems could cause delays or interruptions of service, damage our reputation, cause us to lose customers and limit our growth.
Our communications services could be disrupted by problems with our technology and systems, such as malfunctions in our software or other facilities and overloading of our servers. Our customers could experience interruptions in the future as a result of these types of problems. Interruptions could in the future cause us to lose customers, which could adversely affect our revenue and profitability. In addition, because our systems and our customers’ ability to use our services are Internet-dependent, our services may be subject to “hacker attacks” from the Internet, which could have a significant impact on our systems and services. If service interruptions adversely affect the perceived reliability of our service, it may have difficulty attracting and retaining customers and our brand reputation and growth may suffer.
We depend on overseas manufacturers, and for certain magicJack products, third-party suppliers, and our reputation and results of operations would be harmed if these manufacturers or suppliers fail to meet magicJack’s requirements.
The manufacture of the magicJack devices is conducted by a manufacturing company in China, and certain parts are produced in Taiwan and Hong Kong. These manufacturers supply substantially all of the raw materials and provide all facilities and labor required to manufacture our products. If these companies were to terminate their arrangements with us or fail to provide the required capacity and quality on a timely basis, either due to actions of the manufacturers; earthquakes, typhoons, tsunamis, fires, floods, or other natural disasters; or the actions of their respective governments, we would be unable to manufacture our products until replacement contract manufacturing services could be obtained. To qualify a new contract manufacturer, familiarize it with the magicJack products, quality standards and other requirements, and commence volume production is a costly and time-consuming process. We cannot assure you that we would be able to establish alternative manufacturing relationships on acceptable terms or in a timely manner that would not cause disruptions in our supply. Any interruption in the manufacture of our products would be likely to result in delays in shipment, lost sales and revenue and damage to our reputation in the market, all of which would harm our business and results of operations. In addition, while the magicJack contract obligations with its contract manufacturer in China is denominated in U.S. dollars, changes in currency exchange rates could impact our suppliers and increase our prices.
We rely on independent retailers to sell the magicJack devices, and disruption to these channels would harm our business.
Because we sell a significant amount of the magicJack devices, other devices and certain services to independent retailers, we are subject to many risks, including risks related to their inventory levels and support for magicJack’s products. In particular, magicJack’s retailers maintain significant levels of our products in their inventories. If retailers attempt to reduce their levels of inventory or if they do not maintain sufficient levels to meet customer demand, our sales could be negatively impacted.
The retailers who sell magicJack products also sell products offered by its competitors. If these competitors offer the retailers more favorable terms, those retailers may de-emphasize or decline to carry magicJack’s products. In the future, we may not be able to retain or attract a sufficient number of qualified retailers. If we are unable to maintain successful relationships with retailers or to expand our distribution channels, our business will suffer.
To continue this method of sales, we will have to allocate resources to train vendors, systems integrators and business partners as to the use of our products, resulting in additional costs and additional time until sales by such vendors, systems integrators and business partners are made feasible. Our business depends to a certain extent upon the success of such channels and the broad market acceptance of our products. To the extent that our channels are unsuccessful in selling our products, our revenues and operating results will be adversely affected.
If magicJack fails to maintain relationships with these channels, fails to develop new channels, fails to effectively manage, train, or provide incentives to existing channels or if these channels are not successful in their sales efforts, sales of magicJack’s products may decrease and our operating results would suffer. The independent retailers we rely on were impacted by the acute phase of the COVID-19 pandemic, which resulted in mandatory store closures due to social distancing measures imposed to control the pandemic and they may be limited in their ability to sell magicJack devices to customers should such measures return during additional waves of the pandemic.
The success of our business relies on customers’ continued and unimpeded access to broadband service. Providers of broadband services may be able to block our services or charge their customers more for also using our services, which could adversely affect our revenue and growth.
Our customers must have broadband access to the Internet in order to use our service. Providers of broadband access, some of whom are also competing providers of broadband voice services, may take measures that affect their customers’ ability to use our service, such as degrading the quality of the data packets they transmit over their lines, giving those packets low priority, giving other packets higher priority than ours, blocking our packets entirely or attempting to charge their customers more for also using our services.
In December 2017, the FCC rescinded rules that, among other things, prohibited broadband Internet access providers from blocking, throttling, or otherwise degrading the quality of data packets, or attempting to extract additional fees from edge service providers.
In October 2019, the D.C. Circuit largely upheld the FCC decision. Although some states, most notably California, have adopted prohibitions similar to those rescinded by the FCC, if broadband providers block, throttle or otherwise degrade the quality of our data packets or attempt to extract additional fees from us or our customers, it could adversely impact our business.
Server failures or system breaches could cause delays or adversely affect our service quality, which may cause us to lose customers and revenue.
In operating our servers, we may be unable to connect and manage a large number of customers or a large quantity of traffic at high speeds. Any failure or perceived failure to achieve or maintain high-speed data transmission could significantly reduce demand for our magicJack services and adversely affect our operating results. In addition, computer viruses, break-ins, human error, natural disasters and other problems may disrupt our servers. The system security and stability measures we implement may be circumvented in the future or otherwise fail to prevent the disruption of our services. The costs and resources required to eliminate computer viruses and other security problems may result in interruptions, delays or cessation of services to our customers, which could decrease demand, decrease our revenue and slow our planned expansion.
Hardware and software failures, delays in the operation of our computer and communications systems or the failure to implement system enhancements may harm our business.
Our success depends on the efficient and uninterrupted operation of our software and communications systems. A failure of our servers could impede the delivery of services, customer orders and day-to-day management of our business and could result in the corruption or loss of data. Despite any precautions we may take, damage from fire, floods, hurricanes, power loss, telecommunications failures, computer viruses, break-ins and similar events at our various facilities could result in interruptions in the flow of data to our servers and from our servers to our customers. In addition, any failure by our computer environment to provide our required telephone communications capacity could result in interruptions in our service. Additionally, significant delays in the planned delivery of system enhancements and improvements, or inadequate performance of the systems once they are completed, could damage our reputation and harm our business. Finally, long-term disruptions in infrastructure caused by events such as natural disasters, the outbreak of war, the escalation of hostilities, and acts of terrorism (particularly involving cities in which it has offices) could adversely affect our business. Although we maintain general liability insurance, including coverage for errors and omissions, this coverage may be inadequate, or may not be available in the future on reasonable terms, or at all. We cannot assure you that this policy will cover any claim against us for loss of data or other indirect or consequential damages and defending a lawsuit, regardless of its merit, could be costly and divert management’s attention. In addition to potential liability, if we experience interruptions in our ability to supply our services, our reputation could be harmed and we could lose customers.
Our communications businesses are subject to privacy and online security risks, including security breaches, and we could be liable for such breaches of security. If we are unable to protect the privacy of our customers using our services, or information obtained from our customers in connection with their use or payment of our services, in violation of privacy or security laws or expectations, we could be subject to significant liability and damage to our reputation.
Our systems and processes that are designed to protect customer information and prevent fraudulent transactions, data loss and other security breaches, may not be sufficient to prevent fraudulent transactions, data loss and other security breaches. Failure to prevent or mitigate such breaches may adversely affect our operating results.
The websites of our communications businesses serve as online sales portals. We currently obtain and retain personal information about our website users in connection with such purchases. In addition, we obtain personal information about our customers as part of their registration to use our products and services. Federal, state and foreign governments have enacted or may enact laws or regulations regarding the collection and use of personal information. Additionally, magicJack customers may believe that using our services to make and receive telephone calls using their broadband connection could result in a reduction of their privacy, as compared to traditional wireline carriers.
Our business involves the storage and transmission of users’ proprietary information, and security breaches could expose us to a risk of loss or misuse of this information, litigation, and potential liability. An increasing number of websites, including several other communications companies, have recently disclosed breaches of their security, some of which have involved sophisticated and highly targeted attacks on portions of their sites. Because the techniques used to obtain unauthorized access, disable or degrade service, or sabotage systems, change frequently and often are not recognized until launched against a target, we may be unable to anticipate these techniques or to implement adequate preventative measures. If an actual or perceived breach of our security occurs, the market perception of the effectiveness of our security measures could be harmed and we could lose users. A party that is able to circumvent our security measures could misappropriate our or our users’ proprietary information, cause interruption in our operations, damage our computers or those of our users, or otherwise damage our reputation and business. Any compromise of our security could result in a violation of applicable privacy and other laws, significant legal and financial exposure, damage to our reputation, and a loss of confidence in our security measures, which could harm our business.
Currently, a significant number of our users authorize it to bill their credit card accounts directly for all transaction fees charged by us. We rely on encryption and authentication technology licensed from third parties to provide the security and authentication to effectively secure transmission of confidential information, including customer credit card numbers. Advances in computer capabilities, new discoveries in the field of cryptography or other developments may result in the technology used by us to protect transaction data being breached or compromised. Non-technical means, for example, actions by a suborned employee, can also result in a data breach.
Possession and use of personal information in conducting our business subjects it to legislative and regulatory burdens that could require notification of data breach, restrict our use of personal information and hinder our ability to acquire new customers or market to existing customers. We may incur expenses to comply with privacy and security standards and protocols imposed by law, regulation, industry standards or contractual obligations.
Under payment card rules and our contracts with our card processors, if there is a breach of payment card information that we store, we could be liable to the payment card issuing banks for their cost of issuing new cards and related expenses. In addition, if we fail to follow payment card industry security standards, even if there is no compromise of customer information, we could incur significant fines or lose our ability to give customers the option of using payment cards to fund their payments or pay their fees. If we were unable to accept payment cards, our business would be seriously damaged.
Our servers are also vulnerable to computer viruses, physical or electronic break-ins, and similar disruptions. We may need to expend significant resources to protect against security breaches or to address problems caused by breaches. These issues are likely to become more difficult as we expand the number of places where we operate. Security breaches, including any breach by us or by parties with which we have commercial relationships that result in the unauthorized release of our users’ personal information, could damage our reputation and expose us to a risk of loss or litigation and liability. Our insurance policies carry coverage limits that may not be adequate to reimburse it for losses caused by security breaches.
Our users, as well as those of other prominent communications companies, have been and will continue to be targeted by parties using fraudulent “spoof” and “phishing” emails to misappropriate passwords, credit card numbers, or other personal information or to introduce viruses or other malware through “trojan horse” programs to our users’ computers. These emails appear to be legitimate emails sent by our communications businesses, but direct recipients to fake websites operated by the sender of the email or request that the recipient send a password or other confidential information via email or download a program. Despite our efforts to mitigate “spoof” and “phishing” emails through product improvements and user education, “spoof” and “phishing” remain a serious problem that may damage our brands, discourage use of our websites, and increase our costs.
Our security measures may not prevent security breaches. We may need to expend resources to protect against security breaches or to address problems caused by breaches. If unauthorized third parties were able to penetrate our security and gain access to, or otherwise misappropriate, our customers’ personal information or be able to access their telephone calls, it could harm our reputation and, therefore, our business and we could be subject to liability. Such liability could include claims for misuse of personal information or unauthorized use of credit cards. These claims could result in litigation, our involvement in which, regardless of the outcome, could require us to expend significant financial resources. Internet privacy is a rapidly changing area and we may be subject to future requirements and legislation that are costly to implement and negatively impact our results.
Risks Related to Our Brand Portfolio
The failure of our licensees to sell products that generate royalties to us, to pay us royalties pursuant to their license agreements with us, or to renew these agreements could negatively affect our results of operations and financial condition.
Our revenues are dependent on royalty payments made to us under our license agreements. Although some of our license agreements guarantee a minimum royalty payment to us each year, the failure of our licensees to satisfy these or the other obligations under their agreements with us, their decision to not renew their agreements with us or their inability to grow or maintain their sales of products bearing our brands or their businesses generally could cause our revenues to decline. These events or circumstances could occur for a variety of reasons, many of which are outside our control, including business and operational risks that impact our licensees’ ability to make payments and sell products generally, such as obtaining and maintaining desirable store locations and consumer acceptance and presence; retaining key personnel, including the specific individuals who work on sales and marketing for products bearing our brands; and liquidity and capital resources risks.
The consumer goods and services sector was severely impacted by the ongoing COVID-19 pandemic, which resulted in mandatory store closures of uncertain duration due to social distancing measures imposed to control the pandemic and our licensees may continue to have difficulty selling their merchandise and meeting their financial obligations to us as the sector evolves following the acute phase of the pandemic.
The failure by any of our key licensees or the concurrent failure by several licensees to meet their financial obligations to us or to renew their respective license agreements with us could materially and adversely impact our results of operations and our financial condition.
Our brand investment portfolio is subject to intense competition.
We hold a majority interest in a brand investment portfolio that is focused on generating revenue through the licensing of trademarks. Therefore, our degree of success is dependent on the strength of our brands, consumer acceptance of our brands and our licensees’ ability to design, manufacture and sell products bearing our brands, all of which is dependent on the ability of us and our licensees responding to ever-changing consumer demands. We cannot control the level of consumer acceptance of our brands and changing preferences and trends may lead customers to purchase other products. Further, we cannot control the level of resources that our licensees commit to supporting our brands, and our licensees may choose to support products bearing other brands to the detriment of our brands because our agreements generally do not prevent them from licensing or selling other products, including products bearing competing brands.
In addition, we compete with companies that own other brands and trademarks, as these companies could enter into similar licensing arrangements with retailers and wholesalers in the United States and internationally. These arrangements could be with our existing retail and wholesale partners, thereby competing with us for consumer attention and limited floor or rack space in the same stores in which our branded products are sold, and vying with us for the time and resources of the retailers and wholesale licensees that manufacture and distribute our products. These companies may be able to respond more quickly to changes in retailer, wholesaler and consumer preferences and devote greater resources to brand acquisition, development and marketing. We may not be able to compete effectively against these companies.
If we or our brands are unable to compete successfully against current and future competitors, we may be unable to sustain or increase demand for products bearing our brands, which could have a material adverse effect on our reputation, prospects, performance and financial condition.
Risks Related to Competition
We operate in highly competitive industries. Some of our competitors may have certain competitive advantages, which may cause us to be unable to effectively compete with or gain market share from our competitors.
We face competition with respect to all of our service areas. The level of competition depends on the particular service area and, in the case of our asset and liquidation services, the category of assets being liquidated or appraised. We compete with other companies and investment banks to help clients with their corporate finance and capital needs. In addition, we compete with companies and online services in the bidding for assets and inventory to be liquidated. The demand for online solutions continues to grow and our online competitors include other e-commerce providers, auction websites such as eBay, as well as government agencies and traditional liquidators and auctioneers that have created websites to further enhance their product offerings and more efficiently liquidate assets. We expect the market to become even more competitive as the demand for such services continues to increase and traditional and online liquidators and auctioneers continue to develop online and offline services for disposition, redeployment and remarketing of wholesale surplus and salvage assets. In addition, manufacturers, retailers and government agencies may decide to create their own websites to sell their own surplus assets and inventory and those of third parties.
We also compete with other providers of valuation and advisory services. Competitive pressures within the Financial Consulting and other Advisory Services and real estate services markets, including a decrease in the number of engagements and/or a decrease in the fees which can be charged for these services, could affect revenues from our Financial Consulting and other Advisory Services and real estate services as well as our ability to engage new or repeat clients. We believe that given the relatively low barriers to entry in the Financial Consulting and other Advisory Services and real estate services markets, these markets may become more competitive as the demand for such services increases.
Some of our competitors may be able to devote greater financial resources to marketing and promotional campaigns, secure merchandise from sellers on more favorable terms, adopt more aggressive pricing or inventory availability policies and devote more resources to website and systems development than we are able to do. Any inability on our part to effectively compete could have a material adverse effect on our financial condition, growth potential and results of operations.
We compete with specialized investment banks to provide financial and investment banking services to small and middle-market companies. Middle-market investment banks provide access to capital and strategic advice to small and middle-market companies in our target industries. We compete with those investment banks on the basis of a number of factors, including client relationships, reputation, the abilities of our professionals, transaction execution, innovation, price, market focus and the relative quality of our products and services. We have experienced intense competition over obtaining advisory mandates in recent years, and we may experience pricing pressures in our investment banking business in the future as some of our competitors seek to obtain increased market share by reducing fees. Competition in the middle-market may further intensify if larger Wall Street investment banks expand their focus to this sector of the market. Increased competition could reduce our market share from investment banking services and our ability to generate fees at historical levels.
We also face increased competition due to a trend toward consolidation. In recent years, there has been substantial consolidation and convergence among companies in the financial services industry. This trend was amplified in connection with the unprecedented disruption and volatility in the financial markets during the past several years, and, as a result, a number of financial services companies have merged, been acquired or have fundamentally changed their respective business models. Many of these firms may have the ability to support investment banking, including financial advisory services, with commercial banking, insurance and other financial services in an effort to gain market share, which could result in pricing pressure in our businesses.
UOL competes with numerous providers of broadband, mobile broadband and DSL services, as well as other dial-up Internet access providers, many of whom are large and have significantly more financial and marketing resources. The principal competitors for UOL’s mobile broadband and DSL services include, among others, local exchange carriers, wireless and satellite service providers, and cable service providers.
magicJack competes with the traditional telephone service providers, which provide telephone service using the public switched telephone network. Certain of these traditional providers have also added, or are planning to add, broadband telephone services to their existing telephone and broadband offerings. We also face, or expect to face, competition from cable companies, which offer broadband telephone services to their existing cable television and broadband offerings. Further, wireless providers offer services that some customers may prefer over wireline-based service. In the future, as wireless companies offer more minutes at lower prices, their services may become more attractive to customers as a replacement for broadband or wireline-based phone service. We face competition on magicJack device sales from manufacturers of smart phones, tablets and other handheld wireless devices. Also, we compete against established alternative voice communication providers, and may face competition from other large, well-capitalized Internet companies. In addition, we compete with independent broadband telephone service providers.
Our brand investment portfolio competes with companies that own other brands and trademarks, as these companies could enter into similar licensing arrangements with retailers and wholesalers in the United States and internationally. These arrangements could be with our existing retail and wholesale partners, thereby competing with us for consumer attention and limited floor or rack space in the same stores in which our branded products are sold, and vying with us for the time and resources of the retailers and wholesale licensees that manufacture and distribute our products. These companies may be able to respond more quickly to changes in retailer, wholesaler and consumer preferences and devote greater resources to brand acquisition, development and marketing.
If we are unable to attract and retain qualified personnel, we may not be able to compete successfully in our industry.
Our future success depends to a significant degree upon the continued contributions of senior management and the ability to attract and retain other highly qualified management personnel. We face competition for management from other companies and organizations; therefore, we may not be able to retain our existing personnel or fill new positions or vacancies created by expansion or turnover at existing compensation levels. Although we have entered into employment agreements with key members of the senior management team, there can be no assurances such key individuals will remain with us. The loss of any of our executive officers or other key management personnel would disrupt our operations and divert the time and attention of our remaining officers and management personnel which could have an adverse effect on our results of operations and potential for growth.
We also face competition for highly skilled employees with experience in the industries in which we operate, and some of which requires a unique knowledge base. We may be unable to recruit or retain existing technical, sales and client support personnel that are critical to our ability to execute our business plan, with such difficulties exacerbated by the labor shortages that arose during the COVID-19 pandemic and persist throughout the economy. Additionally, the ongoing COVID-19 pandemic could affect the availability of our key personnel.
Risks Related to Data Security
Security breaches and other disruptions could compromise our information and expose us to liability, which would cause our business and reputation to suffer.
In the ordinary course of our business, we collect and store sensitive data, including intellectual property, our proprietary business information and that of our customers, clients and business partners, and personally identifiable information of our employees, in our servers and on our networks. The secure processing, maintenance and transmission of this information is critical to our operations and business strategy. Despite our security measures, our information technology and infrastructure is vulnerable to attacks by hackers or breach due to employee error, malfeasance or other disruptions. Any such breach could compromise our networks and the information stored there could be accessed, publicly disclosed, lost or stolen. Any such access, disclosure or other loss of information could result in legal claims or proceedings, liability under laws that protect the privacy of personal information, and regulatory penalties. In addition, such a breach could disrupt our operations and the services we provide to our clients, damage our reputation, and cause a loss of confidence in our services, which could adversely affect our business and our financial condition.
Significant disruptions of information technology systems, breaches of data security, or unauthorized disclosures of sensitive data or personally identifiable information could adversely affect our business, and could subject us to liability or reputational damage.
Our business is increasingly dependent on critical, complex, and interdependent information technology (“IT”) systems, including Internet-based systems, some of which are managed or hosted by third parties, to support business processes as well as internal and external communications. The size and complexity of our IT systems make us vulnerable to, and we have experienced, IT system breakdowns, malicious intrusion, and computer viruses, which may result in the impairment of our ability to operate our business effectively.
In addition, our systems and the systems of our third-party providers and collaborators are potentially vulnerable to data security breaches which may expose sensitive data to unauthorized persons or to the public. Such data security breaches could lead to the loss of confidential information, trade secrets or other intellectual property, or could lead to the public exposure of personal information (including personally identifiable information) of our employees, customers, business partners, and others. In addition, the increased use of social media by our employees and contractors could result in inadvertent disclosure of sensitive data or personal information, including but not limited to, confidential information, trade secrets and other intellectual property.
Any such disruption or security breach, as well as any action by us or our employees or contractors that might be inconsistent with the rapidly evolving data privacy and security laws and regulations applicable within the United States and elsewhere where we conduct business, could result in enforcement actions by U.S. states, the U.S. Federal government or foreign governments, liability or sanctions under data privacy laws that protect personally identifiable information, regulatory penalties, other legal proceedings such as but not limited to private litigation, the incurrence of significant remediation costs, disruptions to our development programs, business operations and collaborations, diversion of management efforts and damage to our reputation, which could harm our business and operations. Because of the rapidly moving nature of technology and the increasing sophistication of cybersecurity threats, our measures to prevent, respond to and minimize such risks may be unsuccessful.
In addition, the European Parliament and the Council of the European Union adopted a comprehensive general data privacy regulation (“GDPR”) in 2016 that took effect in May 2018 and governs the collection and use of personal data in the European Union. The GDPR, which is wide-ranging in scope, will impose several requirements relating to the consent of the individuals to whom the personal data relates, the information provided to the individuals, the security and confidentiality of the personal data, data breach notification and the use of third party processors in connection with the processing of the personal data. The GDPR also imposes strict rules on the transfer of personal data out of the European Union to the United States, enhances enforcement authority and imposes large penalties for noncompliance, including the potential for fines of up to €20 million or 4% of the annual global revenues of the infringer, whichever is greater. In addition, the California Consumer Privacy Act effective since January 1, 2020 applies to for-profit businesses that conduct business in California and meet certain revenue or data collection thresholds. The CCPA established new requirements regarding handling of person data to entities serving or employing California residents, and gave consumers the right to request disclosure of information collected about them, and whether that information has been sold or shared with others, the right to request deletion of personal information (subject to certain exceptions), the right to opt out of the sale of the consumer’s personal information, and the right not to be discriminated against for exercising these rights. Such rights will be expanded under the California Privacy Rights Act (“CPRA”) once it goes into effect on January 1, 2023. In addition, similar laws have and may be adopted by other states where the Company does business. The impact of the CCPA and other state privacy laws on the Company’s business is yet to be determined.
During the initial phase of the COVID-19 pandemic, most of our personnel shifted to working remotely and many personnel continue to work remotely. Additional waves of the pandemic have, and may continue to, cause us to require periods of remote work for certain personnel or locations. We cannot predict the duration of these disruptions or the durability of the more general trend toward remote work. While we have made substantial investments on our information security infrastructure, this shift has could put stress on our information security infrastructure and increase the risk of a data breach and could require us to make further investments in our cybersecurity program.
Risks Related to our Securities and Ownership
Anti-takeover provisions under our charter documents and Delaware law could delay or prevent a change of control and could also limit the market price of our stock.
Our amended and restated certificate of incorporation and our bylaws, as amended, contain provisions that could delay or prevent a change of control of our company or changes in our board of directors that our stockholders might consider favorable. Our amended and restated certificate of incorporation provides that our board of directors will be authorized to issue from time to time, without further stockholder approval, up to 1,000,000 shares of preferred stock in one or more series and to fix or alter the designations, preferences, rights and any qualifications, limitations or restrictions of the shares of each series, including the dividend rights, dividend rates, conversion rights, voting rights, rights of redemption, including sinking fund provisions, redemption price or prices, liquidation preferences and the number of shares constituting any series or designations of any series. Such shares of preferred stock could have preferences over our common stock with respect to dividends and liquidation rights. We may issue additional preferred stock in ways which may delay, defer or prevent a change of control of our company without further action by our stockholders. Such shares of preferred stock may be issued with voting rights that may adversely affect the voting power of the holders of our common stock by increasing the number of outstanding shares having voting rights, and by the creation of class or series voting rights.
We are also governed by the provisions of Section 203 of the Delaware General Corporate Law, which may prohibit certain business combinations with stockholders owning 15% or more of our outstanding voting stock. The foregoing and other provisions in our amended and restated certificate of incorporation, our bylaws, as amended, and Delaware law could make it more difficult for stockholders or potential acquirers to obtain control of our board of directors or initiate actions that are opposed by the then-current board of directors, including delaying or impeding a merger, tender offer, or proxy contest or other change of control transaction involving our company. Any delay or prevention of a change of control transaction or changes in our board of directors could prevent the consummation of a transaction in which our stockholders could receive a substantial premium over the then current market price for their shares.
Because of their significant stock ownership, some of our existing stockholders will be able to exert control over us and our significant corporate decisions.
Our executive officers, directors and their affiliates own or control, in the aggregate, approximately 27.1% of our outstanding common stock as of December 31, 2021. In particular, our Chairman and Co-Chief Executive Officer, Bryant R. Riley, owns or controls, in the aggregate, 5,627,388 shares of our common stock or 20.4% of our outstanding common stock as of December 31, 2021. These stockholders are able to exercise influence over matters requiring stockholder approval, such as the election of directors and the approval of significant corporate transactions, including transactions involving an actual or potential change of control of the company or other transactions that non-controlling stockholders may not deem to be in their best interests. This concentration of ownership may harm the market price of our common stock by, among other things:
| ● | delaying, deferring, or preventing a change in control of our company; |
| ● | impeding a merger, consolidation, takeover, or other business combination involving our company; |
| ● | causing us to enter into transactions or agreements that are not in the best interests of all stockholders; or |
| ● | discouraging a potential acquirer from making a tender offer or otherwise attempting to obtain control of our company. |
Our common stock price may fluctuate substantially, and your investment could suffer a decline in value.
The market price of our common stock may be volatile and could fluctuate substantially due to many factors, including, among other things:
| ● | actual or anticipated fluctuations in our results of operations; |
| ● | announcements of significant contracts and transactions by us or our competitors; |
| ● | sale of common stock or other securities in the future; |
| ● | the trading volume of our common stock; |
| ● | changes in our pricing policies or the pricing policies of our competitors; and |
| ● | general economic conditions |
In addition, the stock market in general has experienced extreme price and volume fluctuations that have often been unrelated or disproportionate to the operating performance of those companies. These broad market factors may materially harm the market price of our common stock, regardless of our operating performance.
The trading price of our common shares is subject to volatility.
Trading of our common stock has in the past been highly volatile and the market price of shares of our common stock could continue to fluctuate substantially. Additionally, if we are not able to maintain our listing on NASDAQ, then our common stock will be quoted for trading on an over-the-counter quotation system and may be subject to more significant fluctuations in stock price and trading volume and large bid and ask price spreads.
We manage debt investments that involve significant risksmay not pay dividends regularly or at all in the future.
While we currently pay dividends quarterly, our Board of Directors may reduce or discontinue dividends at any time for any reason it deems relevant and potential additional liabilities.
GACP I., L.P., a direct lending fund of which our wholly owned subsidiary GACP is the general partner, may invest in secured debt issued by companies that have or may incur additional debt that is senior to the secured debt owned by the fund. In the event of insolvency, liquidation, dissolution, reorganization or bankruptcy of any such company, the owners of senior secured debt(i.e., the owners of first priority liens) generally will be entitled to receive proceeds from any realization of the secured collateral until they have been reimbursed. At such time, the owners of junior secured debt (including, in certain circumstances, the fund) will be entitled to receive proceeds from the realization of the collateral securing such debt. Therethere can be no assurances that we will continue to generate sufficient cash to pay dividends, or that we will continue to pay dividends with the proceeds, if any, fromcash that we do generate. The determination regarding the salepayment of such collateral would be sufficientdividends is subject to satisfy the loan obligations secured by subordinate debt instruments. To the extent that the fund owns secured debt that is junior to other secured debt, the fund may lose the valuediscretion of its entire investment in such secured debt.
In addition, the fund may invest in loans that are secured by a second lien on assets. Second lien loans have been a developed market for a relatively short periodour Board of time,Directors, and there is limited historical data on the performance of second lien loanscan be no assurances that we will continue to generate sufficient cash to pay dividends, or that we will pay dividends in adverse economic circumstances. In addition, second lien loan products are subject to intercreditor arrangements with the holders of first lien indebtedness, pursuant to which the second lien holders have waived many of the rights of a secured creditor, and some rights of unsecured creditors, including rights in bankruptcy, which can materially affect recoveries. While there is broad market acceptance of some second lien intercreditor terms, no clear market standard has developed for certain other material intercreditor terms for second lien loan products. This variation in key intercreditor terms may result in dissimilar recoveries across otherwise similarly situated second lien loans in insolvency or distressed situations. While uncertainty of recovery in an insolvency or distressed situation is inherent in all debt instruments, second lien loan products carry more risks than certain other debt products.future periods.
Our level of indebtedness, and restrictions under such indebtedness, could adversely affect our operations and liquidityliquidity.
In December 2017, we completed an offering of 7.25% SeniorOur senior notes include: (a) the 6.75% 2024 Notes due 2027 with an aggregate principal amount of $80.5 million. In May 2017, we completed an offering of 7.50% Seniorapproximately $111.2 million; (b) the 6.50% 2026 Notes due 2027 with an aggregate principal amount of $60.4 million. In November 2016 we completed an offering of 7.50% Seniorapproximately $178.8 million; (c) the 6.375% 2025 Notes due 2021 with an aggregate principal amount of $28.8approximately $144.5 million; (d) the 6.00% 2028 Notes with an aggregate principal amount of approximately $259.3 million; (e) the 5.50% 2026 Notes with an aggregate principal amount of approximately $214.2 million; (f) the 5.25% 2028 Notes with an aggregate principal amount of approximately $397.3 million; and (g) the 5.00% 2026 Notes with an aggregate principal amount of approximately $322.7 million. In 2017, we also enteredThe Company periodically enters into an At Market Issuance Sales AgreementAgreements with B. Riley FBRSecurities. The most recent sales agreement prospectus was filed by us with the SEC on January 5, 2022 (the “January 2022 Sales Agreement Prospectus”) superseding the prospectus filed with the SEC on August 11, 2021, the prospectus filed with the SEC on April 6, 2021, and the prospectus filed with the SEC on January 28, 2021. Pursuant to the January 2022 Sales Agreement, the Company may sell additional 7.50% Senior Notes due 2027 and 7.50% Senior Notes due 2021, under which agreement we sold $32.1 million infrom time to time, at the Company’s option, up to an aggregate principal amount of 7.50% Senior$250.0 million, 6.75% 2024 Notes, 6.50% 2026 Notes, 6.375% 2025 Notes, 6.00% 2028 Notes, 5.50% 2026 Notes, 5.25% 2028 Notes, 5.00% 2026 Notes and Depositary Shares. As of December 31, 2021, the Company had $111.9 million available for offer and sale pursuant to the January 2022 Sales Agreement.
On June 23, 2021, we and our wholly owned subsidiaries, BR Financial Holdings, LLC, a Delaware limited liability company (the “Primary Guarantor”), and BR Advisory & Investments, LLC, a Delaware limited liability company (the “Borrower”), entered into a credit agreement (the “Credit Agreement”) by and among us, Primary Guarantor, the Borrower, the lenders party thereto, Nomura Corporate Funding Americas, LLC, as administrative agent and Wells Fargo Bank, N.A., as collateral agent, providing for a four-year $200.0 million secured term loan credit facility (the “Term Loan Facility”) and a four-year $80.0 million secured revolving loan credit facility (the “Revolving Credit Facility” and, together with the Term Loan Facility, the “Credit Facilities”). The Credit Facilities will mature on June 23, 2025, subject to acceleration or prepayment. On the closing date, the Borrower borrowed the full $200.0 million under the Term Loan Facility. The Revolving Credit Facility is available for borrowing from time to time prior to the final maturity of the Revolving Credit Facility.
On December 19, 2018, BRPI Acquisition Co LLC (“BRPAC”), a Delaware limited liability company, UOL, and YMAX Corporation, a Delaware corporation (collectively, the “Borrowers”), indirect wholly owned subsidiaries of ours, in the capacity of borrowers, entered into a credit agreement with Banc of California, N.A. in its capacity as agent and lender and with the other lenders party thereto (the “BRPAC Credit Agreement”). Under the BRPAC Credit Agreement, we borrowed $80.0 million due 2027 and $6.5 millionDecember 19, 2023. Pursuant to the terms of the BRPAC Credit Agreement, we may request additional optional term loans in an aggregate principal amount of 7.50% Senior Notes due 2021up to $10.0 million at any time prior to the first anniversary of the agreement date. On February 1, 2019, the Borrowers entered into the First Amendment to Credit Agreement and Joinder with City National Bank as ofa new lender in which the new lender extended to Borrowers the additional $10.0 million as further discussed in Note 11 to the accompanying financial statements. On December 31, 2017. On December 18, 2017, we2020, the Borrowers entered into an At Market Issuance Salesthe Second Amendment to Credit Agreement with B. Riley FBRpursuant to issue up towhich, among other things, we borrowed an additional aggregate$75.0 million term loan, the proceeds of which the Borrowers’ will use to repay the outstanding principal amount of $19.0the existing term loans and optional loans and for other general corporate purposes. In April 2017, we amended our Credit Agreement with Wells Fargo Bank (the “Wells Fargo Credit Agreement”) to increase our retail liquidation line of credit from $100 million of additional 7.25% Senior Notes due 2027, 7.50% Senior Notes due 2027 and 7.50% Senior Notes due 2021. to $200 million.
The terms of such indebtedness contain various restrictions and covenants regarding the operation of our business, including, but not limited to, restrictions on our ability to merge or consolidate with or into any other entity. In April 2017, we amended our Credit Agreement with Wells Fargo Bank (the “Wells Fargo Credit Agreement”) to increase our retail liquidation line of credit from $100 million to $200 million and we also entered into a credit agreement with the Banc of California that provides for a revolving credit facility under which UOL may borrow (or request the issuance of letters of credit) up to $20 million. We may also secure additional debt financing in the future in addition to our current debt. Our level of indebtedness generally could adversely affect our operations and liquidity, by, among other things: (i) making it more difficult for us to pay or refinance our debts as they become due during adverse economic and industry conditions because we may not have sufficient cash flows to make our scheduled debt payments; (ii) causing us to use a larger portion of our cash flows to fund interest and principal payments, thereby reducing the availability of cash to fund working capital, capital expenditures and other business activities; (iii) making it more difficult for us to take advantage of significant business opportunities, such as acquisition opportunities or other strategic transactions, and to react to changes in market or industry conditions; and (iv) limiting our ability to borrow additional monies in the future to fund working capital, capital expenditures, acquisitions and other general corporate purposes as and when needed, which could force us to suspend, delay or curtail business prospects, strategies or operations.
We may not be able to generate sufficient cash flow to pay the interest on our debt, and future working capital, borrowings or equity financing may not be available to pay or refinance such debt. If we are unable to generate sufficient cash flow to pay the interest on our debt, we may have to delay or curtail our operations. If we are unable to service our indebtedness, we will be forced to adopt an alternative strategy that may include actions such as reducing capital expenditures, selling assets, restructuring or refinancing our indebtedness or seeking additional equity capital. These alternative strategies may not be affected on satisfactory terms, if at all, and they may not yield sufficient funds to make required payments on our indebtedness. If, for any reason, we are unable to meet our debt service and repayment obligations, we would be in default under the terms of the agreements governing our debt, which could allow our creditors at that time to declare certain outstanding indebtedness to be due and payable or exercise other available remedies, which may in turn trigger cross acceleration or cross default rights in other agreements. If that should occur, we may not be able to pay all such debt or to borrow sufficient funds to refinance it. Even if new financing were then available, it may not be on terms that are acceptable to us.
Risks RelatedOur senior notes are unsecured and therefore are effectively subordinated to any secured indebtedness that we currently have or that we may incur in the future.
Our senior notes are not secured by any of our assets or any of the assets of our subsidiaries. As a result, our senior notes are effectively subordinated to any secured indebtedness that we or our subsidiaries have currently outstanding or may incur in the future (or any indebtedness that is initially unsecured to which we subsequently grant security) to the Acquisitionextent of magicJackthe value of the assets securing such indebtedness. The indenture governing our senior notes does not prohibit us or our subsidiaries from incurring additional secured (or unsecured) indebtedness in the future. In any liquidation, dissolution, bankruptcy or other similar proceeding, the holders of any of our existing or future secured indebtedness and the secured indebtedness of our subsidiaries may assert rights against the assets pledged to secure that indebtedness and may consequently receive payment from these assets before they may be used to pay other creditors, including the holders of our senior notes.
Our senior notes are structurally subordinated to the indebtedness and other liabilities of our subsidiaries.
Our senior notes are obligations exclusively of the Company and not of any of our subsidiaries. None of our subsidiaries is a guarantor of our senior notes, and our senior notes are not required to be guaranteed by any subsidiaries we may acquire or create in the future. Therefore, in any bankruptcy, liquidation or similar proceeding, all claims of creditors (including trade creditors) of our subsidiaries will have priority over our equity interests in such subsidiaries (and therefore the claims of our creditors, including holders of our senior notes) with respect to the assets of such subsidiaries. Even if we are recognized as a creditor of one or more of our subsidiaries, our claims would still be effectively subordinated to any security interests in the assets of any such subsidiary and to any indebtedness or other liabilities of any such subsidiary senior to our claims. Consequently, our senior notes will be structurally subordinated to all indebtedness and other liabilities (including trade payables) of any of our subsidiaries and any subsidiaries that we may in the future acquire or establish as financing vehicles or otherwise. The indenture governing our senior notes does not prohibit us or our subsidiaries from incurring additional indebtedness in the future. In addition, future debt and security agreements entered into by our subsidiaries may contain various restrictions, including restrictions on payments by our subsidiaries to us and the transfer by our subsidiaries of assets pledged as collateral.
OurThe indenture under which our senior notes were issued contains limited protection for holders of our senior notes.
The indenture under which our senior notes were issued offers limited protection to holders of our senior notes. The terms of the indenture and our senior notes do not restrict our or any of our subsidiaries’ ability to engage in, or otherwise be a party to, a variety of corporate transactions, circumstances or events that could have an adverse impact on the holders of our senior notes. In particular, the terms of the indenture and our senior notes do not place any restrictions on our or our subsidiaries’ ability to:
| ● | issue debt securities or otherwise incur additional indebtedness or other obligations, including (1) any indebtedness or other obligations that would be equal in right of payment to our senior notes, (2) any indebtedness or other obligations that would be secured and therefore rank effectively senior in right of payment to our senior notes to the extent of the values of the assets securing such debt, (3) indebtedness of ours that is guaranteed by one or more of our subsidiaries and which therefore is structurally senior to our senior notes and (4) securities, indebtedness or obligations issued or incurred by our subsidiaries that would be senior to our equity interests in our subsidiaries and therefore rank structurally senior to our senior notes with respect to the assets of our subsidiaries; |
| ● | pay dividends on, or purchase or redeem or make any payments in respect of, capital stock or other securities subordinated in right of payment to our senior notes; |
| ● | sell assets (other than certain limited restrictions on our ability to consolidate, merge or sell all or substantially all of our assets); |
| ● | enter into transactions with affiliates; |
| ● | create liens (including liens on the shares of our subsidiaries) or enter into sale and leaseback transactions; |
| ● | make investments; or |
| ● | create restrictions on the payment of dividends or other amounts to us from our subsidiaries. |
In addition, the indenture does not include any protection against certain events, such as a change of control, a leveraged recapitalization or “going private” transaction (which may result in a significant increase of our indebtedness levels), restructuring or similar transactions. Furthermore, the terms of the indenture and our senior notes do not protect holders of our senior notes in the event that we experience changes (including significant adverse changes) in our financial condition, results of operations or credit ratings, as they do not require that we or our subsidiaries adhere to any financial tests or ratios or specified levels of net worth, revenues, income, cash flow, or liquidity. Also, an event of default or acceleration under our other indebtedness would not necessarily result in an event of default under our senior notes.
Our ability to recapitalize, incur additional debt and take a number of other actions that are not limited by the terms of our senior notes may have important consequences for the holders of our senior notes, including making it more difficult for us to satisfy our obligations with respect to our senior notes or negatively affecting the trading value of our senior notes.
Other debt we issue or incur in the future could contain more protections for its holders than the indenture and our senior notes, including additional covenants and events of default. The issuance or incurrence of any such debt with incremental protections could affect the market for and trading levels and prices of our senior notes.
An increase in market interest rates could result in a decrease in the value of our senior notes.
In general, as market interest rates rise, notes bearing interest at a fixed rate decline in value. Consequently, if the market interest rates increase after our senior notes were purchased, the acquisitionmarket value of magicJackour senior notes may decline. We cannot predict the future level of market interest rates.
An active trading market for our senior notes may not develop, which could limit the market price of our senior notes or the ability of our senior note holders to sell them.
The 5.00% 2026 Notes are quoted on NASDAQ under the symbol “RILYG,” the 5.25% 2028 Notes are quoted on NASDAQ under the symbol “RILYZ,” the 6.75% 2024 Notes are quoted on NASDAQ under the symbol “RILYO,” the 6.50% 2026 Notes are quoted on NASDAQ under the symbol “RILYN,” the 6.375% 2025 Notes are quoted on NASDAQ under the symbol “RILYM,” the 5.50% 2026 Notes are quoted on the NASDAQ under the symbol “RILYK” and the 6.00% 2028 Notes are quoted on NASDAQ under the symbol “RILYT”. We cannot provide any assurances that an active trading market will develop for our senior notes or that our senior note holders will be able to sell their senior notes. If the senior notes are traded after their initial issuance, they may trade at a discount from their initial offering price depending on prevailing interest rates, the market for similar securities, our credit ratings, general economic conditions, our financial condition, performance and prospects and other factors. Accordingly, we cannot assure our senior note holders that a liquid trading market will develop for our senior notes, that our senior note holders will be able to sell our senior notes at a particular time or that the price our senior note holders receive when they sell will be favorable. To the extent an active trading market does not develop, the liquidity and trading price for our senior notes may be harmed. Accordingly, our senior note holders may be required to bear the financial risk of an investment in our senior notes for an indefinite period of time.
We may issue additional notes.
Under the terms of the indenture governing our senior notes, we may from time to time without notice to, or the consent of, the holders of our senior notes, create and issue additional notes which will be equal in rank to our senior notes. We will not issue any such additional notes unless such issuance would constitute a “qualified reopening” for U.S. federal income tax purposes.
The rating for the 5.00% 2026 Notes, 5.25% 2028 Notes, 6.75% 2024 Notes, 6.50% 2026 Notes, 6.375% 2025 Notes, 5.50% 2026 Notes, or 6.00% 2028 Notes could at any time be revised downward or withdrawn entirely at the discretion of the issuing rating agency.
We have obtained a rating for the 5.00% 2026 Notes, 5.25% 2028 Notes, 6.75% 2024 Notes, 6.50% 2026 Notes, 6.375% 2025 Notes, 5.50% 2026 Notes, and 6.00% 2028 Notes (collectively, the “Rated Notes”). Ratings only reflect the views of the issuing rating agency or agencies and such ratings could at any time be revised downward or withdrawn entirely at the discretion of the issuing rating agency. A rating is not a recommendation to purchase, sell or hold any of the Rated Notes. Ratings do not reflect market prices or suitability of a security for a particular investor and the rating of the Rated Notes may not reflect all risks related to us and our business, or the structure or market value of the Rated Notes. We may elect to issue other securities for which we may seek to obtain a rating in the future. If we issue other securities with a rating, such ratings, if they are lower than market expectations or are subsequently lowered or withdrawn, could adversely affect the market for or the market value of the Rated Notes.
There is no established market for the Depositary Shares and the market value of the Depositary Shares could be substantially affected by various factors.
The Depositary Shares are an issue of securities with no established trading market. Although the shares are trading on the NASDAQ Global Market, an active trading market on the NASDAQ Global Market for the Depositary Shares may not develop or last, in which case the trading price of the Depositary Shares could be adversely affected. If an active trading market does develop on the NASDAQ Global Market, the Depositary Shares may trade at prices higher or lower than their initial offering price. The trading price of the Depositary Shares also depends on many factors, different from those currently affectingincluding, but not limited to:
| ● | prevailing interest rates; |
| ● | the market for similar securities; |
| ● | general economic and financial market conditions; and |
| ● | the Company’s financial condition, results of operations and prospects. |
The Company has been advised by some of the results of our operations.underwriters that they intend to make a market in the Depositary Shares, but they are not obligated to do so and may discontinue market-making at any time without notice.
Our business
The Existing Preferred Stock and the business of magicJack differ in certain respects and, accordingly, the results of operationsDepositary Shares rank junior to all of the combined companyCompany’s indebtedness and other liabilities and are effectively junior to all indebtedness and other liabilities of the Company’s subsidiaries.
In the event of a bankruptcy, liquidation, dissolution or winding-up of the affairs of the Company, the Company’s assets will be available to pay obligations on the 6.875% Series A Cumulative Perpetual Preferred Stock, par value $0.0001 per share (the “Series A Preferred Stock”) and the 7.375% Series B Cumulative Perpetual Preferred Stock, par value $0.0001 per share (the “Series B Preferred Stock” and, together with the Series A Preferred Stock, the “Existing Preferred Stock”), which ranks in parity with the Series A Preferred Stock, only after all of the Company’s indebtedness and other liabilities have been paid. The rights of holders of the Existing Preferred Stock to participate in the distribution of the Company’s assets will rank junior to the prior claims of the Company’s current and future creditors and any future series or class of preferred stock the Company may issue that ranks senior to the Existing Preferred Stock. In addition, the Existing Preferred Stock effectively ranks junior to all existing and future indebtedness and other liabilities of (as well as any preferred equity interests held by others in) the Company’s existing subsidiaries and any future subsidiaries. The Company’s existing subsidiaries are, and any future subsidiaries would be, separate legal entities and have no legal obligation to pay any amounts to the Company in respect of dividends due on the Existing Preferred Stock. If the Company is forced to liquidate its assets to pay its creditors, the Company may not have sufficient assets to pay amounts due on any or all of the Existing Preferred Stock then outstanding. The Company and its subsidiaries have incurred and may in the future incur substantial amounts of debt and other obligations that will rank senior to the Existing Preferred Stock. The Company may incur additional indebtedness and become more highly leveraged in the future, which could harm the Company’s financial position and potentially limit cash available to pay dividends. As a result, the Company may not have sufficient funds remaining to satisfy its dividend obligations relating to the Existing Preferred Stock if the Company incurs additional indebtedness.
Future offerings of debt or senior equity securities may adversely affect the market price of the combined company’s commonDepositary Shares. If the Company decides to issue debt or senior equity securities in the future, it is possible that these securities will be governed by an indenture or other instrument containing covenants restricting the Company’s operating flexibility. Additionally, any convertible or exchangeable securities that the Company issues in the future may have rights, preferences and privileges more favorable than those of the Existing Preferred Stock and may result in dilution to owners of the Depositary Shares. The Company and, indirectly, the Company’s shareholders, will bear the cost of issuing and servicing such securities. Because the Company’s decision to issue debt or equity securities in any future offering will depend on market conditions and other factors beyond the Company’s control, the Company cannot predict or estimate the amount, timing or nature of the Company’s future offerings. Thus, holders of the Depositary Shares will bear the risk of the Company’s future offerings reducing the market price of the Depositary Shares and diluting the value of their holdings in the Company.
The Company may issue additional shares may be affected by factors different from those currently affecting our independent results of operations.
the Existing Preferred Stock and additional series of preferred stock that rank on a parity with the Existing Preferred Stock as to dividend rights, rights upon liquidation or voting rights.
Regulatory approvals may not be received, may take longer than expected
The Company is allowed to issue additional shares of Existing Preferred Stock and additional series of preferred stock that would rank on a parity with the Existing Preferred Stock as to dividend payments and rights upon the Company’s liquidation, dissolution or may impose conditions that are not presently anticipatedwinding up of the Company’s affairs pursuant to the Company’s certificate of incorporation and the certificate of designation for the Existing Preferred Stock without any vote of the holders of the Existing Preferred Stock. The Company’s certificate of incorporation authorizes the Company to issue up to 1,000,000 shares of preferred stock in one or cannot be met.
Before the transactions contemplatedmore series on terms determined by the AgreementCompany’s Board of Directors. However, the use of depositary shares enables the Company to issue significant amounts of preferred stock, notwithstanding the number of shares authorized by the Company’s certificate of incorporation. The issuance of additional shares of Existing Preferred Stock and Planadditional series of Merger with magicJack, including the magicJack Merger, may be completed, various approvals must be obtained from governmental authorities, including the expiration of the applicable waiting period under the Hart-Scott-Rodino Antitrust Improvements Act of 1976, as amended. These authorities may impose conditions on the granting of such approvals. Such conditions or changes and the process of obtaining regulatory approvalsparity preferred stock could have the effect of delaying completionreducing the amounts available to the Existing Preferred stockholders upon the Company’s liquidation or dissolution or the winding up of the magicJack Merger or of imposing additional costs or limitationsCompany’s affairs. It also may reduce dividend payments on the combined company followingExisting Preferred Stock issued and outstanding if the magicJack Merger. The regulatory approvalsCompany does not have sufficient funds to pay dividends on all Existing Preferred Stock outstanding and other classes of stock with equal priority with respect to dividends.
In addition, although holders of the Depositary Shares are entitled to limited voting rights (discussed further below), the holders of the Depositary Shares will vote separately as a class along with all other outstanding series of the Company’s preferred stock that the Company may notissue upon which like voting rights have been conferred and are exercisable. As a result, the voting rights of holders of the Depositary Shares may be received at all,significantly diluted, and the holders of such other series of preferred stock that the Company may notissue may be received in a timely fashion,able to control or significantly influence the outcome of any vote.
Future issuances and sales of parity preferred stock, or the perception that such issuances and sales could occur, may cause prevailing market prices for the Depositary Shares and the Company’s common stock to decline and may contain conditionsadversely affect the Company’s ability to raise additional capital in the financial markets at times and prices favorable to the Company. Such issuances may also reduce or eliminate the Company’s ability to pay dividends on the completionCompany’s common stock.
Holders of Depositary Shares have extremely limited voting rights.
The voting rights of holders of Depositary Shares are limited. The Company’s common stock is the only class of the magicJack MergerCompany’s securities that are not anticipated or cannot be met. Ifcarries full voting rights. Voting rights for holders of Depositary Shares exist primarily with respect to the consummationability to elect (together with the holders of other outstanding series of the magicJack Merger is delayed, including by a delayCompany’s preferred stock, or Depositary Shares representing interests in receiptthe Company’s preferred stock, or additional series of necessary governmental approvals,preferred stock the business, financial conditionCompany may issue in the future and results of operations of each company may also be materially adversely affected.
The magicJack Merger is subject to certain closing conditions that, if not satisfiedupon which similar voting rights have been or waived, will resultare in such magicJack Merger not being completed, which may cause the prices of our common shares to decline.
The magicJack Merger is subject to customary conditions to closing, including the receipt of required regulatory approvalsfuture conferred and approval of each party’s shareholders of certain merger-related proposals. If any conditionare exercisable) two additional directors to the magicJack Merger isCompany’s Board of Directors in the event that six quarterly dividends (whether or not satisfieddeclared or waived,consecutive) payable on the Existing Preferred Stock are in arrears, and with respect to voting on amendments to the extent permitted by law, such merger will not be completed. In addition, magicJack may terminateCompany’s certificate of incorporation or certificate of designation (in some cases voting together with the Agreement and Planholders of Merger under certain circumstances even if such agreement is approved by its shareholders. If we and magicJack do not complete the magicJack Merger, the trading price of our common shares may decline. In addition, we would not realize anyother outstanding series of the expected benefits of having completed such merger. If the magicJack Merger is not completed, additional risks could materialize, which couldCompany’s preferred stock as a single class) that materially and adversely affect ourthe rights of the holders of Depositary Shares (and other series of preferred stock, as applicable) or create additional classes or series of the Company’s stock that are senior to the Existing Preferred Stock, provided that in any event adequate provision for redemption has not been made. Other than the limited circumstances described in this prospectus supplement, holders of Depositary Shares will not have any voting rights.
The Depositary Shares have not been rated.
The Existing Preferred Stock and the Depositary Shares have not been rated and may never be rated. It is possible, however, that one or more rating agencies might independently decide to assign a rating to the Depositary Shares or that the Company may elect to obtain a rating of the Depositary Shares in the future. Furthermore, the Company may elect to issue other securities for which the Company may seek to obtain a rating. If any ratings are assigned to the Depositary Shares in the future or if the Company issues other securities with a rating, such ratings, if they are lower than market expectations or are subsequently lowered or withdrawn, could adversely affect the market for, or the market value of, the Depositary Shares.
Ratings reflect the views of the issuing rating agency or agencies, and such ratings could at any time be revised downward, placed on negative outlook or withdrawn entirely at the discretion of the issuing rating agency or agencies. Furthermore, a rating is not a recommendation to purchase, sell or hold any particular security, including the Depositary Shares. Ratings do not reflect market prices or the suitability of a security for a particular investor, and any future rating of the Depositary Shares may not reflect all risks related to the Company and its business, financial conditionor the structure or market value of the Depositary Shares.
The conversion feature may not adequately compensate the holders, and results.
Wethe conversion and magicJackredemption features of the Existing Preferred Stock and the Depositary Shares may make it more difficult for a party to take over the Company and may discourage a party from taking over the Company.
Upon the occurrence of a Delisting Event or Change of Control (each as defined in the certificate of designation for each series of the Existing Preferred Stock, respectively), holders of the Depositary Shares will have the right (unless, prior to the Delisting Event Conversion Date or Change of Control Conversion Date (each as defined in the certificate of designation for each series of the Existing Preferred Stock, respectively), as applicable, the Company has provided or provide notice of the Company’s election to redeem such series of Existing Preferred Stock) to direct the depositary to convert some or all of such series of Existing Preferred Stock underlying their Depositary Shares into the Company’s common stock (or equivalent value of alternative consideration), and under these circumstances the Company will also have a special optional redemption right to redeem such series of Existing Preferred Stock. Upon such a conversion, the holders will be limited to a maximum number of shares of the Company’s common stock equal to the Share Cap (as defined in the certificate of designation for each series of the Existing Preferred Stock, respectively) multiplied by the number of shares of such series of Existing Preferred Stock converted. If the common stock price is less than $11.49 in the case of the Series A Preferred Stock (which is approximately 50% of the closing sale price per share of the Company’s common stock on October 1, 2019) or $13.39 in the case of the Series B Preferred Stock (which is approximately 50% of the closing sale price per share of the Company’s common stock on August 31, 2020), subject to business uncertaintiesadjustment, the holders will receive a maximum number of shares of the Company’s common stock per depositary share, which may result in a holder receiving value that is less than the liquidation preference of the Depositary Shares. In addition, those features of the Existing Preferred Stock and contractual restrictions while the magicJack Merger is pending.
Uncertainty aboutDepositary Shares may have the effect of inhibiting a third party from making an acquisition proposal for the magicJack Merger on employees, customers and vendors may have an adverse influence on the business, financial condition and resultsCompany or of operationsdelaying, deferring or preventing a change of magicJack and us. These uncertainties may impair magicJack’s or our ability to attract, retain and motivate key personnel pending the consummationcontrol of the magicJack Merger, as such personnelCompany under circumstances that otherwise could provide the holders of the Company’s common stock and Depositary Shares with the opportunity to realize a premium over the then-current market price or that shareholders may experience uncertainty aboutotherwise believe is in their future roles following the consummation of such merger. Additionally, these uncertainties could cause self-regulatory organizations, customers, clearing brokers, suppliers, vendors and others who deal with magicJack or us to seek to change existing business relationships with magicJack, us or the combined company or fail to extend an existing relationship with magicJack, us or the combined company.best interests.
In addition, the Agreement and Plan of Merger restricts magicJack and us, as applicable, from taking certain actions without the other’s party’s consent while such merger is pending. These restrictions could have a material adverse effect on magicJack’s or our business, financial condition and results of operations.
The combined company may fail to realize the anticipated benefitsmarket price of the magicJack Merger.Depositary Shares could be substantially affected by various factors.
The successmarket price of the magicJack MergerDepositary Shares will depend on amongmany factors, which may change from time to time, including:
| ● | prevailing interest rates, increases in which may have an adverse effect on the market price of the Depositary Shares; |
| ● | the annual yield from distributions on the Depositary Shares as compared to yields on other financial instruments; |
| ● | general economic and financial market conditions; |
| ● | government action or regulation; |
| ● | the financial condition, performance and prospects of the Company and its competitors; |
| ● | changes in financial estimates or recommendations by securities analysts with respect to the Company, its competitors or the industry in which the Company operates; |
| ● | the Company’s issuance of additional preferred equity or debt securities; and |
| ● | actual or anticipated variations in quarterly operating results of the Company and its competitors. |
As a result of these and other things,factors, investors who purchase the combined company’s ability to combineDepositary Shares may experience a decrease, which could be substantial and rapid, in the businesses of us and magicJack. If the combined company is not able to successfully achieve this objective, the anticipated benefitsmarket price of the magicJack Merger may not be realized fully,Depositary Shares, including decreases unrelated to the Company’s operating performance or at all, or may take longer to realize than expected.
We and magicJack have operated and, until the consummation of the magicJack Merger, will continue to operate independently. It is possible that the integration process or other factors could result in the loss or departure of key employees, the disruption of our or magicJack’s ongoing business, or inconsistencies in standards, controls, procedures and policies. It is also possible that clients, customers and counterparties of us or magicJack could choose to discontinue their relationships with the combined company because they prefer doing business with an independent company or for any other reason, which would adversely affect the future performance of the combined company. These transition matters could have an adverse effect on each of us and magicJack during the pre-merger period and for an undetermined amount of time after the consummation of the magicJack Merger. prospects.
Item 1B. UNRESOLVED STAFF COMMENTS
None.
Item 2. PROPERTIES
Our headquarters are located in Woodland Hills,Los Angeles, California in a leased facility. The following table sets forth the location and use of each of our properties, all of which are leased as of December 31, 2017.
We believe that this facility and our other existing facilities are suitable and adequate for the business conducted therein, appropriately used and have sufficient capacity for their intended purpose.
The Company is subject to certain legal and other claims that arise in the ordinary course of its business. In particular, the Company and its subsidiaries are named in and subject to various proceedings and claims arising primarily from our securities business activities, including lawsuits, arbitration claims, class actions, and regulatory matters. Some of these claims seek substantial compensatory, punitive, or indeterminate damages. The Company and its subsidiaries are also involved in other reviews, investigations, and proceedings by governmental and self-regulatory organizations regarding our business, which may result in adverse judgments, settlements, fines, penalties, injunctions, and other relief. In view of the number and diversity of claims against our company, the number of jurisdictions in which litigation is pending, and the inherent difficulty of predicting the outcome of litigation and other claims, we cannot state with certainty what the eventual outcome of pending litigation or other claims will be. Notwithstanding this uncertainty, the Company does not believe that the results of these claims are likely to have a material effect on its financial position or results of operations.
In 2012, Gladden v. Cumberland Trust, WSI, et al. filed a complaint in Circuit Court, Hamblen County, TN at Morristown, Case No. 12-CV-119. This complaint alleges the improper distribution and misappropriation of trust funds. The plaintiff seeks damages of no less than $3.9 million, an accounting, and among other things, punitive damages. In October 2017, the Tennessee Supreme Court remanded the case to the Tennessee State Trial Court for determination of which claims are subject to arbitration and which are not. At the present time, the financial impact to the Company, if any, cannot be estimated.
In January 2015, Great American Group, LLC (“Great American Group”) was served with a lawsuit that seeks to assert claims of breach of contract and other matters in connection with auction services provided to a debtor. The proceeding in the United States Bankruptcy Court for the District of Delaware (“Bankruptcy Court”) is pending in the bankruptcy case of the debtor and its affiliates (the “Debtor”). In the lawsuit, a former landlord of the Debtor generally alleges that Great American Group and a joint venture partner were responsible for contamination while performing services in connection with the auction of certain assets of the Debtor and is seeking approximately $10.0 million in damages. In December 2017, the parties settled the matter and the financial impact to the Company was not material .
In May 2014, Waterford Township Police & Fire Retirement System et al. v. Regional Management Corp et al., filed a complaint in the Southern District of New York (the “Court”), against underwriters alleging violations under sections 11 and 12 of the Securities Act of 1933, as amended (the “Securities Act”). B. Riley FBR, Inc. (“B. Riley FBR”) (formerly, FBR Capital Markets & Co. (“FBRCM”)), a broker-dealer subsidiary of ours, was a co-manager of 2 offerings. On January 30, 2017, the Court denied the plaintiffs’ motion to file a first amended complaint, which would have revived claims previously dismissed by the Court on March 30, 2016. On March 1, 2017, the plaintiffs filed a notice of appeal and an opening brief on June 21, 2017. Defendant’s opposition motion was filed on September 12, 2017. Appellants filed their reply brief on October 17, 2017 and oral argument was held on November 17, 2017. On January 26, 2018, the Appellate court issued its order affirming the court’s order dismissing the plantiff’s case and denying leave to amend. Regional Management continues to indemnify all of the underwriters, including FBRCM, pursuant to the operative underwriting agreement.
On January 5, 2017, complaints filed in November 2015 and May 2016 naming MLV & Co. (“MLV”), a broker-dealer subsidiary of FBR, as a defendant in putative class action lawsuits alleging claims under the Securities Act, in connection with the offerings of Miller Energy Resources, Inc. (“Miller”) have been consolidated. The Master Consolidated Complaint, styled Gaynor v. Miller et al., is pending in the United States District Court for the Eastern District of Tennessee, and, like its predecessor complaints, continues to allege claims under Sections 11 and 12 of the Securities Act against nine underwriters for alleged material misrepresentations and omissions in the registration statement and prospectuses issued in connection with six offerings (February 13, 2013; May 8, 2013; June 28, 2013; September 26, 2013; October 17, 2013 (as to MLV only) and August 21, 2014) with an alleged aggregate offering price of approximately $151.0 million. The plaintiffs seek unspecified compensatory damages and reimbursement of certain costs and expenses. In August 2017, the Court granted Defendant’s Motion to Dismiss on Section 12 claims and found that the plaintiffs had not sufficiently alleged a corrective disclosure prior to August 6, 2015, when an SEC civil action was announced. Defendants’ answer was filed on September 25, 2017. Although MLV is contractually entitled to be indemnified by Miller in connection with this lawsuit, Miller filed for bankruptcy in October 2015 and this likely will decrease or eliminate the value of the indemnity that MLV receives from Miller.
In February 2017, certain former employees filed an arbitration claim with FINRA against Wunderlich Securities, Inc. (“WSI”) alleging misrepresentations in the recruitment of claimants to join WSI. Claimants also allege that WSI failed to support their mortgage trading business resulting in the loss of opportunities during their employment with WSI. Claimants are seeking $10.0 million in damages. WSI has counterclaimed alleging that claimants mispresented their process for doing business, particularly their capital needs, resulting in substantial losses to WSI. WSI believes the claims are meritless and intends to vigorously defend the action. A hearing has been scheduled for March 2018.
In March 2017, United Online, Inc. received a letter from PeopleConnect, Inc. (formerly, Classmates, Inc.) (“Classmates”) regarding a notice of investigation received from the Consumer Protection Divisions of the District Attorneys’ offices of four California counties (“California DAs”). These entities suggest that Classmates may be in violation of California codes relating to unfair competition, false or deceptive advertising, and auto-renewal practices. Classmates asserts that these claims are indemnifiable claims under the purchase agreement between United Online, Inc. and the buyer of Classmates. A tolling agreement with the California DAs has been signed and informal discovery and production is in process. At the present time, the financial impact to the Company, if any, cannot be estimated.
In July 2017, an arbitration claim was filed with FINRA by Dominick & Dickerman LLC and Michael Campbell against WSI and Gary Wunderlich with respect to the acquisition by Wunderlich Investment Company, Inc. (“WIC”) (the parent corporation of WSI) of certain assets of Dominick & Dominick LLC in 2015. The Claimants allege that respondents overvalued WIC so that the purchase price paid to the Claimants in shares of WIC stock was artificially inflated. The Statement of Claim includes claims for common law fraud, negligent misrepresentation, and breach of contract. Claimants are seeking damages of approximately $8.0 million plus unspecified punitive damages. Respondents believe the claims are meritless and intend to vigorously defend the action.
In September 2017, a statement of claim was filed in a FINRA arbitration naming FBRCM and other underwriters related to the underwriting of the now-bankrupt, Quantum Fuel Systems Technologies Worldwide, Inc. (“Quantum”). Claimants are seeking $37.0 million in actual damages, plus $75.0 million in punitive damages and attorney’s fees. On October 24, 2017, we joined in a motion with the other underwriters requesting that the claim be dismissed on the grounds that it is improper under FINRA Rules 12204 and 122205 which prohibit class actions and derivative claims, respectively. On December 1, 2017, the claims were dismissed by FINRA.
Item 4. MINE SAFETY DISCLOSURES
Not applicable.
Not applicable.
PART II
Item 5. MARKET FOR REGISTRANT’S COMMON EQUITY, RELATED STOCKHOLDER MATTERS AND ISSUER PURCHASES OF EQUITY SECURITIES
Stock Market and Other Information
Our common stock is traded on the NASDAQ Global Market under the symbol: “RILY”. From July 16, 2015 to November 15, 2016, our common stock was traded on the NASDAQ Capital Market under the symbol “RILY”.
The following table sets forth the high and low closing sale prices of a share of our Common Stock as reported by the NASDAQ Capital Market or NASDAQ Global Market (as applicable) on a quarterly basis for the years ended December 31, 2016 and 2017.
| High | Low | ||||||||
| 2016 | |||||||||
| Quarter ended March 31, 2016 | $ | 10.50 | $ | 9.05 | |||||
| Quarter ended June 30, 2016 | 11.72 | 9.50 | |||||||
| Quarter ended September 30, 2016 | 13.36 | 8.68 | |||||||
| Quarter ended December 31, 2016 | 19.25 | 12.20 | |||||||
| 2017 | |||||||||
| Quarter ended March 31, 2017 | $ | 21.30 | $ | 14.15 | |||||
| Quarter ended June 30, 2017 | 18.60 | 13.70 | |||||||
| Quarter ended September 30, 2017 | 19.95 | 15.30 | |||||||
| Quarter ended December 31, 2017 | 19.20 | 15.90 | |||||||
As of March 9, 2018,February 18, 2022, there were approximately 187119 holders of record of our Common Stock. This number does not include beneficial owners holding shares through nominees or in “street” name.
Dividend Policy
On August 4, 2016, our Board of Directors approved a dividend of $0.03 per share, which was paid on or about September 8, 2016From time to stockholders of record on August 22, 2016. On November 13, 2016, our Board of Directors approved a regular dividend of $0.08 per share and a special dividend of $0.17 per share, which was paid on or about December 14, 2016time, we may decide to stockholders of record on November 29, 2016. On February 20, 2017, our Board of Directors approved a regular quarterly dividend of $0.08 per share and a special dividend of $0.18 per share, which were paid on or about March 13, 2017 to stockholders of record on March 6, 2017. On May 10, 2017, our Board of Directors approved a regular quarterly dividend of $0.08 per share and a special dividend of $0.08 per share, which were paid on or about May 31, 2017 to stockholders of record on May 23, 2017. On August 7, 2017, our Board of Directors approved a regular quarterly dividend of $0.08 per share and a special dividend of $0.05 per share, which were paid on or about August 29, 2017 to stockholders of record on August 21, 2017. On November 8, 2017, our Board of Directors approved a regular quarterly dividend of $0.08 per share and a special dividend of $0.04 per share, which were paid on or about November 30, 2017 to stockholders of record on November 22, 2017. On March 7, 2018, our Board of Directors approved a regular quarterly dividend of $0.08 per share and a special dividend of $0.08 per share,pay dividends which will be paid on or about April 3, 2018 to stockholdersdependent upon our financial condition and results of record on March 20, 2018.operations. While it is the Board’s current intention to make regular dividend payments of $0.08 per share each quarter and special dividend payments dependent upon exceptional circumstances from time to time, our Board of Directors may reduce or discontinue the payment of dividends at any time for any reason it deems relevant. The declaration and payment of any future dividends or repurchases of our common stock will be made at the discretion of our Board of Directors and will be dependent upon our financial condition, results of operations, cash flows, capital expenditures, and other factors that may be deemed relevant by our Board of Directors.
Share Performance Graph
The following graph compares the cumulative total shareholder return on our common share with the cumulative total return on the Russell 2000 Index and a peer group index for the period from December 31, 20122016 to December 31, 2017.2021. The graph and table below assume that $100 was invested on the starting date and dividends, if any, were reinvested on the date of payment without payment of any commissions. The performance shown in the graph and table represents past performance and should not be considered an indication of future performance.
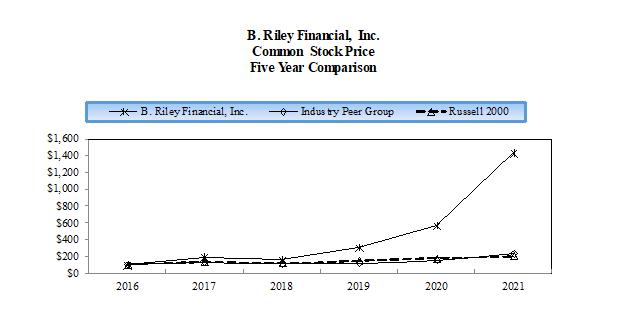
| As of December 31, | 2016 | 2017 | 2018 | 2019 | 2020 | 2021 | ||||||||||||||||||
| B. Riley Financial, Inc. | $ | 100 | $ | 196 | $ | 160 | $ | 302 | $ | 563 | $ | 1,432 | ||||||||||||
| Russell 2000 | $ | 100 | $ | 135 | $ | 119 | $ | 147 | $ | 174 | $ | 198 | ||||||||||||
| Industry Peer Group | $ | 100 | $ | 128 | $ | 108 | $ | 124 | $ | 148 | $ | 228 | ||||||||||||
B. Riley Financial, Inc.Common Stock PriceFive Year Comparison

| As of December 31, | 2012 | 2013 | 2014 | 2015 | 2016 | 2017 | ||||||||||||||||||
| B. Riley Financial, Inc. | $ | 100 | $ | 90 | $ | 161 | $ | 172 | $ | 332 | $ | 347 | ||||||||||||
| Russell 2000 | $ | 100 | $ | 137 | $ | 142 | $ | 134 | $ | 160 | $ | 181 | ||||||||||||
| Industry Peer Group | $ | 100 | $ | 147 | $ | 161 | $ | 129 | $ | 148 | $ | 169 | ||||||||||||
Our peer group index includes the following companies: Cowen Group, Inc.;, JMP Group LLC;LLC (whose performance metrics were included up to November 15, 2021 at which point it was acquired by Citizens Financial Group, Inc.), Oppenheimer Holdings Inc.;, and Stifel Financial Corp. These companies were selected because their businesses and operations were comparable to ours throughout or for some portion of the five-year period presented in the chart above.
The information provided above under the heading “Share Performance Graph” shall not be considered “filed” for purposes of Section 18 of the Exchange Act or incorporated by reference in any filing under the Securities Act of 1933, as amended or the Exchange Act.
Item 6. SELECTED FINANCIAL DATA
The following table sets forth our selected consolidated financial data as of and for each of the five fiscal years ended December 31, 2017, and is derived from our Consolidated Financial Statements. The Consolidated Financial Statements as of December 31, 2017 and 2016, and for each of the years in the three-year period ended December 31, 2017, are included elsewhere in this report. The following data should be read in conjunction with “Management’s Discussion and Analysis of Financial Condition and Results of Operations” and the Consolidated Financial Statements and Notes thereto included elsewhere in this report.
RESERVED
Consolidated Statement of Operations Data:
(Dollars in thousands, except share data)
| Year Ended December 31, | ||||||||||||||||||||
| 2017 | 2016 | 2015 | 2014 | 2013 | ||||||||||||||||
| Revenues: | ||||||||||||||||||||
| Services and fees | $ | 304,841 | $ | 164,235 | $ | 101,929 | $ | 67,257 | $ | 59,967 | ||||||||||
| Interest income - Securities lending | 17,028 | — | — | — | — | |||||||||||||||
| Sale of goods | 307 | 26,116 | 10,596 | 9,859 | 16,165 | |||||||||||||||
| Total revenues | 322,176 | 190,351 | 112,525 | 77,116 | 76,132 | |||||||||||||||
| Operating expenses: | ||||||||||||||||||||
| Direct cost of services | 55,501 | 40,857 | 29,049 | 23,466 | 24,146 | |||||||||||||||
| Cost of goods sold | 398 | 14,755 | 3,072 | 14,080 | 11,506 | |||||||||||||||
| Selling, general and administrative | 213,008 | 82,127 | 58,322 | 44,453 | 36,382 | |||||||||||||||
| Restructuring charge | 12,374 | 3,887 | — | 2,548 | — | |||||||||||||||
| Interest expense - Securities lending | 12,051 | — | — | — | — | |||||||||||||||
| Total operating expenses | 293,332 | 141,626 | 90,443 | 84,547 | 72,034 | |||||||||||||||
| Operating income (loss) | 28,844 | 48,725 | 22,082 | (7,431 | ) | 4,098 | ||||||||||||||
| Other income (expense): | ||||||||||||||||||||
| Interest income | 420 | 318 | 17 | 12 | 26 | |||||||||||||||
| Loss from equity investments | (437 | ) | — | — | — | (177 | ) | |||||||||||||
| Interest expense | (8,382 | ) | (1,996 | ) | (834 | ) | (1,262 | ) | (2,667 | ) | ||||||||||
| Income (loss) from operations before income taxes | 20,445 | 47,047 | 21,265 | (8,681 | ) | 1,280 | ||||||||||||||
| (Provision for) benefit from income taxes | (8,510 | ) | (14,321 | ) | (7,688 | ) | 2,886 | (704 | ) | |||||||||||
| Net income (loss) | 11,935 | 32,726 | 13,577 | (5,795 | ) | 576 | ||||||||||||||
| Net income (loss) attributable to noncontrolling interests | 379 | 11,200 | 1,772 | 6 | (482 | ) | ||||||||||||||
| Net income (loss) attributable to B. Riley Financial, Inc. | $ | 11,556 | $ | 21,526 | $ | 11,805 | $ | (5,801 | ) | $ | 1,058 | |||||||||
| Basic earnings (loss) per share | $ | 0.50 | $ | 1.19 | $ | 0.73 | $ | (0.60 | ) | $ | 0.74 | |||||||||
| Diluted earnings (loss) per share | $ | 0.48 | $ | 1.17 | $ | 0.73 | $ | (0.60 | ) | $ | 0.71 | |||||||||
| Cash dividends per share | $ | 0.67 | $ | 0.28 | $ | 0.32 | $ | 0.03 | $ | — | ||||||||||
| Weighted average basic shares outstanding | 23,181,388 | 18,106,621 | 16,221,040 | 9,612,154 | 1,434,107 | |||||||||||||||
| Weighted average diluted shares outstanding | 24,290,904 | 18,391,852 | 16,265,915 | 9,612,154 | 1,495,328 | |||||||||||||||
Consolidated Balance Sheet Data:
(Dollars in thousands)
| Year Ended December 31, | ||||||||||||||||||||
| 2017 | 2016 | 2015 | 2014 | 2013 | ||||||||||||||||
| Cash and cash equivalents | $ | 132,823 | $ | 112,105 | $ | 30,012 | $ | 21,600 | $ | 18,867 | ||||||||||
| Restricted cash | 19,711 | 3,294 | 51 | 7,657 | 325 | |||||||||||||||
| Securities and other investments owned, at fair value | 145,360 | 16,579 | 25,543 | 17,955 | — | |||||||||||||||
| Total assets | 1,386,904 | 264,618 | 132,420 | 138,990 | 73,677 | |||||||||||||||
| Total liabilities | 1,121,058 | 114,226 | 23,100 | 41,911 | 77,828 | |||||||||||||||
| Total equity (deficit) | 265,846 | 150,392 | 109,320 | 97,079 | (4,151 | ) | ||||||||||||||
None.
Item 7. MANAGEMENT’S DISCUSSION AND ANALYSIS OF FINANCIAL CONDITION AND RESULTS OF OPERATIONS
This report contains forward-looking statements. These statements relate to future events or our future financial performance. In some cases, you can identify forward-looking statements by terminology such as “may,” “will,” “should,” “could,” “expect,” “plan,” “anticipate,” “believe,” “estimate,” “predict,” “future,” “intend,” “seek,” “likely,” “potential” or “continue,” the negative of such terms or other comparable terminology. These statements are only predictions. Actual events or results may differ materially.
Although we believe that the expectations reflected in the forward-looking statements are reasonable, we cannot guarantee future results, levels of activity, performance or achievements. Moreover, neither we, nor any other person, assume responsibility for the accuracy and completeness of the forward-looking statements. WeExcept as required by law we are under no obligation to update any of the forward-looking statements after the filing of this Annual Report to conform such statements to actual results or to changes in our expectations.
The following discussion of our financial condition and results of operations should be read in conjunction with our consolidated financial statements and the related notes and other financial information appearing elsewhere in this Annual Report. Readers are also urged to carefully review and consider the various disclosures made by us which attempt to advise interested parties of the factors which affect our business, including without limitation the disclosures made in Item 1A of Part III of this Annual Report under the caption “Risk Factors”.Factors.”
Risk factors that could cause actual results to differ from those contained in the forward-looking statements include but are not limited to risks related to: volatility in our revenues and results of operations; changing conditions in the financial markets; our ability to generate sufficient revenues to achieve and maintain profitability; our exposure to credit risk; the short term nature of our engagements; the accuracy of our estimates and valuations of inventory or assets in “guarantee” based engagements; competition in the asset management businessbusiness; potential losses related to our auction or liquidation engagements; our dependence on communications, information and other systems and third parties; potential losses related to purchase transactions in our auction and liquidations business; the potential loss of financial institution clients; potential losses from or illiquidity of our proprietary investments; changing economic and market conditions;conditions, including increasing inflation; the continuing effects of the COVID-19 pandemic, or other pandemics or severe public health crises, and other related impacts including supply chain disruptions, labor shortages and increased labor costs; potential liability and harm to our reputation if we were to provide an inaccurate appraisal or valuation; potential mark-downs in inventory in connection with purchase transactions; failure to successfully compete in any of our segments; loss of key personnel; our ability to borrow under our credit facilities or at-the-market offering as necessary; failure to comply with the terms of our credit agreements;agreements or senior notes; our ability to meet future capital requirements ;requirements; our ability to realize the benefits of our completed and proposed acquisitions, including our ability to achieve anticipated opportunities and operating cost savings, and accretion to reported earnings estimated to result from completed and proposed acquisitions in the time frame expected by management or at all; the possibility that our proposed acquisition of magicJack VocalTec Ltd. (“magicJack”) does not close when expected or at all; our ability to promptly and effectively integrate our business with that of magicJack if such transaction closes; the reaction to the magicJack acquisition of our and magicJack’s customers, employees and counterparties; and the diversion of management time on acquisition-related issues.issues; the failure of our brand investment portfolio licensees to pay us royalties; and the intense competition to which our brand investment portfolio is subject. We undertake no obligation to publicly update or revise any forward-looking statements, whether as a result of new information, future events or otherwise.
Except as otherwise required by the context, references in this Annual Report to “thethe “Company,” “B. Riley,” “B. Riley Financial,” “we,” “us” or “our” refer to the combined business of B. Riley Financial, Inc. and all of its subsidiaries.
Overview
General
B. Riley Financial, Inc. and its subsidiaries (NASDAQ: RILY) provide collaborative(“B. Riley” or the “Company”) is a diversified financial services platform and solutions through severalopportunistically invests in companies or assets with attractive risk-adjusted return profiles to benefit its shareholders. Through its affiliated subsidiaries, including:B. Riley provides a full suite of investment banking, corporate finance research, sales, and trading, as well as advisory, valuation, and wealth management, services. The Company’s major business lines include:
| ● | B. Riley |
| ● | B. Riley Wealth Management, which provides comprehensive wealth management and brokerage services to individuals and families, corporations and non-profit organizations, including qualified retirement plans, trusts, foundations, and endowments. The firm was formerly known as Wunderlich |
| ● | National Holdings Corporation (“National”), which provides wealth management, brokerage, insurance brokerage, tax preparation and advisory services, |
| ● | B. Riley Capital Management, |
| that includes B. Riley Asset Management, an advisor to and/or manager of certain private |
| ● |
| ● | B. Riley Retail Solutions, which is a leading provider of asset disposition, liquidation, and auction solutions to a wide range of retail and industrial |
| ● |
We also pursue a strategy of investing in or acquiring companies which we believe have attractive investment return characteristics. On July 1, 2016, we acquired United Online, Inc. (“UOL”) as part of our principal investment strategy.
| ● | B. Riley Principal Investments, which identifies attractive investment opportunities and seeks to control or influence the operations of our portfolio company investments to deliver financial and operational improvements that will maximize the Company’s free cash flow, and therefore, shareholder returns. The team concentrates on opportunities presented by distressed companies or divisions that exhibit challenging market dynamics. Representative transactions include recapitalization, direct equity investment, debt investment, active minority investment and buyouts. |
| ● | Communications consist of United Online, Inc. (“UOL” or “United Online”), which was acquired in July 2016, magicJack VocalTec Ltd. (“magicJack”), which was acquired in November 2018, a 40% equity interest in Lingo Management, LLC (“Lingo”), which was acquired in November 2020, and a mobile virtual network operator business (“Marconi Wireless”), which was acquired in October 2021. Upon receipt of certain regulatory approvals, the Company has the right to acquire an additional 40% equity interest in Lingo. The following briefly describes each such business: |
| ○ | UOL is a communications company that offers consumer subscription services and products, consisting of Internet access services and devices under the NetZero and Juno |
| ○ | magicJack is a Voice over IP (“VoIP”) cloud-based technology and services and wireless mobile communications provider. |
| ○ | Lingo is a global cloud/UC and managed service provider. |
| ○ | Marconi Wireless is a mobile virtual network operator business that provides mobile phone voice, text, and data services and devices. |
| ● | BR Brand Holding (“BR Brands”), in which the Company owns a majority interest, provides licensing of certain brand trademarks. BR Brands owns the assets and intellectual property related to licenses of six brands: Catherine Malandrino, English Laundry, Joan Vass, Kensie Girl, Limited Too and Nanette Lepore as well as investments in the |
We are headquartered in Los Angeles with over 44 offices in major financial markets throughout the United States including New York, Chicago, Boston, Atlanta, Dallas, Memphis, Metro Washington D.C., West Palm Beach, and Europe.Boca Raton.
During the fourth quarter of 2020, the Company realigned its segment reporting structure to reflect organizational management changes. Under the new structure, the valuation and appraisal businesses are reported in the Financial Consulting segment and our bankruptcy, financial advisory, forensic accounting, and real estate consulting businesses that were previously reported in the Capital Markets segment are now reported as part of the Financial Consulting segment. In conjunction with the new reporting structure, the Company recast its segment presentation for all periods presented. During the first quarter of 2021, in connection with the acquisition of National on February 25, 2021, the Company further realigned its segment reporting structure to reflect organizational management changes in the Company’s wealth management business and created a new Wealth Management segment that was previously reported as part of the Capital Markets segment in 2020. In conjunction with the new reporting structures, the Company recast its segment presentation for all periods presented.
For financial reporting purposes, we classify our businesses into foursix operating segments: (i) capital markets, (ii) auction and liquidation, (iii) valuation and appraisal; and (iv) principal investments – United Online.
Capital Markets, Segment.(ii) Wealth Management, (iii) Auction and Liquidation, (iv) Financial Consulting, (v) Principal Investments – Communications, and (vi) Brands.
Capital Markets Segment. Our capital marketsCapital Markets segment provides a full array of investment banking, corporate finance, financial advisory, research, securities lending wealth management,and sales and trading services to corporate, institutional, and high net worthindividual clients. Our corporate finance and investment banking services include merger and acquisitions as well as restructuring advisory services to public and private companies, initial and secondary public offerings, and institutional private placements. In addition, we trade equity securities as a principal for our account, including investments in funds managed by our subsidiaries. Our capital marketsCapital Markets segment also includes our asset management businesses that manage various private and public funds for institutional and individual investors.
Wealth Management Segment. Our Wealth Management segment provides wealth management and tax services to corporate and high net worth clients. We offer comprehensive wealth management services for corporate businesses that include investment strategies, executive services, retirement plans, lending & liquidity resources, and settlement solutions. Our wealth management services for individual client services provide investment management, education planning, retirement planning, risk management, trust coordination, lending & liquidity solutions, legacy planning, and wealth transfer. In addition, we supply market insights to provide unbiased guidance to make important financial decisions. Wealth management resources include market views from our investment strategists and B. Riley Securities’ proprietary equity research.
Auction and Liquidation Segment.Segment. Our auctionAuction and liquidationLiquidation segment utilizes our significant industry experience, a scalable network of independent contractors and industry-specific advisors to tailor our services to the specific needs of a multitude of clients, logistical challenges, and distressed circumstances. Furthermore, ourOur scale and pool of resources allow us to offer our services across North AmericanAmerica as well as parts of Europe, Asia, and Australia. Our auctionAuction and liquidationLiquidation segment operates through two main divisions, retail store liquidations and wholesale and industrial assets dispositions. Our wholesale and industrial assets dispositions division operates through limited liability companies that are controlled by us.
Valuation and Appraisal Segment.Financial Consulting Segment. Our valuation and appraisalFinancial Consulting segment provides valuation and appraisal services to law firms, corporations, financial institutions, lenders, and private equity firms and other providers of capital.firms. These services primarily include the valuation of assets (i) for purposes of determiningbankruptcy, financial advisory, forensic accounting, litigation support, operations management consulting, real estate consulting, and monitoring the value of collateral securing financial transactions and loan arrangements and (ii) in connection with potential business combinations. Our valuation and appraisal services. Our Financial Consulting segment operates through limited liability companies that are wholly owned or majority owned by us.
Principal Investments – United Online- Communications Segment. Our principal investmentsPrincipal Investments - United OnlineCommunications segment consists of businesses which have been acquired primarily for attractive investment return characteristics. Currently, this segment includes, among other investments, UOL, a company that offersthrough which we provide consumer Internet access, magicJack, through which we provide VoIP communication and related product and subscription services, consisting of Internet access under the NetZero and Juno brands. Internet access includes paid dial-up,Marconi Wireless, through which we provide mobile broadband and DSL subscription services. We also offer email, Internet security, web hostingphone services and other services.devices.
Historically, revenues
Brands Segment. Our Brands segment consists of our brand investment portfolio that is focused on generating revenue through the licensing of trademarks and is held by BR Brands.
��
Recent Developments
On January 19, 2022, we acquired FocalPoint Securities, LLC, an independent investment bank based in Los Angeles. The combination is expected to significantly expand B. Riley Securities’ mergers and acquisitions (“M&A”) advisory business and enhance its debt capital markets and financial restructuring capabilities. Founded in 2002, FocalPoint specializes in M&A, private capital advisory, financial restructuring, and special situation transactions. The firm includes approximately 50 investment banking professionals with deep industry specialization in high-growth sectors such as aerospace and defense, industrials, business services, consumer, healthcare, and technology/media/telecom. Our acquisition of FocalPoint builds upon the momentum and proven execution capabilities of both firms and is in line with our stated intent to expand capabilities in M&A advisory and fixed income. This combination provides strategic and financial sponsor clients with access to both firms’ proven execution capabilities and a full suite of end-to-end services from our auctiona single platform.
On January 30, 2020, the World Health Organization (“WHO”) announced a global health emergency because of a new strain of coronavirus (the “COVID-19 outbreak”). In March 2020, the WHO classified the COVID-19 outbreak as a pandemic, based on the rapid increase in exposure globally. During the fourth quarter of 2021, the full impact of the COVID-19 outbreak continued to evolve, with the emergence of variant strains and liquidation segment vary significantly from quarter to quarterbreakthrough infections becoming prevalent both in the U.S. and have a significantworldwide. As the U.S. economy recovers, aided by stimulus packages and fiscal and monetary policies, inflation has been rising at historically high rates, and the Federal Reserve has signaled that it will begin increasing the target federal funds effective rate. The impact of the COVID-19 outbreak and these related matters on our operating results fromof operations, financial position and cash flows will depend on future developments, including the duration and spread of the outbreak and related advisories and restrictions and the success of vaccines and natural immunity in controlling the pandemic. These developments and the impact of the COVID-19 outbreak on the financial markets and the overall economy continue to be highly uncertain and cannot be predicted. If the financial markets and/or the overall economy continue to be impacted, our results of operations, financial position and cash flows may be materially adversely affected.
Results of Operations
The following period to period. These revenues have historically comprised a significant amount of our total revenues and operating profits. During the years ended December 31, 2017, 2016 and 2015, revenues from our auction and liquidation segment were 14.7%, 46.0% and 41.1% of total revenues. Our profitability in each reporting period is impacted by the number and size of retail liquidation engagements we perform on a quarterly or annual basis. Revenues from liquidation service contracts to one retailer represented 13.5% of our total revenues during the year ended December 31, 2016. In addition, revenues from investment banking transactions in our capital markets segment will vary from quarter to quarter and have a material impact on our total revenues and operating profits.
For information about segments and geographic areas, please refer to Note 20 to Consolidated Financial Statements included in Part II of this Annual Report on Form 10-K.
Recent Developments
On November 9, 2017, the Company entered into an Agreement and Plan of Merger with B. R. Acquisition Ltd., an Israeli corporation and wholly-owned subsidiary of the Company (“Merger Sub”), and magicJack VocalTec Ltd., an Israeli corporation (“magicJack”), pursuant to which Merger Sub will merge with and into magicJack, with magicJack continuing as the surviving corporation and as an indirect subsidiary of the Company. Subject to the terms and conditions of the Agreement and Plan of Merger, each outstanding share of magicJack will be converted into the right to receive $8.71 in cash without interest, representing approximately $143,500 in aggregate merger consideration. The closing of the transaction is subject to the receipt of certain regulatory approvals, the approval of the magicJack shareholder’s and the satisfaction of other closing conditions. It is anticipated that the acquisition of magicJack will close in the first half of 2018.
On February 17, 2017, we entered into an Agreement and Plan of Merger (the “FBR Merger Agreement”) with FBR & Co. (“FBR”), pursuant to which FBR was to merge with and into the Company (or a subsidiary of the Company), with the Company (or its subsidiary) as the surviving corporation (the “Merger”). On May 1, 2017, the Company and FBR filed a registration statement for the planned Merger. The shareholders of the Company and FBR approved the acquisition on June 1, 2017, customary closing conditions were satisfied and the acquisition was completed on June 1, 2017. Subject to the terms and conditions of the FBR Merger Agreement, each outstanding share of FBR common stock (“FBR Common Stock”) was converted into the right to receive 0.671 of a share of our common stock. The total acquisition consideration for FBR was estimated to be $73.5 million, which includes the issuance of approximately 4,831,633 shares of our common stock with an estimated fair value of $71.0 million (based on the closing price of our common stock on June 1, 2017) and restricted stock awards with a fair value of $2.5 million attributable to the service period prior to June 1, 2017. We believe that the acquisition of FBR will allow us to benefit from investment banking, corporate finance, securities lending, research, and sales and trading services provided by FBR and planned synergies from the elimination of duplicate corporate overhead and management functions with us.
On May 17, 2017, we entered into a Merger Agreement with Wunderlich Investment Company, Inc., a Delaware corporation (“Wunderlich”), and Stephen Bonnema, in his capacity as the Stockholder Representative (the “Stockholder Representative”), collectively (the “Wunderlich Merger Agreement”). Pursuant to the Wunderlich Merger Agreement, customary closing conditions were satisfied and the acquisition was completed on July 3, 2017. We also entered into a registration rights agreement with certain shareholders of Wunderlich (the “Registration Rights Agreement”) on July 3, 2017. The Registration Rights Agreement provides the Wunderlich shareholder signatories with the right to notice of and, subject to certain conditions, the right to register shares of our common stock in certain future registered offerings of shares of our common stock. In connection with the acquisition Wunderlich on July 3, 2017, the total consideration of $65.1 million included $29.7 million of cash and the issuance of approximately 1,974,812 shares of the Company’s common stock with an estimated fair value of $31.5 million and 821,816 newly issued common stock warrants with an estimated fair value of $3.9 million.
In connection with terms of the Wunderlich Merger Agreement, on July 5, 2017 the number of directors comprising our full Board of Directors was increased by one, with Gary K. Wunderlich, Jr., Chief Executive Officer of Wunderlich, being appointed to fill the new seat in accordance with the terms of his employment agreement. Concurrently with the appointment of Mr. Wunderlich, the number of directors comprising our full Board of Directors was again increased by one, with Michael J. Sheldon appointed as an independent director to fill the new seat.
During 2017, we implemented costs savings measures taking into account the planned synergies as a result of the acquisition of FBR and Wunderlich which included a reduction in force for some of the corporate executives of FBR and Wunderlich and a restructuring to integrate FBR and Wunderlich’s operations with our operations. These initiatives resulted in restructuring charges of $11.7 million in the year ended December 31, 2017. Restructuring charges included $3.3 million related to severance and accelerated vesting of restricted stock awards to former corporate executives of FBR and Wunderlich and $5.0 million of severance, accelerated vesting of stock awards to employees and $3.4 million of lease loss accruals for the planned consolidation of office space related to operations in the Capital Markets segment.
Results of Operations
The following year to year comparisons of our financial results and our interim results are not necessarily indicative of future results.
Year Ended A discussion of changes in our results of operations during the year ended December 31, 2017 Compared2020 compared to Year Endedthe year ended December 31, 20162019 has been omitted from this Annual Report on Form 10-K, but may be found in “Item 7. Management’s Discussion and Analysis of Financial Condition and Results of Operations” in our Annual Report on Form 10-K during the year ended December 31, 2020, filed with the SEC on March 4, 2021, which discussion is incorporated herein by reference and which is available free of charge on the SEC’s website at www.sec.gov.
Consolidated Statements of Income
(Dollars in thousands)
| Year Ended December 31, 2017 | Year Ended December 31, 2016 | |||||||||||||||
| Amount | % | Amount | % | |||||||||||||
| Revenues: | ||||||||||||||||
| Services and fees | $ | 304,841 | 94.6 | % | $ | 164,235 | 86.3 | % | ||||||||
| Interest income - Securities lending | 17,028 | 5.3 | % | — | 0.0 | % | ||||||||||
| Sale of goods | 307 | 0.1 | % | 26,116 | 13.7 | % | ||||||||||
| Total revenues | 322,176 | 100.0 | % | 190,351 | 100.0 | % | ||||||||||
| Operating expenses: | ||||||||||||||||
| Direct cost of services | 55,501 | 17.2 | % | 40,857 | 21.5 | % | ||||||||||
| Cost of goods sold | 398 | 0.1 | % | 14,755 | 7.8 | % | ||||||||||
| Selling, general and administrative expenses | 213,008 | 66.1 | % | 82,127 | 43.1 | % | ||||||||||
| Restructuring charge | 12,374 | 3.8 | % | 3,887 | 2.0 | % | ||||||||||
| Interest expense - Securities lending | 12,051 | 3.7 | % | — | 0.0 | % | ||||||||||
| Total operating expenses | 293,332 | 91.0 | % | 141,626 | 74.4 | % | ||||||||||
| Operating income | 28,844 | 9.0 | % | 48,725 | 25.6 | % | ||||||||||
| Other income (expense): | ||||||||||||||||
| Interest income | 420 | 0.1 | % | 318 | 0.2 | % | ||||||||||
| Loss on equity investment | (437 | ) | (0.1 | %) | — | 0.0 | % | |||||||||
| Interest expense | (8,382 | ) | (2.6 | %) | (1,996 | ) | (1.0 | %) | ||||||||
| Income before income taxes | 20,445 | 6.4 | % | 47,047 | 24.7 | % | ||||||||||
| Provision for income taxes | (8,510 | ) | (2.6 | %) | (14,321 | ) | (7.5 | %) | ||||||||
| Net income | 11,935 | 3.7 | % | 32,726 | 17.2 | % | ||||||||||
| Net income attributable to noncontrolling interests | 379 | 0.1 | % | 11,200 | 5.9 | % | ||||||||||
| Net income attributable to B. Riley Financial, Inc. | $ | 11,556 | 3.6 | % | $ | 21,526 | 11.3 | % | ||||||||
| Year Ended | Year Ended | |||||||||||||||||||||||
| December 31, 2021 | December 31, 2020 | Change | ||||||||||||||||||||||
| Amount | % | Amount | % | Amount | % | |||||||||||||||||||
| Revenues: | ||||||||||||||||||||||||
| Services and fees | $ | 1,172,957 | 67.4 | % | $ | 667,069 | 73.9 | % | $ | 505,888 | 75.8 | % | ||||||||||||
| Trading income and fair value adjustments on loans | 386,676 | 22.2 | % | 104,018 | 11.5 | % | 282,658 | n/m | ||||||||||||||||
| Interest income - Loans and securities lending | 122,723 | 7.1 | % | 102,499 | 11.4 | % | 20,224 | 19.7 | % | |||||||||||||||
| Sale of goods | 58,205 | 3.3 | % | 29,135 | 3.2 | % | 29,070 | 99.8 | % | |||||||||||||||
| Total revenues | 1,740,561 | 100.0 | % | 902,721 | 100.0 | % | 837,840 | 92.8 | % | |||||||||||||||
| Operating expenses: | ||||||||||||||||||||||||
| Direct cost of services | 54,390 | 3.1 | % | 60,451 | 6.7 | % | (6,061 | ) | (10.0 | %) | ||||||||||||||
| Cost of goods sold | 26,953 | 1.5 | % | 12,460 | 1.4 | % | 14,493 | 116.3 | % | |||||||||||||||
| Selling, general and administrative expenses | 906,196 | 52.1 | % | 428,537 | 47.5 | % | 477,659 | 111.5 | % | |||||||||||||||
| Restructuring charge | — | 0.0 | % | 1,557 | 0.2 | % | (1,557 | ) | (100.0 | %) | ||||||||||||||
| Impairment of tradenames | — | 0.0 | % | 12,500 | 1.4 | % | (12,500 | ) | (100.0 | %) | ||||||||||||||
| Interest expense - Securities lending and loan participations sold | 52,631 | 3.0 | % | 42,451 | 4.7 | % | 10,180 | 24.0 | % | |||||||||||||||
| Total operating expenses | 1,040,170 | 59.7 | % | 557,956 | 61.9 | % | 482,214 | 86.4 | % | |||||||||||||||
| Operating income | 700,391 | 40.2 | % | 344,765 | 38.2 | % | 355,626 | 103.2 | % | |||||||||||||||
| Other income (expense): | ||||||||||||||||||||||||
| Interest income | 229 | 0.0 | % | 564 | 0.1 | % | (335 | ) | (59.4 | %) | ||||||||||||||
| Gain on extinguishment of loans and other | 3,796 | 0.2 | % | — | 0.0 | % | 3,796 | 100.0 | % | |||||||||||||||
| Income (loss) on equity investments | 2,801 | 0.2 | % | (623 | ) | (0.1 | %) | 3,424 | n/m | |||||||||||||||
| Interest expense | (92,455 | ) | (5.3 | %) | (65,249 | ) | (7.2 | %) | (27,206 | ) | 41.7 | % | ||||||||||||
| Income before income taxes | 614,762 | 35.3 | % | 279,457 | 31.0 | % | 335,305 | 120.0 | % | |||||||||||||||
| Provision for income taxes | (163,960 | ) | (9.4 | %) | (75,440 | ) | (8.4 | %) | (88,520 | ) | 117.3 | % | ||||||||||||
| Net income | 450,802 | 25.9 | % | 204,017 | 22.6 | % | 246,785 | 121.0 | % | |||||||||||||||
| Net income (loss) attributable to noncontrolling interests | 5,748 | 0.3 | % | (1,131 | ) | (0.1 | %) | 6,879 | n/m | |||||||||||||||
| Net income attributable to B. Riley Financial, Inc. | 445,054 | 25.6 | % | 205,148 | 22.7 | % | 239,906 | 116.9 | % | |||||||||||||||
| Preferred stock dividends | 7,457 | 0.4 | % | 4,710 | 0.5 | % | 2,747 | 58.3 | % | |||||||||||||||
| Net income available to common shareholders | $ | 437,597 | 25.1 | % | $ | 200,438 | 22.2 | % | $ | 237,159 | 118.3 | % | ||||||||||||
n/m - Not applicable or not meaningful.
Revenues
Revenues
The table below and the discussion that follows are based on how we analyze our business.
| Year Ended | Year Ended | |||||||||||||||||||||||
| December 31, 2021 | December 31, 2020 | Change | ||||||||||||||||||||||
| Amount | % | Amount | % | Amount | % | |||||||||||||||||||
| Revenues - Services and fees | ||||||||||||||||||||||||
| Capital Markets segment | $ | 575,317 | 33.1 | % | $ | 339,877 | 37.7 | % | $ | 235,440 | 69.3 | % | ||||||||||||
| Wealth Management segment | 374,361 | 21.5 | % | 72,345 | 8.0 | % | 302,016 | n/m | ||||||||||||||||
| Auction and Liquidation segment | 20,169 | 1.2 | % | 63,101 | 7.0 | % | (42,932 | ) | (68.0 | )% | ||||||||||||||
| Financial Consulting segment | 94,312 | 5.4 | % | 91,622 | 10.1 | % | 2,690 | 2.9 | % | |||||||||||||||
| Principal Investments - Communications segment | 88,490 | 5.1 | % | 83,666 | 9.3 | % | 4,824 | 5.8 | % | |||||||||||||||
| Brands segment | 20,308 | 1.1 | % | 16,458 | 1.8 | % | 3,850 | 23.4 | % | |||||||||||||||
| Subtotal | 1,172,957 | 67.4 | % | 667,069 | 73.9 | % | 505,888 | 75.8 | % | |||||||||||||||
| Revenues - Sale of goods | ||||||||||||||||||||||||
| Auction and Liquidation segment | 53,348 | 3.1 | % | 25,663 | 2.8 | % | 27,685 | 107.9 | % | |||||||||||||||
| Principal Investments - Communications segment | 4,857 | 0.2 | % | 3,472 | 0.4 | % | 1,385 | 39.9 | % | |||||||||||||||
| Subtotal | 58,205 | 3.3 | % | 29,135 | 3.2 | % | 29,070 | 99.8 | % | |||||||||||||||
| Trading income and fair value adjustments on loans | ||||||||||||||||||||||||
| Capital Markets segment | 379,053 | 21.8 | % | 103,214 | 11.4 | % | 275,839 | n/m | ||||||||||||||||
| Wealth Management segment | 7,623 | 0.4 | % | 804 | 0.1 | % | 6,819 | n/m | ||||||||||||||||
| Subtotal | 386,676 | 22.2 | % | 104,018 | 11.5 | % | 282,658 | n/m | ||||||||||||||||
| Interest income - Loans and securities lending | ||||||||||||||||||||||||
| Capital Markets segment | 122,723 | 7.1 | % | 102,499 | 11.4 | % | 20,224 | 19.7 | % | |||||||||||||||
| Total revenues | $ | 1,740,561 | 100.0 | % | $ | 902,721 | 100.0 | % | $ | 837,840 | 92.8 | % | ||||||||||||
| Year Ended December 31, 2017 | Year Ended December 31, 2016 | Change | ||||||||||||||||||||||
| Amount | % | Amount | % | Amount | % | |||||||||||||||||||
| Revenues - Services and fees: | ||||||||||||||||||||||||
| Capital Markets segment | $ | 172,695 | 53.6 | % | $ | 39,335 | 20.7 | % | $ | 133,360 | 339.0 | % | ||||||||||||
| Auction and Liquidation segment | 47,376 | 14.7 | % | 61,891 | 32.5 | % | (14,515 | ) | (23.5 | %) | ||||||||||||||
| Valuation and Appraisal segment | 33,331 | 10.3 | % | 31,749 | 16.7 | % | 1,582 | 5.0 | % | |||||||||||||||
| Principal Investments - United Online segment | 51,439 | 16.0 | % | 31,260 | 16.4 | % | 20,179 | 64.6 | % | |||||||||||||||
| Subtotal | 304,841 | 94.6 | % | 164,235 | 86.3 | % | 140,606 | 85.6 | % | |||||||||||||||
| Revenues - Sale of goods | ||||||||||||||||||||||||
| Auction and Liquidation segment | 3 | 0.0 | % | 25,855 | 13.6 | % | (25,852 | ) | (100.0 | %) | ||||||||||||||
| Principal Investments - United Online segment | 304 | 0.1 | % | 261 | 0.1 | % | 43 | 16.5 | % | |||||||||||||||
| Subtotal | 307 | 0.1 | % | 26,116 | 13.7 | % | (25,809 | ) | (98.8 | %) | ||||||||||||||
| Interest income - Securities lending: | ||||||||||||||||||||||||
| Capital Markets segment | 17,028 | 5.3 | % | — | 0.0 | % | 17,028 | n/m | ||||||||||||||||
| Total revenues | $ | 322,176 | 100.0 | % | $ | 190,351 | 100.0 | % | $ | 131,825 | 69.3 | % | ||||||||||||
n/m - Not applicable or not meaningful.
Total revenues increased $131.8approximately $837.8 million to $322.2$1,740.6 million during the year ended December 31, 20172021 from $190.4$902.7 million during the year ended December 31, 2016.2020. The increase in revenues during the year ended December 31, 20172021 was primarily due to an increase in revenuesrevenue from services and fees of $140.6$505.9 million, an increase in revenue from trading income and fair value adjustments on loans of $282.7 million, an increase in revenue from sale of goods of $29.1 million, and an increase in revenue from interest income –- loans and securities lending of $17.0$20.2 million, as further described below. The increase in revenue from services and fees of $505.9 million was primarily due to increases in revenue of $302.0 million in the Wealth Management segment, $235.4 million in the Capital Markets segment, $4.8 million in the Principal Investments - Communications segment, $3.9 million in the Brands segment, and $2.7 million in the Financial Consulting segment, partially offset by a decrease of $42.9 million in the Auction and Liquidation segment, as further described below.
Revenues from services and fees in the Capital Markets segment increased approximately $235.4 million, to $575.3 million during the year ended December 31, 2021 from $339.9 million during the year ended December 31, 2020. The increase in revenues was primarily due to increases in revenue of $203.2 million from corporate finance, consulting and investment banking fees, $26.0 million from the acquisition of National, $5.5 million in dividends, and $1.4 million in other income, partially offset by a decrease in revenuesrevenue of $0.6 million from asset management fees.
Revenues from services and fees in the sale of goods of $25.8 million.Wealth Management segment increased $302.0 million, to $374.4 million during the year ended December 31, 2021 from $72.3 million during the year ended December 31, 2020. The increase in revenues was primarily due to increases in revenue of $280.9 million from the acquisition of National, $20.7 million from wealth and asset management fees, and $0.5 million in other income.
Revenues from services and fees of $140.6in the Auction and Liquidation segment decreased $42.9 million, to $20.2 million during the year ended December 31, 2021 from $63.1 million during the year ended December 31, 2020. The decrease in 2017revenues was primarily due to fewer large retail fee liquidation engagements.
Revenues from services and fees in the Financial Consulting segment increased $2.7 million, to $94.3 million during the year ended December 31, 2021 from $91.6 million during the year ended December 31, 2020. The increase in revenues was primarily due to an increase in revenuesrevenue of (a) $133.4$2.4 million in the capital markets segment, (b) $20.2 million in the principal investments - United Online segment from the acquisition of UOL on July 1, 2016, and (c) $1.6 million in the valuation and appraisal segment, offset by a $14.5 million decrease in the auction and liquidation segment. The increase of $17.0 million in interest income – securities lending was a result of the acquisition of FBR on June 1, 2017. The decrease in revenues from sale of goods of $25.8 million was primarily due to the sale of retail goods that we acquired title to in September 2016 from the bankruptcy trustee of MS Mode, a retailer of women’s apparel that operates 130 retail locations throughout the Netherlands.advisory services.
Revenues from services and fees in the capital marketsPrincipal Investments - Communications segment increased $133.4$4.8 million or 339% to $172.7$88.5 million during the year ended December 31, 20172021 from $39.3$83.7 million during the year ended December 31, 2016.2020. The increase in revenues was primarily due to an increase$12.4 million from the acquisition of a mobile phone services business during Q4 2021, partially offset by a decrease in revenues of $66.1$7.6 million from investment banking, $33.1 million from wealth management, $29.2 million from sales commissions, fees and other, and $5.0 million from trading income. The increase in revenues from investment banking fees was primarily due to an increase in the number of investment banking transactions where we acted as an advisor in 2017 as compared to the same period in 2016. Of the $66.1 million increase from investment banking fees, $50.9 million was due to operations of FBR that we acquired on June 1, 2017. The increase in revenues from wealth management services of $33.1 million was $33.0 million due to operations of Wunderlich that we acquired on July 3, 2017. The increase in revenues from commissions, fees and other income primarily earned from research, sales and trading was primarily due to an increase in fees and commissions earned from research, sales and trading and incentive management fees earned from our various funds we manage and includes $23.0 million of revenues from the acquisitions of FBR and Wunderlich. The increase of $5.0 million in trading income in 2017 was primarily due to an increase in income we earned from trading activities in our propriety trading account. Of the $5.0 million increase in trading income, $2.6 million was due to the acquisition of FBR.subscription services.
Revenues from services and fees in the auction and liquidationBrands segment decreased $14.5increased approximately $3.9 million, or 23.5%, to $47.4$20.3 million during the year ended December 31, 20172021 from $61.9$16.4 million during the year ended December 31, 2016.2020. The decreaseprimary source of revenue included in revenuesthis segment is the licensing of $14.5trademarks.
Trading income and fair value adjustments on loans increased $282.7 million to income of $386.7 million during the year ended December 31, 2021 compared to $104.0 million during the year ended December 31, 2020. This was primarily due to a decreaseincreases of $275.8 million in revenuesthe Capital Markets segment and $6.8 million in the Wealth Management segment. The gain of $11.2$386.7 million from servicesduring the year ended December 31, 2021 included realized and fees from retail liquidation engagements, and $3.3 million decrease in revenuesunrealized amounts earned on investments made in our wholesaleproprietary trading accounts of $376.2 million and industrial auction division.unrealized amounts on our loans receivable, at fair value of $10.5 million.
Interest income – loans and securities lending increased $20.2 million, to $122.7 million during the year ended December 31, 2021 from $102.5 million during the year ended December 31, 2020. Interest income from securities lending was $66.1 million and $51.3 million during the year ended December 31, 2021 and 2020, respectively. Interest income from loans was $56.6 million and $51.2 million during the year ended December 31, 2021 and 2020, respectively. The decreaseincrease in revenues from services and feesinterest income on loans was primarily due to the completionincrease in lending activities in our Capital Markets segment which included an increase in loans receivable to $873.2 million as of two largeDecember 31, 2021 from $390.7 million as of December 31, 2020.
Revenues – Sale of Goods
Revenues from the sale of goods increased $29.1 million, to $58.2 million during the year ended December 31, 2021 from $29.1 million during the year ended December 31, 2020. Revenues from sale of goods were primarily attributable to $46.1 million of sales of retail goods related to retail liquidation engagements in 2016 where we guaranteed the recovery valueEurope, $6.1 million of inventory and generated more revenues as compared to the larger mix of fee and commission typesales of retail goods related to a retail liquidation engagement in the U.S., and $2.7 million in sales of magicJack devices that were sold in connection with VoIP services, partially offset by a decrease of $25.7 million from sales of goods related to multiple liquidation engagements we completedthat ended in 2017.2020. Cost of goods sold during the years ended December 31, 2021 and 2020 was $27.0 million and $12.5 million, respectively, resulting in a gross margin of 53.7% and 57.2%, respectively.
Operating Expenses
Direct Cost of Services
Total direct costs decreased $6.1 million, to $54.4 million during the year ended December 31, 2021 from $60.5 million during the year ended December 31, 2020. Direct costs of services decreased by $10.0 million in the Auction and Liquidation segment, partially offset by an increase of $4.0 million in the Principal Investments - Communications segment. The decrease in revenues from servicesdirect costs in the Auction and fees in our wholesale and industrial divisionLiquidation segment was primarily due to a decrease in the number of wholesale and industrial auctionretail fee type engagements in 2017 as compared to the same period in 2016.
Revenues from services and fees in the valuation and appraisal segment increased $1.6 million, or 5%, to $33.3 millionperformed during the year ended December 31, 2017 from $31.72021, partially offset by an increase of $11.7 million during the year ended December 31, 2016. The increaseof direct costs incurred on a retail liquidation engagement in revenues was primarily due to increases of (a) $0.9 million related to appraisal engagementsEurope, where we perform valuationspurchased inventory for the monitoringresale and as part of collateral for financial institutions, lenders, and private equity investors and (b) $0.7 million related to appraisal engagements where we perform valuations of intellectual property and business valuations.
Revenues from services and fees in the principal investments - United Online segment increased $20.2 million to $51.4 million during the year ended December 31, 2017 from $31.3 million during the year ended December 31, 2016. The increase in revenues was the result of the acquisition of UOL on July 1, 2016. Services revenues primarily from customer paid accounts related to our Internet access and related subscription services were $39.2 million during the year ended December 31, 2017 and $22.4 million during the year ended December 31, 2016. Advertising revenues from Internet display advertising and search related to our email and Internet access services were $12.2 million during the year ended December 31, 2017 and $8.9 million during the year ended December 31, 2016. Over the past several years revenues from paid subscription services have declined year over year as a result of a decline in the number of paid subscribers for our services. Management believes the decline in paid subscriber accounts is primarily attributable to the industry trends of consumers switching from dial-up Internet access to high speed Internet access such as cable and DSL. Management expects revenues in the principal investments - United Online segment to continue to decline year over year.
Sale of Goods, Cost of Goods Sold and Gross Margin
| Year Ended December 31, 2017 | Year Ended December 31, 2016 | |||||||||||||||||||||||
Auction and Liquidation Segment | Principal Investments - United Online Segment | Total | Auction and Liquidation Segment | Principal Investments - United Online Segment | Total | |||||||||||||||||||
| Revenues - Sale of Goods | $ | 3 | $ | 304 | $ | 307 | $ | 25,855 | $ | 261 | $ | 26,116 | ||||||||||||
| ’Cost of goods sold | 2 | 396 | 398 | 14,502 | 253 | 14,755 | ||||||||||||||||||
| Gross margin on services and fees | $ | 1 | $ | (92 | ) | $ | (91 | ) | $ | 11,353 | $ | 8 | �� | $ | 11,361 | |||||||||
| Gross margin percentage | 33.3 | % | (30.3 | %) | (29.6 | %) | 43.9 | % | 3.1 | % | 43.5 | % | ||||||||||||
Revenues from the sale of goods decreased $25.8 million, to $0.3 million during the year ended December 31, 2017 from $26.1 during the year ended December 31, 2016. Revenues from the sale of goods in 2016 was primarily due to the sale of retail goods related to the retail liquidation engagement of MS Mode in Europe where we took title to the goods and operated the MS Mode stores during the liquidation period. In the principal investments - United Online segment, revenues from the sale of goods was primarily due to the sale of mobile broadband devices that are sold in connection with the mobile broadband services we offer our customers. The increase in revenues were the result of the acquisition of UOL on July 1, 2016. Cost of goods sold in 2017 was $0.4 million resulting in a gross margin of ($0.09) million or (29.6%) during the year ended December 31, 2017. Cost of goods sold in 2016 was $14.8 million resulting in a gross margin of $11.4 million or 43.5% during the year ended December 31, 2016.
Operating Expenses
Direct Costs of Services. Direct cost of services and direct cost of services measured as a percentage of revenues – services and fees by segment during the years ended December 31, 2017 and 2016 are as follows:
| Year Ended December 31, 2017 | Year Ended December 31, 2016 | |||||||||||||||||||||||||||||||
Auction and Liquidation Segment | Valuation and Appraisal Segment | Principal Investments - United Online Segment | Total | Auction and Liquidation Segment | Valuation and Appraisal Segment | Principal Investments - United Online Segment | Total | |||||||||||||||||||||||||
| Revenues - Services and fees | $ | 47,376 | $ | 33,331 | $ | 51,439 | $ | 61,891 | $ | 31,749 | $ | 31,260 | ||||||||||||||||||||
| Direct cost of services | 27,841 | 14,876 | 12,784 | $ | 55,501 | 17,787 | 13,983 | 9,087 | $ | 40,857 | ||||||||||||||||||||||
| Gross margin on services and fees | $ | 19,535 | $ | 18,455 | $ | 38,655 | $ | 44,104 | $ | 17,766 | $ | 22,173 | ||||||||||||||||||||
| Gross margin percentage | 41.2 | % | 55.4 | % | 75.1 | % | 71.3 | % | 56.0 | % | 70.9 | % | ||||||||||||||||||||
Total direct costs increased $14.6 million, to $55.5 million during the year ended December 31, 2017 from $40.9 million during the year ended December 31, 2016. Direct costs of services increased by (a) $10.1 million in the auction and liquidation segment, (b) $0.9 million in the valuation and appraisal segment, and (c) $3.7 million in the principal investments - United Online segment as a result of the acquisition of UOL on July 1, 2016. The increase in direct costs in the auction and liquidation segment was primarily due to the impact of completing more fee and commission type of retail liquidation engagements as compared to 2016 when we completed two large retail liquidation agreements where we guaranteed the recovery value of inventory. The increase in direct costs of services in the valuation and appraisal segment was primarily due to an increase in payroll and related expenses due to an increase headcount 2017 as compared to the same period in 2016.
Auction and Liquidation
Gross margin in the auction and liquidation segment for services and fees decreased to 41.2% of revenues during the year ended December 31, 2017, as compared to 71.3% of revenues during the year ended December 31, 2016. The decrease in gross margin during the year ended December 31, 2017 was primarily due to a change in the mix of fee type engagements in 2017 as compared to the same period in 2016. During 2017, we completed a larger mix of fee and commission type retail liquidation engagements where our margins are generally less than the comparable margins we generated in 2016 when we completed two larger retail liquidation engagements where we guaranteed the recovery value of inventory.
Valuation and Appraisal
Gross margins in the valuation and appraisal segment decreased to 55.4% of revenues during the year ended December 31, 2017 as compared to 56.0% of revenues during the year ended December 31, 2016. The decrease in gross margin is primarily due to an increase in payroll and related expenses from an increase in headcount during 2017 as compared to same period in 2016.
Principal Investments - United Online
Gross margins in the principal investments-United Online segment increased to 75.1% of revenues during the year ended December 31, 2017 as compared to 70.9% of revenues during the year ended December 31, 2016. Direct costs in the principal investments - United Online segment includes telecommunications and data center costs, personnel and overhead-related costs associated with operating our networks and data centers, depreciation of network computers and equipment, third party advertising sales commissions, license fees,incurred costs related to providing customer support, coststhe store operations which primarily related to customer billingsexpenses for occupancy, payroll and processing of customer credit cards and associated bank fees. The increase in gross margin is primarily due to a decrease in costs related to providing customer support and lower personnelother store operating costs.
Selling, General and Administrative Expenses.Expenses
Selling, general and administrative expenses during the years ended December 31, 20172021 and 20162020 were comprised of the following:
Selling, General and Administrative Expenses by Segment
(Dollars in thousands)
| Year Ended | Year Ended | |||||||||||||||||||||||
| December 31, 2021 | December 31, 2020 | Change | ||||||||||||||||||||||
| Amount | % | Amount | % | Amount | % | |||||||||||||||||||
| Capital Markets segment | $ | 347,591 | 38.4 | % | $ | 201,348 | 47.0 | % | $ | 146,243 | 72.6 | % | ||||||||||||
| Wealth Management segment | 366,050 | 40.3 | % | 70,248 | 16.4 | % | 295,802 | n/m | ||||||||||||||||
| Auction and Liquidation segment | 14,069 | 1.6 | % | 12,359 | 2.9 | % | 1,710 | 13.8 | % | |||||||||||||||
| Financial Consulting segment | 77,418 | 8.5 | % | 68,579 | 16.0 | % | 8,839 | 12.9 | % | |||||||||||||||
| Principal Investments - Communications segment | 36,240 | 4.0 | % | 31,363 | 7.3 | % | 4,877 | 15.6 | % | |||||||||||||||
| Brands segment | 5,923 | 0.7 | % | 5,747 | 1.3 | % | 176 | 3.1 | % | |||||||||||||||
| Corporate and Other segment | 58,905 | 6.5 | % | 38,893 | 9.1 | % | 20,012 | 51.5 | % | |||||||||||||||
| Total selling, general & administrative expenses | $ | 906,196 | 100.0 | % | $ | 428,537 | 100.0 | % | $ | 477,659 | 111.5 | % | ||||||||||||
Year Ended December 31, 2017 | Year Ended December 31, 2016 | Change | ||||||||||||||||||||||
| Amount | % | Amount | % | Amount | % | |||||||||||||||||||
| Capital Markets segment | $ | 153,886 | 72.3 | % | $ | 33,244 | 40.5 | % | $ | 120,642 | 362.9 | % | ||||||||||||
| Auction and Liquidation segment | 8,350 | 3.9 | % | 14,357 | 17.5 | % | (6,007 | ) | (41.8 | %) | ||||||||||||||
| Valuation and Appraisal segment | 8,742 | 4.1 | % | 8,885 | 10.8 | % | (143 | ) | (1.6 | %) | ||||||||||||||
| Principal Investments - United Online segment | 18,337 | 8.6 | % | 9,492 | 11.5 | % | 8,845 | 93.2 | % | |||||||||||||||
| Corporate and Other segment | 23,693 | 11.1 | % | 16,149 | 19.7 | % | 7,544 | 46.7 | % | |||||||||||||||
| Total selling, general & administrative expenses | $ | 213,008 | 100.0 | % | $ | 82,127 | 100.0 | % | $ | 130,881 | 159.4 | % | ||||||||||||
Total selling, general and administrative expenses increased $130.9$477.7 million or 159.4%, to $213.0$906.2 million during the year ended December 31, 20172021 from $82.1$428.5 million forduring the year ended December 31, 2016.2020. The increase in expenses was primarily due to an increaseof $477.7 million in selling, general and administrative expenses was due to increases of (a) $120.6$146.2 million in the capital marketsCapital Markets segment, (b)$295.8 million in the Wealth Management segment, $1.7 million in the Auction and Liquidation segment, $8.8 million in the principal investments - United OnlineFinancial Consulting segment, as a result of the acquisition of UOL on July 1, 2016, and (c) $7.5 million in corporate and other, offset by a decrease in expenses of $6.0$4.9 million in the auction and liquidationPrincipal Investments - Communications segment, and $0.1$0.2 million in the valuationBrands segment, and appraisal segment.$20.0 million in the Corporate and Other segment, as described below.
Capital Markets
Selling, general and administrative expenses in the capital marketsCapital Markets segment increased by $120.6$146.2 million or 362.9% to $153.9$347.6 million during the year ended December 31, 20172021 from $33.2$201.3 million during the year ended December 31, 2016.2020. The increase in expenses of $120.6 million was primarily due to an increase in operating expensesincreases of $107.8$85.4 million from the acquisitions of FBR and Wunderlich in 2017. Of the $107.8 million increase in selling and general and administrative expenses from the acquisitions of FBR and Wunderlich, $69.4 million was payroll and related expenses. Selling, general and administrative expenses also increased primarily due to increase in payroll and related expenses, $32.1 million in consulting expenses, $18.7 million from the acquisition of $11.1National, and $10.3 million related to increases in incentive compensation as a result of the increased revenues from investment banking feesdeal expenses, partially offset by a decrease in 2017 as compared to the same period in 2016.depreciation and amortization of $0.3 million.
Auction and LiquidationWealth Management
Selling, general and administrative expenses in the auction and liquidationWealth Management segment decreased $6.0increased by $295.8 million or 41.8%, to $8.4$366.1 million during the year ended December 31, 20172021 from $14.4$70.2 million forduring the year ended December 31, 2016.2020. The decrease in expensesincrease was primarily due to (a) a decreaseincreases of $280.8 million from the acquisition of National and $16.7 million in payroll and incentive compensationrelated expenses, partially offset by decreases of $2.1$1.3 million (b) a decrease in legal expenses and professional fees of $2.8$0.5 million and (c) a decrease in other expenses of $1.1 million in 2017 as compared to the same period in 2016.expenses.
ValuationAuction and AppraisalLiquidation
Selling, general and administrative expenses in the valuationAuction and appraisalLiquidation segment decreased $0.1increased by $1.7 million or 1.6%, to $8.7$14.1 million during year ended December 31, 2017 from $8.9 million for the year ended December 31, 2016.2021 from $12.4 million during the year ended December 31, 2020. The decrease of approximately $0.1 millionincrease was primarily due to a decreasean increase of $3.5 million in general other operatingbusiness development activities, partially offset by decreases of $0.7 million in payroll and related expenses, $0.6 million in 2017 as compared to the same periodoutside contractors, and $0.4 million in 2016.foreign currency fluctuations.
Principal Investments - United OnlineFinancial Consulting
Selling, general and administrative expenses in the principal investments - United OnlineFinancial Consulting segment increased by $8.8 million or 93.2%, to $18.3$77.4 million forduring the year ended December 31, 20172021 from $9.5$68.6 million forduring the year ended December 31, 2016 as a result2020. The increase was primarily due to increases of $5.7 million in payroll and related expenses, $1.8 million in legal expenses, $0.7 million in other expenses, $0.6 million in travel and entertainment expenses, and $0.2 million in occupancy expenses.
Principal Investments - Communications
Selling, general and administrative expenses in the acquisition of UOL on July 1, 2016. ForPrincipal Investments - Communications segment increased by $4.9 million to $36.2 million during the year ended December 31, 2017, these expenses include $4.82021 from $31.4 million of technology and development expenses, $1.2 million of sales and marketing expenses, $6.9 million of general and administrative expenses and $5.4 million of amortization of intangibles. Forduring the year ended December 31, 2016, these2020. The increase was primarily due to increases of $1.2 million in communications expenses, include $2.4$0.9 million of technologyin payroll and developmentrelated expenses, $0.8 million of salesdue to a legal settlement accrual release in 2020, $0.8 million in transaction costs, $0.7 million in other expenses, and marketing expenses, $3.5$0.5 million ofin other business development activities expenses.
Brands
Selling, general and administrative expenses and $2.8 million of amortization of intangibles. Technology and development expenses include expenses for product development, maintenance of existing software, technology and websites. Sales and marketing expenses include expenses associated personnel and overhead-related expenses for marketing, customer service, and advertising sales personnel to acquire and retain paid subscribers. Expenses associated with generating advertising revenues include sales commissions and personnel-related expenses. General and administrative expenses consist of personnel-related expenses for management in the principal investments - United OnlineBrands segment facilities, internal customer support personnel, personnel associated with operating our corporate systems and insurance recoveries. Amortization of intangibles includes amortization expense relatedincreased by $0.2 million to customer lists, advertising relationships, domain names and internally developed software.$5.9 million during the year ended December 31, 2021 from $5.7 million during the year ended December 31, 2020.
Corporate and Other
Selling, general and administrative expenses for corporatethe Corporate and otherOther segment increased approximately $7.5$20.0 million or 46.7%, to $23.7$58.9 million during the year ended December 31, 20172021 from $16.1 million for the year ended December 31, 2016. The increase was primarily due to an increase in (a)fair value adjustment of $8.2 million in connection with the mandatorily redeemable noncontrolling interests, (b) payroll and related expenses of $3.0 million and(c) transactions costs of $2.5 million incurred for professional fees that primarily related to the acquisition of Wunderlich, FBR and Dialectic in 2017. These increases in corporate overhead were offset by an insurance recovery in the amount of $6.0 million related to key man life insurance on one of our executives in our appraisal segment.
Restructuring Charge. During the year ended December 31, 2017, we incurred restructuring charge of $12.4 million compared to restructuring charge of $3.9$38.9 million during the year ended December 31, 2016.2020. The increase was primarily due to increases of $18.9 million in payroll and related expenses, $8.0 million in gains on extinguishment of debt, and $4.0 million from the consolidation of special purpose acquisition corporations (“SPACs”), partially offset by decreases of $8.7 million in legal settlement accrual, primarily due to recording a pre-acquisition litigation claim related to one of our acquired subsidiaries, $1.8 million in other expenses, and $0.8 million in legal expenses.
During the year ended December 31, 2017,2021, we implemented costs savings measures taking into accountrepurchased $513.8 million of our senior notes with an aggregate face value of $504.1 million, resulting in a loss net of expenses, premiums paid, and original issue discount of $6.5 million. The total redemption payments included approximately $6.5 million in accrued interest.
During the planned synergies asyear ended December 31, 2020, we repurchased bonds with an aggregate face value of $3.4 million for $1.8 million resulting in a resultgain net of expenses of $1.6 million. As part of the acquisitionsrepurchase, we paid $0.03 million in interest accrued through the date of Wunderlich and FBR which included a reduction in force for someeach respective repurchase.
Impairment of tradenames. Due to the impact of the corporate executivesCOVID-19 outbreak on economic activity and market volatility, we tested our intangible assets as of WunderlichMarch 31, 2020 and FBRJune 30, 2020 and a restructuring to integrate Wunderlichmade the determination that the indefinite-lived tradenames in the Brands segment were impaired and FBR’s operations with our operations. These initiatives resulted in a restructuring chargethe Company recognized impairment charges of $11.7$12.5 million during the year ended December 31, 2017. The restructuring charges included $3.3 million related to severance and accelerated vesting of restricted stock awards to former corporate executives of Wunderlich and FBR and $5.0 million of severance, accelerated vesting of stock awards to employees and $3.4 million of lease loss accruals for2020. There was no impairment recognized during the planned consolidation of office space related to operations. The restructuring charge in 2017 also included employee termination costs of $0.7 million related to a reduction in personnel in the principal investments – United Online segment of our operations.year ended December 31, 2021.
The restructuring charge in 2016 of $3.9 million included $3.5 million of employee termination costs related to a reduction in personnel in the corporate offices of UOL after our acquisition on July 1, 2016 and $0.4 million of charges related to combining our corporate office location with the offices of UOL.
Other Income (Expense). Other income included interest income of $0.4$0.2 million during the year ended December 31, 2017 as2021 compared to $0.3$0.6 million during the year ended December 31, 2016. Interest expense was $8.42020. Gain on extinguishment of loans and other in the amount of $3.8 million during the year ended December 31, 2017 as compared2021 was primarily due to $2.0a gain of $6.5 million from National PPP loans that were forgiven by the SBA, partially offset by a loss of $2.7 million due to changes in fair value of warrant liabilities. Income on equity investments was $2.8 million during the year ended December 31, 2016. The increase in interest expense during the year ended December 31, 2017 as2021 compared to 2016 was primarily due to (a) $5.7 million increase from the issuancesa loss of senior notes, (b) $0.3 million incurred in 2017 from the UOL credit agreement, and (c) $0.2 million incurred in 2017 from other notes payable. Other expense in year ended December 31, 2017 included $0.4 million loss on equity investment.
Income Before Income Taxes.Income before income taxes was $20.4$0.6 million during the year ended December 31, 2017, a decrease of $26.6 million, from $47.02020. Interest expense was $92.5 million during the year ended December 31, 2016.2021 compared to $65.2 million during the year ended December 31, 2020. The decreaseincrease in interest expense was primarily due to increases in interest expense of $20.2 million from the issuance of senior notes, $5.9 million from the Nomura term loan, and $1.9 million from the Nomura revolver.
Income Before Income Taxes. Income before income taxes increased $335.3 million to $614.8 million during the year ended December 31, 2021 from $279.5 million during the year ended December 31, 2020. The increase in income before income taxes was primarily due to (a) an increaseincreases in corporaterevenues of approximately $837.8 million, gain on extinguishment of loans and other expenses of $10.9$3.8 million, which includes an increase in restructuring chargesand income from equity investments of $3.4 million, (b)partially offset by increases in operating expenses of $482.2 million, interest expense of $27.2 million, and a decrease in operatinginterest income of $29.9 million in our auction and liquidation segment, (c) an increase in interest expense of $6.4 million and (d) loss on equity investment of $0.4 million, offset by (a) an increase in operating income of $10.3 million in our principal investments – United Online segment as a result of the acquisition of UOL on July 1, 2016, (b) an increase in operating income of $9.8 million in our capital markets segment, and (c) an increase in operating income of $0.8 million in our valuation and appraisal segment.
$0.3 million.
Provision for Income Taxes. Provision for income taxtaxes was $8.5$164.0 million during the year ended December 31, 2017, a decrease of $5.8 million, from $14.32021 compared to $75.4 million during the year ended December 31, 2016.2020. The effective income tax rate was 41.6%a provision of 26.7% during the year ended December 31, 2017 and 30.4%2021 as compared to a provision of 27.0% during the year ended December 31, 2016. The provision for income taxes during the year ended December 31, 2017 included (a) tax expense of $13.1 million primarily related to revaluation of deferred tax assets at 21.0% as a result of the U.S. Tax Cuts and Jobs Act enacted on December 22, 1017; and (b) a tax benefit of $8.4 million related to our election to treat the acquisition of UOL as a taxable business combination for income tax purposes in accordance with Internal Revenue Code Section 338(g) as more fully discussed in Note 13 in the consolidated financial statements. The tax provision during the year ended December 31, 2017 also includes a tax benefit due to a non-taxable insurance recovery in the amount of $6.0 million that was received in the second quarter of 2017.2020.
Net Income (Loss) Attributable to Noncontrolling Interests. Net income attributable to noncontrolling interests represents the proportionate share of net income generated by Great American Global Partners, LLC, in which we have a 50% membership interest that we do not own. The net income attributable to noncontrolling interests was $0.4 million during the year ended December 31, 2017 compared to net income attributable to noncontrolling interests of $11.2 million during the year ended December 31, 2016.
Net Income Attributable to the Company. Net income attributable to the Company for the year ended December 31, 2017 was $11.6 million, a decrease of approximately $10.0 million, from $21.5 million during the year ended December 31, 2016. The decrease in net income during the year ended December 31, 2017 as compared to the same period in 2016 was primarily due to (a) an decrease in operating income in the auction and liquidation segment of $29.9 million, (b) increase in corporate and other expenses of $10.9 million, and (c) increase in interest expense of $6.4 million, offset by (a) an increase in operating income in principal investments – United Online segment the $10.3 million, (b) an increase in operating income in the capital markets segment of $9.8 million, (c) increase in operating income of $0.8 million in the valuation and appraisal segment, (d) decrease in net income attributable to noncontrolling interests of $10.8 million, and (e) a decrease in provision for income taxes of $5.8 million.
Year Ended December 31, 2016 Compared to Year Ended December 31, 2015
Consolidated Statements of Income
(Dollars in thousands)
| Year Ended December 31, 2016 | Year Ended December 31, 2015 | |||||||||||||||
| Amount | % | Amount | % | |||||||||||||
| Revenues: | ||||||||||||||||
| Services and fees | $ | 164,235 | 86.3 | % | $ | 101,929 | 90.6 | % | ||||||||
| Sale of goods | 26,116 | 13.7 | % | 10,596 | 9.4 | % | ||||||||||
| Total revenues | 190,351 | 100.0 | % | 112,525 | 100.0 | % | ||||||||||
| Operating expenses: | ||||||||||||||||
| Direct cost of services | 40,857 | 21.5 | % | 29,049 | 25.8 | % | ||||||||||
| Cost of goods sold | 14,755 | 7.8 | % | 3,072 | 2.7 | % | ||||||||||
| Selling, general and administrative expenses | 82,127 | 43.1 | % | 58,322 | 51.8 | % | ||||||||||
| Restructuring charge | 3,887 | 2.0 | % | — | 0.0 | % | ||||||||||
| Total operating expenses | 141,626 | 74.4 | % | 90,443 | 80.4 | % | ||||||||||
| Operating income | 48,725 | 25.6 | % | 22,082 | 19.6 | % | ||||||||||
| Other income (expense): | ||||||||||||||||
| Interest income | 318 | 0.2 | % | 17 | 0.0 | % | ||||||||||
| Interest expense | (1,996 | ) | (1.0 | %) | (834 | ) | (0.7 | %) | ||||||||
| Income before income taxes | 47,047 | 24.7 | % | 21,265 | 18.9 | % | ||||||||||
| Provision for income taxes | (14,321 | ) | (7.5 | %) | (7,688 | ) | (6.8 | %) | ||||||||
| Net income | 32,726 | 17.2 | % | 13,577 | 12.1 | % | ||||||||||
| Net income attributable to noncontrolling interests | 11,200 | 5.9 | % | 1,772 | 1.6 | % | ||||||||||
| Net income attributable to B. Riley Financial, Inc. | $ | 21,526 | 11.3 | % | $ | 11,805 | 10.5 | % | ||||||||
Revenues
The table below and the discussion that follows are based on how we analyze our business.
| Year Ended December 31, 2016 | Year Ended December 31, 2015 | Change | ||||||||||||||||||||||
| Amount | % | Amount | % | Amount | % | |||||||||||||||||||
| Revenues - Services and fees: | ||||||||||||||||||||||||
| Capital Markets segment | $ | 39,335 | 20.7 | % | $ | 35,183 | 31.3 | % | $ | 4,152 | 11.8 | % | ||||||||||||
| Auction and Liquidation segment | 61,891 | 32.5 | % | 35,633 | 31.7 | % | 26,258 | 73.7 | % | |||||||||||||||
| Valuation and Appraisal segment | 31,749 | 16.7 | % | 31,113 | 27.6 | % | 636 | 2.0 | % | |||||||||||||||
| Principal Investments - United Online segment | 31,260 | 16.4 | % | — | n/m | 31,260 | n/m | |||||||||||||||||
| Subtotal | 164,235 | 86.3 | % | 101,929 | 90.6 | % | 62,306 | 61.1 | % | |||||||||||||||
| Revenues - Sale of goods | ||||||||||||||||||||||||
| Auction and Liquidation segment | 25,855 | 13.6 | % | 10,596 | 9.4 | % | 15,259 | 144.0 | % | |||||||||||||||
| Principal Investments - United Online segment | 261 | 0.1 | % | — | n/m | 261 | n/m | |||||||||||||||||
| Subtotal | 26,116 | 13.7 | % | 10,596 | 9.4 | % | 15,520 | 146.5 | % | |||||||||||||||
| Total revenues | $ | 190,351 | 100.0 | % | $ | 112,525 | 100.0 | % | $ | 77,826 | 69.2 | % | ||||||||||||
n/m – not applicable or not meaningful.
Total revenues increased $77.8 million to $190.4 million during the year ended December 31, 2016 from $112.6 million during the year ended December 31, 2015. The increase in revenues during the year ended December 31, 2016 was primarily due to an increase in revenues from services and fees of $62.3 million and an increase in revenues from the sale of goods of $15.5 million. The increase in revenues from services and fees of $62.3 million in 2016 was primarily due to an increase in revenues of (a) $4.1 million in the capital markets segment, (b) $26.3 million in the auction and liquidation segment, (c) $0.6 million in the valuation and appraisal segment, and (d) $31.3 million in the principal investments – United Online segment from the acquisition of UOL on July 1, 2016. The increase in revenues from sale of goods of $15.5 million was primarily due to sale of retail goods that we acquired title to in September 2016 in connection with the retail liquidation engagement of MS Mode, a retailer of women’s apparel that operated 130 retail locations throughout the Netherlands.
Revenues from services and fees in the capital markets segment increased $4.1 million, or 11.8% to $39.3 million during the year ended December 31, 2016 from $35.2 million during the year ended December 31, 2015. The increase in revenues was primarily due to an increase in revenues of $4.1 million from trading income and $1.6 million from commissions, fees and other income primarily earned from research, sales and trading, and wealth management services, offset by a decrease in revenues of $1.6 million from investment banking fees. The increase in revenues from trading income in 2016 was primarily due to an increase in income we earned from trading activities in our propriety trading account. The increase in revenues from commissions, fees and other income primarily earned from research, sales and trading, and wealth management services was primarily due to an increase in fees and commissions earned from research, sales and trading and incentive management fees earned from our various funds we manage. The decrease in revenues from investment banking fees was primarily due to a decrease in the number of investment banking transactions where we acted as an advisor in 2016 as compared to the same period in 2015.
Revenues from services and fees in the auction and liquidation segment increased $26.3 million, or 73.7%, to $61.9 million during the year ended December 31, 2016 from $35.6 million during the year ended December 31, 2015. The increase in revenues of $26.3 million was primarily due to an increase in revenues of $27.9 million from services and fees from retail liquidation engagements, offset by a decrease in revenues of $1.6 million from services and fees in our wholesale and industrial auction division. The increase in revenues from services and fees from retail liquidation engagements was primarily due to (a) revenues from the liquidation of inventory for the going-out-of-business sale of 185 Hancock Fabric stores in the United States and (b) revenues from the liquidation of inventory for the going-out-of-business sale of 63 Masters Home Improvement stores in Australia. In 2015, we only had revenues from one large retail liquidation engagement where we participated in a joint venture involving the liquidation of inventory for the going-out-of-business sale of 133 Target stores located in Canada. The decrease in revenues from services and fees in our wholesale and industrial division was primarily due to a decrease in the number of wholesale and industrial auction engagements in 2016 as compared to the same period in 2015.
Revenues from services and fees in the valuation and appraisal segment increased $0.6 million, or 2.0%, to $31.7 million during the year ended December 31, 2016 from $31.1 million during the year ended December 31, 2015. The increase in revenues was primarily due to increases of (a) $0.3 million related to appraisal engagements where we perform valuations for the monitoring of collateral for financial institutions, lenders, and private equity investors and (b) $0.4 million related to appraisal engagements where we perform valuations of intellectual property and business valuations. These increases were offset by a decrease in revenues of $0.1 million related to appraisal engagements where we perform valuations of machinery and equipment.
Revenues from services and fees in the principal investments – United Online segment of $31.3 million in 2016 were the result of the acquisition of UOL on July 1, 2016. These revenues include $22.4 million in services and fees primarily from customer paid accounts related to our Internet access and related subscription services and $8.9 million in advertising revenues from Internet display advertising and search related to our email and Internet access services. Over the past several years revenues from paid subscription services have declined year over year as a result of a decline in the number of paid subscribers for our services. Management believes the decline in paid subscriber accounts is primarily attributable to the industry trends of consumers switching from dial-up Internet access to high speed Internet access such as cable and DSL. Management expects revenues in the principal investments – United Online segment to continue to decline year over year.
Sale of Goods, Cost of Goods Sold and Gross Margin
| Year Ended December 31, 2016 | Year Ended December 31, 2015 | |||||||||||||||||||||||
| Principal | Principal | |||||||||||||||||||||||
| Auction and | Investments - | Auction and | Investments - | |||||||||||||||||||||
| Liquidation | United Online | Liquidation | United Online | |||||||||||||||||||||
| Segment | Segment | Total | Segment | Segment | Total | |||||||||||||||||||
| Revenues - Sale of Goods | $ | 25,855 | $ | 261 | $ | 26,116 | $ | 10,596 | $ | — | $ | 10,596 | ||||||||||||
| Cost of goods sold | 14,502 | 253 | 14,755 | 3,072 | — | 3,072 | ||||||||||||||||||
| Gross margin on services and fees | $ | 11,353 | $ | 8 | $ | 11,361 | $ | 7,524 | $ | — | $ | 7,524 | ||||||||||||
| Gross margin percentage | 43.9 | % | 3.1 | % | 43.5 | % | 71.0 | % | n/m | 71.0 | % | |||||||||||||
Revenues from the sale of goods increased $15.5 million, to $26.1 million during the year ended December 31, 2016 from $10.6 during the year ended December 31, 2015. Revenues from the sale of goods in 2016 was primarily due to the sale of retail goods related to the retail liquidation engagement of MS Mode in Europe where we took title to the goods and operated the MS Mode stores during the liquidation period. In the principal investments – United Online segment, revenues from the sale of goods was primarily due to the sale of mobile broadband devices that are sold in connection with the mobile broadband services we offer our customers. Revenues from the sale of goods in 2015 was primarily due to the sale of retail goods related to the retail liquidation engagement of Schoenenreus in the Netherlands where we took title to the goods and operated the Schoenenreus stores during the liquidation period. Cost of goods sold in 2016 was $14.8 million resulting in a gross margin of $11.4 million or 43.5% during the year ended December 31, 2016. Cost of goods sold in 2015 was $3.1 million resulting in a gross margin of $7.5 million or 71.0% during the year ended December 31, 2015.
Operating Expenses
Direct Costs of Services. Direct cost of services and direct cost of services measured as a percentage of revenues – services and fees by segment during the years ended December 31, 2016 and 2015 are as follows:
| Year Ended December 31, 2016 | Year Ended December 31, 2015 | |||||||||||||||||||||||||||||||
Auction and Liquidation Segment | Valuation and Appraisal Segment | Principal Investments - United Online Segment | Total | Auction and Liquidation Segment | Valuation and Appraisal Segment | Principal Investments - United Online Segment | Total | |||||||||||||||||||||||||
| Revenues - Services and fees | $ | 61,891 | $ | 31,749 | $ | 31,260 | $ | 35,633 | $ | 31,113 | $ | — | ||||||||||||||||||||
| Direct cost of services | 17,787 | 13,983 | 9,087 | $ | 40,857 | 15,489 | 13,560 | — | $ | 29,049 | ||||||||||||||||||||||
| Gross margin on services and fees | $ | 44,104 | $ | 17,766 | $ | 22,173 | $ | 20,144 | $ | 17,553 | $ | — | ||||||||||||||||||||
| Gross margin percentage | 71.3 | % | 56.0 | % | 70.9 | % | 56.5 | % | 56.4 | % | n/m | |||||||||||||||||||||
n/m – not applicable or not meaningful.
Total direct costs increased $11.8 million, to $40.9 million during the year ended December 31, 2016 from $29.1 million during the year ended December 31, 2015. Direct costs of services increased by (a) $2.3 million in the auction and liquidation segment, (b) $0.4 million in the valuation and appraisal segment, and (c) $9.1 million in the principal investments – United Online segment as a result of the acquisition of UOL on July 1, 2016. The increase in direct costs in the auction and liquidation segment was primarily due to costs incurred in connection with the retail liquidation of inventory from operating the MS Mode retail stores located in the Netherlands in 2016. The increase in direct costs of services in the valuation and appraisal segment was primarily due to an increase in payroll and related expenses due to an increase headcount 2016 as compared to the same period in 2015.
Auction and Liquidation
Gross margin in the auction and liquidation segment for services and fees increased to 71.3% of revenues during the year ended December 31, 2016, as compared to 56.5% of revenues during the year ended December 31, 2015. The increase in gross margin during the year ended December 31, 2016 was primarily due to a change in the mix of fee type engagements in 2016 as compared to the same period in 2015 and the impact of the revenues we earned from the liquidation of inventory for the going-out-of-business sale of 185 Hancock Fabric stores in the United States and liquidation of inventory for the going-out-of-business sale of 63 Masters Home Improvement stores in Australia.
Valuation and Appraisal
Gross margins in the valuation and appraisal segment decreased to 56.0% of revenues during the year ended December 31, 2016 as compared to 56.4% of revenues during the year ended December 31, 2015. The decrease in gross margin is primarily due to an increase in payroll and related expenses from an increase in headcount during 2016 as compared to same period in 2015.
Principal Investments – United Online
Gross margin in the principal investments – United Online segment of $22.2 million or 70.9% of revenues was the result of the acquisition of UOL on July 1, 2016. Direct costs in the principal investments – United Online segment of $9.1 million includes telecommunications and data center costs, personnel and overhead-related costs associated with operating our networks and data centers, depreciation of network computers and equipment, third party advertising sales commissions, license fees, costs related to providing customer support, costs related to customer billings and processing of customer credit cards and associated bank fees.
Selling, General and Administrative Expenses. Selling, general and administrative expenses during the years ended December 31, 2016 and 2015 were comprised of the following:
Selling, General and Administrative Expenses by Segment
(Dollars in thousands)
| Year Ended December 31, 2016 | Year Ended December 31, 2015 | Change | ||||||||||||||||||||||
| Amount | % | Amount | % | Amount | % | |||||||||||||||||||
| Capital Markets segment | $ | 33,244 | 40.5 | % | $ | 30,748 | 52.7 | % | $ | 2,496 | 8.1 | % | ||||||||||||
| Auction and Liquidation segment | 14,357 | 17.5 | % | 8,361 | 14.3 | % | 5,996 | 71.7 | % | |||||||||||||||
| Valuation and Appraisal segment | 8,885 | 10.8 | % | 9,238 | 15.8 | % | (353 | ) | (3.8 | %) | ||||||||||||||
| Principal Investments - United Online segment | 9,492 | 11.5 | % | — | n/m | 9,492 | n/m | |||||||||||||||||
| Corporate and Other segment | 16,149 | 19.7 | % | 9,975 | 17.2 | % | 6,174 | 61.9 | % | |||||||||||||||
| Total selling, general & administrative expenses | $ | 82,127 | 100.0 | % | $ | 58,322 | 100.0 | % | $ | 23,805 | 40.8 | % | ||||||||||||
n/m – not applicable or not meaningful.
Total selling, general and administrative expenses increased $23.8 million, or 40.8%, to $82.1 million during the year ended December 31, 2016 from $58.3 million for the year ended December 31, 2015. The increase in expenses was primarily due to an increase in selling, general and administrative expenses of (a) $2.5 million in the capital markets segment, (b) $6.0 million in the auction and liquidation segment, (c) $9.5 million in the principal investments – United Online segment as a result of the acquisition of UOL on July 1, 2016, and (d) $6.2 million in corporate and other, offset by a decrease in expenses of $0.4 million in the valuation and appraisal segment.
Capital Markets
Selling, general and administrative expenses in the capital markets segment increased by $2.5 million, or 8.1% to $33.2 million during the year ended December 31, 2016 from $30.7 million during the year ended December 31, 2015. The increase in expenses of $2.5 million was primarily due to an increase in incentive compensation as a result of the increase in revenues from investment banking fees in 2016 as compared to the same period in 2015 discussed above.
Auction and Liquidation
Selling, general and administrative expenses in the auction and liquidation segment increased $6.0 million, or 71.7%, to $14.4 million during the year ended December 31, 2016 from $8.4 million for the year ended December 31, 2015. The increase in expenses was primarily due to (a) an increase in payroll and incentive compensation of $2.6 million, (b) an increase in consulting fees of $3.6 million, and (c) an increase in legal and professional fees of $3.0 million in 2016 as compared to the same period in 2015. The increase in payroll, consulting and incentive compensation was primarily due to an increase in operating income from international retail liquidation engagements in 2016 as compared to the same period in 2015. The increase in legal and professional fees is primarily due to an increase in business activity in the auction and liquidation segment in 2016.
Valuation and Appraisal
Selling, general and administrative expenses in the valuation and appraisal segment decreased $0.4 million, or 3.8%, to $8.9 million during year ended December 31, 2016 from $9.2 million for the year ended December 31, 2015. The decrease of $0.4 million was primarily due to a decrease in payroll and other operating expenses in 2016 as compared to the same period in 2015.
Principal Investments – United Online
Selling, general and administrative expenses in the principal investments – United Online segment of $9.5 million in 2016 were the result of the acquisition of UOL on July 1, 2016. These expenses include $2.4 million of technology and development expenses, $0.8 million of sales and marketing expenses, $3.5 million of general and administrative expenses and $2.8 million of amortization of intangibles, offset by $1.6 million from a recovery of an insurance dispute. Technology and development expenses include expenses for product development, maintenance of existing software, technology and websites. Sales and marketing expenses include expenses associated personnel and overhead-related expenses for marketing, customer service, and advertising sales personnel to acquire and retain paid subscribers. Expenses associated with generating advertising revenues include sales commissions and personnel-related expenses. General and administrative expenses consist of personnel-related expenses for management in the principal investments – United Online segment, facilities, internal customer support personnel and personnel associated with operating our corporate systems. Amortization of intangibles includes amortization expense related to customer lists, advertising relationships, tradenames and internally developed software.
Corporate and Other.
Selling, general and administrative expenses for corporate and other increased $6.2 million, or 61.9%, to $16.2 million during the year ended December 31, 2016 from $10.0 million for the year ended December 31, 2015. The increase was primarily due to (a) an increase in payroll and related expenses of $3.0, (b) an increase in accounting and professional fees of $2.0 million which includes transaction costs of $1.2 million related to acquisitions; (c) restructuring charge of $0.4 million related to combining our corporate office location with the offices of UOL, and (d) a fair value adjustment of $0.8 million in connection with the mandatorily redeemable noncontrolling interests.
Restructuring Charge. During the year ended December 31, 2016, we incurred a restructuring charge of $3.9 million. There was no restructuring charge during the year ended December 31, 2015. The restructuring charge in 2016 included $3.5 million of employee termination costs related to a reduction in personnel in the corporate offices of UOL after our acquisition on July 1, 2016 and $0.4 million of charges related to combining our corporate office location with the offices of UOL.
Other Income (Expense). Other income included interest income of $0.3 million during the year ended December 31, 2016 and less than $0.1 million during the year ended December 31, 2015. Interest expense was $2.0 million during the year ended December 31, 2016 as compared to $0.8 million during the year ended December 31, 2015. The increase in interest expense during the year ended December 31, 2016 was primarily due to (a) an increase in interest expense of $0.5 million incurred from borrowings under our $100 million asset based credit facility, (b) interest expense of $0.3 million incurred on the acquisition consideration payable related to our acquisition of UOL on July 1, 2016 as a result of the Quadre Litigation and (c) interest expense of $0.4 million incurred in 2016 from the issuance of senior notes in November 2016.
Income Before Income Taxes. Income before income taxes was $47.0 million during the year ended December 31, 2016, an increase of $25.7 million, from $21.3 million during the year ended December 31, 2015. The increase in income before income taxes of $25.7 million during the year ended December 31, 2016 as compared to the same period in 2015 was primarily due to an increase in operating income of (a) $21.8 million in our auction and liquidation segment, (b) $9.2 million of income generated from our principal investments – United Online segment as a result of the acquisition of UOL on July 1, 2016, (c) $1.7 million in our capital markets segment, and (d) $0.6 million in our valuation and appraisal segment, offset by an increase in corporate overhead of $6.6 million and interest expense of $1.0 million.
Provision For Income Taxes. Provision for income taxes was $14.3 million during the year ended December 31, 2016, an increase of $6.6 million, from $7.7 million during the year ended December 31, 2015. The effective income tax rate was 30.4% during the year ended December 31, 2016 and 36.2% during the year ended December 31, 2015. The decrease in the effective income tax rate during the year ended December 31, 2016 from the same period in 2015 was primarily due to the tax differential on net income attributable to noncontrolling interests.
Net Income Attributable to Noncontrolling Interests. Net income attributable to noncontrolling interests represents the proportionate share of net income (loss) generated by Great American Global Partners, LLC and GA Retail Investments, L.P.membership interests of partnerships that we do not own. The net income attributable to noncontrolling interests was $11.2$5.7 million during the year ended December 31, 20162021 compared to a net loss of $1.1 million during the year ended December 31, 2020.
Net Income Attributable to the Company. Net income attributable to the Company during the year ended December 31, 2021 was $445.1 million, an increase of $239.9 million, from net income attributable to the Company of $205.1 million during the year ended December 31, 2020. The increase was primarily due to increases in operating income of $355.6 million, gain on extinguishment of loans and other of $3.8 million, and income from equity investments of $3.4 million, partially offset by increases in provision for income taxes of $88.5 million, interest expense of approximately $27.2 million, net income attributable to noncontrolling interests of $1.8$6.9 million, and a decrease in interest income of $0.3 million.
Preferred Stock Dividends. Holders of Series A Preferred Stock, when and as authorized by the board of directors of the Company, are entitled to cumulative cash dividends at the rate of 6.875% per annum of the $25,000 liquidation preference ($25.00 per Depositary Share) per year (equivalent to $1,718.75 or $1.71875 per Depositary Share). Dividends are payable quarterly in arrears. On January 11, 2021, the Company declared a cash dividend $0.4296875 per Depositary Share, which was paid on January 29, 2021 to holders of record as of the close of business on January 21, 2021. On April 5, 2021, the Company declared a cash dividend $0.4296875 per Depositary Share, which was paid on April 30, 2021 to holders of record as of the close of business on April 20, 2021. On July 8, 2021, the Company declared a cash dividend $0.4296875 per Depositary Share, which was paid on August 2, 2021 to holders of record as of the close of business on July 21, 2021. On October 6, 2021, the Company declared a cash dividend $0.4296875 per Depositary Share, which was paid on November 1, 2021 to holders of record as of the close of business on October 21, 2021.
Holders of Series B Preferred Stock, when and as authorized by the board of directors of the Company, are entitled to cumulative cash dividends at the rate of 7.375% per annum of the $25,000 liquidation preference ($25.00 per Depositary Share) per year (equivalent to $1,843.75 or $1.84375 per Depositary Share). Dividends are payable quarterly in arrears. On January 11, 2021, the Company declared a cash dividend $0.4609375 per Depositary Share, which was paid on January 29, 2021 to holders of record as of the close of business on January 21, 2021. On April 5, 2021, the Company declared a cash dividend $0.4609375 per Depositary Share, which was paid on April 30, 2021 to holders of record as of the close of business on April 20, 2021. On July 8, 2021, the Company declared a cash dividend $0.4609375 per Depositary Share, which was paid on August 2, 2021 to holders of record as of the close of business on July 21, 2021. On October 6, 2021, the Company declared a cash dividend $0.4609375 per Depositary Share, which was paid on November 1, 2021 to holders of record as of the close of business on October 21, 2021.
Net Income Available to Common Shareholders. Net income available to common shareholders during the year ended December 31, 2021 was $437.6 million, an increase of $237.2 million, from net income available to common shareholders of $200.4 million during the year ended December 31, 2015.
Net Income Attributable to the Company. Net income attributable to the Company for the year ended December 31, 2016 was $21.5 million, an increase of $9.7 million, from $11.8 million during the year ended December 31, 2015.2020. The increase in net income during the year ended December 31, 2016 as compared to the same period in 2015 was primarily due to an increaseincreases in operating income in the auctionof $355.6 million, gain on extinguishment of loans and liquidation segmentother of $3.7 million, and operating income from the principal investment – United Online segment asequity investments of $3.4 million, partially offset by increases in provision for income taxes of $88.5 million, interest expense of approximately $27.2 million, net income attributable to noncontrolling interests of $6.9 million, preferred stock dividends of $2.7 million, and a resultdecrease in interest income of the acquisition of UOL on July 1, 2016 as discussed above.$0.3 million.
Liquidity and Capital Resources
Our operations are funded through a combination of existing cash on hand, cash generated from operations, proceeds from the issuance of common stock, and borrowings under our senior notes payable, term loans and credit facilityfacilities, and special purposespurpose financing arrangements. On May 10, 2016, we completed a secondary offering of 2,420,980 shares of common stock at a price to the public of $9.50 per share. The net proceeds from the offering were $22.8 million after deducting underwriting commissions and other offering expenses. On November 2, 2016, we issued $28.8 million of Senior Notes due in 2021 (the “2021 Notes”), and during the third and fourth quarter of 2017, we issued an additional $6.5 million of 2021 Notes. Interest on the 2021 Notes is payable quarterly at 7.50% commencing January 31, 2017. The 2021 Notes are unsecured and due and payable in full on October 31, 2021. In connection with the issuance of the 2021 Notes, we received net proceeds of $34.3 million (after underwriting commissions, fees and other issuance costs of $1.0 million). On May 31, 2017, we issued $60.4 million of Senior Notes due in May 2027 (the “7.50% 2027 Notes”), and during the third and fourth quarter of 2017, we issued an additional $32.1 million of the 7.50% 2027 Notes. Interest is payable quarterly at 7.50% commencing July 31, 2017. The 2027 Notes are unsecured and due and payable in full on May 31, 2027. In connection with the issuance of the 7.50% 2027 Notes, we received net proceeds of $90.8 million (after underwriting commissions, fees and other issuance costs of $1.7 million). On December 13, 2017, we issued $80.5 million of Senior Notes due in December 2027 (the “7.25% 2027 Notes”). Interest is payable quarterly at 7.25% commencing January 31, 2018. The 7.25% 2027 Notes are unsecured and due and payable in full on December 31, 2027. In connection with the issuance of the 7.25% 2027 Notes, we received net proceeds of $78.2 million (after underwriting commissions, fees and other issuance costs of $2.3 million).
During the years ended December 31, 20172021 and 2016,2020, we generated net income attributable to the Company of $11.6$445.1 million and $21.5$205.2 million, respectively. Our cash flows and profitability are impacted by the number and size of retail liquidation and capital markets engagements performed on a quarterly and annual basis.basis and amounts realized from the sale of our investments in marketable securities.
As of December 31, 2017,2021, we had $132.8$278.9 million of unrestricted cash $19.7and cash equivalents, $0.9 million of restricted cash, investments in$1,532.1 million of securities and other investments, at fair value, $873.2 million of $145.4 million,loans receivable, at fair value, and approximately $205.8$2,033.3 million of borrowings outstanding. The borrowings outstanding of approximately $205.8$2,033.3 million atas of December 31, 20172021 included (a) $34.5$1,606.6 million of borrowings from the issuance of the 2021 Notes, (b) $90.9series of senior notes that are due at various dates ranging from May 31, 2024 to August 31, 2028 with interest rates ranging from 5.00% to 6.75%, $346.4 million term loans borrowed pursuant to the BRPAC Credit Agreement and Nomura Credit Agreement discussed below, $80.0 million of borrowings fromrevolving credit facility under the issuance of the 7.50% 2027 Notes, (c) $78.2Nomura credit facility discussed below, and $0.4 million of borrowings from the issuance of the 7.25% 2027 Notes, and (d) other notes payable of $2.2 million. payable.
We believe that our current cash and cash equivalents, securities and other investments owned, funds available under our asset based credit facility, UOL line offunds available under the BRPAC and Nomura term loans, funds available under the Nomura revolving credit facility, and cash expected to be generated from operating activities will be sufficient to meet our working capital and capital expenditure requirements for at least the next 12 months from issuance date of the accompanying financial statements. We continue to monitor our financial performance to ensure sufficient liquidity to fund operations and execute on our business plan.
From time to time, we may decide to pay dividends which will be dependent uponCash Flow Summary
Following is a summary of our financial conditioncash flows provided by (used in) operating activities, investing activities and results of operations. Duringfinancing activities during the years ended December 31, 20172021 and 2016, we paid cash dividends2020. A discussion of $14.9 million and $5.3 million, respectively, on our common stock. While it is the Board’s current intention to make regular dividend payments of $0.08 per share each quarter and special dividend payments dependent upon exceptional circumstances from time to time, our Board of Directors may reduce or discontinue the payment of dividends at any time for any reason it deems relevant. The declaration and payment of any future dividends or repurchases of our common stock will be made at the discretion of our Board of Directors and will be dependent upon our financial condition, results of operations, cash flows capital expenditures, and other factors thatduring the year ended December 31, 2019 has been omitted from this Annual Report on Form 10-K, but may be deemed relevantfound in “Item 7. Management’s Discussion and Analysis of Financial Condition and Results of Operations,” under the heading “Liquidity and Capital Resources” in our Annual Report on Form 10-K during the year ended December 31, 2020, filed with the SEC on March 4, 2021, which discussion is incorporated herein by our Boardreference and which is available free of Directors.
Our principal sources of liquidity to finance our business is our existing cashcharge on hand, cash flows generated from operating activities, funds available under revolving credit facilities and special purpose financing arrangements.
| Year Ended December 31, | ||||||||||||
| 2017 | 2016 | 2015 | ||||||||||
| (Dollars in thousands) | ||||||||||||
| Net cash (used in) provided by: | ||||||||||||
| Operating activities | $ | (81,790 | ) | $ | 80,280 | $ | 31,671 | |||||
| Investing activities | (33,622 | ) | (36,872 | ) | 4,918 | |||||||
| Financing activities | 134,094 | 40,404 | (28,050 | ) | ||||||||
| Effect of foreign currency on cash | 2,036 | (1,719 | ) | (127 | ) | |||||||
| Net increase in cash and cash equivalents | $ | 20,718 | $ | 82,093 | $ | 8,412 | ||||||
the SEC’s website at www.sec.gov.
Year Ended December 31, 20172021 Compared to Year Ended December 31, 20162020
| Year Ended December 31, | ||||||||
| 2021 | 2020 | |||||||
| (Dollars in thousands) | ||||||||
| Net cash provided by (used in): | ||||||||
| Operating activities | $ | 50,894 | $ | 57,689 | ||||
| Investing activities | (956,534 | ) | 21,790 | |||||
| Financing activities | 1,081,045 | (80,692 | ) | |||||
| Effect of foreign currency on cash | (382 | ) | 1,311 | |||||
| Net increase in cash, cash equivalents and restricted cash | $ | 175,023 | $ | 98 | ||||
Cash used in operating activities was $81.8 million for the year ended December 31, 2017, a decrease of $162.1 million, from cash provided by operating activities of $80.3 million for the year ended December 31, 2016. Cash used in operating activities for the year ended December 31, 2017 includes net income of $11.9 million adjusted for noncash items and changes in operating assets and liabilities. The decrease in cash provided by operating activities of $162.1 million was primarily due to (a) an decrease in net income of $20.8 million to $11.9$50.9 million during the year ended December 31, 2017, from $32.7 million during the comparable year in 2016, (b) an increase in non-cash charges and other items of $36.8 million, which included recovery of key man life insurance of $(6.0) million, depreciation and amortization of $11.1 million, share based compensation $10.3 million, impairment of leasehold improvements and other of $3.6 million, income allocated and fair value adjustment for mandatorily redeemable noncontrolling interest of $10.8 million and deferred income taxes of $5.7 million, and (c) changes in operating assets and liabilities that resulted in an decrease of $130.5 million in cash flows from operations during the year ended December 31, 2017 as2021 compared to the same year in 2016.
Cash used in investingcash provided by operating activities was $33.6of $57.7 million during the year ended December 31, 2017 compared to cash used in investing2020. Cash provided by operating activities of $36.9 million during for the year ended December 31, 2016.2021 included net income of $450.8 million adjusted for noncash items of $91.5 million and changes in operating assets and liabilities of $491.4 million. Noncash items of $91.5 million included deferred income taxes of $61.8 million, share-based compensation of $36.0 million, depreciation and amortization of $25.9 million, loss on extinguishment of debt of $6.1 million, dividends from equity investments of $2.1 million, provision for doubtful accounts of $1.5 million, effect of foreign currency on operations of $0.1 million, and income allocated for mandatorily redeemable noncontrolling interests of $0.9 million, partially offset by interest and other of $22.3 million, fair value adjustments of $7.6 million, gain on extinguishment of loans of $6.5 million, gain on equity investments of $3.5 million, income from equity investments of $2.8 million, and impairment of leaseholds, intangibles and lease loss accrual and gain on disposal of fixed assets of $0.1 million. Cash provided by operating activities during the year ended December 31, 2020 included net income of $204.0 million adjusted for noncash items of $123.4 million and changes in operating assets and liabilities of $269.7 million. Noncash items of $123.4 million included deferred income taxes of $61.6 million, noncash fair value adjustments of $22.0 million, depreciation and amortization of $19.4 million, share-based compensation of $18.6 million, other noncash interest and other of $16.8 million, impairment of leaseholds, intangibles and lease loss accrual and gain on disposal of fixed assets of $14.1 million, provision for doubtful accounts of $3.4 million, gain on extinguishment of debt of $1.6 million, dividends from equity investments of $1.3 million, income allocated for mandatorily redeemable noncontrolling interests of $1.2 million, and loss on equity investments of $0.6 million.
Cash used in investing activities was $956.5 million during the year ended December 31, 2021 compared to cash provided by investing activities of $21.8 million during the year ended December 31, 2020. During the year ended December 31, 2017,2021, cash used in investing activities consisted of (a) cash used to purchase Wunderlich and United Online in the amountsfor purchases of approximately $25.4loans receivable of $738.9 million, and $10.4 million, respectively, (b) an increase in restricted cash of $15.8$345.0 million (c) cash use of $2.1 millionused to fund two trust accounts for the future redemption of our subsidiaries’ redeemable common stock, cash used for acquisition of other businesses (d)of $28.3 million, cash useused for repayments of $1.7loan participations sold of $15.2 million, for an equity investment, and (e) cash use of $0.8 millionused for purchases of property and equipment and intangible assets of $0.7 million, and purchases of equity investments of $0.6 million, partially offset by (a) cash acquiredreceived from the acquisitionloans receivable repayment of FBR of $15.7 million, (b) proceeds from key man life insurance of $6.0 million, and (c) proceeds from sale of property, equipment and other intangibles of $0.8 million$172.1 million. During the year ended December 31, 2016,2020, cash provided by investing activities consisted of funds received from trust account of subsidiary of $320.5 million, cash received from loans receivable repayment of $90.1 million, loan participations sold of $6.9 million, and proceeds from sale of loans receivable to related party of $1.8 million, partially offset by cash used in investing activities was primarily comprisedfor purchases of (a)loans receivable of $207.5 million, cash of $176.8 million used to fund a trust account for the future redemption of one of our subsidiaries’ redeemable common stock, cash used to purchase UOL in the amountfor purchases of $33.4equity investments of $7.5 million, (b) an increase in restrictedrepayments of loan participations sold of $2.2 million, cash used for acquisition of $2.8businesses of $1.5 million and (c) $0.7 million of cash used to purchasefor purchases of property and equipment.equipment and intangible assets of $2.0 million.
Cash provided by financing activities was $134.1$1,081.0 million during the year ended December 31, 20172021 compared to $40.4cash used in financing activities of $80.7 million during the year ended December 31, 2016.2020. During the year ended December 31, 2017,2021, cash provided by financing activities primarily consisted of (a) $66.0 million proceeds from asset based credit facility and (b) $179.5$1,249.1 million proceeds from issuance of senior notes, $345.0 million proceeds from initial public offering of subsidiaries, $300.0 million proceeds from our term loan, $80.0 million proceeds from revolving line of credit, $64.7 million proceeds from our offering of common stock, $13.7 million contributions from noncontrolling interests, $14.7 million proceeds from our offering of preferred stock, partially offset by (a) $66.0$507.3 million used to repurchase our senior notes, $347.1 million used to pay dividends on our common shares, $37.6 million used to repay the asset based credit facility, (b) $16.8our notes payable, $33.4 million used to pay cash dividends, (c) $8.3debt issuance costs, $20.7 million used to repay other notes payable in connection with the acquisition of Wunderlich, (d) $11.3for repayment on our term loan, $16.5 million distributionsdistribution to noncontrolling interests, (e) $4.3$9.6 million used for debt issuance costs, (f) $1.3 million used for the payment of contingent consideration, and (g) $3.5 million used for the payment of employment taxes on vesting of restricted stock.stock, $7.5 million used to pay dividends on our preferred shares, $2.7 million used to repurchase our common stock, and $3.7 million used for payment of participating note payable and contingent consideration. During the year ended December 31, 2016,2020, cash provided byused in financing activities primarily consisted of (a) $22.8$318.8 million used for redemption of net proceeds fromsubsidiary temporary equity and distributions, $67.3 million used for repayment on our secondary offering ofterm loan, $48.2 million used to repurchase our common stock, in May 2016 and (b) $27.7$38.8 million of net proceeds from the issuance of our Senior Notes in November 2016, offset by cash used in financing activities of (a) $5.3 million ofto pay dividends paid on our common stock, (b) $2.0shares, $37.1 million used for repayment of distributions to noncontrolling interests, (c) $1.2our asset based credit facility, $22.6 million of cash used to payfor payment of employment taxes on the vesting of restricted stock, $9.8 million used to pay debt issuance and (d) $1.6offering costs, $4.7 million of cashused to pay dividends on our preferred shares, $4.3 million used for the repaymentpayment of amounts outstanding under our revolving credit facilitiesparticipating note payable and contingent consideration, payable
Year Ended December 31, 2016 Compared$3.8 million distribution to Year Ended December 31, 2015
Cash provided by operating activities was $80.3noncontrolling interests, $1.8 million for the year ended December 31, 2016, an increase of $48.6 million, from cash provided by operating activities of $31.7 million for the year ended December 31, 2015. Cash provided by operating activities for the year ended December 31, 2016 includes net income of $32.7 million adjusted for noncash items and changes in operating assets and liabilities. The increase in cash provided by operating activities of $80.3 million was primarily due to (a) an increase in net income of $9.7 million to $21.5 million during the year ended December 31, 2016, from $11.8 million during the comparable period in 2015, (b) an increase in non-cash charges and other items of $15.6 million which included depreciation and amortization of $4.3 million, share based compensation $2.8 million and deferred income taxes of $3.5 million, and (c) changes in operating assets and liabilities that resulted in an increase of $32.0 million in cash flows from operations during the year ended December 31, 2016 as compared to the same period in 2015.
Cash used in investing activities was $36.9 million for the year ended December 31, 2016 compared to cash provided by investing activities of $4.9 million for the year ended December 31, 2015. During the year ended December 31, 2016, cash used in investing activities was primarily comprised of (a) cash used to purchase UOL in the amount of $33.4repurchase our senior notes, and $0.4 million (b) an increase in restricted cash of $2.8 million, and (c) $0.7 million of cash used to purchase property and equipment. During the year ended December 31, 2015, cash provided by investing activities was primarily comprised of cash provided from a $7.6 million decrease in restricted cash,repay our other notes payable, partially offset by $0.3$186.8 million proceeds from issuance of cash used to purchase property and equipment and $2.5senior notes, $175.0 million proceeds from initial public offering of cash used in connection with the acquisition of MK Capital.
Cash provided by financing activities was $40.4subsidiaries, $75.0 million during the year ended December 31, 2016 compared to cash used by financing activities of $28.1 million during the year ended December 31, 2015. During the year ended December 31, 2016, cash provided by financing activities primarily consisted of (a) $22.8 of net proceeds from our secondaryterm loan, $39.5 million proceeds from our offering of common stock in May 2016 and (b) $27.7 million of net proceeds from the issuance of our Senior Notes in November 2016, offset by cash used in financing activities of (a) $5.3 million of dividends paid on our common stock, (b) $2.0 million of distributions to noncontrolling interests, (c) $1.2 million of cash used to pay employment taxes on the vesting of restrictedpreferred stock, and (d) $1.6$0.6 million of cash used for the repayment of amounts outstanding under our revolving credit facilities and contingent consideration payable.contributions from noncontrolling interests.
Contingent Consideration.
In connection with the acquisition of MK Capital on February 2, 2015 for a total purchase price of $9.4 million, at closing $2.5 million of the purchase price was paid in cash and 333,333 newly issued shares of our common stock with a fair value of $2.7 million were issued to the former members of MK Capital. The purchase agreement also required the payment of contingent consideration in the form of future cash payments with a fair value of $2.2 million and the issuance of shares of common stock with a fair value of $2.0 million. The contingent cash consideration of $2.2 million payable to the former members of MK Capital represents the fair value of the contingent cash consideration of $1.25 million due on the first anniversary date of the closing (February 2, 2016) and a final cash payment of $1.25 million due on the second anniversary date of the closing (February 2, 2017), with imputed interest expense calculated at 8% per annum. The contingent stock consideration of $2.0 million was comprised of the issuance of 166,667 shares of common stock on the first anniversary date of the closing (February 2, 2016) and 166,666 shares of common stock on the second anniversary date of the closing (February 2, 2017). The contingent cash and stock consideration was payable on the first and second anniversary dates of the closing provided that MK Capital generated a minimum amount of gross revenues as defined in the purchase agreement for the twelve months following the first and second anniversary dates of the closing. MK Capital achieved the minimum amount of revenues for the first and second anniversary periods. The contingent cash consideration for such first anniversary period of $1.25 million was paid and contingent stock consideration for such first anniversary period of 166,667 common shares was issued to the former members of MK Capital on February 2, 2016. The contingent cash consideration for such second anniversary period of $1.25 million was paid and contingent stock consideration for such second anniversary period of 166,666 common shares was issued to the former members of MK Capital on February 2, 2017.
Credit Agreements
Nomura Credit Agreement
On June 23, 2021, we, and our wholly owned subsidiaries, BR Financial Holdings, LLC (the “Primary Guarantor”), and BR Advisory & Investments, LLC (the “Borrower”) entered into a credit agreement (as amended prior to the Second Amendment (as defined below) the “Credit Agreement”) with Nomura Corporate Funding Americas, LLC, as administrative agent (the “Administrative Agent”), and Wells Fargo Bank, N.A., as collateral agent (the “Collateral Agent”), for a four-year $200.0 million secured term loan credit facility (the “Term Loan Facility”) and a four-year $80.0 million revolving loan credit facility (the “Revolving Credit Facility”).
On December 17, 2021 (the “Amendment Date”), we, the Primary Guarantor, and the Borrower entered into a Second Incremental Amendment to Credit Agreement (the “Second Amendment”), by and among us, the Primary Guarantor, the Borrower, each of the subsidiary guarantors signatory thereto, each of the lenders party thereto, the Administrative Agent and the Collateral Agent, pursuant to which the Borrower established an incremental facility in an aggregate principal amount of $100.0 million (the “Incremental Facility” and the incremental term loans made thereunder, the “Incremental Term Loans”) of secured term loans under the Credit Agreement on terms identical to those applicable to the Term Loan Facility. The Borrower borrowed the full amount of the Incremental Term Loans on the Amendment Date. The Term Loan Facility, Revolving Credit Facility, and Incremental Facility, together, (“Credit Facilities”), mature on June 23, 2025, subject to acceleration or prepayment.
Eurodollar loans under the Credit Facilities accrue interest at the Eurodollar Rate plus an applicable margin of 4.50%. Base rate loans accrue interest at the Base Rate plus an applicable margin of 3.50%. In addition to paying interest on outstanding borrowings under the Revolving Credit Facility, we are required to pay a quarterly commitment fee based on the unused portion of the Revolving Credit Facility, which is determined by the average utilization of the Revolving Credit Facility for the immediately preceding fiscal quarter.
Subject to certain eligibility requirements, the assets of certain subsidiaries of ours that hold credit assets, private equity assets, and public equity assets are placed into a borrowing base, which serves to limit the borrowings under the Credit Facilities. If borrowings under the Credit Facilities exceed the borrowing base, we are obligated to prepay the loans in an aggregate amount equal to such excess. The Credit Agreement and the Second Amendment contain certain representations and warranties (subject to certain agreed qualifications) that are customary for financings of this kind.
The Credit Agreement and the Second Amendment contain certain affirmative and negative covenants customary for financings of this type that, among other things, limit our, the Primary Guarantor’s, the Borrower’s, and the Borrower’s subsidiaries’ ability to incur additional indebtedness or liens, to dispose of assets, to make certain fundamental changes, to enter into restrictive agreements, to make certain investments, loans, advances, guarantees and acquisitions, to prepay certain indebtedness and to pay dividends or to make other distributions or redemptions/repurchases in respect of their respective equity interests. In addition, the Credit Agreement and the Second Amendment contain a financial covenant that requires us to maintain Operating EBITDA of at least $135.0 million and the Primary Guarantor to maintain net asset value of at least $1,100.0 million. The Credit Agreement and the Second Amendment contain customary events of default, including with respect to a failure to make payments under the credit facilities, cross-default, certain bankruptcy and insolvency events and customary change of control events.
Commencing on September 30, 2022, the Term Loan Facility and Incremental Facility will amortize in equal quarterly installments of 1.25% of the aggregate principal amount of the term loan as of the closing date with the remaining balance due at final maturity. Quarterly installments from September 30, 2022 to March 31, 2025 are in the amount of $3.8 million per quarter.
As of December 31, 2021, the outstanding balance on the Term Loan Facility and Incremental Facility was $292.7 million (net of unamortized debt issuance costs of $7.4 million). Interest on the term loan during the year ended December 31, 2021 was $5.9 million (including amortization of deferred debt issuance costs of $0.8 million). The interest rate on the term loan as of December 31, 2021 was 4.72%.
We had an outstanding balance of $80.0 million under the Revolving Credit Facility as of December 31, 2021. Interest on the revolving facility during the year ended December 31, 2021 was $1.9 million (including unused commitment fees of $0.08 million and amortization of deferred financing costs of $0.3 million). The interest rate on the Revolving Credit Facility as of December 31, 2021 was 4.67%.
We are in compliance with all financial covenants in the Nomura Credit Agreement as of December 31, 2021.
Wells Fargo Credit Agreement
On April 21, 2017, we amended the asset based credit facility agreement (as amended, the “Credit Agreement”) governing our asset based credit facility with Wells Fargo Bank National Association (“Wells Fargo Bank”) to increase the maximum borrowing limit from $100.0 million to $200.0 million. Such amendment, among other things, also extended the expiration date of the credit facility from July 15, 2018 to April 21, 2022. The Credit Agreement continues to allow for borrowings under thea separate credit agreement (a “UK Credit Agreement”) which was dated March 19, 2015 with an affiliate of Wells Fargo Bank which provides for the financing of transactions in the United Kingdom with borrowings up to 50.0 million British Pounds. Any borrowing on the UK Credit Agreement reducereduces the availability of the asset based $200.0 million credit facility. The UK Credit Agreement is cross collateralized and integrated in certain respects with the Credit Agreement. The Credit Agreement continues to include the addition of our Canadian subsidiary, from the October 5, 2016 amendment to the Credit Agreement, to facilitate borrowings to fund retail liquidation transactions in Canada. From time to time, we utilize this credit facility to fund costs and expenses incurred in connection with liquidation engagements. We also utilize this credit facility in order to issue letters of credit in connection with liquidation engagements conducted on a guaranteed basis. Subject to certain limitations and offsets, we are permitted to borrow up to $200.0 million under the credit facility, less the aggregate principal amount borrowed under the UK Credit Agreement (if in effect). Borrowings under the credit facility are only made at the discretion of the lender and are generally required to be repaid within 180 days. The interest rate for each revolving credit advance under the related credit agreement is, subject to certain terms and conditions, equal to the LIBOR plus a margin of 2.25% to 3.25% depending on the type of advance and the percentage such advance represents of the related transaction for which such advance is provided. The credit facility is secured by the proceeds received for services rendered in connection with the liquidation service contracts pursuant to which any outstanding loan or letters of credit are issued and the assets that are sold at liquidation related to such contract, if any. The credit facility also provides for success fees in the amount of 2.5% to 17.5% of the net profits, if any, earned on liquidation engagements that are financed under the credit facility as set forth in the related credit agreement. We typically seek borrowings on an engagement-by- engagementengagement-by-engagement basis. The credit agreement governing the credit facilityCredit Agreement contains certain covenants, including covenants that limit or restrict our ability to incur liens, incur indebtedness, make investments, dispose of assets, make certain restricted payments, merge, or consolidate and enter into certain transactions with affiliates. AtThere was no outstanding balance on this credit facility as of December 31, 2017,2021 or 2020. As of December 31, 2021, there was $18,505 of letters of credits outstanding under the credit facility. There were no borrowings oropen letters of credit outstanding atoutstanding.
We are in compliance with all financial covenants in the asset based credit facility as of December 31, 2016.2021.
BRPAC Credit Agreement
On April 13, 2017,December 19, 2018, BRPI Acquisition Co LLC (“BRPAC”), a Delaware limited liability company, UOL, and YMAX Corporation, Delaware corporations (collectively, the “Borrowers”), indirect wholly owned subsidiaries of ours, in the capacity as borrower,of borrowers, entered into a credit agreement (the “UOL“BRPAC Credit Agreement”) with the Banc of California, N.A. in theits capacity as agent (the “Agent”) and lender. The UOLlender and with the other lenders party (the “Closing Date Lenders”). Under the BRPAC Credit Agreement, provides for a revolving credit facility under which UOL may borrow (or request the issuance of letters of credit) up to $20.0we borrowed $80.0 million which amount is reduced by $1.5 million commencing on June 30, 2017 and on the last day of each calendar quarter thereafter. The final maturity date is April 13, 2020. The proceeds of the UOL Credit Agreement can be used (a) for working capital and general corporate purposes and/or (b) to pay dividends or permitted tax distributions to its parent company, subjectdue December 19, 2023. Pursuant to the terms of the UOLBRPAC Credit Agreement, we may request additional optional term loans in an aggregate principal amount of up to $10.0 million at any time prior to the first anniversary of the agreement date. On February 1, 2019, the Borrowers entered into the First Amendment to Credit Agreement and Joinder with City National Bank as a new lender in which the new lender extended to Borrowers the additional $10.0 million.
On December 31, 2020, the Borrowers, the Secured Guarantors, the Agent, and the Closing Date Lenders, entered into the Second Amendment to Credit Agreement (the “Second Amendment”) pursuant to which, among other things, (i) the Lenders agreed to make a new $75.0 million term loan to the Borrowers, the proceeds of which the Borrowers’ will use to repay the outstanding principal amount of the existing Terms Loans and Optional Loans and for other general corporate purposes, (ii) the Borrowers were permitted to make a one-time Permitted Distribution (as defined in the Second Amendment) in the amount of $30.0 million on the date of the Second Amendment, (iii) the maturity date of the new Term Loans is five (5) years from the date of the Second Amendment, (iv) the interest rate margin was increased by 25 basis points as set forth in the Second Amendment, (v) the Borrowers agreed to make mandatory prepayments of the Term Loans from a portion of the Consolidated Excess Cash Flow (as defined in the Credit Agreement), (vi) the maximum Consolidated Total Funded Debt Ratio (as defined in the Credit Agreement) was increased as set forth in the Second Amendment and (vii) the Company and B. Riley Principal Investments, LLC entered into a reaffirmation of their guarantees of the Borrowers’ obligations under the Credit Agreement. Borrowings underAdditionally, the UOL Credit Agreement will bear interest at a rate equal to (a) (i) the base rate (the greater of the federal funds rate plus one half of one percent (0.5%), or the prime rate) for U.S. dollar loans or (ii) at UOL’s option, the LIBOR Rate for Eurodollar loans, plus (b) the applicable margin rate, which ranges from two percent (2%) to three and one-half percent (3.5%) per annum, based upon UOL’s ratio of funded indebtedness to adjusted earnings before interest, taxes, depreciation and amortization (EBITDA) for the preceding four (4) fiscal quarters. Interest payments are to be made each one, three or six months for Eurodollar loans, and quarterly for U.S. dollar loans.
UOLBorrowers paid a commitment fee equal to 1.00%and an arrangement fee, each based on a percentage of the aggregate commitments, in each case upon the closing of the UOL Credit Agreement. The UOLSecond Amendment.
On December 16, 2021, the Borrowers, the Secured Guarantors, the Agent, and the Closing Date Lenders, entered into the Third Amendment to Credit Agreement also provides for an unused line fee payable quarterly,(the “Third Amendment”) pursuant to which, among other things, replaced LIBOR with the Secured Overnight Financing Rate (“SOFR”) reference rate and the Borrowers were permitted to make a one-time Permitted Distribution (as defined in arrears,the Third Amendment) in an amount equal to: (a) 0.50% per annum times the amount of $30.0 million on the unused revolving commitment that is less than ordate of the Third Amendment.
The borrowings under the amended BRPAC Credit Agreement bear interest equal to the amountSOFR rate plus a margin of 2.75% to 3.25% depending on the cash maintainedBorrowers’ consolidated total funded debt ratio as defined in accounts with the agent (as depositary bank); plus (b) 1.00% per annum timesBRPAC Credit Agreement. As of December 31, 2021 and 2020, the interest rate on the amended BRPAC Credit Agreement was at 3.17% and 3.40%, respectively.
Principal outstanding under the amended BRPAC Credit Agreement is due in quarterly installments. Quarterly installments from March 31, 2022 to December 31, 2022 are in the amount of the unused revolving commitment that is greater than$4.1 million per quarter, from March 31, 2023 to December 31, 2023 are in the amount of $3.6 million per quarter, from March 31, 2024 to December 31, 2024 are in the cash maintained in accounts withamount of $3.1 million per quarter, from March 31, 2025 to December 31, 2025 are $2.8 million per quarter, and the agent (as depositary bank). Any amounts outstanding under the UOL Credit Facility areremaining principal balance is due at maturity. Atfinal maturity on December 31, 2017, there were no borrowings or letters2025.
As of creditsDecember 31, 2021 and 2020, the outstanding under this credit facility.balance on the term loan was $53.7 million (net of unamortized debt issuance costs of $0.6 million), and $74.2 million (net of unamortized debt issuance costs of $0.8 million), respectively. Interest expense on the term loan during the years ended December 31, 2021 and 2020, was $2.5 million (including amortization of deferred debt issuance costs of $0.3 million) and $2.4 million (including amortization of deferred debt issuance costs of $0.3 million), respectively.
We are in compliance with all financial covenants in the amended BRPAC Credit Agreement as of December 31, 2021.
Preferred Stock Offering
On September 4, 2020, the Company closed its public offering of Depositary Shares, each representing 1/1000th of a share of 7.375% Series B Cumulative Perpetual Preferred Stock. The liquidation preference of each share of Series A Preferred Stock is $25,000 ($25.00 per Depositary Share). As a result of the offering the Company issued 1,300 shares of Series B Preferred Stock represented by 1,300,000 depositary shares. The offering resulted in gross proceeds of approximately $32.5 million.
Senior Note Offerings
On November 2, 2016,During the year ended December 31, 2021, we issued $28.8$223.4 million of Senior Notes (the “2021 Notes”), and duringsenior notes due with maturities dates ranging from May 2023 to August 2028 pursuant to At the third and fourth quarterMarket Issuance Sales Agreements with B. Riley Securities, which governs the program of 2017,at-the-market sales of our senior notes. We filed a series of prospectus supplements with the SEC which allowed us to sell these senior notes.
On January 25, 2021, we issued an additional $6.5$230.0 million of senior notes due in January 2028 (“6.0% 2028 Notes”). Interest on the 2021 Notes. Interest6.0% 2028 Notes is payable quarterly at 7.50% commencing January 31, 2017.6.0%. The 20216.0% 2028 Notes are unsecured and due and payable in full on OctoberJanuary 31, 2021.2028. In connection with the issuance of the 20216.0% 2028 Notes, we received net proceeds of $34.3$225.7 million (after underwriting commissions, fees, and other issuance costs of $1.0$4.3 million). The outstanding balanceNotes bear interest at the rate of the6.0% per annum.
On March 29, 2021, Notes was $34.5 million (net of unamortized debt issue costs and premiums of $0.8 million) at December 31, 2017. In connection with the offering of 2021 Notes, certain members of our management and the Board of Directors purchased $2.7 million or 9.5% of the 2021 Notes offered by us.
On May 31, 2017, we issued $60.4$159.5 million of Seniorsenior notes due in March 2026 (“5.5% 2026 Notes”). Interest on the 5.5% 2026 Notes (the “7.50% 2027 Notes”), and during the third and fourth quarter of 2017 we issued an additional $32.1 million of the 7.50% 2027 Notes. Interest is payable quarterly at 7.50% commencing July 31, 2017.5.5%. The 7.50% 20275.5% 2026 Notes are unsecured and due and payable in full on MayMarch 31, 2027.2026. In connection with the issuance of the 7.50% 20275.5% 2026 Notes, we received net proceeds of $90.8$156.3 million (after underwriting commissions, fees, and other issuance costs of $1.7$3.2 million). The outstanding balanceNotes bear interest at the rate of the 5.5% per annum.
On March 31, 2021, we exercised our option for early redemption at par $128.2 million of senior notes due in May 2027 (“7.50% 2027 Notes”) pursuant to the second supplemental indenture dated May 31, 2017. The total redemption payment included $1.6 million in accrued interest.
On July 26, 2021, we redeemed, in full, $122.8 million aggregate principal amount of our 7.25% Senior Notes was $90.9 million (net of unamortized debt issue costs of $1.6 million) atdue 2027 (“7.25% 2027 Notes”) pursuant to the third supplemental indenture dated December 31, 2017. The total redemption payment included approximately $2.1 million in accrued interest. In connection with the full redemption, the 7.25% 2027 Notes under the ticker symbol “RILYG,” were delisted from NASDAQ.
On December 13, 2017,August 4, 2021, we issued $80.5$316.3 million of Senior Notes (the “7.25% 2027senior notes due in August 2028 (“5.25% 2028 Notes”). Interest on the 5.25% 2028 Notes is payable quarterly at 7.25% commencing January5.25%. The 5.25% 2028 Notes are unsecured and due and payable in full on August 31, 2028. In connection with the issuance of the 5.25% 2028 Notes, we received net proceeds of $308.7 million (after underwriting commissions, fees, and other issuance costs of $7.6 million). The Notes bear interest at the rate of 5.25% per annum.
On September 4, 2021, we redeemed, in full, $137.5 million aggregate principal amount of our 7.375% Senior Notes due 2023 (“7.375% 2023 Notes”) pursuant to the fifth supplemental indenture dated September 11, 2018. The 7.25% 2027redemption price was equal to 101.5% of the aggregate principal amount, plus accrued and unpaid interest up to, but excluding, the redemption date. The total redemption payment included approximately $1.0 million in accrued interest and $2.1 million in premium. In connection with the full redemption, the 7.375% 2023 Notes under the ticker symbol “RILYH,” were delisted from NASDAQ.
On October 22, 2021, we redeemed, in full, $115.7 million aggregate principal amount of our 6.875% Senior Notes due 2023 (the “6.875% 2023 Notes”) pursuant to the fifth supplemental indenture dated September 11, 2018. The redemption price was equal to 101% of the aggregate principal amount, plus accrued and unpaid interest, up to, but excluding, the redemption date. The total redemption payment included approximately $1.8 million in accrued interest and $1.2 million in premium. In connection with the full redemption, the 6.875% 2023 Notes under the ticker symbol “RILYI,” were delisted from NASDAQ.
On December 3, 2021, we issued $322.7 million of senior notes due in December 2026 (“5.00% 2026 Notes”). Interest on the 5.00% 2026 Notes is payable quarterly at 5.00%. The 5.00% 2026 Notes are unsecured and due and payable in full on December 31, 2027.2026. In connection with the issuance of the 7.25% 20275.00% 2026 Notes, we received net proceeds of $78.2$317.6 million (after underwriting commissions, fees, and other issuance costs of $2.3$5.0 million). The Notes bear interest at the rate of 5.00% per annum.
As of December 31, 2021 and December 31, 2020, the total senior notes outstanding balance of the 7.25% 2027 Notes was $78.2$1,606.6 million (net of unamortized debt issue costs of $2.3$21.5 million) atand $870.8 million (net of unamortized debt issue costs of $9.6 million) with a weighted average interest rate of 5.69% and 6.95%, respectively. Interest on senior notes is payable on a quarterly basis. Interest expense on senior notes totaled $81.5 million and $61.2 million, during the years ended December 31, 2017.2021 and 2020, respectively.
On December 19, 2017, we entered intoThe most recent sales agreement prospectus was filed by us with the SEC on January 5, 2022 (the “January 2022 Sales Agreement Prospectus”), supplementing the prospectus filed on August 11, 2021, the prospectus filed on April 6, 2021, and the prospectus filed a prospectus supplement, pursuanton January 28, 2021. This program provides for the sale by the Company of up to which we may sell from$250.0 million of certain of the Company’s senior notes. As of December 31, 2021, the Company had $111.9 million remaining availability under the January 2022 Sales Agreement.
Off Balance Sheet Arrangements
Information about our off-balance sheet arrangements is included in Note 17 of the Notes to Consolidated Financial Statements. Such information is hereby incorporated by reference.
Dividends
From time to time, at our option upwe may decide to an aggregate of $19.0 million of the 2021 Notes, the 7.50% 2027 Notes and the 7.25% 2027 Notes. The Notes sold pursuant to the Sales Agreementpay dividends which will be issued pursuant to a prospectus dated March 29, 2017, as supplemented by a prospectus supplement dated June 28, 2017, in each case filed withdependent upon our financial condition and results of operations. During the Securities and Exchange Commission pursuant to our effective Registration Statement on Form S-3 (File No. 333-216763), which was declared effective by the Securities and Exchange Commission on March 29, 2017. The Notes will be issued pursuant to the Indenture, dated as of November 2, 2016, as supplemented by a First Supplemental Indenture, dated as of November 2, 2016 and the Second Supplemental Indenture, dated as of May 31, 2017, each between us and U.S. Bank, National Association, as trustee. Future sales of the 2021 Notes, the 7.50% 2027 Notes, and 7.25% 2027 Notes pursuant to the Sales Agreement will depend on a variety of factors including, but not limited to, market conditions, the trading price of the notes and our capital needs. Atyears ended December 31, 2017,2021 and 2020, we have $19.0 millionpaid cash dividends on our common stock of 2021 Notes, 7.50% 2027 Notes or 7.25% 2027 Notes that may be sold pursuant to the Sales Agreement. There can be no assurance we will be successful in consummating future sales based on prevailing market conditions or in the quantities or at the prices that we may deem appropriate.
Other Borrowings
In August 2016, we formed GA Retail Investments, L.P., a Delaware limited partnership, (the “Partnership”) which required us to contribute $15.4 million. The Partnership borrowed $80.0 million Australian dollars from a third party investor in connection with its formation and the $80.0 million Australian dollars was exchanged for a 50% special limited partnership interest in the Partnership. The Partnership was formed to provide funding for the retail liquidation engagement we entered into to liquidate the Masters Home Improvement stores. The $80.0 million Australian dollar participating note payable was non-interest bearing, shares in 50% of the all of the profits and losses of the Partnership and the principal amount was repaid in December 2016 upon the completion of the going-out-of-business sale of Masters Home Improvement stores as defined in the partnership agreement. At December 31, 2017 and December 31, 2016, $1.3$347.1 million and $10.0$38.8 million, respectively, was payable in accordance with the participating note payable share of profits and is included net income attributable to noncontrolling interests and amounts Due to partners in the consolidated financial statements.
Other notes payable include notes payable to a clearing organization for one of the Company’s broker dealers. The notes payable accrue interest at rates ranging from the prime rate plus 0.25% to 2.0% (4.75% to 6.50% at December 31, 2017) payable annually. The principal payments on the notes payable are due annually in the amount of $0.4 million on January 31, $0.2 million on September 30, and $0.1 million on October 31. The notes payable mature at various dates from September 30, 2018 through January 31, 2022. At December 31, 2017, the outstanding balance for the notes payable were $2.2 million.
Off Balance Sheet Arrangements
We have no obligations, assets or liabilities which would be considered off-balance sheet arrangements and do not participate in transactions that create relationships with unconsolidated entities or financial partnerships, often referred to as variable interest entities, established for the purpose of facilitating off-balance sheet arrangements. We have not guaranteed any debt or commitments of other entities or entered into any options on non-financial assets.
Dividends
On May 4, 2015, our Board of Directors approved a dividend of $0.06 per share, which was paid on or about June 12, 2015 to stockholders of record on May 22, 2015. On August 10, 2015, our Board of Directors approved a dividend of $0.20 per share, which was paid on or about September 10, 2015 to stockholders of record on August 25, 2015. On November 9, 2015, our Board of Directors approved a dividend of $0.06 per share, which was paid on or about December 9, 2015 to stockholders of record on November 24, 2015. On August 4, 2016, our Board of Directors approved a dividend of $0.03 per share, which was paid on or about September 8, 2016 to stockholders of record on August 22, 2016. On November 13, 2016, our Board of Directors approved a regular dividend of $0.08 per share and a special dividend of $0.17 per share, which was paid on or about December 14, 2016 to stockholders of record on November 29, 2016.respectively. On February 20, 2017, our Board of Directors approved23, 2022, the Company declared a regular quarterly dividend of $0.08 per share and a special dividend of $0.18 per share, which were paid on or about March 13, 2017 to stockholders of record on March 6, 2017. On May 10, 2017, our Board of Directors approved a regular quarterly dividend of $0.08 per share and a special dividend of $0.08 per share, which were paid on or about May 31, 2017 to stockholders of record on May 23, 2017. On August 7, 2017, our Board of Directors approved a regular quarterly dividend of $0.08 per share and a special dividend of $0.05 per share, which were paid on or about August 29, 2017 to stockholders of record on August 21, 2017. On November 8, 2017, our Board of Directors approved a regular quarterly dividend of $0.08 per share and a special dividend of $0.04 per share, which were paid on or about November 30, 2017 to stockholders of record on November 22, 2017. On March 7, 2018, our Board of Directors approved a regular quarterly dividend of $0.08 per share and a special dividend of $0.08$1.00 per share, which will be paid on or about April 3, 2018March 23, 2022 to stockholders of record as of March 9, 2022. On October 28, 2021, we declared a regular dividend of $1.00 per share and special dividend of $3.00 per share that will be paid on March 20, 2018.or about November 23, 2021 to stockholders of record as of November 9, 2021. On July 29, 2021, we declared a regular dividend of $0.50 per share and special dividend of $1.50 per share that was paid on August 26, 2021 to stockholders of record as of August 13, 2021. On May 3, 2021, we declared a regular dividend of $0.50 per share and special dividend of $2.50 per share that was paid on May 28, 2021 to stockholders of record as of May 17, 2021. On October 28, 2021, the Board of Directors announced an increase to the regular quarterly dividend from $0.50 per share to $1.00 per share. While it is the Board’s current intention to make regular dividend payments of $0.08$1.00 per share each quarter and special dividend payments dependent upon exceptional circumstances from time to time, our Board of Directors may reduce or discontinue the payment of dividends at any time for any reason it deems relevant. The declaration and payment of any future dividends or repurchases of our common stock will be made at the discretion of our Board of Directors and will be dependent upon our financial condition, results of operations, cash flows, capital expenditures, and other factors that may be deemed relevant by our Board of Directors.
Contractual Obligations
The following table sets forth aggregate information aboutA summary of our contractual obligationscommon stock dividend activity during the years ended December 31, 2021 and 2020 was as follows:
| Regular | Special | Total | ||||||||||||||
| Date | Date | Stockholder | Dividend | Dividend | Dividend | |||||||||||
| Declared | Paid | Record Date | Amount | Amount | Amount | |||||||||||
| October 28, 2021 | November 23, 2021 | November 9, 2021 | $ | 1.000 | $ | 3.000 | $ | 4.000 | ||||||||
| July 29, 2021 | August 26, 2021 | August 13, 2021 | 0.500 | 1.500 | 2.000 | |||||||||||
| May 3, 2021 | May 28, 2021 | May 17, 2021 | 0.500 | 2.500 | 3.000 | |||||||||||
| February 25, 2021 | March 24, 2021 | March 10, 2021 | 0.500 | 3.000 | 3.500 | |||||||||||
| October 28, 2020 | November 24, 2020 | November 10, 2020 | 0.375 | 0.000 | 0.375 | |||||||||||
| July 30, 2020 | August 28, 2020 | August 14, 2020 | 0.300 | 0.050 | 0.350 | |||||||||||
| May 8, 2020 | June 10, 2020 | June 1, 2020 | 0.250 | 0.000 | 0.250 | |||||||||||
| March 3, 2020 | March 31, 2020 | March 17, 2020 | 0.250 | 0.100 | 0.350 | |||||||||||
Holders of Series A Preferred Stock, when and as authorized by the board of directors of the Company, are entitled to cumulative cash dividends at the rate of 6.875% per annum of the $0.03 million liquidation preference ($25.00 per Depositary Share) per year (equivalent to $1,718.75 or $1.71875 per Depositary Share). Dividends are payable quarterly in arrears. As of December 31, 2017 and2021, dividends in arrears in respect of the periods inDepositary Shares were $0.8 million. On January 11, 2021, the Company declared a cash dividend $0.4296875 per Depositary Share, which payments are due:
| Payments due by period | ||||||||||||||||||||
| Total | Less Than One Year | 1-3 Years | 4-5 Years | More Than 5 years | ||||||||||||||||
| (Dollars in thousands) | ||||||||||||||||||||
| Contractual Obligations | ||||||||||||||||||||
| Operating lease obligations | $ | 57,103 | 13,496 | 16,624 | 10,613 | 16,370 | ||||||||||||||
| Notes payable | 2,548 | 805 | 972 | 771 | — | |||||||||||||||
| Senior notes payable, including interest | 342,026 | 15,415 | 30,831 | 62,985 | 232,795 | |||||||||||||||
| Total | $ | 401,677 | $ | 29,716 | $ | 48,427 | $ | 74,369 | $ | 249,165 | ||||||||||
We anticipate thatwas paid on January 29, 2021 to holders of record as of the close of business on January 21, 2021. On April 5, 2021, the Company declared a cash generated from operations and existing borrowing arrangements under our credit facilitydividend $0.4296875 per Depositary Share, which was paid on April 30, 2021 to fund costs and expenses incurred in connection with liquidation engagements should be sufficientholders of record as of the close of business on April 20, 2021. On July 8, 2021, the Company declared a cash dividend $0.4296875 per Depositary Share, which was paid on August 2, 2021 to meet ourholders of record as of the close of business on July 21, 2021. On October 6, 2021, the Company declared a cash requirements for at leastdividend $0.4296875 per Depositary Share, which was paid on November 1, 2021 to holders of record as of the next twelve months. However, our future capital requirements will dependclose of business on many factors, includingOctober 21, 2021. On January 10, 2022, the successCompany declared a cash dividend $0.4296875 per Depositary Share, which was paid on January 31, 2022 to holders of our businesses in generating cash from operations, continued compliance with financial covenants contained in our credit facility,record as of the timingclose of principal paymentsbusiness on our long-term debt, the completion of our acquisition of magicJack and the capital markets in general, among other factors.January 21, 2022.
Holders of Series B Preferred Stock, when and as authorized by the board of directors of the Company, are entitled to cumulative cash dividends at the rate of 7.375% per annum of the $25 thousand liquidation preference ($25.00 per Depositary Share) per year (equivalent to $1,843.75 or $1.84375 per Depositary Share). Dividends are payable quarterly in arrears. As of December 31, 2021, dividends in arrears in respect of the Depositary Shares were $0.5 million. On January 11, 2021, the Company declared a cash dividend $0.4609375 per Depositary Share, which was paid on January 29, 2021 to holders of record as of the close of business on January 21, 2021. On April 5, 2021, the Company declared a cash dividend $0.4609375 per Depositary Share, which was paid on April 30, 2021 to holders of record as of the close of business on April 20, 2021. On July 8, 2021, the Company declared a cash dividend $0.4609375 per Depositary Share, which was paid on August 2, 2021 to holders of record as of the close of business on July 21, 2021. On October 6, 2021, the Company declared a cash dividend $0.4609375 per Depositary Share, which was paid on November 1, 2021 to holders of record as of the close of business on October 21, 2021. On January10, 2022, the Company declared a cash dividend $0.4609375 per Depositary Share, which was paid January 31, 2022 to holders of record as of the close of business on January 21, 2022.
Critical Accounting Policies
Our financial statements and the notes thereto contain information that is pertinent to management’s discussion and analysis. The preparation of financial statements in conformity with accounting principles generally accepted in the United States of America (“GAAP”) requires management to make estimates and assumptions that affect the reported amounts of assets and liabilities and disclosures of contingent assets and liabilities. Management bases its estimates on historical experience and on various other assumptions that are believed to be reasonable under the circumstances, the results of which form the basis for making judgments about the carrying values of assets and liabilities that are not readily apparent from other sources. On a continual basis, management reviews its estimates utilizing currently available information, changes in facts and circumstances, historical experience and reasonable assumptions. After such reviews, and if deemed appropriate, management’s estimates are adjusted accordingly. Actual results may vary from these estimates and assumptions under different and/or future circumstances. Management considers an accounting estimate to be critical if:
| ● | it requires assumptions to be made that were uncertain at the time the estimate was made; and |
| ● | changes in the estimate, or the use of different estimating methods that could have been selected, could have a material impact on results of operations or financial condition. |
Use of Estimates.The preparation of financial statements in conformity with GAAP requires management to make estimates and assumptions that affect the reported amounts of assets, liabilities and disclosures of contingent assets and liabilities at the date of the financial statements and the reported amounts of revenues and expenses during the reporting period. Actual results could differ from those estimates. Estimates are used when accounting for certain items such as valuation of securities, reserves for accounts receivable, the carryingfair value of loans receivable, intangible assets and goodwill, the fair value of mandatorily redeemable noncontrolling interestsshare based arrangements and accounting for income tax valuation allowances, recovery of contract assets and sales returns and allowances. Estimates are based on historical experience, where applicable, and assumptions that management believes are reasonable under the circumstances. Due to the inherent uncertainty involved with estimates, actual results may differ.
On January 30, 2020, the World Health Organization (“WHO”) announced a global health emergency because of a new strain of coronavirus (the “COVID-19 outbreak”). In March 2020, the WHO classified the COVID-19 outbreak as a pandemic, based on the rapid increase in exposure globally. During the fourth quarter of 2021, the full impact of the COVID-19 outbreak continued to evolve, with the emergence of variant strains and breakthrough infections becoming prevalent both in the U.S. and worldwide. As the U.S. economy recovers, aided by stimulus packages and fiscal and monetary policies, inflation has been rising at historically high rates, and the Federal Reserve has signaled that it will begin increasing the target federal funds effective rate. The impact of the COVID-19 outbreak and these related matters on our results of operations, financial position and cash flows will depend on future developments, including the duration and spread of the outbreak and related advisories and restrictions and the success of vaccines and natural immunity in controlling the pandemic. These developments and the impact of the COVID-19 outbreak on the financial markets and the overall economy continue to be highly uncertain and cannot be predicted. If the financial markets and/or the overall economy continue to be impacted, our results of operations, financial position and cash flows may be materially adversely affected.
Our significant accounting policies are described in Note 2 to the consolidated financial statements included elsewhere in this Annual Report. Management believes that the following critical accounting policies reflect the more significant estimates and assumptions used in the preparation of our financial statements.
Revenue Recognition.Recognition. We recognize revenues under Accounting Standards Codification (“ASC”) 606 – Revenue from Contracts with Customers
Revenues are recognized when control of the promised goods or performance obligations for services is transferred to our customers, in accordancean amount that reflects the consideration we expect to be entitled to in exchange for the goods or services.
Revenues from contracts with the accounting guidance when persuasive evidence of an arrangement exists, the related services have been provided, the fee is fixed or determinable, and collection is reasonably assured.
Revenuescustomers in the Capital Markets segment, Wealth Management segment, Auction and Liquidation segment, Financial Consulting segment, Principal Investments – Communications segment and Brands segment are primarily comprised of (i) fees earned from corporate finance, investment banking, restructuring and wealth management services; (ii) revenues from sales and trading activities; and (iii) interest income from securities lending activities.the following:
Capital Markets Segment - Fees earned from corporate finance and investment banking services are derived from debt, equity and convertible securities offerings in which the Company acted as an underwriter or placement agentagent. Fees from underwriting activities are recognized as revenues when the performance obligation for the services related to the underwriting transaction is satisfied under the terms of the engagement and is not subject to any other contingencies. Fees are also earned from financial advisory and consulting services rendered in connection with client mergers, acquisitions, restructurings, recapitalizations and other strategic transactions. Fees from underwriting activities are recognized in earnings when theThe performance obligation for financial advisory services related to the underwriting transaction are completed under the terms ofis satisfied over time as work progresses on the engagement and services are delivered to the client. The performance obligation for financial advisory services may also include success and performance based fees which are recognized as revenue when the income was determinedperformance obligation is no longer constrained and it is not probable that the revenue recognized would be subject to any other contingencies.significant reversal in a future period. Generally, it is probable that the revenue recognized is no longer subject to significant reversal upon the closing of the investment banking transaction.
Fees earned from wealthasset management services consist primarily of investment management fees that are recognized over the period the performance obligation for the services are provided. InvestmentAsset management fees are primarily comprised of fees for investmentasset management services and are generally based on the dollar amount of the assets being managed.
Revenues from sales and trading are recognized when the performance obligation is satisfied and include (i) commissions resulting from equity securities transactions executed as agent or principal and are recorded on a trade date basis;basis and fees paid for equity research.
Revenues from other sources in the Capital Markets segment is primarily comprised of (i) interest income from loans receivable and securities lending activities, (ii) related net trading gains and losses from market making activities, and from the commitment of capital to facilitate customer orders;orders, (iii) fees paid for equity research; and (iv) principal transactions which include realized and unrealized gains and losses and interest and dividend income resultingtrading activities from our principal investmentsPrincipal Investments in equity and other securities for the Company’s account.account, and (iv) other income.
RevenuesInterest income from securities lending activities consistconsists of interest income from equity and fixed income securities that are borrowed from one party and loaned to another. The Company maintains relationships with a broad group of banks and broker-dealers to facilitate the sourcing, borrowing and lending of equity and fixed income securities in a “matched book” to limit the Company’s exposure to fluctuations in the market value or securities borrowed and securities loaned.
RevenuesOther revenues include (i) net trading gains and losses from market making activities in our fixed income group, (ii) carried interest from our asset management recognized as earnings from financial assets within the scope of ASC 323 - Investments - Equity Method and Joint Ventures, and therefore will not be in the scope of ASC 606 - Revenue from Contracts with Customers. In accordance with ASC 323 - Investments - Equity Method and Joint Ventures, the Company will record equity method income (losses) as a component of investment income based on the change in our proportionate claim on net assets of the investment fund, including performance-based capital allocations, assuming the investment fund was liquidated as of each reporting date pursuant to each fund’s governing agreements, and (iii) other miscellaneous income.
Wealth Management segment - Fees from wealth management asset advisory services consist primarily of investment advisory fees that are recognized over the period the performance obligation for the services provided. Investment advisory and asset management fees are primarily comprised of fees for investment services and are generally based on the dollar amount of the assets being managed. Investment advisory fee revenues as a principal registered investment advisor (RIA) are recognized on a gross basis. Asset management fee revenues as an agent are recognized on a net basis.
Revenues from sales and trading are recognized when the performance obligation is satisfied and include commissions resulting from equity securities transactions executed as agent and are recorded on a trade date basis.
Auction and Liquidation segment are comprised of (i) commissions and fees earned on the sale of goods at auctions and liquidations; (ii) revenues from auction and liquidation services contracts where the Company guarantees a minimum recovery value for goods being sold at auction or liquidation; (iii) revenue from the sale of goods that are purchased by the Company for sale at auction or liquidation sales events; (iv) fees earned from real estate services and the origination of loans; (v) revenues from financing activities is recorded over the lives of related loans receivable using the interest method; and (vi) revenues from contractual reimbursable expenses incurred in connection with auction and liquidation contracts.
- Commission and fees earned on the sale of goods at auctionAuction and liquidationLiquidation sales are recognized when evidence of ana contract or arrangement exists, the salestransaction price has been determined, title has passed to the buyer and the buyerperformance obligation has assumedbeen satisfied when control of the product and risks of ownership and collection is reasonably assured.has been transferred to the buyer. The commission and fees earned for these services are included in revenues in the accompanying condensed consolidated statements of operations.income. Under these types of arrangements, revenues also include contractual reimbursable costs.
Revenues earned from auctionAuction and liquidationLiquidation services contracts where the Company guarantees a minimum recovery value for goods being sold at auction or liquidation are recognized over time when the performance obligation is satisfied. We generally use the cost-to-cost measure of progress for our contracts because it best depicts the transfer of services to the customer which occurs as we incur costs on our contracts. Under the cost-to-cost measure of progress, the extent of progress towards completion is measured based on proceeds received. Thethe ratio of costs incurred to date to the total estimated costs at completion of the performance obligation. Revenues, including estimated fees or profits, are recorded proportionally as costs are incurred. Costs to fulfill the contract include labor and other direct costs incurred by the Company records proceeds received fromrelated to the contract. Due to the nature of the guarantees and performance obligations under these typescontracts, the estimation of engagements first as a reduction of contractual reimbursable expenses, second as a recovery of its guaranteerevenue that is ultimately earned is complex and thereafter as revenue, subject to suchmany variables and requires significant judgment. It is common for these contracts to contain provisions that can either increase or decrease the transaction price upon completion of our performance obligations under the contract. Estimated amounts are included in the transaction price at the most likely amount it is probable that a significant reversal of revenue meetingwill not occur. Our estimates of variable consideration and determination of whether or not to include estimated amounts in the criteriatransaction price are based on an assessment of having been fixed or determinable. Contractual reimbursable expensesour anticipated performance under the contract taking into consideration all historical, current and amounts advancedforecasted information that is reasonably available to customers for minimum guaranteesus. Costs that directly relate to the contract and expected to be recoverable are initially recordedcapitalized as an asset and included in advances against customer contracts in the accompanying condensed consolidated balance sheets. These costs are amortized as the services are transferred to the customer over the contract period, which generally does not exceed six months, and the expense is recognized as a component of direct cost of services. If, during the auction or liquidation sale, the Company determines that the proceedstotal costs to be incurred on a performance obligation under a contract exceeds the total estimated revenues to be earned, a provision for the entire loss on the performance obligation is recognized in the period the loss is determined.
If the Company determines that the variable consideration used in the initial determination of the transaction price for the contract is such that the total recoveries from the sale will not meet the minimum guaranteed recovery value as defined in the auction or liquidation services contract,will not exceed the Company accrues a loss on the contract in the period that the loss becomes known.
The Company also evaluates revenue from auction and liquidation contractsguaranteed recovery values or advances made in accordance with the accounting guidance to determine whether to report Auctioncontract, the transaction price will be reduced and Liquidation segmenta loss or negative revenue could result from the performance obligation. A provision for the entire loss as negative revenue on a gross or net basis. The Company has determined that it acts as an agent in a substantial majority of its auction and liquidation services contracts and therefore reports the auction and liquidation revenues on a net basis.
Revenues from the sale of goods are recorded gross and areperformance obligation is recognized in the period in which the sale of goods held for sale or auction are completed, title to the property passes to the purchaser and the Company has fulfilled its obligations with respect to the transaction. These revenues are primarily the result of the Company acquiring title to merchandise with the intent of selling the items at auction or for augmenting liquidation sales. For liquidation contracts where we take title to retail goods, our net sales represent gross sales invoiced to customers, less certain related charges for discounts, returns, and other promotional allowances and are recorded net of sales or value added tax.loss is determined.
Financial Consulting Segment - Revenues in the Valuation and AppraisalFinancial Consulting segment are primarily comprised of fees earned from providing bankruptcy, financial advisory, forensic accounting, real estate consulting and valuation and appraisal services. Fees earned from bankruptcy, financial advisory, forensic accounting and real estate consulting services are rendered to clients over time as work progresses on the engagement and services are delivered to the client. Fees may also include success and performance based fees which are recognized as revenue when the performance obligation is no longer constrained and it is not probable that the revenue recognized would be subject to significant reversal in a future period. Revenues for valuation and appraisal services. Revenuesservices are recognized when the performance obligation is completed and is generally at the point in time upon the delivery of the completed servicesreport to the related customers and collection of the fee is reasonably assured.customer. Revenues in the Valuation and AppraisalFinancial Consulting segment also include contractual reimbursable costs.
Principal Investments – Communications Segment – Revenues in the Principal Investments - United OnlineCommunications segment are primarily comprised of subscription services revenues which are derived primarily fromconsist of fees charged to United Online pay accounts; advertising and other revenues; and products revenues which are derived primarily from the sale of the magicJack access rights; revenues from access rights renewals and mobile apps; prepaid minutes revenues; revenues from access and wholesale charges; service revenue from UCaaS hosting services; and revenues from mobile phone voice, text, and data services. Products revenues consist of revenues from the sale of magicJack, mobile phone, and mobile broadband service devices, including the related shipping and handling fees.
Serviceand installation fees, if applicable. This segment’s revenues are derived primarily from fees charged to pay accounts and are recognized in the period inalso include advertising revenues which fees are fixed or determinable and the related services are provided to the customer. The Company’s pay accounts generally pay in advance for their services by credit card, PayPal, automated clearinghouse or check, and revenues are then recognized ratably over the service period. Advance payments from pay accounts are recorded in the condensed consolidated balance sheets as deferred revenue. In circumstances where payment is not received in advance, revenues are only recognized if collectability is reasonably assured.
Advertising revenues consist primarily of amounts from the Company’s Internet search partner that are generated as a result of users utilizing the partner’s Internet search services and amounts generated from display advertisements. The Company recognizes such advertising revenues in the period in which the advertisement is displayed or, for performance-based arrangements, when the related performance criteria are met. In determining whether an arrangement exists,
Subscription service revenues are recognized over time in the Company ensures that a written contractservice period in which the transaction price has been determinable and the related performance obligations for services are provided to the customer. Fees charged to customers in advance are initially recorded in the consolidated balance sheets as deferred revenue and then recognized ratably over the service period as the performance obligations are provided.
Product revenues for hardware and shipping are recognized at the time of delivery. Revenues from sales of devices and services represent revenues recognized from sales of the magicJack devices to retailers, wholesalers, or direct to customers, net of returns, and rights to access the Company’s servers over the period associated with the access right period, and from sales of mobile phones and voice, text, and data services. The transaction price for devices is in place, such as a standard insertion order or a customer-specific agreement.allocated between equipment and service based on stand-alone selling prices. Revenues allocated to devices are recognized upon delivery (when control transfers to the customer), and service revenue is recognized ratably over the service term. The Company assesses whether performance criteria have been metestimates the return of magicJack device direct sales as part of the transaction price using a six month rolling average of historical returns.
Brands Segment – Licensing revenue results from various license agreements that provide revenue based on guaranteed minimum royalty amounts and whether theadvertising/marketing fees are fixed or determinablewith additional royalty revenue based on a reconciliationpercentage of defined sales. Guaranteed minimum royalty amounts are recognized as revenue on a straight-line basis over the full contract term. Royalty payments exceeding the guaranteed minimum amounts in a specific contract year are recognized only subsequent to when the guaranteed minimum amount has been achieved. Other licensing fees are recognized at a point in time once the performance obligations have been satisfied.
Payments received as consideration for the grant of a license are recorded as deferred revenue at the time payment is received and recognized ratably as revenue over the term of the performance criterialicense agreement. Advanced royalty payments are recorded as deferred revenue at the time payment is received and the payment terms associated with the transaction. The reconciliation of the performance criteria generally includes a comparison of customer-provided performance data to the contractual performance obligation and to internal or third-party performance data in circumstances where that datarecognized as revenue when earned. Revenue is available.not recognized unless collectability is probable.
Allowance for Doubtful Accounts. We maintain an allowance for doubtful accounts for estimated losses inherent in our accounts receivable portfolio. In establishing the required allowance, management utilizes a specific customer identification methodology.the expected loss model. Management also considers historical losses adjusted for current market conditions and the customers’ financial condition, the amount of receivables in dispute, and the current receivables aging and current payment patterns. Account balances are charged off against the allowance after all means of collection have been exhausted and the potential for recovery is considered remote. The bad debt expense is included as a component of selling, general and administrative expenses in the accompanying consolidated statementstatements of operations.income.
Goodwill and Other Intangible Assets. We account for goodwill and intangible assets in accordance with the accounting guidance which requires that goodwill and other intangibles with indefinite lives be tested for impairment annually or on an interim basis if events or circumstances indicate that the fair value of an asset has decreased below its carrying value.
Goodwill includes the excess of the purchase price over the fair value of net assets acquired in a business combinations and the acquisition of noncontrolling interests. The Codification requires that goodwill be tested for impairment at the reporting unit level (operating segment or one level below an operating segment). Application of the goodwill impairment test requires judgment, including the identification of reporting units, assigning assets and liabilities to reporting units, assigning goodwill to reporting units, and determining the fair value. The Company operates threefive reporting units, which are the same as its reporting segments described in Note 2022 to the consolidated financial statements. Significant judgment is required to estimate the fair value of reporting units which includes estimating future cash flows, determining appropriate discount rates and other assumptions. Changes in these estimates and assumptions could materially affect the determination of fair value and/or goodwill impairment.
When testing goodwill for impairment, we may assessin accordance with ASU 2017-04, Intangibles-Goodwill and Other (Topic 350): Simplifying the Test for Goodwill Impairment, the Company made a qualitative factors for some or allassessment of our reporting units to determine whetherthe impact of the COVID-19 outbreak on goodwill and other intangible assets. Based on the Company’s qualitative assessments during 2020, the Company concluded that a positive assertion can be made from the qualitative assessment that it is more likely than not (that is, a likelihood of more than 50 percent) that the fair value of a reporting unit is less than its carrying amount, including goodwill. Alternatively, we may bypass this qualitative assessment for some or all of our reporting units and perform a detailed quantitative test of impairment (step 1). If we perform the detailed qualitative impairment test and the carrying amount of the reporting unit exceeds its fair value, we would perform an analysis (step 2) to measure such impairment. In 2017, we performed a qualitative assessment of the recoverability of our goodwill balances for each of our reporting units in performing our annual impairment test and concluded that the fair values of each of our reporting units exceeded their carrying values and no impairments were identified.
In accordance with the Codification, theThe Company reviews the carrying value of its amortizable intangibles which is comprised of tradenames and customer lists, and other long-lived assets for impairment at least annually or whenever events or changes in circumstances indicate that the carrying amount of an asset may not be recoverable. Recoverability of long-lived assets is measured by comparing the carrying amount of the asset or asset group to the undiscounted cash flows that the asset or asset group is expected to generate. If the undiscounted cash flows of such assets are less than the carrying amount, the impairment to be recognized is measured by the amount by which the carrying amount of the asset or asset group, if any, exceeds its fair market value. No impairment was deemed to exist as ofDuring the year ended December 31, 2017.2020, the Company determined that the COVID-19 outbreak was a triggering event for testing the indefinite-lived tradenames in the Brands segment during the first quarter and again in the second quarter and determined that the indefinite-lived tradenames in the Brands segment were impaired. As a result, the Company recognized impairment charges of $12,500, during the year ended December 31, 2020, which are included in restructuring charge in the Company’s consolidated statements of income. During the year ended December 31, 2021, the Company recognized no impairment of intangibles.
Fair Value Measurements. The Company records securities and other investments owned, securities sold not yet purchased, and mandatorily redeemable noncontrolling interests that were issued after November 5, 2003 at fair value with fair value determined in accordance with the Codification. Our mandatorily redeemable noncontrolling interests are measured at fair value on a recurring basis and are categorized using the three levels of fair value hierarchy. In general, fair values determined by Level 1 inputs utilize quoted prices (unadjusted) for identical instruments that are highly liquid, observable and actively traded in over-the-counter markets. Fair values determined by Level 2 inputs utilize inputs other than quoted prices included in Level 1 that are observable for the asset or liability, either directly or indirectly. Level 2 inputs include quoted prices for similar instruments in active markets, quoted prices for identical or similar instruments in markets that are not active and model-derived valuations whose inputs are observable and can be corroborated by market data. Level 3 inputs are unobservable inputs that are supported by little or no market activity and that are significant to the fair value of the assets or liabilities. In certain cases, the inputs used to measure fair value may fall into different levels of the fair value hierarchy. In such cases, the level in the fair value hierarchy within which the fair value measurement in its entirety falls has been determined based on the lowest level input that is significant to the fair value measurement in its entirety. Our assessment of the significance of a particular input to the fair value measurement in its entirety requires judgment and considers factors specific to the asset or liability.
We determined theThe fair value of mandatorily redeemable noncontrolling interests described aboveis determined based on the issuance of similar interestinterests for cash, references to industry comparables, and relied, in part, on information obtained from appraisal reports preparedand internal valuation models.
Investments in partnership interests include investments in private equity partnerships that primarily invest in equity securities, bonds, and direct lending funds. We also invest in priority investment funds and the underlying securities held by outside specialists.these funds are primarily corporate and asset-backed fixed income securities and restrictions exist on the redemption of amounts invested by the Company. The Company’s partnership and investment fund interests are valued based on the Company’s proportionate share of the net assets of the partnerships and funds; the value for these investments is derived from the most recent statements received from the general partner or fund administrator. These partnership and investment fund interests are valued at net asset value (“NAV”) in accordance with ASC 820 - Fair Value Measurements.
The carrying amounts reported in the consolidated financial statements for cash, restricted cash, accounts receivable, accounts payable and accrued expenses and other current liabilities approximate fair value based on the short-term maturity of these instruments. The carrying amounts of the notes payable (including credit lines used to finance liquidation engagements), long-term debt and capital lease obligations approximate fair value because the contractual interest rates or effective yields of such instruments are consistent with current market rates of interest for instruments of comparable credit risk. The adoption of the new accounting guidance on fair value did not have a material impact on our consolidated financial statements.
Share-Based Compensation. The Company’s share based payment awards principally consist of grants of restricted stock and restricted stock units. Share based payment awards also include grants of membership interests in the Company’s majority owned subsidiaries. The grants of membership interests consist of percentage interests in the Company’s majority owned subsidiaries as determined at the date of grant. In accordance with the accounting guidance share based payment awards are classified as either equity or a liability. For equity-classified awards, the Company measures compensation cost for the grant of membership interests at fair value on the date of grant and recognizes compensation expense in the consolidated statementstatements of operationsincome over the requisite service or performance period the award is expected to vest. The fair
In June 2018, the Company adopted the 2018 Employee Stock Purchase Plan (“Purchase Plan”) which allows eligible employees to purchase common stock through payroll deductions at a price that is 85% of the market value of the liability-classified award will be subsequently remeasured at each reporting date throughcommon stock on the settlement date. Change in fair value duringlast day of the requisite service period will be recognized asoffering period. In accordance with the provisions of ASC 718 - Compensation – Stock Compensation, the Company is required to recognize compensation cost over that period.expense relating to shares offered under the Purchase Plan.
Income Taxes. The Company recognizes deferred tax liabilities and assets for the expected future tax consequences of events that have been included in the financial statements or tax returns. Deferred tax liabilities and assets are determined based on the difference between the financial statement and tax basis of assets and liabilities using enacted tax rates in effect forduring the year in which the differences are expected to reverse. The Company estimates the degree to which tax assets and credit carryforwards will result in a benefit based on expected profitability by tax jurisdiction, the eligible carryforward period, and other circumstances. A valuation allowance for such tax assets and loss carryforwards is provided when it is determined to be more likely than not that the benefit of such deferred tax asset will not be realized in future periods. Tax benefits of operating loss carryforwards are evaluated on an ongoing basis, including a review of historical and projected future operating results, the eligible carryforward period, and other circumstances. If it becomes more likely than not that a tax asset will be used, the related valuation allowance on such assets would be reduced.
The Company establishes a valuation allowance if, based on the weight of available evidence, it is more likely than not that some portion or all of the deferred tax assets will not be realized. Tax benefits of operating loss and tax credit carryforwards are evaluated on an ongoing basis, including a review of historical and projected future operating results, the eligible carryforward period, and other circumstances. As a result of the common stock offering that was completed on June 5, 2014, the Company had a more than 50% ownership shift in accordance with Internal Revenue Code Section 382. Accordingly, the Company is limited to the amount of net operating loss that may be utilized in future taxable years depending on the Company’s actual taxable income. As of December 31, 2015,2019, the Company believes that the net operating loss that existed as of the more than 50% ownership shift will be utilized in future tax periods and it is more-likely-than-not that future taxable earnings will be sufficient to realize its deferred tax assets and has not provided an allowance.
The Tax Cuts and Jobs Act (the “Tax Act”) was enacted on December 22, 2017. The Tax Act reducesRecent Accounting Standards
See Note 2(ac) to the U.S. federal corporate tax rate from 35% to 21%, requires companies to pay a one-time transition tax on earnings of certain foreign subsidiaries that were previously tax deferred, provides an exemption from U.S. federal tax for dividends received from foreign subsidiaries, and creates new taxes on certain foreign sourced earnings. As of the completion of theseaccompanying financial statements and related disclosures,for recent accounting standards we have not completed our accounting for the tax effects of the Tax Act; however, as described below, we have made a reasonable estimate of such effectsyet adopted and recorded a provisional tax expense of $13.1 million, which is included as a component of income tax expense in the fourth quarter of 2017. This provisional tax expense incorporates assumptions made based upon the Company’s current interpretation of the Tax Act, and may change as we receive additional clarification and implementation guidance and as the interpretation of the Tax Act evolves. In accordance with SEC Staff Accounting Bulletin No. 118, the Company will finalize the accounting for the effects of the Tax Act no later than the fourth quarter of 2018. Future adjustments made to the provisional effects will be reported as a component of income tax expense from continuing operations in the reporting period in which any such adjustments are determined. See Note 13 for additional information.recently adopted.
New Accounting Standards
In February 2016, the Financial Accounting Standards Board (the “FASB”) issued Accounting Standards Update (“ASU”) No. 2016-02: Leases (Topic 842) (“ASU 2016-02"). The amendments in this update require lessees, among other things, to recognize lease assets and lease liabilities on the balance sheet for those leases classified as operating leases under previous authoritative guidance. This update also introduces new disclosure requirements for leasing arrangements. ASU 2016-02 will be effective for the Company in fiscal year 2019, but early application is permitted. The Company is currently evaluating the impact of this update on the consolidated financial statements.
In May 2014, the FASB issued ASU No. 2014-09, Revenue from Contracts with Customers (Topic 606) which has subsequently been amended by ASU 2015-14, ASU 2016-08, ASU 2016-10, ASU 2016-12, and ASU 2017-13. These ASUs outline a single comprehensive model for entities to use in accounting for revenue arising from contracts with customers and supersedes most current revenue recognition guidance, including industry-specific guidance. The guidance includes a five-step framework that requires an entity to: (i) identify the contract(s) with a customer, (ii) identify the performance obligations in the contract, (iii) determine the transaction price, (iv) allocate the transaction price to the performance obligations in the contract, and (v) recognize revenue when the entity satisfies a performance obligation. In July 2015, the FASB deferred the effective date of ASU 2014-09 to annual reporting periods beginning after December 15, 2017. Early adoption will be permitted as of annual reporting periods beginning after December 15, 2016, including interim reporting periods within those annual periods. A full retrospective or modified retrospective approach is required. In addition, the new guidance will require enhanced disclosures, including revenue recognition policies to identify performance obligations to customers and significant judgments in measurement and recognition.
The Company has elected to apply the modified retrospective method and the impact was determined to be immaterial on the consolidated financial statements. Accordingly, the new revenue standard will be applied prospectively in our consolidated financial statements from January 1, 2018 forward and reported financial information for historical comparable periods will not be revised and will continue to be reported under the accounting standards in effect during those historical periods.
The Company has performed an analysis and identified its revenues and costs that are within the scope of the new guidance. The Company anticipates that its current methods of recognizing revenues will not be significantly impacted by the new guidance. In addition, there may be certain situations where advisory fees are deferred and not recognized, dependent upon performance obligations and other situations that will result in the acceleration of the recognition of revenue on retail liquidation engagements that contain performance-based arrangements if certain predefined outcomes occur. The scope of the accounting update does not apply to revenue associated with financial instruments, and as a result, will not have an impact on the elements of our consolidated statements of operations most closely associated with our secured lending business and proprietary trading income which includes interest income, proprietary trading income and interest expense. The adoption of the accounting update will not have a material impact on the Company’s consolidated financial statements.
In August 2016, the FASB issued ASU 2016-15, Statement of Cash Flows (Topic 230): Classification of Certain Cash Receipts and Cash Payments (ASU 2016-15), which clarifies how companies present and classify certain cash receipts and cash payments in the statement of cash flows. ASU 2016-15 is effective for us in our first quarter of fiscal year 2019, but early application is permitted. The Company has not yet adopted this update and is currently evaluating the impact it may have on its financial condition and results of operations.
In January 2017, the FASB issued ASU 2017-04,Intangibles—Goodwill and Other (Topic 350) Simplifying the Test for Goodwill Impairment. This standard simplifies the accounting for goodwill impairment. The guidance removes Step 2 of the goodwill impairment test, which requires a hypothetical purchase price allocation. Goodwill impairment will now be the amount by which a reporting unit’s carrying value exceeds its fair value, not to exceed the carrying amount of goodwill. The revised guidance will be applied prospectively, and is effective for calendar year-end SEC filers for its annual or any interim goodwill impairment tests in fiscal years beginning after December 15, 2019. Early adoption is permitted for interim or annual goodwill impairment tests performed on testing dates after January 1, 2017. The Company has not yet adopted this update and is currently evaluating the effect this new standard will have on its financial condition and results of operations.
In February 2018, the FASB issued ASU 2018-02, Income Statement - Reporting Comprehensive Income (Topic 220): Reclassification of Certain Tax Effects from Accumulated Other Comprehensive Income that provides for the reclassification from accumulated other comprehensive income to retained earnings for stranded effects resulting from the Tax Cuts and Jobs Act of 2017. The accounting update is effective for the fiscal year beginning after December 15, 2018 and early adoption is permitted. The accounting update should be applied either in the period of adoption or retrospectively to each period in which the effect of the change in the U.S. federal corporate income tax rate in the Tax Act of 2017 is recognized. We are currently evaluating the impact of the accounting update, but the adoption is not expected to have a material impact on our consolidated financial statements.
Item 7A. QUANTITATIVE AND QUALITATIVE DISCLOSURES ABOUT MARKET RISK
B. Riley’s primary exposureWe periodically use derivative instruments, which primarily consist of the purchase of forward exchange contracts, for certain loans receivable and Auction and Liquidation engagements with operations outside the United States. During the year ended December 31, 2020, our use of derivatives consisted of the purchase of forward exchange contracts in the amount of 12.7 million Euros, of which 6.7 million Euros were settled. As of December 31, 2021 and 2020, forward exchange contracts in the amount of 6.0 million Euros were outstanding.
The forward exchange contracts were entered into to market risk consistsimprove the predictability of riskcash flows related to changesa retail store liquidation engagement and a loan receivable. The net gain from forward exchange contracts was $1.1 million and net loss was $0.3 million during the years ended December 31, 2021 and 2020, respectively. This amount is reported as a component of selling, general and administrative expenses in interestthe consolidated statements of income.
We transact business in various foreign currencies. In countries where the functional currency of the underlying operations has been determined to be the local country’s currency, revenues and expenses of operations outside the United States are translated into United States dollars using average exchange rates while assets and liabilities of operations outside the United States are translated into United States dollars using period-end exchange rates. B. Riley has not used derivative financial instruments for speculation or trading purposes.The effects of foreign currency translation adjustments are included in stockholders’ equity as a component of accumulated other comprehensive income in the accompanying consolidated balance sheets. Transaction gains (losses) are included in selling, general and administrative expenses in our consolidated statements of income.
Interest Rate Risk
Our primary exposure to market risk consists of risk related to changes in interest rates. We utilize borrowings under our senior notes payable and credit facilities to fund costs and expenses incurred in connection with our acquisitions and retail liquidation engagements. Borrowings under our senior notes payable are at fixed interest rates and borrowings under our credit facilities bear interest at a floating rate of interest. In our portfolio of securities owned we invest in loans receivable that primarily bear interest at a floating rate of interest. If floating rates of interest had increased by 1% during the year ended December 31, 2021, the rate increase would have resulted in an increase in interest expense of $4.3 million.
The primary objective of our investment activities is to preserve capital for the purpose of funding operations while at the same time maximizing the income we receive from investments without significantly increasing risk. To achieve these objectives, our investments allow us to maintain a portfolio of cash equivalents, short-term investments through a variety of securities owned that primarily includes common stocks, loans receivable and investments in partnership interests. Our cash and cash equivalents through December 31, 20172021 included amounts in bank checking and liquid money market accounts. We may be exposed to interest rate risk through trading activities in convertible and fixed income securities as well as U.S. Treasury securities, however, based on our daily monitoring of this risk, we believe we currently have limited exposure to interest rate risk in these activities.
Foreign Currency Risk
The majority of our operating activities are conducted in U.S. dollars. Revenues generated from our foreign subsidiaries totaled $3.0 million for the year ended December 31, 2017 or less than 1% or our total revenues of $322.2$50.5 million during the year ended December 31, 2017.2021 or 2.9% of our total revenues of $1,741.0 million during the year ended December 31, 2021. The financial statements of our foreign subsidiaries are translated into U.S. dollars at fiscal year-endperiod-end rates, with the exception of revenues, costs, and expenses, which are translated at average rates during the reporting period. We include gains and losses resulting from foreign currency transactions in income, while we exclude those resulting from translation of financial statements from income and include them as a component of accumulated other comprehensive income (loss). Transaction losses,gains (losses), which were included in our consolidated statements of income, amounted to a gain of $1.3 million and loss of approximately $0.8 million, $0.8 million and $0.3$0.6 million during the years ended December 31, 2017, 20162021 and 2015,2020, respectively. We may be exposed to foreign currency risk; however, our operating results during the year ended December 31, 20172021 included $3.0$50.5 million of revenues and $42.8 million of operating expenses from our foreign subsidiaries and a 10% appreciation or depreciation of the U.S. dollar relative to the local currency exchange rates would result in a $0.3an approximately $0.7 million increasechange in our operating income and a 10% depreciation of the U.S. dollar relative to the local currency exchange rates would have resulted in a net decrease in our operating income of approximately $0.3 million forduring the year ended December 31, 2017.2021.
Item 8. 8. FINANCIAL STATEMENTS AND SUPPLEMENTARY DATA
The information required by this Item 8 is submitted as a separate section beginning on page F-1 of this Annual Report on Form 10-K (the “Financial Statement Schedules”Statements”).
Item 9. CHANGES IN AND DISAGREEMENTDISAGREEMENTS WITH ACCOUNTANTS ON ACCOUNTING DISCLOSURES
None.None.
Item 9A. CONTROLS AND PROCEDURES
Evaluation of Disclosure Controls and Procedures
We maintain a system of disclosure controls and procedures (as defined in the Rules 13a-15(e) and 15(d)-15(e) under the Securities Exchange Act of 1934, as amended (the “Exchange Act”)) that is designed to ensure that information required to be disclosed in our Exchange Act reports is recorded, processed, summarized and reported within the time periods specified in the Securities and Exchange Commission’s rules and forms, and that such information is accumulated and communicated to our management, including our ChiefCo-Chief Executive OfficerOfficers and Chief Financial Officer, as appropriate, to allow timely decisions regarding required disclosures.
Under the supervision and with the participation of our management, including our ChiefCo-Chief Executive OfficerOfficers and Chief Financial Officer, we conducted an evaluation of our disclosure controls and procedures pursuant to Rule 13a-15 under the Exchange Act. Based upon the foregoing evaluation, our ChiefCo-Chief Executive OfficerOfficers and our Chief Financial Officer concluded that as of December 31, 20172021 our disclosure controls and procedures were effective at the reasonable assurance level.
Changes in Internal Control over Financial Reporting
On July 3, 2017,February 25, 2021, we completed the acquisition of Wunderlich and on June 1, 2017, we completed the acquisition of FBR.National Holdings Corporation (“National”). We are in the process of integrating Wunderlich and FBRNational and will be conducting an evaluation of internal control over financial reporting pursuant to the Sarbanes-Oxley Act of 2002. Excluding the Wunderlich and FBR acquisitions,National acquisition, there have not been any changes in our internal control over financial reporting (as such term is defined in Rules 13a-15(f) and 15d-15(f) under the Exchange Act) during the fourth fiscal quarter to which this report relates that materially affected, or are reasonably likely to materially affect, our internal control over financial reporting.
Report of Management on Internal Control over Financial Reporting
Our management is responsible for establishing and maintaining adequate internal control over financial reporting (as such term is defined in Rules 13a-15(f) and 15d-15(f) under the Exchange Act). Under the supervision and with the participation of management, including our ChiefCo-Chief Executive OfficerOfficers and Chief Financial Officer, we conducted an evaluation of the effectiveness of our internal control over financial reporting based on criteria established in Internal Control—Integrated Framework issued by the Committee of Sponsoring Organizations of the Treadway Commission (2013 framework) issued by the Committee of Sponsoring Organizations of the Treadway Commission. Based on our evaluation, our management concluded that our internal control over financial reporting was effective as of December 31, 2017.2021.
Management has excluded from its assessment of internal controlcontrols over financial reporting atas of December 31, 20172021 the internal control over financial reporting of Wunderlich and FBRNational and their subsidiaries, which we acquired in a purchase business combinationscombination on July 3, 2017 and June 1, 2017 respectively. Wunderlich’sFebruary 25, 2021. National’s total assets and total revenues represent 6.5%represents 2.6% and 12.9%18.0%, respectively, of our related consolidated financial statementstatements amounts as of and for the year ended December 31, 2017. FBR’s total assets and total revenues represent 68.7% and 26.4%, respectively, of our related consolidated financial statement amounts as of and for the year ended December 31, 2017.2021.
Our independent registered public accounting firm, Marcum LLP, has audited the effectiveness of our internal control over financial reporting as of December 31, 2017,2021, as stated in their report which is included in the Financial Statement SchedulesStatements of this Annual Report on Form 10-K.
Limitations on Effectiveness of Controls and Procedures
Our management, including our ChiefCo-Chief Executive OfficerOfficers and Chief Financial Officer, does not expect that our disclosure controls and procedures or our internal control over financial reporting will prevent or detect all errors and all fraud. A control system, no matter how well-designedwell- designed and operated, can provide only reasonable, not absolute, assurance that the control system’s objectives will be met. The design of a control system must reflect the fact that there are resource constraints, and the benefits of controls must be considered relative to their costs. Further, because of the inherent limitations in all control systems, no evaluation of controls can provide absolute assurance that misstatements due to error or fraud will not occur or that all control issues and instances of fraud, if any, have been detected. The design of any system of controls is based in part on certain assumptions about the likelihood of future events, and there can be no assurance that any design will succeed in achieving its stated goals under all potential future conditions. Projections of any evaluation of the effectiveness of controls to future periods are subject to risks. Over time, controls may become inadequate because of changes in conditions or deterioration in the degree of compliance with policies or procedures.
Item 9B. OTHER INFORMATION
None.
Item 9C. DISCLOSURE REGARDING FOREIGN JURISDICTIONS THAT PREVENT INSPECTIONS
None.
PART III
Item 10. DIRECTORS, EXECUTIVE OFFICERS AND CORPORATE GOVERNANCE
The information called for by this item is hereby incorporated by reference from our definitive Proxy Statement relating to the 20182022 Annual Meeting of Stockholders, which Proxy Statement is anticipated to be filed with the Securities and Exchange Commission within 120 days of December 31, 2017.2021.
Item 11. EXECUTIVE COMPENSATION
The information called for by this item is hereby incorporated by reference from our definitive Proxy Statement relating to the 20182022 Annual Meeting of Stockholders, which Proxy Statement is anticipated to be filed with the Securities and Exchange Commission within 120 days of December 31, 2017.2021.
Item 12. SECURITY OWNERSHIP OF CERTAIN BENEFICIAL OWNERS AND MANAGEMENT AND RELATED STOCKHOLDER MATTERS
The information called for by this item is hereby incorporated by reference from our definitive Proxy Statement relating to the 20182022 Annual Meeting of Stockholders, which Proxy Statement is anticipated to be filed with the Securities and Exchange Commission within 120 days of December 31, 2017.2021.
Item 13. CERTAIN RELATIONSHIPS AND RELATED TRANACTIONS, AND DIRECTOR INDEPENDENCE
The information called for by this item is hereby incorporated by reference from our definitive Proxy Statement relating to the 20182022 Annual Meeting of Stockholders, which Proxy Statement is anticipated to be filed with the Securities and Exchange Commission within 120 days of December 31, 2017.2021.
Item 14. 14. PRINCIPAL ACCOUNTINGACCOUNTANT FEES AND SERVICES
The information called for by this item is hereby incorporated by reference from our definitive Proxy Statement relating to the 20182022 Annual Meeting of Stockholders, which Proxy Statement is anticipated to be filed with the Securities and Exchange Commission within 120 days of December 31, 2017.2021.
PART IV
Item 15. EXHIBITS AND FINANCIAL STATEMENT SCHEDULES
| (a) | The following documents are filed as part of this report: |
| 1. | Financial Statements. The Company’s Consolidated Financial Statements |
| 2. | Financial Statement Schedules.Financial Statement Schedules other than those listed above have been omitted because they are either not applicable or the information is otherwise included in the consolidated financial statements or the notes thereto. |
Financial Statement Schedules other than those listed above have been omitted because they are either not applicable or the information is otherwise included in the consolidated financial statements or the notes thereto.
| (b) | Exhibits and Index to Exhibits, below. |
(c) Exhibit Index
Exhibit Index
| Incorporated by Reference | ||||||||
| Description | Form | Exhibit | Filing Date | |||||
| Inline XBRL Instance Document | ||||||||
| 101.SCH* | Inline XBRL Taxonomy Extension Schema Document | |||||||
| 101.CAL* | Inline XBRL Taxonomy Extension Calculation Linkbase Document | |||||||
| 101.DEF* | Inline XBRL Taxonomy Extension Definition Linkbase Document | |||||||
| 101.LAB* | Inline XBRL Taxonomy Extension Label Linkbase Document | |||||||
| 101.PRE* | Inline XBRL Taxonomy Extension Presentation Linkbase Document | |||||||
| 104 | Cover Page Interactive Data File (formatted as Inline XBRL and contained in Exhibit 101). | |||||||
| * | Filed herewith. |
| ** | Furnished herewith. |
| + | Schedules to this exhibit have been omitted pursuant to Item 601(b)(2) of Regulation S-K. The registrant hereby agrees to furnish a copy of any omitted schedules to the Securities and Exchange Commission upon request. |
| # | Management contract or compensatory plan or arrangement. |
| § | The Company has omitted certain information contained in this exhibit pursuant to Rule 601(b)(10) of Regulation S-K. The omitted information is not material and, if publicly disclosed, would likely cause competitive harm to the Company. Certain schedules and annexes to this exhibit have been omitted pursuant to Item 601(a)(5) of Regulation S-K. A copy of any omitted schedule and/or annex will be furnished to the U.S. Securities and Exchange Commission or its staff upon request. |
| ^ | Pursuant to Item 601(b)(10) of Regulation S-K, certain annexes to the agreement have not been filed herewith. The registrant agrees to furnish supplementally a copy of any omitted annex to the Securities and Exchange Commission upon request. |
Item 16. FORM 10-K SUMMARY
None.
None.
Pursuant to the requirements of Section 13 or 15(d) of the Securities Exchange Act of 1934, the registrant has duly caused this report to be signed on its behalf by the undersigned, thereunto duly authorized.
| B. Riley Financial, Inc. | |
| Date: | /s/ PHILLIP J. AHN |
| (Phillip J. Ahn, Chief Financial Officer and Chief Operating Officer) |
Pursuant to the requirements of the Securities Exchange Act of 1934, this report has been signed below by the following persons on behalf of the registrant and in the capacities and on the date indicated:
| Signature | Title | Date | ||
| /s/ BRYANT R. RILEY | ||||
| (Bryant R. Riley) | ||||
| /s/ | ||||
| ( | ||||
| /s/ | ||||
| ( | (Principal Financial Officer) | |||
| /s/ HOWARD E. WEITZMAN | Chief Accounting Officer (Principal Accounting Officer) | May 6, 2022 | ||
| (Howard E. Weitzman) | ||||
| /s/ | Director | |||
| ( | ||||
| /s/ | Director | |||
| ( | ||||
| /s/ | Director | |||
| ( | ||||
| /s/ | Director | |||
| ( | ||||
| /s/ | Director | |||
| ( | ||||
| /s/ | Director | |||
| ( | ||||
| /s/ | Director | |||
| ( | ||||
| /s/ MIKEL H. WILLIAMS | Director | May 6, 2022 | ||
| (Mikel H. Williams) |
B. RILEY FINANCIAL, INC.
INDEX TO CONSOLIDATED FINANCIAL STATEMENTS
REPORT OF INDEPENDENT REGISTERED PUBLIC ACCOUNTING FIRM
To the Shareholders and Board of Directors of
B. Riley Financial, Inc.
Opinion on the Financial Statements
We have audited the accompanying consolidated balance sheets of B. Riley Financial, Inc. and Subsidiaries (the “Company”) as of December 31, 20172021 and 2016, and2020, the related consolidated statements of income, comprehensive income, equity and cash flows for each of the three years in the period ended December 31, 2017,2021, and the related notes (collectively referred to as the “financial statements”). In our opinion, the financial statements present fairly, in all material respects, the financial position of the Company as of December 31, 20172021 and 2016,2020, and the consolidated results of its operations and its cash flows for each of the three years in the three year period ended December 31, 2017,2021, in conformity with accounting principles generally accepted in the United States of America.
We also have audited, in accordance with the standards of the Public Company Accounting Oversight Board (United States) (“PCAOB”("PCAOB"), the Company’sCompany's internal control over financial reporting as of December 31, 2017,2021, based on the criteria established in Internal Control - Integrated Framework issued by the Committee of Sponsoring Organizations of the Treadway Commission (COSO) in 2013 and our report dated March 13, 2018February 25, 2022, expressed an unqualified opinion on the effectiveness of the Company’s internal control over financial reporting.
Basis for Opinion
These financial statements are the responsibility of the Company’sCompany's management. Our responsibility is to express an opinion on the Company’sCompany's financial statements based on our audits. We are a public accounting firm registered with the PCAOB and are required to be independent with respect to the Company in accordance with the U.S. federal securities laws and the applicable rules and regulations of the Securities and Exchange Commission and the PCAOB.
We conducted our audits in accordance with the standards of the PCAOB. Those standards require that we plan and perform the audits to obtain reasonable assurance about whether the financial statements are free of material misstatement, whether due to error or fraud. Our audits included performing procedures to assess the risks of material misstatement of the financial statements, whether due to error or fraud, and performing procedures that respond to those risks. Such procedures included examining, on a test basis, evidence regarding the amounts and disclosures in the financial statements. Our audits also included evaluating the accounting principles used and significant estimates made by management, as well as evaluating the overall presentation of the financial statements. We believe that our audits provide a reasonable basis for our opinion.
Critical Audit Matters
The critical audit matters communicated below are matters arising from the current period audit of the financial statements that were communicated or required to be communicated to the audit committee and that: (1) relate to accounts or disclosures that are material to the financial statements and (2) involved our especially challenging, subjective, or complex judgments. The communication of critical audit matters does not alter in any way our opinion on the financial statements, taken as a whole, and we are not, by communicating the critical audit matters below, providing separate opinions on the critical audit matters or on the accounts or disclosures to which they relate.
Accounting for acquisition of National Holdings Corporation (“National”)
Description of the Matter
As discussed in Note 1 of the financial statements, the Company completed an acquisition of the remaining 55% of National outstanding shares that the Company did not previously own and settlement of outstanding share based awards amounting to approximately $35,314,000. The transaction was accounted for using the acquisition method of accounting whereby the total purchase price was allocated to tangible and intangible assets acquired and liabilities assumed based on their respective fair values. Auditing the Company's accounting for the acquisition of National was complex due to the significant estimates in determining the fair value of its identifiable intangible assets, which principally consisted of customer relationships and trademarks. The uncertainty of significant estimates was primarily due to the sensitivity of the underlying assumptions related to future performance of the acquired business. The significant assumptions used to estimate the fair value of the customer relationships included the future operating performance and cash flows generated by the customer relationships and a discount rate. The significant assumptions used to estimate the fair value of the trademarks included the projected revenues generated by the trademarks, a royalty rate, and a discount rate. These significant assumptions are forward looking and could be affected by future economic and market conditions.
How We Addressed the Matter in Our Audit
Our audit procedures related to the accounting for the acquisition of National to address this critical audit matter included the following:
| ● | We obtained an understanding, evaluated the design, and tested the operating effectiveness of controls over the Company’s accounting for acquisitions, including the valuation of identifiable intangible assets |
| ● | We tested the Company's controls over management’s review of the identifiable intangible asset valuation models, as well as the significant assumptions used in the valuation models. |
| ● | Additionally we read the purchase agreement to identify the significant terms, and tested management’s process for estimating the fair value of customer relationships and trademarks including: |
| o | We involved our valuation specialists to assist in our evaluation of the methodologies used by the Company and the significant assumptions included in the fair value estimates, which included guideline companies, discount rates, internal rate of return, weighted average cost of capital, weighted average return on assets. |
| o | We evaluated the reasonableness of management’s forecasts of future cash flows by comparing projections to historical results and applying a reasonable growth rate. |
| o | We compared the significant assumptions to the historical results of the acquired business and performed retrospective review of the actual results compared to the projected cash flows. |
Valuation of Certain Level 3 Investments
Description of the Matter
The Company estimates the fair value of certain investments and loans receivable utilizing valuation models with unobservable inputs. Unlike Level 1 and 2 inputs, Level 3 inputs are unobservable, supported by little or no market activity, and are significant to the fair value of certain investments and loans receivable. As of December 31, 2021, the Company had equity securities of $377,549,000 and loan receivables recorded at fair value of $873,186,000 utilizing Level 3 inputs.
Subjective and challenging judgment is required by management to determine the assumptions and valuation methodology to record financial assets at their fair value using Level 3 inputs. Auditing management’s models to determine the fair value of certain investments and loans receivable was complex and required judgment, particularly when evaluating inputs such as discount rates, projected EBITDA, multiples of EBITDA, projected revenue, multiples of revenue, multiple of PV-10, expected annualized volatility rates and market interest rates. These assumptions are affected by expectations about future economic and industry factors as well as estimates of the investee’s future growth.
How We Addressed the Matter in Our Audit
Our audit procedures related to the valuation of certain Level 3 Investments to address this critical audit matter included the following:
| ● | We obtained an understanding of the control environment, evaluating the design effectiveness, and testing the operating effectiveness of controls over the Company’s process to establish a valuation methodology and determine assumptions used in valuation models to record financial assets at their fair value. For example, we tested management’s review controls over the significant assumptions described above as well as over the data used in the valuation models. |
| ● | With assistance from our valuation specialists, we evaluated the reasonableness of the valuation methodology and significant assumptions; tested inputs for reasonableness, including discount rates, multiples of revenue, multiple of PV-10, expected annualized volatility rates and market interest rates; and corroborated with audit evidence from external sources or comparisons to other companies in the industry. |
| ● | We tested the Company's process used to develop the revenue, projected EBITDA, multiples of EBITDA, projected revenue, multiple of PV-10 and EBITDA projections evaluated audit evidence from events or transactions occurring after the measurement date for comparison to management’s estimate. |
Accounting for investments in variable interest entities
Description of the Matter
As discussed in Note 2 (ab) to the consolidated financial statements, the Company holds interests in various entities that meet the characteristics of a variable interest entity (“VIE”). The Company determines whether it is the primary beneficiary of a VIE at the time it becomes involved with a VIE, which requires consolidation based upon the following criteria:
| a) | the power to direct the activities of the entity that most significantly impact its economic success, |
| b) | the obligation to absorb the expected losses of the entity, or |
| c) | the right to receive the expected residual returns of the entity; or |
| d) | the voting rights of some investors in the entity are not proportional to their economic interests and the activities of the entity involve or are conducted on behalf of an investor with a disproportionately small voting interest. |
We identified the accounting for investments in variable interest entities to be a critical audit matter. Evaluating the Company’s judgments in determining whether an entity is a VIE and the primary beneficiary of each VIE required a high degree of complex auditor judgment.
How We Addressed the Matter in Our Audit
Our audit procedures related to the accounting for investments in variable interest entities to address this critical audit matter included the following:
| ● | We tested certain internal controls over the Company’s process to identify and account for a VIE. These included controls related to the consideration of various interests in an entity, and determining whether the Company is the primary beneficiary of the VIE. |
| ● | We obtained and read the agreements in which the Company evaluated and compared the terms of the agreements to the Company’s assessment. |
| ● | We reviewed the Company’s VIE analyses to determine if the VIE meets the criteria for consolidation in accordance with Accounting Standards Codification (“ASC”) 810, Consolidations. |
| ● | We evaluated the factors considered to determine whether the Company omitted any significant potential variable interests in their analyses. |
| /s/ Marcum LLP |
Marcum LLP
We have served as the Company’s auditor since 2009.
New York, NY
February 25, 2022
Marcum LLP
Melville, NYMarch 13, 2018
REPORT OF INDEPENDENT REGISTERED PUBLIC ACCOUNTING FIRM
ON
INTERNAL CONTROL OVER FINANCIAL REPORTING
To the Shareholders and Board of Directors of
B. Riley Financial, Inc.
Opinion on Internal Control over Financial Reporting
We have audited B. Riley Financial, Inc.’sInc.'s (the “Company”) internal control over financial reporting as of December 31, 2017,2021, based on criteria established inInternal Control-Integrated Framework (2013) issued by the Committee of Sponsoring Organizations of the Treadway Commission. In our opinion, the Company maintained, in all material respects, effective internal control over financial reporting as of December 31, 2017,2021, based on criteria established inInternal Control – Integrated Framework (2013) issued by the Committee of Sponsoring Organizations of the Treadway Commission.
We have also audited, in accordance with the standards of the Public Company Accounting Oversight Board (United States) (“PCAOB”), the consolidated balance sheets as of December 31, 20172021 and 2020 and the related consolidated statements of income, comprehensive income, equity, and cash flows and the related notes for each of the three years in the period ended December 31, 20172021 of the Company, and our report dated March 13, 2018February 25, 2022 expressed an unqualified opinion on those financial statements.
As described in “Management Annual Report on Internal Control over Financial Reporting”, management has excluded its subsidiaries, FBR & Co.subsidiary, National Holdings Corporation (“FBR”National”) and Wunderlich Investment Company, Inc. (“Wunderlich”), from its assessment of internal control over financial reporting as of December 31, 20172021 because these entities werethis entity was acquired by the Company in a purchase business combinationscombination during 2017.2021. We have also excluded FBR and WunderlichNational from our audit of internal control over financial reporting. These subsidiaries’This subsidiary’s combined total assets and total revenues represent approximately 75.2%2% and 39.3%18%, respectively, of the related consolidated financial statement amounts as of and for the year ended December 31, 2017.2021.
Basis for Opinion
The Company’sCompany's management is responsible for maintaining effective internal control over financial reporting, and for its assessment of the effectiveness of internal control over financial reporting, included in the accompanying"Management “Management Annual Report on Internal Control over Financial Reporting”. Our responsibility is to express an opinion on the Company’sCompany's internal control over financial reporting based on our audit. We are a public accounting firm registered with the PCAOB and are required to be independent with respect to the Company in accordance with the U.S. federal securities laws and the applicable rules and regulations of the Securities and Exchange Commission and the PCAOB.
We conducted our audit in accordance with the standards of the PCAOB. Those standards require that we plan and perform the audit to obtain reasonable assurance about whether effective internal control over financial reporting was maintained in all material respects. Our audit of internal control over financial reporting included obtaining an understanding of internal control over financial reporting, assessing the risk that a material weakness exists, and testing and evaluating the design and operating effectiveness of internal control based on the assessed risk. Our audit also included performing such other procedures as we considered necessary in the circumstances. We believe that our audit provides a reasonable basis for our opinion.
Definition and Limitations of Internal Control over Financial Reporting
A company’s internal control over financial reporting is a process designed to provide reasonable assurance regarding the reliability of financial reporting and the preparation of financial statements for external purposes in accordance with generally accepted accounting principles. A company’scompany's internal control over financial reporting includes those policies and procedures that (1) pertain to the maintenance of records that, in reasonable detail, accurately and fairly reflect the transactions and dispositions of the assets of the company; (2) provide reasonable assurance that transactions are recorded as necessary to permit preparation of financial statements in accordance with generally accepted accounting principles, and that receipts and expenditures of the company are being made only in accordance with authorizations of management and directors of the company; and (3) provide reasonable assurance regarding prevention or timely detection of unauthorized acquisition, use, or disposition of the company’s assets that could have a material effect on the financial statements.
Because of the inherent limitations, internal control over financial reporting may not prevent or detect misstatements. Also, projections of any evaluation of effectiveness to future periods are subject to the risk that controls may become inadequate because of changes in conditions, or that degree of compliance with the policies or procedures may deteriorate.
| /s/ Marcum LLP |
Marcum LLP
New York, NY
February 25, 2022
/s/ Marcumllp
Marcumllp
Melville, NY
March 13, 2018
PART IV. FINANCIAL INFORMATION
Item 15. Financial Statements.
B. RILEY FINANCIAL, INC. AND SUBSIDIARIES
Consolidated Balance Sheets
CONSOLIDATED BALANCE SHEETS
(Dollars in thousands, except par value)
| December 31, | December 31, | |||||||
| 2021 | 2020 | |||||||
| Assets | ||||||||
| Assets: | ||||||||
| Cash and cash equivalents | $ | 278,933 | $ | 103,602 | ||||
| Restricted cash | 927 | 1,235 | ||||||
| Due from clearing brokers | 29,657 | 7,089 | ||||||
| Securities and other investments owned, at fair value | 1,532,095 | 777,319 | ||||||
| Securities borrowed | 2,090,966 | 765,457 | ||||||
| Accounts receivable, net | 49,673 | 40,806 | ||||||
| Due from related parties | 2,074 | 986 | ||||||
| Loans receivable, at fair value (includes $167,744 and $295,809 from related parties as of December 31, 2021 and 2020, respectively) | 873,186 | 390,689 | ||||||
| Prepaid expenses and other assets | 463,502 | 93,174 | ||||||
| Operating lease right-of-use assets | 56,969 | 48,799 | ||||||
| Property and equipment, net | 12,870 | 11,685 | ||||||
| Goodwill | 250,568 | 227,046 | ||||||
| Other intangible assets, net | 207,651 | 190,745 | ||||||
| Deferred tax assets, net | 2,848 | 4,098 | ||||||
| Total assets | $ | 5,851,919 | $ | 2,662,730 | ||||
| Liabilities and Equity | ||||||||
| Liabilities: | ||||||||
| Accounts payable | $ | 6,326 | $ | 2,722 | ||||
| Accrued expenses and other liabilities | 343,750 | 173,178 | ||||||
| Deferred revenue | 69,507 | 68,651 | ||||||
| Deferred tax liabilities, net | 93,055 | 34,248 | ||||||
| Due to related parties and partners | — | 327 | ||||||
| Due to clearing brokers | 69,398 | 13,672 | ||||||
| Securities sold not yet purchased | 28,623 | 10,105 | ||||||
| Securities loaned | 2,088,685 | 759,810 | ||||||
| Operating lease liabilities | 69,072 | 60,778 | ||||||
| Notes payable | 357 | 37,967 | ||||||
| Loan participations sold | — | 17,316 | ||||||
| Revolving credit facility | 80,000 | — | ||||||
| Term loans | 346,385 | 74,213 | ||||||
| Senior notes payable, net | 1,606,560 | 870,783 | ||||||
| Total liabilities | 4,801,718 | 2,123,770 | ||||||
| Commitments and contingencies (Note 17) | ||||||||
| Redeemable noncontrolling interests in equity of subsidiaries | 345,000 | — | ||||||
| B. Riley Financial, Inc. stockholders’ equity: | ||||||||
| Preferred stock, $0.0001 par value; 1,000,000 shares authorized; 4,512 and 3,971 shares issued and outstanding as of December 31, 2021 and 2020, respectively; liquidation preference of $112,790 and $99,260 as of December 31, 2021 and 2020, respectively. | — | — | ||||||
| Common stock, $0.0001 par value; 100,000,000 shares authorized; 27,591,028 and 25,777,796 shares issued and outstanding as of December 31, 2021 and 2020, respectively. | 3 | 3 | ||||||
| Additional paid-in capital | 413,486 | 310,326 | ||||||
| Retained earnings | 248,862 | 203,080 | ||||||
| Accumulated other comprehensive loss | (1,080 | ) | (823 | ) | ||||
| Total B. Riley Financial, Inc. stockholders’ equity | 661,271 | 512,586 | ||||||
| Noncontrolling interests | 43,930 | 26,374 | ||||||
| Total equity | 705,201 | 538,960 | ||||||
| Total liabilities and equity | $ | 5,851,919 | $ | 2,662,730 | ||||
| December 31, | December 31, | |||||||
| 2017 | 2016 | |||||||
| Assets | ||||||||
| Assets | ||||||||
| Cash and cash equivalents | $ | 132,823 | $ | 112,105 | ||||
| Restricted cash | 19,711 | 3,294 | ||||||
| Due from clearing brokers | 31,479 | — | ||||||
| Securities and other investments owned, at fair value | 145,360 | 16,579 | ||||||
| Securities borrowed | 807,089 | — | ||||||
| Accounts receivable, net | 20,015 | 18,989 | ||||||
| Due from related parties | 5,689 | 3,009 | ||||||
| Advances against customer contracts | 5,208 | 427 | ||||||
| Prepaid expenses and other assets | 22,605 | 5,742 | ||||||
| Property and equipment, net | 11,977 | 5,785 | ||||||
| Goodwill | 98,771 | 48,903 | ||||||
| Other intangible assets, net | 56,948 | 41,166 | ||||||
| Deferred income taxes | 29,229 | 8,619 | ||||||
| Total assets | $ | 1,386,904 | $ | 264,618 | ||||
| Liabilities and Equity | ||||||||
| Liabilities | ||||||||
| Accounts payable | $ | 2,650 | $ | 2,703 | ||||
| Accrued expenses and other liabilities | 71,685 | 53,168 | ||||||
| Deferred revenue | 3,141 | 4,130 | ||||||
| Due to partners | 1,578 | 10,037 | ||||||
| Securities sold not yet purchased | 28,291 | 846 | ||||||
| Securities loaned | 803,371 | — | ||||||
| Mandatorily redeemable noncontrolling interests | 4,478 | 4,019 | ||||||
| Acquisition consideration payable | — | 10,381 | ||||||
| Notes payable | 2,243 | — | ||||||
| Senior notes payable | 203,621 | 27,700 | ||||||
| Contingent consideration | — | 1,242 | ||||||
| Total liabilities | 1,121,058 | 114,226 | ||||||
| Commitments and contingencies | ||||||||
| B. Riley Financial, Inc. stockholders’ equity: | ||||||||
| Preferred stock, $0.0001 par value; 1,000,000 shares authorized; none issued | — | — | ||||||
| Common stock, $0.0001 par value; 40,000,000 shares authorized; 26,569,462 and 19,140,342 issued and outstanding as of December 31, 2017 and December 31, 2016, respectively | 2 | 2 | ||||||
| Additional paid-in capital | 259,980 | 141,170 | ||||||
| Retained earnings | 6,582 | 9,887 | ||||||
| Accumulated other comprehensive loss | (534 | ) | (1,712 | ) | ||||
| Total B. Riley Financial, Inc. stockholders’ equity | 266,030 | 149,347 | ||||||
| Noncontrolling interests | (184 | ) | 1,045 | |||||
| Total equity | 265,846 | 150,392 | ||||||
| Total liabilities and equity | $ | 1,386,904 | $ | 264,618 | ||||
The accompanying notes are an integral part of these consolidated financial statements.
B. RILEY FINANCIAL, INC. AND SUBSIDIARIES
Consolidated Statements of Income
CONSOLIDATED STATEMENTS OF INCOME
(Dollars in thousands, except share data)
| Year Ended December 31, | ||||||||||||
| 2017 | 2016 | 2015 | ||||||||||
| Revenues: | ||||||||||||
| Services and fees | $ | 304,841 | $ | 164,235 | $ | 101,929 | ||||||
| Interest income - Securities lending | 17,028 | — | — | |||||||||
| Sale of goods | 307 | 26,116 | 10,596 | |||||||||
| Total revenues | 322,176 | 190,351 | 112,525 | |||||||||
| Operating expenses: | ||||||||||||
| Direct cost of services | 55,501 | 40,857 | 29,049 | |||||||||
| Cost of goods sold | 398 | 14,755 | 3,072 | |||||||||
| Selling, general and administrative expenses | 213,008 | 82,127 | 58,322 | |||||||||
| Restructuring charge | 12,374 | 3,887 | — | |||||||||
| Interest expense - Securities lending | 12,051 | — | — | |||||||||
| Total operating expenses | 293,332 | 141,626 | 90,443 | |||||||||
| Operating income | 28,844 | 48,725 | 22,082 | |||||||||
| Other income (expense): | ||||||||||||
| Interest income | 420 | 318 | 17 | |||||||||
| Loss from equity investment | (437 | ) | — | — | ||||||||
| Interest expense | (8,382 | ) | (1,996 | ) | (834 | ) | ||||||
| Income before income taxes | 20,445 | 47,047 | 21,265 | |||||||||
| Provision for income taxes | (8,510 | ) | (14,321 | ) | (7,688 | ) | ||||||
| Net income | 11,935 | 32,726 | 13,577 | |||||||||
| Net income attributable to noncontrolling interests | 379 | 11,200 | 1,772 | |||||||||
| Net income attributable to B. Riley Financial, Inc. | $ | 11,556 | $ | 21,526 | $ | 11,805 | ||||||
| Basic income per share | $ | 0.50 | $ | 1.19 | $ | 0.73 | ||||||
| Diluted income per share | $ | 0.48 | $ | 1.17 | $ | 0.73 | ||||||
| Cash dividends per share | $ | 0.67 | $ | 0.28 | $ | 0.32 | ||||||
| Weighted average basic shares outstanding | 23,181,388 | 18,106,621 | 16,221,040 | |||||||||
| Weighted average diluted shares outstanding | 24,290,904 | 18,391,852 | 16,265,915 | |||||||||
| Year Ended December 31, | ||||||||||||
| 2021 | 2020 | 2019 | ||||||||||
| Revenues: | ||||||||||||
| Services and fees | $ | 1,172,957 | $ | 667,069 | $ | 460,493 | ||||||
| Trading income and fair value adjustments on loans | 386,676 | 104,018 | 106,463 | |||||||||
| Interest income - Loans and securities lending | 122,723 | 102,499 | 77,221 | |||||||||
| Sale of goods | 58,205 | 29,135 | 7,935 | |||||||||
| Total revenues | 1,740,561 | 902,721 | 652,112 | |||||||||
| Operating expenses: | ||||||||||||
| Direct cost of services | 54,390 | 60,451 | 58,824 | |||||||||
| Cost of goods sold | 26,953 | 12,460 | 7,575 | |||||||||
| Selling, general and administrative expenses | 906,196 | 428,537 | 385,219 | |||||||||
| Restructuring charge | — | 1,557 | 1,699 | |||||||||
| Impairment of tradenames | — | 12,500 | — | |||||||||
| Interest expense - Securities lending and loan participations sold | 52,631 | 42,451 | 32,144 | |||||||||
| Total operating expenses | 1,040,170 | 557,956 | 485,461 | |||||||||
| Operating income | 700,391 | 344,765 | 166,651 | |||||||||
| Other income (expense): | ||||||||||||
| Interest income | 229 | 564 | 1,577 | |||||||||
| Gain on extinguishment of loans and other | 3,796 | — | — | |||||||||
| Income (loss) from equity investments | 2,801 | (623 | ) | (1,431 | ) | |||||||
| Interest expense | (92,455 | ) | (65,249 | ) | (50,205 | ) | ||||||
| Income before income taxes | 614,762 | 279,457 | 116,592 | |||||||||
| Provision for income taxes | (163,960 | ) | (75,440 | ) | (34,644 | ) | ||||||
| Net income | 450,802 | 204,017 | 81,948 | |||||||||
| Net income (loss) attributable to noncontrolling interests | 5,748 | (1,131 | ) | 337 | ||||||||
| Net income attributable to B. Riley Financial, Inc. | 445,054 | 205,148 | 81,611 | |||||||||
| Preferred stock dividends | 7,457 | 4,710 | 264 | |||||||||
| Net income available to common shareholders | $ | 437,597 | $ | 200,438 | $ | 81,347 | ||||||
| Basic income per common share | $ | 15.99 | $ | 7.83 | $ | 3.08 | ||||||
| Diluted income per common share | $ | 15.09 | $ | 7.56 | $ | 2.95 | ||||||
| Weighted average basic common shares outstanding | 27,366,292 | 25,607,278 | 26,401,036 | |||||||||
| Weighted average diluted common shares outstanding | 29,005,602 | 26,508,397 | 27,529,157 | |||||||||
The accompanying notes are an integral part of these consolidated financial statements.
B. RILEY FINANCIAL, INC. AND SUBSIDIARIES
Consolidated Statements of Comprehensive Income
CONSOLIDATED STATEMENTS OF COMPHREHENSIVE INCOME
(Dollars in thousands)
| Year Ended December 31, | ||||||||||||
| 2021 | 2020 | 2019 | ||||||||||
| Net income | $ | 450,802 | $ | 204,017 | $ | 81,948 | ||||||
| Other comprehensive income (loss): | ||||||||||||
| Change in cumulative translation adjustment | (257 | ) | 1,165 | 173 | ||||||||
| Other comprehensive income (loss), net of tax | (257 | ) | 1,165 | 173 | ||||||||
| Total comprehensive income | 450,545 | 205,182 | 82,121 | |||||||||
| Comprehensive income (loss) attributable to noncontrolling interests | 5,748 | (1,131 | ) | 337 | ||||||||
| Comprehensive income attributable to B. Riley Financial, Inc. | $ | 444,797 | $ | 206,313 | $ | 81,784 | ||||||
| Year Ended December 31, | ||||||||||||
| 2017 | 2016 | 2015 | ||||||||||
| Net income | $ | 11,935 | $ | 32,726 | $ | 13,577 | ||||||
| Other comprehensive income (loss): | ||||||||||||
| Change in cumulative translation adjustment | 1,178 | (654 | ) | (410 | ) | |||||||
| Other comprehensive income (loss), net of tax | 1,178 | (654 | ) | (410 | ) | |||||||
| Total comprehensive income | 13,113 | 32,072 | 13,167 | |||||||||
| Comprehensive income attributable to noncontrolling interests | 379 | 11,200 | 1,772 | |||||||||
| Comprehensive income attributable to B. Riley Financial, Inc. | $ | 12,734 | $ | 20,872 | $ | 11,395 | ||||||
The accompanying notes are an integral part of these consolidated financial statements.
B. RILEY FINANCIAL, INC. AND SUBSIDIARIES
Consolidated Statements of Equity
CONSOLIDATED STATEMENTS OF EQUITY
(Dollars in thousands)thousands, except share data)
| Accumulated | ||||||||||||||||||||||||||||||||||||
| Additional | Retained | Other | ||||||||||||||||||||||||||||||||||
| Preferred Stock | Common Stock | Paid-in | Earnings | Comprehensive | Noncontrolling | Total | ||||||||||||||||||||||||||||||
| Shares | Amount | Shares | Amount | Capital | (Deficit) | Loss | Interests | Equity | ||||||||||||||||||||||||||||
| Balance, January 1, 2015 | — | $ | — | 15,968,607 | $ | 2 | $ | 110,598 | $ | (12,891 | ) | $ | (648 | ) | $ | 18 | $ | 97,079 | ||||||||||||||||||
| Issuance of common stock for acquisition of MK Capital Advisors, LLC and contingent equity consideration on February 2, 2015 | — | — | 333,333 | — | 4,657 | — | — | — | 4,657 | |||||||||||||||||||||||||||
| Vesting of restricted stock, net of shares withheld for employer taxes | — | — | 146,179 | — | (499 | ) | — | — | — | (499 | ) | |||||||||||||||||||||||||
| Share based payments | — | — | — | — | 2,043 | — | — | — | 2,043 | |||||||||||||||||||||||||||
| Dividends on common stock | — | — | — | — | — | (5,219 | ) | — | — | (5,219 | ) | |||||||||||||||||||||||||
| Net income | — | — | — | — | — | 11,805 | — | 1,772 | 13,577 | |||||||||||||||||||||||||||
| Distributions to noncontrolling interests | — | — | — | — | — | — | — | (1,908 | ) | (1,908 | ) | |||||||||||||||||||||||||
| Foreign currency translation adjustment | — | — | — | — | — | — | (410 | ) | — | (410 | ) | |||||||||||||||||||||||||
| Balance, December 31, 2015 | — | $ | — | 16,448,119 | $ | 2 | $ | 116,799 | $ | (6,305 | ) | $ | (1,058 | ) | $ | (118 | ) | $ | 109,320 | |||||||||||||||||
| Issuance of common stock for acquisition of MK Capital, LLC - contingent equity consideration on February 2, 2016 | — | — | 166,667 | — | — | — | — | — | — | |||||||||||||||||||||||||||
| Vesting of restricted stock, net of shares withheld for employer taxes | — | — | 104,576 | — | (1,156 | ) | — | — | — | (1,156 | ) | |||||||||||||||||||||||||
| Offering of common stock, net of offering expenses | — | — | 2,420,980 | — | 22,759 | — | — | — | 22,759 | |||||||||||||||||||||||||||
| Share based payments | — | — | — | — | 2,768 | — | — | — | 2,768 | |||||||||||||||||||||||||||
| Dividends on common stock | — | — | — | — | — | (5,334 | ) | — | — | (5,334 | ) | |||||||||||||||||||||||||
| Net income | — | — | — | — | — | 21,526 | — | 1,163 | 22,689 | |||||||||||||||||||||||||||
| Foreign currency translation adjustment | — | — | — | — | — | — | (654 | ) | — | (654 | ) | |||||||||||||||||||||||||
| Balance, December 31, 2016 | — | $ | — | 19,140,342 | $ | 2 | $ | 141,170 | $ | 9,887 | $ | (1,712 | ) | $ | 1,045 | $ | 150,392 | |||||||||||||||||||
| Issuance of common stock for acquisition of MK Capital, LLC - contingent equity consideration on February 2, 2017 | — | — | 166,666 | — | 1,151 | — | — | — | 1,151 | |||||||||||||||||||||||||||
| Issuance of common stock for acquisition of Dialectic general partner interests on April 13, 2017 | — | — | 158,484 | — | 1,952 | — | — | — | 1,952 | |||||||||||||||||||||||||||
| Issuance of common stock for acquisition of FBR & Co. on June 1, 2017 | — | — | 4,779,354 | — | 73,471 | — | — | — | 73,471 | |||||||||||||||||||||||||||
| Issuance of common stock and common stock warrants for acquisition of Wunderlich on July 3, 2017 | — | — | 1,974,812 | — | 35,381 | — | — | — | 35,381 | |||||||||||||||||||||||||||
| Vesting of restricted stock, net of shares withheld for employer taxes | — | — | 349,804 | — | (3,486 | ) | — | — | — | (3,486 | ) | |||||||||||||||||||||||||
| Share based payments | — | — | — | — | 10,341 | — | — | — | 10,341 | |||||||||||||||||||||||||||
| Dividends on common stock | — | — | — | — | — | (14,861 | ) | — | — | (14,861 | ) | |||||||||||||||||||||||||
| Net income | — | — | — | — | — | 11,556 | — | (307 | ) | 11,249 | ||||||||||||||||||||||||||
| Distributions to noncontrolling interests | — | — | — | — | — | — | — | (922 | ) | (922 | ) | |||||||||||||||||||||||||
| Foreign currency translation adjustment | — | — | — | — | — | — | 1,178 | — | 1,178 | |||||||||||||||||||||||||||
| Balance, December 31, 2017 | — | $ | — | 26,569,462 | $ | 2 | $ | 259,980 | $ | 6,582 | $ | (534 | ) | $ | (184 | ) | $ | 265,846 | ||||||||||||||||||
| Accumulated | ||||||||||||||||||||||||||||||||||||||||
| Additional | Other | |||||||||||||||||||||||||||||||||||||||
| Preferred Stock | Common Stock | Paid-in | Retained | Comprehensive | Noncontrolling | Total | ||||||||||||||||||||||||||||||||||
| Shares | Amount | Shares | Amount | Capital | Earnings | Loss | Interests | Equity | ||||||||||||||||||||||||||||||||
| Balance, January 1, 2019 | - | $ | - | 26,603,355 | $ | 2 | $ | 258,638 | $ | 1,579 | $ | (2,161 | ) | $ | 602 | $ | 258,660 | |||||||||||||||||||||||
| Common stock issued | — | — | 2,248 | — | 63 | — | — | — | 63 | |||||||||||||||||||||||||||||||
| Preferred stock issued | 2,349 | — | — | — | 56,566 | — | — | — | 56,566 | |||||||||||||||||||||||||||||||
| Issuance of common stock warrant for | ||||||||||||||||||||||||||||||||||||||||
| purchase of BR Brand Holdings, LLC | — | — | — | — | 990 | — | — | — | 990 | |||||||||||||||||||||||||||||||
| ESPP shares issued and vesting of | ||||||||||||||||||||||||||||||||||||||||
| restricted stock, net of shares | ||||||||||||||||||||||||||||||||||||||||
| withheld for employer taxes | — | — | 604,661 | 1 | (2,014 | ) | — | — | — | (2,013 | ) | |||||||||||||||||||||||||||||
| Common stock repurchased and retired | — | — | (237,932 | ) | — | (4,273 | ) | — | — | — | (4,273 | ) | ||||||||||||||||||||||||||||
| Warrants repurchased and retired | — | — | — | — | (2,777 | ) | — | — | — | (2,777 | ) | |||||||||||||||||||||||||||||
| Share based payments | — | — | — | — | 15,916 | — | — | — | 15,916 | |||||||||||||||||||||||||||||||
| Dividends on common stock | ||||||||||||||||||||||||||||||||||||||||
| ($1.49 per share) | — | — | — | — | — | (43,390 | ) | — | — | (43,390 | ) | |||||||||||||||||||||||||||||
| Dividends on preferred stock | — | — | — | — | — | (264 | ) | — | — | (264 | ) | |||||||||||||||||||||||||||||
| Net income | — | — | — | — | — | 81,611 | — | 337 | 81,948 | |||||||||||||||||||||||||||||||
| Distributions to noncontrolling interests | — | — | — | — | — | — | — | (721 | ) | (721 | ) | |||||||||||||||||||||||||||||
| Noncontrolling interest from purchase | — | — | — | — | — | — | — | 29,373 | 29,373 | |||||||||||||||||||||||||||||||
| of BR Brand Holdings, LLC | ||||||||||||||||||||||||||||||||||||||||
| Foreign currency translation adjustment | — | — | — | — | — | — | 173 | — | 173 | |||||||||||||||||||||||||||||||
| Balance, December 31, 2019 | 2,349 | $ | — | 26,972,332 | $ | 3 | $ | 323,109 | $ | 39,536 | $ | (1,988 | ) | $ | 29,591 | $ | 390,251 | |||||||||||||||||||||||
| Preferred stock issued | 1,622 | — | — | — | 39,455 | — | — | — | 39,455 | |||||||||||||||||||||||||||||||
| ESPP shares issued and vesting of | ||||||||||||||||||||||||||||||||||||||||
| restricted stock, net of shares | ||||||||||||||||||||||||||||||||||||||||
| withheld for employer taxes | — | — | 1,358,212 | — | (22,578 | ) | — | — | — | (22,578 | ) | |||||||||||||||||||||||||||||
| Common stock repurchased and retired | — | — | (2,552,748 | ) | — | (48,248 | ) | — | — | — | (48,248 | ) | ||||||||||||||||||||||||||||
| Share based payments | — | — | — | — | 18,588 | — | — | — | 18,588 | |||||||||||||||||||||||||||||||
| Dividends on common stock | — | — | — | — | — | (36,894 | ) | — | — | (36,894 | ) | |||||||||||||||||||||||||||||
| ($1.325 per share) | ||||||||||||||||||||||||||||||||||||||||
| Dividends on preferred stock | — | — | — | — | — | (4,710 | ) | — | — | (4,710 | ) | |||||||||||||||||||||||||||||
| Net income (loss) | — | — | — | — | — | 205,148 | — | (1,131 | ) | 204,017 | ||||||||||||||||||||||||||||||
| Distributions to noncontrolling interests | — | — | — | — | — | — | — | (2,690 | ) | (2,690 | ) | |||||||||||||||||||||||||||||
| Contributions from noncontrolling interests | — | — | — | — | — | — | — | 604 | 604 | |||||||||||||||||||||||||||||||
| Foreign currency translation adjustment | — | — | — | — | — | — | 1,165 | — | 1,165 | |||||||||||||||||||||||||||||||
| Balance, December 31, 2020 | 3,971 | $ | — | 25,777,796 | $ | 3 | $ | 310,326 | $ | 203,080 | $ | (823 | ) | $ | 26,374 | $ | 538,960 | |||||||||||||||||||||||
| Common stock issued, net of offering costs | — | — | 1,413,045 | $ | — | 64,713 | — | — | — | 64,713 | ||||||||||||||||||||||||||||||
| Preferred stock issued | 541 | — | — | — | 14,712 | — | — | — | 14,712 | |||||||||||||||||||||||||||||||
| ESPP shares issued and vesting of | ||||||||||||||||||||||||||||||||||||||||
| restricted stock and other, net of | ||||||||||||||||||||||||||||||||||||||||
| shares withheld for employer taxes | — | — | 433,182 | — | (9,620 | ) | — | — | — | (9,620 | ) | |||||||||||||||||||||||||||||
| Common stock repurchased and retired | — | — | (44,650 | ) | — | (2,656 | ) | — | — | — | (2,656 | ) | ||||||||||||||||||||||||||||
| Warrants exercised | — | — | 11,655 | — | — | — | — | — | — | |||||||||||||||||||||||||||||||
| Share based payments | — | — | — | — | 36,011 | — | — | — | 36,011 | |||||||||||||||||||||||||||||||
| Dividends on common stock ($12.50 per share) | — | — | — | — | — | (373,633 | ) | — | — | (373,633 | ) | |||||||||||||||||||||||||||||
| Dividends on preferred stock | — | — | — | — | — | (7,457 | ) | — | — | (7,457 | ) | |||||||||||||||||||||||||||||
| Net income | — | — | — | — | — | 445,054 | — | 5,748 | 450,802 | |||||||||||||||||||||||||||||||
| Remeasurement of B. Riley Principal 150 | ||||||||||||||||||||||||||||||||||||||||
| and 250 Merger Corporations | ||||||||||||||||||||||||||||||||||||||||
| subsidiary temporary equity | — | — | — | — | — | (18,182 | ) | — | �� | (18,182 | ) | |||||||||||||||||||||||||||||
| Distributions to noncontrolling interests | — | — | — | — | — | — | — | (15,497 | ) | (15,497 | ) | |||||||||||||||||||||||||||||
| Contributions from noncontrolling interests | — | — | — | — | — | — | — | 13,680 | 13,680 | |||||||||||||||||||||||||||||||
| Acquisition of noncontrolling interests | — | — | — | — | — | — | — | 13,625 | 13,625 | |||||||||||||||||||||||||||||||
| Other comprehensive loss | — | — | — | — | — | — | (257 | ) | — | (257 | ) | |||||||||||||||||||||||||||||
| Balance, December 31, 2021 | 4,512 | $ | — | 27,591,028 | $ | 3 | $ | 413,486 | $ | 248,862 | $ | (1,080 | ) | $ | 43,930 | $ | 705,201 | |||||||||||||||||||||||
The accompanying notes are an integral part of these consolidated financial statements.
B. RILEY FINANCIAL, INC. AND SUBSIDIARIES
Consolidated Statements of Cash Flows
CONSOLDIATED STATEMENTS OF CASH FLOWS
(Dollars in thousands)
| Year Ended December 31, | ||||||||||||
| 2021 | 2020 | 2019 | ||||||||||
| Cash flows from operating activities: | (Revised - See Note 23) | (Revised - See Note 23) | ||||||||||
| Net income | $ | 450,802 | $ | 204,017 | $ | 81,948 | ||||||
| Adjustments to reconcile net income to net cash provided by (used in) operating activities: | ||||||||||||
| Depreciation and amortization | 25,871 | 19,369 | 19,048 | |||||||||
| Provision for doubtful accounts | 1,453 | 3,385 | 2,126 | |||||||||
| Share-based compensation | 36,011 | 18,588 | 15,916 | |||||||||
| Fair value adjustments, non-cash | (7,562 | ) | 21,954 | 12,258 | ||||||||
| Non-cash interest and other | (22,322 | ) | (16,810 | ) | (12,267 | ) | ||||||
| Effect of foreign currency on operations | 127 | (460 | ) | (78 | ) | |||||||
| (Income) loss from equity investments | (2,801 | ) | 623 | 1,431 | ||||||||
| Dividends from equity investments | 2,136 | 1,343 | 3,194 | |||||||||
| Deferred income taxes | 61,770 | 61,619 | 10,874 | |||||||||
| Impairment of leaseholds and intangibles, lease loss accrual and gain on disposal of fixed assets | (137 | ) | 14,107 | (286 | ) | |||||||
| Gain on extinguishment of loans | (6,509 | ) | — | — | ||||||||
| Loss (gain) on extinguishment of debt | 6,131 | (1,556 | ) | — | ||||||||
| Gain on equity investment | (3,544 | ) | — | — | ||||||||
| Income allocated and fair value adjustment for mandatorily redeemable noncontrolling interests | 857 | 1,230 | 1,220 | |||||||||
| Change in operating assets and liabilities: | ||||||||||||
| Amounts due to/from clearing brokers | 40,628 | 30,401 | 13,920 | |||||||||
| Securities and other investments owned | (581,785 | ) | (331,759 | ) | (178,023 | ) | ||||||
| Securities borrowed | (1,325,509 | ) | 48,873 | 117,015 | ||||||||
| Accounts receivable and advances against customer contracts | (715 | ) | 18,776 | (37,637 | ) | |||||||
| Prepaid expenses and other assets | (3,737 | ) | 10,135 | 13,298 | ||||||||
| Accounts payable, accrued payroll and related expenses, accrued expenses and other liabilities | 37,798 | 31,301 | 32,553 | |||||||||
| Amounts due to/from related parties and partners | (1,415 | ) | 3,423 | (4,781 | ) | |||||||
| Securities sold, not yet purchased | 18,011 | (31,715 | ) | 4,197 | ||||||||
| Deferred revenue | (3,540 | ) | 1,530 | (3,098 | ) | |||||||
| Securities loaned | 1,328,875 | (50,685 | ) | (120,026 | ) | |||||||
| Net cash provided by (used in) operating activities | 50,894 | 57,689 | (27,198 | ) | ||||||||
| Cash flows from investing activities: | ||||||||||||
| Purchases of loans receivable | (738,909 | ) | (207,466 | ) | (343,811 | ) | ||||||
| Repayments of loans receivable | 172,119 | 90,083 | 159,186 | |||||||||
| Sale of loan receivable to related party | — | 1,800 | — | |||||||||
| Proceeds from loan participations sold | — | 6,900 | 31,806 | |||||||||
| Repayment of loan participations sold | (15,216 | ) | (2,233 | ) | (18,911 | ) | ||||||
| Asset acquisition - BR Brand, net of cash acquired $2,160 | — | — | (114,912 | ) | ||||||||
| Acquisition of businesses, net of $34,942 cash acquired in 2021 | (28,254 | ) | (1,500 | ) | — | |||||||
| Proceeds from sale of division of magicJack | — | — | 6,196 | |||||||||
| Purchases of property, equipment and intangible assets | (676 | ) | (2,045 | ) | (3,461 | ) | ||||||
| Proceeds from sale of property, equipment and intangible assets | 14 | 1 | 513 | |||||||||
| Funds received from trust account of subsidiary | — | 320,500 | — | |||||||||
| Investment of subsidiaries initial public offering proceeds into trust account | (345,000 | ) | (176,750 | ) | (143,750 | ) | ||||||
| Purchases of equity investments | (612 | ) | (7,500 | ) | (28,757 | ) | ||||||
| Distributions from equity investments | — | — | 18,195 | |||||||||
| Net cash (used in) provided by investing activities | (956,534 | ) | 21,790 | (437,706 | ) | |||||||
| Cash flows from financing activities: | ||||||||||||
| Proceeds from revolving line of credit, net | 80,000 | — | — | |||||||||
| Proceeds from asset based credit facility | — | — | 140,439 | |||||||||
| Repayment of asset based credit facility | — | (37,096 | ) | (103,343 | ) | |||||||
| Repayment of notes payable | (37,610 | ) | (357 | ) | (478 | ) | ||||||
| Payment of participating note payable and contingent consideration | (3,714 | ) | (4,250 | ) | (4,250 | ) | ||||||
| Proceeds from term loan | 300,000 | 75,000 | 10,000 | |||||||||
| Repayment of term loan | (20,684 | ) | (67,266 | ) | (22,734 | ) | ||||||
| Proceeds from issuance of senior notes | 1,249,083 | 186,796 | 281,924 | |||||||||
| Redemption of senior notes | (507,348 | ) | (1,829 | ) | (52,154 | ) | ||||||
| Payment of debt issuance and offering costs | (33,377 | ) | (9,845 | ) | (8,059 | ) | ||||||
| Payment of employment taxes on vesting of restricted stock | (9,620 | ) | (22,578 | ) | (2,022 | ) | ||||||
| Common dividends paid | (347,135 | ) | (38,792 | ) | (41,138 | ) | ||||||
| Preferred dividends paid | (7,457 | ) | (4,710 | ) | (264 | ) | ||||||
| Repurchase of common stock | (2,656 | ) | (48,248 | ) | (4,273 | ) | ||||||
| Repurchase of warrants | — | — | (2,777 | ) | ||||||||
| Distribution to noncontrolling interests | (16,542 | ) | (3,826 | ) | (1,958 | ) | ||||||
| Contributions from noncontrolling interests | 13,680 | 604 | — | |||||||||
| Redemption of subsidiary temporary equity and distributions | — | (318,750 | ) | |||||||||
| Proceeds from initial public offering of subsidiaries | 345,000 | 175,000 | 143,750 | |||||||||
| Proceeds from offering common stock | 64,713 | — | 63 | |||||||||
| Proceeds from offering preferred stock | 14,712 | 39,455 | 56,566 | |||||||||
| Net cash provided by (used in) financing activities | 1,081,045 | (80,692 | ) | 389,292 | ||||||||
| Increase (decrease) in cash, cash equivalents and restricted cash | 175,405 | (1,213 | ) | (75,612 | ) | |||||||
| Effect of foreign currency on cash, cash equivalents and restricted cash | (382 | ) | 1,311 | 73 | ||||||||
| Net increase (decrease) in cash, cash equivalents and restricted cash | 175,023 | 98 | (75,539 | ) | ||||||||
| Cash, cash equivalents and restricted cash, beginning of year | 104,837 | 104,739 | 180,278 | |||||||||
| Cash, cash equivalents and restricted cash, end of year | $ | 279,860 | $ | 104,837 | $ | 104,739 | ||||||
| Supplemental disclosures: | ||||||||||||
| Interest paid | $ | 138,369 | $ | 98,595 | $ | 75,625 | ||||||
| Taxes paid | $ | 88,153 | $ | 2,368 | $ | 8,649 | ||||||
| Year ended December 31, | ||||||||||||
| 2017 | 2016 | 2015 | ||||||||||
| Cash flows from operating activities: | ||||||||||||
| Net income | $ | 11,935 | $ | 32,726 | $ | 13,577 | ||||||
| Adjustments to reconcile net income to net cash (used in) provided by operating activities: | ||||||||||||
| Depreciation and amortization | 11,140 | 4,306 | 848 | |||||||||
| Provision for doubtful accounts | 1,066 | 710 | 718 | |||||||||
| Share-based compensation | 10,341 | 2,768 | 2,043 | |||||||||
| Recovery of key man life insurance | (6,000 | ) | — | — | ||||||||
| Non-cash interest and other | 456 | 136 | 163 | |||||||||
| Effect of foreign currency on operations | (769 | ) | 973 | (375 | ) | |||||||
| Loss from equity investment | 437 | — | — | |||||||||
| Deferred income taxes | 5,729 | 3,549 | 6,609 | |||||||||
| Impairment of leaseholds and other, lease loss accrual and loss on disposal of fixed assets | 3,602 | — | 40 | |||||||||
| Income allocated and fair value adjustment for mandatorily redeemable noncontrolling interests | 10,799 | 3,032 | 2,207 | |||||||||
| Change in operating assets and liabilities: | ||||||||||||
| Due from clearing brokers | 3,359 | — | — | |||||||||
| Securities and other investments owned | (82,143 | ) | 8,964 | (7,588 | ) | |||||||
| Securities borrowed | 47,595 | — | — | |||||||||
| Accounts receivable and advances against customer contracts | 1,614 | (1,847 | ) | 11,540 | ||||||||
| Goods held for sale or auction | 213 | 37 | 20 | |||||||||
| Prepaid expenses and other assets | (1,719 | ) | 3,662 | (1,100 | ) | |||||||
| Accounts payable, accrued payroll and related expenses, accrued value added tax payable and other accrued expenses | (30,374 | ) | 23,330 | 3,943 | ||||||||
| Amounts due from related parties and partners | (11,826 | ) | (2,766 | ) | (622 | ) | ||||||
| Securities sold, not yet purchased | 7,678 | 133 | (33 | ) | ||||||||
| Deferred revenue | (668 | ) | 884 | 346 | ||||||||
| Securities loaned | (64,255 | ) | — | — | ||||||||
| Auction and liquidation proceeds payable | — | (317 | ) | (665 | ) | |||||||
| Net cash (used in) provided by operating activities | (81,790 | ) | 80,280 | 31,671 | ||||||||
| Cash flows from investing activities: | ||||||||||||
| Acquisition of Wunderlich, net of cash acquired $4,259 | (25,478 | ) | — | — | ||||||||
| Cash acquired from acquisition of FBR & Co. | 15,738 | — | — | |||||||||
| Acquisition of United Online, net of cash acquired $125,542 in 2016 | (10,381 | ) | (33,430 | ) | — | |||||||
| Acquisition of other businesses, net of cash acquired | (2,052 | ) | — | (2,451 | ) | |||||||
| Purchases of property and equipment | (825 | ) | (729 | ) | (239 | ) | ||||||
| Proceeds from key man life insurance | 6,000 | — | — | |||||||||
| Proceeds from sale of property and equipment and intangible asset | 836 | 96 | 4 | |||||||||
| Equity investment | (1,674 | ) | — | — | ||||||||
| (Increase) decrease in restricted cash | (15,786 | ) | (2,809 | ) | 7,604 | |||||||
| Net cash (used in) provided by investing activities | (33,622 | ) | (36,872 | ) | 4,918 | |||||||
| Cash flows from financing activities: | ||||||||||||
| Repayment of revolving line of credit | — | (272 | ) | 216 | ||||||||
| Proceeds from asset based credit facility | 65,987 | 56,255 | — | |||||||||
| Repayment of asset based credit facility | (65,987 | ) | (56,255 | ) | (18,506 | ) | ||||||
| Proceeds of notes payable - related party | — | — | 4,500 | |||||||||
| Repayment of notes payable - related party | — | — | (4,500 | ) | ||||||||
| Repayment of notes payable | (8,336 | ) | — | — | ||||||||
| Proceeds from participating note payable | — | 61,400 | — | |||||||||
| Repayment of participating note payable and contingent consideration | (1,250 | ) | (62,650 | ) | — | |||||||
| Proceeds from issuance of senior notes | 179,471 | 27,664 | — | |||||||||
| Payment of debt issuance costs | (4,289 | ) | — | — | ||||||||
| Proceeds from issuance of common stock | — | 22,759 | — | |||||||||
| Payment of employment taxes on vesting of restricted stock | (3,486 | ) | (1,156 | ) | (499 | ) | ||||||
| Dividends paid | (16,755 | ) | (5,334 | ) | (5,219 | ) | ||||||
| Distribution to noncontrolling interests | (11,261 | ) | (2,007 | ) | (4,042 | ) | ||||||
| Net cash provided by (used in) financing activities | 134,094 | 40,404 | (28,050 | ) | ||||||||
| Increase in cash and cash equivalents | 18,682 | 83,812 | 8,539 | |||||||||
| Effect of foreign currency on cash | 2,036 | (1,719 | ) | (127 | ) | |||||||
| Net increase in cash and cash equivalents | 20,718 | 82,093 | 8,412 | |||||||||
| Cash and cash equivalents, beginning of year | 112,105 | 30,012 | 21,600 | |||||||||
| Cash and cash equivalents, end of year | $ | 132,823 | $ | 112,105 | $ | 30,012 | ||||||
| Supplemental disclosures: | ||||||||||||
| Interest paid | $ | 18,840 | $ | 376 | $ | 579 | ||||||
| Taxes paid | $ | 14,986 | $ | 685 | $ | 1,688 | ||||||
The accompanying notes are an integral part of these consolidated financial statements.
B. RILEY FINANCIAL, INC. AND SUBSIDIARIES
NOTES TO CONSOLIDATED FINANCIAL STATEMENTS
(Dollars in thousands, except share data)
NOTE 1—1 — ORGANIZATION AND NATURE OF BUSINESS OPERATIONS AND SIGNIFICANT ACCOUNTING POLICIES
Organization and Nature of Operations
B. Riley Financial, Inc. and its subsidiaries (collectively, the “Company”) provide investment banking and financial services to corporate, institutional and high net worth clients, and asset disposition, valuation andfinancial consulting, appraisal and capital advisory services to a wide range of retail, wholesale and industrial clients, as well as lenders, capital providers, private equity investors and professional services firms throughout the United States, Australia, Canada, and Europe and with the acquisition ofconsumer Internet access and cloud communication services through its wholly-owned subsidiaries United Online, Inc. (“UOL” or “United Online”) on July 1, 2016, provide consumer Internet access and related subscriptionmagicJack VocalTec Ltd. (“magicJack”). The Company also has a majority ownership interest in BR Brands Holding, LLC (“BR Brands” or “Brands”), which provides licensing of trademarks.
On February 25, 2021, the Company completed the acquisition of all of the outstanding shares of National Holdings Corporation (“National”) not already owned by the Company. The total cash consideration for the approximately 55% of National outstanding shares that the Company did not previously own and settlement of outstanding share based awards amounted to $35,314. The Company used the acquisition method of accounting for this acquisition. The acquisition expands the Company’s investment banking, wealth management and financial planning offerings by adding National’s brokerage, insurance, tax preparation and advisory services. As a result of the National acquisition, the Company realigned its segment reporting structure in the first quarter of 2021 to reflect organizational management changes for its wealth management business. Under the new structure, the wealth management business previously reported in the Capital Markets segment are now reported in the Wealth Management segment. In conjunction with the new reporting structure, the Company recast its segment presentation for all periods presented.
The Company operates in foursix operating segments: (i) Capital Markets, through which the Company provides investment banking, corporate finance, securities lending, restructuring, research, sales and trading services to corporate and institutional clients; (ii) Wealth Management, through which the Company provides wealth management and tax services to corporate, institutional and high net worth clients; (ii)(iii) Auction and Liquidation, through which the Company provides auction and liquidation services to help clients dispose of assets that include multi-location retail inventory, wholesale inventory, trade fixtures, machinery and equipment, intellectual property and real property; (iii) Valuation and Appraisal,(iv) Financial Consulting, through which the Company provides bankruptcy, financial advisory, forensic accounting, operations management consulting, real estate consulting and valuation and appraisal services to clients with independent appraisals in connection with asset based loans, acquisitions, divestitures and other business needs; and (iv)services; (v) Principal Investments - United Online,Communications, through which the Company provides consumer Internet access and related subscription services.services from United Online and cloud communication services primarily through the magicJack devices; and (vi) Brands, which is focused on generating revenue through the licensing of trademarks.
On November 9, 2017,January 30, 2020, the Company entered into an Agreement and PlanWorld Health Organization (“WHO”) announced a global health emergency because of Merger with B. R. Acquisition Ltd., an Israeli corporation and wholly-owned subsidiarya new strain of coronavirus (the “COVID-19 outbreak”). In March 2020, the WHO classified the COVID-19 outbreak as a pandemic, based on the rapid increase in exposure globally. During the fourth quarter of 2021, the full impact of the Company (“Merger Sub”),COVID-19 outbreak continues to evolve, with the emergence of variant strains and magicJack VocalTec Ltd., an Israeli corporation (“magicJack”), pursuantbreakthrough infections becoming prevalent both in the U.S. and worldwide. As the U.S. economy recovers, aided by additional stimulus packages, inflation has been rising at historically high rates, and the Federal Reserve has signaled that it will begin increasing the target federal funds effective rate and positive momentum in the domestic vaccine rollout, countries across the world continue to which Merger Sub will merge with and into magicJack, with magicJack continuing as the surviving corporation and as an indirect subsidiarymanage repeated waves of the Company. Subject to the terms and conditionspandemic, including variant strains of COVID-19, amid uneven progress toward vaccination. The impact of the AgreementCOVID-19 outbreak on our results of operations, financial position and Plan of Merger, each outstanding share of magicJackcash flows will be converted intodepend on future developments, including the right to receive $8.71 in cash without interest, representing approximately $143,500 in aggregate merger consideration. The closingduration and spread of the transaction is subject tooutbreak and related advisories and restrictions and the receiptsuccess of certain regulatory approvals,vaccines and natural immunity in controlling slowing or halting the approvalpandemic. These developments and the impact of the magicJack shareholder’sCOVID-19 outbreak on the financial markets and the satisfactionoverall economy continue to be highly uncertain and cannot be predicted. If the financial markets and/or the overall economy continue to be impacted, our results of other closing conditions. It is anticipated that the acquisition of magicJack will close in the first half of 2018.operations, financial position and cash flows may be materially adversely affected.
NOTE 2—2 — SUMMARY OF SIGNIFICANT ACCOUNTING POLICIES
((a)a) Principles of Consolidation and Basis of Presentation
The consolidated financial statements include the accounts of B. Riley Financial, Inc. and its wholly-owned and majority-owned subsidiaries. The consolidated financial statements also include the accounts of (a) Great American Global Partners, LLC which is controlled by the Company as a result of its ownership of a 50% member interest, appointment of two of the three executive officers and significant influence over the funding of operations, and (b) GA Retail Investments, L.P. which is controlled by the Company as a result of its ownership of a 50% partnership interest, appointment of executive officers and significant influence over the operations. All intercompany accounts and transactions have been eliminated upon consolidation. In the opinion of the Company’s management, all adjustments, consisting of only normal and recurring adjustments, necessary for a fair presentation of the financial position and the results of operations for the periods presented have been included.
The accounting guidance requires an enterprise to perform an analysis to determine whether the enterprise’s variable interest or interests give it a controlling financial interest in a variable interest entity; to require ongoing reassessments of whether an enterprise is the primary beneficiary of a VIE;Variable Interest Entity (“VIE”); to eliminate the solely quantitative approach previously required for determining the primary beneficiary of a VIE; to add an additional reconsideration event for determining whether an entity is a VIE when any changes in facts and circumstances occur such that holders of the equity investment at risk, as a group, lose the power from voting rights or similar rights of those investments to direct the activities of the entity that most significantly impact the entity’s economic performance; and to require enhanced disclosures that will provide users of financial statements with more transparent information about an enterprise’s involvement in a VIE.
Revision of Prior Period Financial Statements
In connection with the preparation of the Company’s consolidated financial statements during the year ended December 31, 2021, the Company identified an error that was not material related to the consolidation of certain VIE which primarily resulted in a gross up between investing activities and financing activities in the consolidated statements of cash flows. In accordance with SAB No. 99, “Materiality,” and SAB No. 108, “Considering the Effects of Prior Year Misstatements when Quantifying Misstatements in Current Year Financial Statements,” the Company evaluated the error and determined that the related impact did not, either individually or in the aggregate, materially misstate previously issued consolidated financial statements. A summary of revisions to certain previously reported financial information presented herein is included in Note 23.
(b) Use of Estimates
The preparation of the consolidated financial statements in accordance with accounting principles generally accepted in the United States of AmericanAmerica (“GAAP”) requires management to make estimates and assumptions that affect the reported amounts of assets and liabilities at the date of the consolidated financial statements and reported amounts of revenue and expense during the reporting period. Estimates are used when accounting for certain items such as valuation of securities, reservesallowance for doubtful accounts, receivable, the carryingfair value of loans receivables, intangible assets and goodwill, the fair value of mandatorily redeemable noncontrolling interests, fair value of share based arrangements, fair value of contingent consideration in business combination’s and accounting for income tax valuation allowances, recovery of contract assets and sales returns and allowances. Estimates are based on historical experience, where applicable, and assumptions that management believes are reasonable under the circumstances. Due to the inherent uncertainty involved with estimates, actual results may differ.
(c)(d) Revenue Recognition
The Company recognizes revenues under Accounting Standards Codification (“ASC”) 606 – Revenue from Contracts with Customers. Revenues are recognized when control of the promised goods or performance obligations for services is transferred to the Company’s customers, in accordancean amount that reflects the consideration the Company expects to be entitled to in exchange for the goods or services.
Revenues from contracts with the accounting guidance when persuasive evidence of an arrangement exists, the related services have been provided, the fee is fixed or determinable, and collection is reasonably assured.
Revenuescustomers in the Capital Markets segment, Wealth Management segment, Auction and Liquidation segment, Financial Consulting segment, Principal Investments – Communications segment and Brands segment are primarily comprised of (i) fees earned from corporate finance, investment banking, restructuring and wealth management services; (ii) revenues from sales and trading activities; and (iii) interest income from securities lending activities.the following:
Capital Markets segment – Fees earned from corporate finance and investment banking services are derived from debt, equity and convertible securities offerings in which the Company acted as an underwriter or placement agentagent. Fees from underwriting activities are recognized as revenues when the performance obligation for the services related to the underwriting transaction is satisfied under the terms of the engagement and is not subject to any other contingencies. Fees are also earned from financial advisory and consulting services rendered in connection with client mergers, acquisitions, restructurings, recapitalizations and other strategic transactions. Fees from underwriting activities are recognized in earnings when theThe performance obligation for financial advisory services related to the underwriting transaction are completed under the terms ofis satisfied over time as work progresses on the engagement and services are delivered to the client. The performance obligation for financial advisory services may also include success and performance based fees which are recognized as revenue when the income was determinedperformance obligation is no longer constrained and it is not probable that the revenue recognized would be subject to any other contingencies.significant reversal in a future period. Generally, it is probable that the revenue recognized is no longer subject to significant reversal upon the closing of the investment banking transaction.
Fees from wealthasset management services consist primarily of investment management fees that are recognized over the period the performance obligation for the services are provided. InvestmentAsset management fees are primarily comprised of fees for investmentasset management services and are generally based on the dollar amount of the assets being managed.
Revenues from sales and trading are recognized when the performance obligation is satisfied and include (i) commissions resulting from equity securities transactions executed as agent or principal and are recorded on a trade date basis;basis and fees paid for equity research.
Revenues from other sources in the Capital Markets segment is primarily comprised of (i) interest income from loans receivable and securities lending activities, (ii) related net trading gains and losses from market making activities, and from the commitment of capital to facilitate customer orders;orders and fair value adjustments on loans, (iii) fees paid for equity research; and (iv) principal transactions which include realized and unrealized gains and losses and interest and dividend income resultingtrading activities from ourthe Company’s principal investments in equity and other securities for the Company’s account.account, and (iv) other income.
RevenuesInterest income from securities lending activities consistconsists of interest income from equity and fixed income securities that are borrowed from one party and loaned to another. The Company maintains relationships with a broad group of banks and broker-dealers to facilitate the sourcing, borrowing and lending of equity and fixed income securities in a “matched book” to limit the Company’s exposure to fluctuations in the market value or securities borrowed and securities loaned.
RevenuesOther revenues include (i) net trading gains and losses from market making activities in the ValuationCompany’s fixed income group, (ii) carried interest from the Company’s asset management recognized as earnings from financial assets within the scope of ASC 323 - Investments - Equity Method and AppraisalJoint Ventures, and therefore will not be in the scope of ASC 606 - Revenue from Contracts with Customers. In accordance with ASC 323 - Investments - Equity Method and Joint Ventures, the Company will record equity method income (losses) as a component of investment income based on the change in the Company’s proportionate claim on net assets of the investment fund, including performance-based capital allocations, assuming the investment fund was liquidated as of each reporting date pursuant to each fund’s governing agreements, and (iii) other miscellaneous income.
Wealth Management segment– Fees from wealth management asset advisory services consist primarily of investment advisory fees that are recognized over the period the performance obligation for the services is provided. Investment advisory and asset management fees are primarily comprised of fees for valuationinvestment services and appraisal services. Revenuesare generally based on the dollar amount of the assets being managed. Investment advisory fee revenues as a principal registered investment advisor (RIA) are recognized uponon a gross basis. Asset management fee revenues as an agent are recognized on a net basis.
Revenues from sales and trading are recognized when the delivery of the completed services to the related customersperformance obligation is satisfied and collection of the fee is reasonably assured. Revenues in the Valuationinclude commissions resulting from equity securities transactions executed as agent and Appraisal segment also include contractual reimbursable costs.are recorded on a trade date basis.
Revenues in the Auction and Liquidation segment are comprised of (i) commissions and fees earned on the sale of goods at auctions and liquidations; (ii) revenues from auction and liquidation services contracts where the Company guarantees a minimum recovery value for goods being sold at auction or liquidation; (iii) revenue from the sale of goods that are purchased by the Company for sale at auction or liquidation sales events; (iv) fees earned from real estate services and the origination of loans; (v) revenues from financing activities is recorded over the lives of related loans receivable using the interest method; and (vi) revenues from contractual reimbursable expenses incurred in connection with auction and liquidation contracts.
– Commission and fees earned on the sale of goods at auctionAuction and liquidationLiquidation sales are recognized when evidence of ana contract or arrangement exists, the salestransaction price has been determined, title has passed to the buyer and the buyerperformance obligation has assumedbeen satisfied when control of the product and risks of ownership and collection is reasonably assured.has been transferred to the buyer. The commission and fees earned for these services are included in revenues in the accompanying consolidated statements of operations.income. Under these types of arrangements, revenues also include contractual reimbursable costs.
Revenues earned from auctionAuction and liquidationLiquidation services contracts where the Company guarantees a minimum recovery value for goods being sold at auction or liquidation are recognized over time when the performance obligation is satisfied. The Company generally uses the cost-to-cost measure of progress for the Company’s contracts because it best depicts the transfer of services to the customer which occurs as the Company incurs costs on its contracts. Under the cost-to-cost measure of progress, the extent of progress towards completion is measured based on proceeds received.the ratio of costs incurred to date to the total estimated costs at completion of the performance obligation. Revenues, including estimated fees or profits, are recorded proportionally as costs are incurred. Costs to fulfill the contract include labor and other direct costs incurred by the company related to the contract. Due to the nature of the guarantees and performance obligations under these contracts, the estimation of revenue that is ultimately earned is complex and subject to many variables and requires significant judgment. It is common for these contracts to contain provisions that can either increase or decrease the transaction price upon completion of the Company’s performance obligations under the contract. Estimated amounts are included in the transaction price at the most likely amount it is probable that a significant reversal of revenue will not occur. The Company records proceeds received from these typesestimates of engagements firstvariable consideration and determination of whether or not to include estimated amounts in the transaction price are based on an assessment of the Company’s anticipated performance under the contract taking into consideration all historical, current and forecasted information that is reasonably available to the Company. Costs that directly relate to the contract and expected to be recoverable are capitalized as a reduction of contractual reimbursable expenses, second as a recovery of its guaranteean asset and thereafter as revenue, subject to such revenue meeting the criteria of having been fixed or determinable. Contractual reimbursable expenses and amounts advanced to customers for minimum guarantees are initially recorded asincluded in advances against customer contracts in the accompanying consolidated balance sheets. These costs are amortized as the services are transferred to the customer over the contract period, which generally does not exceed six months, and the expense is recognized as a component of direct cost of services. If, during the auction or liquidation sale, the Company determines that the proceedstotal costs to be incurred on a performance obligation under a contract exceeds the total estimated revenues to be earned, a provision for the entire loss on the performance obligation is recognized in the period the loss is determined.
If the Company determines that the variable consideration used in the initial determination of the transaction price for the contract is such that the total recoveries from the sale will not meet the minimum guaranteed recovery value as defined in the auction or liquidation services contract,will not exceed the Company accrues a loss on the contract in the period that the loss becomes known.
The Company also evaluates revenue from auction and liquidation contractsguaranteed recovery values or advances made in accordance with the accounting guidance to determine whether to report Auctioncontract, the transaction price will be reduced and Liquidation segmenta loss or negative revenue could result from the performance obligation. A provision for the entire loss as negative revenue on a gross or net basis. The Company has determined that it acts as an agent in a substantial majority of its auction and liquidation services contracts and therefore reports the auction and liquidation revenues on a net basis.
Revenues from the sale of goods are recorded gross and areperformance obligation is recognized in the period the loss is determined.
Financial Consulting segment – Revenues in which the sale of goods held for sale or auction are completed, title to the property passes to the purchaser and the Company has fulfilled its obligations with respect to the transaction. These revenuesFinancial Consulting segment are primarily the resultcomprised of the Company acquiring title to merchandise with the intent of selling the items at auction or for augmenting liquidation sales. For liquidation contracts where we take title to retail goods, our net sales represent gross sales invoiced to customers, less certain related charges for discounts, returns,fees earned from providing bankruptcy, financial advisory, forensic accounting, real estate consulting and other promotional allowancesvaluation and are recorded net of sales or value added tax.
appraisal services. Fees earned from bankruptcy, financial advisory, forensic accounting and real estate consulting services are rendered to clients over time as work progresses on the origination of loans whereengagement and services are delivered to the Company provides capital advisoryclient. Fees may also include success and performance based fees which are recognized as revenue when the performance obligation is no longer constrained and it is not probable that the revenue recognized would be subject to significant reversal in a future period. Revenues for valuation and appraisal services are recognized when the performance obligation is completed and is generally at the point in time upon delivery of the report to the customer. Revenues in the period earned, if the fee is fixed and determinable and collection is reasonably assured.Financial Consulting segment also include contractual reimbursable costs.
Principal Investments – Communications segment – Revenues in the Principal Investments - United OnlineCommunications segment are primarily comprised of subscription services revenues which are derived primarily fromconsist of fees charged to United Online pay accounts; advertising and other revenues; and products revenues which are derived primarily from the sale of the magicJack access rights; revenues from access rights renewals and mobile apps; prepaid minutes revenues; revenues from access and wholesale charges; service revenue from UCaaS hosting services; and revenues from mobile phone voice, text, and data services. Products revenues consist of revenues from the sale of magicJack, mobile phone, and mobile broadband service devices, including the related shipping and handling fees.
Serviceand installation fees, if applicable. This segment’s revenues are derived primarily from fees charged to pay accounts and are recognized in the period inalso include advertising revenues which fees are fixed or determinable and the related services are provided to the customer. The Company’s pay accounts generally pay in advance for their services by credit card, PayPal, automated clearinghouse or check, and revenues are then recognized ratably over the service period. Advance payments from pay accounts are recorded in the consolidated balance sheet as deferred revenue. In circumstances where payment is not received in advance, revenues are only recognized if collectability is reasonably assured.
Advertising revenues consist primarily of amounts from the Company’s Internet search partner that are generated as a result of users utilizing the partner’s Internet search services and amounts generated from display advertisements. The Company recognizes such advertising revenues in the period in which the advertisement is displayed or, for performance-based arrangements, when the related performance criteria are met. In determining whether an arrangement exists,
Subscription service revenues are recognized over time in the Company ensures that a written contractservice period in which the transaction price has been determinable and the related performance obligations for services are provided to the customer. Fees charged to customers in advance are initially recorded in the consolidated balance sheets as deferred revenue and then recognized ratably over the service period as the performance obligations are provided.
Product revenues for hardware and shipping are recognized at the time of delivery. Revenues from sales of devices and services represent revenues recognized from sales of the magicJack devices to retailers, wholesalers, or direct to customers, net of returns, and rights to access the Company’s servers over the period associated with the access right period, and from sales of mobile phones and voice, text, and data services. The transaction price for devices is in place, such as a standard insertion order or a customer-specific agreement.allocated between equipment and service based on stand-alone selling prices. Revenues allocated to devices are recognized upon delivery (when control transfers to the customer), and service revenue is recognized ratably over the service term. The Company assesses whether performance criteria have been metestimates the return of magicJack device direct sales as part of the transaction price using a six month rolling average of historical returns.
Brands segment – Licensing revenue results from various license agreements that provide revenue based on guaranteed minimum royalty amounts and whether theadvertising/marketing fees are fixed or determinablewith additional royalty revenue based on a reconciliationpercentage of defined sales. Guaranteed minimum royalty amounts are recognized as revenue on a straight-line basis over the full contract term. Royalty payments exceeding the guaranteed minimum amounts in a specific contract year are recognized only subsequent to when the guaranteed minimum amount has been achieved. Other licensing fees are recognized at a point in time once the performance obligations have been satisfied.
Payments received as consideration for the grant of a license are recorded as deferred revenue at the time payment is received and recognized ratably as revenue over the term of the performance criteria and the payment terms associated with the transaction. The reconciliation of the performance criteria generally includes a comparison of customer-provided performance data to the contractual performance obligation and to internal or third-party performance data in circumstances where that data is available.
In the normal course of business, the Company will enter into collaborative arrangements with other merchandise liquidators to collaboratively execute auction and liquidation contracts. The Company’s collaborative arrangements specifically include contractual agreements with other liquidation agents in which the Company and such other liquidation agents actively participate in the performance of the liquidation services and are exposed to the risks and rewards of the liquidation engagement. The Company’s participation in collaborative arrangements including its rights and obligations under each collaborative arrangement can vary. Revenues from collaborative arrangementslicense agreement. Advanced royalty payments are recorded net based onas deferred revenue at the proceedstime payment is received from the liquidation engagement. Amounts paid to participants in the collaborative arrangements are reported separatelyand recognized as direct costs of revenues.revenue when earned. Revenue from collaborative arrangements in which the Company is not the majority participantrecognized unless collectability is recorded net based on the Company’s share of proceeds received. There were no revenues and direct cost of services subject to collaborative arrangements during the year ended December 31, 2017, 2016 and 2015.probable.
(d) Direct Cost of Services
Direct cost of services relaterelates to service and fee revenues. The costs consist of employee compensation and related payroll benefits, travel expenses, the cost of consultants assigned to revenue-generating activities and direct expenses billable to clients in the Valuation and Appraisal segment. Direct costs of services include participation in profits under collaborative arrangements in which the Company is a majority participant. Direct costs of services also include the cost of consultants and other direct expenses related to auctionAuction and liquidationLiquidation contracts pursuant to commission and fee based arrangements in the Auction and Liquidation segment. Direct cost of services in the Principal Investments - United OnlineCommunications segment include cost of telecommunications and data center costs, personnel and overhead-related costs associated with operating the Company’s networks, servers and data centers, sales commissions associated with multi-year service plans, depreciation of network computers and equipment, amortization expense, third party advertising sales commissions, license fees, costs related to providing customer support, costs related to customer billing and processing of customer credit cards and associated bank fees. Direct cost of services does not include an allocation of the Company’s overhead costs.
(e) Interest Expense - Securities Lending Activities and Loan Participations Sold
Interest expense from securities lending activities is included in operating expenses related to operations in the Capital Markets segment. Interest expense from securities lending activities is incurred from equity and fixed income securities that are loaned to the Company.Company and totaled $51,753, $40,490, and $30,739 during the years ended December 31, 2021, 2020, and 2019, respectively. There were no loan participations sold outstanding as of December 31, 2021 and the loan participation sold totaled $17,316, as of December 31, 2020. Interest expense from loan participations sold totaled $878, $1,961, and $1,405 during the years ended December 31, 2021, 2020, and 2019, respectively.
(f) Concentration of Risk
Revenues from one liquidation service contract to a retailer represented 13.5% of total revenues during the year ended December 31, 2016. Revenues in the Capital Markets, Auction and Liquidation, Valuation and Appraisal andFinancial Consulting, Wealth Management, Principal Investments - Communications and Brands segments are currently primarily generated in the United OnlineStates. Revenues in the Auction and Liquidation segment are primarily generated in the United States, Australia, Canada and Europe.
The Company’s activities in the Auction and Liquidation segment are executed frequently with, and on behalf of, distressed customers and secured creditors. Concentrations of credit risk can be affected by changes in economic, industry, or geographical factors. The Company seeks to control its credit risk and potential risk concentration through risk management activities that limit the Company’s exposure to losses on any one specific liquidation services contract or concentration within any one specific industry. To mitigate the exposure to losses on any one specific liquidationliquidations services contract, the Company sometimes conducts operations with third parties through collaborative arrangements.
The Company maintains cash in various federally insured banking institutions. The account balances at each institution periodically exceed the Federal Deposit Insurance Corporation’s (“FDIC”) insurance coverage, and as a result, there is a concentration of credit risk related to amounts in excess of FDIC insurance coverage. The Company has not experienced any losses in such accounts. The Company also has substantial cash balances from proceeds received from auctions and liquidation engagements that are distributed to parties in accordance with the collaborative arrangements.
(g) Advertising ExpenseExpenses
The Company expenses advertising costs, which consist primarily of costs for printed materials, as incurred. Advertising costs totaled $1,312, $1,456$3,681, $3,013, and $519 for$1,903 during the years ended December 31, 2017, 20162021, 2020, and 2015,2019, respectively. Advertising expense is included as a component of selling, general and administrative expenses in the accompanying consolidated statements of income.
(h) Share-Based Compensation
The Company’s share basedshare-based payment awards principally consist of grants of restricted stock, and restricted stock units. Share based payment awards also includes grants of membership interests inunits and costs associated with the Company’s majority owned subsidiaries. The grants of membership interests consist of percentage interests in the Company’s majority owned subsidiaries as determined at the date of grant.employee stock purchase plan. In accordance with the applicable accounting guidance, share basedshare-based payment awards are classified as either equity or liabilities. For equity-classified awards, the Company measures compensation cost for the grant of membership interests at fair value on the date of grant and recognizes compensation expense in the consolidated statementstatements of operationsincome over the requisite service or performance period the award is expected to vest. The fair
In June 2018, the Company adopted the 2018 Employee Stock Purchase Plan (“Purchase Plan”) which allows eligible employees to purchase common stock through payroll deductions at a price that is 85% of the market value of the liability-classified award will be subsequently remeasured at each reporting date throughcommon stock on the settlement date. Change in fair value duringlast day of the requisite service period will beoffering period. In accordance with the provisions of ASC 718 - Compensation - Stock Compensation, the Company is required to recognize compensation expense relating to shares offered under the Purchase Plan. During the years ended December 31, 2021, 2020, and 2019, the Company recognized as compensation cost over that period.expense of $758, $377, and $322 respectively, related to the Purchase Plan. As of December 31, 2021 and 2020, there were 450,717 and 502,326 shares reserved for issuance under the Purchase Plan, respectively.
(i) Income Taxes
The Company recognizes deferred tax liabilities and assets for the expected future tax consequences of events that have been included in the consolidated financial statements or tax returns. Deferred tax liabilities and assets are determined based on the difference between the financial statement basis and tax basis of assets and liabilities using enacted tax rates in effect forduring the year in which the differences are expected to reverse. The Company estimates the degree to which tax assets and credit carryforwards will result in a benefit based on expected profitability by tax jurisdiction. A valuation allowance for such tax assets and loss carryforwards is provided when it is determined to be more likely than not that the benefit of such deferred tax asset will not be realized in future periods. Tax benefits of operating loss carryforwards are evaluated on an ongoing basis, including a review of historical and projected future operating results, the eligible carryforward period, and other circumstances. If it becomes more likely than not that a tax asset will be used, the related valuation allowance on such assets would be reduced.
The Company recognizes tax benefits from uncertain tax positions only if it is more likely than not that the tax position will be sustained on examination by the taxing authorities, based on the technical merits of the position. Once this threshold has been met, the Company’s measurement of its expected tax benefits is recognized in its financial statements. The Company accrues interest on unrecognized tax benefits as a component of income tax expense. Penalties, if incurred, would be recognized as a component of income tax expense.
The Tax Cuts and Jobs Act (the “Tax Act”) was enacted on December 22, 2017. The Tax Act reduces the U.S. federal corporate tax rate from 35% to 21%, requires companies to pay a one-time transition tax on earnings of certain foreign subsidiaries that were previously tax deferred, provides an exemption from U.S. federal tax for dividends received from foreign subsidiaries, and creates new taxes on certain foreign sourced earnings. As of the completion of these financial statements and related disclosures, we have not completed our accounting for the tax effects of the Tax Act; however, as described below, we have made a reasonable estimate of such effects and recorded a provisional tax expense of $13,052, which is included as a component of income tax expense in the fourth quarter of 2017. This provisional tax expense incorporates assumptions made based upon the Company’s current interpretation of the Tax Act, and may change as we receive additional clarification and implementation guidance and as the interpretation of the Tax Act evolves. In accordance with SEC Staff Accounting Bulletin No. 118, the Company will finalize the accounting for the effects of the Tax Act no later than the fourth quarter of 2018. Future adjustments made to the provisional effects will be reported as a component of income tax expense from continuing operations in the reporting period in which any such adjustments are determined. See Note 13 for additional information.
(j) Cash and Cash Equivalents
The Company considers all highly liquid investments with an originala maturity of three months or less when purchased to be cash equivalents.
(k) Restricted Cash
As of December 31, 2017,2021, restricted cash of $19,711 included $19,197$927 of cash collateral related to certain retail liquidation engagements and $514 cash segregated in a special bank accounts for the benefit of customers related to our broker dealer subsidiary and collateral for one of our telecommunication suppliers.leases. As of December 31, 2016,2020, restricted cash of $3,294 included $1,440 of cash collateral related to a retail liquidation engagement in Australia, $1,320$764 of cash collateral for foreign exchange contracts and $534 cash segregated in a special bank accounts for the benefit$471 of customerscollateral related to our broker dealer subsidiary and collateral for one of ourthe Company’s telecommunication suppliers.
Cash, cash equivalents and restricted cash consist of the following:
| December 31, | December 31, | |||||||
| 2021 | 2020 | |||||||
| Cash and cash equivalents | $ | 278,933 | $ | 103,602 | ||||
| Restricted cash | 927 | 1,235 | ||||||
| Total cash, cash equivalents and restricted cash | $ | 279,860 | $ | 104,837 | ||||
(l) Securities Borrowed and Securities Loaned
Securities borrowed and securities loaned are recorded based upon the amount of cash advanced or received. Securities borrowed transactions facilitate the settlement process and require the Company to deposit cash or other collateral with the lender. With respect to securities loaned, the Company receives collateral in the form of cash. The amount of collateral required to be deposited for securities borrowed, or received for securities loaned, is an amount generally in excess of the market value of the applicable securities borrowed or loaned. The Company monitors the market value of the securities borrowed and loaned on a daily basis, with additional collateral obtained, or excess collateral recalled, when deemed appropriate.
The Company accounts for securities lending transactions in accordance with Accounting Standards Codification (“ASC”)ASC 210 - “Topic 210: Balance Sheet”, which requires companies to report disclosures of offsetting assets and liabilities. The Company does not net securities borrowed and securities loaned and these items are presented on a gross basis in the condensed consolidated balance sheets.
(m) Due from/to Brokers, Dealers, and Clearing Organizations
The Company clears all of its proprietary and customer transactions through other broker-dealers on a fully disclosed basis. The amount receivable from or payable to the clearing brokers represents the net of proceeds from unsettled securities sold, the Company’s clearing depositdeposits and amounts receivable for commissions less amounts payable for unsettled securities purchased by the Company and amounts payable for clearing costs and other settlement charges. This amount also includes the cash collateral received for securities loaned less cash collateral for securities borrowed. Any amounts payable would be fully collateralized by all of the securities owned by the Company and held on deposit at the clearing broker.
(n) Accounts Receivable
Accounts receivable represents amounts due from the Company’s auctionAuction and liquidation, valuationLiquidation, Financial Consulting, Capital Markets, Wealth Management, Principal Investments - Communications and appraisal, capital markets and principal investments - United OnlineBrands customers. The Company maintains an allowance for doubtful accounts for estimated losses inherent in its accounts receivable portfolio. In establishing the required allowance, management utilizes a specific customer identification methodology.the expected loss model. Management also considers historical losses adjusted for current market conditions and the customers’ financial condition and the current receivables aging and current payment patterns. Account balances are charged off against the allowance after all means of collection have been exhausted and the potential for recovery is considered remote. The Company does not have any off-balance sheet credit exposure related to its customers. The Company’s bad debt expense totaled $1,066, $710 and $718changes in the allowance for doubtful accounts are included in Note 5.
(o) Leases
The Company determines if an arrangement is, or contains, a lease at the inception date. Operating leases are included in right-of-use assets, with the related liabilities included in operating lease liabilities in the consolidated balance sheets.
Operating lease assets represent our right to use an underlying asset for the years ended December 31, 2017, 2016lease term and 2015, respectively. These amountslease liabilities represent our obligation to make lease payments arising from the lease. Operating lease assets and liabilities are recognized at the lease commencement date based on the estimated present value of lease payments over the lease term. We use our estimated incremental borrowing rate in determining the present value of lease payments. Variable components of the lease payments such as fair market value adjustments, utilities, and maintenance costs are expensed as incurred and not included in determining the present value. Our lease terms include options to extend or terminate the lease when it is reasonably certain that we will exercise that option. Lease expense is recognized on a straight-line basis over the lease term. We have lease agreements with lease and non-lease components which are accounted for as a component of selling, general and administrative expenses in the accompanying consolidated statement of operations.single lease component. See Note 9 for additional information on leases.
(o) Advances Against Customer Contracts
Advances against customer contracts represent advances of contractually reimbursable expenses incurred prior to, and during the term of the auction and liquidation services contract. These advances are charged to expense in the period that revenue is recognized under the contract.
(p) Property and Equipment
Property and equipment are stated at cost. Depreciation and amortization is computed using the straight-line method over the estimated useful lives of the assets. Property and equipment held under capitalfinance leases are amortized on a straight-line basis over the shorter of the lease term or estimated useful life of the asset. PropertyDepreciation expense on property and equipment under capital leases were stated atwas $3,865, $3,632, and $5,202 during the present value of minimum lease payments.years ended December 31, 2021, 2020, and 2019, respectively.
(q) Loans Receivable
Under ASC 326 - Financial Instruments – Credit Losses, the Company elected the irrevocable fair value option for all outstanding loans receivable that were previously measured at amortized cost. Under the fair value option, loans receivables are measured at each reporting period based upon their exit value in an orderly transaction and unrealized gains or losses from changes in fair value are recorded in the consolidated statements of income. These loans are no longer subject to evaluation for impairment through an allowance for loan loss as such losses will be captured through fair value changes.
Loans receivable, at fair value totaled $873,186 and $390,689 as of December 31, 2021 and 2020, respectively. The loans have various maturities through March 2027. As of December 31, 2021 and 2020, the historical cost of loans receivable accounted for under the fair value option was $877,527 and $405,064, respectively, which included principal balances of $886,831 and $416,401, respectively, and unamortized costs, origination fees, premiums and discounts, totaling $9,304 and $11,337, respectively. During the years ended December 31, 2021 and 2020, the Company recorded net unrealized gains of $10,035 and net unrealized losses of $22,033, respectively, on loans receivable, at fair value, which is included in trading income and fair value adjustments on loans on the consolidated statements of income.
The Company may periodically provide limited guarantees to third parties for loans that are made to investment banking and lending customers. As of December 31, 2021, the Company has provided limited guarantees with respect to Babcock & Wilcox Enterprises, Inc. (“B&W”) as further described in Note 17(b). In accordance with the credit loss standard, the Company evaluates the need to record an allowance for credit losses for these loan guarantees since they have off-balance sheet credit exposures. As of December 31, 2021, the Company has not recorded any provision for credit losses on the B&W guarantees since the Company believes that there is sufficient collateral to protect the Company from any credit loss exposure.
Interest income on loans receivable is recognized based on the stated interest rate of the loan on the unpaid principal balance plus the amortization of any costs, origination fees, premiums and discounts and is included in interest income - loans and securities lending on the consolidated statements of income. Loan origination fees and certain direct origination costs are deferred and recognized as adjustments to interest income over the lives of the related loans. Unearned income, discounts, and premiums are amortized to interest income using a level yield methodology.
Badcock Loan Receivable
On December 20, 2021, the Company entered into a Master Receivables Purchase Agreement (“Receivables Purchase Agreement” with W.S. Badcock Corporation, a Florida corporation (“WSBC”), an indirect wholly owned subsidiary of Franchise Group, Inc., a Delaware corporation (“FRG”). The Company paid $400,000 in cash to WSBC for the purchase of certain consumer credit receivables of WSBC. The Company recognized the $400,000 as part of its loans receivable, at fair value on the consolidated balance sheets, which is collateralized by the performance of the consumer credit receivables of WSBC. In connection with the Receivables Purchase Agreement, the Company entered into a Servicing Agreement (the “Servicing Agreement”) with WSBC pursuant to which WSBC will provide to the Company certain customary servicing and account management services in respect of the receivables purchased by the Company under the Receivables Purchase Agreement. In addition, subject to certain terms and conditions, FRG has agreed to guarantee the performance by WSBC of its obligations under the Receivables Purchase Agreement and the Servicing Agreement.
(r) Securities and Other Investments Owned and Securities Sold Not Yet Purchased
Securities owned consistsconsist of marketableequity securities including, common and preferred stocks, warrants, and options; corporate bonds; other fixed income securities including, government and agency bonds; loans receivable valued at fair value; and investments in partnership interests and other securities recorded at fair value.partnerships. Securities sold, but not yet purchased representsrepresent obligations of the Company to deliver the specified security at the contracted price and thereby create a liability to purchase the security in the market at prevailing prices. Changes in the value of these securities are reflected currently in the results of operations.
As of December 31, 20172021 and 2016,2020, the Company’s securities and other investments owned and securities sold not yet purchased at fair value consisted of the following:following securities:
| December 31, | December 31, | |||||||
| 2021 | 2020 | |||||||
| Securities and other investments owned: | ||||||||
| Equity securities | $ | 1,444,474 | $ | 697,288 | ||||
| Corporate bonds | 7,632 | 3,195 | ||||||
| Other fixed income securities | 2,606 | 1,913 | ||||||
| Partnership interests and other | 77,383 | 74,923 | ||||||
| $ | 1,532,095 | $ | 777,319 | |||||
| Securities sold not yet purchased: | ||||||||
| Equity securities | $ | 20,302 | $ | 4,575 | ||||
| Corporate bonds | 6,327 | 4,288 | ||||||
| Other fixed income securities | 1,994 | 1,242 | ||||||
| $ | 28,623 | $ | 10,105 | |||||
| December 31, 2017 | December 31, 2016 | |||||||
| Securities and other investments owned: | ||||||||
| Common stocks and warrants | $ | 67,306 | $ | 2,084 | ||||
| Corporate bonds | 6,539 | 1,025 | ||||||
| Fixed income securities | 2,329 | — | ||||||
| Loans receivable | 33,713 | — | ||||||
| Partnership interests and other | 35,473 | 13,470 | ||||||
| $ | 145,360 | $ | 16,579 | |||||
| Securities sold not yet purchased: | ||||||||
| Common stocks | $ | 19,145 | $ | — | ||||
| Corporate bonds | 1,175 | 846 | ||||||
| Fixed income securities | 699 | — | ||||||
| Partnership interests and other | 7,272 | — | ||||||
| $ | 28,291 | $ | 846 | |||||
(r)(s) Goodwill and Other Intangible Assets
The Company accounts for goodwill and intangible assets in accordance with the accounting guidance which requires that goodwill and other intangibles with indefinite lives be tested for impairment annually or on an interim basis if events or circumstances indicate that the fair value of an asset has decreased below its carrying value.
Goodwill includes the excess of the purchase price over the fair value of net assets acquired in a business combination.combinations and the acquisition of noncontrolling interests. ASC 350 – Intangibles - Goodwill and Other requires that goodwill be tested for impairment at the reporting unit level (operating segment or one level below an operating segment). Application of the goodwill impairment test requires judgment, including the identification of reporting units, assigning assets and liabilities to reporting units, assigning goodwill to reporting units, and determining the fair value. The Company operates foursix reporting units, which are the same as its reporting segments described in Note 20.22. Significant judgment is required to estimate the fair value of reporting units which includes estimating future cash flows, determining appropriate discount rates and other assumptions. Changes in these estimates and assumptions could materially affect the determination of fair value and/or goodwill impairment.
When testing goodwill for impairment, in accordance with ASC 350, the Company may assess qualitative factors for some or all of our reporting units to determine whether it is more likely than not (that is,made a likelihood of more than 50 percent) that the fair value of a reporting unit is less than its carrying amount, including goodwill. Alternatively, the Company may bypass this qualitative assessment for some or all of our reporting units and perform a detailed quantitative test of impairment (step 1). If the Company performs the detailed quantitative impairment test and the carrying amount of the reporting unit exceeds its fair value,impact of the Company would perform an analysis (step 2) to measure such impairment.COVID-19 outbreak on goodwill and other intangible assets during the years ended December 31, 2021 and 2020. Based on the Company’s qualitative assessments, during 2017, the Company concluded that a positive assertion cancould be made from the qualitative assessmentassessments that it is more likely than not that the fair value of the reporting units exceeded their carrying values andvalues. There were no impairments were identified.of goodwill identified during the years ended December 31, 2021, 2020, and 2019.
During the years ended December 31, 2021 and 2019, the Company recognized no impairment of indefinite-lived intangibles. During the year ended December 31, 2020, the Company determined that the COVID-19 outbreak was a triggering event for testing the indefinite-lived tradenames in the Brands segment during the first quarter and again in the second quarter and determined that the indefinite-lived tradenames in the Brands segment were impaired. As a result, the Company recognized impairment charges of $12,500, during the year ended December 31, 2020, which were included as an impairment of tradenames in the Company’s consolidated statements of income.
The Company reviews the carrying value of its finite-lived amortizable intangibles and other long-lived assets for impairment at least annually or whenever events or changes in circumstances indicate that the carrying amount of an asset may not be recoverable. Recoverability of long-lived assets is measured by comparing the carrying amount of the asset or asset group to the undiscounted cash flows that the asset or asset group is expected to generate. If the undiscounted cash flows of such assets are less than the carrying amount, the impairment to be recognized is measured by the amount by which the carrying amount of the asset or asset group, if any, exceeds its fair market value. No impairment was deemed to exist as ofDuring the years ended December 31, 2017.2021, 2020, and 2019, the Company recognized no impairment of finite-lived intangibles.
(s)(t) Fair Value Measurements
The Company’s assessment of the significance of a particular input to the fair value measurement in its entirety requires judgment and considers factors specific to the asset or liability. Fair value is the price that would be received to sell an asset or paid to transfer a liability in an orderly transaction between market participants at the measurement date. A fair value measurement assumes that the transaction to sell the asset or transfer the liability occurs in the principal market for the asset or liability or, in the absence of a principal market, the most advantageous market. In general, fair values determined by Level 1 inputs utilize quoted prices (unadjusted) for identical instruments that are highly liquid, observable, and actively traded in over-the-counter markets. Fair values determined by Level 2 inputs utilize inputs other than quoted prices included in Level 1 that are observable for the asset or liability, either directly or indirectly. Level 2 inputs include quoted prices for similar instruments in active markets, quoted prices for identical or similar instruments in markets that are not active and model-derived valuations whose inputs are observable and can be corroborated by market data. Level 3 inputs are unobservable inputs that are supported by little or no market activity and that are significant to the fair value of the assets or liabilities. In certain cases, the inputs used to measure fair value may fall into different levels of the fair value hierarchy. In such cases, the level in the fair value hierarchy within which the fair value measurement in its entirety falls has been determined based on the lowest level input that is significant to the fair value measurement in its entirety. The Company’s assessment of the significance of a particular input to the fair value measurement in its entirety requires judgment and considers factors specific to the asset or liability.
The Company’s securities and other investments owned and securities sold and not yet purchased are comprised of common and preferred stocks and warrants, corporate bonds, loans receivable and investments in partnerships. Investments in common stocks that are based on quoted prices in active markets are included in Level 1 of the fair value hierarchy. The Company also holds loans receivable valued at fair value, nonpublic common and preferred stocks and warrants for which there is little or no public market and fair value is determined by management on a consistent basis. For investments where little or no public market exists, management’s determination of fair value is based on the best available information which may incorporate management’s own assumptions and involves a significant degree of judgment, taking into consideration various factors including earnings history, financial condition, recent sales prices of the issuer’s securities and liquidity risks. These investments are included in Level 3 of the fair value hierarchy. Investments in partnership interests include investments in private equity partnerships that primarily invest in equity securities, bonds, and direct lending funds. The Company’s partnership interests are valued based on the Company’s proportionate share of the net assets of the partnership which is derived from the most recent statements received from the general partner which are included in Level 2 of the fair value hierarchy. The Company also invests in certain proprietarypriority investment funds that are valued at net asset value (“NAV”) determined byand the fund administrator. The underlying securities held by these investment companiesfunds are primarily corporate and asset-backed fixed income securities and restrictions exist on the redemption of amounts invested by the Company. As a practical expedient, the Company reliesThe Company’s partnership and investment fund interests are valued based on the NAVCompany’s proportionate share of the net assets of the partnerships and funds; the value for these investments as their fair value. The NAVs that have been provided by the fund administrators areis derived from the fair values ofmost recent statements received from the underlying investments as of the reporting date. In accordance with ASC“Topic 820: Fair Value Measurements,” thesegeneral partner or fund administrator. These partnership and investment fundsfund interests are not categorized withinvalued at net asset value (“NAV”) and are excluded from the fair value hierarchy.hierarchy in the table below in accordance with ASC 820 - Fair Value Measurements. As of December 31, 2021 and 2020, partnership and investment fund interests valued at NAV of $77,383 and $74,923, respectively, and are included in securities and other investments owned in the accompanying consolidated balance sheets.
Securities and other investments owned also include investments in nonpublic entities that do not have a readily determinable fair value and do not report NAV per share. These investments are accounted for using a measurement alternative under which they are measured at cost and adjusted for observable price changes and impairments. Observable price changes result from, among other things, equity transactions for the same issuer executed during the reporting period, including subsequent equity offerings or other reported equity transactions related to the same issuer. For these transactions to be considered observable price changes of the same issuer, we evaluate whether these transactions have similar rights and obligations, including voting rights, distribution preferences, conversion rights, and other factors, to the investments we hold. Any investments adjusted to their fair value by applying the measurement alternative are disclosed as nonrecurring fair value measurements, including the level in the fair value hierarchy that was used. As of December 31, 2021 and 2020, investments in nonpublic entities valued using a measurement alternative of $59,745 and $26,948, respectively, are included in securities and other investments owned in the accompanying consolidated balance sheets.
Funds held in trust represents U.S. treasury bills that were purchased with funds raised through the initial public offerings of B. Riley Principal 150 Merger Corporation (“BRPM 150”) and B. Riley Principal 250 Merger Corporation (“BRPM 250”), consolidated special purpose acquisition corporations (“SPACs”). The funds raised are held in trust accounts that are restricted for use and may only be used for purposes of completing an initial business combination or redemption of the class A public common shares of the SPAC’s as set forth in their respective trust agreements. The funds held in trust are included within Level 1 of the fair value hierarchy and included in prepaid expenses and other assets in the accompanying consolidated balance sheets.
The Company has warrant liabilities related to warrants of the SPAC’s that are held by investors in BRPM 150 and BRPM 250. The warrants are accounted for as liabilities in accordance with ASC 815 - Derivatives and Hedging and are measured at fair value at inception and on a recurring basis using quoted prices in over-the-counter markets. Warrant liabilities are included in accrued expenses and other liabilities in the accompanying consolidated balance sheets with changes in fair value that amounted to a loss of $2,473 during the year ended December 31, 2021 included within gain on extinguishment of loans and other as part of other income (expense) in the consolidated statements of income. The fair value of mandatorily redeemable noncontrolling interests is determined based on the issuance of similar interests for cash, references to industry comparables, and relied, in part, on information obtained from appraisal reports and internal valuation models.
The following tables present information on the financial assets and liabilities measured and recorded at fair value on a recurring basis as of December 31, 20172021 and 2016.2020.
| Financial Assets and Liabilities Measured at Fair Value | ||||||||||||||||
| on a Recurring Basis at December 31, 2021 Using | ||||||||||||||||
| Quoted prices in | Other | Significant | ||||||||||||||
| Fair value at | active markets for | observable | unobservable | |||||||||||||
| December 31 | identical assets | inputs | inputs | |||||||||||||
| 2021 | (Level 1) | (Level 2) | (Level 3) | |||||||||||||
| Assets: | ||||||||||||||||
| Funds held in trust account | $ | 345,024 | $ | 345,024 | $ | — | $ | — | ||||||||
| Securities and other investments owned: | ||||||||||||||||
| Equity securities | 1,384,729 | 1,007,180 | — | 377,549 | ||||||||||||
| Corporate bonds | 7,632 | — | 7,632 | — | ||||||||||||
| Other fixed income securities | 2,606 | — | 2,606 | — | ||||||||||||
| Total securities and other investments owned | 1,394,967 | 1,007,180 | 10,238 | 377,549 | ||||||||||||
| Loans receivable, at fair value | 873,186 | — | — | 873,186 | ||||||||||||
| Total assets measured at fair value | $ | 2,613,177 | $ | 1,352,204 | $ | 10,238 | $ | 1,250,735 | ||||||||
| Liabilities: | ||||||||||||||||
| Securities sold not yet purchased: | ||||||||||||||||
| Equity securities | $ | 20,302 | $ | 20,302 | $ | — | $ | — | ||||||||
| Corporate bonds | 6,327 | — | 6,327 | — | ||||||||||||
| Other fixed income securities | 1,994 | — | 1,994 | — | ||||||||||||
| Total securities sold not yet purchased | 28,623 | 20,302 | 8,321 | — | ||||||||||||
| Mandatorily redeemable noncontrolling interests issued after November 5, 2003 | 4,506 | — | — | 4,506 | ||||||||||||
| Warrant liabilities | 12,938 | 12,938 | — | — | ||||||||||||
| Total liabilities measured at fair value | $ | 46,067 | $ | 33,240 | $ | 8,321 | $ | 4,506 | ||||||||
| Financial Assets and Liabilities Measured at Fair Value | ||||||||||||||||
| on a Recurring Basis at December 31, 2020 Using | ||||||||||||||||
| Quoted prices in | Other | Significant | ||||||||||||||
| Fair value at | active markets for | observable | unobservable | |||||||||||||
| December 31 | identical assets | inputs | inputs | |||||||||||||
| 2020 | (Level 1) | (Level 2) | (Level 3) | |||||||||||||
| Assets: | ||||||||||||||||
| Securities and other investments owned: | ||||||||||||||||
| Equity securities | $ | 670,340 | $ | 521,048 | $ | — | $ | 149,292 | ||||||||
| Corporate bonds | 3,195 | — | 3,195 | — | ||||||||||||
| Other fixed income securities | 1,913 | — | 1,913 | — | ||||||||||||
| Total securities and other investments owned | 675,448 | 521,048 | 5,108 | 149,292 | ||||||||||||
| Loans receivable, at fair value | 390,689 | — | — | 390,689 | ||||||||||||
| Total assets measured at fair value | $ | 1,066,137 | $ | 521,048 | $ | 5,108 | $ | 539,981 | ||||||||
| Liabilities: | ||||||||||||||||
| Securities sold not yet purchased: | ||||||||||||||||
| Equity securities | $ | 4,575 | $ | 4,575 | $ | — | $ | — | ||||||||
| Corporate bonds | 4,288 | — | 4,288 | — | ||||||||||||
| Other fixed income securities | 1,242 | — | 1,242 | — | ||||||||||||
| Total securities sold not yet purchased | 10,105 | 4,575 | 5,530 | — | ||||||||||||
| Mandatorily redeemable noncontrolling interests issued after November 5, 2003 | 4,700 | — | — | 4,700 | ||||||||||||
| Total liabilities measured at fair value | $ | 14,805 | $ | 4,575 | $ | 5,530 | $ | 4,700 | ||||||||
| Financial Assets and Liabilities Measured at Fair Value on a Recurring Basis at December 31, 2017, Using | ||||||||||||||||
| Fair value at December 31, 2017 | Quoted prices active markets identical assets (Level 1) | Other observable inputs (Level 2) | Significant unobservable inputs (Level 3) | |||||||||||||
| Assets: | ||||||||||||||||
| Securities and other investments owned: | ||||||||||||||||
| Common stocks and warrants | $ | 67,306 | $ | 38,960 | $ | — | $ | 28,346 | ||||||||
| Corporate bonds | 6,539 | — | 6,539 | — | ||||||||||||
| Fixed income securities | 2,329 | — | 2,329 | — | ||||||||||||
| Loans receivable | 33,713 | — | — | 33,713 | ||||||||||||
| Partnership interests and other | 31,883 | 686 | 5,093 | 26,104 | ||||||||||||
| Total assets measured at fair value | $ | 141,770 | $ | 39,646 | $ | 13,961 | $ | 88,163 | ||||||||
| Liabilities: | ||||||||||||||||
| Securities sold not yet purchased: | ||||||||||||||||
| Common stocks | $ | 19,145 | $ | 19,145 | $ | — | $ | — | ||||||||
| Corporate bonds | 1,175 | — | 1,175 | |||||||||||||
| Fixed income securities | 699 | — | 699 | — | ||||||||||||
| Partnership interests and other | 7,272 | 7,272 | — | — | ||||||||||||
| Total securities sold not yet purchased | 28,291 | 26,417 | 1,874 | — | ||||||||||||
| Mandatorily redeemable noncontrolling interests issued after November 5, 2003 | 4,478 | — | — | 4,478 | ||||||||||||
| Total liabilities measured at fair value | $ | 32,769 | $ | 26,417 | $ | 1,874 | $ | 4,478 | ||||||||
| Financial Assets and Liabilities Measured at Fair Value on a Recurring Basis at December 31, 2016, Using | ||||||||||||||||
| Fair value at December 31, 2016 | Quoted prices active markets identical assets (Level 1) | Other observable inputs (Level 2) | Significant unobservable inputs (Level 3) | |||||||||||||
| Assets: | ||||||||||||||||
| Securities and other investments owned: | ||||||||||||||||
| Common stocks | $ | 2,084 | $ | 1,785 | $ | — | $ | 299 | ||||||||
| Corporate bonds | 1,025 | — | 865 | 160 | ||||||||||||
| Partnership interests | 13,470 | — | 44 | 13,426 | ||||||||||||
| Total assets measured at fair value | $ | 16,579 | $ | 1,785 | $ | 909 | $ | 13,885 | ||||||||
| Liabilities: | ||||||||||||||||
| Securities sold not yet purchased: | ||||||||||||||||
| Corporate bonds | $ | 846 | $ | — | $ | 846 | $ | — | ||||||||
| Mandatorily redeemable noncontrolling interests issued after November 5, 2003 | 3,214 | — | — | 3,214 | ||||||||||||
| Contingent consideration | �� | 1,242 | — | — | 1,242 | |||||||||||
| Total liabilities measured at fair value | $ | 5,302 | $ | — | $ | 846 | $ | 4,456 | ||||||||
As of December 31, 2017, securities2021 and other investments owned included $3,590 of investment funds valued at NAV per share as a practical expedient. As such, total securities and other investments owned of $145,360 in the consolidated balance sheets at December 31, 2017 included investments in investment funds of $3,590 and securities and other investments owned in the amount of $141,770 as outlined in the fair value table above.
As of December 31, 2017 and December 31, 2016,2020, financial assets measured and reported at fair value on a recurring basis and classified within Level 3 were $88,163$1,250,735 and $13,885,$539,981, respectively, or 6.4%21.4% and 5.2%20.3%, respectively, of the Company’s total assets. In determining the fair value for these Level 3 financial assets, the Company analyzes various financial, performance and market factors to estimate the value, including where applicable, over-the-counter market trading activity.
The following table summarizes the significant unobservable inputs in the fair value measurement of level 3 financial assets and liabilities by category of investment and valuation technique as of December 31, 2021:
| Fair value at December 31, 2021 | Valuation Technique | Unobservable Input | Range | Weighted Average | ||||||||
| Assets: | ||||||||||||
| Equity securities | $ | 291,178 | Market approach | Multiple of EBITDA | 3.25x - 17.50x | 6.67x | ||||||
| Multiple of PV-10 | 0.60x - 0.65x | 0.61x | ||||||||||
| Multiple of Sales | 1.45x - 1.60x | 1.48x | ||||||||||
| Market price of related security | $0.84 - $51.43 | $42.13 | ||||||||||
| 74,157 | Discounted cash flow | Market interest rate | 14.8% | 14.8% | ||||||||
| 12,214 | Option pricing model | Annualized volatility | 0.30 - 2.80 | 0.74 | ||||||||
| Loans receivable at fair value | 873,186 | Discounted cash flow | Market interest rate | 6.0% - 38.0% | 26.3% | |||||||
| Total level 3 assets measured at fair value | $ | 1,250,735 | ||||||||||
| Liabilities: | ||||||||||||
| Mandatorily redeemable noncontrolling interests issued after November 5, 2003 | $ | 4,506 | Market approach | Operating income multiple | 6.0x | 6.0x | ||||||
The changes in Level 3 fair value hierarchy during the year ended December 31, 20172021 and 2016 is2020 are as follows:
| Level 3 | Level 3 Changes During the Period | Level 3 | |||||||||||||||||||||||
| Balance at | Fair | Relating to | Purchases, | Transfer in | Balance at | ||||||||||||||||||||
| Beginning of | Value | Undistributed | Sales and | and/or out | End of | ||||||||||||||||||||
| Year | Adjustments | Earnings | Settlements | of Level 3 | Period | ||||||||||||||||||||
| Year Ended December 31, 2021 | |||||||||||||||||||||||||
| Equity securities | $ | 149,292 | 88,804 | — | 138,766 | 687 | 377,549 | ||||||||||||||||||
| Loans receivable at fair value | 390,689 | 10,035 | 10,952 | 461,510 | — | 873,186 | |||||||||||||||||||
| Mandatorily redeemable noncontrolling interests issued after November 5, 2003 | 4,700 | — | (194 | ) | — | — | 4,506 | ||||||||||||||||||
| Warrant liabilities | — | — | — | 10,466 | (10,466 | ) | — | ||||||||||||||||||
| Year Ended December 31, 2020 | |||||||||||||||||||||||||
| Equity securities | $ | 109,251 | $ | (4,358 | ) | $ | — | $ | 54,178 | $ | (9,779 | ) | $ | 149,292 | |||||||||||
| Loans receivable at fair value | 43,338 | (22,033 | ) | 4,409 | 139,127 | 225,848 | 390,689 | ||||||||||||||||||
| Mandatorily redeemable noncontrolling interests issued after November 5, 2003 | 4,616 | — | 84 | — | — | 4,700 | |||||||||||||||||||
| Level 3 | Level 3 Changes During the Year | |||||||||||||||||||||||
| Balance at Beginning of Year | Fair Value Adjustments | Relating to Undistribute Earnings | Purchases, Sales and Settlements | Transfer in and/or out of Level 3 | Level 3 Balance at End of Year | |||||||||||||||||||
| Year Ended December 31, 2017 | ||||||||||||||||||||||||
| Common stocks and warrants | $ | 299 | $ | 3,028 | $ | 3,419 | $ | 21,600 | $ | — | $ | 28,346 | ||||||||||||
| Corporate bonds | 160 | — | — | — | (160 | ) | — | |||||||||||||||||
| Loans receivable | — | 1,447 | — | 32,266 | — | 33,713 | ||||||||||||||||||
| Partnership interests and other | 13,426 | 3,465 | — | 9,213 | — | 26,104 | ||||||||||||||||||
| Mandatorily redeemablenoncontrolling interests issued after November 5, 2003 | 3,214 | 9,000 | (8,542 | ) | — | 806 | 4,478 | |||||||||||||||||
| Contingent consideration | 1,242 | 8 | — | (1,250 | ) | — | — | |||||||||||||||||
| Year Ended December 31, 2016 | ||||||||||||||||||||||||
| Common stocks | $ | 290 | $ | — | $ | — | $ | 9 | $ | — | $ | 299 | ||||||||||||
| Corporate bonds | — | — | — | 160 | — | 160 | ||||||||||||||||||
| Partnership interests | 1,766 | 2,294 | 1,366 | 8,000 | — | 13,426 | ||||||||||||||||||
| Mandatorily redeemable noncontrolling interests issued after November 5, 2003 | 2,330 | 800 | 84 | — | — | 3,214 | ||||||||||||||||||
| Contingent consideration | 2,391 | 101 | — | (1,250 | ) | — | 1,242 | |||||||||||||||||
TheUnder ASC 326, the Company elected the irrevocable fair value adjustmentoption for contingent consideration of $8 and $101 represents imputed interest forall outstanding loans receivable that were measured at amortized cost. The loans receivable, at fair value are included in transfers into level 3 fair value assets in the above table.
The amounts reported in the table above during the years ended December 31, 20172021 and 2016, respectively. The Company had a triggering event in 2017 for the mandatorily redeemable noncontrolling interests that resulted in a fair value adjustment of $7,850 of the total fair value adjustment of $9,000 for the year ended December 31, 2017. In connection with this event, the Company received proceeds of $6,000 from key man life insurance. These amounts have been recorded in the consolidated statements of income in Selling, general and administrative expenses in the corporate segment. The amount reported in the table above also for the years ended December 31, 2017 and 2016 includes2020 include the amount of undistributed earnings attributable to the noncontrolling interests that is distributed on a quarterly basis.
The carrying amounts reported in the consolidated financial statements for cash and cash equivalents, restricted cash, accounts receivable, accounts payable accrued payroll and related, accrued value added tax, income taxes payable and accrued expenses and other current liabilities approximate fair value based on the short-term maturity of these instruments.
Changes in the Level 3 fair value hierarchy during the year ended December 31, 2021 included the fair value of warrant liabilities associated with BRPM 150 and BRPM 250. The value of these warrants transferred from Level 3 to Level 1 of the fair value hierarchy when the public warrants started trading in the over-the-counter markets after the initial public offering.
As of December 31, 2021 and 2020, the senior notes payable had a carrying amount of $1,606,560 and $870,783, respectively, and a fair value of $1,661,189 and $898,606, respectively. The carrying amount of the senior notes payableterm loan approximates fair value because the contractual interest rates or effective yieldsyield of such instruments areinstrument is consistent with current market rates of interest for instruments of comparable credit risk.
The investments in nonpublic entities that do not report NAV are measured at cost, adjusted for observable price changes and impairments, with changes recognized in trading income (losses) and fair value adjustments on loans on the consolidated statements of income. These investments are evaluated on a nonrecurring basis based on the observable price changes in orderly transactions for the identical or similar investment of the same issuer. Further adjustments are not made until another observable transaction occurs. Therefore, the determination of fair values of these investments in nonpublic entities that do not report NAV does not involve significant estimates and assumptions or subjective and complex judgments. Investments in nonpublic entities that do not report NAV are subject to a qualitative assessment for indicators of impairment. If indicators of impairment are present, the Company is required to estimate the investment’s fair value and immediately recognize an impairment charge in an amount equal to the investment’s carrying value in excess of its estimated fair value.
During the years ended
As of December 31, 2017, 20162021 and 2015,2020, except for the impact of the intangible impairment charge in 2020 as described in Note 8 – Goodwill and Intangible Assets, there were no additional assets or liabilities measured at fair value on a non-recurring basis.
(t)(u) Derivative and Foreign Currency Translation
The Company periodically uses derivative instruments, which primarily consist of the purchase of forward exchange contracts, for certain auctionloans receivable and liquidationAuction and Liquidation engagements with operations outside the United States. During the year ended December 31, 2017, the Company’s use of derivative consisted of the purchase of forward exchange contracts (a) in the amount of $8,000 Australian dollars that was settled on March 31, 2017; (b) in the amount of $27,100 Canadian dollars, of which $20,703 remained open at December 31, 2017 and will settle in 2018, and (b) $1,500 Euro’s that will settle in 2018. During the year ended December 31, 2016,2020, the Company’s use of derivatives consisted of the purchase of forward exchange contracts (a) in the amount of $10,200 Canadian dollars that was settled at various periods prior to August12,700 Euros, of which 6,700 Euros were settled. As of December 31, 2016, (b) 5,600 Euro’s that was settled on December 30, 20162021 and (c) $20,000 Australian dollars that was settled on December 30, 2016 and another $25,000 Australian dollars that was settled on January 31, 2017.2020, forward exchange contracts in the amount of 6,000 Euros were outstanding.
The forward exchange contract wascontracts were entered into to improve the predictability of cash flows related to a retail store liquidation engagement that was completed in December 2016.and a loan receivable. The net gain from forward exchange contracts was $31$1,052 and $13net loss was $285 during the years ended December 31, 20172021 and 2015,2020, respectively. The net loss from forward exchange contracts was $117 during the years ended December 31, 2016. This amount is reported as a component of Selling,selling, general and administrative expenses in the consolidated statements of income.
The Company transacts business in various foreign currencies. In countries where the functional currency of the underlying operations has been determined to be the local country’s currency, revenues and expenses of operations outside the United States are translated into United States dollars using average exchange rates while assets and liabilities of operations outside the United States are translated into United States dollars using year-endperiod-end exchange rates. The effects of foreign currency translation adjustments are included in stockholders’ equity as a component of accumulated other comprehensive income in the accompanying consolidated balance sheets. Transaction lossesgains (losses) were $786, $848$1,256, ($639), and $271($238), during the years ended December 31, 2017, 20162021, 2020, and 2015,2019, respectively. These amounts are included in selling, general and administrative expenses in ourthe Company’s consolidated statements of income.
As disclosed in Note 2(ab) below, the Company has consolidated two VIE’s, BRPM 150 and BRPM 250, which have outstanding warrants that were issued in their respective initial public offerings. The warrants have been recorded as a liability since the warrants contain a provision to be settled in cash in the event of a qualifying cash tender offer, which is outside the control of the Company, for both BRPM 150 and BRPM 250. The outstanding warrants are considered derivative instruments with the warrant liability measured at fair value at each reporting date until exercised, with changes in fair value reported in other income in the consolidated statements of income. As of December 31, 2021, the warrant liability totaled $12,938 which is included in accrued expenses and other liabilities in the consolidated balance sheets.
(u)(v) Redeemable Noncontrolling Interests in Equity of Subsidiaries
The Company records redeemable noncontrolling interests in equity of subsidiaries to reflect the economic interests of the class A ordinary shareholders in BRPM 150 and BRPM 250 sponsored SPACs. These interests are presented as redeemable noncontrolling interests in equity of subsidiaries within the consolidated balance sheets, outside of the permanent equity section. The class A ordinary shareholders of BRPM 150 and BRPM 250 have redemption rights that are considered to be outside of the Company’s control. As of December 31, 2021, the carrying amount of the redeemable noncontrolling interest in equity of subsidiaries was recorded at its redemption value of 345,000. Remeasurements to the redemption value of the redeemable noncontrolling interest in equity of subsidiaries are recorded within retained earnings. Such remeasurements totaled $18,182, comprising of offering costs incurred in connection with the sale of class A shares of SPAC 150 and SPAC 250 in the amount of $7,716 and initial valuation of the public warrants of SPAC 150 and SPAC 250 in the amount of $10,466.
(w) Common Stock Warrants
The Company issued 821,816 warrants to purchase common stock of the Company (the “Wunderlich Warrants”) in connection with the acquisition of Wunderlich Securities, Inc. (“Wunderlich”) on July 3, 2017. The common stock warrantsWunderlich Warrants entitle the holders of the warrants to acquire shares of the Company’s common stock from the Company at aan exercise price of $17.50 per share, (the “Exercise Price”), subject to, among other matters, the proper completion of an exercise notice and payment. The Exercise Priceexercise price and the number of shares of Company common stock issuable upon exercise are subject to customary anti-dilution and adjustment provisions, which include stock splits, subdivisions or reclassifications of the Company’s common stock. On May 16, 2019, the Company repurchased 638,311 warrants for $2,777 ($4.35 per warrant). On June 11, 2020, 167,352 warrants held in escrow from the acquisition of Wunderlich were cancelled in accordance with the terms of the escrow instructions. The common stock warrantsWunderlich Warrants expire on July 3, 2022. All warrants were exercised in the third quarter of fiscal year 2021. As of December 31, 2021 and 2020, zero and 16,153 Wunderlich Warrants to purchase shares of common stock, respectively, were outstanding.
On October 28, 2019, the Company issued 200,000 warrants to purchase common stock of the Company (the “BR Brands Warrants”) in connection with the acquisition of a majority ownership interest in BR Brand Holdings LLC. The BR Brands Warrants entitle the holders of the warrants to acquire shares of the Company’s common stock from the Company at an exercise price of $26.24 per share. One-third of the BR Brands Warrants immediately vested and became exercisable upon issuance, and the remaining two-thirds of warrants will vest and become exercisable following the first and/or second anniversaries of the closing, subject to BR Brands’ (or another related joint venture with Bluestar Alliance LLC) satisfaction of specified financial performance targets. The BR Brands warrants expire three years after the last vesting event occurs. As of December 31, 2021 and 2020, 200,000 BR Brands warrants were outstanding.
(x) Equity Investment
As of December 31, 2021 and 2020, equity investments of $39,190 and $54,953, respectively, were included in prepaid expenses and other assets in the accompanying consolidated balance sheets. The Company’s share of earnings or losses from equity method investees is included in gain (loss) from equity investments in the accompanying consolidated statements of income.
bebe stores, inc.
As of December 31, 2021 and 2020, the Company had a 40.1% and 39.5% ownership interest, respectively, in bebe stores, inc. (“bebe”). In December 2021, the Company purchased an additional 71,970 shares of newly issued common stock of bebe for $612 and increased its ownership interest from 39.5% to 40.1%. The equity ownership in bebe is accounted for under the equity method of accounting and is included in prepaid expenses and other assets in the consolidated balance sheets.
National Holdings Corporation
As of December 31, 2020, the Company owned approximately 45% of the commons stock of National which was included in prepaid expenses and other assets in the consolidated balance sheets. The equity ownership in National is accounted for under the equity method of accounting for periods prior to February 25, 2021. On February 25, 2021, the Company completed the acquisition of National by acquiring the 55% of common stock not previously owned by the Company pursuant to an agreement and plan of merger dated January 10, 2021, following the successful completion of a tender offer commenced by us on January 27, 2021. The cash consideration for the purchase of the 55% of common stock not previously owned by the Company and settlement of outstanding share based awards was $35,314. National’s operating results subsequent to February 25, 2021 is included in the Company’s consolidated financial statements.
Other Equity Investments
The Company has other equity investments over which the Company exercises significant influence but do not meet the requirements for consolidation, the largest ownership interest being a 40% ownership interest in Lingo Management, LLC (“Lingo”) which was acquired in November 2020. The equity ownership in these other investments was accounted for under the equity method of accounting and is included in prepaid expenses and other assets in the consolidated balance sheets.
(v)(y) Loan Participations Sold
As of December 31, 2021, the Company has sold investments (“Loan Participations Sold”) to third parties (“Participants”) that are accounted for as secured borrowings under ASC 860 - Transfers and Servicing. Under ASC 860, a partial loan transfer does not qualify for sale accounting. A participation or other partial loan transfer that meets the definition of a participating interest is classified as loan receivable and the portion transferred is recorded as a secured borrowing under loan participations sold in the consolidated balance sheets. The Participants are entitled to payments made by the borrower of the related loan equal to the current Loan Participations Sold outstanding at the interest rates for the respective investment. In the event that the borrower defaults, the Participants have rights to payments from such borrower, but do not have recourse to the Company. The terms of the Loan Participations Sold are commensurate with the terms of the related loan.
As of December 31, 2021, there were no outstanding loan participations. As of December 31, 2020, the Company had entered into participation agreements for a total of $17,316. In addition, the interest income and interest expense related to the Loan Participations Sold resulted in interest income and interest expense which is presented gross on the consolidated statements of income.
(z) Supplemental Non-cash Disclosures
During the year ended December 31, 2021, non-cash investing activities included: the repayment of a loan receivable in full in the amount of $133,453 with equity securities, a $51,000 note receivable issued for the sale of equity securities to a third party, $35,000 of loans receivable exchanged for newly issued debt securities, the repayment of a $2,800 loan with equity securities, and $200 of loans receivable were converted to equity. During the year ended December 31, 2021, other non-cash activities included the recognition of new operating lease right-of-use assets of $18,862 and the recognition of new operating lease liabilities of $20,137.
During the year ended December 31, 2020, non-cash investing activities included $11,133 non-cash conversions of equity method investments and $26,238 conversion of loans receivable to shares of stock. In connection with the purchase of a loan receivable in the amount of $61,687, the Company funded $24,434 in cash and the remaining $37,253 remains payable as a note payable as of December 31, 2020. During the year ended December 31, 2020, other non-cash activities included the recognition of new operating lease right-of-use assets of $8,915 and the recognition of new operating lease liabilities of $8,915.
During the year ended December 31, 2019, non-cash activities included the conversion of loans receivable in the amount of $12,209 into securities and other investments owned, the recognition of new operating right-of-use assets of $1,032, the recognition of new operating lease liabilities of $1,032 and the issuance of warrants to purchase the Company’s stock in the amount of $990 related to the purchase of BR Brand.
(aa) Reclassifications
Certain prior period amounts have been reclassified to conform with the current period presentation. Such reclassifications consist of a reclass of unbilled receivables from accounts receivables, net, to contract assets that is included in prepaid expenses and other assets and a reclass of advances against customer contracts to contract assets that is included in prepaid expenses and other assets on the consolidated balance sheets. Certain amounts reported in the Capital Markets segment during the years ended December 31, 2020 and 2019 have been reclassified and reported in the Financial Consulting and Wealth Management segments during the years ended December 31, 2020 and 2019 as a result of the organizational changes that created the new Financial Consulting segment in the fourth quarter of 2020 and Wealth Management segment in the first quarter of 2021.
(ab) Variable Interest Entity
The Company holds interests in various entities that meet the characteristics of a VIE but are not consolidated as the Company is not the primary beneficiary. Interests in these entities are generally in the form of equity interests, loans receivable, or fee arrangements.
The Company determines whether it is the primary beneficiary of a VIE at the time it becomes involved with a VIE and reconsiders that conclusion at each reporting date. In evaluating whether the Company is the primary beneficiary, the Company evaluates its economic interests in the entity held either directly by the Company or indirectly through related parties. The consolidation analysis can generally be performed qualitatively; however, if it is not readily apparent that the Company is not the primary beneficiary, a quantitative analysis may also be performed.
In November 2020, the Company invested in Lingo Management, LLC (“Lingo”), a joint venture with an unaffiliated third party. On March 10, 2021, the Company also extended a promissory note to Lingo Communications, LLC (a wholly owned subsidiary of Lingo). Lingo is a VIE because the entity does not have enough equity at risk to finance its activities without additional subordinated financial support. The Company has determined that it is not the primary beneficiary because it does not have the power to direct the activities of the VIE that most significantly impact the entity’s financial performance. The Company’s variable interests in Lingo include loans receivable at fair value and an equity investment accounted for under the equity method of accounting.
The Company, through its newly acquired subsidiary, National, has entered into agreements to provide investment banking and advisory services to numerous investment funds (the “Funds”) that are considered variable interest entities under the accounting guidance.
The Company earns fees from the Funds in the form of placement agent fees and carried interest. For placement agent fees, the Company receives a cash fee of generally 7% to 10% of the amount of raised capital for the Funds and the fee is recognized at the time the placement services occurred. The Company receives carried interest as a percentage allocation (8% to 15%) of the profits of the Funds as compensation for asset management services provided to the Funds and it is recognized under the ownership model of ASC “Topic 323: Investments – Equity Method and Joint Ventures” as an equity method investment with changes in allocation recorded currently in the results of operations. As the fee arrangements under such agreements are arm’s length and contain customary terms and conditions and represent compensation that is considered fair value for the services provided, the fee arrangements are not considered variable interests and accordingly, the Company does not consolidate such VIEs.
Placement agent fees attributable to such arrangements during the year ended December 31, 2021 were $66,263 and are included in services and fees in the consolidated statements of income.
The carrying amounts for the Company’s variable interests in VIEs that were not consolidated is shown below.
| December 31, 2021 | ||||
| Securities and other investments owned, at fair value | $ | 27,445 | ||
| Loans receivable, at fair value | 205,265 | |||
| Other assets | 4,956 | |||
| Maximum exposure to loss | $ | 237,666 | ||
B. Riley Principal 150 and 250 Merger Corporations
During the year ended December 31, 2021, the Company along with BRPM 150 and BRPM 250, both newly formed SPACs incorporated as Delaware corporations, consummated the initial public offerings of 17,250,000 units of BRPM 150 and 17,250,000 units of BRPM 250. Each Unit of BRPM 150 and BRPM 250 consisted of one share of class A common stock and one-third of one redeemable warrant, each whole warrant entitling the holder thereof to purchase one share of BRPM 150 or BRPM 250 class A common stock at an exercise price of $11.50 per share. The BRPM 150 and BRPM 250 Units were each sold at a price of $10.00 per unit, generating gross proceeds to BRPM 150 of $172,500 and BRPM 250 of $172,500. These proceeds which totaled $345,000 were deposited in a trust account established for the benefit of the BRPM 150 and BRPM 250 class A public shareholders and is included in prepaid expenses and other assets in the consolidated balance sheets as of December 31, 2021. These proceeds are invested only in U.S. treasury securities in accordance with the governing documents of BRPM 150 and BRPM 250. Under the terms of the BRPM 150 and BRPM 250 initial public offerings, BRPM 150 and BRPM 250 are required to consummate a business combination transaction within 24 months (or 27 months under certain circumstances) of the completion of their respective initial public offerings.
In connection with the completion of the initial public offerings of BRPM 150 and BRPM 250, the Company invested in the private placement units of BRPM 150 and BRPM 250. Both BRPM 150 and BRPM 250 are determined to be VIE’s because each of the entities do not have enough equity at risk to finance their activities without additional subordinated financial support. The Company has determined that the class A shareholders of BRPM 150 and BRPM 250 do not have substantive rights as shareholders of BRPM 150 and BRPM 250 since these equity interests are determined to be temporary equity. As such, the Company has determined that it is the primary beneficiary of BRPM 150 and BRPM 250 as it has the right to receive benefits or the obligation to absorb losses of each entity, as well as the power to direct a majority of the activities that significantly impact BRPM 150 and BRPM 250’s economic performance. Since the Company is determined to be the primary beneficiary, BRPM 150 and BRPM 250 are consolidated into the Company’s financial statements.
(ac) Recent Accounting PronouncementsStandards
Not yet adopted
In March 2020, FASB issued ASU No. 2020-04, Reference Rate Reform (Topic 848),which provided optional guidance for a limited period of time to ease potential accounting impacts associated with transitioning away from reference rates that are expected to be discontinued, such as the London Interbank Offered Rate (“LIBOR”). The amendments applied only to contracts, hedging relationships, and other transactions that reference LIBOR or another reference rate expected to be discontinued. In January 2021, the FASB issued ASU 2021-01, Reference Rate Reform (Topic 848), which refined the scope of Topic 848 through optional expedients and exceptions when accounting for derivative contracts and certain hedging relationships. The amendments were effective through December 31, 2022. The Company is currently assessing the potential impacts of this ASU and does not expect it to have any material impact on its consolidated results of operations, cash flows, financial position or disclosures.
In February 2016,October 2021, the Financial Accounting Standards Board (the “FASB”) issued ASU No. 2016-02:Accounting Standards Update (“ASU”) 2021-08, LeasesBusiness Combinations (Topic 842) (“ASU 2016-02").805): Accounting for Contract Assets and Contract Liabilities from Contracts with Customers to require acquiring entities to apply Topic 606 when recognizing and measuring contract assets and contract liabilities instead of only recognizing such items at fair value on the acquisition date. The update addressed diversity in practice related to the acquired contract liability and payment terms and their effect on subsequent revenue recognized by the acquirer. The amendments in this update require lessees, among other things, to recognize lease assets and lease liabilities on the balance sheet for those leases classified as operating leases under previous authoritative guidance. This update also introduces new disclosure requirements for leasing arrangements. ASU 2016-02 will beare effective for the Company inbeginning with fiscal year 2019, but2023, with early application is permitted.adoption permitted, and should be applied prospectively to business combinations after the adoption date. The Company is currently evaluatingassessing the impactpotential impacts of this updateASU and does not expect it to have any material impact on theits consolidated results of operations, cash flows, financial statements.position or disclosures.
Recently adopted
In February 2018,December 2019, the FASB issued ASU 2018-02,2019-12, Income Statement - Reporting Comprehensive IncomeTaxes (Topic 220)740): Reclassification of Certain Tax Effects from Accumulated Other Comprehensive Income that provides for the reclassification from accumulated other comprehensive income to retained earnings for stranded effects resulting from the Tax Cuts and Jobs Act of 2017. The accounting update is effective for the fiscal year beginning after December 15, 2018 and early adoption is permitted. The accounting update should be applied either in the period of adoption or retrospectively to each period in which the effect of the change in the U.S. federal corporate income tax rate in the Tax Act of 2017 is recognized. We are currently evaluating the impact of the accounting update, but the adoption is not expected to have a material impact on our consolidated financial statements.
In August 2016, the FASB issued ASU 2016-15, Statement of Cash Flows (Topic 230): Classification of Certain Cash Receipts and Cash Payments (ASU 2016-15), which clarifies how companies present and classify certain cash receipts and cash payments in the statement of cash flows. ASU 2016-15 is effective for us in our first quarter of fiscal year 2019, but early application is permitted. The Company has not yet adopted this update and is currently evaluating the impact it may have on its financial condition and results of operations.
In January 2017, the FASB issued ASU 2017-04,Intangibles—Goodwill and Other (Topic 350) Simplifying the TestAccounting for Goodwill ImpairmentIncome Taxes. This standard simplifies the accounting for income taxes by removing certain exceptions for recognizing deferred taxes on investments, performing intra-period allocations, and calculating income taxes in interim periods. The ASU also adds guidance to reduce the complexity in certain areas, including recognizing deferred taxes for tax goodwill impairment.and allocating taxes to members of a consolidated group. Most amendments within the standard are required to be applied on a prospective basis, while certain amendments must be applied on a retrospective or modified retrospective basis. The guidance removes Step 2Company adopted the ASU effective January 1, 2021. The impact of adopting the ASU was immaterial to the consolidated results of operations, cash flows, financial position, and disclosures.
In January 2020, the FASB issued ASU 2020-01, Investments—Equity Securities (Topic 321), Investments—Equity Method and Joint Ventures (Topic 323), and Derivatives and Hedging (Topic 815)—Clarifying the Interactions between Topic 321, Topic 323, and Topic 815 to address accounting for the transition into and out of the goodwill impairment test, which requires a hypothetical purchase price allocation. Goodwill impairment will now beequity method and measuring certain purchased options and forward contracts to acquire investments. Entities are required to remeasure its investment immediately before the amount by which a reporting unit’s carrying value exceedstransition from the measurement alternative for an equity investment under ASC 321 to the equity method due to an observable transaction. Similarly, entities are required to remeasure its fair value, notinvestment immediately after the transition from the equity method to exceed the carrying amount of goodwill.ASC 321 due to an observable transaction. The revised guidance willamendments in this update should be applied prospectively and isat the beginning of the period that includes the adoption date. The Company adopted the ASU effective for calendar year-end SEC filers for its annual or any interim goodwill impairment tests in fiscal years beginning after December 15, 2019. Early adoption is permitted for interim or annual goodwill impairment tests performed on testing dates after January 1, 2017.2020. The Company has not yet adopted this update and currently evaluatingimpact of adopting the effect this new standard will have on its financial condition andASU was immaterial to the consolidated results of operations.
operations, cash flows, financial position, and disclosures.
In May 2014,August 2020, the FASB issued ASU No. 2014-09,2020-06, Revenue fromDebt – Debt with Conversion and Other Options (Subtopic 470-20) and Derivatives and Hedging-Contracts in Entity’s Own Equity (Subtopic 815-40): Accounting for Convertible Instruments and Contracts with Customers (Topic 606)in an Entity’s Own Equity which has subsequently been amended by ASU 2015-14, ASU 2016-08, ASU 2016-10, ASU 2016-12, and ASU 2017-13. These ASUs outline a single comprehensive model for entities to use insimplify the accounting for revenue arising fromcertain financial instruments with characteristics of liabilities and equity, including convertible instruments and contracts with customers and supersedes most current revenue recognition guidance, including industry-specific guidance. The guidance includes a five-step framework that requireson an entity to: (i) identify the contract(s) with a customer, (ii) identify the performance obligations in the contract, (iii) determine the transaction price, (iv) allocate the transaction price to the performance obligations in the contract, and (v) recognize revenue when the entity satisfies a performance obligation. In July 2015, the FASB deferred the effective date of ASU 2014-09 to annual reporting periods beginning after December 15, 2017. Early adoption will be permitted as of annual reporting periods beginning after December 15, 2016, including interim reporting periods within those annual periods. A full retrospective or modified retrospective approach is required. In addition, the new guidance will require enhanced disclosures, including revenue recognition policies to identify performance obligations to customers and significant judgments in measurement and recognition.
entity’s own equity. The Company has elected to applyadopted the ASU effective January 1, 2021. The amendments in this update can be applied through either a modified retrospective method andor fully retrospective method of transition. The impact of adopting the impactASU was determinedimmaterial to be immaterial on the consolidated results of operations, cash flows, financial statements. Accordingly, the new revenue standard will be applied prospectively in our consolidated financial statements from January 1, 2018 forwardposition, and reported financial information for historical comparable periods will not be revised and will continue to be reported under the accounting standards in effect during those historical periods.disclosures.
In October 2020, the FASB issued ASU 2020-08, Codification Improvements to Subtopic 310-20, Receivables-Nonrefundable Fees and Other Costs. The Company has performedamendments in this update clarify that an analysis and identified its revenues and costs that areentity should reevaluate whether a callable debt security is within the scope of the new guidance.paragraph 310-20-35-33 for each reporting period. The Company anticipatesadopted the ASU effective January 1, 2021. The amendments in this update should be applied prospectively and at the beginning of the period that its current methodsincludes the adoption date. The impact of recognizing revenues will not be significantly impacted byadopting the new guidance. ASU was immaterial to the consolidated results of operations, cash flows, financial position, and disclosures.
In addition, there may be certain situations where advisory fees are deferredOctober 2020, the FASB issued ASU 2020-09, Debt (Topic 470): Amendments to SEC Paragraphs Pursuant to SEC Release No. 33-10762. The amendments mostly apply to Topic 470 and not recognized, dependent upon performance obligationsrelate to financial disclosure requirements for SEC registrants and other situationsentities required to furnish information with the SEC. The Company adopted the ASU effective January 4, 2021. The impact of adopting the ASU was immaterial to the consolidated results of operations, cash flows, financial position, and disclosures.
In October 2020, the FASB issued ASU 2020-10, Codification Improvements to make incremental improvements to GAAP and address stakeholder suggestions, including, among other things, clarifying that will resultthe requirement to provide comparative information in the accelerationfinancial statements extends to the corresponding disclosures section. The Company adopted the ASU effective January 1, 2021. The amendments in this update should be applied retrospectively and at the beginning of the recognitionperiod that includes the adoption date. The impact of revenue on retail liquidation engagements that contain performance-based arrangements if certain predefined outcomes occur. The scope ofadopting the accounting update does not applyASU was immaterial to revenue associated with financial instruments, and as a result, will not have an impact on the elements of our consolidated statementsresults of operations, most closely associated with our secured lending businesscash flows, financial position, and proprietary trading income which includes interest income, proprietary trading income and interest expense. The adoption of the accounting update will not have a material impact on the Company’s consolidated financial statements. disclosures.
NOTE 3— ACQUISITIONS
In August 2021, the FASB issued ASU 2021-06, AcquisitionPresentation of WunderlichFinancial Statements (Topic 205) Financial Services—Depositary and Lending (Topic 942), and Financial Services— Investment Company, Inc.Companies (Topic 946).
On May 17, 2017, This update amends certain SEC paragraphs from the Company entered into a Merger Agreement (the “Wunderlich Merger Agreement”) with Wunderlich, a Delaware Corporation. PursuantCodification in response to the Wunderlich Merger Agreement, customary closing conditions were satisfiedissuance of SEC Final Rule Nos. 33-10786, Amendments to Financial Disclosures About Acquired and Disposed Businesses, which modified the significance test and improved disclosure requirements for acquired businesses and pro forma financial information. The Company adopted the SEC Final Rule effective January 1, 2021, and the acquisitionASU was completed on Julyadopted immediately. The impact of adopting the ASU was immaterial to the consolidated results of operations, cash flows, financial position, and disclosures.
NOTE 3 2017. In connection with the Wunderlich acquisition on July 3, 2017, the total consideration of $65,118 paid to Wunderlich shareholders was comprised of (a) cash in the amount of $29,737; (b) 1,974,812 newly issued shares of the Company’s common stock at closing which were valued at $31,495 for accounting purposes determined based on the closing market price of the Company’s shares of common stock on the acquisition date on July 3, 2017, less a 13.0% discount for lack of marketability as the shares issued are subject to certain escrow provisions and restrictions that limit their trade or transfer; and (c) 821,816 newly issued common stock warrants with an estimated fair value of $3,886. The common stock and common stock warrants issued includes 387,365 common shares and 167,352 common stock warrants that are held in escrow and subject to forfeiture to indemnify the Company for certain representations and warranties in connection with the acquisition. — RESTRUCTURING CHARGE
The Company believes that the acquisition of Wunderlich will allow the Company to benefit from wealth management, investment banking, corporate finance, and sales and trading services provided by Wunderlich. The acquisition of Wunderlich is accounted for using the purchase method of accounting. The Company also entered into a registration rights agreement with certain shareholders of Wunderlich (the “Registration Rights Agreement”) on July 3, 2017 for the shares issued in connection with the Wunderlich Merger Agreement. The Registration Rights Agreement provides the Wunderlich shareholders with the right to notice of and, subject to certain conditions, the right to register shares of the Company’s common stock in certain future registered offerings of shares of the Company’s common stock.
The assets and liabilities of Wunderlich, both tangible and intangible, were recorded at their estimated fair values as of the July 3, 2017, acquisition date for Wunderlich. The application of the purchase method of accounting resulted in goodwill of $34,638 which represents the benefits from synergies with our existing business and acquired workforce. Acquisition related costs, such as legal, accounting, valuation and other professional fees related to the acquisition of Wunderlich, were charged against earnings in the amount of $48 and included in selling, general and administrative expenses in the consolidated statements of income fordid not record any restructuring charges during the year ended December 31, 2017. The preliminary purchase accounting for the acquisition has been accounted for as a stock purchase with all of the recognized goodwill is expected to be non-deductible for tax purposes.
The preliminary purchase price allocation was as follows:
| Consideration paid by B. Riley: | ||||
| Cash paid | $ | 29,737 | ||
| Fair value of 1,974,812 B. Riley common shares issued | 31,495 | |||
| Fair value of 821,816 B. Riley common stock warrants issued | 3,886 | |||
| Total consideration | $ | 65,118 | ||
| Tangible assets acquired and assumed: | ||||
| Cash and cash equivalents | $ | 4,259 | ||
| Securities owned | 1,413 | |||
| Accounts receivable | 3,193 | |||
| Due from clearing broker | 15,133 | |||
| Prepaid expenses and other assets | 10,103 | |||
| Property and equipment | 2,315 | |||
| Deferred taxes | 7,568 | |||
| Accounts payable | (1,718 | ) | ||
| Accrued payroll and related expenses | (6,387 | ) | ||
| Accrued expenses and other liabilities | (9,773 | ) | ||
| Securities sold, not yet purchased | (1,707 | ) | ||
| Notes payable | (10,579 | ) | ||
| Customer relationships | 15,320 | |||
| Trademarks | 1,340 | |||
| Goodwill | 34,638 | |||
| Total | $ | 65,118 | ||
The revenue and loss of Wunderlich included in our consolidated financial statements for the period from July 3, 2017 (the date of acquisition) through December 31, 2017 were $41,491 and $2,283, respectively. The loss from Wunderlich of $2,283 includes a restructuring charge in the amount of $1,471 related primarily to severance costs and lease loss accruals for the planned consolidation of office space related to operations in the Capital Markets segment.
Acquisition of FBR & Co.
On February 17, 2017, the Company entered into an Agreement and Plan of Merger (the “FBR Merger Agreement”) with FBR, pursuant to which FBR was to merge with and into the Company (or a subsidiary of the Company), with the Company (or its subsidiary) as the surviving corporation (the “Merger”). On May 1, 2017, the Company and FBR filed a registration statement for the planned Merger. The stockholders of the Company and FBR approved the acquisition on June 1, 2017, customary closing conditions were satisfied and the acquisition was completed on June 1, 2017. Subject to the terms and conditions of the FBR Merger Agreement, each outstanding share of FBR common stock (“FBR Common Stock”) was converted into the right to receive 0.671 of a share of the Company’s common stock as summarized below.2021. The Company believes that the acquisition of FBR will allow the Company to benefit from investment banking, corporate finance, securities lending, research, and sales and trading services provided by FBR and planned synergies from the elimination of duplicate corporate overhead and management functions with the Company. The acquisition of FBR is accounted for using the purchase method of accounting.
The assets and liabilities of FBR, both tangible and intangible, were recorded at their estimated fair values as of the June 1, 2017 acquisition date for FBR. The application of the purchase method of accounting resulted in goodwill of $11,336 which represents expected overhead synergies and acquired workforce. Acquisition related costs, such as legal, accounting, valuation and other professional fees related to the acquisition of FBR, were charged against earnings in the amount of approximately $1,485 and included in selling, general and administrative expenses in the consolidated statements of income for the year ended December 31, 2017. The preliminary purchase accounting for the acquisition has been accounted for as a stock purchase with all of the recognized goodwill is expected to be non-deductible for tax purposes.
The preliminary purchase price allocation was as follows:
| Consideration paid by B. Riley: | ||||
| Number of FBR Common Shares outstanding at June 1, 2017 | 7,099,511 | |||
| Stock merger exchange ratio | 0.671 | |||
| Number of B. Riley common shares | 4,763,772 | |||
| Number of B. Riley common shares to be issued from acceleration of vesting for outstanding FBR stock options, restricted stock and RSU awards | 67,861 | |||
| Total number of B. Riley common shares to be issued | 4,831,633 | |||
| Closing market price of B. Riley common shares on December 31, 2016 | $ | 14.70 | ||
| Total value of B. Riley common shares | 71,025 | |||
| Fair value of RSU’s attributable to service period prior to June 1, 2017(a) | 2,446 | |||
| Total consideration | $ | 73,471 | ||
The preliminary assets acquired and assumed was as follows:
| Tangible assets acquired and assumed: | ||||
| Cash and cash equivalents | $ | 15,738 | ||
| Securities owned | 11,188 | |||
| Securities borrowed | 861,197 | |||
| Accounts receivable | 4,341 | |||
| Due from clearing broker | 29,169 | |||
| Prepaid expenses and other assets | 5,486 | |||
| Property and equipment | 8,663 | |||
| Deferred taxes | 17,706 | |||
| Accounts payable | (1,524 | ) | ||
| Accrued payroll and related expenses | (7,182 | ) | ||
| Accrued expenses and other liabilities | (22,411 | ) | ||
| Securities loaned | (867,626 | ) | ||
| Customer relationships | 5,600 | |||
| Tradename and other intangibles | 1,790 | |||
| Goodwill | 11,336 | |||
| Total | $ | 73,471 | ||
The revenue and loss of FBR included in our consolidated financial statements for the period from June 1, 2017 (the date of acquisition) through December 31, 2017 were $85,111 and $2,099, respectively. The loss from FBR of $2,099 includes transaction costs of $3,551 related to an employment agreement with the former Chief Executive Officer of FBR and restructuring charges in the amount of $9,669 related primarily to severance costs$1,557 and lease loss accruals for$1,699 during the planned consolidation of office space related to operations in the Capital Markets segment.
Acquisition of Rights to Manage Dialectic Hedge Funds
On April 13, 2017, the Company entered into an Asset Purchase and Assignment Agreement with Dialectic Capital Management, L.P., Dialectic Capital, LLC and John Fichthorn (collectively “Dialectic”), pursuant to which Dialectic assigned and transferred the rights to manage certain hedge funds to the Company (the “Dialectic Acquisition”). In addition to obtaining the rights to manage certain hedge funds previously managed by Dialectic, the Company hired the employees that were previously employed by the management company that managed the Dialectic hedge funds and assumed Dialectic’s office lease. In connection with the Dialectic Acquisition, the Company paid the Dialectic parties $700 in cash consideration and 158,484 shares of common stock which has a fair value of approximately $1,952 for total purchase consideration of $2,652. The Dialectic Acquisition expands the Company’s assets under management in the Capital Markets segment and the Company believes such acquisition will allow the Company to benefit from planned synergies from the elimination of duplicate administrative functions of the Company. The acquisition of Dialectic is accounted for using the purchase method of accounting.
The assets acquired from Dialectic were recorded at fair value as of April 13, 2017, the acquisition date of Dialectic. The application of the purchase method of accounting resulted in preliminary purchase allocation of $2,542 to goodwill, which represents expected overhead synergies and acquired workforce, and $110 to other intangible assets - customer relationship for total acquisition consideration of $2,652. There were no tangible assets or liabilities acquired in connection with Dialectic. Acquisition related costs, such as legal, accounting, valuation and other professional fees related to the acquisition of Dialectic, were charged against earnings in the amount of $72 and included in selling, general and administrative expenses in the consolidated statements of income for the yearyears ended December 31, 2017. The preliminary purchase accounting for the acquisition has been accounted for as an asset purchase with all of the recognized goodwill2020 and other intangible assets expected to be deductible for tax purposes.
The revenue and loss of Dialectic included in our consolidated statements of income for the period from April 13, 2017 (the date of acquisition) through December 31, 2017 were $909 and $793,2019, respectively.
Acquisition of United Online, Inc.
On May 4, 2016, the Company entered into a definitive agreement and plan of merger to acquire all of the outstanding common stock of UOL, a provider of consumer Internet access and related subscription services, for $11.00 per share, or approximately $169,354 in aggregate merger consideration plus an additional $1,352 of cash consideration paid to settle the legal matter as more fully described in Note 12. The shareholders of UOL approved the acquisition on June 29, 2016 and customary closing conditions were satisfied and the acquisition was completed on July 1, 2016. The acquisition of UOL allows the Company to benefit from the expected cash flows of UOL due in part to planned synergies from the elimination of duplicate overhead functions with the Company. Acquisition related costs, such as legal, accounting, valuation and other professional fees related to the acquisition of UOL, were charged against earnings in the amount of $674 and included in selling, general and administrative expenses in the consolidated statements of income for the year ended December 31, 2017. The acquisition of UOL is accounted for using the purchase method of accounting.
The assets and liabilities of UOL, both tangible and intangible, were recorded at their estimated fair values as of the July 1, 2016 acquisition date for UOL. The application of the purchase method of accounting resulted in goodwill of $14,375 which represents expected overhead synergies and acquired workforce. The revenue and earnings of UOL included in our consolidated statements of income for the year ended December 31, 2017 were $51,743 and $19,503, respectively. The revenue and earnings of UOL included in the consolidated statements of income for the period from July 1, 2016 (the date of acquisition) through December 31, 2016 were $31,521 and $5,716, respectively.
The preliminary purchase price allocation was as follows:
| Total consideration | $ | 169,354 | ||
| Tangible assets acquired and assumed: | ||||
| Cash and cash equivalents | $ | 125,542 | ||
| Restricted cash | 482 | |||
| Accounts receivables | 3,850 | |||
| Inventory | 624 | |||
| Property and equipment | 5,536 | |||
| Prepaid expenses and other assets | 5,876 | |||
| Accounts payable | (4,874 | ) | ||
| Accrued expenses and other liabilities | (8,886 | ) | ||
| Deferred revenue | (2,900 | ) | ||
| Deferred tax liabilities | (6,824 | ) | ||
| Other liabilities | (3,180 | ) | ||
| Customer relationships | 33,700 | |||
| Advertising relationships | 100 | |||
| Trade name and trademarks | 1,100 | |||
| Domain names | 1,500 | |||
| Internally developed software | 3,333 | |||
| Goodwill | 14,375 | |||
| $ | 169,354 |
Acquisition of MK Capital
On January 2, 2015 the Company entered into a purchase agreement to acquire all of the equity interests of MK Capital Advisors, LLC (“MK Capital”), a wealth management business with operations primarily in New York. On February 2, 2015, the closing conditions were satisfied and the Company completed the purchase of MK Capital for a total purchase price of $9,386. The purchase price is comprised of a cash payment in the amount of $2,500 and 333,333 newly issued shares of the Company’s common stock at closing which were valued at $2,687 for accounting purposes determined based on the closing market price of the Company’s shares of common stock on the acquisition date on February 2, 2015, less a 19.4% discount for lack of marketability as the shares issued are subject to certain restrictions that limit their trade or transfer. The purchase agreement also requires the payment of contingent consideration in the form of future cash payments with a fair value of $2,229 and the issuance of common stock with a fair value of $1,970. The contingent cash consideration of $2,229 was recorded based on the payment of the contingent cash consideration of $1,250 on the first anniversary date of the closing (February 2, 2016) and a final cash payment of $1,250 on the second anniversary date of the closing (February 2, 2017) to the former members of MK Capital discounted at 8.0% per annum (initial discount of $271). In accordance with ASC 805, “Business Combination” (“ASC 805"), the contingent consideration liability has been classified as a liability on the acquisition date. Imputed interest expense totaled $8 and $101 for the year ended December 31, 2017 and 2016, respectively. At December 31, 2016, the balance of the contingent consideration liability was $1,242 (discount of $8 at December 31, 2016) and has been recorded as contingent consideration liability in the consolidated balance sheets.
The fair value of the contingent stock consideration in the amount of $1,970 has been classified as equity in accordance with ASC 805, and is comprised of the issuance of 166,667 shares of common stock on the first anniversary date of the closing (February 2, 2016) and 166,666 shares of common stock on the second anniversary date of the closing (February 2, 2017). The contingent cash and stock consideration is payable on the first and second anniversary dates of the closing provided that MK Capital generates a minimum amount of gross revenues as defined in the purchase agreement for the twelve months ending on the first and second anniversary dates of the closing. MK Capital achieved the minimum amount of revenues for the first and second anniversary periods and the contingent cash consideration and contingent stock consideration for the first anniversary period was paid and issued on February 2, 2016 and for the second anniversary period was paid and issued on February 2, 2017. The MK Capital acquisition has been accounted for under the acquisition method of accounting. The assets and liabilities, both tangible and intangible, were recorded at their estimated fair values as of the February 2, 2015 acquisition date for MK Capital. The application of the acquisition method of accounting resulted in goodwill of $6,971 which is deductible for tax purposes. The acquisition of MK Capital allows the Company to expand into the wealth management business.
In connection with the issuance of common stock to the members of MK Capital, the Company entered into a registration rights agreement which allows the selling members of MK Capital to register their shares upon the Company filing a prospectus or registration statement at any time subsequent to the acquisition of MK Capital. The Company filed a registration statement with the Securities and Exchange Commission on May 22, 2015 that covers the resale of the common stock issued and potentially issuable in the acquisition of MK Capital, and such registration statement, as amended, was declared effective on July 2, 2015.
The purchase price allocation was as follows:
| Tangible assets acquired and assumed: | ||||
| Cash and cash equivalents | $ | 49 | ||
| Accounts receivable | 8 | |||
| Prepaid expenses and other assets | 30 | |||
| Property and equipment | 15 | |||
| Accounts payable and accrued liabilities | (87 | ) | ||
| Customer relationships | 2,400 | |||
| Goodwill | 6,971 | |||
| Total | $ | 9,386 | ||
Pro Forma Financial Information
The unaudited financial information in the table below summarizes the combined results of operations of the Company, Wunderlich, FBR and UOL, as though the acquisitions had occurred as of January 1, of the respective periods presented. The pro forma financial information presented includes the effects of adjustments related to the amortization charges from the acquired intangible assets and the elimination of certain activities excluded from the transaction and transaction related costs. The pro forma financial information as presented below is for informational purposes only and is not necessarily indicative of the results of operations that would have been achieved if the acquisition had taken place at the beginning of the earliest period presented, nor does it intend to be a projection of future results.
| Pro Forma (Unaudited) | ||||||||
| Year Ended December 31, | ||||||||
| 2017 | 2016 | |||||||
| Revenues | $ | 430,723 | $ | 464,587 | ||||
| Net income attributable to B. Riley Financial, Inc. | $ | 5,672 | $ | 1,754 | ||||
| Basic earnings per share | $ | 0.22 | $ | 0.07 | ||||
| Diluted earnings per share | $ | 0.21 | $ | 0.07 | ||||
| Weighted average basic shares outstanding | 26,150,502 | 24,972,700 | ||||||
| Weighted average diluted shares outstanding | 27,268,888 | 25,257,931 | ||||||
NOTE 4— RESTRUCTURING CHARGE
The Company recorded a restructuring charge in the amount of $12,374 during the year ended December 31, 2017. The Company implemented costs savings measures taking into account the planned synergies as a result of the acquisitions of FBR and Wunderlich, as more fully described in Note 3, which included a reduction in force for some of the corporate executives of FBR and Wunderlich and a restructuring to integrate FBR and Wunderlich’s operations with the Company’s existing operations. These initiatives resulted in a restructuring charge of $11,651 during the year ended December 31, 2017. The restructuring charges during the year ended December 31, 2017 included $2,4002020 were primarily related to severanceimpairment of certain acquired tradename intangibles associated with the Company’s brand realignment across its subsidiary companies to provide greater external consistency and $884 related to the accelerated vesting of restricted stock awards to former corporate executives of FBR and Wunderlich and $3,241 of severance and $1,710 related to accelerated vesting of stock awards to employees and $3,416 of lease loss accruals and impairments for the planned consolidation of office space related to operations of FBR and Wunderlich. Of the $11,651 of restructuring charges related to these initiatives, $7,855 related to the Capital Markets segment and $3,796 related to corporate overhead.affiliation. The restructuring chargecharges during the year ended December 31, 2017 also included employee termination2019 were primarily related to severance costs of $723 related tofor magicJack employees from a reduction in personnel in the principal investments – United Online segment of our operations.
During the third quarter of 2016, after completing the acquisition of UOL, the Company initiated cost savings measures which included a reduction in force for certain corporateworkforce and administrative employees of UOL. The reduction in work force resulted in a restructuring charge of $3,474 for employeelease termination costs in the Principal Investments - United Online segment during the year ended December 31, 2016. In the third quarter of 2016, the Company also entered into a sublease and consolidated one of the offices of the Company with the former corporate offices of UOL. The sublease resulted in a restructuring charge of $413 related to office closure costs.– Communications segment.
The following table summarizestables summarize the changes in accrued restructuring charge during the years ended December 31, 20172021, 2020, and 2016:2019:
| Accrued restructuring charge at December 31, 2015 | $ | 187 | ||
| Restructuring charge | 3,887 | |||
| Cash paid | (3,380 | ) | ||
| Non-cash items | — | |||
| Accrued restructuring charge at December 31, 2016 | 694 | |||
| Restructuring charge | 12,374 | |||
| Cash paid | (5,957 | ) | ||
| Non-cash items | (4,511 | ) | ||
| Accrued restructuring charge at December 31, 2017 | $ | 2,600 |
| Year Ended December 31, | ||||||||||||
| 2021 | 2020 | 2019 | ||||||||||
| Balance, beginning of year | $ | 727 | $ | 1,600 | $ | 3,855 | ||||||
| Restructuring charge | — | 1,557 | 1,699 | |||||||||
| Cash paid | (114 | ) | (901 | ) | (4,150 | ) | ||||||
| Non-cash items | 11 | (1,529 | ) | 196 | ||||||||
| Balance, end of year | $ | 624 | $ | 727 | $ | 1,600 | ||||||
The following tables summarize the restructuring activities by reportable segment during the years ended December 31, 20172020 and 2016:2019:
| Auction | Principal | |||||||||||||||||||||||
| Capital | Wealth | and | Financial | Investments - | ||||||||||||||||||||
| Markets | Management | Liquidation | Consulting | Communications | Total | |||||||||||||||||||
| Restructuring charges for the year ended December 31, 2020: | ||||||||||||||||||||||||
| Impairment of intangible assets | $ | 917 | $ | — | $ | 140 | $ | 500 | $ | — | $ | 1,557 | ||||||||||||
| Total restructuring charge | $ | 917 | $ | — | $ | 140 | $ | 500 | $ | — | $ | 1,557 | ||||||||||||
| Restructuring charges for the year ended December 31, 2019: | ||||||||||||||||||||||||
| Employee termination costs | $ | — | $ | — | $ | — | $ | — | $ | 1,594 | $ | 1,594 | ||||||||||||
| Facility closure and consolidation charge (recovery) | — | (4 | ) | — | — | 109 | 105 | |||||||||||||||||
| Total restructuring charge | $ | — | $ | (4 | ) | $ | — | $ | — | $ | 1,703 | $ | 1,699 | |||||||||||
| Year Ended December 31, | ||||||||||||||||||||||||||||||||
| 2017 | 2016 | |||||||||||||||||||||||||||||||
| Capital Markets | Principal Investments - United Online | Corporate | Total | Capital Markets | Principal Investments - United Online | Corporate | Total | |||||||||||||||||||||||||
| Restructuring charge: | ||||||||||||||||||||||||||||||||
| Employee termination costs | $ | 4,951 | $ | 723 | $ | 3,284 | $ | 8,958 | $ | — | $ | 3,474 | $ | — | $ | 3,474 | ||||||||||||||||
| Facility closure and consolidation charge | 2,904 | — | 512 | 3,416 | — | — | 413 | 413 | ||||||||||||||||||||||||
| Total restructuring charge | $ | 7,855 | $ | 723 | $ | 3,796 | $ | 12,374 | $ | — | $ | 3,474 | $ | 413 | $ | 3,887 | ||||||||||||||||
NOTE 5—4 — SECURITIES LENDING
As a result of the acquisition of FBR, the Company has an active securities borrowed and loaned business in which it borrows securities from one party and lends them to another. Securities borrowed and securities loaned are recorded based upon the amount of cash advanced or received. Securities borrowed transactions facilitate the settlement process and require the Company to deposit cash or other collateral with the lender. With respect to securities loaned, the Company receives collateral in the form of cash. The amount of collateral required to be deposited for securities borrowed, or received for securities loaned, is an amount generally in excess of the market value of the applicable securities borrowed or loaned. The Company monitors the market value of the securities borrowed and loaned on a daily basis, with additional collateral obtained, or excess collateral recalled, when deemed appropriate.
The following table presents the contractual gross and net securities borrowing and lending balances and the related offsetting amount as of December 31, 2017:2021 and 2020:
| Gross amounts recognized | Gross amounts offset in the consolidated balance sheets(1) | Net amounts included in the consolidated balance sheets | Amounts not offset in the consolidated balance sheets but eligible for offsetting upon counterparty default(2) | Net amounts | |||||||||||||||
| As of December 31, 2021 | |||||||||||||||||||
| Securities borrowed | $ | 2,090,966 | $ | — | $ | 2,090,966 | $ | 2,090,966 | $ | — | |||||||||
| Securities loaned | $ | 2,088,685 | $ | — | $ | 2,088,685 | $ | 2,088,685 | $ | — | |||||||||
| As of December 31, 2020 | |||||||||||||||||||
| Securities borrowed | $ | 765,457 | $ | — | $ | 765,457 | $ | 765,457 | $ | — | |||||||||
| Securities loaned | $ | 759,810 | $ | — | $ | 759,810 | $ | 759,810 | $ | — | |||||||||
| Amounts not | ||||||||||||||||||||
| offset in the | ||||||||||||||||||||
| consolidated balance | ||||||||||||||||||||
| Gross amounts | Net amounts | sheets but eligible | ||||||||||||||||||
| offset in the | included in the | for offsetting | ||||||||||||||||||
| Gross amounts | consolidated | consolidated | upon counterparty | |||||||||||||||||
| recognized | balance sheets(1) | balance sheets | default(2) | Net amounts | ||||||||||||||||
| As of December 31, 2017 | ||||||||||||||||||||
| Securities borrowed | $ | 807,089 | $ | — | $ | 807,089 | $ | 807,089 | $ | — | ||||||||||
| Securities loaned | $ | 803,371 | $ | — | $ | 803,371 | $ | 803,371 | $ | — | ||||||||||
| (1) | Includes financial instruments subject to enforceable master netting provisions that are permitted to be offset to the extent an event of default has occurred. |
| (2) | Includes the amount of cash collateral held/posted. |
NOTE 6—5 — ACCOUNTS RECEIVABLE
The components of accounts receivable, net, include the following:
| December 31, | December 31, | |||||||
| 2021 | 2020 | |||||||
| Accounts receivable | $ | 39,045 | $ | 33,604 | ||||
| Investment banking fees, commissions and other receivables | 14,286 | 10,316 | ||||||
| Total accounts receivable | 53,331 | 43,920 | ||||||
| Allowance for doubtful accounts | (3,658 | ) | (3,114 | ) | ||||
| Accounts receivable, net | $ | 49,673 | $ | 40,806 | ||||
| December 31, | December 31, | |||||||
| 2017 | 2016 | |||||||
| Accounts receivable | $ | 15,593 | $ | 16,610 | ||||
| Investment banking fees, commissions and other receivables | 4,199 | 576 | ||||||
| Unbilled receivables | 1,023 | 2,058 | ||||||
| Total accounts receivable | 20,815 | 19,244 | ||||||
| Allowance for doubtful accounts | (800 | ) | (255 | ) | ||||
| Accounts receivable, net | $ | 20,015 | $ | 18,989 | ||||
Additions and changes to the allowance for doubtful accounts consist of the following:
| Year Ended December 31, | ||||||||||||
| 2021 | 2020 | 2019 | ||||||||||
| Balance, beginning of period | $ | 3,114 | $ | 1,514 | $ | 696 | ||||||
| Add: Additions to reserve | 1,453 | 3,385 | 2,126 | |||||||||
| Less: Write-offs | (1,074 | ) | (1,785 | ) | (1,151 | ) | ||||||
| Less: Recovery | 165 | — | (157 | ) | ||||||||
| Balance, end of period | $ | 3,658 | $ | 3,114 | $ | 1,514 | ||||||
| Year Ended December 31, | ||||||||||||
| 2017 | 2016 | 2015 | ||||||||||
| Balance, beginning of year | $ | 255 | $ | 89 | $ | 728 | ||||||
| Add: Additions to reserve | 1,066 | 710 | 718 | |||||||||
| Less: Write-offs | (311 | ) | (194 | ) | (1,056 | ) | ||||||
| Less: Recoveries | (210 | ) | (350 | ) | (301 | ) | ||||||
| Balance, end of year | $ | 800 | $ | 255 | $ | 89 | ||||||
NOTE 6 — PREPAID EXPENSES AND OTHER ASSETS
Prepaid expenses and other assets consist of the following:
| December 31, | December 31, | |||||||
| 2021 | 2020 | |||||||
| Funds held in trust account | $ | 345,024 | $ | — | ||||
| Equity investments | 39,190 | 54,953 | ||||||
| Prepaid expenses | 14,965 | 7,371 | ||||||
| Unbilled receivables | 12,315 | 5,712 | ||||||
| Other receivables | 40,483 | 16,230 | ||||||
| Other assets | 11,525 | 8,908 | ||||||
| Prepaid expenses and other assets | $ | 463,502 | $ | 93,174 | ||||
Unbilled receivables represent the amount of contractual reimbursable costs and fees for services performed in connection with fee and service based auctioncontracts in the Auction and liquidation contracts.Liquidation segment, mobile handsets in the Principal Investments – Communications segment, and consulting related engagements in the Financial Consulting segment.
NOTE 7—7 — PROPERTY AND EQUIPMENT
Property and equipment, net, consists of the following:
| Estimated | December 31, | December 31, | ||||||||
| Useful Lives | 2021 | 2020 | ||||||||
| Leasehold improvements | Shorter of the remaining lease term or estimated useful life | $ | 13,766 | $ | 10,737 | |||||
| Machinery, equipment and computer software | 1.8 to 15 years | 16,624 | 15,650 | |||||||
| Furniture and fixtures | 5 years | 4,724 | 4,128 | |||||||
| Total | 35,114 | 30,515 | ||||||||
| Less: Accumulated depreciation and amortization | (22,244 | ) | (18,830 | ) | ||||||
| $ | 12,870 | $ | 11,685 | |||||||
| Estimated | December 31, | |||||||||
| Useful Lives | 2017 | 2016 | ||||||||
| Leasehold improvements | Shorter of the remaining lease term or estimated useful life | $ | 7,834 | $ | 2,325 | |||||
| Machinery, equipment and computer software | 3 to 5 years | 9,474 | 6,559 | |||||||
| Furniture and fixtures | 5 years | 2,688 | 1,921 | |||||||
| Total | 19,996 | 10,805 | ||||||||
| Less: Accumulated depreciation and amortization | (8,019 | ) | (5,020 | ) | ||||||
| $ | 11,977 | $ | 5,785 | |||||||
Depreciation expense was $3,718, $1,052$3,865, $3,632, and $417$5,202 during the years ended December 31, 2017, 20162021, 2020, and 2015,2019, respectively.
NOTE 8—8 — GOODWILL AND OTHER INTANGIBLE ASSETS
Goodwill was $250,568 and $227,046 as of December 31, 2021 and 2020, respectively.
The changes in the carrying amount of goodwill forduring the years ended December 31, 20172021 and 20162020 were as follows:
| Principal | ||||||||||||||||||||||||
| Capital | Wealth | Auction and | Financial | Investments- | ||||||||||||||||||||
| Markets | Management | Liquidation | Consulting | Communications | ||||||||||||||||||||
| Segment | Segment | Segment | Segment | Segment | Total | |||||||||||||||||||
| Balance as of December 31, 2019 | $ | 50,806 | $ | 28,396 | $ | 1,975 | $ | 20,331 | $ | 122,189 | $ | 223,697 | ||||||||||||
| Goodwill acquired during the year: | ||||||||||||||||||||||||
| Acquisition of other business | — | — | — | 3,349 | — | 3,349 | ||||||||||||||||||
| Balance as of December 31, 2020 | 50,806 | 28,396 | 1,975 | 23,680 | 122,189 | 227,046 | ||||||||||||||||||
| Goodwill acquired during the year: | ||||||||||||||||||||||||
| Acquisition of other business | 532 | 22,799 | — | — | 191 | 23,522 | ||||||||||||||||||
| Balance as of December 31, 2021 | $ | 51,338 | $ | 51,195 | $ | 1,975 | $ | 23,680 | $ | 122,380 | $ | 250,568 | ||||||||||||
| Principal | ||||||||||||||||||||
| Capital | Auction and | Valuation and | Investments- | |||||||||||||||||
| Markets | Liquidation | Appraisal | United Online | |||||||||||||||||
| Segment | Segment | Segment | Segment | Total | ||||||||||||||||
| Balance as of December 31, 2015 | $ | 28,840 | $ | 1,975 | $ | 3,713 | $ | — | $ | 34,528 | ||||||||||
| Goodwill acquired during the period: | — | — | — | 14,375 | 14,375 | |||||||||||||||
| United Online on July 1, 2016 | ||||||||||||||||||||
| Balance as of December 31, 2016 | 28,840 | 1,975 | 3,713 | 14,375 | 48,903 | |||||||||||||||
| Goodwill acquired during the period: | ||||||||||||||||||||
| Dialectic on April 13, 2017 | 2,542 | — | — | — | 2,542 | |||||||||||||||
| FBR on June 1, 2017 | 11,336 | — | — | — | 11,336 | |||||||||||||||
| Resolution of acquisition related legal matter on June 30, 2017 | — | — | — | 1,352 | 1,352 | |||||||||||||||
| Wunderlich on July 3, 2017 | 34,638 | — | — | — | 34,638 | |||||||||||||||
| Balance as of December 31, 2017 | $ | 77,356 | $ | 1,975 | $ | 3,713 | $ | 15,727 | $ | 98,771 | ||||||||||
Intangible assets consisted of the following:
| As of December 31, 2021 | As of December 31, 2020 | |||||||||||||||||||||||||
| Gross | Gross | |||||||||||||||||||||||||
| Carrying | Accumulated | Intangibles | Carrying | Accumulated | Intangibles | |||||||||||||||||||||
| Useful Life | Value | Amortization | Net | Value | Amortization | Net | ||||||||||||||||||||
| Amortizable assets: | ||||||||||||||||||||||||||
| Customer relationships | 0.1 to 16 Years | $ | 130,801 | $ | 59,671 | $ | 71,130 | $ | 98,898 | $ | 40,281 | $ | 58,617 | |||||||||||||
| Domain names | 7 Years | 185 | 143 | 42 | 235 | 148 | 87 | |||||||||||||||||||
| Advertising relationships | 8 Years | 100 | 69 | 31 | 100 | 56 | 44 | |||||||||||||||||||
| Internally developed software and other intangibles | 0.5 to 5 Years | 15,275 | 8,820 | 6,455 | 11,775 | 6,913 | 4,862 | |||||||||||||||||||
| Trademarks | 6 to 10 Years | 6,369 | 1,652 | 4,717 | 2,850 | 991 | 1,859 | |||||||||||||||||||
| Total | 152,730 | 70,355 | 82,375 | 113,858 | 48,389 | 65,469 | ||||||||||||||||||||
| Non-amortizable assets: | ||||||||||||||||||||||||||
| Tradenames | 125,276 | — | 125,276 | 125,276 | — | 125,276 | ||||||||||||||||||||
| Total intangible assets | $ | 278,006 | $ | 70,355 | $ | 207,651 | $ | 239,134 | $ | 48,389 | $ | 190,745 | ||||||||||||||
| December 31, 2017 | December 31, 2016 | |||||||||||||||||||||||||
| Gross | Gross | |||||||||||||||||||||||||
| Carrying | Accumulated | Intangibles | Carrying | Accumulated | Intangibles | |||||||||||||||||||||
| Useful Life | Value | Amortization | Net | Value | Amortization | Net | ||||||||||||||||||||
| Amortizable assets: | ||||||||||||||||||||||||||
| Customer relationships | 4 to 16 Years | $ | 58,330 | $ | 9,100 | $ | 49,230 | $ | 37,300 | $ | 3,100 | $ | 34,200 | |||||||||||||
| Domain names | 7 Years | 287 | 61 | 226 | 1,419 | 101 | 1,318 | |||||||||||||||||||
| Advertising relationships | 8 Years | 100 | 19 | 81 | 100 | 6 | 94 | |||||||||||||||||||
| Internally developed software and other intangibles | 0.5 to 4 Years | 3,373 | 1,445 | 1,928 | 3,333 | 550 | 2,783 | |||||||||||||||||||
| Trademarks | 7 to 8 Years | 4,190 | 447 | 3,743 | 1,100 | 69 | 1,031 | |||||||||||||||||||
| Total | 66,280 | 11,072 | 55,208 | 43,252 | 3,826 | 39,426 | ||||||||||||||||||||
| Non-amortizable assets: | ||||||||||||||||||||||||||
| Tradenames | 1,740 | — | 1,740 | 1,740 | — | 1,740 | ||||||||||||||||||||
| Total intangible assets | $ | 68,020 | $ | 11,072 | $ | 56,948 | $ | 44,992 | $ | 3,826 | $ | 41,166 | ||||||||||||||
Amortization expense was $7,422, $3,254$22,006, $15,737, and $431 for$13,846, during the years ended December 31, 2017, 20162021, 2020, and 2015,2019, respectively. AtAs of December 31, 2017,2021, estimated future amortization expense is $8,497, $8,376, $8,008, $7,617 and $7,592 forwas $20,116, $17,769, $13,832, $10,386, $10,410 during the years ended December 31, 2018, 2019, 2020, 20212022, 2023, 2024, 2025 and 2022,2026, respectively. The estimated future amortization expense after December 31, 2022 is $15,118.2026 was $9,861.
NOTE 9— LEASING ARRANGEMENTS
In the first quarter of 2020, in accordance with ASC 350, the Company made a qualitative assessment of the impact of the COVID-19 outbreak on goodwill and other intangible assets. The Company has several noncancellabledetermined that the COVID-19 outbreak was a triggering event for testing the indefinite-lived tradenames in the Brands segment and made a determination that the indefinite-lived tradenames in the Brands segment were impaired and the Company recognized an impairment charge of $4,000. As a result of the continuing impact and duration of the COVID-19 outbreak on the operations of the Brands segment, the Company determined that there was another triggering event for testing the indefinite-lived tradenames in the Brands segment and made a determination that the indefinite-lived tradenames in the Brands segment were impaired and the Company recognized an additional impairment charge of $8,500 in the second quarter of 2020. There have been no triggering events subsequent to the second quarter of 2020 for testing indefinite-lived tradenames in the Brands segment. The Company will continue to monitor the impacts of the COVID-19 outbreak in future quarters. Changes in our forecasts could cause the book values of indefinite-lived tradenames to exceed fair values which may result in additional impairment charges in future periods.
NOTE 9 — LEASING ARRANGEMENTS
The Company’s operating leases that expire at various dates through 2031. Future minimum lease payments under noncancellable operating leases (with initial or remainingassets primarily represent the lease terms in excess of one year)office space where the Company conducts its operations with the weighted average lease term of 7.4 years and 7.2 years as of December 31, 2017 were:
| Operating | ||||||
| Leases | ||||||
| Year Ending December 31: | ||||||
| 2018 | $ | 13,496 | ||||
| 2019 | 9,640 | |||||
| 2020 | 6,984 | |||||
| 2021 | 5,589 | |||||
| 2022 | 5,024 | |||||
| Thereafter | 16,369 | |||||
| Total minimum lease payments | $ | 57,102 | ||||
Rent expense under all2021 and 2020, respectively. The operating leases have lease terms up to 10 and 11 years as of December 31, 2021 and 2020, respectively. The weighted average discount rate used to calculate the present value of lease payments was $7,599, $3,2055.25% and $2,376 for5.55% as of December 31, 2021 and 2020, respectively. During the years ended December 31, 2017, 2016,2021, 2020, and 2015,2019, the total operating lease expense was $15,230, $13,434, and $12,582, respectively. RentDuring the years ended December 31, 2021, 2020, and 2019, $1,377, $1,225, and $1,289, respectively, of operating lease expense were attributable to variable lease expenses. Operating lease expense is included in Selling,selling, general and administrative expenses in the accompanying consolidated statements of income.
NOTE 10— CREDIT FACILITIESDuring the years ended December 31, 2021, 2020, and 2019, cash payments against operating lease liabilities totaled $15,509, $12,901, and $12,934 respectively, and non-cash lease expense transactions totaled $3,750, $3,314, and $3,679, respectively. Cash flows from operating leases are classified as net cash flows from operating activities in the accompanying consolidated statements of cash flows.
As of December 31, 2021, maturities of operating lease liabilities were as follows:
| Operating | ||||
| Leases | ||||
| Year ending December 31: | ||||
| 2022 | $ | 16,125 | ||
| 2023 | 12,629 | |||
| 2024 | 12,232 | |||
| 2025 | 11,417 | |||
| 2026 | 7,977 | |||
| Thereafter | 21,517 | |||
| Total lease payments | 81,897 | |||
| Less: imputed interest | (12,825 | ) | ||
| Total operating lease liability | $ | 69,072 | ||
As of December 31, 2021 and 2020, the Company did not have any significant leases executed but not yet commenced.
NOTE 10 — NOTES PAYABLE
Asset Based Credit facilities consist of the following arrangements:Facility
On April 21, 2017, the Company amended its credit agreement (as amended, the “Credit Agreement”) governing its asset based credit facility with Wells Fargo Bank, National Association (“Wells Fargo Bank”) to increase the maximum borrowing limit from $100,000 to $200,000. Such amendment, among other things, also extended the expiration date of the credit facility from July 15, 2018 to April 21, 2022. The Credit Agreement continues to allow for borrowings under the separate credit agreement (a “UK Credit Agreement”) which was dated March 19, 2015 with an affiliate of Wells Fargo Bank which provides for the financing of transactions in the United Kingdom. Such facility allows the Company to borrow up to 50 million British Pounds. Any borrowings on the UK Credit Agreement reduce the availability on the asset based $200,000 credit facility. The UK Credit Agreement is cross collateralized and integrated in certain respects with the Credit Agreement. The Credit Agreement continues to include the addition of our Canadian subsidiary, from the October 5, 2016 amendment to the Credit Agreement, to facilitate borrowings to fund retail liquidation transactions in Canada. Cash advances and the issuance of letters of credit under the credit facility are made at the lender’s discretion. The letters of credit issued under this facility are furnished by the lender to third parties for the principal purpose of securing minimum guarantees under liquidation services contracts more fully described in Note 2(c)2(e). All outstanding loans, letters of credit, and interest are due on the expiration date which is generally within 180 days of funding. The credit facility is secured by the proceeds received for services rendered in connection with liquidation service contracts pursuant to which any outstanding loan or letters of credit are issued and the assets that are sold at liquidation related to such contract. The Company paid Wells Fargo Bank a closing fee in the amount of $500 in connection with the April 2017 amendment to the Credit Agreement. The interest rate for each revolving credit advance under the Credit Agreement is, subject to certain terms and conditions, equal to the LIBOR plus a margin of 2.25% to 3.25% depending on the type of advance and the percentage such advance represents of the related transaction for which such advance is provided. The credit facility also provides for success fees in the amount of 2.5% to 17.5% of the net profits, if any, earned on the liquidation engagements funded under the Credit Agreement as set forth therein. Interest expense totaled $1,136 (including amortization of deferred loan fees of $123$435, $639, and success fee of $198), $1,113 (including amortization of deferred loan fees of $92 and success fee of $732) and $376 (including amortization of deferred loan fees of $92 and success fee of $127) for$1,503 during the years ended December 31, 2017, 20162021, 2020, and 2015,2019, respectively. There wasis no outstanding balance ofon this credit facility atas of December 31, 20172021 and 2020. As of December 31, 2016.2021 and 2020, there were no open letters of credit outstanding.
We are in compliance with all financial covenants in the asset based credit facility as of December 31, 2021.
Paycheck Protection Program
On April 10, 2020, NSC (a subsidiary of National) entered into a Promissory Note (the “NSC Note”) with Axos Bank as the lender (the “Lender”), pursuant to which the Lender agreed to make a loan to NSC under the Paycheck Protection Program (the “NSC Loan”) offered by the U.S. Small Business Administration (the “SBA”) pursuant to the Coronavirus Aid, Relief, and Economic Security (“CARES”) Act to qualified small businesses (the “PPP”) in a principal amount of $5,524. On April 15, 2020, WEC (another subsidiary of National) also entered into a Promissory Note (the “WEC Note” and together with the NSC Note, the “PPP Notes”) with the Lender, pursuant to which the Lender agreed to make a loan to WEC under the PPP (the “WEC Loan” and together with the NSC Loan, the “PPP Loans”) in a principal amount of $973.
The full amount of the Company’s PPP loans and accrued interest were forgiven in the amount of $6,509 in June 2021, and the Company recorded a gain on extinguishment of loans and other for this amount in the accompanying consolidated statements of income.
Other Notes Payable
Notes payable include notes payable to a clearing organization for one of the Company’s broker dealers. The notes payable accrue interest at the prime rate plus 2.0% (5.25% as of December 31, 2021) payable annually, maturing January 31, 2022. As of December 31, 2021 and 2020, the outstanding balance for the notes payable was $357 and $714, respectively. Interest expense was $21, $51, and $87 during the years ended December 31, 2021, 2020, and 2019, respectively.
Also included in notes payable as of December 31, 2020, was a $37,253 note payable to Garrison TNCI LLC which was assumed as part of the Company’s investment in Lingo Management LLC. The note accrued interest at 12.5% per annum and had a maturity date of March 31, 2021. During the years ended December 31, 2021 and 2020, interest expense on the note was $238 and $447, respectively. The note was paid in full in January 2021.
The
NOTE 11 — TERM LOANS AND REVOLVING CREDIT FACILITY
Nomura Credit Agreement
On June 23, 2021, the Company, and its wholly owned subsidiaries, BR Financial Holdings, LLC (the “Primary Guarantor”), and BR Advisory & Investments, LLC (the “Borrower”) entered into a credit agreement (as amended prior to the Second Amendment (as defined below) the “Credit Agreement”) with Nomura Corporate Funding Americas, LLC, as administrative agent (the “Administrative Agent”), and Wells Fargo Bank, N.A., as collateral agent (the “Collateral Agent”), for a four-year $200,000 secured term loan credit facility (the “Term Loan Facility”) and a four-year $80,000 secured revolving loan credit facility (the “Revolving Credit Facility”).
On December 17, 2021 (the “Amendment Date”), the Company, the Primary Guarantor, and the Borrower entered into a Second Incremental Amendment to Credit Agreement governing(the “Second Amendment”), by and among the creditCompany, the Primary Guarantor, the Borrower, each of the subsidiary guarantors signatory thereto, each of the lenders party thereto, the Administrative Agent and the Collateral Agent, pursuant to which the Borrower established an incremental facility contains certain covenants, including covenants that limit or restrictin an aggregate principal amount of $100,000 (the “Incremental Facility” and the Company’s ability to incur liens, incur indebtedness, make investments, disposeincremental term loans made thereunder, the “Incremental Term Loans”) of assets, make certain restricted payments, merge or consolidate and enter into certain transactions with affiliates. Upon the occurrence of an event of defaultsecured term loans under the Credit Agreement on terms identical to those applicable to the lender may cease makingTerm Loan Facility. The Borrower borrowed the full amount of the Incremental Term Loans on the Amendment Date. The Term Loan Facility, Revolving Credit Facility, and Incremental Facility, together, (“Credit Facilities”), mature on June 23, 2025, subject to acceleration or prepayment.
Eurodollar loans terminateunder the Credit Facilities accrue interest at the Eurodollar Rate plus an applicable margin of 4.50%. Base rate loans accrue interest at the Base Rate plus an applicable margin of 3.50%. In addition to paying interest on outstanding borrowings under the Revolving Credit Facility, the Company is required to pay a quarterly commitment fee based on the unused portion of the Revolving Credit Facility, which is determined by the average utilization of the facility for the immediately preceding fiscal quarter.
Subject to certain eligibility requirements, the assets of certain subsidiaries of the Company that hold credit assets, private equity assets, and public equity assets are placed into a borrowing base, which serves to limit the borrowings under the Credit Facilities. If borrowings under the facilities exceed the borrowing base, the Company is obligated to prepay the loans in an aggregate amount equal to such excess. The Credit Agreement and the Second Amendment contain certain representations and warranties (subject to certain agreed qualifications) that are customary for financings of this kind.
The Credit Agreement and the Second Amendment contain certain affirmative and negative covenants customary for financings of this type that, among other things, limit the Company’s, the Primary Guarantor’s, the Borrower’s, and the Borrower’s subsidiaries’ ability to incur additional indebtedness or liens, to dispose of assets, to make certain fundamental changes, to enter into restrictive agreements, to make certain investments, loans, advances, guarantees and acquisitions, to prepay certain indebtedness and to pay dividends or to make other distributions or redemptions/repurchases in respect of their respective equity interests. In addition, the Credit Agreement and declare all amounts outstanding under the Credit AgreementSecond Amendment contain a financial covenant that requires the Company to be immediately duemaintain Operating EBITDA of at least $135,000 and payable.the Primary Guarantor to maintain net asset value of at least $1,100,000. The Credit Agreement specifies a number ofand the Second Amendment contain customary events of default, (some of which are subjectincluding with respect to applicable grace or cure periods), including, among other things, nonpayment defaults, covenant defaults, cross-defaultsa failure to other material indebtedness,make payments under the credit facilities, cross-default, certain bankruptcy and insolvency defaults,events and material judgment defaults.customary change of control events.
Commencing on September 30, 2022, the Term Loan Facility and Incremental Facility will amortize in equal quarterly installments of 1.25% of the aggregate principal amount of the term loan as of the closing date with the remaining balance due at final maturity. Quarterly installments from September 30, 2022 to March 31, 2025 are in the amount of $3,750 per quarter.
As of December 31, 2021, the outstanding balance on the Term Loan Facility and Incremental Facility was $292,650 (net of unamortized debt issuance costs of $7,350). Interest on the term loan during the year ended December 31, 2021, was $5,907 (including amortization of deferred debt issuance costs of $766). The interest rate on the term loan as of December 31, 2021 was 4.72%.
The Company had an outstanding balance of $80,000 under the Revolving Credit Facility as of December 31, 2021. Interest on the revolving facility during the year ended December 31, 2021 was $1,915 (including unused commitment fees of $76 and amortization of deferred financing costs of $305). The interest rate on the revolving facility as of December 31, 2021 was 4.67%.
The Company is in compliance with all financial covenants in the Nomura Credit Agreement as of December 31, 2021.
BRPAC Credit Agreement
On April 13, 2017,December 19, 2018, BRPI Acquisition Co LLC (“BRPAC”), a Delaware limited liability company, UOL, and YMAX Corporation, Delaware corporations (collectively, the “Borrowers”), indirect wholly owned subsidiaries of the Company, in the capacity as borrower,borrowers, entered into a credit agreement (the “UOL“BRPAC Credit Agreement”) with the Banc of California, N.A. in the capacity as agent (the “Agent”) and lender. The UOL Credit Agreement provides for a revolving credit facility under which UOL may borrow (or requestlender and with the issuance of letters of credit) up to $20,000 which amount is reduced by $1,500 commencing on June 30, 2017 and on the last day of each calendar quarter thereafter. The final maturity date is April 13, 2020. The proceedsother lenders party thereto (the “Closing Date Lenders”). Certain of the UOL Credit Agreement can be used (a) for working capital and general corporate purposes and/or (b) to pay dividends or permitted tax distributions to its parent company, subject to the terms of the UOL Credit Agreement. Borrowings under the UOL Credit Agreement will bear interest at a rate equal to (a) (i) the base rate (the greater of the federal funds rate plus one half of one percent (0.5%), or the prime rate) for U.S. dollar loans or (ii) at UOL’s option, the LIBOR Rate for Eurodollar loans, plus (b) the applicable margin rate, which ranges from two percent (2%) to three and one-half percent (3.5%) per annum, based upon UOL’s ratio of funded indebtedness to adjusted earnings before interest, taxes, depreciation and amortization (EBITDA) for the preceding four (4) fiscal quarters. Interest payments are to be made each one, three or six months for Eurodollar loans, and quarterly for U.S. dollar loans.
UOL paid a commitment fee equal to 1.00% of the aggregate commitments upon the closing of the UOL Credit Agreement. The UOL Credit Agreement also provides for an unused line fee payable quarterly, in arrears, in an amount equal to: (a) 0.50% per annum times the amount of the unused revolving commitment that is less than or equal to the amount of the cash maintained in accounts with the agent (as depositary bank); plus (b) 1.00% per annum times the amount of the unused revolving commitment that is greater than the amount of the cash maintained in accounts with the agent (as depositary bank). Any amounts outstanding under the UOL Credit Facility are due at maturity. There was no outstanding balance under the UOL Credit Agreement at December 31, 2017. Interest expense totaled $292 (including amortization of deferred loan fees of $97) for the year ended December 31, 2017.
Each of UOL’sBorrowers’ U.S. subsidiaries is a guarantorare guarantors of all obligations under the UOLBRPAC Credit Agreement and are parties to the UOLBRPAC Credit Agreement in such capacity (collectively, the “Secured Guarantors”; and together with the Borrowers, the “Credit Parties”). In addition, the Company and B. Riley Principal Investments, LLC, the parent corporation of UOLBRPAC and a subsidiary of the Company, are guarantors of the obligations under the UOLBRPAC Credit Agreement pursuant to standalone guaranty agreements pursuant to which the shares outstanding membership interests of outstanding capital stock of UOLBRPAC are pledged as collateral.
The obligations under the UOLBRPAC Credit Agreement are secured by first-priority liens on, and a first-priorityfirst priority security interest in, substantially all of the assets of UOL and the Secured Guarantors,Credit Parties, including a pledge of (a) 100% of the equity interests of the Secured Guarantors andCredit Parties, (b) 65% of the equity interests in United Online Software Development (India) Private Limited, a private limited company organized under the laws of India.India; and (c) 65% of the equity interests in magicJack VocalTec LTD., a limited company organized under the laws of Israel. Such security interests are evidenced by pledge, security and other related agreements.
The UOLBRPAC Credit Agreement contains certain negative covenants, including those limiting UOL’sthe Credit Parties’, and itstheir subsidiaries’ ability to incur indebtedness, incur liens, sell or acquire assets or businesses, change the nature of their businesses, engage in transactions with related parties, make certain investments or pay dividends. In addition, the UOLBRPAC Credit Agreement requires UOL and its subsidiariesthe Credit Parties to maintain certain financial ratios. The BRPAC Credit Agreement also contains customary representations and warranties, affirmative covenants and events of default, including payment defaults, breach of representations and warranties, covenant defaults and cross defaults. If an event of default occurs, the agent would be entitled to take various actions, including the acceleration of amounts due under the outstanding BRPAC Credit Agreement.
Under BRPAC Credit Agreement, the Company borrowed $80,000 due December 19, 2023. Pursuant to the terms of the BRPAC Credit Agreement, the Company may request additional optional term loans in an aggregate principal amount of up to $10,000 at any time prior to the first anniversary of the agreement date (the “Option Loan”) with a final maturity date of December 19, 2023. On February 1, 2019, the Credit Parties, the Closing Date Lenders, the Agent and City National Bank, as a new lender (the “New Lender”), entered into the First Amendment to the Credit Agreement and Joinder (the “First Amendment”) pursuant to which, among other things, (i) New Lender became a party to the BRPAC Credit Agreement, (ii) the New Lender extended to Borrowers the Option Loan in the amount of $10,000, (iii) the aggregate outstanding principal amount of the term loans was increased from $80,000 to $90,000; and (iv) the amortization schedule under the BRPAC was amended as set forth in the First Amendment. Additionally, in connection with the Option Loan, the Borrowers executed a term note in favor of New Lender dated February 1, 2019 in the amount of $10,000.
On December 31, 2020, the Borrowers, the Secured Guarantors, the Agent and the Closing Date Lenders, entered into the Second Amendment to Credit Agreement (the “Second Amendment”) pursuant to which, among other things, (i) the Lenders agreed to make a new $75,000 term loan to the Borrowers, the proceeds of which the Borrowers’ used to repay the outstanding principal amount of the existing Terms Loans and Optional Loans and will use for other general corporate purposes, (ii) the Borrowers were permitted to make a one-time Permitted Distribution (as defined in the Second Amendment) in the amount of $30,000 on the date of the Second Amendment, (iii) the maturity date of the new Term Loans is five (5) years from the date of the Second Amendment, (iv) the interest rate margin was increased by 25 basis points as set forth in the Second Amendment, (v) the Borrowers agreed to make mandatory prepayments of the Term Loans from a portion of the Consolidated Excess Cash Flow (as defined in the Credit Agreement), (vi) the maximum Consolidated Total Funded Debt Ratio (as defined in the Credit Agreement) was increased as set forth in the Second Amendment and (vii) the Company and B. Riley Principal Investments, LLC entered into a reaffirmation of their guarantees of the Borrowers’ obligations under the Credit Agreement. Additionally, the Borrowers paid a commitment fee and an arrangement fee, each based on a percentage of the aggregate commitments, in each case upon the closing of the Second Amendment.
On December 16, 2021, the Borrowers, the Secured Guarantors, the Agent and the Closing Date Lenders, entered into the Third Amendment to Credit Agreement (the “Third Amendment”) pursuant to which, among other things, replaced LIBOR with the Secured Overnight Financing Rate (“SOFR”) reference rate, and the Borrowers were permitted to make a one-time Permitted Distribution (as defined in the Third Amendment) in the amount of $30,000 on the date of the Third Amendment.
Borrowings under the amended BRPAC Credit Agreement bear interest at a rate equal to (a) the SOFR rate for loans, plus (b) the applicable margin rate, which ranges from 2.75% to 3.25% per annum, based upon the Borrowers’ ratio of consolidated funded indebtedness to adjusted earnings before interest, taxes, depreciation, and amortization (EBITDA) for the preceding four fiscal quarters or other applicable period. As of December 31, 2021 and 2020, the interest rate on the amended BRPAC Credit Agreement was 3.17% and 3.40%, respectively.
Principal outstanding under the amended BRPAC Credit Agreement is due in quarterly installments. Quarterly installments from March 31, 2022 to December 31, 2022 are in the amount of $4,116 per quarter, from March 31, 2023 to December 31, 2023 are in the amount of $3,631 per quarter, from March 31, 2024 to December 31, 2024 are in the amount of $3,147 per quarter, from March 31, 2025 to December 31, 2025 are $2,663 per quarter, and the remaining principal balance is due at final maturity on December 31, 2025.
As of December 31, 2021, and 2020, the outstanding balance on the term loan was $53,735 (net of unamortized debt issuance costs of $582) and $74,213 (net of unamortized debt issuance costs of $787), respectively. Interest expense on the term loan during the years ended December 31, 2021, 2020, and 2019, was $2,468 (including amortization of deferred debt issuance costs of $300), $2,369 (including amortization of deferred debt issuance costs of $278) and $4,609 (including amortization of deferred debt issuance costs of $350), respectively.
We are in compliance with all financial covenants in the amended BRPAC Credit Agreement as of December 31, 2021.
NOTE 11—12 — SENIOR NOTES PAYABLE
Senior notes payable, net, is comprised of the following as of December 31, 20172021 and 2016:
| December 31, | |||||||||
| 2017 | 2016 | ||||||||
| 7.50% Senior notes due October 31, 2021 | $ | 35,231 | $ | 28,750 | |||||
| 7.50% Senior notes due May 31, 2027 | 92,490 | — | |||||||
| 7.25% Senior notes due December 31, 2027 | 80,500 | — | |||||||
| 208,221 | 28,750 | ||||||||
| Less: Unamortized debt issue costs | (4,600 | ) | (1,050 | ) | |||||
| $ | 203,621 | $ | 27,700 | ||||||
2020:
| December 31, | December 31, | |||||||
| 2021 | 2020 | |||||||
| 7.500% Senior notes due May 31, 2027 | $ | — | $ | 128,156 | ||||
| 7.250% Senior notes due December 31, 2027 | — | 122,793 | ||||||
| 7.375% Senior notes due May 31, 2023 | — | 137,454 | ||||||
| 6.875% Senior notes due September 30, 2023 | — | 115,168 | ||||||
| 6.750% Senior notes due May 31, 2024 | 111,170 | 111,170 | ||||||
| 6.500% Senior notes due September 30, 2026 | 178,787 | 134,657 | ||||||
| 6.375% Senior notes due February 28, 2025 | 144,521 | 130,942 | ||||||
| 6.000% Senior notes due January 31, 2028 | 259,347 | — | ||||||
| 5.500% Senior notes due March 31, 2026 | 214,243 | — | ||||||
| 5.250% Senior notes due August 31, 2028 | 397,302 | — | ||||||
| 5.000% Senior notes due December 31, 2026 | 322,679 | — | ||||||
| 1,628,049 | 880,340 | |||||||
| Less: Unamortized debt issuance costs | (21,489 | ) | (9,557 | ) | ||||
| $ | 1,606,560 | $ | 870,783 | |||||
(a) $35,231 Senior Notes Payable due October 31, 2021
AtDuring the year ended December 31, 2017,2021, the Company had $35,231issued $233,416 of Senior Notes Payable (the “2021 Notes”)senior notes with maturity dates ranging from May 2023 to August 2028 pursuant to At the Market Issuance Sales Agreements with B. Riley Securities, Inc., which governs the program of at-the-market sales of the Company’s senior notes.
On January 25, 2021, the Company issued $230,000 of senior notes due in 2021, interestJanuary 2028 (“6.0% 2028 Notes”) pursuant to a prospectus supplement dated February 12, 2020. Interest on the 6.0% 2028 Notes is payable quarterly at 7.50%6.0%. On November 2, 2016, the Company issued $28,750 of the 2021 Notes and during the third and fourth quarter of 2017, the Company issued an additional $6,481 of the 2021 Notes. The 20216.0% 2028 Notes are unsecured and due and payable in full on OctoberJanuary 31, 2021.2028. In connection with the issuance of the 20216.0% 2028 Notes, the Company received net proceeds of $34,238$225,723 (after underwriting commissions, fees, and other issuance costs of $993)$4,277). The outstanding balance6.0% 2028 Notes bear interest at the rate of the6.0% per annum.
On March 29, 2021, Notes was $34,483 (net of unamortized debt issue costs and premiums of $748) and $27,700 (net of unamortized debt issue costs of $1,050) at December 31, 2017 and 2016, respectively. In connection with the offering of 2021 Notes on November 2, 2016, certain members of management and the Board of Directors of the Company purchased $2,731 or 9.5%issued $159,493 of the 2021 Notes offered by the Company.senior notes due in March 2026 (“5.5% 2026 Notes”) pursuant to a prospectus supplement dated January 28, 2021. Interest expense on the 20215.5% 2026 Notes totaled $2,537 and $360 for the years ended December 31, 2017 and 2016, respectively.
(b) $92,490 Senior Notes Payable due May 31, 2027
At December 31, 2017, the Company had $92,490 of Senior Notes Payable (the “7.50% 2027 Notes”) due in May 2027, interestis payable quarterly at 7.50%5.5%. On May 31, 2017, the Company issued $60,375 of the 7.5% 2027 Notes and during the third and fourth quarter ended 2017, the Company issued an additional $32,115 of the 7.50% 2027 Notes. The 7.50% 20275.5% 2026 Notes are unsecured and due and payable in full on MayMarch 31, 2027.2026. In connection with the issuance of the 7.50% 20275.5% 2026 Notes, the Company received net proceeds of $90,796$156,260 (after underwriting commissions, fees, and other issuance costs of $1,694)$3,233). The outstanding balance5.5% 2026 Notes bear interest at the rate of 5.5% per annum.
On March 31, 2021, the Company exercised its option for early redemption at par $128,156 of senior notes due in May 2027 (“7.50% 2027 Notes”) pursuant to the second supplemental indenture dated May 31, 2017. The total redemption payment included $1,602 in accrued interest.
On July 26, 2021, the Company redeemed, in full, $122,793 aggregate principal amount of its 7.25% Senior Notes was $90,904 (net of unamortized debt issue costs of $1,586) atdue 2027 (“7.25% 2027 Notes”) pursuant to the third supplemental indenture dated December 31, 2017. Interest expenseThe 7.25% Notes had an aggregate principal amount of $122,793. The redemption price was equal to 100% of the aggregate principal amount, plus accrued and unpaid interest up to, but excluding, the redemption date. The total redemption payment included approximately $2,127 in accrued interest. In connection with the full redemption, the 7.25% 2027 Notes, which were listed on NASDAQ under the ticker symbol “RILYG,” were delisted from NASDAQ and ceased trading on the 7.50% 2027redemption date.
On August 4, 2021, the Company issued $316,250 of senior notes due in August 2028 (“5.25% 2028 Notes”) pursuant to a prospectus supplement dated January 28, 2021. Interest on the 5.25% 2028 Notes totaled $3,551 foris payable quarterly at 5.25%. The 5.25% 2028 Notes are unsecured and due and payable in full on August 31, 2028. In connection with the year ended December 31, 2017.issuance of the 5.25% 2028 Notes, the Company received net proceeds of $308,659 (after underwriting commissions, fees, and other issuance costs of $7,591). The 5.25% 2028 Notes bear interest at the rate of 5.25% per annum.
On September 4, 2021, the Company redeemed, in full, $137,454 aggregate principal amount of its 7.375% Senior Notes due 2023 (“7.375% 2023 Notes”) pursuant to the fifth supplemental indenture dated September 11, 2018. The redemption price was equal to 101.5% of the aggregate principal amount, plus any accrued and unpaid interest up to, but excluding, the redemption date. The total redemption payment included approximately $957 in accrued interest and $2,062 in premium. In connection with the full redemption, the 7.375% 2023 Notes, which were listed on NASDAQ under the ticker symbol “RILYH,” were delisted from NASDAQ and ceased trading on the redemption date.
On October 22, 2021, the Company redeemed, in full, $115,726 aggregate principal amount of its 6.875% Senior Notes due 2023 (the “6.875% 2023 Notes”) pursuant to the fifth supplemental indenture dated September 11, 2018. The redemption price was equal to 101.0% of the aggregate principal amount, plus accrued and unpaid interest, up to, but excluding, the redemption date. The total redemption payment included approximately $1,812 in accrued interest and $1,157 in premium. In connection with the full redemption, the 6.875% 2023 Notes under the ticker symbol “RILYI,” were delisted from NASDAQ and ceased trading on the redemption date.
(c) $80,500 Senior Notes Payable dueOn December 31, 2027
At December 31, 2017,3, 2021, the Company had $80,500issued $322,679 of Senior Notes Payable ("7.25% 2027 Notes”)senior notes due in December 2027, interest2026 (“5.00% 2026 Notes”) pursuant to a prospectus supplement dated November 29, 2021. Interest on the 5.00% 2026 Notes is payable quarterly at 7.25%5.00%. The 7.25% 20275.00% 2026 Notes are unsecured and due and payable in full on December 31, 2027.2026. In connection with the issuance of the 7.25% 20275.00% 2026 Notes, the Company received net proceeds of $78,223$317,633 (after underwriting commissions, fees, and other issuance costs of $2,277)$5,046). The 5.00% 2026 Notes bear interest at the rate of 5.00% per annum.
As of December 31, 2021 and 2020, the total senior notes outstanding balance of the 7.25% 2027 Notes was $78,234$1,606,560 (net of unamortized debt issue costs of $2,266) at December 31, 2017.$21,489) and $870,783 (net of unamortized debt issue costs of $9,557) with a weighted average interest rate of 5.69% and 6.95%, respectively. Interest on senior notes is payable on a quarterly basis. Interest expense on senior notes totaled $81,475, $61,233, and $43,823 during the 7.25% 2027years ended December 31, 2021, 2020, and 2019, respectively.
Sales Agreement Prospectus to Issue Up to $250,000 of Senior Notes totaled $303
The most recent sales agreement prospectus was filed by us with the SEC on January 5, 2022 (the “January 2022 Sales Agreement Prospectus”) superseding the prospectus filed with the SEC on August 11, 2021, the prospectus filed with the SEC on April 6, 2021, and the prospectus filed with the SEC on January 28, 2021. This program provides for the sale by the Company of up to $250,000 of certain of the Company’s senior notes. As of December 31, 2021, the Company had $111,911 remaining availability under the January 2022 Sales Agreement.
NOTE 13 — REVENUE FROM CONTRACTS WITH CUSTOMERS
Revenue from contracts with customers by reportable segment during the years ended December 31, 2021, 2020, and 2019 is as follows:
| Capital | Wealth | Auction and | Financial | Principal Investments - | ||||||||||||||||||||||||
| Markets | Management | Liquidation | Consulting | Communications | Brands | Total | ||||||||||||||||||||||
| Revenues for the year ended December 31, 2021: | ||||||||||||||||||||||||||||
| Corporate finance, consulting and investment banking fees | $ | 484,247 | $ | — | $ | — | $ | 56,439 | $ | — | $ | — | $ | 540,686 | ||||||||||||||
| Wealth and asset management fees | 6,769 | 282,711 | — | — | — | — | 289,480 | |||||||||||||||||||||
| Commissions, fees and reimbursed expenses | 48,382 | 75,776 | 19,079 | 37,873 | — | — | 181,110 | |||||||||||||||||||||
| Subscription services | — | — | — | — | 79,149 | — | 79,149 | |||||||||||||||||||||
| Service contract revenues | — | — | 1,090 | — | — | — | 1,090 | |||||||||||||||||||||
| Advertising, licensing and other (1) | — | — | 53,348 | — | 14,198 | 20,308 | 87,854 | |||||||||||||||||||||
| Total revenues from contracts with customers | 539,398 | 358,487 | 73,517 | 94,312 | 93,347 | 20,308 | 1,179,369 | |||||||||||||||||||||
| Interest income - Loans and securities lending | 122,722 | — | — | — | — | — | 122,722 | |||||||||||||||||||||
| Trading gains on investments | 368,537 | 7,623 | — | — | — | — | 376,160 | |||||||||||||||||||||
| Fair value adjustment on loans | 10,516 | — | — | — | — | — | 10,516 | |||||||||||||||||||||
| Other | 35,920 | 15,874 | — | — | — | — | 51,794 | |||||||||||||||||||||
| Total revenues | $ | 1,077,093 | $ | 381,984 | $ | 73,517 | $ | 94,312 | $ | 93,347 | $ | 20,308 | $ | 1,740,561 | ||||||||||||||
| (1) | Includes sale of goods of $53,348 in Auction Liquidation and $4,857 in Principal Investments - Communications. |
| Revenues for the year ended December 31, 2020: | ||||||||||||||||||||||||||||
| Corporate finance, consulting and investment banking fees | $ | 255,023 | $ | — | $ | — | $ | 54,051 | $ | — | $ | — | $ | 309,074 | ||||||||||||||
| Wealth and asset management fees | 7,391 | 71,204 | — | — | — | — | 78,595 | |||||||||||||||||||||
| Commissions, fees and reimbursed expenses | 48,416 | — | 50,035 | 36,855 | — | — | 135,306 | |||||||||||||||||||||
| Subscription services | — | — | — | — | 72,666 | — | 72,666 | |||||||||||||||||||||
| Service contract revenues | — | — | 13,066 | — | — | — | 13,066 | |||||||||||||||||||||
| Advertising, licensing and other (1) | — | — | 25,663 | — | 14,472 | 16,458 | 56,593 | |||||||||||||||||||||
| Total revenues from contracts with customers | 310,830 | 71,204 | 88,764 | 90,906 | 87,138 | 16,458 | 665,300 | |||||||||||||||||||||
| Interest income - Loans and securities lending | 102,499 | — | — | — | — | — | 102,499 | |||||||||||||||||||||
| Trading gains on investments | 125,247 | 804 | — | — | — | — | 126,051 | |||||||||||||||||||||
| Fair value adjustment on loans | (22,033 | ) | — | — | — | — | — | (22,033 | ) | |||||||||||||||||||
| Other | 29,047 | 1,141 | — | 716 | — | — | 30,904 | |||||||||||||||||||||
| Total revenues | $ | 545,590 | $ | 73,149 | $ | 88,764 | $ | 91,622 | $ | 87,138 | $ | 16,458 | $ | 902,721 | ||||||||||||||
| (1) | Includes sale of goods of $25,663 in Auction Liquidation and $3,472 in Principal Investments - Communications. |
| Revenues for the year ended December 31, 2019: | ||||||||||||||||||||||||||||
| Corporate finance, consulting and investment banking fees | $ | 129,477 | $ | 2 | $ | — | $ | 37,471 | $ | — | $ | — | $ | 166,950 | ||||||||||||||
| Wealth and asset management fees | 18,421 | 64,357 | — | — | — | — | 82,778 | |||||||||||||||||||||
| Commissions, fees and reimbursed expenses | 42,503 | — | 49,849 | 38,821 | — | — | 131,173 | |||||||||||||||||||||
| Subscription services | — | — | — | — | 82,088 | — | 82,088 | |||||||||||||||||||||
| Service contract revenues | — | — | (31,553 | ) | — | — | — | (31,553 | ) | |||||||||||||||||||
| Advertising, licensing and other (1) | — | — | 4,220 | — | 18,774 | 4,055 | 27,049 | |||||||||||||||||||||
| Total revenues from contracts with customers | 190,401 | 64,359 | 22,516 | 76,292 | 100,862 | 4,055 | 458,485 | |||||||||||||||||||||
| Interest income - Loans and securities lending | 77,221 | — | — | — | — | — | 77,221 | |||||||||||||||||||||
| Trading gains on investments | 92,379 | 1,826 | — | — | — | — | 94,205 | |||||||||||||||||||||
| Fair value adjustment on loans | 12,258 | — | — | — | — | — | 12,258 | |||||||||||||||||||||
| Other | 9,229 | 714 | — | — | — | — | 9,943 | |||||||||||||||||||||
| Total revenues | $ | 381,488 | 66,899 | 22,516 | 76,292 | 100,862 | 4,055 | 652,112 | ||||||||||||||||||||
| (1) | Includes sale of goods of $4,220 in Auction Liquidation and $3,715 in Principal Investments - Communications. |
Revenues are recognized when control of the promised goods or performance obligations for services is transferred to the Company’s customers, in an amount that reflects the consideration the Company expects to be entitled to in exchange for the goods or services. A performance obligation may be satisfied over time or at a point in time. Revenue from a performance obligation satisfied over time is recognized by measuring the Company’s progress in satisfying the performance obligation in a manner that depicts the transfer of the goods or services to the customer. Revenue from a performance obligation satisfied at a point in time is recognized at the point in time that we determine the customer obtains control over the promised good or service. The amount of revenue recognized reflects the consideration we expect to be entitled to in exchange for those promised goods or services (i.e., the “transaction price”). In determining the transaction price, the Company considers multiple factors, including the effects of variable consideration. Variable consideration is included in the transaction price only to the extent it is probable that a significant reversal in the amount of cumulative revenue recognized will not occur when the uncertainties with respect to the amount are resolved. In determining when to include variable consideration in the transaction price, the Company considers the range of possible outcomes, the predictive value of the Company’s past experiences, the time period of when uncertainties expect to be resolved and the amount of consideration that is susceptible to factors outside of our influence, such as market volatility or the judgment and actions of third parties. Revenues by geographic region by segment is included in Note 22 – Business Segments.
The following provides detailed information on the recognition of the Company’s revenues from contracts with customers:
Corporate finance, consulting and investment banking fees. Fees earned from corporate finance and investment banking services are derived from debt, equity and convertible securities offerings in which the Company acted as an underwriter or placement agent. Fees from underwriting activities are recognized as revenues when the performance obligation for the services related to the underwriting transaction is satisfied under the terms of the engagement and is not subject to any other contingencies. Fees are also earned from financial advisory and consulting services rendered in connection with client mergers, acquisitions, restructurings, recapitalizations and other strategic transactions. The performance obligation for financial advisory services is satisfied over time as work progresses on the engagement and services are delivered to the client. Fees earned from bankruptcy, financial advisory, forensic accounting and real estate consulting services are rendered to clients over time as work progresses on the engagement and services are delivered to the client. Fees may also include success and performance based fees which are recognized as revenue when the performance obligation is no longer constrained and it is not probable that the revenue recognized would be subject to significant reversal in a future period. The performance obligation for financial advisory services may also include success and performance based fees which are recognized as revenue when the performance obligation is no longer constrained and it is not probable that the revenue recognized would be subject to significant reversal in a future period. Generally, it is probable that the revenue recognized is no longer subject to significant reversal upon the closing of the investment banking transaction.
Wealth and asset management fees. Fees from wealth and asset management services consist primarily of investment management fees that are recognized over the period the performance obligation for the services are provided. Investment management fees are primarily comprised of fees for investment management services and are generally based on the dollar amount of the assets being managed.
Commissions, fees and reimbursed expenses. Commissions and other fees from clients for trading activities are earned from equity securities transactions executed as agent or principal are recorded at a point in time on a trade date basis. Commission, fees and reimbursed expenses earned on the sale of goods at Auction and Liquidation sales are recognized when evidence of a contract or arrangement exists, the transaction price has been determined, and the performance obligation has been satisfied when control of the product and risks of ownership has been transferred to the buyer. Revenues from fees and reimbursed expenses for valuation services to clients are recognized when the performance obligation is completed and is generally at the point in time upon delivery of the report to the customer.
Subscription services. Subscription service revenues are primarily earned from Principal Investments – Communication service contracts and are recognized in the period in which the transaction price has been determinable and the related performance obligations for services are provided to the customer. UOL pay accounts generally pay in advance for their internet access services and revenues are then recognized ratably over the service period. Subscription service revenues from magicJack include (a) revenues for initial access rights, which are recognized ratably over the service term, (b) revenues from access rights renewal, which are recognized ratably over the extended access right period; (c) revenues from access and wholesale charges, which are recognized as calls are terminated to the network; (d) revenues from UCaaS services, which are recognized in the period the services are provided over the term of the customer agreements; and (e) prepaid international long distance minutes, which are recognized as the minutes are used or expired. Subscription service revenues from our mobile phone business include revenues from mobile voice, text, and data services and are recognized ratably over the service period. Voice, text, and data overage charges are recognized over time as the consumer simultaneously receives and consumes the benefits each period as the Company performs.
Service contract revenues. Service contract revenues are primarily earned from Auction and Liquidation services contracts where the Company guarantees a minimum recovery value for goods being sold at auction or liquidation are recognized over time when the performance obligation is satisfied. The Company generally uses the cost-to-cost measure of progress for its contracts because it best depicts the transfer of services to the customer which occurs as the Company incurs costs on its contracts. Under the cost-to-cost measure of progress, the extent of progress towards completion is measured based on the ratio of costs incurred to date to the total estimated costs at completion of the performance obligation. Revenues, including estimated fees or profits, are recorded proportionally as costs are incurred. Costs to fulfill the contract include labor and other direct costs incurred by the Company related to the contract. Due to the nature of the guarantees and performance obligations under these contracts, the estimation of revenue that is ultimately earned is complex and subject to many variables and requires significant judgment. It is common for these contracts to contain provisions that can either increase or decrease the transaction price upon completion of our performance obligations under the contract. Estimated amounts are included in the transaction price at the most likely amount it is probable that a significant reversal of revenue will not occur. The Company’s estimates of variable consideration and determination of whether or not to include estimated amounts in the transaction price are based on an assessment of its anticipated performance under the contract taking into consideration all historical, current and forecasted information that is reasonably available to the Company.
If the Company determines that the variable consideration used in the initial determination of the transaction price for the contract is such that the total recoveries from the auction or liquidation will not exceed the guaranteed recovery values or advances made in accordance with the contract, the transaction price will be reduced and a loss or negative revenue could result from the performance obligation. A provision for the entire loss as negative revenue on the performance obligation is recognized in the period the loss is determined. Negative revenue from one retail liquidation engagement contributed to the Company reporting negative service contract revenues of $31,553 in the Auction and Liquidation segment during the year ended December 31, 2017.2019.
(d) At Market Issuance Sales AgreementAdvertising, licensing and other. Advertising and other revenues consist primarily of amounts from UOL’s Internet search partner that are generated as a result of users utilizing the partner’s Internet search services and amounts generated from display advertisements, the portion of revenues from the sale of magicJack devices that is allocated to Issue Uphardware, as well as revenues from magicJack ancillary products and mobile broadband service devices to Aggregatecustomers, and amounts from the sale of $19,000 of 2021 Notes, 7.50% 2027 Notesgoods acquired in Auction and Liquidation asset purchase agreements. Advertising revenues are recognized in the period in which the advertisement is displayed or, 7.25% 2027 Notes.
On December 19, 2017,for performance-based arrangements, when the related performance criteria are met. In determining whether an arrangement exists, the Company entered intoensures that a written contract is in place, such as a standard insertion order or a customer-specific agreement. The Company assesses whether performance criteria have been met and whether the Sales Agreementtransaction price is determinable based on a reconciliation of the performance criteria and filedthe payment terms associated with the transaction. The reconciliation of the performance criteria generally includes a prospectus supplement pursuantcomparison of customer-provided performance data to which the Company may sellcontractual performance obligation and to internal or third-party performance data in circumstances where that data is available. Revenues from timethe hardware portion of the sale of magicJack devices are recognized upon delivery (when control transfers to time,the customer). Revenues from the sale of other magicJack related products are recognized at the Company’s option up to an aggregatetime of $19,000sale. Sale of product revenues also include the related shipping and handling and installment fees, if applicable. Revenues from the sale of goods acquired in Auction and Liquidation asset purchase agreements are recognized when control of the 2021 Notes, the 7.50% 2027 Notesproduct and the 7.25% 2027 Notes. The Notes sold pursuantrisks of ownership has been transferred to the Sales Agreement will be issued pursuantbuyer.
Licensing revenue results from various license agreements that provide revenue based on guaranteed minimum royalty amounts and advertising/marketing fees with additional royalty revenue based on a percentage of defined sales. Guaranteed minimum royalty amounts are recognized as revenue on a straight-line basis over the full contract term. Royalty payments exceeding the guaranteed minimum amounts in a specific contract year are recognized only subsequent to when the guaranteed minimum amount has been achieved. Other licensing fees are recognized at a prospectus dated March 29, 2017,point in time once the performance obligations have been satisfied.
Payments received as supplemented byconsideration for the grant of a prospectus supplement dated June 28, 2017,license are recorded as deferred revenue at the time payment is received and recognized ratably as revenue over the term of the license agreement. Advanced royalty payments are recorded as deferred revenue at the time payment is received and recognized as revenue when earned. Revenue is not recognized unless collectability is probable.
Information on Remaining Performance Obligations and Revenue Recognized from Past Performance
The Company does not disclose information about remaining performance obligations pertaining to contracts that have an original expected duration of one year or less. The transaction price allocated to remaining unsatisfied or partially unsatisfied performance obligation(s) with an original expected duration exceeding one year was not material as of December 31, 2021. Corporate finance and investment banking fees and retail liquidation engagement fees that are contingent upon completion of a specific milestone and fees associated with certain distribution services are also excluded as the fees are considered variable and not included in each case filed with the Securities and Exchange Commission pursuant totransaction price as of December 31, 2021.
Contract Balances
The timing of the Company’s effective Registration Statement on Form S-3 (File No. 333-216763), which was declared effectiverevenue recognition may differ from the timing of payment by the SEC on March 29, 2017.its customers. The Notes will be issued pursuantCompany records a receivable when revenue is recognized prior to the Indenture, dated as of November 2, 2016, as supplemented by a First Supplemental Indenture, dated as of November 2, 2016payment and the Second Supplemental Indenture, dated as of May 31, 2017, each between the Company and U.S. Bank, National Association, as trustee. Future sales of the 2021 Notes, 7.50% 2027 Notes and 7.25% 2027 Notes pursuant to the Sales Agreement will depend on a variety of factors including, but not limited to, market conditions, the trading price of the notes and the Company’s capital needs. At December 31, 2017, the Company has an additional $19,000unconditional right to payment. Alternatively, when payment precedes the provision of 2021 Notes, 7.50% 2027 Notes or 7.25% 2027 Notes that may be sold pursuant to the Sales Agreement. There can be no assurance thatrelated services, the Company will be successfulrecords deferred revenue until the performance obligation(s) are satisfied. Receivables related to revenues from contracts with customers totaled $49,673 and $40,806 as of December 31, 2021 and 2020, respectively. The Company had no significant impairments related to these receivables during the years ended December 31, 2021 and 2020. The Company also has $12,315 and $5,712 of unbilled receivables included in consummating future salesprepaid expenses and other assets as of December 31, 2021 and 2020, respectively, and advances against customer contracts of $200 included in prepaid expenses and other assets as of December 31, 2021 and 2020, respectively. The Company’s deferred revenue primarily relates to retainer and milestone fees received from corporate finance and investment banking advisory engagements, asset management agreements, financial consulting engagements, subscription services where the performance obligation has not yet been satisfied and license agreements with guaranteed minimum royalty payments and advertising/marketing fees with additional royalty revenue based on prevailing market conditions or in the quantities or at the prices that the Company may deem appropriate.
(e) Australian Dollar $80,000 Note Payable
In August 2016, the Company formed GA Retail Investments, L.P., a Delaware limited partnership, (the “Partnership”) which required the Company to contribute $15,350. The Partnership borrowed $80,000 Australian dollars from a third party investor in connection with its formation and the $80,000 Australian dollars was exchanged for a 50% special limited partnership interest in the Partnership. The Partnership was formed to provide funding for the retail liquidation engagement the Company entered into to liquidate the Masters Home Improvement stores. The $80,000 Australian dollar participating note payable was non-interest bearing, shares in 50%percentage of the alldefined sales. Deferred revenue as of the profits and losses of the Partnership and was subject to repayment upon the completion of the going-out-of-business sale of Masters Home Improvement stores as defined in the partnership agreement. Although the terms of the participating note payable included the issuance of a 50% equity interest in the Partnership, sharing in all profits and losses of the Partnership, and no repayment until certain events occur, in accordance with ASC 480 Distinguishing Liabilities From Equity, this financial instrument was classified as a participating note payable. The $80,000 Australian dollar participating note payable was repaid in December 2016 upon the completion of the going-out-of-business sale of Masters Home Improvement stores as defined in the partnership agreement. At December 31, 20172021 and 2016, $1,3232020 was $69,507 and $10,037, respectively, were payable in accordance with$68,651, respectively. The Company expects to recognize the participating note payable sharedeferred revenue of profits$69,507 as of December 31, 2021 as service and fee revenues when the performance obligation is included in net income attributable to noncontrolling interestsmet during the years December 31, 2022, 2023, 2024, 2025 and amounts Due to partners in the consolidated financial statements.
(f) Other Notes Payable
Other notes payable include notes payable to a clearing organization for one of the Company’s broker dealers. The notes payable accrue interest at rates ranging from the prime rate plus 0.25% to 2.0% (4.75% to 6.50% at December 30, 2017) payable annually. The principal payments on the notes payable are due annually2026 in the amount of $357 on January 31, $214 on September 30,$39,181, $11,364, $7,936, $5,265, and $121 on October 31.$2,745, respectively. The notes payable mature at various dates from September 30, 2018 through January 31, 2022. AtCompany expects to recognize the deferred revenue of $3,016 after December 31, 2017,2026.
During the outstanding balance for the notes payable was $2,243. Interest expense was $71 for the period from July 3, 2017 (the date of Wunderlich acquisition) throughyears ended December 31, 2017.2021, 2020, and 2019, the Company recognized revenue of $39,906, $38,330, and $39,885 that was recorded as deferred revenue, respectively.
Contract Costs
NOTE 12— COMMITMENTS AND CONTINGENCIES
Contract costs include: (1) costs to fulfill contracts associated with corporate finance and investment banking engagements are capitalized where the revenue is recognized at a point in time and the costs are determined to be recoverable; (2) costs to fulfill Auction and Liquidation services contracts where the Company guarantees a minimum recovery value for goods being sold at auction or liquidation where the revenue is recognized over time when the performance obligation is satisfied; and (3) commissions paid to obtain magicJack contracts which are recognized ratably over the contract term and third party support costs for magicJack and related equipment purchased by customers which are recognized ratably over the service period.
(a) LettersThe capitalized costs to fulfill a contract were $1,605 and $279 as of Credit –
At December 31, 2017, there were letters of credit outstanding2021 and 2020, respectively, and are recorded in prepaid expenses and other assets in the amountconsolidated balance sheets. During the years ended December 31, 2021, 2020, and 2019, the Company recognized expenses of $18,505$580, $405, and $2,755 related to three retail liquidation engagements. Atcapitalized costs to fulfill a contract, respectively. There were no significant impairment charges recognized in relation to these capitalized costs during years ended December 31, 2016, there was a letter of credit in the amount of $465 which was maintained pursuant to lease arrangements2021, 2020, and contractual obligations.2019.
(b) Legal Matters
The Company is subject to certain legal and other claims that arise in the ordinary course of its business. In particular, the Company and its subsidiaries are named in and subject to various proceedings and claims arising primarily from our securities business activities, including lawsuits, arbitration claims, class actions, and regulatory matters. Some of these claims seek substantial compensatory, punitive, or indeterminate damages. The Company and its subsidiaries are also involved in other reviews, investigations, and proceedings by governmental and self-regulatory organizations regarding our business, which may result in adverse judgments, settlements, fines, penalties, injunctions, and other relief. In view of the number and diversity of claims against our company, the number of jurisdictions in which litigation is pending, and the inherent difficulty of predicting the outcome of litigation and other claims, we cannot state with certainty what the eventual outcome of pending litigation or other claims will be. Notwithstanding this uncertainty, the Company does not believe that the results of these claims are likely to have a material effect on its financial position or results of operations.
In 2012, Gladden v. Cumberland Trust, WSI, et al. filed a complaint in Circuit Court, Hamblen County, TN at Morristown, Case No. 12-CV-119. This complaint alleges the improper distribution and misappropriation of trust funds. The plaintiff seeks damages of no less than $3,925, an accounting, and among other things, punitive damages. In October 2017, the Tennessee Supreme Court remanded the case to the Tennessee State Trial Court for determination of which claims are subject to arbitration and which are not. At the present time, the financial impact to the Company, if any, cannot be estimated.
In January 2015, Great American Group, LLC (“Great American Group”) was served with a lawsuit that seeks to assert claims of breach of contract and other matters in connection with auction services provided to a debtor. The proceeding in the United States Bankruptcy Court for the District of Delaware (“Bankruptcy Court”) is pending in the bankruptcy case of the debtor and its affiliates (the “Debtor”). In the lawsuit, a former landlord of the Debtor generally alleges that Great American Group and a joint venture partner were responsible for contamination while performing services in connection with the auction of certain assets of the Debtor and is seeking approximately $10,000 in damages. In December 2017, the parties settled the matter and the financial impact to the Company was not material.
In May 2014, Waterford Township Police & Fire Retirement System et al. v. Regional Management Corp et al., filed a complaint in the Southern District of New York (the “Court”), against underwriters alleging violations under sections 11 and 12 of the Securities Act of 1933, as amended (the “Securities Act”). B. Riley FBR, Inc. (“B. Riley FBR”) (formerly, FBR Capital Markets & Co. (“FBRCM”)), a broker-dealer subsidiary of ours, was a co-manager of 2 offerings. On January 30, 2017, the Court denied the plaintiffs’ motion to file a first amended complaint, which would have revived claims previously dismissed by the Court on March 30, 2016. On March 1, 2017, the plaintiffs filed a notice of appeal and an opening brief on June 21, 2017. Defendant’s opposition motion was filed on September 12, 2017. Appellants filed their reply brief on October 17, 2017 and oral argument was held on November 17, 2017. On January 26, 2018, the Appellate court issued its order affirming the court’s order dismissing the plantiff’s case and denying leave to amend. Regional Management continues to indemnify all of the underwriters, including FBRCM, pursuant to the operative underwriting agreement.
On January 5, 2017, complaints filed in November 2015 and May 2016 naming MLV & Co. (“MLV”), a broker-dealer subsidiary of FBR, as a defendant in putative class action lawsuits alleging claims under the Securities Act, in connection with the offerings of Miller Energy Resources, Inc. (“Miller”) have been consolidated. The Master Consolidated Complaint, styled Gaynor v. Miller et al., is pending in the United States District Court for the Eastern District of Tennessee, and, like its predecessor complaints, continues to allege claims under Sections 11 and 12 of the Securities Act against nine underwriters for alleged material misrepresentations and omissions in the registration statement and prospectuses issued in connection with six offerings (February 13, 2013; May 8, 2013; June 28, 2013; September 26, 2013; October 17, 2013 (as to MLV only) and August 21, 2014) with an alleged aggregate offering price of approximately $151,000. The plaintiffs seek unspecified compensatory damages and reimbursement of certain costs and expenses. In August 2017, the Court granted Defendant’s Motion to Dismiss on Section 12 claims and found that the plaintiffs had not sufficiently alleged a corrective disclosure prior to August 6, 2015, when an SEC civil action was announced. Defendants’ answer was filed on September 25, 2017. Although MLV is contractually entitled to be indemnified by Miller in connection with this lawsuit, Miller filed for bankruptcy in October 2015 and this likely will decrease or eliminate the value of the indemnity that MLV receives from Miller.
On July 5, 2016, Quadre Investments LP (“Quadre”) filed a petition with the Delaware Court of Chancery (the “Court”) seeking a determination of fair value for 943,769 shares of common stock of UOL in connection with the acquisition of UOL by the Company. Such transaction gave rise to appraisal rights pursuant to Section 262 of the General Corporation Law of the State of Delaware. As a result, Quadre petitioned the Court to receive fair value as determined by the Court. On June 30, 2017, the parties settled the action and the petition was dismissed. As discussed in Note 3, the settlement of this action resulted in an increased in goodwill.
In February 2017, certain former employees filed an arbitration claim with FINRA against Wunderlich Securities, Inc. (“WSI”) alleging misrepresentations in the recruitment of claimants to join WSI. Claimants also allege that WSI failed to support their mortgage trading business resulting in the loss of opportunities during their employment with WSI. Claimants are seeking $10,000 in damages. WSI has counterclaimed alleging that claimants mispresented their process for doing business, particularly their capital needs, resulting in substantial losses to WSI. WSI believes the claims are meritless and intends to vigorously defend the action. A hearing has been scheduled for March 2018.
In March 2017, United Online, Inc. received a letter from PeopleConnect, Inc. (formerly, Classmates, Inc.) (“Classmates”) regarding a notice of investigation received from the Consumer Protection Divisions of the District Attorneys’ offices of four California counties (“California DAs”). These entities suggest that Classmates may be in violation of California codes relating to unfair competition, false or deceptive advertising, and auto-renewal practices. Classmates asserts that these claims are indemnifiable claims under the purchase agreement between United Online, Inc. and the buyer of Classmates. A tolling agreement with the California DAs has been signed and informal discovery and production is in process. At the present time, the financial impact to the Company, if any, cannot be estimated.
In July 2017, an arbitration claim was filed with FINRA by Dominick & Dickerman LLC and Michael Campbell against WSI and Gary Wunderlich with respect to the acquisition by Wunderlich Investment Company, Inc. (“WIC”) (the parent corporation of WSI) of certain assets of Dominick & Dominick LLC in 2015. The Claimants allege that respondents overvalued WIC so that the purchase price paid to the Claimants in shares of WIC stock was artificially inflated. The Statement of Claim includes claims for common law fraud, negligent misrepresentation, and breach of contract. Claimants are seeking damages of approximately $8,000 plus unspecified punitive damages. Respondents believe the claims are meritless and intend to vigorously defend the action.
In September 2017, Frontier State Bank (“Frontier”) filed a lawsuit against Wunderlich Loan Capital Corp., a subsidiary of WIC (“WLCC”), seeking rescission of the purchase a residential mortgage in the amount of $1,300. Vanguard Funding, LLC (“Vanguard”) sold the mortgage to WLCC who then assigned its rights to Frontier. Shortly after closing, Frontier was advised that the mortgage had been previously pledged to another lender. In the lawsuit against WLCC, it is alleged that WLCC did not deliver the mortgage to Frontier with clear title. WLCC is conducting settlement discussions with Frontier that are not expected to have a material financial impact on the Company.
In September 2017, a statement of claim was filed in a FINRA arbitration naming FBRCM and other underwriters related to the underwriting of the now-bankrupt, Quantum Fuel Systems Technologies Worldwide, Inc. (“Quantum”). Claimants are seeking $37,000 in actual damages, plus $75,000 in punitive damages and attorney’s fees. On October 24, 2017, we joined in a motion with the other underwriters requesting that the claim be dismissed on the grounds that it is improper under FINRA Rules 12204 and 122205 which prohibit class actions and derivative claims, respectively. On December 1, 2017, the claims were dismissed by FINRA.
NOTE 13—14 — INCOME TAXES
The Tax Act was enacted on December 22, 2017. The Tax Act reduces the U.S. federal corporate tax rate from 35% to 21%, requires companies to pay a one-time transition tax on earnings of certain foreign subsidiaries that were previously tax deferred, provides an exemption from U.S. federal tax for dividends received from foreign subsidiaries, and creates new taxes on certain foreign sourced earnings. As of the completion of these financial statements and related disclosures, we have not completed our accounting for the tax effects of the Tax Act; however, we have made a reasonable estimate of such effects and recorded a provisional tax expense of $13,052, which is included as a component of income tax expense in the fourth quarter of 2017 and is comprised of (a) $12,954 related to the remeasurement of deferred tax assets and liabilities in the United States and (b) $98 related to the transition tax on foreign earnings. This provisional tax expense incorporates assumptions made based upon the Company’s current interpretation of the Tax Act, and may change as we receive additional clarification and implementation guidance and as the interpretation of the Tax Act evolves. In accordance with SEC Staff Accounting Bulletin No. 118, the Company will finalize the accounting for the effects of the Tax Act no later than the fourth quarter of 2018. Future adjustments made to the provisional effects will be reported as a component of income tax expense in the reporting period in which any such adjustments are determined.
The Company’s provision for income taxes consists of the following forduring the years ended December 31, 2017, 20162021, 2020, and 2015:2019:
| Year Ended December 31, | ||||||||||||
| 2017 | 2016 | 2015 | ||||||||||
| Current: | ||||||||||||
| Federal | $ | 3,804 | $ | 5,530 | $ | 201 | ||||||
| State | 1,019 | 1,114 | 99 | |||||||||
| Foreign | (975 | ) | 4,063 | 779 | ||||||||
| Total current provision | 3,848 | 10,707 | 1,079 | |||||||||
| Deferred: | ||||||||||||
| Federal | 6,889 | 3,015 | 5,166 | |||||||||
| State | (1,937 | ) | 610 | 1,443 | ||||||||
| Foreign | (290 | ) | (11 | ) | — | |||||||
| Total deferred | 4,662 | 3,614 | 6,609 | |||||||||
| Total provision for income taxes | $ | 8,510 | $ | 14,321 | $ | 7,688 | ||||||
| Year Ended December 31, | ||||||||||||
| 2021 | 2020 | 2019 | ||||||||||
| Current: | ||||||||||||
| Federal | $ | 67,322 | $ | 4,730 | $ | 16,499 | ||||||
| State | 30,036 | 3,297 | 6,176 | |||||||||
| Foreign | 4,796 | 5,344 | 1,092 | |||||||||
| Total current provision | 102,154 | 13,371 | 23,767 | |||||||||
| Deferred: | ||||||||||||
| Federal | 42,734 | 41,979 | 10,702 | |||||||||
| State | 17,824 | 18,518 | 175 | |||||||||
| Foreign | 1,248 | 1,572 | — | |||||||||
| Total deferred | 61,806 | 62,069 | 10,877 | |||||||||
| Total provision for income taxes | $ | 163,960 | $ | 75,440 | $ | 34,644 | ||||||
A reconciliation of the federal statutory rate of 35%21% to the effective tax rate for income before income taxes is as follows forduring the yearyears ended December 31, 2017, 20162021, 2020, and 2015:
| Year Ended December 31, | ||||||||||||
| 2017 | 2016 | 2015 | ||||||||||
| Provision for income taxes at federal statutory rate | 35.0 | % | 35.0 | % | 34.0 | % | ||||||
| State income taxes, net of federal benefit | 5.0 | 2.8 | 4.0 | |||||||||
| Transaction expenses | 2.0 | — | — | |||||||||
| Noncontrolling interest tax differential | (6.6 | ) | (6.2 | ) | — | |||||||
| Key man life insurance | (7.9 | ) | — | — | ||||||||
| Employee stock based compensation | (8.7 | ) | — | — | ||||||||
| Internal Revenue Service Section 338(g) - Treatment of acquisition of UOL as a taxable business combination | (44.6 | ) | — | — | ||||||||
| U.S. Tax Cuts and Jobs Act | 63.8 | — | — | |||||||||
| Other | 3.6 | (1.2 | ) | (1.8 | ) | |||||||
| Effective income tax rate | 41.6 | % | 30.4 | % | 36.2 | % | ||||||
2019:
| Year Ended December 31, | ||||||||||||
| 2021 | 2020 | 2019 | ||||||||||
| Provision for income taxes at federal statutory rate | 21.0 | % | 21.0 | % | 21.0 | % | ||||||
| State income taxes, net of federal benefit | 6.5 | % | 6.3 | % | 5.9 | % | ||||||
| Noncontrolling interest tax differential | 0.1 | % | (0.1 | %) | (0.1 | %) | ||||||
| Employee stock based compensation | (1.1 | %) | (2.2 | %) | (0.9 | %) | ||||||
| Other | 0.2 | % | 2.0 | % | 3.8 | % | ||||||
| Effective income tax rate | 26.7 | % | 27.0 | % | 29.7 | % | ||||||
Deferred income tax assets (liabilities) consisted of the following as of December 31, 20172021 and 2016:2020:
| December 31, | ||||||||
| 2021 | 2020 | |||||||
| Deferred tax assets: | ||||||||
| Accrued liabilities and other | $ | 8,286 | $ | 2,066 | ||||
| Mandatorily redeemable noncontrolling interests | 1,190 | 1,190 | ||||||
| Other | 649 | — | ||||||
| State taxes | 5,321 | 237 | ||||||
| Share based payments | 6,871 | — | ||||||
| Foreign tax and other tax credit carryforwards | 490 | 1,558 | ||||||
| Capital loss carryforward | 62,539 | 61,315 | ||||||
| Net operating loss carryforward | 32,445 | 33,185 | ||||||
| Total deferred tax assets | 117,791 | 99,551 | ||||||
| Deferred tax liabilities: | ||||||||
| Deductible goodwill and other intangibles | (5,129 | ) | (2,333 | ) | ||||
| Share based payments | — | (434 | ) | |||||
| Depreciation | (1,592 | ) | (112 | ) | ||||
| Deferred revenue | (116,631 | ) | (43,631 | ) | ||||
| Other | (6,483 | ) | (4,902 | ) | ||||
| Total deferred tax liabilities | (129,835 | ) | (51,412 | ) | ||||
| Net deferred tax assets | (12,044 | ) | 48,139 | |||||
| Valuation allowance | (78,163 | ) | (78,289 | ) | ||||
| Net deferred tax liabilities | $ | (90,207 | ) | $ | (30,150 | ) | ||
| Deferred tax assets, net | $ | 2,848 | $ | 4,098 | ||||
| Deferred tax liabilities, net | (93,055 | ) | (34,248 | ) | ||||
| Net deferred tax liabilities | $ | (90,207 | ) | $ | (30,150 | ) | ||
| December 31, | ||||||||
| 2017 | 2016 | |||||||
| Deferred tax assets: | ||||||||
| Deductible goodwill and other intangibles | $ | 4,019 | $ | — | ||||
| Accrued liabilities and other | 3,549 | 2,459 | ||||||
| Deferred revenue | 54 | 335 | ||||||
| Mandatorily redeemable noncontrolling interests | 1,109 | 1,173 | ||||||
| Other | 312 | 379 | ||||||
| State taxes | — | 994 | ||||||
| Share based payments | 2,117 | 443 | ||||||
| Foreign tax and other tax credit carryforwards | 290 | 1,855 | ||||||
| Capital loss carryforward | 2,582 | 3,600 | ||||||
| Net operating loss carryforward | 17,900 | 7,711 | ||||||
| Total deferred tax assets | 31,932 | 18,949 | ||||||
| Deferred tax liabilities: | ||||||||
| State taxes | (46 | ) | — | |||||
| Depreciation | (73 | ) | (1,291 | ) | ||||
| Goodwill and other intangibles | — | (4,139 | ) | |||||
| Total deferred tax liabilities | (119 | ) | (5,430 | ) | ||||
| Net deferred tax assets | 31,813 | 13,519 | ||||||
| Valuation allowance | (2,582 | ) | (4,900 | ) | ||||
| Net deferred tax assets | $ | 29,231 | $ | 8,619 | ||||
The Company’s income before income taxes of $20,445 for$614,762 during the year ended December 31, 20172021 includes a United States component of income before income taxes of $19,949$598,882 and a foreign component comprised of income before income taxes of $496.$15,880. As of December 31, 2017,2021, the Company had federal net operating loss carryforwards of $63,445,$48,869 and state net operating loss carryforwards of $76,978.$52,548. The Company’s federal net operating loss carryforwards will expire in the tax years commencing in December 31, 20292031 through December 31, 2034,2038, the state net operating loss carryforwards will expire in tax years commencing in December 31, 2029 and the foreign tax credit carryforwards will expire in 2027.2025.
The Company establishes a valuation allowance if, based on the weight of available evidence, it is more likely than not that some portion or all of the deferred tax assets will not be realized. Tax benefits of operating loss, capital loss, and tax credit carryforwards are evaluated on an ongoing basis, including a review of historical and projected future operating results, the eligible carryforward period, and other circumstances. The Company’s net operating losses are subject to annual limitations in accordance with Internal Revenue Code Section 382. Accordingly, the Company is limited to the amount of net operating loss that may be utilized in future taxable years depending on the Company’s actual taxable income. As of December 31, 2017,2021, the Company believes that the existing net operating loss carryforwards will be utilized in future tax periods before the loss carryforwards expire and it is more-likely-than-not that future taxable earnings will be sufficient to realize its deferred tax assets and has not provided a valuation allowance. The Company does not believe that it is more likely than not that the Companyit will be able to utilize the benefits related to capital loss carryforwards and has provided a full valuation allowance in the amount of $2,582$65,900 against these deferred tax assets.
AtAs of December 31, 2017,2021, the Company had gross unrecognized tax benefits totaling $1,140$10,826 all of which would have an impact on the Company’s effective income tax rate, if recognized. A reconciliation of the amounts of gross unrecognized tax benefits (before federal impact of state items), excluding interest and penalties, was as follows (in thousands):follows:
| Year Ended December 31, 2017 | ||||
| Beginning balance | ||||
| Addition as a result of the acquisition of UOL | $ | 1,255 | ||
| Additions for current year tax positions | — | |||
| Additions for Prior year tax positions | 34 | |||
| Reductions for Prior year tax positions | — | |||
| Reductions due to lapse in statutes of limitations | (149 | ) | ||
| Ending balance | $ | 1,140 | ||
| Year Ended | ||||
| December 31, | ||||
| 2021 | ||||
| Beginning balance | $ | 10,561 | ||
| Additions for current year tax positions | 15 | |||
| Additions for prior year tax positions | 331 | |||
| Reductions for prior year tax positions | (4 | ) | ||
| Reductions due to lapse in statutes of limitations | (77 | ) | ||
| Ending balance | $ | 10,826 | ||
The Company files income tax returns in the U.S., various state and local jurisdictions, and certain other foreign jurisdictions. The Company is currently under audit by certain federal, state and local, and foreign tax authorities. The audits are in varying stages of completion. The Company evaluates its tax positions and establishes liabilities for uncertain tax positions that may be challenged by tax authorities. Uncertain tax positions are reviewed on an ongoing basis and are adjusted in light of changing facts and circumstances, including progress of tax audits, case law developments, and closing of statutes of limitations. Such adjustments are reflected in the provision for income taxes, as appropriate. The Company is currently open to audit under the statute of limitations by the Internal Revenue Service for the calendar years ended December 31, 20142018 to 2017.2021.
AtAs of December 31, 2017,2021, the Company believes it is reasonably possible that its gross liabilities for unrecognized tax benefits may decrease by approximately $345$43 within the next 12 months due to audit settlements and expiration of statute of limitations.
TheDuring the year ended December 31, 2021, the Company had accrued $786 for interest and penalties relating to uncertain tax positions at December 31, 2017of $551 and $5,345 for UOL and magicJack, respectively, all of which was included in income taxes payable as a component of Accrual expenses and other liabilities inpayable. During the consolidated balance sheet. Theyear ended December 31, 2021, the Company recorded a benefit of $149$103 for UOL related to interest and penalty expenses related topenalties for uncertain tax positions which was includedprimarily due to the lapse in provision for income taxes, for the year ended December 31, 2017.statute of limitations.
NOTE 14—15 — EARNINGS PER SHARE
Basic earnings per share is calculated by dividing net income by the weighted-average number of shares outstanding during the year.period. Diluted earnings per share is calculated by dividing net income by the weighted-average number of common shares outstanding, after giving effect to all dilutive potential common shares outstanding during the year. period. Remeasurements to the carrying value of the redeemable noncontrolling interests in equity of subsidiaries are not deemed to be a dividend (see Note 2(v)). According to ASC 480 - Distinguishing Liabilities from Equity, there is no impact on earnings per share in the computation of basic and diluted earnings per share to common shareholders for changes in the carrying value of the redeemable noncontrolling interests in equity, when such changes in carrying value which in substance approximates fair value.
Basic common shares outstanding exclude 453,365387,365 common shares in 2019 that arewere held in escrow and subject to forfeiture. The 387,365 common shares held in escrow includes 66,000 common shares issuedwere forfeited and cancelled on June 11, 2020 to indemnify the former members of Great American Group, LLC are subjectCompany for certain representations and warranties and related claims pursuant to forfeiture upon the final settlement of claims for goods held for sale in connection with Alternative Asset Management Acquisition Corp. in 2009 and 387,365 common shares that are subject to forfeitures upon the final settlement of claims as more fully described in thea related escrow instructions. Dilutive common shares outstanding include contingently issuable shares that are currently in escrow and subject to release if the conditions for the final settlement of claims in accordance with the escrow instructions were satisfied at the end of the respective years. acquisition agreement.
Securities that could potentially dilute basic net income per share in the future that were not included in the computation of diluted net income per share forwere 1,639,310, 1,445,301, and 1,334,810 during the years ended December 31, 2017, 20162021, 2020, and 2015 were 709,358, 384,825 and 308,699,2019, respectively, because to do so would have been anti-dilutive.
Basic and diluted earnings from continuing operationsper share were calculated as follows (in thousands, except per share amounts):follows:
| Year Ended December 31, | ||||||||||||
| 2021 | 2020 | 2019 | ||||||||||
| Net income attributable to B. Riley Financial, Inc. | $ | 445,054 | $ | 205,148 | $ | 81,611 | ||||||
| Preferred stock dividends | (7,457 | ) | (4,710 | ) | (264 | ) | ||||||
| Net income applicable to common shareholders | $ | 437,597 | $ | 200,438 | $ | 81,347 | ||||||
| Weighted average common shares outstanding: | ||||||||||||
| Basic | 27,366,292 | 25,607,278 | 26,401,036 | |||||||||
| Effect of dilutive potential common shares: | ||||||||||||
| Restricted stock units and warrants | 1,514,728 | 901,119 | 1,082,700 | |||||||||
| Contingently issuable shares | 124,582 | — | 45,421 | |||||||||
| Diluted | 29,005,602 | 26,508,397 | 27,529,157 | |||||||||
| Basic income per common share | $ | 15.99 | $ | 7.83 | $ | 3.08 | ||||||
| Diluted income per common share | $ | 15.09 | $ | 7.56 | $ | 2.95 | ||||||
NOTE 16 — ACCRUED EXPENSES AND OTHER LIABILITIES
Accrued expenses and other liabilities consist of the following:
| December 31, | December 31, | |||||||
| 2021 | 2020 | |||||||
| Accrued payroll and related expenses | $ | 107,904 | $ | 67,333 | ||||
| Dividends payable | 28,486 | 1,987 | ||||||
| Income taxes payable | 39,776 | 29,177 | ||||||
| Other tax liabilities | 20,106 | 18,047 | ||||||
| Accrued expenses | 96,250 | 28,210 | ||||||
| Other liabilities | 51,228 | 28,424 | ||||||
| Accrued expenses and other liabilities | $ | 343,750 | $ | 173,178 | ||||
Other tax liabilities primarily consist of uncertain tax positions, sales and VAT taxes payable, and other non-income tax liabilities. Accrued expenses primarily consist of accrued trade payables, investment banking payables and legal settlements. Other liabilities primarily consist of interest payables, customer deposits, and accrued legal fees.
| Year Ended December 31, | ||||||||||||
| 2017 | 2016 | 2015 | ||||||||||
| Net income attributable to B. Riley Financial, Inc. | $ | 11,556 | $ | 21,526 | $ | 11,805 | ||||||
| Weighted average shares outstanding: | ||||||||||||
| Basic | 23,181,388 | 18,106,621 | 16,221,040 | |||||||||
| Effect of dilutive potential common shares: | ||||||||||||
| Restricted stock units and non-vested shares | 901,397 | 198,852 | — | |||||||||
| Contingently issuable shares | 208,119 | 86,379 | 44,875 | |||||||||
| Diluted | 24,290,904 | 18,391,852 | 16,265,915 | |||||||||
| Basic income per share | $ | 0.50 | $ | 1.19 | $ | 0.73 | ||||||
| Diluted income per share | $ | 0.48 | $ | 1.17 | $ | 0.73 | ||||||
NOTE 17 — COMMITMENTS AND CONTINGENCIES
(a) Legal Matters
NOTE 15— LIMITED LIABILITY COMPANY SUBSIDIARIES
(a) Operating Agreements of Limited Liability Company Subsidiaries
The Company hasis subject to certain subsidiarieslegal and other claims that are organized as limited liability companies, each of which has its own separate operating agreement. Generally, each of these subsidiaries is managed by an individual manager who is a member or employee of the subsidiary, although the manager may not take certain actions unless the majority member of the subsidiary consents to the action. These actions include, among others, the dissolution of the subsidiary, the disposition of all or a substantial part of the subsidiary’s assets notarise in the ordinary course of its business. In particular, the Company and its subsidiaries are named in and subject to various proceedings and claims arising primarily from the Company’s securities business filing for bankruptcy,activities, including lawsuits, arbitration claims, class actions, and regulatory matters. Some of these claims seek substantial compensatory, punitive, or indeterminate damages. The Company and its subsidiaries are also involved in other reviews, investigations, and proceedings by governmental and self-regulatory organizations regarding the Company’s business, which may result in adverse judgments, settlements, fines, penalties, injunctions, and other relief. In view of the number and diversity of claims against the Company, the number of jurisdictions in which litigation is pending, and the purchaseinherent difficulty of predicting the outcome of litigation and other claims, the Company cannot state with certainty what the eventual outcome of pending litigation or other claims will be. Notwithstanding this uncertainty, the Company does not believe that the results of these claims are likely to have a material effect on its financial position or results of operations.
(b) Babcock & Wilcox Commitments and Guarantee
On June 30, 2021, the Company agreed to guaranty (the “B. Riley Guaranty”) up to $110,000 of obligations that Babcock & Wilcox Enterprises, Inc. (“B&W”) may owe to providers of cash collateral pledged in connection with B&W’s debt financing. The B. Riley Guaranty is enforceable in certain circumstances, including, among others, certain events of default and the acceleration of B&W’s obligations under a reimbursement agreement with respect to such cash collateral. B&W will pay the Company $935 per annum in connection with the B. Riley Guaranty. B&W has agreed to reimburse the Company to the extent the B. Riley Guaranty is called upon.
On August 10, 2020, the Company entered into a project specific indemnity rider to a general agreement of indemnity made by the subsidiaryB&W in favor of one of its sureties. Pursuant to the members’ ownership interest uponindemnity rider, the occurrence of certain events. Certain ofCompany agreed to indemnify the memberssurety in connection with a minority ownership interestdefault by B&W under the underlying indemnity agreement relating to a $29,970 payment and performance bond issued by the surety in connection with a construction project undertaken by B&W. In consideration for providing the indemnity rider, B&W paid the Company fees in the subsidiaries are entitledamount of $600 on August 26, 2020.
On December 22, 2021, the Company entered into a general agreement of indemnity in favor of one of B&W’s sureties. Pursuant to receive guaranteed paymentsthis indemnity agreement, the Company agreed to indemnify the surety in connection with a default by B&W under a EUR 30,000 payment and performance bond issued by the surety in connection with a construction project undertaken by B&W. In consideration for providing the indemnity, B&W paid the Company fees in the formamount of compensation or draws, in addition to distributions of available cash from time to time. Distributions of available cash are generally made to each of the members in accordance with their respective ownership interests in the subsidiary after repayment of any loans made by any members to such subsidiary, and allocations of profits and losses of the subsidiary are generally made to members in accordance with their respective ownership interests in the subsidiary. The operating agreements also generally place restrictions$1,694 on the transfer of the members’ ownership interests in the subsidiaries and provideJanuary 20, 2022.
(c) Other Commitments
On June 19, 2020, the Company participated in a loan facility agreement to provide a total loan commitment up to 33,000 EUROS to a retailer in Europe. The Company made an initial funding of 6,600 EUROS in July 2020 and no additional borrowings were made after the initial funding. On December 29, 2021, the availability period under the loan expired, leaving no outstanding commitments under the facility as of December 31, 2021. As of December 31, 2020, unused commitments of 26,400 EUROS were outstanding under the facility.
In the normal course of business, the Company enters into commitments to its clients in connection with capital raising transactions, such as firm commitment underwritings, equity lines of credit, or the other members with certain rights of first refusalcommitments to provide financing on specified terms and drag along and tag along rights in the event of any proposed sales of the members’ ownership interests.
Generally, a member of the subsidiary who materially breaches the operating agreement of the subsidiary, which breach has a direct, substantial and adverse effect on the subsidiary and the other members, or who is convicted of a felony (or a lesser crime of moral turpitude) involving his management of or involvement in the affairs of the subsidiary, or a material act of dishonesty of the member involving his management of or involvement in the affairs of the subsidiary, shall forfeit his entire ownership interest in the subsidiary.
(b) Repurchase Obligations of Membership Interests of Limited Liability Company Subsidiaries
The operating agreements of the Company’s limited liability company subsidiariesconditions. These commitments require the Company to repurchasepurchase securities at a specified price or otherwise provide debt or equity financing on specified terms. Securities underwriting exposes the entire ownership interest of each the members upon the death of a member, disability of a member as definedCompany to market and credit risk, primarily in the operating agreement, or upon declarationevent that, for any reason, securities purchased by a court of law that a member is mentally unsound or incompetent. Upon the occurrence of one of these events, the Company is requiredcannot be distributed at the anticipated price and to repurchase the member’s ownership interest in an amount equal to the fair market value of the member’s noncontrolling interestbalance sheet risk in the subsidiary.event that debt or equity financing commitments cannot be syndicated.
The Company evaluated the classification of all of its limited liability company members’ ownership interests in accordance with the accounting guidance for financial instruments with characteristics of liabilities and equity. This guidance generally provides for the classification of members’ ownership interests that are subject to mandatory redemption obligations to be classified outside of equity. In accordance with this guidance, all members with a minority ownership interest in these subsidiaries are classified as liabilities and included in mandatorily redeemable noncontrolling interests in the accompanying consolidated balance sheets. Members of these subsidiaries with a minority ownership interest issued before November 5, 2003 are stated on a historical cost basis and members of the Company’s subsidiaries with a minority ownership interests issued on or after November 5, 2003 are stated at fair value at each balance sheet date. The Company deems such repurchase obligations, which are payable to members who are also employees of these subsidiaries, to be a compensatory benefit. Accordingly, the changes in the historical cost basis and the changes in the fair value of the respective members’ ownership interests (noncontrolling interests) are recorded as a component of selling, general and administrative expenses in the accompanying consolidated statements of income.
NOTE 18 — SHARE-BASED PAYMENTS
(a) 2021 Stock Incentive Plan
In accordance withThe 2021 Stock Incentive Plan (the “2021 Plan”) replaced the operating agreement of one of the Company’s limited liability Company’s, a repurchase event occurred in the second quarter of 2017 for one of the Members which resulted in the repurchase on the Members minority ownership interest. The triggering event resulted in a fair value adjustment and purchase of the Members minority interest in the amount of $7,850. The Company also received proceeds of $6,000 from key man life insurance in connection with this event.
During the year ended December 31, 2017, the change in fair value of the mandatorily redeemable noncontrolling interests was $9,000, which was comprised of a fair value adjustments of $1,150 and $7,850 from the triggering event previously discussed above. During the year ended December 31, 2016, the change in fair value of the mandatorily redeemable noncontrolling interests was $800. There was no change in the fair value of the mandatorily redeemable noncontrolling interests during the year ended December 31, 2015. The noncontrolling interests share of net income was $1,799, $2,232 and $2,207 for the years ended December 31, 2017, 2016 and 2015, respectively.
NOTE 16—SHARE BASED PAYMENTS
(a) Amended and Restated 2009 Stock Incentive Plan
During on May 27, 2021. Share-based compensation expense for restricted stock units under the 2021 Plan was $33,168, $14,830, and $11,626 during the years ended December 31, 2017, 20162021, 2020, and 2015,2019, respectively. During the year ended December 31, 2021, in connection with employee stock incentive plans the Company granted 516,152 restricted stock units representing 486,049, 544,605 and 527,372 shares of common stock with a total grant date fair value of $7,732, $5,301$35,289 and $5,261 to certain employees and directors1,958,540 performance stock units with a total grant date fair value of $67,227. During the year ended December 31, 2020, in connection with employee stock incentive plans the Company under the Company’s Amended and Restated 2009 Stock Incentive Plan (the “Plan”). Share-based compensation expense for suchgranted 465,711 restricted stock units was $4,994, $2,768 and $2,043 for the years ended December 31, 2017, 2016 and 2015, respectively. Thewith a total income tax benefit recognized related to the vestinggrant date fair value of restricted stock units was $1,249, $1,141 and $804 for the years ended December 31, 2017, 2016 and 2015, respectively.$8,818.
The restricted stock units generally vest over a period of one to threefive years based on continued service. Performance based restricted stock units generally vest based on both the employee’s continued service and the Company’s common stock price, as defined in the grant, achieving a set threshold during the two to three-year period following the grant.In determining the fair value of restricted stock units on the grant date, the fair value is adjusted for (a) estimated forfeitures, (b) expected dividends based on historical patterns and the Company’s anticipated dividend payments over the expected holding period, and (c) the risk-free interest rate based on U.S. Treasuries for a maturity matching the expected holding period.
As of December 31, 2017,2021, the expected remaining unrecognized share-based compensation expense of $7,901 will$82,639 was to be expensed over a weighted average period of 2.11.9 years. As of December 31, 2020, the expected remaining unrecognized share-based compensation expense of $11,156 was to be expensed over a weighted average period of 1.9 years.
A summary of equity incentive award activity under the Plan forduring the years ended December 31, 2017, 2016,2021 and 20152020 was as follows:
| Weighted | ||||||||
| Average | ||||||||
| Shares | Fair Value | |||||||
| Nonvested at December 31, 2019 | 2,263,988 | $ | 12.35 | |||||
| Granted | 465,711 | 18.93 | ||||||
| Vested | (1,730,734 | ) | 10.88 | |||||
| Forfeited | (171,743 | ) | 11.47 | |||||
| Nonvested at December 31, 2020 | 827,222 | $ | 19.29 | |||||
| Granted | 2,474,692 | 41.43 | ||||||
| Vested | (412,272 | ) | 19.97 | |||||
| Forfeited | (5,766 | ) | 50.52 | |||||
| Nonvested at December 31, 2021 | 2,883,876 | $ | 38.21 | |||||
| Shares | Weighted Average Fair Value | |||||||
| Nonvested at January 1, 2015 | 5,859 | $ | 7.68 | |||||
| Granted | 527,372 | 9.98 | ||||||
| Vested | (196,414 | ) | 9.92 | |||||
| Forfeited | (14,086 | ) | 9.98 | |||||
| Nonvested at December 31, 2015 | 322,731 | $ | 9.97 | |||||
| Granted | 544,605 | 9.73 | ||||||
| Vested | (173,147 | ) | 10.13 | |||||
| Forfeited | (14,054 | ) | 9.84 | |||||
| Nonvested at December 31, 2016 | 680,135 | $ | 9.74 | |||||
| Granted | 486,049 | 15.91 | ||||||
| Vested | (344,196 | ) | 10.05 | |||||
| Forfeited | (29,724 | ) | 10.49 | |||||
| Nonvested at December 31, 2017 | 792,264 | $ | 13.30 | |||||
The per-share weighted average grant-date fair value of restricted stock units was $15.91, $9.73 and $9.98 forgranted during the years endingended December 31, 2017, 20162021 and 2015,2020 was $68.37 and $18.93, respectively. TheFor the year ended December 31, 2021, the grant-date per-share weighted average fair value of performance stock units granted was $34.33. During the year ended December 31, 2021, the total fair value of shares vested duringwas $8,233. During the yearsyear ended December 31, 2017, 2016 and 20152020, the total fair value of shares vested was $3,459, $1,755 and $1,949, respectively.$18,831, which included $11,236 in performance based restricted stock units which fully vested in December 2020.
(b) Amended and Restated FBR & Co. 2006 Long-Term Stock Incentive Plan
In connection with the acquisition of FBR & Co. on June 1, 2017, the equity awards previously granted or available for issuance under the FBR & Co. 2006 Long-Term Stock Incentive Plan (the “FBR Stock Plan”) may be issued underissued. On May 27, 2021, the FBR Stock Plan was replaced by the 2021 Plan. During the year ended December 31, 2017,2021, the Company granted restricted stock units representing 871,31715,334 shares of common stock with a total grant date fair value of $14,577. Share-based compensation expense was $2,956 for such restricted$1,007 and 140,000 performance stock units forwith a grant date fair value of $5,202 under the FBR Stock Plan. During the year ended December 31, 2017. In2020, the Company granted, restricted stock units representing 142,029 shares of common stock with a total grant date fair value of $2,603 under the FBR Stock Plan. The share-based compensation expense in connection with the restructuring discussed in Note 4, the Company recorded additional share-based compensation expense of $2,391 related to the accelerated vesting ofFBR Stock Plan restricted stock awards. Ofawards was $2,085, $3,381, and $3,969 during the $2,391, $884 related to former corporate executives of FBR and $1,507 related to employees in the Capital Markets segment. The total income tax benefit recognized related to the vesting of restricted stock units was $1,376 for the yearyears ended December 31, 2017.
The restricted stock units generally vest over a period of one to three years based on continued service. In determining the fair value of restricted stock units on the grant date, the fair value is adjusted for (a) estimated forfeitures, (b) expected dividends based on historical patterns2021, 2020, and the Company’s anticipated dividend payments over the expected holding period and (c) the risk-free interest rate based on U.S. Treasuries for a maturity matching the expected holding period.2019, respectively. As of December 31, 2017,2021, the expected remaining unrecognized share-based compensation expense of $11,362$5,183 will be expensed over a weighted average period of 2.51.2 years. As of December 31, 2020, the expected remaining unrecognized share-based compensation expense of $3,686 will be expensed over a weighted average period of 1.8 years.
A summary of equity incentive award activity for the period from June 1, 2017, the dateas of the acquisition of FBR, through December 31, 20172021 and 2020 was as follows:
| Shares | Weighted Average Fair Value | |||||||
| Nonvested at June 1, 2017, acquisition date of FBR resulting from the exchange of previously existing FBR awards | 530,661 | $ | 14.70 | |||||
| Granted | 871,317 | 16.73 | ||||||
| Vested | (200,905 | ) | 15.08 | |||||
| Forfeited | (134,940 | ) | 15.79 | |||||
| Nonvested at December 31, 2017 | 1,066,133 | $ | 16.15 | |||||
| Weighted | ||||||||
| Average | ||||||||
| Shares | Fair Value | |||||||
| Nonvested at December 31, 2019 | 485,033 | $ | 18.33 | |||||
| Granted | 142,029 | 18.33 | ||||||
| Vested | (310,867 | ) | 17.37 | |||||
| Forfeited | (26,075 | ) | 19.21 | |||||
| Nonvested at December 31, 2020 | 290,120 | $ | 19.33 | |||||
| Granted | 155,334 | 39.98 | ||||||
| Vested | (150,337 | ) | 20.08 | |||||
| Forfeited | (10,636 | ) | 30.59 | |||||
| Nonvested at December 31, 2021 | 284,481 | $ | 30.06 | |||||
The per-share weighted average grant-date fair value of restricted stock units was $16.73 during the year endedgranted as of December 31, 2017. There were 200,905 restricted stock units with a2021 and 2020 was $65.69 and $18.33, respectively. As of December 31, 2021, the grant-date per-share weighted average fair value of $3,030 thatperformance stock units granted was $37.16. The total fair value of shares vested during the year endedas of December 31, 2017 under the Plan.2021 and 2020 was $3,018 and $5,400, respectively.
NOTE 17—19 — BENEFIT PLANS AND CAPITAL TRANSACTIONS
(a) |
In connection with the consummation of the Acquisition, the Company assumed the AAMAC 2009 Stock Incentive Plan which was approved by the AAMAC stockholders on July 31, 2009 (as assumed, the “Incentive Plan”). In accordance with Section 13(a) of the Incentive Plan, in connection with the Company’s assumption of the Incentive Plan, the Company’s board of directors adjusted the maximum number of shares that may be delivered under the Incentive Plan to 782,200 to account for the two-for-one exchange ratio of Company common stock for AAMAC common stock in the Acquisition. On August 19, 2009, the Company’s board of directors approved an amendment and restatement of the Incentive Plan which adjusted the number of shares of stock the Company reserved for issuance thereunder to 391,100. Effective as of October 7, 2014, the Company’s board of directors approved an amendment and restatement of the Incentive Plan which, among other things, increased the number of shares of stock the Company reserved for issuance thereunder to 3,210,133 shares. As of December 31, 2017, the Company has 1,925,178 shares of common stock available for future grants under the Incentive Plan.
(b) Employee Benefit PlanPlans
The Company maintains qualified defined contribution 401(k) plans, which cover substantially all of its U.S. employees. Under the plans, participants are entitled to make pre-tax contributions up to the annual maximums established by the Internal Revenue Service. The plan documents permit annual discretionary contributions from the Company. Employer contributions in the amount of $565$2,125, $1,565 and $53$1,424 were made during the years ended December 31, 20172021, 2020, and 2016,2019, respectively.
(b) Employee Stock Purchase Plan
In connection with the Company’s Employee Stock Purchase Plan, share based compensation was $758, $377 and $322 during the years ended December 31, 2021, 2020, and 2019, respectively. As of December 31, 2021, there were 450,717 shares reserved for issuance under the Purchase Plan. As of December 31, 2020, there were 502,326 shares reserved for issuance under the Purchase Plan.
(c) Public Offering of Common Stock
On May 10, 2016,Since October 30, 2018, the Company’s Board of Directors has authorized annual share repurchase programs of up to $50,000 of its outstanding common shares. All share repurchases were effected on the open market at prevailing market prices or in privately negotiated transactions. During the year ended December 31, 2021, the Company completedrepurchased 44,650 shares of its common stock for $2,656, which represents an average price of $59.49 per common share. The shares repurchased under the public offeringprogram were retired. On October 25, 2021, the share repurchase program was reauthorized by the Board of 2,420,980Directors for share repurchases up to $50,000 of its outstanding common shares and expires in October 2022.
During the year ended December 31, 2020, the Company repurchased 2,165,383 shares of its common stock for $48,248 which represents an average price of $22.28 per common share. On July 1, 2020, the Company entered into an agreement to repurchase 900,000 shares of its common stock for $19,800 ($22.00 per common share) from one of its shareholders. In accordance with the agreement, the Company repurchased 450,000 shares for $9,900 on July 2, 2020 and the remaining 450,000 shares were repurchased for $9,900 on November 2, 2020. In addition to the repurchases of common stock, 387,365 shares of the Company’s common stock that were previously held in escrow in connection with the acquisition of a wealth management company in 2017 were forfeited and cancelled on June 11, 2020 to indemnify the Company for certain representations and warranties and related claims pursuant to a related acquisition agreement. In January and February of 2020, the Company repurchased 880,000 shares of its common stock in a block purchase from an existing stockholder as part of a privately-negotiated transaction. The Company purchased the shares at $24.4725 per share for an aggregate amount of $21,536.
On January 15, 2021, the Company issued 1,413,045 shares of common stock inclusive of 184,310 shares issued pursuant to the full exercise of the Underwriter’s option to purchase additional shares of common stock at a price of $46 per share for net proceeds of approximately $64,713 after underwriting fees and costs.
(d) Preferred Stock
On October 7, 2019, the Company closed its public offering of depositary shares (the “Depositary Shares”), each representing 1/1000th of a share of 6.875% Series A Cumulative Perpetual Preferred Stock, par value $0.0001 per share (the “Series A Preferred Stock”). The liquidation preference of each share of Series A Preferred Stock is $25,000 ($25.00 per Depositary Share). At the closing, the Company issued 2,000 shares of Series A Preferred Stock represented by 2,000,000 Depositary Shares issued. On October 11, 2019, the Company completed the sale of an additional 300,000 Depositary Shares, pursuant to the publicunderwriters’ full exercise of $9.50their over-allotment option to purchase additional Depositary Shares. The offering of the 2,300,000 Depositary Shares generated $57,500 of gross proceeds. The Company may elect from time to time to offer the Series A Preferred Stock via ATM sales.
During the years ended December 31, 2021 and 2020, the Company issued depositary shares equivalent to 233 and 232 shares, respectively, of the Series A Preferred Stock through ATM sales. There were 2,814 and 2,581 shares issued and outstanding as of December 31, 2021 and 2020, respectively. Total liquidation preference for the Series A Preferred Stock as of December 31, 2021 and 2020, was $70,362 and $64,519, respectively. Dividends on the Series A preferred paid during the years ended December 31, 2021 and 2020, were $1.71875 and $1.71875 per depositary share, respectively.
On September 4, 2020, the Company issued depositary shares each representing 1/1000th of a share of 7.375% Series B Cumulative Perpetual Preferred Stock, par value $0.0001 per share (the “Series B Preferred Stock”). The Series B Preferred Stock has a liquidation preference of $25 per 1/1000 depositary share or $25,000 per preferred share. The net proceeds fromAs a result of the offering the Company issued 1,300 shares of Series B Preferred Stock represented by 1,300,000 depositary shares. The offering resulted in gross proceeds of approximately $32,500. The Company may elect from time to time to offer the Series B Preferred Stock via ATM sales.
During the years ended December 31, 2021 and 2020, the Company issued depositary shares equivalent to 307 and 90 shares, respectively, of the Series B Preferred Stock through ATM sales. There were $22,759 after deducting underwriting commissions1,697 shares and 1,390 shares issued and outstanding as of December 31, 2021, and 2020, respectively. Total liquidation preference for the Series B Preferred Stock as of December 31, 2021 and 2020, was $42,428 and $34,741, respectively. Dividends on the Series B preferred paid during the years ended December 31, 2021 and 2020, were $1.84375 and $0.29193 per depositary share, respectively.
The Series A Preferred Stock and the Series B Preferred Stock ranks, as to dividend rights and rights upon the Company’s liquidation, dissolution or winding up: (i) senior to all classes or series of the Company’s common stock and to all other equity securities issued by the Company other than equity securities issued with terms specifically providing that those equity securities rank on a parity with the Series A Preferred Stock or Series B Preferred Stock, (ii) junior to all equity securities issued by the Company with terms specifically providing that those equity securities rank senior to the Series A Preferred Stock and the Series B Preferred Stock with respect to payment of dividends and the distribution of assets upon the Company’s liquidation, dissolution or winding up and (iii) effectively junior to all of the Company’s existing and future indebtedness (including indebtedness convertible into our common stock or preferred stock) and to the indebtedness and other offering expensesliabilities of $240.(as well as any preferred equity interests held by others in) the Company’s existing or future subsidiaries. Generally, the Series A Preferred Stock and the Series B Preferred Stock is not redeemable by the Company prior to October 7, 2024. However, upon a change of control or delisting event, the Company will have the special option to redeem the Series A Preferred Stock and the Series B Preferred Stock.
(d)(e) Dividends
On May 4, 2015,From time to time, we may decide to pay dividends which will be dependent upon our Boardfinancial condition and results of Directors approved a dividendoperations. During the years ended December 31, 2021, 2020, and 2019, we paid cash dividends on our common stock of $0.06 per share, which was paid on or about June 12, 2015 to stockholders of record on May 22, 2015. On August 10, 2015, our Board of Directors approved a dividend of $0.20 per share, which was paid on or about September 10, 2015 to stockholders of record on August 25, 2015. On November 9, 2015, our Board of Directors approved a dividend of $0.06 per share, which was paid on or about December 9, 2015 to stockholders of record on November 24, 2015. On August 4, 2016, our Board of Directors approved a dividend of $0.03 per share, which was paid on or about September 8, 2016 to stockholders of record on August 22, 2016. On November 13, 2016, our Board of Directors approved a regular dividend of $0.08 per share$347,135, $38,792, and a special dividend of $0.17 per share, which was paid on or about December 14, 2016 to stockholders of record on November 29, 2016.$41,138, respectively. On February 20, 2017, our Board of Directors approved23, 2022, the Company declared a regular quarterly dividend of $0.08 per share and a special dividend of $0.18 per share, which were paid on or about March 13, 2017 to stockholders of record on March 6, 2017. On May 10, 2017, our Board of Directors approved a regular quarterly dividend of $0.08 per share and a special dividend of $0.08 per share, which were paid on or about May 31, 2017 to stockholders of record on May 23, 2017. On August 7, 2017, our Board of Directors approved a regular quarterly dividend of $0.08 per share and a special dividend of $0.05 per share, which were paid on or about August 29, 2017 to stockholders of record on August 21, 2017. On November 8, 2017, our Board of Directors approved a regular quarterly dividend of $0.08 per share and a special dividend of $0.04 per share, which were paid on or about November 30, 2017 to stockholders of record on November 22, 2017. On March 7, 2018, our Board of Directors approved a regular quarterly dividend of $0.08 per share and a special dividend of $0.08$1.00 per share, which will be paid on or about April 3, 2018March 23, 2022 to stockholders of record as of March 9, 2022. On October 28, 2021, we declared a regular dividend of $1.00 per share and special dividend of $3.00 per share that will be paid on March 20, 2018.or about November 23, 2021 to stockholders of record as of November 9, 2021. On July 29, 2021, we declared a regular dividend of $0.50 per share and special dividend of $1.50 per share that was paid on August 26, 2021 to stockholders of record as of August 13, 2021. On May 3, 2021, we declared a regular dividend of $0.50 per share and special dividend of $2.50 per share that was paid on May 28, 2021 to stockholders of record as of May 17, 2021. On October 28, 2021, the Board of Directors announced an increase to the regular quarterly dividend from $0.50 per share to $1.00 per share. While it is the Board’s current intention to make regular dividend payments of $0.08$0.50 per share each quarter and special dividend payments dependent upon exceptionalcertain circumstances from time to time, our Board of Directors may reduce or discontinue the payment of dividends at any time for any reason it deems relevant. The declaration and payment of any future dividends or repurchases of our common stock will be made at the discretion of our Board of Directors and will be dependent upon our financial condition, results of operations, cash flows, capital expenditures, and other factors that may be deemed relevant by our Board of Directors.
A summary of our common stock dividend activity during the years ended December 31, 2021, 2020, and 2019 was as follows:
The Company’s Board
| Regular Dividend | Special Dividend | Total Dividend | ||||||||||||||
| Date Declared | Date Paid | Stockholder Record Date | Amount | Amount | Amount | |||||||||||
| October 28, 2021 | November 23, 2021 | November 9, 2021 | $ | 1.000 | $ | 3.000 | $ | 4.000 | ||||||||
| July 29, 2021 | August 26, 2021 | August 13, 2021 | 0.500 | 1.500 | 2.000 | |||||||||||
| May 3, 2021 | May 28, 2021 | May 17, 2021 | 0.500 | 2.500 | 3.000 | |||||||||||
| February 25, 2021 | March 24, 2021 | March 10, 2021 | 0.500 | 3.000 | 3.500 | |||||||||||
| October 28, 2020 | November 24, 2020 | November 10, 2020 | 0.375 | 0.000 | 0.375 | |||||||||||
| July 30, 2020 | August 28, 2020 | August 14, 2020 | 0.300 | 0.050 | 0.350 | |||||||||||
| May 8, 2020 | June 10, 2020 | June 1, 2020 | 0.250 | 0.000 | 0.250 | |||||||||||
| March 3, 2020 | March 31, 2020 | March 17, 2020 | 0.250 | 0.100 | 0.350 | |||||||||||
| October 30, 2019 | November 26, 2019 | November 14, 2019 | 0.175 | 0.475 | 0.650 | |||||||||||
| August 1, 2019 | August 29, 2019 | August 15, 2019 | 0.175 | 0.325 | 0.500 | |||||||||||
| May 1, 2019 | May 29, 2019 | May 15, 2019 | 0.080 | 0.180 | 0.260 | |||||||||||
| March 5, 2019 | March 26, 2019 | March 19, 2019 | 0.080 | 0.000 | 0.080 | |||||||||||
Holders of Directors may reduce or discontinueSeries A Preferred Stock, when and as authorized by the paymentboard of directors of the Company, are entitled to cumulative cash dividends at any time for any reason it deems relevant. The declaration and paymentthe rate of any future dividends or repurchases6.875% per annum of the Company’s common stock$25,000 liquidation preference ($25.00 per Depositary Share) per year (equivalent to $1,718.75 or $1.71875 per Depositary Share). Dividends will be madepayable quarterly in arrears, on or about the last day of January, April, July and October. On January 9, 2020, the Company declared a cash dividend of $0.4296875 per Depositary Share, which was paid on January 31, 2020 to holders of record as of the close of business on January 21, 2020. On April 13, 2020, the Company declared a cash dividend of $0.4296875 per Depositary Share, which was paid on April 30, 2020 to holders of record as of the close of business on April 23, 2020. On July 7, 2020, the Company declared a cash dividend of $0.4296875 per Depositary Share, which was paid on July 31, 2020 to holders of record as of the close of business on July 21, 2020. On October 8, 2020, the Company declared a cash dividend of $0.4296875 per Depositary Share, which was paid on October 31, 2020 to holders of record as of the close of business on October 21, 2020. On January 11, 2021, the Company declared a cash dividend of $0.4296875 per Depositary Share, which was paid on January 29, 2021 to holders of record as of the close of business on January 21, 2021. On April 5, 2021, the Company declared a cash dividend $0.4296875 per Depositary Share, which was paid on April 30, 2021 to holders of record as of the close of business on April 20, 2021. On July 8, 2021, the Company declared a cash dividend $0.4296875 per Depositary Share, which was paid on August 2, 2021 to holders of record as of the close of business on July 21, 2021. On October 6, 2021, the Company declared a cash dividend $0.4296875 per Depositary Share, which was paid on November 1, 2021 to holders of record as of the close of business on October 21, 2021. On January 10, 2022, the Company declared a cash dividend $0.4296875 per Depositary Share, which was paid on January 31, 2022 to holders of record as of the close of business on January 21, 2022.
Holders of Series B Preferred Stock, when and as authorized by the board of directors of the Company, are entitled to cumulative cash dividends at the discretionrate of 7.375% per annum of the Board of Directors and$25,000 liquidation preference ($25.00 per Depositary Share) per year (equivalent to $1,843.75 or $1.84375 per Depositary Share). Dividends will be dependent uponpayable quarterly in arrears, on or about the Company’s financial condition, resultslast day of operations,January, April, July and October. On October 8, 2020, the Company declared a cash dividend of $0.29193 per Depositary Share, which was paid on October 31, 2020 to holders of record as of the close of business on October 21, 2020. On January 11, 2021, the Company declared a cash dividend of $0.4609375 per Depositary Share, which was paid on January 29, 2021 to holders of record as of the close of business on January 21, 2021. On April 5, 2021, the Company declared a cash dividend $0.4609375 per Depositary Share, which was paid on April 30, 2021 to holders of record as of the close of business on April 20, 2021. On July 8, 2021, the Company declared a cash dividend $0.4609375 per Depositary Share, which was paid on August 2, 2021 to holders of record as of the close of business on July 21, 2021. On October 6, 2021, the Company declared a cash dividend $0.4609375 per Depositary Share, which was paid on November 1, 2021 to holders of record as of the close of business on October 21, 2021. On January 10, 2022, the Company declared a cash dividend $0.4609375 per Depositary Share, which was paid on January 31, 2022 to holders of record as of the close of business on January 21, 2022.
Our principal sources of liquidity to finance our business is our existing cash on hand, cash flows capital expenditures,generated from operating activities, funds available under revolving credit facilities and other factors that may be deemed relevant by the Board of Directors.special purpose financing arrangements.
NOTE 18—20 — NET CAPITAL REQUIREMENTS
B. Riley & Co., LLCSecurities (“BRC”BRS”), B. Riley FBR, MLVWealth Management (“BRWM”), and WunderlichNational Securities Inc.Corporation (“WSI”NSC”), the Company’s broker-dealer subsidiaries, are registered with the SEC as broker-dealers and are members of the Financial Industry Regulatory Authority, Inc. (“FINRA”). The Company’s broker-dealer subsidiaries are subject to SEC Uniform Net Capital Rule (Rule 15c3-1) which requires the subsidiaries to maintainmaintenance of minimum net capital and requires that the ratio of aggregate indebtedness to net capital, both as defined, shallto not exceed 15 to 1. As such, they are subject to the minimum net capital requirements promulgated by the SEC. As of December 31, 2017, BRC2021, BRS had net capital of $350,$277,611, which was $100$265,093 in excess of its required minimum net capital of $250 (net capital ratio of 3.50 to 1); B. Riley FBR$12,518; BRWM had net capital of $56,462,$13,833, which was $54,897$12,819 in excess of its required minimum net capital of $1,565 (net capital ratio of 1.02 to 1);$1,014; and MLVNSC had net capital of $496,$1,959 which was $396$959 in excess of required minimum net capital of $1,000. As of December 31, 2020, BRS had net capital of $146,060, which was $140,101 in excess of its required minimum net capital of $100 (net capital ratio of 1.25 to 1),$5,959; and WSIBRWM had net capital of $4,292,$4,998, which was $3,653$4,299 in excess of its required minimum net capital of $640 (net capital ratio of 1.17 to 1).$699.
NOTE 19—21 — RELATED PARTY TRANSACTIONS
AtThe Company provides asset management and placement agent services to unconsolidated funds affiliated with the Company (the “Funds”). In connection with these services, the Funds may bear certain operating costs and expenses which are initially paid by the Company and subsequently reimbursed by the Funds.
As of December 31, 2017,2021, amounts due from related parties include $5,585of $2,306 included $621 from GACP I, L.P., $52 from GACP II, L.P. and $52 from CA Global Partners, LLC (“CA Global”)the Funds for management fees, incentive fees and other operating expenses. At December 31, 2016, amounts due from related parties include $2,050 from GACP I, L.P. for management fees, incentive fees and other operating expenses, and $959$1,635 due from CA Global Partners LLC (“CA Global”). The amounts receivable and payable from CA Global are comprised of amounts due for operating expenses related to and due from CA Global in connection with certain auctions of wholesale and industrial machinery and equipment that they wereliquidation engagements managed by CA Global on behalf of GA Global Ptrs.Partners. As of December 31, 2020, amounts due from related parties of $1,037 included $604 from the Funds for management fees and other operating expenses and $433 due from CA Global for operating expenses related to wholesale and industrial liquidation engagements managed by CA Global on behalf of GA Global Partners.
During the years ended December 31, 2021 and 2020, the Company recorded interest expense of $525 and $1,710, respectively, related to loan participations sold to BRC Partners Opportunity Fund, LP (“BRCPOF”), a private equity fund managed by one of its subsidiaries. The Company also recorded commission income of $555 and $568 from introducing trades on behalf of BRCPOF during the years ended December 31, 2021 and 2020, respectively. Our executive officers and members of our board of directors have a 55.8% financial interest, which includes a financial interest of Bryant Riley, our Co-Chief Executive Officer, of 31.8% in the BRCPOF as of December 31, 2021. The Company had no outstanding loan participations to BRCPOF as of December 31, 2021 and had $14,816 outstanding as of December 31, 2020.
In June 2020, the Company entered into an investment advisory services agreement with Whitehawk Capital Partners, L.P. (“Whitehawk”), a limited partnership controlled by Mr. J. Ahn, who is the brother of Phil Ahn, the Company’s Chief Financial Officer and Chief Operating Officer. Whitehawk has agreed to provide investment advisory services for GACP I, L.P. and GACP II, L.P. During the years ended December 31, 2021 and 2020, management fees paid for investment advisory services by Whitehawk was $1,729 and $1,214, respectively.
The Company periodically participates in loans and financing arrangements for which the Company has an equity ownership and representation on the board of directors (or similar governing body). The Company may also provide consulting services or investment banking services to raise capital for these companies. These transactions can be summarized as follows:
Babcock and Wilcox
The Company had a last-out term loan receivable due from B&W that is included in loans receivable, at fair value with a fair value of $176,191 as of December 31, 2020. On June 1, 2021 the Company agreed to settle the outstanding balance and accrued interest on the last-out term loan receivable in exchange for $848 and 2,916,880 shares of B&W’s 7.75% Series A Cumulative Perpetual Preferred Stock.
During the years ended December 31, 2021 and 2020, the Company earned $15,766 and $2,486, respectively, of underwriting and financial advisory and other fees from B&W in connection with B&W’s capital raising activities.
One of the offering of $28,750 of Senior Notes as more fully described in Note 11, certain members of management andCompany’s wholly owned subsidiaries entered into a services agreement with B&W that provided for the Board of DirectorsPresident of the Company purchased $2,731 or 9.5%to serve as the Chief Executive Officer of B&W until November 30, 2020 (the “Executive Consulting Agreement”), unless terminated by either party with thirty days written notice. The agreement was extended through December 31, 2023. Under this agreement, fees for services provided are $750 per annum, paid monthly. In addition, subject to the achievement of certain performance objectives as determined by B&W’s compensation committee of the Senior Notes offered byboard, a bonus or bonuses may also be earned and payable to the Company.
The Company is also a party to indemnification agreements for the benefit of B&W, and the B. Riley Guaranty, each as disclosed above in Note 17 – Commitments and Contingencies.
Maven
The Company has loans receivable due from the Maven, Inc. that are included in loans receivable, at fair value of $69,835 and $56,552 as of December 31, 2021 and 2020, respectively. Interest on these loans is payable at 10% per annum with maturity dates through December 2022.
NOTE 20— BUSINESS SEGMENTS
Lingo
The Company has loans receivable due from Lingo Management LLC (“Lingo”) included in loans receivable, at fair value with a fair value of $58,565 and $55,066 as of December 31, 2021 and 2020, respectively. The term loan bears interest at 16.0% per annum with a maturity date of December 1, 2022. The term loan has a conversion feature under which $17,500 will convert to additional equity ownership upon receipt of certain regulatory approval. If those regulatory approvals are received, the conversion would increase the Company’s ownership interest in Lingo from 40% to 80%. On August 1, 2021, the credit agreement was amended to allow the borrower to elect that a portion of interest payable be payable in kind. On March 10, 2021, the Company also extended a promissory note to Lingo Communications, LLC (a wholly owned subsidiary of Lingo) in the amount of $1,100. The note bears interest at 6% per annum with a maturity date of March 31, 2022.
bebe
The Company had a loan receivable due from bebe included in loans receivable, at fair value with a fair value of $8,000 as of December 31, 2020. The term loan bore interest at 16.0% per annum and had a maturity date of November 10, 2021. The term loan was paid in full in August 2021.
Charah Solutions, Inc.
On August 25, 2021 the Company extended a $17,852 promissory note to Charah Solutions, Inc., in which one of the Company’s operating segments reflectsenior executives serves on the mannerboard of directors. The promissory note bore interest at 8.0% per annum and had a maturity date of September 25, 2022 and a 2.5% commitment fee payable at maturity. The promissory note was paid in full in December 2021.
California Natural Resources Group, LLC.
On November 1, 2021 the Company extended a $34,393 bridge promissory note bearing interest at up to 10% per annum (the “Bridge Note”) to California Natural Resources Group, LLC (“CalNRG”). As of December 31, 2021, the Bridge Note is included in loans receivable, at fair value in the amount of $34,000. On January 3, 2022, CalNRG repaid the Bridge Note using proceeds from a new credit facility with a third party bank (the “CalNRG Credit Facility”). The Company has guaranteed CalNRG’s obligations, up to $10,375, under the CalNRG Credit Facility.
Other
As of December 31, 2021, the Company has loans receivable due from other related parties in the amount of $4,201.
The Company often provides consulting or investment banking services to raise capital for companies in which the business is managed and howCompany has significant influence through equity ownership, representation on the board of directors (or similar governing body), or both. During the year ended December 31, 2021, the Company allocates resources and assesses performance internally. The Company has several operating subsidiaries through which it delivers specificearned $26,236 of fees related to these services. The Company provides investment banking, corporate finance, restructuring, research, wealth management, sales and trading services to corporate, institutional and high net worth clients. The Company also provides auction and liquidation services to help clients dispose of assets that include multi-location retail inventory, wholesale inventory, trade fixtures, machinery and equipment, intellectual property and real property and valuation and appraisal services to clients with independent appraisals in connection with asset based loans, acquisitions, divestitures and other business needs. As a result of the acquisition of UOL on July 1, 2016, the Company provides consumer services and products over the Internet.
NOTE 22 — BUSINESS SEGMENTS
The Company’s business is classified into the Capital Markets segment, Wealth Management segment, Auction and Liquidation segment, Valuation and AppraisalFinancial Consulting segment, and Principal Investments - United OnlineCommunications segment and Brands segment. These reportable segments are all distinct businesses, each with a different marketing strategy and management structure.
During the fourth quarter of 2020, the Company realigned its segment reporting structure to reflect organizational management changes. Under the new structure, the valuation and appraisal businesses are reported in the Financial Consulting segment and our bankruptcy, financial advisory, forensic accounting, and real estate consulting businesses that were previously reported in the Capital Markets segment are now reported in the Financial Consulting segment.
As a result of the National acquisition, the Company realigned its segment reporting structure in the first quarter of 2021 to reflect organizational management changes for its wealth management business. Under the new structure, the wealth management business previously reported in the Capital Markets segment are now reported in the Wealth Management segment. Under the new structure, there is a new segment for Wealth Management.
In conjunction with the new reporting structure, the Company recast its segment presentation for all periods presented. The following is a summary of certain financial data for each of the Company’s reportable segments:
| Year Ended December 31, | ||||||||||||
| 2021 | 2020 | 2019 | ||||||||||
| Capital Markets segment: | ||||||||||||
| Revenues - Services and fees | $ | 575,317 | $ | 339,877 | $ | 199,630 | ||||||
| Trading income and fair value adjustments on loans | 379,053 | 103,214 | 104,637 | |||||||||
| Interest income - Loans and securities lending | 122,723 | 102,499 | 77,221 | |||||||||
| Total revenues | 1,077,093 | 545,590 | 381,488 | |||||||||
| Selling, general and administrative expenses | (345,455 | ) | (198,962 | ) | (175,369 | ) | ||||||
| Restructuring charge | — | (917 | ) | — | ||||||||
| Interest expense - Securities lending and loan participations sold | (52,631 | ) | (42,451 | ) | (32,144 | ) | ||||||
| Depreciation and amortization | (2,136 | ) | (2,386 | ) | (2,810 | ) | ||||||
| Segment income | 676,871 | 300,874 | 171,165 | |||||||||
| Wealth Management segment: | ||||||||||||
| Revenues - Services and fees | 374,361 | 72,345 | 65,073 | |||||||||
| Trading income and fair value adjustments on loans | 7,623 | 804 | 1,826 | |||||||||
| Total revenues | 381,984 | 73,149 | 66,899 | |||||||||
| Selling, general and administrative expenses | (357,130 | ) | (68,368 | ) | (64,347 | ) | ||||||
| Restructuring recovery | — | — | 4 | |||||||||
| Depreciation and amortization | (8,920 | ) | (1,880 | ) | (2,048 | ) | ||||||
| Segment income | 15,934 | 2,901 | 508 | |||||||||
| Auction and Liquidation segment: | ||||||||||||
| Revenues - Services and fees | 20,169 | 63,101 | 18,296 | |||||||||
| Revenues - Sale of goods | 53,348 | 25,663 | 4,220 | |||||||||
| Total revenues | 73,517 | 88,764 | 22,516 | |||||||||
| Direct cost of services | (30,719 | ) | (40,730 | ) | (33,295 | ) | ||||||
| Cost of goods sold | (20,675 | ) | (9,766 | ) | (4,016 | ) | ||||||
| Selling, general and administrative expenses | (14,069 | ) | (12,357 | ) | (10,731 | ) | ||||||
| Restructuring charge | — | (140 | ) | — | ||||||||
| Depreciation and amortization | — | (2 | ) | (7 | ) | |||||||
| Segment income (loss) | 8,054 | 25,769 | (25,533 | ) | ||||||||
| Financial Consulting segment: | ||||||||||||
| Revenues - Services and fees | 94,312 | 91,622 | 76,292 | |||||||||
| Selling, general and administrative expenses | (77,062 | ) | (68,232 | ) | (58,226 | ) | ||||||
| Restructuring charge | — | (500 | ) | — | ||||||||
| Depreciation and amortization | (356 | ) | (347 | ) | (252 | ) | ||||||
| Segment income | 16,894 | 22,543 | 17,814 | |||||||||
| Principal Investments - Communications segment: | ||||||||||||
| Revenues - Services and fees | 88,490 | 83,666 | 97,147 | |||||||||
| Revenues - Sale of goods | 4,857 | 3,472 | 3,715 | |||||||||
| Total revenues | 93,347 | 87,138 | 100,862 | |||||||||
| Direct cost of services | (23,671 | ) | (19,721 | ) | (25,529 | ) | ||||||
| Cost of goods sold | (6,278 | ) | (2,694 | ) | (3,559 | ) | ||||||
| Selling, general and administrative expenses | (25,493 | ) | (20,352 | ) | (24,256 | ) | ||||||
| Depreciation and amortization | (10,747 | ) | (11,011 | ) | (12,658 | ) | ||||||
| Restructuring charge | — | — | (1,703 | ) | ||||||||
| Segment income | 27,158 | 33,360 | 33,157 | |||||||||
| Brands segment: | ||||||||||||
| Revenues - Services and fees | 20,308 | 16,458 | 4,055 | |||||||||
| Selling, general and administrative expenses | (3,178 | ) | (2,889 | ) | (881 | ) | ||||||
| Depreciation and amortization | (2,745 | ) | (2,858 | ) | (507 | ) | ||||||
| Impairment of tradenames | — | (12,500 | ) | — | ||||||||
| Segment income (loss) | 14,385 | (1,789 | ) | 2,667 | ||||||||
| Consolidated operating income from reportable segments | 759,296 | 383,658 | 199,778 | |||||||||
| Corporate and other expenses | (58,905 | ) | (38,893 | ) | (33,127 | ) | ||||||
| Interest income | 229 | 564 | 1,577 | |||||||||
| Gain on extinguishment of loans and other | 3,796 | — | — | |||||||||
| Income (loss) on equity investments | 2,801 | (623 | ) | (1,431 | ) | |||||||
| Interest expense | (92,455 | ) | (65,249 | ) | (50,205 | ) | ||||||
| Income before income taxes | 614,762 | 279,457 | 116,592 | |||||||||
| Provision for income taxes | (163,960 | ) | (75,440 | ) | (34,644 | ) | ||||||
| Net income | 450,802 | 204,017 | 81,948 | |||||||||
| Net income (loss) attributable to noncontrolling interests | 5,748 | (1,131 | ) | 337 | ||||||||
| Net income attributable to B. Riley Financial, Inc. | 445,054 | 205,148 | 81,611 | |||||||||
| Preferred stock dividends | 7,457 | 4,710 | 264 | |||||||||
| Net income available to common shareholders | $ | 437,597 | $ | 200,438 | $ | 81,347 | ||||||
| Year Ended December 31, | ||||||||||||
| 2017 | 2016 | 2015 | ||||||||||
| Capital Markets reportable segment: | ||||||||||||
| Revenues - Services and fees | $ | 172,695 | $ | 39,335 | $ | 35,183 | ||||||
| Interest income - Securities lending | 17,028 | — | — | |||||||||
| Total revenues | 189,723 | 39,335 | 35,183 | |||||||||
| Selling, general, and administrative expenses | (150,092 | ) | (32,695 | ) | (30,229 | ) | ||||||
| Restructuring costs | (7,855 | ) | — | — | ||||||||
| Interest expense - Securities lending | (12,051 | ) | — | — | ||||||||
| Depreciation and amortization | (3,794 | ) | (549 | ) | (519 | ) | ||||||
| Segment income | 15,931 | 6,091 | 4,435 | |||||||||
| Auction and Liquidation reportable segment: | ||||||||||||
| Revenues - Services and fees | 47,376 | 61,891 | 35,633 | |||||||||
| Revenues - Sale of goods | 3 | 25,855 | 10,596 | |||||||||
| Total revenues | 47,379 | 87,746 | 46,229 | |||||||||
| Direct cost of services | (27,841 | ) | (17,787 | ) | (15,489 | ) | ||||||
| Cost of goods sold | (2 | ) | (14,502 | ) | (3,072 | ) | ||||||
| Selling, general, and administrative expenses | (8,329 | ) | (14,331 | ) | (8,170 | ) | ||||||
| Depreciation and amortization | (21 | ) | (26 | ) | (191 | ) | ||||||
| Segment income | 11,186 | 41,100 | 19,307 | |||||||||
| Valuation and Appraisal reportable segment: | ||||||||||||
| Revenues - Services and fees | 33,331 | 31,749 | 31,113 | |||||||||
| Direct cost of services | (14,876 | ) | (13,983 | ) | (13,560 | ) | ||||||
| Selling, general, and administrative expenses | (8,561 | ) | (8,778 | ) | (9,101 | ) | ||||||
| Depreciation and amortization | (181 | ) | (107 | ) | (137 | ) | ||||||
| Segment income | 9,713 | 8,881 | 8,315 | |||||||||
| Principal Investments - United Online segment: | ||||||||||||
| Revenues - Services and fees | 51,439 | 31,260 | — | |||||||||
| Revenues - Sale of goods | 304 | 261 | — | |||||||||
| Total revenues | 51,743 | 31,521 | — | |||||||||
| Direct cost of services | (12,784 | ) | (9,087 | ) | — | |||||||
| Cost of goods sold | (396 | ) | (253 | ) | — | |||||||
| Selling, general, and administrative expenses | (11,304 | ) | (5,974 | ) | — | |||||||
| Depreciation and amortization | (7,033 | ) | (3,518 | ) | — | |||||||
| Restructuring costs | (723 | ) | (3,474 | ) | — | |||||||
| Segment income | 19,503 | 9,215 | — | |||||||||
| Consolidated operating income from reportable segments | 56,333 | 65,287 | 32,057 | |||||||||
| Corporate and other expenses (including restructuring costs of $3,796, $413 and $1,006 for the years ended December 31, 2017, 2016 and 2015, respectively.) | (27,489 | ) | (16,562 | ) | (9,975 | ) | ||||||
| Interest income | 420 | 318 | 17 | |||||||||
| Loss from equity investment | (437 | ) | — | — | ||||||||
| Interest expense | (8,382 | ) | (1,996 | ) | (834 | ) | ||||||
| Income before income taxes | 20,445 | 47,047 | 21,265 | |||||||||
| Provision for income taxes | (8,510 | ) | (14,321 | ) | (7,688 | ) | ||||||
| Net income | 11,935 | 32,726 | 13,577 | |||||||||
| Net income attributable to noncontrolling interests | 379 | 11,200 | 1,772 | |||||||||
| Net income attributable to B. Riley Financial, Inc. | $ | 11,556 | $ | 21,526 | $ | 11,805 | ||||||
The following table presents revenues by geographical area:
| Year Ended December 31, | ||||||||||||
| 2021 | 2020 | 2019 | ||||||||||
| Revenues: | ||||||||||||
| Revenues - Services and fees: | ||||||||||||
| North America | $ | 1,168,483 | $ | 641,127 | $ | 460,374 | ||||||
| Australia | — | 664 | 58 | |||||||||
| Europe | 4,474 | 25,278 | 61 | |||||||||
| Total Revenues - Services and fees | $ | 1,172,957 | $ | 667,069 | $ | 460,493 | ||||||
| Trading income and fair value adjustments on loans | ||||||||||||
| North America | $ | 386,676 | $ | 104,018 | $ | 106,463 | ||||||
| Revenues - Sale of goods | ||||||||||||
| North America | $ | 12,130 | $ | 6,788 | $ | 7,935 | ||||||
| Europe | 46,075 | 22,347 | — | |||||||||
| Total Revenues - Sale of Goods | $ | 58,205 | $ | 29,135 | $ | 7,935 | ||||||
| Revenues - Interest income - Loans and securities lending: | ||||||||||||
| North America | $ | 122,723 | $ | 102,499 | $ | 77,221 | ||||||
| Total Revenues: | ||||||||||||
| North America | $ | 1,690,012 | $ | 854,432 | $ | 651,993 | ||||||
| Australia | — | 664 | 58 | |||||||||
| Europe | 50,549 | 47,625 | 61 | |||||||||
| Total Revenues | $ | 1,740,561 | $ | 902,721 | $ | 652,112 | ||||||
| Year Ended December 31, | ||||||||||||
| 2017 | 2016 | 2015 | ||||||||||
| Revenues: | ||||||||||||
| Revenues - Services and fees: | ||||||||||||
| North America | $ | 301,881 | $ | 135,428 | $ | 77,153 | ||||||
| Australia | 940 | 26,487 | — | |||||||||
| Europe | 2,020 | 2,320 | 24,776 | |||||||||
| Total Revenues - Services and fees | $ | 304,841 | $ | 164,235 | $ | 101,929 | ||||||
| Revenues - Sale of goods | ||||||||||||
| North America | $ | 307 | $ | 323 | $ | 907 | ||||||
| Europe | — | 25,793 | 9,689 | |||||||||
| Total Revenues - Sale of goods | $ | 307 | $ | 26,116 | $ | 10,596 | ||||||
| Revenues - Interest income - Securities lending: | ||||||||||||
| North America | $ | 17,028 | $ | — | $ | — | ||||||
| Total Revenues: | ||||||||||||
| North America | $ | 319,216 | $ | 135,751 | $ | 78,060 | ||||||
| Australia | 940 | 26,487 | — | |||||||||
| Europe | 2,020 | 28,113 | 34,465 | |||||||||
| Total Revenues | $ | 322,176 | $ | 190,351 | $ | 112,525 | ||||||
The following table presentsAs of December 31, 2021 and 2020 long-lived assets, which consistsconsist of property and equipment net, by geographical area:and other assets of $12,870 and $11,685, respectively, were located in North America.
| As of | As of | |||||||
| December 31, | December 31, | |||||||
| 2017 | 2016 | |||||||
| Long-lived Assets - Property and Equipment, net: | ||||||||
| North America | $ | 11,977 | $ | 5,785 | ||||
| Australia | — | — | ||||||
| Europe | — | — | ||||||
| Total | $ | 11,977 | $ | 5,785 | ||||
Segment assets are not reported to, or used by, the Company’s Chief Operating Decision Maker to allocate resources to, or assess performance of, the segments and therefore, total segment assets have not been disclosed.
NOTE 23 — REVISION OF PRIOR PERIOD FINANCIALS
As disclosed in Note 2(a), during the year ended December 31, 2021, the Company identified misstatements related to the consolidation of certain VIE’s, which primarily resulted in a gross up the investing and financing activities in the consolidated statements of cash flows. Although the Company concluded that these misstatements were not material, either individually or in aggregate, to its current or previously issued consolidated financial statements, the Company has elected to revise its previously issued consolidated financial statements to correct for these misstatements.
The revision to the accompanying consolidated statements of cash flows are as follows:
| Year Ended December 31, 2020 | ||||||||||||
| As Previously | ||||||||||||
| Reported | Adjustments | As Revised | ||||||||||
| Statement of Cash Flows | ||||||||||||
| Cash flows from investing activities: | ||||||||||||
| Purchase of equity investments | $ | (13,986 | ) | $ | 6,486 | $ | (7,500 | ) | ||||
| Funds received from trust account of subsidiary | — | 320,500 | 320,500 | |||||||||
| Investment of subsidiaries initial public offering proceeds into trust account | — | (176,750 | ) | (176,750 | ) | |||||||
| Net cash (used in) provided by investing activities | $ | (128,446 | ) | $ | 150,236 | $ | 21,790 | |||||
| Cash flows from financing activities: | ||||||||||||
| Payment of debt issuance and offering costs | $ | (3,359 | ) | $ | (6,486 | ) | $ | (9,845 | ) | |||
| Redemption of subsidiary temporary equity and distributions | — | (318,750 | ) | (318,750 | ) | |||||||
| Proceeds from initial public offering of subsidiaries | — | 175,000 | 175,000 | |||||||||
| Net cash provided by (used in) financing activities | $ | 69,544 | $ | (150,236 | ) | $ | (80,692 | ) | ||||
NOTE 21— SELECTED QUARTERLY FINANCIAL DATA (UNAUDITED)
| Year Ended December 31, 2019 | ||||||||||||
| As Previously | ||||||||||||
| Reported | Adjustments | As Revised | ||||||||||
| Statement of Cash Flows | ||||||||||||
| Cash flows from investing activities: | ||||||||||||
| Purchase of equity investments | $ | (33,391 | ) | $ | 4,634 | $ | (28,757 | ) | ||||
| Investment of subsidiaries initial public offering proceeds into trust account | — | (143,750 | ) | (143,750 | ) | |||||||
| Net cash used in investing activities | $ | (298,590 | ) | $ | (139,116 | ) | $ | (437,706 | ) | |||
| Cash flows from financing activities: | ||||||||||||
| Payment of debt issuance and offering costs | $ | (3,425 | ) | $ | (4,634 | ) | $ | (8,059 | ) | |||
| Proceeds from initial public offering of subsidiaries | — | 143,750 | 143,750 | |||||||||
| Net cash provided by financing activities | $ | 250,176 | $ | 139,116 | $ | 389,292 | ||||||
NOTE 24 — SUBSEQUENT EVENT
| Quarter Ended | ||||||||||||||||
| March 31, | June 30, | September 30, | December 31, | |||||||||||||
| 2017 | 2017 | 2017 | 2017 | |||||||||||||
| Total revenues | $ | 52,897 | $ | 66,676 | $ | 92,426 | $ | 110,177 | ||||||||
| Operating income | $ | 10,711 | $ | 2,560 | $ | 1,356 | $ | 14,217 | ||||||||
| Income (loss) before income taxes | $ | 10,052 | $ | 816 | $ | (1,235 | ) | $ | 10,812 | |||||||
| Benefit from (provision for) income taxes | $ | 3,849 | $ | 2,547 | $ | 1,357 | $ | (16,263 | ) | |||||||
| Net income (loss) | $ | 13,901 | $ | 3,363 | $ | 122 | $ | (5,451 | ) | |||||||
| Net income (loss) attributable to B. Riley Financial, Inc. | $ | 14,021 | $ | 3,280 | $ | 368 | $ | (6,113 | ) | |||||||
| Earnings (loss) per share: | ||||||||||||||||
| Basic | $ | 0.73 | $ | 0.15 | $ | 0.01 | $ | (0.23 | ) | |||||||
| Diluted | $ | 0.71 | $ | 0.15 | $ | 0.01 | $ | (0.23 | ) | |||||||
| Weighted average shares outstanding: | ||||||||||||||||
| Basic | 19,181,749 | 21,216,829 | 26,059,490 | 26,150,502 | ||||||||||||
| Diluted | 19,626,574 | 22,119,055 | 27,639,862 | 26,150,502 | ||||||||||||
On January 19, 2022, the Company completed the acquisition of FocalPoint Securities, LLC (“FocalPoint”), an independent investment bank, for total cash, stock, and contingent consideration of up to $175,000. The acquisition is expected to expand B. Riley Securities’ mergers and acquisitions advisory business and enhance its debt capital markets and financial restructuring capabilities. The acquisition of FocalPoint will be accounted for using the acquisition method of accounting in the first quarter of fiscal year 2022. The Company has not completed the preliminary purchase price accounting since it is in the process of completing the valuation of the assets of FocalPoint.
| Quarter Ended | ||||||||||||||||
| March 31, | June 30, | September 30, | December 31, | |||||||||||||
| 2016 | 2016 | 2016 | 2016 | |||||||||||||
| Total revenues | $ | 19,946 | $ | 20,261 | $ | 56,966 | $ | 93,178 | ||||||||
| Operating income | $ | 1,665 | $ | 180 | $ | 15,422 | $ | 31,458 | ||||||||
| Income (loss) before income taxes | $ | 1,536 | $ | (92 | ) | $ | 14,457 | $ | 31,146 | |||||||
| (Provision for) benefit from income taxes | $ | (166 | ) | $ | 65 | $ | (6,083 | ) | $ | (8,137 | ) | |||||
| Net income (loss) | $ | 1,370 | $ | (27 | ) | $ | 8,374 | $ | 23,009 | |||||||
| Net income (loss) attributable to B. Riley Financial, Inc. | $ | 248 | $ | (101 | ) | $ | 8,939 | $ | 12,440 | |||||||
| Earnings (loss) per share: | ||||||||||||||||
| Basic | $ | 0.02 | $ | (0.01 | ) | $ | 0.47 | $ | 0.65 | |||||||
| Diluted | $ | 0.01 | $ | (0.01 | ) | $ | 0.47 | $ | 0.64 | |||||||
| Weighted average shares outstanding: | ||||||||||||||||
| Basic | 16,490,178 | 17,935,254 | 18,977,072 | 19,004,548 | ||||||||||||
| Diluted | 16,553,953 | 17,935,254 | 19,208,527 | 19,511,292 | ||||||||||||
F-42