UNITED STATES
SECURITIES AND EXCHANGE COMMISSION
Washington, DC 20549
FORM 10-K
|
| |
| x | ANNUAL REPORT PURSUANT TO SECTION 13 OR 15(d) OF THE |
|
| |
| SECURITIES EXCHANGE ACT OF 1934 |
For fiscal year ended December 31, 20142017
OR
|
| |
| ¨ | TRANSITION REPORT PURSUANT TO SECTION 13 OR 15(d) OF THE SECURITIES EXCHANGE ACT OF 1934 |
For the transition period from to
Commission file number: 000-31659
NOVATEL WIRELESS, INC.INSEEGO CORP.
(Exact name of registrant as specified in its charter)
|
| | |
| Delaware | | 86-082467381-3377646 |
(State or Other Jurisdiction of Incorporation or Organization) | | (I.R.S. Employer Identification No.) |
| | |
96459605 Scranton Road, Suite 300
San Diego, California | | 92121 |
| (Address of Principal Executive Offices) | | (Zip Code) |
Registrant’s telephone number, including area code: (858) 812-3400
Securities registered pursuant to Section 12(b) of the Act: None
|
| |
| Title of each class | Name of each exchange on which registered |
| Common Stock, par value $0.001 per share | The Nasdaq Global Select Market |
| Preferred Stock Purchase Rights | The Nasdaq Global Select Market |
Securities registered pursuant to Section 12(g) of the Act:
Common Stock, par value $.001 per shareNone
Indicate by check mark if the registrant is a well-known seasoned issuer, as defined in Rule 405 of the Securities Act. Yes ¨ No x
Indicate by check mark if the registrant is not required to file reports pursuant to Section 13 or Section 15(d) of the Act. Yes ¨ No x
Indicate by check mark whether the registrant (1) has filed all reports required to be filed by Section 13 or 15(d) of the Securities Exchange Act of 1934 during the preceding 12 months (or for such shorter period that the registrant was required to file such reports), and (2) has been subject to such filing requirements for the past 90 days. Yes x No ¨
Indicate by check mark whether the registrant has submitted electronically and posted on its corporate Website, if any, every Interactive Data File required to be submitted and posted pursuant to Rule 405 of Regulation S-T during the preceding 12 months (or for such shorter period that the registrant was required to submit and post such files). Yes x No ¨
Indicate by check mark if disclosure of delinquent filers pursuant to Item 405 of Regulation S-K is not contained herein, and will not be contained, to the best of registrant’s knowledge, in definitive proxy or information statements incorporated by reference in Part III of this Form 10-K or any amendment to this Form 10-K. ¨o
Indicate by check mark whether the registrant is a large accelerated filer, an accelerated filer, a non-accelerated filer, or a smaller reporting company, or an emerging growth company. See the definitions of “large accelerated filer,” “accelerated filer”filer,” “smaller reporting company,” and “smaller reporting“emerging growth company” in Rule 12b-2 of the Exchange Act. (Check one):Act:
|
| | | |
| Large accelerated filer | o | Accelerated filer | x |
| Non-accelerated filer | o (Do not check if a smaller reporting company) | Smaller reporting company | o |
| | Emerging growth company | o |
Large accelerated filer ¨If an emerging growth company, indicate by check mark if the registrant has elected not to use the extended transition period for complying with any new or revised financial accounting standards provided pursuant to Section 13(a) of the Exchange Act. Accelerated filer x Non-Accelerated filer ¨ Smaller Reporting Company ¨
Indicate by check mark whether the registrant is a shell company (as defined in Rule 12b-2 of the Exchange Act). Yes ¨ No x
The aggregate market value of the voting common stock held by non-affiliates of the registrant, based on the closing price of the registrant’s common stock on June 30, 2014,2017, as reported by The Nasdaq Global Select Market, was approximately $63,195,226.$55.4 million. For the purposes of this calculation, shares owned by officers and directors (and their affiliates) have been excluded. This exclusion is not intended, nor shall it be deemed, to be an admission that such persons are affiliates of the registrant. The registrant does not have any non-voting stock issued or outstanding.
The number of shares of the registrant’s common stock outstanding as of March 3, 20158, 2018 was 45,939,859.
58,830,682.
DOCUMENTS INCORPORATED BY REFERENCE
Portions of the registrant’s definitive proxy statement for the 20152018 Annual Meeting of Stockholders to be filed with the Securities and Exchange Commission pursuant to Regulation 14A are incorporated by reference into Part III of this Form 10-K to the extent stated herein.
TABLE OF CONTENTS
|
| | |
| | Page |
| PART I | |
| | | |
| Item 1. | | |
| | | |
| Item 1A. | | |
| | | |
| Item 1B. | | |
| | | |
| Item 2. | | |
| | | |
| Item 3. | | |
| | | |
| Item 4. | | |
| | |
| PART II | |
| | | |
| Item 5. | | |
| | | |
| Item 6. | | |
| | | |
| Item 7. | | |
| | | |
| Item 7A. | | |
| | | |
| Item 8. | | |
| | | |
| Item 9. | | |
| | | |
| Item 9A. | | |
| | | |
| Item 9B. | | |
| | |
| PART III | |
| | | |
| Item 10. | | |
| | | |
| Item 11. | | |
| | | |
| Item 12. | | |
| | | |
| Item 13. | | |
| | | |
| Item 14. | | |
| | |
| PART IV | |
| | | |
| Item 15. | | |
| |
| Item 16. | Form 10-K Summary | |
| | |
| |
| | |
| |
Forward-Looking Statements
This reportAnnual Report on Form 10-K contains forward-looking statements within the meaning of Section 27A of the Securities Act of 1933, as amended (the “Securities Act”) and Section 21E of the Securities Exchange Act of 1934.1934, as amended (the “Exchange Act”), in reliance upon the safe harbor provisions of the Private Securities Litigation Reform Act of 1995. You should not place undue reliance on these statements. These forward-looking statements include, without limitation, statements that reflect the views of our senior management with respect to our current expectations, assumptions, estimates and projections about Novatel Wireless, Inc.Inseego Corp. (the “Company” or “Inseego”) and our industry. These forward-looking statements speak only as of the date of this report. We disclaim any undertaking to publicly update or revise any forward-looking statements contained herein to reflect any change in our expectations with regard thereto or any change in events, conditions or circumstances on which any such statement is based. Statements that include the words “may,” “could,” “should,” “would,” “estimate,” “anticipate,” “believe,” “expect,” “preliminary,” “intend,” “plan,” “project,” “outlook,” “will” and similar words and phrases identify forward-looking statements.statements (although not all forward-looking statements contain these words). Forward-looking statements address matters that involveare inherently subject to risks and uncertainties, that could causesome of which cannot be predicted or quantified; therefore, our actual results tomay differ materially from those anticipated in these forward-looking statements as of the date of this report. We believe that these factors include those related to:
our ability to compete in the market for wireless broadband data access products, wireless modem products, and machine-to-machine (“M2M”)asset management, monitoring, telematics, vehicle tracking and fleet management products;
our ability to develop and timely introduce new products and services successfully;
our dependence on a small number of customers for a substantial portion of our revenues;
our ability to integraterealize the operationsbenefits of any business, products, technologiesour recent reorganization transactions;
our ability to realize the benefits of recent restructuring activities and cost-reduction initiatives including reductions-in-force, reorganization of executive level management and the consolidation of certain of our facilities;
our ability to make scheduled payments of the principal of, to pay interest on, or personnel that we may acquire in the future;to refinance our indebtedness, including our term loan and convertible notes obligations;
our ability to introduce and sell new products that comply with current and evolving industry standards and government regulations;
our ability to develop and maintain strategic relationships to expand into new markets;
our ability to properly manage the growth of our business to avoid significant strains on our management and operations and disruptions to our business;
our reliance on third parties to procure components and manufacture our products;
our ability to accurately forecast customer demand and order the manufacture and timely delivery of sufficient product quantities;
our reliance on sole source suppliers for some componentsproducts used in our products;solutions;
the continuing impact of uncertain global economic conditions on the demand for our products;
our ability to be cost competitive while meeting time-to-market requirements for our customers;
our ability to meet the product performance needs of our customers in both mobilewireless broadband and M2Mdata access in Internet of Things (“IoT”) markets;
demand for broadband wireless access to enterprise networksfleet, vehicle and the Internet;asset management software-as-a-service (“SaaS”) telematics solutions;
our dependence on wireless telecommunication operators delivering acceptable wireless services;
the outcome of any pending or future litigation, including intellectual property litigation;
infringement claims with respect to intellectual property contained in our products;
our continued ability to license necessary third-party technology for the development and sale of our products;
the introduction of new products that could contain errors or defects;
doing business abroad, including foreign currency risks;
our ability to make focused investments in research and development; and
our ability to hire, retain and manage additional qualified personnel to maintain and expand our business.
The foregoing factors should not be construed as exhaustive and should be read together with the other cautionary statements included in this and other reports we file with the Securities and Exchange Commission (the “SEC”), including the information in “Item 1A. Risk Factors” in Part I of this report. If one or more events related to these or other risks or uncertainties materialize, or if our underlying assumptions prove to be incorrect, actual results may differ materially from what we anticipate. Unless the context requires otherwise, in this Annual Report on Form 10-K the terms “we,” “us,” “our”“our,” the “Company” and “Company”“Inseego” refer to Novatel Wireless, Inc.Inseego Corp., a Delaware corporation, and its wholly owned and indirect subsidiaries.
Trademarks
“NovatelInseego” and the Inseego logo are trademarks or registered trademarks of Inseego. “Novatel Wireless”, the Novatel Wireless logo, “MiFi”, “MiFi Intelligent Mobile Hotspot”, “MiFi OS”, “MiFi Powered”, “MiFi Home”, “MobiLink”, “Ovation”, “Expedite” and “MiFi Freedom. My Way.” are trademarks or registered trademarks of Novatel Wireless, Inc. “Enfora”(“Novatel Wireless”). “DigiCore”, “Ctrack” and the EnforaCtrack logo “Spider”, “Enabling Information Anywhere”, “Enabler” and “N4A” are trademarks or registered trademarks of Enfora, Inc.DigiCore Holdings Limited (“Enfora”DigiCore” or “Ctrack”). “Inseego North America”, “Skyus” and “Crossroads” are trademarks or registered trademarks of Inseego North America, LLC.
Other trademarks, trade names or service marks used in this report are the property of their respective owners.
PART I
Item 1. Business
Inseego Corp. is a Delaware corporation formed in 2016 and is the successor to Novatel Wireless, a Delaware corporation formed in 1996, resulting from an internal reorganization that was completed in November 2016. Our principal offices are located at 9605 Scranton Road, Suite 300, San Diego CA 92121. Our sales and engineering offices are located throughout the world. Inseego’s common stock trades on The NASDAQ Global Select Market under the trading symbol “INSG”.
Overview
Inseego Corp. is a leader in the design and development of products and solutions that enable high performance mobile applications for large enterprise verticals, service providers and small and medium-sized businesses around the globe. Our product portfolio consists of enterprise SaaS solutions and IoT and mobile solutions, which together form the backbone of compelling, intelligent, reliable and secure IoT services with deep business intelligence. Inseego’s products and solutions power mission critical applications with a “zero unscheduled downtime” mandate, such as asset tracking, fleet management, industrial IoT, SD WAN failover management and mobile broadband services. Our solutions are powered by our key innovations in purpose built SaaS cloud platforms, IoT and mobile technologies, including the newly emerging 5G technology.
We have invented and reinvented ways in which the world stays connected, accesses information and derives intelligence from that information. With multiple first-to-market innovations and a strong and growing portfolio of hardware and software innovations for IoT, Inseego has been advancing technology and driving industry transformation for over 30 years. It is this proven expertise and commitment to quality and innovation that makes us a preferred global partner of service providers, distributors, value-added resellers, system integrators, enterprises, small and medium-sized businesses and consumers.
Industry Trends
The mobile industry has experienced tremendous growth for more than 20 years. As the largest technology platform in the world, mobile connectivity has changed the way we work, the way we live and the way we connect with each other. The scale and pace of innovation in mobile technology, especially around connectivity and computing capabilities, is also impacting industries beyond wireless.
Looking ahead, Inseego is working with other leaders in the wireless industry to develop 5G technology, which is the next generation of wireless technology. With the newly defined 5G New Radio (“5G NR”) standard, 5G is being designed to support faster data rates, lower network latency and wider bandwidths of spectrum. Incorporating many of the innovations developed for 4G, 5G is also expected to be scalable and adaptable across a variety of use cases, which include, among others: empowering new industries and services, such as autonomous vehicles and industrial applications, through ultra-reliable, ultra-low latency communication links; and connecting a significant number of IoT service and devices, including the connected home and smart cities devices, with connectivity designed to meet ultra-low power, complexity and cost requirements. 5G is also expected to enhance mobile broadband services, including ultra-high definition (4K) video streaming and augmented and virtual reality, with multi-gigabit speeds.
Most 5G devices are expected to include multimode support for 3G, 4G and Wi-Fi, enabling service continuity where 5G has yet to be deployed and simultaneous connectivity across 4G and Wi-Fi technologies, while also allowing mobile operators to utilize current network deployments. At the same time, 4G is expected to continue to evolve in parallel with the development of 5G and become fundamental to many of the key 5G technologies, such as support for unlicensed spectrum, gigabit LTE user data rates and LTE IoT with connectivity designed to meet the needs of ultra-low power, complexity and cost applications. The first phase of 5G networks are expected to support mobile broadband services in lower spectrum bands below 6 GHz as well as higher bands above 6 GHz, including millimeter wave (mmWave).
According to the Global 5G Market Report issued in January 2018 by Netscribes, Inc. (“Netscribes”), 5G technology is projected to service business frameworks required into 2020 and beyond. Due to socioeconomic transformations brought about by advancements in smart/connected city applications, mobile 5G is projected to be the “next big thing” in connected asset evolution. While mobile 4G LTE will continue to drive substantial volumes over the next decade, Netscribes predicts that the global 5G market will grow at a rate in excess of 95 percent, to greater than $250 billion by 2025. 5G technology is expected to address the rising demands for advanced applications, continued adoption of IoT devices and applications, and the rising bandwidth demands associated with said applications.
We continue to work closely with mobile operators, chipset suppliers and infrastructure companies around the world on 5G developments and trials in preparation for commercial network launches.
The adoption of IoT technology continues to grow as companies across a wide range of industries are leveraging IoT technologies to increase efficiency, gain better customer insights, facilitate compliance and build new business models. IoT growth is expanding broadly, and adoption is particularly strong in the telematics and transportation industries and in industrial IoT markets such as smart city infrastructure, utilities and energy management. We are building IoT capabilities by leveraging business models that monetize usage on most major carrier networks. We have developed IoT solutions that address key market needs for asset tracking applications, telematics, SD WAN failover management and various other industrial applications. In addition, our IoT customers can turn the data that our solutions provide into actionable insights to develop new services and create revenue growth.
Our IoT solutions enable applications for various vertical markets, such as fleet and asset tracking and telematics, smart city applications to improve public safety, traffic management and energy management. Our telematics business offers a full array of solutions to both businesses and consumers that combine location-based software, services and data intelligence. We enable our customers to track, safeguard and optimize their most prized assets: people, vehicles, equipment and data. Inseego telematics, sold under the Ctrack brand, is a top commercial telematics provider globally. We serve both the enterprise and small and medium-sized business market segments with advanced solutions and scale in distribution, research and development, and customer support. Additionally, we have made significant strides into the burgeoning aviation vertical.
Strategic Realignment
On September 21, 2016, we entered into a Stock Purchase Agreement (the “Purchase Agreement”), by and among Inseego and Novatel Wireless, on the one hand, and T.C.L. Industries Holdings (H.K.) Limited and Jade Ocean Global Limited (collectively, the “Purchasers”) on the other hand. The Purchase Agreement related to the proposed sale of our subsidiary, Novatel Wireless, which included the Company’s MiFi branded hotspots and USB modem product lines (the “MiFi Business”), to the Purchasers for $50.0 million in cash, subject to potential adjustment for Novatel Wireless’s working capital as of the closing date.
In June 2017, we terminated the Purchase Agreement due to delays and uncertainty in securing approval of the transactions contemplated by the Purchase Agreement from the Committee on Foreign Investment in the United States (“CFIUS”) and announced key leadership changes and a Company-wide restructuring designed to improve execution, enhance financial performance and drive profitable growth as we worked to create sustainable long-term value for shareholders. As part of the restructuring plan, among other actions, we implemented cost reduction measures which included a series of targeted reductions across our businesses and geographies, and rationalization of our businesses. As a result of the termination of the transaction described above and the institution of certain restructuring initiatives, we retained our ownership interest in Novatel Wireless and the MiFi Business.
One of the many benefits associated with the retention of the MiFi Business is the retention of know-how and intellectual property essential to the development of advanced wireless technologies, such as the newly emerging 5G NR standard.
Our Strategy
Our objective is to be a leader in high performance mobile applications for large enterprise verticals, service providers and small and medium-sized businesses around the globe. We will meet this objective through innovation we are driving in IoT, mobile and SaaS technologies. In furtherance of that objective, we will continue to focus on mission critical enterprise applications with a “zero unscheduled downtime” mandate, such as asset tracking, fleet management, industrial IoT, SD WAN failover management and mobile broadband services. Our solutions will be powered by our key innovations in IoT, purpose-built SaaS platforms and mobile technologies, including the newly emerging 5G technologies.
The key elements of our strategy are to:
Improve SaaS solution penetration. Through our Ctrack telematics and asset tracking platform and subscription management solutions, we provide customers around the world with actionable insights, workflow efficiencies and high security from our cutting-edge cloud platforms. We will continue to expand these solutions into new markets such as the aviation vertical.
Expand our IoT solutions portfolio and develop key core mobile technologies within our mobile portfolio. We intend to expand our IoT device portfolio and develop newly emerging 5G technologies, leveraging our modem technologies, intellectual property, and supplier ecosystem.
Capitalize on our direct relationships with wireless operators, original equipment manufacturers (“OEMs”) and component suppliers. We intend to continue to capitalize on our direct and long-standing relationships with wireless operators, OEMs and component suppliers in order to strengthen our worldwide market position.
Aggressively expand go-to-market offerings through sales resource expansion, channel development and strategic partnerships. We intend to expand our go-to-market resources and channels internationally for our IoT, mobile and cloud solutions.
Increase the value of our offerings. As we seek to capitalize on potential growth opportunities, we continue to develop cutting edge IoT, mobile and cloud solutions, with specific focus on end-to-end solutions that enable the best IoT and mobile experience for our customers. For instance, in the Ctrack cloud aviation solution, we allow Ground Support Equipment (“GSEs”) providers to achieve maximum utilization levels, maximum efficiency gains, and eliminate downtime for business-critical ground support equipment. In addition, further emerging 5G developments with anchor customers leveraging our existing modem technologies opens us up to larger worldwide potential markets. Finally, continued investment within both device and platform solutions in predictive analytics, machine learning, and edge intelligence should expand our market opportunities.
Our Sources of Revenue
Inseego sells SaaS, software and services solutions across multiple mobile and industrial IoT vertical markets, including fleet management, vehicle telematics, aviation (ground service) telematics, usage-based insurance, stolen vehicle recovery, asset tracking, monitoring, business connectivity and subscription management. Our SaaS platforms are device-agnostic and provide a standardized, scalable way to order, connect and manage remote assets and improve business operations. The platforms are flexible and support both on-premise server or cloud-based deployments and are the basis for the delivery of a wide range of IoT services in multiple industries.
Our SaaS delivery platforms include our Ctrack platforms, which provide fleet, vehicle, aviation, asset and other telematics applications and our Device Management Solutions (“DMS”), a hosted SaaS platform that helps organizations manage the selection, deployment and spend of their wireless assets by helping them to save money on personnel and telecom expenses.
We provide intelligent wireless solutionshardware products for the worldwide mobile communications market.and industrial IoT markets. Our hardware products address multiple vertical markets including fleet and commercial telematics, after-market telematics, smart city infrastructure management, remote monitoring and control, security and connected home and wireless surveillance systems. Our broad range of products principally includes intelligent mobile hotspots, wireless routers for IoT applications, USB modems, embedded modules, integrated asset-managementtelematics and mobile tracking machine-to-machine ("M2M")hardware devices, communications andwhich are supported by applications software and cloud services.
services designed to enable customers to easily analyze data insights, and configure and manage their hardware remotely. Our mainstream Mobile Computing Productsproducts currently support Long Term Evolution ("LTE") platforms and otheroperate on every major cellular wireless technology platforms as required by our global carrier customers.platform. Our mobile hotspots, embedded modules, and USB modemssold under the MiFi brand, are actively used by millions of customers to provide subscribers with secure and convenient high-speed access to corporate, public and personal information through the Internet and enterprise networks. Our wireless routers and USB modems serve as gateways to the rapidly growing and underpenetrated IoT market segments. Our telematics and mobile computingasset tracking hardware devices collect and control critical vehicle data and driver behaviors, and can reliably deliver that information to the cloud, all managed by our services enablement platforms.
We sell our intelligent mobile hotspots primarily to wireless operators either directly or through strategic relationships. Our mobile-hotspot customer base is comprised of wireless operators, including Verizon Wireless AT&T and Sprint ; and other original equipment manufacturers, ("OEMs")in the United States, as well as distributors.distributors and various companies in other vertical markets and geographies.
Our M2M products enableWe sell our wireless routers for industrial IoT, integrated telematics and mobile tracking hardware devices to communicate with each otherthrough our direct sales force and with server or cloud-based application infrastructures. Our M2Mthrough distributors. The customer base for our wireless router products is comprised of transportation companies, industrial companies,enterprises, manufacturers, application service providers, system integrators and distributors. Our solutions address multiple vertical markets for our customersdistributors in various industries, including commercial telematics, after-market telematics, remotefleet and vehicle transportation, aviation, energy and industrial automation, security and safety, medical monitoring and control, securitygovernment. Integrated telematics devices are also sold by Ctrack and connected home. We have strategic relationships with severalprovided as part of these customers that provide input and validation of our product requirements across the various vertical markets.integrated Ctrack SaaS solution.
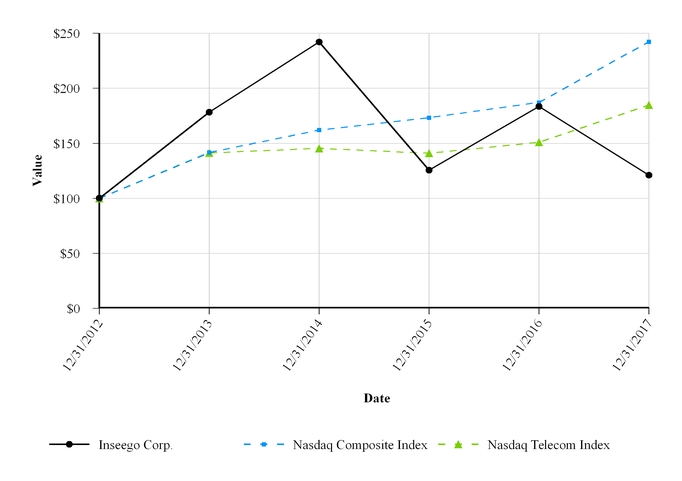
For the years ended December 31, 2014, 20132017, 2016 and 2012,2015, the Company’s total net revenues recognized from sales of our products were $185.2were $219.3 million, $335.1$243.6 million and $344.3$220.9 million, respectively.
We were incorporated in 1996 under the laws of the State of Delaware.
Our StrategyBusiness
Our objective is to be a leading providerTelematics and Asset Tracking Business
Inseego entered the telematics software and services industry through the acquisition of intelligent wireless solutions. The key elements of our strategy are to:
| |
• | Lead the Intelligent Mobile Hotspot Product Category. We invented and developed the MiFi® Intelligent Mobile Hotspot, a new category in wireless mobile data devices. In May 2009, the first nationwide commercial deployment of MiFi hotspots was launched by Verizon Wireless. In 2014, we announced certain software enhancements to the MiFi technology platform that allowed us to differentiate our MiFi family of products based on key performance indicators such as usage time, throughput and value added software applications. During 2014, we shipped MiFi Intelligent Mobile Hotspots to all three leading US carriers: Verizon Wireless, AT&T and Sprint.
|
| |
• | Leverage Our Mobile Computing Expertise and Technology Platforms to Expand Our M2M Portfolio. We are leveraging our Mobile Computing technology expertise, such as cellular wireless engineering radio development and the MiFi® Intelligent Mobile Hotspot technology platform, to expand our M2M portfolio. This enables us to leverage our development efforts, improve time-to-market and expand our portfolio in key markets. In 2014, the M2M-grade MiFi Powered SA 2100, available for telematics and telemetry applications, shipped through our global distribution channels targeting a number of M2M vertical markets.
|
Broaden Our M2M Product Offerings. We intend to diversifyCtrack in October 2015. Ctrack was founded in South Africa in 1985, and continue to broaden our integrated solutions and embedded module product lines for commercial telematics, after-market telematics, remote monitoring and control, security and connected home applications.
Enhance Our M2M Software Supporttoday Ctrack operations span over 50 countries on six continents. Through Our Device Manager or Service Delivery Platform. Through our N4A™ Device Manager ("DM") and N4A™ Communication and Management Software ("CMS"), we enable our customers’ applications to support their specific business needs. Automotive vehicle data such as driver location, driving behavior, driver ID, vehicle status, and device status is gathered from our integrated products and delivered to our software applications or service delivery platform.
Align Our Mobile Computing Product Offerings With Key Carrier Customersand Distributors. Leveraging our expertise in delivering wireless broadband solutions, we support our key customers with innovation and product portfolio flexibility, enabling them to address both premium and value segments for their markets. Our products operate onsuccessful global acquisitions, the major wireless technology platforms, including Second Generation (2G) networks: GSM, CDMA, GPRS; Third Generation (3G) networks: CDMA2000® 1xEV-DO, HSDPA and HSUPA; and Fourth Generation (4G) networks: LTE, dual carrier HSPA+ and WiMAX.
5Ctrack group broadened its international reach by expanding into the United Kingdom, Europe,
Capitalize on Our Direct Relationships with Wireless Operators. We intend to continue to capitalize on our direct and long-standing relationships with wireless operators in order to increase our worldwide market position. In the United States and internationally, we are working closely with wireless operators to provide the best mobile computing solutions and relevant M2M solutions to consumers and enterprise customers.
Leverage Strategic Relationships. We believe that strategic relationships with wireless carriers and enterprises that utilize mobile computing and M2M technology are critical to our ability to leverage sales opportunities and ensure that our technology investments address customer needs. Through strategic relationships, we believe that we can increase market penetration and differentiate our products by leveraging resources and knowledge including sales, marketing and distribution systems. We are also addressing new market opportunities through innovation with our strategic partners.
Continue to Target Key Vertical Market Opportunities and Penetrate New M2M Markets. We believe that continuing developments in wireless technologies will create additional vertical market opportunities and more applications for our products. Currently, we market our M2M solutions to key vertical industry segments by offering innovative solutions that are intended to increase productivity, reduce costs and create operational efficiencies.
Increase the Value of Our Products. We will continue to add new features, functionality and intellectual property to our products and develop new services and software applications to enhance the overall value and ease of use that our products provide to our customers and end users.
Acquire Companies that Accelerate the Growth of Our Business. We will continue to seek strategic acquisitions of companies in closely aligned businesses and technologies that will provide synergistic growth in revenue and profitability.
Our Segments
We operate in the wireless communications industry in the following reportable segments:
The Mobile Computing Products-segment includes our MiFi brand of Intelligent Mobile Hotspot devices, USB modems and embedded modules that enable internet access and data transmission and services via cellular wireless networks.
The M2M Products and Solutions-segment includes our M2M embedded modules, integrated M2M communications devices and our service delivery platform, the N4A™ DM and N4A™ CMS that provides easy device management and service enablement.
Historically, our business units have had their own management teams and have offered different products and services. The business units have been aggregated into two reportable business segments based upon the nature of the products or services produced, the type of customer for the products, the similarity of economic characteristics and the manner in which management reviews results, among other considerations.
Due to the restructuring activities, changes in executive management, re-assignments of responsibilities, product transfers between some of our subsidiaries and increasing synergies between our existing segments and the continued integration and consolidation of our mobile computing business with our M2M business, we are currently reevaluating our reportable segments composition.
For additional information on our segments, see Note 13 to our consolidated financial statements.
Mobile Computing Products
We have a growing portfolio of leading-edge technology solutions that enable data transmission and services via cellular wireless networks. In 2014, we launched new products in our line of MiFi mobile hotspots that provided multi-mode support for CDMA and GSM networks. On September 29, 2014, we launched the new Verizon Jetpack® Mobile Hotspot 4G LTE/XLTE MiFi® 6620L. The MiFi 6620L is the first Verizon Wireless Jetpack that securely connects up to 15 devices to the Verizon XLTE network supporting up to 20 hours of use on a single charge and in some cases more. The MiFi 6620L is global ready, supporting a number of bands for connectivity in over 200 countries.
Below are our major Mobile Computing product lines:
MiFi® Brand of Intelligent Mobile Hotspot is our flagship product. Introduced in 2009, it quickly became a leading brand in mobile communications. MiFi hotspots have gained acceptance as a standard connectivity option for Wi-Fi-enabled devices such as the iPad, Kindle, tablets, PCs, MP3 players, and gaming devices. MiFi hotspots function by connecting to a
cellular-wireless network and creating a secure Wi-Fi signal that can connect to as many as 15 devices simultaneously. MiFi hotspots accounted for 69%, 74% and 72% of our revenue in 2014, 2013 and 2012, respectively.
Our strategy for the MiFi platform is to innovate, focusing on ease of use, key performance indicators and value added features that take the device beyond just basic connectivity. Our MiFi 6620L securely connects up to 15 devices to the Verizon XLTE network supporting up to 20 hours of use on a single charge, and in some cases more. The MiFi 6620L is global ready, supporting a number of bands for connectivity in over 200 countries.
4G LTE Gateway branded MiFi Home™, available through Verizon Wireless and branded as the 4G LTE Broadband Router with Voice, is a wireless solution that supports both wireless voice and data. The wireless data support provides internet access over LTE and 1xRTT voice, which is software upgradeable to support high definition voice as VoLTE support becomes available on the carrier network.
Modems continue to be used to access wireless broadband networks. We originally introduced USB and PC-Card /ExpressCard® modems in North America, Europe, the Middle East and Africa and continue to provide advanced wireless access in the industry. USB and PC-Card modems accounted for 9%, 9% and 11% of our revenue in 2014, 2013 and 2012, respectively.
Expedite® Embedded Modules are utilized in a wide range of computing devices, such as laptop PCs, netbooks, tablets and various other electronic products to provide wireless broadband access. Embedded modules accounted for 3%, 5% and 5% of our revenue in 2014, 2013 and 2012, respectively.
M2M Products and Solutions
During 2014, we expanded our M2M portfolio significantly by adding additional technologies and features to our line of M2M devices and embedded modules to improve performance and strengthen the competitive advantages of our solutions. M2M products and solutions accounted for 21%, 11% and 9% of our revenue in 2014, 2013 and 2012, respectively. M2M product lines consist of the following:
MT and SA Integrated Solutions bring together essential elements for telematics and telemetry applications that service a number of vertical market segments. The telemetry solutions monitor, manage and provide two-way communication to mobile and fixed assets and the telematics solutions provide vehicle tracking and diagnostics, along with workforce tracking and management functions. We add value by developing solutions to meet the needs of specific customers, with a particular emphasis on select vertical markets including: transportation and logistics, usage-based insurance, security and asset tracking, digital signage, industrial automation and smart grid and remote patient monitoring. These solutions can be scaled from a small fleet customer to company-wide enterprise deployments. Our M2M solutions are programmable and can be customized to collect specific types of data as required by a customer. Combining the device with our robust N4A™ DM and N4A CMS platform, assets can easily be monitored, managed and reconfigured remotely from almost anywhere in the world. By combining the N4A CMS platform with the intelligence of the integrated M2M devices, customers will gain a solution that offers ease-of-deployment and superior, reliable performance in small and flexible packages.
In 2014, we achieved network certification for some of our advanced M2M solutions through Verizon Wireless and AT&T, in addition to certifications from a number of regulatory bodies including Conformite Europeenne (CE), Global Certification Forum (GCF) and PTCRB to operate in Europe, the Middle East and Africa.
N4A™ Software and Design Services include our N4A™ DM and N4A™ CMS and design services that we provide to other companies, primarily for asset management solutions. Our N4A CMS 4.1 platform is a next-generation service delivery platform that eases the development, deployment, and operation of asset-management applications. N4A CMS provides a standardized, scalable way to connect and manage remote assets and improve business operations. The platform is flexible and supports both on-premise server or cloud-based deployments and is the basis for delivery of a wide range of M2M services.
Enabler® and Expedite Embedded Module Solutions are integrated into various products or equipment so that those assets may communicate with other computers. These M2M applications enable back-end IT systems to send and receive data from remote assets. These modules are ideal for markets including but not limited to security, advertising, telemetry, POS, mHealth, AVL and AMI/AMR market segments looking for high reliability and a common design across multiple technologies. A common example is modules for smart meters that transmit data about location, energy consumption, and abnormal situations to an energy supplier for usage monitoring and billing purposes. In 2014, the Enabler module HS 3001 was recognized as a best in class smart merchandising solution through award-winning innovations developed by our partners, including an “Interactive Tap Handle” deployed by a leading American brewer designed to display dynamic messages and a Cellular Billboard Timer that enables outdoor billboard companies to operate their signs remotely.
CustomersWith more than 30 years of experience, we are recognized as a leading global provider of advanced fleet management telematics solutions that add value to a global base of customers. We design and develop a robust range of asset management and monitoring systems using GPS satellite positioning, advanced cellular communications and advanced sensory technologies. The result is innovative solutions ranging from basic track-and-trace, with stolen vehicle response services, to complete integrated enterprise-level solutions for large fleet owners across the globe.
Our customer basecontinued emphasis on research and development of next-generation products keeps Ctrack ahead of the market, meeting demands for value-added, flexible, feature-rich and cost-effective technology across multiple market verticals. Our solutions, coupled with a proven track record in the successful implementation and support of projects of all sizes worldwide, provide Ctrack with a competitive edge with respect to attracting and retaining customers.
Key market verticals supported by our telematics and asset tracking platforms include:
|
| |
| l | Fleet Management |
| l | Aviation/Airport Asset Tracking |
| l | Government and Municipality Asset Tracking |
| l | Workforce Tracking |
| l | Vehicle Tracking |
| l | Advanced Data Analytics and Lifecycle Asset Management |
| l | Insurance Telematics |
Other Industry-Specific Solutions
Ctrack is comprised of wireless operators, distributors, OEMs and various companies in vertical markets. Our tier-one wireless-operator customers include Verizon Wireless, AT&T and Sprint. Our M2M customer base is a mix across various verticals including customers such as RAC Monitoring Services, Telogis, Modus Group, Premier Wireless, Linear Technology, Vehicle Tracking Solutions LLC, Fleetmatics, DigiCore Holdings Ltd. and Nextraq.
We also have strategic technology, development and marketing relationships with several of our customers. Our strong customer relationships provide us with the opportunity to expand our market reach and sales.
Wireless Operators and Distributors. By working closely with our wireless operator and distributor customers, we are able to combine our expertise in wireless technologies with our customers’ sales and marketing reach over a global subscriber base, leading to an increased demand for our products. Our customers also provide us with important services, including field trial participation, technical support, wireless data marketing and access to additional indirect distribution channels.
M2M Customers. We believe the M2M market provides substantial opportunities for growth. M2M and smart-systems technologies are being integrated into a growing number of manufactured devicesindustries to understand their unique challenges and machines, whether fixed, movable or fully mobile. We haverequirements, and to increase our competitive advantage. Sectors currently supported include:
|
| | | | |
| l | Service and installation | | l | Government, local authorities and municipalities |
| l | Light delivery | | l | Industrial vehicles and equipment |
| l | Long-haul trucking and trailers | | l | OEMs and dealers |
| l | Utilities | | l | Professional services |
| l | Mining | | l | Agriculture |
| l | Fuel and chemical | | l | Transport and car rental |
| l | Fleet maintenance lease | | l | Containers |
| l | Police and security | | l | Refrigeration |
| l | Construction | | | |
IoT and Mobile Business
Our IoT business focuses on addressing applications for a growing market presence in manyvariety of the high-growth segments of the M2M market,markets including commercial telematics, after-market telematics,large enterprise verticals and industrial IoT markets. These applications range from smart city infrastructure management, remote monitoring and control, securitySD WAN failover, enterprise connectivity, etc. Our Skyus branded wireless gateways, routers and connected home. We expect to work with these customers to develop customizedmodems serve as connectivity solutions that incorporate our softwarefor the rapidly growing and other intellectual property, which will provide significant product differentiation.
OEMs. Our OEM customers integrate our products into devices that they manufacture and sell through their own direct sales forces and indirect distribution channels. Our products are capable of being integrated into a broad range of devices that utilize wireless-data capabilities. We seek to build strong relationships with our OEM partners by working closely with them and providing radio frequency, ("RF"), design consulting, performance optimization, software integration and customization and application engineering support during the integration of our products.
Strategic Relationships
We continue to develop and maintain strategic relationships with wireless and computer industry leaders such as QUALCOMM, Verizon Wireless, AT&T, Sprint, and major software vendors. Through strategic relationships, we have been ableunderpenetrated IoT market segments. Worldwide IoT spending is expected to increase at a 14% compound annual growth rate, surpassing $1 trillion in 2020 (International Data Corporation, 2017). With many customers using our solutions, we believe that we already have a solid footing in this market. We are continuing to invest and grow this portfolio to realize the opportunities in the growing IoT market.
Our mobile business has been driving advanced mobile technologies for a multitude of consumer and enterprise applications for over 20 years. This portfolio consists of intelligent mobile broadband solutions, HD quality voice VoLTE products, residential 4G routers and an advanced 5G portfolio of products under development. Our mobile broadband solutions, sold under the MiFi brand, are actively used by millions of customers annually to provide subscribers with secure and convenient high-speed access to corporate, public and personal information through the Internet and enterprise networks. The introduction of 5G technology is rapidly expanding new enterprise and consumer market penetration by leveraginguse cases and opportunities, including residential broadband gateways, industrial automation, massive machine connectivity and autonomous vehicles. We believe we
are strategically well placed to realize the resources, knowledgeopportunity for 5G and technologywe are focused on developing a portfolio of our channel partners.5G products that we will bring to the market in the future.
Sales and Marketing
We sell our Mobile Computing ProductsIoT, mobile and telematics solutions and services primarily to wireless operators either directly or through strategic relationships, as well as to OEM partnersenterprises and distributors located worldwide. Most of our Mobile Computing Products are sold directly by our sales force, or to a lesser degree, through distributors.
In order to maintain strong sales relationships, we provide co-marketing, trade show support, product training and demo units for merchandising. We are also engaged in a wide variety of activities, such as awareness and lead-generation programs, as well as product marketing. Other marketing initiatives include public relations, seminars and co-branding with partners.
We sell our M2M Products and Solutions primarily to enterprisestier-one service providers in the following industries: transportation;transportation, aviation ground services, government and local municipalities, mining, agriculture, construction, professional services, finance and insurance, energy and industrial automation;automation, and security and safety;safety. These products and medical monitoring. We sell our M2M Products and Solutions throughsolutions are sold by our direct sales force and through distributors.
A significant portionWe engage in a wide variety of sales and marketing activities, driving market leadership and global demand through integrated marketing campaigns. This includes product marketing, corporate communications, brand marketing and demand generation.
Geographic Information and Concentrations of Risk
The following table details the geographic concentration of our revenue comes from a small number of customers. Our revenues from sales to Verizon Wireless represented approximately 52% of our total revenues for the year ended December 31, 2014.assets (in thousands):
|
| | | | | | | | | | | |
| | December 31, |
| | 2017 | | 2016 | | 2015 |
| United States and Canada | $ | 65,208 |
| | $ | 71,564 |
| | $ | 112,424 |
|
| South Africa | 68,186 |
| | 63,693 |
| | 60,580 |
|
| Other | 24,813 |
| | 23,459 |
| | 25,749 |
|
| | $ | 158,207 |
| | $ | 158,716 |
| | $ | 198,753 |
|
A substantial majority of our revenue isduring the year ended December 31, 2017 was derived from sales in the U.S.United States. See Note 13,Geographic Information and Concentrations of Risk, to our consolidated financial statements for a discussion of our revenue and asset concentrations by geographic location.
Product Research and Development
Our research and development efforts are focused on developing innovative new wireless products and improving the functionality, design and performance of our existing products. Our research and development expenses for the years ended December 31, 2014, 2013 and 2012 were $34.3 million, $48.2 million and $60.4 million, respectively.
In both segments, we intend to continue to identify and respond For information regarding risks related to our customers’ needs by introducing new product designs with an emphasis on supporting cutting edge wireless data technology, ease-of-use, performance, weight, cost and power consumption.
We manage our products through a structured life-cycle process, from identifying initial customer requirements through development and commercial introduction to eventual phase-out. During product development, emphasis is placed on innovation, time-to-market, performance, meeting industry standards and customer-product specifications, ease of integration, cost reduction, manufacturability, quality and reliability.
Our product development efforts leverage our core expertise in the following key technology areas:
Advanced Radio Frequency and Hardware Design. Advanced RF design is a key technology that determines the performance of wireless devices. We have specialized in 700/800/900/1800/1900/2100/2500 MHz and AWS designs for digital cellular, packet data, CDMA, HSPA, WiMAX and LTE technologies. Our expertise in RF, baseband, and firmware technology contributes to the performance, cost advantages and small size of our products.
Miniaturization and System Integration. Our expertise includes the integration of RF and baseband chipsets and printed circuit board, or PCB technologies. We will continue to augment our miniaturization technology, working to further reduce the size and cost of current and future products.
Software Development. We specialize in integrating and customizing 3G and 4G software to meet carrier and regulatory requirements. We supply end-to-end solutions to enable our customers to achieve a time-to-market advantage. This includes firmware that runs on a modem processor, drivers for various host operating systems, software development kits, modem-manager software that controls modem operation and server applications for over-the-air updates.
Embedded Operating System. We have developed an embedded operating system that runs applications on our mobile hotspot products and allows us to introduce innovative applications.
M2M Solutions. We have developed customized asset-tracking systems and service-delivery platforms that utilize advanced radio-frequency technology and specialized software that interfaces withforeign operations, see the information technology systemsin “Item 1A. Risk Factors” in Part 1 of our customers.this report.
Manufacturing and Operations
The hardware used in our solutions is produced by contract manufacturers. Their services include component procurement, assembly, testing, quality control and fulfillment. Our current contract manufacturers include:
Mobile Computing Products and M2M Products and Solutions
Inventec Appliances Corporation
Hon Hai Precision Industry Co., Ltd.
M2M Products and Solutions
Benchmark Electronics
These contract manufacturers are located in China and Thailand and are able to produce our products using modern state-of-the-art equipment and facilities and relatively low-cost labor.
We outsource our manufacturing in an effort to:
focus on our core competencies of design, development and marketing;
minimize our capital expenditures and lease obligations;
realize manufacturing economies of scale;
achieve production scalability by adjusting manufacturing volumes to meet changes in demand; and
access best-in-class component procurement and manufacturing resources.
We believe that additional manufacturing efficiencies are realized due to our product architecture and our commitment to process design. Direct materials for our products consist of custom tooled parts such as printed circuit boards, molded plastic components and fabricated metal components, semi-custom parts such as batteries and cables, as well as industry-standard components such as Application Specific Integrated Circuits, RF power amplifiers, flash memory, transistors, integrated circuits, piezo-electric filters, duplexers, inductors, resistors and capacitors. Many of the components used in our products are similar to those used in cellular telephone handsets, helping to reduce our component costs through the use of standard parts.
Our operations organization manages our relationships with the contract manufacturers as well as other key suppliers. Our operations team focuses on supply chain management, quality, cost optimization, customer order management and new product introduction.
Intellectual Property
Our solutions rely on and benefit from our portfolio of intellectual property, including patents and trademarks. We currently own 30 United States patents. In addition, we currently have 21 patent applications pending. From time to time, we also seek to have our patents registered in selected foreign jurisdictions. The patents that we currently own expire at various times between 2020 and 2031.
We have licensed software and other intellectual property for use in our products from third-parties, such as QUALCOMM. In the case of QUALCOMM, these licenses allow us to manufacture CDMA, UMTS, HSPA, EV-DO, and LTE-based wireless modems and to sell or distribute them worldwide. In connection with such sales, we pay royalties to QUALCOMM. The license from QUALCOMM does not have a specified term and may be terminated by us or by QUALCOMM for cause or upon the occurrence of other specified events. In addition, we may terminate the licenses for any reason upon 60 days prior written notice. We have also granted to QUALCOMM a nontransferable, worldwide, nonexclusive, fully-paid and royalty-free license to use, in connection with wireless communications applications, certain of our intellectual property that incorporates the technology licensed to us by QUALCOMM. This license allows QUALCOMM to make, use, sell or dispose of such products and the related components.
We have also licensed software and other intellectual property for use in our products from various third-parties, such as Ericsson and Siemens, allowing us to use the licensed intellectual property for the worldwide manufacture and sale of GSM-based wireless devices. We pay royalties in connection with such sales. The licenses do not have a specified term and may be terminated by either party for cause or upon the occurrence of other specified events.
We also hold a number of trademarks including “Novatel Wireless”, the Novatel Wireless logo, “MiFi”, “MiFi Intelligent Mobile Hotspot”, “MiFi OS”, “MiFi Powered”, “MiFi Home”, “MobiLink”, “Ovation”, “Expedite”, “MiFi Freedom. My Way.”, “Enfora”, the Enfora logo, “Spider”, “Enabling Information Anywhere”, “Enabler” and “N4A”.
Backlog
We do not believe that backlog is currently a meaningful indicator of our future business prospects due to the many variables, some of which are outside of our control, which could cause the actual volume of our product shipments to differ from those that comprise our backlog. Additionally, we sometimes have relatively short lead times between receipt of customer purchase orders and shipment of products.
Competition
The market for wireless broadband accessour mobile, IoT and M2Masset tracking/telematics services and solutions is rapidly evolving and highly competitive. It is likely to continue to be significantly affected by the evolution of new wireless technology standards, additional companies entering the market, new product introductions and the product pricing and other market activities of industry participants.
We believe the principal competitive factors impacting the market for our products are price, form factor, time-to-market, features and functionality, performance, quality and brand. To maintain and improve our competitive position, we must continue to develop new products and solutions, expand our customer base, invest in research and development, grow our distribution network,and leverage our strategic relationships and investment in research and development.relationships.
Our products compete with a variety of devices, including other wireless modemstelematics solutions providers and mobile hotspots, wireless handsets, wireless handheld computing devices and M2M wireless solutions.IoT solutions suppliers. Our current competitors include:
wireless data modemFleet management SaaS and mobile hotspotservices providers, such as Huawei, ZTE, Sierra Wireless, PCD, LG Innotek, Samsung, Franklin WirelessFleetmatics, Masternaut, TomTom, Telogis, MiX Telematics and NetGear;Cartrack;
wireless handset manufacturers,Mobile hotspots providers, such as HTC, Apple, Motorola, NokiaNetgear and Samsung;Franklin Wireless;
wireless M2MIoT solution providers, such as Cradlepoint and Sierra Wireless, Cradlepoint, Telit Wireless Solutions, Gemalto, CalAmpWireless; and Huawei.
Customer experience software solutions and services providers such as Amdocs.
We believe that we have advantages over each of our primary competitors due in varying measure to the technical and engineering design of our products, the broad range of customized solutions that we offer, the ease-of-use of our products, and our ability to adapt our products to specific customer needs and our competitive pricing.needs. As the market for wireless dataour solutions and services expands, other entrants may seek to compete with us either directly or indirectly.
Research and Development
Our research and development efforts are focused on developing innovative mobile devices, including IoT and advanced routing platforms, and telematics solutions and services, and improving the functionality, design and performance of our current products and solutions. Our research and development expenses for the years ended December 31, 2017, 2016 and 2015 were approximately $21.4 million, $30.7 million and $35.4 million, respectively.
We intend to continue to identify and respond to our customers’ needs by introducing new SaaS, IoT and mobile solutions and product designs that meet the needs of the market and our customers, with an emphasis on creating next generation wireless product platforms targeting mass market initiatives in high growth verticals and technologies such as 5G NR and easy-to-use products and services that enable customers to connect, track, and manage their business systems and assets.
We manage our research and development through a structured life-cycle process, from identifying initial customer requirements through development and commercial introduction to eventual phase-out. During product development, emphasis is placed on quality, reliability, performance, time-to-market, meeting industry standards and customer-product specifications, ease of integration, cost reduction, and manufacturability.
Intellectual Property
Our solutions rely on and benefit from our portfolio of intellectual property, including patents and trademarks. We currently own 42 United States patents and 35 foreign patents. In addition, we currently have 26 patent applications pending. The patents that we currently own expire at various times between 2021 and 2035.
We, along with our subsidiaries, also hold a number of trademarks or registered trademarks including “Inseego”, “Inseego North America”, the Inseego logo, “DigiCore”, “Ctrack”, the Ctrack logo, “Crossroads”, “Skyus”, “Novatel Wireless”, the Novatel Wireless logo, “MiFi”, “MiFi Intelligent Mobile Hotspot” and “MiFi Freedom. My Way.”
Key Partners and Customers
We have strategic technology, development and marketing relationships with several of our customers and partners. Our strong customer and partner relationships provide us with the opportunity to expand our market reach and sales. We partner with leading OEMs, telecom groups and installation partners which allows us to offer customers integrated and holistic solutions. Ctrack uses leading cellular providers such as AT&T, Sprint, T-Mobile, Vodafone, MTN, Telstra and Optus to ensure the optimal real-time visibility of tracked vehicles and systems, supported by accurate and sophisticated mapping services such as the HERE Open Location Platform.
Customers for our products include transportation companies, industrial companies, governmental agencies, manufacturers, application service providers, system integrators and distributors, and enterprises in various industries, including fleet and vehicle transportation, finance, accounting, legal, insurance, energy and industrial automation, security and safety, medical monitoring and government.
Our telematics customer base is comprised of wireless operators, distributors, OEMs and various companies in other vertical markets. Fleet management customers include global enterprises such as BHP Billiton, Super Group, Mammoet and Australia Post. Customers of our government, local council and municipality asset management platforms include Thames Water and the City of Ekurhuleni. Airport asset tracking customers include KLM Equipment Services and Hanover Airport. Usage-based insurance customers include Discovery Insure and Cross Country Insurance Consultants. Our largest vehicle tracking customer is the South African Police Service (SAPS).
Our customers for our business connectivity products include EnerNOC, Creative Mobile Technologies, Fastenal, T-Mobile, Sprint and Verizon Wireless. Our customers for our device management solutions include T-Mobile and Sprint.
A significant portion of our revenue during the year ended December 31, 2017 came from one customer, Verizon Wireless, which represented approximately 51% of our total revenues for the year ended December 31, 2017. It is our intention to diversify our customer base.
Manufacturing and Operations
The hardware used in our solutions is produced by contract manufacturers. Our current contract manufacturers include AsiaTelco Technologies Co. and Inventec Appliances Corporation. In the fourth quarter of 2017, we made a transition to make AsiaTelco Technologies Co. our primary contract manufacturer. Under our manufacturing agreements, such contract manufacturers provide us with services including component procurement, product manufacturing, final assembly, testing, quality control and fulfillment. These contract manufacturers are located in China and South Africa and are able to produce our products using modern state-of-the-art equipment and facilities with relatively low-cost labor.
focus on our core competencies of Contentsdesign, development and marketing;
minimize our capital expenditures and lease obligations;
realize manufacturing economies of scale;
achieve production scalability by adjusting manufacturing volumes to meet changes in demand; and
access best-in-class component procurement and manufacturing resources.
Our operations team manages our relationships with the contract manufacturers as well as other key suppliers. Our operations team focuses on supply chain management and logistics, product quality, inventory and cost optimization, customer fulfillment and new product introduction. We develop and control the software that goes on our devices.
Employees
As ofAt December 31, 2014,2017, we had 240927 employees. By segment, Mobile Computing Products had 196 employees, including corporate functions and M2M Products and Solutions had 44 employees. By function, we had 127 employees in research and development, 48 in sales and marketing, 30 in operations and 35 in general and administrative functions. We also use the services of consultants and temporary workers from time to time. Our employees are not represented by any collective bargaining unit and we consider our relationship with our employees to be good.
Website Access to SEC Filings
We maintain an Internet website at www.novatelwireless.com.www.inseego.com. The information contained on our website or that can be accessed through our website does not constitute a part of this report. We make available, free of charge through our Internet website, our annual reportsAnnual Reports on Form 10-K, quarterly reportsQuarterly Reports on Form 10-Q, current reportsCurrent Reports on Form 8-K and amendments to those reports filed or furnished pursuant to Section 13(a) or 15(d) of the Securities Exchange Act of 1934, as amended, or the Exchange Act, as soon as reasonably practicable after we electronically file or furnish this information to the Securities and Exchange Commission ("SEC").SEC.
Item 1A. Risk Factors
An investment in our common stock involves various risks. Before deciding to purchase, hold or sell our common stock, you should carefully consider the risks described below in addition to the other cautionary statements and risks described elsewhere in this report and in the documents incorporated by reference herein and therein. The risks and uncertainties described below are those that we currently deem to be material, and do not represent all of the risks that we face. Additional risks and uncertainties not presently known to us or that we currently do not consider material may in the future become material and impair our business operations. Some of the risks and uncertainties described herein have been grouped so that related risks can be viewed together. You should not draw conclusions regarding the relative magnitude or likelihood of any risk based on the order in which risks or uncertainties are presented herein. If any of the following risks actually occur, our business could be materially harmed, and our financial condition and results of operations could be materially and adversely affected. As a result, the trading price of our securities could decline, and you might lose all or part of your investment.decline. You should also refer to the other information contained in this Annual Report on Form 10-K, including our consolidated financial statements and the related notes.
GENERAL RISK FACTORS RELATING TO OUR BUSINESS
Our quarterly operating results have fluctuated in the past and may fluctuate in the future, which could cause declines or volatility in the price of our common stock.
Our quarterly operating results have fluctuated in the past and may fluctuate in the future as a result of a variety of factors, many of which are outside of our control. If our quarterly operating results or guidance fall below the expectations of research analysts or investors, the price of our common stock could decline substantially. The following factors, among others, could cause fluctuations in our quarterly operating results:
our ability to attract new customers and retain existing customers;
our ability to accurately forecast revenue and appropriately plan our expenses;
our ability to accurately predict changes in customer demand due to matters beyond our control;
our ability to introduce new features, including integration of our existing solutions with third-party software and devices;
the actions of our competitors, including consolidation within the industry, pricing changes or the introduction of new services;
our ability to effectively manage our growth;
our ability to attract and retain key employees;
our ability to successfully manage and realize the anticipated benefits of any future acquisitions of businesses, solutions, or technologies;
our ability to successfully launch new services or solutions or sell existing services or solutions into
additional geographies or vertical markets;
the timing and cost of developing or acquiring technologies, services, or businesses;
the timing, operating costs, and capital expenditures related to the operation, maintenance, and expansion of our business;
service outages or security breaches and any related occurrences which could impact our reputation;
the impact of worldwide economic, industry, and market conditions, including disruptions in financial markets and the deterioration of the underlying economic conditions in some countries, and those conditions specific to Internet usage and online businesses;
fluctuations in currency exchange rates, particularly the South African Rand to U.S. Dollar exchange rate;
trade protection measures (such as tariffs and duties) and import or export licensing requirements;
costs associated with defending intellectual property infringement and other claims;
changes in law and regulations affecting our business; and
provision of fleet management solutions or asset management solutions from cellular carrier-controlled or OEM-controlled channels from which Inseego may be excluded.
We believe that our quarterly revenue and operating results may vary significantly in the future and that period-to-period comparisons of our operating results may not be meaningful. You should not rely on the results of any quarter as an indication of future performance.
We have an accumulated deficit and may not be able to achieve or sustain profitability, which may negatively impact our ability to achieve our business objectives.
We have reported net losses in each of the last three fiscal years, and we cannot predict when we will become profitable or if such profitability can be sustained. We expect to continue making significant expenditures to develop and expand our business. Any growth in our revenue or customer base may not be sustainable, and we may not generate sufficient revenue to become profitable. We may incur significant losses in the future for a number of reasons, including the other risks described in this section, and we may encounter unforeseen expenses, difficulties, complications and delays and other unknown events. Accordingly, we may not be able to achieve or sustain profitability, and the failure to fund our capital requirements may negatively impact our ability to achieve our business objectives.
The reorganized company resulting from the acquisitions of R.E.R. Enterprises, Inc. (“RER”) (and its wholly-owned subsidiary and principal operating asset, Feeney Wireless, LLC (which has been renamed Inseego North America, LLC) (“FW” or “INA”)) and Ctrack and the recent divestiture of our Modules Business (as defined below) may not perform as we or the market expects, which could have an adverse effect on the price of our common stock.
The reorganized company resulting from the acquisitions of FW and Ctrack in 2015 and the divestiture of our Modules Business in 2016 may not perform as we or the market expects. Risks associated with the reorganized company following these acquisitions and the divestiture include the following:
integrating new business acquisitions and divesting existing lines of business is a difficult, expensive and time-consuming process and the failure to successfully manage such transitions could adversely affect our financial condition and results of operations;
the acquisitions of FW and Ctrack changed the nature of the business in which we historically operated from primarily selling communications-related hardware to a solutions and software business in the emerging IoT market; if we are not able to effectively adjust to these changes in the fundamental nature of our business, our financial condition and results of operations may be adversely affected;
it is possible that our key employees might decide not to remain with us as a result of these changes in our business or for other reasons, and the loss of such personnel could have a material adverse effect on our financial condition, results of operations and growth prospects;
relationships with third parties, including key vendors and customers, may be affected by changes in our business resulting from these acquisitions and divestitures; any adverse changes in these third party relationships could adversely affect our business, financial condition and results of operations; and
the price of our common stock may be affected by factors different from those that affected the price of our common stock prior to these acquisitions and/or divestitures.
We cannot provide any assurances with respect to the accuracy of our assumptions with respect to future revenues or revenue growth rates, if any, of the reorganized company, and we cannot provide assurances with respect to our ability to
realize any expected operating synergies or cost savings from the acquisition of FW and Ctrack and the divestiture of our Modules Business.
The 5G market may take longer to materialize than we expect or, if it does materialize rapidly, we may not be able to meet the development schedule.
The 5G market, including the newly defined 5G NR standard, is accelerating and we believe that we are at the forefront of this newly emerging standard. However, this market may take longer to materialize than we expect which could delay important commercial network launches. Even if the market does materialize at the rapid pace that we are expecting, we may have difficulties meeting the aggressive time lines and getting our target products to market on time to meet the demands of our target customers. The 5G market requires us to design routers and antennas that meet certain technical specifications. We may have difficulties meeting the market and technical specifications and time lines. Additionally, our target customers have no guaranty that the configurations of their respective target products will be successful or that they can reach the appropriate target client base to make our research and development investment worthwhile. Failure to manage these challenges could have a material adverse effect on our financial condition and results of operations.
If we fail to develop and timely introduce new products and services or enter new markets for our products and services successfully, we may not achieve our revenue targets or we may lose key customers or sales and our business could be harmed.
The development of new solutions for mobile broadband data, vehicle tracking, asset management, fleet management and telemetry applications can be difficult, time-consuming and costly. There are inherent risks and uncertainties associated with offering new products and services, especially when new markets are not fully developed, related technology standards are not mature, or when the laws and regulations regarding a new product or solution are not mature. Factors outside of our control, such as developing laws and regulations, regulatory orders, competitive product offerings and changes in commercial and consumer demand for products or services may also materially impact the successful implementation of new products or services. As we introduce new products or solutions, our current customers may not require or desire the features of these new offerings and may not purchase them or might purchase them in smaller quantities than we had expected. We may face similar risks that our products or solutions will not be accepted by customers as we enter new markets for our solutions, both in the United States and international markets.
Further, as part of our business, we may enter into contracts with some customers in which we would agree to develop products or solutions that we would sell to such customers. Our ability to generate future revenue and operating income under any such contracts would depend upon, among other factors, our ability to timely and profitably develop products or solutions that can be cost-effectively deployed and that meet required design, technical and performance specifications.
If we are unable to successfully manage these risks or meet required delivery specifications or deadlines in connection with one or more of our key contracts, we may lose key customers or orders and our business could be harmed.
An assertion by a third party that we are infringing its intellectual property could subject us to costly and time- consuming litigation or expensive licenses and our business could be harmed.
The technology industries involving mobile data communications, IoT devices, software and services are characterized by the existence of a large number of patents, copyrights, trademarks and trade secrets and by frequent litigation based on allegations of infringement or other violations of intellectual property rights. Much of this litigation involves patent holding companies or other adverse patent owners who have no relevant product revenues of their own, and against whom our own patent portfolio may provide little or no deterrence. For example, one such entity, Carucel Investments, L.P. (“Carucel”) filed a claim seeking approximately $43.0 million in royalties and damages related to past sales of MiFi mobile hotspots. After a trial in April 2017, a jury found that our products did not infringe Carucel’s patents, but Carucel is appealing the verdict and there can be no assurances as to the ultimate outcome of this litigation. Moreover, this is just one of several patent infringement lawsuits from non-practicing entities that are brought against us or our subsidiaries each year in the ordinary course of business.
We cannot assure you that we or our subsidiaries will prevail in any current or future intellectual property infringement or other litigation given the complex technical issues and inherent uncertainties in such litigation. Defending such claims, regardless of their merit, could be time-consuming and distracting to management, result in costly litigation or settlement, cause development delays, or require us or our subsidiaries to enter into royalty or licensing agreements. In addition, we or our subsidiaries could be obligated to indemnify our customers against third parties’ claims of intellectual property infringement based on our products or solutions, as is the case in the Carucel litigation for which Novatel Wireless may be obligated to indemnify its customer, Verizon Wireless if Carucel’s infringement claim ultimately results in any liability. If our products or solutions violate any third-party intellectual property rights, we could be required to withdraw them from the market, re-develop them or seek to obtain licenses from third parties, which might not be available on reasonable terms or at all. Any efforts to re-develop our products or solutions, obtain licenses from third parties on favorable terms or license a substitute
technology might not be successful and, in any case, might substantially increase our costs and harm our business, financial condition and operating results. Withdrawal of any of our products or solutions from the market could harm our business, financial condition and operating results.
In addition, we incorporate open source software into our products and solutions. Given the nature of open source software, third parties might assert copyright and other intellectual property infringement claims against us based on our use of certain open source software programs. The terms of many open source licenses to which we are subject have not been interpreted by U.S. courts or courts of other jurisdictions, and there is a risk that those licenses could be construed in a manner that imposes unanticipated conditions or restrictions on our ability to commercialize our products and solutions. In that event, we could be required to seek licenses from third parties in order to continue offering our products and solutions, to re-develop our solutions, to discontinue sales of our solutions, or to release our proprietary software source code under the terms of an open source license, any of which could adversely affect our business.
If we are unable to protect our intellectual property and proprietary rights, our competitive position and our business could be harmed.
We rely on a combination of patent laws, trademark laws, copyright laws, trade secrets, confidentiality procedures and contractual provisions to protect our intellectual property and proprietary rights. However, our issued patents and any future patents that may issue may not survive a legal challenge to their scope, validity or enforceability, or provide significant protection for us. The failure of our patents to adequately protect our technology might make it easier for our competitors to offer similar products or technologies. In addition, patents may not issue from any of our current or any future applications and significant portions of our intellectual property are held in the form of trade secrets which are not protected by patents.
Monitoring unauthorized use of our intellectual property is difficult and costly. The steps we have taken to protect our proprietary rights may not be adequate to prevent misappropriation of our intellectual property. We may not be able to detect unauthorized use of, or take appropriate steps to enforce, our intellectual property rights. Our competitors may also independently develop similar technology. In addition, the laws of many countries do not protect our proprietary rights to as great an extent as do the laws of the United States. Any failure by us to meaningfully protect our intellectual property could result in competitors offering products that incorporate our most technologically advanced features, which could seriously reduce demand for our products and solutions. In addition, we may in the future need to initiate infringement claims or litigation. Litigation, whether we are a plaintiff or a defendant, can be expensive, time consuming and may divert the efforts of our technical staff and managerial personnel, which could harm our business, whether or not such litigation results in a determination favorable to us.
We are currently engaged in litigation that could be costly to maintain, distracting to management and could, if decided adversely, have a material adverse effect on our financial condition and operating results.
On May 11, 2017, the Company initiated a lawsuit against the former stockholders of RER in connection with the Company’s acquisition of FW, seeking recovery of damages for civil conspiracy, fraud in the inducement, unjust enrichment and breach of fiduciary duty. The Company has suspended payments owed to the former stockholders of RER under an earn-out arrangement, pursuant to which the Company would have been required to pay an additional $15.8 million in cash and 1.9 million shares of the Company’s common stock pending the outcome of this litigation. There can be no assurance as to the ultimate outcome of this case. If there is an adverse judgment against the Company, in addition to costs associated with maintaining this lawsuit, it could result in the Company being required to make the suspended payments and could have a material adverse effect on our financial condition and operating results.
We may not be able to maintain and expand our business if we are not able to hire, retain and manage additional qualified personnel.
Our success in the future depends in part on the continued contribution of our executive, technical, engineering, sales, marketing, operations and administrative personnel. Recruiting and retaining skilled personnel in the industries in which we operate, including engineers and other technical staff and skilled sales and marketing personnel, is highly competitive. In addition, the success of any acquisition depends in part on our retention and integration of key personnel from the acquired company or business.
Although we may enter into employment agreements with members of our senior management and other key personnel, these arrangements do not prevent any of our management or key personnel from leaving the company. If we are not able to attract or retain qualified personnel in the future, or if we experience delays in hiring required personnel, particularly qualified technical and sales personnel, we may not be able to maintain and expand our business.
Our decision to terminate the Purchase Agreement governing the proposed sale of our MiFi Business and retain ownership of that business could have adverse effects on our business, results of operations and the trading price of our common stock.
In June 2017, we terminated the Purchase Agreement governing the proposed sale of our MiFi Business due to delays and uncertainty in securing approval of the transactions contemplated by the Purchase Agreement from CFIUS. As a result of such termination, we retained our ownership interest in Novatel Wireless and the MiFi Business. While we believe that market opportunities and the underlying business fundamentals of the mobile hotspot business have improved since we decided to seek the sale of the business in early 2016 we expect to face significant challenges as we drive that business toward profitability.
The mobile hotspot business has relatively low gross margins and operates in a very competitive market environment. While our mobile hotspot products tend to have advanced features which often enable them to be sold at premium prices when they are first introduced, we also have higher costs than most of our competitors due to our small scale and heavy use of U.S. based engineers in product development. Many of our competitors have substantially greater resources and scale, as would be expected in the relatively mature, consumer electronics product categories which comprise our mobile hotspot business. Our wireless data modem and mobile hotspots, for example, compete against similar products offered by Huawei, ZTE, Sierra Wireless, TCL, Franklin Wireless and NetGear. More broadly, those products also compete against wireless handset manufacturers such as HTC, Apple, LG and Samsung, which all offer mobile hotspot capability as a feature of their cellular smartphones. Failure to manage these challenges, or failure of our hotspot product or service offerings to be successful and profitable, could have a material adverse effect on our financial condition and results of operations.
Servicing our debt requires a significant amount of cash, and we may not have sufficient cash flow from our business to pay our substantial debt.
Our ability to make scheduled payments of the principal of, to pay interest on, or to refinance our indebtedness, including the Term Loan under the Credit Agreement (each as defined below) and the Convertible Notes (as defined below), depends on our future performance, which is subject to economic, financial, competitive and other factors beyond our control. Our business may not generate cash flow from operations in the future sufficient to service our debt and other fixed charges, fund working capital needs and make necessary capital expenditures. If we are unable to generate such cash flow, we may be required to adopt one or more alternatives, such as selling assets, refinancing or restructuring debt or obtaining additional equity capital on terms that may be onerous or dilutive. Our ability to refinance or restructure our indebtedness will depend on the capital markets and our financial condition at such time. We may not be able to engage in any of these activities or engage in these activities on favorable terms, which could result in a default on our debt obligations.
Interest rates on our Term Loan are tied to the LIBOR plus a fixed percentage. Increases in the prime interest rate (LIBOR) will increase our debt service costs/interest payments.
If we are unable to generate sufficient cash flow or otherwise obtain funds necessary to make required payments, or if we fail to comply with the various requirements of our existing indebtedness or any other indebtedness which we may incur in the future, we would be in default, which could permit the holders of our indebtedness, including the Convertible Notes, to accelerate the maturity of such indebtedness. Any default under such indebtedness could have a material adverse effect on our business, results of operations and financial condition.
Despite our current consolidated debt levels, we may incur additional debt in compliance with our existing obligations.
Despite our current consolidated debt levels, we and our subsidiaries may be able to incur additional debt in the future, including secured debt. The Inseego Indenture contains covenants, that are effective until June 15, 2020, limiting our and our subsidiaries’ ability to incur additional secured indebtedness in the future, but it will not completely prohibit the incurrence of such secured debt. Although the terms of the Inseego Indenture contain restrictions on the incurrence of additional indebtedness, those restrictions are subject to a number of significant qualifications and exceptions and the amount of capital indebtedness that could be incurred in connection with those exceptions could be substantial.
The Credit Agreement relating to our Term Loan contains customary operational covenants, our failure to comply with which could result in a default under the Credit Agreement as well as a cross-default under the Inseego Indenture.
The credit agreement, dated August 23, 2017, by and among the Company and certain of our direct and indirect subsidiaries (the “Guarantors”), Cantor Fitzgerald Securities, as administrative agent and collateral agent (the “Agent”), and certain funds managed by Highbridge Capital Management, LLC, as lenders (the “Lenders”) (the “Credit Agreement”) which governs our Term Loan contains usual and customary restrictive covenants relating to the management and operation of our business, and it is likely that any future debt arrangements we may enter into would contain similar covenants. Failure to comply with any of the covenants under the Credit Agreement or any other debt agreement could result in a default under such an agreement and a cross-default under the Inseego Indenture (as defined below), which could permit the holders of the Inseego
Notes (as defined below) to accelerate the maturity of such indebtedness. Any default or cross-default under such indebtedness could have a material adverse effect on our business, results of operations and financial results.
The indebtedness under our Credit Agreement is secured by certain of our assets, including the equity interests of certain of our direct and indirect subsidiaries. As a result of this security interest, such assets would only be available to satisfy claims of our general creditors or to holders of our equity securities if we were to become insolvent to the extent that the value of such assets exceeded the amount of our indebtedness and other obligations under the Credit Agreement.
Indebtedness under our Credit Agreement is secured by a lien on certain of our assets, including the equity interests of certain of our direct and indirect subsidiaries. Accordingly, if an event of default were to occur under the Credit Agreement, such as a bankruptcy, insolvency, liquidation or other reorganization, the Lenders would have a priority right to such assets, to the exclusion of our general creditors. In that event, such assets would first be used to repay in full all indebtedness and other obligations under the Credit Agreement, resulting in all or a portion of such assets being unavailable to satisfy the claims of our unsecured creditors. Only after satisfying the claims of our unsecured creditors and our subsidiaries’ unsecured creditors would any amount be available for distribution to holders of our equity securities.
If our reorganization and restructuring activities fail to achieve targeted cost and expense reductions our business and financial performance may be adversely affected.
In June 2017, we announced a restructuring plan aimed at reducing our cost of revenues and operating expenses. This restructuring plan was designed to improve our strategic focus on our most profitable business lines and consolidate operations of certain of our subsidiaries with those of the Company, including reductions-in-force, further reorganization of executive level management and the consolidation of certain of our facilities. During the period covered by this Annual Report on Form 10-K, we incurred approximately $5.2 million of restructuring charges and decreased other operating expenses by approximately $35.0 million. While we expect to continue with our cost reductions, we face a variety of risks and uncertainties relating to the effectiveness of such activities. Any delays in the implementation of our restructuring plan or unforeseen expenses related to such activities could have a material adverse effect on our business, results of operations and financial condition.
The reorganization and restructuring announced in June 2017 may not yield the expected results, or may result in additional expenditures.
The reorganization and restructuring announced in June 2017 may fail to reduce the Company’s expenditure rate to the correct level. In addition, we may incur additional expenditures or other adverse effects as a result of the reorganization and restructuring which may:
require us to further reduce the expenditure rate, which may include planned research and development activities or other operating expenses;
make it difficult to retain key personnel as a result of the restructuring; and
prevent us from growing sales/revenue with existing customers or adding new customers.
Our ability to transition to more profitable operations is dependent upon the Company achieving a level of revenue adequate to support our evolving cost structure. If events or circumstances occur such that we do not meet our operating plan as expected, or if we become obligated to pay unforeseen expenditures as a result of our reorganization and restructuring activities, we may never achieve our intended business objectives, which could have a material adverse effect on our business, results of operations and financial condition.
Uncertainties relating to recent changes in our management team may adversely affect our operations.
Over the last two years, we have experienced significant turnover in our senior management. While we expect to engage in an orderly transition process as we integrate newly appointed officers and managers, we face a variety of risks and uncertainties relating to the lack of management continuity, including diversion of management attention from business concerns, failure to retain other key personnel or inability to hire new key personnel. These risks and uncertainties could result in operational and administrative inefficiencies and added costs, which could adversely impact our results of operations, stock price and customer relationships.
The Company has entered into a Rights Agreement, and if the holders exercise their share purchase rights under such agreement, it could materially adversely affect the price of our common stock and cause dilution to our existing stockholders.
We entered into a rights agreement on January 22, 2018, with Computershare Trust Company, N.A., a federally chartered trust company, as Rights Agent (the “Rights Agreement”). The Rights Agreement is intended to discourage acquisitions of our
common stock which could result in a cumulative change in ownership of more than 50% within a rolling three-year period, thereby preserving our current ability to utilize net operating loss carryforwards to offset future income tax obligations, which would become subject to limitations if we were to experience an “ownership change,” as defined under Section 382 of the Internal Revenue Code of 1986, as amended. While this Rights Agreement is intended to preserve our current ability to utilize net operating loss carryforwards, it effectively deters current and future purchasers from accumulating more than 4.9% of our common stock, which could delay or discourage takeover attempts that stockholders may consider favorable. In addition, if the share purchase rights under the Rights Agreement are exercised, additional shares of our common stock will be issued, which could cause dilution to our current stockholders. Moreover, sales in the public market of any shares of our common stock issuable upon such exercise, or the perception that such sales may occur, could adversely affect the prevailing market price of our common stock. These issuances would also cause our per share net income, if any, to decrease in future periods.
If the Rights Agreement has not been approved or ratified by the stockholders prior to the close of business on the date of the Company’s 2018 Annual Meeting, the preferred stock purchase rights issued pursuant to the Rights Agreement will expire, which could make an acquisition of our common stock that would trigger a limitation on our ability to utilize our net operating loss carryforwards more likely to occur.
RISKS RELATED TO CORPORATE DEVELOPMENT ACTIVITIES
If we do not properly manage the development of our business, we may experience significant strains on our management and operations and disruptions in our business.
Various risks arise if companies and industries quickly grow or evolve. If our business or industry develops more quickly than our ability to respond, our ability to meet customer demand in a timely and efficient manner could be challenged. We may also experience development, certification or production delays as we seek to meet demand for our products or unanticipated product requirements. Our failure to properly manage the developments that we or our industry might experience could negatively impact our ability to execute on our operating plan and, accordingly, could have an adverse impact on our business, our cash flow and results of operations and our reputation with our current or potential customers.
Our corporate development activities could disrupt our business and harm our financial condition and results of operations.
As part of our business strategy, we may review acquisition and divestiture opportunities that we believe would be advantageous or complementary to the development of our business. Based on these opportunities, we may acquire additional businesses, assets, or technologies in the future. Alternatively, we may divest businesses, assets or technologies. All of these activities are subject to risks and uncertainties and could disrupt or harm our business. For example, if we make an acquisition, we could take any or all of the following actions, any one of which could adversely affect our business, financial condition, results of operations or stock price:
use a substantial portion of our available cash;
incur substantial debt, which may not be available to us on favorable terms and may adversely affect our liquidity;
issue equity or equity-based securities that would dilute the percentage ownership of existing stockholders;
assume contingent liabilities; and
take substantial charges in connection with acquired assets.
Acquired businesses may have liabilities or adverse operating issues that we fail to discover through due diligence prior to the acquisition, such as:
failure by previous management to comply with applicable laws or regulations;
inaccurate representations; and
unfulfilled contractual obligations to customers or vendors.
Other risks of engaging in acquisitions include:
difficulties in assimilating acquired operations, products, technologies and personnel;
unanticipated costs;
diversion of management’s attention from existing operations;
adverse effects on existing business relationships with suppliers and customers;
risks of entering markets in which we have limited or no prior experience; and
potential loss of key employees from either our existing business or the acquired organization.
There are also risks associated with divested businesses or businesses planned to be sold, such as:
difficulties separating divested operations from ongoing operations;
loss of sales, marketing and operating synergies;
loss of key employees and know-how related to the on-going portions of the business;
unanticipated costs;
diversion of management’s attention from existing operations; and
adverse effects on existing business relationships with suppliers and customers.
As a result, if we fail to properly evaluate or implement acquisitions or divestitures, we may not achieve the anticipated benefits of any such transactions, and we may incur unanticipated costs, either of which could harm our business and operating results.
RISKS RELATED TO COMPETITION
The market for wireless broadband data accessthe products and services that we offer is rapidly evolving and highly competitive. We may be unable to compete effectively.
The market for wireless broadband data accessthe products and services that we offer is rapidly evolving and highly competitive. We expect competition to continue to increase and intensify. Many of our competitors or potential competitors have significantly greater financial, technical, operational and marketing resources than we do. These competitors, for example, may be able to respond more rapidly or more effectively than we can to new or emerging technologies, changes in customer requirements, supplier related developments, or a shift in the business landscape. They also may devote greater or more effective resources than we do to the development, manufacture, promotion, sale, and post-sale support of their respective products and services.
Many of our current and potential competitors have more extensive customer bases and broader customer, supplier and other industry relationships that they can leverage to establish competitive dealings with many of our current and potential customers. Some of these companies also have more established and larger customer support organizations than we do. In addition, these companies may adopt more aggressive pricing policies or offer more attractive terms to customers than they currently do, or than we are able to do. They may bundle their competitive products with broader product offerings and may introduce new products, services and enhancements. Current and potential competitors might merge or otherwise establish cooperative relationships among themselves or with third parties to enhance their products, services or market position. In addition, at any time any given customer or supplier of ours could elect to enter our then existing line of business and thereafter compete with us, whether directly or indirectly. As a result, it is possible that new competitors or new or otherwise enhanced relationships among existing competitors may emerge and rapidly acquire significant market share to the detriment of our business.
Our products compete with a variety of devices, including other wireless modems and mobile hotspots, wireless handsets, wireless handheld computing devices and M2MIoT wireless solutions. Our current competitors include:
wireless data modemfleet management SaaS and mobile hotspotservices providers, such as Huawei, ZTE, Sierra Wireless, PCD, LG Innotek, Samsung, Franklin WirelessFleetmatics, Masternaut, TomTom, Telogis, MiX Telematics and NetGear;Cartrack;
wireless handset manufacturers,mobile hotspots providers, such as HTC, Apple, Motorola, NokiaNetgear and Samsung; andFranklin Wireless;
wireless M2MIoT solution providers, such as Cradlepoint and Sierra Wireless, Cradlepoint, Telit Wireless Solutions, Gemalto, CalAmpWireless; and Huawei.
customer experience software solutions and services providers such as Amdocs.
We expect our competitors to continue to improve the features and performance of their current products and to introduce new products, services and technologies which, if successful, could reduce our sales and the market acceptance of our products, generate increased price competition and make our products obsolete. For our products to remain competitive, we must, among other things, continue to invest significant resources (financial, human and otherwise) in, among other things, research and development, sales and marketing, and customer support. We cannot be sure that we will have or will continue to have sufficient resources to make these investments or that we will be able to make the technological advances necessaryin the marketplace, meet changing customer requirements, achieve market acceptance and respond to our competitors’ products.
The market for asset management and fleet management solutions and the markets for telemetry and tracking solutions are all highly fragmented and competitive, with low barriers to entry. If we do not compete effectively, our productsoperating results may be harmed.
The market for asset management and fleet management solutions and the markets for telemetry and tracking solutions are all highly fragmented, consisting of a large number of vendors, competitive and rapidly changing product and service
offerings, with relatively low barriers to remain competitive. Increasedentry. Competition in all these markets is based primarily on the level of difficulty in installing, using and maintaining solutions, total cost of ownership, product performance, functionality, interoperability, brand and reputation, distribution channels, industries and the financial resources of the vendor. We expect competition to intensify in the future with the introduction of new technologies and market entrants. For example, in the telematics market, mobile service and software providers, such as Google and makers of GPS navigation devices, such as Garmin, provide limited services at lower prices or at no charge, such as basic GPS- based mapping, tracking and turn-by-turn directions that could be expanded or further developed to more directly compete with our fleet management solutions. In addition, wireless carriers, such as Verizon Wireless, have begun to offer fleet management solutions that benefit from the carrier’s scale and cost advantages which we are unable to match. Similarly, vehicle OEMs may provide factory-installed devices and effectively compete against us directly or indirectly by partnering with other fleet management suppliers. We can provide no assurances that we will be able to compete effectively as this ecosystem as the competitive landscape continues to develop. Competition could result in price reductions, fewerreduced operating margins, increased sales and marketing expenses and the loss of market share, any of which would likely cause serious harm to our operating results.
Industry consolidation may result in increased competition, which could result in a loss of customers or smaller customer orders, reduced product marginsa reduction in revenue.
Some of our competitors have made or may make acquisitions or may enter into partnerships or other strategic relationships to offer more comprehensive services than they individually had offered or achieve greater economies of scale. In addition, new entrants not currently considered to be competitors may enter our market through acquisitions, partnerships or strategic relationships. We expect these trends to continue as companies attempt to strengthen or maintain their market positions. Many of the potential entrants may have competitive advantages over us, such as greater name recognition, longer operating histories, more varied services and larger marketing budgets, as well as greater financial, technical and other resources. These pressures could result in a substantial loss of our market share. customers, a reduction in our revenue or increased costs as we seek ways to become more competitive.
RISKS RELATED TO OUR CUSTOMERS AND DEMAND FOR OUR SOLUTIONS
Our failureinability to compete successfully adapt to rapid technological change in our marketscould seriously harmimpair our business, financial conditionability to remain competitive and adversely affect our results of operations.
If we fail to develop and timely introduce new products successfully, we may lose key customers or product orders and our business could be harmed.
The development of new wireless data products requires technological innovation that can be difficult, lengthy and costly. In addition, wireless operators require that wireless data systems deployed on their networks comply with their own technical and product performance standards, which may differ from the standards our products are required to meet for other operators. This increases the complexity and might impact the timingAll of the product development and customer approval process. In addition, as we introduce new products or new versions of our existing products, our current customers may not require or
desire the technological innovations of these products and may not purchase them or might purchase them in smaller quantities than we had expected.
Further, as part of our business, we may enter into contracts with some customersmarkets in which we would agreeoperate are characterized by rapid technological change, frequent introductions of new products, services and solutions and evolving customer demands. In addition, we are affected by changes in the many industries related to developthe products thator services we would sell to such customers. Our ability to generate future revenueoffer, including the aviation, automotive, telematics, wireless telemetry, GPS navigation device and operating income under any such contracts would depend upon, among other factors,work flow software industries. As the technologies used in each of these industries evolves, we will face new integration and competition challenges. For example, as automobile manufacturers evolve in-vehicle technology, GPS tracking devices may become standard equipment in new vehicles and compete against some segments of our ability to timely and profitably develop products that are suitable for manufacturing in a cost effective manner and that meet defined product design, technical and performance specifications.
telematics or asset tracking service offerings. If we are unable to successfully manage these risks or meet required delivery specifications or deadlines in connection with one or more of our key contracts, we may lose key customers or orders and our business could be harmed.
We expectadapt to continue to depend upon only a small number of our customers for a substantial portion of our revenues. Our business could be negatively affected by an adverserapid technological change, in our dealings with these customers.
A significant portion of our net revenues come from only a few customers. For instance, sales to Verizon Wireless accounted for 52% of our revenue in 2014 and 58% of our revenue in 2013. Our revenue could be materially adversely affected if we are unable to maintain currently-existing levels of business with any of our significant customers, including Verizon Wireless, and if we are unable to offset this loss fully from alternative customers. We expect that a small number of customers will continue to account for a substantial portion of our revenue for the foreseeable future and any impairment of our relationship with, or the material financial impairment of, these customersit could adversely affect our business.
In addition, a majority of our current customers purchase our products pursuant to contracts that do not require them to purchase any specific minimum quantity of units other than the number of units ordered on an individual purchase order that might be issued to us from time to time. These customers have no contractual obligation to continue to purchase our products and if they do not continue to make purchases consistent with their historical purchase levels, our net revenue would decline if we are unable to increase sales from other existing or new customers.
In light of the limited number of leading wireless operators and OEMs that form our primary customer base, many of whom are already customers, it would be difficult to replace revenue resulting from the loss of any significant existing customer or from a material reduction in the volume of business we conduct with any significant existing customer. Consolidation among our customers may further concentrate our business to a more limited number of customers and expose us to increased risks relating to dependence on a limited number of customers; such dependence could adversely affect our operating results.
We have had to qualify, and are required to maintain, our status as a supplier for each of our customers. This is a lengthy process that involves the inspection and approval by each customer of our engineering, documentation, manufacturing and quality control procedures before that customer will place volume orders. Attempts to lessen the adverse effect of any loss of, or any material reduction in the volume of business we conduct with, any significant existing customer through the rapid addition of one or more new customers would be difficult because of these qualification requirements. Consequently, our business and operating results could be adversely affected by the loss of, or any material reduction in the volume of business we conduct with, any existing significant customer.
Any acquisitions we make could disrupt our business and harm our financial condition and results of operations.
As part of our business strategy, we review and intend to continue to review, acquisition opportunities that we believe would be advantageous or complementary to the development of our business. Based on these opportunities, we may acquire additional businesses, assets, or technologies in the future. If we make any acquisitions, we could take any or all of the following actions, any one of which could adversely affect our business, financial condition, results of operations or share price:
use a substantial portion of our available cash;
incur substantial debt, which may not be available to us on favorable terms and may adversely affect our liquidity;
issue equity or equity-based securities that would dilute existing stockholders’ percentage ownership;
assume contingent liabilities; and
take substantial charges in connection with acquired assets.
Acquired businesses may have liabilities or adverse operating issues that we fail to discover through due diligence prior to the acquisition. In particular, to the extent that prior owners of any acquired businesses or properties failed to comply with or otherwise violated applicable laws or regulations, or failed to fulfill their contractual obligations to customers, we, as the successor owner, may be financially responsible for these violations and failures and may suffer reputational harm or otherwise be adversely affected. Acquisitions also frequently result in the recording of goodwill and other intangible assets which are subject to potential impairment in the future that could harm our financial results. In addition, if we finance acquisitions by issuing convertible debt or equity securities, our existing stockholders may be diluted, which could affect the market price of
our stock. Acquisitions and/or the related equity financings could also impact our ability to utilize our net operating loss carryforwards.
Numerous other risks of engaging in acquisitions include: difficulties in assimilating acquired operations, products, technologies and personnel; unanticipated costs; diversion of management’s attention from existing operations; adverse effects on existing business relationships with suppliers and customers; risks of entering markets in which we have limited or no prior experience; and potential loss of key employees from either our existing business or the acquired organization. Acquisitions may result in substantial accounting charges for restructuring and other expenses, amortization of purchased technology and intangible assets and stock-based compensation expense, any of which could materially adversely affect our operating results. . As a result, if we fail to properly evaluate acquisitions or investments, we may not achieve the anticipated benefits of any such acquisitions, and we may incur costs in excess of what we anticipate. Even if we do properly evaluate acquisitions or investments, we may not be able to realize the anticipated benefits of, or successfully integrate with our existing business, the businesses, products, technologies or personnel that we acquire, and our failure to do so could harm our business and operating results.remain competitive.
If we fail to develop and maintain strategic relationships, we may not be able to penetrate new markets.
A key element of our business strategy is to penetrate new markets by developing new productsservice offerings through strategic relationships with industry participants in wireless communications.participants. We are currently investing, and plan to continue to invest, significant resources to develop these relationships. We believe that our success in penetrating new markets for our products will depend, in part, on our ability to develop and maintain these relationships and to cultivate additional or alternative relationships. There can be no assurance, however, that we will be able to develop additional strategic relationships, that existing relationships will survive and successfully achieve their purposes or that the companies with whom we have strategic relationships will not form competing arrangements with others or determine to compete unilaterally with us.
IfOur decision to retain the MiFi Business means that we do not properly managewill continue to depend upon Verizon Wireless for a substantial portion of our revenues, and our business would be negatively affected by an adverse change in our dealings with this customer.
Historically, as a result of the developmentsignificant revenues associated with our MiFi Business, sales to Verizon Wireless accounted for 51%, 54% and 54% of our consolidated net revenues for the years ended December 31, 2017, 2016 and 2015, respectively. While we have accelerated our engagements with prospective new MiFi customers and continue to focus on growing revenue in other parts of our business, we may experience significant strainsexpect that Verizon Wireless will continue to account for a substantial portion of our net revenues, and any impairment of our relationship with Verizon Wireless would adversely affect our business. Additionally, any change in the forecasted or actual product sell through of Verizon Wireless could have a detrimental impact on our managementrevenue, bottom line and operationscash position.
We may not be able to retain and disruptionsincrease sales to our existing customers, which could negatively impact our financial results.
We generally seek to license our solutions pursuant to customer agreements with multi-year terms and subscriptions. However, our customers have no obligation to renew these agreements after their initial term expires. We also actively seek to sell additional solutions to our existing customers. If our efforts to satisfy our existing customers are not successful, we may not be able to retain them or sell additional functionality to them and, as a result, our revenue and ability to grow could be adversely affected. Customers may choose not to renew their subscriptions for many reasons, including the belief that our service is not required for their business needs or is otherwise not cost-effective, a desire to reduce discretionary spending, or a belief that our competitors’ services provide better value. Additionally, our customers may not renew for reasons entirely out of our control, such as the dissolution of their business or an economic downturn in their industry. A significant increase in our business.
Various risks arise if companies and industries quickly evolve. Ifchurn rate would have an adverse effect on our business, or industry develops more quickly thanfinancial condition, and operating results.
A part of our growth strategy is to sell additional new features and solutions to our existing customers. Our ability to sell new features to customers will depend in significant part on our ability to respond,anticipate industry evolution, practices and standards and to continue to enhance existing solutions or introduce or acquire new solutions on a timely basis to keep pace with technological developments both within our industry and in related industries, and to remain compliant with any regulations mandated by federal agencies or state-mandated or foreign government regulations as they pertain to our customers. However, we may prove unsuccessful either in developing new features or in expanding the third-party software and products with which our solutions integrate. In addition, the success of any enhancement or new feature depends on several factors, including the timely completion, introduction and market acceptance of the enhancement or feature. Any new solutions we develop or acquire might not be introduced in a timely or cost-effective manner and might not achieve the broad market acceptance necessary to generate significant revenue. If any of our competitors implements new technologies before we are able to implement them or better anticipates the innovation and integration opportunities in related industries, those competitors may be able to provide more effective or cheaper solutions than ours.
Another part of our growth strategy is to sell additional subscriptions to existing customers as their fleet sizes increase. We cannot be assured that our customers’ fleet sizes will continue to increase. A significant decrease in our ability to meet customer demandsell existing customers additional functionality or subscriptions could have an adverse effect on our business, financial condition, and operating results.
Loss of, or a significant reduction in business from, one or more enterprise or government customers could adversely affect our revenue and profitability.
Loss of one or more of our large enterprise or government customers could result in a timelymeaningful decrease in revenue and efficient mannerprofitability, as well as a material increase in our customer churn rate. Because of the variability of industries in which our enterprise and government customers operate and the unpredictability of economic conditions in any particular industry which comprises a significant number of our enterprise or government customers, the composition of, and the volume of business from, our enterprise and government customers is likely to change over time. If we lose one or more large enterprise or government customers, or if we experience a significant reduction in business from one or more large enterprise or government customers, there is no assurance that we would be able to replace those customers to generate comparable revenue over a short time period, which could harm our operating results and profitability.
Adverse economic conditions or reduced spending on information technology solutions may adversely impact our revenue and profitability.
Uncertainty about future economic conditions makes it difficult for us to forecast operating results and to make decisions about future investments. We are unable to predict the likely duration and severity of adverse economic conditions in the United States and other countries, but the longer the duration, the greater risks we face in operating our business. We cannot assure you that current economic conditions, worsening economic conditions or prolonged poor economic conditions will not have a significant adverse impact on the demand for our solutions, and consequently on our results of operations and prospects.
The marketability of our products may suffer if wireless telecommunications operators do not deliver acceptable wireless services.
The success of our business depends, in part, on the capacity, affordability, reliability and prevalence of wireless data networks provided by wireless telecommunications operators and on which our IoT hardware products and solutions operate. Currently, various wireless telecommunications operators, either individually or jointly with us, sell our products in connection with the sale of their wireless data services to their customers. Growth in demand for wireless data access may be challenged. We may also experience development, certificationlimited if, for example, wireless telecommunications operators cease or production delays as we seekmaterially curtail operations, fail to offer services that customers consider valuable at acceptable prices, fail to maintain sufficient capacity to meet demand for wireless data access, delay the
expansion of their wireless networks and services, fail to offer and maintain reliable wireless network services or fail to market their services effectively.
Changes in practices of insurance companies in the markets in which we provide our solutions could materially and adversely affect demand for products and services.
We depend in part on the practices of insurance companies in some of our markets to support demand for certain of our products and services. For example, in South Africa, which is currently the largest market for our Ctrack products and services, insurance companies either mandate the installation of tracking devices as a prerequisite for providing insurance coverage to owners of certain vehicles, or unanticipated product requirements. Our failureprovide insurance premium discounts to properly manageencourage vehicle owners to subscribe to vehicle tracking and mobile asset recovery solutions such as ours. We benefit from this continued practice in the developments that weSouth African and certain other markets of:
accepting mobile asset location technologies such as ours as a preferred security product;
providing premium discounts for using location and recovery products and services such as ours; and
mandating the use of our products and services, or similar products and services, for certain vehicles.
If any of these policies or practices change, revenues from sale of our industry might experienceproducts and services could negatively impact our ability to execute on our operating plandecline, which would materially and accordingly, could have an adverse impact onadversely affect our business, our cash flow and results of operations and financial condition.
Reduction in regulation in certain markets may adversely impact demand for certain of our reputation withsolutions by reducing the necessity for, or desirability of, our current or potential customers.solutions.
Regulatory compliance and reporting is driven by legislation and requirements, which are often subject to change, from regulatory authorities in nearly every jurisdiction globally. For example, in the United States, fleet operators can face numerous complex regulatory requirements, including mandatory Compliance, Safety and Accountability driver safety scoring, hours of service, compliance and fuel tax reporting. The reduction in regulation in certain markets may adversely impact demand for certain of our solutions, which could materially and adversely affect our business, financial condition and results of operations.
RISKS RELATED TO DEVELOPING, MANUFACTURING AND DELIVERING OUR SOLUTIONS
We currently rely on third parties to manufacture and warehouse many of our products, which exposes us to a number of risks and uncertainties outside our control.
We currently outsource the manufacturing of many of our manufacturingproducts to companies including:including AsiaTelco Technologies Co. and Inventec Appliances Corporation, Hon Hai Precision Industry Co.Corporation. In addition, in 2016 we sold portions of our IoT modules business to Telit (as defined below), Ltd. and Benchmark Electronics. These contract manufacturers have operations in China and Thailand and, in 2011, severe flooding in Thailand caused damagewe now rely on Telit to infrastructure and factories and affectedsupply us with modules that are critical to the functionality of some of our supply of products from our contract manufacturer located in Thailand, which constrained our revenue in 2011. telematics hardware devices, including devices sold or deployed by Ctrack. If one of these third-party manufacturers were to experience delays, disruptions, capacity constraints or quality control problems in its manufacturing operations, product shipments to our customers could be delayed or rejected or our customers could consequently elect to change product demand or cancel the underlying product purchase order.subscription or service. These disruptions would negatively impact our revenues, competitive position and reputation. Further, if we are unable to manage successfully our relationship with a manufacturer, the quality and availability of products used in our productsservices and solutions may be harmed. None of our third-party manufacturers is obligated to supply us with a specific quantity of products, except as may be provided in a particular purchase order that we have submitted to, and that has been accepted by, such third-party manufacturer. Our third-party manufacturers could, under some circumstances, decline to accept new purchase orders from us or otherwise reduce their business with us. If a manufacturer stopped manufacturing our products for any reason or reduced manufacturing capacity, we may be unable to replace the lost manufacturing capacity on a timely and comparatively cost effective basis, which would adversely impact our operations. In addition, we generally do not enter into long-term contracts with our manufacturers. As a result, we are subject to price increases due to availability, and subsequent price volatility, in the marketplace of the components and materials needed to manufacture our products. If a third-party manufacturer were to negatively change the product pricing and other terms under which it agrees to manufacture for us and we were unable to locate a suitable alternative manufacturer, our manufacturing costs could significantly increase.
Because we outsource the manufacturing of all of our products, the cost, quality and availability of third-party manufacturing operations is essential to the successful production and sale of our products. Our reliance on third-party manufacturers exposes us to a number of risks which are outside our control, including:
unexpected increases in manufacturing costs;
interruptions in shipments if a third-party manufacturer is unable to complete production in a timely manner;
inability to control quality of finished products;
inability to control delivery schedules;
inability to control production levels and to meet minimum volume commitments to our customers;
inability to control manufacturing yield;
inability to maintain adequate manufacturing capacity; and
inability to secure adequate volumes of acceptable components at suitable prices or in a timely manner.
Although we promote ethical business practices and our operations personnel periodically visit and monitor the operations of our manufacturers, we do not control the manufacturers or their labor and other legal compliance practices. If our current manufacturers, or any other third-party manufacturer which we may use in the future, violate United StatesU.S. or foreign laws or regulations, we may be subjected to extra duties, significant monetary penalties, adverse publicity, the seizure and forfeiture of products that we are attempting to import or the loss of our import privileges. The effects of these factors could render the conduct of our business in a particular country undesirable or impractical and have a negative impact on our operating results.
We might forecast customer demand incorrectly and order the manufacture of excess or insufficient quantities of particular products.
We have historically placed purchase orders with our manufacturers at least three months prior to the scheduled delivery of the corresponding finished goods to our customer. In some instances, due to the length of component lead times, we might need to place manufacturing orders with our contract manufacturers solely on the basis of our receipt of a good-faith, but non-binding, customer forecast of the quantity and timing of the customer’s expected purchases from us. Accordingly, if the actual number and timing of delivery of units that a customer orders from us on the subsequently issued purchase order differs materially from the number of units we contractually ordered our manufacturer to procure component parts for, we might be unable to obtain adequate quantities of components in time to meet our customers’ binding delivery requirements or, alternatively, we might accumulate excess inventory that we are unable to timely use or resell, if at all. Our operating results and financial condition have in the past been, and may in the future be, materially adversely affected by our ability to manage our current or finished goods inventory levels, and respond to short-term or unexpected shifts in customer demand as to quantities or our customer’s product delivery schedule.
We depend on sole source suppliers for some componentsproducts used in our products.services. The availability and sale of those finished productsservices would be harmed if any of these suppliers is not able to meet our demand and production schedule and alternative suitable componentsproducts are not available on acceptable terms, ifor at all.
Our products contain a variety of components,services use hardware and software from various third parties, some of which are procured from single suppliers. These components include both tooled parts and industry-standard parts,For example, some of which are also used in cellular telephone handsets.our vehicle tracking and fleet management solutions rely on telecommunications modules procured from Telit and our MiFi mobile hotspots rely substantially on chipsets from Qualcomm. From time to time, certain components used in our products or certain products used in our solutions have been in short supply worldwide or their anticipated commercial introduction has been delayed or their availability has been subsequently interrupted for reasons outside our control. For example, some of our product components are manufactured in Japan, which experienced a significant earthquake in 2011. Although our suppliers’ facilities were undamaged, some manufacturers experienced temporary suspension of production due to power outages. If there is a shortage or interruption in the availability to us of any such components or products and we cannot timely obtain a commercially and technologically suitable substitute or make sufficient and timely design or other product modifications to permit the use of such a substitute component or product, we may not be able to timely deliver sufficient quantities of our products or solutions to satisfy our contractual obligations and may not be able to meet particular revenue expectations. Moreover, even if we timely locate a substitute part (or locate the originally specified component from a parts broker)or product, but its price materially exceeds the original cost of the component or product, then our results of operations wouldcould be adversely affected.
Our failure to predict carrier and end user customer preferences among the many evolving wireless industry standards could hurt our ability to introduce and sell new products.
In our industry, it is critical to our success that we accurately anticipate evolving wireless technology standards and that our products comply with these standards in relevant respects. We are currently focused on engineering and manufacturing products that comply with several different wireless standards. Any failure of our products to comply with any one of these or future applicable standards could prevent or delay their introduction and require costly and time-consuming engineering changes. Additionally, if an insufficient number of wireless operators or subscribers adopt the standards to which we engineer our products, then sales of our new products designed to those standards could be materially harmed.
Weakness or deterioration in global economic conditions could have a material adverse effect on our results of operations and financial condition.
As a result of weak or deteriorating economic conditions globally, we could experience lower demand for our products, which could adversely impact our results of operations.
Additionally, there could be a number of related effects on our business resulting from weak economic conditions, including the insolvency of one or more of our parts suppliers resulting in product launch or product delivery delays, customer insolvencies resulting in that customer’s inability to order products from us or pay for already delivered product, an inability on the part of our customers to obtain credit to finance purchases of our products and reduced demand by the ultimate end-users of our products.
Although we continue to monitor market conditions, we cannot predict future market conditions or their impact on demand for our products.
The sale of our products depends on the demand for broadband wireless access to enterprise networks and the internet.
The markets for broadband wireless access solutions are rapidly evolving, both technologically and competitively, and the successful sale of related products and services depends in part on the strength of the demand for wireless access to both enterprise networks and the Internet. At times, market demand for both wireless products and wireless access services for the transmission of data developed at a slower rate than we had anticipated and as a result our product sales did not generate sufficient revenue to cover our corresponding operating costs. The failure of these markets to continue to grow at the rate that we currently anticipate may adversely impact the growth in the demand for our products and, subsequently, our overall rate of growth and as a result, our business, financial condition and results of operations may be harmed.
The marketability of our products may suffer if wireless telecommunications operators do not deliver acceptable wireless services.
The success of our business depends, in part, on the capacity, affordability, reliability and prevalence of wireless data networks provided by wireless telecommunications operators and on which our products operate. Currently, various wireless telecommunications operators, either individually or jointly with us, sell our products in connection with the sale of their wireless data services to their customers. Growth in demand for wireless data access may be limited if, for example, wireless telecommunications operators cease or materially curtail operations, fail to offer services that customers consider valuable at acceptable prices, fail to maintain sufficient capacity to meet demand for wireless data access, delay the expansion of their wireless networks and services, fail to offer and maintain reliable wireless network services or fail to market their services effectively.
In addition, our future growth depends on the successful deployment of next generation wireless data networks provided by third parties, including those networks for which we are currently developing products. If these next generation networks are not deployed or widely accepted, or if deployment is delayed, there will be no market for the products we are developing to operate on these networks. If any of these events occurs, or if for any other reason the demand for wireless data access fails to grow, sales of our products will decline or remain stagnant and our business could be harmed.
Third parties may claim that our products, or components within our products, infringe on their intellectual property rights. These claims may result in substantial costs, diversion of resources and management attention, harm to our reputation or interference with our current or prospective customer or supplier relations.
Third parties have in the past claimed, and may in the future claim, that we, or our customers or suppliers, have violated their intellectual property rights. Defending an infringement or misappropriation claim, for example, regardless of the merits or success of the claim, could result in our incurring substantial legal and other costs. These claims could also divert our engineering and other human resources and management attention and cause harm to our reputation. These claims can be difficult and costly to assess and defend. A successful infringement claim related to our products could result in, among other things, our becoming liable for damages and litigation costs or unexpected and costly engineering changes to affected products.
In addition, any finding that our products infringe (or in some instances, our customer’s reasonable conclusion that a bona fide infringement claim is likely to be made with respect to such products) could have other negative consequences. Those consequences could include prohibiting us from further use of the intellectual property, causing us to have to modify our product design, if possible, so it does not infringe, or causing us to have to license the intellectual property at issue, incurring licensing fees, some of which could be retroactive. Upon a finding of infringement, we or one of our suppliers may also have to develop a non-infringing alternative, which, if available, could be costly and delay or prevent sales of affected products.
A number of putative patent infringement claims have been filed by various plaintiffs in a number of U.S. District Courts against us and/or numerous third parties, some of whom are our customers. These cases generally allege that the defendants’ use, sale and importation of specified products and/or processes constitutes infringement of certain U.S. patents allegedly
owned or exclusively licensed by each plaintiff. Under certain circumstances, we may have an obligation to indemnify and/or defend our customers against these lawsuits.
Our business depends on our continued ability to license necessary third-party technology, which we may not be able to do on commercially competitive terms, if at all.
We license technology from third parties for the development of our products. We have licensed from third parties, such as QUALCOMM, software, patents and other intellectual property for use in our products and from time to time we may elect or be required to license additional intellectual property. There can be no assurance that we will be able to maintain our third-party licenses or that these licenses or the technologies that are the subject of these licenses will not be the subject of dispute or litigation, or that additional third-party licenses will be available to us on commercially reasonable terms, if at all. The inability to maintain or obtain third-party licenses required for our products or to develop new products and product enhancements could require us to seek to obtain substitute technology of lower quality or performance standards, if such exists, or at greater cost, which could seriously harm our competitive position, revenue and prospects.
Our products, including our proprietary or third party software contained in our products, may contain errors or defects, which could prevent or decrease their market acceptance and lead to unanticipated costs or other adverse business consequences.
Our products are technologically complex and must meet stringent industry, regulatory and customer requirements. We must develop our hardware and software products quickly to keep pace with the rapidly changing and technologically advanced wireless communications market. Products as sophisticated as ours may contain undetected errors or defects, especially when first introduced or when new models or versions are released. Our products may not be free from errors or defects at the time commercial shipments have begun, which could result in the rejection of our products, the loss of an existing or potential customer or the failure to obtain one, damage to our reputation, lost revenue, diverted development resources, increased customer service and support costs, unanticipated warranty claims, and the payment of monetary damages to our customers. Furthermore, correcting problems could require additional capital expenditures, result in increased design and development costs, and force us to divert resources from other efforts. Failure to remediate problems could result in lost revenue, harm our reputation, and lead to costly warranty or other legal claims against us by our customers, and could have a material adverse impact on our financial condition and operating results.
Product liability, product replacement, or recall costs could adversely affect our business and financial performance.
We are subject to product liability and product recall claims if any of our products and services are alleged to have resulted in injury to persons or damage to property. If any of our products proves to be defective, we may need to recall and/or redesign them. In addition, any claim or product recall that results in significant adverse publicity may negatively affect our business, financial condition, or results of operations. We maintain product liability insurance, but this insurance may not adequately cover losses related to product liability claims brought against us. We may also be a defendant in class action litigation, for which no insurance is available. Product liability insurance could become more expensive and difficult to maintain and may not be available on commercially reasonable terms, if at all. In addition, we do not maintain any product recall insurance, so any product recall we are required to initiate could have a significant impact on our financial position, results of operations or cash flows.
We regularly investigate potential quality issues as partrely on third-party software and other intellectual property to develop and provide our solutions and significant increases in licensing costs or defects in third-party software could harm our business.
We rely on software and other intellectual property licensed from third parties to develop and offer our solutions. In addition, we may need to obtain future licenses from third parties to use software or other intellectual property associated with our solutions. We cannot assure you that these licenses will be available to us on acceptable terms, without significant price increases or at all. Any loss of the right to use any such software or other intellectual property required for the development and maintenance of our ongoing effort to deliver quality products tosolutions could result in delays in the provision of our customers.solutions until equivalent technology is either developed by us, or, if available from others, is identified, obtained, and integrated, which could harm our business. Any errors or defects in third-party software could result in errors or a failure of our solutions, which could harm our business.
Our quarterly operating results may vary significantly from quarter to quartersolutions integrate with third-party technologies and may causeif our stock price to fluctuate.solutions become incompatible with these technologies, our solutions would lose functionality and our customer acquisition and retention could be adversely affected.
Our future quarterly operating resultssolutions integrate with third-party software and devices to allow our solutions to perform key functions. Errors, viruses or bugs may fluctuate significantlybe present in third-party software that our customers use in conjunction with our solutions. Changes to third-party software that our customers use in conjunction with our solutions could also render our solutions inoperable. Customers may conclude that our software is the cause of these errors, bugs or viruses and may fall short ofterminate their subscriptions. The inability to easily integrate with, or exceed the expectations of securities analysts, investors or management. If this occurs, the market price of our stock could fluctuate, in some cases materially. The following factors may cause fluctuations in our operating results:
Decreases in revenue or increases in operating expenses. We budget our operating expenses based on anticipated sales, and a significant portion of our sales and marketing, research and development and general and administrative costs are fixed, at least in the short term. If revenue decreases, due to pricing pressures or otherwise, or does not increase as planned and we are unable to reduce our operating costs quickly and sufficiently, our operating results could be materially adversely affected.
Product mix. The product mix of our sales affects profit marginsany defects in, any given quarter. As our business evolves and the revenue from the product mix of our sales varies from quarter to quarter, our operating results will likely fluctuatethird-party software could result in ways that might not be directly proportionate to the fluctuationincreased costs, or in revenue.delays in
New product introductions. As we introduce new products, the timing of these introductions within any given quarter will affect our quarterly operating results. We may have difficulty predicting the timing of new product introductions and the market acceptance of these new products. If products and services are introduced earlier or
later than anticipated,software releases or if market acceptance is unexpectedly high or low, our quarterly operating results may fluctuate unexpectedly.
Lengthy sales cycle. The length of time between the date of initial contact with a potential customer and the execution of and product delivery under a contract may take several months or longer, and is subjectupdates to delays or interruptions over which we have little or no control. The sale of our products is subject to delays from, among other things, our customers’ budgeting, product testing and vendor approval mechanics, and competitive evaluation processes that typically accompany significant information technology purchasing decisions. As a result, our ability to anticipate the timing and volume of sales to specific customers is limited, and the delay or failure to complete one or more large transactions could cause our operating results to vary significantly from quarter to quarter.
Foreign currency. We are exposed to market risk from changes in foreign currency exchange rates. Our attempts to minimize the effects of volatility in foreign currencies on cash flows may not be successful.
Due to these and other factors, our results of operations may fluctuate substantially in the future and quarter-to-quarter comparisons may not be reliable indicators of future operating or share price performance.
We are subject to the risks of doing business internationally.
In addition to our manufacturing activities in Asia, weuntil such issues have staff located in Canada, China and Europe. We also sell our products outside the U.S. These international business activities expose the Company to additional business risks, including:
difficulty in managing sales, research and development operations and post-sales logistics and support across these continents;
changes in a specific country’s or region’s political or economic conditions, particularly in emerging markets, and changes in diplomatic and trade relationships;
less effective protection of intellectual property and general exposure to different legal processes, standards and expectations;
trade protection measures and import or export licensing requirements;
potentially negative consequences from changes in tax laws;
increased expenses associated with customizing products for different countries;
unexpected changes in regulatory requirements resulting in unanticipated costs and delays;
longer collection cycles and difficulties in collecting accounts receivable;
longer sales cycles;
international terrorism;
loss or damage to products in transit;
international dock strikes or other transportation delays; and
court-ordered injunctions in a given jurisdiction in connection with alleged intellectual property rights infringement by our products or components contained within our productsbeen resolved, which might prohibit the importation, sale or offer for sale of our products in the jurisdiction subject to such injunction.
Any disruption in our ability to obtain products from our foreign manufacturers or in our ability to conduct international operations and sales could have a material adverse effect on our business, financial condition, results of operations, cash flows and future prospects and could damage our reputation.
Our software may contain undetected errors, defects or other software problems, and if we fail to correct any defect or other software problems we could lose customers or incur significant costs, which could result in damage to our reputation or harm to our operating results.
Although we warrant that our software will be free of defects for various periods of time, our software platform and its underlying infrastructure are inherently complex and may contain material defects or errors. We must update our solutions quickly to keep pace with the rapidly changing market and the third-party software and devices with which our solutions integrate. We have from time to time found defects in our software and may discover additional defects in the future, particularly as we continue to migrate our product offerings to new platforms or use new devices in connection with our services and solutions. We may not be able to detect and correct defects or errors before customers begin to use our platform or its applications. Consequently, our solutions could contain undetected errors or defects, especially when first introduced or when new versions are released or when new hardware or software is integrated into our solutions. We implement bug fixes and upgrades as part of our regular system maintenance, which may lead to system downtime. Even if we are able to implement the bug fixes and upgrades in a timely manner, any history of defects or inaccuracies in the performance of our software for our customers could result in damage to our reputation or harm to our operating results.
Our solutions rely on cellular and GPS networks and any disruption, failure or increase in costs could impede our profitability and harm our financial results.
Two critical links in our current solutions are between in-vehicle devices and GPS satellites and between in-vehicle devices or customer premise equipment and cellular networks, which allow us to obtain location data and transmit it to our system. Increases in the fees charged by cellular carriers for data transmission or changes in the cellular networks, such as a cellular carrier discontinuing support of the network currently used by our in-vehicle devices or customer premise equipment, requiring retrofitting of our devices could increase our costs and impact our profitability. In addition, technologies that rely on GPS depend on the use of radio frequency bands and any modification of the permitted uses of these bands may adversely affect the functionality of GPS and, in turn, our solutions.
The mobile carriers can and will discontinue radio frequency technologies as they become obsolete. If we are unable to design our solutions into new technologies such as 4G, 4G LTE and 5G or 5G NR, our future prospects and revenues could be limited.
Any significant disruption in service on our websites or in our computer systems could damage our reputation and result in a loss of customers, which would harm our business and operating results.
Our brand, reputation, and ability to attract, retain, and serve our customers are dependent upon the reliable performance of our services and our customers’ ability to access our solutions at all times. Our customers rely on our solutions to make operating decisions related to their businesses, as well as to measure, store and analyze valuable data regarding their businesses. Our solutions are vulnerable to interruption and our data centers are vulnerable to damage or interruption from human error, intentional bad acts, computer viruses or hackers, earthquakes, hurricanes, floods, fires, war, terrorist attacks, power losses, hardware failures, systems failures, telecommunications failures, and similar events, any of which could limit our customers’ ability to access our solutions. Prolonged delays or unforeseen difficulties in connection with adding capacity or upgrading our network architecture may cause our service quality to suffer. Any event that significantly disrupts our service or exposes our data to misuse could damage our reputation and harm our business and operating results, including reducing our revenue, causing us to issue credits to customers, subjecting us to potential liability, harming our churn rates, or increasing our cost of acquiring new customers.
We host our solutions and serve our South African customers from our network servers, which are located at our data center facilities in South Africa. In other geographies, we host our solutions and serve our customers from network servers hosted by third parties, which are located at data center facilities in the United States, Europe and Australia. If these data centers are unable to keep up with our growing needs for capacity, this could have an adverse effect on our business. Our disaster recovery systems are located at third-party hosting facilities, except in South Africa where we manage our own disaster recovery system at an offsite facility. While we are increasing redundancy, our systems have not been tested under actual disaster conditions and may not have sufficient capacity to recover all data and services in the event of an outage. In the event of a disaster in which our disaster recovery systems are irreparably damaged or destroyed, we would experience interruptions in access to our products. Any changes in third-party service levels at our data centers or any errors, defects, disruptions, or other performance problems with our solutions could harm our reputation and may damage our data. Interruptions in our services might reduce our revenue, cause us to issue credits or refunds to customers, subject us to potential liability, or harm our churn rates.
We provide minimum service level commitments to certain of our customers, and our failure to meet them could require us to issue credits for future subscriptions or pay penalties, which could harm our results of operations.
Certain of our customer agreements currently, and may in the future, provide minimum service level commitments regarding items such as uptime, functionality or performance. If we are unable to meet the stated service level commitments for these customers or suffer extended periods of service unavailability, we are or may be contractually obligated to provide these customers with credits for future subscriptions, provide services at no cost, or pay other penalties which could adversely impact our revenue. We do not currently have any reserves on our balance sheet for these commitments.
Failure to maintain the security of our information and technology networks, including information relating to our customers and employees, could adversely affect us. Furthermore, if security breaches in connection with the delivery of our services allow unauthorized third parties to obtain control or access of our asset management, fleet management and telemetry solutions, our reputation, business, results of operations and financial condition could be harmed.
We are dependent on information technology networks and systems, including the Internet, to process, transmit and store electronic information and, in the normal course of our business, we collect and retain certain information pertaining to our customers and employees. The protection of customer and employee data is critical to us. We devote significant resources to addressing security vulnerabilities in our products and information technology systems, however, the security measures put in place by us cannot provide absolute security, and our information technology infrastructure may be vulnerable to criminal cyber-attacks or data security incidents due to employee or customer error, malfeasance, or other vulnerabilities. Cybersecurity attacks are increasingly sophisticated, change frequently, and often go undetected until after an attack has been launched. We may fail to identify these new and complex methods of attack, or fail to invest sufficient resources in security measures. We cannot be certain that advances in cyber-capabilities or other developments will not compromise or breach the technology protecting the networks that access our services.
If a security breach occurs, our reputation, business, results of operations and financial condition could be harmed. We may also be subject to costly notification and remediation requirements if we, or a third party, determines that we have been the subject of a data breach involving personal information of individuals. Though it is difficult to determine what harm may directly result from any specific interruption or security breach, any failure or perceived failure to maintain performance, reliability, security and availability of systems or the actual or potential theft, loss, fraudulent use or misuse of our products or the personally identifiable data of a customer or employee, could result in harm to our reputation or brand, which could lead some customers to seek to stop using certain of our services, reduce or delay future purchases of our services, use competing services, or materially and adversely affect the overall market perception of the security and reliability of our services.
RISKS RELATED TO INTERNATIONAL OPERATIONS
Due to the global nature of our operations, we are subject to political and economic risks of doing business internationally.
Our internationallargest subsidiary, Ctrack, is headquartered in South Africa and conducts business activities expose the Company to fluctuations in exchange rates betweenover 50 countries. Most of our employees are located outside the United States, dollar and international revenue represents a significant percentage of our worldwide revenue. The risks inherent in global operations include:
difficulty managing sales, product development and logistics and support across continents;
limitations on ownership or participation in local enterprises;
lack of familiarity with, and unexpected changes in, foreign currencieslaws, regulations and legal standards, including employment laws, product liability laws, privacy laws and environmental laws, which may vary widely across the countries in which we operate;
increased expense to comply with U.S. laws that apply to foreign operations, including the U.S. Foreign Corrupt Practices Act (the “FCPA”) and Office of Foreign Assets Control regulations;
compliance with, and potentially adverse tax consequences of, foreign tax regimes;
fluctuations in currency exchange rates, currency exchange controls, price controls and limitations on repatriation of earnings;
transportation delays and interruptions;
local labor laws;
collective bargaining agreements or unionization of employees;
local economic conditions;
political, social and economic instability and disruptions;
acts of terrorism and other security concerns;
government embargoes or foreign trade restrictions such as tariffs, duties, taxes or other controls;
import and export controls;
increased product development costs due to differences among countries’ safety regulations and radio frequency allocation schemes and standards;
increased expense related to localization of products and development of foreign language marketing and sales materials;
longer sales cycles;
longer accounts receivable payment cycles and difficulty in collecting accounts receivable in foreign countries;
increased financial accounting and reporting burdens and complexities;
workforce reorganizations in various locations;
restrictive employment regulations;
difficulties in staffing and managing multi-national operations;
difficulties and increased expense in implementing corporate policies and controls;
international intellectual property laws, which may be more restrictive or offer lower levels of protection than U.S. law;
compliance with differing and changing local laws and regulations in multiple international locations, including regional data privacy laws, as well as compliance with U.S. laws and regulations where applicable in these international locations; and
limitations on our ability to enforce legal rights and remedies.
If we are unable to successfully manage these and other risks associated with managing and expanding our international business, the risks could have a material adverse effect on our business, results of operations or financial condition. Further, operating in international markets requires significant management attention and financial resources. Due to the additional uncertainties and risks of doing business in foreign jurisdictions, international acquisitions tend to entail risks and require additional oversight and management attention that are typically not attendant to acquisitions made within the United States. We cannot be certain that the investment and additional resources required to establish, acquire or integrate operations in other countries will produce desired levels of revenue or profitability.
Weakness or deterioration in global economic conditions or jurisdictions where we have significant foreign operations could have a material adverse effect on our results of operations and financial condition.
As a result of weak or deteriorating economic conditions globally, or in certain jurisdictions where we have significant foreign operations such as South Africa, we could experience lower demand for our products, which could adversely impact our results of operations. Additionally, there could be a number of related effects on our business resulting from weak economic conditions, including the insolvency of one or more of our suppliers resulting in product launch or product delivery delays, customer insolvencies resulting in that customer’s inability to order products from us or pay for already delivered products, and reduced demand by the ultimate end-users of our products. Although we continue to monitor market conditions, we cannot predict future market conditions or their impact on demand for our products.
Fluctuations in foreign currency exchange rates, especially the South African Rand against the U.S. Dollar, could adversely affect our operating results.results of operations.
A significant portion of our revenues are generated from sales agreements denominated in foreign currencies, and we expect to enter into additional such agreements as we expand our international customer base. In addition, we employ a significant number of employees outside the United States, and the associated employment and facilities costs are denominated in foreign currencies. As a result, we are exposed to changes in foreign currency exchange rates. We have particularly large exposure in South Africa where our Ctrack subsidiary is headquartered and the costs of operating in South Africa are subject to the effects of exchange fluctuations of the South African Rand against the U.S. Dollar. Fluctuations in the value of foreign currencies, particularly the South African Rand against the U.S. Dollar, will create greater uncertainty in our revenues and can significantly and adversely affect our operating results.
We do not currently employ any vehicles as a hedge against currency fluctuations, however, we may decide to use hedging vehicles in the future. At times, we may attempt to manage thisthe risk associated with currency changes, in part, by minimizing the effects of volatility on cash flows by identifying forecasted transactions exposed to these risks, and usingor we may decide to use hedging vehicles such as foreign exchange forward contracts. Since there is a high correlation between the hedging instruments and the underlying exposures, the gains and losses on these underlying exposures are generally offset by reciprocal changes in the value of the hedging instruments. We may use derivative financial instruments as risk management tools and not for trading or speculative purposes. Nevertheless, there can be no assurance that we will not incur foreign
currency losses or that foreign exchange forward contracts we may enter into to reduce the risk of such losses will be successful.
We may not be able to maintain and expand our business if we are not able to hire, retain and manage additional qualified personnel.RISKS RELATED TO REGULATIONS, TAXATION AND ACCOUNTING MATTERS
Our success in the future depends in part on the continued contribution ofsubstantial international operations may increase our executive, technical, engineering, sales, marketing, operationsexposure to potential liability under anti-corruption, trade protection, tax and administrative personnel. Recruitingother laws and retaining skilled personnel in the wireless communications industry, including softwareregulations.
The FCPA and hardware engineers, is highly competitive. The success of any acquisition also depends in part onother anti-corruption laws and regulations (“Anti-Corruption Laws”) prohibit corrupt payments by our retention and integration of key personnel from the acquired companyemployees, vendors or business.
Althoughagents. From time to time, we may enter into employment agreements with members of our senior management and other key personnel, these arrangements do not prevent any of our management or key personnelreceive inquiries from leaving the company. If we are not able to attract or retain qualified personnel in the future, or if we experience delays in hiring required personnel, particularly qualified engineers, we may not be able to maintain and expand our business.
System security risks, data protection breaches, cyber-attacks and systems integration issues could disrupt our internal operations or information technology services provided to customers, and any such disruption could reduce our expected revenue, increase our expenses, damage our reputation and adversely affect our stock price.
Experienced computer programmers and hackers may be able to penetrate our network security and misappropriate or compromise our confidential information or that of third parties, create system disruptions or cause shutdowns. Computer programmers and hackers also may be able to develop and deploy viruses, worms, and other malicious software programs that attack our products or otherwise exploit any security vulnerabilities of our products. In addition, sophisticated hardware and software and applications that we produce or procure from third parties may contain defects in design or manufacture, including “bugs” and other problems that could unexpectedly interfere with the operation of our or our customers’ systems. The costs to us to eliminate or alleviate cyber or other security problems, bugs, viruses, worms, malicious software programs and security vulnerabilities could be significant, and our efforts to address these problems may not be successful and could result in interruptions, delays, cessation of service and loss of existing or potential customers that may impede our sales, manufacturing, distribution or other critical functions.
We manage and store various proprietary information and sensitive or confidential data relating to our business. Breaches of our security measures or the accidental loss, inadvertent disclosure or unapproved dissemination of proprietary information or sensitive or confidential data about us or our clients, including the potential loss or disclosure of such information or data as a result of fraud, trickery or other forms of deception, could expose us or our affected customers to a risk of loss or misuse of this information, result in litigation and potential liability for us, damage our brand and reputation, or otherwise harm our business. In addition, the cost and operational consequences of implementing further data protection measures could be significant.
Portions of our IT infrastructure also may experience interruptions, delays or cessations of service, or produce errors in connection with systems integration or migration work that takes place from time to time. We may not be successful in implementing new systems and transitioning data, which could cause business disruptions and be more expensive, time consuming, disruptive and resource-intensive. Such disruptions could adversely impact our ability to fulfill orders and interrupt other processes. Delayed sales, lower margins or lost customers resulting from these disruptions have in the past adversely affected, and in the future could adversely affect, our financial results, stock price and reputation.
We may not be able to develop products that comply with applicable government regulations.
Our products must comply with government regulations. For example,authorities in the United States and elsewhere about our business activities outside of the Federal Communications Commission, or FCC, regulates many aspects of communications devices, including radiation of electromagnetic energy, biological safetyUnited States and rules for devices to be connected to telephone networks. In addition to the federal government, some states have adopted regulations applicableour compliance with Anti-Corruption Laws. While we devote substantial resources to our products. Radio frequency devices, which includeglobal compliance programs and have implemented policies, training and internal controls designed to reduce the risk of corrupt payments, our modems, mustemployees, vendors or agents may violate our policies.
Our failure to comply with Anti-Corruption Laws could result in significant fines and penalties, criminal sanctions against us, our officers or our employees, prohibitions on the conduct of our business, and damage to our reputation. Operations outside of the United States may be approvedaffected by obtaining equipment authorization from the FCC prior to being offered for sale. Regulatory requirementschanges in Canada, Europe, Asiatrade protection laws, policies and measures, and other jurisdictions must alsoregulatory requirements affecting trade and investment.
As a result of our international operations we are subject to foreign tax regulations. Such regulations may not be met. Additionally, we cannot anticipateclear, not consistently applied and subject to sudden change, particularly with regard to international transfer pricing. Our earnings could be reduced by the effect that changesuncertain and changing nature of such tax regulations.
Our software contains encryption technologies, certain types of which are subject to U.S. and foreign export control regulations and, in domesticsome foreign countries, restrictions on importation and/or use. Any failure on our part to comply with encryption or other applicable export control requirements could result in financial penalties or other sanctions under the U.S. or foreign export regulations, including restrictions on future export activities, which could harm our business and operating results. Regulatory restrictions could impair our access to technologies needed to improve our solutions and may also limit or reduce the demand for our solutions outside of the United States.
If we do not achieve applicable black economic empowerment objectives in our South African businesses, we risk not being able to renew certain of our existing contracts which service South African government regulations mayand quasi-governmental customers, as well as not being awarded future corporate and governmental contracts which would result in the loss of revenue.
The South African government, through the Broad-Based Black Economic Empowerment Act, No. 53 of 2003, and the codes of good practice and industry charters published pursuant thereto (collectively “BBBEE”), has established a legislative framework for the promotion of broad-based black economic empowerment. Achievement of BBBEE objectives is measured by a scorecard which establishes a weighting for the various components of BBBEE. BBBEE objectives are pursued in significant part by requiring parties who contract with corporate, governmental or quasi-governmental entities in South Africa to achieve BBBEE compliance through satisfaction of an applicable scorecard. Parties improve their BBBEE score when contracting with businesses that have onearned good BBBEE ratings in relation to their scorecards (this includes black-owned businesses).
Ctrack has material contracts with governmental entities that require it to maintain minimum BBBEE rating levels as measured under the BBBEE scorecard. Failure to achieve applicable BBBEE objectives could jeopardize our ability to develop and sell products in the future. Failure to comply withmaintain existing or evolving government regulationsbusiness or to obtain timely regulatory approvalssecure future business from these and other corporate, governmental or certificates for our productsquasi-governmental customers that could materially and adversely affect our business, financial condition and results of operations or cash flows.operations.
Failure or circumventionWe are required to comply with South African labor laws with respect to certain of our controlsemployees and proceduresface the risk of disruption from labor disputes in South Africa, which could seriously harmresult in additional operating costs.
South African laws relating to labor that regulate work time, provide for mandatory compensation in the event of termination of employment for operational reasons, and impose monetary penalties for non-compliance with administrative and reporting requirements in respect of affirmative action policies, could result in additional operating costs. In addition, future changes to South African legislation and regulations relating to labor may increase our business.
Any system of controlcosts or alter our relationship with our employees and procedures, however well designedresult in labor disruptions. Resulting disruptions could materially and operated, is based in part on certain assumptions and can provide only reasonable, and not absolute, assurances that the objectives of the controls and procedures are met. Acquired companies or businesses are likely to have different standards, controls, contracts, procedures and policies, making it more difficult to implement and harmonize company-wide financial, accounting, billing, information and other systems. Acquisitions of privately held companies and/or non-US companies are particularly challenging because their prior practices in these areas may not meet the requirements of the Sarbanes-Oxley Act or public accounting standards. The failure or
circumvention of our controls, policies and procedures could have a material adverse effect onadversely affect our business, results of operations and financial position.condition.
Evolving regulations and changes in applicable laws relating to data privacy may increase our expenditures related to compliance efforts or otherwise limit the solutions we can offer, which may harm our business and adversely affect our financial condition.
Our products and solutions enable us to collect, manage and store a wide range of data related to vehicle tracking and fleet management such as vehicle location and fuel usage, speed and mileage. Some of the data we collect or use in our business is subject to data privacy laws, which are complex and increase our cost of doing business. The U.S. federal government and various state governments have adopted or proposed limitations on the collection, distribution and use of personal information. Many foreign jurisdictions, including the European Union and the United Kingdom, have adopted legislation (including directives or regulations) that increase or change the requirements governing data collection and storage in these jurisdictions. Ctrack markets its products in over 50 countries, and accordingly, we are subject to many different, and potentially conflicting, privacy laws. If our privacy or data security measures fail to comply, or are perceived to fail to comply, with current or future laws and regulations, we may be subject to litigation, regulatory investigations or other liabilities.
Moreover, if future laws and regulations limit our ability to use and share this data or our ability to store, process and share data with our clients over the Internet, demand for our solutions could decrease and our costs could increase. We might also have to limit the manner in which we collect information, the types of information that we collect, or the solutions we offer. Any of these could materially and adversely affect our business, results of operations and financial condition.
We previously identified a material weakness in our internal control over financial reporting, which has now been remediated. If we fail to maintain an effective system of internal controls over financial reporting, we may not be able to report our financial results timely and accurately, which could adversely affect investor confidence in the Company, and in turn, our results of operations and our stock price.
Effective internal controls are necessary for us to provide reliable financial reports and operate successfully as a public company. Section 404 of the Sarbanes-Oxley Act of 2002 requires that companies evaluate and report on their systems of internal control over financial reporting. In addition, our independent registered public accounting firm must report on its evaluation of those controls.
As disclosed in our Form 10-K for the year ended December 31, 2016, we previously identified a material weakness in our internal controls over financial reporting specifically from a lack of sufficient resources in key accounting and financial reporting roles within the organization necessary to prepare financial statements in time to meet regulatory filing requirements. This lack of sufficient resources was the result of a significant number of unusual and one-time challenges to the Company’s personnel and financial reporting processes, including, but not limited to, implementing an internal reorganization, preparing for the anticipated divestiture of the MiFi Business and closure of the Company’s accounting function in Eugene, Oregon. We completed our remediation efforts related to these material weaknesses by, among other things, updating our U.S. GAAP financial statement close process to ensure timely submission and completeness of subsidiary financial information and enhancing electronic communication to include a list of deliverables and checklists to use as a reference tool during our interim and year-end reporting periods.
Although we have remediated this material weakness in our internal controls over financial reporting, any failure to maintain effective internal controls could cause a delay in compliance with our reporting obligations, SEC rules and regulations or Section 404 of the Sarbanes-Oxley Act of 2002, which could subject us to a variety of administrative sanctions, including, but not limited to, SEC enforcement action, ineligibility for short form registration, the suspension or delisting of our common stock from the stock exchange on which it is listed and the inability of registered broker-dealers to make a market in our common stock, which could adversely affect our business and the trading price of our common stock.
If the accounting estimates we make, and the assumptions on which we rely, in preparing our financial statements prove inaccurate, our actual results may be adversely affected.
Our financial statements have been prepared in accordance with accounting principles generally accepted in the United States. The preparation of these financial statements requires us to make estimates and judgments about, among other things, allowance for doubtful accounts receivable, provision for excess and obsolete inventory, valuation of intangible and long-lived assets, valuation of goodwill, valuation of debt obligations, royalty costs, accruals relating to litigation and restructuring, provision for warranty costs, income taxes, share-based compensation expense and the Company’s ability to continue as a going concern. These estimates and judgments affect the reported amounts of our assets, liabilities, revenues and expenses, the amounts of charges accrued by us, and related disclosure of contingent assets and liabilities. We base our estimates on historical experience and on various other assumptions that we believe to be reasonable under the circumstances and at the time they are made. If our estimates or the assumptions underlying them are not correct, actual results may differ materially from our estimates and we may need to, among other things, accrue additional charges that could adversely affect our results of operations, which in turn could adversely affect our stock price. In addition, new accounting pronouncements and
interpretations of accounting pronouncements have occurred and may occur in the future that could adversely affect our reported financial results.
Any changes to the accounting systems or new accounting system implementations may be ineffective or cause delays in our ability to provide timely financial results
A change in the Company’s accounting systems or new accounting system implementations could cause trial balance to drift out of balance or hinder the reconciliation of items which are time consuming to diagnose, impacting our ability to provide timely audited and unaudited financial results. Any such change could have a significant impact on the effectiveness of our system of internal controls and could cause a delay in compliance with our reporting obligations, which could adversely affect our business and the trading price of our common stock.
Any changes to existing accounting pronouncements or taxation rules or practices may cause adverse fluctuations in our reported results of operations or affect how we conduct our business.
A change in accounting pronouncements or taxation rules or practices can have a significant effect on our reported results and may affect our reporting of transactions completed before the change is effective. New accounting pronouncements, taxation rules and varying interpretations of accounting pronouncements or taxation rules have occurred in the past and may occur in the future. The change to existing rules, future changes, if any, or the need for us to modify a current tax position may adversely affect our reported financial results or the way we conduct our business.
RISKS RELATED TO OWNING OUR SECURITIES
Our share price has been highly volatile in the past and could be highly volatile in the future.
The market price of our common stock can be highly volatile due to the risks and uncertainties described in this report, as well as other factors, including: comments by securities analysts; announcements by us or others regarding, among other things, operating results, additions or departures of key personnel, and acquisitions or divestitures; additional equity or debt financing; technological innovations; introductions of new products; litigation; price and volume fluctuations in the overall stock market, and particularly with respect to market prices and trading volumes of other high technology stocks; and our failure to meet market expectations.
In addition, the stock market has from time to time experienced extreme price and volume fluctuations that were unrelated to the operating performance of particular companies. In the past, companies that have experienced volatility have sometimes subsequently become the subject of securities class action litigation. If litigation were instituted on this basis, it could result in substantial costs and a diversion of management’s attention and resources.
Our future capital needs are uncertain and we may need to raise additional funds in the future. We may not be able to raise such additional funds on acceptable terms or at all.
We may need to raise substantial additional capital in the future to fund our operations, develop and commercialize new products and solutions or acquire companies. If we require additional funds in the future, we may not be able to obtain those funds on acceptable terms, or at all. If we raise additional funds by issuing equity securities, our stockholders may experience dilution. Debt financing, if available, may involve covenants restricting our operations or our ability to incur additional debt. Any debt or additional equity financing that we raise may contain terms that are not favorable to us or our stockholders. In addition, restrictions in our existing debt agreements may limit the amount and/or type of indebtedness that we are able to incur.
If we do not have, or are not able to obtain, sufficient funds, we may have to delay development or commercialization of our products and solutions, liquidate some or all of our assets, or delay, reduce the scope of or eliminate some or all of our sales and marketing expansion programs. Any of these actions could harm our operating results.
If financial or industry analysts do not publish research or reports about our business, or if they issue negative or misleading evaluations of our stock, our stock price and trading volume could decline.
The trading market for our common stock will be influenced by the research and reports that industry or financial analysts publish about us or our business. We do not control these analysts or the content and opinions included in their reports. If one or more of the analysts who cover us were to adversely change their recommendation regarding our stock, or provide more favorable relative recommendations about our competitors, our stock price could decline. If one or more of the analysts who cover us cease coverage of our company or fail to publish reports on us regularly, we could lose visibility in the financial markets, which in turn could cause our stock price or trading volume to decline.
Future issuances of our common stock to holders of warrants may materially and adversely affect the price of our common stock and cause dilution to our existing stockholders.
As of December 31, 2017, we had outstanding warrants to purchase 1,886,630 shares of our common stock. These warrants are generally only exercisable on a cash basis, but may be exercised on a cashless basis if and only if a registration statement relating to the issuance of the shares underlying the warrants is not then effective or an exemption from registration is not available for the resale of such shares. Any such net exercise will dilute the ownership interests of existing stockholders without any corresponding benefit to the Company of a cash payment for the exercise price of such warrant.
Future settlements of any conversion obligations with respect to the Inseego Notes may result in dilution to existing stockholders, lower prevailing market prices for our common stock or require a significant cash outlay.
Prior to December 15, 2021, holders may convert their Inseego Notes only if certain conditions are met. On or after December 15, 2021, until close of business on the business day immediately preceding the maturity date, holders may convert their Inseego Notes at any time. The Inseego Notes are convertible into cash, shares of the Company’s common stock, or a combination thereof, at the election of the Company, and are initially convertible into 25,478,728 shares of the Company’s common stock, based on an initial conversion rate of 212.7660 shares of common stock per $1,000 principal amount of Inseego Notes (which is equivalent to an initial conversion price of $4.70 per share of common stock). The conversion rate is subject to adjustment if certain events occur, but in no event will the conversion rate exceed 387.5968 shares of common stock per $1,000 principal amount of Inseego Notes (which is equivalent to a conversion price of $2.58 per share of common stock). If we elect to settle conversions of the Inseego Notes with common stock, this may cause significant dilution to our existing stockholders. Any sales in the public market of the common stock issued upon such conversion could adversely affect prevailing market prices of our common stock. If we do not elect to settle conversion of the Inseego Notes solely with common stock, we would be required to settle a portion, or all, of our conversion obligation through the payment of cash, which could adversely affect our liquidity.
Certain provisions in the Inseego Indenture could delay or prevent an otherwise beneficial takeover or takeover attempt of us.
Certain provisions in the Inseego Indenture could make it more difficult or more expensive for a third party to acquire us. For example, if a takeover would constitute a fundamental change, holders of the Inseego Notes will have the right to require us to repurchase their Inseego Notes in cash. In addition, if a takeover constitutes a make-whole fundamental change (as defined in the Inseego Indenture), we may be required to increase the conversion rate for holders who convert their Inseego Notes in connection with such takeover. In either case, and in other cases, our obligations under the Inseego Notes and the Inseego Indenture could increase the cost of acquiring us or otherwise discourage a third party from acquiring us.
Item 1B. Unresolved Staff Comments
None.
Item 2. Properties
Our principal executive offices are located in San Diego, California where we lease approximately 96,00021,000 square feet under an arrangement that expires in December 2016.2019 and approximately 12,000 square feet under an arrangement that expires in June 2020. We also currently lease approximately 21,00014,000 square feet in Richardson, TexasEugene, Oregon under a lease arrangement that expires in June 2020.January 2023, and own property in Centurion, South Africa with approximately 28,000 square feet. We further lease space in various geographic locations abroad primarily for sales and support personnel, for research and development, or for temporary facilities. We believe that our existing facilities are adequate to meet our current needs and that we can renew our existing leases or obtain alternative space on terms that would not have a material impact on our financial condition.
Item 3. Legal Proceedings
On May 27, 2015, a patent infringement action was brought against Novatel Wireless by Carucel, a non-practicing entity, seeking approximately $43.0 million in royalties and damages related to past sales of MiFi mobile hotspots (Carucel Investments, L.P. v. Novatel Wireless, Inc., et al., U.S.D.C. S.D. Florida, Civil Action No. 0:15-cv-61116-BB). The complaint alleged that certain MiFi mobile hotspots manufactured by Novatel Wireless infringed claims of patents owned by Carucel. On April 10, 2017, judgment was entered in favor of Novatel Wireless. Carucel has filed to appeal certain orders in the litigation. The Company does not believe there is merit to an appeal by Carucel and intends to vigorously defend the appeal. However, there can be no assurance as to the ultimate outcome of any appeal or other future judgment in this case, and an adverse judgment could have a material adverse effect on the Company’s consolidated results of operations or financial condition.
On May 11, 2017, the Company initiated a lawsuit against the former stockholders of RER in the Court of Chancery of the State of Delaware seeking recovery of damages for civil conspiracy, fraud in the inducement, unjust enrichment and breach of fiduciary duty. The Company has suspended payments owed to the former stockholders of RER under an earn-out arrangement, pursuant to which the Company would have been required to pay an additional $15.8 million in cash and 1.9 million shares of the Company’s common stock pending the outcome of this litigation. There can be no assurance as to the ultimate outcome of the future judgment in this case, and an adverse judgment could have a material adverse effect on the Company’s consolidated results of operations or financial condition.
We are engaged in numerousother legal actions arising in the ordinary course of our business and,business. In general, while there can be no assurance, we believe that the ultimate outcome of these other legal actions will not have a material adverse effect on our business, results of operations, financial condition or cash flows.
The disclosure in Note 13, “Commitments12, Commitments and Contingencies”, in the accompanying consolidated financial statements includes a discussion of our legal proceedings and is incorporated herein by reference.
Item 4. Mine Safety Disclosures
None.
PART II
Item 5. Market for Registrant’s Common Equity, Related Stockholder Matters and Issuer Purchases of Equity Securities
Common Stock Data
Shares of our common stock are currently quoted and traded on The Nasdaq Global Select Market under the symbol “MIFI”“INSG” and, prior to October 15, 2014,November 9, 2016, were quoted on The Nasdaq Global Select Market under the symbol “NVTL”“MIFI”. The following table sets forth, for the periods indicated, the high and low sales prices of our common stock as reported by The Nasdaq Global Select Market.
| | | | High ($) | | Low ($) | High ($) | | Low ($) |
| 2014 | | | | |
| 2017 | | | | |
| First quarter | 3.40 |
| | 1.66 |
| $ | 3.23 |
| | $ | 2.08 |
|
| Second quarter | 2.18 |
| | 1.51 |
| $ | 2.43 |
| | $ | 0.87 |
|
| Third quarter | 3.91 |
| | 1.67 |
| $ | 1.84 |
| | $ | 1.01 |
|
| Fourth quarter | 3.76 |
| | 2.26 |
| $ | 2.01 |
| | $ | 1.26 |
|
| 2013 | | | | |
| 2016 | | | | |
| First quarter | 2.44 |
| | 1.27 |
| $ | 1.79 |
| | $ | 0.84 |
|
| Second quarter | 4.14 |
| | 1.90 |
| $ | 1.82 |
| | $ | 1.06 |
|
| Third quarter | 4.43 |
| | 2.57 |
| $ | 3.80 |
| | $ | 1.40 |
|
| Fourth quarter | 3.36 |
| | 1.95 |
| $ | 3.18 |
| | $ | 2.22 |
|
Number of Stockholders of Record
Our outstanding capital stock consists of a single class of common stock. As of March 3, 2015,8, 2018, there were approximately 4335 holders of record of our common stock. Because many of the shares of our common stock are held by brokers and other institutions on behalf of stockholders, we are unable to estimate the total number of stockholders represented by these record holders.
Dividends
We have never declared or paid cash dividends on any shares of our capital stock. We currently intend to retain all available funds for use in the operation and development of our business and, therefore, do not anticipate paying any cash dividends in the foreseeable future. Any future determination relating to our dividend policy will be made at the discretion of our boardBoard of directorsDirectors and will depend on a number of factors, including future earnings, capital requirements, financial condition and future prospects and other factors the boardBoard of directorsDirectors may deem relevant. UnderIn addition, both the termsCredit Agreement and the Inseego Indenture contain covenants that limit the ability of the Company to pay cash dividends.
During the first quarter of 2018, our $25 million senior secured revolving credit facility with Wells Fargo Bank, NA, we are prohibited from declaringBoard of Directors authorized and declared a dividend distribution of one preferred stock purchase right (“Right”) under certain circumstances for each share of the Company’s common stock authorized and outstanding on February 2, 2018. Each Right entitles the holder to purchase one one-thousandth of a share of Series D Preferred Stock, par value $0.001 per share, at a purchase price of $10.00, subject to adjustments.Prior to exercise, the Rights do not give their holders any rights as a stockholder, including any dividend, voting or paying any cash dividends on our common stock.liquidation rights. The Rights will expire if the Company’s stockholders fail to approve the Rights Agreement at the Company’s 2018 Annual Meeting of Stockholders.
Performance Graph
The following graph compares the cumulative total stockholder return on the Company’s common stock between December 31, 20092012 and December 31, 20142017 with the cumulative total return of (i) the Nasdaq Stock Market (U.S.) Index, or the Nasdaq Composite Index, and (ii) the Nasdaq Telecommunications Index, or the Nasdaq Telecom Index, over the same period. This graph assumes the investment of $100.00 on December 31, 20092012 in the common stock of the Company, the Nasdaq Composite Index and the Nasdaq Telecom Index and assumes the reinvestment of any dividends. The stockholder return shown on the graph below should not be considered indicative of future stockholder returns and the Company will not make or endorse any predictions as to future stockholder returns.
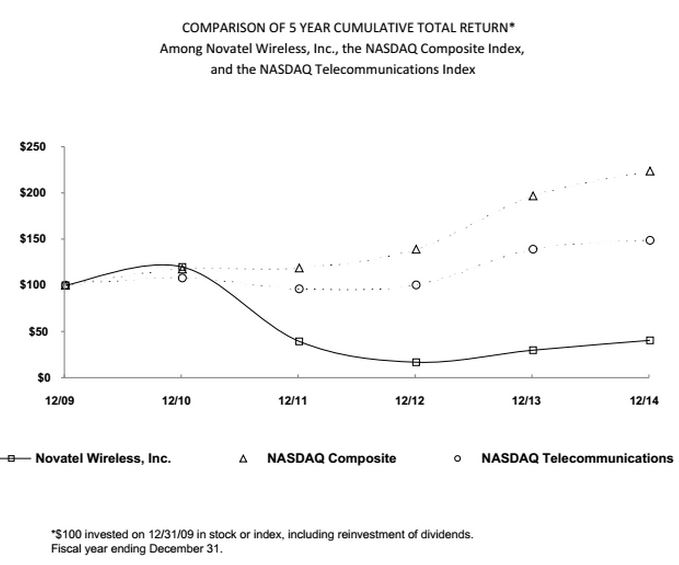
|
| | | | | | | | | | | | | | | | | |
| | Cumulative Total Return |
| | 12/09 | | 12/10 | | 12/11 | | 12/12 | | 12/13 | | 12/14 |
| Novatel Wireless, Inc. | 100.00 |
| | 119.82 |
| | 39.27 |
| | 16.69 |
| | 29.74 |
| | 40.40 |
|
| NASDAQ Composite | 100.00 |
| | 117.61 |
| | 118.70 |
| | 139.00 |
| | 196.83 |
| | 223.74 |
|
| NASDAQ Telecommunications | 100.00 |
| | 107.95 |
| | 96.16 |
| | 100.40 |
| | 139.11 |
| | 148.69 |
|
Unregistered Sales of Equity Securities
None, except as to (i) the description of our issuance of unregistered shares of common stock in connection with the settlement of our recent stockholder litigation and (ii) the description of our sale and issuance of common stock, shares of our Series C Convertible Preferred Stock, par value $0.001 per share (the “Series C Preferred Stock”) and a warrant to purchase 4,117,647 shares of our common stock at an exercise price of $2.26 per share (the “Warrant”), aspreviously disclosed in ourthe Company’s Quarterly Reports on Form 10-Q, Current Reports on Form 8-K filed on July 2, 2014 and September 8, 2014, respectively, eachor as set forth below.
On November 17, 2017, the Company issued 68,966 shares of which is incorporated hereinunregistered common stock to a former employee in a single transaction in connection with a severance agreement with said former employee. The shares were issued to the recipient in an exempt transaction pursuant to Section 4(2) of the Securities Act. No cash proceeds were received by reference.the Company in connection with the issuance.
Item 6. Selected Financial Data
The following selected financial data should be read in conjunction with our consolidated financial statements and the related notes and “Management’s Discussion and Analysis of Financial Condition and Results of Operations” appearing elsewhere in this report. The selected consolidated statements of operations data presented below for each of the years ended December 31, 2014, 20132017, 2016 and 2012,2015, and the consolidated balance sheet data at December 31, 20142017 and 20132016 are derived from our consolidated financial statements included elsewhere in this report. The selected consolidated statements of operations data for the years ended December 31, 20112014 and 20102013 and consolidated balance sheet data at December 31, 2012, 20112015, 2014 and 20102013 are derived from the audited consolidated financial statements not included in this report.
| | | | Year Ended December 31, | Year Ended December 31, |
| | 2014 | | 2013 | | 2012 | | 2011 | | 2010 | 2017 | | 2016 | | 2015 | | 2014 | | 2013 |
| | (in thousands, except per share data) | | | | | | | | | |
| Consolidated Statements of Operations Data: | | | | | | | | | | (in thousands, except share and per share data) |
| Net revenues | $ | 185,245 |
| | $ | 335,053 |
| | $ | 344,288 |
| | $ | 402,862 |
| | $ | 338,942 |
| $ | 219,297 |
| | $ | 243,555 |
| | $ | 220,942 |
| | $ | 185,245 |
| | $ | 335,053 |
|
| Cost of net revenues | 148,198 |
| | 266,759 |
| | 271,845 |
| | 318,270 |
| | 272,648 |
| 151,962 |
| | 167,227 |
| | 161,989 |
| | 148,198 |
| | 266,759 |
|
| Gross profit | 37,047 |
| | 68,294 |
| | 72,443 |
| | 84,592 |
| | 66,294 |
| 67,335 |
| | 76,328 |
| | 58,953 |
| | 37,047 |
| | 68,294 |
|
| Operating costs and expenses: | | | | | | | | | | | | | | | | | | |
| Research and development | 34,314 |
| | 48,246 |
| | 60,422 |
| | 61,392 |
| | 48,906 |
| 21,362 |
| | 30,655 |
| | 35,446 |
| | 34,314 |
| | 48,246 |
|
| Sales and marketing | 13,792 |
| | 20,898 |
| | 27,501 |
| | 29,830 |
| | 20,978 |
| 25,019 |
| | 29,782 |
| | 20,899 |
| | 13,792 |
| | 20,898 |
|
| General and administrative | 15,402 |
| | 24,179 |
| | 22,668 |
| | 21,600 |
| | 21,233 |
| 34,415 |
| | 52,387 |
| | 34,452 |
| | 15,402 |
| | 24,179 |
|
| Goodwill and intangible assets impairment | — |
| | — |
| | 49,521 |
| | 3,277 |
| | — |
| |
| Amortization of purchased intangible assets | 562 |
| | 562 |
| | 1,074 |
| | 2,220 |
| | 179 |
| 3,601 |
| | 3,927 |
| | 2,126 |
| | 562 |
| | 562 |
|
| Impairment of purchased intangible assets | | — |
| | 2,594 |
| | — |
| | — |
| | — |
|
| Shareholder litigation loss | 790 |
| | 14,326 |
| | — |
| | — |
| | — |
| — |
| | — |
| | — |
| | 790 |
| | 14,326 |
|
| Restructuring charges | 7,760 |
| | 3,304 |
| | — |
| | — |
| | — |
| |
| Restructuring charges, net of recoveries | | 5,152 |
| | 1,987 |
| | 3,821 |
| | 7,760 |
| | 3,304 |
|
| Total operating costs and expenses | 72,620 |
| | 111,515 |
| | 161,186 |
| | 118,319 |
| | 91,296 |
| 89,549 |
| | 121,332 |
| | 96,744 |
| | 72,620 |
| | 111,515 |
|
| Operating loss | (35,573 | ) | | (43,221 | ) | | (88,743 | ) | | (33,727 | ) | | (25,002 | ) | (22,214 | ) | | (45,004 | ) | | (37,791 | ) | | (35,573 | ) | | (43,221 | ) |
| | | | | | | | | | | |
| Other income (expense): | | | | | | | | | | | | | | | | | | |
| Change in fair value of warrant liability | (3,280 | ) | | — |
| | — |
| | — |
| | — |
| — |
| | — |
| | — |
| | (3,280 | ) | | — |
|
| Non-cash change in acquisition-related escrow | | — |
| | — |
| | (8,286 | ) | | — |
| | — |
|
| Interest income (expense), net | (85 | ) | | 113 |
| | 291 |
| | 384 |
| | (2,518 | ) | (19,332 | ) | | (15,597 | ) | | (7,164 | ) | | (85 | ) | | 113 |
|
| Other expense, net | (167 | ) | | (222 | ) | | (203 | ) | | (1,052 | ) | | 1,963 |
| |
| Other income (expense), net | | (4,080 | ) | | 414 |
| | 1,128 |
| | (167 | ) | | (222 | ) |
| Loss before income taxes | (39,105 | ) | | (43,330 | ) | | (88,655 | ) | | (34,395 | ) | | (25,557 | ) | (45,626 | ) | | (60,187 | ) | | (52,113 | ) | | (39,105 | ) | | (43,330 | ) |
| Income tax provision | 124 |
| | 83 |
| | 611 |
| | (9,503 | ) | | 7,893 |
| 214 |
| | 381 |
| | 181 |
| | 124 |
| | 83 |
|
| Net loss | (39,229 | ) | | (43,413 | ) | | (89,266 | ) | | (24,892 | ) | | (33,450 | ) | (45,840 | ) | | (60,568 | ) | | (52,294 | ) | | (39,229 | ) | | (43,413 | ) |
| Less: Net loss (income) attributable to noncontrolling interests | | 105 |
| | (5 | ) | | 8 |
| | — |
| | — |
|
| Net loss attributable to Inseego Corp. | | (45,735 | ) | | (60,573 | ) | | (52,286 | ) | | (39,229 | ) | | (43,413 | ) |
| Recognition of beneficial conversion feature | (445 | ) | | — |
| | — |
| | — |
| | — |
| — |
| | — |
| | — |
| | (445 | ) | | — |
|
| Net loss attributable to common shareholders | $ | (39,674 | ) | | $ | (43,413 | ) | | $ | (89,266 | ) | | $ | (24,892 | ) | | $ | (33,450 | ) | $ | (45,735 | ) | | $ | (60,573 | ) | | $ | (52,286 | ) | | $ | (39,674 | ) | | $ | (43,413 | ) |
| Net loss per share attributable to common shareholders: | | | | | | | | | | | | | | | | | | |
| Basic and diluted | $ | (1.05 | ) | | $ | (1.28 | ) | | $ | (2.72 | ) | | $ | (0.78 | ) | | $ | (1.06 | ) | $ | (0.78 | ) | | $ | (1.12 | ) | | $ | (0.99 | ) | | $ | (1.05 | ) | | $ | (1.28 | ) |
| Weighted average shares outstanding: | | | | | | | | | | |
| Weighted-average common shares outstanding: | | | | | | | | | | |
| Basic and diluted | 37,959 |
| | 33,948 |
| | 32,852 |
| | 32,043 |
| | 31,494 |
| 58,718,483 |
| | 53,911,270 |
| | 52,767,230 |
| | 37,958,846 |
| | 33,947,935 |
|
| | | | | | | | | | | | | | | | | | | |
| | December 31, | December 31, |
| | 2014 | | 2013 | | 2012 | | 2011 | | 2010 | 2017 | | 2016 | | 2015 | | 2014 | | 2013 |
| | (in thousands) | | | | | | | | | |
| Consolidated Balance Sheet Data: | | | | | | | | | | (in thousands) |
Cash and cash equivalents and marketable securities (1) | $ | 17,853 |
| | $ | 25,532 |
| | $ | 55,309 |
| | $ | 88,831 |
| | $ | 97,826 |
| |
Cash and cash equivalents and marketable securities (1)(2) | | $ | 21,259 |
| | $ | 9,894 |
| | $ | 12,570 |
| | $ | 17,853 |
| | $ | 25,532 |
|
| Working capital | 29,397 |
| | 40,928 |
| | 67,199 |
| | 81,113 |
| | 87,174 |
| 6,472 |
| | 6,070 |
| | 46,764 |
| | 29,397 |
| | 40,928 |
|
| Total assets | 95,020 |
| | 111,465 |
| | 161,531 |
| | 249,179 |
| | 302,108 |
| 158,207 |
| | 158,716 |
| | 198,753 |
| | 95,020 |
| | 111,465 |
|
| Stockholders’ equity | 30,546 |
| | 44,916 |
| | 85,447 |
| | 166,025 |
| | 185,403 |
| |
| Long-term liabilities | 6,090 |
| | 11,848 |
| | 2,552 |
| | 4,080 |
| | 12,886 |
| |
| Total long-term liabilities | | 143,857 |
| | 114,066 |
| | 104,078 |
| | 6,090 |
| | 11,848 |
|
| Total stockholders’ equity (deficit) | | (45,615 | ) | | (17,727 | ) | | 30,463 |
| | 30,546 |
| | 44,916 |
|
| |
(1) | IncludesAt December 31, 2013, includes restricted marketable securities in 2013.securities. |
| |
(2) | At December 31, 2017, includes restricted cash. |
Item 7. Management’s Discussion and Analysis of Financial Condition and Results of Operations
The following discussion of our consolidated financial condition and results of operations should be read in conjunction with our consolidated financial statements and related notes included elsewhere in this report. This report contains certain forward-looking statements relating to future events or our future financial performance. These statements are subject to risks and uncertainties which could cause actual results to differ materially from those discussed in this report. You are cautioned not to place undue reliance on this information which speaks only as of the date of this report. We are not obligated to update this information,Except as required by law, we assume no responsibility for updating any forward-looking statements, whether as a result of new information, future events or otherwise, except to the extent we are required to by law.otherwise. For a discussion of the important risks related to our business and future operating performance, see the discussion under the caption “Item 1A. Risk Factors” and under the caption “Factors Which May Influence Future Results of Operations” below. In light of these risks, uncertainties and assumptions, the forward-looking events discussed in this report might not occur.
Business Overview and Background
We areInseego Corp. is a providerleader in the design and development of intelligent wireless solutions for the worldwide mobile communications market. Our broad range of products principally includes intelligent mobile hotspots, USB modems, embedded modules, integrated asset-management and mobile tracking M2M devices, communications and applications software and cloud services
Our products currently operate on every major cellular wireless technology platform. Our mobile hotspots, embedded modules, and modems provide subscribers with secure and convenient high-speed access to corporate, public and personal information through the Internet and enterprise networks. Our M2M products enable devices to communicate with each other and with server or cloud-based application infrastructures. Our M2M products and solutions include our M2M embedded modules, integrated M2M communications devicesthat enable high performance mobile applications for large enterprise verticals, service providers and our service delivery platform,small and medium-sized businesses around the N4A™ DMglobe. Our product portfolio consists of enterprise SaaS solutions and N4A™ CMS, that provides easy deviceIoT and mobile solutions, which together form the backbone of compelling, intelligent, reliable and secure IoT services with deep business intelligence. Inseego’s products and solutions power mission critical applications with a “zero unscheduled downtime” mandate, such as asset tracking, fleet management, industrial IoT, SD WAN failover management and mobile broadband services. Our solutions are powered by our key innovations in purpose built SaaS cloud platforms, IoT and mobile technologies, including the newly emerging 5G technology.
We have invented and reinvented ways in which the world stays connected, accesses information and derives intelligence from that information. With multiple first-to-market innovations and a strong and growing portfolio of hardware and software innovations for IoT, Inseego has been advancing technology and driving industry transformation for over 30 years. It is this proven expertise and commitment to quality and innovation that makes us a preferred global partner of service enablement.providers, distributors, value-added resellers, system integrators, enterprises, small and medium-sized businesses and consumers.
Our mobile-hotspotIndustry Trends
The mobile industry has experienced tremendous growth for more than 20 years. As the largest technology platform in the world, mobile connectivity has changed the way we work, the way we live and modem customer basethe way we connect with each other. The scale and pace of innovation in mobile technology, especially around connectivity and computing capabilities, is comprisedalso impacting industries beyond wireless.
Looking ahead, Inseego is working with other leaders in the wireless industry to develop 5G technology, which is the next generation of wireless technology. With the newly defined 5G NR standard, 5G is being designed to support faster data rates, lower network latency and wider bandwidths of spectrum. Incorporating many of the innovations developed for 4G, 5G is also expected to be scalable and adaptable across a variety of use cases, which include, among others: empowering new industries and services, such as autonomous vehicles and industrial applications, through ultra-reliable, ultra-low latency communication links; and connecting a significant number of IoT service and devices, including the connected home and smart cities devices, with connectivity designed to meet ultra-low power, complexity and cost requirements. 5G is also expected to enhance mobile broadband services, including ultra-high definition (4K) video streaming and augmented and virtual reality, with multi-gigabit speeds.
Most 5G devices are expected to include multimode support for 3G, 4G and Wi-Fi, enabling service continuity where 5G has yet to be deployed and simultaneous connectivity across 4G and Wi-Fi technologies, while also allowing mobile operators including Verizon Wireless, AT&T,to utilize current network deployments. At the same time, 4G is expected to continue to evolve in parallel with the development of 5G and Sprint,become fundamental to many of the key 5G technologies, such as support for unlicensed spectrum, gigabit LTE user data rates and LTE IoT with connectivity designed to meet the needs of ultra-low power, complexity and cost applications. The first phase of 5G networks are expected to support mobile broadband services in lower spectrum bands below 6 GHz as well as distributorshigher bands above 6 GHz, including millimeter wave (mmWave).
According to the Global 5G Market Report issued in January 2018 by Netscribes, 5G technology is projected to service business frameworks required into 2020 and beyond. Due to socioeconomic transformations brought about by advancements in smart/connected city applications, mobile 5G is projected to be the “next big thing” in connected asset evolution. While mobile 4G LTE will continue to drive substantial volumes over the next decade, Netscribes predicts that the global 5G market will grow at a rate in excess of 95 percent, to greater than $250 billion by 2025. 5G technology is expected to address the rising demands for advanced applications, continued adoption of IoT devices and applications, and the rising bandwidth demands associated with said applications.
We continue to work closely with mobile operators, chipset suppliers and infrastructure companies around the world on 5G developments and trials in preparation for commercial network launches. In late 2017, we announced a strategic relationship with Qualcomm and Verizon Wireless to co-develop advanced technologies and devices for the next generation 5G NR wireless market.
The adoption of IoT technology continues to grow as companies across a wide range of industries are leveraging IoT technologies to increase efficiency, gain better customer insights, facilitate compliance and build new business models. IoT growth is expanding broadly, and adoption is particularly strong in the telematics and transportation industries and in industrial IoT markets, such as smart city infrastructure, utilities and energy management. We are building IoT capabilities by leveraging business models that monetize usage on most major carrier networks. We have developed IoT solutions that address key market needs for asset tracking applications, telematics, SD WAN failover management and various companiesother industrial applications. In addition, our IoT customers can turn the data that our solutions provide into actionable insights to develop new services and create revenue growth.
Our IoT solutions enable applications for various vertical markets, such as fleet and asset tracking and telematics, smart city applications to improve public safety, traffic management and energy management. Our telematics business offers a full array of solutions to both businesses and consumers that combine location-based software, services and data intelligence. We enable our customers to track, safeguard and optimize their most prized assets: people, vehicles, equipment and data. Inseego telematics, sold under the Ctrack brand, is a top commercial telematics provider globally. We serve both the enterprise and small and medium-sized business market segments with advanced solutions and scale in other vertical markets. distribution, research and development, and customer support. Additionally, we have made significant strides into the burgeoning aviation vertical.
Our M2M customer baseStrategy
Our objective is comprised of transportation companies, industrial companies, manufacturers, applicationto be a leader in high performance mobile applications for large enterprise verticals, service providers system integrators and distributors.small and medium-sized businesses around the globe. We will meet this objective through innovation we are driving in IoT, mobile and SaaS technologies. In furtherance of that objective, we will continue to focus on mission critical enterprise applications with a “zero unscheduled downtime” mandate, such as asset tracking, fleet management, industrial IoT, SD WAN failover management and mobile broadband services. Our solutions address multiple verticalwill be powered by our key innovations in IoT, purpose-built SaaS platforms and mobile technologies, including the newly emerging 5G technologies.
The key elements of our strategy are to:
Improve SaaS solution penetration. Through our Ctrack telematics and asset tracking platform and subscription management solutions, we provide customers around the world with actionable insights, workflow efficiencies and high security from our cutting-edge cloud platforms. We will continue to expand these solutions into new markets forsuch as the aviation vertical.
Expand our customers including commercial telematics, after-market telematics, remote monitoringIoT solutions portfolio and control, securitydevelop key core mobile technologies within our mobile portfolio. We intend to expand our IoT device portfolio and connected home. We have strategicdevelop newly emerging 5G technologies, leveraging our modem technologies, intellectual property, and supplier ecosystem.
Capitalize on our direct relationships with several of these customers that provide input and validation of our product requirements across the various vertical markets.
We sell our wireless broadband solutions primarily to wireless operators, either directly or through strategic relationships. Most of our mobile-computing product sales to wireless operators are sold directly by our sales force, or to a lesser degree, through distributors. We sell our M2M solutions primarily to enterprises in the following industries: transportation; energyOEMs and industrial automation; security and safety; and medical monitoring. We sell our M2M solutions through our direct sales force and through distributors.
component suppliers.We intend to continue to identifycapitalize on our direct and respondlong-standing relationships with wireless operators, OEMs and component suppliers in order to strengthen our customers’ needs by introducing new product designs with an emphasisworldwide market position.
Aggressively expand go-to-market offerings through sales resource expansion, channel development and strategic partnerships. We intend to expand our go-to-market resources and channels internationally for our IoT, mobile and cloud solutions.
Increase the value of our offerings. As we seek to capitalize on supportingpotential growth opportunities, we continue to develop cutting edge wide area network technology, ease-of-use, performance, size, weight, costIoT, mobile and power consumption. We managecloud solutions, with specific focus on end-to-end solutions that enable the best IoT and mobile experience for our products through a structured life cycle process, from identifying initial customer requirements through development and commercial introduction to eventual phase-out. During product development, emphasis is placed on innovation, time-to-market, performance, meeting industry standards and customer product specifications, ease of integration, cost reduction, manufacturability, quality and reliability.
The hardware used in our solutions is produced by contract manufacturers. Their services include component procurement, assembly, testing, quality control and fulfillment. Our contract manufacturers include: Inventec Appliances Corporation, Hon Hai Precision Industry Co., Ltd. and Benchmark Electronics. Under our manufacturing agreements, contract manufacturers provide us with services including component procurement, product manufacturing, final assembly, testing, quality control and fulfillment.
Strategic and Operations Overview
In 2014, we restructured our operations in an effort to increase future revenue levels and gross margins, lower our operating costs and achieve profitability. In the mobile computing business, we are focusing our development efforts only on those products that we believe have the greatest potential sales volume and will generate the highest gross profits and return on development investment. These products are targeted at the tier one telecommunications operators in North America with derivative products for other markets. We expect this strategy to reduce the number of products developed for salecustomers. For instance, in the mobile computing segmentCtrack cloud aviation solution, we allow Ground Support Equipment (“GSEs”) providers to achieve maximum utilization levels, maximum efficiency gains, and resulteliminate downtime for business-critical ground support equipment. In addition, further emerging 5G developments with anchor customers leveraging our existing modem technologies opens us up to larger worldwide potential markets. Finally, continued investment within both device and platform solutions in an improved return on investment from development costs expended. Operating loss also improved throughout the year with a $18.4 million loss in the first half of the year as compared to a $5.0 million loss in the second half of the year.predictive analytics, machine learning, and edge intelligence should expand our market opportunities.
Acquisitions
DigiCore Holdings Limited (DBA Ctrack)
On June 18, 2015, we entered into a transaction implementation agreement (the “TIA”) with DigiCore. Pursuant to the terms of Contents
Additionally,the TIA, we acquired 100% of the issued and outstanding ordinary shares of DigiCore (with the exception of certain excluded shares, including treasury shares) for 4.40 South African Rand per ordinary share outstanding.
On October 5, 2015, the transaction was completed. The total preliminary purchase price was approximately $80.0 million and included (i) cash consideration of $79.4 million for all of the outstanding ordinary shares of DigiCore and the purchase of in-the-money vested stock options held by Ctrack employees on the closing date and (ii) $0.6 million for the portion of the fair value of replacement equity awards issued to Ctrack employees that related to services performed prior to the closing date. Upon consummation of the acquisition, Ctrack became an indirect wholly-owned subsidiary of the Company.
R.E.R. Enterprises, Inc.
On March 27, 2015, we entered into a merger agreement (“RER Merger Agreement”) with RER to acquire all of the issued and outstanding shares of RER and its wholly-owned subsidiary and principal operating asset, FW (which has been renamed Inseego North America, LLC). The total purchase price was approximately $24.8 million and included a cash payment at closing of approximately $9.3 million, the Company’s assumption of $0.5 million in certain transaction-related expenses incurred by FW, and the future issuance of shares of our common stock valued at $15.0 million (the “Deferred Purchase Price”), which would have invested significant resourcesbeen payable in our M2M product and services portfolio. This investment has allowed usMarch 2016 pursuant to engage with new development partner customers in targeted verticals, including commercial and after-market telematics, and remote monitoring, control and security. We are currently integrating our products and services into their business processes,the original terms of the RER Merger Agreement.
The total consideration of $24.8 million did not include amounts, if any, payable under an earn-out arrangement, pursuant to which we believe will contributemay have been required to future revenue growth.
Net revenues from our Mobile Computing Products segment decreased 51.1% inpay up to an additional $25.0 million to the year ended former stockholders of RER contingent upon FW’s achievement of certain financial targets for the years ending December 31, 2014, compared to 2013. However, despite2015, 2016, and 2017 (the “Earn-Out Arrangement”). Such payments, if any, under the $152.0 million reductionEarn-Out Arrangement would have been payable in revenue, operating loss from Mobile Computing Products improved by $4.6 million,either cash or 16.5%, compared to 2013. Net revenues from Mobile Computing Products increased in the second half of 2014 from the first halfshares of the year, in part due toCompany’s common stock at the launchdiscretion of the MiFi® 6620LCompany, and would have been recorded as compensation expense during the service period earned.
On January 5, 2016, the Company and RER amended certain payment terms of the RER Merger Agreement (such agreement, as amended, the “Amended RER Merger Agreement”). Under the Amended RER Merger Agreement, the Deferred Purchase Price that was previously payable in shares of the third quarter, and are expectedCompany’s common stock in March 2016 was agreed to continue to increasebe paid in 2015.
Net revenuesfive cash installments over a four-year period, beginning in our M2M Products and Solutions segment grew $2.2 million or 5.8% inMarch 2016. In addition, the year ended December 31, 2014, compared to 2013. Operating loss from M2M Products and Solutions improved from a $15.3 million lossEarn-Out Arrangement was amended as follows: (a) any amount earned under the Earn-Out Arrangement for the prior year to a $12.2 million lossachievement of financial targets for the year ended December 31, 2014. Net revenues from M2M Products2015 would be paid in five cash installments over a four-year period, beginning in March 2016; and Solutions(b) in replacement of the potential earn-out contingent upon FW’s achievement of certain financial targets for the full fiscal year 2015 are anticipated to exceed the revenue in 2014, primarily based upon the increased adoption of our new products.
We have restructured our research and development process by reducing the size of our in-house engineering staff. This change replaced some of our fixed research and development costs (due primarily to a decrease in our employee headcount and related compensation expenses) with variable costs and is expected to result in a lower overall cost of research and development and a more variable cost structure going forward. We expect to continue to make focused investments in research and development.
We have also been focused on completing the integration of our mobile computing business with our M2M business to increase operational efficiencies and reduce our operating expenses. The total operating expenses incurred for the twelve monthsyears ended December 31, 2014 were $72.62016 and 2017 we would issue to the former stockholders of RER approximately 2.9 million comparedshares of the Company’s common stock in three equal installments over a three-year period, beginning in March 2017. On March 15, 2017, we issued 973,334 shares of our common stock to $111.5the former stockholders of RER in satisfaction of the first installment of this obligation. As of the filing date of this report, the March 2017 and March 2018 cash installments have not been paid and the March 2018 share installment has not been issued. We are disputing our obligations to make such payments and any future payments, in addition to seeking other damages in the related lawsuit (see Note 12, Commitments and Contingencies).
We recognized approximately $7.9 million for 2013, a 34.9%in expense during the year over year reduction. This reduction is primarilyended December 31, 2016 in connection with an earn-out payment due to the former shareholders of RER in the form of 2.9 million shares of our common stock.
As of December 31, 2017, the total amount of Deferred Purchase Price that remained outstanding was $11.3 million and the total amount outstanding pursuant to the Earn-Out Arrangement was $9.8 million, both of which are included in accrued expenses and other current liabilities and in other long-term liabilities in the consolidated balance sheets.
Divestitures
Modules Business
On April 11, 2016, the Company signed a reduction of employee headcountdefinitive asset purchase agreement with Telit Technologies (Cyprus) Limited and Telit Wireless Solutions, Inc. (collectively, “Telit”) pursuant to which the Company sold, and Telit acquired, certain hardware modules and related compensation expenses,assets (the “Modules Business”) for an initial purchase price of $11.0 million in cash, which included $9.0 million that was paid to the Company on the closing date of the transaction, $1.0 million that would be paid to the Company in equal quarterly installments over a two-year period in connection with the provision by the Company of certain transition services and $1.0 million that would be paid to the Company following the satisfaction of certain conditions by the
Company, including the assignment of specified contracts and the delivery of certain certifications and approvals. The Company also had the potential to receive an additional cash payment of approximately $3.8 million from Telit related to their purchase of module product inventory from the Company, $1.0 million of which would be paid to the Company in equal quarterly installments over the two-year period following the closing date in connection with the provision by the Company of certain transition services. In addition to the above, the Company may have been entitled to receive a subsequent earn-out payment following the closing of the transaction if certain conditions were met.
On September 29, 2016, the Company entered into a Final Resolution Letter Agreement (the “Final Resolution”) with Telit. Per the Final Resolution, Telit agreed to pay the Company $2.1 million in full satisfaction of their payment obligations under certain sections of the original purchase agreement, including all installment payments, and the Company agreed to ship the remainder of the hardware modules and related assets as wellsoon as reduced shareholder litigation loss. Our current employee headcount atpracticable. Under the Final Resolution, the aggregate purchase consideration totaled $11.7 million, which consisted of $11.3 million in cash and $0.4 million in net settled Company liabilities.
During the years ended December 31, 20142017 and 2016, we recognized a gain of approximately $45,000 and $5.0 million, respectively, in connection with the fulfillment of certain obligations pursuant to the asset purchase agreement, as amended, which is included in other income (expense), net, in the consolidated statements of operations.
MiFi Business
On September 21, 2016, the Company entered into the Purchase Agreement, by and among Inseego and Novatel Wireless, on the one hand, and the Purchasers, on the other hand. The Purchase Agreement related to the proposed sale of the Company’s subsidiary, Novatel Wireless, which included the Company’s MiFi Business, to the Purchasers for $50.0 million in cash, subject to potential adjustment for Novatel Wireless’s working capital as of the closing date.
In June 2017, we terminated the Purchase Agreement due to delays and uncertainty in securing approval of the transactions contemplated by the Purchase Agreement from CFIUS and announced key leadership changes and a Company-wide restructuring designed to improve execution, enhance financial performance and drive profitable growth as we worked to create sustainable long-term value for shareholders. As part of the restructuring plan, among other actions, we implemented cost reduction measures which included a series of targeted reductions across our businesses and geographies, and rationalization of our businesses. As a result of the termination of the transaction described above and the institution of certain restructuring initiatives, we retained our ownership interest in Novatel Wireless and the MiFi Business.
One of the many benefits associated with the retention of the MiFi Business is the retention of know-how and intellectual property essential to the development of advanced wireless technologies, such as the newly emerging 5G NR standard.
Internal Reorganization
In order to facilitate the proposed sale of Novatel Wireless, we completed an internal reorganization in November 2016 (the “Reorganization”). The first step of the Reorganization was 240the formation of Inseego (formerly known as comparedVanilla Technologies, Inc.) as a direct, wholly owned subsidiary of Novatel Wireless. Inseego then formed Vanilla Merger Sub, Inc., a Delaware corporation and direct, wholly owned subsidiary of Inseego (“Merger Sub”). Merger Sub was formed solely for the purpose of effecting the Reorganization.
Novatel Wireless then contributed all of its assets and liabilities (other than the MiFi Business), including its equity interests in DigiCore, FW, Novatel Wireless Solutions, Inc., Enfora Comercio de Eletronicos LTDA and each of their direct and indirect subsidiaries, to 316Inseego.
Finally, Merger Sub was merged with and into Novatel Wireless, with Novatel Wireless surviving as a direct, wholly owned subsidiary of Inseego. Upon completion of the Reorganization, each share of Novatel Wireless common stock was automatically converted into a corresponding share of Inseego common stock, having the same rights and limitations as the corresponding share of Novatel Wireless common stock that was converted. Accordingly, at December 31, 2013such time, Novatel Wireless’s former stockholders became stockholders of Inseego.
The purpose and 459 at December 31, 2012.effect of the Reorganization was to separate the MiFi Business from the assets and liabilities associated with the Ctrack fleet and vehicle telematics solutions and stolen vehicle recovery and FW telemetry and connectivity solutions businesses.
Business Segment Reporting
We do not provide separate segment reporting for our various lines of business. Our Chief Executive Officer, who is also our Chief Operating Decision Maker, evaluates the business as a single entity and reviews financial information and makes
business decisions based on the overall results of the business. As such, the Company’s operations constitute a single operating segment and one reportable segment.
Factors Which May Influence Future Results of Operations
Net Revenues. We believe that our future net revenues will be influenced largely by the speed and breadtha number of the demand for wireless access to data through the use of next generation networks, including demand for 3G and 4G products, 3G and 4G data access services (particularly in North America, Latina America, Europe and Asia), customer acceptance for our new products that address these markets, including our MiFi line of Intelligent Mobile Hotspots, and our ability to meet customer demand. Factors that could potentially affect customer demand for our products include the following:factors including:
economic environment and related market conditions;
increased competition from other wireless data device suppliersfleet and vehicle telematics solutions, as well as suppliers of emerging devices that contain a wireless data access or device management feature;
demand for broadband access services and networks;acceptance of our products by new vertical markets;
growth in the aviation ground vertical;
rate of change to new products;
timingphase-out of earlier generation wireless technologies (such as 3G);
deployment of 4G networks by wireless operators;5G infrastructure equipment;
decreased demand for 3G and 4Gadoption of 5G end point products;
competition in the area of 5G technology;
product pricing; and
changes in technologies.
Our revenues are also significantly dependent upon the availability of materials and components used in our hardware products.
We anticipate introducing additional products during the next twelve months, including 4G broadband-access products, M2MSaaS telematics solutions and software applicationsadditional service offerings, industrial IoT hardware and platforms.services, and other mobile and fixed wireless devices targeting the emerging 5G market. We continue to develop and maintain strategic relationships with wirelesstier-one service providers and computingother wireless industry leaders like QUALCOMM,such as Verizon Wireless, AT&T andT-Mobile, Sprint, and major software vendors.Qualcomm. Through strategic relationships, we have been able to maintain market penetration by leveraging the resources of our channel partners, including their access to distribution resources, increased sales opportunities and market opportunities.
Cost of Net Revenues. AllCost of net revenues includes all costs associated with our contract manufacturers, as well as distribution, fulfillment and repair services, are included in our costdelivery of net revenues. Cost of net revenues also includesSaaS services, warranty costs, amortization of intangible assets, royalties, operations overhead, costs associated with our cancellation of purchase orders, and costs related to outside services
andnet revenues are costs related to inventory adjustments, including acquisition-related amortization of the fair value of inventory, as well as any write downs for excess and obsolete inventory.inventory and abandoned product lines. Inventory adjustments are impacted primarily by demand for our products, which is influenced by the factors discussed above.
Operating Costs and Expenses. Many of our products target wireless operators and other customers in North America, Latin America, Europe and Asia. We will likely develop new products to serve these markets, resulting in increased research and development expenses. We have incurred these expenses in the past and expect to continue to incur these expenses in future periods prior to recognizing net revenues from sales of these products.
Our operating costs consist of three primary categories: research and development; sales and marketing; and general and administrative costs.
Research and development areis at the core of our ability to produce innovative, leading-edge products. This category consistsThese expenses consist primarily of engineers and technicians who design and test our highly complex products and the acquisitionprocurement of testing and certification services.
Sales and marketing expense consistsexpenses consist primarily of our sales force and product-marketing professionals. In order to maintain strong sales relationships, we provide co-marketing, trade show support and product training and demo units for merchandising.training. We are also engaged in a wide variety of activities, such as awareness and lead generation programs as well as product marketing. Other marketing initiatives include public relations, seminars and co-branding with partners.
General and administrative expenses include primarily corporate functions such as accounting, human resources, legal, administrative support, and professional fees. This category also includes the expenses needed to operate as a publicly-traded company, including compliance with the Sarbanes-Oxley compliance,Act of 2002, as amended, SEC filings, stock-exchangestock exchange fees, and investor-relationsinvestor relations expense. Although general and administrative expenses are not directly related to revenue levels, certain expenses such as legal expenses and provisions for bad debts may cause significant volatility in future general and administrative expenses.
We have undertaken certain restructuring activities and cost reduction initiatives in an effort to better align our organizational structure and costs with our strategy. Restructuring activitiescharges consist primarily of severance costs incurred in connection with the reduction of our workforce and facility exit related costs.costs, as well as discontinued operations if any.
As part of our business strategy, we review, and intend to continue tomay review acquisition or divestiture opportunities that we believe would be advantageous or complementary to the development of our business. Given our current cash position and recent losses, any additional acquisitions we make would likely involve issuing stock and/or borrowing additional funds in order to provide the purchase consideration for the acquisitions. If we make any additional acquisitions, we may incur substantial expenditures in conjunction with the acquisition process and the subsequent assimilation of any acquired business, products, technologies or personnel.
Results of Operations
The following table sets forth our consolidated statements of operations expressed as a percentage of net revenues for the periods indicated.
|
| | | | | | | | |
| | Year Ended December 31, |
| | 2014 | | 2013 | | 2012 |
| | (as a percent of net revenues) |
| Net revenues | 100.0 | % | | 100.0 | % | | 100.0 | % |
| Cost of net revenues | 80.0 |
| | 79.6 |
| | 79.0 |
|
| Gross profit | 20.0 |
| | 20.4 |
| | 21.0 |
|
| Operating costs and expenses: | | | | | |
| Research and development | 18.5 |
| | 14.4 |
| | 17.5 |
|
| Sales and marketing | 7.4 |
| | 6.2 |
| | 8.0 |
|
| General and administrative | 8.3 |
| | 7.2 |
| | 6.6 |
|
| Goodwill and intangible assets impairment | 0.0 |
| | — |
| | 14.4 |
|
| Amortization of purchased intangible assets | 0.3 |
| | 0.2 |
| | 0.3 |
|
| Shareholder litigation loss | 0.4 |
| | 4.3 |
| | 0.0 |
|
| Restructuring charges | 4.2 |
| | 1.0 |
| | 0.0 |
|
| Total operating costs and expenses | 39.2 |
| | 33.3 |
| | 46.8 |
|
| Operating loss | (19.2 | ) | | (12.9 | ) | | (25.8 | ) |
| Change in fair value of warrant liability | (1.8 | ) | | — |
| | — |
|
| Interest income (expense), net | 0.0 |
| | — |
| | 0.1 |
|
| Other expense, net | (0.1 | ) | | (0.1 | ) | | (0.1 | ) |
| Loss before income taxes | (21.1 | ) | | (12.9 | ) | | (25.8 | ) |
| Income tax provision | 0.1 |
| | — |
| | 0.2 |
|
| Net loss | (21.4 | )% | | (13.0 | )% | | (25.9 | )% |
|
| | | | | | | | | |
| | | Year Ended December 31, |
| | | 2017 | | 2016 | | 2015 |
| | | | | | | |
| | Net revenues: | (as a percent of net revenues) |
| |
| | Hardware | 73.4 | % | | 76.9 | % | | 92.0 | % |
| | SaaS, software and services | 26.6 |
| | 23.1 |
| | 8.0 |
|
| | Total net revenues | 100.0 |
| | 100.0 |
| | 100.0 |
|
| | Cost of net revenues: | | | | | |
| | Hardware | 61.5 |
| | 56.2 |
| | 69.6 |
|
| | SaaS, software and services | 8.0 |
| | 7.7 |
| | 3.7 |
|
| | Impairment of abandoned product line | (0.1 | ) | | 4.7 |
| | — |
|
| | Total cost of net revenues | 69.3 |
| | 68.7 |
| | 73.3 |
|
| | Gross profit | 30.7 |
| | 31.3 |
| | 26.7 |
|
| | Operating costs and expenses: | | | | | |
| | Research and development | 9.7 |
| | 12.6 |
| | 16.0 |
|
| | Sales and marketing | 11.4 |
| | 12.2 |
| | 9.5 |
|
| | General and administrative | 15.7 |
| | 21.5 |
| | 15.6 |
|
| | Amortization of purchased intangible assets | 1.6 |
| | 1.6 |
| | 1.0 |
|
| | Impairment of purchased intangible assets | — |
| | 1.1 |
| | — |
|
| | Restructuring charges, net of recoveries | 2.3 |
| | 0.8 |
| | 1.7 |
|
| | Total operating costs and expenses | 40.8 |
| | 49.8 |
| | 43.8 |
|
| | Operating loss | (10.1 | ) | | (18.5 | ) | | (17.1 | ) |
| | Other income (expense): | | | | | |
| | Non-cash change in acquisition-related escrow | — |
| | — |
| | (3.8 | ) |
| | Interest expense, net | (8.8 | ) | | (6.4 | ) | | (3.2 | ) |
| | Other income (expense), net | (1.9 | ) | | 0.2 |
| | 0.5 |
|
| | Loss before income taxes | (20.8 | ) | | (24.7 | ) | | (23.6 | ) |
| | Income tax provision | 0.1 |
| | 0.2 |
| | 0.1 |
|
| | Net loss | (20.9 | ) | | (24.9 | ) | | (23.7 | ) |
| | Less: Net loss (income) attributable to noncontrolling interests | — |
| | — |
| | — |
|
| | Net loss attributable to Inseego Corp. | (20.9 | )% | | (24.9 | )% | | (23.7 | )% |
Year Ended December 31, 20142017 Compared to Year Ended December 31, 20132016
Net revenues. Net revenues for the year ended December 31, 2017 were approximately $185.2$219.3 million, during 2014, a decrease of approximately $149.8$24.3 million, or 44.7%10.0%, compared to 2013. However, our operating loss improved by 17.7% from $43.2 millionthe same period in 2013 to $35.6 million in 2014.2016.
The following table summarizes net revenues by reportable segment andour two product categories during the years ended December 31, 2014 and 2013 (in(dollars in thousands):
|
| | | | | | | | | | | | | | |
| | Year Ended December 31, | | Change |
| | 2014 | | 2013 | | $ | | % |
| Net revenues by reportable segment: | | | | | | | |
| Mobile Computing Products | $ | 145,500 |
| | $ | 297,499 |
| | $ | (151,999 | ) | | (51.1 | )% |
| M2M Products and Solutions | 39,745 |
| | 37,554 |
| | 2,191 |
| | 5.8 | % |
| Total | $ | 185,245 |
| | $ | 335,053 |
| | $ | (149,808 | ) | | (44.7 | )% |
|
| | | | | | | | | | | | | | | |
| | | Year Ended December 31, | | Change |
| Product Category | | 2017 | | 2016 | | $ | | % |
| Hardware | | $ | 160,986 |
| | $ | 187,375 |
| | $ | (26,389 | ) | | (14.1 | )% |
| SaaS, software and services | | 58,311 |
| | 56,180 |
| | 2,131 |
| | 3.8 | % |
| Total | | $ | 219,297 |
| | $ | 243,555 |
| | $ | (24,258 | ) | | (10.0 | )% |
|
| | | | | | | | | | | | | | |
| | Year Ended December 31, | | Change |
| | 2014 | | 2013 | | $ | | % |
| Net revenues by product categories: | | | | | | | |
| Mobile Broadband Devices | $ | 143,309 |
| | $ | 277,415 |
| | $ | (134,106 | ) | | (48.3 | )% |
| Embedded Solutions | 20,949 |
| | 36,689 |
| | (15,740 | ) | | (42.9 | )% |
| Asset Management Solutions and Services | 20,987 |
| | 20,949 |
| | 38 |
| | 0.2 | % |
| Total | $ | 185,245 |
| | $ | 335,053 |
| | $ | (149,808 | ) | | (44.7 | )% |
Mobile Computing Products.Hardware. Net revenues from our Mobile Computing Products segment for the year ended December 31, 2014 were $145.5 million, a decrease of $152.0 million or 51.1% compared to the same period in 2013. The decrease in hardware net revenues is primarily attributable to legacy products reaching their end of their life cycle . Revenues for this segment increased sequentially in the third and fourth quartersprimarily as a result of the launchdivestiture of the MiFi 6620L duringModules Business in the latter part of the thirdsecond quarter of 2014,2016 and we expectthe abandonment of certain legacy Enfora, Inc. (“Enfora”) product lines, as well as reduced sales related to the MiFi Business, partially offset by the hardware sales related to the increase revenues from Mobile Computing Products throughout 2015 as compared to 2014.in IoT sales.
M2M ProductsSaaS, software and Solutions.services. Net revenues from our M2M Products and Solutions segment for the year ended December 31, 2014 were $39.7 million, an increase of $2.2 million, or 5.8%, compared to the same period in 2013. The increase in SaaS, software and services net revenues is primarily due to increased adoptiona result of our new M2M products. We expectincreased subscriber base as we continue to increase revenues from M2M Products and Solutions throughout 2015 as compared to 2014.build a recurring revenue business.
Product Categories. We have categorized the combined product portfolios of the mobile computing and M2M businesses into three categories (i) Mobile Broadband Devices, (ii) Embedded Solutions and (iii) Asset Management Solutions and Services. These categories were established due to the different markets and sales channels served. We believe this product categorization facilitates the analysis of our operating trends and enhances our segment disclosures.
The Mobile Broadband Devices category includes all external data modems including MiFi Intelligent Hotspots and USB modems. These devices are sold primarily through wireless operator enterprise and retail channels, telecommunications equipment distributors and consumer retail chains.
The Embedded Solutions product category includes M2M modules sold to manufacturers of various asset tracking and monitoring products. Our products are sold directly to OEMs or through distributor channels.
Asset Management Solutions and Services are mobile intelligent wireless broadband terminal devices and N4A DM and/or N4A CMS software which transmit information about the assets into which these products are integrated. These hardware and software products can be bundled or sold separately.
Cost of net revenues. Cost of net revenues for the year ended December 31, 20142017 was approximately $148.2$152.0 million, or 80.0%69.3% of net revenues, as compared to approximately $266.8$167.2 million, or 79.6%68.7% of net revenues, for the same period in 2013. Cost2016.
The following table summarizes cost of net revenues declinedby our two product categories (dollars in 2014 duethousands):
|
| | | | | | | | | | | | | | | |
| | | Year Ended
December 31, | | Change |
| Product Category | | 2017 | | 2016 | | $ | | % |
| Hardware | | $ | 134,795 |
| | $ | 136,936 |
| | $ | (2,141 | ) | | (1.6 | )% |
| SaaS, software and services | | 17,436 |
| | 18,751 |
| | (1,315 | ) | | (7.0 | )% |
| Impairment of abandoned product line, net of recoveries | (269 | ) | | 11,540 |
| | (11,809 | ) | | (102.3 | )% |
| Total | | $ | 151,962 |
| | $ | 167,227 |
| | $ | (15,265 | ) | | (9.1 | )% |
Hardware. The decrease in hardware cost of net revenues is primarily a result of reduced revenues, partially offset by increased costs per unit on new products released in 2017.
SaaS, software and services. The decrease in SaaS, software and services cost of net revenues is primarily a result of our cost containment initiatives and product mix.
Impairment of abandoned product line, net of recoveries. The impairment of abandoned product line includes the write down of the value of certain Enfora inventory related to product lines the Company decided to abandon during the year ended December 31, 2016, net of recoveries related to the corresponding declinesubsequent sale of such abandoned products, as well as a legal settlement in revenues described above.2017.
Gross profit. Gross profit for the year ended December 31, 20142017 was approximately $37.0$67.3 million, or 20.0%a gross margin of net revenues, as30.7%, compared to approximately $68.3$76.3 million, or 20.4%a gross margin of net revenues,31.3%, for the same period in 2013. While our2016. The decrease in gross profit percentageand gross margin was relatively flatprimarily due to decreased gross margins related to the new MiFi products introduced in 2014 as compared2017 and the one-time sale of certain legacy MiFi products at cost in order to 2013, we expect thatimprove our gross profit percentage will increase throughout 2015 based on expected increased sales from our newer, higher margin products.liquidity in the third quarter of 2017.
Research and development expenses. Research and development expenses for the year ended December 31, 20142017 were approximately $34.3$21.4 million, or 18.5%9.7% of net revenues, compared to approximately $48.2$30.7 million, or 14.4%12.6% of net revenues, in 2013. Research and development expenses for the year ended December 31, 2014 were lower as compared to the same period in 20132016. The decrease was primarily due to reduced labor costs attributed to headcount reductions and lower outside service costs and depreciation expenses.
We believe that focused investments in research and development are critical to our future growth and competitive position in the marketplace and are directly related to timely development of new and enhanced products that are central to our core business strategy. As such, we expect to make further investments in research and development to remain competitive.
Research and development expenses as a percentage of net revenues are expected to fluctuate in future periods depending on the amount of revenue recognized, and potential variation in the costs associated with the developmentresult of our products,cost containment initiatives, including reductions in our workforce over the number and complexity of the products under development and the progress of the development activities with respect to those products.past 24 months.
Sales and marketing expenses. Sales and marketing expenses for the year ended December 31, 20142017 were approximately $13.8$25.0 million, or 7.4%11.4% of net revenues, compared to approximately $20.9$29.8 million, or 6.2%12.2% of net revenues, in 2013. Sales and marketing expenses were lower as compared tofor the same period in 2013,2016. The decrease was primarily due to headcounta result of our cost containment initiatives, including reductions resulting in a decrease in salaries and related expenditures and share-based compensation expenses.
While managing sales and marketing expenses relative to net revenues, we expect to continue to make selected investments in sales and marketing as we introduce new products, market existing products, expand our distribution channels and focus on key customers aroundworkforce over the world.past 24 months.
General and administrative expenses. General and administrative expenses for the year ended December 31, 20142017 were approximately $15.4$34.4 million, or 8.3%15.7% of net revenues, compared to approximately $24.2$52.4 million, or 7.2%21.5% of net revenues, for the same period in 2016. The
2013. The decreaseour cost containment initiatives, including reductions in general and administrative expenses was due primarily to lower legal and professional fees coupled with lower salaries and related expenditures attributed to headcount reductions, and decreased share-based compensation expense.our workforce over the past 24 months.
Amortization of purchased intangible assets. The amortization of purchased intangible assets for the yearyears ended December 31, 20142017 and 2016 was approximately $562,000, the same as in 2013.$3.6 million and $3.9 million, respectively.
Shareholder litigation loss.Impairment of purchased intangible assets. The loss for litigation forDuring the year ended December 31, 2014 was $790,000 and2016, we recorded an impairment loss of $2.6 million primarily related to the In re Novatel Wireless Securities Litigation described in Note 13, “Commitments and Contingencies” in the accompanying consolidated financial statements, compared to $14.3 million in 2013.
Restructuring charges. Restructuring expenses fordeveloped technologies acquired through our acquisition of FW. We did not have an impairment of purchased intangible assets during the year ended December 31, 2014 were approximately $7.8 million compared to approximately $3.3 million in 2013. 2017.
Restructuring charges, net of recoveries. Restructuring charges, net of recoveries, for the yearyears ended December 31, 2014 primarily consisted of severance costs2017 and expenses related to the departure of our former Chief Executive Officer, including expenses relating to the accelerated vesting of restricted stock units2016 were $5.2 million and options, other severance costs$2.0 million, respectively, and expenses incurred in connection with the reduction of our workforce, and facility exit costs. Restructuring charges for the year ended December 31, 2013 primarily consisted of severance costs incurred in connection with the reduction of our workforce and facility exit related costs.
Change in fair value of warrant liability. During the year ended December 31, 2014, we incurred a non-cash loss of $3.3 million related to the fair value measurement of the warrant that we issued in connection with the financing transaction that closed on September 8, 2014.
Interest income (expense),expense, net. Interest expense, net for the year ended December 31, 20142017 was $85,000$19.3 million, as compared to interest income, net of $113,000$15.6 million for the same period in 2013.2016. The increase in interest expense is primarily a result of the interest expense and amortization of the debt discount and debt issuance costs related to our Term Loan and Prior Credit Agreement, as discussed below, as well as the increase in the amortization of debt discount related to the increase in the fair value of the embedded conversion feature of the Inseego Notes.
Other expense,income (expense), net. Other expense, net, for the year ended December 31, 20142017 was $167,000$4.1 million, as compared to $222,000other income, net, of $0.4 million for the same period in 2013.
Income tax provision. Income tax2016. Other expense, was approximately $124,000 for fiscal 2014, compared to $83,000 in 2013. The difference between the federal and state statutory combined benefit rate of 36% and our effective tax rate for 2014 is primarily due to a full valuation allowance on the Canadian-based deferred tax assets generated in 2014. The income tax expense for 2013 was primarily due to a full valuation allowance on the U.S.-based deferred tax assets generated in 2013.
Beneficial conversion feature. For the year ended December 31, 2014, we recognized the fair value of an embedded beneficial conversion feature for $445,000 on the convertible Series C preferred shares issued in connection with the financing transaction that closed on September 8, 2014.
Net loss. For the year ended December 31, 2014, we reported a net, loss of approximately $39.7 million, as compared to net loss of approximately $43.4 million in 2013. Net loss for the year ended December 31, 2014 was impacted by changes in2017 primarily consisted of a loss on extinguishment of debt related to the repayment of the Prior Credit Agreement and repurchase of certain of our Inseego Notes, as well as the termination of the Revolver (as defined below). Other income, net, revenue and restructuring charges recognized during the year. Net loss for the year ended December 31, 2013 was significantly impacted by expenses associated2016 primarily consisted of a gain recorded in connection with the shareholder litigation settlementsale of $14.3our Modules Business, partially offset by net foreign currency transaction losses, including unrealized foreign currency losses on outstanding intercompany loans that Ctrack has with certain of its subsidiaries, which are remeasured at each reporting period.
Income tax provision (benefit). Income tax expense for the year ended December 31, 2017 was $0.2 million accruedas compared to $0.4 million for the same period in 2016.
The effective tax rate for the fourth quarter of 2013, and restructuring charges recognizedyear ended December 31, 2017 is different than the U.S. statutory rate primarily due to a valuation allowance recorded against additional tax assets generated during the year.
Net loss (income) attributable to noncontrolling interests. Net loss attributable to noncontrolling interests for the year ended December 31, 2017 was $0.1 million as compared to net income attributable to noncontrolling interests of $5,000 for the same period in 2016.
Year Ended December 31, 20132016 Compared to Year Ended December 31, 20122015
Net revenues. Net revenues were approximately $335.1$243.6 million during 2013, a decrease2016, an increase of approximately $9.2$22.6 million or 2.7%10.2% compared to 2012.2015.
The following table summarizes net revenues by reportable segment andour two product categories during the years ended December 31, 20132016 and 2012 (in2015 (dollars in thousands):
|
| | | | | | | |
| | Year Ended December 31, |
| | 2013 | | 2012 |
| Net revenues by reportable segment: | | | |
| Mobile Computing Products | $ | 297,499 |
| | $ | 312,508 |
|
| M2M Products and Solutions | 37,554 |
| | 31,780 |
|
| Total | $ | 335,053 |
| | $ | 344,288 |
|
|
| | | | | | | |
| | Year Ended December 31, |
| | 2013 | | 2012 |
| Net revenues by product categories: | | | |
| Mobile Broadband Devices | $ | 277,415 |
| | $ | 287,572 |
|
| Embedded Solutions | 36,689 |
| | 29,960 |
|
| Asset Management Solutions and Services | 20,949 |
| | 26,756 |
|
| Total | $ | 335,053 |
| | $ | 344,288 |
|
|
| | | | | | | | | | | | | | | |
| | | Year Ended December 31, | | Change |
| Product Category | | 2016 | | 2015 | | $ | | % |
| Hardware | | $ | 187,375 |
| | $ | 203,281 |
| | $ | (15,906 | ) | | (7.8 | )% |
| SaaS, software and services | | 56,180 |
| | 17,661 |
| | 38,519 |
| | 218.1 | % |
| Total | | $ | 243,555 |
| | $ | 220,942 |
| | $ | 22,613 |
| | 10.2 | % |
Mobile Computing Products.Hardware. Net revenues from our Mobile Computing Products segment for the year ended December 31, 2013 were $297.5 million, a decrease of $15.0 million or 4.8% compared to the same period in 2012. The decrease in hardware net revenues is primarily attributable toa result of the divestiture of our Modules Business and our strategic focus on reducing the volume of our lower margin, standalone hardware sales, partially offset by the acquisition of Mobile Broadband devices caused by increased market competition at our largest customer and lower average sales prices during the period.Ctrack with its hardware net revenues.
M2M ProductsSaaS, software and Solutions.services. Net revenues from our M2M Products and Solutions segment for the year ended December 31, 2013 were $37.6 million, an increase of $5.8 million or 18.2% compared to the same period in 2012. The increase in SaaS, software and services net revenues is primarily due to increased salesa result of our HS3001 module launched in the first quarteracquisition of 2013.Ctrack with its subscription-based solutions and our strategic focus on increasing our higher margin, SaaS, software and services revenues.
Cost of net revenues. Cost of net revenues for the year ended December 31, 20132016 was approximately $266.8$167.2 million, or 79.6%68.7% of net revenues, as compared to approximately $271.8$162.0 million, or 79.0%73.3% of net revenues in 2012.2015.
The following table summarizes cost of net revenues by our two product categories (dollars in thousands):
|
| | | | | | | | | | | | | | | |
| | | Year Ended
December 31, | | Change |
| Product Category | | 2016 | | 2015 | | $ | | % |
| Hardware | | $ | 136,936 |
| | $ | 153,815 |
| | $ | (16,879 | ) | | (11.0 | )% |
| SaaS, software and services | | 18,751 |
| | 8,174 |
| | 10,577 |
| | 129.4 | % |
| Impairment of abandoned product line, net of recoveries | 11,540 |
| | — |
| | 11,540 |
| | 100.0 | % |
| Total | | $ | 167,227 |
| | $ | 161,989 |
| | $ | 5,238 |
| | 3.2 | % |
Hardware. The decrease in hardware cost of net revenues is primarily a result of the divestiture of our Modules Business and our strategic focus on reducing the volume of our lower margin, standalone hardware sales, partially offset by the acquisition of Ctrack with its hardware cost of net revenues.
SaaS, software and services. The increase in SaaS, software and services cost of net revenues is primarily a result of our acquisition of Ctrack with its SaaS, software and services cost of net revenues and our strategic focus on increasing our higher margin, SaaS, software and services revenues.
Impairment of abandoned product line, net of recoveries. The impairment of abandoned product line includes the write down of the value of certain Enfora inventory related to product lines the Company decided to abandon during the year ended December 31, 2016.
Gross profit.Gross profit for the year ended December 31, 20132016 was approximately $68.3$76.3 million, or 20.4%31.3% of net revenues, as compared to approximately $72.4$59.0 million, or 21.0%26.7% of net revenues, in 2012.2015. The increase in gross profit percentage decrease compared to the same period in 2012and gross margin was primarily attributabledue to the changes in net revenues.revenues and cost of net revenues as discussed above, as the Company sought to transition its revenue mix toward more highly profitable SaaS, software and services business.
Research and development expenses. Research and development expenses for the year ended December 31, 20132016 were approximately $48.2$30.7 million, or 14.4%12.6% of net revenues, compared to approximately $60.4$35.4 million, or 17.5%16.0% of net revenues, in 2012. Research2015. The decrease was primarily a result of our cost containment activities in 2016, including reductions in our workforce, partially offset by our acquisition of Ctrack with its research and development expenses for the year ended December 31, 2013 were lower as compared to the same period in 2012 due to reduced labor cost attributed to headcount reductions, as well as lower share-based compensation expense.expenses.
Sales and marketing expenses.Sales and marketing expenses for the year ended December 31, 20132016 were approximately $20.9$29.8 million, or 6.2%12.2% of net revenues, compared to approximately $27.5$20.9 million, or 8.0%9.5% of net revenues, in 2012. Sales2015. The increase was primarily a result of our acquisition of Ctrack with its sales and marketing expenses, were lower as compared topartially offset by the same period in 2012, primarily due to headcount reductions, resulting in a decrease in salaries and related expenditures and share-based compensation expenses.release of certain marketing development fund liabilities.
General and administrative expenses. General and administrative expenses for the year ended December 31, 20132016 were approximately $24.2$52.4 million, or 7.2%21.5% of net revenues, compared to approximately $22.7$34.5 million, or 6.6%15.6% of net revenues, in 2012.2015. The increase was due primarily to litigation settlements reacheda result of the acquisitions of Ctrack and FW, including non-cash equity earn-out expense, as well as a legal settlement entered into during the year, as well as increased legal fees and an increase to our allowance for doubtful accounts receivable, partially offset by reduced salaries and related expenditures attributed to headcount reductions and decreased share-based compensation expense.
Goodwill and intangible assets impairments. No impairments were recorded during the year ended December 31, 2013. During the first and third quarters of 2012, based on actual operating results, and reductions in management’s estimates of forecasted operating results of the M2M Products and Solutions reporting unit principally due to an updated view of competitive pressures impacting average selling prices and forecasted sales volumes, customer product and technology selections,our cost containment initiatives and the losslack of certain customers, we determined there were sufficient indicators of impairment present to require an interim impairment analysis. Based on the fair value tests performed during the first quarter of 2012, we recorded a pre-tax goodwill impairment charge of $6.6 million and a purchased intangible asset charge of $22.8 million. Based on the fair value tests performed during the third quarter of 2012, we recorded a preliminary pre-tax goodwill impairment charge of $13.2 million and a preliminary purchased intangible asset charge of $7.3 million. During the fourth quarter of 2012, we completed the third quarter impairment analysis and reduced the purchased intangible asset impairment by $300,000.all-employee retention bonus that was paid in 2015.
Amortization of purchased intangible assets.The amortization of purchased intangible assets for the years ended December 31, 2016 and 2015 was approximately $3.9 million and $2.1 million, respectively. Amortization of purchased intangible assets for the year ended December 31, 2013 was approximately $562,000, compared to approximately $1.12015 includes the amortization of intangible assets purchased through the acquisitions of Ctrack and FW for the period following their applicable dates of acquisition through December 31, 2015.
Impairment of purchased intangible assets. During the year ended December 31, 2016, we recorded an impairment loss of $2.6 million in 2012. The decrease in amortization expense was dueprimarily related to the lower net asset valuedeveloped technologies acquired through our acquisition of theFW. We did not have an impairment of purchased intangible assets resulting from impairment charges induring the first and third quarters of 2012.year ended December 31, 2015.
Shareholder litigation loss.Restructuring charges, net of recoveries. The contingent loss for litigationRestructuring charges, net of recoveries, for the year ended December 31, 2013 was $14.32016 were approximately $2.0 million relatedas compared to the In re Novatel Wireless Securities Litigation described in Note 13, “Commitments and Contingencies” in the accompanying consolidated financial statements.
Restructuring charges. Restructuring expensesapproximately $3.8 million for the year ended December 31, 2013 were $3.3 million, andsame period in 2015. Restructuring charges predominantly consisted of severance costs incurred in connection with the reduction of our workforce and facility exit related costs. In September 2013, We commenced certain restructuring initiatives, including
Non-cash change in acquisition-related escrow. During the closureyear ended December 31, 2015, we recorded a non-cash loss of our development site in Calgary, Canada, and$8.3 million related to an acquisition-related escrow account for the consolidationpurchase of certain supply chain management activities, resulting in a reduction in force of 72 employees across all functional areasCtrack due to the weakening of the Company.South African Rand compared to the U.S. Dollar. We did not have an acquisition-related escrow account during the year ended December 31, 2016.
Interest income,expense, net. Interest expense, net, for the year ended December 31, 2016 was $15.6 million as compared to $7.2 million for the same period in 2015. The increase in interest expense is primarily a result of the interest expense related to the Novatel Wireless Notes (as defined below) and includes the amortization of the debt discount and debt issuance costs.
Other income (expense), net. Other income, net, for the year ended December 31, 20132016 was $113,000$0.4 million as compared to $291,000other income, net, of $1.1 million for the same period in 2012. Our net interest2015. Other income, during 2013 and 2012 was primarily related to interest earned on our marketable securities. The decrease in our interest income during 2013 was primarily related to the decrease in net asset values of our marketable securities compared to the same period in 2012.
Other expense, net. Other expense, net, for the year ended December 31, 2013 was $222,000 as compared to $203,000 for the same period in 2012.
Income tax expense. Income tax expense was approximately $83,000 for fiscal 2013, compared to an expense of $611,000 in 2012. The difference between the federal and state statutory combined benefit rate of 36% and our effective tax rate for 2013 is2016 primarily duerelated to a full valuation allowancegain recorded in connection with the sale of our Modules Business, partially offset by net foreign currency transaction losses, including unrealized foreign currency losses on the U.S.-based deferred tax assets generated in 2013. Theoutstanding intercompany loans that Ctrack has with certain of its subsidiaries, which are remeasured at each reporting period. Other income, tax expense for 2012 was primarily due to a full valuation allowance on the U.S.-based deferred tax assets generated in 2012, and a $0.4 million expense related to an increase in our valuation allowance on the Canadian-based deferred tax assets.
Net loss. For the year ended December 31, 2013, we reported a net, loss of approximately $43.4 million, as compared to net loss of approximately $89.3 million in 2012. Net loss for the year ended December 31, 20132015 primarily consisted of unrealized foreign currency gains on outstanding intercompany loans that Ctrack has with certain of its subsidiaries.
Income tax provision (benefit). Income tax provision was significantly impacted by the shareholder litigation loss of $14.3 million. Net lossapproximately $0.4 million for the year ended December 31, 20122016, as compared to $0.2 million for the same period in 2015.
Net loss (income) attributable to noncontrolling interests. Net income attributable to noncontrolling interests for the year ended December 31, 2016 was significantly impacted due$5,000 as compared to net loss attributable to noncontrolling interests of $8,000 for the impairment charges recognizedsame period in the first and third quarters of 2012.2015.
Liquidity and Capital Resources
Our principal sources of liquidity are our existing cash and cash equivalents and cash generated from operations.
Financing TransactionTransactions
On September 3, 2014, we entered into a purchase agreement (the “Financing Purchase AgreementAgreement”) with HC2 Holdings 2, Inc., a Delaware corporation (the “Investor”), pursuant to which, on September 8, 2014, we sold to the Investor (i) 7,363,334 shares of our common stock, par value $0.001 per share, (ii) the Warranta warrant to purchase 4,117,647 shares of our common stock at an exercise price of $2.26 per share (the “2014 Warrant”) and (iii) 87,196 shares of our Series C Convertible Preferred Stock, par value $0.001 per share (the “Series C Preferred Stock”), all at a purchase price of (a) $1.75 per share of common stock plus, in each case, the related 2014 Warrant and (b) $17.50 per share of Series C Preferred Stock, for aggregate gross proceeds of approximately $14.4 million. On November 17, 2014, each share of Series C Preferred Stock then outstanding automatically converted into ten shares of common stock.
On March 26, 2015, the Investor exercised a portion of the 2014 Warrant to purchase 3,824,600 shares of our common stock at an exercise price of $2.26 per share for total proceeds of $8.6 million.
On March 26, 2015, in order to induce the Investor to exercise the 2014 Warrant for cash in connection with the acquisition of FW, we issued to the Investor a new warrant to purchase 1,593,583 shares of our common stock at an exercise price of $5.50 per share.
As of December 31, 2014, all warrant2017, 293,047 shares remain unexercised.outstanding under the 2014 Warrant.
Previous Credit FacilitiesAgreements
On October 31, 2014, we entered into a five-year senior secured revolving credit facility in the amount of $25.0 million (the “Revolver”) with Wells Fargo Bank, National Association, (the “Revolver”). Theas lender. On November 17, 2015, the Revolver was amended to increase the maximum borrowing capacity to $48.0 million. On March 20, 2017, at our request, the financial covenants with respect to liquidity requirements and EBITDA targets, among other things, were amended in order to enable draw-downs by the Company from time to time. In exchange for such accommodations, the aggregate amount of borrowings that may be madeavailable under the Revolver are basedwas decreased from $48.0 million to $10.0 million.
We terminated the Revolver on a borrowing base and are comprisedMay 8, 2017, in connection with the execution of a specified percentageCredit Agreement with Lakestar Semi Inc., a private investment fund managed by Soros Fund Management LLC, dated as of eligible receivables. If, at any time duringMay 8, 2017 (the “Prior Credit Agreement”). The Prior Credit Agreement provided for a $20.0 million secured term loan with a maturity date of May 8, 2018.
On August 23, 2017, upon entering into the termCredit Agreement described below, we used a portion of the Revolver,proceeds of the amount of borrowings outstanding under the Revolver exceeds the borrowing base then in effect or the maximum revolver amount of $25.0 million, we would be requirednew Term Loan (as defined below) to repay such borrowings in an amount sufficient to eliminate such excess. The Revolver includes $3.0 million of availability for letters of credit. At December 31, 2014,all outstanding amounts under and terminate the balancePrior Credit Agreement. In connection with the termination of the revolving credit facility was approximately $5.2 million andPrior Credit Agreement, we had available borrowingsrecognized a loss on extinguishment of debt of approximately $12.1 million. See Note 12 to our$1.7 million, which is included in other income (expense), net, in the consolidated financial statements for a discussionof operations. There was no early termination fee paid in connection with the termination of the Revolver.Prior Credit Agreement.
On November 19, 2014, we terminated our existing margin credit facility with one of the banks that held our marketable securities. Borrowings under this facility were collateralized by our cash and cash equivalents and marketable securities on deposit at the bank. During the twelve months ended December 31, 2014, we did not borrow against the facility and had no outstanding borrowings under this facility at December 31, 2014.
Working Capital, Cash and Cash Equivalents and Marketable Securities
The following table presents working capital, cash and cash equivalents and marketable securities:
On August 23, 2017, we entered into the Credit Agreement with certain of Contents
our direct and indirect subsidiaries, as Guarantors, Cantor Fitzgerald Securities, as Agent, and certain funds managed by Highbridge Capital Management, LLC, as Lenders. Pursuant to the Credit Agreement, the Lenders provided us with a term loan in the principal amount of $48.0 million (the “Term Loan”) with a maturity date of August 23, 2020 (the “Maturity Date”). In conjunction with the closing of the Term Loan, we received proceeds of $46.9 million, $35.0 million of which was funded to us in cash on the closing date, net of approximately $1.1 million related to an original issue discount and commitment fee, and the remaining $11.9 million of which was funded through our repurchase and cancellation of approximately $14.9 million of our outstanding Inseego Notes pursuant to the terms of the Note Purchase Agreement (as defined below). Additionally, in conjunction with the closing of the Term Loan, we issued 2,000,000 shares of our common stock to the Lenders with a market value of approximately $2.3 million, accrued an exit fee of approximately $0.6 million, and paid issuance costs of approximately $0.5 million. |
| | | | | | | | | | | |
| | Year Ended December 31,
|
| | 2014 | | 2013 | | Increase / (Decrease) |
| | (in thousands)
|
| Working capital (1) | $ | 29,397 |
| | $ | 40,928 |
| | $ | (11,531 | ) |
| Cash and cash equivalents (2) | $ | 17,853 |
| | $ | 2,911 |
| | $ | 14,942 |
|
| Short-term marketable securities (2)(3) | — |
| | 16,612 |
| | (16,612 | ) |
| Long-term marketable securities | — |
| | 3,443 |
| | (3,443 | ) |
| Total cash and cash equivalents and marketable securities | $ | 17,853 |
| | $ | 22,966 |
| | $ | (5,113 | ) |
| |
(1) | Working capital is defined as the excess of current assets over current liabilities. |
| |
(2) | Included in working capital. |
| |
(3) | Excludes restricted marketable securities. |
Our decreaseThe Term Loan bears interest at a rate per annum equal to the three-month LIBOR, but in working capitalno event less than 1.00%, plus 7.625%. Interest on the Term Loan is payable on the last business day of each calendar month and on the Maturity Date. Principal on the Term Loan is payable on the Maturity Date.
Convertible Senior Notes
On June 10, 2015, Novatel Wireless issued $120.0 million of 5.50% convertible senior notes due 2020 (the “Novatel Wireless Notes”) which are governed by the terms of an indenture, dated June 10, 2015, between Novatel Wireless, as issuer, Inseego and Wilmington Trust, National Association, as trustee, as amended by certain supplemental indentures. The Novatel Wireless Notes are senior unsecured obligations of Novatel Wireless and bear interest at a rate of 5.50% per year, payable semi-annually in arrears on June 15 and December 31, 2014 compared to15 of each year, beginning on December 31, 2013 was primarily due to losses from operations incurred,15, 2015. The Novatel Wireless Notes will mature on June 15, 2020, unless earlier repurchased or converted. The Novatel Wireless Notes will be convertible into cash, shares of our common stock, or a combination thereof, at our election, at an investment in inventory and capital expenditures in 2014.
initial conversion price of $5.00 per share of our common stock. As of December 31, 2014, our2017, $250,000 aggregate principal amount of the Novatel Wireless Notes remained outstanding. The remainder of the Novatel Wireless Notes were exchanged for the Inseego Notes.
On January 9, 2017, in connection with the settlement of an exchange offer and consent solicitation with respect to the Novatel Wireless Notes, the Company issued $119.8 million aggregate principal amount of the 5.50% senior convertible notes due 2022 (the “Inseego Notes” and collectively with the Novatel Wireless Notes, the “Convertible Notes”). The Inseego Notes were issued in exchange for the $119.8 million aggregate principal amount of outstanding Novatel Wireless Notes that were validly tendered and accepted for exchange and subsequently canceled. The Inseego Notes are governed by the terms of an indenture, dated January 9, 2017 (the “Inseego Indenture”), between the Company, as issuer, and Wilmington Trust, National Association, as trustee. The Inseego Notes are senior unsecured obligations of the Company and bear interest at a rate of 5.50% per year, payable semi-annually in arrears on June 15 and December 15 of each year, beginning on June 15, 2017. The Inseego Notes permit the Company to have a senior credit facility up to a maximum amount of $48.0 million.
The Inseego Notes are subject to repurchase by the Company at the option of the holders on June 15, 2020 (the “Optional Repurchase Date”) at a repurchase price in cash cash equivalentsequal to 100% of the principal amount of the Inseego Notes to be repurchased, plus accrued and marketable securities decreased $5.1unpaid interest to, but excluding, the Optional Repurchase Date, subject to the right of holders of the Inseego Notes on a record date to receive interest through the corresponding interest payment date.
The exchange of the Novatel Wireless Notes for the Inseego Notes was treated as a debt modification in accordance with applicable Financial Accounting Standards Board (“FASB”) guidance and the Company recognized $3.6 million as comparedan additional component of debt discount and additional paid-in capital attributed to the increase in the fair value of the embedded conversion feature of the Inseego Notes before and after modification.
The Inseego Notes will mature on June 15, 2022, unless earlier converted, redeemed or repurchased. The Inseego Notes will be convertible into cash, shares of our common stock, or a combination thereof, at our election, at an initial conversion price of $4.70 per share of our common stock.
On August 23, 2017, in connection with the Credit Agreement described above, we entered into a Note Purchase Agreement (the “Note Purchase Agreement”) with the Lenders pursuant to which we repurchased approximately $14.9 million of outstanding Inseego Notes from such Lenders in exchange for $11.9 million deemed to have been loaned to us pursuant to
the Credit Agreement and the accrued and unpaid interest on such notes. In connection with the repurchase of such notes, we recognized a loss on extinguishment of debt of approximately $0.3 million, which is included in other income (expense), net, in the consolidated statements of operations.
As of the filing date of this report, the following aggregate principal amounts remain outstanding (in thousands):
|
| | | |
| Inseego Notes | $ | 104,875 |
|
| Novatel Wireless Notes | 250 |
|
| Total | $ | 105,125 |
|
Rights Agreement
On January 22, 2018, the Company entered into the Rights Agreement and issued a Right to each of the stockholders of record of each share of the Company’s common stock outstanding on February 2, 2018. Each Right entitles the registered holder, under certain circumstances, to purchase from the Company one one-thousandth of a share of Series D Preferred Stock, par value $0.001 per share (the “Preferred Shares”), of the Company, at a price of $10.00 per one one-thousandth of a Preferred Share represented by a Right (the “Purchase Price”), subject to adjustment. The description and terms of the Rights are set forth in the Rights Agreement.
The Rights are not exercisable until the Distribution Date (as defined in the Rights Agreement). The Rights will expire on the earlier of (i) the close of business on January 22, 2021, (ii) the time at which the Rights are redeemed, (iii) the time at which the Rights are exchanged and (iv) if the Rights Agreement has not been approved or ratified by the stockholders prior to the conclusion of the Company’s 2018 Annual Meeting of Stockholders, the close of business on such date.
Until a Right is exercised, the holder thereof, as such, will have no rights as a stockholder of the Company, including, without limitation, the right to vote or to receive dividends.
DigiCore Mortgage Bond
DigiCore has a mortgage bond with Absa Bank Limited in South Africa (“Absa”) that is secured by certain property of DigiCore. The mortgage bond has a ten-year term, expiring in December 2018, and bears interest at the South Africa prime rate minus 1.75% (8.50% at December 31, 2013, primarily due2017). At December 31, 2017, $0.3 million remained outstanding under the mortgage bond.
DigiCore Secured Banking Facility
DigiCore has a secured banking facility with Absa, which had a maximum borrowing capacity of $1.9 million at December 31, 2017. The facility bears interest at the South Africa prime interest rate less 0.10% (10.15% at December 31, 2017) and is subject to $16.3renewal annually in April. At December 31, 2017, $1.9 million remained outstanding under this facility.
DigiCore Secured Overdraft Facility
DigiCore has a secured overdraft facility with Grindrod Bank in South Africa, which had a maximum borrowing capacity of $1.2 million at December 31, 2017. The facility bears interest at the South Africa prime interest rate plus 1.00% (11.25% at December 31, 2017), requires monthly interest and, in certain instances, minimum principal payments. The facility is subject to renewal annually in September. At December 31, 2017, $1.1 million remained outstanding under this facility.
RER Amendment
Pursuant to the Amended RER Merger Agreement with respect to our acquisition of FW, we agreed to pay a total of $15.0 million in deferred purchase price in five cash usedinstallments over a four-year period, beginning in operating activitiesMarch 2016. We also agreed to pay a total of approximately $6.1 million in cash over a four-year period, beginning in March 2016, of which approximately $4.6 million remains unpaid, related to the Earn-Out Arrangement of the Amended RER Merger Agreement (see Note 2, Acquisitions and capital expendituresDivestitures). As of $1.8the filing date of this report, the March 2017 and March 2018 cash installments of $5.3 million partially offset byeach have not been paid and the net proceeds of $14.2 million received from the Investor in the financing transaction described above. See the discussion of market risk in Item 7A.Company is disputing its obligation to make such payments and any future payments (see Note 12, QuantitativeCommitments and Qualitative Disclosures About Market Risk.Contingencies).
Historical Cash Flows
The following table summarizes our consolidated statements of cash flows for the periods indicated:indicated (in thousands):
| | | | Year Ended December 31,
| | | | | |
| | 2014 | | 2013 | Year Ended December 31, |
| | (in thousands) | 2017 | | 2016 |
| Net cash used in operating activities | $ | (16,267 | ) | | $ | (26,627 | ) | $ | (14,637 | ) | | $ | (6,579 | ) |
| Net cash provided by investing activities | 20,432 |
| | 11,624 |
| |
| Net cash provided by financing activities | 10,908 |
| | 2,014 |
| |
| Net cash provided by (used in) investing activities | | (4,375 | ) | | 5,035 |
|
| Net cash provided by (used in) financing activities | | 30,366 |
| | (1,291 | ) |
| Effect of exchange rates on cash and cash equivalents | (131 | ) | | (144 | ) | (50 | ) | | 159 |
|
| Net increase (decrease) in cash and cash equivalents | 14,942 |
| | (13,133 | ) | 11,304 |
| | (2,676 | ) |
| Cash and cash equivalents, beginning of period | 2,911 |
| | 16,044 |
| 9,894 |
| | 12,570 |
|
| Cash and cash equivalents, end of period | $ | 17,853 |
| | $ | 2,911 |
| $ | 21,198 |
| | $ | 9,894 |
|
Operating activities.Net cash used in operating activities was $16.3$14.6 million for 2014the year ended December 31, 2017 compared to $26.6$6.6 million of net cash usedfor the same period in 2013.2016. Net cash used in operating activities for the year ended December 31, 20142017 was primarily attributable to the net losses incurred in 2014.during the period, partially offset by non-cash charges for depreciation and amortization, including the amortization of debt discount and debt issuance costs, loss on extinguishment of debt and share-based compensation expense. Net cash used in operating activities for the year ended December 31, 20132016 was primarily attributable to the net losses incurred in 2013during the period, partially offset by non-cash charges related to the acquisitions of Ctrack and FW, depreciation and amortization, including that of the unfavorable working capital impactsdebt discount and debt issuance costs, the impairment of a $19.2 million reduction in accounts payable.certain product lines the Company decided to abandon and certain purchased intangible assets, the reversal of certain market development fund accruals and share-based compensation expense.
Investing activities.Net cash used in investing activities during the year ended December 31, 2017 was $4.4 million compared to $5.0 million provided by investing activities for 2014 was approximately $20.4 million compared to $11.6 millionthe same period in 2016. Cash used in investing activities during the year ended December 31, 2017 was primarily attributable to the purchases of property, plant and equipment and the capitalization of certain costs related to the research and development of software to be sold in 2013. The net cashour solutions. Cash provided by investing activities in 2014during the year ended December 31, 2016 was primarily attributable to proceeds from the sale of our Modules Business, partially offset by payments made pursuant to the Amended RER Merger Agreement and the capitalization of certain costs related to the net salesresearch and maturitiesdevelopment of software to be sold in our marketable securities of $22.6 million, partially offset by purchases of property and equipment of $1.8 million.solutions.
Financing activities. Net cash provided by financing activities for 2014during the year ended December 31, 2017 was $10.9$30.4 million, compared to net cash provided byused in financing activities of $2.0$1.3 million for 2013.the same period in 2016. Net cash provided by financing activities in 2014during the year ended December 31, 2017 was primarily relatedattributable to the net proceeds received from the equity issued to the Investor in September 2014,Term Loan, partially offset by payments made in 2014the repurchase of certain Inseego Notes and payment of issuance costs related to settle our shareholder litigation.the Term Loan and Prior Credit Agreement. Net cash provided byused in financing activities in 2013during the year ended December 31, 2016 was primarily relatedattributable to proceeds received from borrowing on our margin credit facility,net repayments of DigiCore bank facilities and capital lease obligations, partially offset by principal repayments on our margin credit facility borrowings,proceeds from stock option exercises and payroll taxes paid on behalf of employees for restrictedpurchases under the employee stock units which vested during the period.purchase plan.
Contractual Obligations and Commercial Commitments
The following table summarizes our contractual obligations and commercial commitments at December 31, 2014,2017, and the effect such obligations could have on our liquidity and cash flow in future periods (in thousands):
|
| | | | | | | | | | | | | | | | | | | | | | | | | | | |
| | Payments Due by Fiscal Year |
| | 2015 | | 2016 | | 2017 | | 2018 | | 2019 | | Thereafter | | Total |
| Operating leases | $ | 2,744 |
| | $ | 2,749 |
| | $ | 537 |
| | $ | 436 |
| | $ | 433 |
| | $ | 221 |
| | $ | 7,120 |
|
| Committed purchase orders | 55,000 |
| | — |
| | — |
| | — |
| | — |
| | — |
| | 55,000 |
|
| Total contractual obligations | $ | 57,744 |
| | $ | 2,749 |
| | $ | 537 |
| | $ | 436 |
| | $ | 433 |
| | $ | 221 |
| | $ | 62,120 |
|
|
| | | | | | | | | | | | | | | | | | | |
| | Payments Due by Period |
| | Total | | < 1 Year | | 1 - 3 Years | | 4 - 5 Years | | > 5 Years |
Convertible Notes(1) | $ | 131,116 |
| | $ | 5,782 |
| | $ | 11,807 |
| | $ | 113,527 |
| | $ | — |
|
Term Loan(2) | 59,650 |
| | 4,155 |
| | 55,495 |
| | — |
| | — |
|
DigiCore mortgage bond(3) | 338 |
| | 338 |
| | — |
| | — |
| | — |
|
DigiCore bank facilities(3) | 3,075 |
| | 3,075 |
| | — |
| | — |
| | — |
|
| Amended RER Merger Agreement | 15,823 |
| | 10,549 |
| | 5,274 |
| | — |
| | — |
|
Capital lease obligations(3) | 1,412 |
| | 782 |
| | 630 |
| | — |
| | — |
|
Operating lease obligations(3) | 6,663 |
| | 2,874 |
| | 3,168 |
| | 601 |
| | 20 |
|
| Total | $ | 218,077 |
| | $ | 27,555 |
| | $ | 76,374 |
| | $ | 114,128 |
| | $ | 20 |
|
| |
(1) | Represents the outstanding borrowings and contractually required interest payments to Convertible Notes holders at December 31, 2017, assuming no repurchases or conversions of the Novatel Wireless Notes prior to June 15, 2020, the maturity date, or the Inseego Notes prior to June 15, 2022, the maturity date. |
Our liability for uncertain tax benefits, including interest, as of December 31, 2014 was $0, compared to approximately $61,000 as of December 31, 2013. The decrease was primarily due to the expiration of the applicable statutes of limitations for certain tax years. Our tax liability for uncertain tax benefits is not included in our table of contractual obligations and commercial commitments.46
| |
(2) | Represents the outstanding borrowings and contractually required interest payments and exit fee at December 31, 2017, assuming applicable interest rates at December 31, 2017. |
| |
(3) | Assumes applicable foreign currency exchange rates at December 31, 2017 remain unchanged. |
Other Liquidity Needs
We have recently incurred operating losses and had a net loss of $39.7 million during the year ended December 31, 2014. As of December 31, 2014,2017, we had available cash and cash equivalents totaling $17.9$21.2 million and working capital of $29.4 million. We also have availability for borrowings under the Revolver. Borrowings under this facility are secured by a first priority lien on substantially all of our assets and the assets of certain of our subsidiaries, subject to certain exceptions and permitted liens. During the twelve months ended December 31, 2014, we borrowed $5.2 million against the revolving credit facility and had available borrowings of approximately $12.1$6.5 million.
The restructuring announced in June 2017 is aimed at significantly reducing our cost of revenues and operating expenses in an effort to increase operating cash flows to eventually be sufficient to offset debt service costs and cash flows from investing activities. Our ability to transition to attainingmore profitable operations and generating positive cash flow is dependent upon achieving a level of revenuesrevenue adequate to support our evolving cost structure. If events or circumstances occur such that we do not meet our operating plan as expected, we may be required to reduce planned research and development activities, incur additional restructuring charges or reduce other operating expenses which could have an adverse impact on our ability to achieve our intended business objectives. We believe that our cash and cash equivalents, and our availability under the Revolver, together with anticipated cash flows from operations, will be sufficient to meet our working capital needs for the next twelve months.months following the filing date of this report.
Our liquidity could be impaired if there is any interruption in our business operations, a material failure to satisfy our contractual commitments or a failure to generate revenue from new or existing products.
We may decide to raise additional funds to accelerate development of new and existing services and products, to respond to competitive pressures or to acquire complementary products, businesses or technologies. There can be no assurance that any required or desired additional financing will be available on terms favorable to us, or at all. In addition, in order to obtain additional borrowings, we must comply with certain requirements under the Revolver.Credit Agreement. If additional funds are raised by the issuance of equity securities, our shareholdersstockholders could experience dilution of their ownership interests and securities issued may have rights senior to those of the holders of our common stock. If additional funds are raised by the issuance of debt securities, we may be subject to certain limitations on our operations. If adequate funds are not available or not available on acceptable terms, we may be unable to take advantage of acquisition opportunities, develop or enhance products or respond to competitive pressures, any of which could have a material adverse effect on our business, financial condition and results of operations.
Off-Balance Sheet Arrangements
We do not have any off-balance sheet arrangements that are material to our results of operations, financial conditions or liquidity.arrangements.
Critical Accounting Policies and Estimates
The preparation of financial statements in conformity with accounting principles generally accepted in the U.S.United States requires management to make estimates and assumptions. These estimates and assumptions affect the reported amounts of assets, liabilities, revenues, expenses and disclosures of contingent assets and liabilities. Actual results could differ from these estimates. Critical accounting policies and significant estimates include revenue recognition, allowance for doubtful accounts receivable, provision for excess and obsolete inventory, valuation of intangible and long-lived assets, fair value of warrant liability, accruals relating to litigation, restructuring, and retention bonus, provision for warranty costs, income taxes and share-based compensation expense.
Revenue Recognition. Our revenue is principally generatedWe generate revenues from the sale of wireless modems to wireless operators, OEM customers and value added resellers and distributors. In addition, we generate revenue from the sale of asset-management solutions utilizing wireless technology and M2Mmachine-to-machine communication devices to transportation and industrial companies, medical device manufacturers and security system providers. Revenue from product sales is generally recognized upon the later of transfer of title or delivery of the product to the customer. Where the transfer of title or risk of loss is contingent on the customer’s acceptance of the product, we will not recognize revenue until both title and risk of loss have transferred to the customer. We recognize revenues from SaaS services pro-rata over the contract term. We record deferred revenue for cash payments received from customers in advance of when revenue recognition criteria are met. We have granted price protection to certain customers in accordance with the provisions of the respective contracts and track pricing and other terms offered to customers buying similar products to assess compliance with these provisions. We estimate the amount of price protection for current period product sales utilizing historical experience and information regarding customer inventory levels. To date, we have not incurred material price protection obligations. Revenues from sales to certain customers are subject to cooperative advertising allowances. Cooperative advertising allowances are recorded as an operating expense to the extent that the advertising benefit is separable from the revenue transaction and the fair value of that advertising benefit is determinable. To the extent that such allowances either do not provide a separable benefit to us, or the fair value of the advertising benefit cannot be reliably estimated, such amounts are recorded as a reduction of revenue. We establish reserves for estimated product returns allowances in the period in which revenue is recognized. In estimating future product returns, we consider various factors, including our stated return policies and practices and historical trends.
Predominantly all of the revenues represent the sale of hardware with accompanied software that is essential to the functionality of the hardware.
We record our hardware revenue associated with the agreed upon price on hardware sales, and accruesaccrue any estimated costs of post-delivery performance obligations, such as warranty obligations. We consider the four basic revenue recognition criteria discussed under Staff Accounting Bulletin No. 104 when assessing appropriate revenue recognition as follows:
Criterion #1 — Persuasive evidence of an arrangement must exist;
Criterion #2 — Delivery has occurred;
Criterion #3 — Our price to the buyer must be fixed or determinable; and,
Criterion #4 — Collectability is reasonably assured.
Under Accounting Standards Update 2009-13, inFor multiple element arrangements, the total consideration received from customers must beis allocated to the elements. This may include hardware, non-essential software elements and/or essential software, based on a relative selling price. The accounting guidance establishes a hierarchy to determine the selling price to be used for allocating revenue to deliverables as follows: (i) vendors specific objective evidence (VSOE)(“VSOE”), (ii) third party evidence (TPE)(“TPE”), and (iii) best estimate of selling price (BESP)(“BESP”). Because we have neither VSOE nor TPE, revenue has been based on our BESP. Amounts allocated to the delivered hardware and the related essential software are recognized at the time of the sale provided all other revenue recognition criteria have been met. Amounts allocated to other deliverables based upon BESP are recognized in the period the revenue recognition criteria have been met.
Our process for determining BESP for deliverables without VSOE or TPE considers multiple factors that may vary depending upon the unique facts and circumstances related to each deliverable. Our prices are determined based upon cost to produce our products, expected order quantities and acceptance in the marketplace. In addition, when developing BESPs for products, we may consider other factors as appropriate, including the pricing of competitive alternatives (if they exist) and product-specific business objectives.
We account for multiple element arrangements that primarily consist of software licenses and post contract support (PCS)(“PCS”) by recognizing revenue for such arrangements ratably over the term of the PCS as we have not established VSOE for the PCS element.
ForWe provide SaaS subscriptions for our fleet and vehicle management solutions in which customers are provided with the years ended December 31, 2014, 2013,ability to wirelessly communicate with monitoring devices installed in vehicles and 2012,other mobile assets via software applications hosted by us. The customer has the option to purchase the monitoring device or lease it over the term of the contract. If the customer purchases the monitoring device, we recognize the revenue at the time of purchase. If the customer chooses to lease the monitoring device, we recognize the revenue for the monitoring device over the term of the contract. The Company records such revenue in accordance with the FASB Accounting Standards Codification (“ASC”) 840, Leases, as we have not recorded any significantdetermined that they qualify as operating leases. We recognize revenues from multiple elementSaaS services over the term of the contract.
Certain of our revenue is based on contractual arrangements. In such instances, management considers the nature of the Company’s contractual arrangements in determining whether to recognize certain types of revenue on the basis of the gross amount billed or software arrangements.net amount retained after payments are made to providers of certain services related to the product or service offering. The main factors we use to determine whether to record revenue on a gross or net basis are whether:
we are primarily responsible for the service to the customer;
we have discretion in establishing fees paid by the customer; and
we are involved in the determination of product or service specifications.
When the customer’s fee includes a portion of charges that are paid to another party and we are primarily responsible for providing the service to the customer, revenue is recognized on a gross basis in an amount equal to the fee paid by the customer. The cost of revenues recognized is the amount due to the other party and is recorded as cost of revenues in the consolidated statements of operations. In instances in which another party is primarily responsible for providing the service to the customer, revenue is recognized in the net amount retained by the Company. The portion of the fees that we collect from the customer and remit to the other party are considered pass through amounts and accordingly are not a component of net revenues or cost of net revenues.
Allowance for Doubtful Accounts Receivable.We provide an allowance for our accounts receivable for estimated losses that may result from our customers’ inability to pay. We determine the amount of the allowance by analyzing known uncollectible accounts, aged receivables, economic conditions, historical losses, and changes in customer payment cycles and our customers’ credit-worthiness. Amounts later determined and specifically identified to be uncollectible are charged or written off against this allowance. To minimize the likelihood of uncollectibility, we review our customers’ credit-worthiness periodically based on credit scores generated by independent credit reporting services, our experience with our customers and the economic condition of our customers’ industries. Material differences may result in the amount and timing of expense for any period if we were to make different judgments or utilize different estimates. If the financial condition of our customers deteriorates resulting in an impairment of their ability to make payments, additional allowances may be required.
Provision for Excess and Obsolete Inventory. Inventories are stated at the lower of cost (first-in, first-out method) or market.net realizable value. We review the components of our inventory and our inventory purchase commitments on a regular basis for excess and
obsolete inventory based on estimated future usage and sales. Write-downs in inventory value or losses on inventory purchase commitments depend on various items, including factors related to customer demand, economic and competitive conditions, technological advances or new product introductions by us or our customers that vary from our current expectations. Whenever inventory is written down, a new cost basis is established and the inventory is not subsequently written up if market conditions improve.
We believe that, when made, the estimates we use in calculating the inventory provision are reasonable and properly reflect the risk of excess and obsolete inventory. If customer demand for our inventory is substantially less than our estimates, inventory write-downs may be required, which could have a material adverse effect on our consolidated financial statements.
Acquisitions. When acquiring companies, we recognize separately from goodwill the assets acquired and the liabilities assumed at their acquisition date fair values. Goodwill as of the acquisition date is measured as the excess of consideration transferred and the net of the acquisition date fair values of the assets acquired and the liabilities assumed. While we use our best estimates and assumptions as a part of the purchase price allocation process to accurately value assets acquired and liabilities assumed at the acquisition date, our estimates are inherently uncertain and subject to refinement. As a result, during the measurement period, which may be up to one year from the acquisition date, we record adjustments to the assets acquired and liabilities assumed, with the corresponding offset to goodwill. Upon the conclusion of the measurement period or final determination of the values of assets acquired or liabilities assumed, whichever comes first, any subsequent adjustments are recorded to the condensed consolidated statements of operations.
Accounting for business combinations requires management to make significant estimates and assumptions, especially at the acquisition date with respect to intangible assets, support liabilities assumed, and pre-acquisition contingencies. Although we believe the assumptions and estimates we have made in the past have been reasonable and appropriate, they are based in part on historical experience, market data and information obtained from the management of the acquired companies and are inherently uncertain.
Examples of critical estimates in valuing certain of the intangible assets the Company has acquired include but are not limited to: (i) future expected cash flows from customer relationships; (ii) estimates to develop or use technology; and (iii) discount rates.
If management determines that a pre-acquisition contingency is probable in nature and estimable as of the acquisition date, we record our best estimate for such a contingency as a part of the preliminary fair value allocation. We continue to gather information for and evaluate pre-acquisition contingencies throughout the measurement period and if we make changes to the amounts recorded or if we identify additional pre-acquisition contingencies during the measurement period, such amounts will be included in the fair value allocation during the measurement period and, subsequently, in our results of operations.
We may be required to pay future consideration to the former shareholders of acquired companies, depending on the terms of the applicable purchase agreements, which may be contingent upon the achievement of certain financial and operating targets, as well as the retention of key employees. If the future consideration is considered to be compensation, amounts will be expensed when incurred.
Purchased Intangible Assets. In determining the fair value allocation for our acquisitions, we considered, among other factors, our intended uses of the acquired assets and the historical and estimated future demand for the acquired company’s products and services. The estimated fair value of intangible assets was determined using the income approach. The income approach relies on an estimation of the present value of the future monetary benefits expected to flow to the owner of an asset during its remaining economic life. This approach requires a projection of the cash flow that the asset is expected to generate in the future. The projected cash flow is discounted to its present value using a rate of return, or discount rate that accounts for the time value of money and the degree of risks inherent in the asset. The expected future cash flow that is projected should include all of the economic benefits attributable to the asset, including the tax savings associated with the amortization of the intangible asset value over the tax life of the asset. The income approach may take the form of a “relief from royalty” methodology, a cost savings methodology, a “with and without” methodology, or excess earnings methodology, depending on the specific asset under consideration.
Long-Lived Assets. We periodically evaluate the carrying value of the unamortized balances of our long-lived assets, including property, plant and equipment, rental assets and intangible assets, which requires us to make assumptions and judgments regarding the carrying value of these assets. We consider assets to be impaired if the carrying value may not be recoverable based upon our assessment of the following events or changes in circumstances: the asset’s ability to continue to generate income from operations and positive cash flow in future periods; loss of legal ownership or title to the asset; significant changes in our strategic business objectives and utilization of the asset; or significant negative industry or economic trends.
Our assessment includes comparing the carrying amounts of long-lived assets to their associated undiscounted expected future cash flows, which are determined using an expected cash flow model. This model requires estimates of our future revenues, profits, capital expenditures, working capital and other relevant factors. We estimate these amounts by evaluating our historical trends, current budgets, operating plans and other industry data. If the assets are considered to be impaired, the impairment charge recognized is the amount by which the asset’s carrying value exceeds its estimated fair value.
The timing and frequency of our impairment test is based on an ongoing assessment of triggering events that could reduce the fair value of our long-lived assets below their carrying value. We monitor our long-lived asset balances and conduct formal tests on at least an annual basis or earlier when impairment indicators are present. We believe that the assumptions and estimates we used to value long-lived assets were appropriate based on the information available to management. The majority of our long-lived assets are being amortized or depreciated over approximately two to ten years. As most of these assets are associated with technology or trade conditions that may change rapidly; such changes could have an immediate impact on our impairment analysis.
Valuation of Goodwill. Our goodwill resulted from our acquisitions of FW and Ctrack during 2015. In accordance with the ASC 350, Intangibles—Goodwill and Other, we will review goodwill for impairment at least annually, typically at the beginning of the fourth quarter of each year, and more frequently if events or changes in circumstances occur that indicate a potential reduction in the fair value of the reporting unit to which the goodwill has been assigned below its carrying value.
Convertible Debt. We account for convertible debt instruments that are settleable in cash upon conversion (including partial cash settlement) by separating the liability and equity components of the instruments in a manner that reflects our nonconvertible debt borrowing rate. We determine the carrying amount of the liability component by measuring the fair value of similar debt instruments that do not have the conversion feature. If a similar debt instrument does not exist, we estimate the fair value by using assumptions that market participants would use in pricing a debt instrument, including market interest rates, credit standing, yield curves and volatilities. Determining the fair value of the debt component requires the use of accounting estimates and assumptions. These estimates and assumptions are judgmental in nature and could have a significant impact on the determination of the debt component and the associated non-cash interest expense.
Upon issuance, we assign a value to the debt component equal to the estimated fair value of similar debt instruments without the conversion feature, which could result in our recording the debt instrument at a discount. If the debt instrument is recorded at a discount, we amortize the debt discount over the life of the debt instrument as additional non-cash interest expense utilizing the effective interest method.
Provision for Warranty Costs. We accrue warranty costs based on estimates of future warranty related replacement, repairs or rework of products. Our warranty policy generally provides between one and three years of coverage for products following the date of purchase. Our policy is to accrue the estimated cost of warranty coverage as a component of cost of revenue in the consolidated statements of operations at the time revenue is recognized. In estimating our future warranty obligations we consider various relevant factors, including the historical frequency and volume of claims, and the cost to replace or repair products under warranty. The warranty provision for our products is determined by using a financial model to estimate future warranty costs. Our financial model takes into consideration actual product failure rates; estimated replacement over the contractual warranty period, repair or rework expenses; and potential risks associated with our different products. The risk levels, warranty cost information, and failure rates used within this model are reviewed throughout the year and updated, if and when, these inputs change.
We actively engage in product improvement programs and processes to limit our warranty costs, but our warranty obligation is affected by the complexity of our product, product failure rates and costs incurred to correct those product failures. The industry in which we operate is subject to rapid technological change, and as a result, we periodically introduce newer, more complex products. Depending on the quality of our product design and manufacturing, actual product failure rates or actual warranty costs could be materially greater than our estimates, which could harm our financial condition and results of operations.
Fair value of warrant liability. We evaluate stock options, stock warrants or other contracts to determine if those contracts or embedded components of those contracts qualify as derivative financial instruments to be separately accounted for under the relevant sections of Financial Accounting Standards Board (“FASB”) Accounting Standards Codification (“ASC”) 815-40, Derivative Instruments and Hedging: Contracts in Entity’s Own Equity. The result of this accounting treatment could be that the fair value of a financial instrument is classified as a derivative financial instrument and is marked-to-market at each balance sheet date and recorded as an asset or liability. In the event that the fair value is recorded as an asset or liability, the change in fair value is recorded in the statement of operations as other income or other expense. Upon conversion, exercise or expiration of a derivative financial instrument, the instrument is marked to fair value and then that fair value is reclassified to equity.
Litigation. We are currently involved in certain legal proceedings. We will record a loss when we determine information available prior to the issuance of the financial statements indicates the loss is both probable and estimable. Where a liability is probable and there is a range of estimated loss with no best estimate in the range, we record the minimum estimated liability related to the claim. As additional information becomes available, we assess the potential liability related to our pending litigation and revise our estimates, if necessary. Our policy is to expense litigation costs as incurred.
Share-based Compensation Expense.Compensation. We have stock incentive plans under which stock options and restricted stock units have been granted to employees and non-employee members of our Board of Directors. We also have an employee stock purchase plan for all eligible employees. Share-based payments to employees, including grants of employee stock options, restricted stock units and employee stock purchase rights, are recognized in the financial statements based upon their respective grant date fair values.
We estimate the fair value of stock option awards and stock purchase rights on the date of grant using an option-pricing model. The value of the portion of the award that is ultimately expected to vest is principally recognized as expense ratably over the requisite service periods. We have estimated the fair value of stock options and stock purchase rights as of the date of grant or assumption using the Black-Scholes option pricingoption-pricing model, which was developed for use in estimating the value of traded options that have no vesting restrictions and that are freely transferable. The Black-Scholes model considers, among other factors, the expected life of the award and the expected volatility of our stock price. We evaluate the assumptions used to value stock options and stock purchase rights on a quarterly basis. Although the Black-Scholes model is an acceptable model, the fair values generated by the model may not be indicative of the actual fair values of our equity awards, as it does not consider other factors important to those awards to employees, such as continued employment, periodic vesting requirements and limited transferability.
Compensation cost associated with grants of restricted stock units are measured at fair value, which has historically been the closing price of our stock on the date of the grant.
Item 7A. Quantitative and Qualitative Disclosures About Market Risk
Interest Rate Risk
Our investment portfolio is maintained in accordance with our investment policy that defines allowable investments, specifies credit quality standards and limits our credit exposure to any single issuer. The fair value of our cash equivalents and marketable debt securities is subject to change as a result of changes in market interest rates and investment risk related to the issuers’ credit worthiness. At December 31, 2014, we had $17.9 million in cash and cash equivalents. Changes in market interest rates would not be expected to have a material impact on the fair value of our $2.1 million in cash equivalents at December 31, 2014, as these consisted of money market funds and certificates of deposit with the value of all of our cash equivalents determined based on “Level 1” and "Level 2" inputs, which consist of quoted prices in active markets for identical assets.
As of December 31, 2014, we do not hold any debt securities nor do we utilize derivative instruments or other financial contracts to manage our exposure to changes in interest rates in our investment portfolio.
Credit Risk
We maintain our cash and cash equivalents and our marketable debt securities, which include various security holdings, types and maturities, with a number of financial institutions. As of the date of this report, we have not identified any significant credit risk associated with any of the financial institutions that maintain our portfolio of cash and cash equivalents and our marketable securities. However, our ability to support our working capital needs depends, in part, on our available cash, cash equivalents, and marketable securities. As a result, any significant decrease in the value of our investments may materially adversely impact our ability to support our working capital needs.
We place our cash investments in instruments that meet credit quality standards specified in our investment policy guidelines at the time the investments are made. At December 31, 2014, we have cash and cash equivalents of $17.9 million, all of which are stated at fair value. Changes in market interest rates would not be expected to have a material impact on the fair value of our $2.1 million in cash equivalents at December 31, 2014, as these consisted of money market funds and certificates of deposit with maturities of less than three months, with the value of all of our cash equivalents determined based on “Level 1” and "Level 2" inputs, which consist of quoted prices in active markets for identical assets.
Money market funds attempt to maintain a net asset value, ("NAV"), of $1 per unit of investment. Should the underlying investments held by these money market funds suffer significant losses to market value dueexposed to interest rate changes or perceived counterparty risk, primarily through our borrowing activities under the NAV of these money market fundsCredit Agreement discussed under “Liquidity and Capital Resources” above. We may suffer declines below the targeted $1 NAV. We hold money market funds that target a balance of investment return and preservation of invested capital through diversified holdings. As such, we do not believe we currently have significantmanage exposure to NAV declinesthis risk through our operating and financing activities and, when deemed appropriate, through the use of derivative financial instruments. Derivative financial instruments are viewed as risk management tools and are not used for speculation or for trading purposes. Our Term Loan under the Credit Agreement is variable-rate debt bearing interest at a rate equal to the three-month LIBOR, but in no event less than 1.00%, plus 7.625%.
Based on our money market holdings.current outstanding balance, if interest rates were to increase or decrease by 1%, the corresponding increase or decrease, as applicable, in interest expense on our variable-rate debt would increase or decrease, as applicable, future earnings and cash flows by approximately $0.5 million per year.
Foreign Currency Exchange Rate Risk
We generate Euro-denominated accounts receivableForeign currency transaction exposure results primarily from sales tointercompany transactions and transactions with customers that are membersor vendors denominated in currencies other than the functional currency of the European Union. Duringlegal entity in which the year ended December 31, 2014, Euro-denominated revenue was approximately $133,000 which represents less than 1% of our total net revenues compared to less than 1% in the same period last year. Although we are exposed to market risktransaction is recorded by us. Assets and liabilities arising from changessuch transactions are translated into the legal entity’s functional currency using the exchange rate in foreigneffect at the balance sheet date. Any gain or loss resulting from currency exchange rates, principally the change in the value of the Euro versus the U.S. Dollar,fluctuations is recorded as Euro-denominated revenue is not considered significant, we did not enter into any foreign exchange contracts during the year ended December 31, 2014. If our net revenues increase in the foreseeable future, we may enter into foreign exchange contracts to mitigate this risk. These forward currency foreign exchange contracts would cover a portion, generally 50% to 80%, but may cover up to 100%, of our Euro-based financial assets.
At December 31, 2014, we had no outstanding forward contracts. During the year ended December 31, 2014, we recorded approximately $2,700 in unrealized foreign currency losses related to our outstanding Euro-denominated accounts receivable balances. Both the unrealized gain on the outstanding forward contracts and the unrealized gains on outstanding Euro-denominated receivables were recorded in other income (expense), net in our consolidated statementstatements of operations.
Assumingoperations, except for the non-cash change in acquisition-related escrow which is shown as a translationseparate line item in our consolidated statements of our Euro-denominated revenueoperations. Net foreign currency transaction gains of approximately $0.2 million were recorded for the year ended December 31, 2014 at an average Euro-to-U.S. Dollar exchange rate of $1.33 and a uniform ten percent strengthening or weakening of this exchange rate, we estimate that income before income taxes for2017.
For the year ended December 31, 2014 would increase or decrease, respectively,2017, approximately 28.1% of our revenues and approximately 46.9% of our operating expenses were generated by approximately $53,000. This analysis doessubsidiaries whose functional currency is not give effectthe U.S. Dollar and therefore are subject to any forward currency foreign exchange contracts that may be used to hedge foreign currency risk.
Actual gainstranslation exposure. These foreign functional currencies primarily consist of the South African Rand, Great British Pound, Euro, Australian Dollar and lossesChinese Yuan (collectively, the “Foreign Functional Currencies”). A 10% change in the future may differ materially from the hypothetical gains and losses discussed above based on fluctuations in interest and foreign currency exchange rates and our actual exposure and hedging transactions.
Our sales to non-European Union countries are typically denominated in U.S. Dollars. Competitive conditions in the markets in which we operate may limit our ability to increase prices in the event of adverse changes in currency exchange rates. Sales of these products are affected by the value of the U.S. Dollar relative to other currencies,the Foreign Functional Currencies during 2017 would have changed our revenue by approximately $6.2 million and our operating expenses by approximately $4.2 million. A 10% change in particular, the Euro. Any long-term strengtheningvalue of the U.S. Dollar could depressrelative to any of the demandother currencies in which we receive revenues or incur operating expenses would not have had a material impact on our foreign currency transaction gains or losses.
Foreign currency translation exposure results from the translation of the financial statements of our subsidiaries whose functional currency is not the U.S. Dollar into U.S. Dollars for consolidated reporting purposes. The balance sheets of these subsidiaries are translated into U.S. manufactured products, reduce sales,Dollars using period end exchange rates and their income statements are translated into U.S. Dollars using the average exchange rate over the period. Resulting currency translation adjustments are recorded in accumulated other comprehensive income (loss) in our consolidated balance sheets. Net foreign currency translation gains of $6.0 million were recorded for the year ended December 31, 2017.
As of December 31, 2017, approximately 58.8% of our assets and approximately 9.1% of our liabilities were subject to foreign currency translation exposure. A 10% change in the value of the U.S. Dollar relative to the Foreign Functional Currencies or cause usany of the other currencies in which our assets or liabilities are denominated would not have had a material impact on our net foreign currency translation gain or loss.
The Company continuously monitors opportunities to reduce per unit selling prices.potential monetary risks that may arise from our foreign operations.
Item 8. Financial Statements and Supplementary Data
The index to ourOur consolidated financial statements and the Report of Independent Registered Public Accounting Firm appears in Part IV of this report.
Item 9. Changes in and Disagreements With Accountants on Accounting and Financial Disclosure
None.
Item 9A. Controls and Procedures
Evaluation of Disclosure Controls and Procedures
We maintain disclosure controls and procedures (as defined in Rule 13a-15(e) under the Securities Exchange Act of 1934, as amended)Act) that are designed to provide reasonable assurance that information required to be disclosed in our reports to the SEC is recorded, processed, summarized and reported within the time periods specified in the SEC'sSEC’s rules and forms, and that such information is accumulated and communicated to our management, including our principal executive officer and our principal financial and accounting officer, as appropriate, to allow timely decisions regarding required disclosure.
As required by SEC rules, we carried out an evaluation, under the supervision and with the participation of our management, including our principal executive officer and our principal financial and accounting officer, of the effectiveness of the design and operation of our disclosure controls and procedures as of December 31, 2014,2017, the end of the period covered by this report. Based on the foregoing, our principal executive officer and principal financial and accounting officer concluded that our disclosure controls and procedures were effective as of December 31, 2014.
Changes in Internal Control Over Financial Reporting
An evaluation was also performed under the supervision and with the participation of our management, including our principal executive officer and our principal financial and accounting officer, of any change in our internal control over financial reporting that occurred during our last fiscal quarter and that has materially affected, or is reasonably likely to materially affect, our internal control over financial reporting. The evaluation did not identify any change in our internal control over financial reporting that occurred during our latest fiscal quarter and that has materially affected, or is reasonably likely to materially affect, our internal control over financial reporting.2017.
Management’s Annual Report on Internal Control Over Financial Reporting
Our management is responsible for establishing and maintaining adequate internal control over financial reporting, as such term is defined in Exchange Act Rules 13a-15(f) and 15d-15(f). Our internal control over financial reporting is a process designed to provide reasonable assurance regarding the reliability of financial reporting and the preparation of the financial statements for external purposes in accordance with generally accepted accounting principles. Because of its inherent limitations, internal control over financial reporting may not prevent or detect misstatements. Also, projections of any evaluation of effectiveness to future periods are subject to the risk that internal controls may become inadequate because of changes in conditions, or thatbecause the degree of compliance with policies and procedures may deteriorate.
Under the supervision and with the participation of our management, including our principal executive officer and principal financial officer, we conducted an evaluation of the effectiveness of our internal control over financial reporting based on the framework set forth in by the Committee of Sponsoring Organizations of the Treadway Commission (COSO) (2013 framework) in Internal Control—Integrated Framework. Based on our evaluation under the framework in Internal Control—Integrated Framework, our management concluded that our internal control over financial reporting was effective as of December 31, 2014.2017.
Ernst & Young LLP,Mayer Hoffman McCann P.C., the independent registered public accounting firm that audited the consolidated financial statements included in this Annual Report on Form 10-K, has also audited our internal control over financial reporting as of December 31, 2014,2017, as stated in their report which is included herein.
Remediation of Previously Identified Material Weakness
As disclosed in our Annual Report on Form 10-K for the year ended December 31, 2016, we previously identified a material weakness in our internal controls specifically from a lack of sufficient resources in key accounting and financial reporting roles within the organization necessary to prepare financial statements in time to meet regulatory filing requirements. This lack of sufficient resources was the result of a significant number of unusual and one-time challenges to the Company’s personnel and financial reporting processes, including, but not limited to, implementing the Reorganization, preparing for the anticipated divestiture of the MiFi Business and closure of the Company’s accounting function in Eugene, Oregon.
Beginning in the second quarter of 2017, we initiated an active program to: (a) hire additional employees and upgrade certain accounting positions to provide further support to our finance and accounting team; (b) provide additional functional and system training to employees; (c) document and formalize our accounting policies and internal control processes and to help strengthen supervisory reviews by our management; and (d) design and implement monthly manual controls to manage our financial reporting close processes and to help ensure timely preparation of financial statements. We believe that the additional resources provided from this program have remediated the previous material weakness that was caused by a lack of sufficient resources.
Changes in Internal Control over Financial Reporting
An evaluation was also performed under the supervision and with the participation of our management, including our principal executive officer and our principal financial and accounting officer, of any change in our internal control over financial reporting that occurred during our last fiscal quarter and that has materially affected, or is reasonably likely to materially affect, our internal control over financial reporting. Except as set forth above, the evaluation did not identify any change in our internal control over financial reporting that occurred during our latest fiscal quarter and that has materially affected, or is reasonably likely to materially affect, our internal control over financial reporting.
Item 9B. Other Information
NoneNone.
Report of Independent Registered Public Accounting Firm
The Board of Directors and Stockholders
Novatel Wireless, Inc.:
We have audited Novatel Wireless Inc.’s internal control over financial reporting as of December 31, 2014, based on criteria established in Internal Control-Integrated Framework issued by the Committee of Sponsoring Organizations of the Treadway Commission (2013 framework) (the COSO criteria). Novatel Wireless Inc.’s management is responsible for maintaining effective internal control over financial reporting, and for its assessment of the effectiveness of internal control over financial reporting included in the accompanying Management’s Annual Report on Internal Control Over Financial Reporting. Our responsibility is to express an opinion on the company’s internal control over financial reporting based on our audit.
We conducted our audit in accordance with the standards of the Public Company Accounting Oversight Board (United States). Those standards require that we plan and perform the audit to obtain reasonable assurance about whether effective internal control over financial reporting was maintained in all material respects. Our audit included obtaining an understanding of internal control over financial reporting, assessing the risk that a material weakness exists, testing and evaluating the design and operating effectiveness of internal control based on the assessed risk, and performing such other procedures as we considered necessary in the circumstances. We believe that our audit provides a reasonable basis for our opinion.
A company’s internal control over financial reporting is a process designed to provide reasonable assurance regarding the reliability of financial reporting and the preparation of financial statements for external purposes in accordance with generally accepted accounting principles. A company’s internal control over financial reporting includes those policies and procedures that (1) pertain to the maintenance of records that, in reasonable detail, accurately and fairly reflect the transactions and dispositions of the assets of the company; (2) provide reasonable assurance that transactions are recorded as necessary to permit preparation of financial statements in accordance with generally accepted accounting principles, and that receipts and expenditures of the company are being made only in accordance with authorizations of management and directors of the company; and (3) provide reasonable assurance regarding prevention or timely detection of unauthorized acquisition, use, or disposition of the company’s assets that could have a material effect on the financial statements.
Because of its inherent limitations, internal control over financial reporting may not prevent or detect misstatements. Also, projections of any evaluation of effectiveness to future periods are subject to the risk that controls may become inadequate because of changes in conditions, or that the degree of compliance with the policies or procedures may deteriorate.
In our opinion, Novatel Wireless, Inc. maintained, in all material respects, effective internal control over financial reporting as of December 31, 2014, based on the COSO criteria.
We also have audited, in accordance with the standards of the Public Company Accounting Oversight Board (United States), the consolidated balance sheets of Novatel Wireless, Inc. as of December 31, 2014 and 2013, and the related consolidated statements of operations, comprehensive loss, stockholders’ equity, and cash flows for each of the three years in the period ended December 31, 2014, of Novatel Wireless, Inc. and our report dated March 9, 2015 expressed an unqualified opinion thereon.
/s/ ERNST & YOUNG LLP
San Diego, California
March 9, 2015
PART III
Item 10. Directors, Executive OfficersItems 10, 11, 12, 13 and Corporate Governance14.
(a)Identification of Directors.The information underrequired by Items 10, 11, 12, 13 and 14 is incorporated by reference from the caption “Election of Directors” appearing in the Proxy Statement to be filedCompany’s definitive proxy statement for the 20152018 Annual Meeting of Stockholders, is incorporated herein by reference.
(b)Identification of Executive Officers. The information underwhich the caption “Executive Officers” appearing inCompany intends to file with the Proxy Statement to be filed for the 2015 Annual Meeting of Stockholders is incorporated herein by reference.
(c)Compliance with Section 16(a)SEC within 120 days of the Exchange Act. The information under the caption “Section 16(a) Beneficial Ownership Reporting Compliance” appearing in the Proxy Statement to be filed for the 2015 Annual Meeting of Stockholders is incorporated herein by reference.
(d)Code of Ethics. We have adopted a Code of Conduct and Ethics which, together with the policies referred to therein, is applicable to all of our directors, officers and employees. The Code of Conduct and Ethics is intended to cover all areas of professional conduct, including conflicts of interest, disclosure obligations, insider trading and confidential information, as well as compliance with all laws, rules and regulations applicable to our business. We encourage all employees, officers and directors to promptly report any violations of any of our policies. The Code of Conduct and Ethics is posted on our website at www.novatelwireless.com in the Investors tab under “Corporate Governance.” In the event that a substantive amendment to, or a waiver from, a provisionend of the Code of Conduct and Ethics that appliesfiscal year end to our principal executive officer or principal financial and accounting officer is necessary, we intend to post such information on our website.which this report relates.
(e)Audit Committee. The information under the caption “The Board, Its Committees and Its Compensation—Audit Committee” appearing in the Proxy Statement to be filed for the 2015 Annual Meeting of Stockholders is incorporated herein by reference.
Item 11. Executive Compensation
The information under the headings “Executive Compensation,” “The Board, Its Committees and Its Compensation—Director Compensation,” “Compensation Discussion and Analysis” and “Compensation Committee Report” appearing in the Proxy Statement to be filed for the 2015 Annual Meeting of Stockholders is incorporated herein by reference.
Item 12. Security Ownership of Certain Beneficial Owners and Management and Related Stockholder Matters
The information under the headings “Security Ownership of Management and Certain Beneficial Owners” and “Equity Compensation Plan Information” appearing in the Proxy Statement to be filed for the 2015 Annual Meeting of Stockholders is incorporated herein by reference.
Item 13. Certain Relationships and Related Transactions, and Director Independence
The information under the headings “Review and Approval of Transactions with Related Parties” and “The Board, Its Committees and Its Compensation—Director Independence” appearing in the Proxy Statement to be filed for the 2015 Annual Meeting of Stockholders is incorporated herein by reference.
Item 14. Principal Accountant Fees and Services
The information under the heading “Independent Public Accountants” appearing in the Proxy Statement to be filed for the 2015 Annual Meeting of Stockholders is incorporated herein by reference.
PART IV
Item 15. Exhibits and Financial Statement Schedules
(a) 1. Index to consolidated financial statements
See Index to consolidated financial statements on page F-1.
2. Index to financial statement schedules
The following financial statement schedules for the years ended December 31, 2014, 2013, and 2012 should be read in conjunction with the consolidated financial statements, and related notes thereto.
| |
| (a)(1) | The Company’s consolidated financial statements and report of the Mayer Hoffman McCann P.C., Independent Registered Public Accounting Firm, are included in Section IV of this report beginning on page F-1. |
| |
| (a)(2) | The following financial statement schedules for the years ended December 31, 2017, 2016 and 2015 should be read in conjunction with the consolidated financial statements, and related notes thereto. |
|
| |
| Schedule | Page |
| Schedule II—Valuation and Qualifying Accounts | |
Schedules not listed above have been omitted because they are not applicable or are not required or the information required to be set forth therein is included in the consolidated financial statements or related notes thereto.
(b) Exhibits
The following Exhibits are filed as part of, or incorporated by reference into this report:
|
| | |
Exhibit Number
No. | | Description |
| | | |
| 2.1 | | Agreement and Plan of Merger, dated March 27, 2015, by and among Novatel Wireless, Inc., Duck Acquisition, Inc., R.E.R. Enterprises, Inc., the stockholders of R.E.R. Enterprises, Inc. and Ethan Ralston, as the representative of Novemberthe stockholders (incorporated by reference to Exhibit 2.1 to the Company’s Current Report on Form 8-K, filed April 1, 2015). |
| | |
| 2.2 | | Amendment No. 1 to Agreement and Plan of Merger, dated January 5, 2010,2016, by and among Novatel Wireless, Inc., Duck Acquisition, Inc., R.E.R. Enterprises, Inc., certain stockholders of R.E.R. Enterprises, Inc. and Ethan Ralston, as the representative of the R.E.R. stockholders (incorporated by reference to Exhibit 2.1 to the Company’s Current Report on Form 8-K, filed January 11, 2016). |
| | |
| 2.3 | | |
| | |
| 2.4 | | |
| | |
| 2.5 | | |
| | |
| 2.6 | | |
| | | |
| 3.1 | | |
| | | |
| 3.2 | | Certificate of Amendment to |
| | | |
| 3.3 | | Certificate of Amendment to Amended and Restated Certificate of Incorporation (incorporated by reference to Exhibit 3.2 to the Company’s Amendment No. 1 to Form 10-K on Form 10-K/A for the year ended December 31, 2003, filed March 31, 2004). |
| | |
3.4** | | Certificate of Amendment to Amended and Restated Certificate of Incorporation. |
| | |
3.5 | | Amended and Restated |
| | |
3.6 | | Certificate of Designation of Series B Convertible Preferred Stock (incorporated by reference to Exhibit 3.5 to the Company’s Amendment No. 1 to Form 10-K on Form 10-K/A for the year ended December 31, 2003, filed March 31, 2004). |
| | |
3.7 | | Certificate of Designation of Series C Convertible Preferred StockInseego Corp. (incorporated by reference to Exhibit 3.1 to the Company’s Current Report on Form 8-K, filed September 8, 2014)January 22, 2018). |
| | |
3.8 | | Second Amended and Restated Bylaws (incorporated by reference to Exhibit 3.1 to the Company’s Current Report on Form 8-K, filed February 19, 2015). |
| | | |
| 4.1 | | Amended and Restated Registration Rights Agreement, dated as of June 15, 1999, by and among the Company and certain of its stockholders (incorporated by reference to Exhibit 10.4 to the Company’s Registration Statement on Form S-1 (No. 333-42570), filed July 28, 2000, as amended). |
| | |
4.2 | | |
| | |
4.3 | | Registration Rights Agreement, dated as of March 12, 2003, entered into in connection with the Company’s 2003 Series B Convertible Preferred Stock Financing (incorporated by reference to Exhibit 4.8 to the Company’s Current Report on Form 8-K, filed March 28, 2003). |
| | | |
|
| | |
Exhibit Number
No. | | Description |
| 4.2 | | |
4.4 | | Registration Rights Agreement, dated as of January 13, 2004, entered into in connection with the Company’s January 2004 Common Stock and Warrant Financing Transaction (incorporated by reference to Exhibit 10.21 to the Company’s Annual Report on Form 10-K for the year ended December 31, 2003, filed March 15, 2004). |
| | |
4.5 | | Stipulation of Settlement, dated January 31, 2014 and effective as of June 20, 2014 (incorporated by reference to Exhibit 4.1 to the Company’s Quarterly Report on Form 10-Q for the period ended June 30, 2014, filed August 8, 2014). |
| | |
4.6 | | Promissory Note, dated July 3, 2014 (incorporated by reference to Exhibit 4.2 to the Company’s Quarterly Report on Form 10-Q for the period ended June 30, 2014, filed August 8, 2014). |
| | |
4.7 | | Security Agreement, dated July 3, 2014 (incorporated by reference to Exhibit 4.3 to the Company’s Quarterly Report on Form 10-Q for the period ended June 30, 2014, filed August 8, 2014). |
| | |
4.8 | | Final Judgment and Order of Dismissal With Prejudice, dated June 23, 2014 (incorporated by reference to Exhibit 4.4 to the Company’s Quarterly Report on Form 10-Q for the period ended June 30, 2014, filed August 8, 2014). |
| | |
4.9 | | Order Granting Motion to Amend the Judgment Date, dated July 8, 2014 (incorporated by reference to Exhibit 4.5 to the Company’s Quarterly Report on Form 10-Q for the period ended June 30, 2014, filed August 8, 2014). |
| | |
4.10 | | Warrant to Purchase Common Stock issued to HC2 Holdings 2, Inc., dated September 8, 2014 (incorporated by reference to Exhibit 4.1 to the Company’s Current Report on Form 8-K, filed September 8, 2014). |
| | |
4.11 | | |
| | | |
10.14.3 | | Credit and Security Agreement,Warrant to Purchase Common Stock issued to HC2 Holdings 2, Inc., dated as of October 31,September 8, 2014 by and among Novatel Wireless, Inc. and Enfora, Inc., as Borrowers, and Wells Fargo Bank, National Association, as Lender (incorporated by reference to Exhibit 10.1 to the Company’s Current Report on Form 8-K, filed November 6, 2014). |
| | |
10.2 | | Purchase Agreement, dated September 3, 2014, by and between Novatel Wireless, Inc. and HC2 Holdings 2, Inc. (incorporated by reference to Exhibit 10.14.1 to the Company’s Current Report on Form 8-K, filed September 8, 2014). |
| | | |
10.34.4 | | Memorandum of Understanding: In re Novatel Wireless Secs. Litig., Civil Action No. 08-CV-01689-AJB (RBB) United States District Court for the Southern District of California, executed December 6, 2013 |
| | |
10.4 | | Letter Agreement, dated as of April 29, 2014, by and among the Company and each of Cobb H. Sadler, Edward T. Shadek, Robert Ellsworth, Alex Mashinsky, Richard A. Karp, Maguire Financial, LP, a Delaware limited partnership, Maguire Asset Management, LLC, a Delaware limited liability company, and Timothy Maguire (incorporated by reference to Exhibit 10.14.1 to the Company’s Current Report on Form 8-K, filed May 6, 2014)April 1, 2015). |
| | | |
10.54.5 | | Confirmation Letter,Indenture, dated July 3, 2014, byJanuary 9, 2017, between Inseego Corp. and among the Company and each of Cobb H. Sadler, Edward T. Shadek, Robert Ellsworth, Maguire Financial, LP, a Delaware limited partnership, Maguire Asset Management, LLC, a Delaware limited liability company, and Timothy MaguireWilmington Trust, National Association, as Trustee (incorporated by reference to Exhibit 10.14.2 to the Company’s Current Report on Form 8-K, filed JulyJanuary 10, 2014)2017). |
| | | |
10.6*4.6 | | Amended and Restated 1997 Employee Stock Option Plan (“1997 Plan”) |
| | | |
10.7*4.7 | | |
| | |
| 4.8 | | |
| | |
| 4.9 | | |
| | |
| 4.10 | | |
| | |
| 4.11 | | |
| | |
| 10.1* | | |
| | | |
10.8*10.2* | | |
| | | |
10.9*10.3* | | |
| | | |
10.10*10.4* | | Form of Amendment of Stock Option Agreements, dated July 20, 2006, by and between the Company and Optionee with respect to the 1997 Plan (incorporated by reference to Exhibit 10.2 to the Company’s Quarterly Report on Form 10-Q for the period ended September 30, 2006, filed November 9, 2006). |
| | |
|
| | |
Exhibit
Number
| | Description |
10.11* | | Form of Amendment of Stock Option Agreements, dated July 20, 2006, by and between the Company and Optionee with respect to the 2000 Plan (incorporated by reference to Exhibit 10.3 to the Company’s Quarterly Report on Form 10-Q for the period ended September 30, 2006, filed November 9, 2006). |
| | | |
10.12*10.5* | | |
| | | |
10.13*10.6* | | Amended and Restated Novatel Wireless, Inc. 2000 Employee Stock Purchase Plan (incorporated by reference to Appendix A to the Company’s Proxy Statement on Schedule 14A filed May 2, 2011). |
| | |
10.14* | | |
| | | |
10.15*10.7* | | |
| | | |
10.16*10.8* | | Form of Indemnification Agreement (incorporated by reference to Exhibit 10.2 to the Company’s Current Report on Form 8-K, filed November 6, 2014). |
| | |
10.17* | | Form of Change of Control Letter Agreement by |
| | |
10.18* | | 2009 Omnibus Incentive Compensation Plan (incorporated by reference to Appendix A to the Company’s Proxy Statement on Schedule 14A, filed October 14, 2014). |
| | |
10.19* | | 2009 Omnibus Incentive Compensation Plan (incorporated by reference to Appendix B to the Company’s Proxy Statement on Schedule 14A, filed April 30, 2013). |
| | |
10.20* | | 2010 Senior Management IncentiveRestated Inseego Corp. 2000 Employee Stock Purchase Plan (incorporated by reference to Exhibit 10.1 to the Company’s Current Report on Form 8-K, filed September 13, 2010)June 15, 2017). |
| | | |
10.21* |
| | |
| Exhibit No. | | 2011 Senior Management Incentive Plan (incorporated by reference to Exhibit 10.1 to the Company’s Quarterly Report on Form 10-Q for the period ended June 30, 2011, filed on August 9, 2011).Description |
| 10.9* | | |
10.22* | | 2012 Senior Management Incentive Plan (incorporated by reference to Exhibit 10.1 to the Company’s Current Report on Form 8-K, filed July 6, 2012). |
| | |
10.23* | | 2013 Senior Management Incentive Plan (incorporated by reference to Exhibit 10.1 to the Company's Current Report on Form 8-K, filed March 22, 2013). |
| | |
10.24** | | 2014 Retention Bonus Plan. |
| | |
10.25* | | Employment Agreement, |
| | |
10.26* | | Letter Agreement, dated as of April 29, 2014,August 11, 2017, by and between the Company and Peter V. Leparulo (incorporated by reference to Exhibit 10.2Stephen Smith with an employment start date of the Company’s Current Report on Form 8-K, filed May 6, 2014). |
| | |
10.27* | | Form of Severance Agreement between Novatel Wireless, Inc. and each of Kenneth G. Leddon and Robert M. HadleyAugust 21, 2017 (incorporated by reference to Exhibit 10.1 to the Company’s Current Report on Form 8-K, filed August 2, 2010)21, 2017). |
| | | |
10.28*10.10* | | Employment |
| | | |
10.29*10.11* | | Offer Letter, dated November 2, 2014, by and between Novatel Wireless, Inc. and Alex Mashinsky |
| | | |
10.30*10.12* | | |
| | |
|
| | |
Exhibit
Number
| | Description |
| | | |
10.31*10.13* | | |
| | |
| 10.14* | | |
| | |
| 10.15* | | |
| | |
| 10.16* | | |
| | |
| 10.17* | | |
| | |
| 10.18* | | |
| | | |
2110.19* | | Subsidiaries of Novatel Wireless, Inc. |
| | |
| 10.20* | | |
| | |
| 10.21* | | |
| | |
| 10.22* | | |
| | |
| 10.23* | | |
| | |
| 10.24* | | |
| | |
| 10.25* ** | | |
| | |
| 10.26* ** | | |
| | |
| 10.27* ** | | |
| | |
| 10.28 | | |
| | |
| 10.29 | | Credit Agreement, dated as of May 8, 2017, by and among Inseego Corp., as the Borrower, certain subsidiaries of the Borrower, as Guarantors, and Lakestar Semi Inc., as Lender (incorporated by reference to Exhibit 10.1 to the Company’s Quarterly Report on Form 10-Q, filed August 9, 2017). |
| | |
|
| | |
| Exhibit No. | | Description |
| 10.30 | | Security and Pledge Agreement, dated as of May 8, 2017, by and among Inseego Corp., as the Borrower, certain subsidiaries of the Borrower, as Grantors, and Lakestar Semi Inc., as Lender (incorporated by reference to Exhibit 10.2 to the Company’s Quarterly Report on Form 10-Q, filed August 9, 2017). |
| | |
| 10.31 | | Credit Agreement, dated as of August 23, 2017, by and among Inseego Corp. and certain of its direct and indirect subsidiaries, Cantor Fitzgerald Securities, as Agent, and certain funds managed by Highbridge Capital Management, LLC, as Lenders (incorporated by reference to Exhibit 10.1 to the Company’s Quarterly Report on Form 10-Q, filed on November 7, 2017). |
| | |
| 10.32 | | |
| | |
| 10.33 | | |
| | |
| 10.34* | | |
| | |
| 10.35* | | |
| | |
| 10.36* | | |
| | |
| 21** | | |
| | | |
| 23.1** | | |
| | |
| 23.2** | | |
| | | |
| 24** | | |
| | | |
| 31.1** | | |
| | | |
| 31.2** | | |
| | | |
| 32.1** | | |
| | | |
| 32.2** | | |
| | | |
| 101** | | The following financial statements and footnotes from the Novatel Wireless, Inc.Inseego Corp. Annual Report on Form 10-K for the year ended December 31, 20142017 formatted in eXtensible Business Reporting Language (XBRL): (i) Consolidated Balance Sheets; (ii) Consolidated Statements of Operations; (iii) Consolidated Statements of Comprehensive Loss; (iv) Consolidated Statements of Stockholders’ Equity;Equity (Deficit); (v) Consolidated Statements of Cash Flows; and (vi) the Notes to Consolidated Financial Statements. |
| | | |
| * | | Management contract, compensatory plan or arrangement |
| | | |
| ** | | Filed herewith |
| | |
Item 16. Form 10-K Summary
None.
SIGNATURES
Pursuant to the requirements of Section 13 or 15(d) of the Securities Exchange Act of 1934, the Registrant has duly caused this report to be signed on its behalf by the undersigned, thereunto duly authorized.
|
| | | | |
Date: March 9, 201515, 2018 | | NOVATEL WIRELESS, INC.
INSEEGO CORP. |
| | | |
| | | By | | /s/ ALEX MASHINSKY Dan Mondor |
| | | | | Alex MashinskyDan Mondor |
| | | | | Chief Executive Officer (Principal Executive Officer) |
POWER OF ATTORNEY
Know all men by these presents, that each person whose signature appears below constitutes and appoints Alex MashinskyDan Mondor and Michael Newman,Stephen Smith, or either of them, as his or her true and lawful attorneys-in-fact and agents, with full power of substitution, for him or her and in his or her name, place and stead, in any and all capacities, to sign any and all amendments to this Annual Report on Form 10-K, and to file the same, with all exhibits thereto, and other documents in connection therewith, with the Securities and Exchange Commission, granting unto said attorneys-in-fact and agents, full power and authority to do and perform each and every act and thing requisite and necessary to be done in connection therewith as fully to all intents and purposes as he or she might or could do in person, hereby ratifying and confirming all that said attorneys-in-fact and agents, or their substitute or substitutes may lawfully do or cause to be done by virtue hereof.
Pursuant to the requirements of the Securities Exchange Act of 1934, this Annual Report on Form 10-K has been signed below by the following persons on behalf of the Registrant and in the capacities and on the dates indicated.
|
| | | | |
| Signature | | Title | | Date |
/s/ ALEX MASHINSKY Dan Mondor | | Chief Executive Officer (Principal Executive Officer)Officer and Director) | | March 9, 201515, 2018 |
Alex MashinskyDan Mondor | | | |
| | | | | |
/s/ MICHAEL NEWMAN Stephen Smith | | Chief Financial Officer (Principal Financial and Accounting Officer) | | March 9, 201515, 2018 |
Michael NewmanStephen Smith | | | | |
| | | | | |
/s/ PHILIP FALCONE Philip Falcone | | Director | | March 9, 201515, 2018 |
| Philip Falcone | | |
| | | | | |
/s/ RUSSELL C. GERNS Robert Pons | | Director | | March 9, 2015 |
Russell C. Gerns | | |
| | | | |
/s/ JAMES LEDWITH
| | Director | | March 9, 2015 |
James Ledwith | | |
| | | | |
/s/ ROBERT PONS
| | Director | | March 9, 201515, 2018 |
| Robert Pons | | |
| | | | | |
/s/ SUE SWENSON Jeffrey Tuder | | Director | | March 9, 201515, 2018 |
Sue SwensonJeffrey Tuder | | |
| | | | | |
/s/ DAVID A. WERNER Mark Licht | | Director | | March 9, 201515, 2018 |
David A. WernerMark Licht | | |
| | | | |
INDEX TO CONSOLIDATED FINANCIAL STATEMENTS
Report of Independent Registered Public Accounting Firm
The
To the Board of Directors and Stockholders
Novatel Wireless, Inc.Stockholders of Inseego Corp.
Opinions on the Financial Statements and Internal Control over Financial Reporting
We have audited the accompanying consolidated balance sheets of Novatel Wireless, Inc.Inseego Corp. (“Company”) as of December 31, 20142017 and 2013,2016, and the related consolidated statements of operations, comprehensive loss, stockholders’ equity (deficit), and cash flows for each of the threetwo years in the period ended December 31, 2014.2017, and the related notes and schedule (collectively referred to as the “financial statements”). We have also audited Inseego Corp.’s internal control over financial reporting as of December 31, 2017, based on criteria established in Internal Control-Integrated Framework (2013) issued by the Committee of Sponsoring Organizations of the Treadway Commission (COSO criteria).
In our opinion, the financial statements present fairly, in all material respects, the financial position of Inseego Corp. as of December 31, 2017 and 2016, and the results of its operations and its cash flows for each of the years in the two year period ended December 31, 2017, in conformity with accounting principles generally accepted in the United States of America. Also in our opinion, the Company maintained, in all material respects, effective internal control over financial reporting as of December 31, 2017, based on the COSO criteria.
Basis for Opinion
The Company’s management is responsible for these financial statements, for maintaining effective internal control over financial reporting, and for its assessment of the effectiveness of internal control over financial reporting, included in the accompanying Management’s Annual Report on Internal Control Over Financial Reporting.Our responsibility is to express an opinion on the Company’s financial statements and an opinion on the Company’s internal control over financial reporting based on our audits. We are a public accounting firm registered with the Public Company Accounting Oversight Board (United States) (PCAOB) and are required to be independent with respect to the Company in accordance with the U.S. federal securities laws and the applicable rules and regulations of the Securities and Exchange Commission and the PCAOB.
We conducted our audits in accordance with the standards of the PCAOB. Those standards require that we plan and perform the audits to obtain reasonable assurance about whether the financial statements are free of material misstatement, whether due to error or fraud, and whether effective internal control over financial reporting was maintained in all material respects.
Our audits of the financial statements included performing procedures to assess the risks of material misstatement of the financial statements, whether due to error or fraud, and performing procedures that respond to those risks. Such procedures included examining, on a test basis, evidence regarding the amounts and disclosures in the financial statements. Our audits also included evaluating the accounting principles used and significant estimates made by management, as well as evaluating the overall presentation of the financial statement schedule listedstatements. Our audit of internal control over financial reporting included obtaining an understanding of internal control over financial reporting, assessing the risk that a material weakness exists, and testing and evaluating the design and operating effectiveness of internal control based on the assessed risk. Our audits also included performing such other procedures as we considered necessary in the index at Item 15(a).circumstances. We believe that our audits provide a reasonable basis for our opinions.
Definition and Limitations of Internal Control over Financial Reporting
A company’s internal control over financial reporting is a process designed to provide reasonable assurance regarding the reliability of financial reporting and the preparation of financial statements for external purposes in accordance with accounting principles generally accepted in the United States of America. A company’s internal control over financial reporting includes those policies and procedures that (1) pertain to the maintenance of records that, in reasonable detail, accurately and fairly reflect the transactions and dispositions of the assets of the company; (2) provide reasonable assurance that transactions are recorded as necessary to permit preparation of financial statements in accordance with generally accepted accounting principles, and that receipts and expenditures of the company are being made only in accordance with authorizations of management and directors of the company; and (3) provide reasonable assurance regarding prevention or timely detection of unauthorized acquisition, use, or disposition of the company’s assets that could have a material effect on the financial statements.
Because of its inherent limitations, internal control over financial reporting may not prevent or detect misstatements. Also, projections of any evaluation of effectiveness to future periods are subject to the risk that controls may become inadequate because of changes in conditions, or that the degree of compliance with the policies or procedures may deteriorate.
/s/ MAYER HOFFMAN MCCANN P.C.
We have served as the Company’s auditor since 2016.
San Diego, California
March 15, 2018
Report of Independent Registered Public Accounting Firm
The Board of Directors and Stockholders
Novatel Wireless, Inc. (predecessor issuer to Inseego Corp.)
We have audited the accompanying consolidated statements of operations, comprehensive loss, stockholders’ equity and cash flows of Novatel Wireless, Inc. for the year ended December 31, 2015. These financial statements and schedule are the responsibility of the Company’s management. Our responsibility is to express an opinion on these financial statements and schedule based on our audits.audit.
We conducted our auditsaudit in accordance with the standards of the Public Company Accounting Oversight Board (United States). Those standards require that we plan and perform the audit to obtain reasonable assurance about whether the financial statements are free of material misstatement. An audit includes examining, on a test basis, evidence supporting the amounts and disclosures in the financial statements. An audit also includes assessing the accounting principles used and significant estimates made by management, as well as evaluating the overall financial statement presentation. We believe that our audits provideaudit provides a reasonable basis for our opinion.
In our opinion, the financial statements referred to above present fairly, in all material respects, the consolidated financial positionresults of operations and cash flows of Novatel Wireless, Inc. at December 31, 2014 and 2013, andfor the consolidated results of its operations and its cash flows for each of the three years in the periodyear ended December 31, 2014,2015, in conformity with U.S. generally accepted accounting principles. Also, in our opinion, the related financial statement schedule, when considered in relation to the basic financial statements taken as a whole, presents fairly in all material respects the information set forth therein.
We also have audited, in accordance with the standards of the Public Company Accounting Oversight Board (United States), Novatel Wireless, Inc.’s internal control over financial reporting as of December 31, 2014, based on the criteria established in Internal Control-Integrated Framework issued by the Committee of Sponsoring Organizations of the Treadway Commission (2013 framework) and our report dated March 9, 2015 expressed an unqualified opinion thereon.
/s/ ERNSTERNST & YOUNGYOUNG LLP
San Diego, California
March 9, 201514, 2016
NOVATEL WIRELESS, INC.INSEEGO CORP.
CONSOLIDATED BALANCE SHEETS
(in thousands, except share and per share data)
|
| | | | | | | |
| | As of December 31, |
| | 2014 | | 2013 |
| ASSETS | | | |
| Current assets: | | | |
| Cash and cash equivalents | $ | 17,853 |
| | $ | 2,911 |
|
| Marketable securities | — |
| | 16,612 |
|
| Restricted marketable securities | — |
| | 2,566 |
|
| Accounts receivable, net of allowance for doubtful accounts of $217 in 2014 and $2,449 in 2013 | 24,213 |
| | 39,985 |
|
| Inventories | 37,803 |
| | 27,793 |
|
| Prepaid expenses and other | 7,912 |
| | 5,762 |
|
| Total current assets | 87,781 |
| | 95,629 |
|
| | | | |
| Property and equipment | 5,279 |
| | 9,901 |
|
| Marketable securities | — |
| | 3,443 |
|
| Intangible assets, net of accumulated amortization of $14,050 in 2014 and $12,983 in 2013 | 1,493 |
| | 2,131 |
|
| Other assets | 467 |
| | 361 |
|
| Total assets | $ | 95,020 |
| | $ | 111,465 |
|
| LIABILITIES AND STOCKHOLDERS’ EQUITY | | | |
| Current liabilities: | | | |
| Accounts payable | $ | 34,540 |
| | $ | 24,538 |
|
| Accrued expenses | 23,844 |
| | 23,271 |
|
| Current portion of shareholder litigation | — |
| | 4,326 |
|
| Short-term margin loan facility | — |
| | 2,566 |
|
| Total current liabilities | 58,384 |
| | 54,701 |
|
| | | | |
| Revolving credit facility | 5,158 |
| | — |
|
| Other long-term liabilities | 932 |
| | 1,848 |
|
| Non-current portion of shareholder litigation | — |
| | 10,000 |
|
| Total liabilities | 64,474 |
| | 66,549 |
|
| | | | |
| Commitments and Contingencies |
| |
|
| | | | |
| Stockholders’ equity: | | | |
| Preferred stock, par value $0.001; 2,000 shares authorized and none outstanding | — |
| | — |
|
| Common stock, par value $0.001; 100,000 shares authorized, 45,742 and 34,097 shares issued and outstanding at December 31, 2014 and 2013, respectively | 46 |
| | 34 |
|
| Additional paid-in capital | 466,665 |
| | 441,368 |
|
| Accumulated other comprehensive income | — |
| | 5 |
|
| Accumulated deficit | (411,165 | ) | | (371,491 | ) |
| | 55,546 |
| | 69,916 |
|
| Treasury stock at cost; 2,436 common shares at December 31, 2014 and 2013 | (25,000 | ) | | (25,000 | ) |
| Total stockholders’ equity | 30,546 |
| | 44,916 |
|
| Total liabilities and stockholders’ equity | $ | 95,020 |
| | $ | 111,465 |
|
|
| | | | | | | |
| | December 31, |
| | 2017 | | 2016 |
| ASSETS | | | |
| Current assets: | | | |
| Cash and cash equivalents | $ | 21,198 |
| | $ | 9,894 |
|
| Restricted cash | 61 |
| | — |
|
| Accounts receivable, net of allowance for doubtful accounts of $2,683 and $1,660, respectively | 15,674 |
| | 22,203 |
|
| Inventories, net | 20,403 |
| | 31,142 |
|
| Prepaid expenses and other | 9,101 |
| | 5,208 |
|
| Total current assets | 66,437 |
| | 68,447 |
|
| Property, plant and equipment, net | 6,991 |
| | 8,392 |
|
| Rental assets, net | 7,563 |
| | 7,003 |
|
| Intangible assets, net | 38,671 |
| | 40,283 |
|
| Goodwill | 37,681 |
| | 34,428 |
|
| Other assets | 864 |
| | 163 |
|
| Total assets | $ | 158,207 |
| | $ | 158,716 |
|
| LIABILITIES AND STOCKHOLDERS’ DEFICIT | | | |
| Current liabilities: | | | |
| Accounts payable | $ | 29,332 |
| | $ | 31,242 |
|
| Accrued expenses and other current liabilities | 27,558 |
| | 27,897 |
|
| DigiCore bank facilities | 3,075 |
| | 3,238 |
|
| Total current liabilities | 59,965 |
| | 62,377 |
|
| Long-term liabilities: | | | |
| Convertible senior notes, net | 84,773 |
| | 90,908 |
|
| Term loan, net | 44,055 |
| | — |
|
| Deferred tax liabilities, net | 5,261 |
| | 4,439 |
|
| Other long-term liabilities | 9,768 |
| | 18,719 |
|
| Total liabilities | 203,822 |
| | 176,443 |
|
| Commitments and Contingencies |
| |
|
| Stockholders’ deficit: | | | |
| Preferred stock, par value $0.001; 2,000,000 shares authorized and none outstanding | — |
| | — |
|
| Common stock, par value $0.001; 150,000,000 shares authorized, 58,644,559 and 54,372,080 shares issued and outstanding, respectively | 59 |
| | 54 |
|
| Additional paid-in capital | 519,531 |
| | 507,616 |
|
| Accumulated other comprehensive income (loss) | 4,604 |
| | (1,409 | ) |
| Accumulated deficit | (569,759 | ) | | (524,024 | ) |
| Total stockholders’ deficit attributable to Inseego Corp. | (45,565 | ) | | (17,763 | ) |
| Noncontrolling interests | (50 | ) | | 36 |
|
| Total stockholders’ deficit | (45,615 | ) | | (17,727 | ) |
| Total liabilities and stockholders’ deficit | $ | 158,207 |
| | $ | 158,716 |
|
See accompanying notes to consolidated financial statementsstatements.
NOVATEL WIRELESS, INC.INSEEGO CORP.
CONSOLIDATED STATEMENTS OF OPERATIONS
(in thousands, except share and per share data)
| | | | Year Ended December 31, | Year Ended December 31, |
| | 2014 | | 2013 | | 2012 | 2017 | | 2016 | | 2015 |
| Net revenues | $ | 185,245 |
| | $ | 335,053 |
| | $ | 344,288 |
| |
| Cost of net revenues | 148,198 |
| | 266,759 |
| | 271,845 |
| |
| Net revenues: | | | | | | |
| Hardware | | $ | 160,986 |
| | $ | 187,375 |
| | $ | 203,281 |
|
| SaaS, software and services | | 58,311 |
| | 56,180 |
| | 17,661 |
|
| Total net revenues | | 219,297 |
| | 243,555 |
| | 220,942 |
|
| Cost of net revenues: | | | | | | |
| Hardware | | 134,795 |
| | 136,936 |
| | 153,815 |
|
| SaaS, software and services | | 17,436 |
| | 18,751 |
| | 8,174 |
|
| Impairment of abandoned product line, net of recoveries | | (269 | ) | | 11,540 |
| | — |
|
| Total cost of net revenues | | 151,962 |
| | 167,227 |
| | 161,989 |
|
| Gross profit | 37,047 |
| | 68,294 |
| | 72,443 |
| 67,335 |
| | 76,328 |
| | 58,953 |
|
| Operating costs and expenses: | | | | | | | | | | |
| Research and development | 34,314 |
| | 48,246 |
| | 60,422 |
| 21,362 |
| | 30,655 |
| | 35,446 |
|
| Sales and marketing | 13,792 |
| | 20,898 |
| | 27,501 |
| 25,019 |
| | 29,782 |
| | 20,899 |
|
| General and administrative | 15,402 |
| | 24,179 |
| | 22,668 |
| 34,415 |
| | 52,387 |
| | 34,452 |
|
| Goodwill and intangible assets impairment | — |
| | — |
| | 49,521 |
| |
| Amortization of purchased intangible assets | 562 |
| | 562 |
| | 1,074 |
| 3,601 |
| | 3,927 |
| | 2,126 |
|
| Shareholder litigation loss | 790 |
| | 14,326 |
| | — |
| |
| Restructuring charges | 7,760 |
| | 3,304 |
| | — |
| |
| Impairment of purchased intangible assets | | — |
| | 2,594 |
| | — |
|
| Restructuring charges, net of recoveries | | 5,152 |
| | 1,987 |
| | 3,821 |
|
| Total operating costs and expenses | 72,620 |
| | 111,515 |
| | 161,186 |
| 89,549 |
| | 121,332 |
| | 96,744 |
|
| Operating loss | (35,573 | ) | | (43,221 | ) | | (88,743 | ) | (22,214 | ) | | (45,004 | ) | | (37,791 | ) |
| Other income (expense): | | | | | | | | | | |
| Change in fair value of warrant liability | (3,280 | ) | | — |
| | — |
| |
| Interest income (expense), net | (85 | ) | | 113 |
| | 291 |
| |
| Other expense, net | (167 | ) | | (222 | ) | | (203 | ) | |
| Non-cash change in acquisition-related escrow | | — |
| | — |
| | (8,286 | ) |
| Interest expense, net | | (19,332 | ) | | (15,597 | ) | | (7,164 | ) |
| Other income (expense), net | | (4,080 | ) | | 414 |
| | 1,128 |
|
| Loss before income taxes | (39,105 | ) | | (43,330 | ) | | (88,655 | ) | (45,626 | ) | | (60,187 | ) | | (52,113 | ) |
| Income tax provision | 124 |
| | 83 |
| | 611 |
| 214 |
| | 381 |
| | 181 |
|
| Net loss | (39,229 | ) | | (43,413 | ) | | (89,266 | ) | (45,840 | ) | | (60,568 | ) | | (52,294 | ) |
| Recognition of beneficial conversion feature | (445 | ) | | — |
| | — |
| |
| Net loss attributable to common shareholders | $ | (39,674 | ) | | $ | (43,413 | ) | | $ | (89,266 | ) | |
| Less: Net loss (income) attributable to noncontrolling interests | | 105 |
| | (5 | ) | | 8 |
|
| Net loss attributable to Inseego Corp. | | $ | (45,735 | ) | | $ | (60,573 | ) | | $ | (52,286 | ) |
| Per share data: | | | | | | | | | | |
| Net loss per share attributable to common shareholders: | | | | | | |
| Net loss per share: | | | | | | |
| Basic and diluted | $ | (1.05 | ) | | $ | (1.28 | ) | | $ | (2.72 | ) | $ | (0.78 | ) | | $ | (1.12 | ) | | $ | (0.99 | ) |
| Weighted average shares used in computation of basic and diluted net loss per share attributable to common shareholders: | | | | | | |
| Weighted-average common shares outstanding: | | | | | | |
| Basic and diluted | 37,959 |
| | 33,948 |
| | 32,852 |
| 58,718,483 |
| | 53,911,270 |
| | 52,767,230 |
|
See accompanying notes to consolidated financial statementsstatements.
NOVATEL WIRELESS, INC.INSEEGO CORP.
CONSOLIDATED STATEMENTS OF COMPREHENSIVE LOSS
(in thousands)
|
| | | | | | | | | | | |
| | Year Ended December 31, |
| | 2014 | | 2013 | | 2012 |
| Net loss attributable to common shareholders | $ | (39,674 | ) | | $ | (43,413 | ) | | $ | (89,266 | ) |
| Unrealized gain (loss) on cash equivalents and marketable securities, net of tax | (5 | ) | | (9 | ) | | 22 |
|
| Total comprehensive loss | $ | (39,679 | ) | | $ | (43,422 | ) | | $ | (89,244 | ) |
|
| | | | | | | | | | | |
| | Year Ended December 31, |
| | 2017 | | 2016 | | 2015 |
| Net loss | $ | (45,840 | ) | | $ | (60,568 | ) | | $ | (52,294 | ) |
| Foreign currency translation adjustment | 6,013 |
| | 7,098 |
| | (8,507 | ) |
| Total comprehensive loss | $ | (39,827 | ) | | $ | (53,470 | ) | | $ | (60,801 | ) |
See accompanying notes to consolidated financial statementsstatements.
NOVATEL WIRELESS, INC.INSEEGO CORP.
CONSOLIDATED STATEMENTS OF STOCKHOLDERS’ EQUITY (DEFICIT)
(in thousands)
|
| | | | | | | | | | | | | | | | | | | | | | | | | | |
| | Common Stock | | Additional Paid-in | | Treasury | | Accumulated | | Accumulated Other Comprehensive | | Total Stockholders’ |
| | Shares | | Amount | | Capital | | Stock | | Deficit | | Income (Loss) | | Equity |
| Balance, December 31, 2011 | 32,262 |
| | $ | 32 |
| | $ | 429,813 |
| | $ | (25,000 | ) | | $ | (238,812 | ) | | $ | (8 | ) | | $ | 166,025 |
|
| Exercise of stock options, vesting of restricted stock units and shares issued under employee stock purchase plan | 1,393 |
| | 2 |
| | 1,597 |
| | — |
| | — |
| | — |
| | 1,599 |
|
| Taxes withheld on net settled vesting of restricted stock units | — |
| | — |
| | (433 | ) | | — |
| | — |
| | — |
| | (433 | ) |
| Share-based compensation | — |
| | — |
| | 7,500 |
| | — |
| | — |
| | — |
| | 7,500 |
|
| Net loss | — |
| | — |
| | — |
| | — |
| | (89,266 | ) | | — |
| | (89,266 | ) |
| Other comprehensive income (loss) | — |
| | — |
| | — |
| | — |
| | — |
| | 22 |
| | 22 |
|
| Balance, December 31, 2012 | 33,655 |
| | 34 |
| | 438,477 |
| | (25,000 | ) | | (328,078 | ) | | 14 |
| | 85,447 |
|
Exercise of stock options and vesting of restricted stock units
| 442 |
| | — |
| | 102 |
| | — |
| | — |
| | — |
| | 102 |
|
| Taxes withheld on net settled vesting of restricted stock units | — |
| | — |
| | (654 | ) | | — |
| | — |
| | — |
| | (654 | ) |
| Share-based compensation | — |
| | — |
| | 3,443 |
| | — |
| | — |
| | — |
| | 3,443 |
|
| Net loss | — |
| | — |
| | — |
| | — |
| | (43,413 | ) | | — |
| | (43,413 | ) |
| Other comprehensive income (loss) | — |
| | — |
| | — |
| | — |
| | — |
| | (9 | ) | | (9 | ) |
| Balance, December 31, 2013 | 34,097 |
| | 34 |
| | 441,368 |
| | (25,000 | ) | | (371,491 | ) | | 5 |
| | 44,916 |
|
| Exercise of stock options, vesting of restricted stock units and shares issued under employee stock purchase plan | 689 |
| | 2 |
| | 246 |
| | — |
| | — |
| | — |
| | 248 |
|
| Taxes withheld on net settled vesting of restricted stock units | — |
| | — |
| | (1,067 | ) | | — |
| | — |
| | — |
| | (1,067 | ) |
| Issuance of common shares in connection with litigation settlement | 2,407 |
| | 2 |
| | 4,998 |
| | — |
| | — |
| | — |
| | 5,000 |
|
| Issuance of common shares in connection with financing transaction, net of issuance costs | 7,363 |
| | 7 |
| | 7,929 |
| | — |
| | — |
| | — |
| | 7,936 |
|
| Issuance of common shares in connection with the conversion of Series C preferred shares | 872 |
| | 1 |
| | 939 |
| | — |
| | — |
| | — |
| | 940 |
|
| Beneficial conversion feature of convertible Series C preferred shares | — |
| | — |
| | 445 |
| | — |
| | — |
| | — |
| | 445 |
|
| Reclassification of warrant liability | — |
| | — |
| | 8,219 |
| | — |
| | — |
| | — |
| | 8,219 |
|
| Share-based compensation | 314 |
| | — |
| | 3,588 |
| | — |
| | — |
| | — |
| | 3,588 |
|
| Net loss attributable to common shareholders | — |
| | — |
| | — |
| | — |
| | (39,674 | ) | | — |
| | (39,674 | ) |
| Other comprehensive income (loss) | — |
| | — |
| | — |
| | — |
| | — |
| | (5 | ) | | (5 | ) |
| Balance, December 31, 2014 | 45,742 |
| | $ | 46 |
| | $ | 466,665 |
| | $ | (25,000 | ) | | $ | (411,165 | ) | | $ | — |
| | $ | 30,546 |
|
|
| | | | | | | | | | | | | | | | | | | | | | | | | | | | | | |
| | Common Stock | | Additional Paid-in Capital | | Treasury Stock | | Accumulated Deficit | | Accumulated Other Comprehensive Income (Loss) | | Noncontrolling Interests | | Total Stockholders’ Equity (Deficit) |
| | Shares | | Amount | | | | | | |
| Balance, December 31, 2014 | 45,742 |
| | $ | 46 |
| | $ | 466,665 |
| | $ | (25,000 | ) | | $ | (411,165 | ) | | $ | — |
| | $ | — |
| | $ | 30,546 |
|
| Net loss | — |
| | — |
| | — |
| | — |
| | (52,286 | ) | | — |
| | (8 | ) | | (52,294 | ) |
| Foreign currency translation adjustment | — |
| | — |
| | — |
| | — |
| | — |
| | (8,507 | ) | | — |
| | (8,507 | ) |
| Noncontrolling interest acquired | — |
| | — |
| | — |
| | — |
| | — |
| | — |
| | 39 |
| | 39 |
|
| Exercise of stock options, vesting of restricted stock units and stock issued under employee stock purchase plan | 1,257 |
| | 1 |
| | 1,763 |
| | — |
| | — |
| | — |
| | — |
| | 1,764 |
|
| Taxes withheld on net settled vesting of restricted stock units | — |
| | — |
| | (757 | ) | | — |
| | — |
| | — |
| | — |
| | (757 | ) |
| Exercise of a portion of 2014 Warrant | 3,825 |
| | 4 |
| | 8,640 |
| | — |
| | — |
| | — |
| | — |
| | 8,644 |
|
| Net shares issued for retention bonus | 2,158 |
| | 2 |
| | 5,748 |
| | — |
| | — |
| | — |
| | — |
| | 5,750 |
|
| Share-based compensation | 183 |
| | — |
| | 6,350 |
| | — |
| | — |
| | — |
| | — |
| | 6,350 |
|
| Discount on convertible senior notes | — |
| | — |
| | 38,305 |
| | — |
| | — |
| | — |
| | — |
| | 38,305 |
|
| Fair value of DigiCore replacement options granted | — |
| | — |
| | 623 |
| | — |
| | — |
| | — |
| | — |
| | 623 |
|
| Retirement of treasury stock | — |
| | — |
| | (25,000 | ) | | 25,000 |
| | — |
| | — |
| | — |
| | — |
|
| Balance, December 31, 2015 | 53,165 |
| | 53 |
| | 502,337 |
| | — |
| | (463,451 | ) | | (8,507 | ) | | 31 |
| | 30,463 |
|
| Net loss | — |
| | — |
| | — |
| | — |
| | (60,573 | ) | | — |
| | 5 |
| | (60,568 | ) |
| Foreign currency translation adjustment | — |
| | — |
| | — |
| | — |
| | — |
| | 7,098 |
| | — |
| | 7,098 |
|
| Exercise of stock options, vesting of restricted stock units and stock issued under employee stock purchase plan | 1,207 |
| | 1 |
| | 942 |
| | — |
| | — |
| | — |
| | — |
| | 943 |
|
| Taxes withheld on net settled vesting of restricted stock units | — |
| | — |
| | (251 | ) | | — |
| | — |
| | — |
| | — |
| | (251 | ) |
| Share-based compensation | — |
| | — |
| | 4,588 |
| | — |
| | — |
| | — |
| | — |
| | 4,588 |
|
| Balance, December 31, 2016 | 54,372 |
| | 54 |
| | 507,616 |
| | — |
| | (524,024 | ) | | (1,409 | ) | | 36 |
| | (17,727 | ) |
| Net loss | — |
| | — |
| | — |
| | — |
| | (45,735 | ) | | — |
| | (105 | ) | | (45,840 | ) |
| Foreign currency translation adjustment | — |
| | — |
| | — |
| | — |
| | — |
| | 6,013 |
| | — |
| | 6,013 |
|
| Net noncontrolling interest acquired | — |
| | — |
| | — |
| | — |
| | — |
| | — |
| | 19 |
| | 19 |
|
| Exercise of stock options, vesting of restricted stock units and stock issued under employee stock purchase plan | 1,231 |
| | 2 |
| | 388 |
| | — |
| | — |
| | — |
| | — |
| | 390 |
|
| Taxes withheld on net settled vesting of restricted stock units | — |
| | — |
| | (896 | ) | | — |
| | — |
| | — |
| | — |
| | (896 | ) |
| Issuance of common shares (Notes 2 and 6) | 3,042 |
| | 3 |
| | 5,075 |
| | — |
| | — |
| | — |
| | — |
| | 5,078 |
|
| Share-based compensation | — |
| | — |
| | 3,748 |
| | — |
| | — |
| | — |
| | — |
| | 3,748 |
|
| Additional discount on exchange of convertible senior notes | — |
| | — |
| | 3,600 |
| | — |
| | — |
| | — |
| | — |
| | 3,600 |
|
| Balance, December 31, 2017 | 58,645 |
| | $ | 59 |
| | $ | 519,531 |
| | $ | — |
| | $ | (569,759 | ) | | $ | 4,604 |
| | $ | (50 | ) | | $ | (45,615 | ) |
See accompanying notes to consolidated financial statementsstatements.
NOVATEL WIRELESS, INC.INSEEGO CORP.
CONSOLIDATED STATEMENTS OF CASH FLOWS
(in thousands)
| | | | Year Ended December 31, | Year Ended December 31, |
| | 2014 | | 2013 | | 2012 | 2017 | | 2016 | | 2015 |
| Cash flows from operating activities: | | | | | | | | | | |
| Net loss attributable to common shareholders | $ | (39,674 | ) | | $ | (43,413 | ) | | $ | (89,266 | ) | |
| Net loss | | $ | (45,840 | ) | | $ | (60,568 | ) | | $ | (52,294 | ) |
| Adjustments to reconcile net loss to net cash used in operating activities: | | | | | | | | | | |
| Depreciation and amortization | 7,408 |
| | 8,949 |
| | 12,337 |
| 14,274 |
| | 14,053 |
| | 8,323 |
|
| Loss on goodwill and purchased intangible assets impairment | — |
| | — |
| | 49,521 |
| |
| Impairment loss on equipment, leasehold improvements and software license intangible assets | — |
| | 418 |
| | 100 |
| |
| Amortization of acquisition-related inventory step-up | | — |
| | 1,829 |
| | 4,097 |
|
| Loss on impairment of purchased intangible assets | | — |
| | 2,594 |
| | — |
|
| Provision for bad debts, net of recoveries | 86 |
| | 1,936 |
| | 439 |
| 1,618 |
| | 1,136 |
| | 422 |
|
| Net impairment loss on marketable securities | — |
| | — |
| | 39 |
| |
| Loss on impairment of abandoned product line, net of recoveries | | 815 |
| | 11,540 |
| | — |
|
| Provision for excess and obsolete inventory | 3,382 |
| | 4,344 |
| | 2,843 |
| 1,674 |
| | 3,257 |
| | 1,043 |
|
| Share-based compensation expense | 3,588 |
| | 3,443 |
| | 7,500 |
| 3,748 |
| | 4,588 |
| | 6,350 |
|
| Change in fair value of warrant liability and fair value of beneficial conversion feature on convertible Series C preferred shares | 3,725 |
| | — |
| | — |
| |
| Shareholder litigation loss | — |
| | 14,326 |
| | — |
| |
| Non-cash income tax expense | 87 |
| | 220 |
| | 462 |
| |
| Changes in assets and liabilities: | | | | | | |
| Amortization of debt discount and debt issuance costs | | 10,283 |
| | 8,447 |
| | 4,692 |
|
| Loss on extinguishment of debt | | 2,035 |
| | — |
| | — |
|
| Loss on disposal of assets, net of gain on divestiture and sale of other assets | | 804 |
| | (4,742 | ) | | (50 | ) |
| Non-cash change in acquisition-related escrow | | — |
| | — |
| | 8,286 |
|
| Deferred income taxes | | 319 |
| | 196 |
| | 106 |
|
| Non-cash equity earn-out compensation expense | | — |
| | 7,913 |
| | — |
|
| Reversal of market development fund accrual | | — |
| | (2,109 | ) | | — |
|
| Unrealized foreign currency transaction loss (gain), net | | (316 | ) | | 3,513 |
| | (1,298 | ) |
| Other | | 65 |
| | 270 |
| | 225 |
|
| Changes in assets and liabilities, net of effects from divestiture: | | | | | | |
| Restricted cash | | (61 | ) | | — |
| | — |
|
| Accounts receivable | 15,688 |
| | 730 |
| | (6,242 | ) | 5,638 |
| | 11,616 |
| | 4,760 |
|
| Inventories | (13,392 | ) | | 6,879 |
| | 420 |
| 3,020 |
| | (3,159 | ) | | (3,960 | ) |
| Prepaid expenses and other assets | (2,403 | ) | | (489 | ) | | (1,237 | ) | (3,239 | ) | | 869 |
| | 2,683 |
|
| Accounts payable | 10,036 |
| | (19,237 | ) | | (10,433 | ) | (730 | ) | | (7,825 | ) | | (11,187 | ) |
| Accrued expenses, income taxes, and other | (4,798 | ) | | (4,733 | ) | | 3,638 |
| (8,744 | ) | | 3 |
| | 866 |
|
| Net cash used in operating activities | (16,267 | ) | | (26,627 | ) | | (29,879 | ) | (14,637 | ) | | (6,579 | ) | | (26,936 | ) |
| Cash flows from investing activities: | | | | | | | | | | |
| Purchases of property and equipment | (1,753 | ) | | (5,011 | ) | | (4,579 | ) | |
| Purchases of intangible assets | (431 | ) | | — |
| | (104 | ) | |
| Purchases of marketable securities | (1,359 | ) | | (24,262 | ) | | (44,216 | ) | |
| Marketable securities maturities / sales | 23,975 |
| | 40,897 |
| | 46,696 |
| |
| Acquisition-related escrow | | — |
| | — |
| | (8,275 | ) |
| Installment payments related to past acquisitions | | — |
| | (3,750 | ) | | (85,991 | ) |
| Purchases of property, plant and equipment | | (1,789 | ) | | (1,439 | ) | | (1,975 | ) |
| Proceeds from the sale of property, plant and equipment | | 253 |
| | 629 |
| | 46 |
|
| Proceeds from the sale of divested assets | | — |
| | 11,300 |
| | — |
|
| Purchases of intangible assets and additions to capitalized software development costs | | (2,839 | ) | | (2,915 | ) | | (1,157 | ) |
| Proceeds from the sale of short-term investments | | — |
| | 1,210 |
| | 265 |
|
| Net cash provided by (used in) investing activities | 20,432 |
| | 11,624 |
| | (2,203 | ) | (4,375 | ) | | 5,035 |
| | (97,087 | ) |
| Cash flows from financing activities: | | | | | | | | | | |
| Proceeds from the issuances of Series C preferred and common stock, net of issuance costs | 14,163 |
| | — |
| | — |
| |
| Proceeds from the issuance of short-term debt, net of issuance costs | — |
| | 20,300 |
| | 14,000 |
| |
| Principal repayments of short-term debt | (2,566 | ) | | (17,734 | ) | | (14,000 | ) | |
| Repayment of litigation settlement note payable, including interest | (5,026 | ) | | — |
| | — |
| |
| Borrowings on revolving credit facility | 5,158 |
| | — |
| | — |
| |
| Proceeds from term loans | | 64,917 |
| | — |
| | — |
|
| Payment of issuance costs related to term loans | | (905 | ) | | — |
| | — |
|
| Repayment of term loan | | (20,000 | ) | | — |
| | — |
|
| Gross proceeds from the issuance of convertible senior notes | | — |
| | — |
| | 120,000 |
|
| Payment of issuance costs related to convertible senior notes | | — |
| | — |
| | (3,927 | ) |
| Repurchase of convertible senior notes | | (11,900 | ) | | — |
| | — |
|
| Proceeds from the exercise of warrant to purchase common stock | | — |
| | — |
| | 8,644 |
|
| Net borrowings from (repayment of) DigiCore bank and overdraft facilities | | (76 | ) | | (840 | ) | | 1,581 |
|
| Net repayments of revolving credit facility | | — |
| | — |
| | (5,158 | ) |
| Payoff of acquisition-related assumed liabilities | | — |
| | — |
| | (2,633 | ) |
| Principal payments under capital lease obligations | — |
| | — |
| | (46 | ) | (876 | ) | | (903 | ) | | (288 | ) |
| Taxes paid on vested restricted stock units net of proceeds from stock option exercises and ESPP | (821 | ) | | (552 | ) | | 1,166 |
| |
| Net cash provided by financing activities | 10,908 |
| | 2,014 |
| | 1,120 |
| |
| Principal payments on mortgage bond | | (288 | ) | | (240 | ) | | (59 | ) |
| Taxes paid on vested restricted stock units, net of proceeds from stock option exercises and employee stock purchase plan | | (506 | ) | | 692 |
| | 1,007 |
|
| Net cash provided by (used in) financing activities | | 30,366 |
| | (1,291 | ) | | 119,167 |
|
| Effect of exchange rates on cash and cash equivalents | (131 | ) | | (144 | ) | | (63 | ) | (50 | ) | | 159 |
| | (427 | ) |
| Net increase (decrease) in cash and cash equivalents | 14,942 |
| | (13,133 | ) | | (31,025 | ) | 11,304 |
| | (2,676 | ) | | (5,283 | ) |
| Cash and cash equivalents, beginning of period | 2,911 |
| | 16,044 |
| | 47,069 |
| 9,894 |
| | 12,570 |
| | 17,853 |
|
| Cash and cash equivalents, end of period | $ | 17,853 |
| | $ | 2,911 |
| | $ | 16,044 |
| $ | 21,198 |
| | $ | 9,894 |
| | $ | 12,570 |
|
| Supplemental disclosures of cash flow information: | | | | | | | | | | |
| Cash paid during the year for: | | | | | | | | | | |
| Interest | $ | 119 |
| | $ | 65 |
| | $ | 17 |
| $ | 9,074 |
| | $ | 7,137 |
| | $ | 3,640 |
|
| Income taxes | $ | 108 |
| | $ | 121 |
| | $ | 104 |
| $ | 440 |
| | $ | 115 |
| | $ | 139 |
|
| Supplemental disclosures of non-cash activities: | | | | | | | | | | |
| Building rent incentives to fund leasehold improvements | $ | — |
| | $ | 359 |
| | $ | — |
| |
| Issuance of common stock for litigation settlement | $ | 5,000 |
| | $ | — |
| | $ | — |
| |
| Initial fair value of warrant liability recorded upon issuance of Series C preferred and common stock | $ | 4,939 |
| | $ | — |
| | $ | — |
| |
| Issuance of common stock for conversion of Series C preferred shares | $ | 940 |
| | $ | — |
| | $ | — |
| |
| Transfer of inventories to rental assets | | $ | 5,943 |
| | $ | 5,568 |
| | $ | 1,032 |
|
| Issuance of common stock under amended earn-out agreement | | $ | 2,638 |
| | $ | — |
| | $ | — |
|
| Additional debt discount on exchange of convertible senior notes | | $ | 3,600 |
| | $ | — |
| | $ | — |
|
| Term loan debt discount issued in common stock | | $ | 2,340 |
| | $ | — |
| | $ | — |
|
See accompanying notes to consolidated financial statements.
NOVATEL WIRELESS, INC.INSEEGO CORP.
NOTES TO CONSOLIDATED FINANCIAL STATEMENTS
1. Nature of Business and Significant Accounting Policies
Novatel Wireless, Inc.Inseego Corp. (the “Company,” “our”“Company” or “we”“Inseego”) is a provider of wireless broadband access solutions forleader in the worldwide mobile communications market. Our broad rangedesign and development of products principally includes intelligentand solutions that enable high performance mobile hotspots, USB modems, embedded modules, integrated asset-managementapplications for large enterprise verticals, service providers and small and medium-sized businesses around the globe. Inseego’s product portfolio consists of enterprise SaaS solutions, IoT and mobile solutions, which together form the backbone of compelling, intelligent, reliable and secure IoT services with deep business intelligence. Inseego’s products and solutions power mission critical applications with a “zero unscheduled downtime” mandate, such as asset tracking, machine-to-machinefleet management, industrial IoT, SD WAN failover management and mobile broadband services. Inseego’s solutions are powered by its key innovations in purpose built SaaS cloud platforms, IoT and mobile technologies, including the newly emerging 5G technology.
Inseego is a Delaware corporation formed in 2016 and is the successor to Novatel Wireless, Inc., a Delaware corporation formed in 1996 (“M2M”Novatel Wireless”) devices, communications, as a result of an internal reorganization that was completed in November 2016 (the “Reorganization”). The Company’s principal offices are located at 9605 Scranton Road, Suite 300, San Diego CA 92121. The Company’s sales and applications software and cloud services.engineering offices are located throughout the world. Inseego’s common stock trades on The NASDAQ Global Select Market under the trading symbol “INSG”.
Basis of Presentation
We have recently incurred operating losses andThe Company had a net loss attributable to common shareholders of $39.7$45.7 million during the year ended December 31, 2014.2017. As of December 31, 2014, we2017, the Company had available cash and cash equivalents totaling $17.9$21.2 million and working capital of $29.4$6.5 million. OurThe Company has a history of operating and net losses and overall usage of cash from operating and investing activities. In June 2017, the Company terminated the proposed sale of its MiFi Business (as defined below) due to delays and uncertainty in securing approval of the sale from the Committee on Foreign Investment in the United States (“CFIUS”) (see Note 2, Acquisitions and Divestitures).
During the year ended December 31, 2017, the Company commenced certain restructuring initiatives aimed at significantly reducing the Company’s cost of revenues and operating expenses in an effort to increase operating cash flows to eventually be sufficient to offset debt service costs and cash flows from investing activities. The Company’s management believes that its cash and cash equivalents, together with anticipated cash flows from operations, will be sufficient to meet its working capital needs for the next twelve months following the filing date of this report. The Company’s ability to transition to attainingmore profitable operations is dependent upon achieving a level of revenuesrevenue adequate to support ourits evolving cost structure. If events or circumstances occur such that we dothe Company does not meet ourits operating plan as expected, weor if the Company becomes obligated to pay unforeseen expenditures as a result of ongoing litigation, the Company may be required to reduce planned research and development activities, incur additional restructuring charges or reduce other operating expenses which could have an adverse impact on ourits ability to achieve ourits intended business objectives. These additional reductions in expenditures , if required, could have an adverse impact on our ability to achieve certain of our business objectives during 2015. We believe our working capital resources are sufficient to fund our operations through at least December 31, 2015.
Principles of Consolidation
The consolidated financial statements include the accounts of the Company and its wholly-ownedwholly owned subsidiaries. All intercompany transactions and balances have been eliminated in consolidation.
Use of Estimates
The preparation of financial statements in conformity with accounting principles generally accepted in the U.S.United States requires management to make estimates and assumptions. These estimates and assumptions affect the reported amounts of assets, liabilities, revenues and expenses, and disclosure of contingent liabilities. Actual results could differ materially from these estimates. Significant estimates include allowance for doubtful accounts receivable, provision for excess and obsolete inventory, valuation of intangible and long-lived assets, fair valuevaluation of warrant liability,goodwill, valuation of debt obligations, royalty costs, accruals relating to litigation restructuring, and retention bonus,restructuring, provision for warranty costs, income taxes, and share-based compensation expense.expense and the Company’s ability to continue as a going concern.
Segment Information
The Company does not provide separate segment reporting for its various lines of business. The Chief Executive Officer, who is also the Chief Operating Decision Maker, evaluates the business as a single entity, reviews financial information, and makes business decisions based on the overall results of the business. As such, the Company’s operations constitute a single operating segment and one reportable segment.
INSEEGO CORP.
NOTES TO CONSOLIDATED FINANCIAL STATEMENTS
Cash and Cash Equivalents
Cash and cash equivalents include highly liquid investments with original maturities of three months or less. Cash and cash equivalents consist of demand deposits, US Treasury securities, and money market funds. Cash and cash equivalents are recorded at market value, which approximates cost. Gains and losses associated with the Company’s foreign currency denominated demand deposits are recorded as a component of other income (expense)., net, in the consolidated statements of operations.
Allowance for Doubtful Accounts Receivable
The Company provides an allowance for its accounts receivable for estimated losses that may result from its customers’ inability to pay. The Company determines the amount of the allowance by analyzing known uncollectible accounts, aged receivables, economic conditions, historical losses, and changes in customer payment cycles and ourits customers’ credit-worthiness. Amounts later determined and specifically identified to be uncollectible are charged or written off against this allowance. To minimize the likelihood of uncollectibility, the Company reviews its customers’ credit-worthiness periodically based on credit scores generated by independent credit reporting services, its experience with its customers and the economic condition of its customers’ industries. Material differences may result in the amount and timing of expense for any period if the Company were to make different judgments or utilize different estimates.
Marketable Securities
Marketable securities predominantly consist of highly liquid debt investments with a maturity of greater than three months when purchased. The Company did not have any short or long-term marketable securities at December 31, 2014. All of the Company’s marketable debt securities are treated as “available-for-sale.” While it is the Company’s intent to hold its debt securities until maturity, the Company may sell certain securities for cash flow purposes. Thus, the Company’s marketable debt securities are classified as available-for-sale and are carried on the balance sheet at fair value with the related unrealized gains and losses included in accumulated other comprehensive loss, a component of stockholders’ equity. Realized gains and losses on the sale of marketable securities are determined using the specific-identification method. The Company determines the fair value of its financial assets and liabilities by reference to the hierarchy of inputs which consists of three levels: Level 1 fair
values are valuations based on quoted market prices in active markets for identical assets or liabilities that the entity has the ability to access; Level 2 fair values are those valuations based on quoted prices for similar assets or liabilities, quoted prices in markets that are not active, or other inputs that are observable or can be corroborated by observable data for substantially the full term of the assets or liabilities; and Level 3 fair values are valuations based on inputs that are supported by little or no market activity and that are significant to the fair value of the assets or liabilities.
All securities whose maturity or sale is expected within one year are classified as “current” on the consolidated balance sheet. All other securities are classified as “long-term” on the consolidated balance sheet.
Inventories and Provision for Excess and Obsolete Inventory
Inventories are stated at the lower of cost (first-in, first-out method) or market.net realizable value. Shipping and handling costs are classified as a component of cost of net revenues in the consolidated statements of operations. The Company reviews the components of its inventory and its inventory purchase commitments on a regular basis for excess and obsolete inventory based on estimated future usage and sales. Write-downs in inventory value or losses on inventory purchase commitments depend on various items, including factors related to customer demand, economic and competitive conditions, technological advances or new product introductions by the Company or its customers that vary from its current expectations. Whenever inventory is written down, a new cost basis is established and the inventory is not subsequently written up if market conditions improve.
The Company believes that, when made, the estimates used in calculating the inventory provision are reasonable and properly reflect the risk of excess and obsolete inventory. If customer demand for the Company’s inventory is substantially less than its estimates, inventory write-downs may be required, which could have a material adverse effect on its consolidated financial statements.
Property, Plant and Equipment
Property, plant and equipment are initially stated at cost and depreciated using the straight-line method. Test equipment, computer equipment, purchased software, furniture and fixtures, and product tooling and vehicles are depreciated over lives ranging from eighteen months to five years and leaseholdsix years. Leasehold improvements are depreciated over the shorter of the related remaining lease period or useful life. Buildings are depreciated over 50 years. Land is not depreciated. Amortization of assets heldequipment under capital leases is included in depreciation expense.
Expenditures for repairs and maintenance are expensed as incurred. Expenditures for major renewals and betterments that extend the useful lives of existing property, plant and equipment are capitalized and depreciated. Upon retirement or disposition of property, plant and equipment, any resulting gain or loss is recognized in other income (expense), net, in the consolidated statements of operations.
Rental Assets
The cost of rental assets, which represents fleet management and vehicle tracking hardware installed in customers’ vehicles where such hardware is provided as part of a fixed term contract with the customer, is capitalized and disclosed separately in the consolidated balance sheets. The Company depreciates rental assets to costs of net revenues on a straight-line basis over the term of the contract, generally three to four years, commencing on installation of the rental asset.
Software Development Costs
Software development costs are expensed as incurred until technological feasibility has been established, at which time those costs are capitalized as intangible assets until the software is implemented into products sold to customers. Capitalized software development costs are amortized on a straight-line basis over the estimated useful life of the software (see Note 4, Goodwill and Other Intangible Assets). Costs incurred to enhance existing software or after the implementation of the software into a product are expensed in the period they are incurred and included in research and development expense in the consolidated statements of operations.
INSEEGO CORP.
NOTES TO CONSOLIDATED FINANCIAL STATEMENTS
Internal Use Software
Costs incurred in the preliminary stages of development are expensed as incurred and included in research and development expense in the consolidated statements of operations. Once an application has reached the development stage, internal and external costs, if direct and incremental, are capitalized until the software is substantially complete and ready for its intended use. Capitalization ceases upon completion of all substantial testing performed to ensure the product is ready for its intended use. The Company also capitalizes costs related to specific upgrades and enhancements of internal-use software when it is probable that the expenditures will result in additional functionality. Maintenance and training costs are expensed as incurred. Capitalized internal-use software costs are recorded as part of property, plant and equipment and are amortized on a straight-line basis over the estimated useful life of the software, which is generally five years. The Company does not capitalize pilot projects and projects for which it believes that the future economic benefits are less than probable. The Company tests these assets for impairment whenever events or circumstances occur that could impact their recoverability.
Intangible Assets
Intangible assets include purchased finite-lived and indefinite-lived intangible assets acquiredresulting from the acquisitions of DigiCore Holdings Limited (“DigiCore” or “Ctrack”), Feeney Wireless, LLC (which has been renamed Inseego North America, LLC) (“FW” or “INA”) and Enfora, Inc. (“Enfora”) on November 30, 2010 and, along with the costs of non-exclusive and perpetual worldwide software technology licenses. These costslicenses and capitalized software developments costs. Finite-lived intangible assets are amortized on an accelerated basis or on a straight-line basis over the estimated useful lives of the assets depending on(see Note 4, Goodwill and Other Intangible Assets).
Indefinite-lived assets, including goodwill, in-process research and development and in-process capitalized software development costs, are not amortized; however, they are tested for impairment annually, and between annual tests, if certain events occur indicating that the anticipated utilizationcarrying amounts may be impaired. If a qualitative assessment is used and the Company determines that the fair value of an indefinite-lived intangible asset is more likely than not (i.e., a likelihood of more than 50%) less than its carrying amount, a quantitative impairment test will be performed. If indefinite-lived intangible assets, excluding goodwill, are quantitatively assessed for impairment, a two-step approach is applied. First, the Company compares the estimated fair value of the asset.indefinite-lived intangible asset to its carrying value. The majoritysecond step, if necessary, measures the amount of such impairment by comparing the implied fair value of the asset to its carrying value. The Company tests goodwill for impairment by comparing the fair value of each reporting unit with its carrying amount and an impairment charge is recorded for the amount, if any, by which the carrying value exceeds the reporting unit’s fair value. For the year ended December 31, 2017, the Company recorded an impairment loss related to indefinite-lived intangible assets relate toof approximately $0.3 million, which is included in other income (expense), net, in the developed technologiesconsolidated statements of operations. No impairment of indefinite-lived intangible assets was recognized during the years ended December 31, 2016 and trade name resulting from the acquisition of Enfora. Developed technologies are amortized on a straight-line basis over the remaining one year useful life. Trade name is amortized on a straight-line basis over the remaining useful life of three years.2015.
Long-Lived Assets
The Company periodically evaluates the carrying value of the unamortized balances of its long-lived assets, including property, plant and equipment, rental assets and intangible assets, to determine whether impairment of these assets has occurred or whether a revision to the related amortization periods should be made. When the carrying value of an asset exceeds the associated undiscounted expected future cash flows, it is considered to be impaired and is written down to fair value. Fair value is determined based on an evaluation of the assets associated undiscounted future cash flows or appraised value. This evaluation is based on management’s projections of the undiscounted future cash flows associated with each class of asset. If management’s evaluation indicates that the carrying values of these assets are impaired, such impairment is recognized by a reduction of the applicable asset carrying value to its estimated fair value and the impairment is expensed as a part of continuing operations. For the year ended December 31, 2017, the Company recorded an impairment loss related to long-lived assets of approximately $0.1 million, which is included in other income (expense), net, in the consolidated statements of operations. For the year ended December 31, 2016, the Company recorded an impairment loss related to long-lived assets of approximately $2.7 million, which is included in impairment of purchased intangibles and other income (expense), net, in the consolidated statements of operations. For the year ended December 31, 2015, the Company recorded an impairment loss related to long-lived assets of approximately $27,000, which is included in cost of net revenues in the consolidated statements of operations.
GoodwillAcquisitions
When acquiring companies, the Company recognizes separately from goodwill the assets acquired and the liabilities assumed at their acquisition date fair values. Goodwill representsas of the acquisition date is measured as the excess of consideration transferred and the net of the acquisition date fair values of the assets acquired and the liabilities assumed. While the Company uses its best estimates and assumptions as a part of the purchase price of anallocation process to accurately value assets acquired enterprise overand
INSEEGO CORP.
NOTES TO CONSOLIDATED FINANCIAL STATEMENTS
liabilities assumed at the fair value assignedacquisition date, the Company’s estimates are inherently uncertain and subject to refinement. As a result, during the measurement period (which may be up to one year from the acquisition date), the Company records adjustments to the assets acquired and liabilities assumed, with the corresponding offset to goodwill. Upon the conclusion of the measurement period or final determination of the values of assets acquired or liabilities assumed, whichever comes first, any subsequent adjustments are recorded to the consolidated statements of operations.
Accounting for business combinations requires the Company’s management to make significant estimates and assumptions, especially at the acquisition date with respect to intangible assets, support liabilities assumed, and pre-acquisition contingencies. Although the Company believes the assumptions and estimates it has made in the past have been reasonable and appropriate, they are based in part on historical experience, market data and information obtained from the management of the acquired companies and are inherently uncertain.
Examples of critical estimates in valuing certain of the intangible assets the Company has acquired include but are not limited to: (i) future expected cash flows from customer relationships; (ii) estimates to develop or use technology; and (iii) discount rates.
If the Company determines that a business combination. Goodwillpre-acquisition contingency is allocatedprobable in nature and estimable as of the acquisition date, the Company records its best estimate for such a contingency as a part of the business combinationpreliminary fair value allocation. The Company continues to gather information for and evaluate pre-acquisition contingencies throughout the measurement period and if the Company makes changes to the reporting units that are expectedamounts recorded or if the Company identifies additional pre-acquisition contingencies during the measurement period, such amounts will be included in the fair value allocation during the measurement period and, subsequently, in the Company’s results of operations.
The Company may be required to benefit frompay future consideration to the synergiesformer shareholders of acquired companies, depending on the terms of the business combination. Goodwillapplicable purchase agreements, which may be contingent upon the achievement of certain financial and operating targets, as well as the retention of key employees. If the future consideration is considered to be impairedcompensation, amounts will be expensed when incurred.
Divestitures
Gains or losses from divested operations and assets that do not qualify for treatment as discontinued operations under Accounting Standards Codification (“ASC”) 205-20, Presentation of Financial Statements—Discontinued Operations, are recorded as other income (expense), net, in the consolidated statements of operations.
Restructuring
The Company accounts for facility exit costs in accordance with ASC 420, Exit or Disposal Cost Obligations, which requires that a liability for such costs be recognized and measured initially at fair value on the cease-use date based on remaining lease rentals, adjusted for the effects of any prepaid or deferred items recognized, reduced by the estimated sublease rentals that could be reasonably obtained even if the Company does not intend to sublease the facilities.
The Company is required to estimate future sublease income and future net operating expenses of the facilities, among other expenses. The most significant of these estimates relate to the timing and extent of future sublease income which reduce lease obligations, and the probability that such sublease income will be realized. The Company based estimates of sublease income, in part, on information from third party real estate experts, current market conditions and rental rates, an assessment of the time period over which reasonable estimates could be made, and the location of the respective facility, among other factors. Further adjustments to the facility exit liability accrual will be required in future periods if actual exit costs or sublease income differ from current estimates. Exit costs recorded by the Company under these provisions are neither associated with, nor do they benefit, continuing activities.
Convertible Debt
The Company accounts for its convertible debt instruments that are settleable in cash upon conversion (including partial cash settlement) by separating the liability and equity components of the instruments in a manner that reflects the Company’s nonconvertible debt borrowing rate. The Company determines that the carrying amount of the liability component by measuring the fair value of similar debt instruments that do not have the conversion feature. If a similar debt instrument does not exist, the Company estimates the fair value by using assumptions that market participants would use in pricing a debt instrument, including market interest rates, credit standing, yield curves and volatilities. Determining the fair value of the reporting unit to whichdebt component requires the goodwill has been assigned exceeds its estimated fair value. Asuse of December 31, 2014, all historical goodwill had been fully impaired.accounting estimates and assumptions. These estimates and assumptions are judgmental in nature and could have a significant impact on the determination of the debt component and the associated non-cash interest expense.
INSEEGO CORP.
NOTES TO CONSOLIDATED FINANCIAL STATEMENTS
Upon issuance, the Company assigns a value to the debt component equal to the estimated fair value of Contentssimilar debt instruments without the conversion feature, which could result in the Company recording the debt instrument at a discount. If the debt instrument is recorded at a discount, the Company amortizes the debt discount over the life of the debt instrument as additional non-cash interest expense utilizing the effective interest method.
Revenue Recognition
The Company’sDuring the year ended December 31, 2017, the Company generated a portion of its revenue is principally generated from the sale of wireless modems to wireless operators, OEM customers and value added resellers and distributors. In addition, the Company generates revenue from the sale of asset-management solutions utilizing wireless technology and M2Mmachine-to-machine communication devices predominantly to transportation and industrial companies, medical device manufacturers and security system providers. Revenue from product sales is generally recognized upon the later of transfer of title or delivery of the product to the customer. Where the transfer of title or risk of loss is contingent on the customer’s acceptance of the product, wethe Company will not recognize revenue until both title and risk of loss have transferred to the customer. We recordRevenues from SaaS services are recognized pro-rata over the contract term. The Company records deferred revenue for cash payments received from customers in advance of when revenue recognition criteria are met. We haveThe Company has granted price protection to certain customers in accordance with the provisions of the respective contracts and tracktracks pricing and other terms offered to customers buying similar products to assess compliance with these provisions. We estimateThe Company estimates the amount of price protection for current period product sales utilizing historical experience and information regarding customer inventory levels. To date, we havethe Company has not incurred material price protection obligations. Revenues from sales to certain customers are subject to cooperative advertising allowances. Cooperative advertising allowances are recorded as an operating expense to the extent that the advertising benefit is separable from the revenue transaction and the fair value of that advertising benefit is determinable. To the extent that such allowances either do not provide a separable benefit to us,the Company or the fair value of the advertising benefit cannot be reliably estimated, such amounts are recorded as a reduction of revenue. We establish reservesThe Company establishes a reserve for estimated product returns allowances in the period in which revenue is recognized. In estimating future product returns, we considerthe Company considers various factors, including ourits stated return policies and practices and historical trends.
Predominantly allCertain of ourthe Company’s revenues represent the sale of hardware with accompanied software that is essential to the functionality of the hardware. TheIn such instances, the Company records revenue associated with the agreed upon price on hardware sales, and accrues any estimated costs of post-delivery performance obligations such as warranty obligations. The Company considers the four basic revenue recognition criteria discussed under Staff Accounting Bulletin No. 104 when assessing appropriate revenue recognition as follows:
Criterion #1—#1 — Persuasive evidence of an arrangement must exist;
Criterion #2—#2 — Delivery has occurred;
Criterion #3—#3 — The Company’sseller’s price to the buyer must be fixed or determinable; and
Criterion #4—#4 — Collectability is reasonably assured.
For multiple element arrangements, total consideration received from customers is allocated to the elements. This may include hardware, leased elements, non-essential software elements and/or essential software, based on a relative selling price. The accounting guidance establishes a hierarchy to determine the selling price to be used for allocating revenue to deliverables as follows: (i) vendors specific objective evidence (VSOE)(“VSOE”), (ii) third party evidence (TPE)(“TPE”), and (iii) best estimate of selling price (BESP)(“BESP”). Because the Company has neither VSOE nor TPE, revenue has been based on the Company’s BESP. Amounts allocated to the delivered hardware and the related essential software are recognized at the time of the sale provided all other revenue recognition criteria have been met. Amounts allocated to other deliverables based upon BESP are recognized in the period the revenue recognition criteria have been met.
OurThe Company’s process for determining its BESP for deliverables without VSOE or TPE considers multiple factors that may vary depending upon the unique facts and circumstances related to each deliverable. OurThe Company’s prices are determined based upon cost to produce ourthe products, expected order quantities, acceptance in the marketplace and internal pricing parameters. In addition, when developing BESPs for products wethe Company may consider other factors as appropriate including the pricing of competitive alternatives if they exist, and product-specific business objectives.
We accountThe Company accounts for nonessential software licenses and related post contract support (PCS)(“PCS”) under multiple element arrangements by recognizing revenue for such arrangements ratably over the term of the PCS as we haveit has not established VSOE for the PCS element.
ForThe Company provides SaaS subscriptions for its fleet management and vehicle finance applications in which customers are provided with the years ended December 31, 2014, 2013ability to wirelessly communicate with monitoring devices installed in vehicles and 2012, we have not recorded any significantother mobile assets
INSEEGO CORP.
NOTES TO CONSOLIDATED FINANCIAL STATEMENTS
via software applications hosted by the Company. The customer has the option to purchase the monitoring device or lease it over the term of the contract. If the customer purchases the monitoring device, the Company recognizes the revenue at the time of purchase. If the customer chooses to lease the monitoring device, the Company recognizes the revenue for the monitoring device over the term of the contract, which is generally three years. The Company records such revenue in accordance with ASC 840, Leases (“ASC 840”), as it has determined that they qualify as operating leases. The Company recognizes revenues from multiple elementSaaS services over the term of the contract.
Certain of the Company’s revenue is based on contractual arrangements. In such instances, management considers the nature of the Company’s contractual arrangements in determining whether to recognize certain types of revenue on the basis of the gross amount billed or software arrangements.net amount retained after payments are made to providers of certain services related to the product or service offering. The main factors the Company uses to determine whether to record revenue on a gross or net basis are whether:
Researchthe Company is primarily responsible for the service to the customer;
the Company has discretion in establishing fees paid by the customer; and Development Costs
Researchthe Company is involved in the determination of product or service specifications.
When the customer’s fee includes a portion of charges that are paid to another party and development coststhe Company is primarily responsible for providing the service to the customer, revenue is recognized on a gross basis in an amount equal to the fee paid by the customer. The cost of revenues recognized is the amount due to the other party and is recorded as cost of revenues in the consolidated statements of operations. In instances in which another party is primarily responsible for providing the service to the customer, revenue is recognized in the net amount retained by the Company. The portion of the fees that are expensedcollected from the customer by the Company and remitted to the other party are considered pass through amounts and accordingly are not a component of net revenues or cost of net revenues.
The Company occasionally enters into transactions where it provides consideration to its customers in the form of credits for certain raw materials received that are used in the finished goods purchased by the same customer. The Company accounts for such credits to customers as incurred.a reduction of net revenues because it is unable to demonstrate the receipt of a benefit that is identifiable and sufficiently separable from the revenue transaction and reasonably estimate the fair value of the benefit identified. Significant management judgment and estimates must be used to determine the fair value of the benefit received in any period.
Provision for Warranty Costs
The Company accrues warranty costs based on estimates of future warranty related replacement, repairs or rework of products. OurThe Company’s warranty policy generally provides one to three years of coverage for products following the date of purchase. The Company’s policy is to accrue the estimated cost of warranty coverage as a component of cost of revenue in the
accompanying consolidated statements of operations at the time revenue is recognized. In estimating ourits future warranty obligations, the Company considers various factors, including the historical frequency and volume of claims and the cost to replace or repair products under warranty. The warranty provision for ourthe Company’s products is determined by using a financial model to estimate future warranty costs. The Company’s financial model takes into consideration actual product failure rates; estimated replacement, repair or rework expenses; and potential risks associated with ourits different products. The risk levels, warranty cost information and failure rates used within this model are reviewed throughout the year and updated, if and when, these inputs change.
Foreign Currency Transactions
Foreign currency transactions are transactions denominated in a currency other than a subsidiary’s functional currency. A change in the exchange rates between a subsidiary’s functional currency and the currency in which a transaction is denominated increases or decreases the expected amount of functional currency cash flows upon settlement of the transaction. That increase or decrease in expected functional currency cash flows is reported by the Company as a foreign currency transaction gain (loss). The primary component of the Company’s foreign currency transaction gain (loss) is due to agreements in place with certain subsidiaries in foreign countries regarding intercompany transactions. Based upon historical experience, the Company anticipates repayment of these transactions in the foreseeable future, and recognizes the realized and unrealized gains (losses) on these transactions that result from foreign currency changes in the period in which they occur as foreign currency transaction gain (loss), which is recorded as other income (expense), net, in the consolidated statements of operations.
INSEEGO CORP.
NOTES TO CONSOLIDATED FINANCIAL STATEMENTS
Foreign Currency Translation
Assets and liabilities of the Company’s international subsidiaries in which the local currency is the functional currency are translated into U.S. Dollars at period-end exchange rates. Income and expenses are translated into U.S. Dollars at the average exchange rates during the period. The resulting translation adjustments are included in the Company’s consolidated balance sheets as a component of accumulated other comprehensive loss.
Income Taxes
The Company recognizes federal, state and foreign current tax liabilities or assets based on ourits estimate of taxes payable to or refundable by tax authorities in the current fiscal year. The Company also recognizes federal, state and foreign deferred tax liabilities or assets based on the Company’s estimate of future tax effects attributable to temporary differences and carryforwards. Deferred tax assets and liabilities are measured using enacted tax rates expected to apply to taxable income in the years in which those temporary differences are expected to be recovered or settled.
Deferred tax assets are reduced by valuation allowances if, based on the consideration of all available evidence, it is more likely than not that some portion of the deferred tax asset will not be realized. The Company evaluates deferred income taxes on a quarterly basis to determine if valuation allowances are required by considering available evidence. If the Company is unable to generate sufficient future taxable income in certain tax jurisdictions, or if there is a material change in the actual effective tax rates or time period within which the underlying temporary differences become taxable or deductible, the Company could be required to increase its valuation allowance against its deferred tax assets which could result in an increase in the Company’s effective tax rate and an adverse impact on operating results. The Company will continue to evaluate the necessity of the valuation allowance based on the remaining deferred tax assets.
The Company follows the accounting guidance related to financial statement recognition, measurement and disclosure of uncertain tax positions. The Company recognizes the impact of an uncertain income tax position on an income tax return at the largest amount that is more-likely-than-not to be sustained upon audit by the relevant taxing authority. An uncertain income tax position will not be recognized if it has less than a 50% likelihood of being sustained. Uncertain tax positions are recognized in the first subsequent financial reporting period in which that threshold is met or from changes in circumstances such as the expiration of applicable statutes of limitations.
Litigation
The Company is currently involved in certain legal proceedings. The Company will record a loss when the Company determines information available prior to the issuance of the financial statements indicates the loss is both probable and estimable. Where a liability is probable and there is a range of estimated loss with no best estimate in the range, the Company records the minimum estimated liability related to the claim. As additional information becomes available, the Company assesses the potential liability related to the Company’s pending litigation and revises its estimates, if necessary. The Company’s policy is to expense litigation costs as incurred.
Share-Based Compensation
The Company has granted stock options to employees and restricted stock units. The Company also has an employee stock purchase plan (“ESPP”) for eligible employees. The Company measures the compensation cost associated with all share-based payments based on grant date fair values. The fair value of each employee stock option and employee stock purchase right is estimated on the date of grant using an option pricing model that meets certain requirements. The Company currentlygenerally uses the Black-Scholes option pricing model to estimate the fair value of its stock options and stock purchase rights. The Black-Scholes model is considered an acceptable model but the fair values generated by it may not be indicative of the actual fair values of ourthe Company’s equity awards as it does not consider certain factors important to those awards to employees, such as continued employment and periodic vesting requirements as well as limited transferability. The determination of the fair value of share-based payment awards utilizing the Black-Scholes model is affected by ourthe Company’s stock price and a number of assumptions, including expected volatility, expected term, risk-free interest rate and expected dividends.
For grants of stock options, the Company uses a blend of historical and implied volatility for traded options on its stock in order to estimate the expected volatility assumption required in the Black-Scholes model. The Company’s use of a blended volatility estimate in computing the expected volatility assumption for stock options is based on its belief that while thatthe implied volatility is representative of expected future volatility, the historical volatility over the expected term of the award is also an indicator of expected future volatility. Due to the short duration of employee stock purchase rights under ourthe Company’s ESPP, the Company utilizes historical volatility in order to estimate the expected volatility assumption of the Black-Scholes model.
The expected term of stock options granted is estimated using historical experience. The risk-free interest rate assumption is based on observed interest rates appropriate for the expected terms of ourthe Company’s stock options and employee stock purchase rights.
The dividend yield assumption is based on the Company’s history and expectation of no dividend payouts. The Company estimates forfeitures at the time of grant and revises these estimates, if necessary, in subsequent periods if actual forfeitures differ from those estimates. The Company estimates its forfeiture rate assumption for all types of share basedshare-based compensation awards based on historical forfeiture rates related to each category of award.
INSEEGO CORP.
NOTES TO CONSOLIDATED FINANCIAL STATEMENTS
Compensation cost associated with grants of restricted stock units are measured at fair value, which has historically been the closing price of the Company’s stock on the date of grant.
The Company recognizes share-based compensation expense over the requisite service period of each individual award, which generally equals the vesting period, using the straight-line method for awards that contain only service conditions. For awards that contain performance conditions, the Company recognizes the share-based compensation expense on a straight-line basis for each vesting tranche.
The Company evaluates the assumptions used to value stock awards on a quarterly basis. If factors change and the Company employs different assumptions, share-based compensation expense may differ significantly from what it has recorded in the past. If there are any modifications or cancellations of the underlying unvested securities, the Company may be required to accelerate, increase or cancel any remaining unearned share-based compensation expense.
Computation of Net Loss Per Share Attributable to Common Shareholders
The Company computes basic and diluted per share data for all periods for which a statement of operations is presented. Basic net loss per share excludes dilution and is computed by dividing the net loss by the weighted-average number of shares that were outstanding during the period. Diluted EPSearnings per share (“EPS”) reflects the potential dilution that could occur if securities or other contracts to acquire common stock were exercised or converted into common stock. Potential dilutive securities are excluded from the diluted EPS computation in loss periods as their effect would be anti-dilutive. For all periods presented, there is no difference in the number of shares used to calculate basic and diluted shares outstanding due to the Company’s net loss position.
Fair Value of Financial Instruments
The Company’s fair value measurements relate to its cash equivalents, marketable debt securities, and marketable equity securities, which are classified pursuant to authoritative guidance for fair value measurements. The Company places its cash equivalents and marketable debt securities in instruments that meet credit quality standards, as specified in its investment policy guidelines. These guidelines also limit the amount of credit exposure to any one issue, issuer or type of instrument.
OurThe Company’s financial instruments consist principally of cash and cash equivalents, short-term and long-term marketable securities, warrants and short-term and long-term debt. The Company’s cash and cash equivalents consist of our investments in money market securities, time deposits with maturities of less than three months and treasury bills. The Company’s marketable securities consist primarily of government agency securities, municipal bonds, time deposits and investment-grade corporate bonds. From time to time, the Company may utilize foreign exchange forward contracts. These contracts are valued using pricing models that take into account the currency rates as of the balance sheet date.
Comprehensive Loss
Comprehensive loss consists of net earnings and unrealized gains and losses on available-for-sale securities.foreign currency translation adjustments.
Recent Accounting Pronouncements
From time to time, new accounting pronouncements are issued by the Financial Accounting Standards Board (the “FASB”(“FASB”), which are adopted by the Company as of the specified date. Unless otherwise discussed, management believes the impact of recently issued standards, which are not yet effective, will not have a material impact on its consolidated financial statements upon adoption.
In August 2014,May 2017, the FASB issued Accounting Standards Update ("ASU"(“ASU”) No. 2014-15,2017-09, PresentationCompensation—Stock Compensation (Topic 718): Scope of Financial Statements-Going Concern (Subtopic 205-40): DisclosureModification Accounting, which amends the scope of Uncertainties aboutmodification accounting for share-based payment arrangements and provides guidance on the types of changes to the terms or conditions of share-based payment awards to which an Entity’s Ability to Continue as a Going Concern. Under the new guidance, management willentity would be required to assessapply modification accounting. The Company implemented this guidance during the fourth quarter of 2017. This guidance did not have a material impact on the Company’s consolidated financial statements upon adoption.
In January 2017, the FASB issued ASU 2017-04, Intangibles—Goodwill and Other (Topic 350): Simplifying the Test for Goodwill Impairment, which simplifies the measurement of goodwill by eliminating the second step from the goodwill impairment test, which requires the comparison of the implied fair value of goodwill with the current carrying amount of goodwill. Instead, under the amendments in this guidance, an entity’s abilityentity shall perform a goodwill impairment test by comparing the fair value of each reporting unit with its carrying amount and an impairment charge is to continue asbe recorded for the amount, if any, by which the carrying value exceeds the reporting unit’s fair value. The Company implemented this guidance during the fourth quarter of 2017. This guidance did not have a going concern,material impact on the Company’s consolidated financial statements upon adoption.
INSEEGO CORP.
NOTES TO CONSOLIDATED FINANCIAL STATEMENTS
In August 2016, the FASB issued ASU 2016-15, Statement of Cash Flows (Topic 230): Classification of Certain Cash Receipts and to provide related footnote disclosuresCash Payments, which clarifies how companies present and classify certain cash receipts and cash payments in certain circumstances.the statement of cash flows. The provisionsCompany implemented this guidance during the fourth quarter of this2017. This guidance did not have a material impact on the Company’s consolidated financial statements upon adoption.
In June 2016, the FASB issued ASU are2016-13, Financial Instruments—Credit Losses (Topic 326): Measurement of Credit Losses on Financial Instruments, which requires measurement and recognition of expected credit losses for financial assets held. This guidance is effective for interim and annual periods beginning after December 15, 2016, and for annual and interim periods thereafter. The Company is currently evaluating the potential changes from this ASU to its future financial reporting and disclosures.
In June 2014, the FASB issued ASU No. 2014-12, Compensation—Stock Compensation: Accounting for Share-Based Payments When the Terms of an Award Provide That a Performance Target Could Be Achieved after the Requisite Service Period. The standard requires that a performance target that affects vesting and that could be achieved after the requisite service period be treated as a performance condition. Entities are required to apply the standard for annual periods and interim periods within those annual periods, beginning after December 15, 2015.2019. Early applicationadoption is permitted. The Company is currently assessing the impact of this new guidance.
F- 12In March 2016, the FASB issued ASU 2016-09, Improvements to Employee Share-Based Payment Accounting, which affects entities that issue share-based payment awards to their employees. The guidance is designed to identify areas for simplification involving several aspects of accounting for share-based payment transactions, including the income tax consequences, classification of awards as either equity or liabilities, an option to recognize gross stock compensation expense with actual forfeitures recognized as they occur, as well as certain classifications on the statement of cash flows. The Company implemented this guidance during the first quarter of 2017. This guidance did not have a material impact on the Company’s consolidated financial statements upon adoption.
In May 2014, the FASB issued ASU No. 2014-09, Revenue from Contracts with Customers(“ASU 2014-09”), which requires a reporting entityprovides guidance for revenue recognition. The new guidance will require revenue recognized to recognize revenue to depictrepresent the transfer of promised goods or services to customers in an amount that reflects the consideration to which the entitycompany expects to be entitledreceive in exchange for those goods or services. The guidance in thisalso requires new, expanded disclosures regarding revenue recognition. In August 2015, the FASB issued ASU affects any entity that either enters into contracts2015-14, Revenue from Contracts with customersCustomers: Deferral of Effective Date, which deferred the effective date of adoption of ASU 2014-09 to transfer goods or services or enters into contracts for the transfer of nonfinancial assets unless those contracts are within the scope of other standards. This standard will be effective forinterim and annual reporting periods beginning after December 15, 2017. Early adoption is permitted. In April 2016, the FASB issued ASU 2016-10, Revenue from Contracts with Customers (Topic 606): Identifying Performance Obligations and Licensing, which clarifies aspects of ASU 2014-09 pertaining to the identification of performance obligations and the licensing implementation guidance, while retaining the related principles for those areas. There are two adoption methods available for implementation of this guidance. Under one method, the guidance is applied retrospectively to contracts for each reporting period presented, subject to allowable practical expedients. Under the other method, the guidance is applied only to the most current period presented, recognizing the cumulative effect of the change as an adjustment to the beginning balance of retained earnings, and also requires additional disclosures comparing the results to the previous guidance.
The Company has established an implementation team, including the utilization of a revenue consultant, to assist with the assessment of the impact of the new guidance on its operations, consolidated financial statements and related disclosures. The Company has substantially completed its assessment of the impact of the new guidance and expects the revenue recognition of its various revenue streams to remain largely unchanged and therefore does not expect a material impact on its revenues upon adoption. The Company has also made a preliminary assessment that the expense related to sales commissions will not be materially different under the new guidance. Based on the Company’s analysis of the new guidance, it has determined that the accounting for leased monitoring devices is outside the scope of the new guidance; therefore, upon adoption of the new revenue recognition guidance the Company will continue to recognize revenues pursuant to two different accounting standards. Revenues related to the Company’s leased monitoring devices will continue to be recognized under ASC 840.
The Company adopted the new guidance in the first quarter of 2018, subsequent to the balance sheet date, using the modified retrospective method and does not expect this guidance to have a material impact on its consolidated financial statements upon adoption.
INSEEGO CORP.
NOTES TO CONSOLIDATED FINANCIAL STATEMENTS
2. Acquisitions and Divestitures
Acquisitions
DigiCore Holdings Limited (DBA Ctrack)
On June 18, 2015, the Company entered into a transaction implementation agreement (the “TIA”) with DigiCore. Pursuant to the terms of the TIA, the Company acquired 100% of the issued and outstanding ordinary shares of DigiCore (with the exception of certain excluded shares, including treasury shares) for 4.40 South African Rand per ordinary share outstanding, with the total consideration not to exceed 1,094,223,363 South African Rand (the “Maximum Consideration”), which amount was placed into escrow upon signing of the TIA. On October 5, 2015 the transaction was completed and upon consummation of the acquisition, DigiCore became an indirect wholly owned subsidiary of the Company.
From the date of execution of the TIA through the date the transaction closed, the Maximum Consideration amount placed into escrow experienced a non-cash loss of $8.3 million due to the weakening of the South African Rand against the U.S. Dollar. This amount is included in non-cash change in acquisition-related escrow in the consolidated statements of operations.
Upon the closing of the transaction, holders of unvested in-the-money DigiCore stock options received stock options to purchase shares of the Company’s common stock as replacement awards.
During the year ended December 31, 2015, the Company incurred $1.7 million in costs and expenses related to the Company’s acquisition of Ctrack that are included in general and administrative expenses in the consolidated statements of operations.
Purchase Price
The total purchase price was approximately $80.0 million and included a cash payment for all of the outstanding ordinary shares of DigiCore and the purchase of in-the-money vested stock options held by Ctrack employees on the closing date of the transaction and the portion of the fair value of replacement equity awards issued to Ctrack employees that related to services performed prior to the date the transaction closed.
Set forth below is supplemental purchase consideration information related to the Ctrack acquisition (in thousands):
|
| | | | |
| | | Year Ended December 31, 2015 |
| Cash payments | | $ | 79,365 |
|
| Fair value of replacement equity awards issued to Ctrack employees for preacquisition services | | 623 |
|
| Total purchase price | | $ | 79,988 |
|
Allocation of Fair Value
The Company accounted for the transaction using the acquisition method and, accordingly, the consideration has been allocated to the tangible and intangible assets acquired and liabilities assumed on the basis of their respective estimated fair values on the acquisition date. Goodwill resulting from this acquisition is largely attributable to the experienced workforce of Ctrack and synergies expected to arise after the integration of Ctrack’s products and operations into those of the Company. Goodwill resulting from this acquisition is not deductible for tax purposes. Identifiable intangible assets acquired as part of the acquisition included finite-lived intangible assets for developed technologies, customer relationships and trade names, which are being amortized using the straight-line method over their estimated useful lives, as well as indefinite-lived intangible assets. Liabilities assumed from DigiCore included a mortgage bond and capital lease obligations.
INSEEGO CORP.
NOTES TO CONSOLIDATED FINANCIAL STATEMENTS
The fair value has been allocated based on the estimated fair values of assets acquired and liabilities assumed as follows (in thousands):
|
| | | | |
| | | October 5, 2015 |
| Cash | | $ | 2,437 |
|
| Accounts receivable | | 15,052 |
|
| Inventory | | 11,361 |
|
| Property, plant and equipment | | 5,924 |
|
| Rental assets | | 6,603 |
|
| Intangible assets | | 28,270 |
|
| Goodwill | | 29,273 |
|
| Other assets | | 5,695 |
|
| Bank facilities | | (2,124 | ) |
| Accounts payable | | (7,446 | ) |
| Accrued and other liabilities | | (15,018 | ) |
| Noncontrolling interests | | (39 | ) |
| Net assets acquired | | $ | 79,988 |
|
Valuation of Intangible Assets Acquired
The following table sets forth the components of intangible assets acquired in connection with the Ctrack acquisition (dollars in thousands):
|
| | | | | | |
| | | Amount Assigned | | Amortization Period (in years) |
| Finite-lived intangible assets: | | | | |
| Developed technologies | | $ | 10,170 |
| | 6.0 |
| Trade name | | 14,030 |
| | 10.0 |
| Customer relationships | | 4,070 |
| | 5.0 |
| Total intangible assets acquired | | $ | 28,270 |
| | |
R.E.R. Enterprises, Inc. (DBA Feeney Wireless)
On March 27, 2015, the Company entered into a merger agreement (“RER Merger Agreement”) with R.E.R. Enterprises, Inc. (“RER”) to acquire all of the issued and outstanding shares of RER and its wholly owned subsidiary and principal operating asset, FW, an Oregon limited liability company, which develops and sells IoT solutions that integrate wireless communications into business processes. This strategic acquisition expanded the Company’s product and solutions offerings to include private labeled cellular routers, in-house designed and assembled cellular routers, high-end wireless surveillance systems, modems, computers and software, along with associated hardware, purchased from major industry suppliers. Additionally, FW’s services portfolio includes consulting, systems integration and device management services.
In connection with the acquisition, the Company incurred $0.9 million in total costs and expenses, which are included in general and administrative expenses in the consolidated statements of operations for the year ended December 31, 2015.
Purchase Price
The total purchase price was approximately $24.8 million and included a cash payment at closing of approximately $9.3 million, $1.5 million of which was placed into an escrow fund to serve as partial security for the indemnification obligations of RER and its former shareholders, the Company’s assumption of $0.5 million in certain transaction-related expenses incurred by FW, and the future issuance of shares of the Company’s common stock valued at $15.0 million (the “Deferred Purchase Price”), which would have been payable in March 2016 pursuant to the original terms of the RER Merger Agreement.
The total consideration of $24.8 million does not include amounts, if any, payable under an earn-out arrangement under which the Company may have been required to pay up to an additional $25.0 million to the former shareholders of RER contingent upon FW’s achievement of certain financial targets for the years ending December 31, 2015, 2016 and 2017 (the
INSEEGO CORP.
NOTES TO CONSOLIDATED FINANCIAL STATEMENTS
“Earn-Out Arrangement”). Such payments, if any, under the Earn-Out Arrangement would have been payable in either cash or shares of the Company’s common stock at the discretion of the Company, and would have been recorded as compensation expense during the service period earned.
Set forth below is supplemental purchase consideration information related to the FW acquisition (in thousands):
|
| | | | |
| Cash payments | | $ | 9,268 |
|
| Future issuance of common stock | | 15,000 |
|
| Other assumed liabilities | | 509 |
|
| Total purchase price | | $ | 24,777 |
|
On January 5, 2016, the Company and RER amended certain payment terms of the RER Merger Agreement (such agreement, as amended, the “Amended RER Merger Agreement”). Under the Amended RER Merger Agreement, the $1.5 million placed into escrow on the date of acquisition was released to RER and its former shareholders on January 8, 2016, and the Deferred Purchase Price that was previously payable in shares of the Company’s common stock in March 2016 was agreed to be paid in five cash installments over a four-year period, beginning in March 2016. In addition, the Earn-Out Arrangement was amended as follows: (a) any amount earned under the Earn-Out Arrangement for the achievement of financial targets for the year ended December 31, 2015 would be paid in five cash installments over a four-year period, beginning in March 2016 and (b) in replacement of the potential earn-out contingent upon FW’s achievement of certain financial targets for the years ended December 31, 2016 and 2017 the Company will issue to the former shareholders of RER approximately 2.9 million shares of the Company’s common stock in three equal installments over a three-year period, beginning in March 2017. The Company recognized approximately $7.9 million in expense during the year ended December 31, 2016 in connection with an earn-out payment due to the former shareholders of RER in the form of shares of the Company’s common stock.
On March 15, 2017, the Company issued 973,334 shares of its common stock to the former stockholders of RER in satisfaction of the first installment of this obligation. As of the filing date of this report, the March 2017 and March 2018 cash installments have not been paid and the March 2018 share installment has not been issued. The Company is currently assessingdisputing its obligations to make such payments and any future payments (see Note 12, Commitments and Contingencies).
As of December 31, 2017, the impacttotal amount of the Deferred Purchase Price that remained outstanding was $11.3 million and the total amount outstanding pursuant to the Earn-Out Arrangement was $9.8 million, both of which are included in accrued expenses and other current liabilities and in other long-term liabilities in the consolidated balance sheets.
Allocation of Fair Value
The Company accounted for the transaction using the acquisition method and, accordingly, the consideration has been allocated to the tangible and intangible assets acquired and liabilities assumed on the basis of their respective estimated fair values on the acquisition date as set forth below. Goodwill resulting from this new guidance.acquisition is largely attributable to the experienced workforce of FW and synergies expected to arise after the integration of FW’s products and operations into those of the Company. Goodwill resulting from this acquisition is deductible for tax purposes. Identifiable intangible assets acquired as part of the acquisition included finite-lived intangible assets for developed technologies, customer relationships, and trademarks, which are being amortized using the straight-line method over their estimated useful lives, as well as indefinite-lived intangible assets, including in-process research and development. Liabilities assumed from FW included a term loan and capital lease obligations. The term loan and certain capital lease obligations were paid in full by the Company immediately following the closing of the acquisition on March 27, 2015.
INSEEGO CORP.
NOTES TO CONSOLIDATED FINANCIAL STATEMENTS
The fair value has been allocated based on the estimated fair values of assets acquired and liabilities assumed as follows (in thousands):
|
| | | | |
| | | March 27, 2015 |
| Cash | | $ | 205 |
|
| Accounts receivable | | 3,331 |
|
| Inventory | | 10,008 |
|
| Property, plant and equipment | | 535 |
|
| Intangible assets | | 18,880 |
|
Goodwill(1) | | 3,949 |
|
| Other assets | | 544 |
|
| Accounts payable | | (7,494 | ) |
Accrued and other liabilities(1) | | (1,916 | ) |
| Deferred revenues | | (270 | ) |
| Note payable | | (2,575 | ) |
| Capital lease obligations | | (420 | ) |
| Net assets acquired | | $ | 24,777 |
|
| |
(1) | Reflects measurement-period adjustments recorded by the Company in accordance with ASU 2015-16. During the year ended December 31, 2016, the Company recorded a measurement-period adjustment to the allocation of fair value resulting in a $0.2 million increase to accrued and other liabilities and a corresponding $0.2 million increase to goodwill. |
Valuation of Intangible Assets Acquired
The following table sets forth the components of intangible assets acquired in connection with the FW acquisition (dollars in thousands):
|
| | | | | | |
| | | Amount Assigned | | Amortization Period (in years) |
| Finite-lived intangible assets: | | | | |
| Developed technologies | | $ | 3,660 |
| | 6.0 |
| Trademarks | | 4,700 |
| | 10.0 |
| Customer relationships | | 8,500 |
| | 10.0 |
| Indefinite-lived intangible assets: | | | | |
| In-process research and development | | 2,020 |
| |
|
| Total intangible assets acquired | | $ | 18,880 |
| | |
During the year ended December 31, 2016, the Company recorded an impairment loss related to developed technologies acquired in connection with the FW acquisition of approximately $2.6 million, which is included in impairment of purchased intangibles in the consolidated statements of operations.
Divestitures
Modules Business
On April 11, 2016, the Company signed a definitive asset purchase agreement with Telit Technologies (Cyprus) Limited and Telit Wireless Solutions, Inc. (collectively, “Telit”) pursuant to which the Company sold, and Telit acquired, certain hardware modules and related assets for an initial purchase price of $11.0 million in cash, which included $9.0 million that was paid to the Company on the closing date of the transaction, $1.0 million that would be paid to the Company in equal quarterly installments over a two-year period in connection with the provision by the Company of certain transition services and $1.0 million that would be paid to the Company following the satisfaction of certain conditions by the Company, including the assignment of specified contracts and the delivery of certain certifications and approvals. The Company also had the potential to receive an additional cash payment of approximately $3.8 million from Telit related to their purchase of module product inventory from the Company, $1.0 million of which would be paid to the Company in equal quarterly installments over the two-year period following the closing date in connection with the provision by the Company of certain transition services. In
INSEEGO CORP.
NOTES TO CONSOLIDATED FINANCIAL STATEMENTS
addition to the above, the Company may have been entitled to receive a subsequent earn-out payment following the closing of the transaction if certain conditions were met.
On September 29, 2016, the Company entered into a Final Resolution Letter Agreement (the “Final Resolution”) with Telit. Per the Final Resolution, Telit agreed to pay the Company $2.1 million in full satisfaction of their payment obligations under certain sections of the original purchase agreement, including all installment payments, and the Company agreed to ship the remainder of the hardware modules and related assets as soon as practicable. Under the Final Resolution, the aggregate purchase consideration totaled $11.7 million, which consisted of $11.3 million in cash and $0.4 million in net settled Company liabilities.
During the years ended December 31, 2017 and 2016, the Company recognized a gain of approximately $45,000 and $5.0 million, respectively, in connection with the fulfillment of certain obligations pursuant to the asset purchase agreement, as amended, which is included in other income (expense), net, in the consolidated statements of operations.
MiFi Business
On September 21, 2016, the Company entered into a Stock Purchase Agreement (the “Purchase Agreement”), by and among Inseego and Novatel Wireless, on the one hand, and T.C.L. Industries Holdings (H.K.) Limited and Jade Ocean Global Limited (collectively, the “Purchasers”), on the other hand. The Purchase Agreement related to the proposed sale of the Company’s subsidiary, Novatel Wireless, which included the Company’s MiFi branded hotspots and USB modem product lines (the “MiFi Business”), to the Purchasers for $50.0 million in cash, subject to potential adjustment for Novatel Wireless’s working capital as of the closing date.
In June 2017, the Company terminated the Purchase Agreement due to delays and uncertainty in securing approval of the transactions contemplated by the Purchase Agreement from CFIUS and announced key leadership changes and a Company-wide restructuring designed to improve execution, enhance financial performance and drive profitable growth as the Company worked to create sustainable long-term value for shareholders. As part of the restructuring plan, among other actions, the Company implemented cost reduction measures which included a series of targeted reductions across its businesses and geographies, and rationalization of its businesses. As a result of the termination of the transaction described above and the institution of certain restructuring initiatives, the Company retained its ownership interest in Novatel Wireless and the MiFi Business.
One of the many benefits associated with the retention of the MiFi Business is the retention of know-how and intellectual property essential to the development of advanced wireless technologies, such as the newly emerging 5G NR standard.
3. Financial Statement Details
Short-term investments
The Company acquired certain short-term investments in trading securities through its acquisition of Ctrack. The Company recognized a gain of approximately $0.2 million and $0.1 million on such securities during the years ended December 31, 2016 and 2015, respectively, which is included in other income (expense), net, in the consolidated statements of operations. The Company did not have short-term investments during the year ended December 31, 2017.
Inventories
Inventories consist of the following (in thousands):
|
| | | | | | | |
| | December 31, |
| | 2017 | | 2016 |
| Finished goods | $ | 14,331 |
| | $ | 19,277 |
|
| Raw materials and components | 6,072 |
| | 11,865 |
|
| | $ | 20,403 |
| | $ | 31,142 |
|
INSEEGO CORP.
NOTES TO CONSOLIDATED FINANCIAL STATEMENTS
Property, Plant and Equipment
Property, plant and equipment consists of the following (in thousands):
|
| | | | | | | |
| | December 31, |
| | 2017 | | 2016 |
| Land | $ | 288 |
| | $ | 260 |
|
| Buildings | 2,614 |
| | 2,363 |
|
| Test equipment | 23,396 |
| | 23,115 |
|
| Computer equipment and purchased software | 5,548 |
| | 4,373 |
|
| Product tooling | 449 |
| | 409 |
|
| Furniture and fixtures | 564 |
| | 915 |
|
| Vehicles | 2,003 |
| | 1,746 |
|
| Leasehold improvements | 267 |
| | 243 |
|
| | 35,129 |
| | 33,424 |
|
| Less—accumulated depreciation and amortization | (28,138 | ) | | (25,032 | ) |
| | $ | 6,991 |
| | $ | 8,392 |
|
At December 31, 2017, the Company had vehicles and equipment under capital leases of $1.6 million, net of accumulated amortization of $1.5 million. At December 31, 2016, the Company had vehicles and equipment under capital leases of $1.8 million, net of accumulated amortization of $1.1 million.
Rental Assets
Rental assets consist of the following (in thousands):
|
| | | | | | | |
| | December 31, |
| | 2017 | | 2016 |
| Rental assets | $ | 16,602 |
| | $ | 11,115 |
|
| Less—accumulated depreciation | (9,039 | ) | | (4,112 | ) |
| | $ | 7,563 |
| | $ | 7,003 |
|
Depreciation and amortization expense related to property, plant and equipment, including equipment under capital leases, and rental assets was $8.0 million, $7.8 million and $5.0 million for the years ended December 31, 2017, 2016 and 2015, respectively.
INSEEGO CORP.
NOTES TO CONSOLIDATED FINANCIAL STATEMENTS
Accrued Expenses and Other Current Liabilities
Accrued expenses and other current liabilities consist of the following (in thousands):
|
| | | | | | | |
| | December 31, |
| | 2017 | | 2016 |
| Royalties | $ | 1,558 |
| | $ | 1,544 |
|
| Payroll and related expenses | 2,870 |
| | 5,315 |
|
| Warranty obligations | 400 |
| | 480 |
|
| Market development funds and price protection | 34 |
| | 320 |
|
| Professional fees | 1,789 |
| | 4,793 |
|
| Bank overdrafts | 117 |
| | 489 |
|
| Accrued interest | 239 |
| | 275 |
|
| Deferred revenue | 1,823 |
| | 1,656 |
|
| Restructuring | 964 |
| | 837 |
|
| Acquisition-related liabilities | 13,186 |
| | 7,912 |
|
| Divestiture-related liabilities | — |
| | 463 |
|
| Other | 4,578 |
| | 3,813 |
|
| | $ | 27,558 |
| | $ | 27,897 |
|
4. Goodwill and Other Intangible Assets
A summary of the activity in goodwill is presented below (in thousands):
|
| | | |
| Balance at December 31, 2015 | $ | 29,520 |
|
Ctrack adjustment(1) | 1,236 |
|
| FW adjustment | 195 |
|
| Effect of change in foreign currency exchange rates | 3,477 |
|
| Balance at December 31, 2016 | 34,428 |
|
| Effect of change in foreign currency exchange rates | 3,253 |
|
| Balance at December 31, 2017 | $ | 37,681 |
|
| |
(1) | During the year ended December 31, 2016, the Company identified the need for an immaterial adjustment in the recording of net assets and goodwill in the accounting for the acquisition of Ctrack. As a result, the Company has recorded an adjustment during the year ended December 31, 2016 that increased goodwill and decreased accounts receivable. There was no change in reported cash flows in any period related to this adjustment. |
The Company’s intangible assets are comprised of the following (in thousands):
|
| | | | | | | | | | | | | |
| | December 31, 2017 |
| | Weighted-Average Life
(in years) | | Gross Carrying Value | | Accumulated Amortization | | Net Carrying Value |
| Finite-lived intangible assets: | | | | | | | |
| Developed technologies | 5.6 | | $ | 18,332 |
| | $ | (9,532 | ) | | $ | 8,800 |
|
| Trademarks and trade names | 9.3 | | 24,337 |
| | (8,911 | ) | | 15,426 |
|
| Customer relationships | 8.2 | | 13,480 |
| | (4,852 | ) | | 8,628 |
|
| Capitalized software development costs | 5.0 | | 6,491 |
| | (1,472 | ) | | 5,019 |
|
| Other | 2.8 | | 712 |
| | (706 | ) | | 6 |
|
| Total finite-lived intangible assets | | | $ | 63,352 |
| | $ | (25,473 | ) | | 37,879 |
|
| Indefinite-lived intangible assets: | | | | | | | |
| In-process capitalized software development costs | | | | | | | 792 |
|
| Total intangible assets | | | | | | | $ | 38,671 |
|
INSEEGO CORP.
NOTES TO CONSOLIDATED FINANCIAL STATEMENTS
|
| | | | | | | | | | | | | |
| | December 31, 2016 |
| | Weighted-Average Life
(in years) | | Gross Carrying Value | | Accumulated Amortization | | Net Carrying Value |
| Finite-lived intangible assets: | | | | | | | |
| Developed technologies | 5.5 | | $ | 17,247 |
| | $ | (7,042 | ) | | $ | 10,205 |
|
| Trademarks and trade names | 9.2 | | 23,043 |
| | (6,905 | ) | | 16,138 |
|
| Customer relationships | 8.3 | | 13,046 |
| | (2,993 | ) | | 10,053 |
|
| Capitalized software development costs | 5.0 | | 3,579 |
| | (511 | ) | | 3,068 |
|
| Other | 2.7 | | 828 |
| | (545 | ) | | 283 |
|
| Total finite-lived intangible assets | | | $ | 57,743 |
| | $ | (17,996 | ) | | 39,747 |
|
| Indefinite-lived intangible assets: | | | | | | | |
| In-process capitalized software development costs | | | | | | | 536 |
|
| Total intangible assets | | | | | | | $ | 40,283 |
|
During the year ended December 31, 2016, in-process research and development acquired in connection with the FW acquisition was completed and reclassified to developed technologies where it is being amortized over its estimated useful life.
Amortization expense for the years ended December 31, 2017, 2016 and 2015 was approximately $6.3 million, $6.2 million and $3.3 million, respectively, including approximately $0.9 million, $0.3 million and $25,000 related to capitalized software development costs for the years ended December 31, 2017, 2016 and 2015, respectively.
During the year ended December 31, 2017, the Company recorded an impairment loss on intangible assets of approximately $0.4 million, which is included in other income (expense), net, in the consolidated statements of operations. During the year ended December 31, 2016, the Company recorded an impairment loss on intangible assets of approximately $2.7 million, which is included in impairment of purchased intangibles and other income (expense), net, in the consolidated statements of operations.
The following table represents details of the amortization of finite-lived intangible assets that is estimated to be expensed in the future (in thousands):
|
| | | |
| 2018 | $ | 7,281 |
|
| 2019 | 7,274 |
|
| 2020 | 7,044 |
|
| 2021 | 5,759 |
|
| 2022 | 3,301 |
|
| Thereafter | 7,220 |
|
| Total | $ | 37,879 |
|
5. Fair Value Measurement of Assets and Liabilities
Fair value is defined as the price that would be received to sell an asset or paid to transfer a liability in an orderly transaction between market participants at the measurement date (exit price). A fair value measurement reflects the assumptions market participants would use in pricing an asset or liability based on the best available information. These assumptions include the risk inherent in a particular valuation technique (such as a pricing model) and the risks inherent in the inputs to the model.
We classify ourThe Company classifies inputs to measure fair value using a three-level hierarchy that maximizes the use of observable inputs and minimizes the use of unobservable inputs by requiring that the most observable inputs be used when available. The categorization of financial instruments within the valuation hierarchy is based upon the lowest level of input that is significant to the fair value measurement. The hierarchy is prioritized into three levels (with Level 3 being the lowest) and is defined as follows:
| |
| Level 1: | Pricing inputs are based on quoted market prices for identical assets or liabilities in active markets (e.g., NYSE or NASDAQ). Active markets are those in which transactions for the asset or liability occur in sufficient frequency and volume to provide pricing information on an ongoing basis. |
Level 1: Pricing inputs are based on quoted market prices for identical assets or liabilities in active markets (e.g., NYSE). Active markets are those in which transactions for the asset or liability occur in sufficient frequency and volume to provide pricing information on an ongoing basis.
Level 2: Pricing inputs include benchmark yields, trade data, reported trades and broker dealer quotes, two-sided markets and industry and economic events, yield to maturity, Municipal Securities Rule Making Board reported trades and vendor trading platform data. Level 2 includes those financial instruments that are valued using various pricing services and broker pricing information including Electronic Communication Networks and broker feeds.F-26
Level 3: Pricing inputs include significant inputs that are generally less observable from objective sources, including the Company’s own assumptions.
At December 31, 2014, the Company did not have any securities in the Level 3 category.
INSEEGO CORP.
NOTES TO CONSOLIDATED FINANCIAL STATEMENTS
| |
| Level 2: | Pricing inputs include benchmark yields, trade data, reported trades and broker dealer quotes, two-sided markets and industry and economic events, yield to maturity, Municipal Securities Rule Making Board reported trades and vendor trading platform data. Level 2 includes those financial instruments that are valued using various pricing services and broker pricing information including Electronic Communication Networks and broker feeds. |
| |
| Level 3: | Pricing inputs include significant inputs that are generally less observable from objective sources, including the Company’s own assumptions. |
The Company reviews the fair value hierarchy classification on a quarterly basis. We validate the quoted market prices provided by our primary pricing service by comparing their assessment of the fair values of our investments by using a third party investment manager. The third party investment manager uses similar techniques to our primary pricing service to derive the pricing describe above. Changes in the observability of valuation inputs may result in a reclassification of levels for certain securities within the fair value hierarchy. There have been no transfers of assets or liabilities between fair value measurement classifications during the year ended December 31, 2017.
The Company had no financial instruments measured at fair value on a recurring basis as of December 31, 2017.
The following table summarizes the Company’s financial instruments measured at fair value on a recurring basis in accordance with the authoritative guidance for fair value measurements as of December 31, 20142016 (in thousands):
|
| | | | | | | | | | | |
| Description | Balance as of
December 31, 2014 | | Level 1 | | Level 2 |
| Assets: | | | | | |
| Cash equivalents | | | | | |
| Money market funds | $ | 1,134 |
| | $ | 1,134 |
| | $ | — |
|
| Certificates of deposit | 980 |
| | — |
| | 980 |
|
| Total cash equivalents | $ | 2,114 |
| | $ | 1,134 |
| | $ | 980 |
|
The following table summarizes the Company’s financial instruments measured at fair value on a recurring basis in accordance with the authoritative guidance for fair value measurements as of December 31, 2013 (in thousands):
|
| | | | | | | | | | | |
| Description | Balance as of
December 31, 2013 | | Level 1 | | Level 2 |
| Assets: | | | | | |
| Cash equivalents | | | | | |
| US Treasury securities | $ | 487 |
| | $ | — |
| | $ | 487 |
|
| Total cash equivalents | 487 |
| | — |
| | 487 |
|
| Short-term marketable securities: | | | | | |
| Available-for-sale: | | | | | |
| Government agency securities | 2,351 |
| | — |
| | 2,351 |
|
| Municipal bonds | 2,829 |
| | — |
| | 2,829 |
|
| Certificates of deposit | 3,360 |
| | — |
| | 3,360 |
|
| Corporate debentures / bonds | 10,638 |
| | — |
| | 10,638 |
|
| Total short-term marketable securities | 19,178 |
| | — |
| | 19,178 |
|
| Long-term marketable securities: | | | | | |
| Available-for-sale: | | | | | |
| Certificates of deposit | 1,300 |
| | — |
| | 1,300 |
|
| Corporate debentures / bonds | 2,143 |
| | — |
| | 2,143 |
|
| Total long-term marketable securities | 3,443 |
| | — |
| | 3,443 |
|
| Total financial assets | $ | 23,108 |
| | $ | — |
| | $ | 23,108 |
|
|
| | | | | | | | |
| | | Balance as of
December 31, 2016 | | Level 1 |
| Assets: | | | | |
| Cash equivalents | | | | |
| Money market funds | | $ | 35 |
| | $ | 35 |
|
| Total cash equivalents | | $ | 35 |
| | $ | 35 |
|
As of December 31, 2014, the Company had no short- or long-term marketable securities.
As of December 31, 20142017 and 2013,2016, the Company had no outstanding foreign currency exchange forward contracts.
During the years ended December 31, 2014, 20132017 and 2012,2015, the Company recorded net foreign currency losses on foreign currency denominated transactionstransaction gains of approximately $176,000, $183,000$0.2 million and $51,000, respectively. The loss during$1.1 million, net of the years ended December 31, 2014 and 2013non-cash change in acquisition-related escrow, respectively, primarily related to foreign currency losses on foreign currency denominated bank accounts. The loss duringoutstanding intercompany loans that Ctrack has with certain of its subsidiaries, which are remeasured at each reporting period and payable upon demand. During the year ended December 31, 20122016, the Company recorded net foreign currency transaction losses of approximately $3.6 million, primarily related to foreign currency losses on South Korean won denominated trade payables.outstanding intercompany loans that Ctrack has with certain of its subsidiaries.
All recorded gains and losses on foreign exchangecurrency transactions are recorded in other income (expense), net, withinin the consolidated statements of operations.
Other Financial Instruments
Carrying valuesThe Company’s financial assets and fair values of financial instruments thatliabilities are not carried at fair value or at amounts that, because of their short-term nature, approximate current fair value, with the exception of its $105.1 million in the consolidated balance sheets are as follows (in thousands):
|
| | | | | | | |
| | As of December 31, 2014 |
| Description | Carrying Amount | | Fair Value |
| Revolving credit facility | $ | 5,158 |
| | $ | 5,158 |
|
| Total other financial instruments | $ | 5,158 |
| | $ | 5,158 |
|
3. Financial Statement Details
Marketable Securities
Convertible Notes (as defined below) (see Note 6, Debt). The Company didcarries its Convertible Notes at amortized cost. The debt and equity components of the Convertible Notes were measured using Level 3 inputs and are not have any short-term or long-term marketable securitiesmeasured on a recurring basis. The fair value of the liability component of the Convertible Notes, which approximates the carrying value of such notes, was $84.8 million and $90.9 million as of December 31, 2017 and 2016, respectively.
6. Debt
Short-Term Borrowings
DigiCore Secured Banking Facility
DigiCore has a secured banking facility with Absa Bank Limited in South Africa (“Absa”), which had a maximum borrowing capacity of $1.9 million at December 31, 2014.2017. The facility bears interest at the South Africa prime interest rate less 0.10% (10.15% at December 31, 2017) and is subject to renewal annually in April. At December 31, 2017 and 2016, $1.9 million and $1.7 million, respectively, was outstanding under this facility.
INSEEGO CORP.
NOTES TO CONSOLIDATED FINANCIAL STATEMENTS
DigiCore Secured Overdraft Facility
DigiCore has a secured overdraft facility with Grindrod Bank Limited in South Africa, which had a maximum borrowing capacity of Contents
The following table summarizes the Company’s portfolio of available-for-sale securities by contractual maturity as of$1.2 million at December 31, 2013 (in thousands):
|
| | | | | | | | | | | | | | | | | |
| December 31, 2013 | Maturity in
Years | | Amortized
Cost | | Gross
Unrealized
Gains | | Gross
Unrealized
Losses | | Estimated
Fair Value |
| Available-for-sale: | | | | | | | | | |
| Government agency securities | 1 or less | | $ | 2,350 |
| | $ | 1 |
| | $ | — |
| | $ | 2,351 |
|
| Municipal bonds | 1 or less | | 2,828 |
| | 1 |
| | — |
| | 2,829 |
|
| Certificates of deposit | 1 or less | | 3,360 |
| | — |
| | — |
| | 3,360 |
|
| Corporate debentures / bonds | 1 or less | | 10,635 |
| | 3 |
| | — |
| | 10,638 |
|
| Total short-term marketable securities | | | 19,173 |
| | 5 |
| | — |
| | 19,178 |
|
| Available-for-sale: | | | | | | | | | |
| Certificates of deposit | 1 to 2 | | 1,300 |
| | — |
| | — |
| | 1,300 |
|
| Corporate debentures / bonds | 1 to 2 | | 2,143 |
| | — |
| | — |
| | 2,143 |
|
| Total long-term marketable securities | | | 3,443 |
| | — |
| | — |
| | 3,443 |
|
| | | | $ | 22,616 |
| | $ | 5 |
| | $ | — |
| | $ | 22,621 |
|
2017. The Company’s available-for-sale securities are carried onfacility bears interest at the consolidated balance sheetSouth Africa prime interest rate plus 1.00% (11.25% at fair market value with the related unrealized gainsDecember 31, 2017), requires monthly interest and, losses included in accumulated other comprehensive loss on the consolidated balance sheet, whichcertain instances, minimum principal payments. The facility is a separate component of stockholders’ equity. Realized gains and losses on the sale of available-for-sale marketable securities are determined using the specific-identification method.
subject to renewal annually in September. At December 31, 20142017 and 2013, the Company recorded net unrealized gains of $0 and $5,000, respectively. The Company’s net unrealized loss is the result of market conditions affecting its fixed-income debt securities, which are included in accumulated other comprehensive income on the consolidated balance sheet for the periods then ended.
Inventories
Inventories consist of the following (in thousands): |
| | | | | | | |
| | December 31, |
| | 2014 | | 2013 |
| Finished goods | $ | 33,045 |
| | $ | 20,870 |
|
| Raw materials and components | 4,758 |
| | 6,923 |
|
| | $ | 37,803 |
| | $ | 27,793 |
|
Property and Equipment
Property and equipment consists of the following (in thousands): |
| | | | | | | |
| | December 31, |
| | 2014 | | 2013 |
| Test equipment | $ | 53,019 |
| | $ | 52,108 |
|
| Computer equipment and purchased software | 11,247 |
| | 10,814 |
|
| Product tooling | 3,535 |
| | 3,204 |
|
| Furniture and fixtures | 1,824 |
| | 2,015 |
|
| Leasehold improvements | 4,103 |
| | 4,094 |
|
| | 73,728 |
| | 72,235 |
|
| Less—accumulated depreciation and amortization | (68,449 | ) | | (62,334 | ) |
| | $ | 5,279 |
| | $ | 9,901 |
|
For the years ended December 31, 2014, 2013 and 2012, the Company recorded $0, $70,000 and $100,000, respectively, in its cost of net revenues as a result of its impairment analysis of property and equipment.
Depreciation expense relating to property and equipment was $6.3 million, $7.92016, $1.1 million and $9.4$1.5 million, for the years ended December 31, 2014, 2013 and 2012, respectively.
F- 15respectively, was outstanding under this facility.
Accrued ExpensesLong-Term Debt
Accrued expenses consist of the following (in thousands):
|
| | | | | | | |
| | December 31, |
| | 2014 | | 2013 |
| Royalties | $ | 4,035 |
| | $ | 4,243 |
|
| Payroll and related expenses | 8,038 |
| | 4,828 |
|
| Product warranty | 1,196 |
| | 2,244 |
|
| Market development funds and price protection | 2,502 |
| | 3,059 |
|
| Professional fees | 780 |
| | 1,040 |
|
| Deferred revenue | 962 |
| | 2,999 |
|
| Restructuring | 1,886 |
| | 610 |
|
| Other | 4,445 |
| | 4,248 |
|
| | $ | 23,844 |
| | $ | 23,271 |
|
Accrued Warranty Obligations
Accrued warranty obligations consist of the following (in thousands):
|
| | | | | | | |
| | December 31, |
| | 2014 | | 2013 |
| Warranty liability at beginning of period | $ | 2,244 |
| | $ | 2,329 |
|
| Additions charged to operations | 1,345 |
| | 5,055 |
|
| Deductions from liability | (2,393 | ) | | (5,140 | ) |
| Warranty liability at end of period | $ | 1,196 |
| | $ | 2,244 |
|
4. Intangible Assets
The Company’s amortizable purchased intangible assets resulting from its 2010 acquisition of Enfora are composed of (in thousands):
|
| | | | | | | | | | | | | | | | | | | | | | | | | | | | | | | |
| | Years ended December 31, |
| | 2014 | | 2013 |
| | Gross | | Accumulated
Amortization | | Accumulated
Impairment | | Net | | Gross | | Accumulated
Amortization | | Impairment | | Net |
| Developed technologies | $ | 26,000 |
| | $ | (6,453 | ) | | $ | (19,547 | ) | | $ | — |
| | $ | 26,000 |
| | $ | (6,120 | ) | | $ | (19,547 | ) | | $ | 333 |
|
| Trade name | 12,800 |
| | (3,183 | ) | | (8,582 | ) | | 1,035 |
| | 12,800 |
| | (2,665 | ) | | (8,582 | ) | | 1,553 |
|
| Other | 3,720 |
| | (2,011 | ) | | (1,620 | ) | | 89 |
| | 3,720 |
| | (1,967 | ) | | (1,620 | ) | | 133 |
|
| Total amortizable purchased intangible assets | $ | 42,520 |
| | $ | (11,647 | ) | | $ | (29,749 | ) | | $ | 1,124 |
| | $ | 42,520 |
| | $ | (10,752 | ) | | $ | (29,749 | ) | | $ | 2,019 |
|
The following table presents details of the amortization of purchased intangible assets included in the cost of net revenues and general and administrative expense categories (in thousands):
|
| | | | | | | |
| | Years ended December 31, |
| | 2014 | | 2013 |
| Cost of net revenues | $ | 333 |
| | $ | 334 |
|
| General and administrative expenses | 562 |
| | 562 |
|
| Total amortization expense | $ | 895 |
| | $ | 896 |
|
The following table presents details of the amortization of existing amortizable purchased intangible assets of Enfora that is currently estimated to be expensed in the future (in thousands):
|
| | | |
| Fiscal year: | Amount |
| 2015 | $ | 562 |
|
| 2016 | 562 |
|
| Total | $ | 1,124 |
|
Additionally, at December 31, 2014 and 2013, the Company had net acquired software licenses and other intangibles of $369,000 and $112,000, respectively, net of accumulated amortization of $2.4 million and $2.2 million, respectively. The acquired software licenses represent rights to use certain software necessary for the development and commercial sale of the Company’s products.
The Company monitors its intangible and long-lived asset balances and conducts formal tests when impairment indicators are present. There was no impairment loss recorded for the year ended December 31, 2014 and 2013. For the year ended December 31, 2012, the Company recorded an impairment loss of $49.5 million.
Amortization expense relating to acquired software licenses and other intangibles was $173,000, $113,000 and $196,000 for the years ended December 31, 2014, 2013 and 2012, respectively. Amortization expense related to licenses obtained for research purposes is recorded within research and development expense in the consolidated statements of operations. Amortization expense related to licenses obtained for commercial products is recorded in cost of net revenues in the consolidated statements of operations.
At December 31, 2014, the weighted average remaining useful life of the Company’s long-lived intangible assets including acquired software licenses is 2.0 years.
5. Derivative Financial Instruments
The Company evaluates stock options, stock warrants or other contracts to determine if those contracts or embedded components of those contracts qualify as derivative financial instruments to be separately accounted for under the relevant sections of FASB Accounting Standards Codification. The result of this accounting treatment could be that the fair value of a financial instrument is classified as a derivative financial instrument and is marked-to-market at each balance sheet date and recorded as an asset or liability. In the event that the fair value is recorded as an asset or liability, the change in fair value is recorded in the statement of operations as other income or other expense. Upon conversion, exercise or expiration of a derivative financial instrument, the instrument is marked to fair value and then that fair value is reclassified to equity.
Certain of the Company’s outstanding warrants were treated as derivative liabilities for accounting purposes due to insufficient authorized shares to settle these outstanding contracts at the time of issuance. These common stock purchase warrants did not trade in an active securities market. The Company estimated the fair value of these warrant liabilities using a Monte Carlo simulation option pricing model.
6. RevolvingPrevious Credit FacilityAgreement
On October 31, 2014, the Company and one of its subsidiaries entered into a five-year senior secured revolving credit facility in the amount of $25.0 million (the “Revolver”) with Wells Fargo Bank, National Association,NA, as lender.
The Concurrently with the acquisition of FW, the Company amended the Revolver to include FW as a borrower and Loan Party, as defined by the agreement. On November 17, 2015, the Revolver was amended to increase the maximum borrowing capacity to $48.0 million. On March 20, 2017, at the Company’s request, the financial covenants with respect to liquidity requirements and EBITDA targets, among other things, were amended in order to enable draw-downs by the Company from time to time. In exchange for such accommodations, the aggregate amount of borrowings that may be madeavailable under the Revolver is based on a borrowing base comprised of a specified percentage of eligible receivables. If, at any time during the term of the Revolver, the amount of borrowings outstanding under the Revolver exceeds the borrowing base then in effect or the maximum revolver amount of $25.0was decreased from $48.0 million the Company is required to repay such borrowings in an amount sufficient to eliminate such excess. The Revolver includes $3.0 million of availability for letters of credit.$10.0 million.
The Company may borrow funds underterminated the Revolver from timeon May 8, 2017, in connection with the execution of a credit agreement between the Company and Lakestar Semi Inc., a private investment fund managed by Soros Fund Management LLC, dated as of May 8, 2017 (the “Prior Credit Agreement”). The Prior Credit Agreement provided for a $20.0 million secured term loan with a maturity date of May 8, 2018. In conjunction with the closing of the Prior Credit Agreement, the Company received proceeds of $18.0 million, net of a $2.0 million debt discount, and paid issuance costs of approximately $0.4 million.
On August 23, 2017, upon entering into the Credit Agreement described below, the Company used a portion of the proceeds of the new Term Loan (as defined below) to time,repay all outstanding amounts under and terminate the Prior Credit Agreement. In connection with interest payable monthly atthe termination of the Prior Credit Agreement, the Company recognized a base rate determinedloss on extinguishment of debt of approximately $1.7 million, which is included in other income (expense), net, in the consolidated statements of operations. There was no early termination fee paid in connection with the termination of the Prior Credit Agreement.
Term Loan
On August 23, 2017, the Company and certain of its direct and indirect subsidiaries (the “Guarantors”) entered into a credit agreement (the “Credit Agreement”) with Cantor Fitzgerald Securities, as administrative agent and collateral agent (the “Agent”), and certain funds managed by usingHighbridge Capital Management, LLC, as lenders (the “Lenders”). Pursuant to the daily three month LIBOR rate, plus an applicable marginCredit Agreement, the Lenders provided the Company with a term loan in the principal amount of 2.50%$48.0 million (the “Term Loan”) with a maturity date of August 23, 2020 (the “Maturity Date”). In conjunction with the closing of the Term Loan, the Company received proceeds of $46.9 million, $35.0 million of which was funded to 3.00% dependingthe Company in cash on the closing date, net of an original issue discount and commitment fee, and the remaining $11.9 million of which was funded through the Company’s liquidity as determined onrepurchase and cancellation of approximately $14.9 million of its outstanding Inseego Notes (as defined below) pursuant to the last dayterms of each calendar month.the Note Purchase Agreement (as defined below). The RevolverCompany paid issuance costs of approximately $0.5 million. Additionally, the Company issued shares of its common stock and accrued an exit fee, which, when combined with the original debt discount and commitment fee, resulted in a total debt discount of approximately $4.0 million.
The Term Loan is secured by a first priority lien on substantially all of the assets of the Company and the Guarantors, including equity interests in certain of itsthe Company’s direct and indirect subsidiaries, in each case subject to certain customary exceptions and permitted liens. The RevolverCredit Agreement includes customary representations and warranties, a material adverse change clause, as well as customary reporting and financial covenants.
At December 31, 2014, the balance of the revolving credit facility was approximately $5.2 million, with a weighted average effective interest rate of 2.8% and the Company had available borrowings of approximately $12.1 million. At December 31, 2014, the The Company was in compliance with all customary reporting and financial covenants containedat December 31, 2017.
The Term Loan bears interest at a rate per annum equal to the three-month LIBOR, but in no event less than 1.00%, plus 7.625%. Interest on the credit agreement.Term Loan is payable on the last business day of each calendar month and on the Maturity Date. Principal on the Term Loan is payable on the Maturity Date.
INSEEGO CORP.
NOTES TO CONSOLIDATED FINANCIAL STATEMENTS
The Term Loan consisted of Contents
7. Earnings Per Share
Basic earnings per share (“EPS”) excludes dilution and is computed by dividing net income (loss) attributable to common stockholders by the weighted-average number of common shares outstanding for the period. Diluted EPS reflects the potential dilution that could occur if securities or other contracts to issue common stock were exercised or converted into common stock using the treasury stock method. Potentially dilutive securities (consisting of warrants, options and restricted stock units (“RSUs”) and employee stock purchase plan (“ESPP”) withholdings calculated using the treasury stock method) are excluded from the diluted EPS computation in loss periods and when the applicable exercise price is greater than the market price on the period end date as their effect would be anti-dilutive.
Weighted average options, restricted stock units, warrants and ESPP shares to acquire a total of 8,130,000 shares, 4,424,000 shares and 5,793,000 shares of common stock for the years endedfollowing at December 31, 2014, 2013 and 2012, respectively, were outstanding but not included in the computation of diluted earnings per share as their effect was anti-dilutive.
|
| | | | | | | | | | | |
| | Year Ended December 31, |
| | 2014 | | 2013 | | 2012 |
| | (in thousands except per share amounts) |
| Numerator | | | | | |
| Net loss attributable to common shareholders: | $ | (39,674 | ) | | $ | (43,413 | ) | | $ | (89,266 | ) |
| Denominator | |
| | |
| | |
|
| Weighted-average common shares outstanding | 37,959 |
| | 33,948 |
| | 32,852 |
|
| Basic and diluted net loss per share attributable to common shareholders | $ | (1.05 | ) | | $ | (1.28 | ) | | $ | (2.72 | ) |
8. Stockholders’ Equity
Preferred Stock
The Company has a total of 2,000,000 shares of Series A and Series B preferred stock authorized for issuance at a par value of $0.001 per share. No preferred shares are currently issued or outstanding.
Common Shares Reserved for Future Issuance
The Company has reserved shares of common stock for possible future issuance as of December 31, 2014 and 2013 as follows2017 (in thousands):
|
| | | | | |
| | Shares |
| | 2014 | | 2013 |
| Common stock warrants outstanding | 4,118 |
| | — |
|
| Stock options outstanding under the 2009 Omnibus Incentive Compensation Plan and previous plans | 3,065 |
| | 3,933 |
|
| Restricted stock units outstanding | 1,629 |
| | 1,108 |
|
| Future grants of awards under the 2009 Omnibus Incentive Compensation Plan | 4,463 |
| | 3,668 |
|
| Shares available under the Employee Stock Purchase Plan | 1,385 |
| | 1,500 |
|
| Total shares of common stock reserved for issuance | 14,660 |
| | 10,209 |
|
|
| | | |
| Principal | $ | 48,000 |
|
| Less: unamortized debt discount and debt issuance costs | (3,945 | ) |
| Net carrying amount | $ | 44,055 |
|
9. Stock Incentive and Employee Stock Purchase Plans
DuringThe effective interest rate on the Term Loan was 12.73% for the period from the date of issuance through December 31, 2017. The following table sets forth total interest expense recognized related to the Term Loan during the year ended December 31, 2014, the Company granted awards under the 2009 Omnibus Incentive Compensation Plan (the “2009 Plan”). The Compensation Committee of the Board of Directors administers the plan.
Under the 2009 Plan, a maximum of 10.0 million shares of common stock may be issued upon the exercise of stock options, in the form of restricted stock, or in settlement of restricted stock units or other awards, including awards with alternative vesting schedules such as performance-based criteria.
For the years ended December 31, 2014, 2013 and 2012, the following table presents total share-based compensation expense in each functional line item on our consolidated statements of operations2017 (in thousands):
|
| | | | | | | | | | | |
| | Year Ended December 31, |
| | 2014 | | 2013 | | 2012 |
| Cost of revenues | $ | 5 |
| | $ | 84 |
| | $ | 747 |
|
| Research and development | 654 |
| | 1,114 |
| | 3,042 |
|
| Sales and marketing | 247 |
| | 669 |
| | 1,403 |
|
| General and administrative | 2,682 |
| | 1,576 |
| | 2,308 |
|
| Totals | $ | 3,588 |
| | $ | 3,443 |
| | $ | 7,500 |
|
|
| | | |
| Contractual interest expense | $ | 1,511 |
|
| Amortization of debt discount | 472 |
|
| Amortization of debt issuance costs | 57 |
|
| Total interest expense | $ | 2,040 |
|
Included in share-based compensation for the year ended December 31, 2014 is approximately $1.3Convertible Senior Notes
Novatel Wireless Notes
On June 10, 2015, Novatel Wireless issued $120.0 million of share-based compensation5.50% convertible senior notes due 2020 (the “Novatel Wireless Notes”). The Company incurred issuance costs of approximately $3.9 million. The Company used a portion of the proceeds from the offering to finance its acquisition of Ctrack, to pay fees and expenses related to the departure of the Company’s former Chief Executive Officeracquisition, and the vesting of all of his restricted stock units and options immediately upon his departure in accordance withfor general corporate purposes.
The Novatel Wireless Notes are governed by the terms of his employment agreement.
an indenture, dated June 10, 2015, between Novatel Wireless, as issuer, Inseego and Wilmington Trust, National Association, as trustee, as amended by certain supplemental indentures. The per share fair valuesNovatel Wireless Notes are senior unsecured obligations of stock options granted under the 2009 PlanNovatel Wireless and rights granted under the ESPP have been estimated with the following assumptions.
|
| | | | | | | | | | | | | | | | | |
| | Employee Stock Options | | Employee Stock Purchase Rights |
| | 2014 | | 2013 | | 2012 | | 2014 | | 2013 | | 2012 |
| Expected dividend yield: | — | % | | — | % | | — | % | | — | % | | — | % | | — | % |
| Risk-free interest rate: | 1.4 | % | | 0.8 | % | | 0.9 | % | | 5.4 | % | | — | % | | 0.2 | % |
| Volatility: | 80 | % | | 63 | % | | 63 | % | | 53 | % | | — | % | | 68 | % |
| Expected term (in years): | 4.6 |
| | 6 |
| | 6 |
| | 0.4 |
| | 0.0 |
| | 1.3 |
|
Stock Options
The Compensation Committee of the Board of Directors determines eligibility, vesting schedules and exercise prices for options granted. Options granted under the 2009 Plan and previous plans generally havebear interest at a term of ten years, and in the case of new hires, generally vest and become exercisable at the rate of 33.3% after one5.50% per year, payable semi-annually in arrears on June 15 and ratably on a monthly basis over a period of 24 months thereafter. Subsequent option grants to existing employees generally have the same terms.
A summary of stock option activity for the years ended December 31, 2014 and 2013 is presented below (dollars and shares in thousands, except per share data):
|
| | | | | | | | | | | | |
| | Stock
Options
Outstanding | | Weighted
Average
Exercise
Price Per
Option | | Weighted
Average
Remaining
Contractual
Term
(Years) | | Aggregate
Intrinsic
Value |
| Options outstanding December 31, 2012 | 4,282 |
| | $ | 10.25 |
| | | | |
| Granted | 425 |
| | 2.10 |
| | | | |
| Exercised | (38 | ) | | 2.68 |
| | | | |
| Cancelled | (736 | ) | | 10.21 |
| | | | |
| Options outstanding December 31, 2013 | 3,933 |
| | $ | 9.45 |
| | | | |
| Granted | 1,658 |
| | 2.92 |
| | | | |
| Exercised | (89 | ) | | 2.17 |
| | | | |
| Cancelled | (2,437 | ) | | 10.52 |
| | | | |
| Balance December 31, 2014 | 3,065 |
| | $ | 5.27 |
| | 4.92 years | | $ | 1,022 |
|
| Options Exercisable, December 31, 2014 | 1,769 |
| | $ | 6.80 |
| | 4.99 years | | $ | 449 |
|
The total intrinsic value of options exercised to purchase common stock during the years ended December 31, 2014, 2013 and 2012 was approximately $96,000, $44,000 and $0, respectively. As of December 31, 2014, total unrecognized share-based compensation cost related to unvested stock options was $1,777,000, which is expected to be recognized over a weighted average period of approximately 2.7 years. The total fair value of option awards recognized as expense during the years ended December 31, 2014, 2013 and 2012 was approximately $776,000, $0.8 million and $1.7 million, respectively. The weighted
average fair value of option awards granted during years ended December 31, 2014, 2013 and 2012 was $1.48, $1.20 and $1.97, respectively.
Restricted Stock Units
The Company may issue restricted stock units (“RSUs”) that, upon satisfaction of vesting conditions, allow for employees and non-employee directors to receive common stock. Issuances of such awards reduce common stock available under the 2009 Plan for stock incentive awards. The Company measures compensation cost associated with grants of RSUs at fair value, which is generally the closing price of the Company’s stock on the date of grant.
During 2014, the Compensation Committee of the Board of Directors, pursuant to the 2009 Plan, awarded employees a total of 2,658,956 RSUs at fair values ranging from $1.60 per share to $3.55 per share. Generally, one-third of the shares underlying each grant become issuable on the anniversary15 of each grant date, assuming continued employment with the Company through such date. Basedyear, beginning on the fair value of the Company’s common stock price at the grant dates, the Company estimated the aggregate fair value of these awards at approximately $5.7 million.December 15, 2015. The estimated fair value of these awards is being amortized to compensation expense for each grantNovatel Wireless Notes will mature on a straight-line basis over the estimated service period.
During 2013, the Compensation Committee of the Board of Directors, pursuant to the 2009 Plan, awarded employees a total of 447,703 RSUs at fair values ranging from $1.74 per share to $4.17 per share. Generally, one-third of the shares underlying each grant become issuable on the anniversary of each grant date, assuming continued employment with the Company through such date. Based on the fair value of the Company’s common stock price at the grant dates, the Company estimated the aggregate fair value of these awards at approximately $0.9 million.June 15, 2020, unless earlier repurchased or converted. The estimated fair value of these awards is being amortized to compensation expense for each grant on a straight-line basis over the estimated service period.
During 2012, the Compensation Committee of the Board of Directors, pursuant to the 2009 Plan, awarded employees a total of 1,015,638 RSUs at fair values ranging from $1.28 per share to $3.58 per share. Generally, one-third of the shares underlying each grant become issuable on the anniversary of each grant date, assuming continued employment with the Company through such date. Based on the fair value of the Company’s common stock price at the grant dates, the Company estimated the aggregate fair value of these awards at approximately $3.4 million. The estimated fair value of these awards is being amortized to compensation expense for each grant on a straight-line basis over the estimated service period.
A summary of restricted stock unit activity for the year ended December 31, 2014 is presented below (shares in thousands):
|
| | |
| Shares |
Non-vested at December 31, 2013 | 1,108 |
|
Granted | 2,659 |
|
Vested | (1,207 | ) |
Forfeited | (931 | ) |
Non-vested at December 31, 2014 | 1,629 |
|
As of December 31, 2014, there was $3.0 million of unrecognized compensation expense related to non-vested RSUs. That expense is expected toNovatel Wireless Notes will be recognized over a weighted average period of 2.7 years. The total fair value of RSUs recognized as expense during the years ended December 31, 2014, 2013 and 2012 was $2.9 million, $2.6 million and $3.4 million, respectively.
2000 Employee Stock Purchase Plan
The Company’s 2000 Employee Stock Purchase Plan (the “ESPP”) permits eligible employees of the Company to purchase newly issued shares of common stock, at a price equal to 85% of the lower of the fair market value on (i) the first day of the offering period or (ii) the last day of each six-month purchase period, through payroll deductions of up to 10% of their annualconvertible into cash, compensation.
On October 22, 2012, the Company announced the termination of the ESPP as of November 15, 2012 due to a lack of available shares. The cancellation of the awards was accounted for as a repurchase for no consideration. The previously unrecognized compensation cost as of November 15, 2012 of $1.0 million was fully expensed in the fourth quarter of 2012.
The Company reinstated the ESPP program effective as of August 16, 2014. The reinstated ESPP authorizes the Company to issue 1,500,132 shares of common for purchase by eligible employees.
During the years ended December 31, 2014, 2013 and 2012, the Company issued 114,791 shares, 0 shares and 1,086,837 shares, respectively, under the ESPP. During the years ended December 31, 2014, 2013 and 2012, the Company received $192,000, $0 and $1.6 million, respectively, in cash through employee withholdings.
The total fair value of ESPP awards recognized as expense during the years ended December 31, 2014, 2013 and 2012 was $101,000, $0 and $1.4 million, respectively.
10. Securities Purchase Agreement
On September 3, 2014, the Company entered into a Purchase Agreement (the “Purchase Agreement”) with HC2 Holdings 2, Inc., a Delaware corporation (the “Investor”), pursuant to which, on September 8, 2014, the Company sold to the Investor (i) 7,363,334 shares of the Company’s common stock, par value $0.001or a combination thereof, at the election of the Company, at an initial conversion price of $5.00 per share (ii)of the Company’s common stock.
Following the settlement of the exchange offer and consent solicitation described below, approximately $0.2 million aggregate principal amount of Novatel Wireless Notes remain outstanding. In connection with the exchange offer and consent solicitation, the Novatel Wireless Notes and its related indenture were amended to, among other things, eliminate certain events of default and substantially all of the restrictive covenants in the Novatel Wireless Notes and its related indenture, including the merger covenant, which sets forth certain requirements that must be met for Novatel Wireless to consolidate, merge or sell all or substantially all of its assets, and the reporting covenant, which requires Novatel Wireless to provide certain periodic reports to noteholders. The Novatel Wireless Notes’ related indenture, as amended, also provides that the form of settlement of any conversions of the Novatel Wireless Notes will be elected by the Company.
Inseego Notes
On January 9, 2017, in connection with the settlement of an exchange offer and consent solicitation with respect to the Novatel Wireless Notes, the Company issued approximately $119.8 million of 5.50% convertible senior notes due 2022 (the “Inseego Notes” and collectively with Novatel Wireless Notes, the “Convertible Notes”). The Inseego Notes were issued in exchange for the approximately $119.8 million aggregate principal amount of outstanding Novatel Wireless Notes that were validly tendered and accepted for exchange and subsequently canceled.
The Inseego Notes are governed by the terms of an indenture, dated January 9, 2017 (the “Inseego Indenture”), between the Company, as issuer, and Wilmington Trust, National Association, as trustee (the “Trustee”). The Inseego Notes are senior unsecured obligations of the Company and bear interest from, and including, December 15, 2016, at a warrantrate of 5.50% per year, payable semi-annually in arrears on June 15 and December 15 of each year, beginning on June 15, 2017. The Inseego Notes permit the Company to purchase 4,117,647have a senior credit facility up to a maximum amount of $48.0 million. The Inseego Notes will mature on June 15, 2022, unless earlier converted, redeemed or repurchased.
The Inseego Notes will be convertible into cash, shares of the Company’s common stock, or a combination thereof, at the election of the Company, at an initial conversion rate of 212.7660 shares of common stock atper $1,000 principal amount of the
INSEEGO CORP.
NOTES TO CONSOLIDATED FINANCIAL STATEMENTS
Inseego Notes, which corresponds to an exerciseinitial conversion price of $2.26$4.70 per share (the “Warrant”) and (iii) 87,196 shares of the Company’s Series C Convertible Preferred Stock, par value $0.001 per share (the “Series C Preferred Stock”)common stock. The conversion rate is subject to adjustment from time to time upon the occurrence of certain events, including, but not limited to, the issuance of stock dividends and payment of cash dividends.
At any time prior to the close of business on the business day immediately preceding December 15, 2021, holders may convert their Inseego Notes at their option only under the following circumstances:
| |
| (i) | during any calendar quarter (and only during such calendar quarter), if the last reported sale price of the Company’s common stock for at least 20 trading days (whether or not consecutive) during a period of 30 consecutive trading days ending on the last trading day of the immediately preceding calendar quarter equals or exceeds 130% of the conversion price on such trading day; |
| |
| (ii) | during the five consecutive business day period immediately after any five consecutive trading day period (the “Measurement Period”) in which the trading price per $1,000 principal amount of the Inseego Notes for each trading day of the Measurement Period was less than 98% of the product of the last reported sale price per share of the Company’s common stock and the conversion rate on each such trading day; |
| |
| (iii) | upon the occurrence of certain corporate events specified in the Inseego Indenture; or |
| |
| (iv) | if the Company has called the Inseego Notes for redemption. |
On or after December 15, 2021, the holders may convert any of their Inseego Notes at any time prior to the close of business on the business day immediately preceding the maturity date.
The Company may redeem all or a portion of the Inseego Notes at a purchaseits option on or after June 15, 2018 if the last reported sale price of (a) $1.75 per share of the Company’s common stock equals or exceeds 140% of the conversion price for each of at least 20 trading days (whether or not consecutive) during the 30 consecutive trading days ending on, and including, the trading day immediately prior to the date on which the Company provides written notice of redemption, at a redemption price equal to 100% of the principal amount of the Inseego Notes to be redeemed, plus in each case,any accrued and unpaid interest on such Inseego Notes, subject to the right of holders as of the close of business on an interest record date to receive the related Warrant and (b) $17.50 per share of Series C Preferred Stock,interest. In addition, if the Company calls the Inseego Notes for aggregate gross proceeds of approximately $14.4 million (collectively,redemption, a “make-whole fundamental change” (as defined in the “Financing”).Inseego Indenture) will be deemed to occur. As a result, the Company will, in certain circumstances, increase the conversion rate for holders who convert their Inseego Notes in connection with such redemption.
Certain termsThe Inseego Notes are subject to repurchase by the Company at the option of the Warrantholders on June 15, 2020 (the “Optional Repurchase Date”) at a repurchase price in cash equal to 100% of the principal amount of the Inseego Notes to be repurchased, plus accrued and unpaid interest to, but excluding, the Optional Repurchase Date, subject to the right of holders of the Inseego Notes on a record date to receive interest through the corresponding interest payment date.
No “sinking fund” is provided for the Inseego Notes, which means that the Company is not required to periodically redeem or retire the Inseego Notes. If the Company undergoes a “fundamental change” (as defined in the Inseego Indenture), subject to certain conditions, holders may require the Company to repurchase for cash all or part of their Inseego Notes in principal amounts of $1,000, or an integral multiple of $1,000 in excess thereof. The fundamental change repurchase price will be equal to 100% of the principal amount of the Inseego Notes to be repurchased, plus accrued and unpaid interest to, but excluding, the fundamental change repurchase date, subject to the right of holders as of the close of business on an interest record date to receive the related interest. In addition, every fundamental change is a make-whole fundamental change. As a result, the Company will, in certain circumstances, increase the conversion rate for holders who convert their Inseego Notes in connection with such fundamental change.
The Inseego Indenture contains certain covenants, effective until June 15, 2020, that limit the amount of debt, including secured debt, that may be incurred by the Company or its subsidiaries, and that limit the ability of the Company to pay dividends, repurchase its equity securities or make other restricted payments. The Company was in compliance with such covenants at December 31, 2017.
The Inseego Indenture also provides for customary events of default. If an event of default (other than certain events of bankruptcy, insolvency or reorganization involving the Company) occurs and is continuing, the Trustee, by notice to the Company, or the holders of at least 25% in principal amount of the outstanding Inseego Notes, by notice to the Company and the Series C Preferred Stock were dependent uponTrustee, may declare the approvalprincipal and accrued and unpaid interest on the outstanding Inseego Notes to be immediately due and payable. Upon the occurrence of certain events of bankruptcy, insolvency or reorganization involving the Company, 100% of the principal and accrued and unpaid interest of the Inseego Notes will automatically become immediately due and payable.
INSEEGO CORP.
NOTES TO CONSOLIDATED FINANCIAL STATEMENTS
Notwithstanding the foregoing, the Inseego Indenture provides that, to the extent the Company elects and for up to 60 days, the sole remedy for an event of default relating to certain failures by the Company’s stockholdersCompany to comply with certain reporting covenants consists exclusively of (i)the right to receive special interest on the Inseego Notes at a rate equal to 0.50% per annum on the principal amount of the outstanding Inseego Notes.
Because the exchange of the Novatel Wireless Notes for the Inseego Notes described above was treated as a debt modification in accordance with applicable FASB guidance (it was between a parent and a subsidiary company and for substantially identical notes), the Company did not recognize a gain or loss with respect to the issuance of the Inseego Notes. In accordance with authoritative guidance, the Company recognized $3.6 million as an additional component of debt discount and additional paid-in capital attributed to the increase in the total number of authorized shares of common stock to 100,000,000 shares and (ii) the issuance and salefair value of the securitiesembedded conversion feature of the Inseego Notes before and after modification. The Company will amortize the debt discount on the Inseego Notes as a component of interest expense using the effective interest method through June 2020.
Note Purchase Agreement
On August 23, 2017, in connection with the Credit Agreement described above, the Company and certain of the Lenders entered into a Note Purchase Agreement (the “Note Purchase Agreement”) pursuant to which the Company repurchased approximately $14.9 million of outstanding Inseego Notes from such Lenders in exchange for $11.9 million deemed to have been loaned to the Company pursuant to the Purchase Agreement (including the issuance of all shares of common stock issuable upon the full conversion of the Series C Preferred Stock issued pursuant to the PurchaseCredit Agreement and the full exerciseaccrued and unpaid interest on such notes. In connection with the repurchase of such notes, the Company recognized a loss on extinguishment of debt of approximately $0.3 million, which is included in other income (expense), net, in the consolidated statements of operations.
The Convertible Notes consisted of the Warrant) and any change of control that may be deemed to occur as a result of such issuance and sale pursuant to the applicable rules of The NASDAQ Stock Market LLC (together, the “Stockholder Approval”). This Stockholder Approval was obtained on November 17, 2014, at a Special Meeting of the Company's stockholders.following (in thousands):
|
| | | | | | | |
| | December 31, |
| | 2017 | | 2016 |
| Liability component: | | | |
| Principal | $ | 105,125 |
| | $ | 120,000 |
|
| Less: unamortized debt discount and debt issuance costs | (20,352 | ) | | (29,092 | ) |
| Net carrying amount | $ | 84,773 |
| | $ | 90,908 |
|
| Equity component | $ | 41,905 |
| | $ | 38,305 |
|
In connection with the issuance of 7,363,334 sharesthe Convertible Notes, the Company incurred approximately $3.9 million of common stockissuance costs, which primarily consisted of underwriting, legal and other professional fees, and allocated the costs to the Investor,liability and equity components based on the Company unreserved 1,651,455 sharesallocation of common stock previously approved forthe proceeds. Of the approximately $3.9 million of issuance pursuantcosts, approximately $1.3 million were allocated to the Company’s 2009 Omnibus Incentive Compensation Planequity component and 1,300,000 shares of common stock previously approved for issuance pursuantrecorded as a reduction to additional paid-in capital and $2.6 million were allocated to the Company’s 2000 ESPP. Accordingly, these shares were not available for grants under the respective plans until the Company’s Stockholders approved an increase in the total number of authorized shares of common stock.
Warrant
In connection with the above transaction the Company issuedliability component and recorded as a Warrant to purchase 4,117,647 shares of common stock at an exercise price of $2.26 per sharedecrease to the Investor. Pursuantcarrying amount of the liability component on the consolidated balance sheet. The portion allocated to the termsliability component is being amortized to interest expense using the effective interest method through June 2020.
The effective interest rate on the liability component of the Warrant, the Warrant will generally only be exercisable on a cash basis. However, the Warrant may be exercisable on a cashless basis if and only if a registration statement relating to the issuance of the shares underlying the Warrant is not then effective or an exemption from registration is not available. Subject to certain limitations, the Warrant will be exercisable into shares of common stock during the period commencing on March 8, 2015 and ending on September 8, 2019, the expiration date of the Warrant. The Warrant may be exercised by surrendering to the Company the warrant certificate evidencing the Warrant to be exercised with the accompanying exercise notice, appropriately completed, duly signed and delivered, together with cash payment of the exercise price, if applicable.
The exercise price and the number of shares of common stock issuable upon exercise of the Warrant are subject to adjustment upon certain corporate events, including certain combinations, recapitalizations, reorganizations, reclassifications, stock dividends and stock splits. In the event of an extraordinary transaction, as described in the Warrant and generally including any merger with or into another entity, sale of all or substantially all of the Company’s assets, tender offer or exchange offer, or reclassification of the common stock, each Warrant will automatically be converted into the right to receive, for each share of common stock that would have been issuable upon exercise of such Warrant immediately prior to such transaction, the same kind and amount of securities, cash or property as the holder would have been entitled to receive if the holder had been the holder of common stock immediately prior to the occurrence of such transaction. No fractional shares will be issued upon exercise of the Warrant. The Warrant does not confer upon its holder any voting or other rights as a stockholder of the Company.
Due to insufficient authorized shares to satisfy the exercise of the instrument in full at the time of issuance, the Company determined that the instrument should be treated as a derivative instrument as of September 30, 2014. Liability classificationConvertible Notes was required because share settlement was not within the control of the Company and the Warrant was not considered to be “indexed to the company’s own stock” and therefore did not qualify18.11% for the exemptions provided by ASC 815.
On November 17, 2014, at a Special Meeting of the Stockholders the Company received Stockholder Approval to increase the number of authorized shares of the Company's common stock from 50,000,000 shares to 100,000,000 shares, and accordingly, the Company marked to fair value the above described Warrant instrument and then reclassified that fair value of $8,219,000 to additional paid-in-capital.
Because the Warrant has no comparable market data to determine fair value, the Company hired an independent valuation firm to assist with the valuation of the Warrant. The primary factors used to determine the fair value include: (i) the fair value of the Company’s common stock; (ii) the volatility of the Company’s common stock; (iii) the risk free interest rate; (iv) the estimated likelihood and timing of exercise; and (v) the estimated likelihood and timing of a future financing arrangement.
Increases in the market value of the Company’s common stock and volatility, which have the most impact on the fair value of the Warrant, would cause the fair value of the Warrant to change. Because of the significant unobservable inputs used to calculate fair value the Company has classified the Warrant as a Level 3 measurement. The Warrant was measured at fair value on a recurring basis including a final remeasurement immediately preceding its reclassification to additional paid-in-capital on November 17, 2014. Unrealized gains and losses on items measured at fair value are recognized in earnings as other income/(expense). The Company incurred an expense of $3.3 million for the twelve monthsyear ended December 31, 20142017. The following table sets forth total interest expense recognized related to the Warrant as a result of an increase in the market value of the Company’s common stock.
The following table shows the change to the fair value of the WarrantConvertible Notes during the twelve monthsyears ended December 31, 20142017 and 2016 (in thousands):
|
| | | | |
Warrant Derivative Liability | | |
Balance at September 8, 2014 (Transaction Date)
| | $ | 4,939 |
|
| Change in fair value | | 3,280 |
|
Balance at November 17, 2014 (Shareholder Approval Date)
| | 8,219 |
|
Reclassification to additional paid-in-capital
| | (8,219 | ) |
| Ending balance at December 31, 2014 | | $ | — |
|
|
| | | | | | | |
| | Year Ended
December 31, |
| | 2017 | | 2016 |
| Contractual interest expense | $ | 6,310 |
| | $ | 6,600 |
|
| Amortization of debt discount | 8,542 |
| | 7,920 |
|
| Amortization of debt issuance costs | 502 |
| | 527 |
|
| Total interest expense | $ | 15,354 |
| | $ | 15,047 |
|
Contingently Redeemable Convertible Series C Preferred Stock
INSEEGO CORP.
NOTES TO CONSOLIDATED FINANCIAL STATEMENTS
DigiCore Mortgage Bond
DigiCore has a mortgage bond with Absa that is secured by certain property of DigiCore. The mortgage bond has a ten year term, expiring in December 2018, and bears interest at the FinancingSouth Africa prime rate minus 1.75% (8.50% at December 31, 2017). At December 31, 2017 and 2016, $0.3 million and $0.6 million, respectively, remained outstanding under the Company issued 87,196 sharesmortgage bond.
At December 31, 2017, the minimum calendar year principal payments and maturities of Series C Preferred Stock at $17.50 per share, initially convertible, subject to adjustments, into 871,960 shares of common stock.
On November 17, 2014, at a Special Meetinglong-term debt were as follows, assuming no repurchases or conversions of the Stockholders,Novatel Wireless Notes prior to June 15, 2020, the Company received stockholder approvalmaturity date, or the Inseego Notes prior to increaseJune 15, 2022, the number of authorized shares of the Company's common stock from 50,000,000 shares to 100,000,000 shares and each share of Series C Preferred Stock then outstanding automatically converted into the number of shares of common stock by the conversion rate then in effect. Accordingly, each share of Series C Preferred Stock was converted into ten shares of common stock and upon conversion the Company reclassified the Series C Preferred Stock out of mezzanine equity into permanent equity and recognized a beneficial conversion feature ("BCF") of $445,000 in equity due to the resolution of the contingent BCF embedded within the Series C Preferred Stock.maturity date (in thousands):
|
| | | |
| 2018 | $ | 338 |
|
| 2019 | — |
|
| 2020 | 48,250 |
|
| 2021 | — |
|
| 2022 | 104,875 |
|
| Total | $ | 153,463 |
|
11.7. Income Taxes
Income (loss)Loss before income taxes for the years ended December 31, 2014, 20132017, 2016 and 20122015 is comprised of the following (in thousands):
| | | | Year Ended December 31, | Year Ended December 31, |
| | 2014 | | 2013 | | 2012 | 2017 | | 2016 | | 2015 |
| Domestic | $ | (39,513 | ) | | $ | (44,142 | ) | | $ | (88,945 | ) | $ | (40,034 | ) | | $ | (51,265 | ) | | $ | (48,965 | ) |
| Foreign | 408 |
| | 812 |
| | 290 |
| (5,592 | ) | | (8,922 | ) | | (3,148 | ) |
| Loss before taxes | $ | (39,105 | ) | | $ | (43,330 | ) | | $ | (88,655 | ) | |
| Loss before income taxes | | $ | (45,626 | ) | | $ | (60,187 | ) | | $ | (52,113 | ) |
The provision (benefit) for income taxes for the years ended December 31, 2014, 20132017, 2016 and 20122015 is comprised of the following (in thousands):
|
| | | | | | | | | | | |
| | Year Ended December 31, |
| | 2017 | | 2016 | | 2015 |
| Current: | | | | | |
| Federal | $ | (760 | ) | | $ | — |
| | $ | — |
|
| State | 104 |
| | — |
| | (6 | ) |
| Foreign | 551 |
| | 185 |
| | 81 |
|
| Total current | (105 | ) | | 185 |
| | 75 |
|
| Deferred: | | | | | |
| Federal | (117 | ) | | 156 |
| | — |
|
| State | — |
| | — |
| | — |
|
| Foreign | 436 |
| | 40 |
| | 106 |
|
| Total deferred | 319 |
| | 196 |
| | 106 |
|
| Provision for income taxes | $ | 214 |
| | $ | 381 |
| | $ | 181 |
|
INSEEGO CORP.
NOTES TO CONSOLIDATED FINANCIAL STATEMENTS
|
| | | | | | | | | | | |
| | Year Ended December 31, |
| | 2014 | | 2013 | | 2012 |
| Current: | | | | | |
| Federal | $ | — |
| | $ | (248 | ) | | $ | — |
|
| State | 21 |
| | 33 |
| | 29 |
|
| Foreign | 16 |
| | (229 | ) | | 74 |
|
| Total Current | 37 |
| | (444 | ) | | 103 |
|
| Deferred: | | | | | |
| Federal | — |
| | 53 |
| | 14 |
|
| State | — |
| | — |
| | — |
|
| Foreign | 87 |
| | 474 |
| | 494 |
|
| Total Deferred | 87 |
| | 527 |
| | 508 |
|
| Provision or income taxes | $ | 124 |
| | $ | 83 |
| | $ | 611 |
|
The Company’s net deferred tax assetsliabilities consist of the following (in thousands):
| | | | December 31, | December 31, |
| | 2014 | | 2013 | 2017 | | 2016 |
| Deferred tax assets: | | | | | | |
| Accrued expenses | $ | 4,566 |
| | $ | 11,292 |
| $ | 1,921 |
| | $ | 2,881 |
|
| Inventory obsolescence provision | 2,352 |
| | 3,539 |
| |
| Provision for excess and obsolete inventory | | 2,577 |
| | 4,913 |
|
| Depreciation and amortization | 4,137 |
| | 4,136 |
| 4,610 |
| | 9,655 |
|
| Deferred rent | 555 |
| | 559 |
| |
| Net operating loss and tax credit carryforwards | 76,346 |
| | 55,010 |
| 86,966 |
| | 105,143 |
|
| Stock-based compensation | 1,910 |
| | 4,518 |
| |
| Share-based compensation | | 1,034 |
| | 2,203 |
|
| Unrecognized tax benefits | 1,296 |
| | 1,190 |
| 1,108 |
| | 1,510 |
|
| Deferred tax assets | 91,162 |
| | 80,244 |
| 98,216 |
| | 126,305 |
|
| Deferred tax liabilities: | | | |
| | |
| Amortization of acquired intangibles | (388 | ) | | (699 | ) | |
| Net deferred tax assets | 90,774 |
| | 79,545 |
| |
| Convertible Notes | | (4,353 | ) | | (9,535 | ) |
| Purchased intangible assets | | (6,280 | ) | | (6,790 | ) |
| Deferred tax liabilities | | (10,633 | ) | | (16,325 | ) |
| Valuation allowance | (90,774 | ) | | (79,458 | ) | (92,844 | ) | | (114,419 | ) |
| Net deferred tax assets | $ | — |
| | $ | 87 |
| |
| Net deferred tax liabilities | | $ | (5,261 | ) | | $ | (4,439 | ) |
The Company recognizes federal, state and foreign current tax liabilities or assets based on its estimate of taxes payable to or refundable by tax authorities in the current fiscal year. The Company also recognizes federal, state and foreign deferred tax liabilities or assets based on the Company’s estimate of future tax effects attributable to temporary differences and carryforwards. The Company records a valuation allowance to reduce any deferred tax assets by the amount of any tax benefits that, based on available evidence and judgment, are not expected to be realized.
The Company assesses whether a valuation allowance should be recorded against its deferred tax assets based on the consideration of all available evidence, using a “more likely than not” realization standard. The four sources of taxable income that must be considered in determining whether deferred tax assets will be realized are: (1) future reversals of existing taxable temporary differences (i.e., offset of gross deferred tax assets against gross deferred tax liabilities); (2) taxable income in prior carryback years, if carryback is permitted under the applicable tax law; (3) tax planning strategies; and (4) future taxable income exclusive of reversing temporary differences and carryforwards.
After a review of the four sources of taxable income described above and after being in a three year cumulative loss position at the end of 2014,2015, the Company recognized a full valuation allowance.allowance against all of its U.S.-based and against some of the Company’s foreign-based entities’ deferred tax assets.
During 2014At December 31, 2017 and 2013,2016, the Company recognized valuation allowances of $11.3$16.4 million and $15.6$19.3 million, respectively, related to its U.S.-based and Canadian deferred tax assets created in those respective years. As a result, no net income tax benefits resulted in the Company’s statements forof operations from the operating losses created during those years.
The Tax Cuts and Jobs Act (the “Tax Act”) was enacted on December 22, 2017. The Tax Act, among other things, reduces the U.S. federal corporate tax rate from 35% to 21%, requires companies to pay a one-time transition tax on earnings of certain foreign subsidiaries that were previously tax deferred, changes rules related to uses and limitations of net operating loss carryforwards created in tax years beginning after December 31, 2017, eliminates the corporate alternative minimum tax (“AMT”) and changes how existing AMT credits can be realized, creates the base erosion anti-abuse tax (BEAT), a new minimum tax, and creates a new limitation on deductible interest expense.
The SEC issued Staff Accounting Bulletin No. 118, Income Tax Accounting Implications of the Tax Cuts and Jobs Act (“SAB 118”), which provides guidance on accounting for the tax effects of the Tax Act. SAB 118 provides a measurement period, which should not extend beyond one year from the Tax Act’s enactment date, for companies to complete the accounting under ASC 740, Income Taxes. In accordance with SAB 118, a company must reflect the income tax effects of those aspects of the Tax Act for which the accounting under ASC 740 is complete. To the extent that a company’s accounting for certain income tax effects of the Tax Act is incomplete but it is able to determine a reasonable estimate, it must record a provisional estimate in the financial statements. If a company cannot determine a provisional estimate to be included in the financial statements, it should continue to apply ASC 740 on the basis of the provisions of the tax laws that were in effect immediately before the
INSEEGO CORP.
NOTES TO CONSOLIDATED FINANCIAL STATEMENTS
enactment of the Tax Act. At December 31, 2014,2017, the Company has not completed its accounting for the tax effects of enactment of the Tax Act; however, in certain cases, as described below, the Company has made a reasonable estimate of the effects on its existing deferred tax asset valuation allowance consisted of $86.0 million relatingbalances and the one-time transition tax. In other cases, the Company has not been able to make a reasonable estimate and continues to account for those items under ASC 740 and the Company’s domestictax laws that were in effect immediately prior to enactment. The items for which the Company was able to determine a reasonable estimate did not have a material impact on income tax expense.
The Company remeasured certain deferred tax assets and $4.8 million relatedliabilities based on the rates at which they are expected to reverse in the Company’s Canadianfuture, which is generally 21%. However, the Company is still analyzing certain aspects of the Tax Act and refining its calculations, which could potentially affect the measurement of these balances or potentially give rise to new deferred tax assets. At December 31, 2013,
the valuation allowance consisted of $74.7 million relating to the Company’s domesticamounts. For certain deferred tax assets, the Company has recorded a decrease of approximately $38.8 million, with a corresponding adjustment to valuation allowance for the year ended December 31, 2017. The re-measurement of the Company’s indefinite-lived deferred tax liabilities resulted in an immaterial deferred income tax benefit.
The aggregate income tax benefit recorded by the Company in 2017 as a result of the Tax Act’s impact on its net deferred tax liabilities and $4.7 millionthe change in how AMT carryforwards are treated and monetized was approximately $1.0 million.
The Deemed Repatriation Transition Tax (“Transition Tax”) is a tax on previously untaxed accumulated and current earnings and profits (“E&P”) of certain of our foreign subsidiaries. To determine the amount of the Transition Tax, the Company must determine, in addition to other factors, the amount of post-1986 E&P of the relevant subsidiaries, as well as the amount of non-U.S. income taxes paid on such earnings. The Company has initially determined that it will not owe a Transition Tax since it estimates that it has deficit E&P for its foreign subsidiaries that are subject to the tax. However, the Company is continuing to gather additional information to refine its computation.
The Company must assess whether its valuation allowance analyses are affected by various aspects of the Tax Act (e.g., deemed repatriation of deferred foreign income, Global Intangible Low-Taxed Income (GILTI) inclusions, new interest expense disallowances). Since, as discussed herein, the Company has recorded provisional amounts related to certain portions of the Company’s Canadian deferred tax assets.Tax Act, any corresponding determination of the need for or change in a valuation allowance is also provisional.
The provision (benefit) for income taxes reconciles to the amount computed by applying the statutory federal income tax rate of 34% in 2014, 20132017, 2016 and 20122015 to income (loss)loss before provision for income taxes as follows (in thousands):
| | | | Year Ended December 31, | Year Ended December 31, |
| | 2014 | | 2013 | | 2012 | 2017 | | 2016 | | 2015 |
| Federal tax benefit, at statutory rate | $ | (13,447 | ) | | $ | (14,732 | ) | | $ | (30,142 | ) | $ | (15,513 | ) | | $ | (20,463 | ) | | $ | (17,718 | ) |
| State benefit, net of federal benefit | (1,054 | ) | | (922 | ) | | (757 | ) | (211 | ) | | (293 | ) | | (280 | ) |
| Change in valuation allowance | 11,316 |
| | 15,577 |
| | 27,486 |
| |
| Change in fair value of warrant | 1,203 |
| | — |
| | — |
| |
| Beneficial conversion feature | 163 |
| | — |
| | — |
| |
| Foreign tax rate difference | | 336 |
| | 681 |
| | 222 |
|
| Change in tax rate of net deferred tax assets | | (38,772 | ) | | — |
| | — |
|
| Valuation allowances offsetting tax rate change | | 38,772 |
| | — |
| | — |
|
| Valuation allowance against future tax benefits | | 16,364 |
| | 19,341 |
| | 15,389 |
|
| Research and development credits | 3 |
| | (1,084 | ) | | (856 | ) | (244 | ) | | (1,010 | ) | | (796 | ) |
| Share-based compensation | 2,402 |
| | 2,433 |
| | 1,616 |
| 876 |
| | 418 |
| | 752 |
|
| Uncertain tax positions | (62 | ) | | (307 | ) | | (46 | ) | |
| Goodwill impairment | — |
| | — |
| | 3,700 |
| |
| Change in state apportionment | (347 | ) | | (767 | ) | | — |
| — |
| | — |
| | 2,561 |
|
| Effect of Tax Act | | (971 | ) | | — |
| | — |
|
| Other | (53 | ) | | (115 | ) | | (390 | ) | (423 | ) | | 1,707 |
| | 51 |
|
| | $ | 124 |
| | $ | 83 |
| | $ | 611 |
| |
| Provision for income taxes | | $ | 214 |
| | $ | 381 |
| | $ | 181 |
|
At December 31, 2014,2017, the Company hashad U.S. federal net operating loss carryforwards of approximately $174.3 million. Federal net operating loss carryforwards$351.4 million, which begin to expire at various dates from 2029 through 2034. The Company hasin 2021, unless previously utilized, California net operating loss carryforwards of approximately $67.1$38.1 million, which begin to expire at various dates fromin 2027, unless previously utilized, and foreign net operating losses for its active foreign subsidiaries of approximately $38.6 million, which generally have no expiration date. At December 31, 2017, through 2034. Thethe Company hashad California research and development tax credit carryforwards of approximately $5.4 million. The California tax credits$10.4 million, which have no expiration date. The Company also hasdate, and federal research and development tax credit carryforwards of approximately $4.3 million. The federal tax credits$8.8 million, which begin to expire at various dates from 2027 through 2034.in 2021, unless previously utilized.
INSEEGO CORP.
NOTES TO CONSOLIDATED FINANCIAL STATEMENTS
Pursuant to Internal Revenue Code (IRC)(“IRC”) Sections 382 and 383, annual use of the Company’s net operating loss and research and development credit carryforwards may be limited in the event a cumulative change in ownership of more than 50% occurs within a rolling three-year period. The analysis was performed for the period through December 20, 2017. The analysis did not identify any events of cumulative change in ownership during the review period. The Company is in the process of completing an IRC Section 382/383 analysis and expects to have this analysis completed within the next three months. Due to the existence of the valuation allowance,will continue monitoring any future changes in stock ownership.
The Company entered into a Rights Agreement on January 22, 2018 (the “Rights Agreement”), subsequent to the balance sheet date, with Computershare Trust Company, N.A., a federally chartered trust company, as rights agent. The Rights Agreement is intended to discourage acquisitions of the Company’s unrecognized tax benefits will not impactcommon stock which could result in a cumulative change in ownership of more than 50% within a rolling three-year period, thereby preserving the Company’s effectivecurrent ability to utilize net operating loss carryforwards to offset future income tax rate.obligations; however, there is no assurance that the Rights Agreement will prevent a cumulative change in ownership.
It is the Company’s intention to reinvest undistributed earnings of its foreign subsidiaries and thereby indefinitely postpone their remittance. Accordingly, no provision has been made for foreign withholding taxes on United StatesU.S. income taxes which may become payable if undistributed earnings of the foreign subsidiary were paid as dividends to the Company.
The Company follows the accounting guidance related to financial statement recognition, measurement and disclosure of uncertain tax positions. The Company recognizes the impact of an uncertain income tax position on an income tax return at the largest amount that is more-likely-than-not to be sustained upon audit by the relevant taxing authority. An uncertain income tax position will not be recognized if it has less than a 50% likelihood of being sustained. DuringNo income tax benefit was recognized during the years ended December 31, 20142017 and 2013,2016. At December 31, 2017 and 2016, the Company recognized approximately $61,000 and $71,000, respectively, of incomedid not have interest expense related to uncertain tax benefit plus $0 and $236,000, respectively, of associated interest due to expiration of the applicable statutes of limitations applicable to certain tax years. As of December 31, 2014 and 2013, the totalpositions or a liability for unrecognized tax benefits was $0 and $61,000, respectively, and is includedbenefits. The Company does not expect changes to its uncertain tax position in other long-term liabilities.the next twelve months.
A reconciliation of the beginning and ending amounts of unrecognized tax benefits is as follows (in thousands):
|
| | | |
| | |
| | Amount |
| Unrecognized tax benefits balance at December 31, 2012 | $ | 33,220 |
|
| Increases related to current and prior year tax positions | 2,653 |
|
| Settlements and lapses in statutes of limitations | (373 | ) |
| Unrecognized tax benefits balance at December 31, 2013 | 35,500 |
|
| Increases related to current and prior year tax positions | 204 |
|
| Settlements and lapses in statutes of limitations | (61 | ) |
| Unrecognized tax benefits balance at December 31, 2014 | $ | 35,643 |
|
|
| | | |
| Balance at December 31, 2014 | $ | 35,643 |
|
| Increases related to current and prior year tax positions | 160 |
|
| Balance at December 31, 2015 | 35,803 |
|
| Increases related to current and prior year tax positions | 488 |
|
| Balance at December 31, 2016 | 36,291 |
|
| Increases related to current and prior year tax positions | 291 |
|
| Balance at December 31, 2017 | $ | 36,582 |
|
There are no tax benefits that, if recognized, would affect the effective tax rate that are included in the balances of unrecognized tax benefits at December 31, 2014.
The Company recognizes interest and penalties related to unrecognized tax benefits in the provision for income taxes. As of December 31, 2014, the same as in 2013, the Company recorded $0 of accrued interest related to uncertain tax positions.2017.
The Company and its subsidiaries file U.S., state and foreign income tax returns in jurisdictions with various statutes of limitations. In the fourth quarter of 2014, the Company reduced its uncertainThe Company’s tax liability by approximately $61,000, due to the expiration of the statute of limitations applicable to the 2009 taxable year. The Company is alsoreturns are subject to variousexamination by federal, incomestate and foreign taxing authorities. The Company’s federal and state tax examinationsreturns are subject to examination for the 2003 throughyears beginning in 2014 and 2013, calendar years due to the availability of netrespectively. Net operating loss carryforwards.carryforwards arising prior to these years are also open to examination, if and when utilized. The Company believes appropriate provisions for all outstanding issues have been made for all jurisdictions and all open years. However, because audit outcomes and the timing of audit settlements are subject to significant uncertainty, the Company’s current estimate of the total amounts of unrecognized tax benefits could increase or decrease for all open years.
8. Stockholders’ Equity
Preferred Stock
The Company has a total of 2,000,000 shares of preferred stock authorized for issuance at a par value of $0.001 per share. No preferred shares are currently issued or outstanding.
Rights Agreement
On January 22, 2018, subsequent to the balance sheet date, the Company entered into the Rights Agreement and issued a dividend of one preferred share purchase right (a “Right”) to each of the stockholders of record of each share of common stock outstanding on February 2, 2018. Each Right entitles the registered holder to purchase from the Company one one-thousandth
INSEEGO CORP.
NOTES TO CONSOLIDATED FINANCIAL STATEMENTS
of a share of Series D Preferred Stock, par value $0.001 per share (the “Preferred Shares”), of the Company, at a price of $10.00 per one one-thousandth of a Preferred Share represented by a Right (the “Purchase Price”), subject to adjustment. The description and terms of the Rights are set forth in the Rights Agreement.
The Rights are not exercisable until the Distribution Date (as defined in the Rights Agreement). The Rights will expire on the earlier of (i) the close of business on January 22, 2021, (ii) the time at which the Rights are redeemed, (iii) the time at which the Rights are exchanged, and (iv) if the Rights Agreement has not been approved or ratified by the stockholders prior to the close of business of the date of the Company’s 2018 Annual Meeting of Stockholders, the close of business on the date of the Company’s 2018 Annual Meeting of Stockholders.
Until a Right is exercised, the holder thereof, as such, will have no rights as a stockholder of the Company, including, without limitation, the right to vote or to receive dividends.
Common Shares Reserved for Future Issuance
The Company had reserved shares of common stock for possible future issuance as of December 31, 2017 and 2016 as follows:
|
| | | | | |
| | December 31, |
| | 2017 | | 2016 |
| Common stock warrants outstanding | 1,886,630 |
| | 1,886,630 |
|
| Stock options outstanding | 6,566,483 |
| | 6,356,203 |
|
| Restricted stock units outstanding | 1,055,977 |
| | 2,975,800 |
|
| Shares available for issuance pursuant to Convertible Notes | 40,649,225 |
| | 30,000,000 |
|
| Shares available for future grants of awards under the 2015 Incentive Compensation Plan | 1,973,537 |
| | 1,332,035 |
|
| Shares available for future grants of awards under the 2009 Omnibus Incentive Compensation Plan | 3,816,243 |
| | 3,871,666 |
|
| Shares available under the 2000 Employee Stock Purchase Plan | 857,638 |
| | 89,676 |
|
| Total shares of common stock reserved for issuance | 56,805,733 |
| | 46,512,010 |
|
9. Share-based Compensation
During the year ended December 31, 2017, the Company granted awards under the Amended and Restated 2009 Omnibus Incentive Compensation Plan (the “2009 Plan”). The Compensation Committee of the Board of Directors administers the plans.
Under the 2015 Incentive Compensation Plan (the “2015 Plan”) and the 2009 Plan, a maximum of 4,000,000 shares and 15,323,000 shares, respectively, of common stock may be issued upon the exercise of stock options, in the form of restricted stock, or in settlement of restricted stock units or other awards, including awards with alternative vesting schedules such as performance-based criteria.
For the years ended December 31, 2017, 2016 and 2015, the following table presents total share-based compensation expense in each functional line item on the consolidated statements of operations (in thousands):
|
| | | | | | | | | | | |
| | Year Ended December 31, |
| | 2017 | | 2016 | | 2015 |
| Cost of revenues | $ | 182 |
| | $ | 235 |
| | $ | 233 |
|
| Research and development | 749 |
| | 868 |
| | 1,003 |
|
| Sales and marketing | 747 |
| | 707 |
| | 579 |
|
| General and administrative | 1,901 |
| | 2,778 |
| | 2,963 |
|
| Restructuring charges | 169 |
| | — |
| | 1,572 |
|
| Total | $ | 3,748 |
| | $ | 4,588 |
| | $ | 6,350 |
|
Stock Options
The Compensation Committee of the Board of Directors determines eligibility, vesting schedules and exercise prices for stock options granted. Stock options generally have a term of ten years and vest over a three- to four-year period.
INSEEGO CORP.
NOTES TO CONSOLIDATED FINANCIAL STATEMENTS
In connection with the acquisition of FW, the Company granted inducement stock options to FW employees to acquire an aggregate of 323,000 shares of the Company’s common stock under the 2009 Plan. The inducement awards became effective upon the closing of the acquisition. These stock options granted to FW employees have an exercise price of $4.65 per share. The options have a ten-year term and will vest over a four-year period. In the event of termination of employment, all unvested options will terminate.
In connection with the acquisition of Ctrack, the Company assumed a number of stock options granted to both executive and non-executive employees of Ctrack. Under the 2015 Plan, the Company granted stock options to employees of Ctrack to replace the stock options previously granted by DigiCore (the “Replacement Options”). The Company adjusted the exercise price and number of shares originally granted by DigiCore in order to preserve the intrinsic value and stock-exercise ratio of such awards. For Replacement Options granted to executives, the vesting schedule was reset to four years and the expiration date was extended to ten years from the date of acquisition. For Replacement Options granted to non-executives, the vesting schedule remains unchanged and the expiration date was extended to ten years from the date of acquisition.
As a result of the Company granting Replacement Options at an exercise price that preserved the value of the options, these options were valued as in-the-money options. Due to limitations in the Black-Scholes model related to in-the-money options, the Company elected to value the options using the Hull-White I lattice model. The inherent advantage of a lattice model relative to the Black-Scholes model is that option exercises are modeled as being dependent on the evolution of the stock price and not solely on the amount of time that has passed since the grant date. The Hull-White I lattice model uses the same assumptions as the Black-Scholes model except it replaces the expected term with the suboptimal exercise factor and includes an additional assumption regarding the post-vesting termination rate.
Under the 2015 Plan, the Company also granted additional bonus stock options to Ctrack executives with an exercise price equal to the market price on the date of grant, a four-year vesting schedule, and an expiration date that occurs ten years from the acquisition date. The fair value of these options was determined using the Black-Scholes valuation model. No other shares have been granted under the 2015 Plan.
The following table presents the weighted-average assumptions used in the Hull-White I valuation model and the Black-Scholes valuation model by the Company in calculating the fair value of each Replacement Option and executive bonus stock option, respectively, granted under the 2015 Plan for the year ended December 31, 2015:
|
| | | | | | | | |
| | Hull-White I | | |
| | Executive | | Non-executive | | Black-Scholes |
| Expected dividend yield | — | % | | — | % | | — | % |
| Risk-free interest rate | 2.1 | % | | 2.1 | % | | 1.4 | % |
| Volatility | 64 | % | | 64 | % | | 67 | % |
| Expected term (in years) | n/a |
| | n/a |
| | 5.0 |
|
| Suboptimal exercise factor | 2.570 |
| | 1.626 |
| | n/a |
|
| Post-vesting termination rate | 3 | % | | 3 | % | | n/a |
|
The following table presents the weighted-average assumptions used in the Black-Scholes valuation model by the Company in calculating the fair value of each stock option granted under the 2009 Plan:
|
| | | | | | | | |
| | Year Ended December 31, |
| | 2017 | | 2016 | | 2015 |
| Expected dividend yield | — | % | | — | % | | — | % |
| Risk-free interest rate | 1.8 | % | | 1.7 | % | | 1.4 | % |
| Volatility | 108 | % | | 79 | % | | 69 | % |
| Expected term (in years) | 5.0 |
| | 5.0 |
| | 4.5 |
|
The weighted-average fair value of stock option awards granted under all plans during the years ended December 31, 2017, 2016 and 2015 was $0.89, $1.05 and $1.63, respectively.
INSEEGO CORP.
NOTES TO CONSOLIDATED FINANCIAL STATEMENTS
The following table summarizes the Company’s stock option activity under all plans for the years ended December 31, 2017 and 2016 (dollars in thousands, except per share data):
|
| | | | | | | | | | | | |
| | Stock
Options
Outstanding | | Weighted-Average
Exercise
Price Per
Option | | Weighted-Average
Remaining
Contractual
Term
(in years) | | Aggregate
Intrinsic
Value |
| Outstanding — December 31, 2015 | 6,084,836 |
| | $ | 3.01 |
| | | | |
| Granted | 1,051,550 |
| | 1.65 |
| | | | |
| Exercised | (78,384 | ) | | 1.12 |
| | | | |
| Canceled | (701,799 | ) | | 4.35 |
| | | | |
| Outstanding — December 31, 2016 | 6,356,203 |
| | 2.64 |
| | | | |
| Granted | 3,877,000 |
| | 1.15 |
| | | | |
| Exercised | (146,039 | ) | | 1.11 |
| | | | |
| Canceled | (3,520,681 | ) | | 2.69 |
| | | | |
| Outstanding — December 31, 2017 | 6,566,483 |
| | $ | 1.77 |
| | 8.18 | | $ | 2,460 |
|
| Vested and Expected to Vest — December 31, 2017 | 5,815,396 |
| | $ | 1.84 |
| | 8.03 | | $ | 2,132 |
|
| Exercisable — December 31, 2017 | 2,202,598 |
| | $ | 2.83 |
| | 6.12 | | $ | 491 |
|
The total intrinsic value of stock options exercised to purchase common stock during the years ended December 31, 2017, 2016 and 2015 was approximately $0.1 million, $0.1 million and $0.9 million, respectively. As of December 31, 2017, total unrecognized share-based compensation expense related to non-vested stock options was $2.6 million, which is expected to be recognized over a weighted-average period of approximately 1.5 years. The Company recognized approximately $2.3 million, $2.2 million and $3.2 million of share-based compensation expense related to the vesting of stock option awards during the years ended December 31, 2017, 2016 and 2015, respectively.
Restricted Stock Units
Pursuant to the 2015 Plan and the 2009 Plan, the Company may issue restricted stock units (“RSUs”) that, upon satisfaction of vesting conditions, allow for employees and non-employee directors to receive common stock. Issuances of such awards reduce common stock available under the 2015 Plan and 2009 Plan for stock incentive awards. The Company measures compensation cost associated with grants of RSUs at fair value, which is generally the closing price of the Company’s stock on the date of grant. RSUs generally vest over a three- to four-year period.
A summary of restricted stock unit activity under all plans for the year ended December 31, 2017 is presented below:
|
| | | | | | |
| | Number of Shares | | Weighted-Average Grant-Date Fair Value |
| Non-vested — December 31, 2016 | 2,975,800 |
| | $ | 1.87 |
|
| Granted | 1,480,301 |
| | 1.83 |
|
| Vested | (1,193,721 | ) | | 1.92 |
|
| Forfeited | (2,206,403 | ) | | 1.72 |
|
| Non-vested — December 31, 2017 | 1,055,977 |
| | $ | 2.06 |
|
During the years ended December 31, 2016 and 2015, the weighted-average grant-date fair value of RSUs granted was $1.62 and $4.55 (net of immediately vesting RSUs granted as payment to the Company’s U.S. employees for their retention bonus in the third quarter of 2015), respectively. During the years ended December 31, 2017, 2016 and 2015, the total fair value of shares vested was $3.0 million, $0.9 million and $3.1 million (net of immediately vesting RSUs granted as payment to the Company’s U.S. employees for their retention bonus in the third quarter of 2015), respectively.
As of December 31, 2017, there was $1.1 million of unrecognized share-based compensation expense related to non-vested RSUs, which is expected to be recognized over a weighted-average period of 2.4 years. The Company recognized
INSEEGO CORP.
NOTES TO CONSOLIDATED FINANCIAL STATEMENTS
approximately $1.3 million, $2.0 million and $2.8 million of share-based compensation expense related to the vesting of RSUs during the years ended December 31, 2017, 2016 and 2015, respectively.
2000 Employee Stock Purchase Plan
The ESPP permits eligible employees of the Company to purchase newly issued shares of common stock, at a price equal to 85% of the lower of the fair market value on (i) the first day of the offering period or (ii) the last day of each six-month purchase period, through payroll deductions of up to 10% of their annual cash compensation. Under the ESPP, a maximum of 5,074,000 shares of common stock may be purchased by eligible employees.
During the years ended December 31, 2017, 2016 and 2015, the Company issued 232,038 shares, 789,565 shares and 506,100 shares, respectively, under the ESPP. The Company recognized approximately $0.1 million, $0.4 million and $0.4 million of share-based compensation expense related to the ESPP during the years ended December 31, 2017, 2016 and 2015, respectively.
10. Earnings per Share
Basic EPS excludes dilution and is computed by dividing net income (loss) attributable to common shareholders by the weighted-average number of common shares outstanding for the period. Diluted EPS reflects the potential dilution that could occur if securities or other contracts to issue common stock were exercised or converted into common stock using the treasury stock method. Potentially dilutive securities (consisting of warrants, stock options and RSUs calculated using the treasury stock method) are excluded from the diluted EPS computation in loss periods and when the applicable exercise price is greater than the market price on the period end date as their effect would be anti-dilutive.
The calculation of basic and diluted earnings per share was as follows (in thousands, except share and per share data):
|
| | | | | | | | | | | |
| | Year Ended December 31, |
| | 2017 | | 2016 | | 2015 |
| Net loss attributable to Inseego Corp. | $ | (45,735 | ) | | $ | (60,573 | ) | | $ | (52,286 | ) |
| Weighted-average common shares outstanding | 58,718,483 |
| | 53,911,270 |
| | 52,767,230 |
|
| Basic and diluted net loss per share | $ | (0.78 | ) | | $ | (1.12 | ) | | $ | (0.99 | ) |
For the years ended December 31, 2017, 2016 and 2015 the computation of diluted EPS excluded 9,509,090 shares, 11,218,633 shares and 8,931,669 shares, respectively, related to warrants, stock options and RSUs as their effect would have been anti-dilutive.
11. Securities Purchase Agreement and Warrant Issues
On September 3, 2014, the Company entered into a Purchase Agreement (the “Financing Purchase Agreement”) with HC2 Holdings 2, Inc., a Delaware corporation (the “Investor”), pursuant to which, on September 8, 2014, the Company sold to the Investor (i) 7,363,334 shares of the Company’s common stock, par value $0.001 per share, (ii) a warrant to purchase 4,117,647 shares of the Company’s common stock at an exercise price of $2.26 per share (the “2014 Warrant”) and (iii) 87,196 shares of the Company’s Series C Convertible Preferred Stock, par value $0.001 per share (the “Series C Preferred Stock”), all at a purchase price of (a) $1.75 per share of common stock plus, in each case, the related 2014 Warrant and (b) $17.50 per share of Series C Preferred Stock, for aggregate gross proceeds of approximately $14.4 million (collectively, the “Financing”).
Due to insufficient authorized shares to satisfy the exercise of the instrument in full at the time of issuance, the Company determined that the instrument should be treated as a derivative instrument as of September 30, 2014. Liability classification was required because share settlement was not within the control of the Company and the 2014 Warrant was not considered to be “indexed to the company’s own stock” and therefore did not qualify for the exemptions provided by ASC 815, Derivatives and Hedges (“ASC 815”). As such the warrants were recorded at fair value with any changes in fair value being recognized in earnings.
On November 17, 2014 (the “Approval Date”), at a Special Meeting of the Stockholders, the Company received stockholder approval to increase the number of authorized shares of the Company’s common stock. With this approval, the Company had a sufficient amount of authorized shares to satisfy the exercise of the instrument in full. As a result, the Company performed a final re-measurement of the 2014 Warrant to fair value and then reclassified the fair value to additional paid-in capital.
INSEEGO CORP.
NOTES TO CONSOLIDATED FINANCIAL STATEMENTS
Because the 2014 Warrant had no comparable market data to determine fair value, the Company hired an independent valuation firm to assist with the valuation of the 2014 Warrant at the measurement date and as of the Approval Date. The primary factors used to determine the fair value included: (i) the fair value of the Company’s common stock; (ii) the volatility of the Company’s common stock; (iii) the risk free interest rate; (iv) the estimated likelihood and timing of exercise; and (v) the estimated likelihood and timing of a future financing arrangement. Increases in the market value of the Company’s common stock and volatility, which have the most impact on the fair value of the 2014 Warrant, would cause the fair value of the 2014 Warrant to change. While classified as a liability, the 2014 Warrant was measured at fair value on a recurring basis and any unrealized losses were recognized in earnings as other expense. During the year ended December 31, 2014, the Company recorded a change in fair value of $3.3 million related to the 2014 Warrant, primarily as a result of an increase in the market value of the Company’s common stock.
The following table shows the change to the fair value of the 2014 Warrant during the year ended December 31, 2014 (in thousands):
|
| | | | |
| Balance at September 8, 2014 (Transaction Date) | | $ | 4,939 |
|
| Change in fair value | | 3,280 |
|
| Balance at November 17, 2014 (Approval Date) | | 8,219 |
|
| Reclassification to additional paid-in-capital | | (8,219 | ) |
| Balance at December 31, 2014 | | $ | — |
|
On March 26, 2015, the Investor exercised a portion of the 2014 Warrant to purchase 3,824,600 shares of the Company’s common stock at an exercise price of $2.26 per share for total proceeds of $8.6 million.
On March 26, 2015, in order to induce the Investor to exercise the 2014 Warrant for cash in connection with the acquisition of FW, the Company issued to the Investor a new warrant (the “2015 Warrant”) to purchase 1,593,583 shares of the Company’s common stock at an exercise price of $5.50 per share.
The 2015 Warrant will be exercisable into shares of the Company’s common stock during the period commencing on September 26, 2015 and ending on March 26, 2020, the expiration date of the 2015 Warrant. The 2015 Warrant will generally only be exercisable on a cash basis; provided, however, that the 2015 Warrant may be exercised on a cashless basis if and only if a registration statement relating to the issuance of the shares underlying the 2015 Warrant is not then effective or an exemption from registration is not available for the resale of such shares. The 2015 Warrant may be exercised by surrendering to the Company the certificate evidencing the 2015 Warrant to be exercised with the accompanying exercise notice, appropriately completed, duly signed and delivered, together with cash payment of the exercise price, if applicable.
The Company reviewed the terms of the 2015 Warrant to determine whether or not it met the criteria of a derivative instrument under ASC 815. Pursuant to this guidance, the Company has determined that the 2015 Warrant does not require liability accounting and has classified the warrant as equity.
Because the 2015 Warrant has no comparable market data to determine fair value, the Company hired an independent valuation firm to assist with the valuation of the 2015 Warrant at March 26, 2015, the issuance date of the warrant. The primary factors used to determine the fair value include: (i) the fair value of the Company’s common stock; (ii) the volatility of the Company’s common stock; (iii) the risk free interest rate and (iv) the estimated likelihood and timing of exercise.
The 2015 Warrant was issued in connection with the cash exercise of the 2014 Warrant, and accordingly, the fair value of the 2015 Warrant of $3.5 million was considered cost of capital and netted against the $8.6 million aggregate proceeds received from the exercise of the 2014 Warrant.
Contingently Redeemable Convertible Series C Preferred Stock
In connection with the Financing the Company issued 87,196 shares of Series C Preferred Stock at $17.50 per share, initially convertible, subject to adjustments, into 871,960 shares of common stock.
On November 17, 2014, at a Special Meeting of the Stockholders, the Company received stockholder approval to increase the number of authorized shares of the Company’s common stock from 50,000,000 shares to 100,000,000 shares and each share of Series C Preferred Stock then outstanding automatically converted into ten shares of common stock. Upon conversion, the Company reclassified the Series C Preferred Stock out of mezzanine equity into permanent equity and recognized a beneficial
INSEEGO CORP.
NOTES TO CONSOLIDATED FINANCIAL STATEMENTS
conversion feature (“BCF”) of $0.4 million in equity due to the resolution of the contingent BCF embedded within the Series C Preferred Stock.
12. Commitments and Contingencies
Capital Leases
The Company has vehicles and equipment under capital leases that were assumed through its acquisitions of Ctrack. The future minimum payments under capital leases were as follows at December 31, 2017 (in thousands):
|
| | | |
| 2018 | $ | 782 |
|
| 2019 | 491 |
|
| 2020 | 139 |
|
| Total minimum capital lease payments | 1,412 |
|
| Less: amounts representing interest | (135 | ) |
| Present value of net minimum capital lease payments | 1,277 |
|
| Less: current portion | (679 | ) |
| Long-term portion | $ | 598 |
|
Operating Leases
The Company leases its office space and certain equipment under non-cancellable operating leases with various terms through 2017.2020. The minimum annual rent on the Company’s office space is subject to increases based on stated rental adjustment terms, property taxes and operating costs and contains rent concessions. For financial reporting purposes, rent expense is recognized on a straight-line basis over the term of the lease. Accordingly, rent expense recognized in excess of rent paid is reflected as deferred rent. RentalDuring the years ended December 31, 2017, 2016 and 2015, rent expense under operating leases in 2014, 2013 and 2012 was $3.0$2.7 million, $4.1 million and $4.5$3.3 million, respectively. The Company’s office space lease contains incentives in the form of reimbursement from the landlord for a portion of the costs of leasehold improvements incurred by the Company which are recorded to rent expense on a straight-line basis over the term of the lease.
The minimum future leaseminimum payments under non-cancellable operating leases were as offollows at December 31, 2014 are as follows2017 (in thousands):
|
| | | |
| For the Period Ending December 31, | Amount |
| 2015 | $ | 2,744 |
|
| 2016 | 2,749 |
|
| 2017 | 537 |
|
| 2018 | 436 |
|
| 2019 | 433 |
|
| Thereafter | 221 |
|
| Total minimum lease payments | $ | 7,120 |
|
Committed Purchase Orders
The Company has entered into purchase commitments totaling approximately $55.0 million with certain contract manufacturers under which the Company has committed to buy a minimum amount of designated products between January 2015 and December 2015. In certain of these agreements, the Company may be required to acquire and pay for such products up to the prescribed minimum or forecasted purchases. |
| | | |
| 2018 | $ | 2,874 |
|
| 2019 | 2,204 |
|
| 2020 | 964 |
|
| 2021 | 365 |
|
| 2022 | 236 |
|
| Thereafter | 20 |
|
| Total | $ | 6,663 |
|
Employee Retention Matters
In connection with the Company’s turnaround efforts, and to retain and encourage employees to assist the Company with its efforts, the Company'sCompany’s Compensation Committee approved an all-employee retention bonus plan ("in 2014 (“2014 Retention Bonus Plan"Plan”) based on achieving certain financial and cash targets. The financial metrics musthad to be met for two consecutive quarter periods during the three quarter periods ending March 31, 2015. At December 31, 2014, the Company accrued approximately $5.5 million of the maximum total target bonus expense based on the Company'sCompany’s financial results for the quarter ended December 31, 2014 and the assessment of the probability of the achievement of the remaining metrics in March 31, 2015. The total bonus is beingexpense of approximately $10.7 million was recognized over the requisite service period, and$5.2 million of which was recognized during the total estimated expense underyear ended December 31, 2015. In the 2014 Retention Bonus Plan is $11.0 million inthird quarter of 2015, the eventCompany paid U.S. employees their bonuses with 2,158,436 net shares of the remaining metrics are achieved on March 31, 2015.Company’s common stock. Non-U.S. employees receive cash bonus payments.
INSEEGO CORP.
NOTES TO CONSOLIDATED FINANCIAL STATEMENTS
Legal Matters
The Company is, from time to time, party to various legal proceedings arising in the ordinary course of business. For example,The Company records a loss when information indicates that a loss is both probable and estimable. Where a liability is probable and there is a range of estimated loss with no best estimate in the range, the Company records the minimum estimated liability related to the claim. As additional information becomes available, the Company assesses the potential liability related to the Company’s pending litigation and revises its estimates, if necessary. The Company expenses litigation costs as incurred.
The Company is currently named as a defendant or co-defendant in some patent infringement lawsuits in the U.S.United States and is indirectly participating in other U.S. patent infringement actions pursuant to its contractual indemnification obligations to certain customers. Based on an evaluation of these matters and discussions with the Company’s intellectual property litigation counsel, the Company believes that liabilities arising from or sums paid in settlement of these existing matters would not have a material adverse effect on its consolidated results of operations or financial condition.condition, other than those discussed below.
On September 15, 2008 and September 18, 2008, two putative securities classMay 27, 2015, a patent infringement action lawsuits werewas brought against Novatel Wireless by Carucel Investments, L.P. (“Carucel”), a non-practicing entity (Carucel Investments, L.P. v. Novatel Wireless, Inc., et al., U.S.D.C. S.D. Florida, Civil Action No. 0:15-cv-61116-BB). The complaint alleged that certain MiFi mobile hotspots manufactured by Novatel Wireless infringed claims of patents owned by Carucel. On April 10, 2017, judgment was entered in favor of Novatel Wireless. Carucel has filed to appeal certain orders in the U.S. District Court forlitigation. The Company does not believe there is merit to an appeal by Carucel and intends to vigorously defend the Southern Districtappeal. However, there can be no assurance as to the ultimate outcome of California (the “Court”) on behalf of alleged stockholders of the Company. On December 11, 2008, these lawsuits were consolidated into a single action andany appeal or other future judgment in May 2010, the consolidated lawsuits were captioned the case In re Novatel Wireless Securities Litigation (the “Litigation”). The Litigation was filed on behalf of persons who purchased the Company’s common stock between February 27, 2007 and September 15, 2008.this case.
On June 23, 2014, the Court entered its judgment approving a final settlement agreement with respect to the Litigation. The settlement agreement does not admit any liability, andSeptember 26, 2016, the Company andsettled a breach of contract claim alleging that the individual defendants continueCompany had failed to deny any and all liability.pay certain royalties on hardware products sold by its subsidiary, Enfora. Under the terms of the settlement agreement, the plaintiff class agreed to settle all claims asserted in the Litigation and granted the defendants and released parties a full and complete release in exchange for (i) a cash payment of $6.0 million to the plaintiff’s class, approximately $1.7 million of which was to be funded by the Company’s insurers, (ii) the issuance of unrestricted and freely tradable shares of the Company’s stock with an aggregate value of $5.0 million and (iii) the issuance of a $5.0 million secured promissory note, which such note shall having a 30-month maturity, carrying interest at 5% per annum, payable quarterly, and being secured by the accounts receivable of the Company.
On July 1, 2014, the Company and the individual defendants filed a motion to amend the judgment entered on June 23, 2014, specifically requesting the Court to amend the effective date of such judgment to June 20, 2014 - the date the court held the final approval hearing. The Court granted this motion on July 8, 2014, and the judgment date was deemed entered on June 20, 2014.
On July 8, 2014, the Company funded the cash portion of the settlement with $4.3 million of Company cash and $1.7 million previously funded into escrow by the Company’s insurers. On July 17, 2014, the Company issued 2,407,318 unrestricted shares of the Company’s common stock to the class members in satisfaction of the $5.0 million stock payment. The Company also issued a $5.0 million secured promissory note on July 8, 2014, which was paid off by the Company during the fourth quarter of 2014.
On November 17, 2014, the Court granted Plaintiff’s motion to enforce the Settlement and the Court agreed with the Plaintiffs to use an intra-day trading price of the Company's stock for valuation purposes and not the closing price, and accordingly, the Company owed $789,600 which was paid by the Company on December 16, 2014.
As of December 31, 2014, there were no further liabilities accrued in connection with the Litigation.
Credit Facility
On October 31, 2014, the Company and one of its subsidiaries entered into the Revolver with Wells Fargo Bank, National Association. The amount of borrowings that may be made under the Revolver are based on a borrowing base and are comprised of a specified percentage of eligible receivables. If, at any time during the term of the Revolver, the amount of borrowings outstanding under the Revolver exceeds the borrowing base then in effect or the maximum revolver amount of
$25.0 million, the Company is required to repay such borrowings inpay an aggregate settlement amount sufficient to eliminate such excess. the Revolver includes $3.0of $2.8 million, $0.9 million of availability for letterswhich remained outstanding as of credit. At December 31, 2014,2017 and is included in accrued expenses and other current liabilities and in other long-term liabilities in the consolidated balance sheets, and is payable in eight equal quarterly installments. The contract underlying the claim has now been terminated.
On May 11, 2017, the Company initiated a lawsuit against the former stockholders of RER in the Court of Chancery of the revolving credit facility was approximately $5.2 millionState of Delaware seeking recovery of damages for civil conspiracy, fraud in the inducement, unjust enrichment and breach of fiduciary duty. The Company has suspended payments due to the former stockholders of RER pursuant to the Earn-Out Arrangement and the Company had available borrowingsDeferred Purchase Price pending the outcome of approximately $12.1 million. At December 31, 2014,this litigation. There can be no assurance as to the Company was in compliance with all financial covenants contained in the credit agreement. (see Note 6)
Under the termsultimate outcome of the Revolver, we are prohibited from declaringfuture judgment in this case, and an adverse judgment could have a material adverse effect on the Company’s consolidated results of operations or paying any cash dividends on our common stock.financial condition.
On November 19, 2014, the Company terminated its existing margin credit facility with one of the banks that held the Company's marketable securities. Borrowings under this facility were collateralized by the Company's cash and cash equivalents and marketable securities on deposit at the bank. During the twelve months ended December 31, 2014, the Company did not borrow against the facility and had no outstanding borrowings under this facility at December 31, 2014.
13. SegmentGeographic Information and Concentrations of Risk
SegmentGeographic Information
The Company operates in the wireless broadband technology industry and senior management makes decisions about allocating resources based on the following reportable segments:
The Mobile Computing Products segment includes the Company's MiFi brand of Intelligent Mobile Hotspot devices, USB modems and embedded modules that enable data transmission and services via cellular wireless networks. All products within the segment represent a single product family.
The M2M Products and Solutions segment includes the Company's M2M embedded modules, integrated M2M communications devices and our service delivery platform, the N4ATM DM and N4ATM CMS that provides easy device management and service enablement.
Segment net revenues and segment operating losses represent the primary financial measures used by senior management to assess performance and include the net revenues, cost of net revenues, sales and other operating expenses for which management is held accountable. Segment operating expenses include sales and marketing, research and development, general and administrative and amortization expenses that are directly related to individual segments. Segment losses also include acquisition-related costs, purchase price amortization, impairment charges, restructuring and integration costs.
The table below presents net revenues from external customers, operating loss and identifiable assets for our reportable segments (in thousands):
|
| | | | | | | | | | | |
| | Year Ended December 31, |
| | 2014 | | 2013 | | 2012 |
| Net revenues by reportable segment: | | | | | |
| Mobile Computing Products | $ | 145,500 |
| | $ | 297,499 |
| | $ | 312,508 |
|
| M2M Products and Solutions | 39,745 |
| | 37,554 |
| | 31,780 |
|
| Total | $ | 185,245 |
| | $ | 335,053 |
| | $ | 344,288 |
|
| Operating loss: | | | | | |
| Mobile Computing Products | $ | (23,339 | ) | | $ | (27,939 | ) | | $ | (22,924 | ) |
| M2M Products and Solutions | (12,234 | ) | | (15,282 | ) | | (65,819 | ) |
| Total | $ | (35,573 | ) | | $ | (43,221 | ) | | $ | (88,743 | ) |
|
| | | | | | | |
| | Year Ended December 31, |
| | 2014 | | 2013 |
| Identifiable assets by reportable segment: | | | |
| Mobile Computing Products | $ | 79,368 |
| | $ | 96,516 |
|
| M2M Products and Solutions | 15,652 |
| | 14,949 |
|
| Total | $ | 95,020 |
| | $ | 111,465 |
|
The Company has operations in the United States, Canada, Europe, Latin America and Asia. The following table details the geographic concentration of the Company’s assets in the United States, Canada, Europe, Latin America and Asia (in thousands):
|
| | | | | | | |
| | Year Ended December 31, |
| | 2014 | | 2013 |
| United States | $ | 91,843 |
| | $ | 108,932 |
|
| Canada | 587 |
| | 808 |
|
| Europe, Latin America and Asia | 2,590 |
| | 1,725 |
|
| | $ | 95,020 |
| | $ | 111,465 |
|
|
| | | | | | | |
| | December 31, |
| | 2017 | | 2016 |
| United States and Canada | $ | 65,208 |
| | $ | 71,564 |
|
| South Africa | 68,186 |
| | 63,693 |
|
| Other | 24,813 |
| | 23,459 |
|
| | $ | 158,207 |
| | $ | 158,716 |
|
The following table details the Company’sgeographic concentration of the Company’s net revenues by geographic region based on shipping destination:
|
| | | | | | | | |
| | Year Ended December 31, |
| | 2014 | | 2013 | | 2012 |
| United States and Canada | 91.2 | % | | 95.6 | % | | 93.1 | % |
| Latin America | 1.0 |
| | 0.8 |
| | 2.4 |
|
| Europe, Middle East, Africa and other | 6.6 |
| | 3.4 |
| | 4.1 |
|
| Asia and Australia | 1.2 |
| | 0.2 |
| | 0.4 |
|
| | 100.0 | % | | 100.0 | % | | 100.0 | % |
|
| | | | | | | | |
| | Year Ended December 31, |
| | 2017 | | 2016 | | 2015 |
| United States and Canada | 71.4 | % | | 72.9 | % | | 89.1 | % |
| South Africa | 17.9 |
| | 16.6 |
| | 4.6 |
|
| Other | 10.7 |
| | 10.5 |
| | 6.3 |
|
| | 100.0 | % | | 100.0 | % | | 100.0 | % |
INSEEGO CORP.
NOTES TO CONSOLIDATED FINANCIAL STATEMENTS
Concentrations of Risk
Substantially all ofFor the Company’s net revenues are derived from sales of wireless access products. Any significant decline in market acceptance of the Company’s products or in the financial condition of the Company’s customers would have an adverse effect on the Company’s results of operationsyears ended December 31, 2017, 2016 and financial condition.
A significant portion of the Company’s net revenues come from a small number of customers. One2015, one customer accounted for 51.6% 51.2%, 58.0%53.9% and 57.5%53.6% of 2014, 2013 and 2012 net revenues, respectively. All significant customers are included in the Company’s Mobile Computing Products segment.
A significant portion of the Company’s accounts receivables comes from a small number of customers. At December 31, 2014, the Company had2017 and 2016, one customer who accounted for 46.1%23.9% and 42.8% of total accounts receivable. At December 31, 2013, the Company had three customers who accounted for 24.5%, 12.6% and 12.0% of total accounts receivable.receivable, respectively.
The Company outsources its manufacturing to several third-party manufacturers. If they were to experience delays, disruptions, capacity constraints or quality control problems in its manufacturing operations, product shipments to the Company’s customers could be delayed or its customers could consequently elect to cancel the underlying order, which would negatively impact the Company’s net revenues and results of operations.
14. Retirement Savings Plan
The Company has a defined contribution 401(K)401(k) retirement savings plan (the “Plan”). Substantially all of the Company’s U.S. employees are eligible to participate in the Plan after meeting certain minimum age and service requirements. EffectiveThe Company suspended the employer matching program on August 1, 2014,2014. Effective January 1, 2016, the Company suspended itsreinstated the employer matching program.program and matches 50% of the first 6% of an employee’s designated deferral of their eligible compensation. Employees may make discretionary contributions to the Plan subject to Internal Revenue Service limitations. Employer matching contributions under the planPlan amounted to approximately $579,000, $1.0$0.5 million and $1.2$0.6 million for the years ended December 31, 2014, 20132017 and 2012,2016, respectively. Employer matching contributions vestvested over a two-year period. The Company has a registered retirement savings plan for its Canadian employees. Substantially all of the Company’s Canadian employees are eligibleperiod prior to participate in this plan. Employees make discretionary contributions to the plan subject to local limitations. Employer contributions to the Canadian plan amounted to approximately $26,000, $157,000January 1, 2016 and $232,000 for the years ended December 31, 2014, 2013 and 2012, respectively.vest immediately beginning January 1, 2016.
15. Restructuring
In September 2013,August 2015, the Company approved a restructuring initiative to better position the Company to operate in current market conditions and more closely align operating expenses with revenues, which included employee severance costs and facility exit related costs. In the fourth quarter of 2015, the Company commenced certain restructuring initiatives (“2013 Initiatives”) including the closure of the Company’s development site in Calgary, Canada, and the consolidation of certain supply chain management activities. During February and March 2014, the Company commenced additional reduction in force initiatives resulting in headcount reductions of 41 employees and 21 employees, respectively, and during June 2014 a further headcount reduction of five employees at its Calgary, Canada site.
In connection with the 2013 Initiatives and for the twelve months ended December 31, 2014, the Company recorded restructuring charges of $2.9 million, which consisted of $1.7 million in employee severance costs and $1.2 million in facility exit related costs related to ongoing assessment of estimates of the timing and amounts of sublease income.
Total restructuring charges incurred to date relating to the 2013 Initiatives discussed above, are approximately $6.2 million, including restructuring charges recorded during the year ended December 31, 2013 of approximately $3.3 million.
The Company accounts for facility exit costs in accordance with FASB ASC Topic 420, Exit or Disposal Cost Obligations, which requires that a liability for such costs be recognized and measured initially at fair value on the cease-use date based on remaining lease rentals, adjusted for the effects of any prepaid or deferred items recognized, reduced by the estimated sublease rentals that could be reasonably obtained even if it is not the intent to sublease.
The Company is required to estimate future sublease income and future net operating expenses of the facilities, among other expenses. The most significant of these estimates relate to the timing and extent of future sublease income which reduce lease obligations, and the probability that such sublease income will be realized. The Company based estimates of sublease income, in part, on information from third party real estate experts, current market conditions and rental rates, an assessment of the time period over which reasonable estimates could be made, and the location of the respective facility, among other factors. Further adjustments to the facility exit liability accrual will be required in future periods if actual exit costs or sublease income differ from amounts currently expected. Exit costs the Company records under these provisions are neither associated with, nor do they benefit, continuing activities.
In June 2014, the Company commenced certain restructuring initiatives relating to the reorganization of executive level management (“2014(collectively, the “2015 Initiatives”), which included among other actions. The Company continued these initiatives in 2016 with a reduction-in-force and the replacementcompletion of the former Chief Executive Officer withclosure of its facility in Richardson, TX. The 2015 Initiatives are expected to cost a total of approximately $6.0 million and be completed when the current Chief Executive Officer. In connection withRichardson, TX lease expires in June 2020.
During the 2014 Initiatives, and for the twelve monthsyear ended December 31, 2014,2017, the Company recordedcommenced certain restructuring chargesinitiatives intended to continue to improve its strategic focus on its more profitable business lines and consolidate operations of its subsidiaries with those of the Company, including reductions-in-force, further reorganization of executive level management and the consolidation of certain of its facilities (the “2017 Initiatives”). The 2017 Initiatives are expected to cost a total of approximately $4.9$4.3 million including approximately $1.3 million related to the accelerated vesting of all of former Chief Executive Officer's restricted stock units and options which vested immediately upon his departure.be completed in May 2018.
The following table sets forth activity in the restructuring liability for the twelve monthsyear ended December 31, 20142017 (in thousands):
|
| | | | | | | | | | | | | | | | | | | |
| | 2013 Initiatives | | 2014 Initiatives | | |
| | Employee
Severance
Costs | | Facility Exit
Related Costs | | Employment Contract
Costs | | Share-based Compensation Costs | | Total |
| Balance at December 31, 2013 | $ | — |
| | $ | 881 |
| | $ | — |
| | $ | — |
| | $ | 881 |
|
| Accruals | 1,713 |
| | 1,170 |
| | 3,579 |
| | 1,298 |
| | 7,760 |
|
| Payments | (1,713 | ) | | (1,819 | ) | | (1,828 | ) | | — |
| | (5,360 | ) |
| Share-based compensation | — |
| | — |
| | — |
| | (1,298 | ) | | (1,298 | ) |
| Balance at December 31, 2014 | $ | — |
| | $ | 232 |
| | $ | 1,751 |
| | $ | — |
| | $ | 1,983 |
|
|
| | | | | | | | | | | | | | | | | | | | | | | | | | | | |
| | Balance at December 31, 2016 | | Costs Incurred | | Payments | | Non-cash | | Translation Adjustment | | Balance at December 31, 2017 | | | Cumulative Costs Incurred to Date |
| 2015 Initiatives | | | | | | | | | | | | | | |
| Employee Severance Costs | $ | 455 |
| | $ | 1 |
| | $ | (456 | ) | | $ | — |
| | $ | — |
| | $ | — |
| | | $ | 4,131 |
|
| Facility Exit Related Costs | 588 |
| | 862 |
| | (469 | ) | | — |
| | — |
| | 981 |
| | | 1,728 |
|
| | | | | | | | | | | | | | | |
| 2017 Initiatives | | | | | | | | | | | | | | |
| Employee Severance Costs | — |
| | 3,351 |
| | (3,088 | ) | | — |
| | 24 |
| | 287 |
| | | 3,351 |
|
| Facility Exit Related Costs | — |
| | 283 |
| | (268 | ) | | 91 |
| | — |
| | 106 |
| | | 283 |
|
| Other Related Costs | — |
| | 655 |
| | (326 | ) | | (169 | ) | | — |
| | 160 |
| | | 655 |
|
| Total | $ | 1,043 |
| | $ | 5,152 |
| | $ | (4,607 | ) | | $ | (78 | ) | | $ | 24 |
| | $ | 1,534 |
| | | $ | 10,148 |
|
The balance of the restructuring liability at December 31, 20142017 consists of approximately $1.9$1.0 million included in accrued expenses and other current liabilities in the consolidated balance sheet and $60,000approximately $0.5 million included in non-current liabilities. Thelong-term liabilities in the consolidated balance sheet.
In the fourth quarter of 2016, the Company wrote down the value of certain inventory by approximately $11.5 millionrelated to the abandonment of certain Enfora product lines that management decided to exit. During the year ended December 31, 2017, the Company sold certain inventory that had been written down related to the abandonment of certain Enfora product lines that management decided to exit, net of the restructuring liability at December 31, 2014 is anticipatedvalue of additional inventory related to be fully distributed by the endabandonment of 2016, atcertain Enfora product lines that management decided to exit, resulting in a net recovery of approximately $0.3 million. The Company accounted for the expirationadjustments in accordance with the ASC 330, Inventory, and included the adjustments in impairment of abandoned product line within cost of net revenues in the Company’s facility lease in San Diego.consolidated statements of operations.
INSEEGO CORP.
NOTES TO CONSOLIDATED FINANCIAL STATEMENTS
16. Quarterly Financial Information (Unaudited)
The following is a summary of unaudited quarterly results of operations for the years ended December 31, 20142017 and 2013.2016:
|
| | | | | | | | | | | | | | | |
| | Quarter |
| | First | | Second | | Third | | Fourth |
| | (in thousands, except per share amounts) |
| 2014 | | | | | | | |
| Net revenues | $ | 48,284 |
| | $ | 37,270 |
| | $ | 44,330 |
| | $ | 55,361 |
|
| Gross profit | 10,068 |
| | 3,987 |
| | 10,486 |
| | 12,506 |
|
| Net loss attributable to common shareholders | (8,981 | ) | | (17,415 | ) | | (8,832 | ) | | (4,446 | ) |
| Basic net loss per common share | (0.26 | ) | | (0.51 | ) | | (0.23 | ) | | (0.10 | ) |
| Diluted net loss per common share | (0.26 | ) | | (0.51 | ) | | (0.23 | ) | | (0.13 | ) |
| 2013 | | | | | | | |
| Net revenues | $ | 85,921 |
| | $ | 91,124 |
| | $ | 92,673 |
| | $ | 65,335 |
|
| Gross profit | 16,848 |
| | 19,024 |
| | 20,383 |
| | 12,039 |
|
| Net loss attributable to common shareholders | (9,122 | ) | | (7,892 | ) | | (5,093 | ) | | (21,306 | ) |
| Basic and diluted net loss per common share | (0.27 | ) | | (0.23 | ) | | (0.15 | ) | | (0.63 | ) |
|
| | | | | | | | | | | | | | | |
| | 2017 |
| | First Quarter | | Second Quarter | | Third Quarter | | Fourth Quarter |
| | | | | | | | |
| | (in thousands, except per share amounts) |
| Net revenues | $ | 55,389 |
| | $ | 59,913 |
| | $ | 57,461 |
| | $ | 46,534 |
|
| Gross profit | 16,186 |
| | 17,229 |
| | 16,372 |
| | 17,548 |
|
| Net loss attributable to Inseego Corp. | (16,100 | ) | | (12,024 | ) | | (13,789 | ) | | (3,822 | ) |
| Basic and diluted net loss per share | $ | (0.28 | ) | | $ | (0.21 | ) | | $ | (0.23 | ) | | $ | (0.06 | ) |
| | | | | | | | |
| | 2016 |
| | First Quarter | | Second Quarter | | Third Quarter | | Fourth Quarter |
| | | | | | | | |
| | (in thousands, except per share amounts) |
| Net revenues | $ | 66,944 |
| | $ | 62,811 |
| | $ | 60,881 |
| | $ | 52,919 |
|
| Gross profit | 21,183 |
| | 23,238 |
| | 22,924 |
| | 8,983 |
|
| Net loss attributable to Inseego Corp. | (11,904 | ) | | (2,701 | ) | | (18,567 | ) | | (27,401 | ) |
| Basic and diluted net loss per share | $ | (0.22 | ) | | $ | (0.05 | ) | | $ | (0.34 | ) | | $ | (0.50 | ) |
In the second quarter of 2016 the Company sold its Modules Business, see Note 2, Acquisitions and Divestitures, for additional information.
INSEEGO CORP.
SCHEDULE II
NOVATEL WIRELESS, INC.
II—Valuation and Qualifying Accounts
For the Years Ended December 31, 2014, 2013 and 2012 (in(in thousands):
|
| | | | | | | | | | | | | | | |
| | Balance At
Beginning
of Year | | Additions
Charged to
Operations | | Deductions
From
Reserves | | Balance
At End
of Year |
| Allowance for Doubtful Accounts: | | | | | | | |
| December 31, 2014 | $ | 2,449 |
| | $ | 86 |
| | $ | 2,318 |
| | $ | 217 |
|
| December 31, 2013 | 627 |
| | 1,936 |
| | 114 |
| | 2,449 |
|
| December 31, 2012 | 245 |
| | 439 |
| | 57 |
| | 627 |
|
| Warranty: | | | | | | | |
| December 31, 2014 | 2,244 |
| | 1,345 |
| | 2,393 |
| | 1,196 |
|
| December 31, 2013 | 2,329 |
| | 5,055 |
| | 5,140 |
| | 2,244 |
|
| December 31, 2012 | 1,525 |
| | 6,261 |
| | 5,457 |
| | 2,329 |
|
| Deferred Tax Asset Valuation Allowance: | | | | | | | |
| December 31, 2014 | 79,458 |
| | 11,316 |
| | — |
| | 90,774 |
|
| December 31, 2013 | 63,881 |
| | 15,577 |
| | — |
| | 79,458 |
|
| December 31, 2012 | 36,395 |
| | 27,486 |
| | — |
| | 63,881 |
|
| Sales Returns and Allowances: | | | | | | | |
| December 31, 2014 | 727 |
| | — |
| | 572 |
| | 155 |
|
| December 31, 2013 | 911 |
| | 196 |
| | 380 |
| | 727 |
|
| December 31, 2012 | 545 |
| | 497 |
| | 131 |
| | 911 |
|
|
| | | | | | | | | | | | | | | | | | | | | | | |
| | Balance At Beginning of Year | | Additions Charged to Operations | | Deductions | | Effect of Tax Act | | Effect of Change in Foreign Currency Exchange Rates | | Balance At End of Year |
| Allowance for Doubtful Accounts: | | | | | | | | | | | |
| December 31, 2017 | $ | 1,660 |
| | $ | 1,618 |
| | $ | (747 | ) | | $ | — |
| | $ | 152 |
| | $ | 2,683 |
|
| December 31, 2016 | 601 |
| | 1,136 |
| | (112 | ) | | — |
| | 35 |
| | 1,660 |
|
| December 31, 2015 | 217 |
| | 422 |
| | (38 | ) | | — |
| | — |
| | 601 |
|
| Reserve for Excess and Obsolete Inventory: | | | | | | | | | | | |
| December 31, 2017 | 14,039 |
| | 2,489 |
| | (4,648 | ) | | — |
| | 74 |
| | 11,954 |
|
| December 31, 2016 | 4,169 |
| | 14,797 |
| | (4,961 | ) | | — |
| | 34 |
| | 14,039 |
|
| December 31, 2015 | 5,468 |
| | 1,043 |
| | (2,342 | ) | | — |
| | — |
| | 4,169 |
|
| Deferred Tax Asset Valuation Allowance: | | | | | | | | | | | |
| December 31, 2017 | 114,419 |
| | 16,364 |
| | — |
| | (38,772 | ) | | 833 |
| | 92,844 |
|
| December 31, 2016 | 94,984 |
| | 19,341 |
| | — |
| | — |
| | 94 |
| | 114,419 |
|
| December 31, 2015 | 90,774 |
| | 17,903 |
| | (13,693 | ) | | — |
| | — |
| | 94,984 |
|
EXHIBIT INDEX
The following Exhibits are filed as part of, or incorporated by reference into, this Annual Report on Form 10-K:
|
| | |
Exhibit
Number
| | Description |
| | |
2.1 | | Agreement and Plan of Merger, dated as of November 5, 2010, by and between Novatel Wireless, Inc., England Acquisition Corp. and Enfora, Inc. (incorporated by reference to Exhibit 2.1 to the Company’s Current Report on Form 8-K, filed on November 10, 2010). |
| | |
3.1 | | Amended and Restated Certificate of Incorporation (incorporated by reference to Exhibit 3.1 to the Company’s Annual Report on Form 10-K for the year ended December 31, 2000, filed March 27, 2001). |
| | |
3.2 | | Certificate of Amendment to Amended and Restated Certificate of Incorporation (incorporated by reference to Exhibit 3.1 to the Company’s Quarterly Report on Form 10-Q for the period ended September 30, 2002, filed November 14, 2002). |
| | |
3.3 | | Certificate of Amendment to Amended and Restated Certificate of Incorporation (incorporated by reference to Exhibit 3.2 to the Company’s Amendment No. 1 to Form 10-K on Form 10-K/A for the year ended December 31, 2003, filed March 31, 2004). |
| | |
3.4** | | Certificate of Amendment to Amended and Restated Certificate of Incorporation. |
| | |
3.5 | | Amended and Restated Certificate of Designation of Series A Convertible Preferred Stock (incorporated by reference to Exhibit 3.4 to the Company’s Amendment No. 1 to Form 10-K on Form 10-K/A for the year ended December 31, 2003, filed March 31, 2004). |
| | |
3.6 | | Certificate of Designation of Series B Convertible Preferred Stock (incorporated by reference to Exhibit 3.5 to the Company’s Amendment No. 1 to Form 10-K on Form 10-K/A for the year ended December 31, 2003, filed March 31, 2004). |
| | |
3.7 | | Certificate of Designation of Series C Convertible Preferred Stock (incorporated by reference to Exhibit 3.1 to the Company’s Current Report on Form 8-K, filed September 8, 2014). |
| | |
3.8 | | Second Amended and Restated Bylaws (incorporated by reference to Exhibit 3.1 to the Company’s Current Report on Form 8-K, filed February 19, 2015). |
| | |
4.1 | | Amended and Restated Registration Rights Agreement, dated as of June 15, 1999, by and among the Company and certain of its stockholders (incorporated by reference to Exhibit 10.4 to the Company’s Registration Statement on Form S-1 (No. 333-42570), filed July 28, 2000, as amended). |
| | |
4.2 | | Form of Securities Purchase Agreement entered into in connection with the Company’s 2003 Series B Convertible Preferred Stock Financing (incorporated by reference to Exhibit 4.1 to the Company’s Current Report on Form 8-K, filed March 28, 2003). |
| | |
4.3 | | Registration Rights Agreement, dated as of March 12, 2003, entered into in connection with the Company’s 2003 Series B Convertible Preferred Stock Financing (incorporated by reference to Exhibit 4.8 to the Company’s Current Report on Form 8-K, filed March 28, 2003). |
| | |
4.4 | | Registration Rights Agreement, dated as of January 13, 2004, entered into in connection with the Company’s January 2004 Common Stock and Warrant Financing Transaction (incorporated by reference to Exhibit 10.21 to the Company’s Annual Report on Form 10-K for the year ended December 31, 2003, filed March 15, 2004). |
| | |
4.5 | | Stipulation of Settlement, dated January 31, 2014 and effective as of June 20, 2014 (incorporated by reference to Exhibit 4.1 to the Company’s Quarterly Report on Form 10-Q for the period ended June 30, 2014, filed August 8, 2014). |
| | |
4.6 | | Promissory Note, dated July 3, 2014 (incorporated by reference to Exhibit 4.2 to the Company’s Quarterly Report on Form 10-Q for the period ended June 30, 2014, filed August 8, 2014). |
| | |
4.7 | | Security Agreement, dated July 3, 2014 (incorporated by reference to Exhibit 4.3 to the Company’s Quarterly Report on Form 10-Q for the period ended June 30, 2014, filed August 8, 2014). |
| | |
4.8 | | Final Judgment and Order of Dismissal With Prejudice, dated June 23, 2014 (incorporated by reference to Exhibit 4.4 to the Company’s Quarterly Report on Form 10-Q for the period ended June 30, 2014, filed August 8, 2014). |
| | |
4.9 | | Order Granting Motion to Amend the Judgment Date, dated July 8, 2014 (incorporated by reference to Exhibit 4.5 to the Company’s Quarterly Report on Form 10-Q for the period ended June 30, 2014, filed August 8, 2014). |
| | |
|
| | |
Exhibit
Number
| | Description |
| | |
4.10 | | Warrant to Purchase Common Stock issued to HC2 Holdings 2, Inc., dated September 8, 2014 (incorporated by reference to Exhibit 4.1 to the Company’s Current Report on Form 8-K, filed September 8, 2014). |
| | |
4.11 | | Investors’ Rights Agreement, dated September 8, 2014, by and between Novatel Wireless, Inc. and HC2 Holdings 2, Inc. (incorporated by reference to Exhibit 4.2 to the Company’s Current Report on Form 8-K, filed September 8, 2014). |
| | |
10.1 | | Credit and Security Agreement, dated as of October 31, 2014, by and among Novatel Wireless, Inc. and Enfora, Inc., as Borrowers, and Wells Fargo Bank, National Association, as Lender (incorporated by reference to Exhibit 10.1 to the Company’s Current Report on Form 8-K, filed November 6, 2014). |
| | |
10.2 | | Purchase Agreement, dated September 3, 2014, by and between Novatel Wireless, Inc. and HC2 Holdings 2, Inc. (incorporated by reference to Exhibit 10.1 to the Company’s Current Report on Form 8-K, filed September 8, 2014). |
| | |
10.3 | | Memorandum of Understanding: In re Novatel Wireless Secs. Litig., Civil Action No. 08-CV-01689-AJB (RBB) United States District Court for the Southern District of California, executed December 6, 2013 (incorporated by reference to Exhibit 10.19 to the Company’s Annual Report on Form 10-K, filed March 12, 2014). |
| | |
10.4 | | Letter Agreement, dated as of April 29, 2014, by and among the Company and each of Cobb H. Sadler, Edward T. Shadek, Robert Ellsworth, Alex Mashinsky, Richard A. Karp, Maguire Financial, LP, a Delaware limited partnership, Maguire Asset Management, LLC, a Delaware limited liability company, and Timothy Maguire (incorporated by reference to Exhibit 10.1 to the Company’s Current Report on Form 8-K, filed May 6, 2014). |
| | |
10.5 | | Confirmation Letter, dated July 3, 2014, by and among the Company and each of Cobb H. Sadler, Edward T. Shadek, Robert Ellsworth, Maguire Financial, LP, a Delaware limited partnership, Maguire Asset Management, LLC, a Delaware limited liability company, and Timothy Maguire (incorporated by reference to Exhibit 10.1 to the Company’s Current Report on Form 8-K, filed July 10, 2014). |
| | |
10.6* | | Amended and Restated 1997 Employee Stock Option Plan (“1997 Plan”) (incorporated by reference to Exhibit 10.1 to the Company’s Registration Statement on Form S-1 (No. 333-42570), filed July 28, 2000 as amended). |
| | |
10.7* | | Amended and Restated Novatel Wireless, Inc. 2000 Stock Incentive Plan (“2000 Plan”) (incorporated by reference to Exhibit 10.1 to the Company’s Quarterly Report on Form 10-Q for the quarter ended June 30, 2007, filed August 9, 2007). |
| | |
10.8* | | Form of Executive Officer Stock Option Agreement under the 2000 Plan (incorporated by reference to Exhibit 10.3 to the Company’s Annual Report on Form 10-K for the year ended December 31, 2005, filed March 16, 2006). |
| | |
10.9* | | Form of Director Stock Option Agreement under the 2000 Plan (incorporated by reference to Exhibit 10.4 to the Company’s Annual Report on Form 10-K for the year ended December 31, 2005, filed March 16, 2006). |
| | |
10.10* | | Form of Amendment of Stock Option Agreements, dated July 20, 2006, by and between the Company and Optionee with respect to the 1997 Plan (incorporated by reference to Exhibit 10.2 to the Company’s Quarterly Report on Form 10-Q for the period ended September 30, 2006, filed November 9, 2006). |
| | |
10.11* | | Form of Amendment of Stock Option Agreements, dated July 20, 2006, by and between the Company and Optionee with respect to the 2000 Plan (incorporated by reference to Exhibit 10.3 to the Company’s Quarterly Report on Form 10-Q for the period ended September 30, 2006, filed November 9, 2006). |
| | |
10.12* | | Form of Amendment of Stock Option Agreements, dated July 20, 2006, by and between the Company and Optionee with respect to the 2000 Plan and grants made pursuant thereto in 2004 and subsequently (incorporated by reference to Exhibit 10.4 to the Company’s Quarterly Report on Form 10-Q for the period ended September 30, 2006, filed November 9, 2006). |
| | |
10.13* | | Amended and Restated Novatel Wireless, Inc. 2000 Employee Stock Purchase Plan (incorporated by reference to Appendix A to the Company’s Proxy Statement on Schedule 14A filed May 2, 2011). |
| | |
10.14* | | Form of Restricted Share Award Agreement for restricted stock granted to non-employee directors (incorporated by reference to Exhibit 10.10 to the Company’s Quarterly Report on Form 10-Q for the period ended June 30, 2006, filed August 9, 2006). |
| | |
10.15* | | Form of Restricted Share Award Agreement for restricted stock granted to executive officers (incorporated by reference to Exhibit 10.11 to the Company’s Quarterly Report on Form 10-Q for the period ended June 30, 2006, filed August 9, 2006). |
| | |
|
| | |
Exhibit
Number
| | Description |
| | |
10.16* | | Form of Indemnification Agreement (incorporated by reference to Exhibit 10.2 to the Company’s Current Report on Form 8-K, filed November 6, 2014). |
| | |
10.17* | | Form of Change of Control Letter Agreement by and between the Company and certain of its executive officers (incorporated by reference to Exhibit 10.1 to the Company’s Quarterly Report on Form 10-Q for the period ended June 30, 2004, filed August 16, 2004). |
| | |
10.18* | | 2009 Omnibus Incentive Compensation Plan (incorporated by reference to Appendix A to the Company’s Proxy Statement on Schedule 14A, filed October 14, 2014). |
| | |
10.19* | | 2009 Omnibus Incentive Compensation Plan (incorporated by reference to Appendix B to the Company’s Proxy Statement on Schedule 14A, filed April 30, 2013). |
| | |
10.20* | | 2010 Senior Management Incentive Plan (incorporated by reference to Exhibit 10.1 to the Company’s Current Report on Form 8-K, filed September 13, 2010). |
| | |
10.21* | | 2011 Senior Management Incentive Plan (incorporated by reference to Exhibit 10.1 to the Company’s Quarterly Report on Form 10-Q for the period ended June 30, 2011, filed on August 9, 2011). |
| | |
10.22* | | 2012 Senior Management Incentive Plan (incorporated by reference to Exhibit 10.1 to the Company’s Current Report on Form 8-K, filed July 6, 2012). |
| | |
10.23* | | 2013 Senior Management Incentive Plan (incorporated by reference to Exhibit 10.1 to the Company's Current Report on Form 8-K, filed March 22, 2013). |
| | |
10.24** | | 2014 Retention Bonus Plan. |
| | |
10.25* | | Employment Agreement, dated November 2, 2007, by and between Peter V. Leparulo and the Company (incorporated by reference to Exhibit 10.1 to the Company’s Quarterly Report on Form 10-Q for the quarter ended September 30, 2007, filed November 9, 2007). |
| | |
10.26* | | Letter Agreement, dated as of April 29, 2014, by and between the Company and Peter V. Leparulo (incorporated by reference to Exhibit 10.2 of the Company’s Current Report on Form 8-K, filed May 6, 2014). |
| | |
10.27* | | Form of Severance Agreement between Novatel Wireless, Inc. and each of Kenneth G. Leddon and Robert M. Hadley (incorporated by reference to Exhibit 10.1 to the Company’s Current Report on Form 8-K, filed August 2, 2010). |
| | |
10.28* | | Employment Agreement, dated August 4, 2014, by and between the Company and Alex Mashinsky (incorporated by reference to Exhibit 10.1 to the Company’s Current Report on Form 8-K, filed August 6, 2014). |
| | |
10.29* | | Offer Letter, dated November 2, 2014, by and between Novatel Wireless, Inc. and Alex Mashinsky (incorporated by reference to Exhibit 10.3 to the Company’s Current Report on Form 8-K, filed November 6, 2014). |
| | |
10.30* | | Offer letter, effective September 2, 2014, by and between the Company and Michael Newman (incorporated by reference to Exhibit 10.1 to the Company’s Current Report on Form 8-K, filed September 4, 2014). |
| | |
10.31* | | Change in Control and Severance Agreement, effective September 2, 2014, by and between the Company and Michael Newman (incorporated by reference to Exhibit 10.2 to the Company’s Current Report on Form 8-K, filed September 4, 2014). |
| | |
21 | | Subsidiaries of Novatel Wireless, Inc. (incorporated by reference to Exhibit 21 to the Company’s Annual Report on Form 10-K for the year ended December 31, 2013, filed March 12, 2014). |
| | |
23.1** | | Consent of Independent Registered Public Accounting Firm. |
| | |
24** | | Power of Attorney (See signature page). |
| | |
31.1** | | Certification of our Principal Executive Officer adopted pursuant to Section 302 of the Sarbanes-Oxley Act of 2002. |
| | |
31.2** | | Certification of our Principal Financial Officer adopted pursuant to Section 302 of the Sarbanes-Oxley Act of 2002. |
| | |
32.1** | | Certification of Principal Executive Officer pursuant to 18 U.S.C. Section 1350, as adopted pursuant to Section 906 of the Sarbanes-Oxley Act of 2002. |
| | |
32.2** | | Certification of Principal Financial Officer pursuant to 18 U.S.C. Section 1350, as adopted pursuant to Section 906 of the Sarbanes-Oxley Act of 2002. |
|
| | |
Exhibit
Number
| | Description |
| | |
101** | | The following financial statements and footnotes from the Novatel Wireless, Inc. Annual Report on Form 10-K for the year ended December 31, 2014 formatted in eXtensible Business Reporting Language (XBRL): (i) Consolidated Balance Sheets; (ii) Consolidated Statements of Operations; (iii) Consolidated Statements of Comprehensive Loss; (iv) Consolidated Statements of Stockholders’ Equity; (v) Consolidated Statements of Cash Flows; and (vi) the Notes to Consolidated Financial Statements. |
| | |
* | | Management contract, compensatory plan or arrangement |
| | |
** | | Filed herewith |