UNITED STATES
SECURITIES AND EXCHANGE COMMISSION
Washington, D.C. 20549
FORM 10-K
x ANNUAL REPORT PURSUANT TO SECTION 13 OR 15(d) OF THE SECURITIES EXCHANGE ACT OF 1934
For the fiscal year ended December 31, 20142017
OR
q TRANSITION REPORT PURSUANT TO SECTION 13 OR 15(d) OF THE SECURITIES EXCHANGE ACT OF 1934
For the transition period from ________ to _________
Commission file number 001-36479
VERITIV CORPORATION
(Exact name of registrant as specified in its charter)
|
| |
| Delaware | 46-3234977 |
| (State or other jurisdiction of incorporation or organization) | (I.R.S Employer Identification Number) |
6600 Governors Lake Parkway1000 Abernathy Road NE | |
Norcross,Building 400, Suite 1700 | |
| Atlanta, Georgia | 3007130328 |
| (Address of principal executive offices) | (Zip Code) |
| (770) 391-8200 |
| (Registrant's telephone number, including area code) |
|
| |
Registrant's telephone number, including area code: (770) 447-9000 |
| Securities registered pursuant to Section 12(b) of the Act: |
| Title of each class | Name of each exchange on which registered |
| Common stock, $0.01 par value | New York Stock Exchange |
| Securities registered pursuant to Section 12(g) of the Act: None |
Indicate by check mark if the registrant is a well-known seasoned issuer, as defined in Rule 405 of the Securities Act. Yes ¨ No x
Indicate by check mark if the registrant is not required to file reports pursuant to Section 13 or Section 15(d) of the Act. Yes ¨ No x
Indicate by check mark whether the registrant (1) has filed all reports required to be filed by Section 13 or 15(d) of the Securities Exchange Act of 1934 during the preceding 12 months (or for such shorter period that the registrant was required to file such reports), and (2) has been subject to such filing requirements for the past 90 days. Yes x No ¨
Indicate by check mark whether the registrant has submitted electronically and posted on its corporate Web site, if any, every Interactive Data File required to be submitted and posted pursuant to Rule 405 of Regulation S-T (§232.405 of this chapter) during the preceding 12 months (or for such shorter period that the registrant was required to submit and post such files). Yes x No ¨
Indicate by check mark if disclosure of delinquent filers pursuant to Item 405 of Regulation S-K (§229.405 of this chapter) is not contained herein, and will not be contained, to the best of registrant's knowledge, in definitive proxy or information statements incorporated by reference in Part III of this Form 10-K or any amendment to this Form 10-K. x
Indicate by check mark whether the registrant is a large accelerated filer, an accelerated filer, a non-accelerated filer, or a smaller reporting company, or an emerging growth company. See the definitions of "large accelerated filer", "accelerated filer", "smaller reporting company", and "smaller reporting"emerging growth company" in Rule 12b-2 of the Exchange Act.
|
| | | | | |
| Large accelerated filer | ¨ | | | Accelerated filer | ¨x |
| Non-accelerated filer | x (Do¨
| (do not check if a smallersmall reporting company) | | Smaller reporting company | ¨ |
| Emerging growth company | ¨ | | | | |
If an emerging growth company, indicate by check mark if the registrant has elected not to use the extended transition period for complying with any new or revised financial accounting standards provided pursuant to Section 13(a) of the Exchange Act. ☐
Indicate by check mark whether the registrant is a shell company (as defined in Rule 12b-2 of the Act). Yes ¨ No x
As of June 30, 2014,2017, the registrant'saggregate market value of the voting common stock of the registrant held by non-affiliates of the registrant, based on the closing sale price of those shares on the New York Stock Exchange reported on June 30, 2017, was not publicly traded.$511,432,245. For the purposes of this disclosure only, the registrant has assumed that its directors and executive officers (as defined in Rule 3b-7 under the Exchange Act) and the UWW Holdings, LLC stockholder are the affiliates of the registrant.
The number of shares outstanding of the registrant's common stock as of March 16, 2015February 23, 2018 was 16,000,000.15,733,745.
DOCUMENTS INCORPORATED BY REFERENCE
Portions of the Company's Proxy Statement for the 20152018 Annual Meeting of Shareholders are incorporated by reference into Part III of this Form 10-K.
TABLE OF CONTENTS
|
| | |
| | | Page |
| |
| |
| | | |
| Part I | | |
| Item 1. | | |
| Item 1A. | | |
| Item 1B. | | |
| Item 2. | | |
| Item 3. | | |
| Item 4. | | |
| | | |
| Part II | | |
| Item 5. | | |
| Item 6. | | |
| Item 7. | | |
| Item 7A. | | |
| Item 8. | | |
| Item 9. | | |
| Item 9A. | | |
| Item 9B. | | |
| | | |
| Part III | | |
| Item 10. | | |
| Item 11. | | |
| Item 12. | | |
| Item 13. | | |
| Item 14. | | |
| | | |
| Part IV | | |
| Item 15. | | |
| Item 16. | | |
| | | |
| |
| |
EXPLANATORY NOTE
On July 1, 2014, International Paper Company completed the spin-off of its xpedx distribution solutions business ("xpedx") to the International Paper Company shareholders. Immediately following the spin-off, UWW Holdings, Inc., the parent company of Unisource Worldwide, Inc. ("Unisource"), was merged with and into xpedx to form a new publicly traded company known as Veritiv Corporation ("Veritiv").
Because the spin-off and merger transactions were consummated on July 1, 2014:
The Veritiv Consolidated and Combined Statements of Operations, Statements of Comprehensive Income (Loss), Statements of Cash Flows and Statements of Shareholders' Equity and Notes thereto presented in this report for the year ended December 31, 2014 include the legacy xpedx business for the full twelve months presented and the legacy Unisource results from July 1, 2014. The Veritiv Combined Statements of Operations, Statements of Comprehensive Income (Loss), Statements of Cash Flows and Statements of Shareholders' Equity and Notes thereto presented in this report for the years ended December 31, 2013 and 2012 reflect the results of the legacy xpedx business only.
The Veritiv Consolidated Balance Sheet and Notes thereto presented in this report as of December 31, 2014 reflect the assets, liabilities and equity of the combined legacy xpedx and Unisource businesses. The Veritiv Combined Balance Sheet and Notes thereto presented in this report as of December 31, 2013 reflect the assets, liabilities and equity of the legacy xpedx business only.
Additionally, the financial information presented in Part II, Item 7—Management’s Discussion and Analysis of Financial Condition and Results of Operations—of this report, and elsewhere, is consistent with the above Consolidated and Combined financial statement presentation.
CAUTIONARY NOTE ON FORWARD-LOOKING STATEMENTS
Certain statements contained in this report regarding the Company’s future operating results, performance, business plans, prospects, guidance and any other statements not constituting historical fact are "forward-looking statements" subject to the safe harbor created by the Private Securities Litigation Reform Act of 1995. Where possible, the words "believe," "expect," "anticipate," "continue," "intend," "should," "will," "would," "planned," "estimated," "potential," "goal," "outlook," "may," "predicts," "could," or the negative of such terms, or other comparable expressions, as they relate to the Company or its management,business, have been used to identify such forward-looking statements. All forward-looking statements reflect only the Company’s current beliefs and assumptions with respect to future operating results, performance, business plans, prospects, guidance and other matters, and are based on information currently available to the Company. Accordingly, the statements are subject to significant risks, uncertainties and contingencies, which could cause the Company’s actual operating results, performance, or business plans or prospects to differ materially from those expressed in, or implied by, these statements.
Factors that could cause actual results to differ materially from current expectations include risks and other factors described under "Risk Factors" in this report and elsewhere in the Company’s publicly available reports filed with the Securities and Exchange Commission ("SEC"), which contain a discussion of various factors that may affect the Company’s business or financial results. Such risks and other factors, which in some instances are beyond the Company’s control, include:the industry-wide decline in demand for paper and related products; increased competition from existing and non-traditional sources; adverse developments in general business and economic conditions as well as conditions in the global capital and credit markets; foreign currency fluctuations; our ability to attract, train and retain highly qualified employees; the effects of work stoppages, union negotiations and labor disputes; the loss of any of our significant customers; changes in business conditions in our international operations; procurement and other risks in obtaining packaging, paper and facility products from our suppliers for resale to our customers; increased competition from existing and non-traditional sources; loss of significant customers; our ability to collect trade receivables from customers to whom we extend credit; successful integration of the legacy xpedx and Unisource businesses and realization and timing of the expected synergy and other cost savings from the Merger;changes in prices for raw materials; fuel cost increases; inclement weather, anti-terrorism measures and other disruptions to the transportation network; our dependence on a variety of IT and telecommunications systems and the Internet; our reliance on third-party vendors for various services; cyber-security risks; costs to comply with laws, rules and regulations, including environmental, health and safety laws, and to satisfy any liability or obligation imposed under such laws; regulatory changes and judicial rulings impacting our business; adverse results from litigation, governmental investigations or audits, or tax-related proceedings or audits; our inability to renew existing leases on acceptable terms, negotiate rent decreases or concessions and identify affordable real estate; our ability to adequately protect our material intellectual property and other proprietary rights, or to defend successfully against intellectual property infringement claims by third parties; our pension and health care costs and participation in multi-employer pension, health and welfare plans; increasing interest rates; our ability to generate sufficient cash to service our debt; our ability to comply with the covenants contained in our debt agreements; our ability to refinance or restructure our debt on reasonable terms and conditions as might be necessary from time to time; our ability to put in place in a timely manner the Sarbanes-Oxley procedures necessary as a public company; increasing interest rates; foreign currency fluctuations; changes in accounting standards and methodologies; regulatory changesour ability to realize the full benefit of the anticipated synergies, cost savings and judicial rulings impactinggrowth opportunities from the merger transaction and our ability to integrate the xpedx business with the Unisource business; adverse results from litigation, governmental investigations or audits, or tax related proceedings or audits; the effectspossibility of work stoppages, union negotiations and union disputes; our reliance on third-party vendors for various services;incurring expenditures in excess of those currently budgeted in connection with the integration, and other events of which we are presently unaware or that we currently deem immaterial that may result in unexpected adverse operating results.
For a more detailed discussion of these factors, see the information under the heading "Risk Factors" in this report and in other filings we make with the SEC. Forward-looking statements are made only as of the date hereof, and the Company undertakes no obligation to update or revise the forward-looking statements, whether as a result of new information, future events or otherwise, except as required by law. In addition, historical information should not be considered as an indicator of future performance.
PART I
ITEM 1. BUSINESS
Our Company
Veritiv Corporation ("Veritiv" or the "Company" and sometimes referred to in this Annual Report on Form 10-K as "we", "our", or "us", or "ourselves") is a leading North American business-to-business distributor of print, publishing, packaging, facility solutions, print and publishing products and services. Additionally, Veritiv provides logistics solutions.and supply chain management solutions to its customers. Veritiv was established in 2014, following the merger (the "Merger") of International Paper Company’s ("International Paper" or "Parent") xpedx distribution solutions business ("xpedx") and UWW Holdings, Inc. ("UWWH"), the parent company of Unisource.Unisource
Worldwide, Inc. ("Unisource"). Independently, the two companies achieved past success by continuously upholding high standards of efficiency and customer focus. Through leveraging this combined history of operational excellence, Veritiv evolved into one team shaping its success through exceptional service, innovative people and consistent values. Today, Veritiv's focus on segment-tailored market leadership in distribution and a commitment to operational excellence allows it to partner with world class suppliers, add value through multiple capabilities and deliver solutions to a wide range of customer segments.
We operate from more than 180approximately 170 distribution centers primarily throughout the U.S., Canada and Mexico, serving customers across a broad range of industries. These customers include printers, publishers, commercial printing, data centers, manufacturers, higher education institutions, healthcare facilities, sporting and performance arenas, retail stores, government agencies, property managers and building service contractors.
Veritiv's business is organized under four reportable segments: Packaging, Facility Solutions, Print, and Publishing Packaging and Facility Solutions.Print Management ("Publishing"). This segment structure is consistent with the way the Chief Operating Decision Maker, who is Veritiv's Chief Executive Officer, makes operating decisions and manages the growth and profitability of the Company's business. The Company also has a Corporate & Other category which includes certain assets and costs not primarily attributable to any of the reportable segments, as well as our Veritiv Logistics Solutionslogistics solutions business which provides transportation and warehousing solutions. The following summary describes the products and services offered in each of the reportable segments:
Packaging – The Packaging segment provides standard as well as custom and comprehensive packaging solutions for customers based in North America and in key global markets. The business is strategically focused on higher growth industries including light industrial/general manufacturing, food production, fulfillment and internet retail, as well as niche verticals based on geographical and functional expertise. Veritiv’s packaging professionals create customer value through supply chain solutions, structural and graphic packaging design and engineering, automation, workflow and equipment services and kitting and fulfillment.
Facility Solutions – The Facility Solutions segment sources and sells cleaning, break-room and other supplies such as towels, tissues, wipers and dispensers, can liners, commercial cleaning chemicals, soaps and sanitizers, sanitary maintenance supplies and equipment, safety and hazard supplies, and shampoos and amenities primarily in the U.S., Canada and Mexico. Veritiv is a leading distributor in the Facility Solutions segment. Through this segment we manage a world class network of leading suppliers in most facilities solutions categories. Additionally, we offer total cost of ownership solutions with re-merchandising, budgeting and compliance reporting, inventory management, and a sales-force trained to bring leading vertical expertise to the major North American geographies.
Print – The Print segment sells and distributes commercial printing, writing, copying, digital, wide format and specialty paper products, graphics consumables and graphics equipment primarily in the U.S., Canada and Mexico. This segment also includes customized paper conversion services of commercial printing paper for distribution to document centers and form printers. Our broad geographic platform of operations coupled with the breadth of paper and graphics products, including our exclusive private brand offerings, provides a foundation to service national, regional and local customers across North America.
Publishing – The Publishing segment sells and distributes coated and uncoated commercial printing papers to publishers, retailers, converters, printers and specialty businesses for use in magazines, catalogs, books, directories, gaming, couponing, retail inserts and direct mail. This segment also provides print management, procurement and supply chain management solutions to simplify paper and print procurement processes for itsour customers.
Packaging – The Packaging segment provides standard as well as custom and comprehensive packaging solutions for customers based in North America and in key global markets. The business is strategically focused on higher growth industries including light industrial/general manufacturing, food manufacturing, fulfillment and internet retail, as well as niche verticals based on geographical and functional expertise. Veritiv’s packaging professionals create customer value through supply chain solutions, structural and graphic packaging design and engineering, automation, workflow and equipment services, and contract packaging, kitting and fulfillment.
Facility Solutions – The Facility Solutions segment sources and sells cleaning, break-room and other supplies such as towels, tissues, wipers and dispensers, can liners, commercial cleaning chemicals, soaps and sanitizers, sanitary maintenance supplies and equipment, safety and hazard supplies, and shampoos and amenities primarily in the U.S., Canada and Mexico. Veritiv is a leading distributor in the Facility Solutions segment. We offer a world class network of leading suppliers in all categories, total cost of ownership solutions with re-merchandising, budgeting
and compliance, inventory management, consistent multi-local supply solutions, and a sales-force trained to bring leading vertical expertise to all of the major North American geographies.
The table below summarizes net sales for each of the above reportable segments, as well as the Corporate & Other category, as a percentage of consolidated net sales:
| | | | Year Ended December 31, | Year Ended December 31, |
| | 2014 | | 2013 | | 2012 | 2017 |
| 2016 |
| 2015 |
| Packaging | | 38% | | 34% | | 32% |
| Facility Solutions | | 16% | | 15% | | 15% |
| Print | 40% | | 43% | | 44% | 33% | | 37% | | 38% |
| Publishing | 15% | | 14% | | 14% | 11% | | 13% | | 14% |
| Packaging | 30% | | 28% | | 26% | |
| Facility Solutions | 14% | | 15% | | 16% | |
| Corporate & Other | 1% | | —% | | —% | 2% | | 1% | | 1% |
| Total | 100% | | 100% | | 100% | 100% | | 100% | | 100% |
Additional financial information regarding our reportable business segments and certain geographic information is included in Item 7 of this report and in Note 17 of the Notes to Consolidated and Combined Financial Statements in Item 8 of this report.
Our History
On July 1, 2014 (the "Distribution Date"), International Paper Company ("International Paper") completed the previously announced spin-off of xpedx to the International Paperits shareholders (the "Spin-off"), forming a new public company calledknown as Veritiv. Immediately following the Spin-off, UWWH merged with and into Veritiv (the "Merger").Veritiv. The Spin-off and the Merger are collectively referred to as the "Transactions".
On the Distribution Date, 8,160,000 shares of Veritiv common stock were distributed on a pro rata basis to the International Paper shareholders of record as of the close of business on June 20, 2014. Immediately following the Spin-off, but prior to the Merger, International Paper’s shareholders owned all of the outstanding shares of Veritiv common stock.
Immediately following the Spin-off on the Distribution Date, UWW Holdings, LLC, the sole stockholder of UWWH, (the "UWWH Stockholder") which is jointly owned by Bain Capital and Georgia-Pacific, received 7,840,000 shares of Veritiv common stock for all of the outstanding shares of UWWH common stock that it held on the Distribution Date, in a private placement transaction.
Immediately following the completion of the Transactions, International Paper shareholders owned approximately 51%, and UWW Holdings, LLC, the former sole stockholder of UWWH Stockholder(the "UWWH Stockholder"), which is jointly owned by Bain Capital and Georgia-Pacific, owned approximately 49%, of the shares of Veritiv common stock on a fully-diluted basis. Immediately following the completion of the Spin-off, International Paper did not own any shares of Veritiv common stock. Veritiv’s common stock began regular-way trading on the New York Stock Exchange on July 2, 2014 under the ticker symbol VRTV.
International Paper's distribution business was consolidated into a division operating under the xpedx name in 1998 to serve the U.S. and Mexico markets. International Paper grew its distribution business both organically and through the acquisition of over 30 distribution businesses located across the U.S. and Mexico. Unisource was a wholly-owned subsidiary of Alco Standard Corporation until its spin-off of Unisource in December 1996 whereby Unisource became a separate public company. Unisource was acquired by Georgia-Pacific, now owned by Koch Industries, in July 1999. In November 2002, Bain Capital acquired approximately a 60% ownership interest in Unisource, while Georgia-Pacific retained approximately a 40% ownership interest.
On August 31, 2017, Veritiv completed its acquisition of 100% of the equity interest in various All American Containers entities (collectively, "AAC"), a family owned and operated distributor of rigid packaging, including plastic, glass and metal containers, caps, closures and plastic pouches. The acquisition of AAC aligns with the Company's strategy of investing in higher growth and higher margin segments of the business. Through the acquisition, Veritiv gains expertise in rigid plastic, glass and metal packaging that complements its portfolio of packaging products and services. This acquisition also provides Veritiv with additional marketing, selling and distribution channels into the growing U.S. rigid packaging market. The rigid packaging market's primary product categories include paperboard, plastics, metals and glass.
Products and Services
Veritiv distributes well-known national and regional brandedbrand products as well as products marketed under its own private label brands. Products under the Company’s private label brands are manufactured by third-party suppliers in accordance with specifications established by the Company. Our portfolio of private label products includes:
Coated and uncoated papers, coated board and cut size under the Endurance, uBrand, nordic+, Econosource, Comet, Starbrite Opaque Ultra, porcelianECO 30Select and other brands,brands;
Packaging products under the TUFflex brand, which include stretch film, mailers, shrink film, carton sealing tape, and other specialty tapes,tapes; and
Foodservice disposable products, cleaning chemicals, skin care products,towels and tissues, can liners, sanitary maintenance supplies and a wide range of facility supplies products under the Reliable and Spring Grove brands.
For the year ended December 31, 2014,The table below summarizes sales of products sold under private label brands accounted for approximately 12%as a percentage of consolidated net sales. On a segment basis, private label sales in the Print, Packaging and Facility Solutions segments accounted for approximately 21%, 8% and 9%, respectively, of thatrespective total Company or applicable segment's total net sales for the year ended December 31, 2014. The Publishing segment did not have any private label sales.periods shown:
|
| | | | | |
| | Year Ended December 31, |
| | 2017 | | 2016 | | 2015 |
| Packaging | 6% | | 6% | | 6% |
| Facility Solutions | 8% | | 8% | | 8% |
| Print | 20% | | 22% | | 19% |
| Total Company | 10% | | 11% | | 10% |
Customers
We serve customers across a broad range of industries, through a variety of means ranging from multi-year supply agreements to transactional sales. The Company has valuable, multi-year, long-term supply agreements with many of its largest customers that set forth the terms and conditions of sale, including product pricing and warranties. Generally, theWe enter into incentive agreements with certain of our largest customers, which are generally based on sales to these customers. The Company’s customers are generally not required to purchase any minimum amount of products under these agreements and can place orders on an individual purchase order basis. However, the Company enters into negotiated supply agreements with a minority of its customers.
For the yearyears ended December 31, 2014,2017, 2016 and 2015, no single customer accounted for more than 5% of the Company’s consolidated net sales.
Suppliers
We purchase our products from thousands of suppliers, both domestic and international, across different business segments. Although varying by segment, the Company’s suppliers consist generally of large corporations selling brand name and private label products and, to a more limited extent, independent regional and private label suppliers. Suppliers are selected based on customer demand for the product and a supplier’s total service, cost and product quality offering.
Our sourcing organization supports the purchasing of well-known national and regional brand products as well as products marketed under our own private label brands from key national suppliers in the Print, Packagingpackaging, facility solutions and Facility Solutions segments.print industries. The Publishing segment primarily operates as a direct ship brokerage business aligned with the Company’s core supplier strategy. In addition, under the guidance and oversight of the sourcing team, our merchandising personnel located within individual distribution centers source products not available within our core offering in order to meet specialized customer needs.
The product sourcing program is designed to ensure that the Company is able to offer consistent product selections and market competitive pricing across the enterprise while maintaining the ability to service localized market requirements. Our procurement program is also focused on replenishment which includes purchase order placement and managingcontrolling the total cost of inventory by improvingproactively managing the number of day’s inventory on hand, negotiating favorable payment terms and maintaining vendor-owned and vendor-managed programs. As one of the largest purchasers of paper, graphics, packaging and facility supplies, we can qualify for volume allowances with some suppliers and can realize significant economies of scale. We in turn enter into incentive agreements with certain
During the year ended December 31, 2017, approximately 38% of our largest customers, which are generally based on sales to these customers.purchases were made from ten suppliers.
Competition
The paper, publishing, packaging, and facility solutions, paper and publishing distribution industry is highly competitive, with numerous regional and local competitors, and is a mature industry characterized by slowing growth or, in the case of paper, declining net sales. The Company’s principal competitors include national, regional and local distributors, national and regional manufacturers, independent brokers and both catalog-based and online business-to-business suppliers. Most of these
competitors generally offer a wide range of products at prices comparable to those Veritiv offers, though at varying service levels. Additionally, new competition could arise from non-traditional sources, group purchasing organizations, e-commerce, discount wholesalers or consolidation among competitors. Veritiv believes it offers the full range of services required to effectively compete, but if new competitive sources appear, it may result in margin erosion or make it more difficult to attract and retain customers.
The following summary briefly describes the key competitive landscape for each of Veritiv’s business segments:
Print – Industry sources estimate that there are hundreds of regional and local companies engaged in the marketing and distribution of paper and graphics products. While the Company believes there are few national distributors of paper and graphics products similar to Veritiv, several regional and local distributors have cooperated together to serve customers nationally. The Company’s customers also have the opportunity to purchase products directly from paper and graphics manufacturers. In addition, competitors also include regional and local specialty distributors, office supply and big box stores, independent brokers and large commercial printers that broker the sale of paper in connection with the sale of their printing services.
Publishing – The publishing market is serviced by printers, paper brokers and distributors. The Company’s customers also have the opportunity to purchase paper directly from paper manufacturers. The market consists primarily of magazine and book publishers, cataloguers, direct mailers and retail customers using catalog, insert and direct mail as a method of advertising. Veritiv’s brokerage companies, Bulkley Dunton and Graphic Communications, act in a consulting capacity in the selection of products as well as providing supply chain services and solutions.
Packaging – The packaging market is fragmented and consists of competition from national and regional packaging distributors, national and regional manufacturers of packaging materials, independent brokers and both catalog-based and online business-to-business suppliers. Veritiv believes there are few national packaging distributors with substrate neutral design capabilities similar to the Company’s capabilities.
Facility Solutions – There are few national, but numerous regional and local distributors of facility supply solutions. Several groups of distributors have created strategic alliances among multiple distributors to provide broader geographic coverage for larger customers. Other key competitors include the business-to-business divisions of big box stores, purchasing group affiliates and both catalog-based and online business-to-business suppliers.
Print – Industry sources estimate that there are hundreds of regional and local companies engaged in the marketing and distribution of paper and graphics products. While the Company believes there are few national distributors of paper and graphics products similar to Veritiv, several regional and local distributors have cooperated together to serve customers nationally. The Company’s customers also have the opportunity to purchase products directly from paper and graphics manufacturers. In addition, competitors also include regional and local specialty distributors, office supply and big box stores, online business-to-business suppliers, independent brokers and large commercial printers that broker the sale of paper in connection with the sale of their printing services.
Publishing – The publishing market is serviced by printers, paper brokers and distributors. The Company’s customers also have the opportunity to purchase paper directly from paper manufacturers. The market consists primarily of magazine and book publishers, cataloguers, direct mailers and retail customers using catalog, insert and direct mail as a method of advertising.
We believe that our competitive advantages include over 1,6001,800 sales and marketing professionals and the breadth of our selection of quality products, including high-quality private brands. The breadth of products distributed and services offered, the diversity of the types of customers served, and our broad geographic footprint in the U.S., Canada and Mexico buffer the impact of regional economic declines while also providing a network to readily serve national accounts.
Distribution and Logistics
Timely and accurate delivery of a customer’s order, on a consistent basis, are important criteria in a customer’s decision to purchase products and services from Veritiv. Delivery of products is provided through two primary channels, either from the Company’s warehouses or directly from the manufacturer. Our distribution centers offer a range of delivery options depending on the customer’s needs and preferences, and the strategic placement of the distribution centers also allows for delivery of special or "rush" orders to many customers.
Working Capital
Veritiv's working capital needs generally reflect the need to carry significant amounts of inventory in our distribution centers to meet delivery requirements of our customers, as well as significant accounts receivable balances. As is typical in our industry, our customers often do not pay upon receipt, but are offered terms which are heavily dependent on the specific circumstances of the sale.
Employees
As of December 31, 2014,2017, Veritiv had approximately 8,900 employees worldwide, of which approximately 10% were covered by collective bargaining agreements. Labor contract negotiations are handled on an individual basis by a team of Veritiv Human Resources and Legal personnel. Approximately 40%41% of the Company’s unionized employees have collective bargaining agreements that expire during 2015.2018. We currently expect that we will be able to renegotiate such agreements on satisfactory terms when they expire.terms. We consider labor relations to be good.
Government Relations
As a distributor, our transportation operations are subject to the U.S. Department of Transportation Federal Motor Carrier Safety Regulations. We are also subject to federal, state and local regulations regarding licensing and inspection of facilities, including compliance with the U.S. Occupational Safety and Health Act. These regulations require us to comply
with health and safety standards to protect our employees from accidents and establish communication programs to transmit information on the hazards of certain chemicals present in specific products that we distribute.
We are also subject to regulation by numerous U.S., Canadian and Mexican federal, state and local regulatory agencies, including, but not limited to, the U.S. Department of Labor, which sets employment practice standards for workers. Although we are subject to other U.S., Canadian and Mexican federal, state and local provisions relating to the protection of the environment and the discharge or destruction of materials, these provisions do not materially impact the use or operation of the Company’s facilities. Compliance with these laws has not had, and is not anticipated to have, a material effect on Veritiv’s capital expenditures, earnings or competitive position.
Intellectual Property
We have numerous well-recognized trademarks, represented primarily by our private label brands, in each of our segments. For the year ended December 31, 2014, sales of products sold under private label brands accounted for approximately 12% of consolidated net sales.brands. Most of our trademark registrations are effective for an initial period of 10 years, and we generally renew our trademark registrations before their expiration dates for trademarks that are in use or have reasonable potential for future use. Although our Print, Packaging and Facility Solutions segments rely on a number of trademarks that, in the aggregate, provide important protections to the Company, no single trademark is material to any one of these segments. See the Products and Services section above for additional information regarding our private label brand sales.
Veritiv does not have any material patents or licenses. During the last three years, Veritiv has not had any research and development expenditures.
Seasonality
The Company’s operating results are subject to seasonal influences. Historically, our highesthigher consolidated net sales and consequently Adjusted EBITDA (as defined in the "Key Performance Measure" section of Item 7 of this report) occur during the third quarterand fourth quarters while our lowest consolidated net sales and consequently Adjusted EBITDA occur during the first quarter. Within the Print and Publishing segments, seasonality is driven by increased magazine advertising page counts, retail inserts, catalogs and direct mail primarily due to back-to-school, political election and holiday-related advertising and promotions in the second half of the year. The Packaging segment net sales tend to increase each quarter throughout the year and net sales for the first quarter are typically less than net sales for the fourth quarter of the preceding year. Production schedules for non-durable goods that build up to the holidays and peak in the fourth quarter drive this seasonal net sales pattern. Net sales for the Facility Solutions segment tend to be highest during the second quarterthird and fourth quarters due to increased summer demand in the away-from-home resort, cruise and hospitality markets, activities related to back-to-school and second highestincreased retail activity during the third quarterholidays. Within the Print and Publishing segments, seasonality is driven by increased magazine advertising page counts, retail inserts, catalogs and direct mail primarily due to back-to-school, demand from our customers.political election and holiday-related advertising and promotions in the second half of the year.
Executive Officers of the Company
The following table sets forth certain information concerning the individuals who serve as executive officers of the Company as of March 1, 2015.2018. |
| | | | |
| Name | | Age | | Position |
| Mary A. Laschinger | | 5457 | | Chairman and Chief Executive Officer |
| Stephen J. Smith | | 5154 | | Senior Vice President and Chief Financial Officer |
| Charles B. Henry | | 5053 | | Senior Vice President Integration and Change ManagementCorporate Services |
| Mark W. Hianik | | 5457 | | Senior Vice President, General Counsel and Corporate Secretary |
| Thomas S. Lazzaro | | 5154 | | Senior Vice President Field Sales and Operations |
Joseph B. MyersBarry R. Nelson | | 4953 | | Senior Vice President Facility Solutions Strategy and Commercial Excellence |
Barry R. NelsonElizabeth A. Patrick | | 50 | | Senior Vice President Publishing and Print Management |
Elizabeth Patrick | | 47 | | Senior Vice President and Chief Human Resources Officer |
Neil A. RussellTracy L. Pearson | | 43 | | Senior Vice President Corporate Affairs |
Darin W. Tang | | 4947 | | Senior Vice President Packaging |
| Daniel J. Watkoske | | 4649 | | Senior Vice President Print and Veritiv Services |
The following descriptions of the business experience of our executive officers include the principal positions held by them since March 2010.2013.
Mary A. Laschinger has served as Chairman and Chief Executive Officer of the Company since JanuaryJuly 2014. Ms. Laschinger also served as Senior Vice President of International Paper Company, a global packaging and paper manufacturing company, from 2007 to July 2014 and as President of its xpedx distribution business from January 2010 to July 2014. Ms. Laschinger previously served as President of International Paper’s Europe, Middle East, Africa and Russia business, Vice President and General Manager of International Paper’s Wood Products and Pulp businesses and in other senior management roles at International Paper in sales, marketing, manufacturing and supply chain. Ms. Laschinger joined International Paper in 1992. Prior to joining International Paper, Ms. Laschinger held various positions in product managementsales, marketing and distributionsupply chain at James River Corporation and Kimberly-Clark Corporation. Ms. Laschinger has significant knowledge and executive management experience running domestic and international manufacturing and distribution businesses as well as a deep understanding of xpedxVeritiv and the industry in which it operates. Ms. Laschinger also serves as a director of Kellogg Company.Company and the Federal Reserve Bank of Atlanta.
Stephen J. Smith has served as Senior Vice President and Chief Financial Officer of the Company since March 2014. Previously, Mr. Smith served as Senior Vice President and Chief Financial Officer of American Greetings Corporation, a global greeting card company, from November 2006 to March 2014. Previously, Mr. Smith served as Vice President of Investor Relations and Treasurer of American Greetings from April 2003 to November 2006. Prior to American Greetings, Mr. Smith served as Vice President and Treasurer of General Cable Corporation, a global wire and cable manufacturer and distributer,distributor, and Vice President, Treasurer and Assistant Secretary of Insilco Holding Company, a telecommunications and electrical component products manufacturer. During Mr. Smith’s tenure as a public company chief financial officer, he helped lead several strategic acquisitions and was responsible for the design and execution of the capital structure for a management buyout.
Charles B. Henry has served as Senior Vice President Corporate Services since March 2016. Previously, Mr. Henry served as Senior Vice President Commercial Excellence and Enterprise Initiatives of the Company from January 2016 to March 2016. Previously, Mr. Henry served as Senior Vice President Integration and Change Management of the Company sincefrom July 2014. Previously,2014 to December 2015. Prior to that, Mr. Henry served as Vice President, Strategy Management and Integration of xpedx from March 2013 to July 2014 and was a member of the xpedx Senior Lead Team. Prior to that, he served as Director of the xpedx Strategy Management Office from February 2011 to March 2013. Prior to that, he served as a Director in International Paper’s Supply Chain Project Management Office. Mr. Henry joined International Paper in 1986 and served in a variety of supply chain, sales and general management roles within International Paper’s Program Management Office, Printing and Communications Papers business and Global Supply Chain operations. Mr. Henry has significant strategy and project management experience in the manufacturing and distribution industries.
Mark W. Hianik has served as Senior Vice President, General Counsel and Corporate Secretary of the Company since January 2014. Previously, Mr. Hianik served as Senior Vice President, General Counsel and Chief Administrative Officer for Dex One Corporation, an advertising and marketing services company, from March 2012 to May 2013. Prior to that Mr. Hianik served as Senior Vice President, General Counsel and Corporate Secretary for Dex One (and its predecessor, R.H. Donnelley Corporation) from April 2008 to March 2012. R.H. Donnelley filed for voluntary reorganization under Chapter 11 of the U.S. Bankruptcy Code in May 2009 emerging with a confirmed plan as Dex One in January 2010 and Dex One filed a pre-packaged bankruptcy petition under Chapter 11 in March 2013 to effect a merger consummated in April 2013. Mr. Hianik previously served as Vice President and Assistant General Counsel for Tribune Company, a diversified media company, and as a corporate and securities partner in private practice. Mr. Hianik has significant experience as a public company general counsel and leader of other corporate administrative functions as well as significant mergers and acquisitions, securities, corporate financecapital markets and corporate governance experience.
Thomas S. Lazzaro has served as Senior Vice President Field Sales and Operations of the Company since July 2014. In this role, Mr. Lazzaro leads the Supply Chain and the Field Sales organizations. Previously, Mr. Lazzaro served as Executive Vice President, Supply Chain of xpedx from March 2013 to July 2014 and was a member of the xpedx Senior Lead Team. Mr. Lazzaro joined xpedx in January 2011 as Executive Vice President and Chief Procurement Officer, responsible for all aspects of the purchasing organization. From October 2007Prior to May 2010, Mr. Lazzaro held several positions with HD Supply, a construction supply company, including President of White Cap Construction Supply and President of Creative Touch Interiors. Previously,xpedx, Mr. Lazzaro was a senior executive with HD Supply, The Home Depot and General Electric. Mr. Lazzaro has significant experience in general management, supply chain, operations and finance in the manufacturing and distribution industries.
Joseph B. Myers has served asSenior Vice President Facility Solutions, Strategy and Commercial Excellence of the Company since April 2014. Previously, Mr. Myers served as President of Oldcastle Building Solutions, a unit of Oldcastle
Inc., one of the nation’s largest building products companies, from February 2012 to April 2014. From August 2000 to February 2012, Mr. Myers was a Partner at McKinsey & Company, a management consulting firm, where he was a designated expert in sales and market growth development and led client engagements across various industries, including distribution, paper, packaging and chemicals. Previously, Mr. Myers held positions in sales, marketing and general management with BP Amoco. Mr. Myers has significant experience in senior leadership, general management, consulting, strategy and business transformation positions.
Barry R. Nelson has served as Senior Vice President Facility Solutions of the Company since December 2015. Previously, Mr. Nelson served as Senior Vice President Publishing and Print Management of the Company sincefrom July 2014.2014 to December 2015. Prior to that, Mr. Nelson served as Group Vice President, Sales-Publishing for xpedx from December 2012 to July 2014. From August 2002 to December 2012, Mr. Nelson served as Senior Vice President of Sales and Marketing for NewPage Corporation, a paper manufacturing company. NewPage filed for voluntary reorganization under Chapter 11 of the U.S. Bankruptcy Code in September 2011 and emerged with a confirmed plan in December 2012. Previously, Mr. Nelson served as Executive Vice President of Sales, Marketing and Client Delivery at ForestExpress, a technology joint venture of leading forest product companies. Mr. Nelson has significant sales and sales leadership experience in the paper manufacturing and distribution industries.
Elizabeth A. Patrick has served as Senior Vice President and Chief Human Resources Officer of the Company since July 2014. Prior to that, Ms. Patrick served as Vice President, Human Resources, of xpedx from March 2013 untilto July 2014 and was a member of International Paper Company’s Human Resources & Communications Lead Team and the xpedx Senior Lead Team. Prior to that, she served as Director, Human Resources-Field Operations of xpedx from October 2012 to March 2013. Previously, Ms. Patrick served as Vice President of Human Resources of TE Connectivity, a global electronics manufacturing and distribution company, from April 2008 to October 2012. Prior to that,Previously, Ms. Patrick served as Vice President Human Resources of Guilford Mills, Inc., an automotive and specialty markets fabrics manufacturer, and in a variety of roles of increasingincreased responsibility with General Motors Company and GM spin-off, Delphi Corporation, a global automotive parts manufacturer. Ms. Patrick has significant human resources and finance management and leadership experience.
Neil A. Russell has served as Senior Vice President Corporate Affairs of the Company since February 2014. Previously, Mr. Russellserved as Vice President—Investor Relations of Sysco Corporation, a global business-to-business foodservice distributor, from August 2007 to February 2014. Prior to that, Mr. Russell served as Director of Investor Relations of Delta Air Lines. While at Delta, Mr. Russell also held positions of increasing responsibility including Director of Financial Analysis and worked in the areas of Strategic Planning and Network Analysis. Mr. Russell has significant experience as an investor relations officer for global public companies, as well as significant financial planning and public relations experience.
Darin W. TangTracy L. Pearson has served as Senior Vice President Packaging of the Company since July 2014.October 2016. Prior to that,, Mr. Tang Ms. Pearson served as President of the Packaging Solutions Group for Unisource from January 2013 to July 2014. Since joining Unisource in 2004, Mr. Tang has held positions as Area Vice President and General Manager, South Area, for the Container the Americas business of Packaging, SeniorInternational Paper Company, a global paper and packaging manufacturing company, from May 2016 to October 2016. Prior to that, Ms. Pearson served as Vice President of Packaging, Senior Vice Presidentand General Manager for the East RegionFoodservice packaging business of International Paper from August 2011 to May 2016. Ms. Pearson joined International Paper in 1994 and National Packaging Directorserved in a variety of sales, supply chain, marketing, process engineering, product development, and President, Sales of the Industry Business Group. Prior to joining Unisource, Mr. Tang served as Director of Sales with Intertape Polymer Group, Inc., a specialty manufacturer of packaging products and systems, and in various roles in sales and training with Scott Paper Company/Kimberly-Clark, a manufacturer of personal care products to the distributiongeneral management roles within International Paper’s packaging and retail channels. Mr. Tangprint businesses. Ms. Pearson has significant experience in general management, sales and sales management, experienceand supply chain in the paperpackaging and packagingpaper manufacturing and distribution industries.
Daniel J. Watkoske has served as Senior Vice President Print of the Company since July 2014.2014 and, since October 2016, has also served as Senior Vice President of Veritiv Services. Prior to that, Mr. Watkoske served as Executive Vice President Sales for xpedx from January 2011 to July 2014 and was a member of the xpedx Senior Lead Team. Prior to that, Mr. Watkoske served as Group Vice President for the xpedx Metro New York Group from January 2008 to January 2011. Previously, Mr. Watkoske served as Vice President National Accounts for xpedx. Mr. Watkoske joined International Paper in 1989 as a sales trainee for Nationwide Papers, which later became part of xpedx. Mr. Watkoske has significant sales, sales management and operations experience in the paper and packaging distribution industries.
We have been advised that there are no family relationships among any of our executive officers or directors and that there is no arrangement or understanding between any of our executive officers and any other persons pursuant to which they were appointed, respectively, as an executive officer.
Company Information
Veritiv was incorporated in Delaware on July 10, 2013. Our principal executive offices are currently located at 6600 Governors Lake Parkway, Norcross,1000 Abernathy Road NE, Building 400, Suite 1700, Atlanta, Georgia 30071. In December 2014, we announced our plans to relocate our principal executive offices to 400 Northpark Town Center in Atlanta, Georgia.30328.
Our corporate website is http://www.veritivcorp.com. Information contained on our website is not part of this Annual Report on Form 10-K. Through the "Investors""Investor Relations" portion of this website, we make available, free of charge, our proxy statements, Annual Reports on Form 10-K, Quarterly Reports on Form 10-Q, Current Reports on Form 8-K and other relevant filings with the SEC and any amendments to those reports as soon as reasonably practicable after such material has been filed with, or furnished to, the SEC. These filings are also accessible on the SEC's website at http://www.sec.gov.
ITEM 1A. RISK FACTORS
You should carefully consider the following risk factors, together with the other information contained in this report, in evaluating us and an investment in our common stock. The risks described below are the material risks, although not the
only risks, relating to us and our common stock. If any of the following risks and uncertainties develop into actual events, these events could have a material adverse effect on our business, financial condition, results of operations or cash flows.
Risks Relating to Our Business
The industry-wide decline in demand for paper and related products could have a material adverse effect on our financial condition and results of operations.
Our Print and Publishing businesses rely heavily on the sale of paper and related products. The industry-wide decrease in demand for paper and related products in key markets we serve places continued pressure on our revenues and profit margins and makes it more difficult to maintain or grow earnings. This trend is expected to continue. The failure to effectively differentiate us from our competitors and the failure to grow the Packaging and Facility Solutions businesses in the face of increased use of email, increased and permanent product substitution, including less print advertising, more electronic billing, more e-commerce, fewer catalogs and a reduced volume of mail, could have a material adverse effect on market share, sales and profitability through increased expenditures or decreased prices. Our failure to grow the Packaging and Facility Solutions businesses at rates adequate to offset the expected decline in Print and Publishing could also have a material adverse effect on our financial results.
Competition in our industry may adversely impact our margins and our ability to retain customers and make it difficult to maintain our market share and profitability.
The business-to-business distribution industry is highly competitive, with numerous regional and local competitors, and is a mature industry characterized by slowing revenue growth. Our principal competitors include regional and local distributors in the Print segment; regional, national and international paper manufacturers and other merchants and brokers in the Publishing segment; national distributors, national and regional manufacturers and independent brokers in the Packaging segment; and national, regional and local distributors in the Facility Solutions segment. Most of these competitors generally offer a wide range of products at prices comparable to those we offer. Additionally, new competition could arise from non-traditional sources, group purchasing organizations, e-commerce, discount wholesalers or consolidation among competitors. New competitive sources may result in increased focus on pricing and on limiting price increases, or may require increased discounting. Such competition may result in margin erosion or make it difficult to attract and retain customers.
Increased competition within the industry, reduced demand for paper, increased and permanent product substitution through less print advertising, more electronic billing, more e-commerce, fewer catalogs, a reduced volume of mail and general economic conditions havehas served to further increase pressure on the industry’s profit margins, and continued margin pressure within the industry may have a material adverse impact on our operating results and profitability.
Adverse developments in general business and economic conditions as well as conditions in the global capital and credit markets could have a material adverse effect on the demand for our products and our financial condition and results of operations.
The persistently slow rate of increase in the U.S. gross domestic product ("GDP") in recent years has adversely affected our results of operations. If GDP continues to indicateincrease at a sluggish economy,slow rate or if economic growth declines, demand for the products we sell will be adversely affected. In addition, volatility in the global capital and credit markets, which impacts interest
rates, currency exchange rates and the availability of credit, could have a material adverse effect on the business, financial condition and results of operations of our company and our customers. We have exposure to counterparties with which we routinely execute transactions. Such counterparties include customers and financial institutions. A bankruptcy or liquidity event by one or more of our counterparties could have a material adverse effect on our business, financial condition and results of operations.
In order to compete, we must attract, train and retain highly qualified employees, and the failure to do so could have a material adverse effect on our results of operations.
To successfully compete, we must attract, train and retain a large number of highly qualified employees while controlling related labor costs. Specifically, we must recruit and retain qualified sales professionals. If we were to lose a significant amount of our sales professionals, we could lose a material amount of sales, which would have a material adverse effect on our financial condition and results of operations. Many of our sales professionals are subject to confidentiality and non-competition agreements. If our sales professionals were to violate these agreements, we could seek to legally enforce these agreements, andbut we may incur substantial costs in connection with such enforcement and may not be successful in such
enforcement. We compete with other businesses for employees and invest significant resources in training and motivating them. There is no assurance that we will be able to attract or retain highly qualified employees. The inability to retain or hire qualified personnel at economically reasonable compensation levels would restrict our ability to improve our business and result in lower operating results and profitability.
Our business may be adversely affected by work stoppages, union negotiations and labor disputes.
Approximately 10% of our employees are currently covered by collective bargaining or other similar labor agreements. Historically, the effects of collective bargaining and other similar labor agreements have not been significant. However, if a larger number of our employees were to unionize, including in the wake of any future legislation or administrative regulation that makes it easier for employees to unionize, the effect may be negative.
Approximately 41% of the Company’s unionized employees have collective bargaining agreements that expire during 2018. Any inability to negotiate acceptable new contracts under these collective bargaining arrangements could cause strikes or other work stoppages, and new contracts could result in increased operating costs. If any such strikes or other work stoppages occur, or if additional employees become represented by a union, a disruption of our operations and higher labor costs could result. Labor relations matters affecting our suppliers of products and services could also adversely affect our business from time to time.
The loss of any of our significant customers could adversely affect our financial condition.
Our ten largest customers generated approximately 13%9% of our consolidated net sales for the six monthsyear ended December 31, 2014,2017, and our largest customer accounted for approximately 2% of our consolidated net sales in that same period. We cannot guarantee that we will maintain or improve our relationships with these customers or that we will continue to supply these customers at historicalhistoric levels.
Generally, our customers are not contractually required to purchase any minimum amount of products. Should such customers purchase products sold by us in significantly lower quantities than they have in the past, such decreased purchases could have a material adverse effect on our financial condition, operating results and cash flows.
In addition, consolidation among customers could also result in changes to the purchasing habits and volumes among some of our present customers. The loss of one or more of these significant customers, a significant customer’s decision to purchase our products in substantially lower quantities than they have in the past, or a deterioration in the relationship with any of these customers could adversely affect our financial condition, operating results and cash flows.
Changes in business conditions in our international operations could adversely affect our business and results of operations.
Our operating results and business prospects could be substantially affected by risks related to Canada, Mexico and other non-U.S. countries where we sell and distribute our products. Some of our operations are in or near locations that have suffered from political, social and economic issues; civil unrest; and a high level of criminal activity. In those locations where we have employees or operations, we may incur substantial costs to maintain the safety of our personnel and the security of our operations. Downturns in economic activity, adverse tax consequences or any change in social, political or labor conditions in any of the countries in which we operate could negatively affect our financial results. In addition, our international operations are subject to regulation under U.S. law and other laws related to operations in foreign jurisdictions. For example, the Foreign Corrupt Practices Act of 1977 (the "FCPA") prohibits U.S. companies and their representatives
from offering, promising, authorizing or making payments to foreign officials for the purpose of obtaining or retaining business abroad. Failure to comply with domestic or foreign laws could result in various adverse consequences, including the imposition of civil or criminal sanctions and the prosecution of executives overseeing our international operations.
We purchase all of the products we sell to our customers from other parties, and conditions beyond our control can interrupt our supplies and increase our product costs.
As a distributor, we obtain our packaging, paper and facility products from third-party suppliers. Our business and financial results are dependent on our ability to purchase products from suppliers not controlled by us that we, in turn, sell to our customers. We may not be able to obtain the products we need on open credit, with market or other favorable terms, or at all. During the six monthsyear ended December 31, 2014,2017, approximately 40%38% of our purchases were made from only ten suppliers. A
sustained disruption in our ability to source products from one or more of the largest of these vendors might have a material impact on our ability to fulfill customer orders resulting in lost sales and, in rare cases, damages for late or non-delivery.
For the most part, we do not have a significant number of long-term contracts with our suppliers committing them to provide products to us. Although our purchasing volume can provide benefits when dealing with suppliers, suppliersSuppliers may not provide the products and supplies needed in the quantities and at the prices and times requested. We are also subject to delays caused by interruption in production and increases in product costs based on conditions outside of our control. These conditions include raw material shortages, environmental restrictions on operations, work slowdowns, work interruptions, strikes or other job actions by employees of suppliers, product recalls, transportation interruptions, unavailability of fuel or increases in fuel costs, competitive demands and natural disasters or other catastrophic events. Our inability to obtain adequate supplies of paper, packaging and facility products as a result of any of the foregoing factors or otherwise could mean that we could not fulfill our obligations to customers, and customers may turn to other distributors.
In addition, increases in product costs may reduce our margins if we are unable to pass all or a portion of these costs along to our customers, which we have historically had difficulty doing. Any such inability may have a negative impact on our business and our profitability.
Changes in prices for raw materials, including pulp, paper and resin, could negatively impact our results of operations and cash flows.
Changes in prices for raw materials, such as pulp, paper and resin, could significantly impact our results of operations in the print market. Although we do not produce paper products and are not directly exposed to risk associated with production, declines in pulp and paper prices, driven by falling secular demand, periods of industry overcapacity and overproduction by paper suppliers, may adversely affect our revenues and net income to the extent such factors produce lower paper prices. Declining pulp and paper prices generally produce lower revenues and profits, even when volume and trading margin percentages remain constant. During periods of declining pulp and paper prices, customers may alter purchasing patterns and defer paper purchases or deplete inventory levels until long-term price stability occurs. Alternatively, if prices for raw materials rise and we are unable to pass these increases on to our customers, our results of operations and profits may also be negatively impacted.
We may not be able to fully compensate for increases in fuel costs.
Volatile fuel prices have a direct impact on our industry. The cost of fuel affects the price paid by us for products as well as the costs incurred to deliver products to our customers. Although we have been able to pass along a portion of increased fuel costs to our customers in the past, there is no guarantee that we can continue to do so. We currently pass on some of our fuel costs through a fuel surcharge on orders, butAs such, we may experience difficulties in passing all or a portion of these costs along to our customers, which may have a negative impact on our business and our profitability.
Inclement weather, anti-terrorism measures and other disruptions to the transportation network could impact our distribution system and operations.
Our ability to provide efficient distribution of products to our customers is an integral component of our overall business strategy. Disruptions at distribution centers or shipping ports or the closure of roads or imposition of other driving bans due to natural events such as flooding, tornadoes and blizzards may affect our ability to both maintain key products in
inventory and deliver products to our customers on a timely basis, which may in turn adversely affect our results of operations.
Furthermore, in the aftermath of terrorist attacks in the United States, federal, state and local authorities have implemented and continue to implement various security measures that affect many parts of the transportation network in the U.S. and abroad. Our customers typically need quickrequire delivery of products in short time frames and will rely on our on-time delivery capabilities. If security measures disrupt or impede the timing of our deliveries, we may fail to meet the needs of our customers, or may incur increased expenses to do so. Any of these disruptions to our operations may reduce our sales and have an adverse effect on our business, financial condition and results of operations.
We are dependent on a variety of IT and telecommunications systems and the Internet, and any failure of these systems could adversely impact our business and operating results.
We depend on information technology ("IT") and telecommunications systems and the Internet for our operations. These systems support a variety of functions including inventory management, order placement and processing with vendors and from customers, shipping, shipment tracking and billing. We maintain redundantOur information systems as part of our disaster recovery program and, if necessary, are able to operate in many respects using a paper-based system to help mitigate a complete interruption in our information processing capabilities. We have also invested in tools and processes to combat security threats. Nonetheless, our information systems remain vulnerable to natural disasters, wide-area telecommunications or power utility outages, terrorist or cyber-attacks and other major disruptions.disruptions and our redundant information systems may not operate effectively.
Failures or significant downtime of our IT or telecommunications systems for any reason, including as a result of disruptions from integrating the xpedx and Unisource businesses, could prevent us from taking customer orders, printing product pick-lists, shipping products, billing customers and handling call volume. Sales also may be adversely impacted if our reseller and retail customers are unable to access pricing and product availability information. We also rely on the Internet, electronic data interchange and other electronic integrations for a large portion of our orders and information exchanges with our suppliers and customers. The Internet and individual websites have experienced a number of disruptions and slowdowns, some of which were caused by organized attacks. In addition, some websites have experienced security breakdowns. If we were to experience a security breakdown, disruption or breach that compromised sensitive information, it could harm our relationships with our suppliers and customers. Disruption of our website or the Internet in general could impair our order processing or more generally prevent our suppliers and resellers from accessing information. Failures of our systems could also lead to delivery delays and may expose us to litigation and penalties under some of our contracts. Any significant increase in our IT and telecommunications costs or temporary or permanent loss of our IT or telecommunications systems, including as a result of disruptions from integrating the xpedx and Unisource businesses, could harm our relationships with our customers and suppliers and result in lost sales, business delays and bad publicity. The occurrence of any of these events, as well as the costs we may incur in preventing or responding to such events, could have a material adverse effect on our business, financial condition and results of operations.
We are subject to cyber-security risks related to breaches of security pertaining to sensitive company, customer, employee and vendor information as well as breaches in the technology that manages operations and other business processes.
Our operations rely upon secure IT systems for data capture, processing, storage and reporting. Our IT systems, and those of our third-party providers, could become subject to cyber-attacks. Network, system, application and data breaches could result in operational disruptions or information misappropriation including, but not limited to, interruption of systems availability, or denial of access to and misuse of applications required by our customers to conduct business with us. Access to internal applications required to plan our operations, source materials, ship finished goods and account for orders could be denied or misused. Theft of intellectual property or trade secrets, and inappropriate disclosure of confidential information, could stem from such incidents. Any operational disruptions or misappropriation of information could harm our relationship with our customers and suppliers, result in lost sales, business delays and negative publicity and could have a material adverse effect on our business, financial condition and results of operations.
Costs to comply with environmental, health and safety laws, and to satisfy any liability or obligation imposed under such laws, could negatively impact our business, financial condition and results of operations.
Our operations are subject to U.S. and international environmental, health and safety laws, including laws regulating the emission or discharge of materials into the environment, the use, storage, treatment, disposal and management of hazardous substances and waste, the investigation and remediation of contamination and the health and safety of our employees and the
public. We could incur substantial fines or sanctions, enforcement actions (including orders limiting our operations or requiring corrective measures), investigation, remediation and closure costs and third-party claims for property damage and personal injury as a result of violations of, or liabilities or obligations under, environmental, health and safety laws. We could be held liable for the costs to address contamination at any real property we have ever owned, operated or used as a disposal site.
In addition, changes in, or new interpretations of, existing laws, the discovery of previously unknown contamination, or the imposition of other environmental liabilities or obligations in the future, may lead to additional compliance or other costs that could impact our business and results of operations. Moreover, as environmental issues, such as climate change, have become more prevalent, U.S. and foreign governments have responded, and are expected to continue to respond, with
increased legislation and regulation, which could negatively impact our business, financial condition and results of operations.
Expenditures related to the cost of compliance with laws, rules and regulations could adversely impact our business and results of operations.
Our operations are subject to U.S. and international laws and regulations, including regulations of the U.S. Department of Transportation Federal Motor Carrier Safety Administration, the import and export of goods, customs regulations, Office of Foreign Asset Control and the FCPA. WeExpenditures related to the cost of compliance with laws, rules and regulations could adversely impact our business and results of operations. In addition, we could incur substantial fines or sanctions, enforcement actions (including orders limiting our operations or requiring corrective measures), and third-party claims for property damage and personal injury as a result of violations of, or liabilities under, laws, regulations, codes and common law.
Tax assessments and unclaimed property audits by governmental authorities could adversely impact our operating results.
We remit a variety of taxes and fees to various governmental authorities, including federal and state income taxes, excise taxes, property taxes, sales and use taxes and payroll taxes. The taxes and fees remitted by us are subject to review and audit by the applicable governmental authorities which could result in liability for additional assessments. In addition, we are subject to unclaimed property (escheat) laws which require us to turn over to certain government authorities the property of others held by us that has been unclaimed for a specified period of time. We are subject to audit by individual U.S. states with regard to our escheatment practices. The legislation and regulations related to tax and unclaimed property matters tend to be complex and subject to varying interpretations by both government authorities and taxpayers. Although management believes that the positions we have taken are reasonable, various taxing authorities may challenge certain of the positions we have taken, which may also potentially result in additional liabilities for taxes, unclaimed property, interest and interestpenalties in excess of accrued liabilities. Our positions are reviewed as events occur such as the availability of new information, the lapsing of applicable statutes of limitations, the conclusion of tax audits, the measurement of additional estimated liabilityliabilities based on current calculations, the identification of new tax contingencies or the rendering of relevant court decisions. An unfavorable resolution of assessments by a governmental authority could have a material adverse effect on our financial condition, results of operations and cash flows in future periods.
Adverse developments in general business and economic conditions, including the industry-wide decline in demand for paper and related products could have a material adverse effect on our financial condition and results of operations impairing our ability to use Net Operating Loss ("NOL") carryforwards and other deferred tax assets.
The realization of our NOLs and other deferred tax assets depends on the timing and amount of taxable income earned by our company in the future and a lack of future taxable income would adversely affect our ability to realize these tax assets. Tax attributes are generally subject to expiration at various times in the future to the extent that they have not previously been applied to offset the taxable income of our company, and there is a risk that our existing NOL carryforwards could expire unused and be unavailable to offset future income tax liabilities.
The Merger resulted in an ownership change for Unisource under Section 382 of the Internal Revenue Code (the "Code"), limiting the use of Unisource’s NOLs to offset future taxable income for both U.S. federal and state income tax purposes. Moreover, future trading of our stock by our significant shareholders may result in additional ownership changes as defined under Section 382 of the Code, further limiting the use of Unisource's NOLs. These limitations may affect the availability and the timing of when these NOLs may be used which could impair our deferred tax assets which, in turn, may adversely impact the timing and amount of cash taxes payable by our company.
Significant judgment is required in evaluating the need for and magnitude of appropriate valuation allowances against deferred tax assets. The realization of these assets is dependent on generating future taxable income, as well as successful implementation of various tax planning strategies. Although we believe that the judgments and estimates with respect to the valuation allowances are appropriate and reasonable under the circumstances, actual results could differ from projected results, which could give rise to additions to valuation allowances or reductions in valuation allowances. It is possible that such changes could have a material adverse effect on the amount of income tax expense (benefit) recorded in our consolidated statement of operations.
Our inability to renew existing leases on acceptable terms, negotiate rent decreases or concessions and identify affordable real estate could adversely affect our operating results.
We may be unable to successfully negotiate or renew existing leases at attractive rents, negotiate rent decreases or concessions or identify affordable real estate. A key factor in our operating performance is the location and associated real estate costs of our distribution centers. In particular, approximately 4024 of our lease and subleasereal estate financing agreements expire in June 2018.2018 which accounted for approximately 20% of our total operating leased square footage as of December 31, 2017. Our inability to negotiate or renew these or any other leases on favorable terms, or at all, could have a material adverse effect on our business and results of operations due to, among other things, any resultant increased lease payments.
Results of legal proceedings could have a material adverse effect on our consolidated financial statements.
We rely on manufacturers and other suppliers to provide us with the products and equipment we sell, distribute and service. As we do not have direct control over the quality of the products manufactured or supplied by such third-party suppliers, we are exposed to risks relating to the quality of the products and equipment we sell, distribute and service. It is possible that inventory from a manufacturer or supplier could be sold to our customers and later be alleged to have quality problems or to have caused personal injury, subjecting us to potential claims from customers or third parties. Our ability to hold such manufacturer or supplier liable will depend on a variety of factors, including its financial viability. Moreover, as
we increase the number of private label products we distribute, our exposure to potential liability for product liability claims may increase. Finally, even if we are successful in defending any claim relating to the products or equipment we distribute, claims of this nature could negatively impact our reputation and customer confidence in our products, equipment and company. We have been subject to such claims in the past, which have been resolved without material financial impact. We also operate a significant number of facilities and a large fleet of trucks and other vehicles and therefore face the risk of premises-related liabilities and vehicle-related liabilities including traffic accidents.
From time to time, we may also be involved in government inquiries and investigations, as well as class action, employment and other litigation. We cannot predict with certainty the outcomes of these legal proceedings and other contingencies, including environmental remediation and other proceedings commenced by government authorities. The costs and other effects of pending litigation against us cannot be determined with certainty. Although we believe that the outcome of any pending or future lawsuits or claims will not have a material adverse effect on our business or consolidated financial statements, thereThere can be no assurance that the outcome of any lawsuit or claim or its effect on our business or financial condition will be as expected. The defense of these lawsuits and claims may divert our management’s attention, and significant expenses may be incurred in defending these lawsuits.as a result. In addition, we may be required to pay damage awards or settlements, or become subject to injunctions or other equitable remedies, that could have a material adverse effect on our business, financial condition, results of operations and cash flows.
WhileAlthough we currently maintain insurance coverage to address a portionsome of these types of liabilities, we cannot make assurances that we will be able to obtain such insurance on acceptable terms in the future, if at all, or that any such insurance will provide adequate coverage against potential claims. In addition, we may choose not to seek to obtain such insurance in the future. Moreover, indemnification rights that we have may be insufficient or unavailable to protect us against potential loss exposures.
We may not be able to adequately protect our material intellectual property and other proprietary rights, or to defend successfully against intellectual property infringement claims by third parties.
Our ability to compete effectively depends in part upon our intellectual property rights, including but not limited to trademarks, copyrights and proprietary technology. The use of contractual provisions, confidentiality procedures and agreements, and trademark, copyright, unfair competition, trade secret and other laws to protect intellectual property rights and proprietary technology may not be adequate. Litigation may be necessary to enforce our intellectual property rights and protect proprietary technology, or to defend against claims by third parties that our conduct or our use of intellectual property infringes upon such third-party’s intellectual property rights. Any intellectual property litigation or claims brought against us, whether or not meritorious, could result in substantial costs and diversion of our resources, and there can be no assurances that favorable final outcomes will be obtained in all cases.obtained. The terms of any settlement or judgment may require us to pay substantial amounts to the other party or cease exercising our rights in such intellectual property, including ceasing the use of certain trademarks used by us to distinguish our services from those of others or ceasing the exercise of our rights in copyrightable works. In addition, we may havebe required to seek a license to continue practices found to be in violation of a third-party’s rights, which may not be available on reasonable terms, or at all. Our business, financial condition or results of operations could be adversely affected as a result.
Our pension and health care costs are subject to numerous factors which could cause these costs to change.
Our pension and health care costs are dependent upon numerous factors resulting from actual plan experience and assumptions of future experience, including, for pension costs, actuarial assumptions regarding life expectancies. Pension plan assets are primarily made up of equity and fixed income investments. Fluctuations in actual equity market returns, changes in general interest rates and changes in the number of retirees may result in increased pension costs in future periods. Significant changes in any of these factors may adversely impact our cash flows, financial condition and results of operations.
We participate in multi-employer pension plans and multi-employer health and welfare plans, which could create additional obligations and payment liabilities.
We contribute to multi-employer defined benefit pension plans as well as multi-employer health and welfare plans under the terms of collective bargaining agreements that cover certain unionized employee groups in the United States. The risks of participating in multi-employer pension plans differ from single employer-sponsored plans and such plans are subject to regulation under the Pension Protection Act ("PPA"(the "PPA"). Multi-employer pension plans are cost-sharing plans subject to collective-bargaining agreements. Contributions to a multi-employer plan by one employer are not specifically earmarked for its employees and may be used to provide benefits to employees of other participating employers. If a participating
employer stops contributing to the plan, the unfunded obligations of the plan are borne by the remaining participating employers. In addition, if a multi-employer plan is determined to be underfunded based on the criteria established by the PPA, the plan may be required to implement a financial improvement plan or rehabilitation plan that may require additional contributions or surcharges by participating employers.
In addition to the contributions discussed above, we could be obligated to pay additional amounts, known as withdrawal liability,liabilities, upon decrease or cessation of participation in a multi-employer pension plan. WhileAlthough an employer may obtain an estimate of such liability, the final calculation of the withdrawal liability may not be able to be determined for an extended period. Theperiod of time. Generally, the cash obligation of such withdrawal liability is payable over a 20 year period.
Our substantial indebtedness could adversely affect our financial condition and impair our ability to operate our business.
As of December 31, 2014,2017, we had approximately $911.0$934.8 million in total indebtedness, reflecting borrowings of $847.8$897.7 million under the asset-based lending facility (the "ABL Facility"), $52.2$23.6 million of financing obligations (including financing obligations to a related party (exclusiveexclusive of the non-monetary portion) and $11.0$13.5 million of equipment capital lease and other obligations. This level of indebtedness could have important consequences to our financial condition, operating results and business, including the following:
limiting our ability to obtain additional debt or equity financing for working capital, capital expenditures, debt service requirements, acquisitions and general corporate or other purposes;
increasing our cost of borrowing;
requiring that a substantial portion of our cash flows from operations be dedicated to payments on our indebtedness instead of other purposes, including operations, capital expenditures and future business opportunities;
making it more difficult for us to make payments on our indebtedness or satisfy other obligations;
exposing us to risk of (i) increased interest rates on our borrowings in excess of our interest rate cap and (ii) increased interest rates of up to 3% on our borrowings covered by our interest rate cap because all of our borrowings under the ABL Facility are at variable rates of interest;
limiting our ability to make the expenditures necessary to complete the integration of xpedx’s business with Unisource’s business;
limiting our ability to adjust to changing market conditions and placing us at a competitive disadvantage compared to our competitors that have less debt; and
increasing our vulnerability to a downturn in general economic conditions or in our business, and making us unable to carry out capital spending that is important to our growth.
Despite our substantial indebtedness, we may still be able to incur substantially more indebtedness in the future. This could further exacerbate the risks to our financial condition described above.
We may be able to incur significant additional indebtedness in the future, including secured indebtedness. Although the agreements governing the ABL Facility contain restrictions on the incurrence of additional indebtedness, these restrictions are subject to a number of qualifications and exceptions, and the additional indebtedness incurred in compliance with these restrictions could be substantial. If new indebtedness is added to our current indebtedness levels, the related risks we will face could intensify.
The agreements governing our indebtedness contain restrictive covenants, which could restrict our operational flexibility.
The agreements governing the ABL Facility contain restrictions and limitations on our ability to engage in activities that may be in our long-term best interests, including financial and other restrictive covenants that could limit our ability to:
incur additional indebtedness or guaranties, or issue certain preferred shares;
pay dividends, redeem stock or make other distributions;
repurchase, prepay or redeem subordinated indebtedness;
make investments or acquisitions;
create liens;
make negative pledges;
consolidate or merge with another company;
sell or otherwise dispose of all or substantially all of our assets;
enter into certain transactions with affiliates; and
change the nature of our business.
The agreements governing the ABL Facility also contain other restrictions customary for asset-based facilities of this nature.
Our ability to borrow additional amounts under the ABL Facility will depend upon satisfaction of these covenants. Events beyond our control could affect our ability to meet these covenants. Our failure to comply with obligations under the agreements governing the ABL Facility may result in an event of default under those agreements. A default, if not cured or waived, may permit acceleration of our indebtedness. If our indebtedness is accelerated, we cannot be certain that we will have sufficient funds available to pay the accelerated indebtedness or that we will have the ability to refinance the accelerated indebtedness on terms favorable to us or at all. This could have serious consequences to our business, financial condition and operating results and could cause us to become bankrupt or insolvent.
Risks Relating to the Recent Spin-off and Merger
We may not realize the full benefits of the anticipated synergies, cost savings and growth opportunities from the Merger.
The benefits that we expect to achieve as a result of the Merger will depend, in part, on our ability to realize anticipated growth opportunities, cost savings and other synergies. Our success in realizing these growth opportunities, cost savings and synergies, and the timing of this realization, depends on the successful integration of the xpedx and Unisource businesses. Even if we are able to integrate the xpedx and Unisource businesses successfully, this integration may not result in the realization of the full benefits of the growth opportunities and cost savings and other synergies that we currently expect from this integration within the anticipated time frame or at all. For example, we may be unableWe have incurred and will continue to eliminate duplicative costs. Moreover, we will incur substantial expenses in connection with the integration of xpedx’s and Unisource’sthese businesses. Such expenses are difficult to estimate accurately and may exceed current estimates. Accordingly,estimates and accordingly, the full benefits from the Merger may be offset by costs or delays incurred in integrating the businesses.
The integration of the xpedx business with the Unisource business following the Transactions may present significant challenges.
There is a significant degree of difficulty and management distraction inherent in the process of integrating the xpedx and Unisource businesses. These challenges include:
the challenge of integrating the xpedx and Unisource businesses and carrying on the ongoing operations of each business;
the challenge of integrating the business cultures of each company;
which include the challenge and cost of integrating the IT systems of each company;company and network optimization.
the potential difficulty in retaining key employees and sales personnel
The continuation of the integration process couldmay cause an interruption of, or loss of momentum in, the activities of our business and may require us to incur substantial out-of-pocket costs. Members of our senior management have devoted and will continue to devote considerable amounts of time and attention to the integration process, which, in turn, decreases the time they will have to manage our company, service existing customers, attract new customers and develop new services or strategies.process.
We cannot assure you that we will successfully or cost-effectively integratefinalize the Unisourceintegration of the xpedx and xpedxUnisource businesses. The failure to do so could have a material adverse effect on our business, financial condition and results of operations.
Our historical financial data are not necessarily representative of the results we would have achieved if we operated as a combined company prior to the Transactions and may not be a reliable indicator of our future results.
Our historical financial data for periods prior to the Transactions included in this report may not reflect what xpedx’s or Unisource’s results of operations, financial condition and cash flows would have been had we been a combined company during the periods presented, or what our results of operations, financial condition and cash flows will be in the future. Among other factors, this is because:
Prior to the Transactions, International Paper operated the xpedx business as part of its broader corporate organization. International Paper, or one of its affiliates, performed certain corporate functions for the xpedx business, including tax and treasury administration and certain governance functions, such as internal audit and
external reporting. Our historical financial statements reflect allocations of corporate expenses from International Paper for these and similar functions and may not reflect the costs that we will incur for similar services in the future.
The working capital and other capital required for the general corporate purposes of the xpedx business, including acquisitions and capital expenditures, historically have been satisfied as part of the company-wide cash management practices of International Paper. As a result of the Transactions, we need to generate our own funds to finance working capital or other cash requirements and may need to obtain additional financing from banks, either through public offerings or private placements of debt or equity securities or other arrangements.
Other significant changes may occur in our cost structure, management, financing and business operations as a result of operating as a combined company.
We have limited experience complying with the reporting and other requirements of a publicly traded company.
As a result of the Transactions, we became a publicly traded company on July 1, 2014. We have limited experience complying with the reporting and other requirements of the Securities Exchange Act of 1934, as amended (the "Exchange Act"). The Exchange Act requires that we file annual, quarterly and current reports with respect to our business and financial condition. We are responsible for ensuring that all aspects of our business comply with Section 404 of the Sarbanes-Oxley Act of 2002 (the "Sarbanes Oxley Act"). Under the Sarbanes-Oxley Act, we are required to maintain effective disclosure controls and procedures and internal control over financial reporting. In addition, our management is required to assess the effectiveness of our internal control over financial reporting and obtain a report by an independent registered public accounting firm addressing such assessments on an annual basis, subject to applicable phase-in periods.
To comply with these requirements, we have incurred significant costs in upgrading our systems, implementing additional financial and management controls, reporting systems and procedures, and hiring additional accounting, audit, tax and legal staff. We will also incur additional annual expenses for the purpose of addressing these requirements, and those expenses may be significant. Any failure to achieve and maintain effective internal controls could have a material adverse effect on our business, financial condition and results of operations.
We have incurred and continue to incur significant costs and charges associated with the Transactions that could affect our period-to-period operating results.
Through December 31, 2017, we have incurred approximately $221 million in costs and charges associated with the Transactions, including approximately $82 million for capital expenditures and $25 million related to the complete or partial withdrawal from various multi-employer pension plans. We anticipate that we will incur additional costs and charges associated with the Transactions of approximately $225 million over the five years following the Transactions. We are not able to quantify the exacttotal amount of these costs and charges or the period in which they will be incurred. Some ofincurred as the factorsoperating plans affecting these costs are evolving and most charges relating to the withdrawal from multi-employer pension plans are uncertain. Excluding the multi-employer pension plan withdrawal charges, we currently anticipate that total net costs and charges associated with the Transactions include the resources required in integrating the Unisource business and the xpedx business and the length of time during which transition services are providedwill be approximately $225 to us by International Paper.$250 million through December 31, 2018. The amount and timing of these costs and charges could adversely affect our period-to-period operating results, which could result in a reduction in the market price of shares of our common stock. Moreover, delays in completing the integration may reduce or delay the synergies and other benefits expected from the Transactions and such reduction may be material.
If costs to integrate our IT infrastructure and network systems are more than amounts that have been budgeted, our business, financial condition and results of operations could be adversely affected.
We currently expect to incur additional costs associated with achieving anticipated cost savings and other synergies from the Transactions to be approximately $225.0 million over a five-year period from the Distribution Date, including approximately $55.0 million for capital expenditures, primarily consistingTransactions. Some of these costs will consist of information technology infrastructure, systems integration and planning. The primary areas of spending will be integrating our financial, operational and human resources systems. We expect that a portion of these expenditures will be capitalized. Expenditures in excess of the budgeted amounts on integrationSuch expenditures and other integration costs could adversely affect our business, financial condition and results of operations.
If the Spin-off does not qualify as a tax-free spin-off under Section 355 of the Internal Revenue Code, (the "Code"), including as a result of subsequent acquisitions of stock of International Paper or our company, then International Paper and/or the International Paper shareholders may be required to pay substantial U.S. federal income taxes.
In connection with the Transactions, International Paper received a private letter ruling from the Internal Revenue Service ("IRS") to the effect that the Spin-off and certain related transactions will qualify as tax-free to International Paper and the International Paper shareholders for U.S. federal income tax purposes. Although a private letter ruling from the IRS
generally is binding on the IRS, the IRS ruling does not rule that the Spin-off satisfies every requirement for a tax-free spin-off under Section 355 of the Code, and we and International Paper relied solely on the opinion of counsel for comfort that such additional requirements are satisfied. We also received an opinion of counsel to the effect that the Spin-off will qualify as tax-free to International Paper and the International Paper shareholders. This opinion relied on the IRS ruling as to matters covered by the IRS ruling.
The IRS ruling and such opinion were based on, among other things, certain representations and assumptions as to factual matters made by us, International Paper and UWWH, including assumptions concerning Section 355(e) of the Code as discussed below. The failure of any factual representation or assumption to be true, correct and complete in all material respects could adversely affect the validity of the IRS ruling or such opinion. An opinion of counsel represents counsel’s best legal judgment, is not binding on the IRS or the courts, and the IRS or the courts may not agree with the opinion. In addition, the IRS ruling and such opinion were based on then current law, and cannot be relied upon if current law changes with retroactive effect.
If the Spin-off does not qualify as a tax-free spin-off under Section 355 of the Code, then the receipt of our common stock would be taxable to the International Paper shareholders, International Paper might recognize a substantial gain on the Spin-off, and we may be required to indemnify International Paper for the tax on such gain pursuant to the Tax Matters Agreement we entered into with International Paper in connection with the Spin-off.
In addition, the Spin-off will be taxable to International Paper pursuant to Section 355(e) of the Code if there is a 50% or more change in ownership of either International Paper or our company, directly or indirectly, as part of a plan or series of related transactions that include the Spin-off. Because the International Paper shareholders collectively owned more than 50% of our common stock upon the Merger, the Merger alone will not cause the Spin-off to be taxable to International Paper under Section 355(e) of the Code. However, Section 355(e) of the Code might apply if other acquisitions of stock of International Paper before or after the Merger, or of our company after the Merger, are considered to be part of a plan or series of related transactions that include the Spin-off. If Section 355(e) of the Code applied, then International Paper might recognize a substantial amount of taxable gain, and we may be required to indemnify International Paper for the tax on such gain pursuant to the Tax Matters Agreement.
If the Merger does not qualify as a tax-free reorganization under Section 368(a) of the Code, or if the Subsidiary Merger does not qualify as a transfer of property to Unisource under Section 351(a) of the Code, then we may be required to pay substantial U.S. federal income taxes.
In connection with the Transactions, we received an opinion of counsel to the effect that the Merger will qualify as a tax-free reorganization under Section 368(a) of the Code and UWWH received an opinion of counsel to the effect that the merger of xpedx Intermediate with and into Unisource (the "Subsidiary Merger" and, collectively with the Merger the "Mergers") will qualify as a transfer of property to Unisource under Section 351(a) of the Code. In addition, International Paper received a private letter rulingrulings from the IRS to the effect that the Merger will qualify as a tax-free reorganization under Section 368(a) of the Code and that the Subsidiary Merger will qualify as a transfer of property to Unisource under Section 351(a) of the Code. Although a private letter ruling from the IRS generally is binding on the IRS, the IRS ruling doesrulings do not rule that the Merger satisfies every requirement for a tax-free reorganization under Section 368(a) of the Code, and weor that the Subsidiary Merger satisfies every requirement for a transfer of property to Unisource under Section 351(a) of the Code. The parties involved have each relied on an opinion of counsel for comfort that such additional requirements are satisfied.
The IRS rulingrulings and such opinionopinions were based on, among other things, certain representations and assumptions as to factual matters made by us, International Paper and UWWH. The failure of any factual representation or assumption to be true, correct and complete in all material respects could adversely affect the validity of the respective IRS rulingrulings and such opinion.opinions. An opinion of counsel represents counsel’s best legal judgment, is not binding on the IRS or the courts, and the IRS or the courts may not agree with the opinion. In addition, the IRS rulingrulings and such opinionopinions were based on then current law, and cannot be relied upon if current law changes with retroactive effect.
If the Merger does not qualify as a tax-free reorganization under Section 368(a) of the Code, then UWWH would be considered to have made a taxable sale of its assets to us and we would be required to pay the U.S. federal income tax on the gain, if any, arising from such taxable sale as a result of being the surviving corporation in the Merger.
If the Subsidiary Merger does not qualify as a transfer of property to Unisource under Section 351(a) of the Code, then we may be required to pay substantial U.S. federal income taxes.
In connection with the Transactions, UWWH received an opinion of counsel to the effect that the merger of xpedx Intermediate with and into Unisource (the "Subsidiary Merger" and, collectively with the Merger, the "Mergers") will qualify as a transfer of property to Unisource under Section 351(a) of the Code. In addition, International Paper received a private letter ruling from the IRS to the effect that the Subsidiary Merger will qualify as a transfer of property to Unisource under
Section 351(a) of the Code. Although a private letter ruling from the IRS generally is binding on the IRS, the IRS ruling does not rule that the Subsidiary Merger satisfies every requirement for a transfer of property to Unisource under Section 351(a) of the Code, and the parties relied solely on the opinion of counsel for comfort that such additional requirements are satisfied.
The IRS ruling and such opinion were based on, among other things, certain representations and assumptions as to factual matters made by us, International Paper and UWWH. The failure of any factual representation or assumption to be true, correct and complete in all material respects could adversely affect the validity of the IRS ruling or such opinion. An opinion of counsel represents counsel’s best legal judgment, is not binding on the IRS or the courts, and the IRS or the courts may not agree with the opinion. In addition, the IRS ruling and such opinion were based on then current law, and cannot be relied upon if current law changes with retroactive effect.
If the Subsidiary Merger does not qualify as a transfer of property to Unisource under Section 351(a) of the Code, then we would be considered to have made a taxable sale of the assets of xpedx Intermediate to Unisource, and we may either be required to pay the U.S. federal income tax on such sale or to indemnify International Paper for the U.S. federal income tax on such sale pursuant to the Tax Matters Agreement.
We are generally obligated to pay the UWWH Stockholder an amount equal to 85% of the tax savings arising from pre-Merger net operating loss ("NOL") carryforwards, and our ability to use such NOL carryforwards to offset future taxable income may be subject to limitations, including as a result of an ownership change for Unisource in connection with the Merger under Section 382 of the Code.
Unisource had, and we acquired, substantial NOLs for U.S. federal, state and Canadian income tax purposes. Pursuant to the Tax Receivable Agreement, we are generally obligated to pay the UWWH Stockholder an amount equal to 85% of the U.S. federal, state and Canadian income tax savings, if any, that we actually realize with respect to taxable periods (or portions thereof) beginning after the date of the Merger as a result of the utilization of Unisource’s net operating losses attributable to taxable periods prior to the date of the Merger. The utilization of Unisource’s NOLs, tax credits and other tax attributes depends on the timing and amount of taxable income earned by our company in the future and a lack of future taxable income would adversely affect our ability to utilize these tax attributes. Tax attributes are generally subject to expiration at various times in the future to the extent that they have not previously been applied to offset the taxable income of our company, and there is a risk that our existing NOL carryforwards could expire unused and be unavailable to offset future income tax liabilities. Moreover, the Merger resulted in an ownership change for Unisource under Section 382 of the Code, potentially limiting the use of Unisource’s NOLs to offset future taxable income for both U.S. federal and state income tax purposes. These limitations may affect the timing of when these NOLs may be used which, in turn, may impact the timing and amount of cash taxes payable by our company.
Significant judgment is required in evaluating the need for and magnitude of appropriate valuation allowances against deferred tax assets. The realization of these assets is dependent on generating future taxable income, as well as successful implementation of various tax planning strategies. While we believe that the judgments and estimates with respect to the valuation allowances are appropriate and reasonable under the circumstances, actual results could differ from projected results, which could give rise to additions to valuation allowances or reductions in valuation allowances. It is possible that such changes could have a material adverse effect on the amount of income tax expense (benefit) recorded in our consolidated statement of operations.
We are required to abide by potentially significant restrictions that could limit our ability to undertake certain corporate actions (such as the issuance of common stock or the undertaking of a merger or consolidation) that otherwise could be advantageous.
The Tax Matters Agreement prohibits us from taking actions that could reasonably be expected to cause the Transactions to be taxable. In particular, for two years after the Spin-off we may not:
cease, or permit certain of our wholly owned subsidiaries to cease, the active conduct of a business that was conducted immediately prior to the Spin-off or from holding certain assets held at the time of the Spin-off;
dissolve, liquidate, take any action that is a liquidation for U.S. federal income tax purposes, merge or consolidate with any other person (other than pursuant to the Mergers), or permit certain of our wholly owned subsidiaries from doing any of the foregoing; or
approve or allow an extraordinary contribution to us by our shareholders in exchange for stock, redeem or otherwise repurchase (directly or indirectly) any of our stock, or amend our certificate of incorporation or other organizational
documents, or take any other action, if such amendment or other action would affect the relative voting rights of our capital stock.
Nevertheless, we are permitted to take any of the actions described above if International Paper obtains a supplemental IRS private letter ruling (or, in certain circumstances, an opinion of counsel that is reasonably acceptable to International Paper) to the effect that such action will not affect the tax-free status of the Transactions. Because of these restrictions, for two years after the Spin-off, we may be limited in the amount of capital stock that we can issue to make acquisitions or to raise additional capital.
Risks Relating to Our Common Stock
Our stock price may fluctuate significantly.
The market price of our common stock may fluctuate widely, depending on many factors, some of which may be beyond our control, including:
actual or anticipated fluctuations in the operating results of our company due to factors related to our business;
success or failure of the strategy of our company;
the quarterly or annual earnings of our company, or those of other companies in our industry;
continued industry-wide decrease in demand for paper and related products;
our ability to obtain third-party financing as needed;
announcements by us or our competitors of significant acquisitions or dispositions;
the inability to issue equity securities or convertible debt securities during the two year period following the Distribution Date without jeopardizing the intended tax consequences of the Transactions;
restrictions on our ability to pay dividends under our ABL Facility;
changes in accounting standards, policies, guidance, interpretations or principles;
the operating and stock price performance of other comparable companies;
investor perception of our company;
natural or environmental disasters that investors believe may affect our company;
overall market fluctuations;
a large sale of our stock by a significant shareholder;
results from any material litigation or government investigation;
changes in laws and regulations affecting our company or any of the principal products sold by our company; and
general economic and political conditions and other external factors.
Stock markets in general have experienced volatility that has often been unrelated to the operating performance of a particular company. These broad market fluctuations could adversely affect the trading price of our common stock.
If securities or industry analysts do not continue to publish research, or publish unfavorable research, about our company, our stock price and trading volume could decline.
The trading market for our common stock depends in part on the research and reports that securities or industry analysts publish about us and our business. If the current coverage of our company by securities or industry analysts ceases, the trading price for our stock would be negatively impacted. In addition, if one or more of these analysts downgrades our stock or publishes misleading or unfavorable research about our business, our stock price would likely decline. If one or more of these analysts ceases coverage of our company or fails to publish reports on us regularly, demand for our stock could decrease, which could cause our stock price or trading volume to decline.
A few shareholders may exert significant control over the directionpercentage of our company. Ownershipoutstanding common stock is held by our three largest shareholders, and certain of those shareholders exercise significant influence over matters requiring shareholder approval. So long as a significant percentage of our common stock is highly concentrated ascontinues to be held by a small number of shareholders, the liquidity of our common stock may be impacted, and future sales by those shareholders may result ofin a reduction in the Transactions and could prevent shareholders from influencing significant corporate decisions.
As a result of the Transactions, the UWWH Stockholder, controlled by Bain Capital, beneficially owns approximately 49% of the outstanding sharesmarket price of our common stock.
Our three largest shareholders collectively owned approximately 60% of our outstanding common stock as of December 31, 2017. As a result, the UWWH Stockholder willcertain of these shareholders may exercise significant influence over all matters requiring shareholder approval, for the foreseeable future, including approval of significant corporate transactions, which may reduce the market price of our common stock. TheAdditionally, the interests of the UWWH Stockholderthese shareholders may conflict with the interests of our other shareholders. Our board
This concentrated ownership could also result in a limited amount of directors has adopted corporate governance guidelinesshares being available to be traded in the market, resulting in reduced liquidity. Further, all of the shares of our common stock owned by the UWWH Stockholder are registered for resale under the Securities Act of 1933 (the “Securities Act”) and, subject to certain limitations, all or a portion of such shares may be offered and sold to the public in the future. When some or all of the shares held by the UWWH Stockholder are sold, or if it is perceived that among other things, address potential conflicts between a director’s interests andthey will be sold, the market price of our interests. In addition, we have adoptedcommon stock could decline.
20
a code of business conduct that, among other things, requires our employees to avoid actions or relationships that might conflict or appear to conflict with their job responsibilities or our interests and to disclose their outside activities, financial interests or relationships that may present a possible conflict of interest or the appearance of a conflict to management or corporate counsel. These corporate governance guidelines and code of business ethics do not, by themselves, prohibit transactions with our principal shareholders.
Under our amended and restated certificate of incorporation (our "charter"), the UWWH Stockholder, Bain Capital Fund VII, L.P. and their respective affiliates and, in some circumstances, any of our directors and officers who is also a director, officer, employee, member or partner of the UWWH Stockholder, Bain Capital Fund VII, L.P. and their respective affiliates, have no obligation to offer us corporate opportunities.
The policies relating to corporate opportunities and transactions with the UWWH Stockholder, Bain Capital Fund VII, L.P. and their respective affiliates set forth in our amended and restated certificate of incorporationcharter address potential conflicts of interest between us, on the one hand, and the UWWH Stockholder, Bain Capital Fund VII, L.P., their respective affiliates and their respective officers and directors who are directors or officers of our company, on the other hand. Although these provisions are designed to resolve conflicts between us and the UWWH Stockholder, Bain Capital Fund VII, L.P. and their respective affiliates fairly, conflicts may not be so resolved.
Anti-takeover provisions in our amended and restated certificate of incorporationcharter and amended and restated by-laws (our "by-laws") could discourage, delay or prevent a change of control of our company and may affect the trading price of our common stock.
Our amendedcharter and restated certificate of incorporation and amended and restated by-laws include a number of provisions that may discourage, delay or prevent a change in our management or control over us that shareholders may consider favorable. For example, our amendedcharter and restated certificate of incorporation and amended and restated by-laws collectively:
authorize the issuance of "blank check" preferred stock that could be issued by our board of directors to thwart a takeover attempt;
limit the ability of shareholders to remove directors;
provide that vacancies on our board of directors, including vacancies resulting from an enlargement of our board of directors, may be filled only by a majority vote of directors then in office;
prohibit shareholders from calling special meetings of shareholders unless called by the holders of not less than 20% of our outstanding shares of common stock;
prohibit shareholder action by written consent, unless initiated by the holders of not less than 20% of the outstanding shares of common stock;
establish advance notice requirements for nominations of candidates for election as directors or to bring other business before an annual meeting of our shareholders; and
require the approval of holders of at least a majority of the outstanding shares of our common stock to amend our amended and restated by-laws and certain provisions of our amended and restated certificate of incorporation.charter.
These provisions may prevent our shareholders from receiving the benefit from any premium to the market price of our common stock offered by a bidder in a takeover context. Even in the absence of a takeover attempt, the existence of these provisions may adversely affect the prevailing market price of our common stock if the provisions are viewed as discouraging takeover attempts in the future.
Our amendedcharter and restated certificate of incorporation and amended and restated by-laws may also make it difficult for shareholders to replace or remove our management. These provisions may facilitate management entrenchment that may delay, deter, render more difficult or prevent a change in our control, which may not be in the best interests of our shareholders.
We dohave not intend to payhistorically paid dividends on our common stock and, consequently, your ability to achieve a return on your investment will depend on appreciation in the price of our common stock.
We dohave not intend to declare and payhistorically declared or paid dividends on our common stock for the foreseeable future.stock. We currently intend to invest our future earnings, if any, to fund our growth, to develop our business, for working capital needs, to reduce debt and for general corporate purposes. Therefore, the success of an investment in shares of our common stock will depend upon any future
appreciation in their value. There is no guarantee that shares of our common stock will appreciate in value or even maintain their current value.
Any decision to pay dividends in the future will be at the discretion of Veritiv's Board of Directors and will depend upon various factors then existing, including earnings, financial condition, results of operations, capital requirements, level of indebtedness, restrictions imposed by applicable law, general business conditions and other factors that Veritiv's Board of Directors may deem relevant. In addition, our operations are conducted almost entirely through our subsidiaries. As such, to the extent that we determine in the future to pay dividends on our common stock, none of our subsidiaries will be obligated to make funds available to us for the payment of dividends. Further, the agreements governing our ABL Facility can, and
agreements governing future indebtedness may, in certain circumstances, restrict the ability of our subsidiaries to pay dividends or otherwise transfer assets to us. We are also restricted under the Contribution and Distribution Agreement that we entered into with International Paper in connection with the Spin-off from declaring or paying special dividends through July 1, 2016 (or, in certain circumstances, January 1, 2016). In addition, Delaware law may impose requirements that may restrict our ability to pay dividends to holders of our common stock.
A significant percentage of our outstanding common stock is held by a single shareholder, which could impact your liquidity, and future sales of our common stock by this shareholder may lower our stock price.
As noted above, the UWWH Stockholder, which is jointly owned by Bain Capital and Georgia-Pacific, currently owns 7,840,000 shares, or 49%, of our common stock. Continuation of this concentrated ownership could result in a limited amount of shares being available to be traded in the market, resulting in reduced liquidity.
The shares held by the UWWH Stockholder are restricted securities within the meaning of Rule 144 under the Securities Act of 1933 (the “Securities Act”) and are eligible for resale in the public market without registration subject to volume, manner of sale and holding period limitations under Rule 144 under the Securities Act. Further, pursuant to the Registration Rights Agreement, dated as of July 1, 2014, between the UWWH Stockholder and the Company, all of the shares of our common stock owned by the UWWH Stockholder are now eligible to be registered under the Securities Act, subject to certain limitations set forth in the Registration Rights Agreement, and may be offered and sold to the public now or in the future. If and when some or all of these shares are sold, or if it is perceived that they will be sold, the market price of our common stock could decline.
Our amended and restated certificate of incorporationcharter designates the Court of Chancery of the State of Delaware as the exclusive forum for certain litigation that may be initiated by our shareholders, which could limit our shareholders’ ability to obtain a favorable judicial forum for disputes with us.
Our amended and restated certificate of incorporationcharter provides that the Court of Chancery of the State of Delaware is the sole and exclusive forum for (i) any derivative action or proceeding brought on our behalf, (ii) any action asserting a claim of breach of a fiduciary duty owed to us or our shareholders by any of our directors, officers, employees or agents, (iii) any action asserting a claim against us arising under the Delaware General Corporation Law or (iv) any action asserting a claim against us that is governed by the internal affairs doctrine. The choice of forum provision in our amended and restated certificate of incorporationcharter may limit our shareholders’ ability to obtain a favorable judicial forum for disputes with us.
ITEM 1B. UNRESOLVED STAFF COMMENTS
Not applicable.None.
ITEM 2. PROPERTIES
As of December 31, 2014, our corporate office operations were split between our offices in Norcross, Georgia and Loveland, Ohio. In December 2014, we announced our plans to relocate our principal executive offices to 400 Northpark Town Center in Atlanta, Georgia.
As of December 31, 2014,2017, we had a distribution network of more than 180operating from approximately 170 distribution centers, of which approximately 160 were leased and 20 were owned. Our leased locations comprise approximately 19.7 million square feet while our owned locations comprise approximately 2.7 million square feet.centers.
|
| | | | | | | | |
| | Leased | | Owned | | Total |
| Properties | 160 |
| | 10 |
| | 170 |
|
| Square feet (in millions) | 18.1 |
| | 1.3 |
| | 19.4 |
|
These facilities are strategically located throughout the U.S., Canada and Mexico in order to efficiently serve our customer base in the surrounding areas while also facilitating expedited delivery services for special orders. We continually evaluate location, size and attributes to maximize efficiency, deliver top quality customer service and achieve economies of scale.
The Company also leases various office spaces for corporate and sales functions.
ITEM 3. LEGAL PROCEEDINGS
From time to time, the Company is involved in various lawsuits, claims, and regulatory and administrative proceedings arising out of its business relating to general commercial and contractual matters, governmental regulations, intellectual property rights, labor and employment matters, tax and other actions.
Although the ultimate outcome of any legal proceeding or investigation cannot be predicted with certainty, based on present information, including the Company's assessment of the merits of the particular claim, the Company does not expect that any asserted or unasserted legal claims or proceedings, individually or in the aggregate, will have a material adverse effect on its cash flow, results of operations or financial condition.
ITEM 4. MINE SAFETY DISCLOSURES
Not applicable.
PART II
ITEM 5. MARKET FOR REGISTRANT'S COMMON EQUITY, RELATED STOCKHOLDER MATTERS AND ISSUER PURCHASES OF EQUITY SECURITIES
Veritiv's common stock is publicly traded on the New York Stock Exchange ("NYSE") under the symbol VRTV. A "when-issued" trading market for Veritiv's common stock began on the NYSE on June 18, 2014, and "regular-way" trading of Veritiv's common stock began on July 2, 2014. As of March 16, 2015,February 23, 2018, there were 7,0485,904 shareholders of record. The number of record holders does not include shareholders who are beneficial owners, but whose shares are held in street name by brokers and other nominees.
The following table sets forth, for the quarterly reporting periods indicated, the high and low market prices per share for the Company's common stock, as reported on the NYSE.
|
| | | | | | | |
| | 2014 |
| | 3rd Quarter | | 4th Quarter |
| High | $ | 53.21 |
| | $ | 52.23 |
|
| Low | $ | 31.94 |
| | $ | 40.93 |
|
|
| | | | | | | | | | | | | | | | |
| | | 2017 | | 2016 |
| | | High | | Low | | High | | Low |
| 1st Quarter | | $ | 62.60 |
| | $ | 48.95 |
| | $ | 39.23 |
| | $ | 27.44 |
|
| 2nd Quarter | | $ | 53.25 |
| | $ | 39.30 |
| | $ | 42.25 |
| | $ | 34.10 |
|
| 3rd Quarter | | $ | 45.40 |
| | $ | 26.85 |
| | $ | 52.49 |
| | $ | 37.05 |
|
| 4th Quarter | | $ | 33.70 |
| | $ | 20.35 |
| | $ | 56.70 |
| | $ | 43.00 |
|
Veritiv doeshas not intend to declare and payhistorically paid dividends on its common stock for the foreseeable future.stock. The Company currently intends to invest its future earnings, if any, to fund its growth, to develop its business, for working capital needs, to reduce debt and for general
corporate purposes. Any payment of dividends will be at the discretion of Veritiv's boardBoard of directorsDirectors and will depend upon various factors then existing, including earnings, financial condition, results of operations, capital requirements, level of indebtedness, contractual restrictions with respect to payment of dividends, restrictions imposed by applicable law, general business conditions and other factors that Veritiv's boardBoard of directorsDirectors may deem relevant.
On November 23, 2016, the UWWH Stockholder, one of Veritiv's existing stockholders and the former parent company of Unisource Worldwide, Inc., sold 1.76 million shares of Veritiv common stock in an underwritten public offering. Concurrently with the closing of the offering, Veritiv repurchased 0.31 million of these offered shares from the underwriters at a price of $42.8625 per share, which is the price at which the underwriters purchased such shares from the selling stockholder, for an aggregate purchase price of approximately $13.4 million. The Company may repurchase additional shares in the future, however, there is currently no share repurchase authorization plan approved by the Company's Board of Directors.
On March 22, 2017, the UWWH Stockholder sold 1.80 million shares of Veritiv common stock in a block trade. The Company did not sell or repurchase any shares and did not receive any of the proceeds.
The UWWH Stockholder beneficially owned 4,283,840 shares of Veritiv's outstanding common stock as of December 31, 2017.
Performance Graph
The following graph provides a comparison of the cumulative shareholder return on the Company's common stock to the returns of the Russell 2000 Index and the average performance of a group consisting of the Company's peer companies (the "Peer Group") based on total shareholder return from June 18, 2014 (the first day ourVeritiv's common stock began "when-issued" trading on the NYSE) through December 31, 2014.2017. Companies included in the Peer Group are as follows:
|
| | | | | |
| • | Anixter International Inc. | • | Graphic Packaging HoldingGenuine Parts Company | • | Resolute Forest Products Inc. |
| • | Applied Industrial Technologies, Inc. | • | InnerWorkings Inc.Graphic Packaging Holding Company | • | Rock-Tenn CompanyScanSource, Inc. |
| • | Arrow Electronics, Inc. | • | International PaperInnerWorkings Inc. | • | ScanSource, Inc.Sealed Air Corporation |
| • | Avery Dennison Corporation | • | International Paper Company | • | Sonoco Products Company |
| • | Avnet, Inc. | • | Kaman Corporation | • | Sealed Air CorporationStaples, Inc. |
| • | Avnet,Bemis Company, Inc. | • | KapStone Paper and Packaging Corporation | • | Sonoco Products Co. |
• | Bemis Company, Inc. | • | MeadWestvaco Corporation | • | Staples,W.W. Grainger, Inc. |
| • | Brady Corporation | • | MSC Industrial Direct Co. Inc. | • | United StationersWESCO International Inc. |
| • | Deluxe Corporation | • | Neenah Paper, Inc. | • | W.W. Grainger, Inc.WestRock Company |
| • | Domtar Corporation | • | Office Depot, Inc. | • | Wausau Paper Corporation |
| • | Ennis Inc. | • | Packaging Corporation of America | • | WESCO International Inc. |
| • | Fastenal CompanyEssendant Inc. | • | PH Glatfelter Co.Company | | |
| • | Genuine PartsFastenal Company | • | R.R. Donnelley & Sons Company | | |
The graph is not, and is not intended to be, indicative of future performance of our common stock. The graph assumes $100 invested on June 18, 2014 in the Company, the Russell 2000 Index and the Peer Group. Total return indices reflect reinvestment of dividends and are weighted on the basis of market capitalization at the time of each reported data point.
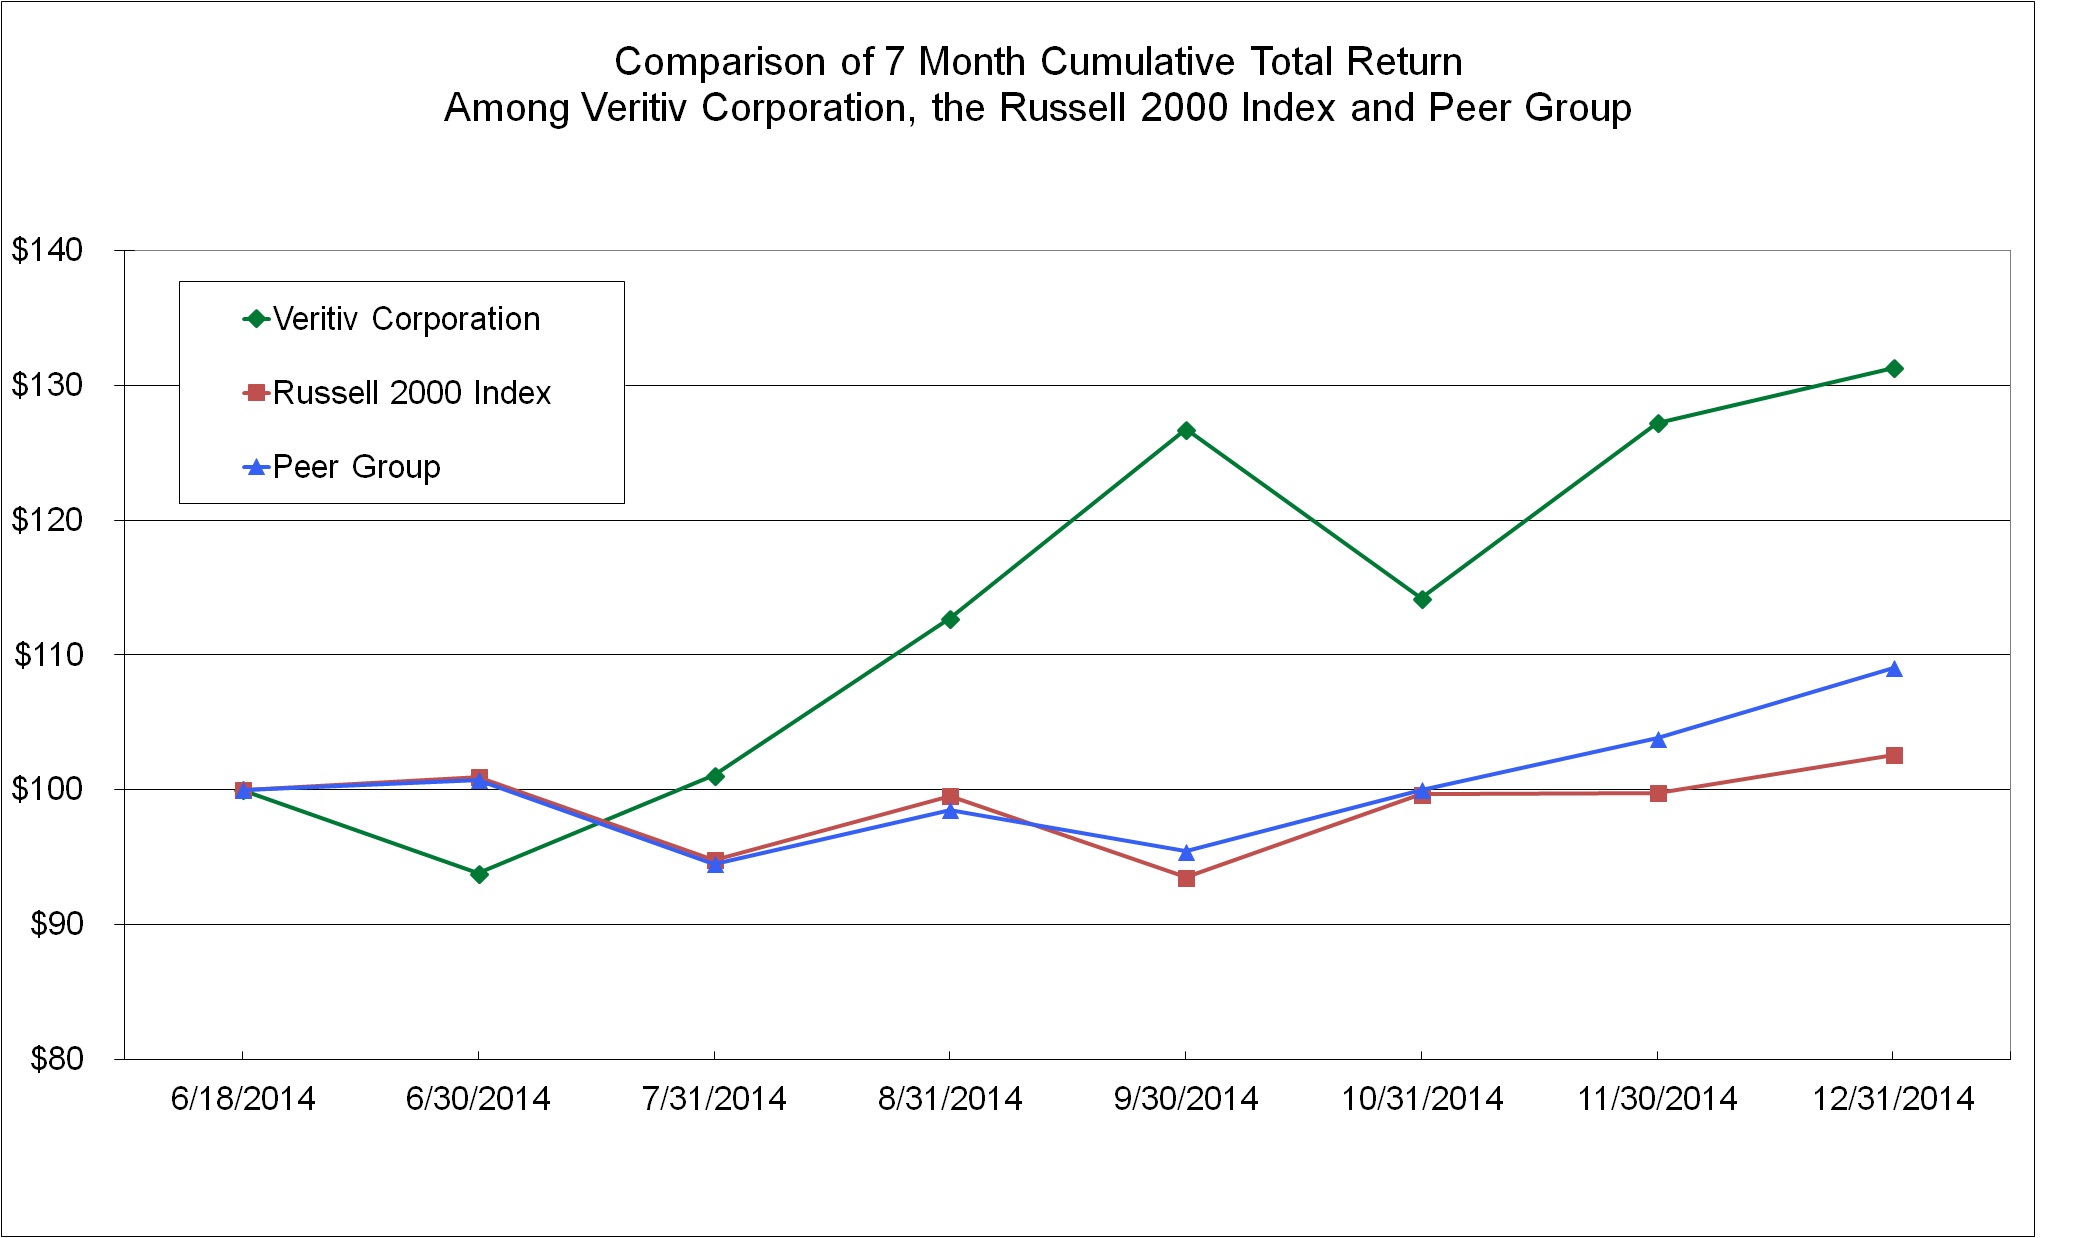
ITEM 6. SELECTED FINANCIAL DATA
The following table presents the selected historical consolidated and combined financial data for Veritiv and should be read in conjunction with Item 7 of this report and the audited Consolidated and Combined Financial Statements and notes thereto contained in Item 8 of this report. The Consolidated Statements of Operations data for the years ended December 31, 2017, 2016 and 2015 and the Consolidated Balance Sheets data as of December 31, 2017 and 2016 set forth below are derived from the audited Consolidated Financial Statements included in Item 8 of this report.
The Consolidated and Combined Statement of Operations data for each of the yearsyear ended December 31, 2014 2013 and 2012 and the Consolidated and Combined Balance Sheet data as of December 31, 2014 and 2013 set forth below areis derived from theVeritiv's audited Consolidated and Combined Financial Statements included in Item 8 of this report.
The Combined Statement of Operations data for the years ended December 31, 2011 and 20102014 and the CombinedConsolidated Balance SheetSheets data as of December 31, 20122015 and 20112014 are derived from xpedx'sVeritiv's audited combinedConsolidated Financial Statements for 2015. These financial statements which are not included in this report. The Combined Statements of Operations data for the year ended December 31, 2013 and the Combined Balance SheetSheets data as of December 31, 2010 is2013 are derived from xpedx's unaudited condensed combined financial informationaudited Combined Financial Statements for 2013 which isare not included in this report.
The financial information may not be indicative of Veritiv's future performance and the financial information presented for the years prior to 2015 does not necessarily reflect what the financial positioncondition and results of operations would have been had Veritiv operated as a separate, stand-alone entity during the periods presented.those periods.
| | | (in millions, except per share data) | As of and for the Year Ended December 31, | As of and for the Year Ended December 31, |
| Statement of Operations Data | 2014(1) | | 2013 | | 2012 | | 2011 | | 2010 | |
| Statements of Operations Data | | 2017 | | 2016 | | 2015 | | 2014(1) | | 2013 |
| Net sales | $ | 7,406.5 |
| | $ | 5,652.4 |
| | $ | 6,012.0 |
| | $ | 6,509.2 |
| | $ | 6,625.1 |
| $ | 8,364.7 |
| | $ | 8,326.6 |
| | $ | 8,717.7 |
| | $ | 7,406.5 |
| | $ | 5,652.4 |
|
| Cost of products sold | 6,180.9 |
| | 4,736.8 |
| | 5,036.7 |
| | 5,475.3 |
| | 5,585.9 |
| 6,846.6 |
| | 6,826.4 |
| | 7,160.3 |
| | 6,180.9 |
| | 4,736.8 |
|
| Distribution expenses | 426.2 |
| | 314.2 |
| | 324.0 |
| | 324.5 |
| | 316.7 |
| 516.9 |
| | 505.1 |
| | 521.8 |
| | 426.2 |
| | 314.2 |
|
| Selling and administrative expenses | 689.1 |
| | 548.2 |
| | 580.6 |
| | 598.7 |
| | 635.8 |
| 872.6 |
| | 826.2 |
| | 853.9 |
| | 689.1 |
| | 548.2 |
|
| Depreciation and amortization | 37.6 |
| | 17.1 |
| | 14.0 |
| | 15.6 |
| | 14.7 |
| 54.2 |
| | 54.7 |
| | 56.9 |
| | 37.6 |
| | 17.1 |
|
| Merger and integration expenses | 75.1 |
| | — |
| | — |
| | — |
| | — |
| |
| Restructuring charges | 4.0 |
| | 37.9 |
| | 35.1 |
| | 43.6 |
| | — |
| |
| Acquisition, integration and merger expenses | | 36.5 |
| | 25.9 |
| | 34.9 |
| | 75.1 |
| | — |
|
| Restructuring charges, net | | 16.7 |
| | 12.4 |
| | 11.3 |
| | 4.0 |
| | 37.9 |
|
| Operating income (loss) | (6.4 | ) | | (1.8 | ) | | 21.6 |
| | 51.5 |
| | 72.0 |
| 21.2 |
| | 75.9 |
| | 78.6 |
| | (6.4 | ) | | (1.8 | ) |
| Income tax expense (benefit) | (2.1 | ) | | 0.4 |
| | 9.1 |
| | 21.2 |
| | 33.0 |
| 11.4 |
| | 19.8 |
| | 18.2 |
| | (2.1 | ) | | 0.4 |
|
| Income (loss) from continuing operations | (19.5 | ) | | (0.0 | ) | | 14.4 |
| | 35.5 |
| | 47.7 |
| (13.3 | ) | | 21.0 |
| | 26.7 |
| | (19.5 | ) | | 0.0 |
|
| Income (loss) from discontinued operations, net of income taxes | (0.1 | ) | | 0.2 |
| | (10.0 | ) | | (13.6 | ) | | (9.1 | ) | — |
| | — |
| | — |
| | (0.1 | ) | | 0.2 |
|
| Net income (loss) | $ | (19.6 | ) | | $ | 0.2 |
| | $ | 4.4 |
| | $ | 21.9 |
| | $ | 38.6 |
| (13.3 | ) | | 21.0 |
| | 26.7 |
| | (19.6 | ) | | 0.2 |
|
| | | | | | | | | | | | | | | | | | | |
Earnings (loss) per share(2): | | | | | | | | | | | | | | | | | | |
| Basic and diluted | | | | | | | | | | |
| Basic | | | | | | | | | | |
| Continuing operations | $ | (1.61 | ) | | $ | (0.00 | ) | | $ | 1.76 |
| | $ | 4.35 |
| | $ | 5.85 |
| $ | (0.85 | ) | | $ | 1.31 |
| | $ | 1.67 |
| | $ | (1.61 | ) | | $ | 0.00 |
|
| Discontinued operations | (0.01 | ) | | 0.02 |
| | (1.23 | ) | | (1.67 | ) | | (1.12 | ) | — |
| | — |
| | — |
| | (0.01 | ) | | 0.02 |
|
| Basic and diluted earnings (loss) per share | $ | (1.62 | ) | | $ | 0.02 |
| | $ | 0.53 |
| | $ | 2.68 |
| | $ | 4.73 |
| |
| Balance Sheet Data (at period end) | | | | | | | | | | |
| Basic earnings (loss) per share | | $ | (0.85 | ) | | $ | 1.31 |
| | $ | 1.67 |
| | $ | (1.62 | ) | | $ | 0.02 |
|
| | | | | | | | | | | |
| Diluted | | | | | | | | | | |
| Continuing operations | | $ | (0.85 | ) | | $ | 1.30 |
| | $ | 1.67 |
| | $ | (1.61 | ) | | $ | 0.00 |
|
| Discontinued operations | | — |
| | — |
| | — |
| | (0.01 | ) | | 0.02 |
|
| Diluted earnings (loss) per share | | $ | (0.85 | ) | | $ | 1.30 |
| | $ | 1.67 |
| | $ | (1.62 | ) | | $ | 0.02 |
|
| | | | | | | | | | | |
| Balance Sheets Data (at period end) | | | | | | | | | | |
| Accounts receivable, net | $ | 1,115.1 |
| | $ | 669.7 |
| | $ | 680.6 |
| | $ | 731.7 |
| | $ | 796.8 |
| $ | 1,174.3 |
| | $ | 1,048.3 |
| | $ | 1,037.5 |
| | $ | 1,115.1 |
| | $ | 669.7 |
|
| Inventories | 673.2 |
| | 360.9 |
| | 373.4 |
| | 387.2 |
| | 447.5 |
| 722.7 |
| | 707.9 |
| | 720.6 |
| | 673.2 |
| | 360.9 |
|
| Total assets | 2,574.5 |
| | 1,256.9 |
| | 1,307.9 |
| | 1,379.7 |
| | 1,516.1 |
| 2,708.4 |
| | 2,483.7 |
| | 2,476.9 |
| | 2,574.5 |
| | 1,256.9 |
|
| Long-term debt, net of current maturities | 855.0 |
| | — |
| | — |
| | — |
| | — |
| 908.3 |
| | 749.2 |
| | 800.5 |
| | 855.0 |
| | — |
|
| Financing obligations to related party, less current portion | 212.4 |
| | — |
| | — |
| | — |
| | — |
| |
| Financing obligations, less current portion | | 181.6 |
| | 176.1 |
| | 197.8 |
| | 212.4 |
| | — |
|
| Defined benefit pension obligations | 36.3 |
| | — |
| | — |
| | — |
| | — |
| 24.4 |
| | 27.6 |
| | 28.7 |
| | 36.3 |
| | — |
|
| Other non-current liabilities | 107.2 |
| | 12.5 |
| | 16.9 |
| | 16.4 |
| | 14.1 |
| 137.0 |
| | 121.2 |
| | 105.6 |
| | 107.2 |
| | 12.5 |
|
(1) Includes the operating results of Unisource for the six months ended December 31, 2014.
(2) See Note 1213 of the Notes to the Consolidated and Combined Financial Statements for discussion onabout the shares of common stock utilized in the computation of basic and diluted earnings per share.share for the years ended December 31, 2017, 2016 and 2015.
ITEM 7. MANAGEMENT’S DISCUSSION AND ANALYSIS OF FINANCIAL CONDITION AND RESULTS OF OPERATIONS
The following discussion of the Company’s results of operations and financial condition should be read in conjunction with the Consolidated and Combined Financial Statements and Notes thereto, included elsewhere in this report. The financial information discussed below and included in this report as of December 31, 2013 and for the years ended December 31, 2013 and 2012 may not necessarily reflect what xpedx's financial condition, results of operations or cash flows would have been had xpedx been a stand-alone company during this period or what xpedx's financial condition, results of operations and cash flows may be in the future.
References in the Consolidated and Combined Financial Statements to "International Paper" or "Parent" refer to International Paper Company.
Executive Overview
Business Overview
Veritiv Corporation ("Veritiv" or the "Company") is a leading North American business-to-business distributor of print, publishing, packaging, facility solutions, print and publishing products and services. Additionally, Veritiv provides logistics solutions. Establishedand supply chain management solutions to its customers. On August 31, 2017, Veritiv completed its acquisition of 100% of the equity interest in 2014, following the merger of International Paper's xpedx division ("xpedx") and UWW Holdings, Inc. ("UWWH"various All American Containers entities (collectively, "AAC"), thea family owned and operated distributor of rigid packaging, including plastic, glass and metal containers, caps, closures and plastic pouches. The Company operates from more than 180approximately 170 distribution centers primarily throughout the U.S., Canada and Mexico.
xpedx was a business-to-business distributor of paper, publishing, packaging and facility supplies products in North America that operated in the U.S. and Mexico. xpedx distributed products and services to various customer markets, including printers, publishers, data centers, manufacturers, higher education institutions, healthcare facilities, sporting and performance arenas, retail stores, government agencies, property managers and building service contractors.
UWWH, operating through Unisource Worldwide, Inc. and its other consolidated subsidiaries (collectively, "Unisource"), was a distributor of printing and business paper, publishing solutions, packaging supplies and equipment, facility supplies and equipment and logistics services that operated primarily in the U.S. and Canada. Unisource sold its products to a diverse customer base that included the commercial printing, retail, hospitality, healthcare, governmental, distribution and manufacturing sectors.
Veritiv's business is organized under four reportable segments: Packaging, Facility Solutions, Print, and Publishing Packaging and Facility Solutions. During 2014, the Company realigned and expanded its reportable segments to include a new Publishing segment.Print Management ("Publishing"). This realignment followed the Company’s merger with Unisource in the third quarter of 2014. This new segment structure is consistent with the way the Chief Operating Decision Maker, nowwho is Veritiv's Chief Executive Officer, makes operating decisions and manages the growth and profitability of the Company’s business. As a result of the change in segment reporting, all historical financial information has been revised to conform to the new presentation. The following summary describes the products and services offered in each of the segments:
Packaging – The Packaging segment provides standard as well as custom and comprehensive packaging solutions for customers based in North America and in key global markets. The business is strategically focused on higher growth industries including light industrial/general manufacturing, food production, fulfillment and internet retail, as well as niche verticals based on geographical and functional expertise. Veritiv’s packaging professionals create customer value through supply chain solutions, structural and graphic packaging design and engineering, automation, workflow and equipment services and kitting and fulfillment.
Facility Solutions – The Facility Solutions segment sources and sells cleaning, break-room and other supplies such as towels, tissues, wipers and dispensers, can liners, commercial cleaning chemicals, soaps and sanitizers, sanitary maintenance supplies and equipment, safety and hazard supplies, and shampoos and amenities primarily in the U.S., Canada and Mexico. Veritiv is a leading distributor in the Facility Solutions segment. Through this segment we manage a world class network of leading suppliers in most facilities solutions categories. Additionally, we offer total cost of ownership solutions with re-merchandising, budgeting and compliance reporting, inventory management, and a sales-force trained to bring leading vertical expertise to the major North American geographies.
Print – The Print segment sells and distributes commercial printing, writing, copying, digital, wide format and specialty paper products, graphics consumables and graphics equipment primarily in the U.S., Canada and Mexico. This segment also includes customized paper conversion services of commercial printing paper for distribution to document centers and form printers. OurThe Company's broad geographic platform of operations coupled with the breadth of paper and graphics products, including ourits exclusive private brand offerings, provides a foundation to service national, regional and local customers across North America.
Publishing – The Publishing segment sells and distributes coated and uncoated commercial printing papers to publishers, retailers, converters, printers and specialty businesses for use in magazines, catalogs, books, directories, gaming, couponing, retail inserts and direct mail. This segment also provides print management, procurement and supply chain management solutions to simplify paper and print procurement processes for its customers.
Packaging – The Packaging segment provides standard as well as custom and comprehensive packaging solutions for customers based in North America and in key global markets. The business is strategically focused on higher growth industries including light industrial/general manufacturing, food processing and manufacturing, fulfillment and internet retail, as well as niche verticals based on geographical and functional expertise. Veritiv’s packaging
professionals create customer value through supply chain solutions, structural and graphic packaging design and engineering, automation, workflow and equipment services, contract packaging, and kitting and fulfillment.
Facility Solutions – The Facility Solutions segment sources and sells cleaning, break-room and other supplies such as towels, tissues, wipers and dispensers, can liners, commercial cleaning chemicals, soaps and sanitizers, sanitary maintenance supplies and equipment, safety and hazard supplies, and shampoos and amenities primarily in the U.S., Canada and Mexico. Veritiv is a leading distributor in the Facility Solutions segment. We offer a world class network of leading suppliers in all categories; total cost of ownership solutions with re-merchandising, budgeting and compliance, inventory management, and consistent multi-local supply solutions; and a sales-force trained to bring leading vertical expertise to all of the major North American geographies.
The Company also has a Corporate & Other category which includes certain assets and costs not primarily attributable to any of the reportable segments, as well as ourits Veritiv Logistics Solutionslogistics solutions business which provides transportation and warehousing solutions.
The Spin-off and Merger
On July 1, 2014 (the "Distribution Date")Results of Operations, Including Business Segments
The following discussion compares the consolidated operating results of Veritiv for the years ended December 31, 2017, 2016 and 2015.
Comparison of the Years Ended December 31, 2017, 2016 and 2015 |
| | | | | | | | | | | | | | | | | |
| | Year Ended December 31, | | 2017 vs. 2016 | | 2016 vs. 2015 |
| (in millions) | 2017 | | 2016 | | 2015 | | Increase (Decrease) % | | Increase (Decrease) % |
| Net sales | $ | 8,364.7 |
| | $ | 8,326.6 |
| | $ | 8,717.7 |
| | 0.5 | % | | (4.5 | )% |
| Cost of products sold (exclusive of depreciation and amortization shown separately below) | 6,846.6 |
| | 6,826.4 |
| | 7,160.3 |
| | 0.3 | % | | (4.7 | )% |
| Distribution expenses | 516.9 |
| | 505.1 |
| | 521.8 |
| | 2.3 | % | | (3.2 | )% |
| Selling and administrative expenses | 872.6 |
| | 826.2 |
| | 853.9 |
| | 5.6 | % | | (3.2 | )% |
| Depreciation and amortization | 54.2 |
| | 54.7 |
| | 56.9 |
| | (0.9 | )% | | (3.9 | )% |
| Acquisition and integration expenses | 36.5 |
| | 25.9 |
| | 34.9 |
| | 40.9 | % | | (25.8 | )% |
| Restructuring charges, net | 16.7 |
| | 12.4 |
| | 11.3 |
| | 34.7 | % | | 9.7 | % |
| Operating income | 21.2 |
| | 75.9 |
| | 78.6 |
| | (72.1 | )% | | (3.4 | )% |
| Interest expense, net | 31.2 |
| | 27.5 |
| | 27.0 |
| | 13.5 | % | | 1.9 | % |
| Other (income) expense, net | (8.1 | ) | | 7.6 |
| | 6.7 |
| | (206.6 | )% | | 13.4 | % |
| Income (loss) before income taxes | (1.9 | ) | | 40.8 |
| | 44.9 |
| | (104.7 | )% | | (9.1 | )% |
| Income tax expense | 11.4 |
| | 19.8 |
| | 18.2 |
| | (42.4 | )% | | 8.8 | % |
| Net income (loss) | $ | (13.3 | ) | | $ | 21.0 |
| | $ | 26.7 |
| | (163.3 | )% | | (21.3 | )% |
Net Sales
2017 compared to 2016:Net sales increased by $38.1 million, or 0.5%, International Paper completed the previously announced spin-off of xpedxprimarily due to the International Paper shareholders (the "Spin-off")incremental net sales of $71.7 million resulting from the AAC acquisition. Increases in net sales in the Packaging and Facility Solutions segments as well as Veritiv's logistics solutions business were offset by declines in the Print and Publishing segments. See the “Segment Results” section for additional discussion.
2016 compared to 2015:Net sales declined by $391.1 million, or 4.5%, forming a new public company called Veritiv. Immediately followingprimarily due to declines in the Spin-off, UWWH merged withPrint and into Veritiv (the "Merger"). PriorPublishing segments. See the “Segment Results” section for additional discussion.
Cost of Products Sold (exclusive of depreciation and amortization shown separately below)
2017 compared to 2016: Cost of products sold increased by $20.2 million, or 0.3%, due to the growth in net sales as previously discussed. See the “Segment Results” section for additional discussion.
2016 compared to 2015: Cost of products sold decreased by $333.9 million, or 4.7%, primarily due to the decline in net sales as previously discussed. See the “Segment Results” section for additional discussion.
Distribution Date, Veritiv’sExpenses
2017 compared to 2016: Distribution expenses increased by $11.8 million or 2.3%. Distribution expenses increased $12.2 million from an increase in freight and logistics expenses, primarily due to increased third-party freight, transfer expenses and diesel fuel prices and $4.9 million related to the AAC acquisition. These increases were partially offset by (i) a $1.7 million decrease in facilities rent and other related expenses, (ii) a $1.5 million decrease in insurance expense and (iii) a $1.6 million decrease in personnel expenses as well as maintenance and material expense. The offsetting decreases were primarily driven by warehouse consolidations.
2016 compared to 2015: Distribution expenses decreased by $16.7 million or 3.2%. The decline was primarily due to (i) a $6.3 million decrease in facilities expenses due primarily to warehouse consolidations, (ii) a $5.9 million decrease in personnel costs due primarily to reductions in temporary employee expense and (iii) a $5.3 million decrease in vehicle operating expenses primarily driven by reductions in third-party freight expense and fuel.
Selling and Administrative Expenses
2017 compared to 2016: Selling and administrative expenses increased by $46.4 million or 5.6%. The increase was primarily attributed to (i) an $18.8 million increase in personnel expenses, (ii) a $13.3 million increase in bad debt expense and (iii) a $9.3 million increase related to the AAC acquisition. The increase in personnel expenses was primarily driven by an increase in headcount to support the Company's growth strategy as well as lower commissions in 2016 due to the recovery of commission advances, discussed below. The increase in bad debt expense was primarily due to additional reserves related to certain customers with declining financial position, resultsconditions during 2017 combined with favorable collections experience in 2016. Selling and administrative expenses also included $8.4 million of impairment charges related to the impairment of the logistics solutions business goodwill and customer relationship intangible asset.
2016 compared to 2015: Selling and administrative expenses decreased by $27.7 million or 3.2%. The decrease was primarily attributed to (i) an $11.2 million decrease in commission expense due in part to lower net sales volume and (ii) a $13.6 million decrease in incentive compensation. In 2013, xpedx advanced funds to commissioned sales representatives to compensate them for a change in the timing of commission payments. During 2016, the Company recovered $6.0 million of those advances, which further reduced commission expense. These decreases were partially offset by $5.8 million of impairment charges attributable to the Print and Publishing segments' customer relationship intangible assets.
Depreciation and Amortization
2017 compared to 2016: Depreciation and amortization expense decreased $0.5 million.
2016 compared to 2015: Depreciation and amortization expense decreased $2.2 million primarily due to $2.4 million of amortization for intangible assets acquired in the Merger that were fully amortized as of June 30, 2015.
Acquisition and Integration Expenses
During the years ended December 31, 2017, 2016 and 2015, Veritiv incurred costs and charges to integrate its combined businesses. Integration expenses include internally dedicated integration management resources, retention compensation, information technology conversion costs, rebranding, professional services and other costs to integrate its businesses. Veritiv incurred acquisition and integration expenses of $8.0 million in 2017 related to the acquisition of AAC.
See Note 3 of the Notes to Consolidated Financial Statements for a breakdown of these costs. Restructuring Charges, Net
Restructuring charges, net relates primarily to Veritiv's restructuring of its North American operations intended to integrate the legacy xpedx and cash flows consistedUnisource operations, generate cost savings and capture synergies across the combined company. Restructuring charges, net includes net gains related to the sale or exit of onlycertain facilities totaling $24.4 million and $2.1 million for the xpedx business of International Paperyears ended December 31, 2017 and have been derived2016, respectively, and a $4.1 million net non-cash loss from International Paper’s historical accounting records. The financial results of xpedx have been presented on a carve-out basis through the Distribution Date, while the financial results for Veritiv, post Spin-off, are prepared on a stand-alone basis. As such, the Consolidated and Combined Statements of Operations, Consolidated and Combined Statements of Comprehensive Income (Loss) and Consolidated and Combined Statements of Cash Flowsasset impairments for the year ended December 31, 2014 consist of:2015. See Note 3 of the Notes to Consolidated Financial Statements for additional details. The Company may continue to record restructuring charges in the future as these activities progress, which may include gains or losses from the disposition of assets. Interest Expense, Net
Interest expense, net in 2017 consisted of (i) $25.5 million of interest expense on the Company’s asset-based lending facility (the “ABL Facility”), (ii) $2.6 million for amortization of deferred financing costs related to the ABL Facility and (iii) $3.1 million in miscellaneous interest expense. Interest expense, net in 2017 increased $ 3.7 million. Interest expense increased due to (i) an increased average balance on the ABL Facility and (ii) increased interest rates. See Note 5 of the Notes to Consolidated Financial Statements for information related to the ABL Facility. The increased average balance and interest rates on the ABL Facility were primarily due to the acquisition of AAC on August 31, 2017. See Note 2 of the Notes to Consolidated Financial Statements for additional details. Interest expense, net in 2016 consisted of (i) $18.6 million of interest expense on the ABL Facility, (ii) $5.6 million for amortization of deferred financing costs related to the ABL Facility and (iii) $3.3 million in miscellaneous interest expense. The increase in 2016 was due primarily to an additional $1.9 million of deferred financing cost amortization resulting from an amendment to the ABL Facility. This increase was offset by lower miscellaneous interest expense.
Interest expense, net in 2015 consisted of (i) $18.7 million of interest expense on the combined resultsABL Facility, (ii) $4.4 million for amortization of operations of xpedx fordeferred financing costs related to the six months ended June 30, 2014 on a carve-out basis,ABL Facility and (iii) $3.9 million in miscellaneous interest expense.
the consolidated results of Veritiv on a stand-alone basis for the six months ended December 31, 2014.Other (Income) Expense, Net
| |
| • | 2017 compared to 2016: Other (income) expense, net was income of $8.1 million in 2017 compared to expense of $7.6 million in 2016. The $15.7 million change is primarily the result of the Tax Cuts and Jobs Act (the "Tax Act") which lowered the U.S. corporate federal tax rate, from 35% to 21%. The lower rate reduced the value of the Tax Receivable Agreement liability by $13.5 million which was recorded as other income in the fourth quarter of 2017. See Note 8 of the Notes to Consolidated Financial Statements for additional details regarding the Tax Act. |
The combined financial statements as of December 31, 20132016 compared to 2015: Other (income) expense, net increased $0.9 million compared to 2015. This increase was primarily driven by higher expenses associated with the Tax Receivable Agreement and a loss on debt extinguishment that were partially offset by lower expenses associated with foreign currency losses in 2016 compared to 2015.
Effective Tax Rate
Veritiv's effective tax rates were (600.0)%, 48.5% and 40.5% for the years ended December 31, 20132017, 2016 and 2012 consist entirely2015 respectively. The Company’s effective tax rate for the year ended December 31, 2017 is impacted by a near break-even pre-tax book loss in combination with the impact of the combined resultsfollowing discrete items:
| |
| • | A $30.2 million expense in connection with our provisional estimate of the impact of the Tax Act, including $23.0 million for the remeasurement of our deferred taxes and $7.2 million for the one-time transition tax. See Note 8 of the Notes to Consolidated Financial Statements for additional details regarding the Tax Act. |
A $13.4 million benefit for the reversal of xpedxthe valuation allowance on the deferred tax assets of the Company’s Canadian subsidiary. The reversal reflects the Company’s cumulative recent income and improved expectation of future taxable income.
A $3.8 million tax rate benefit for the reduction in the fair value of the Tax Receivable Agreement, including the federal rate reduction.
A $3.1 million benefit in conjunction with the third quarter 2017 filing of Veritiv’s 2016 U.S. federal tax return and amended 2015 and 2014 U.S. federal tax returns for credits related to foreign taxes and research and experimentation activities.
A tax rate effect of $2.1 million for the impact of impairing non-deductible goodwill.
In addition to the above items, the difference between the Company’s effective tax rates for the years ended December 31, 2017, 2016 and 2015 and the U.S. statutory tax rate of 35% includes the impact of non-deductible expenses, state income taxes (net of federal income tax benefit), the Company's income (loss) by jurisdiction, the tax effect of Tax Receivable Agreement changes, and changes in the valuation allowance against deferred tax assets. The year ended December 31, 2015 also includes the tax impact of a carve-out basis.foreign exchange loss and an impairment of non-deductible goodwill.
For periods priorThe Tax Act makes broad and complex changes to the Spin-off,U.S. tax code that affected our income taxes in 2017 as well as changes that will affect us beginning in 2018. The volatility of the combined financial statements include expense allocations for certain functions previously providedCompany's effective tax rate has been primarily due to both the level of pre-tax income as well as variations in the Company's income (loss) by International Paper.jurisdiction. Additionally, uncertainty related to the future impact of the Tax Act may increase effective tax rate volatility. Pending further evaluation of the Tax Act, over time and with increasing pre-tax income, the Company estimates its effective tax rate will trend toward approximately 26%. However, the effective tax rate may vary significantly due to potential fluctuations in the amount and source, including both foreign and domestic, of pre-tax income and changes in amounts of non-deductible expenses and other items that could impact the effective tax rate. See Note 18 of the Notes to the Consolidated and Combined Financial Statements for further information.additional details.
Key Performance Measure
Segment Results
Adjusted EBITDA is the primary financial performance measure Veritiv uses to manage its businesses, to monitor its results of operations, to measure its performance against the ABL Facility and to incentivize its management. This common metric is intended to align shareholders, debt holders and management. Adjusted EBITDA is a non-GAAP financial measure and is not an alternative to net income, operating income or any other measure prescribed by U.S. generally accepted accounting principles ("U.S. GAAP").
Veritiv uses Adjusted EBITDA (earnings before interest, income taxes, depreciation and amortization, restructuring charges, (income), non-restructuringnet, acquisition and integration expenses and other similar charges including any severance costs, costs associated with warehouse and office openings or closings, consolidation, and relocation and other business optimization expenses, stock-based compensation expense, changes in the LIFO (income) expense,reserve, non-restructuring asset impairment charge,charges, non-restructuring severance
charges, gain on sale of joint venture, merger and integration expenses, income (loss) from discontinued operations, net of income taxes,non-restructuring pension charges, fair value adjustments on therelated to contingent liability associated with the Tax Receivable Agreement ("TRA")liabilities assumed in mergers and acquisitions and certain other adjustments) because Veritiv believes investors commonly use Adjusted EBITDA as a key financial metric for valuing companies such as Veritiv.companies. In addition, the credit agreement governing the ABL Facility (as defined in the Notes to the Consolidated and Combined Financial Statements) permits the Company to exclude these and other charges in calculating Consolidated EBITDA, as defined in the ABL Facility.
The table below provides a reconciliation of Veritiv’s net income (loss) determined in accordance with GAAP to Adjusted EBITDA on a pro forma basis for the years ended December 31, 2014 and 2013. The pro forma adjustments take into account the Merger and the related financing as if they occurred on January 1, 2013, as well as purchase accounting adjustments and transaction costs related to the Merger. The pro forma results do not reflect events that have occurred or may occur after the transactions, including the impact of any synergies expected to result from the Merger. Accordingly, the
unaudited pro forma financial information is not necessarily indicative of the results of operations as they would have been had the transactions been effected on the assumed date, nor is it necessarily an indication of future operating results.
|
| | | | | | | | | | | | | | | | | | | | | | | |
| | Year Ended December 31, 2014 | | Year Ended December 31, 2013 |
| (in millions) | Veritiv As Reported | | Pro Forma Adjust-ments | | Veritiv Pro Forma | | Veritiv
As Reported | | Pro Forma Adjust-ments | | Veritiv Pro Forma |
| Net income (loss) | $ | (19.6 | ) | | $ | 42.3 |
| | $ | 22.7 |
| | $ | 0.2 |
| | $ | 180.9 |
| (1) | $ | 181.1 |
|
| Interest expense, net | 14.0 |
| | 12.4 |
| | 26.4 |
| | — |
| | 25.9 |
| | 25.9 |
|
| Income tax expense (benefit) | (2.1 | ) | | 44.3 |
| | 42.2 |
| | 0.4 |
| | (267.9 | ) | (1) | (267.5 | ) |
| Depreciation and amortization | 37.6 |
| | 14.7 |
| | 52.3 |
| | 17.1 |
| | 39.1 |
| | 56.2 |
|
| EBITDA | $ | 29.9 |
| | $ | 113.7 |
| | $ | 143.6 |
| | $ | 17.7 |
| | $ | (22.0 | ) | | $ | (4.3 | ) |
| Restructuring charges (income) | 4.0 |
| | 0.2 |
| | 4.2 |
| | 37.9 |
| | (3.4 | ) | | 34.5 |
|
| Non-restructuring stock-based compensation | 4.0 |
| | 0.1 |
| | 4.1 |
| | 13.1 |
| | 0.4 |
| | 13.5 |
|
| LIFO (income) expense | 6.3 |
| | (2.8 | ) | | 3.5 |
| | 3.4 |
| | 3.3 |
| | 6.7 |
|
| Asset impairment charge | — |
| | 2.8 |
| | 2.8 |
| | — |
| | 0.4 |
| | 0.4 |
|
| Non-restructuring severance charges | 2.6 |
| | 0.4 |
| | 3.0 |
| | 2.3 |
| | 0.4 |
| | 2.7 |
|
| Gain on sale of joint venture | — |
| | (6.6 | ) | | (6.6 | ) | | — |
| | — |
| | — |
|
| Merger and integration expenses | 75.1 |
| | (75.1 | ) | | — |
| | — |
| | 103.5 |
| | 103.5 |
|
| Fair value adjustment on TRA contingent liability | 1.7 |
| | — |
| | 1.7 |
| | — |
| | — |
| | — |
|
| Other | (1.7 | ) | | (1.1 | ) | | (2.8 | ) | | — |
| | 4.5 |
| | 4.5 |
|
| Loss (income) from discontinued operations, net of income taxes | 0.1 |
| | — |
| | 0.1 |
| | (0.2 | ) | | — |
| | (0.2 | ) |
| Adjusted EBITDA | $ | 122.0 |
| | $ | 31.6 |
| | $ | 153.6 |
| | $ | 74.2 |
| | $ | 87.1 |
| | $ | 161.3 |
|
| | | | | | | | | | | | |
| Net sales | $ | 7,406.5 |
| | $ | 1,907.6 |
| | $ | 9,314.1 |
| | $ | 5,652.4 |
| | $ | 4,089.1 |
| | $ | 9,741.5 |
|
| Adjusted EBITDA / Pro Forma Adjusted EBITDA as a % of net sales | 1.6 | % | | | | 1.6 | % | | 1.3 | % | | | | 1.7 | % |
(1) Unisource's historical results for the year ended December 31, 2013 includes the reversal of a $238.7 million valuation allowance against its U.S. federal and a substantial portion of its state net deferred tax assets.
The table below provides a reconciliation of Veritiv’s net income (loss) determined in accordance with GAAP to Adjusted EBITDA for the years ended December 31, 2014, 2013 and 2012. |
| | | | | | | | | | | | |
| | | Year Ended December 31, |
| (in millions) | | 2014 | | 2013 | | 2012 |
| Net income (loss) | | $ | (19.6 | ) | | $ | 0.2 |
| | $ | 4.4 |
|
| Interest expense, net | | 14.0 |
| | — |
| | — |
|
| Income tax expense (benefit) | | (2.1 | ) | | 0.4 |
| | 9.1 |
|
| Depreciation and amortization | | 37.6 |
| | 17.1 |
| | 14.0 |
|
| EBITDA | | $ | 29.9 |
| | $ | 17.7 |
| | $ | 27.5 |
|
| Restructuring charges | | 4.0 |
| | 37.9 |
| | 35.1 |
|
| Non-restructuring stock-based compensation | | 4.0 |
| | 13.1 |
| | 13.1 |
|
| LIFO expense | | 6.3 |
| | 3.4 |
| | 1.0 |
|
| Non-restructuring severance charges | | 2.6 |
| | 2.3 |
| | 0.6 |
|
| Merger and integration expenses | | 75.1 |
| | — |
| | — |
|
| Fair value adjustment on TRA contingent liability | | 1.7 |
| | — |
| | — |
|
| Other | | (1.7 | ) | | — |
| | 2.2 |
|
| Loss (income) from discontinued operations, net of income taxes | | 0.1 |
| | (0.2 | ) | | 10.0 |
|
| Adjusted EBITDA | | $ | 122.0 |
| | $ | 74.2 |
| | $ | 89.5 |
|
| | | | | | | |
| Net sales | | $ | 7,406.5 |
| | $ | 5,652.4 |
| | $ | 6,012.0 |
|
| Adjusted EBITDA as a % of net sales | | 1.6 | % | | 1.3 | % | | 1.5 | % |
Adjusted EBITDA has limitations as an analytical tool and should not be considered in isolation or as a substitute for analysis of Veritiv’s results as reported under U.S. GAAP. For example, Adjusted EBITDA:
Does not reflect the Company’s income tax expenses or the cash requirements to pay its taxes; and
Although depreciation and amortization charges are non-cash charges, it does not reflect that the assets being depreciated and amortized will often have to be replaced in the future, and the foregoing metrics do not reflect any cash requirements for such replacements.
Other companies in the industry may calculate Adjusted EBITDA differently than Veritiv does, limiting its usefulness as a comparative measure. Because of these limitations, Adjusted EBITDA should not be considered as a measure of discretionary cash available to Veritiv to invest in the growth of its business. Veritiv compensates for these limitations by relying both on the Company's U.S. GAAP results and by using Adjusted EBITDA for supplemental purposes. Additionally, Adjusted EBITDA is not an alternative measure of financial performance under U.S. GAAP and therefore should be considered in conjunction with net income and other performance measures such as operating income or net cash provided by operating activities and not as an alternative to such U.S. GAAP measures.
Results of Operations, Including Business Segments
The following discussion compares the consolidated and combined operating results of Veritiv for the years ended December 31, 2014, 2013 and 2012:
Comparison of the Years Ended December 31, 2014 and December 31, 2013 |
| | | | | | | | | | | | | | | | | |
| | Year Ended December 31, | | Increase (Decrease) |
| (in millions) | 2014 | % | | 2013 | % | | $ | % |
| Net sales | $ | 7,406.5 |
| 100.0 | % | | $ | 5,652.4 |
| 100.0 | % | | $ | 1,754.1 |
| 31.0 | % |
| Cost of products sold (exclusive of depreciation and amortization shown separately below) | 6,180.9 |
| 83.5 | % | | 4,736.8 |
| 83.8 | % | | 1,444.1 |
| 30.5 | % |
| Distribution expenses | 426.2 |
| 5.8 | % | | 314.2 |
| 5.6 | % | | 112.0 |
| 35.6 | % |
| Selling and administrative expenses | 689.1 |
| 9.3 | % | | 548.2 |
| 9.7 | % | | 140.9 |
| 25.7 | % |
| Depreciation and amortization | 37.6 |
| 0.5 | % | | 17.1 |
| 0.3 | % | | 20.5 |
| 119.9 | % |
| Merger and integration expenses | 75.1 |
| 1.0 | % | | — |
| — | % | | 75.1 |
| * |
| Restructuring charges | 4.0 |
| 0.1 | % | | 37.9 |
| 0.7 | % | | (33.9 | ) | (89.4 | )% |
| Operating income (loss) | (6.4 | ) | (0.1 | )% | | (1.8 | ) | (0.0 | )% | | (4.6 | ) | * |
| Interest expense, net | 14.0 |
| 0.2 | % | | — |
| — | % | | 14.0 |
| * |
| Other expense (income), net | 1.2 |
| 0.0 | % | | (2.2 | ) | (0.0 | )% | | 3.4 |
| * |
| Income (loss) from continuing operations before income taxes | (21.6 | ) | (0.3 | )% | | 0.4 |
| 0.0 | % | | (22.0 | ) | * |
| Income tax expense (benefit) | (2.1 | ) | (0.0 | )% | | 0.4 |
| 0.0 | % | | (2.5 | ) | * |
| Income (loss) from continuing operations | (19.5 | ) | (0.3 | )% | | (0.0 | ) | (0.0 | )% | | (19.5 | ) | * |
| Income (loss) from discontinued operations, net of income taxes | (0.1 | ) | (0.0 | )% | | 0.2 |
| 0.0 | % | | (0.3 | ) | * |
| Net income (loss) | $ | (19.6 | ) | (0.3 | )% | | $ | 0.2 |
| 0.0 | % | | (19.8 | ) | * |
* - not meaningful
Net Sales
Net sales increased due primarily to the net sales contribution of $2,040.5 million, or 36.1%, from the Merger and due to an increase in legacy xpedx Packaging segment sales which increased 2.9%. These increases were partially offset by an 8.2% decrease in net sales in the legacy xpedx Print, Publishing and Facility Solutions segments. See the “Segment Results” for additional discussion.
Cost of Products Sold
Cost of products sold increased due primarily to incremental costs of $1,677.3 million, or 35.4%, attributable to the Merger. This increase was partially offset by a 4.9% decrease in legacy xpedx cost of products sold. The percentage decrease in cost of
products sold were driven by a decline in Facilities Solutions, Print and Publishing cost of products sold. The declines in the three segments was driven primarily by a decline in sales volume.
Distribution Expenses
Distribution expenses increased due primarily to incremental expenses of $131.4 million, or 41.8%, attributable to the Merger. This increase was partially offset by a 6.2% decrease in legacy xpedx distribution expenses. The decline in legacy xpedx distribution expenses was driven by (i) an $11.3 million decrease in vehicle operation expenses due primarily to a reduction in third-party freight expense, (ii) a $4.1 million decrease in wages and benefits driven by a reduction in headcount and (iii) a $3.3 million one-time benefit related to a change in Veritiv’s vacation policy.
Selling and Administrative Expenses
Selling and administrative expenses increased due primarily to incremental expenses of $191.9 million, or 35.0%, from the Merger. This increase was partially offset by a $51.0 million decrease in legacy xpedx selling and administrative expenses. The decrease in legacy xpedx selling and administrative expenses is primarily attributed to: (i) a $29.9 million reduction in allocated expenses from International Paper, (ii) a $9.6 million one-time benefit related to the change in the vacation policy previously noted, (iii) a $4.0 million decrease in personnel costs due to a reduction in headcount, (iv) a $4.0 million decrease in sales professional training, (v) a $2.4 million reduction in IT project spending and (vi) a $1.1 million decline in miscellaneous other expenses.
Depreciation and Amortization Expenses
Depreciation and amortization expenses increased due primarily to incremental expenses of $19.0 million, or 111.1%, attributable to the Merger. Legacy xpedx depreciation and amortization expenses increased an additional 8.8% due primarily to an increase in capital leases for tractor-trailer power units.
Merger and Integration Expenses
Merger and integration expenses incurred during the year included advisory, legal and other professional fees directly associated with the Merger; integration-related professional services and project management fees; retention compensation; termination benefits (including change-in-control bonuses); rebranding and other redundant costs to integrate the combined businesses of xpedx and Unisource. See Note 2 of the Notes to Consolidated and Combined Financial Statements for a breakdown of the major components of these costs.Restructuring Charges
For the year ended December 31, 2014, restructuring charges related primarily to Veritiv's restructuring program of its North American operations intended to integrate the legacy xpedx and Unisource operations, generate cost savings and capture synergies across the combined company. During the fourth quarter of 2014, the Company initiated the process of consolidating warehouse and customer service locations of the legacy organizations as well as realigning its field and sales management function. As a result, the Company incurred restructuring charges for employee termination benefits and other direct costs. See Note 3 of the Notes to the Consolidated and Combined Financial Statements for additional details. The Company may continue to record restructuring charges in the future as integration activities progress. Restructuring charges for the year ended December 31, 2013 related to xpedx's multi-year restructuring plan as further described below.
Interest Expense, Net
Interest expense, net primarily consists of (i) $9.2 million of interest expense on the ABL Facility, (ii) $2.2 million for amortization of deferred financing costs related to the ABL Facility, (iii) $1.1 million attributable to financing obligations to related party and (iv) $1.5 million in miscellaneous other interest expense.
Effective Tax Rate
Veritiv's effective tax rate was 9.7% and 100.0% for the years ended December 31, 2014 and 2013, respectively. The difference between the Company’s effective tax rate for the year ended December 31, 2014 and the U.S. statutory tax rate of 35% is principally related to non-deductible transaction-related costs and other expenses and changes in the valuation allowance. Over time, the Company estimates its effective tax rate will be approximately 38-40%. However, it may vary significantly due to potential changes in the amount and mix of pre-tax book income and changes in amounts of non-deductible expenses and other items impacting the effective tax rate. See Note 7 of the Notes to the Consolidated and Combined Financial Statements for additional details.
Comparison of the Years Ended December 31, 2013 and December 31, 2012
|
| | | | | | | | | | | | | | | | | |
| | Year Ended December 31, | | Increase (Decrease) |
| (in millions) | 2013 | % | | 2012 | % | | $ | % |
| Net sales | $ | 5,652.4 |
| 100.0 | % | | $ | 6,012.0 |
| 100.0 | % | | $ | (359.6 | ) | (6.0 | )% |
| Cost of products sold (exclusive of depreciation and amortization shown separately below) | 4,736.8 |
| 83.8 | % | | 5,036.7 |
| 83.8 | % | | (299.9 | ) | (6.0 | )% |
| Distribution expenses | 314.2 |
| 5.6 | % | | 324.0 |
| 5.4 | % | | (9.8 | ) | (3.0 | )% |
| Selling and administrative expenses | 548.2 |
| 9.7 | % | | 580.6 |
| 9.7 | % | | (32.4 | ) | (5.6 | )% |
| Depreciation and amortization | 17.1 |
| 0.3 | % | | 14.0 |
| 0.2 | % | | 3.1 |
| 22.1 | % |
| Restructuring charges | 37.9 |
| 0.7 | % | | 35.1 |
| 0.6 | % | | 2.8 |
| 8.0 | % |
| Operating income (loss) | (1.8 | ) | (0.0 | )% | | 21.6 |
| 0.4 | % | | (23.4 | ) | * |
| Other income, net | (2.2 | ) | (0.0 | )% | | (1.9 | ) | (0.0 | )% | | (0.3 | ) | 15.8 | % |
| Income (loss) from continuing operations before income taxes | 0.4 |
| 0.0 | % | | 23.5 |
| 0.4 | % | | (23.1 | ) | (98.3 | )% |
| Income tax (benefit) expense | 0.4 |
| 0.0 | % | | 9.1 |
| 0.2 | % | | (8.7 | ) | (95.6 | )% |
| Income (loss) from continuing operations | (0.0 | ) | (0.0 | )% | | 14.4 |
| 0.2 | % | | (14.4 | ) | (100.0 | )% |
| Income (loss) from discontinued operations, net of income taxes | 0.2 |
| 0.0 | % | | (10.0 | ) | (0.2 | )% | | 10.2 |
| * |
| Net income (loss) | $ | 0.2 |
| 0.0 | % | | $ | 4.4 |
| 0.1 | % | | (4.2 | ) | (95.5 | )% |
* - not meaningful
Net Sales
Net sales decreased due primarily to lower net sales of $251.6 million and $99.6 million in our Print and Facility Solutions segments, respectively, which are further discussed in the section "Segment Results" below.
Cost of Products Sold
Cost of products sold decreased in line with the net sales decrease.
Distribution Expenses
Distribution expenses decreased due primarily to (i) a $4.0 million decrease in salaries, wages and employee benefits as a result of a management initiative to restructure the organization to reduce headcount, (ii) a $3.9 million decrease in temporary labor costs attributable to the decline in net sales, (iii) a $1.2 million decrease in freight and fuel costs primarily attributable to the decrease in net sales and (iv) a $0.6 million decrease in repairs and maintenance costs. As a percentage of net sales, distribution expenses increased due primarily to sales volumes declining more rapidly than costs.
Selling and Administrative Expenses
Selling and administrative expenses decreased due primarily to (i) a $14.7 million decline in incentive compensation, (ii) a $7.4 million decline in commissions associated with the decreased volume, (iii) a $4.3 million decrease in overhead allocations from International Paper, (iv) a $3.1 million decrease in travel and entertainment expenses and (v) a $2.7 million decrease in salaries, wages and benefits as a result of a management initiative to restructure the organization. As a percentage of net sales, selling and administrative expenses remained consistent for the years ended December 31, 2013 and 2012.
Depreciation and Amortization Expenses
Depreciation and amortization expenses increased due primarily to investment in e-commerce and supply chain management systems.
Restructuring Charges
Restructuring charges for the years ended December 31, 2013 and 2012 related to xpedx's multi-year restructuring plan to (i) optimize the warehouse network, (ii) improve the efficiency of the sales team and (iii) reorganize the procurement function. During 2013 and 2012, six and 118 locations were closed, respectively, related to this plan. As a result of these closures, xpedx incurred restructuring charges for severance and other termination benefits, facility closure costs, gains on sales of fixed assets
and other direct costs. See Note 3 of the Notes to the Consolidated and Combined Financial Statements for the breakout of these costs and additional details.
Effective Tax Rate
Veritiv's effective tax rate was 100.0% and 38.7% for the years ended December 31, 2013 and 2012, respectively. The difference between the Company’s effective tax rate for the year ended December 31, 2013 and the U.S. statutory tax rate of 35% is principally related to the meals and entertainment disallowance. See Note 7 of the Notes to the Consolidated and Combined Financial Statements for additional details.
Segment Results
As discussed above, during 2014, the Company realigned and expanded its reportable segments to include a new Publishing segment. This new segment structure is consistent with the way the Chief Operating Decision Maker ("CODM"), identified as the Chief Executive Officer, manages and evaluates the business. In addition, as a result of the change in how the CODM manages and evaluates the business, certain costs such as executive costs, corporate affairs, finance, human resources, IT and legal that were previously allocated to the reportable segments are no longer allocated. The Company’s consolidated financial results now include a "Corporate & Other" category which includes certain assets and costs not primarily attributable to any of the reportable segments. Corporate & Other also includes the Veritiv Logistics Solutions business unit which provides transportation and warehousing solutions. As a result of these changes in segment reporting, all historical financial information has been revised to conform to the new presentation, with no resulting impact on the consolidated and combined results of operations.
Due to the shared nature of the distribution network, distribution chargesexpenses are not a directspecific charge to each segment but are instead allocated to each segment based primarily on operational metrics that correlate with changes in volume. Accordingly, distribution expenses allocated to each segment are highly interdependent on the results of other segments. Lower volume in any segment that is not offset by a reduction in distribution expenses can result in the other segments absorbing a larger share of distribution expenses. Conversely, higher volume in any segment can result in the other segments absorbing a smaller share of distribution expenses. The impact of this at the segment level is that the changes in distribution expense trends may not correspond with volume trends within a particular segment.
The Company sells thousands of products. In conjunction withthe Packaging, Facility Solutions and Print segments, Veritiv is unable to compute the impact of changes in net sales volume based on changes in net sales of each individual product. Rather, the Company assumes that the margin stays constant and estimates the volume impact based on changes in cost of products sold as a proxy for the change in reportable segments, management re-evaluated its use of key performance metrics. Historically, xpedx used operating profit, excluding certain charges, as its measure of operating performance of segment results. Based onnet sales volume. After any other significant net sales variances are identified, the recent evaluation, Veritiv has concluded that Adjusted EBITDAremaining net sales variance is attributed to price/mix.
The Company approximates foreign currency effects by applying the primary metric management usesforeign currency exchange rate for the prior period to assess operating performance. Therefore,the local currency results for the current and prior period segment presentations reflect Adjusted EBITDA asperiod. We believe the operating performance measure.elimination of the foreign currency translation impact provides better year-to-year comparability without the distortion of foreign currency fluctuations.
The Company believes that the decline in the demand for paper and related products is due to the widespread use of electronic media and permanent product substitution, more e-commerce, less print advertising, fewer catalogs and a reduced volume of direct mail, andamong other factors. This trend is expected to continue and will place continued pressure on the Company’s revenues and profit margins and make it more difficult to maintain or grow Adjusted EBITDA within the Print and Publishing segments.
Included in the following table are net sales and Adjusted EBITDA for each of the reportable segments reconciled to the combined totals:and Corporate & Other:
| | | (in millions) | Print | | Publishing | | Packaging | | Facility Solutions | | Corporate & Other | | Total | Packaging | | Facility Solutions | | Print | | Publishing | | Corporate & Other |
| Year Ended December 31, 2014 | | | | | | | | | | | | |
| Year Ended December 31, 2017 | | | | | | | | | | |
| Net sales | $ | 2,956.1 |
| | $ | 1,075.5 |
| | $ | 2,259.4 |
| | $ | 1,070.3 |
| | $ | 45.2 |
| | $ | 7,406.5 |
| $ | 3,157.8 |
| | $ | 1,309.7 |
| | $ | 2,793.7 |
| | $ | 958.0 |
| | $ | 145.5 |
|
| Adjusted EBITDA | $ | 55.4 |
| | $ | 27.1 |
| | $ | 157.0 |
| | $ | 33.6 |
| | $ | (151.1 | ) | | $ | 122.0 |
| $ | 238.0 |
| | $ | 35.5 |
| | $ | 60.8 |
| | $ | 26.4 |
| | $ | (184.3 | ) |
| Adjusted EBITDA as a % of net sales | 1.9 | % | | 2.5 | % | | 6.9 | % | | 3.1 | % | | — |
| | 1.6 | % | 7.5 | % | | 2.7 | % | | 2.2 | % | | 2.8 | % | | * |
|
| | | | | | | | | | | | | | | | | | | | | |
| Year Ended December 31, 2013 | | | | | | | | | | | | |
| Year Ended December 31, 2016 | | | | | | | | | | |
| Net sales | $ | 2,399.6 |
| | $ | 807.9 |
| | $ | 1,600.3 |
| | $ | 844.6 |
| | $ | — |
| | $ | 5,652.4 |
| $ | 2,854.2 |
| | $ | 1,271.6 |
| | $ | 3,047.4 |
| | $ | 1,033.6 |
| | $ | 119.8 |
|
| Adjusted EBITDA | $ | 43.9 |
| | $ | 16.4 |
| | $ | 117.9 |
| | $ | 14.4 |
| | $ | (118.4 | ) | | $ | 74.2 |
| $ | 221.2 |
| | $ | 47.0 |
| | $ | 76.8 |
| | $ | 23.6 |
| | $ | (176.4 | ) |
| Adjusted EBITDA as a % of net sales | 1.8 | % | | 2.0 | % | | 7.4 | % | | 1.7 | % | | — |
| | 1.3 | % | 7.7 | % | | 3.7 | % | | 2.5 | % | | 2.3 | % | | * |
|
| | | | | | | | | | | | | | | | | | | | | |
| Year Ended December 31, 2012 | | | | | | | | | | | | |
| Year Ended December 31, 2015 | | | | | | | | | | |
| Net sales | $ | 2,651.2 |
| | $ | 822.7 |
| | $ | 1,593.9 |
| | $ | 944.2 |
| | $ | — |
| | $ | 6,012.0 |
| $ | 2,829.9 |
| | $ | 1,289.3 |
| | $ | 3,271.8 |
| | $ | 1,215.5 |
| | $ | 111.2 |
|
| Adjusted EBITDA | $ | 53.0 |
| | $ | 13.8 |
| | $ | 123.6 |
| | $ | 19.2 |
| | $ | (120.1 | ) | | $ | 89.5 |
| $ | 212.6 |
| | $ | 41.7 |
| | $ | 79.0 |
| | $ | 34.7 |
| | $ | (186.0 | ) |
| Adjusted EBITDA as a % of net sales | 2.0 | % | | 1.7 | % | | 7.8 | % | | 2.0 | % | | — |
| | 1.5 | % | 7.5 | % | | 3.2 | % | | 2.4 | % | | 2.9 | % | | * |
|
* - not meaningful
See Note 17, of the Notes to Consolidated Financial Statements for additional information related to Adjusted EBITDA, including a reconciliation of income (loss) before income taxes as reflected in the Consolidated Statements of Operations to Adjusted EBITDA for reportable segments. 32
PrintPackaging
The table below presents selected data with respect to the PrintPackaging segment:
| | | | Year Ended December 31, | | 2014 vs. 2013 | | 2013 vs. 2012 | Year Ended December 31, | | 2017 vs. 2016 | | 2016 vs. 2015 |
| (in millions) | 2014 | | 2013 | | 2012 | | Increase (Decrease) % | | Increase (Decrease) % | 2017 | | 2016 | | 2015 | | Increase (Decrease) % | | Increase (Decrease) % |
| Net sales | $ | 2,956.1 |
| | $ | 2,399.6 |
| | $ | 2,651.2 |
| | 23.2 | % | | (9.5 | )% | $ | 3,157.8 |
| | $ | 2,854.2 |
| | $ | 2,829.9 |
| | 10.6 | % | | 0.9 | % |
| Adjusted EBITDA | $ | 55.4 |
| | $ | 43.9 |
| | $ | 53.0 |
| | 26.2 | % | | (17.2 | )% | $ | 238.0 |
| | $ | 221.2 |
| | $ | 212.6 |
| | 7.6 | % | | 4.0 | % |
| Adjusted EBITDA as a % of net sales | 1.9 | % | | 1.8 | % | | 2.0 | % | | | | | 7.5 | % | | 7.7 | % | | 7.5 | % | | | | |
The table below presents the components of the net sales change compared to the prior year:
| | | | Increase (Decrease) % | Increase (Decrease) |
| (in millions) | | 2017 vs. 2016 | | 2016 vs. 2015 |
| Volume | | $ | 315.0 |
| | $ | 50.3 |
|
| Foreign currency | | 3.3 |
| | (21.8 | ) |
| Price/Mix | | (14.7 | ) | | (4.2 | ) |
| | 2014 vs. 2013 | | 2013 vs. 2012 | $ | 303.6 |
| | $ | 24.3 |
|
| Volume | (7.0 | )% | | (9.5 | )% | |
| Price/Mix | (0.4 | )% | | — | % | |
| Merger | 30.6 | % | | — | % | |
| | 23.2 | % | | (9.5 | )% | |
Comparison of the Years Ended December 31, 20142017 and December 31, 20132016
Net sales increased due primarily$303.6 million, or 10.6%, compared to the2016. The net sales contribution of $733.5 million from the Merger. This increase was partially offset by a 7.4% decrease in the net sales of legacy xpedx operations which was primarily attributable to declining volumes at existing customers.an increase in net sales of corrugated products, films and tertiary packaging items due to increases in volume and market prices as well as $71.7 million of rigid packaging product net sales in 2017 relating to the AAC acquisition.
Adjusted EBITDA increased by $9.2$16.8 million, as a result of the Merger. The legacy xpedx Adjusted EBITDA increased by $2.2 million driven by (i) a $13.5 million decline in distribution expensesor 7.6%, compared to 2016 primarily due to lowerincreased net sales volume, (ii) an $8.1 million declinevolume. The increase in personnel costs driven by a reduction in headcount, (iii) a $6.0 million decrease innet sales training programs and project spend, (iv) a $2.7 million decline in commissions and (v) a $1.8 million decline in miscellaneous other expenses. These declines in expenses arewas partially offset by (i) cost of products sold increasing at a $24.0faster rate than net sales, (ii) a $25.0 million reductionincrease in Adjusted EBITDAdistribution expenses and (iii) an $18.7 million increase in selling and administrative expenses. The increase in distribution expenses was primarily driven by increased utilization of the distribution network, which is reflected in (i) increased freight and logistics expenses driven primarily by increased third-party freight, transfer expenses and diesel fuel prices, (ii) increased personnel expenses and (iii) increased facilities rent and other related expenses. The increase in selling and administrative expenses was primarily driven by higher personnel expenses associated with increased headcount to support our growth strategy. The AAC acquisition resulted in a decline$4.9 million increase in volumedistribution expenses and (ii) a $5.9$9.4 million decrease due to changesincrease in pricingselling and mix.administrative expenses.
Comparison of the Years Ended December 31, 20132016 and December 31, 20122015
NetThe net sales decreased dueincrease was primarily attributable to lower volumes driven by (i) $70.2 millionan increase in customer losses and (ii) a decreasenet sales of $29.3 million as a result of xpedx altering its go-to-market approach for walk-in customers through the closing of certain retail stores. The remaining decline is due to loss in volumes at existing customers driven by the continued decline in the overall paper market.corrugated products.
The decrease in Adjusted EBITDA increase was driven primarily by an overall decrease indue to increased net sales which reduced Adjusted EBITDA by $34.9volume, and $3.4 million attributed to cost of products sold increasing at a slower rate than net sales. These improvements were partially offset by a $25.8$1.1 million reduction in expenses. Expenses declined due to (i) a $13.5 million declineincrease in selling, general, and general administrative expenses, benefits and incentive compensation, (ii) a $9.4 million decline in distribution expenses that was driven by declines inpersonnel costs primarily attributable to the addition of new sales volume, (iii) a $2.6 million decline in commissions and (iv) a $0.3 million decline in miscellaneous other expenses.representatives.
Facility Solutions
The table below presents selected data with respect to the PublishingFacility Solutions segment:
| | | | Year Ended December 31, | | 2014 vs. 2013 | | 2013 vs. 2012 | Year Ended December 31, | | 2017 vs. 2016 | | 2016 vs. 2015 |
| (in millions) | 2014 | | 2013 | | 2012 | | Increase (Decrease) % | | Increase (Decrease) % | 2017 | | 2016 | | 2015 | | Increase (Decrease) % | | Increase (Decrease) % |
| Net sales | $ | 1,075.5 |
| | $ | 807.9 |
| | $ | 822.7 |
| | 33.1 | % |
| (1.8 | )% | $ | 1,309.7 |
| | $ | 1,271.6 |
| | $ | 1,289.3 |
| | 3.0 | % | | (1.4 | )% |
| Adjusted EBITDA | $ | 27.1 |
| | $ | 16.4 |
| | $ | 13.8 |
| | 65.2 | % | | 18.8 | % | $ | 35.5 |
| | $ | 47.0 |
| | $ | 41.7 |
| | (24.5 | )% | | 12.7 | % |
| Adjusted EBITDA as a % of net sales | 2.5 | % | | 2.0 | % | | 1.7 | % | | | | | 2.7 | % | | 3.7 | % | | 3.2 | % | | | | |
The table below presents the components of the net sales change compared to the prior year:
| | | | Increase (Decrease) % | Increase (Decrease) |
| (in millions) | | 2017 vs. 2016 | | 2016 vs. 2015 |
| Volume | | $ | 43.1 |
| | $ | (5.6 | ) |
| Foreign currency | | 5.1 |
| | (9.2 | ) |
| Price/Mix | | (10.1 | ) | | (2.9 | ) |
| | 2014 vs. 2013 | | 2013 vs. 2012 | $ | 38.1 |
| | $ | (17.7 | ) |
| Volume | (6.3 | )% | | 2.9 | % | |
| Price/Mix | (0.9 | )% | | (4.7 | )% | |
| Merger | 40.3 | % | | — | % | |
| | 33.1 | % | | (1.8 | )% | |
Comparison of the Years Ended December 31, 20142017 and December 31, 20132016
Net sales increased due primarily$38.1 million, or 3.0%, compared to the2016. The net sales contribution of $325.9 million from the Merger. This increase was partially offset by a 7.2% decrease in theprimarily attributable to increased net sales of legacy xpedx operations, due primarily to a 6.3% decline in volume driven by (i) the loss of three large customers which comprised 2.8% of the decline in salesfood service products, safety supplies, chemicals, towels and (ii) a continued decrease in volume at existing customers due to both structural demand decline and market price decreases for the products we sell.tissues.
Adjusted EBITDA decreased $11.5 million, or 24.5%, compared to 2016. The decrease in Adjusted EBITDA was primarily driven by (i) cost of products sold increasing at a faster rate than net sales, (ii) a $6.9 million increase in distribution expenses and (iii) a $5.6 million increase in selling and administrative costs, partially offset by an increase in net sales. The increase in distribution expenses was primarily driven by increased by $10.8 million as a resultutilization of the Merger.distribution network and is evidenced in (i) increased freight and logistics expenses driven primarily by increased third-party freight, transfer expenses and diesel fuel prices and (ii) increased personnel expenses. The changeincrease in legacy xpedx Adjusted EBITDA during this periodselling and administrative expenses was minimal.primarily driven by (i) an increase in personnel expenses primarily due to increased headcount to support our growth strategy and (ii) an increase in bad debt expense.
Comparison of the Years Ended December 31, 20132016 and December 31, 20122015
The net sales decrease iswas primarily attributable to (i) foreign currency effects, (ii) strategic decisions to exit certain unprofitable customer relationships in line with a 1.6% print market decline. Volume increased2015 and (iii) pricing pressure.
The Adjusted EBITDA improvement was primarily due to increased share with customers(i) cost of products sold decreasing at a faster rate than net sales and (ii) a $3.5 million decrease in the book, retail insertselling and specialty segments.administrative costs. The price/mix declinedecrease in selling and administrative expenses was primarily driven by deterioration(i) a decrease in the coated free sheetcommissions due to lower net sales volume, (ii) a decrease in bad debt expense due to favorable collections experience and coated ground wood segments.
The increase in Adjusted EBITDA was driven by a $1.7 million decline in incentive compensation and a $1.3 million decline in wages and benefits as a result of(iii) a reduction in headcount which was partially offset by a $0.4 million increase in various other expenses.personnel costs.
Print
The table below presents selected data with respect to the PackagingPrint segment:
| | | | Year Ended December 31, | | 2014 vs. 2013 | | 2013 vs. 2012 | Year Ended December 31, | | 2017 vs. 2016 | | 2016 vs. 2015 |
| (in millions) | 2014 | | 2013 | | 2012 | | Increase (Decrease) % | | Increase (Decrease) % | 2017 | | 2016 | | 2015 | | Increase (Decrease) % | | Increase (Decrease) % |
| Net sales | $ | 2,259.4 |
| | $ | 1,600.3 |
| | $ | 1,593.9 |
| | 41.2 | % |
| 0.4 | % | $ | 2,793.7 |
| | $ | 3,047.4 |
| | $ | 3,271.8 |
| | (8.3 | )% | | (6.9 | )% |
| Adjusted EBITDA | $ | 157.0 |
| | $ | 117.9 |
| | $ | 123.6 |
| | 33.2 | % | | (4.6 | )% | $ | 60.8 |
| | $ | 76.8 |
| | $ | 79.0 |
| | (20.8 | )% | | (2.8 | )% |
| Adjusted EBITDA as a % of net sales | 6.9 | % | | 7.4 | % | | 7.8 | % | | | | | 2.2 | % | | 2.5 | % | | 2.4 | % | | | | |
The table below presents the components of the net sales change compared to the prior year:
| | | | Increase (Decrease) % | Increase (Decrease) |
| (in millions) | | 2017 vs. 2016 | | 2016 vs. 2015 |
| Volume | | $ | (256.8 | ) | | $ | (225.2 | ) |
| Foreign currency | | 3.5 |
| | (9.2 | ) |
| Price/Mix | | (0.4 | ) | | 10.0 |
|
| | 2014 vs. 2013 | | 2013 vs. 2012 | $ | (253.7 | ) | | $ | (224.4 | ) |
| Volume | 4.2 | % | | 0.9 | % | |
| Price/Mix | (1.3 | )% | | (0.5 | )% | |
| Merger | 38.3 | % | | — | % | |
| | 41.2 | % | | 0.4 | % | |
Comparison of the Years Ended December 31, 20142017 and December 31, 20132016
Net sales increased duedecreased $253.7 million, or 8.3%, compared to 2016. The net sales decrease was primarily attributable to the continued secular decline in the paper industry.
Adjusted EBITDA decreased $16.0 million, or 20.8%, compared to 2016. The Adjusted EBITDA decrease was largely attributable to the decline in net sales contribution of $613.1 million from the Merger, along with a 2.9% increasesales. The decline in net sales was partially offset by (i) a $16.0 million decrease in distribution expenses and (ii) a $5.2 million decrease in selling and administrative expenses. The decrease in distribution expenses was primarily driven by decreased utilization of the legacy xpedx operations. This increasedistribution network, which is reflected in (i) a decrease in facilities rent and other related expenses and (ii) a decrease in personnel expense. The decrease in selling and administrative expenses was due primarily todriven by a 4.2%decrease in personnel expenses and professional fees, partially offset by an increase in bad debt expense.
Comparison of the Years Ended December 31, 2016 and December 31, 2015
The net sales decrease was primarily attributable to the continued erosion in net sales volume driven by higherfrom the secular decline in the paper industry as well as strategic decisions to exit certain unprofitable customer relationships.
The decline in Adjusted EBITDA was primarily due to lower net sales at existing customers. Thisvolume and was partially offset by a 1.3% unfavorable price mix variance driven primarily by growth$5.4 million reduction in new business at lower margins.selling and general administrative expenses resulting from a decrease in personnel costs.
Adjusted EBITDA increased by $50.2 million as a result of the Merger. The legacy xpedx Adjusted EBITDA declined by $11.1 million as a result of (i) an $8.7 million increase in distribution expenses driven by an increase in sales volume and (ii) a $2.2 million decrease due primarily to lower pricing, and (iii) a $4.6 million increase in personnel expense. These cost increases were offset by a $4.4 million decline in various other expenses.
Comparison of the Years Ended December 31, 2013 and December 31, 2012
The increase in net sales was due primarily to increased sales volume to existing customers.Publishing
The decrease in Adjusted EBITDA is due to (i) cost of sales rising faster than net sales which reduced Adjusted EBITDA by $4.7 million and (ii) an increase in distribution expenses of $4.4 million driven by the increase in packaging revenues as well as reductions in revenues in other segments which had the overall effect of increasing this segment’s share of distribution expenses. These negative variances were partially offset by a $3.0 million reduction in commissions and a $0.4 million decline in various other expenses.
Facility Solutions
The table below presents selected data with respect to the Facility Solutions segment.Publishing segment: | | | | Year Ended December 31, | | 2014 vs. 2013 | | 2013 vs. 2012 | Year Ended December 31, | | 2017 vs. 2016 | | 2016 vs. 2015 |
| (in millions) | 2014 | | 2013 | | 2012 | | Increase (Decrease) % | | Increase (Decrease) % | 2017 | | 2016 | | 2015 | | Increase (Decrease) % | | Increase (Decrease) % |
| Net sales | $ | 1,070.3 |
| | $ | 844.6 |
| | $ | 944.2 |
| | 26.7 | % |
| (10.5 | )% | $ | 958.0 |
| | $ | 1,033.6 |
| | $ | 1,215.5 |
| | (7.3 | )% | | (15.0 | )% |
| Adjusted EBITDA | $ | 33.6 |
| | $ | 14.4 |
| | $ | 19.2 |
| | 133.3 | % | | (25.0 | )% | $ | 26.4 |
| | $ | 23.6 |
| | $ | 34.7 |
| | 11.9 | % | | (32.0 | )% |
| Adjusted EBITDA as a % of net sales | 3.1 | % | | 1.7 | % | | 2.0 | % | | | | | 2.8 | % | | 2.3 | % | | 2.9 | % | | | | |
The table below presents the components of the net sales change compared to the prior year:
|
| | | | | |
| | Increase (Decrease) % |
| | 2014 vs. 2013 | | 2013 vs. 2012 |
| Volume | (12.7 | )% | | (10.6 | )% |
| Price/Mix | 1.2 | % | | 0.1 | % |
| Merger | 38.2 | % | | — | % |
| | 26.7 | % | | (10.5 | )% |
Comparison of the Years Ended December 31, 2014 and December 31, 2013
Net sales increased due primarily to the net sales contribution of $322.8 million from the Merger. This increase was offset by an 11.5% decline in legacy xpedx net sales. The decline in legacy xpedx sales is primarily driven by customer attrition with five customers comprising 8.4% of the decline.
Adjusted EBITDA increased by $16.1 million as a result of the Merger. The legacy xpedx Adjusted EBITDA increased by $3.1 million driven primarily by (i) a $10.8 million reduction in distribution expenses due to a reduction in sales volume, (ii) a $12.6 million impact from cost of products sold declining faster than net sales and (iii) a $1.4 million decline in selling and administrative costs primarily due to less sales commissions resulting from the decline in sales. These improvements were partially offset by a $21.7 million reduction in Adjusted EBITDA driven primarily by the decline in net sales volume.
Comparison of the Years Ended December 31, 2013 and December 31, 2012
The decrease in sales volume is due primarily to (i) $31.8 million in customer losses, (ii) management's decision to reposition its distribution network, which reduced net sales by $8.2 million and (iii) volume declines at existing customers.
The decrease in Adjusted EBITDA is due primarily to the decrease in net sales which reduced Adjusted EBITDA by $19.2 million, partially offset by (i) a $6.0 million decline in selling and administrative wages, benefits and incentive compensation, (ii) a $3.1 million decrease in distribution expenses driven by the decline in sales volumes, (iii) a $2.5 million decrease in commission costs, (iv) a $1.0 million decrease in travel and entertainment expenses, (v) a $1.0 million decline in bad debt expense and (vi) a $0.8 million decline in various other expenses.
Corporate & Other |
| | | | | | | |
| | Increase (Decrease) |
| (in millions) | 2017 vs. 2016 | | 2016 vs. 2015 |
| Volume | $ | (82.5 | ) | | $ | (192.5 | ) |
| Foreign currency | 0.8 |
| | (0.2 | ) |
| Price/Mix | 6.1 |
| | 10.8 |
|
| | $ | (75.6 | ) | | $ | (181.9 | ) |
Comparison of the Years Ended December 31, 20142017 and December 31, 20132016
Net sales decreased $75.6 million, or 7.3%, compared to 2016. The net sales decrease was primarily attributable to a decline in volume, reflecting the continued secular decline in the paper industry.
Adjusted EBITDA decreased by $50.5increased $2.8 million, as a result of the Merger.or 11.9%, compared to 2016. The legacy xpedx Adjusted EBITDA improvedincrease was primarily attributable to the cost of products sold decreasing at a faster rate than net sales and a $1.9 million decrease in selling and administrative expenses partially offset by $17.9 million,a decrease in net sales. The decrease in selling and administrative expenses was primarily driven by a $29.8decrease in personnel expenses.
Comparison of the Years Ended December 31, 2016 and December 31, 2015
The net sales decrease was primarily attributable to the continued erosion in net sales volume from the continued secular decline in the paper industry.
The decline in Adjusted EBITDA was primarily due to lower net sales volume and a $2.9 million reduction in allocated expenses from International Paper, that wasdecrease attributed to cost of products sold decreasing at a slower rate than net sales. These declines were partially offset by a $3.6 million decrease in selling and administrative expenses due to lower commission expense.
Corporate & Other
|
| | | | | | | | | | | | | | | | | |
| | Year Ended December 31, | | 2017 vs. 2016 | | 2016 vs. 2015 |
| (in millions) | 2017 | | 2016 | | 2015 | | Increase (Decrease) % | | Increase (Decrease) % |
| Net sales | $ | 145.5 |
| | $ | 119.8 |
| | $ | 111.2 |
| | 21.5 | % | | 7.7 | % |
| Adjusted EBITDA | $ | (184.3 | ) | | $ | (176.4 | ) | | $ | (186.0 | ) | | (4.5 | )% | | 5.2 | % |
Comparison of the Years Ended December 31, 2017 and December 31, 2016
Net sales increased $25.7 million, or 21.5%, compared to 2016. The net sales increase was primarily attributable to an increase in freight brokerage services.
Adjusted EBITDA decreased $7.9 million, or 4.5% compared to 2016. The Adjusted EBITDA decrease was primarily
driven by (i) cost of products sold increasing at a $10.3faster rate than net sales, (ii) a $9.1 million increase in selling and administrative costs partially offset by an increase in net sales and (iii) a $3.3 million decrease in distribution expenses. The
increase in selling and administrative costs was driven primarily by (i) an increase in personnel costsexpenses primarily driven by increased headcount to support the Company's growth strategy and (ii) a $1.6 million increaselower commission expense in various other expenses.2016 due to the recovery of commission advances, as discussed above.
Comparison of the Years Ended December 31, 20132016 and December 31, 20122015
Net sales increased $8.6 million, or 7.7%, due to continued growth in freight brokerage services.
The Adjusted EBITDA improved fromimprovement was primarily due to (i) the recovery of commission advances and (ii) a loss of $120.1 milliondecrease in corporate personnel costs mainly attributable to a loss of $118.4 million due primarily to a $3.9 million decreasereduction in overhead allocations from International Paper, partially offset by a $2.2 million increase in IT services.incentive compensation.
Liquidity and Capital Resources
The cash requirements of the Company are provided by cash flows from operations and borrowings under the ABL Facility. The following table sets forth a summary of cash flows:
| | | | Year Ended December 31, | Year Ended December 31, |
| (in millions) | 2014 | | 2013 | | 2012 | 2017 | | 2016 | | 2015 |
| Net cash provided by (used for): | | | | | | | | | | |
| Operating activities | $ | 5.0 |
| | $ | 52.2 |
| | $ | 56.0 |
| $ | 36.6 |
| | $ | 140.2 |
| | $ | 113.0 |
|
| Investing activities | 19.9 |
| | 13.2 |
| | (7.5 | ) | (126.2 | ) | | (34.4 | ) | | (44.1 | ) |
| Financing activities | 23.0 |
| | (76.6 | ) | | (46.3 | ) | 99.2 |
| | (89.9 | ) | | (70.4 | ) |
Operating Activities
2014 ComparedAnalysis of Cash Flows
The Company ended 2017 with 2013: Net$80.3 million in cash, provided by operating activities decreased by $47.2an increase of $10.7 million compared to lastduring the year. Cash provided byflow from operations was $36.6 million in 2017 compared with $140.2 million in 2016. The factors driving cash flow from operating activities in 2014 was negatively impacted by approximately $58.4 million of cash outflows for merger and integration expenses.
2013 Compared with 2012: Net cash provided by operating activities decreased by $3.8 million due primarily to $13.2 million of lower income from continuing operations, adjusted to exclude non-cash items and deferred income taxes, partially offset by2017 were: (i) a $7.6$48.3 million increase in cash generated by working capitalaccounts payable and related party payable, (ii) a $1.8$30.1 million decrease in cash used by discontinued operations forinventories, (iii) a $13.6 million increase in other accrued liabilities and (iv) a $15.3 million increase from other operating activities.
Investing Activities
2014 Compared with 2013: Net The increase in cash provided by investingfrom operating activities increased by $6.7 million due primarily to the net cash acquired from the Merger. This increase was partially offset by higherby: (i) a net loss, (ii) a $101.9 million increase in accounts receivable and related party receivable, (iii) an $11.3 million decrease in accrued payroll and benefits and (iv) an $8.4 million increase in other current assets. The Company also generated $167.3 million in cash flow from a net increase in revolving loan borrowings under the ABL Facility and $51.1 million related to proceeds from asset sales. The primary uses of cash during 2017 were: (i) $144.8 million for the acquisition of AAC, (ii) a $40.5 million decline in book overdrafts, (iii) $32.5 million for property and equipment additions, of which $16.1 million were integration-related capital expenditures and lower proceeds from sales of assets as compared$16.4 million were ordinary capital expenditures, (iv) $16.4 million for payments under financing obligations including obligations to last year.
2013 Compared with 2012: Net cash provided by investing activities increased by $20.7 million due primarily to incremental proceeds from the sale of certain assets as compared to 2012, along with lower capital expenditures.
Financing Activities
2014 Compared with 2013: Net cash provided by financing activities was $23.0 million compared to net cash used for financing activities of $76.6related party, (v) $8.5 million for the prior year period. Tax Receivable Agreement payment and (vi) $2.7 million for payments under capital lease obligations.
The current year activity includes netprimary sources of cash during 2016 were: (i) a $69.9 million increase in accounts payable and related party payable, (ii) a $14.3 million increase in other operating activities and (iii) a $13.1 million reduction in inventories. The Company also generated $18.9 million in positive cash flow from an increase in book overdrafts and $6.6 million related to proceeds from the new ABL Facility, as described below, partially offsetasset sales. The primary uses of cash during 2016 were: (i) a $40.9 million decrease in accrued payroll and benefits, (ii) a $14.7 million increase in accounts receivable and related party receivable, (iii) an $11.4 million increase in other current assets, and (iv) a $3.6 million decrease in other accrued liabilities. Cash was also used by $493.1(i) $70.1 million of net cash transfers to Parent and $22.4repayments of revolving loan borrowings under the ABL Facility, (ii) $41.0 million of deferredproperty and equipment additions, of which $25.5 million were integration-related capital expenditures and $15.5 million were ordinary capital expenditures, (iii) $19.9 million of payments under financing feeobligations to related party, (iv) $13.6 million used to repurchase 0.31 million shares of Veritiv outstanding common stock, (v) $3.2 million for payments relatedunder capital lease obligations and (vi) $2.0 million for financing fees incurred in connection with an amendment to the new ABL Facility.
2013 Compared with 2012: Cash used
The primary sources of cash during 2015 were: (i) higher net income compared to 2014, (ii) a $53.4 million reduction in accounts receivable and related party receivable, (iii) $10.5 million from an increase in accrued payroll and benefits and (iv) $3.1 million from other operating activities. The primary uses of cash during 2015 were: (i) a $62.0 million increase in inventories, (ii) $47.0 million of net repayments of revolving loan borrowings under the ABL Facility, (iii) $44.4 million of property and equipment additions, of which $29.4 million were integration-related capital expenditures and $15.0 million were ordinary capital expenditures, (iv) $13.8 million of payments under financing activities for the years ended December 31, 2013 and 2012 primarily represents transactions between xpedx and International Paper. These transactions were consideredobligations to be effectively settled for cash at the time the transaction was recorded. The components of these transactions (or transfers) include (i) cash transfers from xpedx to International Paper, (ii) cash transfers from International Paper to fund xpedx's requirements for working capital and other commitments and (iii)related party, (v) an allocation of International Paper’s corporate expenses.$8.4 million decrease in accounts
payable and related party payable, (vi) a $7.1 million decrease in other accrued liabilities and (vii) $3.8 million in payments under capital lease obligations. Cash was also used for a $5.8 million decrease in book overdrafts.
Funding and Liquidity Strategy
The Spin-off and Merger transactions resulted in a new capital structure and additional sources of liquidity for Veritiv when compared to the historical capital structures of both xpedx and Unisource. In conjunction with the Spin-off and Merger, and to refinance existing debt of Unisource, Veritiv entered into a commitment with a group of lenders forhas a $1.4 billion asset-based lending facility (the "ABL Facility"). The ABL Facility is comprised of U.S. and Canadian sub-facilities of $1,250.0 million and $150.0 million, respectively. The ABL Facility is available to be drawn in U.S. dollars, in the case of the U.S. sub-facilities, and in U.S. dollars or Canadian dollars, in the case of the Canadian sub-facilities, or in other currencies that are mutually agreeable. The Company's accounts receivable and inventories in the U.S. and Canada are collateral under the ABL Facility.
On August 11, 2016, the Company amended the ABL Facility to, among other things, extend the maturity date to August 11, 2021. All other significant terms remained consistent. The ABL Facility will mature and the commitments thereunder will terminate after July 1, 2019, however, it provides for the right of the individual lenders to extend the maturity date of their respective commitments and loans upon the request of Veritiv and without the consent of any other lenders. The ABL Facility may be prepaid at Veritiv's option at any time without premium or penalty and is subject to mandatory prepayment if the amount outstanding under the ABL Facility exceeds either the aggregate commitments with respect thereto or the current borrowing base, in an amount equal to such excess. The Company incurred and deferred $2.0 million of new financing fees associated with the amendment, which are reflected in other non-current assets in the Consolidated Balance Sheets, and will be amortized to interest expense on a straight-line basis over the amended term of the ABL Facility.
The ABL Facility has a springing minimum fixed charge coverage ratio of at least 1.00 to 1.00 on a trailing four-quarter basis, which will be tested only when specified availability is less than limits outlined under the ABL Facility. At December 31, 2014,2017 the above test was not applicable.applicable and is not expected to be applicable in the next 12 months.
Availability under the ABL Facility is determined based upon a monthly borrowing base calculation which includes eligible customer receivables and inventory, less outstanding borrowings, letters of credit and certain designated reserves. As of December 31, 2014,2017, the available additional borrowing capacity under the ABL Facility was approximately $392.0$316.5 million.
Under the terms of the ABL Facility, interest rates are based upon LIBOR or the prime rate plus a margin rate, or in the case of Canada, a banker’s acceptance rate or base rate plus a margin rate. AtFor the years ended December 31, 2014,2017 and December 31, 2016, the weighted-average borrowing interest rate was 2.0%.3.3% and 2.5%, respectively.
On November 23, 2016, the UWWH Stockholder sold 1.76 million shares of Veritiv common stock in an underwritten public offering. Veritiv did not receive any of the proceeds. Concurrently with the closing of the offering, Veritiv repurchased 0.31 million of these offered shares from the underwriters at a price of $42.8625 per share, which is the price at which the underwriters purchased such shares from the selling stockholder, for an aggregate purchase price of approximately $13.4 million. In conjunction with these transactions, Veritiv incurred approximately $0.8 million in transaction-related fees, of which approximately $0.2 million was recorded as part of the cost to acquire the treasury stock and the remainder was included in selling and administrative expenses on the Consolidated Statements of Operations.
Veritiv's ability to fund its capital needs will depend on its ongoing ability to generate cash from operations, and borrowings under the ABL Facility.Facility and funds received from capital markets offerings. If Veritiv's cash flows from operating activities are lower than expected, the Company will need to borrow under the ABL Facility and may need to incur additional debt or issue additional equity. Although management believes that the arrangements currently in place will permit Veritiv to finance its operations on acceptable terms and conditions, the Company’s access to, and the availability of, financing on acceptable terms and conditions in the future will be impacted by many factors, including (i) the liquidity of the overall capital markets and (ii) the current state of the economy.
Veritiv's management expects that the Company's primary future cash needs will be for working capital, capital expenditures, contractual commitments and strategic investments. Additionally, management expects that cash provided by operating activities and available capacity under the ABL Facility will provide sufficient funds to operate the business and meet other liquidity needs.
TheThrough December 31, 2017, the Company currently expectsincurred approximately $221 million in costs and charges associated with achieving anticipated cost savings and other synergies from the Spin-offMerger, including approximately $82 million for capital expenditures and $25 million related to the complete or partial withdrawal from various multi-employer pension plans. The Company anticipates that it will incur additional costs and charges associated with the Merger. The Company is not able to
quantify the total amount of these costs and charges or the period in which they will be incurred as the operating plans affecting these costs are evolving and charges relating to the withdrawal from multi-employer pension plans which have not yet been finalized, are uncertain. Excluding the multi-employer pension plan withdrawal charges, we currently anticipate that total costs associated with the Merger towill be approximately $225.0$225 to $250 million over a five-year period from the Distribution Date,through December 31, 2018, including approximately $55.0$90 million for capital expenditures, primarily consisting of information technology infrastructure, systems integration and planning. Ordinary capital expenditures for 2018 are expected to be in the range of $20 million to $30 million, with another $10 million to $20 million of integration-related capital expenditures during 2018.
All of the cash held by our non-U.S. subsidiaries is available for general corporate purposes. Veritiv considers the earnings of certain non-U.S. subsidiaries to be permanently invested outside the United States on the basis of estimates that future domestic cash generation will be sufficient to meet future domestic cash needs and management's specific plans for reinvestment of those subsidiary earnings. The table below summarizes the Company's cash positions as of December 31, 2017 and 2016:
|
| | | | | | | | |
| | | As of December 31, |
| (in millions) | | 2017 | | 2016 |
| Cash held in the U.S. | | $ | 64.0 |
| | $ | 57.6 |
|
| Cash held in foreign subsidiaries | | 16.3 |
| | 12.0 |
|
| Total Cash | | $ | 80.3 |
| | $ | 69.6 |
|
Off-Balance Sheet Arrangements
Veritiv does not have any off-balance sheet arrangements as of December 31, 2014,2017, other than the operatingOther lease type obligations addressedincluded in the contractual obligations table below under Contractual Obligations and the letters of credit under the ABL Facility as discussed above.Facility. The Company does not have any off-balance sheet arrangements that have or are reasonably likely to have a material current or future effect on its financial condition, revenues or expenses, results of operations, liquidity, capital expenditures or capital resources.
Contractual Obligations
The table below summarizes the Company's contractual and certain other long-term obligations as of December 31, 2014:2017:
| | | | Payment Due by Period | Payment Due by Period |
| (in millions) | 2015 | | 2016 – 2017 | | 2018 – 2019 | | After 2019 | | Total | 2018 | | 2019 – 2020 | | 2021 – 2022 | | After 2022 | | Total |
Equipment capital lease obligations (1) | $ | 4.7 |
| | $ | 6.6 |
| | $ | 1.1 |
| | $ | 0.3 |
| | $ | 12.7 |
| $ | 4.0 |
| | $ | 6.3 |
| | $ | 4.3 |
| | $ | 3.7 |
| | $ | 18.3 |
|
Financing obligations to related party (1,2) | 16.0 |
| | 32.6 |
| | 8.2 |
| | — |
| | 56.8 |
| |
Operating lease obligations (3) | 77.5 |
| | 126.1 |
| | 90.0 |
| | 87.2 |
| | 380.8 |
| |
Financing obligations (including obligations to related party) (1,2) | | 8.8 |
| | 3.3 |
| | 3.5 |
| | 18.7 |
| | 34.3 |
|
Other lease type obligations (3) | | 94.1 |
| | 150.5 |
| | 103.5 |
| | 135.6 |
| | 483.7 |
|
ABL Facility (4) | — |
| | — |
| | 847.8 |
| | — |
| | 847.8 |
| 29.6 |
| | 59.3 |
| | 915.8 |
| | — |
| | 1,004.7 |
|
Deferred compensation (5) | 2.7 |
| | 5.2 |
| | 4.6 |
| | 17.2 |
| | 29.7 |
| 2.6 |
| | 4.9 |
| | 3.9 |
| | 9.2 |
| | 20.6 |
|
Tax Receivable Agreement contingent liability (6) | | 9.9 |
| | 12.4 |
| | 9.9 |
| | 25.5 |
| | 57.7 |
|
AAC contingent liability(7) | | 17.1 |
| | 7.1 |
| | — |
| | — |
| | 24.2 |
|
Multi-employer pension plan ("MEPP") withdrawal obligations (8) | | 0.7 |
| | 1.3 |
| | 1.4 |
| | 9.9 |
| | 13.3 |
|
Federal income tax liability (9) | | 0.5 |
| | 1.0 |
| | 1.0 |
| | 3.7 |
| | 6.2 |
|
| Total | $ | 100.9 |
| | $ | 170.5 |
| | $ | 951.7 |
| | $ | 104.7 |
| | $ | 1,327.8 |
| $ | 167.3 |
| | $ | 246.1 |
| | $ | 1,043.3 |
| | $ | 206.3 |
| | $ | 1,663.0 |
|
(1) Equipment capital lease obligations and financing obligations to related party include amounts classified as interest.
(2) Financing obligations to related party will not result in cash payments in excess of amounts reported above. At the end of the lease term,terms, the net remaining financing obligationobligations of $174.0$155.2 million and $10.6 million will be settled by the return of the assets to the purchaser/landlord.Purchaser/Landlord for the related party and non-related party obligations, respectively.
(3) Non-cancelable operating leases Amounts shown are presented net of contractual sublease rental income.
(4) The ABL Facility will mature and the commitments thereunder will terminate after July 1, 2019.August 11, 2021. Interest payments are not included.included here were estimated using a simple interest method based on the year-end December 31, 2017 ABL Facility outstanding balance of $897.7 million and its corresponding year-end weighted-average interest rate of 3.3%. The 2021 payment amount shown above includes an estimated $897.7 million of principal balance.
(5) Deferred The deferred compensation obligations reflectobligation relates to Unisource's legacy deferred compensation plans and reflects gross cash payment amounts due.
(6) The Tax Receivable Agreement contingent liability reflects gross contingent obligation amounts excluding interest due to related party.
(7) The AAC contingent liability reflects the fair value of the estimated amount to be paid. The maximum amount payable is $50.0 million, payable in up to $25.0 million increments at the first and second anniversaries of the acquisition of AAC on August 31, 2017.
(8) The MEPP withdrawal obligations include final gross unpaid charges for one plan where a determination has been issued.
(9) The federal income tax liability reflects amounts payable over eight years resulting from the transition tax implemented in the Tax Act.
The table above does not include future expected Company contributions to its pension benefit payments.plans nor does it include future expected payments related to the complete or partial withdrawals from various multi-employer pension plans where final determinations have not been made. Information related to the amounts of these future payments is described in Note 910 of the Notes to the Consolidated and Combined Financial Statements. The table above also excludes the liability for uncertain tax positions and for the Veritiv Deferred Compensation Savings Plan as the Company cannot predict with reasonable certainty the timing of future cash settlementsoutflows associated with these liabilities. As a result of the Merger, International Paper has a potential earn-out payment of up to $100.0 million that would become due in 2020. The potential earn-out payment would be reflected by Veritiv as a reduction to equity at the time of payment. Due to the uncertainty of achievement, that potential payment is not included in the table above. The Company has recorded undiscounted charges related to the complete or partial withdrawal from various multi-employer pension plans. Charges not related to the Company's restructuring efforts are recorded as distribution expense. Initial amounts are recorded as other non-current liabilities in the Consolidated Balance Sheets. See the table below for a summary of the net charges and the year-end balance sheet liability positions for the respective taxing authorities.years ended December 31:
|
| | | | | | | | | | | |
| | Year Ended December 31, |
| (in millions) | Restructuring charges, net | | Distribution expenses | | Total Net Charges |
| 2017 | $ | 17.4 |
| | $ | 2.1 |
| | $ | 19.5 |
|
| 2016 | 7.5 |
| | 2.3 |
| | 9.8 |
|
| | | | | | |
| | At December 31, | | |
| | | | | | |
| (in millions) | Other accrued liabilities | | Other non-current liabilities | | |
| 2017 | $ | 0.7 |
| | $ | 27.2 |
| | |
| 2016 | 0.0 |
| | 9.8 |
| | |
See Note 3of the Notes to Consolidated Financial Statements for additional information regarding these restructuring efforts. Final charges for these withdrawals will not be known until the plans issue their respective determinations. As a result, these estimates may increase or decrease depending upon the final determinations. Currently, the Company expects payments will occur over an approximately 20 year period. The Company expects to incur similar types of charges in future periods in connection with its ongoing restructuring activities. As of December 31, 2017, the Company has received determination letters from two plans. Of those, the liability for one was settled with a lump sum payment, while monthly payments for the other plan are expected to occur over an approximately 20 year period.
Critical Accounting Policies and Estimates
The preparation of financial statements in conformity with U.S. GAAP requires the Company to establish accounting policies and utilize estimates that affect both the amounts and timing of the recording of assets, liabilities, net sales and expenses. Some of these estimates require judgment about matters that are inherently uncertain. Different amounts would be reported under different operating conditions or under alternative assumptions.
The Company has evaluated the accounting policies used in the preparation of the accompanying Consolidated and Combined Financial Statements and related Notes and believes those policies to be reasonable and appropriate. Management believes that the accounting estimates discussed below are the most critical accounting policies whose application may have a significant effect on the reported results of operations and financial position of the Company and that can require judgments by management that affect their application.
Revenue Recognition
Revenue is recognized when persuasive evidence of an arrangement exists, the price is fixed or determinable, collectability is reasonably assured and delivery has occurred. Revenue is recognized when the customer takes title and assumes the risks and rewards of ownership. When management cannot conclude collectability is reasonably assured for shipments to a particular customer, revenue associated with that customer is not recognized until cash is collected or management is otherwise able to establish that collectability is reasonably assured.
Revenue is recorded at the time of shipment for customer terms designated f.o.b. (free on board) shipping point. For salesSales transactions with customers are designated free on board ("f.o.b.") destination and revenue is recorded when the product is delivered to the customer’s delivery site, when title and risk of loss are transferred. ShippingEffective January 1, 2016, the Company harmonized its shipping terms areto be f.o.b. destination. Prior to that date, revenue was recorded at the time of shipment for certain xpedx customers whose terms were designated f.o.b. shipping point. Management determined onthat any shipments in transit at December 31, 2015 would honor the f.o.b. destination terms resulting in a customer-by-customer or order-by-order basis.reduction of $27.0 million and $1.8 million to net sales and operating income, respectively, for the year ended December 31, 2015.
Certain revenues are derived from shipments arranged by the Company made directly from a manufacturer to a customer. The Company is considered to be a principal to these transactions because, among other factors, it controls pricing to the customer and bears the credit risk of the customer defaulting on payment and is the primary obligor. Revenues from these sales are reported on a gross basis in the Consolidated and Combined Statements of Operations and amounted to $2.9$3.0 billion, $2.4$3.0 billion and $2.5$3.3 billion for the years ended December 31, 2014, 20132017, 2016 and 2012,2015, respectively.
The Company adopted Accounting Standards Update 2014-09, Revenue from Contracts with Customers (Topic 606), and its related interpretationson January 1, 2018 applying the modified retrospective method. The adoption did not materially impact the Company's financial statements and is not expected to have a material impact on future financial results as the adoption did not change the recognition pattern for the Company's existing revenue streams.
MergerAcquisition and Integration Expenses
The Company's Consolidated and Combined Statements of Operations includesinclude a line item titled, "Merger"Acquisition and Integration Expenses". MergerAcquisition and Integration Expenses is not a defined term in U.S. GAAP, thus management must use judgment in determining whether a particular expense should be classified as a mergeran acquisition and integration expense. Management believes its accounting policy for mergeracquisition and integration expenses is critical because these costs are expectedhave been significant and will continue to be significant over the next few years,in 2018, will generally involve cash expenditures, are not defined in U.S. GAAP, are excluded in determining compliance with the Company's ABL credit facility,Facility and are excluded in determining management compensation.
Under Veritiv's accounting policy for mergerAcquisition and integration expenses merger expenses include advisory, legal and other professional fees directly associated with the Merger. Integration expenses includeinternally dedicated integration management resources, retention compensation, information technology conversion costs, rebranding, professional services and project management fees, retention compensation, termination benefits (including change-in-control bonuses), rebranding and other redundant costs to integrate the combined businesses of xpedx and Unisource.its businesses. See Note 23 of the Notes to Consolidated and Combined Financial Statements for a breakdown of the major components of these expenses.Acquisition and integration expenses are differentiated from restructuring charges as restructuring charges primarily relate to contract termination costs, involuntary termination benefits and other direct costs associated with consolidating facilities and reorganizing functions.
Allowance for Doubtful Accounts
The allowance for doubtful accounts reflects the best estimate of losses inherent in the Company's accounts receivable portfolio determined on the basis of historical experience, specific allowances for known troubled accounts and other available evidence. The allowances contain uncertainties because the calculation requires management to make assumptions and apply judgment regarding the customer’s credit worthiness. We performVeritiv performs ongoing evaluations of ourits customers’ financial condition and adjustadjusts credit limits based upon payment history and the customer’s current credit worthiness, as determined by ourits review of their current financial information. WeThe Company continuously monitormonitors collections from ourits customers and maintainmaintains a provision for estimated credit losses based upon ourthe customers’ financial condition, our collection experience and any other relevant customer specific information. OurVeritiv's assessment of this and other information forms the basis of ourits allowances.
If the financial condition of ourVeritiv's customers deteriorates, resulting in an inability to make required payments to us,the Company, or if economic conditions deteriorate, additional allowances may be deemed appropriate or required. If the allowance for doubtful accounts changed by 0.1% of gross billed receivables, reflecting either an increase or decrease in expected future write-offs, the impact to consolidated pre-taxpretax income would have been approximately $1.2 million.
Purchase Incentives and Customer Rebates
Veritiv receives purchase incentives from its suppliers through volume-based and cost-supported arrangements. Volume-based agreements are based on purchases made from suppliers and may require the attainment of specific thresholds before rebates are earned. Volume-based purchase incentives are typically earned over a monthly, quarterly or annual period, and some agreements may be retroactive to the first purchase of the period. Under cost-supported arrangements, Veritiv earns purchase incentives from suppliers based on achieving certain sales thresholds with specific customers. In these arrangements, suppliers provide rebates to Veritiv to lower the overall cost of the product sold to customers. Cost-supported rebates are typically paid to Veritiv on a weekly or monthly basis as Veritiv provides documentation to suppliers of sales to specified customers. Other current assets in the Consolidated and Combined Balance Sheets included $58.1 million and $18.4 million as of December 31, 2014 and 2013, respectively, of anticipated amounts of volume-based and cost-supported rebates not yet received. Purchase incentives are recorded as a reduction in inventory and recognized in cost of products sold as the product is sold.
Veritiv also enters into volume-based incentive agreements with its customers, which are generally based on customers attaining specific purchasing levels from Veritiv. Incentive rebates are calculated on a given customer’s purchases relative to a volume threshold over a monthly, quarterly or annual period. Customer rebates can include all products purchased, or may be limited to purchases of specific products. Veritiv records estimated rebates to customers as a reduction to gross sales as customer revenue is recognized. Other accrued liabilities in the Consolidated and Combined Balance Sheets included $24.1 million and $12.8 million as of December 31, 2014 and 2013, respectively, of anticipated amounts not yet paid.
Inventories
We record inventory at the lower of LIFO cost or market value. We reduce the value of obsolete and inactive inventory based on the difference between the LIFO cost of the inventory and the estimated market value using assumptions of future demand and market conditions. To estimate the net realizable value, we consider factors such as age of the inventory, the
nature of the products, the quantity of items on-hand relative to sales trends, current market prices and trends in pricing, our ability to use excess supply in another channel, historical write-offs and expected residual values or other recoveries. If actual demand or market conditions are less favorable than those projected by management or if the integration of the legacy businesses results in the identification of additional inventory to be disposed of for less than cost, additional charges may be required.
Impairment or Disposal of Long-Lived Assets and Goodwill
The Company completed the Merger in July 2014. The process of integrating the two companies has begun, but will continue for some time. The Company used various valuation methodologies to estimate the fair value of assets acquired and liabilities assumed, including using a market participant perspective when applying cost, income and relief from royalty analyses, supplemented with market appraisals where appropriate. Pension and other benefits plans were revalued using current estimates of interest and earnings rates, as well as cost trends. Significant judgments and estimates were required in preparing these fair value estimates.
Intangible assets acquired in the Merger are naturally more susceptible to impairment, primarily due to the fact that they are recorded at fair value based on recent operating plans and macroeconomic conditions present at the time of acquisition. Consequently, if operating results and/or macroeconomic conditions deteriorate shortly after an acquisition, it could result in the impairment of the acquired assets. A deterioration of macroeconomic conditions may not only negatively impact the estimated operating cash flows used in our cash flow models, but may also negatively impact other assumptions used in our analyses, including, but not limited to, the estimated cost of capital and/or discount rates. Additionally, we are required to ensure that assumptions used to determine fair value in our analyses are consistent with the assumptions a marketplace participant would use. As a result, the cost of capital and/or discount rates used in our analyses may increase or decrease based on market conditions and trends, regardless of whether our Company’s actual cost of capital has changed. Therefore, if the cost of capital and/or discount rates change, our Company may recognize an impairment of an intangible asset in spite of realizing actual cash flows that are approximately equal to, or greater than, our previously forecasted amounts.
An impairment of a long-lived asset exists when the asset’s carrying amount exceeds its expected future undiscounted cash flows and is recorded at its estimated fair value. Goodwill impairment exists when the carrying amount of goodwill exceeds its fair value. Assessments of possible impairments of long-lived assets and goodwill are made in the fourth quarter, and when events or changes in circumstances indicate that the carrying value of the asset may not be recoverable through future operations. Additionally, testing for possible impairment of goodwill and indefinite-lived intangible asset balances is required annually. The Company currently does not have any indefinite-lived intangible assets.
The amount and timing of any impairment charges based on these assessments require the estimation of future cash flows and the fair market value of the related assets based on management’s best estimates of certain key factors. These key factors include future selling prices and volumes, operating, inventory, energy and freight costs and various other projected operating economic factors. As these key factors change in future periods, the Company will update its impairment analyses to reflect the latest estimates and projections.
The testing of goodwill for possible impairment is a two-step process. In the first step, the fair value of the reporting unit is compared with its carrying value, including goodwill. If fair value exceeds the carrying value, goodwill is not considered to be impaired. If the fair value of a reporting unit is below the carrying value, then step two is performed to measure the amount of the goodwill impairment loss for the reporting unit. This analysis requires the determination of the fair value of all of the individual assets and liabilities of the reporting unit, including any currently unrecognized intangible assets, as if the reporting unit had been purchased on the analysis date. Once these fair values have been determined, the implied fair value of the unit’s goodwill is calculated as the excess, if any, of the fair value of the reporting unit determined in step one over the fair value of the net assets determined in step two. The carrying value of goodwill is then reduced to this implied value, or to zero if the fair value of the assets exceeds the fair value of the reporting unit, through a goodwill impairment charge.
The impairment analysis requires a number of judgments by management. In calculating the estimated fair value of its reporting units in step one, Veritiv uses the projected future cash flows to be generated by each unit over the estimated remaining useful operating lives of the unit’s assets, discounted using the estimated cost-of-capital discount rate for each reporting unit. These calculations require many estimates, including discount rates, future growth rates and cost and pricing trends for each reporting unit. Subsequent changes in economic and operating conditions can affect these assumptions and could result in additional interim testing and goodwill impairment charges in future periods. Upon completion, the resulting
estimated fair values are then analyzed for reasonableness by comparing them to earnings multiples for historic industry business transactions and by comparing the sum of the reporting unit fair values to the fair value of the Company as a whole.
No long-lived asset or goodwill impairment charges were recorded during the years ended December 31, 2014, 2013 and 2012.
Employee Benefit Plans
In conjunction with the Merger, Veritiv assumed responsibility for Unisource’ssponsors defined benefit plans and Supplemental Executive Retirement Plans ("SERP") in the U.S. and Canada. These plans were frozen prior to the Merger. See Note 910 of the Notes to Consolidated and Combined Financial Statements for more information about these plans.
Management is required to make certain critical estimates related to actuarial assumptions used to determine ourthe Company's pension expense and related obligation. We believeThe Company believes the most critical assumptions are related to (i) the discount rate used to determine the present value of the liabilities and (ii) the expected long-term rate of return on plan assets. All of ourthe actuarial assumptions are reviewed annually. Changes in these assumptions could have a material impact on the measurement of our pension expense and the related obligation.
At each measurement date, we determinemanagement determines the discount rate by reference to rates of high-quality, long-term corporate bonds that mature in a pattern similar to the future payments we anticipate makinganticipated to be made under the plans. As of December 31, 2014,2017, the weighted-average discount rates used to compute ourthe benefit obligations was 3.75%were 3.33% and 4.00%3.40% for the U.S. and Canadian plans, respectively.
The expected long-term rate of return on plan assets is based upon the long-term outlook of ourthe investment strategy as well as our historical returns and volatilities for each asset class. WeVeritiv also reviewreviews current levels of interest rates and inflation to assess the reasonableness of ourthe long-term rates. OurThe Company's pension plan investment objective is to ensure all of ourits plans have sufficient funds to meet their benefit obligations when they become due. As a result, the Company periodically revises asset allocations, where appropriate, to improve returns and manage risk. The weighted-average expected long-term rate of return used to calculate ourthe pension expense for the year ended 2017 was 8.00%7.15% and 5.75%5.50% for the U.S. and Canadian plans, respectively.
The following illustrates the effects of a 1% change in the discount rate or return on plan assets on the 20142017 net periodic pension cost and projected benefit obligation (in millions):
| | | Assumption | | Change | | Net Periodic Benefit Cost | | Projected Benefit Obligation | | Change | | Net Periodic Benefit Cost | | Projected Benefit Obligation |
| Discount rate | | 1% increase | | $0.2 | | $(22.3) | | 1% increase | | $(0.2) | | $(4.5) |
| | | 1% decrease | | (0.3) | | 28.1 | | 1% decrease | | 0.7 | | 6.7 |
| Return on plan assets | | 1% increase | | (0.7) | | N/A | | 1% increase | | (1.4) | | N/A |
| | | 1% decrease | | 0.7 | | N/A | | 1% decrease | | 1.4 | | N/A |
Fair Value of Nonfinancial Assets and Liabilities
We define fair value as the price that would be received from the sale of an asset or paid to transfer a liability in the principal or most advantageous market for the asset or liability in an orderly transaction between market participants on the measurement date.
We measure certain nonfinancial assets and nonfinancial liabilities at fair value on a nonrecurring basis. These assets and liabilities include assets acquired and liabilities assumed in an acquisition, and property and equipment and goodwill and other intangible assets that are written down to fair value when they are held for sale or determined to be impaired. Given the nature of nonfinancial assets and liabilities, evaluating their fair value from the perspective of a market participant is inherently complex. Assumptions and estimates about future values can be affected by a variety of internal and external factors. Changes in these factors may require us to revise our estimates and could result in future impairment charges for goodwill and acquired intangible assets, or retroactively adjust provisional amounts that we have recorded for the fair values of assets and liabilities in connection with business combinations. These adjustments could have a material impact on our financial condition and results of operations.
Income Taxes
Veritiv's income tax expense, deferred tax assets and liabilities, and liabilities for unrecognized tax benefits reflect management’s best assessment of estimated current and future taxes to be paid. Veritiv records its global tax provision based on the respective tax rules for the jurisdictions in which it operates. Where Veritiv believes that a tax position is supportable for income tax purposes, the item is included in the appropriate income tax filings. Where treatment of a position is uncertain, liabilities are recorded based upon an evaluation of the more likely than not outcome considering technical meritsNotes to Consolidated Financial Statements for a comprehensive discussion of Veritiv's pension and post-retirement benefit expense, including a discussion of the position. Changes to recorded liabilities are made only when an identifiable event occurs that altersactuarial assumptions, the likely outcome, such as settlement withpolicy for recognizing the relevant tax authority,associated gains and losses and the expiration of statutes of limitation for the subject tax year, change in tax laws or a recent court case that addresses the matter. Significant judgments and estimates are required in determining the consolidated income tax expense.
Valuation allowances are recorded to reduce deferred tax assets when it is more likely than not that a tax benefit will not be realized. Significant judgment is required in evaluating the need for and amount of valuation allowances against deferred tax assets. The realization of these assets is dependent on generating sufficient future taxable income.
Veritiv's most significant deferred tax asset is for net operating loss ("NOL") carryforwards. The NOL carryforwards at December 31, 2014 available to offset future taxable income primarily consist of $312.5 million, $230.0 million and $34.4 million in federal, state and foreign (primarily Canada) NOL carryforwards, respectively. In order to fully utilize these NOL carryforwards, Veritiv must generate taxable income prior to the expiration of these carryforwards. The NOL carryforwards will expire at various dates from 2015 to 2034, with the exception of certain foreign NOL carryforwards that do not expire but have a full valuation allowance.
The Merger resulted in a significant change in the ownership of Veritiv which, pursuant to the Internal Revenue Code Section 382, limits Veritiv’s ability to utilize its U.S. federal and state NOL carryforwards on an annual basis. Veritiv’s NOL carryforwards will continue to be available to offset taxable income (until such NOL carryforwards are either utilized or expire) subject to the Section 382 annual limitation and an increase for built-in gains recognized within a 60-month period following the ownership change to the extent of total unrealized built-in gains. If the annual limitation amount is not fully utilized in a particular tax year, then the unused portion from that particular tax year will be added to the annual limitation in subsequent years.
As of December 31, 2014, Veritiv has a valuation allowance of $41.8 million established against its federal, state, and foreign NOL carryforwards and other foreign deferred tax assets. This valuation allowance has been established in part due to the Section 382 limitations resulting from the Merger and subsequent ownership change, and in part due to Veritiv’s expected inability to utilize the NOL carryforwards prior to their expiration.
In analyzing the future realization of Veritiv's deferred tax assets, management evaluated all available positive and negative evidence and determined that it was more likely than not that the remaining deferred tax assets will be realized. In this analysis, management has considered reversals of deferred tax liabilities, projected future taxable income, available tax-planning strategies, and results of recent operations. In projecting future taxable income, management begins with historical results and incorporates assumptions about the amount of future federal, state and foreign pre-tax operating income. The assumptions about future taxable income require significant judgment and are consistent with Veritiv's plans and estimatesmethod used to manage the underlying businesses.
While Veritiv does not have an earnings history prior to the Merger, both Unisourceestimate service and xpedx generated income on a stand-alone basis in recent years, with the exception of certain legacy Unisource foreign entities. Veritiv has generated a loss in the current year. This loss is primarily attributable to the significant one-time expenses incurred relating to the Merger and subsequent integration. As these expenses start to decrease, and as expected synergies are realized, Veritiv expects to return to profitability. Despite these losses, Veritiv is projecting sufficient income to support the utilization of the tax attributes and realization of the deferred tax assets on a more likely than not basis. As a result of the historical stand-alone results and the forecast of future taxable income, Veritiv believes the positive evidence significantly outweighs the negative evidence. Therefore, Veritiv currently believes that it is more likely than not that the remaining net deferred tax assets will be realized.
Should Veritiv fail to generate income in the future for a sustained period, an additional valuation allowance may be required. Future changes in the valuation allowance, if required, should not affect Veritiv's liquidity or compliance with any existing debt covenants.
All legacy Unisource foreign jurisdictions have generated losses in recent years, leading to uncertainty about the ability to generate income in the future. In evaluating both the positive and negative evidence, management has concluded that it is more likely that not that Veritiv will be unable to realize the benefit of these foreign deferred tax assets. Furthermore, the Merger had no impact on the filing positions of these jurisdictions. Approximately $15.7 million of the valuation allowance is against Veritiv's foreign NOL carryforwards and other foreign deferred tax assets. In contrast, the legacy xpedx foreign jurisdictions have shown consistent and cumulative income. As such, no valuation allowance has been recorded against these deferred tax assets.
Veritiv records unrecognized tax benefits as liabilities in accordance with ASC 740, interest cost components.Income Taxes, and adjusts these liabilities when the judgment changes as a result of the evaluation of new information not previously available. While management believes that these judgments and estimates are appropriate and reasonable under the circumstances, actual resolution of these matters may differ from recorded estimated amounts.
Veritiv's effective tax rate was 9.7%, 100.0% and 38.7% for the years ended December 31, 2014, 2013 and 2012, respectively. If the effective tax rate used for financial reporting purposes changed by 1.0%, Veritiv would have recognized an increase or decrease to income taxes of approximately $0.2 million for both the years ended December 31, 2014 and 2012, with no change to income taxes for the year ended December 31, 2013. Over time, the Company estimates its effective tax rate will be approximately 38-40%. However, it may vary significantly due to potential changes in the amount and mix of pre-tax book income and changes in amounts of non-deductible expenses and other items impacting the effective tax rate.
Cash as of December 31, 2014 consisted of $47.7 million held in the U.S. and $9.9 million held in our foreign subsidiaries. All of the cash held by our foreign subsidiaries is available for general corporate purposes. Veritiv considers the earnings of certain non-U.S. subsidiaries to be indefinitely invested outside the United States on the basis of estimates that future domestic cash generation will be sufficient to meet future domestic cash needs and management's specific plans for reinvestment of those subsidiary earnings. As of December 31, 2014, Veritiv’s tax basis is in excess of its financial reporting basis of certain investments in non-U.S. subsidiaries. The Company does not believe these temporary differences will reverse in the foreseeable future and, therefore, no deferred tax asset has been recognized with respect to these basis differences. The Company does have unremitted foreign earnings of approximately $20.4 million with respect to certain of its non-U.S. subsidiaries that would be taxable as dividends if repatriated to the U.S. The estimated income and withholding tax liability associated with the remittance of these earnings would be approximately $8.0 million. The Company has not recorded a deferred tax liability associated with these unremitted earnings.
Recently Issued Accounting Standards
See Note 1 of the Notes to the Consolidated and Combined Financial Statements for information regarding recently issued accounting standards.
ITEM 7A. QUANTITATIVE AND QUALITATIVE DISCLOSURES ABOUT MARKET RISK
Veritiv is exposed to the impact of interest rate changes, foreign currency fluctuations, primarily related to the Canadian dollar, and fuel price changes. The Company's objective is to identify and understand these risks and implement strategies to manage them. When evaluating potential strategies, Veritiv evaluates the fundamentals of each market and the underlying accounting and business implications. To implement these strategies, the Company may enter into various hedging or similar transactions. The sensitivity analyses presented below do not consider the effect of possible adverse changes in the general economy, nor do they consider additional actions the Company may take from time to time in the future to mitigate the exposure to these or other market risks. There can be no assurance that Veritiv will manage or continue to manage any risks in the future or that any of its efforts will be successful.
Derivative Instrument
Borrowings under the ABL Facility bear interest at a variable rate, based on LIBOR or the prime rate, in either case plus an applicable margin. From time to time, Veritiv may use interest rate swap agreements to manage the variable interest rate characteristics on a portion of the outstanding debt. The Company evaluates its outstanding indebtedness, market conditions, and the covenants contained in the ABL Facility in order to determine its tolerance for potential increases in interest expense that could result from changes in variable interest rates. In July 2015, the Company entered into an interest rate cap agreement. The interest rate cap effectively limits the floating LIBOR-based portion of the interest rate. The interest rate cap expires on July 1, 2019. The initial notional amount of this agreement covered $392.9 million of the Company’s floating-rate debt at 3.0% plus the applicable credit spread. The Company paid $2.0 million for the interest rate cap agreement. Approximately $0.6 million of the amount paid represented transaction costs and was expensed immediately to earnings.
The Company designated the interest rate cap as a cash flow hedge of exposure to changes in cash flows due to changes in the LIBOR-based portion of the interest rate above 3.0% on an equivalent amount of debt. The notional amount of the cap is reduced throughout the term of the agreement to align with the expected repayment of the Company’s outstanding floating-rate debt.
At December 31, 2017, the fair value of the interest rate cap was not significant. The amount expected to be reclassified from accumulated other comprehensive loss into earnings during the next 12 months is approximately $0.7 million. During 2017 the amount reclassified into earnings as an adjustment to interest expense was not significant.
The Company is exposed to counterparty credit risk for nonperformance and, in the event of nonperformance, to market risk for changes in the interest rate. The Company attempts to manage exposure to counterparty credit risk primarily by selecting only counterparties that meet certain credit and other financial standards. The Company believes there has been no material change in the creditworthiness of its counterparty and believes the risk of nonperformance by such party is minimal. For additional information regarding Veritiv's interest rate swap, see Note 6 of the Notes to Consolidated Financial Statements.
Interest Rate Risk
Veritiv’s exposure to fluctuations in interest rates results primarily from its borrowings under the ABL Facility. Under the terms of the ABL Facility, interest rates are based upon LIBOR or the prime rate plus a margin rate, or in the case of Canada, a banker’s acceptance rate or base rate plus a margin rate. LIBOR based loans can be set for durations of one week, or for periods of one to nine months. The margin rate amount can be adjusted upward or downward based upon usage under the line in two increments of 25 basis points. Veritiv’s interest rate exposure under the ABL Facility results from changes in LIBOR, bankers’ acceptance rates, the prime/base interest rates and actual borrowings. The weighted-average borrowing interest rate at December 31, 20142017 was 2.0%3.3%. Based on the average borrowings under the ABL Facility during the six monthsyear ended December 31, 2014,2017, a hypothetical 100 basis point increase in the interest rate would result in approximately $7.9$8.5 million of additional interest expense.
Foreign Currency Exchange Rate Risk
Veritiv conducts business in various foreign currencies and is exposed to earnings and cash flow volatility associated with changes in foreign currency exchange rates. This exposure is primarily related to international assets and liabilities, whose value could change materially in reference to the U.S. dollar reporting currency. The most significant impact of changes to foreign currency values include certain intercompany loans and advances not deemed to be permanently invested and transactions denominated in currencies which differ from Veritiv’s own currency.
Veritiv’s most significant foreign currency exposure primarily relates to fluctuations in the foreign exchange rate between the U.S. dollar and the Canadian dollar. Net sales from Veritiv’s Canadian operations for the year ended December 31, 20142017 represented approximately 6%8% of Veritiv’s total net sales. Veritiv has not used foreign exchange currency options or futures agreements to hedge its exposure to changes in foreign exchange rates.
Fuel Price Risk
Due to the nature of ourVeritiv's distribution business, we arethe Company is exposed to potential volatility in fuel prices. The cost of fuel affects the price paid by us for products as well as the costs incurred to deliver products to ourthe Company's customers. The price and availability of diesel fuel fluctuates due to changes in production, seasonality and other market factors generally outside of ourthe Company's control. Increased fuel costs may have a negative impact on ourthe Company's results of operations and financial condition. In times of higher fuel prices, weVeritiv may have the ability to pass a portion of ourthe increased costs on to our customers; however, there can be no assurance that wethe Company will be able to do so. Based on our 2014Veritiv's 2017 fuel consumption, on a combined basis, a 10% increase in the average annual price per gallon of diesel fuel would result in a potential increase of approximately $5.0$3.0 million in our annual transportation fuel costs (excluding any amounts recovered from customers). We doVeritiv does not use derivatives to manage ourits exposure to fuel prices.
ITEM 8. FINANCIAL STATEMENTS AND SUPPLEMENTARY DATA
TABLE OF CONTENTS
Report of Independent Registered Public Accounting Firm
REPORT OF INDEPENDENT REGISTERED PUBLIC ACCOUNTING FIRM
To the Shareholders and Board of Directors and Shareholders of
Veritiv Corporation
Norcross, Georgia
Opinion on the Financial Statements
We have audited the accompanying consolidated and combined balance sheets of Veritiv Corporation and subsidiaries (the "Company") as of December 31, 20142017 and 2013,2016, and the related consolidated and combined statements of operations, comprehensive income (loss), shareholders'shareholders’ equity, and cash flows for each of the three years in the period ended December 31, 2014. 2017, and the related notes (collectively referred to as the "financial statements"). In our opinion, the financial statements present fairly, in all material respects, the financial position of the Company as of December 31, 2017 and 2016, and the results of its operations and its cash flows for each of the three years in the period ended December 31, 2017, in conformity with accounting principles generally accepted in the United States of America.
We have also audited, in accordance with the standards of the Public Company Accounting Oversight Board (United States) (PCAOB), the Company's internal control over financial reporting as of December 31, 2017, based on criteria established in Internal Control — Integrated Framework (2013) issued by the Committee of Sponsoring Organizations of the Treadway Commission and our report dated March 1, 2018, expressed an unqualified opinion on the Company's internal control over financial reporting.
Basis for Opinion
These financial statements are the responsibility of the Company's management. Our responsibility is to express an opinion on the Company's financial statements based on our audits. We are a public accounting firm registered with the PCAOB and are required to be independent with respect to the Company in accordance with the U.S. federal securities laws and the applicable rules and regulations of the Securities and Exchange Commission and the PCAOB
We conducted our audits in accordance with the standards of the Public Company Accounting Oversight Board (United States).PCAOB. Those standards require that we plan and perform the audit to obtain reasonable assurance about whether the financial statements are free of material misstatement. The Company is not requiredmisstatement, whether due to have, nor were we engaged to perform, an audit of its internal control over financial reporting.error or fraud. Our audits included considerationperforming procedures to assess the risks of internal control overmaterial misstatement of the financial reporting as a basis for designing auditstatements, whether due to error or fraud, and performing procedures that are appropriate in the circumstances, but not for the purpose of expressing an opinion on the effectiveness of the Company's internal control over financial reporting. Accordingly, we express no such opinion. An audit also includesrespond to those risks. Such procedures included examining, on a test basis, evidence supportingregarding the amounts and disclosures in the financial statements, assessingstatements. Our audits also included evaluating the accounting principles used and significant estimates made by management, as well as evaluating the overall presentation of the financial statement presentation.statements. We believe that our audits provide a reasonable basis for our opinion.
In our opinion, such consolidated and combined financial statements present fairly, in all material respects, the financial position of Veritiv Corporation and subsidiaries as of December 31, 2014 and 2013, and the results of their operations and their cash flows for each of the three years in the period ended December 31, 2014, in conformity with accounting principles generally accepted in the United States of America.
As discussed in Note 1 to the consolidated and combined financial statements, on July 1, 2014, UWW Holdings, Inc. was merged with and into the Company. Prior to July 1, 2014, the Company was comprised of the assets and liabilities used in managing the xpedx business of International Paper Company. For periods prior to July 1, 2014, the combined financial statements include expense allocations for certain corporate functions historically provided by International Paper Company. These allocations may not be reflective of the actual expenses which would have been incurred had the Company operated as a separate entity apart from International Paper Company.
/s/ Deloitte & Touche LLP
Cincinnati, OhioAtlanta, Georgia
March 24, 20151, 2018
We have served as the Company's auditor since 2013.
VERITIV CORPORATION
CONSOLIDATED AND COMBINED STATEMENTS OF OPERATIONS
(in millions, except share and per share data)
|
| | | | | | | | | | | |
| | Year Ended December 31, |
| | 2014 | | 2013 | | 2012 |
| Net sales (including sales to related parties of $42.7, $53.0 and $65.1 for 2014, 2013 and 2012, respectively) | $ | 7,406.5 |
| | $ | 5,652.4 |
| | $ | 6,012.0 |
|
| Cost of products sold (including purchases from related parties of $412.6, $604.4 and $639.0 for 2014, 2013 and 2012, respectively) (exclusive of depreciation and amortization shown separately below) | 6,180.9 |
| | 4,736.8 |
| | 5,036.7 |
|
| Distribution expenses | 426.2 |
| | 314.2 |
| | 324.0 |
|
| Selling and administrative expenses | 689.1 |
| | 548.2 |
| | 580.6 |
|
| Depreciation and amortization | 37.6 |
| | 17.1 |
| | 14.0 |
|
| Merger and integration expenses | 75.1 |
| | — |
| | — |
|
| Restructuring charges | 4.0 |
| | 37.9 |
| | 35.1 |
|
| Operating income (loss) | (6.4 | ) | | (1.8 | ) | | 21.6 |
|
| Interest expense, net | 14.0 |
| | — |
| | — |
|
| Other expense (income), net | 1.2 |
| | (2.2 | ) | | (1.9 | ) |
| Income (loss) from continuing operations before income taxes | (21.6 | ) | | 0.4 |
| | 23.5 |
|
| Income tax expense (benefit) | (2.1 | ) | | 0.4 |
| | 9.1 |
|
| Income (loss) from continuing operations | (19.5 | ) | | (0.0 | ) | | 14.4 |
|
| Income (loss) from discontinued operations, net of income taxes | (0.1 | ) | | 0.2 |
| | (10.0 | ) |
| Net income (loss) | $ | (19.6 | ) | | $ | 0.2 |
| | $ | 4.4 |
|
| | | | | | |
| Earnings (loss) per share: | | | | | |
| Basic and diluted | | | | | |
| Continuing operations | $ | (1.61 | ) | | $ | (0.00 | ) | | $ | 1.76 |
|
| Discontinued operations | (0.01 | ) | | 0.02 |
| | (1.23 | ) |
| Basic and diluted earnings (loss) per share | $ | (1.62 | ) | | $ | 0.02 |
| | $ | 0.53 |
|
| | | | | | |
| Weighted-average shares outstanding – basic and diluted | 12,080,000 |
| | 8,160,000 |
| | 8,160,000 |
|
|
| | | | | | | | | | | |
| | Year Ended December 31, |
| | 2017 | | 2016 | | 2015 |
| Net sales (including sales to related party of $32.2, $35.6 and $33.6, respectively) | $ | 8,364.7 |
| | $ | 8,326.6 |
| | $ | 8,717.7 |
|
| Cost of products sold (including purchases from related party of $181.6, $224.9 and $264.7, respectively) (exclusive of depreciation and amortization shown separately below) | 6,846.6 |
| | 6,826.4 |
| | 7,160.3 |
|
| Distribution expenses | 516.9 |
| | 505.1 |
| | 521.8 |
|
| Selling and administrative expenses | 872.6 |
| | 826.2 |
| | 853.9 |
|
| Depreciation and amortization | 54.2 |
| | 54.7 |
| | 56.9 |
|
| Acquisition and integration expenses | 36.5 |
| | 25.9 |
| | 34.9 |
|
| Restructuring charges, net | 16.7 |
| | 12.4 |
| | 11.3 |
|
| Operating income | 21.2 |
| | 75.9 |
| | 78.6 |
|
| Interest expense, net | 31.2 |
| | 27.5 |
| | 27.0 |
|
| Other (income) expense, net | (8.1 | ) | | 7.6 |
| | 6.7 |
|
| Income (loss) before income taxes | (1.9 | ) | | 40.8 |
| | 44.9 |
|
| Income tax expense | 11.4 |
| | 19.8 |
| | 18.2 |
|
| Net income (loss) | $ | (13.3 | ) | | $ | 21.0 |
| | $ | 26.7 |
|
| | | | | | |
| Earnings (loss) per share: | | | | | |
| Basic earnings (loss) per share | $ | (0.85 | ) | | $ | 1.31 |
| | $ | 1.67 |
|
| Diluted earnings (loss) per share | $ | (0.85 | ) | | $ | 1.30 |
| | $ | 1.67 |
|
| | | | | | |
| Weighted-average shares outstanding: | | | | | |
| Basic | 15.70 |
| | 15.97 |
| | 16.00 |
|
| Diluted | 15.70 |
| | 16.15 |
| | 16.00 |
|
See accompanying Notes to Consolidated and Combined Financial Statements.
VERITIV CORPORATION
CONSOLIDATED AND COMBINED STATEMENTS OF COMPREHENSIVE INCOME (LOSS)
(in millions)
| | | | Year Ended December 31, | Year Ended December 31, |
| | 2014 | | 2013 | | 2012 | 2017 | | 2016 | | 2015 |
| Net income (loss) | $ | (19.6 | ) | | $ | 0.2 |
| | $ | 4.4 |
| $ | (13.3 | ) | | $ | 21.0 |
| | $ | 26.7 |
|
| Other comprehensive income (loss): | | | | | | | | | | |
| Foreign currency translation adjustments | (10.0 | ) | | 1.4 |
| | 1.8 |
| |
| Pension liability adjustments, net of $3.4 tax | (7.4 | ) | | — |
| | — |
| |
| Foreign currency translation adjustments, net of $2.0 tax for 2015 | | 5.7 |
| | (2.1 | ) | | (12.4 | ) |
| Change in fair value of cash flow hedge, net of $0.0, $0.1 and $0.3 tax, respectively | | 0.0 |
| | (0.2 | ) | | (0.5 | ) |
| Pension liability adjustments, net of ($0.6), ($0.3) and $0.3 tax, respectively | | (0.2 | ) | | (1.7 | ) | | 0.0 |
|
| Other comprehensive income (loss) | (17.4 | ) | | 1.4 |
| | 1.8 |
| 5.5 |
| | (4.0 | ) | | (12.9 | ) |
| Total comprehensive income (loss) | $ | (37.0 | ) | | $ | 1.6 |
| | $ | 6.2 |
| $ | (7.8 | ) | | $ | 17.0 |
| | $ | 13.8 |
|
See accompanying Notes to Consolidated and Combined Financial Statements.
VERITIV CORPORATION
CONSOLIDATED AND COMBINED BALANCE SHEETS
(dollars in millions, except par value)
| | | | December 31, 2014 | | December 31, 2013 | December 31, 2017 | | December 31, 2016 |
| Assets | | | | | | |
| Current assets: | | | | | | |
| Cash | $ | 57.6 |
| | $ | 5.7 |
| $ | 80.3 |
| | $ | 69.6 |
|
| Accounts receivable, less allowances of $39.0 and $22.7 in 2014 and 2013, respectively | 1,115.1 |
| | 669.7 |
| |
| Accounts receivable, less allowances of $44.0 and $34.5, respectively | | 1,174.3 |
| | 1,048.3 |
|
| Related party receivable | 3.9 |
| | 10.1 |
| 3.3 |
| | 3.9 |
|
| Inventories | 673.2 |
| | 360.9 |
| 722.7 |
| | 707.9 |
|
| Other current assets | 109.3 |
| | 26.3 |
| 133.5 |
| | 118.9 |
|
| Assets held for sale | — |
| | 9.3 |
| |
| Total current assets | 1,959.1 |
| | 1,082.0 |
| 2,114.1 |
| | 1,948.6 |
|
| Property and equipment, net | 377.4 |
| | 107.1 |
| |
| Property and equipment (net of depreciation and amortization of $314.6 and $292.8, respectively) | | 340.2 |
| | 371.8 |
|
| Goodwill | 52.4 |
| | 26.4 |
| 99.6 |
| | 50.2 |
|
| Other intangibles, net | 36.1 |
| | 9.3 |
| 64.1 |
| | 21.0 |
|
| Non-current deferred income tax assets | 105.6 |
| | 22.7 |
| |
| Deferred income tax assets | | 59.6 |
| | 61.8 |
|
| Other non-current assets | 43.9 |
| | 9.4 |
| 30.8 |
| | 30.3 |
|
| Total assets | $ | 2,574.5 |
| | $ | 1,256.9 |
| $ | 2,708.4 |
| | $ | 2,483.7 |
|
| Liabilities and Equity | | | | |
| Liabilities and shareholders' equity | | | | |
| Current liabilities: | | | | | | |
| Accounts payable | $ | 589.8 |
| | $ | 357.3 |
| $ | 680.1 |
| | $ | 654.1 |
|
| Related party payable | 11.0 |
| | 2.6 |
| 8.5 |
| | 9.0 |
|
| Accrued payroll and benefits | 111.1 |
| | 54.9 |
| 73.5 |
| | 84.4 |
|
| Deferred income tax liabilities | 21.1 |
| | 13.5 |
| |
| Other accrued liabilities | 100.5 |
| | 36.5 |
| 134.6 |
| | 102.5 |
|
| Current maturities of long-term debt | 3.8 |
| | — |
| 2.9 |
| | 2.9 |
|
| Financing obligations to related party, current portion | 13.8 |
| | — |
| |
| Financing obligations, current portion (including obligations to related party of $7.1 and $14.9, respectively) | | 7.8 |
| | 14.9 |
|
| Total current liabilities | 851.1 |
| | 464.8 |
| 907.4 |
| | 867.8 |
|
| Long-term debt, net of current maturities | 855.0 |
| | — |
| 908.3 |
| | 749.2 |
|
| Financing obligations to related party, less current portion | 212.4 |
| | — |
| |
| Financing obligations, less current portion (including obligations to related party of $155.2 and $176.1, respectively) | | 181.6 |
| | 176.1 |
|
| Defined benefit pension obligations | 36.3 |
| | — |
| 24.4 |
| | 27.6 |
|
| Other non-current liabilities | 107.2 |
| | 12.5 |
| 137.0 |
| | 121.2 |
|
| Total liabilities | 2,062.0 |
| | 477.3 |
| 2,158.7 |
| | 1,941.9 |
|
| Commitments and contingencies (Note 15) |
|
| |
|
| |
| Equity: | | | | |
| Parent company investment, prior to Spin-off | — |
| | 784.3 |
| |
| Commitments and contingencies (Note 16) | |
|
| |
|
|
| Shareholders' equity: | | | | | | |
| Preferred stock, $0.01 par value, 10.0 million shares authorized, none issued | — |
| | — |
| — |
| | — |
|
| Common stock, $0.01 par value, 100.0 million shares authorized, 16.0 million shares issued and outstanding | 0.2 |
| | — |
| |
| Common stock, $0.01 par value, 100.0 million shares authorized, 16.0 million shares issued; shares outstanding - 15.7 million at December 31, 2017 and 2016 | | 0.2 |
| | 0.2 |
|
| Additional paid-in capital | 562.4 |
| | — |
| 590.2 |
| | 574.5 |
|
| Accumulated deficit | (28.0 | ) | | — |
| |
| Accumulated earnings | | 6.4 |
| | 19.7 |
|
| Accumulated other comprehensive loss | (22.1 | ) | | (4.7 | ) | (33.5 | ) | | (39.0 | ) |
| Treasury stock at cost - 0.3 million shares at December 31, 2017 and 2016 | | (13.6 | ) | | (13.6 | ) |
| Total shareholders' equity | 512.5 |
| | (4.7 | ) | 549.7 |
| | 541.8 |
|
| Total equity | 512.5 |
| | 779.6 |
| |
| Total liabilities and equity | $ | 2,574.5 |
| | $ | 1,256.9 |
| |
| Total liabilities and shareholders' equity | | $ | 2,708.4 |
| | $ | 2,483.7 |
|
See accompanying Notes to Consolidated and Combined Financial Statements.
VERITIV CORPORATION
CONSOLIDATED AND COMBINED STATEMENTS OF CASH FLOWS
(in millions)
| | | | Year Ended December 31, | Year Ended December 31, |
| Operating Activities | 2014 | | 2013 | | 2012 | |
| Operating activities | | 2017 | | 2016 | | 2015 |
| Net income (loss) | $ | (19.6 | ) | | $ | 0.2 |
| | $ | 4.4 |
| $ | (13.3 | ) | | $ | 21.0 |
| | $ | 26.7 |
|
| Income (loss) from discontinued operations, net of income taxes | (0.1 | ) | | 0.2 |
| | (10.0 | ) | |
| Income (loss) from continuing operations | (19.5 | ) | | (0.0 | ) | | 14.4 |
| |
| Depreciation and amortization | 37.6 |
| | 17.4 |
| | 15.2 |
| 54.2 |
| | 54.7 |
| | 56.9 |
|
| Amortization of deferred financing fees | 2.2 |
| | — |
| | — |
| |
| Net gains on sales of property and equipment | (2.3 | ) | | (6.4 | ) | | (2.3 | ) | |
| Amortization and write-off of deferred financing fees | | 2.6 |
| | 5.6 |
| | 4.4 |
|
| Net losses (gains) on dispositions of property and equipment | | (25.7 | ) | | (0.8 | ) | | 0.5 |
|
| Goodwill and long-lived asset impairment charges | | 8.4 |
| | 7.7 |
| | 5.9 |
|
| Provision for allowance for doubtful accounts | 12.8 |
| | 6.4 |
| | 7.5 |
| 15.9 |
| | 2.2 |
| | 7.4 |
|
| Deferred income tax provision | (9.7 | ) | | 3.3 |
| | 1.4 |
| 1.9 |
| | 11.1 |
| | 14.9 |
|
| Stock-based compensation | 4.3 |
| | 15.4 |
| | 13.1 |
| 15.7 |
| | 8.3 |
| | 3.8 |
|
| Other noncash items, net | 1.6 |
| | — |
| | — |
| |
| Changes in operating assets and liabilities, net of Merger | | | | | | |
| Other non-cash items, net | | (8.8 | ) | | 3.7 |
| | 2.0 |
|
| Changes in operating assets and liabilities | | | | | | |
| Accounts receivable and related party receivable | (17.7 | ) | | (1.3 | ) | | 27.8 |
| (101.9 | ) | | (14.7 | ) | | 53.4 |
|
| Inventories | 28.2 |
| | 12.3 |
| | 12.3 |
| 30.1 |
| | 13.1 |
| | (62.0 | ) |
| Other current assets | (21.8 | ) | | 3.1 |
| | 7.8 |
| (8.4 | ) | | (11.4 | ) | | 1.0 |
|
| Accounts payable and related party payable | (44.5 | ) | | 7.2 |
| | (37.4 | ) | 48.3 |
| | 69.9 |
| | (8.4 | ) |
| Accrued payroll and benefits | 19.9 |
| | (0.5 | ) | | (1.6 | ) | (11.3 | ) | | (40.9 | ) | | 10.5 |
|
| Other accrued liabilities | 15.4 |
| | 4.1 |
| | 1.0 |
| 13.6 |
| | (3.6 | ) | | (7.1 | ) |
| Other | (0.4 | ) | | (8.0 | ) | | (0.6 | ) | 15.3 |
| | 14.3 |
| | 3.1 |
|
| Net cash provided by operating activities – continuing operations | 6.1 |
| | 53.0 |
| | 58.6 |
| |
| Net cash used for operating activities – discontinued operations | (1.1 | ) | | (0.8 | ) | | (2.6 | ) | |
| Net cash provided by operating activities | 5.0 |
| | 52.2 |
| | 56.0 |
| 36.6 |
| | 140.2 |
| | 113.0 |
|
| Investing Activities | | | | | | |
| Net cash acquired in Merger | 31.8 |
| | — |
| | — |
| |
| Investing activities | | | | | | |
| Property and equipment additions | (17.2 | ) | | (9.8 | ) | | (13.3 | ) | (32.5 | ) | | (41.0 | ) | | (44.4 | ) |
| Proceeds from asset sales | 4.8 |
| | 22.7 |
| | 5.1 |
| 51.1 |
| | 6.6 |
| | 0.3 |
|
| Other | 0.5 |
| | 0.3 |
| | 0.5 |
| |
| Net cash provided by (used for) investing activities – continuing operations | 19.9 |
| | 13.2 |
| | (7.7 | ) | |
| Net cash provided by investing activities – discontinued operations | — |
| | — |
| | 0.2 |
| |
| Net cash provided by (used for) investing activities | 19.9 |
| | 13.2 |
| | (7.5 | ) | |
| Financing Activities | | | | | | |
| Net cash transfers to Parent | (60.3 | ) | | (70.8 | ) | | (48.9 | ) | |
| Cash paid for purchase of business, net of cash acquired | | (144.8 | ) | | — |
| | — |
|
| Net cash used for investing activities | | (126.2 | ) | | (34.4 | ) | | (44.1 | ) |
| Financing activities | | | | | | |
| Change in book overdrafts | 1.6 |
| | (5.8 | ) | | 1.7 |
| (40.5 | ) | | 18.9 |
| | (5.8 | ) |
| Transfer to Parent in connection with Spin-off | (432.8 | ) | | — |
| | — |
| |
| Repayment of Unisource Senior Credit Facility | (303.9 | ) | | — |
| | — |
| |
| Borrowings of long-term debt | 3,142.2 |
| | — |
| | — |
| 4,898.8 |
| | 4,555.8 |
| | 4,661.9 |
|
| Repayments of long-term debt | (2,294.4 | ) | | — |
| | — |
| (4,731.5 | ) | | (4,625.9 | ) | | (4,708.9 | ) |
| Payments under equipment capital lease obligations | (1.3 | ) | | — |
| | — |
| (2.7 | ) | | (3.2 | ) | | (3.8 | ) |
| Payments under financing obligations to related party | (6.8 | ) | | — |
| | — |
| |
| Payments under financing obligations (including obligations to related party of $15.0, $19.9 and $13.8, respectively) | | (16.4 | ) | | (19.9 | ) | | (13.8 | ) |
| Deferred financing fees | (22.4 | ) | | — |
| | — |
| — |
| | (2.0 | ) | | — |
|
| Net cash provided by (used for) financing activities – continuing operations | 21.9 |
| | (76.6 | ) | | (47.2 | ) | |
| Net cash provided by financing activities – discontinued operations | 1.1 |
| | — |
| | 0.9 |
| |
| Purchase of treasury stock | | — |
| | (13.6 | ) | | — |
|
| Payments under Tax Receivable Agreement | | (8.5 | ) | | — |
| | — |
|
| Net cash provided by (used for) financing activities | 23.0 |
| | (76.6 | ) | | (46.3 | ) | 99.2 |
| | (89.9 | ) | | (70.4 | ) |
| Effect of exchange rate changes on cash | 4.0 |
| | 1.5 |
| | (1.5 | ) | 1.1 |
| | (0.7 | ) | | (1.7 | ) |
| Net change in cash | 51.9 |
| | (9.7 | ) | | 0.7 |
| 10.7 |
| | 15.2 |
| | (3.2 | ) |
| Cash at beginning of period | 5.7 |
| | 15.4 |
| | 14.7 |
| 69.6 |
| | 54.4 |
| | 57.6 |
|
| Cash at end of period | $ | 57.6 |
| | $ | 5.7 |
| | $ | 15.4 |
| $ | 80.3 |
| | $ | 69.6 |
| | $ | 54.4 |
|
| Supplemental Cash Flow Information | | | | | | |
| Supplemental cash flow information | | | | | | |
| Cash paid for income taxes, net of refunds | $ | 2.0 |
| | $ | 0.7 |
| | $ | 1.1 |
| $ | 3.7 |
| | $ | 11.6 |
| | $ | 1.9 |
|
| Cash paid for interest | 11.5 |
| | — |
| | — |
| 27.6 |
| | 20.6 |
| | 21.7 |
|
| Non-Cash Transactions | | | | | | |
| Common stock issued in connection with Spin-off | $ | 277.9 |
| | $ | — |
| | $ | — |
| |
| Common stock issued in connection with Merger | 284.7 |
| | — |
| | — |
| |
| Contingent liability associated with the Tax Receivable Agreement | 58.8 |
| | — |
| | — |
| |
| Non-cash transfers (to) from Parent | (26.0 | ) | | 20.3 |
| | — |
| |
| Non-cash investing and financing activities | | | | | | |
| Non-cash additions to property and equipment | | 17.8 |
| | 20.8 |
| | 4.0 |
|
| Contingent consideration for purchase of business: Earn-out | | 22.2 |
| | — |
| | — |
|
See accompanying Notes to Consolidated and Combined Financial Statements.
VERITIV CORPORATION
CONSOLIDATED AND COMBINED STATEMENTS OF SHAREHOLDERS' EQUITY
(in millions)
|
| | | | | | | | | | | | | | | | | | | | | | | | | | |
| | Common Stock Issued | | Additional Paid-in Capital | | Parent Company Investment | | Accumulated Deficit | | Accumulated Other Comprehensive Income (Loss) | | Total |
| | Shares | | Amount | | | | | |
| Balance at December 31, 2011 | — |
| | $ | — |
| | $ | — |
| | $ | 850.2 |
| | $ | — |
| | $ | (7.9 | ) | | $ | 842.3 |
|
| Net income | — |
| | — |
| | — |
| | 4.4 |
| | — |
| | — |
| | 4.4 |
|
| Other comprehensive income | — |
| | — |
| | — |
| | — |
| | — |
| | 1.8 |
| | 1.8 |
|
| Net transfers to Parent | — |
| | — |
| | — |
| | (35.4 | ) | | — |
| | — |
| | (35.4 | ) |
| Balance at December 31, 2012 | — |
| | $ | — |
| | $ | — |
| | $ | 819.2 |
| | $ | — |
| | $ | (6.1 | ) | | $ | 813.1 |
|
| Net income | — |
| | — |
| | — |
| | 0.2 |
| | — |
| | — |
| | 0.2 |
|
| Other comprehensive income | — |
| | — |
| | — |
| | — |
| | — |
| | 1.4 |
| | 1.4 |
|
| Net transfers to Parent | — |
| | — |
| | — |
| | (35.1 | ) | | — |
| | — |
| | (35.1 | ) |
| Balance at December 31, 2013 | — |
| | — |
| | — |
| | 784.3 |
| | — |
| | (4.7 | ) | | 779.6 |
|
| Net income from January 1, 2014 to June 30, 2014 | — |
| | — |
| | — |
| | 8.4 |
| | — |
| | — |
| | 8.4 |
|
| Net loss from July 1, 2014 to December 31, 2014 | — |
| | — |
| | — |
| | — |
| | (28.0 | ) | | — |
| | (28.0 | ) |
| Other comprehensive loss, net of tax | — |
| | — |
| | — |
| | — |
| | — |
| | (17.4 | ) | | (17.4 | ) |
| Net transfers to Parent | — |
| | — |
| | — |
| | (82.0 | ) | | — |
| | — |
| | (82.0 | ) |
| Conversion of Parent Company Investment in connection with Spin-off | 8.2 |
| | 0.1 |
| | 710.6 |
| | (710.7 | ) | | — |
| | — |
| | — |
|
| Transfer to Parent in connection with Spin-off | — |
| | — |
| | (432.8 | ) | | — |
| | — |
| | — |
| | (432.8 | ) |
| Issuance of common stock for Merger | 7.8 |
| | 0.1 |
| | 284.6 |
| | — |
| | — |
| | — |
| | 284.7 |
|
| Balance at December 31, 2014 | 16.0 |
| | $ | 0.2 |
| | $ | 562.4 |
| | $ | — |
| | $ | (28.0 | ) | | $ | (22.1 | ) | | $ | 512.5 |
|
|
| | | | | | | | | | | | | | | | | | | | | | | | | | | | |
| | Common Stock Issued | | Additional Paid-in Capital | | Accumulated Earnings (Deficit) | | Accumulated Other Comprehensive Loss | | Treasury Stock | | Total |
| | Shares | Amount | | | | | Shares | | Amount | |
| Balance at December 31, 2014 | 16.0 |
| $ | 0.2 |
| | $ | 562.4 |
| | $ | (28.0 | ) | | $ | (22.1 | ) | | — |
| | $ | — |
| | $ | 512.5 |
|
| Net income | — |
| — |
| | — |
| | 26.7 |
| | — |
| | — |
| | — |
| | 26.7 |
|
| Other comprehensive loss | — |
| — |
| | — |
| | — |
| | (12.9 | ) | | — |
| | — |
| | (12.9 | ) |
| Stock-based compensation | — |
| — |
| | 3.8 |
| | — |
| | — |
| | — |
| | — |
| | 3.8 |
|
| Balance at December 31, 2015 | 16.0 |
| $ | 0.2 |
| | $ | 566.2 |
| | $ | (1.3 | ) | | $ | (35.0 | ) | | — |
| | $ | — |
| | $ | 530.1 |
|
| Net income | — |
| — |
| | — |
| | 21.0 |
| | — |
| | — |
| | — |
| | 21.0 |
|
| Other comprehensive loss | — |
| — |
| | — |
| | — |
| | (4.0 | ) | | — |
| | — |
| | (4.0 | ) |
| Stock-based compensation | — |
| — |
| | 8.3 |
| | — |
| | — |
| | — |
| | — |
| | 8.3 |
|
| Treasury stock | — |
| — |
| | — |
| | — |
| | — |
| | (0.3 | ) | | (13.6 | ) | | (13.6 | ) |
| Balance at December 31, 2016 | 16.0 |
| $ | 0.2 |
| | $ | 574.5 |
| | $ | 19.7 |
| | $ | (39.0 | ) | | (0.3 | ) | | $ | (13.6 | ) | | $ | 541.8 |
|
| Net loss | — |
| — |
| | — |
| | (13.3 | ) | | — |
| | — |
| | — |
| | (13.3 | ) |
| Other comprehensive income | — |
| — |
| | — |
| | — |
| | 5.5 |
| | — |
| | — |
| | 5.5 |
|
| Stock-based compensation | — |
| — |
| | 15.7 |
| | — |
| | — |
| | — |
| | — |
| | 15.7 |
|
| Balance at December 31, 2017 | 16.0 |
| $ | 0.2 |
| | $ | 590.2 |
| | $ | 6.4 |
| | $ | (33.5 | ) | | (0.3 | ) | | $ | (13.6 | ) | | $ | 549.7 |
|
See accompanying Notes to Consolidated and Combined Financial Statements.
VERITIV CORPORATION
NOTES TO CONSOLIDATED FINANCIAL STATEMENTS
1. BUSINESS AND SUMMARY OF SIGNIFICANT ACCOUNTING POLICIES
Description of Business
Veritiv Corporation ("Veritiv" or the "Company") is a North American business-to-business distributor of print, publishing, packaging, facility solutions, print and publishing products and services. Additionally, Veritiv provides logistics solutions. Established inand supply chain management solutions to its customers. Veritiv was established on July 1, 2014 (the "Distribution Date"), following the merger (the "Merger") of International Paper Company’s ("International Paper" or "Parent") xpedx divisiondistribution solutions business ("xpedx") and UWW Holdings, Inc. ("UWWH"), the Company operates from more than 180 distribution centers primarily throughout the U.S., Canada and Mexico.
xpedx was a business-to-business distributorparent company of paper, publishing, packaging and facility supplies products in North America that operated in the U.S. and Mexico. xpedx distributed products and services to various customer markets, including printers, publishers, data centers, manufacturers, higher education institutions, healthcare facilities, sporting and performance arenas, retail stores, government agencies, property managers and building service contractors.
UWWH, operating through Unisource Worldwide, Inc. and its other consolidated subsidiaries (collectively, "Unisource"("Unisource"), was a distributor of printing and business paper, publishing solutions, packaging supplies and equipment, facility supplies and equipment and logistics services that operated primarily in. On July 2, 2014, Veritiv’s common stock began regular-way trading on the U.S. and Canada. Unisource sold its products to a diverse customer base that included commercial printing, retail, hospitality, healthcare, governmental, distribution and manufacturing sectors.New York Stock Exchange under the ticker symbol VRTV.
The Spin-off and Merger
On July 1, 2014 (the "Distribution Date"), International Paper completed the previously announced spin-off of xpedx to its shareholders (the "Spin-off"), forming a new public company called Veritiv. Immediately following the Spin-off, UWWH merged with and into Veritiv (the "Merger"). The primary reason for the business combination was to create a North American business-to-business distribution company with a broad geographic reach, an extensive product offering and a differentiated and leading service platform. The Merger has been reflected in Veritiv’s financial statements using the acquisition method of accounting, with Veritiv as the accounting acquirer of UWWH.
On the Distribution Date:
8,160,000 shares of Veritiv common stock were distributed on a pro rata basis to the International Paper shareholders of record as of the close of business on June 20, 2014. Immediately following the Spin-off, but prior to the Merger, International Paper’s shareholders owned all of the shares of Veritiv common stock outstanding, and
A cash payment of $404.2 million was distributed to International Paper, which was comprised of: (i) a special payment of $400.0 million, (ii) reduced by a $15.3 million preliminary working capital adjustment and (iii) increased by $19.5 million of transaction expense-related adjustments. During the fourth quarter of 2014, the working capital and transaction expense-related adjustments were finalized, resulting in an additional cash payment of $30.7 million to International Paper. Of the total payment, $432.8 million was reflected as a reduction to equity while the remaining $2.1 million was recorded in the Consolidated Statement of Operations for 2014.
In addition to the above payment, International Paper also has a potential earnoutearn-out payment of up to $100.0 million that would become due in 2020 if Veritiv's aggregate EBITDA for fiscal years 2017, 2018 and 2019 exceeds an agreed-upon target of $759.0 million, subject to certain adjustments. The $100.0 million potential earnoutearn-out payment would be reflected by Veritiv as a reduction to equity at the time of payment.
Immediately following the Spin-off on the Distribution Date:
UWW Holdings, LLC, the sole shareholder of UWWH, (the "UWWH Stockholder") received 7,840,000 shares of Veritiv common stock for all outstanding shares of UWWH common stock that it held on the Distribution Date, in a private placement transaction,
| |
• | Veritiv and the UWWH Stockholder entered into a registration rights agreement (the "Registration Rights Agreement") that provides the UWWH Stockholder with certain demand registration rights and piggyback registration rights which is more fully described in Note 8, Related Party Transactions, |
| |
• | Veritiv and the UWWH Stockholder entered into a tax receivable agreement (the "Tax Receivable Agreement") which is more fully described in Note 8, Related Party Transactions, and |
The UWWH Stockholder received approximately $33.9 million of cash proceeds associated with preliminary working capital and net indebtedness adjustments, as well as cash proceeds of $4.7 million associated with transaction expense-related adjustments. During the fourth quarter of 2014, the Company finalized the working capital and net indebtedness adjustments, resulting in an additional cash payment of $5.7 million to the UWWH Stockholder. Of the total payment, $39.1 million was recorded as part of the purchase price consideration for Unisource while the remaining $5.2 million was recorded in the Consolidated Statement of Operations for 2014.
Immediately following the completion of the Spin-off and Merger, International Paper shareholders owned approximately 51%, and the UWWH Stockholder owned approximately 49%, of the shares of Veritiv common stock on a fully-diluted basis. Immediately following the completion of the Spin-off, International Paper did not own any shares of Veritiv common stock. See Note 2, Merger with Unisource, for further details on the Merger.
Veritiv’s common stock began regular-way trading on the New York Stock Exchange on July 2, 2014 under the ticker symbol VRTV.
Basis of Presentation
Prior to the Distribution Date, Veritiv’s financial position, results of operations and cash flows consisted of only the xpedx business of International Paper and have been derived from International Paper’s historical accounting records. The financial results of xpedx have been presented on a carve-out basis through the Distribution Date, while the financial results for Veritiv, post Spin-off, are prepared on a stand-alone basis. As such, the audited Consolidated and Combined Statements of Operations, Consolidated and Combined Statements of Comprehensive Income (Loss) and Consolidated and Combined Statements of Cash Flows for the year ended December 31, 2014 consist of:
the combined results of operations of xpedx for the six months ended June 30, 2014 on a carve-out basis, and
the consolidated results of Veritiv on a stand-alone basis for the six months ended December 31, 2014.
The combined financial statements as of December 31, 2013 and for the years ended December 31, 2013 and 2012 consist entirely of the combined results of xpedx on a carve-out basis.
As of December 31, 2014, all intercompany transactions have been eliminated. Prior to the Distribution Date, all significant intercompany transactions between xpedx and International Paper have been included for the periods prior to the Spin-off and were considered to be effectively settled for cash at the time the transaction was recorded. The total net effect of the settlement of these intercompany transactions is reflected in the Consolidated and Combined Statements of Cash Flows as a financing activity and in the Consolidated and Combined Balance Sheets as Parent company investment.
For periods prior to the Spin-off, the combined financial statements include expense allocations for certain functions previously provided by International Paper, including, but not limited to, general corporate expenses related to finance, legal, information technology, human resources, communications, insurance and stock-based compensation. These expenses have been allocated on the basis of direct usage when identifiable, with the remainder principally allocated on the basis of percent of capital employed, headcount, sales or other measures. Management considers the basis on which the expenses have been allocated to reasonably reflect the utilization of services provided to or for the benefit received by xpedx during those periods. The allocations may not, however, reflect the expenses xpedx would have incurred as an independent company for the periods presented. Actual costs that may have been incurred if xpedx had been a stand-alone company would depend on a number of factors, including the organizational structure, whether functions were outsourced or performed by employees and strategic decisions made in areas such as information technology and infrastructure. Veritiv is unable to determine what such costs would have been had xpedx been independent. See Note 8, Related Party Transactions, for further information.
Following the Spin-off,Merger, certain corporate and other related functions described above continuecontinued to be provided by International Paper under a transition services agreement. Since July 1, 2014,For the year ended December 31, 2015, the Company has recognized $15.5$10.0 million in selling and administrative expenses related to this agreement.
For the years ended December 31, 2013 and 2012, certain amounts in the operating activities section of the Statements of Cash Flows have been reclassified for comparative purposes to conform to the current year presentation. This
reclassification did not have any impact on net cash flows from operations or the Combined Statements of Operations for the years ended December 31, 2013 and 2012, or on the Combined Balance Sheet as As of December 31, 2013.2015, all of the functions originally provided by International Paper under this agreement have been fully transitioned to the Company.
Veritiv operates from approximately 170 distribution centers primarily throughout the U.S., Canada and Mexico.
Basis of Presentation
The accompanying consolidated financial statements have been prepared in accordance with accounting principles generally accepted in the United States of America (“U.S. GAAP”) and include all of the Company’s subsidiaries. All significant intercompany transactions between Veritiv's businesses have been eliminated.
Use of Estimates
The preparation of financial statements in conformity with U.S. generally accepted accounting principles ("GAAP")GAAP requires management to make estimates and assumptions that affect the reported amounts of assets and liabilities, revenue and expenses and certain financial statement disclosures. Estimates and assumptions are used for, but not limited to, revenue recognition, accounts receivable valuation, inventory valuation, employee benefit plans, income tax contingency accruals and valuation allowances, recognition of the Tax Cuts and Jobs Act (the "Tax Act"), multi-employer pension plan withdrawal liabilities, contingency accruals and goodwill and other intangible asset valuations. Although these estimates are based on management's knowledge of current events and actions it may undertake in the future, actual results may ultimately differ from these estimates and assumptions. Estimates are revised as additional information becomes available.
Summary of Significant Accounting Policies
Revenue Recognition
Revenue is recognized when persuasive evidence of an arrangement exists, the price is fixed or determinable, collectability is reasonably assured and delivery has occurred. Revenue is recognized when the customer takes title and assumes the risks and rewards of ownership. Revenue is recorded at the time of shipment for customer terms designated f.o.b. (free on board) shipping point. For sales transactions with customers designated f.o.b. destination, revenue is recorded when the product is delivered to the customer’s delivery site, when title and risk of loss are transferred. Shipping terms are determined on a customer-by-customer or order-by-order basis. When management cannot conclude collectability is reasonably assured for shipments to a particular customer, revenue associated with that customer is not recognized until cash is collected or management is otherwise able to establish that collectability is reasonably assured. Multiple contracts with a single counterparty are accounted for as separate arrangements.
Sales transactions with customers are designated free on board ("f.o.b.") destination and revenue is recorded when the product is delivered to the customer’s delivery site, when title and risk of loss are transferred. Effective January 1, 2016, the Company harmonized its shipping terms to be f.o.b. destination. Prior to that date, revenue was recorded at the time of shipment for certain xpedx customers whose terms were designated f.o.b. shipping point. Management determined that any shipments in transit at December 31, 2015 would honor the f.o.b. destination terms resulting in a reduction of $27.0 million and $1.8 million to net sales and operating income, respectively, for the year ended December 31, 2015.
Certain revenues are derived from shipments arranged by the Company made directly from a manufacturer to a customer. The Company is considered to be a principal to these transactions because, among other factors, it controls pricing to the customer, bears the credit risk of the customer defaulting on payment and is the primary obligor. Revenues from these sales are reported on a gross basis in the Consolidated and Combined Statements of Operations and amounted to $2.9$3.0 billion, $2.4$3.0 billion and $2.5$3.3 billion for the years ended December 31, 2014, 20132017, 2016 and 2012,2015, respectively.
Taxes collected from customers relating to product sales and remitted to governmental authorities are accounted for on a net basis. Accordingly, such taxes are excluded from both net sales and expenses.
Purchase Incentives and Customer Rebates
Veritiv enters into agreements with suppliers that entitle Veritiv to receive rebates, allowances and other discounts based on the attainment of specified purchasing levels or sales to certain customers. Purchase incentives are recorded as a reduction to inventory and recognized in cost of products sold aswhen the product is sold.sale occurs. During the year ended December 31, 2017, approximately 38% of the Company's purchases were made from ten suppliers.
Veritiv also enters into incentive agreements with certain of its customers, which are generally based on sales to these customers. Veritiv records estimated rebates to customers as a reduction to gross sales as customer revenue is recognized.
Distribution Expenses
Distribution expenses consist of storage, handling and delivery costs including freight to the Company's customers’ destination.destinations. Handling and delivery costs were $322.3$380.7 million, $252.9$371.7 million and $259.7$380.5 million for the years ended December 31, 2014, 20132017, 2016 and 2012,2015, respectively.
MergerAcquisition and Integration Expenses
MergerAcquisition and integration expenses are expensed as incurred. MergerAcquisition and integration expenses include advisory, legal and other professional fees directly associated with the Merger. Integration expenses includeinternally dedicated integration management resources, retention compensation, information technology conversion costs, rebranding, professional services and project management fees, retention compensation, termination benefits (including change-in-control bonuses), rebranding and other non-recurring or redundant costs to integrate the combined businesses of xpedx and Unisource.its businesses.
Accounts Receivable and Allowances
Accounts receivablesreceivable are recognized net of allowances that primarily consist of allowance for doubtful accounts of $31.7 million and $22.5 million as of December 31, 2014 and 2013, respectively, with the remaining balance of $7.3 million and $0.2 million being comprised of other allowances as of December 31, 2014 and 2013, respectively.allowances. The allowance for doubtful accounts reflects the best estimate of losses inherent in the Company’s accounts receivable portfolio determined on the basis of historical experience, specific allowances for known troubled accounts and other available evidence. The other allowances balance is inclusive of credit risks, returns, discounts and any other items affecting the realization of these assets. Accounts receivable are written off when management determines they are uncollectible.
The components of the accounts receivable allowances were as follows:
|
| | | | | | | |
| | Year Ended December 31, |
| (in millions) | 2017 | | 2016 |
| Allowance for doubtful accounts | $ | 32.4 |
| | $ | 23.7 |
|
| Other allowances | 11.6 |
| | 10.8 |
|
| Total accounts receivable allowances | $ | 44.0 |
| | $ | 34.5 |
|
Below is a rollforward of the Company's accounts receivable allowances for the years ended December 31, 2014, 20132017, 2016 and 2012:2015: | | | | Year Ended December 31, | Year Ended December 31, |
| (in millions) | 2014 | | 2013 | | 2012 | 2017 |
| 2016 |
| 2015 |
| Beginning balance, January 1 | $ | 22.7 |
| | $ | 25.3 |
| | $ | 26.2 |
| $ | 34.5 |
| | $ | 33.3 |
| | $ | 39.0 |
|
| Add / (Deduct): | | | | | | | | | | |
| Provision for bad debt expense | 12.8 |
| | 6.4 |
| | 8.7 |
| 15.9 |
| | 2.2 |
| | 7.4 |
|
| Net write-offs and other adjustments | (9.8 | ) | | (9.0 | ) | | (9.6 | ) | |
Other(1) | 13.3 |
| | — |
| | — |
| |
| Net write-offs and recoveries | | (7.7 | ) | | (6.7 | ) | | (13.1 | ) |
Other adjustments(1) | | 1.3 |
| | 5.7 |
| | — |
|
| Ending balance, December 31 | $ | 39.0 |
| | $ | 22.7 |
| | $ | 25.3 |
| $ | 44.0 |
| | $ | 34.5 |
| | $ | 33.3 |
|
(1) (Represents1) Other adjustments represent amounts reserved for returns and discounts, foreign currency translation adjustments and reserves for customer accounts where revenue is not recognized because collectability is not reasonably assured, and may include accounts receivable allowances recorded in connection with the Merger.acquisitions. 2015 amounts were not material.
Inventories
The Company's inventories are primarily comprised of finished goods and primarilypredominantly valued at cost as determined by the last-in first-out ("LIFO") method. Such valuations are not in excess of market. Elements of cost in inventories include the purchase price invoiced by a supplier, plus inbound freight and related costs and reduced by estimated volume-based discounts and early pay discounts available from certain suppliers. Approximately 86% and 97%87% of inventories were valued using the LIFO method as of December 31, 20142017 and 2013,2016, respectively. If the first-in, first-out method had been used, total inventory balances would havebe increased by approximately $79.1$78.7 million and $76.6$71.3 million at December 31, 20142017 and 2013,2016, respectively.
The Company reduces the value of obsolete and inactive inventory based on the difference between the LIFO cost of the inventory and the estimated market value using assumptions of future demand and market conditions. To estimate the net realizable value, the Company considers factors such as age of the inventory, the nature of the products, the quantity of items on-hand relative to sales trends, current market prices and trends in pricing, its ability to use excess supply in another channel, historical write-offs and expected residual values or other recoveries.
Veritiv maintains some of its inventory on a consignment basis in which the inventory is physically located at the customer's premises or a third-party warehouse. Veritiv had $58.3$50.9 million and $17.7$47.3 million of consigned inventory as of December 31, 20142017 and 2013, respectively.2016, respectively, valued on a LIFO basis, net of reserves.
Property and Equipment, Net
Property and equipment are stated at cost, less accumulated depreciation.depreciation and software amortization. Expenditures for replacements and major improvements are capitalized, whereas repair and maintenance costs that do not improve service potential or extend economic life are expensed as incurred. The Company capitalizes certain computer software and development costs incurred in connection with developing or obtaining software for internal use. Costs related to the development of internally developedinternal use software, other than those incurred during the application development stage, are expensed as incurred.
The components of property and equipment, net were as follows:
| | | (in millions) | December 31, | | December 31, | December 31, | | December 31, |
| 2014 | | 2013 | 2017 | | 2016 |
| Land, buildings and improvements | $ | 128.9 |
| | $ | 143.8 |
| $ | 106.6 |
| | $ | 132.0 |
|
| Machinery and equipment | 110.2 |
| | 72.5 |
| 145.3 |
| | 131.1 |
|
| Equipment capital leases and assets related to financing obligations with related party | 232.0 |
| | — |
| |
| Internally developed software | 114.4 |
| | 84.5 |
| |
| Equipment capital leases and assets related to financing obligations (including financing obligations with related party) | | 233.3 |
| | 215.5 |
|
| Internal use software | | 159.2 |
| | 151.0 |
|
| Construction-in-progress | 14.0 |
| | 4.9 |
| 10.4 |
| | 35.0 |
|
| Less: Accumulated depreciation and software amortization | (222.1 | ) | | (198.6 | ) | (314.6 | ) | | (292.8 | ) |
| Property and equipment, net | $ | 377.4 |
| | $ | 107.1 |
| $ | 340.2 |
| | $ | 371.8 |
|
Depreciation is calculated using the straight-line method over the estimated useful lives of the assets. Land is not depreciated, and construction-in-progress ("CIP") is not depreciated until ready for service. Leased property and leasehold improvements to leased property are amortized on a straight-line basis over the lease term or useful life of the asset, whichever is less.
Depreciation and amortization for property and equipment, other than land and CIP, is based upon the following estimated useful lives:
|
| |
| Buildings | 40 years |
| Leasehold improvements | 1 to 20 years |
| Machinery and equipment | 3 to 15 years |
Equipment capital leases and assets related to financing obligations (including financing obligations with related partyparty) | 3 to 15 years |
Internally developedInternal use software | 3 to 5 years |
DepreciationAdditional property and amortization expenses, includingequipment information is as follows:
|
| | | | | | | | | | | |
| | Year Ended December 31, |
| (in millions) | 2017 | | 2016 | | 2015 |
Depreciation expense (1) | $ | 33.5 |
| | $ | 33.8 |
| | $ | 32.6 |
|
| Amortization expense - internal use software | 16.5 |
| | 17.5 |
| | 18.4 |
|
| Depreciation and amortization expense related to property and equipment | $ | 50.0 |
| | $ | 51.3 |
| | $ | 51.0 |
|
| | | | | | |
| Accumulated depreciation on equipment capital leases and assets related to financing obligations (including financing obligations with related party) | $ | 35.6 |
| | $ | 29.7 |
| | |
| Unamortized internal use software costs, including amounts recorded in CIP | $ | 37.6 |
| | $ | 43.9 |
| | |
(1) Includes the depreciation expense for assets under capital leases and amortization expense of internally developed software, totaled $32.9 million, $15.9 million and $12.9 million for the years ended December 31, 2014, 2013 and 2012, respectively. Accumulated depreciation on equipment capital leases and assets related to financing obligations (including financing obligations with
related party as of December 31, 2014 was $15.6 million. Veritiv did not have any capital leases as of December 31, 2013. Amortization expense of the internally developed software was $11.0 million, $8.3 million and $3.0 million during the years ended December 31, 2014, 2013 and 2012, respectively. During 2014, there were no depreciation amounts included in restructuring. During 2013 and 2012, $0.3 million and $1.2 million of depreciation was included in restructuring.
As of December 31, 2014 and 2013, unamortized internally developed software costs, including amounts recorded in CIP, were $44.6 million and $17.1 million, respectively.party).
Upon retirement or other disposal of property and equipment, the cost and related amount of accumulated depreciation or accumulated amortization are eliminated from the asset and accumulated depreciation or accumulated amortization accounts, respectively. The difference, if any, between the net asset value and the proceeds is included in net income.
Leases
The Company leases certain property and equipment used for operations. Such lease arrangements are reviewed for capital or operating classification at their inception.
Capital lease obligations consist of delivery equipment, material handling equipment, computer hardware and office equipment which are leased through third parties under non-cancelable leases with terms generally ranging from three to eight years. Many of the delivery equipment leases include annual rate increases based on the Consumer Price Index which are included in the calculation of the initial lease obligation. The carrying value of the related equipment associated with these capital leases is included within property and equipment, net in the Consolidated and Combined Balance Sheets at December 31, 2014, and depreciated over the term of the lease. The Company does not record rent expense for capital leases.
Rather, rental payments under the lease are recognized as a reduction of the capital lease obligation and interest expense. Depreciation expense for assets under capital leases is included in the total depreciation expense disclosed in the Consolidated and Combined Statements of Operations.
All other leases are operating leases. Certain lease agreements include renewal options and rent escalation clauses. Assets subject to an operating lease and the related lease payments are not recorded on the Company’s balance sheet. Rent expense is recognized on a straight-line basis over the expected lease term.
The term for all types of leases begins on the date the Company becomes legally obligated for the rent payments or takes possession of the asset, whichever is earlier. See Note 7, Leases, for additional information related to the Company's leases.
Goodwill and Other Intangible Assets, Net
Goodwill relating to a single business reporting unit is included as an asset of the applicable segment. Goodwill arising from major acquisitions that involve multiple reportable segments is allocated to the reporting units based on the relative fair value of the reporting unit.
Goodwill is reviewed by Veritiv for impairment on a reporting unit basis annually on October 1st or more frequently if indicators are present or changes in circumstances suggest that impairment may exist. The testing of goodwill for possible impairment is performed by completing a two-step process. InStep 0 test or electing to by-pass the first step,Step 0 test and comparing the fair value of a reporting unit with its carrying value, including goodwill. The Step 0 test utilizes qualitative factors to determine whether it is comparedmore likely than not that the fair value of the reporting unit is less than its carrying value. Qualitative factors include: macroeconomic conditions; industry and market considerations; overall financial performance and cost factors to determine whether a reporting unit is at risk for goodwill impairment.
In the event a reporting unit fails the Step 0 goodwill impairment test, it is necessary to move forward with a comparison of the fair value of the reporting unit with its carrying value, including goodwill. If the fair value exceeds the carrying value, goodwill is not considered to be impaired. If the fair value of a reporting unit is below the carrying value, then step twoa goodwill impairment charge is performed to measurerecognized for the amount by which the carrying amount exceeds the reporting unit’s fair value; however, any loss recognized will not exceed the total amount of the goodwill impairment loss forallocated to the reporting unit. This analysis requiresSee Note 4, Goodwill and Other Intangible Assets, for additional information related to the determination of the fair value of all of the individual assets and liabilities of the reporting unit, including any currently unrecognized intangible assets, as if the reporting unit had been purchased on the analysis date. Once these fair values have been determined, the implied fair value of the unit’s goodwill is calculated as the excess, if any, of the fair value of the reporting unit determined in step one over the fair value of the net assets determined in step two. The carrying value of goodwill is then reduced to this implied value, or to zero if the fair value of the assets exceeds the fair value of the reporting unit, through a goodwill impairment charge. The impairment test performed during the fourth quarter of 2014 and 2013 indicated the fair value of the reporting units containing goodwill was in excess of the related carrying value of the net assets.Company's goodwill.
Intangible assets acquired in a business combination are recorded at fair value. The Company's intangible assets include customer relationships, trademarks and trade names and non-compete agreements. Intangible assets with finite useful lives are subsequently amortized using the straight-line method over the estimated useful lives of the assets. See the Impairment of Long-Lived Assets section below for the accounting policy related to the periodic review of long-lived intangible assets for impairment. See Note 4, Goodwill and Other Intangible Assets, for additional information related to the Company's intangible assets.
Impairment of Long-Lived Assets
Long-lived assets, including finite-livedfinite lived intangible assets, are amortized and tested for impairment whenever events or changes in circumstances indicate their carrying value may not be recoverable. The Company assesses the recoverability of long-lived assets based on the undiscounted future cash flow the assets are expected to generate and recognizerecognizes an impairment loss when estimated undiscounted future cash flows expected to result from the use of the asset plus net proceeds expected from disposition of the asset, if any, are less than the carrying value of the asset. When an impairment is identified, the Company reduces the carrying amount of the asset to its estimated fair value based on a discounted cash flow approach or, when available and appropriate, to comparable market values.
No long-lived asset impairment charges were recorded duringFor the years ended December 31, 2014, 20132017 and 2012.2016, impairment charges of $0.7 million and $1.9 million, respectively, were recorded for certain long-lived assets that supported multiple segments. These charges were recorded as
selling and administrative expense as they were not related to the Company's restructuring efforts. For the year ended December 31, 2015, impairment charges of $4.0 million were recorded for certain long-lived assets that supported multiple segments, with $0.7 million recorded as selling and administrative expense and $3.3 million recorded as restructuring expense. See Note 3, Acquisition, Integration and Restructuring Charges for additional information related to the Company's restructuring efforts.
Employee Benefit Plans
The Company sponsors and/or contributes to defined contribution plans, defined benefit pension plans and multi-employer pension plans in the United States. In addition, the Company and its subsidiaries have various pension plans and other forms of retirement arrangements outside the United States. See Note 9,10, Employee Benefit Plans, for additional information.information related to these plans and arrangements.
Prior to the Spin-off, certain of xpedx’s employees participated in defined benefit pension and other postretirement benefit plans sponsored and accounted for by International Paper. In conjunction with the Spin-off, the above plans were frozen for the xpedx employees, and International Paper retained the associated liabilities. Certain xpedx union employees
were added as participants to the Unisource defined benefit pension plan. In conjunction with the Merger, Veritiv assumed responsibility for Unisource’s defined benefit plans and Supplemental Executive Retirement Plan ("SERP") in the U.S. and Canada. Except as discussed below, these plans were frozen prior to the Merger. Union employees continue to accrue benefits under the U.S. defined benefit pension plan in accordance with their collective bargaining agreements.
The determination of defined benefit pension and postretirement plan obligations and their associated costs requires the use of actuarial computations to estimate participant plan benefits to which the employees will be entitled. The Company’s significant assumptions in this regard include discount rates, rate of future compensation increases, expected long-term rates of return on plan assets, mortality rates, and other factors. Each assumption is developed using relevant company experience in conjunction with market-related data in the U.S. and Canada. All actuarial assumptions are reviewed annually with third-party consultants and adjusted, as necessary.
For the recognition of net periodic postretirement cost, the calculation of the expected long-term rate of return on plan assets is derived using the fair value of plan assets at the measurement date. Actual results that differ from the Company's assumptions are accumulated and amortized on a straight-line basis only to the extent they exceed 10% of the higher of the fair value of plan assets or the projected benefit obligation, over the estimated remaining service period of active participants. The fair value of plan assets is determined based on market prices or estimated fair value at the measurement date.
The Company also makes contributions to multi-employer pension plans for its union employees covered by such plans. For these plans, the Company recognizes a liability only for any required contributions to the plans or surcharges imposed by the plans that are accrued and unpaid at the balance sheet date. The Company does not record an asset or liability to recognize the funded status of the plans. The Company records an estimated undiscounted charge when it becomes probable that it has incurred a withdrawal liability, as the final amount and timing is not assured. When a final determination of the withdrawal liability is received from the plan, the estimated charge is adjusted to the final amount determined by the plan.
Stock-Based Compensation
The Company measures and records compensation expense for all stock-based awards based on the grant date fair values over the vesting period of the awards. Forfeitures are recognized when they occur. See Note 14,15, Equity-Based Incentive Plans, for additional information.
Income Taxes
Veritiv's income tax expense, deferred tax assets and liabilities, and liabilities for unrecognized tax benefits reflect management’s best assessment of estimated current and future taxes to be paid. Veritiv records its global tax provision based on the respective tax rules and regulations for the jurisdictions in which it operates. Where Veritiv believes that a tax position is supportable for income tax purposes, the item is included in the appropriate income tax returns. Where treatment of a position is uncertain, liabilities are recorded based upon an evaluation of the more likely than not outcome considering technical merits of the position based on specific tax regulations and facts of each matter.position. Changes to recorded liabilities are made only when an identifiable event occurs that alters the likely outcome, such as settlement with the relevant tax authority or the expiration of statutes of limitation for the subject tax year, changeyear. Significant judgments and estimates are required in determining the consolidated income tax laws, or a recent court case that addresses the matter.expense.
The Tax Act was signed into law on December 22, 2017 and makes broad and complex changes to the U.S. tax code. We recognized provisional estimates of the impact of the Tax Act in the year ended December 31, 2017. These provisional amounts may be adjusted during 2018 in accordance with the measurement period guidance outlined in Securities and Exchange Commission's Staff Accounting Bulletin No. 118. See Note 8, Income Taxes of the Notes to Consolidated Financial Statements for additional details regarding the Tax Act.
Valuation allowances are recorded to reduce deferred tax assets when it is more likely than not that a tax benefit will not be realized. Significant judgment is required in evaluating the need for and magnitudeamount of appropriate valuation allowances against deferred tax assets. The realization of these assets is dependent on generating sufficient future taxable income, as well as successful implementation of various tax planning strategies.income.
While Veritiv believes that these judgments and estimates are appropriate and reasonable under the circumstances, actual resolution of these matters may differ from recorded estimated amounts.
Fair Value Measurements
Fair value is the price that would be received upon the sale of an asset or paid to transfer a liability in an orderly transaction between market participants at the measurement date. The following fair value hierarchy is used in selecting inputs, with the highest priority given to Level 1, as these are the most transparent or reliable.
|
| |
| Level 1 – | Quoted market prices in active markets for identical assets or liabilities. |
| Level 2 – | Observable market-based inputs other than quoted prices included within Level 1 that are observable for the asset or liability, either directly or indirectly. |
| Level 3 – | Unobservable inputs for the asset or liability reflecting the reporting entity’s own assumptions or external inputs from inactive markets. |
Foreign Currency
The assets and liabilities of the foreign subsidiaries are translated from their respective local currencies to the U.S. dollars at the appropriate spot rates as of the balance sheet date. Changes in the carrying valuevalues of these assets and liabilities attributable to fluctuations in spot rates are recognized in foreign currency translation adjustment, a component of accumulated other comprehensive income (loss)loss ("AOCI"AOCL"). See Note 13,14, Shareholders' Equity, for further detail.the impacts of foreign currency translation adjustments on AOCL.
The revenues and expenses of the foreign subsidiaries are translated using the monthly average exchange rates during the year. The gains or losses from foreign currency transactions are included in other (income) expense, (income), net in the Consolidated and Combined Statements of Operations.
Treasury Stock
Common stock purchased for treasury is recorded at cost. Costs incurred by the Company that are associated with the acquisition of treasury stock are treated in a manner similar to stock issue costs and are added to the cost of the treasury stock.
Recently Issued Accounting Standards
|
| | | | | | |
| Recently Issued Accounting Standards Not Yet Adopted |
| Standard | | Description | | Effective Date of Adoption | | Effect on the Financial Statements or Other Significant Matters |
Accounting Standards that are not yet adopted:Update ("ASU") 2016-02, Leases (Topic 842) | | The standard requires lessees to put most leases on their balance sheet but recognize expenses in their statement of operations in a manner similar to current accounting guidance. The new standard also eliminates the current guidance related to real estate specific provisions. The guidance requires application on a modified retrospective basis to leases that existed at the beginning of the earliest period presented and those entered into thereafter but prior to the effective date. A proposed ASU has been issued that would add the option for organizations to not provide comparative period financial statements and instead apply the transition requirements as of the effective date. The standard permits entities to elect a package of practical expedients which must be applied consistently to all leases that commenced prior to the effective date. If the package of practical expedients is elected, entities do not need to reassess: (i) whether expired or existing contracts contain leases; (ii) lease classification for any expired or existing leases; and (iii) initial direct costs for any existing leases. The guidance also allows entities to make certain policy elections under the new standard, including: (i) the use of hindsight to determine lease term and when assessing existing right of use assets for impairment; (ii) a policy to not record short-term leases on the balance sheet; and (iii) a policy to not separate lease and non-lease components. | | January 1, 2019; early adoption is permitted | | The Company is currently evaluating this standard and anticipates that its adoption will have a material impact on the Consolidated Financial Statements and related disclosures as it will result in recording substantially all operating leases on the balance sheet as a lease obligation and right of use asset. Lease software has been implemented that will better enable the Company to implement the standard. The Company currently anticipates electing to apply the package of practical expedients to all leases that commenced prior to the date of adoption. Based on the analysis performed to date, the Company anticipates making a policy election to not include short-term leases on the Consolidated Balance Sheets and to separate lease and non-lease components. The Company currently does not anticipate making a policy election to use hindsight to determine lease term. The assessment is ongoing and the preliminary conclusions are subject to change. At this time the Company is unable to quantify the impact that the adoption of this standard will have on the Consolidated Financial Statements and related disclosures. The Company currently plans to adopt this ASU on January 1, 2019. |
| | | | | | | |
|
| | | | | | |
| Recently Issued Accounting Standards Not Yet Adopted (continued) | | | | |
| Standard | | Description | | Effective Date | | Effect on the Financial Statements or Other Significant Matters |
ASU 2016-13, Financial Instruments-Credit Losses (Topic 326) | | The standard will replace the currently required incurred loss impairment methodology with guidance that reflects expected credit losses and requires consideration of a broader range of reasonable and supportable information to be considered in making credit loss estimates. The guidance requires application on a modified retrospective basis. Other application requirements exist for specific assets impacted by a more-than-insignificant credit deterioration since origination. | | January 1, 2020; early adoption is permitted for fiscal years beginning after December 15, 2018 | | The Company is currently evaluating the impact this ASU will have on its Consolidated Financial Statements and related disclosures. The Company currently plans to adopt this ASU on January 1, 2020. |
ASU 2018-02, Income Statement-Reporting Comprehensive Income (Topic 220) | | The standard allows companies to reclassify the effect of the change in tax laws and rates on deferred tax assets and liabilities as part of the Tax Act from accumulated other comprehensive income (loss) to retained earnings. The guidance is to be applied to each period in which the effect of the Tax Act (or portion thereof) is recorded and companies may apply it either (1) retrospectively as of the date of enactment or (2) as of the beginning of the period of adoption. | | January 1, 2019; early adoption is permitted. | | The Company is currently evaluating early adoption and the impact this ASU will have on its Consolidated Financial Statements and related disclosures. |
|
| | | | | | |
| Recently Adopted Accounting Standards |
| Standard | | Description | | Effective Date | | Effect on the Financial Statements or Other Significant Matters |
ASU 2014-09, Revenue from Contracts with Customers (Topic 606)
| | The standard will replace existingreplaces previous revenue recognition standards and significantly expandexpands the disclosure requirements for revenue arrangements. It may be adopted either retrospectively or on a modified retrospective basis to new contracts and existing contracts with remaining performance obligations as of the effective date.
| | January 1, 2018; early adoption date is no earlier than the annual period beginning after December 15, 2016
| | The Company adopted this ASU on January 1, 2018 applying the modified retrospective method. Focus areas were customer rebates, accounting for customer dedicated inventory and principal/agent considerations. The adoption did not materially impact the Company's Financial Statements and is not expected to have a material impact on future financial results as the adoption did not change the recognition pattern for the Company's existing revenue streams. The Company implemented new internal controls related to contract reviews and revenue recognition disclosures. Additional disclosures will be made as needed in future reports as a result of the adoption in 2018. |
| | | | | | |
|
| | | | | | |
| Recently Adopted Accounting Standards (continued) | | | | |
| Standard | | Description | | Effective Date | | Effect on the Financial Statements or Other Significant Matters |
ASU 2016-15, Statement of Cash Flows (Topic 230)
| | The standard addresses eight specific cash flow issues and is intended to reduce diversity in practice in how certain cash receipts and cash payments are presented and classified in the statement of cash flows. The guidance requires application on a retrospective basis.
| | January 1, 2018; early adoption is permitted (early adoption requires the adoption of all amendments in the same period)
| | The Company adopted this ASU on January 1, 2018. The adoption did not materially impact the Company's historical Consolidated Financial Statements or related disclosures. Impacts to future results and disclosures will be dependent upon the presence of any items noted in the standard. |
ASU 2017-01, Business Combinations (Topic 805) | | The standard clarifies the definition of a business with the objective of adding guidance to assist entities with evaluating whether transactions should be accounted for as acquisitions (or disposals) of assets or businesses. The guidance requires application on a prospective basis. | | January 1, 2018; early adoption is permitted
| | The Company adopted this ASU on January 1, 2018. |
ASU 2017-07, Compensation-Retirement Benefits (Topic 715) | | The standard requires employers to disaggregate the service cost component from the other components of net benefit cost and disclose the amount of net benefit cost that is included in the income statement or capitalized in assets, by line item. The standard requires employers to report the service cost component in the same line item(s) as other compensation costs and to report other pension-related costs (which include interest costs, amortization of pension-related costs from prior periods, and the gains or losses on plan assets) separately and exclude them from the subtotal of operating income. The standard also allows only the service cost component to be eligible for capitalization when applicable. The guidance requires application on a retrospective basis for the presentation of the service cost component and the other components of net periodic pension cost and net periodic postretirement benefit cost in the income statement and on a prospective basis for the capitalization of the service cost component of net periodic pension cost and net periodic postretirement benefit in assets. | | January 1, 2018; early adoption is permitted as of the first interim period of an annual period for which interim or annual financial statements have not been issued | | The Company adopted this ASU on January 1, 2018. The adoption did not materially impact its historical Consolidated Financial Statements or related disclosures.
|
ASU 2015-11, Inventory - Simplifying the Measurement of Inventory (Topic 330) | | The standard requires companies to measure inventory at the lower of cost and net realizable value, thereby simplifying the current guidance under which an entity must measure inventory at the lower of cost or market. This ASU will not apply to inventories measured by either the last-in first-out method or retail inventory method. The guidance requires application on a prospective basis. | | January 1, 2017 | | The Company is currently evaluating the alternative methods ofadopted this ASU on January 1, 2017. The adoption and the effect ondid not materially impact its Consolidated and Combined Financial Statements andor related disclosures. For the years ended December 31, 2017 and 2016, approximately 86% and 87% of the inventory balances were measured using LIFO, respectively. |
|
| | | | | | |
| | | | | | |
| Recently Adopted Accounting Standards (continued) | | | | |
| Standard | | Description | | Effective Date | | Effect on the Financial Statements or Other Significant Matters |
ASU 2017-04, Intangibles - Goodwill and Other (Topic 350) | | The standard simplifies how an entity is required to test goodwill for impairment by eliminating Step 2 from the goodwill impairment test. Step 2 measures a goodwill impairment loss by comparing the implied fair value of a reporting unit’s goodwill with the carrying amount of that goodwill. The guidance requires application on a prospective basis. | | January 1, 2020; early adoption is permitted | | The Company adopted this ASU on January 1, 2017. |
| ASU 2017-09, Compensation - Stock Compensation (Topic 718) | | The standard clarifies the changes to the terms and conditions of a share-based payment award that require an entity to apply modification accounting. The guidance requires application on a prospective basis. | | January 1, 2018; early adoption is permitted | | The Company adopted this ASU on April 1, 2017. The adoption did not materially impact its Consolidated Financial Statements or related disclosures. Impacts to future results and disclosures will be dependent upon the presence of any items noted in the standard. |
2. MERGER WITH UNISOURCE2017 ACQUISITION
As more fully describedOn August 31, 2017 (the "Acquisition Date"), Veritiv completed its acquisition of 100% of the equity interest in Note 1, Businessvarious All American Containers entities (collectively, "AAC"), a family owned and Summaryoperated distributor of Significant Accounting Policiesrigid packaging, including plastic, glass and metal containers, caps, closures and plastic pouches. ,The acquisition of AAC aligns with the Company's strategy of investing in higher growth and higher margin segments of the business. Through the acquisition, Veritiv gains expertise in rigid plastic, glass and metal packaging that complements its portfolio of packaging products and services. This acquisition also provides Veritiv with additional marketing, selling and distribution channels into the growing U.S. rigid packaging market. The rigid packaging market's primary product categories include paperboard, plastics, metals and glass. |
| | | |
| | (in millions) |
| Legal and other professional and consulting fees | $ | 29.7 |
|
| Retention compensation and termination benefits | 37.9 |
|
| Other | 7.5 |
|
| Total merger and integration expenses | $ | 75.1 |
|
The Mergeracquisition of AAC was accounted for in the Company’sCompany's financial statements using the acquisition method of accounting, with Veritiv asaccounting. The total consideration to complete the accounting acquirer of Unisource. The preliminary estimated purchase price of $382.6 millionacquisition was determined in accordance with the Merger Agreement. During the fourth quarter of 2014, the Company recorded a $3.1 million increaseapproximately $169.8 million. Due to the purchase pricelimited amount of time since the acquisition of AAC, the valuation of certain assets and corresponding adjustment to goodwillliabilities is preliminary and, as a result of finalizingmanagement receives additional information during the working capitalmeasurement period, these assets and net indebtedness adjustment with the UWWH Stockholder, less a decrease to the fair value of the contingent liability associated with the Tax Receivable Agreement.liabilities may be adjusted. The preliminary purchase price iswas allocated to tangible and identifiable intangible assets and liabilities based upon their respective fairestimated fair values.
The following table summarizes the components of the preliminary estimated purchase price for Unisource. The fair value of Veritiv shares transferred represents the aggregate value of 7,840,000 shares issued at the closing "when-issued" market price of the Company’s stock on June 30, 2014, the day prior to the Merger, less a discount for lack of marketability. See Note 10, Fair Value Measurements, regarding the valuation of the contingent liability.AAC:
Preliminary estimated purchase price:
|
| | | |
| Preliminary estimated purchase price: | (in millions) |
| Fair value of Veritiv shares transferred | $ | 284.7 |
|
| Cash payments associated with customary working capital and net indebtedness adjustments | 39.1 |
|
| Fair value of contingent liability associated with the Tax Receivable Agreement | 58.8 |
|
| Total preliminary estimated purchase price | $ | 382.6 |
|
|
| | | |
| | (in millions) |
| Cash consideration | $ | 112.0 |
|
| Loan pay-off | 34.3 |
|
| Contingent consideration | 22.2 |
|
| Other | 1.3 |
|
| Total preliminary estimated purchase price | $ | 169.8 |
|
The following table summarizes the preliminary allocationallocation of the preliminary estimated purchase price to assets acquired and liabilities assumed as of the date of the Merger:
|
| | | |
| Preliminary Allocation: | (in millions) |
| Cash | $ | 70.9 |
|
| Accounts receivable | 448.4 |
|
| Inventories | 353.8 |
|
| Deferred income tax assets | 71.1 |
|
| Property and equipment | 299.0 |
|
| Goodwill | 26.0 |
|
| Other intangible assets | 31.5 |
|
| Other current and non-current assets (including below market leasehold agreements) | 61.8 |
|
| Accounts payable | (284.2 | ) |
| Long-term debt (including equipment capital leases) | (313.2 | ) |
| Financing obligations to related party | (233.1 | ) |
| Defined benefit pension obligations | (30.3 | ) |
| Other current and non-current liabilities (including above market leasehold agreements) | (119.1 | ) |
| Total purchase price | $ | 382.6 |
|
The purchase price allocated to the identifiable intangible assets acquired is as follows:
|
| | | | | |
| | Value (in millions) | | Estimated Weighted-Average Useful Life (in years) |
| Customer relationships | $ | 24.3 |
| | 14.8 |
| Trademarks/Trade names | 4.1 |
| | 3.6 |
| Non-compete agreements | 3.1 |
| | 1 |
| Total identifiable intangible assets acquired | $ | 31.5 |
| | |
The allocation of the purchase price above is considered preliminary and wasAcquisition Date based on valuation information, estimates and
assumptionsassumptions available on December 31, 2014. During2017. See Note 4, Goodwill and Other Intangible Assets, for additional information related to the fourth quartergoodwill and intangible assets acquired in the AAC acquisition. See Note 11, Fair Value Measurements, for additional information related to the fair value of 2014, the Company finalized certain valuation matters, including property and equipment and certain typescontingent consideration related to the earn-out.Preliminary allocation:
|
| | | |
| | (in millions) |
| Cash | $ | 1.5 |
|
| Accounts receivable | 30.4 |
|
| Inventories | 38.5 |
|
| Other current assets | 5.7 |
|
| Property and equipment | 3.5 |
|
| Goodwill | 55.5 |
|
| Other intangible assets | 49.0 |
|
| Other non-current assets | 1.4 |
|
| Accounts payable | (12.4 | ) |
| Other current liabilities | (2.7 | ) |
| Other non-current liabilities | (0.6 | ) |
| Total preliminary estimated purchase price | $ | 169.8 |
|
The amounts shown above may change as the purchase price will be based upon finalization of obligations, which resulted in a $5.8 million net decrease to goodwill.customary working capital adjustments. The Company is still in the process of verifying data and finalizing information related to the valuation and expects to finalize these matters within the measurement period as final asset and liability valuations are completed. The following assets and liabilities are subject to change:
Deferred income tax assets and liabilities;
Contingent liability associated with the Tax Receivable Agreement; and
Other intangible assets.
As management receives additional information during the measurement period, these assets and liabilities may be adjusted.
The Company has evaluated and continues to evaluate and gather information relating to the pre-acquisition contingency for the escheat audit described in Note 15, Commitments and Contingencies, that existed as of the acquisition date. Should the Company develop an estimate for this contingency during the measurement period, it will be included in the
final valuation and related amounts recognized. Subsequent to the end of the measurement period, any adjustments to pre-acquisition contingency amounts will be reflected in the Company’s results of operations.
Preliminary goodwill of $26.0 million arising from the Merger consists largely of the synergies and other benefits expected from combining the operations and is not expected to be deductible for income tax purposes. See Note 4, Goodwill and Other Intangible Assets, for the preliminary allocation of goodwill to the Company's reportable segments.
Actual and Pro Forma Impact (unaudited)
The operating results for Unisourceof AAC are included in the Company’sCompany's financial statements from JulySeptember 1, 20142017 through December 31, 2014.2017 and are reported as part of the Packaging reportable segment. Net sales and pre-tax incomeoperating loss attributable to UnisourceAAC during this period and included in the Company's Consolidated Statements of Operations were $2,040.5$71.7 million and $31.2($1.7) million, respectively.
The following unaudited pro forma financial information presents results as if the Merger and the related financing, further described in Note 5, Debt,acquisition of AAC occurred on January 1, 2013.2016. The historical consolidated financial information of the Company and UnisourceAAC has been adjusted in the pro forma information to give effect to pro forma events that are directly attributable to the transactionstransaction and are factually supportable. The unaudited pro forma results do not reflect events that have occurred or may occur after the transactions,transaction, including the impact of any synergies expected to result from the Merger.acquisition. Accordingly, the unaudited pro forma financial information is not necessarily indicative of the results of operations as they would have been had the transactionstransaction been effected on the assumed date, nor is it necessarily an indication of future operating results.
|
| | | | | | | |
| (Unaudited) | Year Ended
December 31, |
| (in millions, except share and per share data) | 2014 | | 2013 |
| Net sales | $ | 9,314.1 |
| | $ | 9,741.5 |
|
Net income(1) | $ | 22.7 |
| | $ | 181.1 |
|
| Earnings per share – basic and diluted | $ | 1.42 |
| | $ | 11.32 |
|
| Weighted-average shares outstanding – basic and diluted | 16,000,000 |
| | 16,000,000 |
|
(1) Unisource's historical results for the year ended December 31, 2013 include the reversal of a $238.7 million valuation allowance against its U.S. federal and a substantial portion of its state net deferred tax assets. |
| | | | | | | |
| (Unaudited) | Year Ended December 31, |
| (in millions, except share and per share data) | 2017 | | 2016 |
| Net sales | $ | 8,527.6 |
| | $ | 8,548.2 |
|
| Net income (loss) | (7.2 | ) | | 14.1 |
|
| Earnings (loss) per share: | | | |
| Basic earnings (loss) per share | $ | (0.46 | ) | | $ | 0.88 |
|
| Diluted earnings (loss) per share | $ | (0.46 | ) | | $ | 0.87 |
|
| Weighted-average shares outstanding | | | |
| Basic | 15.70 |
| | 15.97 |
|
| Diluted | 15.70 |
| | 16.15 |
|
The unaudited pro forma information reflects primarily the following pre-tax adjustments for the respective periods:
Merger- Acquisition and integration expenses: MergerAcquisition and integration expenses of $75.1$8.9 million incurred during the year ended December 31, 20142017 have been eliminated. Pro forma net income for the year ended December 31, 20132016 includes mergeracquisition and integration expenses of $103.5$8.9 million.
- Incremental depreciation and amortization expense: Pro forma net income for the yearsyear ended December 31, 2014 and 20132017 includes $2.5 million and $14.0 million, respectively, of incremental depreciation and amortization expense related toof $2.5 million. Pro forma net income for the fair value adjustments to property and equipment and identifiable intangible assets.year ended December 31, 2016 includes incremental amortization expense of $6.3 million.
- Interest expense: Pro forma net income for the year ended December 31, 2017 includes incremental interest expense of $2.0 million. Pro forma net income for the year ended December 31, 2016 includes incremental interest expense of $2.4 million.
A combined effective U.S. federal statutory and state rate of 39.0% was used to determine the after-tax impact on net income of the pro forma adjustments.
3. ACQUISITION, INTEGRATION AND RESTRUCTURING CHARGES
Merger of xpedx and Unisource
The Company currently expects net costs and charges associated with achieving anticipated cost savings and other synergies from the Merger (excluding charges relating to the complete or partial withdrawal from multi-employer pension plans ("MEPP"), some of which are uncertain at this time, and including cash proceeds from sales of assets related to consolidation), to be approximately $225 million to $250 million, through December 31, 2018. Included in the estimate is approximately $90 million for capital expenditures, primarily consisting of information technology infrastructure, systems integration and planning. Through December 31, 2017, the Company has incurred approximately $221 million in costs and charges, including approximately $82 million for capital expenditures.
Acquisition and Integration Expenses
During the years ended December 31, 2017, 2016 and 2015, Veritiv incurred costs and charges related primarily to: internally dedicated integration management resources, retention compensation, information technology conversion costs, rebranding, professional services and other costs to integrate its businesses. The following table summarizes the components of acquisition and integration expenses:
|
| | | | | | | | | | | | |
| | | Year Ended December 31, |
| (in millions) | | 2017 | | 2016 | | 2015 |
| Integration management | | $ | 14.5 |
| | $ | 8.3 |
| | $ | — |
|
| Retention compensation | | 0.2 |
| | 2.5 |
| | 10.8 |
|
| Information technology conversion costs | | 8.8 |
| | 6.3 |
| | 7.4 |
|
| Rebranding | | 0.5 |
| | 2.4 |
| | 6.1 |
|
| Legal, consulting and other professional fees | | 1.5 |
| | 2.3 |
| | 7.8 |
|
| Other | | 3.0 |
| | 4.1 |
| | 2.8 |
|
| AAC acquisition and integration | | 8.0 |
| | — |
| | — |
|
| Total acquisition and integration expenses | | $ | 36.5 |
| | $ | 25.9 |
| | $ | 34.9 |
|
Veritiv Restructuring Plan
As part of the Spin-off and Merger, the Company is executing on a multi-year restructuring program of its North American operations intended to integrate the legacy xpedx and Unisource operations, generate cost savings and capture synergies across the combined company. The restructuring plan includes initiatives to: (i) consolidate warehouse facilities in overlapping markets, (ii) improve the efficiency of the delivery network, (iii) consolidate customer service centers, (iv) reorganize the field sales and operations functions and (v) restructure the corporate general and administrative functions.
During the fourth quarterAs part of 2014,its restructuring efforts, the Company initiated the processcontinues to evaluate its operations outside of consolidating warehouse and customer service locations of the legacy organizations as well as realigning its field and sales management function.
North America to identify additional cost saving opportunities. The Company recordedmay elect to restructure its operations in specific countries, which may include staff reductions, lease terminations and facility closures, or a complete exit of a market. The Company may continue to record restructuring charges in the future as restructuring activities progress, which may include gains or losses from the disposition of $5.1 million during the fourth quarter of 2014 related to these initiatives.assets. See Note 17, Segment and Geographic Information, for the impact these charges had on the Company's reportable segments.
For the years ended December 31, 2017, 2016 and 2015, the Company recognized $24.4 million and $2.1 million in net gains related to the sale or exit of certain facilities and a $4.1 million net non-cash loss from asset impairments, respectively. As of December 31, 2017, the Company held for sale $3.2 million in assets related to these activities, which are included in other current assets on the Consolidated Balance Sheets.
Other direct costs reported in the tabletables below include facility closing costs, actual and estimated multi-employer pension plan withdrawal charges and other incidental costs associated with the development, communication, administration and implementation of these initiatives.
The corresponding liabilityfollowing table presents a summary of restructuring charges, net, related to active restructuring initiatives that were incurred during the last three fiscal years and activity are detailed in the table below.cumulative recorded amounts since the initiative began:
|
| | | | | | | | | |
| (in millions) | Severance and Related Costs | Other Direct Costs | Total |
| Liability at December 31, 2013 | $ | — |
| $ | — |
| $ | — |
|
| Costs incurred | 4.7 |
| 0.4 |
| 5.1 |
|
| Payments | (1.0 | ) | (0.2 | ) | (1.2 | ) |
| Liability at December 31, 2014 | $ | 3.7 |
| $ | 0.2 |
| $ | 3.9 |
|
|
| | | | | | | | | | | | | | | |
| (in millions) | Severance and Related Costs | | Other Direct Costs | | Gain on Sale of Assets and Other | | Total |
| 2017 | $ | 7.5 |
| | $ | 33.6 |
| | $ | (24.4 | ) | | $ | 16.7 |
|
| 2016 | 3.5 |
| | 11.0 |
| | (2.1 | ) | | 12.4 |
|
| 2015 | 4.3 |
| | 2.9 |
| | 4.1 |
| | 11.3 |
|
| Cumulative | 20.0 |
| | 47.9 |
| | (22.4 | ) | | 45.5 |
|
xpedx Restructuring Plan
During 2010, xpedx completed a strategic assessment of its operating model, resulting in the decision to begin a multi-year restructuring plan. The restructuring plan involved the establishment of a lower cost operating model in connection with the repositioning of the Print segment in response to changing market considerations. The restructuring plan included initiatives to (i) optimize the warehouse network, (ii) improve the efficiency of the sales team and (iii) reorganize the procurement function. The plan was launched in 2011 and was substantially completed by June 30, 2014.
The restructuring plan identified locations to be affected and a range of time for specific undertakings. During 2013 and 2012, xpedx closed six and 118 locations, respectively. There were no locations closed in 2014 under this plan. xpedx recorded restructuring income of $1.1 million and charges of $37.9 million and $35.1 million during the years ended December 31, 2014, 2013 and 2012, respectively, related to these closures. The income and charges were as follows:
|
| | | | | | | | | | | |
| | Year Ended December 31, |
| (in millions) | 2014 | | 2013 | | 2012 |
| Facility costs | $ | 0.3 |
| | $ | 15.2 |
| | $ | 13.0 |
|
| Severance | 0.2 |
| | 16.9 |
| | 11.9 |
|
| Personnel costs | — |
| | 10.9 |
| | 10.6 |
|
| Accelerated amortization and depreciation | — |
| | 0.3 |
| | 1.2 |
|
| Professional services | — |
| | 1.0 |
| | 1.1 |
|
| Gain on sale of fixed assets | (1.6 | ) | | (6.4 | ) | | (2.7 | ) |
| Total | $ | (1.1 | ) | | $ | 37.9 |
| | $ | 35.1 |
|
The corresponding liability and activity during the periods presented are detailed in the table below. In connection with the Spin-off on July 1, 2014, the remaining liability at June 30, 2014 was transferred to International Paper. See Note 8, Related Party Transactions, for more details. |
| | | |
| (in millions) | Total |
| Liability at December 31, 2012 | $ | 3.8 |
|
| Costs incurred | 44.0 |
|
| Payments | (39.7 | ) |
| Adjustment of prior year's estimate | (0.4 | ) |
| Liability at December 31, 2013 | 7.7 |
|
| Costs incurred | 0.1 |
|
| Payments | (3.9 | ) |
| Adjustment of prior year's estimate | (0.3 | ) |
| Liability transferred to Parent in connection with Spin-off | (3.6 | ) |
| Liability at December 31, 2014 | $ | — |
|
The following is a summary of the Company's restructuring liability activity for the periods presented:
|
| | | | | | | | | | | |
| (in millions) | Severance and Related Costs | | Other Direct Costs | | Total |
| Balance at December 31, 2015 | $ | 1.7 |
| | $ | 0.4 |
| | $ | 2.1 |
|
| Costs incurred | 3.5 |
| | 11.0 |
| | 14.5 |
|
| Payments | (3.4 | ) | | (3.4 | ) | | (6.8 | ) |
| Balance at December 31, 2016 | 1.8 |
| | 8.0 |
| | 9.8 |
|
| Costs incurred | 7.5 |
| | 33.6 |
| | 41.1 |
|
| Payments | (4.9 | ) | | (16.4 | ) | | (21.3 | ) |
| Balance at December 31, 2017 | $ | 4.4 |
| | $ | 25.2 |
| | $ | 29.6 |
|
The Company has recorded undiscounted charges related to the complete or partial withdrawal from various multi-employer pension plans. Charges not related to the Company's restructuring efforts are recorded as distribution expenses. Initial amounts are recorded as other non-current liabilities in the Consolidated Balance Sheets. See the table below for a summary of the net withdrawal charges for the respective years ended December 31:
|
| | | | | | | | | | | |
| | Year Ended December 31, |
| (in millions) | Restructuring charges, net | | Distribution expenses | | Total Net Charges |
| 2017 | $ | 17.4 |
| | $ | 2.1 |
| | $ | 19.5 |
|
| 2016 | 7.5 |
| | 2.3 |
| | 9.8 |
|
Final charges for these MEPP withdrawals will not be known until the plans issue their respective determinations. As a result, these estimates may increase or decrease depending upon the final determinations. Currently, the Company expects payments will occur over an approximate 20 year period. The Company expects to incur similar types of charges in future periods in connection with its ongoing restructuring activities. As of December 31, 2017, the Company has received the determination letters from one of the restructuring related plans. Monthly payments for this plan are expected to occur over an approximate 20 year period.
4. GOODWILL AND OTHER INTANGIBLE ASSETS
Goodwill
At December 31, 2013,2017, the net goodwill balance was $26.4 million and was specific to the Packaging reportable segment. There were no additions to goodwill during the year ended December 31, 2013.$99.6 million. The following table sets forth the changes in the carrying amount of goodwill during 2014:2017 and 2016:
|
| | | | | | | | | | | | | | | | | | | | | | | |
| (in millions) | Print | | Publishing | | Packaging | | Facility Solutions | | Corporate & Other | | Total |
| Balance at December 31, 2013 | $ | — |
| | $ | — |
| | $ | 26.4 |
| | $ | — |
| | $ | — |
| | $ | 26.4 |
|
| Additions to goodwill | — |
| | — |
| | 17.9 |
| | 1.9 |
| | 6.2 |
| | 26.0 |
|
| Balance at December 31, 2014 | $ | — |
| | $ | — |
| | $ | 44.3 |
| | $ | 1.9 |
| | $ | 6.2 |
| | $ | 52.4 |
|
|
| | | | | | | | | | | | | | | | | | | | | | | |
| (in millions) | Packaging | | Facility Solutions | | Print | | Publishing | | Corporate & Other | | Total |
| Balance at December 31, 2015: | | | | | | | | | | | |
| Goodwill | $ | 44.1 |
| | $ | 59.0 |
| | $ | 265.4 |
| | $ | 50.5 |
| | $ | 6.1 |
| | $ | 425.1 |
|
| Accumulated impairment losses | — |
| | (59.0 | ) | | (265.4 | ) | | (50.5 | ) | | — |
| | (374.9 | ) |
| Net goodwill 2015 | 44.1 |
| | — |
| | — |
| | — |
| | 6.1 |
| | 50.2 |
|
| 2016 Activity: | | | | | | | | | | | |
| Goodwill acquired | — |
| | — |
| | — |
| | — |
| | — |
| | — |
|
| Impairment of goodwill | — |
| | — |
| | — |
| | — |
| | — |
| | — |
|
| Balance at December 31, 2016: | | | | |
| |
| |
| |
|
| Goodwill | 44.1 |
| | 59.0 |
| | 265.4 |
| | 50.5 |
| | 6.1 |
| | 425.1 |
|
| Accumulated impairment losses | — |
| | (59.0 | ) | | (265.4 | ) | | (50.5 | ) | | — |
| | (374.9 | ) |
| Net goodwill 2016 | 44.1 |
| | — |
| | — |
| | — |
| | 6.1 |
| | 50.2 |
|
| 2017 Activity: | | | | | | | | | | | |
| Goodwill acquired | 55.5 |
| | — |
| | — |
| | — |
| | — |
| | 55.5 |
|
| Impairment of goodwill | — |
| | — |
| | — |
| | — |
| | (6.1 | ) | | (6.1 | ) |
| Balance at December 31, 2017: | | | | | | | | | | | |
| Goodwill | 99.6 |
| | 59.0 |
| | 265.4 |
| | 50.5 |
| | 6.1 |
| | 480.6 |
|
| Accumulated impairment losses | — |
| | (59.0 | ) | | (265.4 | ) | | (50.5 | ) | | (6.1 | ) | | (381.0 | ) |
| Net goodwill 2017 | $ | 99.6 |
| | $ | — |
| | $ | — |
| | $ | — |
| | $ | — |
| | $ | 99.6 |
|
AsPreliminary goodwill of December 31, 2013, xpedx had recognized accumulated$55.5 million arising from the acquisition of AAC, as described in Note 2, 2017 Acquisition, consists largely of the expected synergies and other benefits from combining operations and is expected to be deductible for tax purposes. The goodwill was allocated 100% to the Company's Packaging reportable segment.
During the third quarter of 2017, as part of the Company's review for possible goodwill impairment chargesindicators, management determined that the goodwill allocated to the logistics solutions business was fully impaired. The impairment was recorded as selling and administrative expense in the Consolidated Statements of $265.4 million, $57.1 million and $50.5 millionOperations. See Note 11, Fair Value Measurements, for additional information related to its Print, Facility Solutions and Publishing segments, respectively.the impairment. There were no other goodwill impairment charges for the year ended December 31, 2014. Additions to2017. No goodwill in 2014 representimpairment charges were recorded during the preliminaryyear ended December 31, 2016. During the fourth quarter of 2015, a $1.9 million goodwill resulting fromimpairment was identified and recorded as selling and administrative expense for the Merger. See Note 2, Merger with Unisource, for further details.Facility Solutions segment.
Other Intangible Assets
The components of the Company's other intangible assets were as follows:
| | | | December 31, 2014 | | December 31, 2013 | December 31, 2017 | | December 31, 2016 |
| (in millions) | Gross Carrying Amount | | Accumulated Amortization | | Net | | Gross Carrying Amount | | Accumulated Amortization | | Net | Gross Carrying Amount | | Accumulated Amortization | | Net | | Gross Carrying Amount | | Accumulated Amortization | | Net |
| Customer relationships | $ | 55.0 |
| | $ | 23.7 |
| | $ | 31.3 |
| | $ | 30.7 |
| | $ | 21.5 |
| | $ | 9.2 |
| $ | 67.7 |
| | $ | 6.1 |
| | $ | 61.6 |
| | $ | 23.6 |
| | $ | 4.0 |
| | $ | 19.6 |
|
| Trademarks/Trade names | 4.3 |
| | 1.1 |
| | 3.2 |
| | 0.2 |
| | 0.1 |
| | 0.1 |
| 3.8 |
| | 2.3 |
| | 1.5 |
| | 2.7 |
| | 1.3 |
| | 1.4 |
|
| Non-compete agreements | 3.1 |
| | 1.5 |
| | 1.6 |
| | — |
| | — |
| | — |
| 1.5 |
| | 0.5 |
| | 1.0 |
| | — |
| | — |
| | — |
|
| Total | $ | 62.4 |
| | $ | 26.3 |
| | $ | 36.1 |
| | $ | 30.9 |
| | $ | 21.6 |
| | $ | 9.3 |
| $ | 73.0 |
| | $ | 8.9 |
| | $ | 64.1 |
| | $ | 26.3 |
| | $ | 5.3 |
| | $ | 21.0 |
|
Additions toThe gross carrying amount of other intangible assets increased by $49.0 million as a result of the acquisition of AAC. The Company is still in 2014 represent the preliminary identifiableprocess of verifying data and finalizing information related to the valuation and expects to finalize these matters within the measurement period as final asset and liability valuations are completed. These assets are included in other intangibles, net on the Consolidated Balance Sheets and are being amortized to operating expense on a straight-line basis over their estimated useful lives. Preliminary allocated values from the AAC acquisition are as follows:
|
| | | | | |
| | Gross Value (in millions) | | Estimated Useful Life (in years) |
| Customer relationships | $ | 46.4 |
| | 14.0 |
| Trademarks/Trade names | 1.1 |
| | 1.0 |
| Non-compete agreements | 1.5 |
| | 1.0 |
| Total identifiable intangible assets acquired | $ | 49.0 |
| | |
During the third quarter of 2017, the Company recognized a $1.6 million non-restructuring asset impairment charge related to its logistics solutions business's customer relationship intangible asset, which was recorded in selling and administrative expenses. During the year ended December 31, 2016, the Company recognized $2.8 million and $3.0 million in asset impairment charges related to its Print and Publishing segments' customer relationship intangible assets, resultingrespectively, which were recorded in selling and administrative expenses. No intangible asset impairment charges were recorded during the year ended December 31, 2015.
Upon retirement or full impairment of the intangible asset, the cost and related amount of accumulated amortization are eliminated from the
Merger, as discussed in Note 2, Merger with Unisource.asset and accumulated amortization accounts, respectively.
The Company recorded amortization expense of $4.7$4.2 million, $1.5$3.4 million and $2.3$5.9 million duringfor the years ended December 31, 2014, 20132017, 2016 and 2012,2015, respectively.
The estimated aggregate amortization expense for each of the five succeeding years is as follows (in millions):
| | | Year | | Total | | Total |
| 2015 | | $ | 5.8 |
| |
| 2016 | | 3.6 |
| |
| 2017 | | 3.6 |
| |
| 2018 | | 3.6 |
| | $ | 6.7 |
|
| 2019 | | 3.3 |
| | 4.8 |
|
| 2020 | | | 4.8 |
|
| 2021 | | | 4.8 |
|
| 2022 | | | 4.8 |
|
5. DEBT AND OTHER OBLIGATIONS
The Company did not have any long-term debt obligations as of December 31, 2013. As of December 31, 2014, the Company's long-term debt obligations were as follows:
|
| | | | | | | |
| (in millions) | December 31, 2017 | | December 31, 2016 |
| Asset-Based Lending Facility (the "ABL Facility") | $ | 897.7 |
| | $ | 726.9 |
|
| Equipment capital lease and other obligations | 13.5 |
| | 25.2 |
|
| Total debt | 911.2 |
| | 752.1 |
|
| Less: current maturities of long-term debt | (2.9 | ) | | (2.9 | ) |
| Long-term debt, net of current maturities | $ | 908.3 |
| | $ | 749.2 |
|
The equipment capital lease and other obligations reported in the table above includes $19.1 million related to the accumulated construction costs for the Toronto build-to-suit arrangement as of December 31, 2016. This project was completed during the second quarter of 2017 and is accounted for as a financing obligation. As such, for periods beginning with the second quarter of 2017 the obligation value is shown in the table below as other financing, in addition to the Company's related party financing obligations.
The Company's long-term financing obligations were as follows:
|
| | | |
| (in millions) | December 31, 2014 |
| ABL Facility | $ | 847.8 |
|
| Equipment capital lease obligations | 11.0 |
|
| Total debt | 858.8 |
|
| Less: current portion of long-term debt | (3.8 | ) |
| Long-term debt, net of current maturities | $ | 855.0 |
|
|
| | | | | | | |
| (in millions) | December 31, 2017 | | December 31, 2016 |
| Obligations to related party | $ | 162.3 |
| | $ | 191.0 |
|
| Obligations - other financing | 27.1 |
| | — |
|
| Total financing obligations | 189.4 |
| | 191.0 |
|
| Less: current portion of financing obligations | (7.8 | ) | | (14.9 | ) |
| Financing obligations, less current portion | $ | 181.6 |
| | $ | 176.1 |
|
From the Merger through December 31, 2017, the Company has terminated agreements for 11 of the related party financed properties and therefore triggered an early termination of each respective property's financing agreement. One of these terminations also involved the purchase of a facility in Austin, Texas. See Note 7, Leases, for additional information related to that purchase. Upon termination of a property's financing agreement, the Company recognizes the non-cash effects of the derecognition of (i) the property and equipment and (ii) the corresponding financing obligation, as other non-cash items, net, on the Consolidated Statements of Cash Flows. Any gain or loss realized upon derecognition has been included in other (income) expense, net or restructuring charges on the Consolidated Statements of Operations, based upon the rationale for the termination. Unless terminated early, upon the expiration of the term of the remaining related party financing agreements, the net remaining financing obligation of $155.2 million will be settled by the return of the assets to the owner and has been included in other non-current liabilities on the Consolidated Balance Sheets. See the table below for the non-cash effects of the derecognition of (i) the property and equipment and (ii) the corresponding financing obligation: |
| | | | | | | | | | | |
| | Year Ended December 31, |
| (in millions, except number of agreements) | 2017 | | 2016 | | Total |
| | | | | | |
| Property and equipment | $ | 14.6 |
| | $ | 3.7 |
| | $ | 18.3 |
|
| Financing obligations | 15.2 |
| | 8.4 |
| | 23.6 |
|
| Number of terminated property agreements | 8 |
| | 3 |
| | 11 |
|
ABL Facility
In conjunction with the Spin-off and Merger, and to refinance existing debt of Unisource, Veritiv entered into a commitment with a group of lenders forhas a $1.4 billion asset-based lending facility (the "ABL Facility").facility. The ABL Facility is comprised of U.S. and Canadian sub-facilities of $1,250.0 million and $150.0 million, respectively. The ABL Facility is available to be drawn in U.S. dollars, in the case of the U.S. sub-facilities, and in U.S. dollars or Canadian dollars, in the case of the Canadian sub-facilities, or in other currencies that are mutually agreeable. The Company's accounts receivable and inventories in the U.S. and Canada are collateral under the ABL Facility.
On August 11, 2016, the Company amended the ABL Facility to, among other things, extend the maturity date to August 11, 2021. All other significant terms remained consistent. The ABL Facility will mature and the commitments thereunder will terminate after July 1, 2019; however, it provides for the right of the individual lenders to extend the maturity date of their respective commitments and loans upon the request of Veritiv and without the consent of any other lenders. The ABL Facility may be prepaid at Veritiv's option at any time without premium or penalty and is subject to mandatory prepayment if the amount outstanding under the ABL Facility exceeds either the aggregate commitments with respect thereto or the current borrowing base, in an amount equal to such excess.
The ABL Facility has a springing minimum fixed charge coverage ratio of at least 1.00 to 1.00 on a trailing four-quarter basis, which will be tested only when specified availability is less than limits outlined under the ABL Facility. At December 31, 2014,2017 the above test was not applicable.
Availability under the ABL Facility is determined based upon a monthly borrowing base calculation which includes eligible customer receivables and inventory, less outstanding borrowings, letters of credit and certain designated reserves. As of December 31, 2014,2017, the available additional borrowing capacity under the ABL Facility was approximately $392.0$316.5 million. As of December 31, 2017, the Company held $10.1 million in outstanding letters of credit.
Under the terms of the ABL Facility, interest rates are based upon LIBOR or the prime rate plus a margin rate, or in the case of Canada, a banker’s acceptance rate or base rate plus a margin rate. At December 31, 2014, theThe weighted-average borrowing interest rate was 2.0%.3.3% and 2.5% at December 31, 2017 and December 31, 2016, respectively.
Financing and other related costs incurred in connection with the ABL Facility are reflected in other non-current assets in the Consolidated and Combined Balance Sheets and are amortized over the ABL Facility term. In conjunction with the ABL Facility amendment noted above, the Company recognized a charge of $1.9 million to interest expense, net, in the Consolidated Statements of Operations, for the write-off of a portion of the previously deferred financing costs associated with lenders in the original ABL Facility that exited the amended ABL Facility. In addition, the Company incurred and deferred $2.0 million of new financing costs associated with this transaction, reflected in other non-current assets in the Consolidated Balance Sheets, which will be amortized to interest expense on a straight-line basis over the amended term of the ABL Facility. For the years ended December 31, 2017, 2016 and 2015, interest expense, net in the Consolidated Statements of Operations included $2.6 million, $5.6 million and $4.4 million, respectively, of amortization and write-off of deferred financing fees.
Equipment Capital Lease Obligations
See Note 7, Leases, for additional information regarding the Company's equipment capital lease obligations.
6. DERIVATIVE INSTRUMENT, HEDGING ACTIVITIES AND RISK MANAGEMENT
Financial Risk Management Policy
The Company’s indebtedness under its financing arrangement creates interest rate risk. The Company’s objective is to reduce, where it is deemed appropriate to do so, fluctuations in earnings and cash flows associated with changes in the interest rate. The Company does not hold or issue derivative financial instruments for trading or speculative purposes.
This interest rate exposure is actively monitored by management, and in July 2015, the Company entered into an interest rate cap agreement. The interest rate cap effectively limits the floating LIBOR-based portion of the interest rate. The effective date of the interest rate cap agreement was July 31, 2015 with an expiration date of July 1, 2019. The initial notional amount of this agreement covered $392.9 million of the Company’s floating-rate debt at 3.0% plus the applicable credit spread. The Company paid $2.0 million for the interest rate cap agreement. Approximately $0.6 million of the amount paid represented transaction costs and was expensed immediately to earnings. As of December 31, 2017 and December 31, 2016, the interest rate cap agreement had a fair value that was not significant, classified within other non-current assets on the Consolidated Balance Sheets. The fair value is estimated using observable market-based inputs including interest rate curves and implied volatilities (Level 2).
The Company designated the interest rate cap as a cash flow hedge of exposure to changes in cash flows due to changes in the LIBOR-based portion of the interest rate above 3.0% on an equivalent amount of debt. The notional amount of the cap is reduced throughout the term of the agreement to align with the expected repayment of the Company’s outstanding floating-rate debt.
The Company is exposed to counterparty credit risk for nonperformance and, in the event of nonperformance, to market risk for changes in the interest rate. The Company attempts to manage exposure to counterparty credit risk primarily by selecting only those counterparties that meet certain credit and other financial standards. The Company believes there has been no material change in the creditworthiness of its counterparty and believes the risk of nonperformance by such party is minimal.
Accounting for Derivative Instruments
The interest rate cap agreement is subject to Accounting Standards Codification 815, Accounting for Derivative and Hedging Transactions. For those instruments that are designated and qualify as hedging instruments, a company must designate the instrument, based upon the exposure being hedged, as a cash flow hedge, a fair value hedge or a hedge of a net investment in a foreign operation.
A cash flow hedge refers to hedging the exposure to variability in expected future cash flows attributable to a particular risk. For derivative instruments that are designated and qualify as a cash flow hedge, the effective portion of the gain or loss on the derivative instrument is reported as a component of AOCL until reclassified into earnings in the same period the hedged transaction affects earnings. The gain or loss on the ineffective portion, if any, is immediately recognized in earnings. The ineffective portion was not significant for the years ended December 31, 2017, 2016 and 2015 respectively.
For the years ended December 31, 2017, 2016 and 2015, the Company recognized an after-tax loss of $0.0 million, $0.2 million and $0.5 million, respectively, in other comprehensive income associated with the interest rate cap. For the year ended December 31, 2014, interest expense, net in2017, $0.2 million was reclassified from AOCL into earnings. There were no reclassifications from AOCL into earnings for the Consolidatedyears ended December 31, 2016 and Combined Statements of Operations included $2.2 million of amortization of deferred financing fees.
Senior Credit Facility2015, respectively. The amount the Company expects to reclassify from AOCL into earnings within the following twelve months is approximately $0.7 million.
Unisource had an asset-based senior credit facility agreement (the "Senior Credit Facility") of which $303.9 million was drawn and outstanding as of July 1, 2014. On July 1, 2014, Veritiv assumed the Senior Credit Facility debt in connection with the Merger and used a portion of the proceeds borrowed against the ABL Facility to repay all of the outstanding balance under the Senior Credit Facility. Accordingly, the Senior Credit Facility expired on July 1, 2014 as a result of the prepayment.
6.7. LEASES
Lease Commitments
Future minimum lease payments at December 31, 20142017 were as follows:
| | | | | | Operating Leases | Financing Obligations and Equipment Capital Leases (1) | | Operating Leases |
| (in millions) | Financing Obligations to Related Party and Equipment Capital Leases | | Lease Obligations | | Sublease Income | | Total | | Lease Obligations | | Sublease Income | | Total |
| 2015 | $ | 20.7 |
| | $ | 77.8 |
| | $ | (0.3 | ) | | $ | 77.5 |
| |
| 2016 | 19.8 |
| | 68.1 |
| | (0.2 | ) | | 67.9 |
| |
| 2017 | 19.4 |
| | 58.3 |
| | (0.1 | ) | | 58.2 |
| |
| 2018 | 8.9 |
| | 49.4 |
| | (0.1 | ) | | 49.3 |
| $ | 12.8 |
| | $ | 94.3 |
| | $ | (0.2 | ) | | $ | 94.1 |
|
| 2019 | 0.4 |
| | 40.7 |
| | — |
| | 40.7 |
| 5.0 |
| | 80.3 |
| | (0.2 | ) | | 80.1 |
|
| 2020 | | 4.6 |
| | 70.4 |
| | — |
| | 70.4 |
|
| 2021 | | 4.0 |
| | 57.7 |
| | — |
| | 57.7 |
|
| 2022 | | 3.8 |
| | 45.8 |
| | — |
| | 45.8 |
|
| Thereafter | 0.3 |
| | 87.2 |
| | — |
| | 87.2 |
| 22.4 |
| | 135.6 |
| | — |
| | 135.6 |
|
| | 69.5 |
| | 381.5 |
| | (0.7 | ) | | 380.8 |
| 52.6 |
| | 484.1 |
| | (0.4 | ) | | 483.7 |
|
| Amount representing interest | (6.3 | ) | | — |
| | — |
| | — |
| (12.5 | ) | | — |
| | — |
| | — |
|
| Total future minimum lease payments | $ | 63.2 |
| | $ | 381.5 |
| | $ | (0.7 | ) | | $ | 380.8 |
| $ | 40.1 |
| | $ | 484.1 |
| | $ | (0.4 | ) | | $ | 483.7 |
|
(1) Amounts shown include the financing obligations to related party.
Financing Obligations to Related Party
In connection with Bain Capital Fund VII, L.P.’s acquisition of its 60% interest in UWWH on November 27, 2002, Unisource transferred 40 of its U.S. warehouse and distribution facilities (the "Properties") to Georgia-Pacific who then sold 38 of the Properties to an unrelated third-party (the "Purchaser/Landlord"). Contemporaneously with the sale, Georgia-Pacific entered into lease agreements with the Purchaser/Landlord with respect to the individual 38 Properties and concurrently entered into sublease agreements with Unisource, which are set to expire in June 2018. As a result of certain forms of continuing involvement, these transactions did not qualify for sale-leaseback accounting. Accordingly, the leases were classified as financing transactions. From the Merger through December 31, 2017, the Company has terminated agreements for 11 of these Properties. At the end of the lease term, the net remaining financing obligation of $174.0$155.2 million will be settled by the return of the assets to the Purchaser/Landlord.
The lease and sublease agreements also include rent schedules and escalation clauses throughout the lease and sublease terms. Subject to certain conditions, Unisourcethe Company has the right to sublease any of the Properties. Under the terms of the lease and sublease agreements, Georgia-Pacific and Unisourcethe Company are responsible for all costs and expenses associated with the Properties, including the operation, maintenance and repair, taxes and insurances. Currently, UnisourceIn addition to the obligations noted above, the Company currently leases from Georgia-Pacific twoone remaining PropertiesProperty that areis directly owned by Georgia-Pacific and has classified themit as capital oran operating leaseslease in accordance with the accounting guidance.
In April 2016, Veritiv assumed ownership of a warehouse and distribution facility located in Austin, Texas that was subleased from Georgia-Pacific. The Company exercised its right of first refusal and matched a $5.4 million offer from an unrelated third-party to purchase the facility directly from the owner. This transaction was accounted for as a settlement of
the financing obligation related to the facility. Accordingly, Veritiv recognized a $1.3 million loss on the transaction, which is reflected in other (income) expense, net, on the Consolidated Statements of Operations.
In May 2017, the Company entered into a purchase and sale agreement under which Veritiv agreed to sell the previously acquired Austin, Texas facility to an unrelated third-party. Upon the closing of the sale, Veritiv entered into a lease of the facility for an initial period of ten years with two optional five-year renewal terms. The sale-leaseback transaction does not provide for any continuing involvement by the Company other than a normal lease for use of the property during the lease term. The transaction resulted in net cash proceeds of $9.1 million and a related deferred gain of $5.4 million. The Company expects to recognize the gain over the initial ten-year lease period on a straight-line basis as a reduction to selling and administrative expenses in the Consolidated Statements of Operations. The current portion of the deferred gain is included in other accrued liabilities and the non-current portion of the deferred gain is included in other non-current liabilities on the Consolidated Balance Sheets.
Operating Leases
Certain properties and equipment are leased under cancelable and non-cancelable agreements. The Company recorded rent expense of $92.4$106.3 million, $65.0$108.1 million and $64.4$106.2 million for the years ended December 31, 2014, 20132017, 2016 and 2012,2015, respectively.
7.8. INCOME TAXES
As described in Note 1, Business and Summary of Significant Accounting Policies, Veritiv was formed through a merger of xpedx, previously a division of International Paper, and Unisource Worldwide, Inc. on July 1, 2014. Accordingly, the tax provision included for the periods prior to July 1, 2014 include only the financial results of xpedx presented on a carve-out basis from International Paper’s historical accounting records. For periods subsequent to July 1, 2014 the tax provision presents the consolidated results of Veritiv on a stand-alone basis.
The Company is subject to federal, state and local income taxes in the United States, as well as income taxes in Canada, Mexico and other foreign jurisdictions. The domestic (United States) and foreign components of the Company's income (loss) from continuing operations before income taxes were as follows:
| | | | Year Ended December 31, | Year Ended December 31, |
| (in millions) | 2014 | | 2013 | | 2012 | 2017 | | 2016 | | 2015 |
| Domestic (United States) | $ | (19.0 | ) | | $ | (2.1 | ) | | $ | 15.8 |
| $ | (18.0 | ) | | $ | 27.6 |
| | $ | 46.6 |
|
| Foreign | (2.6 | ) | | 2.5 |
| | 7.7 |
| 16.1 |
| | 13.2 |
| | (1.7 | ) |
| Income (loss) from continuing operations before income taxes | $ | (21.6 | ) | | $ | 0.4 |
| | $ | 23.5 |
| |
| Income (loss) before income taxes | | $ | (1.9 | ) | | $ | 40.8 |
| | $ | 44.9 |
|
Income tax expense (benefit) in the Consolidated and Combined Statements of Operations consisted of the following:
| | | | Year Ended December 31, | Year Ended December 31, |
| (in millions) | 2014 | | 2013 | | 2012 | 2017 | | 2016 | | 2015 |
| Current Provision: | | | | | | | | | | |
| U.S. Federal | $ | 5.0 |
| | $ | (3.3 | ) | | $ | 4.6 |
| $ | 4.8 |
| | $ | 3.6 |
| | $ | — |
|
| U.S. State | 0.9 |
| | (0.1 | ) | | 1.0 |
| 1.5 |
| | 1.5 |
| | 1.7 |
|
| Foreign | 1.7 |
| | 0.5 |
| | 2.1 |
| 3.2 |
| | 3.6 |
| | 1.6 |
|
| Total current income tax expense (benefit) | $ | 7.6 |
| | $ | (2.9 | ) | | $ | 7.7 |
| |
| Total current income tax expense | | $ | 9.5 |
| | $ | 8.7 |
| | $ | 3.3 |
|
| | | | | | | | | | | |
| Deferred, net: | | | | | | | | | | |
| U.S. Federal | $ | (8.3 | ) | | $ | 3.0 |
| | $ | 1.0 |
| $ | 16.3 |
| | $ | 9.6 |
| | $ | 14.8 |
|
| U.S. State | (1.2 | ) | | 0.2 |
| | 0.3 |
| (2.7 | ) | | 1.9 |
| | 0.5 |
|
| Foreign | (0.2 | ) | | 0.1 |
| | 0.1 |
| (11.7 | ) | | (0.4 | ) | | (0.4 | ) |
| Total deferred, net | (9.7 | ) | | 3.3 |
| | 1.4 |
| $ | 1.9 |
| | $ | 11.1 |
| | $ | 14.9 |
|
| Provision for income tax expense (benefit) | $ | (2.1 | ) | | $ | 0.4 |
| | $ | 9.1 |
| $ | 11.4 |
| | $ | 19.8 |
| | $ | 18.2 |
|
Reconciliation between the federal statutory rate and the effective tax rate is as follows:follows (see Note 9, Related Party Transactions for additional information related to the Tax Receivable Agreement): |
| | | | | | | | | | | |
| | Year Ended December 31, |
| (in millions) | 2014 | | 2013 | | 2012 |
| Income from continuing operations before income taxes | $ | (21.6 | ) | | $ | 0.4 |
| | $ | 23.5 |
|
| Statutory U.S. income tax rate | 35.0 | % | | 35.0 | % | | 35.0 | % |
| Tax expense using statutory U.S. income tax rate | $ | (7.6 | ) | | $ | 0.1 |
| | $ | 8.2 |
|
| Foreign income tax rate differential | 0.3 |
| | (0.1 | ) | | (0.6 | ) |
| State tax (net of federal benefit) | (0.3 | ) | | — |
| | 0.7 |
|
| Meals and entertainment | 0.7 |
| | 0.4 |
| | 0.6 |
|
| Transaction costs | 1.6 |
| | — |
| | — |
|
| Change in valuation allowance | 2.0 |
| | — |
| | — |
|
| Executive compensation | 0.9 |
| | — |
| | — |
|
| Other | 0.3 |
| | — |
| | 0.2 |
|
| Income tax provision | $ | (2.1 | ) | | $ | 0.4 |
| | $ | 9.1 |
|
| Effective income tax rate | 9.7 | % | | 100.0 | % | | 38.7 | % |
|
| | | | | | | | | | | |
| | Year Ended December 31, |
| (in millions) | 2017 | | 2016 | | 2015 |
| Income (loss) before income taxes | $ | (1.9 | ) | | $ | 40.8 |
| | $ | 44.9 |
|
| Statutory U.S. income tax rate | 35.0 | % | | 35.0 | % | | 35.0 | % |
| Tax expense using statutory U.S. income tax rate | $ | (0.7 | ) | | $ | 14.3 |
| | $ | 15.7 |
|
| Foreign income tax rate differential | (1.4 | ) | | (1.1 | ) | | 0.2 |
|
| State tax (net of federal benefit) | (0.5 | ) | | 2.8 |
| | 1.6 |
|
| Non-deductible expenses | 2.2 |
| | 2.3 |
| | 1.5 |
|
Tax Receivable Agreement (a) | (3.8 | ) | | 1.6 |
| | 0.7 |
|
Tax credits (b) | (4.0 | ) | | — |
| | — |
|
Foreign exchange loss (c) | — |
| | — |
| | (1.2 | ) |
| Impact of U.S. Tax Act (Federal and State) | 30.2 |
| | — |
| | — |
|
Change in valuation allowance - U.S. Federal and State (d) | — |
| | — |
| | (0.8 | ) |
| Change in valuation allowance - Foreign | (13.7 | ) | | (0.5 | ) | | 1.7 |
|
| Goodwill impairment | 2.1 |
| | — |
| | 0.7 |
|
| Foreign taxes | 0.7 |
| | 0.5 |
| | 0.1 |
|
Other (e) | 0.3 |
| | (0.1 | ) | | (2.0 | ) |
| Income tax provision (benefit) | $ | 11.4 |
| | $ | 19.8 |
| | $ | 18.2 |
|
| Effective income tax rate | (600.0 | )% | | 48.5 | % | | 40.5 | % |
(a) Includes a $4.7 million tax rate benefit for the federal tax rate change as part of the Tax Act and a $0.9 million tax rate increase for other fair value changes in 2017.
(b) Includes a $3.1 million benefit for credits related to foreign taxes and research and experimentation activities recognized in conjunction with the third quarter of 2017 filing of Veritiv’s 2016 U.S. federal tax return and amended 2015 and 2014 U.S. federal tax returns.
(c) Recognition of a 2015 U.S. tax benefit with respect to a foreign exchange loss on the capitalization of an intercompany loan with the Company's Canadian subsidiary.
(d) Increase in Section 382 limitation resulting from recognition of 2015 built-in gains.
(e) In 2015, Other primarily relates to tax benefits related to uncertain tax positions, taxes allocated to comprehensive income, adjustments for prior year tax matters and fuel tax credits.
The Tax Act was signed into law on December 22, 2017. The Tax Act makes broad and complex changes to the U.S. tax code, including, but not limited to reducing the U.S. federal corporate tax rate from 35% to 21%, implementation of a territorial tax system and a one-time transition tax on certain unrepatriated earnings of foreign subsidiaries that is payable over eight years. Veritiv recognized the tax effects of the Tax Act in the year ended December 31, 2017 and recorded $30.2 million in provisional tax expense, of which $23.0 million related primarily to the remeasurement of the Company's deferred taxes to the 21% tax rate and $7.2 million related to the one-time transition tax.
66On December 22, 2017, Staff Accounting Bulletin No. 118 (“SAB 118”) was issued to address the application of U.S. GAAP in situations when a registrant does not have the necessary information available, prepared, or analyzed (including computations) in reasonable detail to complete the accounting for certain income tax effects of the Tax Act. In accordance with SAB 118, the Company has determined that remeasurement of its deferred tax assets and liabilities, one-time transition tax, impact of the Tax Act on state taxes, and tax liability associated with investments in non-U.S. subsidiaries where book basis exceeds tax basis are provisional amounts and reasonable estimates at December 31, 2017. The impact of the Tax Act may differ from this estimate, possibly materially, due to, among other things, changes in interpretations and assumptions the Company has made, guidance that may be issued, completion of the Company's 2017 U.S. federal and state tax returns in 2018, completion of earnings and profits and foreign income tax calculations for the Company's non-U.S. subsidiaries, and actions the Company may take as a result of the Tax Act. Additional work is necessary for a more detailed analysis of Veritiv's deferred tax assets and liabilities and its historical foreign earnings as well as potential correlative adjustments. The Company has not accounted for the tax impacts related to the Global Intangible Low Tax Income (GILTI), Base Erosion Anti Abuse Tax or Foreign Derived Intangible Income regimes or any of the other provisions of the Tax Act that are not effective until fiscal year 2018. Additionally, the Company has not concluded on any applicable accounting policy election associated with GILTI. Any subsequent adjustment to these amounts will be recorded to tax expense in the quarter of 2018 when the analysis is complete.
Deferred income tax assets and liabilities as of December 31, 20142017 and 20132016 were as follows:
| | | | December 31, 2014 | | December 31, 2013 | December 31, 2017 | | December 31, 2016 |
| (in millions) | U.S. | | Non-U.S. | | U.S. | | Non-U.S. | U.S. | | Non-U.S. | | U.S. | | Non-U.S. |
| Deferred income tax assets: | | | | | | | | | | | | | | |
| Accrued compensation | $ | 16.8 |
| | $ | — |
| | $ | 7.1 |
| | $ | — |
| $ | 11.6 |
| | $ | 0.2 |
| | $ | 17.7 |
| | $ | 0.1 |
|
| Capital lease obligations to related party | 86.8 |
| | 0.8 |
| | — |
| | — |
| |
| Financing obligations to related party | | 47.3 |
| | 0.8 |
| | 77.5 |
| | 0.8 |
|
| Goodwill and other intangibles, net | 5.7 |
| | — |
| | 18.2 |
| | — |
| 1.9 |
| | — |
| | 4.6 |
| | — |
|
| Property and equipment, net | — |
| | 0.3 |
| | — |
| | — |
| |
| Long-term compensation | 15.2 |
| | 6.0 |
| | 8.3 |
| | — |
| 21.3 |
| | 4.1 |
| | 21.2 |
| | 3.8 |
|
| Net operating losses and credit carryforwards | 120.5 |
| | 8.7 |
| | 3.4 |
| | — |
| 44.9 |
| | 11.8 |
| | 74.1 |
| | 13.6 |
|
| Allowance for doubtful accounts | 13.8 |
| | — |
| | 8.6 |
| | — |
| 10.0 |
| | 0.1 |
| | 11.9 |
| | — |
|
| Other | 1.8 |
| | 0.5 |
| | 3.7 |
| | 0.5 |
| 5.6 |
| | 0.6 |
| | 3.5 |
| | 0.8 |
|
| Gross deferred income tax assets | 260.6 |
| | 16.3 |
| | 49.3 |
| | 0.5 |
| 142.6 |
| | 17.6 |
| | 210.5 |
| | 19.1 |
|
| Less valuation allowance | (26.1 | ) | | (15.7 | ) | | — |
| | — |
| (4.7 | ) | | (3.6 | ) | | (6.5 | ) | | (18.1 | ) |
| Total deferred tax asset | 234.5 |
| | 0.6 |
| | 49.3 |
| | 0.5 |
| 137.9 |
| | 14.0 |
| | 204.0 |
| | 1.0 |
|
| Deferred income tax liabilities: | | | | | | | | | | | | | | |
| Property and equipment, net | (95.1 | ) | | — |
| | (8.7 | ) | | — |
| (54.2 | ) | | — |
| | (86.7 | ) | | — |
|
| Inventory reserve | (50.1 | ) | | — |
| | (31.9 | ) | | — |
| (33.5 | ) | | — |
| | (48.2 | ) | | — |
|
| Prepaid assets | (3.8 | ) | | — |
| | — |
| | — |
| |
| Other | (1.6 | ) | | — |
| | — |
| | — |
| (4.6 | ) | | — |
| | (8.3 | ) | | — |
|
| Total deferred tax liability | $ | (150.6 | ) | | $ | — |
| | $ | (40.6 | ) | | $ | — |
| (92.3 | ) | | — |
| | (143.2 | ) | | — |
|
| Net deferred income tax asset (liability) | $ | 83.9 |
| | $ | 0.6 |
| | $ | 8.7 |
| | $ | 0.5 |
| |
| Net deferred income tax asset | | $ | 45.6 |
| | $ | 14.0 |
| | $ | 60.8 |
| | $ | 1.0 |
|
Deferred income tax asset valuation allowance is as follows:
| | | | Year Ended December 31, | | | | | | | | | | | |
| (in millions) | 2014 | U.S. | | Non-U.S. | | Total |
| Balance at July 1, 2014 | $ | 39.8 |
| |
| Balance at December 31, 2015 | | $ | 6.3 |
| | $ | 15.5 |
| | $ | 21.8 |
|
| Additions | 2.0 |
| 0.2 |
| | 3.4 |
| | 3.6 |
|
| Subtractions | — |
| — |
| | (0.9 | ) | | (0.9 | ) |
| Balance at end of year | $ | 41.8 |
| |
| Currency translation adjustments | | — |
| | 0.1 |
| | 0.1 |
|
| Balance at December 31, 2016 | | 6.5 |
| | 18.1 |
| | 24.6 |
|
| Additions | | — |
| | 0.2 |
| | 0.2 |
|
Subtractions (a) | | (1.8 | ) | | (16.0 | ) | | (17.8 | ) |
| Currency translation adjustments | | — |
| | 1.3 |
| | 1.3 |
|
| Balance at December 31, 2017 | | $ | 4.7 |
| | $ | 3.6 |
| | $ | 8.3 |
|
The Company recorded(a) Includes a $13.4 million benefit for release of the valuation allowance on its deferred income tax assets as of December 31, 2014 of $41.8 million, comprised of $24.4 million against its U.S. federal net deferred tax assets $1.7 million against its U.S. state net deferred tax assetsin Canada reflecting the Company’s cumulative recent income and $15.7 million against its foreign net deferred tax assets. There was no valuation allowance recorded asimproved expectation of December 31, 2013 and 2012. As a result of thefuture taxable income.
The Merger resulted in a significant change in the ownership of the Company, occurred which, pursuant to the Internal Revenue Code Section 382, imposes annual limits on an annual basis the Company’s ability to utilize its U.S. federal and state net operating loss carryforwards ("NOLs"). The Company’s NOLs will continue to be available to offset taxable income and tax liabilities (until such NOLs and credits are either usedutilized or expire) subject to the Section 382 annual limitation. This limitation is increased for built-in gains recognized within a 60-month period following the ownership change to the extent of total unrealized built-in gains. If the annual limitation amount is not fully utilized in a particular tax year, then the unused portion from that particular tax year will be added to the annual limitation in subsequent years.
In analyzing the future realization of Veritiv's deferred tax assets, management evaluated all available positive and negative evidence and determined that it was more likely than not that the remaining deferred tax assets will be realized. In this analysis, management has considered reversals of deferred tax liabilities, projected future taxable income, available tax-planning strategies, and results of recent operations. In projecting future taxable income, management begins with historical results and incorporates assumptions about the amount of future federal, state and foreign pre-tax operating income. The assumptions about future taxable income require significant judgment and are consistent with Veritiv's plans and estimates used to manage the underlying businesses.
In general, it is the practice and intention of Veritiv to reinvest the earnings of its non-U.S. subsidiaries in those operations. As of December 31, 2014,2017, Veritiv’s tax basis is in excess ofexceeded its financial reporting basis ofin certain investments in non-U.S. subsidiaries. The Company does not believe these temporary differences will reverse in the foreseeable future and, therefore, no deferred tax asset has been recognized with respect to these basis differences. The Company does have unremitted foreign earnings of approximately $20.4 millionAdditionally, no deferred tax liability has been recognized for income and withholding tax liabilities associated with respect to certain of itsinvestments in non-U.S. subsidiaries that would be taxable
where book basis exceeds tax basis. The provisional estimate of such temporary differences totaled approximately $25.8 million as dividends if repatriated to the U.S.of December 31, 2017. The estimatedprovisional estimate of income and withholding tax liability associated with these temporary differences is immaterial. Veritiv will record the remittancetax effects of any change in its prior provisional estimates, with respect to these earnings would be approximately $8.0 million. The Company has not recorded ainvestments, and disclose any unrecognized deferred tax liability associated with these unremitted earnings.impact for temporary differences related to its foreign investments, if practicable, in the period that it is first able to determine a change, but no later than December 31, 2018.
Veritiv applies a "more likely than not" threshold to the recognition and de-recognition of uncertain tax positions. A change in judgment related to prior years' uncertain tax positions is recognized in the period of such change. The following table presents the rollforward of activity for the years ended December 31, 2014, 2013 and 2012 for uncertain tax positions:
|
| | | | | | | | | | | |
| | Year Ended December 31, |
| (in millions) | 2014 | | 2013 | | 2012 |
| Beginning of period | $ | (0.6 | ) | | $ | (1.7 | ) | | $ | (1.4 | ) |
| Additions based on tax positions taken during the current period | — |
| | — |
| | (0.3 | ) |
| Reductions based on tax positions taken during a prior period | 0.6 |
| | — |
| | — |
|
| Additions based on tax positions taken during a prior period | (1.0 | ) | | — |
| | — |
|
| Lapses of statutes of limitations | — |
| | 1.1 |
| | — |
|
| Total gross unrecognized tax benefit | $ | (1.0 | ) | | $ | (0.6 | ) | | $ | (1.7 | ) |
Included in the balance as of December 31, 2013 and December 31, 2012 are $0.6 million and $1.7 million, respectively, for tax positions for which the ultimate benefits are highly certain, but for which there is uncertainty about the timing of such benefits. There are no such amounts included in the balance as of December 31, 2014. However, except for the possible effect of any penalties, any disallowance that would change the timing of these benefits would not affect the annual effective tax rate, but would accelerate the payment of cash to the taxing authority to an earlier period. Included in the balance of unrecognized tax benefits as of December 31, 2014 is $1.0 million of tax benefits that, if recognized, would affect the effective tax rate. There are no such amounts as of December 31, 2013 or 2012.
The Company accrues interest on unrecognized tax benefits as a component of interest expense. Penalties, if incurred, are recognized as a component of income tax expense. The Company recorded interest of $0.6 millionTotal gross unrecognized tax benefits as of December 31, 20142017, 2016 and less than $0.1 million2015, as well as activity within each of December 31, 2013 and 2012. Additionally, the Company recorded penalties as of December 31, 2014 of $0.2 million. The Company didyears, was not record any penalties as of December 31, 2013 and 2012.
During 2015, Veritiv expects to resolve certain tax matters related to U.S. and foreign jurisdictions. As of December 31, 2014, Veritiv estimates that it is reasonably possible that unrecognized tax benefits may decrease by $0.3 million in the next twelve months due to the resolution of these issues or due to a lapse in the statute of limitations. With the exception of these tax matters, Veritiv does not expect any significant changes in unrecognized tax benefits in 2015.material.
In the U.S., Veritiv is generally subject to examination by the Internal Revenue Service ("IRS") for fiscal years 2014 and later and certain states for fiscal years 20102013 and later; however, it may be subject to IRS and state tax authority adjustments for years prior to 20102014 to the extent of losses or other tax attributes carrying forward from the earlier years. UnisourceVeritiv Canada remains subject to examination by the Canadian Revenue Agency for fiscal years 2010 and later and certain provinces for fiscal years 20092012 and later.
As of December 31, 2014,2017, Veritiv has federal, state and foreign income tax NOLs available to offset future taxable income of $312.5$167.1 million, $230.0$165.5 million and $34.4$49.2 million, respectively, which will expire at various dates from 20152018 through 2034,2035, with the exception of certain foreign NOLs that do not expire but have a full valuation allowance.
On September 13, 2013, the U.S. Treasury Department and the IRS issued final regulations that address costs incurred in acquiring, producing, or improving tangible property (the "tangible property regulations"). The tangible property regulations are generally effective for tax years beginning on or after January 1, 2014. The estimated tax impact of these accounting method changes has an immaterial effect on non-current deferred tax assets, with a corresponding reduction in current taxes payable, and has been reflected in the Consolidated and Combined Balance Sheet as of December 31, 2014.
8.9. RELATED PARTY TRANSACTIONS
Agreements with the UWWH Stockholder
As described in Note 1, Business and Summary of Significant Accounting Policies, onOn the Distribution Date the UWWH Stockholder, the sole shareholder of UWWH, received 7,840,0007.84 million shares of Veritiv common stock for all outstanding shares of UWWH common stock that it held in a private placement transaction. Additionally, Veritiv and the UWWH Stockholder executed the following agreements:
Registration Rights Agreement: The Registration Rights Agreement provides the UWWH Stockholder with certain demand and piggyback registration rights. Under this Agreement, the UWWH Stockholder is also entitled to transfer its Veritiv common stock to one or more of its affiliates or equity-holders and may exercise registration rights on behalf of such transferees if such transferees become a party to the Registration Rights Agreement. The UWWH Stockholder, on behalf of the holders of shares of Veritiv’s common stock that are party to the Registration Rights Agreement, under certain circumstances and provided certain thresholds described in the Registration Rights Agreement are met, may make a written request to the Company for the registration of the offer and sale of all or part of the shares subject to such registration rights. If the Company registers the offer and sale of its common stock (other than pursuant to a demand registration or in connection with registration on Form S-4 and Form S-8 or any successor or similar forms, or relating solely to the sale of debt or convertible debt instruments) either on its behalf or on the behalf of other security holders, the holders of the registration rights under the Registration Rights Agreement are entitled to include their shares in such registration. The demand rights described commenced 180 days after the Distribution Date. Veritiv is not required to effect more than one demand registration in any 150-day period or more than two demand registrations in any 365-day period. If Veritiv believes that a registration or an offering would materially affect a significant transaction or would require it to disclose confidential information which it in good faith believes would be adverse to its interest, then Veritiv may delay a registration or filing for no more than 120 days in a 360-day period.
Tax Receivable Agreement: The Tax Receivable Agreement sets forth the terms by which Veritiv generally will be obligated to pay the UWWH Stockholder an amount equal to 85% of the U.S. federal, state and Canadian income tax savings that Veritiv actually realizes as a result of the utilization of Unisource Worldwide, Inc.’sUnisource's net operating losses attributable to taxable periods prior to the date of the Merger. For purposes of the Tax Receivable Agreement, Veritiv’s income tax savings will generally be computed by comparing Veritiv’s actual aggregate U.S. federal, state and Canadian income tax liability for taxable periods (or portions thereof) beginning after the date of the Merger to the amount of Veritiv’s aggregate U.S. federal, state and Canadian income tax liability for the same periods had Veritiv not been able to utilize Unisource Worldwide, Inc.’sUnisource's net operating losses attributable to taxable periods prior to the date of the Merger. Veritiv will pay to the
UWWH Stockholder an amount equal to 85% of such tax savings, plus interest at a rate of LIBOR plus 1.00%, computed from the earlier of the date that Veritiv filedfiles its U.S. federal income tax return for the applicable taxable year and the date that such tax return wasis due (without extensions) until payments are made. Under the Tax Receivable Agreement, the UWWH Stockholder will not be required to reimburse Veritiv for any payments previously made if such tax benefits are subsequently disallowed or adjusted (although future payments under the Tax Receivable Agreement would be adjusted to the extent possible to reflect the result of such disallowance or adjustment). The Tax Receivable Agreement will be binding on and adapt to the benefit of any permitted assignees of the UWWH Stockholder and to any successors to any of the parties of the Tax Receivable Agreement to the same extent as if such permitted assignee or successor had been an original party to the Tax Receivable Agreement.
In January 2018 and 2017, Veritiv paid $10.1 million and $8.7 million, respectively, in principal and interest, to the UWWH Stockholder for the utilization of pre-merger NOLs in its 2016 and 2015 federal and state tax returns, respectively. As of December 31, 2017, the Tax Receivable Agreement was revalued for the Tax Act change, lowering the U.S. federal corporate tax rate from 35% to 21%. This change reduced the value of the Tax Receivable Agreement liability by $13.5 million.
On November 23, 2016, the UWWH Stockholder sold 1.76 million shares of Veritiv common stock in an underwritten public offering. Concurrently with the closing of the offering, Veritiv repurchased 0.31 million of these offered shares from the underwriters at a price of $42.8625 per share, which is the price at which the underwriters purchased such shares from the selling stockholder, for an aggregate purchase price of approximately $13.4 million. In conjunction with these transactions, Veritiv incurred approximately $0.8 million in transaction-related fees, of which approximately $0.2 million was capitalized as part of the cost to acquire the treasury stock with the remainder included in selling and administrative expense, on the Consolidated Statements of Operations.
On March 22, 2017, the UWWH Stockholder sold 1.80 million shares of Veritiv common stock in a block trade. The Company did not sell any shares and did not receive any of the proceeds. In conjunction with this transaction, Veritiv incurred approximately $0.2 million in transaction-related fees, which were included in selling and administrative expenses on the Consolidated Statements of Operations. The UWWH Stockholder beneficially owned 4,283,840 shares of Veritiv's outstanding common stock as of December 31, 2017.
Transactions with Georgia-Pacific
Veritiv purchases certain inventory items from, and sells certain inventory items to, Georgia-Pacific in the normal course of business. As a result of the Merger and related private placement, Georgia-Pacific, as joint owner of the UWWH Stockholder, is a related party. ForThe following table summarizes the year ended December 31, 2014, the Company sold products to Georgia-Pacific in the amountfinancial impact of $18.4 million, reflected in net sales. For the year ended December 31, 2014, the Company purchased and recognized in cost of products sold inventory from Georgia-Pacific of $136.1 million. The aggregate amount of inventories purchased from Georgia-Pacific that remained on Veritiv's Consolidated Balance Sheet was $26.6 million as of December 31, 2014. Relatedthese related party payable to and receivable from Georgia-Pacific were $11.0 million and $3.9 million, as of December 31, 2014, respectively.transactions with Georgia Pacific:
|
| | | | | | | | | | | | |
| | | Year Ended December 31, |
| (in millions) | | 2017 | | 2016 | | 2015 |
| Sales to Georgia-Pacific, reflected in net sales | | $ | 32.2 |
| | $ | 35.6 |
| | $ | 33.6 |
|
| Purchases of inventory from Georgia-Pacific, recognized in cost of products sold | | $ | 181.6 |
| | $ | 224.9 |
| | $ | 264.7 |
|
| | | | | | | |
| Inventories purchased from Georgia-Pacific that remained on Veritiv's balance sheet | | $ | 22.7 |
| | $ | 24.8 |
| | |
| Related party payable to Georgia-Pacific | | $ | 8.5 |
| | $ | 9.0 |
| | |
| Related party receivable from Georgia-Pacific | | $ | 3.3 |
| | $ | 3.9 |
| | |
See Note 6,7, Leases, for information on the Company's financing obligations to Georgia-Pacific.
Relationship between Veritiv and International Paper
Transactions with International Paper
Prior to the Spin-off, xpedx purchased certain inventory items from, and sold certain inventory items to, International Paper in the normal course of business. For the years ended December 31, 2014, 2013 and 2012, the Company sold products to International Paper in the amount of $24.3 million, $53.0 million and $65.1 million, respectively, reflected in net sales. For the years ended December 31, 2014, 2013 and 2012, the Company purchased and recognized in cost of products sold inventory from International Paper of $276.5 million, $604.4 million and $639.0 million, respectively. As of December 31, 2013, the aggregate amount of inventories purchased from International Paper that remained on the Company’s Combined Balance Sheet was $48.5 million. Related party payable to and receivable from International Paper were $2.6 million and $10.1 million as of December 31, 2013, respectively. After the Spin-off and the Merger, Veritiv continues to purchase and sell certain inventory items to International Paper that are considered transactions in the normal course of the Company’s operations. While the Company and International Paper have entered into a transition services agreement, International Paper is not considered a related party subsequent to the Spin-off.
Parent Company Investment
Net transfers (to) from International Paper are included within Parent company equity on the Combined Balance Sheet as of December 31, 2013. The components of net transfers (to) from Parent for the years ended December 31, 2014, 2013 and 2012, were as follows:
|
| | | | | | | | | | | |
| | Year Ended December 31, |
| (in millions) | 2014 | | 2013 | | 2012 |
| Intercompany sales and purchases, net | $ | 255.4 |
| | $ | 556.6 |
| | $ | 575.2 |
|
| Cash pooling and general financing activities | (322.5 | ) | | (675.8 | ) | | (695.4 | ) |
| Corporate allocations including income taxes | 34.7 |
| | 84.1 |
| | 84.8 |
|
| Net adjustments in conjunction with the Spin-off | (49.6 | ) | | — |
| | — |
|
| Total net transfers to International Paper | $ | (82.0 | ) | | $ | (35.1 | ) | | $ | (35.4 | ) |
In 2011, xpedx borrowed approximately $20.3 million from the Parent in the form of Promissory Notes. On December 31, 2013, xpedx entered into a General Conveyance Agreement with its Parent whereby the debt was assumed by the Parent.
In conjunction with the Spin-off, certain xpedx assets and liabilities were retained by International Paper. Such assets and liabilities were identified and quantified in accordance with the terms agreed to in the Contribution and Distribution Agreement ("C&DA") dated January 28, 2014, entered into by International Paper, xpedx Holding Company, UWWH and the UWWH Stockholder. Additionally, in accordance with the C&DA, the parties agreed to settle, within 30 days of the Distribution Date, all intercompany balances outstanding between International Paper and xpedx as of the Distribution Date, determined based on an agreed-upon formula. The net effect of assets and liabilities retained and adjustments to intercompany balances as of the Distribution Date are reflected in the table above in the net adjustments in conjunction with the Spin-off. These primarily include $24.3 million of net assets transferred to International Paper and settlement of intercompany balances of $24.6 million as of the Distribution Date.
Allocation of General Corporate Expenses
Prior to the Spin-off, the xpedx financial statements included expense allocations for certain functions previously provided by International Paper, including, but not limited to, general corporate expenses related to finance, legal, information technology, human resources, communications, insurance and stock-based compensation. These expenses were allocated on the basis of direct usage when identifiable, with the remainder principally allocated on the basis of percent of capital employed, headcount, sales or other measures. Prior to the Spin-off, $25.5 million, $84.0 million and $78.4 million of expenses were allocated to xpedx and were included within selling and administrative expenses in the Consolidated and Combined Statements of Operations for the years ended December 31, 2014, 2013 and 2012.
Separation Agreements with Former Unisource CEO
Effective as of the Distribution Date, Allan R. Dragone, Jr. ceased to be the Chief Executive Officer of Unisource and became a member of Veritiv’s Board of Directors. Under his then existing employment agreement with Unisource, Mr. Dragone was entitled to receive severance benefits, subject to his execution and non-revocation of a general release of claims against Unisource, the Company and International Paper. Under a Separation and Non-Competition Agreement entered into between the Company and Mr. Dragone as of June 30, 2014 (the "Separation Agreement"), Mr. Dragone received an additional $3.0 million in severance pay and agreed to be bound by the restrictive covenants set forth in the Separation Agreement. For the year ended December 31, 2014, the Company recognized $5.4 million in expense related to Mr. Dragone's employment agreement and the Separation Agreement, which is reflected in merger and integration expenses in the Consolidated and Combined Statements of Operations. In addition, asAs part of his employment agreement, Mr. Dragone exercised his right to sell his personal residence to the Company. The Company completed the purchase of the residence on February 10,for $4.6 million and subsequently sold the residence for $4.6 million during 2015.
9.10. EMPLOYEE BENEFIT PLANS
Defined Contribution Plans
Veritiv sponsors qualified defined contribution plans covering its employees in the U.S. and Canada. The defined
contribution plans allow eligible employees to contribute a portion of their eligible compensation (including salary and annual incentive plan bonus) to the plans and Veritiv makes matching
contributions to participant accounts on a specified percentage of employee deferrals as determined by the provisions of each plan.
Prior to the Spin-off, certain employees of xpedx participated in defined contribution plans sponsored by International Paper. International Paper's matching contributions to the plans totaled approximately $8.9 million, $16.7 million and $17.3 million for During the years ended December 31, 2014, 20132017, 2016 and 2012, respectively. After the Spin-off, xpedx employees commenced participating in the Veritiv defined contribution plan (formerly known as Unisource plan). The assets of the xpedx employees under International Paper plans were transferred to2015 Veritiv's plan. For the year ended December 31, 2014, Veritiv's matching contributions to this plan totaled $5.6 million.
In conjunction with the Merger, Veritiv assumed responsibility for Unisource's defined contribution retirement plans in the U.S. and Canada. Veritiv’s total contribution to these plans was $2.4totaled $19.4 million, for the year ended December 31, 2014.$19.6 million and $19.0 million, respectively.
Deferred Compensation Savings Plans
In conjunction with the Merger, Veritiv assumed responsibility for Unisource's legacy deferred compensation savings plan. Unisource maintained deferred compensation obligations for certain employees from its past acquisitions. Unisource agreed to pay these employees deferred compensation in return for services rendered prior to their retirement.plans. In general, the payout terms varied for each employee agreement and wereare paid in monthly or annual installments ranging up to 15 years from the date of eligibility.
For the year ended December 31, 2014, the cost of the deferred compensation agreements was $2.0 million. The deferred compensation liability as of December 31, 2014 was $20.9 million with $2.7 million included in other accrued liabilities and $18.2 million included in other non-current liabilities in the Consolidated and Combined Balance Sheets.
Effective January 1, 2015, the Company adopted the Veritiv established a deferred compensation savings planDeferred Compensation Savings Plan which provides for the deferral of salaries, commissions or bonuses of eligible non-union employees.employees and the deferral of cash and equity retainers for non-employee members of the Company's Board of Directors. Under this plan, eligible employees may elect to defer up to 85% of their base salary, commissions and annual incentive bonus. The amounts deferred are credited to notional investment accounts selected by participants. At the time a deferral election is made, participants elect to receive payout of the deferred amounts upon termination of employment or termination of Board service in the form of a lump sum or equal annual installments ranging from two to ten years. Currently, Veritiv does not make matching contributions to this plan.
The liabilities associated with these plans are summarized in the table below.
|
| | | | | | | | |
| Deferred Compensation Liability | | | | |
| | | | | |
| (in millions) | | December 31, 2017 | | December 31, 2016 |
| Other accrued liabilities | | $ | 2.6 |
| | $ | 2.7 |
|
| Other non-current liabilities | | 23.7 |
| | 21.6 |
|
| Total liabilities | | $ | 26.3 |
| | $ | 24.3 |
|
Defined Benefit Plans
At December 31, 2014,2017 and 2016, Veritiv did not maintain any active defined benefit plans for its non-union employees.
Certain of xpedx’s employees participated in defined benefit pension and other post-retirement benefit plans sponsored and accounted for by International Paper. In conjunction with the Spin-off, the above plans were frozen for the xpedx employees, and International Paper retained the associated liabilities. Certain xpedx union employees were added as participants to the Unisource's defined benefit pension plan. The amount of net pension and other post-employment benefit
expense attributable to xpedx related to the International Paper sponsored plans was $8.0 million, $15.1 million and $12.7 million for the years ended December 31, 2014, 2013 and 2012, respectively.
In conjunction with the Merger, Veritiv assumed responsibility for Unisource’s defined benefit plans and Supplemental Executive Retirement Plans ("SERP") in the U.S. and Canada. Except as discussed below, these plans were frozen prior to the Merger.
Unisource sponsored a defined benefit pension plan for its non-union and union employees and a SERP for certain highly compensated employees. On September 26, 2013, the U.S. defined benefit pension plan received actuarial certification that eligible U.S. non-union participants were permitted to receive lump sum payments for their full cash balance accounts. Expected benefit payments in the U.S. plan assume that vested terminated participants will take lump sum payments at retirement age. Union employees continue to accrue benefits under the U.S. defined benefit pension plan in accordance with their collective bargaining agreements.
In Canada, Unisource sponsored one non-union and two union defined benefit plans also known as Registered Pension Plans. Additionally, Unisource maintained a nonregistered SERP for certain highly compensated employees in Canada that provided pension benefits in excess of the registered plan compensation limits. The non-union defined benefit plan and the SERP plan were frozen for service credit, but participants were still eligible for early retirement benefits, and final average earnings continued to be used for calculating retirement benefits. The Canada union defined benefit plans were frozen for new participants under the two collective bargaining agreements.
Benefit Obligations and Funded Status
The following table provides information about the UnisourceVeritiv's U.S. and Canadian defined benefit pension and SERP plans assumed by Veritiv due to the Merger:plans: | | | | Year Ended December 31, |
| | | | | | 2017 |
| 2016 |
| (in millions) | U.S. | | Canada | U.S. |
| Canada |
| U.S. |
| Canada |
| Accumulated benefit obligation at December 31, 2014 | $ | 93.7 |
| | $ | 79.0 |
| |
| Accumulated benefit obligation, end of year | | $ | 91.0 |
| | $ | 83.2 |
| | $ | 89.7 |
| | $ | 71.9 |
|
| | | | | | | | | | | |
| Change in projected benefit obligation: | | | | | | | | | | |
| Benefit obligation at July 1, 2014 | $ | 87.9 |
| | $ | 92.7 |
| |
| Benefit obligation, beginning of year | | $ | 89.7 |
| | $ | 79.0 |
| | $ | 89.0 |
| | $ | 76.0 |
|
| Service cost | 0.4 |
| | 0.1 |
| 0.8 |
| | 0.3 |
| | 0.7 |
| | 0.3 |
|
| Interest cost | 1.7 |
| | 1.9 |
| 2.7 |
| | 2.7 |
| | 3.4 |
| | 3.1 |
|
| Actuarial loss | 5.9 |
| | 4.4 |
| |
| Actuarial (gain) loss | | 3.3 |
| | 6.1 |
| | — |
| | 2.2 |
|
| Benefits paid | (2.0 | ) | | (2.0 | ) | (5.5 | ) | | (3.9 | ) | | (3.4 | ) | | (4.8 | ) |
| Settlements | (0.2 | ) | | — |
| |
| Foreign exchange adjustments | — |
| | (7.7 | ) | — |
| | 5.8 |
| | — |
| | 2.2 |
|
| Projected benefit obligation at December 31, 2014 | $ | 93.7 |
| | $ | 89.4 |
| |
| Projected benefit obligation, end of year | | $ | 91.0 |
| | $ | 90.0 |
| | $ | 89.7 |
| | $ | 79.0 |
|
| | | | | | | | |
| Change in plan assets: | | | | | | | | | | |
| Plan assets at July 1, 2014 | $ | 81.6 |
| | $ | 68.7 |
| |
| Plan assets, beginning of year | | $ | 75.9 |
| | $ | 64.9 |
| | $ | 74.4 |
| | $ | 61.6 |
|
| Employer contributions | 0.8 |
| | 2.0 |
| — |
| | 3.1 |
| | — |
| | 3.1 |
|
| Investment returns | 0.4 |
| | 4.1 |
| 12.0 |
| | 6.0 |
| | 5.9 |
| | 3.1 |
|
| Benefits paid | (2.0 | ) | | (2.0 | ) | (5.5 | ) | | (3.9 | ) | | (3.4 | ) | | (4.8 | ) |
| Administrative expenses paid | (0.4 | ) | | — |
| (1.0 | ) | | — |
| | (1.0 | ) | | — |
|
| Settlements | (0.2 | ) | | — |
| |
| Currency translation adjustments | — |
| | (6.4 | ) | |
| Plan assets at December 31, 2014 | $ | 80.2 |
| | $ | 66.4 |
| |
| Underfunded status at December 31, 2014 | $ | (13.5 | ) | | $ | (23.0 | ) | |
| Foreign exchange adjustments | | — |
| | 4.8 |
| | — |
| | 1.9 |
|
| Plan assets, end of year | | $ | 81.4 |
| | $ | 74.9 |
| | $ | 75.9 |
| | $ | 64.9 |
|
| Underfunded status, end of year | | $ | (9.6 | ) | | $ | (15.1 | ) | | $ | (13.8 | ) | | $ | (14.1 | ) |
Balance Sheet Positions
|
| | | | | | | | | | | | | | | |
| | Year Ended December 31, |
| | 2017 |
| 2016 |
| (in millions) | U.S. |
| Canada |
| U.S. |
| Canada |
| Amounts recognized in the Consolidated Balance Sheets consist of: | | | | | | | |
| Other accrued liabilities | $ | 0.1 |
| | $ | 0.2 |
| | $ | 0.1 |
| | $ | 0.2 |
|
| Defined benefit pension obligations | 9.5 |
| | 14.9 |
| | 13.7 |
| | 13.9 |
|
| Net liability recognized | $ | 9.6 |
| | $ | 15.1 |
| | $ | 13.8 |
| | $ | 14.1 |
|
|
| | | | | | | | | | | | | | | |
| | Year Ended December 31, |
| | 2017 |
| 2016 |
| (in millions) | U.S. | | Canada | | U.S. | | Canada |
| Amounts not yet reflected in net periodic benefit cost and included in AOCL consist of: | | | | | | | |
| Net loss, net of tax | $ | 3.2 |
| | $ | 6.1 |
| | $ | 5.7 |
| | $ | 3.4 |
|
Balance Sheet Positions
|
| | | | | | | |
| | December 31, 2014 |
| (in millions) | U.S. | | Canada |
| Amounts recognized in the Consolidated and Combined Balance Sheets consist of: | | | |
| Other current liabilities | $ | 0.1 |
| | $ | 0.1 |
|
| Defined benefit pension obligations | 13.4 |
| | 22.9 |
|
| Net liability recognized | $ | 13.5 |
| | $ | 23.0 |
|
|
| | | | | | | |
| | December 31, 2014 |
| (in millions) | U.S. | | Canada |
| Amounts not yet reflected in net periodic benefit cost and included in AOCI consist of: | | | |
| Net loss, net of tax | $ | 5.2 |
| | $ | 2.2 |
|
Net Periodic Cost
Total net periodic pensionbenefit cost associated with the defined benefit pension and SERP plans is summarized below:
| | | | | | | | Year Ended December 31, |
| | Year Ended December 31, 2014 | 2017 |
| 2016 | | 2015 |
| (in millions) | U.S. | | Canada | U.S. | | Canada | | U.S. | | Canada | | U.S. | | Canada |
| Components of net periodic benefit cost: | | | | |
| Components of net periodic benefit cost (credit): | | | | | | | | | | | | |
| Service cost | $ | 0.8 |
| | $ | 0.1 |
| $ | 2.0 |
| | $ | 0.3 |
| | $ | 1.7 |
| | $ | 0.3 |
| | $ | 1.6 |
| | $ | 0.2 |
|
| Interest cost | 1.7 |
| | 1.9 |
| 2.7 |
| | 2.7 |
| | 3.4 |
| | 3.1 |
| | 3.2 |
| | 3.2 |
|
| Expected return on plan assets | (3.1 | ) | | (1.9 | ) | (5.1 | ) | | (3.7 | ) | | (5.0 | ) | | (3.5 | ) | | (5.2 | ) | | (3.3 | ) |
| Amortization of net loss | | 0.1 |
| | 0.2 |
| | 0.1 |
| | 0.2 |
| | — |
| | — |
|
| Net periodic benefit cost (credit) | $ | (0.6 | ) | | $ | 0.1 |
| $ | (0.3 | ) | | $ | (0.5 | ) | | $ | 0.2 |
| | $ | 0.1 |
| | $ | (0.4 | ) | | $ | 0.1 |
|
| | | | | | | | | | | | | |
| | | | | | | | | | | | | |
| Changes to funded status recognized in other comprehensive (income) loss: | | | | | | | | | | | | |
| Net loss (gain) during year, net of tax | | $ | (2.5 | ) | | $ | 2.7 |
| | $ | (0.5 | ) | | $ | 2.2 |
| | $ | 1.0 |
| | $ | (1.0 | ) |
Amounts are generally amortized from AOCL over the expected future working lifetime of active plan participants. The amount Veritiv does not expect any amounts in AOCIexpects to be recognized as components ofamortize from AOCL into net periodic pension cost in 2015.2017 is not significant.
Fair Value of Plan Assets
U.S. and Canada pension plan assets are primarily invested in broad-based mutual funds and pooled funds comprised of U.S. and non-U.S. equities, U.S. and non-U.S. high-quality and high-yield fixed income securities, and short-term interest bearing securities or deposits.
The underlying investments of the U.S. plan assets are either valued using quoted prices in active markets (Level 1) or valued as. The underlying investments of the most recent tradeCanada plan assets in equity and fixed income securities are measured at fair value using the Net Asset Value ("NAV") provided by the administrator of the fund and the Company has the ability to redeem such assets at the measurement date (Level 2).or within the near term without redemption restrictions. In accordance with ASU 2015-07, "Fair Value Measurement (Topic 820)", investments that are measured at fair value using the NAV per share practical expedient have not been classified in the fair value hierarchy. The following table presentstables present Veritiv’s plan assets using the fair value hierarchy which is reconciled to the amounts presented for the total pension benefit plan assets as of December 31, 2014:31:
| | | As of December 31, 2017 | | | | | | | | |
| (in millions) | Total | | Level 1 | | Level 2 | | Level 3 | Total | | Level 1 | | Level 2 | | Level 3 |
| Investments – U.S.: | | | | | | | | | | | | | | |
| Equity securities | $ | 53.3 |
| | $ | 53.3 |
| | $ | — |
| | $ | — |
| $ | 56.8 |
| | $ | 56.8 |
| | $ | — |
| | $ | — |
|
| Fixed income securities | 26.7 |
| | 26.7 |
| | — |
| | — |
| 24.3 |
| | 24.3 |
| | — |
| | — |
|
| Cash and short-term securities | 0.2 |
| | 0.2 |
| | — |
| | — |
| 0.3 |
| | 0.3 |
| | — |
| | — |
|
| Total | $ | 80.2 |
| | $ | 80.2 |
| | $ | — |
| | $ | — |
| $ | 81.4 |
| | $ | 81.4 |
| | $ | — |
| | $ | — |
|
| | | As of December 31, 2017 | | | | | | | | |
| (in millions) | Total | | Level 1 | | Level 2 | | Level 3 | Total | | Level 1 | | Level 2 | | Level 3 |
| Investments – Canada: | | | | | | | | | | | | | | |
| Cash and short-term securities | | $ | 0.1 |
| | $ | 0.1 |
| | $ | — |
| | $ | — |
|
| Investments measured at NAV: | | | | | | | | |
| Equity securities | $ | 42.4 |
| | $ | — |
| | $ | 42.4 |
| | $ | — |
| 49.2 |
| | | | | | |
| Fixed income securities | 22.9 |
| | — |
| | 22.9 |
| | — |
| 25.6 |
| | | | | | |
| Cash and short-term securities | 1.1 |
| | 1.1 |
| | — |
| | — |
| |
| Total | $ | 66.4 |
| | $ | 1.1 |
| | $ | 65.3 |
| | $ | — |
| $ | 74.9 |
| | $ | 0.1 |
| | $ | — |
| | $ | — |
|
|
| | | | | | | | | | | | | | | |
| As of December 31, 2016 | | | | | | | |
| (in millions) | Total | | Level 1 | | Level 2 | | Level 3 |
| Investments – U.S.: | | | | | | | |
| Equity securities | $ | 50.0 |
| | $ | 50.0 |
| | $ | — |
| | $ | — |
|
| Fixed income securities | 25.7 |
| | 25.7 |
| | — |
| | — |
|
| Cash and short-term securities | 0.2 |
| | 0.2 |
| | — |
| | — |
|
| Total | $ | 75.9 |
| | $ | 75.9 |
| | $ | — |
| | $ | — |
|
|
| | | | | | | | | | | | | | | |
| As of December 31, 2016 | | | | | | | |
| (in millions) | Total | | Level 1 | | Level 2 | | Level 3 |
| Investments – Canada: | | | | | | | |
| Cash and short-term securities | $ | 0.3 |
| | $ | 0.3 |
| | $ | — |
| | $ | — |
|
| Investments measured at NAV: | | | | | | | |
| Equity securities | 43.8 |
| | | | | | |
| Fixed income securities | 20.8 |
| | | | | | |
| Total | $ | 64.9 |
| | $ | 0.3 |
| | $ | — |
| | $ | — |
|
The classification of fair value measurements within the hierarchy is based upon the lowest level of input that is significant to the measurement. Valuation methodologies used for assets and liabilities measured at fair value are as follows:
* Equity Securities: Common and preferred stock are valued at the closing price reported on the active market on which the individual securities are traded. Commingled funds are valued at the net asset value of units held at year end, as determined by a pricing vendor or the fund family. Mutual funds are valued at the net asset value of shares held at year end, as determined by the closing price reported on the active market on which the individual securities are traded, or a pricing vendor or the fund family if an active market is not available.
* Fixed Income Securities: Corporate and government bonds, including asset backed securities, are valued at the closing price reported on the active market on which the individual securities are traded, or based on institutional bid evaluations using proprietary models if an active market is not available. Mutual funds are valued at the net asset value of shares held at year end, as determined by the closing price reported on the active market on which the individual securities are traded, or a pricing vendor or the fund family if an active market is not available.
* Cash and Short-term Securities: Cash and cash equivalents consist of U.S. and foreign currencies. Foreign currencies are reported in U.S. dollars based on currency exchange rates readily available in active markets. Short termShort-term securities are valued at the net asset value of units held at year end.
The weighted-average asset allocations of invested assets within Veritiv’s defined benefit pension plans as of December 31, 2014 were as follows:
| | | | | | | | Asset Allocation Range | |
| As of December 31, 2017 | | | | | | Asset Allocation Range |
| (in millions) | U.S. | | Canada | | U.S. | | Canada | U.S. | | Canada | | U.S. | | Canada |
| Equity securities | $ | 53.3 |
| | $ | 42.4 |
| | 55 - 75% | | 50 - 70% | $ | 56.8 |
| | $ | 49.2 |
| | 55 - 75% | | 50 - 70% |
| Fixed income securities | 26.7 |
| | 22.9 |
| | 20 - 40% | | 30 - 50% | 24.3 |
| | 25.6 |
| | 20 - 40% | | 30 - 50% |
| Cash and short-term securities | 0.2 |
| | 1.1 |
| | 0 - 10% | | 0 - 5% | 0.3 |
| | 0.1 |
| | 0 - 10% | | 0 - 5% |
| Total | $ | 80.2 |
| | $ | 66.4 |
| | $ | 81.4 |
| | $ | 74.9 |
| |
|
| | | | | | | | | | | |
| As of December 31, 2016 | | | | | Asset Allocation Range |
| (in millions) | U.S. | | Canada | | U.S. | | Canada |
| Equity securities | $ | 50.0 |
| | $ | 43.8 |
| | 55 - 75% | | 50 - 70% |
| Fixed income securities | 25.7 |
| | 20.8 |
| | 20 - 40% | | 30 - 50% |
| Cash and short-term securities | 0.2 |
| | 0.3 |
| | 0 - 10% | | 0 - 5% |
| Total | $ | 75.9 |
| | $ | 64.9 |
| | | | |
Veritiv's investment objectives include maximizing long-term returns at acceptable risk levels, diversifying among asset classes, as applicable, and among investment managers as well as establishing certain risk parameters within asset classes.
Investment performance is evaluated at least quarterly. Total returns are compared to the weighted-average return of a benchmark mix of investments. Individual fund investments are compared to historical 3, 5 and 10 year returns achieved by funds with similar investment objectives.
Assumptions
The determination of Veritiv’s defined benefit obligations and pension expense is based on various assumptions, such as discount rates, expected long-term rates of return, rate of compensation increases, employee retirement patterns and payment selections, inflation, and mortality rates.
Veritiv's weighted averageweighted-average discount rates for its U.S. plans were determined by using cash flow matching techniques whereby the rates of yield curves, developed from U.S. corporate yield curves, were applied to the benefit obligations to determine the appropriate discount rate. Veritiv's weighted averageweighted-average discount rates for its Canadian plans were determined by using spot rates from yield curves, developed from high-quality bonds (rated AA or higher) by established rating agencies, matching the duration of the future expected benefit obligations.
Veritiv’s weighted-average expected rate of return was developed based on several factors, including projected and historical rates of returns, investment allocations of pension plan assets and inflation expectations. Veritiv evaluates the expected rate of return assumptions on an annual basis.
The following table presents significant weighted-average assumptions used in computing the benefit obligations:
| | | | | | | December 31, |
| | Year Ended December 31, 2014 | 2017 |
| 2016 |
| | U.S. | | Canada | U.S. | | Canada | | U.S. | | Canada |
| Discount rate | 3.75 | % | | 4.00 | % | 3.33 | % | | 3.40 | % | | 3.76 | % | | 3.85 | % |
| Rate of compensation increases | N/A |
| | 3.00 | % | N/A |
| | 3.00 | % | | N/A |
| | 3.00 | % |
The following table presents significant weighted-average assumptions used in computing net periodic benefit cost:
| | | | | | | Year Ended December 31, |
| | Year Ended December 31, 2014 | 2017 | | 2016 |
| | U.S. | | Canada | U.S. | | Canada | | U.S. | | Canada |
| Discount rate | 4.05 | % | | 4.30 | % | 3.76 | % | | 3.85 | % | | 4.05 | % | | 4.00 | % |
| Rate of compensation increases | N/A |
| | 3.00 | % | N/A |
| | 3.00 | % | | N/A |
| | 3.00 | % |
| Expected long-term rate of return on assets | 8.00 | % | | 5.75 | % | 7.15 | % | | 5.50 | % | | 7.15 | % | | 5.50 | % |
Cash Flows
Veritiv expects to contribute $0.1 million and $3.9$3.2 million to its U.S. and Canadian defined benefit pension and SERP plans, respectively, during 2015.2018. Future benefit payments under the defined benefit pension and SERP plans are estimated as follows:
|
| | | | | | | |
| (in millions) | U.S. | | Canada |
| 2015 | $ | 6.6 |
| | $ | 2.5 |
|
| 2016 | 4.7 |
| | 2.7 |
|
| 2017 | 4.8 |
| | 2.8 |
|
| 2018 | 4.8 |
| | 2.9 |
|
| 2019 | 4.9 |
| | 3.0 |
|
| 2020-2024 | 27.4 |
| | 18.3 |
|
|
| | | | | | | |
| (in millions) | U.S. | | Canada |
| 2018 | $ | 9.6 |
| | $ | 2.8 |
|
| 2019 | 5.7 |
| | 2.9 |
|
| 2020 | 5.4 |
| | 3.0 |
|
| 2021 | 5.6 |
| | 3.2 |
|
| 2022 | 5.5 |
| | 3.4 |
|
| 2023-2027 | 27.7 |
| | 20.1 |
|
Multi-employer Plans
In conjunction with the Merger, Veritiv assumed responsibility for Unisource’s multi-employer plans. Veritiv's contributions to multi-employer plans were $3.2$3.5 million, $2.5$3.7 million and $2.6$3.9 million for the years ended December 31, 2014, 20132017, 2016 and 2012,2015, respectively. It is reasonably possible that changes to Veritiv employees covered under these plans might result in additional contribution obligations to these plans.obligations. Any such obligations would be governed by the specific agreement between Veritiv and any such plan. Veritiv's contributions did not represent more than 5% of total contributions to any multi-employer plans.plans for the years ended December 31, 2017, 2016 and 2015. At the date these Consolidated and Combined Financial Statements were issued, Forms 5500 were not available for the plan years ending in 2014.2017.
The risks of participating in these multi-employer pension plans are different from a single employer plan in the following aspects:
Assets contributed to the multi-employer plans by one employer may be used to provide benefits to employees of other participating employers,
If a participating employer ceases contributing to the plan, the unfunded obligations of the plan may be inherited by the remaining participating employers, and
If the Company stops participating in any of the multi-employer plans, the Company may be required to pay those plans an amount based on the underfunded status of the plan, referred to as a withdrawal liability.
The Company has recorded undiscounted charges related to the complete or partial withdrawal from various multi-employer pension plans. Charges not related to the Company's restructuring efforts are recorded as distribution expenses. Initial amounts are recorded as other non-current liabilities in the Consolidated Balance Sheets. See the table below for a summary of the net charges and the year-end balance sheet liability positions for the respective years ended December 31:
|
| | | | | | | | | | | |
| Year Ended December 31, |
| (in millions) | Restructuring charges, net | | Distribution expenses | | Total Net Charges |
| 2017 | $ | 17.4 |
| | $ | 2.1 |
| | $ | 19.5 |
|
| 2016 | 7.5 |
| | 2.3 |
| | 9.8 |
|
| | | | | | |
| | At December 31, | | |
| | | | | | |
| (in millions) | Other accrued liabilities | | Other non-current liabilities | | |
| 2017 | $ | 0.7 |
| | $ | 27.2 |
| | |
| 2016 | 0.0 |
| | 9.8 |
| | |
Included in the previously mentioned multi-employer pension plan withdrawal charges is $13.6 million related to the New England Teamsters and Trucking Industry Pension Fund (the “NE Fund”), a multi-employer pension plan. During the second quarter of 2017, the Company was presented with a Demand for Payment of Withdrawal Liability from the NE Fund attributable to the closure of the Company's Wilmington, Massachusetts facility in the amount of $10.9 million, payable in 240 equal monthly installments beginning in August 2017. Also as part of this same consolidation, the Company's Windsor and Middletown, Connecticut facilities were closed and relocated to Enfield, Connecticut. Employees at both the Windsor and Middletown locations were covered by separate collective bargaining agreements. Employees at the Middletown location subject to that agreement also participate in the NE Fund. The Company entered into a new collective bargaining agreement for the Enfield, Connecticut facility to replace the legacy Windsor and Middletown, Connecticut agreements. The new agreement ended participation in the NE Fund. As a result, in December 2017, the Company received another Demand for Payment of Withdrawal Liability from the NE Fund attributable to that negotiated exit in the amount of $2.7 million, payable in 240 equal monthly installments beginning in February 2018.
See Note 3, Acquisition, Integration and Restructuring Charges, for additional information regarding these transactions. The Company records an estimated undiscounted charge when it becomes probable that it has incurred a withdrawal liability. Final charges for these withdrawals will not be known until the plans issue their respective determinations. As a result, these estimates may increase or decrease depending upon the final determinations. Currently, the Company expects payments will occur over an approximately 20-year period. The Company expects to incur similar types of charges in future periods in connection with its ongoing restructuring activities. As of December 31, 2017, the Company has received determination letters from two plans. Of those, the liability for one was settled with a lump sum payment, while monthly payments for the other plan are expected to occur over an approximately 20-year period.
Veritiv’s participation in the multi-employer plans for the year ended December 31, 20142017 is outlined in the table below. The "EIN/Pension Plan Number" column provides the Employee Identification Number and the three-digit plan number, if applicable. The Pension Protection Act zone listed below is based on the latest information Veritiv received from the plan and is certified by the plan’s actuary. Plans in the red zone are generally less than 65% funded, plans in the yellow zone are less than 80% funded and plans in the green zone are at least 80% funded. There were no changes in the status of any zones in 2017. The "FIP/RP Status Pending/Implemented" column indicates plans for which a financial improvement plan or a rehabilitation plan is either pending or has been implemented. The last column lists the expiration date(s) of the collective-bargaining agreement(s). Contributions in the table below, for the year ended December 31, 2017 exclude $1.4 million related to payments made for accrued withdrawal liabilities.
| | | (in millions) | EIN/Pension Plan No. | | Pension Protection Act Zone Status | | FIP/RP Status Pending/Implemented | | Veritiv's Contributions | | Surcharge Imposed | | Expiration Date(s) of Collective Bargaining Agreement(s) | |
| Pension Fund | | EIN/Pension Plan No. | | Pension Protection Act Zone Status | | FIP/RP Status Pending/ Implemented | | Veritiv's Contributions | | Surcharge Imposed | | Expiration Date(s) of Collective Bargaining Agreement(s) |
| EIN/Pension Plan No. | | Pension Protection Act Zone Status | | FIP/RP Status Pending/Implemented | | 2014 | | 2013 | | 2012 | | Surcharge Imposed | | Expiration Date(s) of Collective Bargaining Agreement(s) | | | 2017 | | 2016 | | 2015 | |
Western Conference of Teamsters Pension Trust Fund (1) | | $ | 1.5 |
| | $ | 1.2 |
| | $ | 1.3 |
| | 916145047/001 | | Green | | No | | $ | 1.6 |
| | $ | 1.7 |
| | $ | 1.7 |
| | No | | 7/31/2017 - 10/31/2020 |
Central States, Southeast & Southwest Areas Pension Fund | 366044243/001 | | Red | | Implemented | | 0.3 |
| | 0.2 |
| | 0.2 |
| | Yes | | 2/28/2015 - 11/30/2016 | 366044243/001 | | Red | | Implemented | | 0.2 |
| | 0.3 |
| | 0.4 |
| | Yes | | 7/31/2018 |
| Teamsters Pension Plan of Philadelphia & Vicinity | 231511735/001 | | Yellow | | Implemented | | 0.3 |
| | 0.3 |
| | 0.3 |
| | Yes | | 3/31/2015 - 7/31/2015 | 231511735/001 | | Yellow | | Implemented | | 0.4 |
| | 0.4 |
| | 0.4 |
| | Yes | | 3/31/2018 & 7/31/2018 |
| Graphic Arts Industry Joint Pension Trust | 521074215/001 | | Red | | Implemented | | 0.1 |
| | 0.1 |
| | 0.1 |
| | Yes | | 6/16/2016 | 521074215/001 | | Red | | Implemented | | — |
| | — |
| | 0.1 |
| | Yes | | Exited during 2016 |
| New England Teamsters & Trucking Industry Pension | 046372430/001 | | Red | | Implemented | | 0.5 |
| | 0.5 |
| | 0.5 |
| | Yes | | 9/30/2017 & 11/30/2017 | 046372430/001 | | Red | | Implemented | | 0.4 |
| | 0.5 |
| | 0.4 |
| | Yes | | Exited during 2017 |
| Western Pennsylvania Teamsters and Employers Pension Plan | 256029946/001 | | Red | | Implemented | | 0.2 |
| | 0.2 |
| | 0.2 |
| | Yes | | 3/31/2016 & 3/31/2017 | 256029946/001 | | Red | | Implemented | | 0.3 |
| | 0.3 |
| | 0.3 |
| | Yes | | 3/31/2019 & 3/31/2020 |
| Contributions for individually significant plans | | 2.9 |
| | 2.5 |
| | 2.6 |
| | | 2.9 |
| | 3.2 |
| | 3.3 |
| |
| Contributions to other multi-employer plans | | 0.3 |
| | — |
| | — |
| | | 0.6 |
| | 0.5 |
| | 0.6 |
| |
| Total contributions | | $ | 3.2 |
| | $ | 2.5 |
| | $ | 2.6 |
| | | $ | 3.5 |
| | $ | 3.7 |
| | $ | 3.9 |
| |
(1) There are 17As of December 31, 2017, there were 11 collective bargaining units participating in the Western Conference of Teamsters Pension Trust. As of December 31, 2014, five2017, one was then in negotiations.
(2) As of these were underDecember 31, 2017, there was one collective bargaining unit participating in the Central States, Southeast & Southwest Areas Pension Fund. As of December 31, 2017, it was not then in negotiations.
10.11. FAIR VALUE MEASUREMENTS
At December 31, 20142017 and 2013,2016, the carrying amounts of cash, receivables, payables and other components of other current assets and other current liabilities approximate their fair valuevalues due to the short maturity of these items.
Borrowings under the ABL Facility are at variable market interest rates, and accordingly, itsthe carrying amount approximates fair value. There have been no transfers between the
The fair value measurement levelsof the interest rate cap was derived from a discounted cash flow analysis based on the terms of the agreement and Level 2 data for the forward interest rate curve adjusted for the Company’s credit risk. See Note 6, Derivative Instrument, Hedging Activities and Risk Management, for additional information on the interest rate cap agreement.
During the third quarter of 2017, the Company reviewed its intangible assets for possible impairment indicators, and management determined that the carrying values of the goodwill and customer relationship intangible assets allocated to the logistics solutions business were fully impaired. The impairments were determined after a review of the business's forecasted revenues and estimated cash flows (Level 3 data). The impairment charges were primarily a result of lower forecasted sales growth due to changes in the Company's growth strategy and margin compression due to increased competition. The fair value of these assets was derived using discounted cash flow analyses based on Level 3 inputs. As a result, the Company recorded $7.7 million in non-restructuring impairment charges related to its logistics solutions business's goodwill and customer relationship intangible assets, included in selling and administrative expenses, on the Consolidated Statements of
For the year ended December 31, 2016, the Company recognized $5.8 million in intangible asset impairment charges related to its Print and Publishing segments' customer relationship intangible assets, included in selling and administrative expenses, on the Consolidated Statements of Operations. The impairments were determined after review of the segments' forecasted revenues and estimated cash flows (Level 3). As a result, the entire carrying values were deemed impaired.
For the year ended December 31, 2015, the Company recognized a $1.9 million goodwill impairment charge for its Facility Solutions segment and $3.3 million in asset impairment charges related to property, plant and equipment disposed of as part of its restructuring efforts. The goodwill impairment charge is included in selling and administrative expense and the property, plant and equipment impairment charge is included in restructuring charges, net on the Consolidated Statements of Operations.
For the year ended December 31, 2017, there were no impairments charged to restructuring expense. The Company has on occasion recognized other minor impairments when warranted as part of its normal review of long-lived assets and these impairments are included in selling and administrative expenses on the Consolidated Statements of Operations. Total goodwill and long-lived asset impairments for the years ended December 31, 20142017, 2016 and 2013. The Company recognizes transfers between the fair value measurement levels at the end of the reporting period.2015 were $8.4 million, $7.7 million and $5.9 million, respectively.
At December 31, 2014,2017 and 2016, the pension plan assets were primarily comprised of mutual funds and pooled funds. The underlying investments of these funds were valued using either quoted prices in active markets or valued as of the most recent trade date. See Note 9,10, Employee Benefits Plans, for further detail.
At the time of the Merger, the Company recorded a $58.8$59.4 million contingent liability associated with the Tax Receivable Agreement at fair value using a discounted cash flow model that reflected management's expectations about probability of payment. Key assumptions utilized inThe fair value of the discounted cash flow model includedTax Receivable Agreement is a discount rate of 4.8%,Level 3 measurement which relied upon both Level 2 data (publicly observable data such as market interest rates) and Level 3 data (internal data such as the Company’s projected revenues, taxable income and taxable income. The Company’s discounted cash flow model used significant unobservable (Level 3) inputs that were tied toassumptions about the utilization of Unisource’s net operating losses, attributable to taxable periods prior to the Merger, by the Company.Company). The amount payable under the Tax Receivable Agreement is contingent on the Company generating a certain level of taxable income prior to the expiration of the NOL carryforwards. Moreover, future trading of Company stock by significant shareholders may result in additional ownership changes as defined under Section 382 of the Internal Revenue Code, further limiting the use of Unisource's NOLs and the amount ultimately payable under the Tax Receivable Agreement. The contingent liability is remeasured at fair value at each reporting period with the change in fair value recognized in other (income) expense, (income), net inon the Company’s Consolidated and Combined Statements of Operations. At December 31, 2014,2017, the Company remeasured the contingent liability using a discount rate of 4.7%4.2% (Moody's daily long-term corporate BAA bond yield). There have been no transfers between the fair value measurement levels for the years ended December 31, 2017 and recorded $1.7 million2016. The Company recognizes transfers between the fair value measurement levels at the end of other expense related to the change in fair value.reporting period. See Note 8,9, Related Party Transactions, for further discussion of the Tax Receivable Agreement.
The following table provides a reconciliation of the beginning and ending balance of the Tax Receivable Agreement ("TRA") contingent liability for the year ended December 31, 2014:2017:
|
| | | | |
| (in millions) | | Contingent Liability |
| Beginning balance, July 1, 2014 | | $ | 58.8 |
|
| Change in fair value adjustment | | 1.7 |
|
| Balance at December 31, 2014 | | $ | 60.5 |
|
|
| | | | |
| (in millions) | | TRA Contingent Liability |
| Balance at December 31, 2015 | | $ | 63.0 |
|
| Change in fair value adjustment recorded in other (income) expense, net | | 4.9 |
|
| Balance at December 31, 2016 | | 67.9 |
|
Change in fair value adjustment recorded in other (income) expense, net (a) | | (9.4 | ) |
| Principal payments | | (8.5 | ) |
| Balance at December 31, 2017 | | $ | 50.0 |
|
(a) The Tax Act lowered the U.S. federal corporate tax rate to 21%, which resulted in a fair value reduction of $13.5 million included in the 2017 fair value change in the table above.
The preliminary purchase price allocation for the acquisition of AAC, described in Note 2, 2017 Acquisition, includes $22.2 million for the estimated fair value of contingent consideration. The maximum amount payable for the contingent consideration is $50.0 million, with up to $25.0 million payable at each of the first and second anniversaries of the Acquisition Date. The final amount will be determined based on actual growth rates in revenue and gross profit. The preliminary fair value estimate was based on historic growth patterns and future forecasts, which are Level 3 data. The valuation of contingent consideration uses assumptions and estimates to forecast a range of outcomes and probabilities for the contingent consideration. The contingent consideration is valued using a Monte Carlo simulation model. The Company will assess these assumptions and estimates on a quarterly basis as additional data impacting the assumptions is obtained. Any changes in the fair value of contingent consideration related to updated assumptions and estimates will be recognized within other (income) expense, net, in the Consolidated Statements of Operations during the period in which the change occurs.
The following table provides a reconciliation of the beginning and ending balance of the AAC contingent liability for the year ended December 31, 2017:
|
| | | | |
| (in millions) | | AAC Contingent Liability |
| Balance at August 31, 2017 | | $ | 30.0 |
|
| Purchase accounting adjustment | | (7.8 | ) |
| Adjusted purchase price | | 22.2 |
|
| Change in fair value adjustment recorded in other (income) expense, net | | 2.0 |
|
| Balance at December 31, 2017 | | $ | 24.2 |
|
11.12. SUPPLEMENTARY FINANCIAL STATEMENT INFORMATION
Other Current Assets
The components of other current assets were as follows:
| | | (in millions) | December 31, | | December 31, | December 31, | | December 31, |
| 2014 | | 2013 | 2017 | | 2016 |
| Rebates receivable | $ | 58.1 |
| | $ | 18.4 |
| $ | 61.1 |
| | $ | 62.3 |
|
| Prepaid expenses | 25.7 |
| | 5.6 |
| 33.8 |
| | 26.1 |
|
| Other | 25.5 |
| | 2.3 |
| 38.6 |
| | 30.5 |
|
| Other current assets | $ | 109.3 |
| | $ | 26.3 |
| $ | 133.5 |
| | $ | 118.9 |
|
Other Non-Current Assets
The components of other non-current assets were as follows:
| | | (in millions) | December 31, | | December 31, | December 31, | | December 31, |
| 2014 | | 2013 | 2017 | | 2016 |
| Deferred financing costs | $ | 19.9 |
| | $ | — |
| $ | 9.3 |
| | $ | 11.9 |
|
| Investments in real estate joint ventures | 5.7 |
| | — |
| 6.4 |
| | 6.0 |
|
| Below market leasehold agreements | 6.0 |
| | — |
| 4.7 |
| | 4.7 |
|
| Other | 12.3 |
| | 9.4 |
| 10.4 |
| | 7.7 |
|
| Other non-current assets | $ | 43.9 |
| | $ | 9.4 |
| $ | 30.8 |
| | $ | 30.3 |
|
Accrued Payroll and Benefits
The components of accrued payroll and benefits were as follows:
| | | (in millions) | December 31, | | December 31, | December 31, | | December 31, |
| 2014 | | 2013 | 2017 | | 2016 |
| Accrued payroll and related taxes | $ | 32.4 |
| | $ | 11.2 |
| $ | 18.0 |
| | $ | 26.0 |
|
| Accrued commissions | 37.0 |
| | 25.9 |
| 23.2 |
| | 21.8 |
|
| Accrued incentive plans | | 28.7 |
| | 33.1 |
|
| Other | 41.7 |
| | 17.8 |
| 3.6 |
| | 3.5 |
|
| Accrued payroll and benefits | $ | 111.1 |
| | $ | 54.9 |
| $ | 73.5 |
| | $ | 84.4 |
|
Other Accrued Liabilities
The components of other accrued liabilities were as follows:
| | | (in millions) | December 31, | | December 31, | December 31, | | December 31, |
| 2014 | | 2013 | 2017 | | 2016 |
| Accrued taxes | $ | 15.3 |
| | $ | 6.4 |
| $ | 12.1 |
| | $ | 9.1 |
|
| Accrued customer incentives | 24.1 |
| | 12.8 |
| 25.1 |
| | 23.3 |
|
| Accrued freight | 10.1 |
| | 2.4 |
| 16.0 |
| | 13.9 |
|
| Accrued professional fees | 15.1 |
| | — |
| 6.7 |
| | 7.3 |
|
| Tax Receivable Agreement contingent liability | | 9.9 |
| | 8.5 |
|
| AAC contingent liability and working capital adjustment | | 18.4 |
| | — |
|
| Other | 35.9 |
| | 14.9 |
| 46.4 |
| | 40.4 |
|
| Other accrued liabilities | $ | 100.5 |
| | $ | 36.5 |
| $ | 134.6 |
| | $ | 102.5 |
|
Other Non-Current Liabilities
The components of other non-current liabilities were as follows:
| | | (in millions) | December 31, | | December 31, | December 31, | | December 31, |
| 2014 | | 2013 | 2017 | | 2016 |
| Contingent liability associated with Tax Receivable Agreement | $ | 60.5 |
| | $ | — |
| |
| Tax Receivable Agreement contingent liability | | $ | 40.1 |
| | $ | 59.4 |
|
| AAC contingent liability | | 7.1 |
| | — |
|
| Deferred compensation | 18.2 |
| | — |
| 23.7 |
| | 21.6 |
|
| Straight-line rent | 9.4 |
| | 9.2 |
| 17.5 |
| | 15.7 |
|
| Above market leasehold agreements | 7.0 |
| | — |
| 2.1 |
| | 3.1 |
|
| Other | 12.1 |
| | 3.3 |
| |
| Other, including multi-employer pension plan withdrawals | | 46.5 |
| | 21.4 |
|
| Other non-current liabilities | $ | 107.2 |
| | $ | 12.5 |
| $ | 137.0 |
| | $ | 121.2 |
|
12.13. EARNINGS (LOSS) PER SHARE
Basic earnings (loss) per share for Veritiv common stock is calculated by dividing net income (loss) by the weighted averageweighted-average number of shares of common stock outstanding during the period. Diluted earnings (loss) per share is similarly calculated, except that the denominator is increased to include the number of additional common shares that would have been outstanding if the dilutive potential common shares had been issued, except where the inclusion of such common shares would have an anti-dilutive impact.
On the Distribution Date, Veritiv had 16,000,000 shares of common stock issued and outstanding, including 7,840,000 shares issued in a private placement to the UWWH Stockholder. The calculation of both basic and diluted earnings (loss) per share for the years ended December 31, 20132017, 2016 and 20122015 utilized 8,160,00015.70 million, 15.97 million and 16.00 million shares as no equity-based awards werefor basic, respectively, and 15.70 million, 16.15 million and
16.00 million shares for dilutive, respectively, issued and outstanding prior to the Distribution Date, and Veritiv was a wholly-owned subsidiary of International Paper prior to that date. The calculation of both basic and diluted earnings (loss) per share for the year ended December 31, 2014 utilized 12,080,000 shares based on the weighted-average shares outstanding during this period, reflectingwith the impact of the private placement of shares to the UWWH Stockholder on the Distribution Date. Also, as the Company has not issued or granted any dilutive securities since the Distribution Date, there was no dilutive impact toweighted-average shares outstanding for the year ended December 31, 2014.diluted earnings per share having been adjusted for potentially dilutive shares.
Basicthe numerators and denominators used in the basic and diluted earnings (loss) per share werecalculations is as follows:
|
| | | | | | | | | | | |
| | Year Ended December 31, |
| (in millions, except share and per share data) | 2014 | | 2013 | | 2012 |
| Income (loss) from continuing operations | $ | (19.5 | ) | | $ | (0.0 | ) | | $ | 14.4 |
|
| Income (loss) from discontinued operations, net of income taxes | (0.1 | ) | | 0.2 |
| | (10.0 | ) |
| Net income (loss) | $ | (19.6 | ) | | $ | 0.2 |
| | $ | 4.4 |
|
| | | | | | |
| Weighted-average number of shares outstanding – basic and diluted | 12,080,000 |
| | 8,160,000 |
| | 8,160,000 |
|
| Earnings (loss) per share: | | | | | |
| Basic and diluted | | | | | |
| Continuing operations | $ | (1.61 | ) | | $ | (0.00 | ) | | $ | 1.76 |
|
| Discontinued operations | (0.01 | ) | | 0.02 |
| | (1.23 | ) |
| Basic and diluted earnings (loss) per share | $ | (1.62 | ) | | $ | 0.02 |
| | $ | 0.53 |
|
13. SHAREHOLDERS' EQUITY |
| | | | | | | | | | | |
| | Year Ended December 31, |
| (in millions, except per share data) | 2017 | | 2016 | | 2015 |
| Numerator: | | | | | |
| Net income (loss) | $ | (13.3 | ) | | $ | 21.0 |
| | $ | 26.7 |
|
| | | | | | |
| Denominator: | | | | | |
| Weighted-average number of shares outstanding – basic | 15.70 |
| | 15.97 |
| | 16.00 |
|
| Weighted-average number of shares outstanding – diluted | 15.70 |
| | 16.15 |
| | 16.00 |
|
| | | | | | |
| Earnings (loss) per share: | | | | | |
| Basic earnings (loss) per share | $ | (0.85 | ) | | $ | 1.31 |
| | $ | 1.67 |
|
| Diluted earnings (loss) per share | $ | (0.85 | ) | | $ | 1.30 |
| | $ | 1.67 |
|
| | | | | | |
| Antidilutive stock-based awards excluded from computation of diluted earnings per share | 0.80 |
| | 0.06 |
| | 0.10 |
|
| Performance stock-based awards excluded from computation of diluted earnings per share because performance conditions had not been met | 0.30 |
| | 0.20 |
| | 0.16 |
|
On the Distribution Date, Veritiv amended and restated its Certificate of Incorporation and its Bylaws. The following summarizes information concerning Veritiv's capital stock.
Authorized Capital Stock14. SHAREHOLDERS' EQUITY
As a result of the Spin-off, the Company’s authorized capital stock consists of 100,000,000 shares of common stock, par value $0.01 per share, and 10,000,000 shares of preferred stock, par value $0.01 per share.
Common Stock
Shares Outstanding: On November 23, 2016, the Distribution Date, 8,160,000UWWH Stockholder sold 1.76 million shares of Veritiv common stock were distributed on a pro rata basis toin an underwritten public offering. See the International Paper shareholders"Treasury Stock" section of record as of the close of business on June 20, 2014. Furthermore,this footnote below for additional information. On March 22, 2017, the UWWH Stockholder the sole shareholder of UWWH, received 7,840,000sold 1.80 million shares of Veritiv common stock for all outstandingin a block trade. The Company did not sell any shares and did not receive any of UWWH common stock that it held on the Distribution Date. Followingproceeds in these distributions, Veritiv had 16,000,000 shares of common stock issued and outstanding.transactions.
Dividends: Each holder of common stock shall be entitled to participate equally in all dividends payable with respect to the common stock.
Voting Rights: The holders of the Company’s common stock are entitled to vote only in the circumstances set forth in Veritiv's Amended and Restated Certificate of Incorporation. Each holder of common stock shall be entitled to one vote for each share of common stock held of record by such holder upon all matters to be voted on by the holders of the common stock.
Other Rights: Each holder of common stock shall be entitled to share equally, subject to any rights and preferences of the preferred stock (as fixed by resolutions, if any, of the Board of Directors), in the assets of the Company available for distribution, in the event of any voluntary or involuntary liquidation, dissolution or winding up of the affairs of Veritiv, or upon any distribution of the assets of the Company.
Preferred Stock
Subject to the provisions of the Amended and Restated Certificate of Incorporation, the Board of Directors of Veritiv is authorized to provide for the issuance of up to 10,000,00010.00 million shares of preferred stock in one or more series. The Board of Directors may fix the number of shares constituting any series and determine the designation of the series, the dividend rates, rights of priority of dividend payment, the voting powers (if any) of the shares of the series, and the preferences and relative participating, optional and other rights, if any, and any qualifications, limitations or restrictions, applicable to the shares of such series. No preferred stock was issued and outstanding as of December 31, 2014.2017.
In conjunction with the November 2016 UWWH Stockholder offering and related Veritiv stock repurchase, Veritiv incurred approximately $0.8 million in transaction-related fees, of which approximately $0.2 million was capitalized as part of the cost to acquire the treasury stock with the remainder included in selling and administrative expense on the Consolidated Statements of Operations. The Company may repurchase additional shares in the future, however, there is currently no share repurchase authorization plan approved by the Company's Board of Directors. See Note 9, Related Party Transactions, for additional information regarding these transactions.
Accumulated Other Comprehensive Income (Loss)Loss
Comprehensive income (loss) is reported in the Consolidated and Combined Statements of Comprehensive Income (Loss) and consists of net income (loss) and other gains and losses affecting shareholders' equity that, under U.S. GAAP, are excluded from net income (loss). AOCIAOCL consisted of the following:
|
| | | | | | | |
| (in millions) | December 31, 2014 | | December 31, 2013 |
| Foreign currency translation adjustments | $ | (14.7 | ) | | $ | (4.7 | ) |
| Adjustments to pension and other benefit liabilities, net of tax | (7.4 | ) | | — |
|
| Accumulated other comprehensive loss | $ | (22.1 | ) | | $ | (4.7 | ) |
|
| | | | | | | | | | | | | | | | |
| (in millions) | | Foreign currency translation adjustments | | Retirement liabilities | | Interest rate swap | | AOCL |
| | | | | | | | | |
| Balance at December 31, 2015 | | $ | (27.1 | ) | | $ | (7.4 | ) | | $ | (0.5 | ) | | $ | (35.0 | ) |
| Unrealized net losses arising during the period | | (2.1 | ) | | (1.8 | ) | | (0.2 | ) | | (4.1 | ) |
| Amounts reclassified from AOCL | | — |
| | 0.1 |
| | — |
| | 0.1 |
|
| Net current period other comprehensive loss | | (2.1 | ) | | (1.7 | ) | | (0.2 | ) | | (4.0 | ) |
| Balance at December 31, 2016 | | (29.2 | ) | | (9.1 | ) | | (0.7 | ) | | (39.0 | ) |
| Unrealized net gains (losses) arising during the period | | 5.9 |
| | 0.1 |
| | (0.1 | ) | | 5.9 |
|
| Amounts reclassified from AOCL | | (0.2 | ) | | (0.3 | ) | | 0.1 |
| | (0.4 | ) |
| Net current period other comprehensive income (loss) | | 5.7 |
| | (0.2 | ) | | 0.0 |
| | 5.5 |
|
| Balance at December 31, 2017 | | $ | (23.5 | ) | | $ | (9.3 | ) | | $ | (0.7 | ) | | $ | (33.5 | ) |
For the years ended December 31, 2014, 2013 and 2012, there were no reclassifications out of AOCI.
14.15. EQUITY-BASED INCENTIVE PLANS
Veritiv Omnibus Incentive PlansPlan
2014 Omnibus Incentive Plan – In conjunction with the Spin-off and the Merger, Veritiv adopted the Veritiv CorporationVeritiv's 2014 Omnibus Incentive Plan, as amended and restated as of March 8, 2017 (the "Omnibus Incentive"2014 Plan"). provides for the grant of stock, deferred share units ("DSUs"), restricted stock units ("RSUs"), performance condition share units ("PCSUs"), and market condition performance share units ("MCPSUs"), among other awards. A total of 2,080,0003.08 million shares of Veritiv common stock may be issued under the Omnibus Incentive2014 Plan subject to certain adjustment provisions. Veritiv may grant options, stock appreciation rights, stock purchase rights, restrictedAs of December 31, 2017, there were approximately 1.3 million shares restricted stock units, dividend equivalents, deferred share units, performance shares, performance units and other equity-based awards under the Omnibus Incentive Plan. Awards mayavailable to be granted under the Omnibus Incentive Plan to any employee, director consultant or other service providerconsultant of Veritiv or a subsidiary of Veritiv. Grants are made at the discretion of the Compensation and Leadership Development Committee of the Company's Board of Directors.
Stock
The Company made grants of common stock in 2017 to its non-employee directors. The stock grant was fully vested and non-forfeitable as of the grant date. The non-employee directors were eligible to defer receipt of the award under the Veritiv Deferred Compensation Plan. The Company recognized $1.1 million in expense related to these grants for the year ended December 31, 2014, the2017.
Deferred Share Units
The Company granted 16,064 Deferred Share Units ("DSUs")DSUs in 2014, 2015 and 2016 to its non-employee directors. Each DSU is the economical equivalent of one share of Veritiv's common stock. The DSUs arewere fully vested and non-forfeitable as of the grant date and are payable in cash following the individual's termination of service as a Veritiv director. At December 31,The DSUs granted in 2014 and 2015 are payable in cash and the Company recognized $0.8 millionDSUs granted in expense related to these units based on the closing market price of the Company's common2016 are settled in stock. The cash-settled DSUs wereare classified as a non-current liability and will beare remeasured at each reporting date, with a corresponding adjustment to compensation expense. At December 31, 2017 there were approximately 51,900 DSUs outstanding with a fair value of $1.7 million. At December 31, 2016, there were approximately 55,100 DSUs outstanding with a fair value of $3.0 million. The Company recognized $(0.8) million, $0.6 million and $0.7 million in net expense related to these grants for the years ended December 31, 2017, 2016 and 2015 respectively.
Subsequently, on January 1, 2015, the Company granted 63,217 restricted stock units ("RSUs")Restricted Stock Units
RSUs are awarded to key employees annually and 252,930 performance stock units ("PSUs") to certain of its employees based on the closing stock price of the Company's common stock on December 31, 2014. The RSUs willcliff vest at the end of three years, based onsubject to continued service. The PSUs willfair value of the RSU awards is based typically on either the closing price of Veritiv common stock on the date of grant or the closing price on the trading date immediately prior to the date of grant if the grant date is not a trading date. Compensation expense for the RSUs is recognized ratably from the grant date to the vesting date.
A summary of activity related to non-vested RSUs is presented below:
|
| | | | | | | |
| (units in thousands) | | Number of RSUs | | Weighted-Average Grant Date Fair Value Per Share |
| Non-vested at December 31, 2015 | | 59 |
| | $ | 51.21 |
|
| Granted | | 98 |
| | $ | 36.43 |
|
| Vested | | (1 | ) | | $ | 47.71 |
|
| Forfeited | | (10 | ) | | $ | 41.35 |
|
| Non-vested at December 31, 2016 | | 146 |
| | $ | 42.05 |
|
| Granted | | 111 |
| | $ | 49.86 |
|
| Vested | | — |
| | $ | — |
|
| Forfeited | | (8 | ) | | $ | 44.21 |
|
| Non-vested at December 31, 2017 | | 249 |
| | $ | 45.43 |
|
Performance Condition Share Units
PCSUs are awarded to key employees annually and cliff vest at the end of three years, subject to continued service and the attainment of performance conditions. The PCSU award represents the contingent right to receive a number of shares equal to a portion, all or a multiple (not to exceed 200%) of the target number of PCSUs. The PCSUs are divided into three tranches, and each tranche is earned based on the Company’s financial results onachievement of an annual Adjusted EBITDA target which is set at the beginning of each of the three years in the vesting period. The Company defines Adjusted EBITDA as earnings before interest, income taxes, depreciation and amortization, ("EBITDA")restructuring charges, net, acquisition and total shareholder return, subject to continuing service. As of December 31, 2014, no expense was recognized for these awards.
International Paper Incentive Plans
At the time of the Spin-off, all equity awards held by employees of xpedx were granted under International Paper’s 2009 Incentive Compensation Planintegration expenses and other similar charges including any severance costs, costs associated with warehouse and office openings or predecessor plans. In conjunction with the Spin-offclosings, consolidation, and Merger, International Paper retained all rightsrelocation and obligations of these incentive plans. xpedx'sother business optimization expenses, stock-based compensation expense, changes in the LIFO reserve, non-restructuring asset impairment charges, non-restructuring severance charges, non-restructuring pension charges, fair value adjustments related to contingent liabilities assumed in mergers and related income tax benefits associated with these International Paper plans were as follows:acquisitions and certain other
|
| | | | | | | | | | | |
| | Year Ended December 31, |
| (in millions) | 2014 | | 2013 | | 2012 |
| Total stock-based compensation expense | $ | 4.3 |
| | $ | 15.4 |
| | $ | 13.1 |
|
| Income tax benefit related to stock-based compensation | $ | 1.3 |
| | $ | 8.5 |
| | $ | 6.2 |
|
adjustments. Compensation expense for each tranche is recognized ratably from the date the fair value is determined to the vesting date for the number of awards expected to vest.
A summary of activity related to non-vested PCSUs is presented below:
|
| | | | | | | | |
| (units in thousands) | | Number of PCSUs | | Weighted-Average Grant Date Fair Value Per Share | |
| Non-vested at December 31, 2015 | | 159 |
| | $ | 51.23 |
| |
| Granted | | 244 |
| | $ | 47.98 |
| (1) |
| Shares lost based on actual performance | | (22 | ) | | $ | 36.43 |
| |
| Vested | | — |
| | $ | — |
| |
| Forfeited | | (26 | ) | | $ | 41.49 |
| |
| Non-vested at December 31, 2016 | | 355 |
| | $ | 42.14 |
| |
| Granted | | 166 |
| | $ | 53.56 |
| (2) |
| Shares lost based on actual performance | | (45 | ) | | $ | 53.56 |
| |
| Vested | | — |
| | $ | — |
| |
| Forfeited | | (22 | ) | | $ | 40.78 |
| |
| Non-vested at December 31, 2017 | | 454 |
| | $ | 40.87 |
| |
15.(1) Represents weighted-average grant date fair value for the 2016 and 2017 tranches.
(2) Represents weighted-average grant date fair value for the 2017 tranche.
Market Condition Performance Share Units
MCPSUs are awarded to key employees annually and cliff vest at the end of three years, subject to continued service and the attainment of performance conditions. The MCPSU award represents the contingent right to receive a number of shares equal to a portion, all or a multiple (not to exceed 200%) of the target number of MCPSUs. The MCPSUs are divided into three tranches and each tranche is earned based on the achievement of a total shareholder return ("TSR") target relative to the TSR of an applicable peer group over the 1-, 2- and 3-year cumulative periods in the vesting period. The weighted-average grant date fair value of the MCPSUs is determined using a Monte Carlo simulation model. Assumptions used in the 2017, 2016 and 2015 models included a 25.0% expected volatility rate and a 1.1% risk-free interest rate. The expected volatility rate is based on the historical volatility over the most recent period equal to the vesting period. Given Veritiv’s limited trading history, an average of the peer group volatility was used for the portion of the historical period prior to the Merger and Veritiv’s actual historical volatility was used for the portion of the period after the Merger. The risk-free interest rate is based on the yield on U.S. Treasury securities matching the vesting period. Compensation expense is recognized ratably from the grant date to the vesting date.
A summary of activity related to non-vested MCPSUs is presented below:
|
| | | | | | | |
| (units in thousands) | | Number of MCPSUs | | Weighted-Average Grant Date Fair Value Per Share |
| Non-vested at December 31, 2015 | | 91 |
| | $ | 62.52 |
|
| Granted | | 146 |
| | $ | 42.23 |
|
| Shares earned based on actual performance | | 15 |
| | $ | — |
|
| Vested | | — |
| | $ | — |
|
| Forfeited/cancelled | | (44 | ) | | $ | 58.16 |
|
| Non-vested at December 31, 2016 | | 208 |
| | $ | 48.23 |
|
| Granted | | 100 |
| | $ | 71.63 |
|
| Shares lost based on actual performance | | (103 | ) | | $ | 71.63 |
|
| Vested | | — |
| | $ | — |
|
| Forfeited/cancelled | | (12 | ) | | $ | 55.65 |
|
| Non-vested at December 31, 2017 | | 193 |
| | $ | 56.23 |
|
For the years ended December 31, 2017, 2016 and 2015, the Company recognized $15.7 million, $8.3 million and $3.8 million, respectively, in expense related to the aforementioned equity-based awards. The income tax benefit recognized in 2017, 2016 and 2015 related to stock-based compensation expense was $5.7 million, $3.2 million and $1.5 million, respectively. As of December 31, 2017, total unrecognized stock-based compensation expense was $21.8 million and is expected to be recognized over a weighted-average period of 1.8 years. Unrecognized compensation expense for the 2018 and 2019 tranches of the PCSU awards is estimated based on the Company's closing stock price at December 31, 2017. Dividends are not paid or accrued on unvested stock units. The grant date fair values are not reduced for dividends as none are expected to be paid during the vesting period.
16. COMMITMENTS AND CONTINGENCIES
Legal Proceedings
From time to time, the Company is involved in various lawsuits, claims and regulatory and administrative proceedings arising out of its business relating to general commercial and contractual matters, governmental regulations, intellectual property rights, labor and employment matters, tax and other actions.
Although the ultimate outcome of any legal proceeding or investigation cannot be predicted with certainty, based on present information, including the Company's assessment of the merits of the particular claim, the Company does not expect that any asserted or unasserted legal claims or proceedings, individually or in the aggregate, will have a material adverse effect on its cash flow, results of operations, financial condition or financial condition.cash flows.
Escheat Audit
DuringIn 2013, Unisource was notified by the State of Delaware that theyit intended to examine the books and records of Unisource to determine compliance with Delaware escheat laws. Since that date, seven other states have joined with Delaware in the audit process, which is conducted by an outside firm on behalf of the states and coversstates. In the period from 1981 to present. The Company has been informed that similar audits have generally taken two to four years to complete. Due to the preliminary stagethird quarter of this audit,2017, the Company has determined that the ultimate outcome cannot berecorded an estimated at this time. Any claims or liabilities resulting from these audits could have a material impact on the Company’s financial condition, results of operations and cash flows.
16. DISCONTINUED OPERATIONS
During 2011, xpedx ceased its Canadian operations, which had provided distribution of printing suppliesliability with respect to Canadian-based customers. Additionally, xpedx ceased its printing press distribution business, which was located in the U.S. Both of these businesses were historically included in xpedx’s Print segment. The operations and cash flows of these components have been eliminated from the ongoing operations of xpedx, and going forward Veritiv will not have any significant continuing involvement in the operations of these components, as any assets and related obligations were retained by International Paper as part of the Spin-off. Prior to the Spin-off, these components were included in discontinued operations for all periods presented.
Results of discontinued operations were as follows:
|
| | | | | | | | | | | |
| | Year Ended December 31, |
| (in millions) | 2014 | | 2013 | | 2012 |
| Loss from operations | $ | (0.1 | ) | | $ | (0.5 | ) | | $ | (0.4 | ) |
| Restructuring and disposal income (loss) | — |
| | 0.7 |
| | (10.1 | ) |
| (Loss) income from discontinued operations, net of income tax benefit of $0.0, $0.0 and $0.5, respectively | (0.1 | ) | | 0.2 |
| | (10.0 | ) |
17. SEGMENT AND GEOGRAPHIC INFORMATION
Effective July 1, 2014,certain transactions in connection with the Spin-off and Merger,pending audit.
During the fourth quarter of 2017, the Company reorganized its reportable segments asfiled an election to convert the Delaware portion of the audit into a resultreview under the State of a change inDelaware’s Voluntary Disclosure Agreement Program (“VDA”). Under the way the Chief Executive Officer, who serves as the Chief Operating Decision Maker ("CODM"), manages and evaluates the business. Previously,VDA, the Company had three reportable segments: Print, Packaging and Facility Solutions. Duringwill continue to identify source documents that support the third quarterhistorical treatment of 2014,the transactions at issue to determine the amount it believes is owed to Delaware. Similarly, the Company realigned and expandedwill continue to identify source documents that support the Print segment into two separate reportable segments, Print and Publishing, and, therefore, expanded the number of reportable segments to four. In addition, as a resulthistorical treatment of the change in howtransactions under audit by the CODM manages and evaluates the business, certain costs such as executive costs, corporate affairs, finance, human resources, IT and legal that were previously allocated to the reportable segments are no longer allocated. The Company’s consolidated financial results now include a "Corporate & Other" category which includes certain assets and costs not primarily attributable to any of the reportable segments. Corporate & Other also includes the Veritiv Logistics Solutions business which provides transportation and warehousing solutions. As a result of these changes in segment reporting, all historical segment information has been revised to conform to the new presentation, with no resulting impact on the consolidated and combined results of operations.other participating states.
Based upon the information available to date, the Company recognized an estimated liability in 2017 of $7.5 million. The Company anticipates that it may take more than a year to complete the VDA and audit. Due to the inherent uncertainties with respect to the ultimate outcome of these matters, any updates to this estimate of loss could have a material impact on the Company's results of operations, financial condition or cash flows.
17. SEGMENT INFORMATION
The following is a brief description of the four reportable segments, organized by major product category:
Packaging – The Packaging segment provides standard as well as custom and comprehensive packaging solutions for customers based in North America and in key global markets. The business is strategically focused on higher growth industries including light industrial/general manufacturing, food production, fulfillment and internet retail, as well as niche verticals based on geographical and functional expertise.
Facility Solutions – The Facility Solutions segment sources and sells cleaning, break-room and other supplies such as towels, tissues, wipers and dispensers, can liners, commercial cleaning chemicals, soaps and sanitizers, sanitary maintenance supplies and equipment, safety and hazard supplies, and shampoos and amenities primarily in the U.S., Canada and Mexico.
Print – The Print segment sells and distributes commercial printing, writing, copying, digital, wide format and specialty paper products, graphics consumables and graphics equipment primarily in the U.S., Canada and Mexico. This segment also includes customized paper conversion services of commercial printing paper for distribution to document centers and form printers.
Publishing– The Publishing segment sells and distributes coated and uncoated commercial printing papers to publishers, retailers, converters, printers and specialty businesses for use in magazines, catalogs, books, directories, gaming, couponing, retail inserts and direct mail. This segment also provides print management, procurement and supply chain management solutions to simplify paper and print procurement processes for its customers.
Packaging – The Packaging segmentCompany’s consolidated financial results also include a "Corporate & Other" category which includes certain assets and costs not primarily attributable to any of the reportable segments. Corporate & Other also includes the Veritiv logistics solutions business which provides standard as well as customtransportation and comprehensive packaging solutions for customers based in North America and in key global markets. The business is strategically focused on higher growth industries including light industrial/general manufacturing, food processing and manufacturing, fulfillment and internet retail, as well as niche verticals based on geographical and functional expertise.warehousing solutions.
Facility Solutions – The Facility Solutions segment sources and sells cleaning, break-room and other supplies such as towels, tissues, wipers and dispensers, can liners, commercial cleaning chemicals, soaps and sanitizers, sanitary maintenance supplies and equipment, safety and hazard supplies, and shampoos and amenities primarily in the U.S., Canada and Mexico.
In conjunction with the change in reportable segments, management re-evaluated its use of key performance metrics. Historically, xpedx presented operating profit, excluding certain charges, as its measure of operating performance for presentation of segment results. Based on the recent evaluation, Veritiv management has concluded that Adjusted EBITDA is the metric management uses to assess operating performance. Therefore, the current and prior period segment presentations reflect Adjusted EBITDA as the operating performance measure.
The following tables present net sales, Adjusted EBITDA (the metric management uses to assess operating performance) and certain other measures for each of the reportable segments and total continuing operationsCorporate & Other for the periods presented:
| | | (in millions) | Print | | Publishing | | Packaging | | Facility Solutions | | Corporate & Other | | Total | Packaging | | Facility Solutions | | Print | | Publishing | | Total Reportable Segments | | Corporate & Other | | Total |
| Year Ended December 31, 2014 | | | | | | | | | | | | |
| Year Ended December 31, 2017 | | | | | | | | | | | | | | |
| Net sales | | $ | 3,157.8 |
| | $ | 1,309.7 |
| | $ | 2,793.7 |
| | $ | 958.0 |
| | $ | 8,219.2 |
| | $ | 145.5 |
| | $ | 8,364.7 |
|
| Adjusted EBITDA | | 238.0 |
| | 35.5 |
| | 60.8 |
| | 26.4 |
| | 360.7 |
| | (184.3 | ) | |
|
| Depreciation and amortization | | 15.9 |
| | 6.0 |
| | 10.4 |
| | 1.5 |
| | 33.8 |
| | 20.4 |
| | 54.2 |
|
| Restructuring charges, net | | 6.1 |
| | 2.3 |
| | 8.0 |
| | 0.0 |
| | 16.4 |
| | 0.3 |
| | 16.7 |
|
| Year Ended December 31, 2016 | | | | | | | | | | | | | | |
| Net sales | | 2,854.2 |
| | 1,271.6 |
| | 3,047.4 |
| | 1,033.6 |
| | 8,206.8 |
| | 119.8 |
| | 8,326.6 |
|
| Adjusted EBITDA | | 221.2 |
| | 47.0 |
| | 76.8 |
| | 23.6 |
| | 368.6 |
| | (176.4 | ) | |
|
| Depreciation and amortization | | 12.4 |
| | 5.9 |
| | 12.4 |
| | 3.1 |
| | 33.8 |
| | 20.9 |
| | 54.7 |
|
| Restructuring charges, net | | 4.6 |
| | 2.3 |
| | 5.2 |
| | 0.1 |
| | 12.2 |
| | 0.2 |
| | 12.4 |
|
| Year Ended December 31, 2015 | | | | | | | | | | | | | | |
| Net sales | $ | 2,956.1 |
| | $ | 1,075.5 |
| | $ | 2,259.4 |
| | $ | 1,070.3 |
| | $ | 45.2 |
| | $ | 7,406.5 |
| 2,829.9 |
| | 1,289.3 |
| | 3,271.8 |
| | 1,215.5 |
| | 8,606.5 |
| | 111.2 |
| | 8,717.7 |
|
| Adjusted EBITDA | $ | 55.4 |
| | $ | 27.1 |
| | $ | 157.0 |
| | $ | 33.6 |
| | $ | (151.1 | ) | | $ | 122.0 |
| 212.6 |
| | 41.7 |
| | 79.0 |
| | 34.7 |
| | 368.0 |
| | (186.0 | ) | |
|
| Depreciation and amortization | $ | 9.7 |
| | $ | 1.4 |
| | $ | 9.7 |
| | $ | 4.6 |
| | $ | 12.2 |
| | $ | 37.6 |
| 14.4 |
| | 7.1 |
| | 13.5 |
| | 3.1 |
| | 38.1 |
| | 18.8 |
| | 56.9 |
|
| Restructuring charges | $ | 1.5 |
| | $ | — |
| | $ | 1.4 |
| | $ | 0.6 |
| | $ | 0.5 |
| | $ | 4.0 |
| 3.8 |
| | 2.5 |
| | 3.6 |
| | 0.0 |
| | 9.9 |
| | 1.4 |
| | 11.3 |
|
| | | | | | | | | | | | | |
| Year Ended December 31, 2013 | | | | | | | | | | | | |
| Net sales | $ | 2,399.6 |
| | $ | 807.9 |
| | $ | 1,600.3 |
| | $ | 844.6 |
| | $ | — |
| | $ | 5,652.4 |
| |
| Adjusted EBITDA | $ | 43.9 |
| | $ | 16.4 |
| | $ | 117.9 |
| | $ | 14.4 |
| | $ | (118.4 | ) | | $ | 74.2 |
| |
| Depreciation and amortization | $ | 4.4 |
| | $ | 0.6 |
| | $ | 2.6 |
| | $ | 1.5 |
| | $ | 8.0 |
| | $ | 17.1 |
| |
| Restructuring charges | $ | 15.7 |
| | $ | 1.1 |
| | $ | 11.7 |
| | $ | 7.4 |
| | $ | 2.0 |
| | $ | 37.9 |
| |
| | | | | | | | | | | | | |
| Year Ended December 31, 2012 | | | | | | | | | | | | |
| Net sales | $ | 2,651.2 |
| | $ | 822.7 |
| | $ | 1,593.9 |
| | $ | 944.2 |
| | $ | — |
| | $ | 6,012.0 |
| |
| Adjusted EBITDA | $ | 53.0 |
| | $ | 13.8 |
| | $ | 123.6 |
| | $ | 19.2 |
| | $ | (120.1 | ) | | $ | 89.5 |
| |
| Depreciation and amortization | $ | 6.1 |
| | $ | 0.6 |
| | $ | 2.8 |
| | $ | 1.8 |
| | $ | 2.7 |
| | $ | 14.0 |
| |
| Restructuring charges | $ | 20.4 |
| | $ | 0.3 |
| | $ | 7.1 |
| | $ | 5.0 |
| | $ | 2.3 |
| | $ | 35.1 |
| |
The table below presents a reconciliation of income (loss) from continuing operations before income taxes as reflected in the Consolidated and Combined Statements of Operations to Total Adjusted EBITDA:EBITDA for the reportable segments: |
| | | | | | | | | | | |
| | Year Ended December 31, |
| (in millions) | 2014 | | 2013 | | 2012 |
| Income (loss) from continuing operations before income taxes | $ | (21.6 | ) | | $ | 0.4 |
| | $ | 23.5 |
|
| Interest expense, net | 14.0 |
| | — |
| | — |
|
| Depreciation and amortization | 37.6 |
| | 17.1 |
| | 14.0 |
|
| Restructuring charges | 4.0 |
| | 37.9 |
| | 35.1 |
|
| Non-restructuring stock-based compensation | 4.0 |
| | 13.1 |
| | 13.1 |
|
| LIFO expense | 6.3 |
| | 3.4 |
| | 1.0 |
|
| Non-restructuring severance charges | 2.6 |
| | 2.3 |
| | 0.6 |
|
| Merger and integration expenses | 75.1 |
| | — |
| | — |
|
| Fair value adjustment on TRA contingent liability | 1.7 |
| | — |
| | — |
|
| Other | (1.7 | ) | | — |
| | 2.2 |
|
| Total Adjusted EBITDA | $ | 122.0 |
| | $ | 74.2 |
| | $ | 89.5 |
|
|
| | | | | | | | | | | |
| | Year Ended December 31, |
| (in millions) | 2017 | | 2016 | | 2015 |
| Income (loss) before income taxes | $ | (1.9 | ) | | $ | 40.8 |
| | $ | 44.9 |
|
| Interest expense, net | 31.2 |
| | 27.5 |
| | 27.0 |
|
| Depreciation and amortization | 54.2 |
| | 54.7 |
| | 56.9 |
|
| Restructuring charges, net | 16.7 |
| | 12.4 |
| | 11.3 |
|
| Stock-based compensation | 15.7 |
| | 8.3 |
| | 3.8 |
|
| LIFO reserve increase (decrease) | 7.1 |
| | 3.6 |
| | (7.3 | ) |
| Non-restructuring asset impairment charges | 8.4 |
| | 7.7 |
| | 2.6 |
|
| Non-restructuring severance charges | 3.5 |
| | 3.1 |
| | 3.3 |
|
| Non-restructuring pension charges | 2.2 |
| | 2.4 |
| | — |
|
| Acquisition and integration expenses | 36.5 |
| | 25.9 |
| | 34.9 |
|
| Fair value adjustment on Tax Receivable Agreement contingent liability | (9.4 | ) | | 4.9 |
| | 1.9 |
|
| Fair value adjustment on contingent consideration liability | 2.0 |
| | — |
| | — |
|
| Escheat audit contingent liability | 7.5 |
| | — |
| | — |
|
| Other | 2.7 |
| | 0.9 |
| | 2.7 |
|
| Adjustment for Corporate & Other | 184.3 |
| | 176.4 |
| | 186.0 |
|
| Adjusted EBITDA for reportable segments | $ | 360.7 |
| | $ | 368.6 |
| | $ | 368.0 |
|
The table below summarizes total assets as of December 31, 20142017 and December 31, 2013:2016: | | | (in millions) | December 31, 2014 | | December 31, 2013 | December 31, 2017 | | December 31, 2016 |
| Packaging | | $ | 1,192.2 |
| | $ | 875.9 |
|
| Facility Solutions | | 416.9 |
| | 397.9 |
|
| Print | $ | 949.1 |
| | $ | 517.4 |
| 801.8 |
| | 874.1 |
|
| Publishing | 207.6 |
| | 79.8 |
| 168.6 |
| | 170.0 |
|
| Packaging | 797.6 |
| | 398.7 |
| |
| Facility Solutions | 381.3 |
| | 201.7 |
| |
| Corporate & Other | 238.9 |
| | 59.3 |
| 128.9 |
| | 165.8 |
|
| Total assets | $ | 2,574.5 |
| | $ | 1,256.9 |
| $ | 2,708.4 |
| | $ | 2,483.7 |
|
Prior to the Merger, the Company's operations and identifiable assets were primarily located in the U.S. After the Merger, the Company's operations and identifiable assets are primarily located in the U.S. and Canada. The following table presents net sales and property and equipment, net by geographic area.
|
| | | | | | | | | | | | | | | | | | | |
| | Net Sales(1) | | Property and Equipment, Net |
| | Year Ended December 31, | | December 31, 2014 | | December 31, 2013 |
| (in millions) | 2014 | | 2013 | | 2012 | | |
| U.S. | $ | 6,848.9 |
| | $ | 5,508.5 |
| | $ | 5,830.9 |
| | $ | 355.0 |
| | $ | 106.1 |
|
| Canada | 408.2 |
| | 25.2 |
| | 32.6 |
| | 18.7 |
| | — |
|
| Rest of world | 149.4 |
| | 118.7 |
| | 148.5 |
| | 3.7 |
| | 1.0 |
|
| Total | $ | 7,406.5 |
| | $ | 5,652.4 |
| | $ | 6,012.0 |
| | $ | 377.4 |
| | $ | 107.1 |
|
(1) Net sales are attributed based on the location of the purchaser/destination. |
| | | | | | | | | | | | | | | | | | | |
| | Net Sales | | Property and Equipment, Net |
| | Year Ended December 31, | | December 31, 2017 | | December 31, 2016 |
| (in millions) | 2017 | | 2016 | | 2015 | | |
| U.S. | $ | 7,510.9 |
| | $ | 7,552.3 |
| | $ | 7,961.3 |
| | $ | 300.6 |
| | $ | 333.8 |
|
| Canada | 682.0 |
| | 631.2 |
| | 628.9 |
| | 36.7 |
| | 35.0 |
|
| Rest of world | 171.8 |
| | 143.1 |
| | 127.5 |
| | 2.9 |
| | 3.0 |
|
| Total | $ | 8,364.7 |
| | $ | 8,326.6 |
| | $ | 8,717.7 |
| | $ | 340.2 |
| | $ | 371.8 |
|
No single customer accounted for more than 5% of net sales for the years ended December 31, 2014, 20132017, 2016 and 2012.2015. During the year ended December 31, 2017, approximately 38% of our purchases were made from ten suppliers.
18. QUARTERLY DATA (UNAUDITED)
The unaudited quarterly results of operations for 20142017 and 20132016 are summarized below:
|
| | | | | | | | | | | | | | | |
| | 2014 |
| (in millions, except share and per share data) | Three Months Ended |
| | March 31 | | June 30 | | September 30(2) | | December 31(3) |
| Net sales | $ | 1,307.4 |
| | $ | 1,329.0 |
| | $ | 2,390.3 |
| | $ | 2,379.8 |
|
| Cost of products sold | 1,088.5 |
| | 1,116.7 |
| | 1,987.1 |
| | 1,988.6 |
|
| Income (loss) from continuing operations | 5.6 |
| | 2.9 |
| | (14.0 | ) | | (14.0 | ) |
| Loss from discontinued operations, net of income taxes | (0.1 | ) | | — |
| | — |
| | — |
|
| Net income (loss) | 5.5 |
| | 2.9 |
| | (14.0 | ) | | (14.0 | ) |
| | | | | | | | |
| Weighted-average number of shares outstanding – basic and diluted | 8,160,000 | | 8,160,000 | | 16,000,000 | | 16,000,000 |
Earnings (loss) per share (1): | | | | | | | |
| Basic and diluted | | | | | | | |
| Continuing operations | $ | 0.69 |
| | $ | 0.36 |
| | $ | (0.88 | ) | | $ | (0.88 | ) |
| Discontinued operations | (0.01 | ) | | — |
| | — |
| | — |
|
| Basic and diluted earnings (loss) per share | $ | 0.68 |
| | $ | 0.36 |
| | $ | (0.88 | ) | | $ | (0.88 | ) |
| | | | | | | | |
| | 2013 |
| | Three Months Ended |
| | March 31(4) | | June 30(5) | | September 30(6) | | December 31(7) |
| Net sales | $ | 1,388.4 |
| | $ | 1,402.9 |
| | $ | 1,442.8 |
| | $ | 1,418.3 |
|
| Cost of products sold | 1,159.3 |
| | 1,172.1 |
| | 1,214.1 |
| | 1,191.3 |
|
| Income (loss) from continuing operations | (0.9 | ) | | (2.3 | ) | | 5.2 |
| | (2.0 | ) |
| Income (loss) from discontinued operations, net of income taxes | 0.2 |
| | (0.1 | ) | | (0.1 | ) | | 0.2 |
|
| Net income (loss) | (0.7 | ) | | (2.4 | ) | | 5.1 |
| | (1.8 | ) |
| | | | | | | | |
| Weighted-average number of shares outstanding – basic and diluted | 8,160,000 | | 8,160,000 | | 8,160,000 | | 8,160,000 |
Earnings (loss) per share (1): | | | | | | | |
| Basic and diluted | | | | | | | |
| Continuing operations | $ | (0.11 | ) | | $ | (0.28 | ) | | $ | 0.64 |
| | $ | (0.25 | ) |
| Discontinued operations | 0.02 |
| | (0.01 | ) | | (0.01 | ) | | 0.02 |
|
| Basic and diluted earnings (loss) per share | $ | (0.09 | ) | | $ | (0.29 | ) | | $ | 0.63 |
| | $ | (0.23 | ) |
|
| | | | | | | | | | | | | | | |
| | 2017 |
| | Three Months Ended |
| (in millions, except per share data) | March 31 | | June 30 | | September 30 | | December 31 |
| Net sales | $ | 1,994.6 |
| | $ | 2,028.9 |
| | $ | 2,116.8 |
| | $ | 2,224.4 |
|
| Cost of products sold | 1,629.3 |
| | 1,660.5 |
| | 1,736.6 |
| | 1,820.2 |
|
| Net income (loss) | (2.2 | ) | | (9.1 | ) | | (14.3 | ) | | 12.3 |
|
| | | | | | | | |
| Weighted-average number of shares outstanding – basic | 15.69 | | 15.70 | | 15.70 | | 15.70 |
| Weighted-average number of shares outstanding – diluted | 15.69 | | 15.70 | | 15.70 | | 15.98 |
| | | | | | | | |
Earnings (loss) per share (1): | | | | | | | |
| Basic earnings (loss) per share | $ | (0.14 | ) | | $ | (0.58 | ) | | $ | (0.91 | ) | | $ | 0.78 |
|
| | | | | | | | |
| Diluted earnings (loss) per share | (0.14 | ) | | (0.58 | ) | | (0.91 | ) | | 0.77 |
|
(1) See Note 13, Earning (Loss) Per Share, for discussion about the shares of common stock utilized in the computation of basic and diluted earnings per share for the year ended December 31, 2017. |
| | | | | | | | |
| | 2016 |
| | Three Months Ended |
| (in millions, except per share data) | March 31 | | June 30 | | September 30 | | December 31 |
| Net sales | $ | 2,019.8 |
| | $ | 2,060.8 |
| | $ | 2,126.6 |
| | $ | 2,119.4 |
|
| Cost of products sold | 1,654.5 |
| | 1,687.9 |
| | 1,743.8 |
| | 1,740.2 |
|
| Net income | 3.3 |
| | 7.9 |
| | 5.6 |
| | 4.2 |
|
| | | | | | | | |
| Weighted-average number of shares outstanding – basic | 16.00 | | 16.00 | | 16.00 | | 15.87 |
| Weighted-average number of shares outstanding – diluted | 16.00 | | 16.00 | | 16.27 | | 16.21 |
| | | | | | | | |
Earnings per share (1): | | | | | | | |
| Basic earnings per share | $ | 0.21 |
| | $ | 0.49 |
| | $ | 0.35 |
| | $ | 0.26 |
|
| Diluted earnings per share | 0.21 |
| | 0.49 |
| | 0.34 |
| | 0.26 |
|
(1) See Note 1213, Earnings (Loss) Per Share of the Notes to the Consolidated and Combined Financial Statements, for discussion onabout the shares of common stock utilized in the computation of basic and diluted earnings per share.share for the year ended December 31, 2016. (2) Includes $54.8 million
See the Mergertable below for the quarterly breakdown of Unisource and to integrate the combined businesses of xpedx and Unisource.
(3) Includes $18.2 million of mergeracquisition and integration expenses and
$5.1 million of restructuring charges,
related to Veritiv's restructuring program of its North American operations.net:(4) Includes $7.1 million of restructuring charges related to xpedx's restructuring plan. |
| | | | | | | | | | | | | | | |
| | 2017 |
| (in millions) | Three Months Ended |
| | March 31 | | June 30 | | September 30 | | December 31 |
| Acquisition and integration expenses | $ | 6.4 |
| | $ | 7.5 |
| | $ | 14.2 |
| | $ | 8.4 |
|
| Restructuring charges, net | 4.1 |
| | 23.2 |
| | 2.7 |
| | (13.3 | ) |
| | | | | | | | |
| | 2016 |
| (in millions) | Three Months Ended |
| | March 31 | | June 30 | | September 30 | | December 31 |
| Acquisition and integration expenses | $ | 6.2 |
| | $ | 6.1 |
| | $ | 7.3 |
| | $ | 6.3 |
|
| Restructuring charges, net | 1.7 |
| | (0.3 | ) | | 5.8 |
| | 5.2 |
|
(5) Includes $17.3 million of restructuring charges related to xpedx's restructuring plan.
(6) Includes $6.0 million of restructuring charges related to xpedx's restructuring plan.
(7) Includes $7.5 million of restructuring charges related to xpedx's restructuring plan.
ITEM 9. CHANGES IN AND DISAGREEMENTS WITH ACCOUNTANTS ON ACCOUNTING AND FINANCIAL DISCLOSURE
Not applicable.None.
ITEM 9A. CONTROLS AND PROCEDURES
Evaluation of Disclosure Controls and Procedures
OurThe Company maintains a set of disclosure controls and procedures, as defined in Rules 13a-15(e) and 15d-15(e) of the Securities Exchange Act, of 1934, as amended (the “Exchange Act”), designed to ensure that information required to be disclosed by the Company in reports that it files or submits under the Exchange Act is recorded, processed, summarized or reported within the time periods specified in SEC rules and forms. The Company’s management, with the participation of the Chief Executive Officer and Chief Financial Officer, of the Company, havehas evaluated the effectiveness of the Company’s disclosure controls and procedures as of December 31, 2017. Based on that evaluation, the Company’s Chief Executive Officer and Chief Financial Officer concluded that the Company’s disclosure controls and procedures were effective as of December 31, 2017.
Management necessarily applies its judgment in assessing the costs and benefits of such controls and procedures, which, by their nature, can provide only reasonable assurance regarding management's control objectives. The Company's management, including the Chief Executive Officer and the Chief Financial Officer, does not expect that our disclosure controls and procedures (as defined in Rules 13a-15(e) and 15d-15(e) under the Exchange Act) as of the end of the period covered by this report. Any controls and procedures,can prevent all possible errors or fraud. A control system, no matter how well designedconceived and operated, can provide only reasonable, assurance, not absolute, assurance that misstatements due to error or fraud will not occur or that all control issues and instances of achievingfraud, if any, within the desired control objectives. Based on such evaluation, such officersCompany have concluded that, asbeen detected. Judgments in decision-making can be faulty and breakdowns can occur because of simple errors or mistakes. Additionally, controls can be circumvented by the endindividual acts of one or more persons. The design of any system of controls is based in part upon certain assumptions about the period covered by this report, the Company’slikelihood of future events, and while our disclosure controls and procedures are designed to be effective at the reasonableunder circumstances where they should reasonably be expected to operate effectively, there can be no assurance level.
Management's Annual Report on Internal Control Over Financial Reporting
This annual report does not include a report of management's assessment regarding internal control over financial reporting or an attestation reportthat any design will succeed in achieving its stated goals under all potential future conditions. Because of the Company's registered public accounting firminherent limitations in any control system, misstatements due to a transition period established by rules of the SEC for newly public companies.possible errors or fraud may occur and not be detected.
Changes in Internal Control Over Financial Reporting
There have been no changes in our internal control over financial reporting during the fourth quarter of 20142017 that have materially affected or are reasonably likely to materially affect the Company’s internal control over financial reporting.
Management’s Annual Report On July 1, 2014, we completed our merger with Unisource. We are currently integrating policies, processes, people, technology and operationsInternal Control Over Financial Reporting
Management’s Responsibility for the combined company. Financial Statements
The management of Veritiv Corporation is responsible for the preparation and integrity of the Consolidated Financial Statements appearing in our Annual Report on Form 10-K. The financial statements were prepared in conformity with U.S. GAAP appropriate in the circumstances and, accordingly, include certain amounts based on our best judgments and estimates. Financial information in this Annual Report on Form 10-K is consistent with that in the financial statements.
Internal Control Over Financial Reporting
Management will continueof our company is responsible for establishing and maintaining adequate internal control over financial reporting as such term is defined in Rule 13a-15(f) and 15(d)-15(f) under the Exchange Act. Our internal control over financial reporting is designed to evaluateprovide reasonable assurance regarding the reliability of financial reporting and the preparation of the Consolidated Financial Statements. Our internal control over financial reporting is supported by a program of internal audits and appropriate reviews by management, written policies and guidelines, careful selection and training of qualified personnel and a written code of conduct adopted by our Board of Directors that is applicable to all officers and employees of our Company and subsidiaries, as well as a code of conduct that is applicable to all of our directors.
Because of its inherent limitations, internal control over financial reporting may not prevent or detect misstatements and even when determined to be effective, can only provide reasonable assurance with respect to financial statement preparation
and presentation. Also, projections of any evaluation of effectiveness to future periods are subject to the risk that controls may become inadequate because of changes in conditions, or that the degree of compliance with the policies or procedures may deteriorate.
Management, including the Chief Executive Officer and the Chief Financial Officer, assessed the effectiveness of our internal control over financial reporting as of December 31, 2017. The scope of management’s assessment of the effectiveness of internal control over financial reporting includes all of the Company’s businesses except for the various All American Containers entities (collectively, “AAC”) which were acquired on August 31, 2017. The financial statements of AAC constitute 6.8% of total assets and 0.9% of revenues of the consolidated financial statement amounts as of and for the year ended December 31, 2017. Further discussion of this acquisition can be found in Note 2 of the Notes to Consolidated Financial Statements. This exclusion is in accordance with SEC staff interpretive guidance that a recently acquired business may be omitted from the scope of the assessment in the year of acquisition. In making this assessment on the effectiveness of our internal control over financial reporting as of December 31, 2017, management used the criteria set forth by the Committee of Sponsoring Organizations of the Treadway Commission (COSO) in Internal Control — Integrated Framework (2013 Framework). Based on our assessment, management has concluded that internal controls over financial reporting were effective as of December 31, 2017.
Our independent auditors, Deloitte & Touche LLP, an independent registered public accounting firm, are appointed by the Audit and Finance Committee of our Board of Directors. Deloitte & Touche LLP has audited and reported on the Consolidated Financial Statements of Veritiv Corporation, and has issued an attestation report on the effectiveness of our internal control over financial reporting. The report of the independent registered public accounting firm is contained in this Annual Report.
Audit and Finance Committee Responsibility
The Audit and Finance Committee of our Board of Directors, composed solely of directors who are independent in accordance with the requirements of the New York Stock Exchange listing standards, the Exchange Act and our Corporate Governance Guidelines, meets with the independent auditors, management and internal auditors periodically to discuss internal control over financial reporting and auditing and financial reporting matters. The Audit and Finance Committee reviews with the independent auditors the scope and results of the audit effort. The Audit and Finance Committee also meets periodically with the independent auditors and the chief internal auditor without management present to ensure that the independent auditors and the chief internal auditor have free access to the Audit and Finance Committee. Our Audit and Finance Committee’s Report can be found in the Proxy Statement for the Annual Meeting of Stockholders to be held on April 25, 2018, which will be filed on or about March 2, 2018.
REPORT OF INDEPENDENT REGISTERED PUBLIC ACCOUNTING FIRM
To the Shareholders and Board of Directors of Veritiv Corporation
Opinion on Internal Control over Financial Reporting
We have audited the internal control over financial reporting of Veritiv Corporation and subsidiaries (the "Company") as of December 31, 2017, based on criteria established in Internal Control — Integrated Framework (2013) issued by the Committee of Sponsoring Organizations of the Treadway Commission (COSO). In our opinion, the Company maintained, in all material respects, effective internal control over financial reporting as of December 31, 2017, based on criteria established in Internal Control —Integrated Framework (2013) issued by COSO.
We have also audited, in accordance with the standards of the Public Company Accounting Oversight Board (United States) (PCAOB), the consolidated financial statements as of and for the year ended December 31, 2017, of the Company and our report dated March 1, 2018 expressed an unqualified opinion on those financial statements.
As described in Management’s Annual Report on Internal Control over Financial Reporting, management excluded from its assessment the internal control over financial reporting at the All American Containers entities (collectively referred to as "AAC"), which were acquired on August 31, 2017 and whose financial statements constitute 6.8% of total assets and 0.9% of
revenues of the consolidated financial statement amounts as of and for the year ended December 31, 2017. Accordingly, our audit did not include the internal control over financial reporting at AAC.
Basis for Opinion
The Company’s management is responsible for maintaining effective internal control over financial reporting and for its assessment of the effectiveness of internal control over financial reporting, included in the accompanying Management’s Annual Report on Internal Control over Financial Reporting. Our responsibility is to express an opinion on the Company’s internal control over financial reporting based on our audit. We are a public accounting firm registered with the PCAOB and are required to be independent with respect to the Company in accordance with the U.S. federal securities laws and the applicable rules and regulations of the Securities and Exchange Commission and the PCAOB.
We conducted our audit in accordance with the standards of the PCAOB. Those standards require that we execute integration activities.plan and perform the audit to obtain reasonable assurance about whether effective internal control over financial reporting was maintained in all material respects. Our audit included obtaining an understanding of internal control over financial reporting, assessing the risk that a material weakness exists, testing and evaluating the design and operating effectiveness of internal control based on the assessed risk, and performing such other procedures as we considered necessary in the circumstances. We believe that our audit provides a reasonable basis for our opinion.
Definition and Limitations of Internal Control over Financial Reporting
A company’s internal control over financial reporting is a process designed to provide reasonable assurance regarding the reliability of financial reporting and the preparation of financial statements for external purposes in accordance with generally accepted accounting principles. A company’s internal control over financial reporting includes those policies and procedures that (1) pertain to the maintenance of records that, in reasonable detail, accurately and fairly reflect the transactions and dispositions of the assets of the company; (2) provide reasonable assurance that transactions are recorded as necessary to permit preparation of financial statements in accordance with generally accepted accounting principles, and that receipts and expenditures of the company are being made only in accordance with authorizations of management and directors of the company; and (3) provide reasonable assurance regarding prevention or timely detection of unauthorized acquisition, use, or disposition of the company’s assets that could have a material effect on the financial statements.
Because of its inherent limitations, internal control over financial reporting may not prevent or detect misstatements. Also, projections of any evaluation of effectiveness to future periods are subject to the risk that controls may become inadequate because of changes in conditions, or that the degree of compliance with the policies or procedures may deteriorate.
/s/ Deloitte & Touche LLP
Atlanta, Georgia
March 1, 2018
ITEM 9B. OTHER INFORMATION
Not applicable.
PART III
ITEM 10. DIRECTORS, EXECUTIVE OFFICERS AND CORPORATE GOVERNANCE
(a) Directors of the Company.
This information is incorporated by reference to the Company’s Proxy Statement for the 20152018 Annual Meeting of Shareholders to be filed subsequent to the filing of this report under the heading "Proposal 1 – Election of Directors".Directors."
(b) Executive Officers of the Company.
This information can be found under "Executive Officers of the Company" in Part I, Item 1 of this report.
(c) Audit Committee Financial Experts.
This information is incorporated by reference to the Company’s Proxy Statement for the 20152018 Annual Meeting of Shareholders to be filed subsequent to the filing of this report under the heading "Corporate Governance—Board Committees".Committees."
(d) Identification and Composition of the Audit and Finance Committee.
This information is incorporated by reference to the Company’s Proxy Statement for the 20152018 Annual Meeting of Shareholders to be filed subsequent to the filing of this report under the heading "Corporate Governance—Board Committees".Committees."
(e) Compliance with Section 16(a) of the Exchange Act.
This information is incorporated by reference to the Company’s Proxy Statement for the 20152018 Annual Meeting of Shareholders to be filed subsequent to the filing of this report under the heading "Security Ownership of Certain Beneficial Owners and Management—Section 16(a) Beneficial Ownership Reporting Compliance".Compliance."
(f) Code of Ethics.
This information is incorporated by reference to the Company’s Proxy Statement for the 20152018 Annual Meeting of Shareholders to be filed subsequent to the filing of this report under the heading "Corporate Governance—Corporate Governance Principles".Principles."
ITEM 11. EXECUTIVE COMPENSATION
This information is incorporated by reference to the Company’s Proxy Statement for the 20152018 Annual Meeting of Shareholders to be filed subsequent to the filing of this report under the headings "Executive Compensation" and "Corporate Governance—Director Compensation".Compensation."
ITEM 12. SECURITY OWNERSHIP OF CERTAIN BENEFICIAL OWNERS AND MANAGEMENT AND RELATED STOCKHOLDER MATTERS
This information is incorporated by reference to the Company’s Proxy Statement for the 20152018 Annual Meeting of Shareholders to be filed subsequent to the filing of this report under the headings "Security Ownership of Certain Beneficial Owners and Management" and "Executive Compensation—Equity Compensation Plans."
ITEM 13. CERTAIN RELATIONSHIPS AND RELATED TRANSACTIONS, AND DIRECTOR INDEPENDENCE
This information is incorporated by reference to the Company’s Proxy Statement for the 20152018 Annual Meeting of Shareholders to be filed subsequent to the filing of this report under the headings "Corporate Governance—Related Person Transaction Policy" and "Corporate Governance—Director Independence".Independence."
ITEM 14. PRINCIPAL ACCOUNTANT FEES AND SERVICES
This information is incorporated by reference to the Company’s Proxy Statement for the 20152018 Annual Meeting of Shareholders to be filed subsequent to the filing of this report under the heading "Principal Accountant Fees and Services".Services."
PART IV
ITEM 15. EXHIBITS AND FINANCIAL STATEMENT SCHEDULES
(a) The following documents are filed or incorporated by reference as part of this Form 10-K:
1. Financial Statements:
See Item 8. Financial Statements and Supplementary Data.
2. Financial Statement Schedules:
All schedules have been omitted as the required information is included in the footnotes or not applicable.
3. Exhibits:
See Exhibit Index of this Form 10-K, which is incorporated herein by reference.
SIGNATURES
Pursuant to the requirements of Section 13 or 15(d) of the Securities Exchange Act of 1934, the registrant has duly caused this Annual Report on Form 10-K to be signed on its behalf by the undersigned, thereunto duly authorized, on March 24, 2015.
|
| | | |
| | VERITIV CORPORATION |
| | (Registrant) |
| | | |
| | By: | /s/ Mary A. Laschinger |
| | | Name: Mary A. Laschinger |
| | | Title: Chairman and Chief Executive Officer |
Pursuant to the requirements of the Securities Exchange Act of 1934, this report has been signed by the following persons on behalf of the registrant and in the capacities indicated on March 24, 2015.
|
| | |
(i) | Principal executive officer: | |
| /s/ Mary A. Laschinger | Chairman of the Board of Directors and Chief Executive Officer |
| Mary A. Laschinger | |
| | |
(ii) | Principal financial officer: | |
| /s/ Stephen J. Smith | Senior Vice President and Chief Financial Officer |
| Stephen J. Smith | |
| | |
(iii) | Principal accounting officer: | |
| /s/ W. Forrest Bell | Chief Accounting Officer |
| W. Forrest Bell | |
| | |
(iv) | The Directors: | |
| /s/ Allan R. Dragone, Jr. | Director |
| Allan R. Dragone, Jr. | |
| | |
| /s/ Daniel T. Henry | Director |
| Daniel T. Henry | |
| | |
| /s/ Tracy A. Leinbach | Director |
| Tracy A. Leinbach | |
| | |
| /s/ Seth A. Meisel | Director |
| Seth A. Meisel | |
| | |
| /s/ William E. Mitchell | Director |
| William E. Mitchell | |
| | |
| /s/ Michael P. Muldowney | Director |
| Michael P. Muldowney | |
| | |
| /s/ Charles G. Ward, III | Director |
| Charles G. Ward, III | |
| | |
| /s/ John J. Zillmer | Director |
| John J. Zillmer | |
EXHIBIT INDEX
|
| | |
| Exhibit No. | | Description |
| 2.1 | | Agreement and Plan of Merger, dated as of January 28, 2014, by and among International Paper Company, Veritiv Corporation (f/k/a/ xpedx Holding Company), xpedx Intermediate, LLC, xpedx, LLC, UWW Holdings, LLC, UWW Holdings, Inc. and Unisource Worldwide, Inc., incorporated by reference from Exhibit 2.1 to the Registrant’s Registration Statement on Form S-1 (File No. 333-193950) filed on April 4, 2014. |
| | | |
| 2.2 | | Amendment No. 1 to the Agreement and Plan of Merger, dated as of May 28, 2014, by and among International Paper Company, Veritiv Corporation (f/k/a xpedx Holding Company), xpedx Intermediate, LLC, xpedx, LLC, UWW Holdings, LLC, UWW Holdings, Inc. and Unisource Worldwide, Inc., incorporated by reference from Exhibit 2.2 to the Registrant’s Registration Statement on Form S-1 (File No. 333-193950) filed on June 5, 2014. |
| | | |
| 2.3 | | Amendment No. 2 to the Agreement and Plan of Merger, dated as of June 4, 2014, by and among International Paper Company, Veritiv Corporation (f/k/a) xpedx Holding Company), xpedx Intermediate, LLC, xpedx, LLC, UWW Holdings, LLC, UWW Holdings, Inc. and Unisource Worldwide, Inc., incorporated by reference from Exhibit 2.3 to the Registrant’s Registration Statement on Form S-1 (File No. 333-193950) filed on June 5, 2014. |
| | | |
| 2.4 | | |
| | | |
| 2.5 | | |
| | | |
| 3.1 | | |
| | | |
| 3.2 | | |
| | |
| 3.3 | | |
| | | |
| 10.1 | | Credit Agreement, dated as of July 1, 2014, among Veritiv Corporation, xpedx Intermediate, LLC and xpedx, LLC, as borrowers, the several lenders and financial institutions from time to time parties thereto, Bank of America, N.A., as administrative agent and collateral agent for the lenders party thereto, and the other parties thereto, together with the ABL Joinder Agreement, dated as of July 1, 2014, made by Unisource Worldwide, Inc. and Unisource Canada, Inc. for the benefit of the Lenders under the Credit Agreement, incorporated by reference from Exhibit 10.1 to the Registrant's Current Report on Form 8-K filed on July 3, 2014. |
| | |
|
| | |
| Exhibit No. | | Description |
| 10.2 | | First Amendment to ABL Credit Agreement, dated as of August 11, 2016, among Veritiv Operating Company (f/k/a Unisource Worldwide, Inc.) and Unisource Canada, Inc., as borrowers, Veritiv Corporation and certain subsidiaries of Veritiv Operating Company, as loan parties, the several lenders and financial institutions from time to time parties thereto, Bank of America, N.A., as administrative agent and collateral agent for the lenders party thereto, and the other parties thereto, incorporated by reference from Exhibit 10.1 to the Registrant’s Current Report on Form 8-K filed on August 15, 2016. |
| | | |
10.210.3 | | U.S. Guarantee and Collateral Agreement, dated as of July 1, 2014, made by xpedx Intermediate, LLC, xpedx, LLC, the Subsidiary Borrowers and the U.S. Guarantors parties thereto and Veritiv Corporation, in favor of Bank of America, N.A., as administrative agent and collateral agent for the Secured Parties (as defined therein), together with the Assumption and Supplemental Agreement, dated as of July 1, 2014, made by Veritiv Corporation, Alco Realty, Inc., Graph Comm Holdings International, Inc., Graphic Communications Holdings, Inc., Paper Corporation of North America, Unisource International Holdings, Inc., Unisource International Holdings Poland, Inc., and Unisource Worldwide, Inc., in favor of Bank of America, N.A., as collateral agent and as administrative agent, incorporated by reference from Exhibit 10.2 to the Registrant's Current Report on Form 8-K filed on July 3, 2014. |
| | | |
10.310.4 | | |
| | | |
10.410.5 | | |
| | | |
10.510.6 | | |
| | |
|
| | |
Exhibit No. | | Description |
10.6 | | Transition Services Agreement, dated as of July 1, 2014, by and between International Paper Company and Veritiv Corporation, incorporated by reference from Exhibit 10.6 to the Registrant's Current Report on Form 8-K filed on July 3, 2014. |
| | | |
| 10.7 | | Employee Matters Agreement, dated as of January 28, 2014, by and between International Paper Company, Veritiv Corporation (f/k/a/ xpedx Holding Company) and UWW Holdings, Inc., incorporated by reference from Exhibit 10.2 to the Registrant’s Registration Statement on Form S-1 (File No. 333-193950) filed on February 14, 2014. |
| | |
10.8 | | Amendment to Employee Matters Agreement, dated as of June 2, 2014, by and between International Paper Company, Veritiv Corporation (f/k/a xpedx Holding Company) and UWW Holdings, Inc. , incorporated by reference from Exhibit 10.14 to the Registrant’s Registration Statement on Form S-1 (File No. 333-193950) filed on June 5, 2014. |
| | |
10.9 | | |
| | | |
10.1010.8† | | Separation Agreement, dated as of June 30, 2014, between UWW Holdings, Inc. and Allan R. Dragone, incorporated by reference from Exhibit 10.7 to the Registrant's Current Report on Form 8-K filed on July 3, 2014. |
| | |
10.11† | | |
| | | |
10.12†10.9† | | |
| | | |
10.13†10.10†* | | |
| | |
| 10.11†* | | |
| | |
| 10.12† | | |
| | |
| 10.13† | | |
| | | |
| 10.14† | | Veritiv Corporation 2014 Omnibus Incentive Plan, incorporated by reference from Exhibit 10.8 to the Registrant's Current Report on Form 8-K filed on July 3, 2014. |
| | |
10.15† | | |
| | | |
10.16†10.15† | | |
| | | |
10.17†10.16† | | |
| | | |
10.18† |
| | |
| Exhibit No. | | Description |
| 10.17† | | |
| | | |
10.19†10.18† | | |
| | | |
10.20†10.19† | | |
| | |
| 10.20† | | |
| | | |
10.21†* | | |
| | | |
10.22†* | | |
| | | |
10.23†* | | |
| | | |
10.24†* | | |
| | | |
10.25†* | | |
| | | |
10.26†* | | |
|
| | |
Exhibit No. | | Description |
| | | |
| 21.1* | | |
| | | |
| 23.1* | | |
| | | |
| 31.1* | | |
| | | |
| 31.2* | | |
| | | |
| 32.1* | | |
| | | |
| 32.2* | | |
| | | |
| 101.INS* | | XBRL Instance Document. |
| | | |
| 101.SCH* | | XBRL Taxonomy Extension Schema Document. |
| | | |
| 101.CAL* | | XBRL Taxonomy Extension Calculation Linkbase Document. |
| | | |
| 101.DEF* | | XBRL Taxonomy Extension Definition Linkbase Document. |
| | | |
| 101.LAB* | | XBRL Taxonomy Extension Label Linkbase Document. |
| | | |
| 101.PRE* | | XBRL Taxonomy Extension Presentation Linkbase Document. |
| | | |
| † Management contract or compensatory plans or arrangements |
| * Filed herewith |
ITEM 16. FORM 10-K SUMMARY
None.
SIGNATURES
Pursuant to the requirements of Section 13 or 15(d) of the Securities Exchange Act of 1934, the registrant has duly caused this Annual Report on Form 10-K to be signed on its behalf by the undersigned, thereunto duly authorized, on March 1, 2018.
|
| | | |
| | VERITIV CORPORATION |
| | (Registrant) |
| | | |
| | By: | /s/ Mary A. Laschinger |
| | | Name: Mary A. Laschinger |
| | | Title: Chairman and Chief Executive Officer |
Pursuant to the requirements of the Securities Exchange Act of 1934, this report has been signed by the following persons on behalf of the registrant and in the capacities indicated on March 1, 2018.
|
| | |
| (i) | Principal executive officer: | |
| /s/ Mary A. Laschinger | Chairman of the Board of Directors and Chief Executive Officer |
| Mary A. Laschinger | |
| | |
| (ii) | Principal financial officer: | |
| /s/ Stephen J. Smith | Senior Vice President and Chief Financial Officer |
| Stephen J. Smith | |
| | |
| (iii) | Principal accounting officer: | |
| /s/ W. Forrest Bell | Chief Accounting Officer |
| W. Forrest Bell | |
| | |
| (iv) | Directors: | |
| | |
| /s/ David E. Flitman | Director |
| David E. Flitman | |
| | |
| /s/ Daniel T. Henry | Director |
| Daniel T. Henry | |
| | |
| /s/ Liza K. Landsman | Director |
| Liza K. Landsman | |
| | |
| /s/ Tracy A. Leinbach | Director |
| Tracy A. Leinbach | |
| | |
| | |
| /s/ William E. Mitchell | Director |
| William E. Mitchell | |
| | |
| /s/ Michael P. Muldowney | Director |
| Michael P. Muldowney | |
| | |
| /s/ Charles G. Ward, III | Director |
| Charles G. Ward, III | |
| | |
| /s/ John J. Zillmer | Director |
| John J. Zillmer | |