FORM 10–K/A This Amendment No. 1 on Form 10-K/A (the “Amendment”) amends our annual report Except as set forth above, we have not modified or updated disclosures presented in the Original Filing to reflect events or developments that have occurred after the date of the Original Filing. Among other things, forward-looking statements made in the Original Filing have not been revised to reflect events, results, or developments that have occurred or facts that have become known to us after the date of the Original Filing (other than as discussed above), and such forward-looking statements should be read in their historical context. Accordingly, this Amendment should be read in conjunction with our Item 10.DIRECTORS, EXECUTIVE OFFICERS AND CORPORATE GOVERNANCE Directors The Board is composed of nine directors. Certain information regarding the members of the Board as of July 20, 2016, is set forth below, including with respect to each director of the Company, the name and age of the director as of July 20, 2016, present position with the Company or principal occupation, and employment history during the past five years. There are no family relationships between any directors or executive officers of the Company. Mr. Robert J. Andersen has served as Executive Vice President and Chief Financial Officer of Tessera Technologies, Inc., a leading developer of semiconductor packaging solutions and advanced imaging products, since January 2014. From June 2011 to July 2013, he served as the Executive Vice President and Chief Financial Officer of G2 Holdings Corp. d/b/a Components Direct, a privately held provider of cloud-based product life cycle solutions that was acquired by Avnet, Inc. in April 2013. From September 2008 to June 2011, Mr. Andersen served as Vice President of Finance and then as Chief Financial Officer at Phoenix Technologies Ltd., a publicly traded developer of core system software and productivity solutions for personal computers. Prior to his time at Phoenix Technologies, Mr. Andersen served in various senior financial roles at Wind River Systems, Inc., a publicly traded embedded systems software company, and NextOffice, Inc., a privately held technology company. Mr. Andersen began his finance career at Hewlett-Packard Company, where he served in various controller, treasury and technology finance management roles. Mr. Andersen has a B.A. in Economics from the University of California, Davis, and an M.B.A. from the Anderson School of Management at the Mr. Paul R. Auvil III has served as Chief Financial Officer of Proofpoint, Inc. since March 2007, leading the Mr. Mr. Dale L. Fuller has served as Chairman of the Supervisory Board of AVG Technologies N.V. (“AVG”), a global leader in mobile security, PC optimization, Internet security, and privacy software, since November 2009. He joined AVG’s Board of Directors in October 2008. Mr. Fuller also has served as Chairman of the Board of Directors of MobiSocial, Inc., a Stanford-based technology startup, since January 2013. Previously, Mr. Fuller served as President and Chief Executive Officer of MokaFive (n/k/a moka5, Inc.), a venture-backed private company, from 2008 to January 2013. Mr. Fuller also previously served on the Board of Directors of Zoran Corporation, a multinational digital technology company, from March 2011 until its merger with CSR plc in August 2011, and as Chairman of the Board of Directors of Webgistix Corporation, a global leader in e-commerce fulfillment, from October 2008 through January 2013. Prior to that, Mr. Fuller served as a director of Phoenix Technologies, Ltd., a BIOS software company, from November 2009 until its sale to Marlin Equity Partners in November 2010. Mr. Fuller also previously served on the Boards of Directors of Guidance Software, Inc., Krugle, Inc., Quest Aircraft Company, LLC and McAfee, Inc. (“McAfee”). In addition, Mr. Fuller served as interim President and CEO of McAfee, from October 2006 through March 2007. Prior to joining McAfee, he was President and CEO of Borland Software Corporation, from 1999 until 2005. Mr. Fuller also founded and served as President and CEO of WhoWhere? Corporation, which was later acquired by Lycos, Inc. As a start-up company CEO, Mr. Fuller led the expansion of several domain sites, including angelfire.com and Mailcity. In addition, he has held various senior executive positions at Apple Computer, NEC, Motorola, and Texas Instruments. Mr. Fuller holds an honorary doctorate from St. Petersburg State University. We believe that Mr. Fuller’s experience in the technology industry both as an executive officer and a director of private and publicly traded technology companies well qualifies him to serve on the Company’s Board. Mr. Jon W. Gacek has served as President and Chief Executive Officer of Quantum Corporation since April 2011 and was also appointed to the Company’s Board of Directors in April 2011. He was President and Chief Operating Officer of Quantum from January 2011 through March Mr. David A. Krall has served as a strategic advisor to Roku, Inc., a leading manufacturer of Mr. Clifford Press has served as Managing Member of Oliver Press Partners, LLC, an investment advisory firm, since March 2005. From 1986 to Mr. David E. Roberson has served as a business consultant to technology companies since 2012. Mr. Roberson served as Senior Vice President within the Enterprise Servers, Storage and Networking Group of HP from May 2007 to May 2011, where he was responsible for building on the company’s foundation as a leading provider of storage solutions and pursuing new opportunities for global growth. Additionally, he was General Manager of HP’s StorageWorks Division from May 2007 to October 2010. Prior to that, Mr. Roberson spent 26 years at Selection Arrangements Each of Messrs. Andersen, DiNardo, Fuller and Press (the “Starboard Nominees”) was initially nominated for election to the Executive Officers Pursuant to Instruction G.3. to Form 10-K, Audit Committee The Company has a separately-designated standing Audit Committee which currently consists of Stockholder Nominations There have been no changes to the Code of Ethics We have adopted a code of ethics that applies to our principal executive officer and all members of our finance department, including the principal financial officer and principal accounting officer. This code of ethics is posted on our website. The Internet address for our website is: http://www.quantum.com, and the code of ethics may be found by clicking “About Us” from the home page and then choosing “Investor Relations” and then “Corporate Governance.” Copies of the code are available free upon request by a stockholder. We intend to satisfy the disclosure requirement under Item 5.05 of Form 8-K regarding an amendment to, or waiver from, a provision of this code of ethics by posting such information on our website, at the address and location specified above. We have adopted Corporate Governance Principles, which are available on our website at http://www.quantum.com, where they may be found by clicking “About Us” from the home page and then choosing “Investor Relations” and then SECTION 16(A) BENEFICIAL OWNERSHIP REPORTING COMPLIANCE Section 16(a) of the Exchange Act requires the Company’s Section 16 officers, directors and persons who own more than ten percent (10%) of a registered class of the Company’s equity securities to file reports of ownership and changes in ownership with the SEC. Such executive officers, directors and greater than ten-percent stockholders are also required by Item 11.EXECUTIVE COMPENSATION Compensation Discussion and Analysis This Compensation Discussion and Analysis (“CD&A”) describes the overall philosophy, material elements and actual compensation provided to the Jon W. Gacek, President and Chief Executive Officer (our “CEO”); Christopher S. Willis, Interim Senior Vice President and Chief Financial Officer (our “CFO”); William C. Britts, Senior Vice President, Worldwide Sales and Marketing; Robert S. Clark, Senior Vice President, Product Operations; Geoffrey G. Stedman, Senior Vice President, StorNext Solutions; and Linda M. Breard, Former Senior Vice President and Chief Financial Officer (our former “CFO”). Effective January 26, 2016, Ms. Breard voluntarily resigned as Senior Vice President and Chief Financial Officer to pursue another opportunity outside of our company. Mr. Willis, Vice President, Financial Planning and Analysis, served as Interim Senior Vice President and Chief Financial Officer for the rest of Fiscal 2016. Effective April 15, 2016, Mr. Fuad Ahmad joined the Company as Senior Vice President and Chief Financial Officer. Mr. Stedman was a newly named executive in Fiscal 2016. Executive Summary – Overview of Fiscal 2016 We are a leading expert in scale-out storage, archive and data protection, providing solutions for capturing, sharing, managing and preserving digital assets over the entire data lifecycle. Our customers, ranging from small businesses to large/multi-national enterprises, trust us to address their most demanding data workflow challenges. Our end-to-end tiered storage solutions enable users to maximize the value of their data by making it accessible whenever and wherever needed, retaining it indefinitely and reducing total cost and complexity. We work closely with a broad network of distributors, value-added resellers (“VARs”), direct marketing resellers (“DMRs”), original equipment manufacturers (“OEMs”) and other suppliers to meet customers’ evolving needs. Business and Financial Highlights for Fiscal 2016 Our goal for Fiscal 2016 is to increase stockholder value by growing our scale-out storage revenue and investing to drive future scale-out growth while also delivering on our operating profit goals. We continued to focus on building our momentum in three main broad categories of scale-out storage: media and entertainment, intelligence and surveillance and technical applications. Outside of scale-out storage, our strategy continued to include leveraging our technology leadership, our extensive customer base and our channel and technology partnerships to generate profits and cash from our offerings. During Fiscal 2016, our data protection revenues were impacted by overall weakness in general storage market. We took a series of actions to reduce our cost structure without impacting our scale-out revenue growth. During the third quarter of Fiscal 2016, we added Xcellis™ workflow storage in our Some of our financial highlights in Fiscal 2016 included: We had total revenue of $476.0 million in Fiscal 2016, a $77.1 million decrease from Fiscal 2015, primarily due to decreased revenue from data protection tape automation systems, disk backup systems, media and service, partially offset by an increase in revenue from scale-out storage solutions. Revenue from branded scale-out storage solutions generally increased in Fiscal 2016 compared to Fiscal 2015 in North America. Our gross margin percentage decreased 120 basis points from Fiscal 2015 to 43.0% primarily due to a combination of lower revenue and a decrease in material margin related to changes in our overall revenue mix. Higher margin service revenue decreased and lower margin products comprised a higher portion of our product revenue. In addition, we are experiencing overall pricing pressure in the storage market, which has resulted in increased discounting. Our operating expenses increased $40.1 million, or 17.4%, from Fiscal 2015 as a result of a $55.6 million goodwill impairment charge. The increase in operating expense was offset by a decrease in compensation and benefits largely attributable to recognition of a profit sharing bonus in Fiscal 2015 which was not repeated in Fiscal 2016, a decrease in commission expense on lower branded revenue and a decrease in intangible amortization expense due to certain intangibles becoming fully amortized during Fiscal 2015. We had a $74.7 million net loss in Fiscal 2016 compared to a $16.8 million net income in Fiscal 2015, which included a gain of $13.6 million resulting from the sale of our investment in a privately held company in Fiscal 2015. We repaid $83.7 million remaining balance of our 3.50% convertible subordinated notes due November 15, 2015 for $85.2 million, which included $1.1 million of accrued interest. We used a combination of $68.9 million of proceeds from our credit agreement with Wells Fargo and $16.3 million of cash to fund the purchases and pay the accrued interest. In connection with the purchases, we recorded a loss on debt extinguishment of $0.4 million comprised of a loss of $0.3 million from the notes purchased and $0.1 million of unamortized debt issuance costs related to the purchased notes. Executive Compensation Highlights for Fiscal 2016 We are committed to responsible and effective executive compensation practices that aim to enhance stockholder value. We seek to balance the need to compensate our executive officers fairly and competitively based on their importance to the growth and success of our business and their individual contributions with our objective of ensuring that their compensation reflects Company performance that rewards for both short-term and long-term financial success. Our executive compensation program aims to (i) enhance stockholder value by designing appropriate leadership and compensation programs to enable the successful execution of the Company’s corporate strategy and objectives, (ii) facilitate competitiveness by attracting and retaining the best talent and (iii) promote meritocracy by recognizing individual contributions. During Fiscal 2016 we took the following actions with respect to the compensation of our named executive officers: We reviewed the salary of our executive officers in comparison to the market and the performance of each executive. As a result of this review, we determined not to increase Mr. Gacek’s or Mr. Britt’s salaries, but provided increases to both Ms. Breard and Mr. Clark of 3%-8% to reflect their individual contributions for the prior fiscal year as well as to better align their base salaries with the market for comparable executive positions. Ms. Breard, our Senior Vice President and Chief Financial Officer voluntarily resigned to pursue an opportunity outside the Company. Mr. Willis served as the Interim Senior Vice President and Chief Financial Officer for the remainder of Fiscal 2016. Effective April 15, 2016, Mr. Fuad Ahmad joined the Company as Senior Vice President and Chief Financial Officer. The Company did not achieve the operating income performance targets that had been established for purposes of funding our annual bonus program, therefore the bonus pool was not funded and no bonuses were allocated in Fiscal 2016. Since Fiscal 2014 and including in Fiscal 2016, the Company moved away from granting only time-based restricted stock units toward a mix of time-based restricted stock units and performance-based restricted stock units for the CEO. The performance-based equity plan was designed to only award shares if the Company met the corporate operating income and exceeded the specified revenue targets, otherwise no shares would be earned if Company’s performance falls short of the defined performance measure. Based on actual Fiscal 2016 results, the performance was not met and Mr. Gacek did not earn any portion of his Fiscal 2016 performance-based awards. Since Fiscal 2015 and including in Fiscal 2016, the Company moved away from granting only time-based restricted stock units toward a mix of time-based restricted stock units and performance-based restricted stock units for our remaining executive officers.40% of the total awards granted to the remaining executive officers were performance-based. Based on actual Fiscal 2016 results, executive officers did not earn any of their performance-based equity awards. In Fiscal 2016, the Company moved from a three-year vesting schedule to four-year vesting schedule for the time-based restricted stock units. The performance stock units remained on the three-year vesting schedule. We continue to maintain responsible compensation practices including having stock ownership guidelines for our CEO, an anti-pledging/anti-hedging policy, no tax gross-ups and no excessive executive perquisites. Executive Compensation Philosophy Pay for Performance Compensation Philosophy and Objectives The Executive compensation program is intended to encourage and reward the executives for significant contributions to the Company’s success and for the creation of stockholder value. To that end, the Company has established and maintains a strong pay-for-performance Executive compensation program. The Committee believes that our executive compensation program should: provide a strong link between pay and performance on both an individual and Company level and encourage and reward executives for significant contributions to the Company’s success; ensure that the interests of all executives are aligned with the success of the Company and the interests of the Company’s stockholders; promote the achievement of the Company’s short-term and long-term strategic objectives; provide compensation opportunities that will attract, motivate and retain the most qualified executive talent to accomplish these objectives; provide executives with a total compensation package that strikes an appropriate balance between fixed and variable pay and between short-term and long-term incentives; take into account relevant economic and market considerations; and ensure that the total compensation levels of executives are externally competitive and internally consistent and fair. Our executive compensation program is designed to offer target cash and equity compensation opportunities at market-competitive levels and to reward superior Company and individual performance with above-market compensation. Company performance, as measured by pre-established corporate performance metrics and share price, together with individual performance, as measured through the Company’s annual performance evaluation process, greatly affect annual and long-term compensation levels. Actual annual executive compensation is expected to be, and will be, below targeted market median levels if the Company and/or the executive officer do not achieve the designated Company and individual performance objectives, as has been the case in recent years, including Fiscal 2016. The Committee believes that this program aligns the interests of our executive officers with those of our stockholders in promoting the creation of long-term stockholder value. Competitive Positioning Market competitiveness is an important element of our executive compensation program. The Committee has established that market competitiveness for this purpose generally means the market median and has determined to generally target the market median with respect to each component of our executive compensation program. In assessing the market competitiveness of our executive compensation program, the individual elements, as well as the aggregate total compensation of each executive officer (which includes base salary, target annual bonus opportunity and annual equity awards), are compared to the corresponding market median for executive officers holding similar positions or who have similar levels of responsibility in technology companies of similar size. Nevertheless, although our compensation philosophy is to generally target the market median for competitiveness purposes, the actual compensation paid to our executive officers may be above or below the competitive market based on individual and Company performance. As its sources of data for identifying and establishing market median compensation levels, the Committee utilizes applicable compensation data from the Company’s Peer Group (as defined and discussed below), as well as from the Radford Global Technology and Radford Global Sales surveys (the “Radford Surveys”) of technology companies with annual revenue between $500M and $999.9M (collectively, the “Market Data”). In the case of our CEO, the Committee utilizes the data from our Peer Group for competitive benchmarking purposes as the Committee believes this data, given the composition of the Peer Group and the fact that each public company is required to disclose the compensation of its CEO, is the best source of competitive CEO compensation. In the case of our other executive officers, for Fiscal 2016, the Committee referenced Peer Group data provided by our independent compensation consultant. The positions of our executive officers for Fiscal 2016 were found to be directly comparable to those found in our Peer Group specific to technology companies that are comparable in size to the Company in terms of revenue. Peer Group The Committee has established a Peer Group of companies that are reasonably comparable to the Company in terms of industry and financial characteristics so as to provide relevant compensation information to support compensation decision making. The Committee reviews the Peer Group on an annual basis. For purposes of Fiscal 2016, the Committee established the following criteria for purposes of conducting its annual review and update of the Peer Group: Technology hardware and equipment companies; Inclusion of some companies with a hardware/software mix or systems/software orientation based on the Company’s strategic business direction; Comparability to the Company in terms of revenue (~0.5x – 2.0x) and market capitalization (~0.5x – 5.0x); and Other factors, including, geography, revenue growth, profitability, valuation, number of employees, and enterprise value. In November 2014, the Committee, with the assistance of the Company’s independent compensation consultant, Compensia, Inc. (“Compensia”), reviewed and updated its compensation Peer Group. Based on the above criteria, Compensia recommended, and the Committee approved, the following group of peer companies for Fiscal 2016 (the “Peer Group”) (with annual revenue and market capitalization shown based on the latest available public filings with the SEC at the time the Peer Group was established): For Fiscal 2016, Fusion-io was removed due to acquisition and was replaced by Cray Inc. whose revenue and market capitalization fell within our established parameters. The Committee concluded that the above Peer Group of 17 companies was sufficient and representative in terms of number and size of companies for competitive executive compensation purposes. In October 2015, the Committee approved additional changes for fiscal year 2017. Two peers (Emulex and Riverbed Technology) have been removed because both companies were acquired in 2015 and two additional peers (Polycom and Super Micro Computer) were removed because their revenue size exceeded that of our established Peer Group parameters. To ensure a large enough number of companies in the Peer Group, the Committee approved five additional peers (Avid Technology, Barracuda Networks, Infinera, Nimble Storage, and Sonus Networks) bringing the Peer Group total for Fiscal 2017 to 18 companies. Avid Technology was formerly in the Peer Group before being removed for Fiscal 2015 due to the potential of delisting. Executive Compensation Process and Decision-Making Role of the Leadership and Compensation Committee and the Board of Directors – The Committee oversees and approves all compensation and benefit arrangements for our executive officers, other than for our CEO. In the case of the compensation of our CEO, the independent members of the Board of Directors, based on the recommendations of the Committee, review and approve his compensation. A substantial portion of the Committee’s work involves an annual review of our executive compensation program, including determining total compensation levels for our executive officers and evaluating Company and individual executive officer performance. The Committee considers a variety of factors when determining our executive compensation program and total compensation levels. These factors include the Company’s financial performance for the most recent fiscal year, the recommendations of our CEO for all executive officers, other than for himself, the input of Compensia, and the results of competitive studies and analyses prepared by Compensia and Company management, the outcome of our annual say-on-pay vote, input we receive from stockholders as well as the individual performance of each executive. Role of Compensation Consultant – During Fiscal 2016, the Committee consulted with Compensia on a range of issues relating to executive compensation and engaged Compensia to review the results of executive compensation studies and analyses conducted by Company management. Compensia serves at the discretion of the Committee and provides services only to the Committee. Compensia regularly meets with the Committee both with and without management present. The Committee regularly reviews its advisers’ independence status against the specific independence factors contained in the rules of the Securities and Exchange Commission and the related New York Stock Exchange corporate governance listing standards and has determined that no relationship or conflict of interest exists that would preclude Compensia from independently advising the Committee. Role of Management – The Committee reviews recommendations made by the CEO on various executive compensation matters, including executive compensation program design, annual corporate performance metrics, bonus funding target levels, and evaluations of corporate and executive officer performance. Other members of the Company’s management team provide the Committee with the Market Data as well as data and information relating to various executive compensation matters. In addition, our CEO makes individual compensation recommendations to the Committee for our executive officers, other than for himself. While the Committee considers all recommendations made by the CEO, ultimate authority for all compensation decisions regarding our executive officers, other than for our CEO, rests with the Committee and, in the case of our CEO, rests with the independent members of the Board of Directors. Certain members of the Company’s executive management team, including our CEO and CFO, attend Committee meetings and participate in the Committee’s discussions and deliberations. However, these individuals are not present when the Committee or the independent members of the Board of Directors discusses and determines their compensation. At each meeting, the Committee also may choose to meet in an executive session without members of management present and may meet without any members of management present at any time. Say on Pay – At the Company’s 2015 Annual Meeting of Stockholders, approximately 97% of the vote cast on the non-binding advisory vote on our executive compensation program supported the compensation of our named executive officers. In light of this voting result, and after careful consideration by the Committee, we made no significant changes to our executive compensation program in Fiscal 2016. Performance Evaluation Process Our executive compensation program is guided by and reflects a “pay-for-performance” philosophy. For Fiscal 2016, we followed our established and formal annual performance review and evaluation process under which the individual performance of our executive officers is reviewed by our CEO with the Committee. Each executive officer is evaluated by our CEO based on demonstrated leadership skills, individual contributions to the success of the Company during the fiscal year and results against any pre-established annual performance objectives. Our CEO then prepares performance evaluations for each of our executive officers detailing their performance for the prior fiscal year. Upon the completion of the evaluation process, typically in June, our CEO meets with the Committee to review and discuss his evaluation of executive officer performance which is then taken into account in connection with compensation decisions with respect to such executives as described further below. Executive Compensation Review and Approval Process As part of the annual performance evaluation process, the Committee evaluates the recommendations of our CEO for our executive officers, including base salary adjustments, bonus awards and equity awards. In making these recommendations, our CEO takes into account the following factors: The median compensation levels from the Market Data for each element of direct compensation (i.e., salary, bonus and equity awards) for each of our executive officers; The annual performance of each executive officer based on our CEO’s assessment of his or her contributions to our overall performance, including the ability of the executive officer to successfully lead his or her functional organization and to work effectively across the entire organization; The scope of each executive officer’s role and the assumption of any additional duties and responsibilities by the executive officer during the fiscal year; Internal compensation equity among our executive officers; Our Company performance against the performance goals and objectives established by the Committee and the Board of Directors for the fiscal year; and Our Company performance for the fiscal year against the Peer Group. In making his compensation recommendations to the Committee, our CEO considers each of the above factors and no single factor is determinative. Through the performance evaluation and executive compensation review process, the Committee reviews the performance evaluations, discusses the individual performance of each executive officer, reviews the compensation recommendations of our CEO and approves the compensation for our executive officers. CEO Performance Evaluation With respect to the performance evaluation and compensation review process for our CEO, the independent members of the Board of Directors conduct a review of our CEO’s performance against his objectives for the fiscal year that were previously reviewed and approved by the Committee and the independent members of the Board. The CEO generally provides a summary of his results against objectives and the Committee is also provided with data regarding the Company’s performance as compared to the performance of the Peer Group. The Committee and the independent members of the Board of Directors then review the CEO’s performance results against his objectives and consider the CEO’s compensation in light of that performance evaluation. Compensation of the Chief Executive Officer The Committee recognizes that special scrutiny is applied to the compensation of the Chief Executive Officer, as the most highly compensated of the named executive officers and the primary leader of the company. The Committee believes that the total compensation opportunity for Mr. Gacek, our Chief Executive Officer, was both appropriate and performance-based in Fiscal 2016. In Fiscal 2016, due to factors including stock price and revenue declines, the total realizable compensation actually paid to Mr. Gacek was less than his total target compensation. For purposes of this CD&A, total realizable pay is defined as the sum of the base salary, actual earned short-term cash incentive payments, actual time-based equity awards granted, and actual equity awards that become eligible to vest based on performance (as measured based on the value of such awards as of March 31, 2016). Total target compensation is defined as the sum of the base salary, target short-term cash incentives, and target equity awards that could become eligible to vest based on service or performance (as measured based on the grant date value of such awards) during the fiscal year. Of Mr. Gacek’s total 2016 compensation opportunity, 50% is tied to both performance-based equity and short-term cash incentives. Due to the company financial performance previously described, Mr. Gacek did not receive any portion of his performance-based compensation in Fiscal 2016. The following graph further illustrates that Mr. Gacek’s Fiscal 2016 Total Realizable Compensation was 32.4% of his Fiscal 2016 Total Target Compensation. Elements of Compensation Consistent withour compensation philosophy and objectives, the Company provides a mix of compensation elements that emphasizes annualcash incentivesand long-term equity incentives. Our executivecompensation program consistsof base salary, an annual bonusopportunity,equity awards with both time and performance-based vesting,minimal perquisites and certain other benefits including health and welfarebenefits and change of control and severance protection. Base Salary Overview Base salaries are set competitively to attract andretain executive talent while compensating ournamed executive officers for their day-to-day responsibilities.The base salaries are typically reviewed annually in June andmay be adjusted in accordancewith individualperformance,market alignment, company performance, promotions or an increased level of responsibility. As in previous years, the Committee continues to generally position the base salaries of our Chief Executive Officer and other executive officers at market median based on the Peer Groupdata and other benchmark data from other compensation surveys. Base Salary Adjustments Made in Fiscal 2016 (1)Mr. Willis and Mr. Stedman were not among the named executive officers in 2015. The Committee agreed that Mr. Gacek’s base salary was aligned with the median base salary of the Company’s Peer Group; therefore Mr. Gacek did not receive a base salary increase in Fiscal 2016. The Committee evaluated the recommendation of Mr. Gacek to increase base salaries for Mr. Clark and Ms. Breard. The recommendation of Mr. Gacek to raise the base salaries of these named executive officers was based on the following considerations: (i) this increase brings the base salary of each of these named executive officers to a level that is approximately at the market median for comparable executive officer positions, (ii) is reflective of the role and contribution of each within the Company, (iii) provides each with a competitive base salary that will assist the Company in retaining executive talent, and (iv) maintains internal equity for comparable executive positions. The Committee determined that a base salary increase for Mr. Clark of 8.11% and Ms. Breard of 3.61% was appropriate. Mr. Gacek reviewed the base salary for Mr. Britts in comparison to the Company’s Peer Group. Mr. Gacek recommended and the Committee agreed that Mr. Britts’ base salary was aligned with the median base salary and therefore made no further recommendations for a Fiscal 2016 adjustment. For purposes of Fiscal 2016 compensation, Mr. Gacek reviewed the base salaries for Mr. Willis, prior to his position as interim SVP & CFO, and Mr. Stedman based on a combination of market data and end of year performance. The Committee agreed to the Fiscal 2016 salaries for Mr. Willis and Mr. Stedman as recommended by Mr. Gacek. Annual Incentive Plan Overview of Annual Incentive Plan All employees of the Company participate in the Company’s annual incentive plan (the “Company Bonus Plan”). The annual incentive target is set as a percentage of the employee’s base salary and earned only when pre-established corporate metrics are achieved. As part of the Company Bonus Plan, our executive officers are eligible to earn annual incentives through the Company’s Executive Officer Incentive Plan (the “Executive Officer Incentive Plan”) which was reapproved by our stockholders at the Company’s 2012 annual stockholders meeting. In addition to the Executive Officer Incentive Plan and as of August 2013, in connection with his assumption of the role as Senior Vice President, Worldwide Sales and Marketing, Mr. Britts also participates in the Company’s Sales Compensation Plan which provides him with the opportunity to earn sales commissions based on the Company’s revenue. The purpose of Mr. Britts’ participation in this plan is drive increased revenue growth and directly linking a portion of Mr. Britts target total cash to the Company’s financial performance. The Executive Officer Incentive Plan is structured to support our strategic business plan and reflects the Company’s underlying business conditions. The Executive Officer Incentive Plan is intended to provide competitive annual incentive compensation opportunities to our executive officers while supporting our pay-for-performance philosophy by directly tying annual cash incentive compensation levels to both corporate and individual performance. The Executive Officer Incentive Plan provides for the funding of an annual incentive pool based upon the achievement of one or more pre-established financial or operational performance objectives. If the minimum level of performance is achieved under the Company Bonus Plan, and the Company Bonus Plan pool is funded, the Executive Officer Incentive Plan is also funded based on the proportion of the total funded amount of the Company Bonus Plan allocated to the participants in the Executive Officer Incentive Plan. Our executive officers are eligible to receive discretionary incentive awards based on a combination of the level of Executive Officer Incentive Plan funding, their individual target annual incentive award opportunity and their individual performance for the fiscal year. Target Annual Incentive Award Opportunity Each executive officer has a target annual incentive award opportunity under the Executive Officer Incentive Plan that is expressed as a percentage of his or her base salary. Target annual incentive awards are reviewed, set, and approved annually as part of our executive compensation review. Annual incentive targets are compared to market data including the Peer Group and set approximately at market median; including with respect to the Fiscal 2016 target annual incentive award opportunity for each named executive officer. In addition to the annual incentive, Mr. Britts’ has a targeted sales commission opportunity approved by the Committee and deemed to be (1)In addition to the target annual incentive award opportunity under the Executive Officer Incentive Plan, in August, 2013, the Committee approved a $200,000 annual commission target for Mr. Britts (described further below). The Committee determined that the target annual incentive award opportunities for all of the named executive officers were generally aligned with the market median. The Fiscal 2016 incentive targets for Mr. Willis and Mr. Stedman as recommended by Mr. Gacek and approved by the Committee were consistent with market median. Although each named executive officer has an annual incentive target opportunity, actual incentive awards for our executive officers under the Executive Officer Incentive Plan may be above or below the established target annual incentive award opportunities, and may be eliminated entirely, depending on actual Company and individual performance, as determined by the Committee, in its discretion; provided, however, that in no event may an award to any executive officer under the Executive Officer Incentive Plan exceed 150% of the executive officer’s annual incentive target opportunity. Performance Metrics and Targets Under Executive Officer Incentive Plan for Fiscal 2016 For Fiscal 2016, as in Fiscal 2015, the Committee approved the use of one financial performance metric, non-GAAP operating income for the Company Bonus Plan, including under the Executive Officer Incentive Plan. While the plan has a single metric, the focus on operating income in the bonus plan is balanced by a focus on revenue growth in the long term incentive plan and is a critical measure of success for the fiscal year. The Committee continues to believe that non-GAAP operating income is an appropriate measure of our financial performance, as it reflects the level of growth resulting from the successful execution of our annual operating plan consistent with producing an appropriate return for our stockholders and satisfying our obligations to our debt holders. (For purposes of the Company Bonus Plan, “non-GAAP operating income” is defined as operating income reduced by acquisition expenses, amortization of intangibles, Crossroads patent litigation costs, goodwill impairment, outsourcing transition costs, proxy contest and related costs, restructuring charges, share-based compensation charges and Symform expenses, net.) The Company Bonus Plan provides for the funding of a single pool for all employees based upon the achievement of pre-established non-GAAP operating income target performance levels. The target performance levels for Fiscal 2016 were set at the beginning of the fiscal year in conjunction with the approval of our annual operating plan. The annual operating plan is considered and discussed extensively by our Board and senior management before it is approved by the Board. The annual non-GAAP operating income target performance level for Fiscal 2016 was set at $38.0 million. Based on actual Fiscal 2015 non-GAAP operating income of $37.7 million, the Committee believed that the achievement of this target level of operating income was consistent with the Company’s continuing evolution in becoming a market leader in scale-out storage, archive and data protection and achievement of this target level would require a high level of performance by our CEO, executive officers and all other employees. Funding of Executive Officer Incentive Plan For Fiscal 2016, the Committee agreed to fund the Company Bonus Plan based on the achievement of certain levels of non-GAAP operating income performance. The Committee provided that no funding for incentives would occur unless and until non-GAAP operating income exceeded $47.0 million. If this target level of performance was achieved, total funding under the Company Bonus Plan would equal $5.0 million. The Committee also determined that as the Company’s performance increased above the operating income performance target level, the Company would fund the incentive pool with approximately $0.45 of every $1.00 of non-GAAP operating income earned above $47.0 million. Provided an incentive pool is funded for the Company Bonus Plan, actual bonuses would be paid at 30% of target once the pool is funded at $5.0 million and continue to increase on a linear basis as non-GAAP operating income increases. While all bonuses are capped at 150% of target, this requires significant over achievement of company performance. Our CEO approves incentive awards for our executive officers (other than himself) under the Executive Officer Incentive Plan, based on the total level of incentive funding, the individual target annual incentive award opportunities and on his assessment of their individual performance for the fiscal year. The Committee ultimately approves all incentive awards to our executive officers under the Executive Officer Incentive Plan and is not bound by the recommendations of our CEO. The independent members of the Board of Directors determine the incentive award, if any, payable to our CEO under the Executive Officer Incentive Plan from the funded incentive pool. Following the completion of Fiscal 2016, the Committee compared our actual non-GAAP operating income results to the annual target performance levels. Because our reported Fiscal 2016 non-GAAP operating income of $5.6 million did not exceed the minimum performance levels necessary to begin funding the incentive pool, the Committee concluded that an incentive pool would not be funded under the Company Bonus Plan for Fiscal 2016. As a result, no annual incentives were paid to executives or any other employees under Executive Officer Incentive Plan including the Company Bonus Plan for Fiscal 2016. Sales Compensation Plan for Fiscal 2016 Beginning August 2013, when assuming the role of Senior Vice President, Worldwide Sales and Marketing, Mr. Britts participated in the Company’s Sales Compensation Plan. The Sales Compensation Plan is a standard commission plan in which all of the Company’s commissioned employees participate and which provides for commission payments based upon sales of the Company’s products and the attainment of specified individual quotas. Commission payments for Mr. Britts are based on the sale of the Company’s branded products and branded service. Mr. Britts’ quota for Fiscal 2016 was $509.0 million. During Fiscal 2016, Mr. Britts earned total commissions of $30,814 which was below his annual commission target of $200,000. Quota and commission targets for Mr. Britts were based on weightings between various strategic product groups and other revenue. Clawback Policy In April 2015, the Committee approved and the Company adopted a clawback policy for cash incentive/bonus compensation to executive officers if the Company is required to provide a material restatement of its financial statements for any of the prior three fiscal years due to fraud or misconduct by an executive officer. This policy and per Item 402(b)(2)(viii) of Regulation S K, entitles the Company to recover excess compensation paid to an Executive Officer as determined by the Board. This policy will be reviewed and modified, if necessary, once the SEC adopts final rules implementing the requirement of Section 954 of the Dodd-Frank Act. Equity Awards Overview of Annual Equity Award Program Historically, the cash compensation of our executive officers has been supplemented with equity awards under the Company’s long-term incentive plan that tie their overall compensation to the performance of the Company’s Common Stock over a period of time. Equity awards are granted to our executive officers to (i) provide at-risk equity compensation consistent with our pay-for-performance philosophy and (ii) align the interests of our executive officers with those of our stockholders by providing them with significant equity stakes in the Company. The Committee determines, on a discretionary basis, whether an equity award should be granted, the form of any equity award and the number of shares of the Company’s Common Stock subject to the equity award. Establishment of Stock Pool for Annual Equity Awards Each fiscal year, as part of the development and approval of the Company’s annual compensation program, management recommends, and the Committee approves, a stock pool for the purpose of granting annual equity awards to our executive officers and other eligible employees. In establishing the size of this stock pool, the following factors are considered: The Market Data regarding the size of competitive equity pools; The Market Data regarding the competitive size and fair value of equity awards provided to similar executive officers and other employees; The resulting impact the stock pool would have on our annual and three-year average burn rates (“burn rate” is defined as the number of shares of the Company’s Common Stock subject to stock options granted during the fiscal year plus the number of shares of the Company’s Common Stock subject to restricted stock unit awards granted during the fiscal year, with the number of restricted stock units multiplied by the appropriate ISS burn-rate multiplier, divided by the average number of shares of the Company’s Common Stock outstanding during the fiscal year); and The impact of the stock pool on the remaining shares of stock available for grant under the Company’s stockholder-approved long-term incentive plan. Form of Annual Equity Awards For the past several years, in an on-going effort to reduce the dilution, burn rate, overhang and financial accounting compensation expense resulting from the use of equity awards, the Committee has been granting equity awards in the form of restricted stock units. Additionally, to support the Company’s efforts to retain its top executive talent, the Committee has favored granting restricted stock units with service-based vesting because restricted stock units have some financial value regardless of stock price performance and therefore serve as a valuable retention vehicle. In Fiscal 2014, the Committee reviewed market and industry-wide best practices and determined that a portion of the CEO equity awards should be more directly tied to Company performance and achievement of specified performance targets. To strengthen this alignment, more than 50% of the equity awards granted to Mr. Gacek were performance-based restricted stock units that would vest only if defined performance measures were achieved. In Fiscal 2015, the Committee expanded the use of performance-based restricted stock units to all vice-presidents and executive officers and this practice continued for Fiscal 2016. The Committee believes this strategy of granting equity awards in the form of both service-based and performance-based restricted stock units serves the purposes of retaining executive officers and, consistent with our pay-for-performance philosophy, incenting and rewarding them for performance, and that it also aligns the interests of our executive officers with those of its stockholders. Vesting In Fiscal 2016, as a further effort to reduce dilution, burn rate and overhang, and to align with market best practices, the Committee agreed to move the vesting schedule of the time-based RSUs from a three-year vesting schedule to a four-year vesting duration. As a result, any time-based equity awards granted in Fiscal 2016 to our CEO, named executive officers, or other equity recipients, other than our Directors, are subject to vest in equal increments over four-years. Performance-based equity awards continue to vest annually over a three-year vesting schedule contingent upon the Company achieving pre-established performance goals in Fiscal 2016. Size/Value of Annual Equity Awards In determining the size of the annual equity awards to be granted individually to our executive officers, the Committee does not establish specific target equity award levels for them. Instead, the Company develops annual equity award grant guidelines for the individual grants. The equity award grant guidelines are developed based on the number of shares of the Company’s Common Stock that are available for the granting of equity awards to our executive officers and incorporate a range that permits variation in the individual grants based on different levels of individual performance. Using these guidelines, the Committee reviews the recommendations by the CEO regarding the size of the equity award to be granted to each of our executive officers (other than with respect to his own award). The recommendations regarding the size of the equity award for each individual executive officer may vary within Individual performance of each executive officer for the prior fiscal year; Company financial performance for the prior fiscal year; The grant date fair value of equity awards granted to executive officers in similar positions in technology companies of similar size (the “grant date fair value” is equal to the number of restricted stock unit awards multiplied by the market price of the Company’s Common Stock on the date of grant; Internal consistency and comparability in terms of the size of the equity awards among the executive officers; and The number, type and current retentive value of the outstanding equity awards held individually by each of the executive officers. Although our philosophy is to generally target the market median equity award value for our annual equity awards, based on the Market Data, when making equity awards to our executive officers, the value of the resulting equity awards may be above or below the market median award value depending upon the factors noted above as well as the Company’s stock price at the time the awards are granted. The Committee reviews the recommendations of our CEO, including the application of the aforementioned factors to each of our executive officers and ultimately approves the equity awards for the executive officers. The independent members of the Board of Directors apply the same factors in determining the size and form of the equity award for our CEO. Fiscal 2016 Annual Equity Awards Using the factors established for purposes of determining the size of individual equity awards, as noted above, the Committee approved the following annual equity awards to the named executive officers in Fiscal 2016 (with the number of performance-based restricted stock units shown at target levels): *Ms. Breard’s fiscal 2016 equity awards were forfeited upon her departure from Quantum in January 2016. Mr. Gacek In determining the equity award for Mr. Gacek for Fiscal 2016, the Committee reviewed the median grant date fair value of equity awards and mix of performance-based and non-performance-based equity from the Company’s Peer Group. Based on a combination of factors including market data on equity mix for Peer Group CEOs, the degree of difficulty in earning target awards, and the level of equity compensation being considered, the Committee decided to grant Mr. Gacek more equity in the form of performance-based RSUs to try and maintain the same total equity value from Fiscal 2015 and in recognition of Mr. Gacek’s strong Fiscal 2015 results. To that end, the Committee decided that a 53/47 mix for Fiscal 2016 consisting of 500,000 performance-based and 445,000 time-based RSUs was appropriate. At the time the Committee approved the grants, the Company’s stock price was approximately $1.69. The equity grants had a total potential value of approximately $1.6 million based on a stock price of $1.69 per share, which was near the 50th percentile of the Peer Group for target performance. For Fiscal 2016, Mr. Gacek could earn a minimum of 50% of the target performance-based RSUs with a maximum award of 150% of target; however, consistent with the Company’s plan, overachievement of performance must have been met before performance-based equity could become eligible to vest. The service-based restricted stock unit award is scheduled to vest in equal annual installments over four years on each anniversary of the grant date of July 1, 2015, subject to continued employment. The performance-based RSUs are earned based on the achievement of two goals, (i) non-GAAP operating income of $38.0M and (ii) an internal revenue target. Upon attainment of these goals, 50% of target performance-based RSUs are granted. Scaling on a linear basis from 50%, additional shares are granted as revenue performance increases until a maximum of 150% of target performance-based RSUs have been granted. The revenue target, an internal target under the Company’s target operating model, was related to individual product lines that the Company does not disclose publicly and believes would be competitively harmful to disclose. For Mr. Gacek, 50% target performance-based RSUs, or 250,000 shares grant upon the achievement of both financial metrics with a maximum grant of 150% or 750,000 shares. Based on the Company’s financial results as of March 31, 2016, the company did not achieve the corporate operating income necessary for the performance-based RSUs to be awarded. Mr. Gacek did not receive any portion of his target performance-based equity for Fiscal 2016. Other Named Executive Officers The Committee reviewed recommendations made by Mr. Gacek and approved equity awards during Fiscal 2016 of 100,000 service-based restricted stock units to Ms. Breard (all of which were forfeited upon termination) and 160,000 service-based restricted stock units to each of Mr. Britts, Mr. Clark and Mr. Stedman. Mr. Willis was granted 45,000 service-based restricted stock units prior to his role as Interim SVP & CFO. The grant guidelines established by the Company for the executive officers for Fiscal 2016 ranged from 100,000 to 160,000 restricted stock units which will vest in equal installments over four-years on each anniversary of the grant date of July 1, 2015, subject to continued employment. Additionally, Mr. Gacek recommended and the Committee approved 66,667 performance-based restricted stock units to Ms. Breard (all of which were forfeited upon termination) and 106,667 performance-based restricted stock units to each of Mr. Britts, Mr. Clark, and Mr. Stedman. Mr. Willis was granted 19,286 performance-based restricted stock units as part of the annual equity grant as recommended by Mr. Gacek. These grants represent an equity mix of 60% service-based awards and 40% performance-based awards. At the time the grant guidelines were established and the equity awards approved, the Company’s stock price was approximately $1.69. Although the equity awards would have a combined value at grant ranging from approximately $280,000 to $450,000 (for the named executive officers not in an interim position), the realized value was expected to be substantially less as the Company would need to significantly over-perform in order to earn awards at target. The Company performance goals for all other executive officers are identical to that described for Mr. Gacek. Based on the attainment of the financial goals all executive officers are granted 50% of target performance-based RSUs with a maximum grant of 150% of target. Based on the Company’s financial results as of March 31, 2016, the corporate operating income target was not achieved and therefore no performance-based restricted stock units became eligible to vest. Mr. Gacek provided the Committee with target annual equity awards for the other named executive officers, which took into account (i) the leadership position of each named executive officer, (ii) the named executive officer’s level of individual performance, (iii) the role of each named executive officer and the scope of their responsibilities, (iv) the Company’s financial performance for the prior fiscal year, and (v) the current equity holdings of each named executive officer. The Committee reviewed the recommendations from Mr. Gacek for the executive officers in combination with market data that compared the size of the internal equity awards to that of comparable positions in companies of similar size. While it is always the intention to keep the target value of internal equity comparable to market and Peer Group medians, the Committee took into consideration other factors including anticipated stock price growth, the financial performance of the Company for the prior year. The Committee noted that the realized value was expected to be below market median as the Company would need to significantly over-perform in Fiscal 2016 in order for the performance-based restricted stock units to reach target levels. The service-based restricted stock units granted will vest in equal annual installments over four years while any performance-based restricted stock units that are earned by the named executive officers will vest in equal annual installments over three years. Timing & Pricing of Equity Awards We do not have an established schedule for the granting of equity awards. Instead, the Committee makes awards from time to time as necessary. The Committee has instituted a policy that all equity awards will be approved either at a regularly scheduled Committee meeting, with the annual schedule of such meetings established prior to the beginning of the fiscal year, or by unanimous written consent on the first day of each month, or as close as reasonably possible to the first day of the month. The actual grant date for equity awards under this policy is the later to occur of the first day of the month or the day the last member of the Committee executes a written consent approving in writing the equity award grant. As required by the Company’s long-term incentive plan, the exercise price for any stock option grants is set at not less than the closing market price of our Common Stock on the date of grant or, if the date of grant falls on a weekend or holiday, the closing price on the immediately preceding business day. Perquisites and Other Benefits Perquisites – We offer Company-paid financial counseling and tax preparation services to our executive officers and non-executive vice presidents. Our executive officers are entitled to receive up to $6,000 in their initial year of participation, and an additional $3,500 per year thereafter to reimburse them for the cost of such services. The Committee considers this expense to be minimal and appropriate given the level of the executive officers’ responsibilities. Other than this perquisite and the non qualified deferred compensation plan discussed below, we do not provide any other perquisites or personal benefits to our executive officers that are not available to all other full time employees. Employee Stock Purchase Plan – We offer all employees, including our executive officers, the ability to acquire shares of the Company’s Common Stock through a tax-qualified employee stock purchase plan. This plan allows employees to purchase shares of the Company’s Common Stock at a 15% discount relative to the market price. The Committee believes that the Employee Stock Purchase Plan is a cost efficient method of encouraging employee stock ownership. Health and Welfare Benefits – We offer health, welfare, and other benefit programs to substantially all full-time employees. We share the cost of health and welfare benefits with our employees, the cost of which is dependent on the level of coverage an employee elects. The health and welfare benefits offered to our executive officers are identical to those offered to other full time employees. Qualified Retirement Benefits – All U.S.-based employees, including our executive officers, are eligible to participate in the Company’s tax-qualified 401(k) Savings Plan. Participants may defer cash compensation up to statutory IRS limits and may receive a discretionary matching Company contribution. The matching contribution for our executive officers is reported in a footnote to the Summary Compensation Table. Participants direct their own investments in the Company’s tax-qualified 401(k) Savings Plan, which does not include an opportunity to invest in shares of the Company’s Common Stock. Non-Qualified Deferred Compensation Plan – We maintain a non-qualified deferred compensation plan which allows select employees, including our executive officers, to contribute a portion of their base salary and annual bonus payouts to an irrevocable trust for the purpose of deferring federal and state income taxes. Participants direct the deemed investment of their deferred accounts among a pre-selected group of investment funds, which does not include shares of the Company’s Common Stock. The deemed investment accounts mirror the investment options available under the Company’s 401(k) Savings Plan. Participants’ deferred accounts are credited with interest based on their deemed investment selections. Participants may change their investment elections on a daily basis, the same as they may under the Company’s 401(k) Savings Plan. We do not make employer or matching contributions to the deferred accounts under the non-qualified deferred compensation plan. We offer the non-qualified deferred compensation plan as a competitive practice to enable us to attract and retain top talent. During Fiscal 2016, none of our executive officers participated in the non-qualified deferred compensation plan. Change of Control Severance Policy, Employment Agreements and Severance Agreements Change of Control Agreements In the third quarter of Fiscal Year 2016, we entered into amended and restated change of control agreements with our executive officers, whereby in the event of a “change of control” of the Company, which is defined to include, among other things, a merger or sale of all or substantially all of the assets of the Company or a change in the composition of the Board of Directors occurring within a 24 month period as a result of which fewer than a majority of the directors are Incumbent Directors (as defined in the Change of Control Agreement), and, within 12 months of the change of control, there is an “Involuntary Termination” of such executive officer’s employment, then the executive officer is entitled to specified payments and benefits, subject to the executive officer’s execution of a release of claims in favor of the Company. The agreements define an “Involuntary Termination” to include, among other things, any termination of employment of the executive officer by the Company without “cause” or a significant reduction of the executive officer’s duties without his or her express written consent. The change of control agreements do not provide for the payment of any tax gross-up to offset any excise tax incurred as a result of any payment under the agreements. The change of control agreements also provide that, in the event an executive officer brings an action to enforce or effect his or her rights under the agreement, then Quantum will advance all reasonable attorneys’ fees incurred by the executive officer in connection with the action. The arbitrator in the action will determine whether or not the executive officer is the prevailing party. If Quantum is the prevailing party, the arbitrator will determine whether any portion of the advanced payments will be required to be repaid by the executive officer to Quantum. The purpose of these change of control agreements is to ensure that we will have the continued dedication of our executive officers by providing such individuals with compensation arrangements that are competitive with those of the executives of the companies in our Peer Group, to provide sufficient incentive to the individuals to remain employed with us, to enhance their financial security, as well as protect them against unwarranted termination in the event of a change of control of the Company. The Board of Directors believes that this policy serves the best interests of stockholders because it eliminates management’s self-interest considerations during a potential change of control at a cost that is both appropriate and reasonable. In January 2015, each named executive officer, except for Mr. Gacek, entered into an agreement with Quantum providing that, in the event the executive officer brings an action to enforce or effect his or her rights under a written agreement relating to his or her employment then Quantum will advance all reasonable attorneys’ fees incurred by the executive officer in connection with the action. These agreements were superseded by the Q3 FY 2016 amended and restated change of control agreements to the extent they relate to the subject matter of those agreements, but remain in effect with respect to other employment-related agreements. Our board of directors and the Committee believed that these agreements for the advanced payments were appropriate in order to provide the executives with additional assurances that the benefits intended to be provided under employment agreements would not be unduly denied upon a qualifying event thereunder. The payments to each of our named executive officers in the event of a triggering event as of the last day of our fiscal year Employment Offer Letters Except for the offer letters with Mr. Gacek and Mr. Britts described below, we do not have employment agreements with any of our named executive officers. Each of our named executive officer’s employment is at will and the named executive officer may be terminated at any time and for any reason, with or without notice. We entered into an offer letter with Mr. Gacek, effective April 1, 2011, in connection with his appointment as President and CEO. This offer letter replaces the offer letter we entered into with Mr. Gacek at the time Mr. Gacek was originally hired by the Company in 2006. This offer letter provides for severance benefits in the event of an involuntary termination of employment without cause (as defined in Mr. Gacek’s change of control agreement) that is not associated with a change of control of the Company, subject to his execution of a separation agreement and general release. We entered into an offer letter with Mr. Britts at the time of his initial employment with Quantum. This offer letter provides for certain severance benefits in the event of a qualifying termination of employment that is not associated with a change of control of the Company, subject to Mr. Britts’ execution of a separation agreement and general release. The purpose of the severance benefits provided in these offer letters is to ensure that the Company will have the continued dedication of Mr. Gacek and Mr. Britts by providing sufficient incentive to them to remain with us and to enhance their financial security. The Board of Directors believes that these offer letters serve the best interests of stockholders because it enables us to secure the services of Mr. Gacek and Mr. Britts at a cost that is both appropriate and reasonable. Stock Ownership Guidelines We maintain stock ownership guidelines for our CEO and for our non-employee directors. For our President and CEO, these stock ownership guidelines require him to acquire and hold shares of the Company’s Common Stock with a value at least equal to three times his annual base salary. For our non-employee directors, these stock ownership guidelines require them to acquire and hold shares of the Company’s Common Stock with a value at least equal to three times the directors’ annual retainer. The measurement date for compliance with the stock ownership guidelines is the last day of each fiscal year. The stock ownership guidelines are required to be met by the later of five years from (i) the date the guidelines were adopted or (ii) the date an individual first becomes subject to the guidelines. As of the last day of Fiscal 2016, Mr. Gacek, who was appointed our President and CEO on the first day of Fiscal 2012, and Mr. Fuller, who was first appointed to the Board of Directors during Fiscal 2015, had not yet met the applicable stock ownership guidelines. However, in each case, these individuals have several years in which to reach the ownership requirement. While the Committee encourages executive share ownership for our other executive officers, we do not currently require those executive officers to own shares of our stock with a minimum stated value. Anti-Hedging and Anti-Pledging Policy We maintain an insider trading policy which expressly prohibits buying Company shares on margin or using or pledging owned shares as collateral for loans and engaging in transactions in publicly-traded options, such as puts and calls, and other derivative securities with respect to the Company’s securities. This extends to any hedging or similar transaction designed to decrease the risks associated with holding Company securities. All of our executive officers are subject to the Company’s insider trading policy. Tax and Accounting Considerations Section 162(m) of the Internal Revenue Code Section 162(m) of the Internal Revenue Code (“Section 162(m)”) imposes limitations on the deductibility for federal income tax purposes of remuneration in excess of $1 million paid to certain executive officers in a taxable year. Generally, remuneration in excess of $1 million may only be deducted if it is “performance-based compensation” within the meaning of the Internal Revenue Code. The Executive Officer Incentive Plan allows the Committee to pay compensation that qualifies as performance-based compensation under Section 162(m). While we currently seek to preserve deductibility of compensation paid to our executive officers under Section 162(m), flexibility to provide compensation arrangements necessary to recruit and retain outstanding executives is maintained. In particular, full preservation of tax deductibility may not be possible if non-performance-based restricted stock units continue to play a role in our executive compensation program since such restricted stock units are not deemed to be performance-based underSection 162(m). With respect to our executive officers, no portion of their compensation in Fiscal 2016 was determined to be non-deductible under Section 162(m). Section 409A of the Internal Revenue Code Section 409A of the Internal Revenue Code (“Section 409A”) imposes additional significant taxes in the event that an executive officer, director or other service provider receives deferred compensation that does not meet the requirements of Section 409A. Section 409A applies to traditional nonqualified deferred compensation plans, certain severance arrangements, and certain equity awards. As described above, we maintain a non-qualified deferred compensation plan, have entered into severance and change of control agreements with our executive officers and grant equity awards. However, to assist in the prevention of adverse tax consequences under Section 409A, we structure our equity awards in a manner intended to comply with or be exempt from the applicable requirements of Section 409A. With respect to our non-qualified deferred compensation plan and the severance and change of control agreements, we have determined that the plan and such agreements are in compliance with or are exempt from Section 409A. Accounting Considerations We follow the applicable accounting rules for our equity-based compensation. The applicable accounting rules require companies to calculate the grant date fair value of equity-based awards. This calculation is performed for accounting purposes and reported in the compensation tables, even though the equity award recipients may never realize any value from their awards. The applicable accounting rules also require companies to recognize the compensation cost of their equity-based awards in their income statements over the period that a recipient is required to render service in exchange for the equity award. Compensation cost for equity-based awards with performance conditions is recognized only when it is probable that the performance conditions will be achieved. Compensation Committee Report(1) The Leadership and Compensation Committee of the Board of Directors has reviewed and discussed the Compensation Discussion and Analysis required by Item 402(b) of Regulation S-K with management. Based on such review and discussions, the Compensation Committee recommended to the Board of Directors that the Compensation Discussion and Analysis be included in this annual report on Form 10-K, as amended. Submitted by the Leadership and Compensation Committee of the Board of Directors: RISKS RELATED TO COMPENSATION POLICIES AND PRACTICES Annually, we conduct a risk assessment of our compensation policies and practices for our employees, including those relating to our executive compensation program, and discuss the findings of this risk assessment with the Committee. The Committee directed Compensia to conduct this assessment for us. Our risk assessment includes a detailed analysis of our compensation programs in which employees at all levels of the organization may participate, including our executive officers. We believe that our compensation programs have been appropriately designed to attract and retain talent and properly reward our employees. Generally, our programs are designed to pay for performance and, thus, provide incentive-based compensation that encourages appropriate risk-taking. These programs contain various mitigating features, however, to ensure our employees, including our executive officers, are not encouraged to take excessive or unnecessary risks in managing our business. These features include: Independent oversight of the compensation programs by the Committee; Multi-year service-based vesting requirements with respect to equity awards; and Based on the assessment conducted for Fiscal 2016, we believe that our compensation programs are not likely to create excessive risks that might adversely affect the Company. Summary Compensation Table for Fiscal Years 2016, 2015 and 2014 The following table lists the compensation for our named executive officers for Fiscal 2016. SUMMARY COMPENSATION TABLE Grants of Plan-Based Awards for Fiscal Year 2016 The following table presents information on plan-based awards granted to our named executive officers during Fiscal 2016. Estimated Future Payouts Under Outstanding Equity Awards at Fiscal Year End 2016 The following table provides information with respect to outstanding stock options and restricted stock unit awards held by our named executive officers as of March 31, 2016. Number of Note: The table above uses a price of $0.61 per share, the market price of the Company’s Common Stock as of March 31, 2016, to calculate the market value of shares or units that have not vested. Option Exercises and Stock Vested in Fiscal 2016 The following table provides information on stock option exercises and restricted stock and restricted stock unit vesting for our named executive officers during Fiscal 2016. Non-qualified Deferred Compensation The Company’s Non-qualified Deferred Compensation Plan is discussed under the section entitled “Compensation Discussion and Analysis – Perquisites and Other Benefits – Non-Qualified Deferred Compensation Plan.” In Fiscal 2016, no named executive officers elected to defer compensation under this plan, and no named executive officer maintains a balance in this plan. Employment Agreements and Change-in-Control Arrangements We have entered into change of control agreements with our executive officers, whereby in the event of a “change of control” of the Company, which is defined to include, among other things, a merger or sale of all or substantially all of the assets of the Company or a change in the composition of the Board of Directors occurring within a 24 month period as a result of which fewer than a majority of the directors are Incumbent Directors (as defined in the Change of Control Agreement), and, within 12 months of the change of control, there is an “Involuntary Termination” of such executive officer’s employment, then the executive officer is entitled to specified payments and benefits, subject to the executive officer’s execution of a release of claims in favor of the Company. The agreements define an “Involuntary Termination” to include, among other things, any termination of employment of the executive officer by the Company without “cause” or a significant reduction of the executive officer’s duties without his or her express written consent. The change of control agreements do not provide for the payment of any tax gross-up to offset any excise tax incurred as a result of any payment under the agreements. The benefits that would be provided to Mr. Gacek, as President and CEO, in the event of both a change of control of the Company and a qualifying termination of employment would be: The benefits that would be provided to our other executive officers (except for Mr. Willis who would receive lump sum payments as set forth below equal to 100% instead of 150%) in the event of both a change of control of the Company and a qualifying termination of employment would be: Mr. Gacek’s offer letter provides for the lump sum payment of severance benefits equivalent to twelve months of base salary and health benefits coverage for twelve months in the event of an involuntary termination of employment without cause (as defined in Mr. Gacek’s change of control agreement) that is not associated with a change of control of Quantum, subject to his execution of a separation agreement and general release. Mr. Britts’ offer letter provides for the lump sum payment of severance benefits of 52 weeks of base salary in the event of a qualifying termination of employment that is not associated with a change of control of the Company, subject to his execution of a separation agreement and general release. The following table provides information concerning the estimated payments and benefits that would be provided in the circumstances described above and under the agreements as they existed on the last day of Fiscal 2016 for our named executive officers. Payments and benefits are estimated assuming that the triggering event took place on the last business day of Fiscal 2016 (March 31, 2016), outstanding equity awards were not assumed or substituted for in connection with a change of control of the Company, and the price per share of the Company’s Common Stock is the closing price on the NYSE as of that date ($0.61). There can be no assurance that a triggering event would produce the same or similar results as those estimated below if such event occurs on any other date or at any other price, or if any other assumption used to estimate potential payments and benefits differs with respect to such triggering event. Due to the number of factors that affect the nature and amount of any potential payments or benefits, any actual payments and benefits may be substantially different. DIRECTOR COMPENSATION The Leadership and Compensation Committee, together with the full Board, are responsible for determining the amount and form of compensation for the Company’s non-employee directors. The Company’s management team provides information, analysis and recommendations to the Leadership and Compensation Committee on matters such as competitive market practices, target compensation levels and non-employee director compensation program design. In addition, the Leadership and Compensation Committee’s compensation consultant, as identified in the Compensation Discussion & Analysis, also provides analysis and advice on the market competitiveness of our non-employee directors’ compensation program (both in relation to the Company’s peer group and to the broader technology industry), as well as on current trends and developments, and specific non-employee director compensation program design recommendations. While the Leadership and Compensation Committee carefully considers all of the information and recommendations made by members of management and its compensation consultant, ultimate authority for all decisions relating to the non-employee director compensation program rests with the Board. The Leadership and Compensation Committee has determined that it will conduct a comprehensive review of the compensation program for the Company’s non-employee directors every two years. As the last comprehensive review of the non-employee director compensation occurred in fiscal year 2014, the management team and the consultant conducted a comprehensive review of the Fiscal 2016 compensation programs in fiscal year 2016 and concluded that the total compensation delivered to non-employee directors is competitive in comparison to the Company’s compensation peer group (discussed in the Compensation Discussion and Analysis above). As a result of this review, the management team and the consultant recommended to the Leadership and Compensation Committee that they do not approve changes to either the type or the amount of compensation for the Board is needed at this time, except for an increase to the Chairman annual retainer of $5,000, from $25,000 to $30,000 per year. Mr. Auvil, however, later declined to accept this increase, so that the annual Chairman retainer remains at $25,000. The table below details the specific elements of the Company’s Fiscal 2016 compensation program for its non-employee directors. All cash compensation is paid in equal quarterly installments. During Fiscal 2016, the non-employee directors received the following equity awards: Messrs. Auvil, Black, DiNardo, Fuller, Krall, Powers, and Roberson each received 90,090 restricted stock units and Mr. Anderson received 22,523 restricted stock units that vest as follows: 25% vest on each of December 1, 2015, March 1, 2016, June 1, 2016, and the date of the Annual Meeting. Mr. Andersen, who joined the Board on May 6, 2015, received 64,767 restricted stock units that will vest as follows: 50% will vest on June 1, 2016 and 50% will vest on June 1, 2017. Due to Mr. Black’s resignation from the Board in February 2016, any unvested restricted stock units were forfeited. The Board, in its discretion, determines the time or times at which equity awards may be granted, the form in which such awards are granted, the number of shares of the Company’s stock subject to each award and, in the case of stock options, the period over which such stock options become exercisable. We also maintain a non-qualified deferred compensation plan which allows our non-employee directors to contribute some or all of their cash fees to an irrevocable trust for the purpose of deferring federal and state income taxes. Participants direct the deemed investment of their deferred accounts among a pre-selected group of investment funds, which does not include shares of the Company’s Common Stock. The deemed investment accounts mirror the investment options available under the Company’s 401(k) Savings Plan. Participants’ deferred accounts are credited with interest based on their deemed investment selections. During Fiscal 2016, none of our non-employee directors elected to defer any of their cash fees to the non-qualified deferred compensation plan. Effective October 2015, in connection with his service on the Company’s Board, Mr. Auvil declined to receive any further cash fees and this forgone compensation will not be made up to Mr. Auvil in any other form. Employee directors receive no additional compensation for their service on the Board or on committees of the Board. Compensation paid to the non-employee directors during Fiscal 2016 is set forth in the following table. Mr. Press joined the Board in fiscal year 2017 and therefore, did not receive compensation during Fiscal 2016. Fiscal 2016 Director Compensation Table(1) Amounts reflect compensation earned by each director during Fiscal 2016. Fees Earned or Paid in Cash include the following: Leadership and Compensation Committee Interlocks and Insider Participation in Compensation Decisions The members of the Company’s Leadership and Compensation Committee are Mr. David A. Krall, Chair of the committee, and Mr. David E. Roberson. No member of the Leadership and Compensation Committee is currently, nor has any been at any time since the formation of the Company, an officer or employee of the Company or any of its subsidiaries. Likewise, no member of the Leadership and Compensation Committee has entered into a transaction, or series of similar transactions, in which they will have a direct or indirect material interest adverse to the Company. No interlocking relationships exist between any member of the Board or Leadership and Compensation Committee and any member of the board of directors or compensation committee of any other company, nor has any such interlocking relationship existed in the past. Security Ownership of Certain Beneficial Owners and Management The following Less than 1%. Equity Compensation Plan Information Information regarding our equity compensation plans was set forth in Item 12 of the Original Filing. Item 13.CERTAIN RELATIONSHIPS AND RELATED TRANSACTIONS, AND DIRECTOR INDEPENDENCE CERTAIN RELATIONSHIPS AND RELATED PERSON TRANSACTIONS Agreements with Directors and Executive Officers The Company has entered into indemnification agreements with its executive officers, directors and certain significant employees containing provisions that are in some respects broader than the specific indemnification provisions contained in the General Corporation Law of the State of Delaware. These agreements provide, among other things, for indemnification of the executive officers, directors and certain significant employees in proceedings brought by third parties and in stockholder derivative suits. Each agreement also provides for advancement of expenses to the indemnified party. The Company has entered into a change of control agreement and an agreement to advance legal fees with Shawn D. Hall, Senior Vice President, General Counsel and Secretary and Donald E. Martella, SVP, Engineering. The material terms of these agreements are the same as for the Company’s named executive officers and are described above in the section entitled “Compensation Discussion and Analysis - Change of Control Severance Policy, Employment Agreements and Severance Agreements.” The Company has entered into agreements with its non-employee directors whereby in the event that there is a “change of control” of the Company (which is defined in the agreements to include, among other things, a merger or sale of all or substantially all of the assets of the Company or a reconstitution of the Company’s Board) and, on or within 12 months of the change of control, the non-employee director’s performance of services as a Board member terminates other than as a result of death or Disability (as defined in the Agreement), then, to the extent that any portion of any equity-based compensation awards held by such Director is not vested at the time of termination, all such unvested awards will automatically vest. Procedures for Reviewing and Approving Related Party Transactions In accordance with the charter for the Audit Committee and with the Company’s restated and amended related party transaction policy, which was approved by the Board on August 15, 2012, our Audit Committee reviews and approves any proposed related party transactions. Any related party transaction will be disclosed in the applicable SEC filing as required by the rules of the SEC. For purposes of these procedures, “related party” and “related party transaction” have the meanings set forth in the Company’s related party transaction policy. In addition, the Company’s Code of Business Conduct and Ethics (the “Code”) requires that the Company’s employees, officers and directors avoid conducting Company business with a relative or significant other, or with a business in which a relative or significant other is associated in any significant role unless disclosed to the Company’s ethics committee (which includes the General Counsel and the Vice President, Corporate Controller (the “Ethics Committee”)) and approved in advance by the Ethics Committee or the Audit Committee, as applicable. Board Independence Quantum’s Corporate Governance Principles provide that a majority of the Board shall consist of independent directors. The Board has determined that none of the directors, other than Jon W. Gacek, has any material relationship with Quantum (either directly or as a partner, stockholder or officer of an organization that has a relationship with Quantum), and that such directors and nominees (other than Mr. Gacek) are independent under all applicable regulations, including the rules of the NYSE and the SEC. In addition, all members of the Audit Committee, the Leadership and Compensation Committee and the Corporate Governance and Nominating Committee meet the independence requirements for such committee under all applicable regulations, including the rules of the NYSE and the SEC. Item 14.PRINCIPAL ACCOUNTANT FEES AND SERVICES The following table shows the fees billed for various professional services by PricewaterhouseCoopers LLP for Fiscal 2016 and Fiscal 2015: Audit Committee Pre-Approval Policy In accordance with Audit Committee policy and the requirements of law, all services to be provided by the Company’s independent registered public accounting firm are pre-approved by the Audit Committee. This is to avoid potential conflicts of interest that could arise if the Company received specified non-audit services from its auditing firm. Annually, the Audit Committee pre-approves appropriate audit, audit-related and tax services which are listed on a general approval schedule that the Company’s independent registered public accounting firm may perform for the Company. Where such services are expected to require more than ten hours of such firm’s billable senior partner or the equivalent time, the Company must notify the Audit Committee of the auditing firm’s performance of such services. For all services to be performed by the Company’s independent registered public accounting firm that are not specified in the general pre-approval schedule, the Company must obtain specific engagement approval from the Audit Committee for such services in advance. The Audit Committee receives all notifications and requests relating to the independent registered public accounting firm’s performance of services for the Company. The Audit Committee will review and make changes to the services listed under the general approval schedule on an annual basis and otherwise from time to time as necessary. In Fiscal 2016, the Company’s independent registered public accounting firm attended all meetings of the Audit Committee. The Audit Committee believes that the provision of services by the Company’s independent registered public accounting firm described above is compatible with maintaining such firm’s independence from the Company. Item 15.EXHIBITS AND FINANCIAL STATEMENT SCHEDULES (a)(1)-(2) The financial statements or required financial statement schedules are included in the Original Filing. (3)Exhibits Except as set forth below, the required exhibits are included in the Original Filing. SIGNATURES Pursuant to the requirements of Section 13 or 15(d) of the Securities Exchange Act of 1934, the registrant has duly caused this report to be signed on its behalf by the undersigned, thereunto duly authorized. QUANTUM CORPORATION 33PART Icontains forward-looking statements withinon Form 10-K for the meaning of Section 27A ofyear ended March 31, 2016, originally filed on June 3, 2016 (the “Original Filing”). We are filing this Amendment solely to include the Securities Act of 1933, as amended,information required by Part III and Section 21E of the Securities Exchange Act of 1934, as amended. Forward-looking statements in this report usually contain the words “will,” “estimate,” “anticipate,” “expect,” “believe,” “project” or similar expressions and variations or negatives of these words. All such forward-looking statements including, but not limited to, (1) our goals, strategy and expectations for future operating performance, including increasing market share, continuing to add customers and increasing revenue and earnings; (2) our expectation that we will continue to derive a substantial portion of our revenue from products based on tape technology; (3) our belief that our existing cash and capital resources will be sufficient to meet all currently planned expenditures, debt service and sustain our operations for at least the next 12 months; (4) our expectations regarding our ongoing efforts to control our cost structure; (5) our expectations regarding the outcome of any litigation in which we are involved; and (6) our business goals, objectives, key focuses, opportunities and prospects which are inherently uncertain as they are based on management’s expectations and assumptions concerning future events, and they are subject to numerous known and unknown risks and uncertainties. Readers are cautioned not to place undue reliance on these forward-looking statements, about which we speak only as of the date hereof. As a result, our actual results may differ materially from the forward-looking statements contained herein. Factors that could cause actual results to differ materially from those described herein include, but are not limited to: (1) the amount of orders received in future periods; (2) our ability to timely ship our products; (3) uncertainty regarding information technology spending and the corresponding uncertaintyincluded in the demand for our products and services; (4) our ability to maintain supplier relationships; (5) general economic, political and fiscal conditions in the U.S. and internationally; (6) our ability to successfully introduce new products; (7) our ability to capitalize on market demand; (8) our ability to achieve anticipated gross margin levels; and (9) those factors discussed under Item 1A “Risk Factors.” Our forward-looking statements are not guarantees of future performance. We disclaim any obligation to update information in any forward-looking statement.ITEM 1. BUSINESSBusiness DescriptionQuantum Corporation (“Quantum”, the “Company”, “us” or “we”), founded in 1980 and incorporated in Delaware in 1987, is a leading expert in scale-out storage, archive and data protection, providing solutions for capturing, sharing and preserving digital assets over the entire data lifecycle. Our customers, ranging from small businesses to large/multi-national enterprises, trust us to address their most demanding data workflow challenges. We provide solutions for storing and protecting information in physical, virtual and cloud environments that are designed to help customers Be Certain™ that they have an end-to-end storage foundation to maximize the value of their data by making it accessible whenever and wherever needed, retaining it indefinitely and reducing total cost and complexity. We work closely with a broad network of distributors, value-added resellers (“VARs”), direct marketing resellers (“DMRs”), original equipment manufacturers (“OEMs”) and other suppliers to meet customers’ evolving needs. Our stock is traded on the New York Stock Exchange under the symbol QTM.Our scale-out storage portfolio includes StorNext® software, appliances and full systems called StorNext ProTM Solutions, as well as LattusTM extended online storage and Q-CloudTM Archive services. Our StorNext offerings enable customers to manage large unstructured data sets in an information workflow, providing high-performance ingest, real-time collaboration, scalable processing and intelligent protection. They are centered on our StorNext 5 platform, which is designed for today's modern workflow challenges of capturing, sharing and preserving massive amounts of data in the most demanding environments. StorNext 5 includes the industry's fastest streaming file system and policy-based tiering for automatically moving data across primary storage, extended online storage, tape archive and the cloud.We also have a comprehensive portfolio of data protection solutions for physical, virtual and cloud environments. This includes our DXi® deduplication systems, Scalar® automated tape libraries and vmPRO™ virtual server backup software. In addition, we offer a Q-Cloud service for data center customers and we also provide the underlying technology platform to partners and end user customers to build their own clouds.Recently, we introduced Artico, an intelligent network-attached storage ("NAS") archive appliance that can benefit both scale-out storage and data protection customers.We are a member of the consortium that develops and has licensed LTO® media technology to tape media manufacturing companies. We receive royalty payments for both LTO and DLT® media technology sold under licensing agreements. We have also entered into various licensing agreements with respect to our technology, patents and similar intellectual property which provide licensing revenues in certain cases and may expand the market for products and solutions using these technologies.3We are focused on driving profitable revenue growth and long-term shareholder value by capitalizing on new market opportunities, leveraging the strength of our technology, products and install base across scale-out storage and data protection, continuing to expand our solutions portfolio and building new and enhanced channel and technology partnerships.Industry BackgroundFor most of our customers, demands on data have changed and so have the requirements for storing and retaining it. Previously, data had a one-way, predictable lifecycle where the information technology (“IT”) focus was around risk mitigation. Now, companies know that their data can be a source of competitive advantage, revenue and growth. They are much more focused on the opportunity of data, so IT must save everything and make it available based on business requirements. In addition, the challenge of dealing with large data files is extending beyond a narrow set of vertical markets such as media and entertainment, government intelligence or oil and gas to commercial enterprises more broadly.All of this is leading to new workflows and putting pressure on status quo approaches. Traditional infrastructures are breaking down based on the sheer volume of data and the need to store data indefinitely and continue to produce value from it. IT departments have determined that adding more spinning disk to the problem will not resolve the issues, nor will legacy backup processes.We believe the industry is evolving to a new infrastructure that is based on high-performance, tiered storage solutions with smart data movement that fits a customer’s workflow. These tiered storage solutions need to support unpredictable, on-demand access, whenever and wherever customers need their data, and incorporate new approaches to data protection and archive. At the same time, these solutions must be cost-effective.While there are different workflows which require different solutions, there are common elements that must be addressed. This includes the need for high-performance data capture or ingest, real-time sharing and collaboration, scalability for processing and editing, intelligent protection and archiving and the ability to deliver high-value results and monetization opportunities. We understand these challenges and have a history of meeting them in some of the most demanding workflow environments.ProductsScale-out StorageWith new digital technologies creating larger data files that can generate greater business value, there is a growing need to retain data for progressively longer periods while maintaining visibility and access to it. IT departments as well as vertically focused business units, including but not limited to media and entertainment, video surveillance, oil and gas, life sciences and high performance computing, are increasingly focused on managing large amounts of unstructured data. Generally, unstructured data refers to relatively new data types that produce large files, often measured in petabytes, such as video, imaging and audio. In some cases, this also refers to large collections of small data, such as retail purchasing information, underwater photos of the ocean floor and feeds from traffic cameras that when combined, create meaning and increasingly, competitive advantage.Original Filing. In addition, in managing unstructured data, organizations are increasingly recognizing that they need efficient and cost-effective ways to archive it. We offer StorNext software and appliance-based solutions, in addition to Lattus Object Storage for extended online storage and tape for low cost archiving, to address this growing need for managing and archiving growing unstructured data sets.StorNext Workflow StorageOur StorNext appliances leverage the power of StorNext 5 software and market-leading hardware to offer predictable high-performance file sharing and archiving in purpose-built configurations of metadata controllers, expansion appliances and disk and archive enabled libraries. StorNext 5 delivers higher levels of performance, scalability and flexibility for a new generation of the industry’s leading scale-out shared storage file system, tiered storage and archive. Newly engineered from the ground up, StorNext 5 is a complete end-to-end solution that combines file management technology with easy-to-deploy appliances to support the world’s most complex and demanding workflows. In addition, our StorNext Storage Manager™ software automatically copies and migrates data between different tiers of storage based on user-defined policies. The result is a highly scalable, high-performance data management solution designed to optimize the use of storage while enabling long-term protection and recoverability of data.4StorNext Appliances and StorNext Pro Solutions are simple to deploy and architected to deliver scalable, industry-leading performance, drive lower operational costs and provide a flexible open system for enabling third party applications. These appliances also work seamlessly with traditional StorNext software and partner hardware offerings to provide additional options for building a shared storage area network (“SAN”) and scale-out NAS environment. They are intended to serve a wide range of markets, such as broadcast, post-production, video surveillance storage, DNA sequencing, corporate video and seismic exploration, and balance the highest performanceconnection with the lowest long-term cost for sharing all typesfiling of unstructured data used in data intensive operations.Lattus Object StorageOur family of Lattus Object Storage solutions enables high volumes of data to be immediately available to extract valuable information at any time,this Amendment and over time. The Lattus family is designed as extended online storage with wide-ranging scalability from terabytes to hundreds of petabytes with predictable retrieval times for high speed file access. These systems have self-healing capabilities that offer extremely high durability to ensure data is not lost and virtually eliminate unscheduled maintenance and performance degradation. Lattus has been designed to be self-migrating through innovative algorithms that simplify upgrades to new storage technologies.Q-Cloud Archive ServicesMany customers are using the cloud in different ways and we offer Q-Cloud services for a variety of applications, including using the cloud as a tier for archive storage within StorNext storage environments. Q-Cloud Archive incorporates the power of the public cloud as an off-site tier within a StorNext 5 workflow environment without changes to existing applications or processes required.Data ProtectionDXi Disk SystemsOur DXi disk-based backup systems meet the needs of a broad range of customers, from small businesses and remote offices to large distributed enterprise data center environments, seeking high speed recovery and extreme reliability beyond what a tape-only environment can deliver. These solutions offer functionality normally reserved for enterprise class data centers, such as data deduplication, virtual tape, snapshot, data recovery and replication capabilities. Our disk-based backup appliances are designed for easy implementation and integration into existing environments and provide best-in-class performance, capacity and price-performance.Our DXi disk systems use deduplication technology to increase the amount of backup data users can retain on traditional disk systems. The result is a cost-effective means for IT departments to store backup data on disk for months instead of days, providing high-speed restores, increasing available data recovery points and reducing media management. For disaster recovery in distributed environments, the DXi-Series™ also makes wide area network (“WAN”) replication practical because of the greatly reduced bandwidth required with data deduplication. By greatly increasing effective disk capacity, data deduplication enables users to retain backup data on fast recovery disk much longer than possible using conventional disk and significantly reduces the bandwidth needed to move data between sites. We hold a key patent in one of the most efficient methods of data deduplication, known as variable-length data deduplication.Our DXi-Series systems provide a combination of high performance and advanced functionality. In addition to data deduplication, the core set of advanced features of the DXi-Series includes a high performance embedded file system, support for high speed data compression, asynchronous replication, direct tape creation and built-in monitoring and diagnostic tools.vmPRO for Virtual EnvironmentsOur vmPRO software provides virtualization data protection software with advanced utilities designed to dramatically improve and simplify virtual data protection in midrange and larger data centers. It works with our DXi family of deduplication products to accelerate backup, restore and disaster recovery protection in data center virtual environments while reducing IT costs.5Scalar Tape Automation SystemsWe are a leading supplier of tape automation products and we continue to expand features and functionality of our tape library offerings to increase storage capacity and improve performance. Our Scalar tape automation portfolio includes a range of products, from autoloaders with one tape drive and up to sixteen cartridges to large enterprise-class libraries which can hold hundreds of drives and thousands of cartridges. Our tape libraries intelligently manage and protect business critical data in workgroup, medium size business and enterprise data center environments. With an emphasis on ease of use, management features and investment optimization, Scalar tape libraries are designed to grow with business needs. These products integrate tape drives into a system with automation technology, advanced connectivity and sophisticated management tools, including integrated media integrity analysis in tape drives and library diagnostic systems. We also offer the SuperLoader®3 autoloader designed to maximize data density and performance.Tying our libraries together from entry-level to enterprise is a common, integrated software called iLayerTM, which provides monitoring, alerts and proactive diagnostics, thereby reducing service calls, shortening issue resolution time and decreasing the time users spend managing their tape automation solutions. In addition, we believe the growth in archiving of unstructured data represents a substantial opportunity for tape automation systems. To capitalize on this trend and the changing role of tape automation systems in data protection, we have invested in our enterprise Scalar i6000 and midrange Scalar i500 platforms to provide increased redundancy capabilities. These platforms can be implemented on their own or in an appliance configuration with our StorNext archiving software.Devices and MediaOur device and media products include removable disk drives and libraries, tape drives and media. We offer tape drives and media primarily based on the LTO format. Our LTO family of devices is designed to deliver outstanding performance, capacity and reliability, combining the advantages of linear multi-channel, bi-directional formats with enhancements in servo technology, data compression, track layout and error correction. These LTO tape drives are designed to provide midrange and enterprise customers with disaster recovery and cost-effective backup solutions.We also sell a full range of storage media offerings to complement each tape drive technology and to satisfy a variety of specific media requirements. Our media is compatible with our drives, autoloaders and libraries as well as other industry products.Q-Cloud Storage SolutionsIn addition to using the cloud as a tier for archive storage within StorNext storage environments, we also offer Q-Cloud services for off-site disaster recovery storage using our deduplication technology. In both cases, our customers get the benefits of the cloud such as pricing flexibility and offsite storage for disaster recovery protection, in a way that integrates with their existing applications. Our approach enables customers to use the cloud as a tier of storage, resulting in hybrid-cloud storage solutions that best fit the needs of our customers’ workflows and storage requirements.Global Services and WarrantyOur global services strategy is an integral component of our total customer solution. Service is typically a significant purchase factor for customers considering scale-out or data protection storage solutions, and our ability to provide comprehensive service and support can be a noteworthy competitive advantage to attract new customers and retain existing customers. In addition, we believe that our ability to retain long-term customer relationships and secure repeat business is frequently tied directly to our service capabilities and performance.Our extensive use of technology and innovative, built-in product intelligence allows us to scale our global services operations to meet the needs of our expanding installed base. We are currently able to provide service to customers in more than 100 countries, supported by 24-hour, multi-language technical support centers located in North America, Europe and Asia. We provide our customers with warranty coverage on all of our products. Customers with high availability requirements may also purchase additional service to extend the warranty period, obtain faster response times, or both, on our disk backup systems, tape automation products and StorNext appliances. We offer this additional support coverage at a variety of response levels up to 24-hours a day, seven-days-a-week, 365-days-a-year, for customers with stringent high-availability needs. We provide support ranging from repair and replacement to 24-hour rapid exchange to on-site service support for our midrange and enterprise-class products.We generally warrant our hardware products against defects for periods ranging from one to three years from the date of sale. We provide warranty and non-warranty repair services through our service team and third party service providers. In addition, we utilize various other third party service providers throughout the world to perform repair and warranty services for us to reach additional geographic areas and industries in order to provide quality services in a cost-effective manner.6Research and DevelopmentWe compete in an industry characterized by rapid technological change and evolving customer requirements. Our success depends, in part, on our ability to introduce new products and features to meet end user needs. Our research and development teams are working on the next generation disk, data deduplication, virtual systems, cloud solutions, object storage solutions, tape automation and scale-out storage technologies as well as software solutions to advance these technologies for the scale-out storage and data protection markets to meet changing customer requirements. We continue to focus our efforts on software and integrated software and hardware solutions that offer improvements in the efficiency and cost of storing, moving, managing and protecting large amounts of data and providing solutions for the continuing convergence between backup and archive to provide compelling solutions for our customers.We continue to invest in research and development to improve and expand our product lines and introduce new product lines, striving to provide superior data protection, including cloud environments, and scale-out storage solutions. Research and development costs were $58.6 million, $64.4 million, and $74.0 million for fiscal 2015, 2014 and 2013, respectively.Sales and Distribution ChannelsQuantum Branded Sales ChannelsFor Quantum-branded products, we utilize distributors, VARs and DMRs. Our integrated Quantum Alliance Reseller Program provides our channel partners the option of purchasing products directly or through distribution and provides them access to a more comprehensive product line. Additionally, we sell directly to a select number of large corporate entities and government agencies.OEM RelationshipsWe sell our products to several OEM customers that resell our hardware products under their own brand names and typically assume responsibility for product sales, end user service and support. We also license our software to certain OEM customers that include this software in their own brand name products. These OEM relationships enable us to reach end users not served by our branded distribution channels or our direct sales force. They also allow us to sell to select geographic or vertical markets where specific OEMs have exceptional strength.CustomersOur sales are concentrated with several key customers because under our business model, as is typical for our industry, we sell to OEMs, distributors, VARs and DMRs to reach end user customers. Sales to our top five customers represented 31% of revenue in each of fiscal 2015 and 2014 and 32% of revenue in fiscal 2013. No customer accounted for 10% or more of our revenue in fiscal 2015, 2014 or 2013. Through our Quantum Alliance Reseller Program and our emphasis on growing our branded business, including increasing the independent channel, we are expanding our customer base and continue to distribute our products and services across a larger number of customers.CompetitionThe markets in which we participate are highly competitive, characterized by rapid technological change and changing customer requirements. In some cases, our competitors in one market area are customers or suppliers in another. Our competitors often have greater financial, technical, manufacturing, marketing or other resources than we do. Additionally, the competitive landscape continues to change due to merger and acquisition activity as well as new entrants into the market.Our StorNext appliances and workflow solutions primarily face competition from EMC Corporation (“EMC”), International Business Machines Corporation (“IBM”), NetApp, Inc. (“NetApp”) and other content storage vendors in the media and entertainment industry as well as government agencies and departments. Our cloud solutions face competition from a large number of businesses that provide hardware, software and virtual solutions as well as companies that offer cloud services based on other technology. The Lattus Object Storage solutions primarily compete with object storage solutions from other providers, ranging from startup companies to established companies, such as EMC, as well as large public cloud storage providers.Our disk backup solutions primarily compete with products sold by EMC, Hewlett-Packard Company (“HP”), IBM and NetApp. Additionally, a number of software companies that have traditionally been partners with us have deduplication features in their products and will, at times, compete with us. A number of our competitors also license technology from other competing companies.7In the tape automation market, we primarily compete for midrange and enterprise reseller and end user business with Dell, Inc. ("Dell"), IBM, Oracle Corporation and SpectraLogic Corporation as well as HP through its OEM relationship with other tape automation suppliers. Competitors for entry-level and OEM tape automation business include BDT Products, Inc. and several others that supply or manufacture similar products. In addition, disk backup products are a competitive alternative to tape products and solutions.At the storage device level, our main competitors are HP and IBM. Both HP and IBM develop and sell their own LTO tape drives, which compete with our device offerings. We also face competition from disk alternatives, including removable disk drives in the entry-level market.For a discussion of risks associated with competing technologies, see the Risk Factor in Item 1A "Risk Factors" titled, “We derive the majority of our revenue from products incorporating tape technology. Our future operating results depend in part on continued market acceptance and use of products employing tape technology and decreases in the market could materially and adversely impact our business, financial condition and operating results. In addition, if we are unable to compete with new or alternative storage technologies, our business, financial condition and operating results could be materially and adversely affected.”ManufacturingIn fiscal 2014, we transitioned our manufacturing from a model incorporating in-house production and contract manufacturers to a fully outsourced model as part of our strategy to enhance our variable cost structure and provide more flexibility to cost-effectively manage the volume of products manufactured to align with our expectations, including market declines in the tape business and growth expectations in disk backup products and scale-out storage solutions. During fiscal 2015 we used contract manufacturers to produce our products.We outsource the manufacture, repair and fulfillment of disk backup products, scale-out storage solutions, tape automation systems, tape devices and service parts to contract manufacturers. Tape drives used in our products are primarily sourced from Hungary and China. Disk drives used in our products are largely sourced from Thailand, the Philippines and China. Certain tape automation system materials and assemblies as well as certain disk system materials and assemblies are sourced in China, Malaysia, Thailand, Mexico and the U.S.Our recording tape media is manufactured by one or more tape media manufacturing companies, which are qualified and licensed to manufacture, use and sell media products. In most cases, the media is produced in Japan and multi-sourced on a worldwide basis.Intellectual Property and TechnologyWe develop and protect our technology and know-how, principally in the field of data storage. We generally rely on patent, copyright, trademark and trade secret laws and contract rights to establish and maintain our proprietary rights in our technology and products. As of March 31, 2015, we hold over 400 U.S. patents and have over 70 pending U.S. patent applications. In general, these patents have a 20-year term from the first effective filing date for each patent. We also hold a number of foreign patents and patent applications for certain of our products and technologies. Although we believe that our patents and applications have significant value, rapidly changing technology in our industry means that our future success may also depend heavily on the technical competence and creative skills of our employees.From time to time, third parties have asserted that the manufacture and sale of our products have infringed on their patents. We are not knowingly infringing any third party patents. Should it ultimately be determined that licenses for third party patents are required, we will make best efforts to obtain such licenses on commercially reasonable terms. See Item 3 “Legal Proceedings” for additional disclosures regarding lawsuits alleging patent infringement.On occasion, we have entered into various patent licensing and cross-licensing agreements with other companies. We may enter into patent cross-licensing agreements with other third parties in the future as part of our normal business activities. These agreements, when and if entered into, would enable these third parties to use certain patents that we own and enable us to use certain patents owned by these third parties. We have also sold certain patents, retaining a royalty-free license for these patents.Segment InformationWe operate as a single reporting unit and operating segment for business and operating purposes. Information about revenue attributable to each of our product groups is included in Item 7 “Management’s Discussion and Analysis of Financial Condition and Results of Operations” and information about revenue and long-lived assets attributable to certain geographic regions is included in Note 14 “Geographic Information”pursuant to the Consolidated Financial Statements and risks attendant to our foreign operations is set forth below in Item 1A “Risk Factors.”8SeasonalityAs is typical in our industry, we generally have the greatest demand for our products and services in the fourth quarter of each calendar year, or our fiscal third quarter. We usually experience the lowest demand for our products and services in the first and second quarters of each calendar year, or our fiscal fourth quarter and fiscal first quarter, respectively.BacklogOur products are manufactured based on forecasts of customer demand. We also place inventory in strategic locations throughout the world in order to enable certain key customers to obtain products on demand. Orders are generally placed by customers on an as-needed basis. Product orders are confirmed and, in most cases, shipped to customers within one week. More complex systems and product configurations often have longer lead times and may include on-site integration or customer acceptance. Most of the backlog accumulated during any particular fiscal quarter is shipped in the same quarter in which the backlog initially occurs. Therefore, our backlog generally grows during the first part of each fiscal quarter and shrinks during the latter part of the quarter to reach its lowest levels at the end of that same quarter, by which time significant shipments have occurred. As a result, our backlog as of the end of any fiscal quarter is not material and is not a predictor of future sales.EmployeesWe had approximately 1,250 employees worldwide as of March 31, 2015.Available InformationOur Annual Report on Form 10-K, Quarterly Reports on Form 10-Q, Current Reports on Form 8-K and amendments to reports filed or furnished pursuant to Sections 13(a) and 15(d) of the Securities Exchange Act of 1934, as amended, are available free of charge on our website at http://www.quantum.com generally when such reports are available on the Securities and Exchange Commission (“SEC”(the “SEC”) website. The contents, we are including with this Amendment certain currently dated certifications. Accordingly, Item 15 of Part IV has also been amended to reflect the filing of these currently dated certifications.website are not incorporated into this Annual Report on Form 10-K.The public may read and copy any materials we filefilings made with the SEC subsequent to the filing of the Original Filing.Name of Director Age Director
Since Position Robert J. Andersen(1) 52 2015 Director Paul R. Auvil III(1)(3) 52 2007 Director Louis DiNardo(2) 56 2013 Director Dale L. Fuller(3) 57 2014 Director Jon W. Gacek 54 2011 Director, President and Chief Executive Officer David A. Krall(2) 56 2011 Director Gregg J. Powers(3) 53 2013 Director Clifford Press(3) 62 2016 Director David E. Roberson(1)(2) 61 2011 Director (1) Member of the Audit Committee. (2) Member of the Leadership and Compensation Committee. (3) Member of the Corporate Governance and Nominating Committee. SEC’s Public Reference Room at 100 F Street, NE, Washington, D.C. 20549. The public may obtain information on the operationUniversity of California, Los Angeles. We believe that Mr. Andersen possesses specific attributes that qualify him to serve as a member of the Public Reference Room by callingBoard, including his significant expertise in financial operations, capital allocation decisions and M&A transactions.SECcompany’s public offering in April of 2012. Prior to joining Proofpoint, Mr. Auvil was an entrepreneur-in-residence with Benchmark Capital, a venture capital firm, from October 2006 to March 2007. While at 1-800-SEC-0330. The SEC maintainsBenchmark, he evaluated a broad range of investments and advised various portfolio companies throughout the technology industry. From August 2002 to July 2006, he held the position of Chief Financial Officer of VMware, Inc., a global leader in virtualization and cloud infrastructure companies. Prior to that, Mr. Auvil served for four years as Chief Financial Officer at Vitria Technology, where he led various aspects of the company’s financial and business operations, executing both an internet site that contains reports, proxyinitial and information statementssecondary public offering during his tenure. Earlier in his career, he spent 10 years at VLSI Technology, ultimately becoming vice president and other information regarding issuers that file electronically withgeneral manager of its Internet and Secure Products Division. Mr. Auvil holds a Bachelor of Engineering degree from Dartmouth College and a Master of Management degree from the SECJ.L. Kellogg Graduate School of Management at http://www.sec.gov.Executive Officers and Management TeamFollowing are the names and positions of our management team as of May 29, 2015, including a brief account of his or her business experience.NamePosition with QuantumJon W. Gacek*President and Chief Executive OfficerLinda M. Breard*Senior Vice President, Chief Financial OfficerWilliam C. Britts*Senior Vice President, Worldwide Sales and MarketingRobert S. Clark*Senior Vice President, Product OperationsShawn D. Hall*Senior Vice President, General Counsel and SecretaryJanae S. Lee*Senior Vice President, StrategyDon MartellaSenior Vice President, EngineeringGeoff StedmanSenior Vice President, StorNext Solutions* Determined byNorthwestern University. He also serves on the Board of Directors to be an “officer”of Marin Software, a provider of a Revenue Acquisition Management platform for advertisers and agencies. Mr. Auvil is the purposesChairman of Section 16 (a)Quantum’s Board and is a member of the Exchange Act.Company’s Corporate Governance and Nominating Committee as well as the Audit Committee. With a career in finance and technology spanning more than 25 years, Mr. Auvil brings valuable management, financial and corporate leadership experience to Quantum. In particular, he brings to the Board a deep understanding of financial statements, corporate finance, accounting and capital markets; senior management experience at technology companies relevant to Quantum’s business; and expertise on issues facing public companies and governance matters. As a trained engineer, Mr. Auvil also holds patents related to digital video compression in Japan and high-speed, PCI compatible on-chip data bus in the U.S., which demonstrates his extensive technological expertise and provides valuable insight to our Board on the critical role of innovation and strategic growth direction.GacekLouis DiNardo becamehas served as a Principal of BackBeat Management Solutions, a venture capital company, since May 2016. He served as the President and Chief Executive Officer of Exar Corporation, a provider of integrated circuits and solutions for data communication, networking, storage, consumer and industrial applications, from January 2012 to October 2015. From January 2008 through December 2011, he was a Partner at Crosslink Capital, a stage-independent venture capital and growth equity firm based in San Francisco and focused on semiconductor and alternative energy technology investment in private companies. Mr. DiNardo was a partner at VantagePoint Venture Partners from January 2007 through January 2008. Mr. DiNardo was President and Chief Operating Officer at Intersil Corporation from January 2006 through October 2006. Prior to his promotion, Mr. DiNardo held the position of Executive Vice President of the Power Management Business at Intersil. He held the position of President and Chief Executive Officer, as well as Co-Chairman of the Board of Directors at Xicor Corporation, a public company, from 2000 until Intersil acquired the company in July of 2004. Mr. DiNardo spent thirteen years at Linear Technology where he was Vice President of Worldwide Marketing and General Manager of the Mixed-Signal Business Unit. He began his career in the semiconductor industry at Analog Devices Incorporated where he served for eight years in a variety of technical and management roles. Mr. DiNardo currently serves on the Boards of Fixeus, Incorporated and of San Diego State University, Lavin Entrepreneur Center and served on the Board of Directors of Exar Corporation from 2012 to 2015. Mr. DiNardo is a member of Quantum’s Leadership and Compensation Committee. We believe that Mr. DiNardo possesses specific attributes that qualify him to serve as a member of the Board, including his executive and board experience.2011. He2011, with responsibility for operations, sales, marketing and service. Mr. Gacek joined Quantumthe Company as Executive Vice President and Chief Financial Officer in August 2006 uponfollowing Quantum’s acquisition of Advanced Digital Information Corporation (“ADIC”), and he was promoted to Executive Vice President, Chief Financial Officer and Chief Operating Officer in June 2009. Previously, hePrior to joining Quantum, Mr. Gacek served as the Chief Financial Officer at ADIC, a manufacturer of tape libraries and storage management software, from 1999 to 2006 and2006. He also led ADIC’s Operations division during his last three years at ADIC. Prior tothe company. Before ADIC, Mr. Gacek was an audit partner at PricewaterhouseCoopers LLP, and ledleading the Technology Practice in the firm’s Seattle office. While at PricewaterhouseCoopers LLP,there, he assisted several private equity investment firms with a number ofnumerous mergers, acquisitions and leveraged buyouts andsituations, among other transactions.9Ms. Breard joined Quantum as Vice PresidentPower-One from 2008 through 2013, of FinanceMarket Leader from 2006 to 2013 and of LWD Technology from 2003 through 2007. Mr. Gacek holds a Bachelor of Arts degree in August 2006, upon Quantum’s acquisition of ADIC. In May 2009, she was promoted to Senior Vice President and assumed responsibility for IT and Facilities in addition to Finance. In January 2011, Ms. Breard was promoted to Chief Financial Officer, and in April 2012 she added Human Resources and Corporate Communications to her portfolio. Prior to Quantum, she spent eight years at ADIC, serving as Vice President of Finance and Accounting and in other leadership positions, where she was deeply involved in the company’s merger and acquisition activity and success in driving growth. Earlier in her career, Ms. Breard worked in public accounting for six years.Mr. Britts joined Quantum as Executive Vice President, Sales and Marketing in August 2006, upon Quantum’s acquisition of ADIC. He served in this position until June 2011, when he assumed the role of Senior Vice President, Worldwide Marketing, Service and Business Development. In April 2012, Mr. Britts added Operations to his portfolio. In July 2013, he was named Senior Vice President, Worldwide Sales and Marketing. Prior to Quantum, he spent 12 years at ADIC, where he held numerous leadership positions, including Executive Vice President of Worldwide Sales and Marketing, Vice President of Sales and Marketing and Director of Marketing. Before ADIC, Mr. Britts served in a number of marketing and sales positions at Raychem Corp. and its subsidiary, Elo TouchSystems.Mr. Clark joined Quantum as Director of Tape Products in August 2006, upon Quantum’s acquisition of ADIC. In March 2009, he was promoted to Vice President with responsibility for various product lines, as well as business operations and OEM sales. In April 2010, he was named Senior Vice President, Tape and OEM Product Group (subsequently reorganized as Disk and Tape Backup Product Group). In January 2014, Mr. Clark assumed additional responsibility for all Quantum products in a newly named Product Operations organization. In April 2015, Mr. Clark also assumed responsibility for both Operations and Service. Prior to Quantum, Mr. Clark was at HP for 10 years in various engineering and sales positions.Mr. Hall joined Quantum in 1999 as Corporate Counsel, became Vice President, General Counsel and Secretary in 2001 and was promoted to Senior Vice President, General Counsel and Secretary in May 2009. Prior to Quantum, Mr. Hall worked at the law firms of Skadden, Arps and Willkie Farr & Gallagher, where he practiced in the areas of mergers and acquisitions and corporate finance, representing numerous public and private technology companies.Ms. Lee joined Quantum in October 2007 as Vice President, Marketing and in April 2010 was promoted to Senior Vice President, Disk and Software Products, subsequently reorganized as File System and Archive. In January 2014, she was named to a new position as Senior Vice President, Strategy. She has more thanfrom Western Washington University. With nearly 30 years of business, operating and leadership experience, inhe brings to the storage industry, including 10 years working with a variety of companies in data reduction and file system software and hardware. Previously, she was Chief Executive Officer at TimeSpring Software Corporation, Vice President of Product, Marketing and Business Development at Avamar Technologies and a senior sales and marketing executive at both Legato Systems, Inc. and IBM.Mr. Martella joined Quantum as Vice President, Automation Engineering in August 2006, upon Quantum’s acquisition of ADIC. In June 2010, he was promoted to Senior Vice President, Platform Engineering, and in April 2011 assumed his current role. Before joining Quantum, Mr. Martella served as a Vice President of Engineering and Quality at ADIC, where he spent five years in various leadership positions. Previously, he held engineering positions in the storage and process control industries.Mr. Stedman joined Quantum as Senior Vice President, StorNext Solutions in March 2014. From March 2012 to February 2014, Mr. Stedman served as vice president of marketing at Tintri, Inc., and he was senior vice president and general managerBoard extensive knowledge of the Storage Business Unit at Harmonic, Inc. He joined Harmonic in conjunction with its acquisition of Omneon, Inc. where he spent seven years as senior vice president of worldwide marketing. Before Omneon, Mr. Stedman held marketing positions at several technology companies.10ITEM 1A. RISK FACTORSYOU SHOULD CAREFULLY CONSIDER THE RISKS DESCRIBED BELOW, TOGETHER WITH ALL OF THE OTHER INFORMATION INCLUDED IN THIS ANNUAL REPORT ON FORM 10-K. THE RISKS AND UNCERTAINTIES DESCRIBED BELOW ARE NOT THE ONLY ONES FACING QUANTUM. ADDITIONAL RISKS AND UNCERTAINTIES NOT PRESENTLY KNOWN TO US OR THAT WE CURRENTLY BELIEVE ARE IMMATERIAL MAY ALSO IMPAIR OUR BUSINESS AND OPERATIONS. THIS ANNUAL REPORT ON FORM 10-K CONTAINS “FORWARD-LOOKING” STATEMENTS THAT INVOLVE RISKS AND UNCERTAINTIES. PLEASE SEE PAGE 1 OF THIS REPORT FOR ADDITIONAL DISCUSSION OF THESE FORWARD-LOOKING STATEMENTS.We derive the majority of our revenue from products incorporating tape technology. Our future operating results depend in part on continued market acceptance and use of products employing tape technology and decreases in the market has materially and adversely impacted our business, financial condition and operating results. In addition, if we are unable to compete with new or alternative storage technologies, our business, financial condition and operating results could be materially and adversely affected.We derive the majority of our revenue from products that incorporate some form of tape technology, and we expect to continue to derive significant revenue from these products in the next several years. As a result, our future operating results depend in part on continued market acceptance and use of products employing tape technology. We believe that the storage environment is changing, including reduced demand for tape products. Decreased market acceptance or use of products employing tape technology has materially and adversely impacted our business, financial condition and operating results and we expect that our revenues from tape products will continue to decline, which could materially and adversely impact our business, financial condition and operating results in the future.Disk products as well as various software solutions and alternative technologies continue to gain broader market acceptance. We expect that, over time, many of our tape customers will continue to migrate toward these products and solutions. While we are making targeted investment in software, disk backup systems and other alternative technologies, these markets are characterized by rapid innovation, evolving customer demands and strong competition, including competition with several companies who are also significant customers. If we are not successful in our efforts, our business, financial condition and operating results could be materially and adversely affected.We rely on indirect sales channels to market and sell our branded products. Therefore, the loss of or deterioration in our relationship with one or more of our resellers or distributors, or our inability to establish new indirect sales channels to drive growth of our branded revenue, especially for disk systems and software solutions, could negatively affect our operating results.We sell the majority of our branded products to distributors such as Ingram Micro, Inc. and others, VARs and to direct marketing resellers such as CDW Corporation, who in turn sell our products to end users . The success of these sales channels is hard to predict, particularly over time, and we have no purchase commitments or long-term orders from them that assure us of any baseline sales through these channels. Several of our resellers carry competing product lines that they may promote over our products. A reseller might not continue to purchase our products or market them effectively, and each reseller determines the type and amount of our products that it will purchase from us and the pricing of the products that it sells to end user customers. Establishing new indirect sales channels is an important part of our strategy to drive growth of our branded revenue.As we introduce new products and solutions, we could negatively impact our relationship with channel partners that historically have sold other products and solutions that now compete with our new offerings. For example, we introduced various StorNext appliance solutions beginning in fiscal 2012 causing us to more directly compete for hardware sales with channel partners that sold other hardware products in conjunction with our StorNext software.Certain of our contracts with customers contain “most favored nation” pricing provisions mandating that we offer our products to these customers at the lowest price offered to other similarly situated customers. In addition, sales of our enterprise products, and the revenue associated with the on-site service of those products, are somewhat concentrated in specific customers, including government agencies and government-related companies. Any failure of such customers and agencies to continue purchasing products in the same quantities and in the same time frames as they have in the past could affect our operating results. Our operating results could be adversely affected by any number of factors including:A change in competitive strategy that adversely affects a reseller’s willingness or ability to distribute our products;The reduction, delay or cancellation of orders or the return of a significant amount of products;Our inability to gain traction in developing new indirect sales channels for our branded products;The loss of one or more of such distributors or resellers;Any financial difficulties of such distributors or resellers that result in their inability to pay amounts owed to us; orChanges in requirements or programs that allow our products to be sold by third parties to government customers.11If our products fail to meet our or our customers’ specifications for quality and reliability, we may face liability and reputational or financial harm which may adversely impact our results of operations, and our competitive position may suffer.Although we place great emphasis on product quality, we may from time to time experience problems with the performance of our products, which could result in one or more of the following:Increased costs related to fulfillment of our warranty obligations;The reduction, delay or cancellation of orders or the return of a significant amount of products;Focused failure analysis causing distraction of the sales, operations and management teams; orThe loss of reputation in the market and customer goodwill.These factors could cause our business, financial condition and results of operations to be materially and adversely affected.In addition, we face potential liability for performance problems of our products because our end users employ our storage technologies for the storage and backup of important data and to satisfy regulatory requirements. Although we maintain technology errors and omissions liability insurance, our insurance may not cover potential claims of this type or may not be adequate to indemnify us for all liability that may be imposed. Any imposition of liability or litigation costs that is not covered by insurance or is in excess of our insurance coverage could harm our business. In addition, we could potentially face claims for product liability from our customers if our products cause property damage or bodily injury. Although we maintain general liability insurance, our insurance may not cover potential claims of this type or may not be adequate to indemnify us for all liability that may be imposed. Any imposition of liability or litigation costs that is not covered by insurance or is in excess of our insurance coverage could harm our business.A large percentage of our sales are to a few customers, some of which are also competitors, and these customers generally have no minimum or long-term purchase commitments. The loss of, or a significant reduction in demand from, one or more key customers could materially and adversely affect our business, financial condition and operating results.Our sales have been and continue to be concentrated among a few customers because under our business model, we sell to OEMs, distributors, VARs and DMRs to reach end user customers. Furthermore, customers are not obligated to purchase any minimum product volume, and our relationships with customers are terminable at will. Revenue from OEM customers has decreased in recent years. If we experience further declines in revenue from OEM customers or any of our other large customers, our business, financial condition and operating results could be materially and adversely affected. In addition, certain of our large customers are also our competitors, and such customers could decide to reduce or terminate their purchases of our products for competitive reasons.Some of our tape and disk products are incorporated into larger storage systems or solutions that are marketed and sold to end users by large OEM customers as well as VARs, channel partners and other distributors. Because of this, we have limited market access to these end users, limiting our ability to reach and influence their purchasing decisions. These market conditions further our reliance on these OEM and other large customers such as distributors and VARs. Thus if they were to significantly reduce, cancel or delay their orders with us, our results of operations could be materially and adversely affected.A portion of our sales are to various agencies and departments of the U.S. federal government, and funding cuts to federal spending can adversely impact our revenue. The American Taxpayer Relief Act of 2012 implemented automatic spending cuts beginning March 1, 2013. Between October 1 and October 16, 2013, the U.S. government partial shutdown caused reductions, cancellations and delayed orders. Future spending cuts by the U.S. federal government could decrease revenue from sales to the federal government that could materially and adversely affect our results of operations.12Our operating results depend on a limited number of products and on new product introductions, which may not be successful, in which case our business, financial condition and operating results may be materially and adversely affected.A limited number of products comprise a significant majority of our sales, and due to rapid technological change in the industry, our future operating results depend on our ability to develop and successfully introduce new products. To compete effectively, we must continually improve existing products and introduce new ones. We have devoted and expect to continue to devote considerable management and financial resources to these efforts. We cannot provide assurance that:We will introduce new products in the timeframe we are forecasting;We will not experience technical, quality, performance-related or other difficulties that could prevent or delay the introduction and market acceptance of new products;Our new products will achieve market acceptance and significant market share, or that the markets for these products will continue or grow as we have anticipated;Our new products will be successfully or timely qualified with our customers by meeting customer performance and quality specifications which must occur before customers will place large product orders; orWe will achieve high volume production of these new products in a timely manner, if at all.If we are not successful in timely completion of our new product qualifications and then ramping sales to our key customers, our revenue and results of operations could be adversely impacted. In addition, if the quality of our products is not acceptable to our customers, this could result in customer dissatisfaction, lost revenue and increased warranty and repair costs.We continue to face risks related to economic uncertainty and slow economic growth.Uncertainty about economic conditions poses a risk as businesses may further reduce or postpone spending in response to reduced budgets, tightening of credit markets, negative financial news and declines in income or asset values which could adversely affect our business, financial condition and results of operations. The slow economic growth in recent years along with periods of economic uncertainty in various countries around the world has had a material and adverse impact on our business and our financial condition.In particular, we have experienced reduced demand for IT products and services overall and more specifically for products with tape technology in the data protection market. We continue to face risks related to economic conditions in Europe, including concerns about sovereign debt and related political matters, which could negatively impact the U.S. and global economies and adversely affect our financial results. In addition, our ability to access capital markets may be restricted, which could have an impact on our ability to react to changing economic and business conditions and could also adversely affect our results of operations and financial condition.Competition may intensify in the data protection market as a result of competitors introducing products based on new technology standards and merger and acquisition activity, which could materially and adversely affect our business, financial condition and results of operations.Our competitors in the data protection market for disk backup systems and virtual machine solutions are aggressively trying to advance and develop new technologies and products to compete against our technologies and products, and we face the risk that customers could choose competitor products over ours. Competition in our markets is characterized by technological innovation and advancement. As a result of competition and new technology standards, our sales or gross margins could decline, which could materially and adversely affect our business, financial condition and results of operations.Technological developments and competition over the years in the tape automation market and in the storage market in general has resulted in decreased prices for tape automation products and product offerings. Pricing pressure is more pronounced in the tape automation market for entry-level products and less pronounced for enterprise products. Over time, the prices of our products and competitor products have decreased, but such products often incorporate new and/or different features and technologies than prior years. We face risks that customers could choose competitor products over ours due to these features and technologies or due to pricing differences. We have managed pricing pressure by reducing production costs and/or adding features to increase value to maintain a certain level of gross margin for our tape automation systems. However, certain of our costs are fixed in the short term, so we may not be able to offset price decreases or reductions in demand sufficiently to maintain our profitability. In addition, if competition further intensifies, or if there is additional industry consolidation, our sales and gross margins for tape automation systems could decline, which could materially and adversely affect our business, financial condition and results of operations.13Industry consolidation and competing technologies with device products, which include tape drives and removable hard drives, have resulted in decreased prices and increasingly commoditized device products. Our response has been to manage our device business at the material margin level, and we have chosen not to compete for sales in intense price-based situations or if we would be unable to maintain a certain gross margin level. Our focus has shifted to higher margin opportunities in other product lines. Although revenue from devices has decreased in recent years, our material margins have remained relatively stable over this period. We have exited certain portions of the device market and have anticipated decreased sales of devices. We face risk of reduced shipments of our devices beyond our plans and could have reduced margins on these products, which could adversely impact our business, financial condition and results of operations.Additionally, the competitive landscape could change due to merger and acquisition activity in the data protection market. Such transactions may impact us in a number of ways. For instance, they could result in:Competitors decreasing in number but having greater resources and becoming more competitive with us;Companies that we have not historically competed against entering into one or more of our primary markets and increasing competition in such market(s); andCustomers that are also competitors becoming more competitive with us and/or reducing their purchase of our products.These transactions also create uncertainty and disruption in the market because whether a pending transaction will be completed, the timing of such a transaction and its degree of impact are often unknown. Given these factors and others, such merger and acquisition activity may materially and adversely impact our business, financial condition and results of operations.Competition may intensify in the scale-out storage market as a result of competitors introducing products based on new technology standards and market consolidation, which could materially and adversely affect our business, financial condition and results of operations.Competition in the scale-out storage market is characterized by technological innovation and advancement, including performance and scale features, and our competitors are aggressively trying to advance and develop new technologies and solutions. If we are unable to compete effectively in these markets and develop solutions that have features and technologies that our customers desire, including new technology standards, our sales from software solutions and appliances could decline, which could materially and adversely affect our business, financial condition and results of operations.Additionally, the competitive landscape could change due to mergers and acquisitions among our competitors, customers and partners. Transactions such as these may impact us in a number of ways. For instance, they could result in:Competitors decreasing in number but having greater resources and becoming more competitive with us;Companies that we have not historically competed against entering into one or more of our primary markets and increasing competition in such market(s);Customers that are also competitors becoming more competitive with us and/or reducing their purchase of our products; andCompetitors acquiring our current suppliers or business partners and negatively impacting our business model.These transactions also create uncertainty and disruption in the market, because whether a pending transaction will be completed, the timing of such a transaction and its degree of impact are often unknown. Given these factors and others, such merger and acquisition activity may materially and adversely impact our business, financial condition and results of operations.A significant decline in our media royalty, branded software or OEM deduplication software revenues could materially and adversely affect our business, financial condition and operating results.Our media royalties, branded software and OEM deduplication software revenues are relatively profitable and can significantly impact total company profitability. We receive media royalty revenue based on tape media cartridges sold by various tape media manufacturers and resellers. Under our license agreements with these companies, each of the licensees determines the pricing and number of units of tape media cartridges that it sells. Our media royalty revenue varies depending on the level of sales of the various media cartridge offerings sold by the licensees and other factors, including:The size of the installed base of devices and similar products that use tape media cartridges;The performance of our strategic licensing partners, which sell tape media cartridges;The relative growth in units of newer device products, since the associated media cartridges for newer products typically sell at higher prices than the media cartridges associated with older products;The media consumption habits and rates of end users;The pattern of device retirements; andThe level of channel inventories.14Our media royalties depend on royalty rates and the quantity of media consumed in the market. We do not control licensee sales of these tape media cartridges. Reduced royalty rates, or a reduced installed device base using tape media cartridges, would result in further reductions in our media royalty revenue and could reduce gross margins. This could materially and adversely affect our business, financial condition and results of operations.Our branded software revenues are also dependent on many factors, including the success of competitive offerings, our ability to execute on our product roadmap and our effectiveness at marketing and selling our branded software solutions directly or through our channel partners. Disruptions to any one of these factors could reduce our branded software revenues, which could adversely affect our business, financial condition and operating results.Our OEM deduplication software revenues also depend on many factors, including the success of competitive offerings, our ability to execute on our product roadmap with our OEM deduplication software partners, the effort of our OEM deduplication software partners in marketing and selling the resulting products, the market acceptance of the resulting products and changes in the competitive landscape, including the impact of acquisitions. At various times, we had significant revenue from OEM deduplication software revenue and at times we had negligible revenue from OEM deduplication software, which negatively impacted our results. Any further disruptions to the factors on which our OEM deduplication software revenues depend could adversely affect our business, financial condition and operating results.Some of our products contain licensed, third-party technology that provides important product functionality and features. The loss or inability to obtain any such license could have a material adverse effect on our business.Our products may contain technology licensed from third parties that provides important product functionality and features. We have contractual protections within our license agreements to help mitigate against the risks of incorporating third-party technology into our products. However, there remains a risk that we may not have continued access to this technology, for instance, if the licensing company ceased to exist, either from bankruptcy, dissolution or purchase by a competitor. In addition, legal actions, such as intellectual property actions, brought against the licensing company could impact our future access to the technology. We also have limited control of the technology roadmap and cannot ensure that the licensing company will advance the roadmap of the licensed technology in the manner best for Quantum. Any of these actions could negatively impact our technology licensing, thereby reducing the functionality and/or features of our products, and adversely affect our business, financial condition and operating results. We also face the risk of not being able to quickly implement a replacement technology or otherwise mitigating the risks associated with not having access to this licensed technology, which may adversely affect our business, financial condition and operating results.We have taken considerable steps towards reducing our cost structure and may take further cost reduction actions. The steps we have taken and may take in the future may not reduce our cost structure to a level appropriate in relation to our future sales and therefore, these anticipated cost reductions may be insufficient to result in consistent profitability.In the last several years, we have recorded significant restructuring charges and made cash payments in order to reduce our cost of sales and operating expenses to respond to adverse economic and industry conditions, from strategic management decisions and to rationalize our operations following acquisitions. These restructurings may result in decreases to our revenues or adversely affect our ability to grow our business in the future. We may take future steps to further reduce our operating costs, including future cost reduction steps or restructurings in response to strategic decisions, adverse changes in our business or industry or future acquisitions. We may be unable to reduce our cost of sales and operating expenses at a rate and to a level appropriate in relation to our future sales, which may adversely affect our business, financial condition and operating results.If we are unable to attract and retain skilled employees, our business could be adversely impacted.We may be subject to increased turnover in our employee base or the inability to fill open headcount requisitions due to competition, concerns about our operational performance or other factors. In addition, we may rely on the performance of employees whose skill sets are not sufficiently developed to fulfill their expected job responsibilities. Either of these situations could impair or delay our ability to realize operational and strategic objectives and cause increased expenses and lost sales opportunities.Additionally, over the last several years, we made certain changes in strategic direction focusing on key technology segments. As part of this change in focus, we reduced costs of revenue and other operating expenses. Executing on this new strategic direction as well as the ongoing efficiency initiatives across the company could adversely affect our ability to retain and hire key personnel and may result in reduced productivity by our employees.The loss of the services of any of our key employees, the inability to attract or retain qualified talent in the future, or delays in hiring required talent, particularly sales and engineering talent, could delay the development and introduction of our products or services and/or negatively affect our ability to sell our products or services.15Economic or other business factors may lead us to write down the carrying amount of our goodwill or long-lived assets, which could have a material and adverse effect on our results of operations.We evaluate our goodwill for impairment annually during the fourth quarter of our fiscal year, or more frequently when indicators of impairment are present. Long-lived assets are reviewed for impairment whenever events or circumstances indicate impairment might exist. We continue to monitor relevant market and economic conditions, including the price of our stock, and perform appropriate impairment reviews when conditions deteriorate such that we believe the value of our goodwill could be further impaired or an impairment exists in our long-lived assets. We have been required to record material goodwill impairment charges in the past and it is possible that conditions could deteriorate due to economic or other factors that affect our business, resulting in the need to write down the carrying amount of our goodwill or long-lived assets to fair value at the time of such assessment. As a result of any impairment charge, our operating results could be materially and adversely affected.Third party intellectual property infringement claims could result in substantial liability and significant costs, and, as a result, our business, financial condition and operating results may be materially and adversely affected.From time to time, third parties allege our infringement of and need for a license under their patented or other proprietary technology, such as our current litigation with Crossroads Systems, Inc. described in Item 3 "Legal Proceedings." While we currently believe the amount of ultimate liability, if any, with respect to any such actions will not materially affect our financial position, results of operations or liquidity, the ultimate outcome of any license discussion or litigation is uncertain. Adverse resolution of any third party infringement claim could subject us to substantial liabilities and require us to refrain from manufacturing and selling certain products. In addition, the costs incurred in intellectual property litigation can be substantial, regardless of the outcome. As a result, our business, financial condition and operating results could be materially and adversely affected.In addition, certain products or technologies acquired or developed by us may include “open source” software. Open source software is typically licensed for use at no initial charge. Certain open source software licenses, however, require users of the open source software to license to others any software that is based on, incorporates or interacts with, the open source software under the terms of the open source license. Although we endeavor to comply fully with such requirements, third parties could claim that we are required to license larger portions of our software than we believe we are required to license under open source software licenses. If such claims were successful, they could adversely impact our competitive position and financial results by providing our competitors with access to sensitive information that may help them develop competitive products. In addition, our use of open source software may harm our business and subject us to intellectual property claims, litigation or proceedings in the future because:Open source license terms may be ambiguous and may subject us to unanticipated obligations regarding our products, technologies and intellectual property;Open source software generally cannot be protected under trade secret law; andIt may be difficult for us to accurately determine the origin of the open source code and whether the open source software infringes, misappropriates or violates third party intellectual property or other rights.As a result of our global manufacturing and sales operations, we are subject to a variety of risks related to our business outside of the U.S., any of which could, individually or in the aggregate have a material adverse effect on our business.A significant portion of our manufacturing and sales operations and supply chain occurs in countries other than the U.S. We also have sales outside the U.S. We utilize contract manufacturers to produce and fulfill orders for our products and have suppliers for various components, several of which have operations located in foreign countries including China, Hungary, Japan, Malaysia, Singapore, Mexico, the Philippines and Thailand. Because of these operations, we are subject to a number of risks including:Reduced or limited protection of our intellectual property;Compliance with multiple and potentially conflicting regulatory requirements and practices;Commercial laws that favor local businesses;Exposure to economic fluctuations including inflationary risk and continuing sovereign debt risk;Shortages in component parts and raw materials;Import and export and trade regulation changes that could erode our profit margins or restrict our ability to transport our products;The burden and cost of complying with foreign and U.S. laws governing corporate conduct outside the U.S. including the Foreign Corrupt Practices Act, the United Kingdom Bribery Act and other similar regulations;Adverse movement of foreign currencies against the U.S. dollar (the currency in which our results are reported) and global economic conditions generally;16Inflexible employee contracts and employment laws that may make it difficult to terminate or change the compensation structure for employees in some foreign countries in the event of business downturns;Recruiting employees in highly competitive markets and wage inflation in certain markets;Potential restrictions on the transfer of funds between countries;Political, military, social and infrastructure risks, especially in emerging or developing economies;Import and export duties and value-added taxes;Natural disasters, including earthquakes, flooding, typhoons and tsunamis; andCultural differences that affect the way we do business.Any or all of these risks could have a material adverse effect on our business.Our quarterly operating results could fluctuate significantly, and past quarterly operating results should not be used to predict future performance.Our quarterly operating results have fluctuated significantly in the past and could fluctuate significantly in the future. As a result, our quarterly operating results should not be used to predict future performance. Quarterly operating results could be materially and adversely affected by a number of factors, including, but not limited to:Fluctuations in IT spending as a result of economic conditions or fluctuations in U.S. federal government spending;Failure by our contract manufacturers to complete shipments in the last month of a quarter during which a substantial portion of our products are typically shipped;Customers canceling, reducing, deferring or rescheduling significant orders as a result of excess inventory levels, weak economic conditions or other factors;Seasonality, including customer fiscal year-ends and budget availability impacting customer demand for our products;Declines in large orders defined as orders greater than $200,000;Declines in royalty or software revenues;Product development and ramp cycles and product performance or quality issues of ours or our competitors;Poor execution of and performance against expected sales and marketing plans and strategies;Reduced demand from our OEM or distribution, VAR, DMR and other large customers;Increased competition which may, among other things, increase pricing pressure or reduce sales;Failure to meet the expectations of investors or analysts;Restructuring actions or unexpected costs; andForeign exchange fluctuations.If we fail to meet our projected quarterly results, our business, financial condition and results of operations may be materially and adversely affected.If we fail to protect our intellectual property or if others use our proprietary technology without authorization, our competitive position may suffer.Our future success and ability to compete depends in part on our proprietary technology. We rely on a combination of copyright, patent, trademark and trade secrets laws and nondisclosure agreements to establish and protect our proprietary technology. However, we cannot provide assurance that patents will be issued with respect to pending or future patent applications that we have filed or plan to file or that our patents will be upheld as valid or will prevent the development of competitive products or that any actions we have taken will adequately protect our intellectual property rights. We generally enter into confidentiality agreements with our employees, consultants, customers, potential customers, contract manufacturers and others as required, in which we strictly limit access to, and distribution of, our software and further limit the disclosure and use of our proprietary information.Despite our efforts to protect our proprietary rights, unauthorized parties may attempt to copy or otherwise obtain or use our products or technology. Enforcing our intellectual property rights can sometimes only be accomplished through the use of litigation. Our competitors may also independently develop technologies that are substantially equivalent or superior to our technology. In addition, the laws of some foreign countries do not protect our proprietary rights to the same extent as the laws of the U.S.17Because we may order components from suppliers in advance of receipt of customer orders for our products that include these components, we could face a material inventory risk if we fail to accurately forecast demand for our products or manage production, which could have a material and adverse effect on our results of operations and cash flows.Although we use third parties to manufacture our products, in some cases we may retain the responsibility to purchase component inventory to support third party manufacturing activities, which presents a number of risks that could materially and adversely affect our financial condition. For instance, as part of our component planning, we may place orders with or pay certain suppliers for components in advance of receipt of customer orders. We may occasionally enter into negotiated orders with vendors early in the manufacturing process of our products to ensure that we have sufficient components for our products to meet anticipated customer demand. Because the design and manufacturing process for these components can be complicated, it is possible that we could experience a design or manufacturing flaw that could delay or even prevent the production of the components for which we previously committed to pay. We also face the risk of ordering too many components, or conversely, not enough components, since supply orders are generally based on forecasts of customer orders rather than actual customer orders. In addition, in some cases, we may make non-cancelable order commitments to our suppliers for work-in-progress, supplier’s finished goods, custom sub-assemblies, discontinued (end-of-life) components and Quantum-unique raw materials that are necessary to meet our lead times for finished goods. If we cannot change or be released from supply orders, we could incur costs from the purchase of unusable components, either due to a delay in the production of the components or other supplies or as a result of inaccurately predicting supply orders in advance of customer orders. These same risks exist with our third party contract manufacturing partners. Our business and operating results could be materially and adversely affected if we incur increased costs or are unable to fulfill customer orders.Our manufacturing, component production and service repair are outsourced to third party contract manufacturers, component suppliers and service providers. If we cannot obtain products, parts and services from these third parties in a cost effective and timely manner that meets our customers’ expectations, this could materially and adversely impact our business, financial condition and results of operations.Many aspects of our supply chain and operational results are dependent on the performance of third party business partners. We increased the use of third party contract manufacturers, service providers and/or product integrators in fiscal 2014. We face a number of risks as a result of these relationships, including, among others:Sole source of product supplyIn many cases, our business partner may be the sole source of supply for the products or parts they manufacture, or the services they provide, for us. Because we are relying on one supplier, we are at greater risk of experiencing shortages, reduced production capacity or other delays in customer deliveries that could result in customer dissatisfaction, lost sales and increased expenses, each of which could materially damage customer relationships and result in lost revenue.Cost and purchase commitmentsWe may not be able to control the costs for the products our business partners manufacture for us or the services they provide to us. They procure inventory to build our products based upon a forecast of customer demand that we provide. We could be responsible for the financial impact on the contract manufacturer, supplier or service provider of any reduction or product mix shift in the forecast relative to materials that they had already purchased under a prior forecast. Such a variance in forecasted demand could require us to pay them for finished goods in excess of current customer demand or for excess or obsolete inventory and generally incur higher costs. As a result, we could experience reduced gross margins and operating losses based on these purchase commitments. With respect to service providers, although we have contracts for most of our third party repair service vendors, the contract period may not be the same as the underlying service contract with our customer. In such cases, we face risks that the third party service provider may increase the cost of providing services over subsequent periods contracted with our customer.Financial condition and stabilityOur third party business partners may suffer adverse financial or operational results or may be negatively impacted by global and local economic conditions. Therefore, we may face interruptions in the supply of product components or service as a result of financial or other volatility affecting our supply chain. We could suffer production downtime or increased costs to procure alternate products or services as a result of the possible inadequate financial condition of one or more of our business partners.18Quality and supplier conductWe have limited control over the quality of products and components produced and services provided by our supply chain and third party contract manufacturing and service business partners. Therefore, the quality of the products, parts or services may not be acceptable to our customers and could result in customer dissatisfaction, lost revenue and increased warranty costs. In addition, we have limited control over the manner in which our business partners conduct their business. Sub-tier suppliers selected by the primary third party could have process control issues or could select components with latent defects that manifest over a longer period of time. We may face negative consequences or publicity as a result of a third party’s failure to comply with applicable compliance, trade, environmental or employment regulations.Any or all of these risks could have a material adverse effect on our business. In the past we have successfully transitioned products or component supply from one supplier or manufacturing location to another without significant financial or operational impact, but there is no guarantee of our continued ability to do so.If we do not successfully manage the changes that we have made and may continue to make to our infrastructure and management, our business could be disrupted, and that could adversely impact our results of operations and financial condition.Managing change is an important focus for us. In recent years, we have implemented several significant initiatives involving our sales and marketing, engineering and operations organizations, aimed at increasing our efficiency and better aligning these groups with our corporate strategy. In addition, we have reduced headcount to streamline and consolidate our supporting functions as appropriate in response to market or competitive conditions and following past acquisitions and are increasing our reliance on certain third party business relationships. Our inability to successfully manage the changes that we implement and detect and address issues as they arise could disrupt our business and adversely impact our results of operations and financial condition.Because we rely heavily on distributors and other resellers to market and sell our products, if one or more distributors were to experience a significant deterioration in its financial condition or its relationship with us, this could disrupt the distribution of our products and reduce our revenue, which could materially and adversely affect our business, financial condition and operating results.In certain product and geographic segments we heavily utilize distributors and value added resellers to perform the functions necessary to market and sell our products. To fulfill this role, the distributor must maintain an acceptable level of financial stability, creditworthiness and the ability to successfully manage business relationships with the customers it serves directly. Under our distributor agreements with these companies, each of the distributors determines the type and amount of our products that it will purchase from us and the pricing of the products that it sells to its customers. If the distributor is unable to perform in an acceptable manner, we may be required to reduce the amount of sales of our product to the distributor or terminate the relationship. We may also incur financial losses for product returns from distributors or for the failure or refusal of distributors to pay obligations owed to us. Either scenario could result in fewer of our products being available to the affected market segments, reduced levels of customer satisfaction and/or increased expenses, which could in turn have a material and adverse impact on our business, results of operations and financial condition.We have significant indebtedness, which imposes upon us debt service obligations, and our credit facility contains various operating and financial covenants that limit our discretion in the operation of our business. If we are unable to generate sufficient cash flows from operations to meet these debt obligations or remain in compliance with the covenants, our business, financial condition and operating results could be materially and adversely affected.Our level of indebtedness presents risks to investors, both in terms of the constraints that it places on our ability to operate our business and because of the possibility that we may not generate sufficient cash to pay the principal and interest on our indebtedness as it becomes due. For example, the outstanding $83.7 million aggregate principal amount as of May 29, 2015 of our 3.50% convertible subordinated notes is payable by us on November 15, 2015. If we are unable to generate cash sufficient to meet this obligation through a refinancing or otherwise, we could default under these notes, which could cause an acceleration of our other outstanding indebtedness and could have a material effect on us. For further description of our outstanding debt, see the section captioned "Liquidity and Capital Resources" in Item 7 "Management’s Discussion and Analysis of Financial Condition and Results of Operations."19As a result of our indebtedness:We must dedicate a portion of our cash flow from operations and other capital resources to debt service, thereby reducing our ability to fund working capital, capital expenditures, research and development and other cash requirements;Our flexibility in planning for, or reacting to, changes and opportunities in the markets in which we compete may be limited, including our ability to engage in mergers and acquisitions activity, which may place us at a competitive disadvantage;We are subject to mandatory field audits and control of cash receipts by the lender if we do not maintain liquidity above certain thresholds;We may be more vulnerable to adverse economic and industry conditions;We may be unable to make payments on other indebtedness or obligations; andWe may be unable to incur additional debt on acceptable terms, if at all.Our credit facility agreement contains restrictive covenants that require us to comply with and maintain certain financial tests and ratios, as well as restrict our ability, subject to certain thresholds, to:Incur debt;Incur liens;Make acquisitions of businesses or entities or sell certain assets;Make investments, including loans, guarantees and advances;Engage in transactions with affiliates;Pay dividends or engage in stock repurchases; andEnter into certain restrictive agreements.Our ability to comply with covenants contained in this credit agreement may be affected by events beyond our control, including prevailing economic, financial and industry conditions.Our credit facility agreement is collateralized by a pledge of all of our assets. If we were to default and were unable to obtain a waiver for such a default, the lender would have a right to foreclose on our assets in order to satisfy our obligations under the credit agreement. Any such action on the part of the lender against us could have a materially adverse impact on our business, financial condition and results of operations.Our stock price has been volatile and such volatility could increase based on the trading activity of our institutional investors. In addition, there are other factors and events that could affect the trading prices of our common stock.A small number of institutional investors have owned a significant portion of our common stock at various times in recent years. If any or all of these investors were to decide to purchase significant additional shares or to sell significant amounts or all of the common shares they currently own, or if there is a perception that those sales may occur, that may cause our stock price to be more volatile. For example, there have been instances in the past where a shareholder with a significant equity position began to sell shares, putting downward pressure on our stock price for the duration of their selling activity. In these situations, selling pressure outweighed buying demand and our stock price declined. This situation has occurred due to our stock price falling below institutional investors’ price thresholds and our volatility increasing beyond investors’ volatility parameters, causing even greater selling pressure.Trading prices of our common stock may fluctuate in response to a number of other events and factors, such as:General economic conditions;Changes in interest rates;Fluctuations in the stock market in general and market prices for technology companies in particular;Quarterly variations in our operating results;Failure to meet our expectations or the expectations of securities analysts and investors;New products, services, innovations and strategic developments by our competitors or us, or business combinations and investments by our competitors or us;Changes in financial estimates by us or securities analysts and recommendations by securities analysts;Changes in our capital structure, including issuance of additional debt or equity to the public; andStrategic acquisitions.Any of these events and factors may cause our stock price to rise or fall and may adversely affect our business and financing opportunities.20Our design processes are subject to safety and environmental regulations which could lead to increased costs, or otherwise adversely affect our business, financial condition and results of operations.We are subject to a variety of laws and regulations relating to, among other things, the use, storage, discharge and disposal of materials and substances used in our facilities as well as the safety of our employees and the public. Current regulations in the U.S. and various international jurisdictions restrict the use of certain potentially hazardous materials used in electronic products and components (including lead and some flame retardants), impose a “take back” obligation on manufacturers for the financing of the collection, recovery and disposal of electrical and electronic equipment and require extensive investigation into and disclosure regarding certain minerals used in our supply chain. We have implemented procedures and will likely continue to introduce new processes to comply with current and future safety and environmental legislation. However, measures taken now or in the future to comply with such legislation may adversely affect our costs or product sales by requiring us to acquire costly equipment or materials, redesign processes or to incur other significant expenses in adapting our waste disposal and emission management processes. Furthermore, safety or environmental claims or our failure to comply with present or future regulations could result in the assessment of damages or imposition of fines against us or the suspension of affected operations, which could have an adverse effect on our business, financial condition and results of operations.We are subject to many laws and regulations, and violation of or changes in those requirements could materially and adversely affect our business.We are subject to numerous U.S. and international laws regarding corporate conduct, fair competition, corruption prevention and import and export practices, and requirements including laws applicable to U.S. government contractors. In addition, the SEC has adopted disclosure rules related to the supply of certain minerals originating from the conflict zones of the Democratic Republic of Congo or adjoining countries, and we may incurr costs to comply with such regulations and may realize other costs relating to the sourcing and availability of minerals used in our products. While we maintain a rigorous corporate ethics and compliance program, we may be subject to increased regulatory scrutiny, significant monetary fines or penalties, suspension of business opportunities or loss of jurisdictional operating rights as a result of any failure to comply with regulatory requirements. If we were to be subject to a compliance investigation, we may incur increased personnel and legal costs. We may also be exposed to potential liability resulting from our business partners' violation of these requirements. Further, our U.S. and international business models are based on currently applicable regulatory requirements and exceptions. Changes in those requirements or exceptions could necessitate changes to our business model. Any of these consequences could materially and adversely impact our business and operating results.A cybersecurity breach could adversely affect our ability to conduct our business, harm our reputation, expose us to significant liability or otherwise damage our financial results.A cybersecurity breach could negatively affect our reputation as a trusted provider of scale-out storage, archive and data protection products by adversely affecting the market’s perception of the security or reliability of our products and services. Many of our customers and partners store sensitive data on our products, and a cybersecurity breach related to our products could harm our reputation and potentially expose us to significant liability.We also maintain sensitive data related to our employees, strategic partners and customers, including intellectual property, proprietary business information and personally identifiable information on our own systems. We employ sophisticated security measures; however, we may face threats across our infrastructure including unauthorized access, security breaches and other system disruptions.It is critical to our business that our employees’, strategic partners’ and customers’ sensitive information remains secure and that our customers perceive that this information is secure. A cybersecurity breach could result in unauthorized access to, loss of, or unauthorized disclosure of such information. A cybersecurity breach could expose us to litigation, indemnity obligations, government investigations and other possible liabilities. Additionally, a cyber attack, whether actual or perceived, could result in negative publicity which could harm our reputation and reduce our customers’ confidence in the effectiveness of our solutions, which could materially and adversely affect our business and operating results. A breach of our security systems could also expose us to increased costs including remediation costs, disruption of operations or increased cybersecurity protection costs that may have a material adverse effect on our business.21We must maintain appropriate levels of service parts inventories. If we do not have sufficient service parts inventories, we may experience increased levels of customer dissatisfaction. If we hold excessive service parts inventories, we may incur financial losses.We maintain levels of service parts inventories to satisfy future warranty obligations and also to earn service revenue by providing enhanced and extended warranty and repair service during and beyond the warranty period. We estimate the required amount of service parts inventories based on historical usage and forecasts of future warranty and extended warranty requirements, including estimates of failure rates and costs to repair, and out of warranty revenue. Given the significant levels of judgment inherently involved in the process, we cannot provide assurance that we will be able to maintain appropriate levels of service parts inventories to satisfy customer needs and to avoid financial losses from excess service parts inventories. If we are unable to maintain appropriate levels of service parts inventories, our business, financial condition and results of operations may be materially and adversely impacted.From time to time we have made acquisitions. The failure to successfully integrate future acquisitions could harm our business, financial condition and operating results.As a part of our business strategy, we have in the past and may make acquisitions in the future, subject to certain debt covenants. We may also make significant investments in complementary companies, products or technologies. If we fail to successfully integrate such acquisitions or significant investments, it could harm our business, financial condition and operating results. Risks that we may face in our efforts to integrate any recent or future acquisitions include, among others:Failure to realize anticipated synergies from the acquisition;Difficulties in assimilating and retaining employees;Potential incompatibility of business cultures or resistance to change;Coordinating geographically separate organizations;Diversion of management’s attention from ongoing business concerns;Coordinating infrastructure operations in a rapid and efficient manner;The potential inability to maximize our financial and strategic position through the successful incorporation of acquired technology and rights into our products and services;Failure of acquired technology or products to provide anticipated revenue or margin contribution;Insufficient revenues to offset increased expenses associated with the acquisition;Costs and delays in implementing or integrating common systems and procedures;Reduction or loss of customer orders due to the potential for market confusion, hesitation and delay;Impairment of existing customer, supplier and strategic relationships of either company;Insufficient cash flows from operations to fund the working capital and investment requirements;Difficulties in entering markets in which we have no or limited direct prior experience and where competitors in such markets have stronger market positions;The possibility that we may not receive a favorable return on our investment, the original investment may become impaired, and/or we may incur losses from these investments;Dissatisfaction or performance problems with the acquired company;The assumption of risks of the acquired company that are difficult to quantify, such as litigation;The cost associated with the acquisition, including restructuring actions, which may require cash payments that, if large enough, could materially and adversely affect our liquidity; andAssumption of unknown liabilities or other unanticipated adverse events or circumstances.Acquisitions present many risks, and we may not realize the financial and strategic goals that were contemplated at the time of any transaction. We cannot provide assurance that we will be able to successfully integrate any business, products, technologies or personnel that we may acquire in the future, and our failure to do so could negatively impact our business, financial condition and operating results.22If the average closing price of our common stock were to drop below $1.00 per share over a consecutive thirty trading-day period, we would be out of compliance with NYSE Euronext (“NYSE”) rules, and our common stock could be delisted from trading on the NYSE, which could materially and adversely impair the liquidity and value of our common stock.During fiscal 2015, the closing price of our common stock ranged between a low of $0.99 on May 7, 2014 and a high of $1.81 on December 26, 2014. If the average closing price of our common stock does not exceed $1.00 per share over a consecutive thirty trading-day period, we would be non-compliant with NYSE continued listing standards. Once notified of such non-compliance by the NYSE, we would need to bring our share price and consecutive thirty trading-day average share price back above $1.00 per share within six months or the NYSE would commence suspension and delisting procedures. In addition, if our common stock price falls below the $1.00 threshold to the point where the NYSE considers the stock price to be “abnormally low,” the NYSE has the discretion to begin delisting proceeding immediately with respect to our common stock. There is no formal definition of “abnormally low” in the NYSE rules. If our common stock were delisted, the ability of our stockholders to sell any of our common stock at all would be severely, if not completely, limited, causing our stock price to decline further.If the future outcomes related to the estimates used in recording tax liabilities to various taxing authorities result in higher tax liabilities than estimated, then we would have to record tax charges, which could be material.We have provided amounts and recorded liabilities for probable and estimable tax adjustments that may be proposed by various taxing authorities in the U.S. and foreign jurisdictions. If events occur that indicate payments of these amounts will be less than estimated, then reversals of these liabilities would create tax benefits recognized in the periods when we determine the liabilities have reduced. Conversely, if events occur which indicate that payments of these amounts will be greater than estimated, then tax charges and additional liabilities would be recorded. In particular, various foreign jurisdictions could challenge the characterization or transfer pricing of certain intercompany transactions. In the event of an unfavorable outcome of such challenge, there exists the possibility of a material tax charge and adverse impact on the results of operations in the period in which the matter is resolved or an unfavorable outcome becomes probable and estimable.Certain changes in stock ownership could result in a limitation on the amount of net operating loss and tax credit carryovers that can be utilized each year. Should we undergo such a change in stock ownership, it would severely limit the usage of these carryover tax attributes against future income, resulting in additional tax charges, which could be material.We are exposed to fluctuations in foreign currency exchange rates, and an adverse change in foreign currency exchange rates relative to our position in such currencies could have a material adverse impact on our business, financial condition and results of operations.We do not currently use derivative financial instruments for speculative purposes. We have used in the past, and may use in the future, foreign currency forward contracts and derivative financial instruments to hedge our exposure to foreign currency exchange rates. To the extent that we have assets or liabilities denominated in a foreign currency that are inadequately hedged or not hedged at all, we may be subject to foreign currency losses, which could be significant.Our international operations can act as a natural hedge when both operating expenses and sales are denominated in local currencies. In these instances, although an unfavorable change in the exchange rate of a foreign currency against the U.S. dollar would result in lower sales when translated to U.S. dollars, operating expenses would also be lower in these circumstances. An increase in the rate at which a foreign currency is exchanged for U.S. dollars would require more of that particular foreign currency to equal a specified amount of U.S. dollars than before such rate increase. In such cases, and if we were to price our products and services in that particular foreign currency, we would receive fewer U.S. dollars than we would have received prior to such rate increase for the foreign currency. Likewise, if we were to price our products and services in U.S. dollars while competitors priced their products in a local currency, an increase in the relative strength of the U.S. dollar would result in our prices being uncompetitive in those markets. Such fluctuations in currency exchange rates could materially and adversely affect our business, financial condition and results of operations.ITEM 1B. UNRESOLVED STAFF COMMENTSNone.23ITEM 2. PROPERTIESOur headquarters are located in San Jose, California. We lease facilities in North America, Europe and Asia Pacific. The following is a summary of the significant locations and primary functions of those facilities as of March 31, 2015:LocationFunctionNorth AmericaSan Jose, CACorporate headquarters, research and developmentIrvine, CAAdministration, research and development, sales, serviceColorado Springs, COAdministration, operations management, research and development, serviceEnglewood, COResearch and development, sales, serviceMendota Heights, MNResearch and developmentRichardson, TXResearch and developmentBellevue, WAAdministration and salesOther North AmericaSalesEuropeParis, FranceSales and serviceBoehmenkirch, GermanyServiceMunich, GermanySales and serviceZurich, SwitzerlandAdministration and operationsBracknell, UKSales and serviceNorthampton, UKServiceOther EuropeSales and serviceAsia PacificAdelaide, AustraliaResearch and developmentBeijing, ChinaMarketing and salesKuala Lumpur, MalaysiaCustomer serviceSingapore City, Singapore Administration, operations management, salesOther Asia PacificSalesITEM 3. LEGAL PROCEEDINGSOn February 18, 2014, Crossroads Systems, Inc. (“Crossroads”) filed a patent infringement lawsuit against Quantum in the U.S. District Court for the Western District of Texas, alleging infringement of U.S. Patents 6,425,035 and 7,934,041. An amended complaint filed on April 15, 2014 also alleged infringement of U.S. patent 7,051,147. Crossroads asserts that we have incorporated Crossroads' patented technology into our StorNext QX and Q-Series lines of disk array products, and into our Scalar libraries. Crossroads seeks unspecified monetary damages and injunctive relief. Crossroads has already dismissed all claims of infringement with respect to the StorNext QX and Q-Series products. We believe the probability that we will pay material damages related to this lawsuit is remote.On September 23, 2014, we filed a lawsuit against Crossroads in the U.S. District Court for the Northern District of California alleging patent infringement of our patent 6,766,412 by Crossroad’s StrongBox VSeries Library Solution product. We are seeking injunctive relief and the recovery of monetary damages. On December 4, 2014, we amended our complaint alleging infringement of a second patent, 5,940,849, related to Crossroad's SPHiNX product line. On December 16, 2014, we withdrew the amended complaint alleging infringement of the second patent, 5,940,849.ITEM 4. MINE SAFETY DISCLOSURESNot applicable.24PART IIITEM 5.MARKET FOR REGISTRANT’S COMMON EQUITY, RELATED STOCKHOLDER MATTERS AND ISSUER PURCHASES OF EQUITY SECURITIESOur common stock is traded on the New York Stock Exchange under the symbol “QTM.” As of May 29, 2015, the closing price of our common stock was $2.04 per share. The prices per share reflected in the following table represent the range of high and low sales prices of our common stock for the quarters indicated:Fiscal 2015 High Low First quarter ended June 30, 2014 $ 1.22 $ 0.99 Second quarter ended September 30, 2014 1.31 1.16 Third quarter ended December 31, 2014 1.81 1.02 Fourth quarter ended March 31, 2015 1.76 1.54 Fiscal 2014 High Low First quarter ended June 30, 2013 $ 1.61 $ 1.19 Second quarter ended September 30, 2013 1.75 1.34 Third quarter ended December 31, 2013 1.59 1.10 Fourth quarter ended March 31, 2014 1.43 1.13 Historically, we have not paid cash dividends on our common stock and do not intend to pay dividends in the foreseeable future. Our ability to pay dividends is restricted by the covenants in our senior secured revolving credit agreement unless we meet certain defined thresholds. See the section captioned “Liquidity and Capital Resources” in Item 7 “Management’s Discussion and Analysis of Financial Condition and Results of Operations” and also Note 7 “Debt” to the Consolidated Financial Statements.As of May 29, 2015, there were 1,152 Quantum stockholders of record, including the Depository Trust Company, which holds shares of Quantum common stock on behalf of an indeterminate number of beneficial owners. The information required by this item regarding equity compensation plans is provided in Item 12, “Security Ownership of Certain Beneficial Owners and Management and Related Stockholder Matters.”Performance GraphThe following graph compares the cumulative total return to stockholders of Quantum common stock at March 31, 2015 for the period since March 31, 2010 to the cumulative total return over such period of (i) the NASDAQ Composite Index and (ii) the S&P Computer Storage & Peripherals Index. The graph assumes an investment of $100 on March 31, 2010 in our common stock and in each of the indices listed on the graph and reflects the change in the market price of our common stock relative to the changes in the noted indices at March 31, 2011, 2012, 2013, 2014 and 2015. The performance shown below is based on historical data and is not indicative of, nor intended to forecast, future price performance of our common stock.25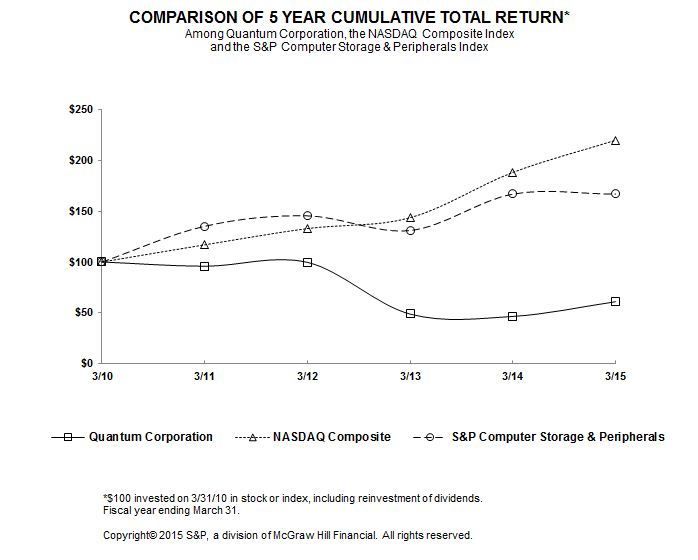
ITEM 6. SELECTED FINANCIAL DATAThis summary of selected consolidated financial information of Quantum for fiscal 2011 to 2015 should be read together with our Consolidated Financial Statements contained in this Annual Report on Form 10-K. For the year ended March 31, (In thousands, except per share data) 2015 2014 2013 2012 2011 Statement of Operations Data: Total revenue $ 553,095 $ 553,165 $ 587,439 $ 651,987 $ 673,094 Total cost of revenue 308,409 313,545 346,878 378,542 389,288 Gross margin 244,686 239,620 240,561 273,445 283,806 Income (loss) from operations 14,397 (11,799 ) (42,460 ) 4,745 25,861 Net income (loss) 16,760 (21,474 ) (52,179 ) (9,256 ) 5,698 Basic net income (loss) per share 0.07 (0.09 ) (0.22 ) (0.04 ) 0.03 Diluted net income (loss) per share 0.06 (0.09 ) (0.22 ) (0.04 ) 0.02 As of March 31, 2015 2014 2013 2012 2011 Balance Sheet Data: Total assets $ 358,755 $ 361,798 $ 368,882 $ 393,223 $ 429,223 Short-term debt 83,735 — — — 1,067 Long-term debt 70,000 203,735 205,000 184,495 238,267 26ITEM 7.MANAGEMENT’S DISCUSSION AND ANALYSIS OF FINANCIAL CONDITION AND RESULTS OF OPERATIONSOVERVIEWQuantum Corporation (“Quantum”, the “Company”, “us” or “we”), founded in 1980, is a is a leading expert in scale-out storage, archive and data protection, providing solutions for capturing, sharing and preserving digital assets over the entire data lifecycle. Our customers, ranging from small businesses to major enterprises, have trusted us to address their most demanding data workflow challenges. We provide solutions for storing and protecting information in physical, virtual and cloud environments that are designed to help customers Be Certain™ they have an end-to-end storage foundation to maximize the value of their data by making it accessible whenever and wherever needed, retaining it indefinitely and reducing total cost and complexity. We work closely with a broad network of distributors, value-added resellers (“VARs”), direct marketing resellers (“DMRs”), original equipment manufacturers (“OEMs”) and other suppliers to meet customers’ evolving needs. Our stock is traded on the New York Stock Exchange under the symbol QTM.BusinessWe believe our combination of expertise, innovation and platform independence enables us to solve scale-out storage and data protection challenges more easily, cost-effectively and securely than competitive offerings. We earn our revenue from the sale of products, systems and services through an array of channel partners and our sales force. Our products are sold under both the Quantum brand nameindustry and the namesCompany’s worldwide business in particular.various OEM customers. Our scale-out storage solutions include StorNext®media players for streaming entertainment, since December 2010 and to Universal Audio, Inc., a manufacturer of audio hardware and software StorNext appliances, StorNext Pro™ Solutions, Lattus™ extended online storage systemsplug-ins, since August 2011. From February 2010 to November 2010, he served as President and Q-CloudTM ArchiveChief Operating Officer of Roku, where his was responsible for managing all functional areas of the company. Prior to that, Mr. Krall spent two years as President and are designedChief Executive Officer of Qsecure, Inc., a developer of secure credit cards based on micro-electro-mechanical-system technology. From 1995 to help customers manage large unstructured data sets in an information workflow, encompassing high-performance ingest, real-time collaboration, scalable processing, intelligent protection and high-value monetization. Our data protection solutions include DXi® deduplication backup systems and Scalar® automated tape libraries that optimize backup and recovery, simplify management and lower cost. Our vmPRO™ virtual server backup and disaster recovery offerings protect virtual environments while minimizing the impact on servers and storage. In addition, we also offer software for cloud backup and disaster recoveryJuly 2007, he held a variety of physical and virtual servers. We have a full rangepositions of services and the global scaleincreasing responsibility and scope to support our worldwide customer base.During fiscal 2015, our focus was on providing an increasingly broad rangeat Avid Technology, Inc., a leading provider of scale-out storage solutions and expanding our footprint indigital media creation tools for the vertical market of media and entertainment which helped us to achieve record revenue for scale-out storage productsindustry. His tenure at Avid included serving seven years as the company’s President and services. We created specific product combinationsChief Executive Officer. Earlier in our StorNext Pro Solutions as well as dedicated saleshis career, Mr. Krall worked in engineering and marketing resources for this vertical market. In addition, we leveraged our install baseproject management at several companies. He holds Bachelor and Master degrees in Electrical Engineering from the Massachusetts Institute of data center customers to sell scale-out storage solutions to manage growing media files and large content workflow for these customers. We continue to pursue growth opportunities in other vertical markets and use cases where customers can benefit from our workflow-optimized solutions, including corporate video, cybersecurity, government intelligence and oil and gas. We announced new joint solutions with strategic partners that include a solution targeted for sporting event media and entertainment customers, a solution that enables customers to more easily investigate and combat cyber-attacksTechnology and a solution that optimizes workflows for the oil and gas industry. Reflecting our expansion into video surveillance, we announced the certificationMaster of a combined solution using StorNext to store large amounts of video files while optimizing system performance.We introduced new product offerings during the year, including the DXi6900, which incorporates StorNext 5 technology and is optimized for modern data protection workflows and StorNext QXS-5600, a high-capacity, high-density disk array that provides cost-effective storage for customers for a wide variety of applications. In the second quarter, we acquired Symform, Inc.'s cloud storage services platform and development team, gaining technology and expertise we plan to leverage in future scale-out storage and data protection offerings. In the fourth quarter, we announced three new Q-Cloud public cloud solutions that enable our customers to leverage Quantum's intelligent data management software to integrate the cloud into multi-tier, hybrid storage architectures for demanding workloads and to realize the full benefits of the cloud without requiring modification to existing applications or processes.In connectionBusiness Administration degree, with continuing to build our go-to-market partnerships, we entered into two new initiatives with a partner to expand our customer base: a joint focused go-to-market initiative in the U.S. whereby we are selling their branded product as part of a larger StorNext workflow solution, and a joint sales effort in Europe for a co-branded DXi6900. Additionally, we announced an agreement with a leading information technology company to offer North American customers a joint solution for large enterprise and mainframe backup and archive storage that encompasses best-in-class disk and tape technologies. We recently announced a new partnership whereby we will integrate our partner's storage arrays to our scale-out storage and data protection portfolio to further expand our range of solutions designed for managing data across its entire life cycle in demanding environments.27In fiscal 2016 we plan to increase revenue by expanding our product and solution offerings, particularly in scale-out storage, focusingdistinction, from Harvard Business School. Mr. Krall also currently serves on key vertical markets to which our solutions are well-suited and capitalizing on new go-to-market partnerships.We believe our current cash, balance sheet resources and line of credit availability are sufficient to pay off the outstanding balance of the 3.50% convertible subordinated notes due November 15, 2015 (“3.50% notes”), operate the business and fund additional growth opportunities. For additional information regarding our 3.50% notes, refer to the section below captioned "Liquidity and Capital Resources."ResultsWe had total revenue of $553.1 million in fiscal 2015, which is essentially flat compared to fiscal 2014. This is the net result of increased revenue from scale-out storage solutions, disk backup systems and service, offset by decreased tape automation systems and devices and media revenue and a $15.0 million royalty received in fiscal 2014 in connection with finalizing an intellectual property agreement that is not expected to recur. We had record revenue from scale-out storage solutions due to increased branded revenue in all geographies - Asia-Pacific (APAC), Europe, the Middle East and Africa (EMEA) and North America. Our total branded product and service revenue increased 7% from fiscal 2014 and our continued focus on our branded business is reflected in a greater proportion of non-royalty revenue from branded products and services, which grew to 88% in fiscal 2015 compared to 84% in fiscal 2014 and 83% in fiscal 2013.Our gross margin percentage increased 90 basis points from fiscal 2014 to 44.2%, the net result of higher service revenue driven by the growth in scale-out storage and the improvements we have made in our business model over the past year-and-a -half, offset by lower royalty revenue. Operating expenses decreased $20.9 million, or 8%, from fiscal 2014 primarily due to cost controls and spending reductions that were implemented over the past year. Restructuring charges decreased by $9.5 million compared to fiscal 2014, primarily related to lower severance and benefits. Compensation and benefits also decreased due to reduced staffing levels. Intangible amortization expense decreased due to certain intangibles becoming fully amortized during fiscal 2015. Our operating results improved by $26.2 million, from a loss of $11.8 million in fiscal 2014 to $14.4 million of income from operations in fiscal 2015.Net income improved by $38.2 million, from a net loss of $21.5 million in fiscal 2014 to net income of $16.8 million in fiscal 2015, which included a gain of $13.6 million resulting from the sale of our investment in a privately held company.RESULTS OF OPERATIONS FOR FISCAL 2015, 2014 and 2013Revenue For the year ended March 31, Change (dollars in thousands) 2015 2014 2013 2015 vs. 2014 2014 vs. 2013 Product revenue $ 355,579 64.3 % $ 348,318 63.0 % $ 398,910 67.9 % $ 7,261 2.1 % $ (50,592 ) (12.7 )% Service revenue 155,674 28.1 % 147,199 26.6 % 144,037 24.5 % 8,475 5.8 % 3,162 2.2 % Royalty revenue 41,842 7.6 % 57,648 10.4 % 44,492 7.6 % (15,806 ) (27.4 )% 13,156 29.6 % Total revenue $ 553,095 100.0 % $ 553,165 100.0 % $ 587,439 100.0 % $ (70 ) — % $ (34,274 ) (5.8 )% Total revenue in fiscal 2015 remained relatively flat compared to fiscal 2014. Revenue from scale-out storage solutions, disk backup systems and service revenue increased. These increases were offset by decreases in OEM and branded tape automation systems revenue, royalty revenue as well as branded devices and media revenue. The decrease in royalty revenue was primarily due to a $15.0 million royalty in connection with an intellectual property agreement received in the prior year.We believe the changes in our product and service revenue are driven by the changing storage environment, including increased market demand for scale-out storage solutions and reduced demand for tape products. Revenue from branded data protection products and services decreased $13.7 million, or 4%, from fiscal 2014, largely due to decreases in tape automation systems and media revenue. Data protection products include our tape automation systems, disk backup systems and devices and media offerings. Revenue from branded scale-out storage solutions and services increased $43.4 million, or 74%, from fiscal 2014 largely due to increased sales of our StorNext appliances. Scale-out storage solutions include StorNext software, StorNext appliances, StorNext Pro Solutions and Lattus extended online storage solutions. In addition, OEM product and service revenue, which primarily comprises tape automation systems, decreased $14.0 million from fiscal 2014.28Total revenue in fiscal 2014 decreased from fiscal 2013, driven by a decline in tape automation systems revenue and disk backup systems revenue, partially offset by increased royalty revenue and revenue from scale-out storage solutions. We believe this was due to the changing storage environment including reduced demand for tape products and increased market demand for scale-out storage solutions. Prevailing economic uncertainty also impacted fiscal 2014 results, as did the U.S. federal government shut down during fiscal 2014, which we believe negatively impacted sales. Revenue from branded data protection products and services decreased $41.5 million, or 10%, from fiscal 2013. Revenue from branded scale-out storage solutions products and services increased $6.5 million, or 12%, from fiscal 2013. OEM product and service revenue decreased $12.4 from fiscal 2013. Royalty revenue increased $13.2 million from fiscal 2013.Product RevenueTotal product revenue, which includes sales of our hardware and software products sold through both our Quantum branded and OEM channels, increased $7.3 million in fiscal 2015 compared to fiscal 2014. The increase in product revenue was primarily due to increased sales of scale-out storage solutions; revenue from disk backup systems also increased. These increases were partially offset by decreased sales of OEM and branded tape automation systems and devices and media. Revenue from sales of branded products increased 8% in fiscal 2015, and sales of products to our OEM customers decreased 20% compared to fiscal 2014.Total product revenue decreased 13% in 2014 from fiscal 2013, primarily due to decreased sales of tape automation systems followed by lower revenue from disk backup systems, partially offset by increased revenue from scale-out storage solutions and devices and media. Revenue from sales of branded products decreased 12% primarily due to lower sales of disk backup systems followed by tape automation systems decreases, and OEM product revenue decreased 14% in fiscal 2014 compared to fiscal 2013 largely due to decreased tape automation revenue. For the year ended March 31, Change (dollars in thousands) 2015 2014 2013 2015 vs. 2014 2014 vs. 2013 Tape automation systems $ 152,205 27.6 % $ 174,438 31.5 % $ 206,112 35.1 % $ (22,233 ) (12.7 )% $ (31,674 ) (15.4 )% Disk backup systems* 54,845 9.9 % 50,217 9.1 % 74,255 12.6 % 4,628 9.2 % (24,038 ) (32.4 )% Devices and media 62,642 11.3 % 70,680 12.8 % 68,724 11.7 % (8,038 ) (11.4 )% 1,956 2.8 % Scale-out storage solutions* 85,887 15.5 % 52,983 9.6 % 49,819 8.4 % 32,904 62.1 % 3,164 6.4 % Total product revenue $ 355,579 64.3 % $ 348,318 63.0 % $ 398,910 67.8 % $ 7,261 2.1 % $ (50,592 ) (12.7 )% *Revenue from disk backup systems and scale-out storage solutions was previously included in a caption entitled disk systems and software solutions. Previously reported amounts have been reclassified to conform to current period presentation.Fiscal 2015 Compared to Fiscal 2014Our branded tape automation business performed better in fiscal 2015 than our OEM tape automation systems business. Branded tape automation revenue declined 7%, or $7.4 million, compared to an OEM tape automation revenue decrease of 22%, or $14.8 million. The OEM decreases during fiscal 2015 were primarily due to a decline in revenue from midrange and enterprise systems, with midrange systems declining nearly twice as much as enterprise systems. The decline in fiscal 2015 of our branded tape automation revenue was primarily due to a decrease in sales of enterprise systems.Revenue from disk backup systems, primarily attributed to our branded business, increased 9%, or $4.6 million, during fiscal 2015. A decrease in revenue from our enterprise systems was offset by increases in revenue from entry-level systems, driven by the introduction of DXi 4700, and midrange systems, including the recently-introduced DXi 6900. The DXi 6900 scales to higher storage capacities than previous midrange systems, which contributed to the decrease in enterprise systems revenue. During fiscal 2015, we experienced an increase in large disk backup systems orders over $200,000.Product revenue from devices, which includes tape drives and removable hard drives, and non-royalty media sales decreased during fiscal 2015 primarily due to lower media sales.Our scale-out storage solutions revenue increased during fiscal 2015 primarily due to increased sales of StorNext appliances. Revenue from Lattus extended online storage and StorNext Pro Solutions products also increased, partially offset by a decrease in StorNext standalone software revenue. During fiscal 2015, we experienced an increase in large scale-out storage solutions orders over $200,000.29Fiscal 2014 Compared to Fiscal 2013Product revenue from tape automation systems revenue decreased 15% in fiscal 2014 compared to fiscal 2013, primarily due to decreased enterprise tape automation system sales, with a 24% decrease in branded enterprise sales and a 20% decline in OEM enterprise revenue. Midrange and entry-level tape automation sales also contributed to the decrease due to declines in both OEM and branded revenue from these products.Revenue from disk backup systems decreased 32% from fiscal 2013 primarily due to decreased sales of enterprise DXi systems in addition to decreased midrange disk revenue. We had lower enterprise and midrange disk system revenue primarily due to fewer large orders, or orders over $200,000, during fiscal 2014.Product revenue from devices and media, which includes tape drives, removable hard drives and non-royalty media, increased modestly from fiscal 2013 primarily due to increased branded media sales in addition to increased revenue from devices.Revenue from scale-out storage solutions increased 6% due to increased revenue from StorNext appliances compared to fiscal 2013.Service RevenueService revenue is primarily comprised of hardware service contracts, which are typically purchased by our customers to extend the warranty or to provide faster service response time, or both. Service revenue increased in both fiscal 2015 and 2014 primarily due to increased revenue from branded service contracts for our StorNext appliances. Service revenue for our data protection products experienced slight decreases in both fiscal 2015 and 2014.Royalty RevenueRoyalty revenue decreased in fiscal 2015 and increased in fiscal 2014 primarily due to a $15.0 million royalty received in connection with an intellectual property agreement in fiscal 2014. We also experienced expected decreases in DLT® media royalties in both fiscal 2015 and 2014 as customers chose to not use this older technology.Gross Margin For the year ended March 31, Change (dollars in thousands) 2015 2014 2013 2015 vs. 2014 2014 vs. 2013 Margin Margin Margin Margin Margin Product margin $ 117,900 33.2 % $ 111,242 31.9 % $ 131,636 33.0 % $ 6,658 130 $ (20,394 ) (110 ) Service margin 84,944 54.6 % 71,269 48.4 % 64,433 44.7 % 13,675 620 6,836 370 Royalty margin 41,842 100.0 % 57,648 100.0 % 44,492 100.0 % (15,806 ) — 13,156 — Gross margin $ 244,686 44.2 % $ 239,620 * 43.3 % $ 240,561 41.0 % $ 5,066 90 $ (941 ) 230 * Fiscal 2014 total gross margin includes $0.5 million of restructuring expense related to cost of revenue.The 90 basis point increase in gross margin percentage in fiscal 2015 compared to fiscal 2014 was primarily driven by an increase in the service gross margin rates and to a lesser extent, product gross margin rates. The improvement in the overall gross margin rate reflects the impact of the changes we have implemented in our operations, repair and service business models, partially offset by the decline in royalty revenue.Over half of the 230 basis point increase in gross margin percentage in fiscal 2014 compared to fiscal 2013 was due to the $13.2 million net increase in royalty revenue, and to a lesser extent, due to the improvements in our service delivery model. These increases were partially offset by decreases in our product margin, largely as a result of decreased product revenue.30Product MarginFiscal 2015 Compared to Fiscal 2014Product gross margin dollars increased $6.7 million, or 6% in fiscal 2015, and our product gross margin rate increased 130 basis points in fiscal 2015. The increase in the product gross margin rate was primarily due to shifting to an outsourced manufacturing model during the second half of fiscal 2014. Outsourcing our manufacturing has created a more variable cost model, reducing costs during fiscal 2015 that were relatively fixed during most of fiscal 2014 when the majority of our products were manufactured in our facilities. Notable cost decreases from fiscal 2014 driven by the implementation of outsourced manufacturing include compensation and benefits and facility expenses.Fiscal 2014 Compared to Fiscal 2013Product gross margin dollars decreased $20.4 million, or 15%, compared to fiscal 2013, and our product gross margin rate decreased 110 basis points primarily due to a 13% decrease in product revenue which was mostly offset by decreased costs as a result of several items. Product material costs decreased the most, commensurate with the decrease in product revenue, and we also had decreased freight costs as a result of fewer shipments. A number of expenses decreased compared to fiscal 2013 as a result of cost reduction initiatives that began in the second half of fiscal 2013 and continued throughout fiscal 2014. The most significant decreased cost as a result of these initiatives was compensation and benefits expense from reduced staffing levels in addition to decreased facility expenses from additional reductions to our warehouse footprint. We also had lower intangible amortization in fiscal 2014 from certain intangible assets becoming fully amortized.Service MarginService gross margin dollars increased $13.7 million, or 19%, in fiscal 2015 compared to fiscal 2014, and service gross margin percentage increased 620 basis points compared to fiscal 2014 on a 6% increase in service revenue. Service gross margin dollars increased $6.8 million, or 11%, in fiscal 2014 compared to fiscal 2013, and service gross margin percentage increased 370 basis points on a 2% increase in service revenue. The increase in service gross margin rate in both periods was primarily due to reduced costs as a result of continued improvements to our service delivery model, including outsourcing geographies with lower service and repair volumes and improving utilization of our service team and service parts inventories. In addition, our service activities continue to reflect a larger proportion of branded products under contract, which have margins that are relatively higher than for OEM repair services.Royalty MarginRoyalties typically do not have related cost of sales and have a 100% gross margin percentage. Therefore, royalty gross margin dollars vary directly with royalty revenue. The royalty gross margin dollar decrease in fiscal 2015 and increase in fiscal 2014 were both primarily due to a $15.0 million royalty received in fiscal 2014 which is not expected to recur.Research and Development Expenses For the year ended March 31, Change (dollars in thousands) 2015 2014 2013 2015 vs. 2014 2014 vs. 2013 Research and development $ 58,618 10.6 % $ 64,375 11.6 % $ 73,960 12.6 % $ (5,757 ) (8.9 )% $ (9,585 ) (13.0 )% Fiscal 2015 Compared to Fiscal 2014The decrease in research and development expenses compared to fiscal 2014 was primarily due to implementing cost controls and spending reductions that resulted in a $4.7 million decrease in compensation and benefits from reduced staffing levels. Additionally, there was a $1.2 million decrease in depreciation expense due to declining capital expenditures.31Fiscal 2014 Compared to Fiscal 2013The decrease in research and development expenses compared to fiscal 2013 was primarily due to cost reduction measures that resulted in a $6.6 million decrease in compensation and benefits from reduced staffing levels due to focusing investments in scale-out storage technology while continuing to invest in targeted future generation tape and disk technology. We also had a decrease of $1.5 million in external service provider expense and a decrease of $0.9 million in depreciation expense due to equipment becoming fully depreciated. Additionally, there was a $0.3 million decrease in project material expenses due to the nature of projects under development and specific development activities in the prior year periods that were not repeated at the same levels and a $0.3 million decrease in expensed equipment.Sales and Marketing Expenses For the year ended March 31, Change (dollars in thousands) 2015 2014 2013 2015 vs. 2014 2014 vs. 2013 Sales and marketing $ 113,954 20.6 % $ 118,771 21.5 % $ 136,873 23.3 % $ (4,817 ) (4.1 )% $ (18,102 ) (13.2 )% Fiscal 2015 Compared to Fiscal 2014The most significant factor driving the decrease in sales and marketing expense compared to fiscal 2014 was a $4.6 million decrease in intangible amortization expense due to certain intangibles becoming fully amortized during fiscal 2015. We had a $2.5 million decrease in compensation and benefits from decreased staffing levels. Additionally, spending reductions in fiscal 2015 resulted in decreases of $0.8 million in advertising costs, $0.8 million in travel expense and $0.8 million in external service provider expense compared to fiscal 2014. These decreases were partially offset by a $4.8 million increase in commission expense related to increased branded product revenue.Fiscal 2014 Compared to Fiscal 2013The decrease in sales and marketing expense compared to fiscal 2013 was primarily due to cost reduction initiatives that resulted in decreases of $12.8 million in compensation and benefits, including commissions, from decreased staffing levels and reduced revenue compared to fiscal 2013. We had a $2.1 million decrease in intangible amortization due to certain intangibles becoming fully amortized in the first half of fiscal 2014. Other decreases from cost reduction initiatives included declines of $1.8 million in travel expenses, $0.8 million in advertising and marketing costs and $0.7 million in recruiting expenses. These decreases were partially offset by a $1.1 million increase in external service provider expense.General and Administrative Expenses For the year ended March 31, Change (dollars in thousands) 2015 2014 2013 2015 vs. 2014 2014 vs. 2013 General and administrative $ 56,513 10.2 % $ 57,865 10.5 % $ 62,017 10.6 % $ (1,352 ) (2.3 )% $ (4,152 ) (6.7 )% Fiscal 2015 Compared to Fiscal 2014The decrease in general and administrative expense was primarily due to a $1.6 million decrease in facility-related expenses from vacating portions of various facilities in fiscal 2014 and continuing into fiscal 2015. Additionally, we had a $0.8 million decrease in depreciation expense due to declining capital expenditures. These decreases were partially offset by a $0.9 million increase in legal and advisory fees, primarily due to costs related to intellectual property matters and costs related to activities and inquiries of Starboard Value LP incurred during fiscal 2015.Fiscal 2014 Compared to Fiscal 2013The decrease in general and administrative expense was largely due to a $1.4 million decrease in compensation and benefits, largely as a result of decreased staffing as well as reduced stock compensation expense due to a modification to extend the post-retirement exercise period for certain options in the first quarter of fiscal 2013 that was not repeated. Other cost decreases included $0.8 million in facility expenses from consolidating facilities during fiscal 2014, $0.5 million due to a refund of prior IT claims, $0.4 million in depreciation expense, $0.3 million in external service provider expense and $0.3 million in expensed IT equipment.32Restructuring Charges For the year ended March 31, Change (dollars in thousands) 2015 2014 2013 2015 vs. 2014 2014 vs. 2013 Restructuring charges related to
cost of revenue$ — — % $ 539 0.1 % $ — — % $ (539 ) (100.0 )% $ 539 n/a 1,666 0.3 % 10,675 1.9 % 10,171 1.7 % (9,009 ) (84.4 )% 504 5.0 % Total restructuring charges $ 1,666 0.3 % $ 11,214 2.0 % $ 10,171 1.7 % $ (9,548 ) (85.1 )% $ 1,043 10.3 % Our restructuring plans have been undertaken in an effort to return to consistent profitability and generate cash from operations. Restructuring actions in fiscal 2015 were largely due to further consolidating our facilities in the U.S.Restructuring actions in fiscal 2014 were largely due to strategic management decisions to outsource our manufacturing and further consolidate repair and service operations, in addition to reducing research and development, sales and marketing and administrative activities and teams to align our workforce with our continuing operations plans.For additional information and disclosure of restructuring charges refer to Note 8 “Restructuring Charges” to the Consolidated Financial Statements. Until we achieve consistent and sustainable levels of profitability, we may incur restructuring charges in the future from additional strategic cost reduction efforts.Fiscal 2015 Compared to Fiscal 2014Restructuring charges decreased in fiscal 2015 compared to fiscal 2014 primarily due to decreased severance and benefits restructuring and facility restructuring charges. Severance and benefits restructuring charges decreased $5.7 million in fiscal 2015 compared to fiscal 2014 primarily due to strategic management decisions to outsource our manufacturing operations and further consolidate production and service activities in fiscal 2014. Facility restructuring charges decreased $3.1 million in fiscal 2015 compared to fiscal 2014 primarily due to vacating a majority of our manufacturing and warehouse facilities in the U.S. in fiscal 2014.Fiscal 2014 Compared to Fiscal 2013Restructuring charges increased in fiscal 2014 compared to fiscal 2013 primarily due to increased facility restructuring and other restructuring charges, largely attributable to our decision to outsource our manufacturing operations. Facility restructuring charges increased $2.4 million from fiscal 2013 primarily due to vacating a majority of our manufacturing and warehouse facilities, all of which are in the U.S. Other restructuring charges increased $0.8 million primarily due to restructuring charges related to cost of sales incurred as a result of our manufacturing outsourcing decision. These were partially offset by a $2.1 million decrease in severance charges largely due to a higher average severance charge per position in the prior year as a result of the specific job type, tenure and geographies of the positions eliminated.Gain on Sale of Assets For the year ended March 31, Change (dollars in thousands) 2015 2014 2013 2015 vs. 2014 2014 vs. 2013 Gain on sale of assets $ 462 0.1 % $ 267 0.0 % $ — — % $ 195 73.0 % $ 267 n/a We had a $0.5 million gain on the sale of assets primarily due to the sale of IP addresses in fiscal 2015.33Other Income and Expense For the year ended March 31, Change (dollars in thousands) 2015 2014 2013 2015 vs. 2014 2014 vs. 2013 Other income and (expense) $ 13,836 2.5 % $ 1,296 0.2 % $ (216 ) 0.0 % $ 12,540 967.6 % $ 1,512 n/m Fiscal 2015 Compared to Fiscal 2014The increase in other income in fiscal 2015 compared to fiscal 2014 was primarily due to a $12.8 million increase in investment gains largely due to a $13.6 million gain on the sale of our investment in a privately held company in fiscal 2015.Fiscal 2014 Compared to Fiscal 2013Other income in fiscal 2014 was primarily attributable to an $0.8 million increase from foreign currency gains in fiscal 2014 compared to foreign currency losses in fiscal 2013. The foreign currency gains in fiscal 2014 were primarily attributable to a strengthening of the U.S. dollar against the Australian dollar. The foreign currency losses in fiscal 2013 were largely due to strengthening of the U.S. dollar against the euro.Interest Expense For the year ended March 31, Change (dollars in thousands) 2015 2014 2013 2015 vs. 2014 2014 vs. 2013 Interest expense $ 9,460 1.7 % $ 9,754 1.8 % $ 8,342 1.4 % $ (294 ) (3.0 )% $ 1,412 16.9 % Interest expense includes the amortization of debt issuance costs for debt facilities. For further information, refer to Note 7 “Debt” to the Consolidated Financial Statements.Interest expense decreased in fiscal 2015 from fiscal 2014 due to the purchase of $50.0 million of aggregate principal amount of 3.50% convertible subordinated notes in January 2015. Interest expense increased in fiscal 2014 from fiscal 2013 primarily due to refinancing our revolving debt balance in the third quarter of fiscal 2013 with 4.50% convertible subordinated notes. These convertible subordinated notes have a higher interest rate and a larger principal balance.Loss on Debt Extinguishment For the year ended March 31, Change (dollars in thousands) 2015 2014 2013 2015 vs. 2014 2014 vs. 2013 Loss on debt extinguishment $ 1,295 0.2 % $ — — % $ — — % $ 1,295 n/a $ — n/a The loss on debt extinguishment in fiscal 2015 was due to the purchase of $50.0 million of aggregate principal amount of the 3.50% convertible subordinated notes for $51.0 million. In connection with this transaction, we recorded a loss on debt extinguishment of $1.3 million comprised of the loss of $1.0 million from the notes purchased and a write-off of $0.3 million of unamortized debt costs related to the purchased notes. For further information, refer to Note 7 “Debt” to the Consolidated Financial Statements.34Income Taxes For the year ended March 31, Change (dollars in thousands) 2015 2014 2013 2015 vs. 2014 2014 vs. 2013 % of
pre-tax income % of
pre-tax loss % of
pre-tax loss Income tax provision $ 718 4.1 % $1,217 (6.0 )% $ 1,161 (2.3 )% $ (499 ) (41.0 )% $ 56 4.8% The decrease in income tax provision was primarily due to lower foreign taxes in fiscal 2015 compared to fiscal 2014. Income tax provision was essentially unchanged in fiscal 2014 compared to fiscal 2013. Tax expense in fiscal 2015, 2014 and 2013 was primarily comprised of foreign income taxes and state taxes. For additional information, including a reconciliation of the effective tax rate, refer to Note 11 “Income Taxes” to the Consolidated Financial Statements.Amortization of Intangible AssetsThe following table details intangible asset amortization expense by classification within our Consolidated Statements of Operations (in thousands): For the year ended March 31, Change 2015 2014 2013 2015 vs. 2014 2014 vs. 2013 Cost of revenue $ 913 $ 1,476 $ 3,775 $ (563 ) (38.1 )% $ (2,299 ) (60.9 )% Sales and marketing 2,784 7,426 9,524 (4,642 ) (62.5 )% (2,098 ) (22.0 )% $ 3,697 $ 8,902 $ 13,299 $ (5,205 ) (58.5 )% $ (4,397 ) (33.1 )% The decreases in intangible asset amortization in fiscal 2015 and 2014 compared to the respective prior years was due to certain intangible assets becoming fully amortized. Refer to Note 5 “Intangible Assets and Goodwill” to the Consolidated Financial Statements for further information regarding our amortizable intangible assets.Share-Based CompensationThe following table summarizes share-based compensation within our Consolidated Statements of Operations (in thousands): For the year ended March 31, Change 2015 2014 2013 2015 vs. 2014 2014 vs. 2013 Cost of revenue $ 1,489 $ 1,963 $ 2,389 $ (474 ) (24.1 )% $ (426 ) (17.8 )% Research and development 2,559 3,430 3,665 (871 ) (25.4 )% (235 ) (6.4 )% Sales and marketing 3,506 4,097 4,699 (591 ) (14.4 )% (602 ) (12.8 )% General and administrative 4,029 3,969 4,386 60 1.5 % (417 ) (9.5 )% $ 11,583 $ 13,459 $ 15,139 $ (1,876 ) (13.9 )% $ (1,680 ) (11.1 )% Fiscal 2015 Compared to Fiscal 2014The decrease in share-based compensation in fiscal 2015 was primarily due to a $1.3 million decrease in the restricted stock expense resulting from a lower fair value of restricted stock units. We also had a $0.4 million decrease in stock purchase plan expense as a result of decreased headcount.Fiscal 2014 Compared to Fiscal 2013The decrease in share-based compensation in fiscal 2014 was primarily due to a $0.9 million decrease in option expense due to option modifications in fiscal 2013 that were not repeated in addition to existing options becoming fully vested during fiscal 2014. We also had a $0.6 million decrease in stock purchase plan expense due to a combination of decreased employee contributions as a result of reduced staffing from fiscal 2013 and lower stock prices.35LIQUIDITY AND CAPITAL RESOURCESCapital Resources and Financial ConditionAs of March 31, 2015, we had $67.9 million of cash and cash equivalents which is comprised of money market funds and cash deposits.We continue to focus on improving our operating performance, including efforts to increase revenue and to continue to control costs in order to improve margins, return to consistent profitability and generate positive cash flows from operating activities. We believe that our existing cash and capital resources will be sufficient to meet all currently planned expenditures, debt service, contractual obligations and sustain operations for at least the next 12 months. This belief is dependent upon our ability to achieve gross margin projections and to control operating expenses in order to provide positive cash flow from operating activities. Although we recorded facility restructuring charges in fiscal 2015 and anticipate another nominal charge in fiscal 2016, payments for the accrued facility restructuring will be made monthly in accordance with the lease agreements, which continue through February 2021. As a result, the facility restructuring is not expected to change our cash requirements. Our cash outlay for these lease payments could be reduced in the future if we are able to sublease facilities. Should any of the above assumptions prove incorrect, either in combination or individually, it would likely have a material negative effect on our cash balances and capital resources.The following is a description of our existing capital resources including outstanding balances, funds available to borrow and primary repayment terms including interest rates. For additional information, see Note 7 “Debt” to the Consolidated Financial Statements.We have $153.7 million of convertible subordinated debt outstanding in addition to a line of credit under a Wells Fargo Credit agreement, inclusive of amendments (“WF credit agreement”). The $153.7 million of convertible subordinated debt is comprised of $83.7 million of 3.50% convertible subordinated notes due November 15, 2015 (“3.50% notes”) and $70 million of 4.50% convertible subordinated notes due November 15, 2017 (“4.50% notes”). Both the 3.50% notes and the 4.50% notes have required semi-annual interest payments and no early call provisions. Interest payments related to the 3.50% notes and 4.50% notes are paid on May 15 and November 15 of each year. We paid $5.1 million of interest on the 3.50% notes and $3.2 million of interest on the 4.50% notes in fiscal 2015.On January 28, 2015, we entered into a private transaction with a note holder to purchase $50.0 million of aggregate principal amount of the 3.50% notes for $51.0 million. In connection with this transaction, we recorded a loss on debt extinguishment of $1.3 million comprised of the loss of $1.0 million from the notes we purchased and a write-off of $0.3 million of unamortized debt costs related to the purchased notes. We also paid accrued interest on the purchased notes of $0.4 million. We funded this transaction using cash on hand.Under the WF credit agreement, as amended, we have the ability to borrow the lesser of $75 million or the amount of the monthly borrowing base under a senior secured revolving credit facility. The WF credit agreement matures March 29, 2017 so long as an amount sufficient to repay the 3.50% notes is available for borrowing under the WF credit agreement or is deposited in a WF controlled account prior to August 16, 2015. Otherwise, the WF credit agreement matures on August 16, 2015. Quarterly, we are required to pay a 0.375% commitment fee on undrawn amounts under the revolving credit facility. There is a blanket lien on all of our assets under the WF credit agreement in addition to certain financial and reporting covenants. We have letters of credit totaling $1.0 million, reducing the maximum amount available to borrow by this amount at May 29, 2015. As of May 29, 2015, and during fiscal 2015, we were in compliance with all covenants and had no outstanding balance on the line of credit.The interest rate on amounts borrowed is based on an election by us of an annual rate equal to (1) a base rate established by Wells Fargo plus an applicable margin of 1.0% to 1.5%, based on availability levels under the WF credit agreement or (2) the LIBOR rate plus an applicable margin ranging from 2.0% and 2.5%, based on availability levels under the WF credit agreement. The base rate is defined in the WF credit agreement.The WF credit agreement contains customary covenants, including cross-default provisions, as well as financial covenants. Average liquidity must exceed $15 million each month. The fixed charge coverage ratio is required to be greater than 1.2 for the 12 month period ending on the last day of any month in which the covenant is applicable. This covenant is applicable only in months in which borrowings exceed $5 million at any time during the month and was not applicable in fiscal 2015. To avoid triggering mandatory field audits and Wells Fargo controlling our cash receipts, we must maintain liquidity of at least $20 million at all times. Repurchases of the subordinated convertible notes is allowed as long as we have a proforma fixed coverage ratio of 1.5 and liquidity of $25 million. The fixed charge coverage ratio, average liquidity and liquidity are defined in the WF credit agreement and/or amendments. Certain schedules in the compliance certificate must be filed monthly if borrowings exceed $5 million; otherwise they are to be filed quarterly.36Generation of positive cash flow from operating activities has historically been, and will continue to be, an important source of cash to fund operating needs and meet our current and long-term obligations. We plan to utilize a combination of cash on hand and cash available under the WF credit agreement to repay the outstanding balance of the 3.50% notes while maintaining sufficient cash to fund operating needs and other obligations. While, we expect that we will repay the outstanding balance of the 3.50% notes using currently available resources as described, we may choose to raise additional capital if strategically advantageous to the company. We can provide no assurance that such financing would be available to us on commercially acceptable terms or at all.We have taken many actions in recent years to offset the negative impact of economic uncertainty and slow economic growth and their impact on the data protection and scale-out storage markets. We cannot provide assurance that the actions we have taken in the past or any actions we may take in the future will ensure a consistent, sustainable and sufficient level of net income and positive cash flow from operating activities to fund, sustain or grow our business. Certain events that are beyond our control, including prevailing economic, competitive and industry conditions, as well as various legal and other disputes, may prevent us from achieving these financial objectives. Any inability to achieve consistent and sustainable net income and cash flow could result in:(i)Restrictions on our ability to manage or fund our existing operations, which could result in a material and adverse effect on our future results of operations and financial condition.(ii)Unwillingness on the part of the lenders to do any of the following:Provide a waiver or amendment for any covenant violations we may experience in future periods, thereby triggering a default under, or termination of, the revolving credit line, orApprove any amendments to the credit agreement we may seek to obtain in the future.Any lack of renewal, waiver, or amendment, if needed, could result in the revolving credit line becoming unavailable to us and any amounts outstanding becoming immediately due and payable.(iii)Further impairment of our financial flexibility, which could require us to raise additional funding in the capital markets sooner than we otherwise would, and on terms less favorable to us, if available at all.Any of the above mentioned items, individually or in combination, could have a material and adverse effect on our results of operations, available cash and cash flows, financial condition, access to capital and liquidity.Cash FlowsFollowing is a summary of cash flows from operating, investing and financing activities (in thousands): As of or for the year ended March 31, (In thousands) 2015 2014 2013 Cash and cash equivalents $ 67,948 $ 99,125 $ 68,976 Net income (loss) 16,760 (21,474 ) (52,179 ) Net cash provided by operating activities 6,034 35,474 7,735 Net cash provided by (used in) investing activities 11,641 (6,649 ) (10,908 ) Net cash provided by (used in) financing activities (48,641 ) 1,285 20,975 Fiscal 2015The $10.7 million difference between reported net income and cash provided by operating activities during fiscal 2015 was primarily due to a $22.6 million increase in accounts receivable, a $19.7 million increase in manufacturing inventories and a $13.6 million gain on sale of other investments, offset by $29.0 million of non-cash items and a $12.8 million increase in accounts payable. The increase in accounts receivable was primarily due to increased product revenue and service billings in the fourth quarter of fiscal 2015 as compared to the fourth quarter of fiscal 2014. The increases in manufacturing inventories and accounts payable were due to increased inventory purchases to ensure adequate quantities on hand to fulfill orders. The largest non-cash items included share-based compensation, depreciation, amortization and service parts lower of cost or market adjustment.Cash provided by investing activities was primarily due to $15.1 million of proceeds of sale of other investments in a privately held company, partially offset by $3.2 million of property and equipment purchases. Equipment purchases were primarily for engineering equipment for product development and permanent demo units.Cash used in financing activities was primarily due to the purchase of $50.0 million of aggregate principal amount of convertible subordinated debt.37Fiscal 2014The $56.9 million difference between reported net loss and cash provided by operating activities during fiscal 2014 was primarily due to $46.1 million in non-cash items, the largest of which were share-based compensation, service parts lower of cost or market adjustment, depreciation and amortization. In addition, we had a $13.4 million decrease in manufacturing inventories primarily due to outsourcing our manufacturing operations and an $8.7 million increase in deferred revenue primarily due to increased service contract revenue deferred at March 31, 2014 compared to March 31, 2013. These were partially offset by a $6.1 million decrease in accrued compensation due to decreased staffing and timing of payroll payments, and a $5.9 million decrease in accounts payable primarily due to decreased purchases.Cash used in investing activities was primarily due to $6.0 million of property and equipment purchases. Equipment purchases were primarily for engineering equipment to support product development activities, IT equipment and software, largely related to an ERP system upgrade, leasehold improvements in locations we started leasing in the second quarter of fiscal 2014 and the purchase of permanent demo units.Cash provided by financing activities during fiscal 2014 was primarily due to receipt of $4.4 million from the exercise of stock options and issuance of shares under the employee stock purchase plan, partially offset by $1.9 million paid for taxes due upon vesting of restricted stock and the purchase of $1.3 million of convertible subordinated debt.Fiscal 2013The $59.9 million difference between reported net loss and cash provided by operating activities during fiscal 2013 was primarily due to $52.1 million in non-cash items, the largest of which were share-based compensation, amortization, depreciation and service parts lower of cost or market adjustment. In addition, we had an $11.9 million decrease in accounts receivable primarily due to lower revenue and service billings in the fourth quarter of fiscal 2013 than the fourth quarter of fiscal 2012. This was partially offset by an $8.6 million decrease in accounts payable primarily due to decreased purchases and the timing of payments.Cash used in investing activities was primarily due to $10.1 million of property and equipment purchases and $2.2 million used to purchase other investments. Equipment purchases were primarily for engineering equipment and testing hardware to support product development activities and equipment to update our network. We also made leasehold improvements to a location we started leasing in the first quarter of fiscal 2013. Other investment purchases we made were in private technology companies with products or features complementary to Quantum products and our strategy.Cash provided by financing activities during fiscal 2013 was primarily due to $18.2 million in net borrowings from issuing convertible subordinated debt and repaying our line of credit balance from a portion of the convertible debt proceeds. In addition, we received $4.8 million from the exercise of stock options and issuance of shares under the employee stock purchase plan, partially offset by $2.0 million paid for taxes due upon vesting of restricted stock.Off Balance Sheet ArrangementsLease CommitmentsWe lease certain facilities under non-cancelable lease agreements. Some of the leases have renewal options ranging from one to ten years and others contain escalation clauses and provisions for maintenance, taxes or insurance. We also have equipment leases for computers and other office equipment. Future minimum lease payments under these operating leases are shown below in the “Contractual Obligations” section.Commitments to Purchase InventoryWe use contract manufacturers for our manufacturing operations. Under these arrangements, the contract manufacturer procures inventory to manufacture products based upon our forecast of customer demand. We have similar arrangements with certain other suppliers. We are responsible for the financial impact on the supplier or contract manufacturer of any reduction or product mix shift in the forecast relative to materials that the third party had already purchased under a prior forecast. Such a variance in forecasted demand could require a cash payment for inventory in excess of current customer demand or for costs of excess or obsolete inventory. As of March 31, 2015, we had issued non-cancelable commitments for $46.0 million to purchase inventory from our contract manufacturers and suppliers.38Stock RepurchasesDuring fiscal 2000, the Board of Directors authorized us to repurchase up to $700 millionfor Universal Audio, Audinate Pty Ltd., and Progress Software Corp. He is the Chair of our common stock in open market purchases or private transactions. As of March 31, 2015, $87.9 million remained under this authorization. No stock repurchases were made during the fiscal years ended March 31, 2015, 2014 or 2013. Our ability to repurchase our common stock is restricted unless we meet certain thresholds under the terms of the WF credit agreement.Contractual ObligationsThe table below summarizes our contractual obligations as of March 31, 2015 (in thousands): Payments Due by Period 1 – 3 years 3 –5 years Total Convertible subordinated debt $ 89,811 $ 76,300 $ — $ — $ 166,111 Purchase obligations 46,019 — — — 46,019 Operating leases: Lease payments 9,107 12,734 9,555 4,459 35,855 Sublease rental income (587 ) (1,895 ) (1,852 ) (813 ) (5,147 ) Total operating leases 8,520 10,839 7,703 3,646 30,708 Total contractual cash obligations $ 144,350 $ 87,139 $ 7,703 $ 3,646 $ 242,838 The contractual commitments shown above include $12.4 million in interest payments on our various debt obligations. As of March 31, 2015, we had $5.1 million of long-term tax liabilities for uncertain tax positions, for which we cannot make a reasonably reliable estimate of when payments are likely to occur.RECENT ACCOUNTING PRONOUNCEMENTSSee Recent Accounting Pronouncements in Note 2 “Summary of Significant Accounting Policies”Quantum’s Leadership and Compensation Committee. Mr. Krall brings to the Consolidated Financial Statements for a full description of recent accounting pronouncements including the respective expected dates of adoption and effects on our results of operations and financial condition.CRITICAL ACCOUNTING ESTIMATES AND POLICIESOur discussion and analysis of the financial condition and results of operations is based on the accompanying Consolidated Financial Statements, which have been prepared in accordance with accounting principles generally accepted in the U.S. The preparation of these statements requires us to make significant estimates and judgments about future uncertainties that affect reported assets, liabilities, revenues and expenses and related disclosures. We base our estimates on historical experience and on various other assumptions believed to be reasonable under the circumstances. Our significant accounting policies are presented within Note 2 to the Consolidated Financial Statements. Our critical accounting estimates require the most difficult, subjective or complex judgments and are described below. An accounting estimate is considered critical if it requires estimates about the effect of matters that are inherently uncertain when the estimate is made, if different estimates reasonably could have been used or if changes in the estimate that are reasonably possible could materially impact the financial statements. We have discussed the development, selection and disclosure of our critical accounting policies with the Audit Committee of ourQuantum Board of Directors. We believe the assumptions and estimates used and the resulting balances are reasonable; however, actual results may differ from these estimates under different assumptions or conditions.Revenue RecognitionApplication of the various accounting principles related to measurement and recognition of revenue requires us to make judgments and estimates in the following related areas: determining estimated selling prices and allocating revenue based on the relative selling prices in arrangements with multiple deliverables, including assessing whether we have vendor-specific objective evidence (“VSOE”) or third-party evidence of selling price (“TPE”) for each deliverable; the interpretation of non-standard terms and conditions in sales agreements; assessments of future price adjustments, such as rebates, price protection and future product returns and estimates for contractual licensee fees.39When we enter into sales arrangements with customers that contain multiple deliverables such as hardware, software and services, these arrangements require us to identify each deliverable and determine its estimated selling price following the relative selling price hierarchy. Additionally, we sometimes use judgment in order to determine the appropriate timing of revenue recognition and to assess whether any software and non-software components function together to deliver a tangible product’s essential functionality in order to ensure the arrangement is properly accounted for as software or hardware revenue.When we enter into multiple deliverable revenue arrangements with customers which are not subject to software revenue guidance, we use judgment to (1) separate the deliverables based on specific criteria, (2) assign an estimated selling price to each deliverable based on the selling price hierarchy using VSOE, TPE or best estimate of selling price (“BESP”) and (3) allocate the total arrangement consideration using the relative selling price method. When VSOE cannot be established we attempt to establish the selling price of each element based on TPE. TPE is determined based on competitor prices for largely interchangeable products when sold separately. When we are unable to establish selling price using VSOE or TPE, we use BESP. We use judgment to determine BESP, which is the price at which we would transact a sale if the product or service were regularly sold on a standalone basis. In this determination we consider our discounting and internal pricing practices, external market conditions and competitive positioning for similar offerings.While the majority of our sales arrangements contain standard terms and conditions, we sometimes apply judgment when interpreting complex arrangements with non-standard terms and conditions to determine the appropriate accounting and timing of revenue recognition. An example of such a judgment is deferring revenue related to significant post-delivery obligations and customer acceptance criteria until such obligations are fulfilled.For software products, we generally recognize revenue upon delivery of the software. Revenue from post-contract customer support agreements, which entitle software customers to both telephone support and any unspecified upgrades and enhancements during the term of the agreement, is classified as product revenue and recognized ratably over the term of the support agreement.We license certain software to customers under licensing agreements that allow those customers to embed the software into specific products they offer. As consideration, licensees pay us a fee based on the amount of sales of their products that incorporate our software. On a periodic and timely basis, the licensees provide us with reports listing their sales to end users for which they owe us license fees. Similarly, royalty revenue is estimated from licensee reports of units sold to end users subject to royalties under master contracts. In both cases, these reports are used to substantiate delivery and we recognize revenue based on the information in these reports or when amounts can be reasonably estimated.Inventory AllowancesOur manufacturing and service parts inventories are stated at the lower of cost or market, with cost computed on a first-in, first-out (“FIFO”) basis. Adjustments to reduce the carrying value of both manufacturing and service parts inventories to their net realizable value are made for estimated excess, obsolete or impaired balances. Factors influencing these adjustments include significant estimates and judgments about the future of product life cycles, product demand, rapid technological changes, development plans, product pricing, physical deterioration, quality issues, end of service life plans and volume of enhanced or extended warranty service contracts.Accrued WarrantyWe estimate future product failure rates based upon historical product failure trends as well as anticipated future failure rates if believed to be significantly different from historical trends. Similarly, we estimate future costs of repair based upon historical trends and anticipated future costs if they are expected to significantly differ, for example due to negotiated agreements with third parties. We use a consistent model and exercise considerable judgment in determining the underlying estimates. Our model requires an element of subjectivity for all of our products. For example, historical return rates are not completely indicative of future return rates and we must therefore exercise judgment with respect to future deviations from our historical return rates. When actual failure rates differ significantly from our estimates, we record the impact in subsequent periods and update our assumptions and forecasting models accordingly. As our newer products mature, we are able to improve our estimates with respect to these products.40Income TaxesA number of estimates and judgments are necessary to determine deferred tax assets, deferred tax liabilities and valuation allowances. We recognize the benefit from a tax position only if it is more-likely-than-not that the position would be sustained upon audit based solely on the technical merits of the tax position. The calculation of our tax liabilities requires judgment related to uncertainties in the application of complex tax regulations. It is inherently difficult and subjective to estimate such amounts, as we have to determine the probability of various possible outcomes. We reevaluate these uncertain tax positions on a quarterly basis. This evaluation is based on factors including, but not limited to, changes in facts or circumstances, changes in tax law, effectively settled issues under audit and new audit activity.We have provided a full valuation allowance against our U.S. net deferred tax assets due to our history of net losses, difficulty in predicting future results and our conclusion that we cannot rely on projections of future taxable income to realize the deferred tax assets. In addition, we have provided a full valuation allowance against certain of our international net deferred tax assets. Due to reorganizations in these jurisdictions, it is unclear whether we will be able to realize a benefit from these deferred tax assets. Also, certain changes in stock ownership could result in a limitation on the amount of net operating loss and tax credit carryovers that can be utilized each year. Should we undergo such a change in stock ownership, it would severely limit the usage of these carryover tax attributes against future income, resulting in additional tax charges.Significant management judgment is required in determining our deferred tax assets and liabilities and valuation allowances for purposes of assessing our ability to realize any future benefit from our net deferred tax assets. We intend to maintain this valuation allowance until sufficient evidence exists to support the reversal of the valuation allowance. Future income tax expense will be reduced to the extent that we have sufficient evidence to support a reversal or decrease in this allowance. We also have deferred tax assets and liabilities due to prior business acquisitions with corresponding valuation allowances after assessing our ability to realize any future benefit from these acquired net deferred tax assets.ITEM 7A. QUANTITATIVE AND QUALITATIVE DISCLOSURES ABOUT MARKET RISKInterest Rate RiskChanges in interest rates affect interest income earned on our cash equivalents, which consisted solely of money market funds in fiscal 2015 and 2014. During both fiscal 2015 and 2014, interest rates on these funds were under 1.0% and we earned a negligible amount of interest income, thus a hypothetical 100 basis point decrease in interest rates would have an insignificant impact on interest income.We had no outstanding borrowings under the WF credit agreement and our convertible subordinated notes have fixed interest rates, thus a hypothetical 100 basis point increase in interest rates would not impact interest expense.Foreign Exchange RiskWe conduct business in certain international markets, primarily in the European Union. Because we operate in international markets, we have exposure to different economic climates, political arenas, tax systems and regulations that could affect foreign exchange rates. Our primary exposure to foreign currency risk relates to transacting in foreign currency and recording the activity in U.S. dollars. Changes in exchange rates between the U.S. dollar and these other currencies will result in transaction gains or losses, which we recognize in our Consolidated Statements of Operations.To the extent practicable, we minimize our foreign currency exposures by maintaining natural hedges between our assets and liabilities and revenues and expenses denominated in foreign currencies. Additionally, in fiscal 2015 we entered into a foreign currency option contract to economically hedge euro product revenue exposures. We may enter into foreign exchange derivative contracts or other economic hedges in the future. Our goal in managing our foreign exchange risk is to reduce to the extent practicable our potential exposure to the changes that exchange rates might have on our earnings. We make a number of estimates in conducting hedging. In the event those estimates differ significantly from actual results, we could experience greater volatility as a result of our hedges.41ITEM 8. FINANCIAL STATEMENTS AND SUPPLEMENTARY DATAINDEX TO CONSOLIDATED FINANCIAL STATEMENTSPageQuantum Corporation – Financial Statements42Report of Independent Registered Public Accounting FirmTo the Board of Directors andStockholders of Quantum Corporation:In our opinion, the accompanying consolidated balance sheets and the related consolidated statements of operations, of comprehensive income (loss), of cash flows, and of stockholders’ deficit present fairly, in all material respects, the financial position of Quantum Corporation and its subsidiaries at March 31,2015 and March 31, 2014, and the results of their operations and their cash flows for each of the three years in the period ended March 31, 2015 in conformity with accounting principles generally accepted in the United States of America. In addition, in our opinion, the financial statement schedule listed in the accompanying indexpresents fairly, in all material respects, the information set forth therein when read in conjunction with the related consolidated financial statements. Also in our opinion, the Company maintained, in all material respects, effective internal control over financial reporting as of March 31, 2015, based on criteria established in Internal Control - Integrated Framework 2013 issued by the Committee of Sponsoring Organizations of the Treadway Commission (COSO). The Company’s management is responsible for these financial statements and financial statement schedule, for maintaining effective internal control over financial reporting and for its assessment of the effectiveness of internal control over financial reporting included in Management’s Report on Internal Control over Financial Reporting, appearing under item 9A. Our responsibility is to express opinions on these financial statements, on the financial statement schedule, and on the Company’s internal control over financial reporting based on our integrated audits. We conducted our audits in accordance with the standards of the Public Company Accounting Oversight Board (United States). Those standards require that we plan and perform the audits to obtain reasonable assurance about whether the financial statements are free of material misstatement and whether effective internal control over financial reporting was maintained in all material respects. Our audits of the financial statements included examining, on a test basis, evidence supporting the amounts and disclosures in the financial statements, assessing the accounting principles used and significant estimates made by management, and evaluating the overall financial statement presentation. Our audit of internal control over financial reporting included obtaining an understanding of internal control over financial reporting, assessing the risk that a material weakness exists, and testing and evaluating the design and operating effectiveness of internal control based on the assessed risk. Our audits also included performing such other procedures as we considered necessary in the circumstances. We believe that our audits provide a reasonable basis for our opinions.A company’s internal control over financial reporting is a process designed to provide reasonable assurance regarding the reliability of financial reporting and the preparation of financial statements for external purposes in accordance with generally accepted accounting principles. A company’s internal control over financial reporting includes those policies and procedures that (i) pertain to the maintenance of records that, in reasonable detail, accurately and fairly reflect the transactions and dispositions of the assets of the company; (ii) provide reasonable assurance that transactions are recorded as necessary to permit preparation of financial statements in accordance with generally accepted accounting principles, and that receipts and expenditures of the company are being made only in accordance with authorizations of management and directors of the company; and (iii) provide reasonable assurance regarding prevention or timely detection of unauthorized acquisition, use, or disposition of the company’s assets that could have a material effect on the financial statements.Because of its inherent limitations, internal control over financial reporting may not prevent or detect misstatements. Also, projections of any evaluation of effectiveness to future periods are subject to the risk that controls may become inadequate because of changes in conditions, or that the degree of compliance with the policies or procedures may deteriorate./s/ PricewaterhouseCoopers LLPSeattle, WashingtonJune 12, 201543QUANTUM CORPORATIONCONSOLIDATED BALANCE SHEETS(In thousands, except par value) March 31, 2015 March 31, 2014 Assets Current assets: Cash and cash equivalents $ 67,948 $ 99,125 Restricted cash 2,621 2,760 Accounts receivable, net of allowance for doubtful accounts of $27 and $88, respectively 124,159 101,605 Manufacturing inventories 50,274 34,815 Service parts inventories 24,640 25,629 Other current assets 12,332 10,161 Total current assets 281,974 274,095 Long-term assets: Property and equipment, less accumulated depreciation 14,653 17,574 Intangible assets, less accumulated amortization 731 3,911 Goodwill 55,613 55,613 Other long-term assets 5,784 10,605 Total long-term assets 76,781 87,703 $ 358,755 $ 361,798 Liabilities and Stockholders’ Deficit Current liabilities: Accounts payable $ 54,367 $ 41,792 Accrued warranty 4,219 6,116 Deferred revenue, current 95,899 98,098 Accrued restructuring charges, current 3,855 4,345 Convertible subordinated debt, current 83,735 — Accrued compensation 35,414 25,036 Other accrued liabilities 20,740 15,168 Total current liabilities 298,229 190,555 Long-term liabilities: Deferred revenue, long-term 39,532 40,054 Accrued restructuring charges, long-term 991 4,023 Convertible subordinated debt, long-term 70,000 203,735 Other long-term liabilities 10,441 10,831 Total long-term liabilities 120,964 258,643 Commitments and contingencies — — Stockholders’ deficit: Preferred stock: Preferred stock, 20,000 shares authorized; no shares issued as of March 31, 2015 and 2014 — — Common stock: Common stock, $0.01 par value; 1,000,000 shares authorized; 258,208 and 250,410 shares issued and outstanding at March 31, 2015 and March 31, 2014, respectively 2,582 2,504 Capital in excess of par 456,411 443,547 Accumulated deficit (523,311 ) (540,071 ) Accumulated other comprehensive income 3,880 6,620 Stockholders’ deficit (60,438 ) (87,400 ) $ 358,755 $ 361,798 The accompanying notes are an integral part of these Consolidated Financial Statements.44QUANTUM CORPORATIONCONSOLIDATED STATEMENTS OF OPERATIONS(In thousands, except per share data) For the year ended March 31, 2015 2014 2013 Product revenue $ 355,579 $ 348,318 $ 398,910 Service revenue 155,674 147,199 144,037 Royalty revenue 41,842 57,648 44,492 Total revenue 553,095 553,165 587,439 Product cost of revenue 237,679 237,076 267,274 Service cost of revenue 70,730 75,930 79,604 Restructuring charges related to cost of revenue — 539 — Total cost of revenue 308,409 313,545 346,878 Gross margin 244,686 239,620 240,561 Operating expenses: Research and development 58,618 64,375 73,960 Sales and marketing 113,954 118,771 136,873 General and administrative 56,513 57,865 62,017 Restructuring charges 1,666 10,675 10,171 Total operating expenses 230,751 251,686 283,021 Gain on sale of assets 462 267 — Income (loss) from operations 14,397 (11,799 ) (42,460 ) Other income and expense 13,836 1,296 (216 ) Interest expense (9,460 ) (9,754 ) (8,342 ) Loss on debt extinguishment (1,295 ) — — Income (loss) before income taxes 17,478 (20,257 ) (51,018 ) Income tax provision 718 1,217 1,161 Net income (loss) $ 16,760 $ (21,474 ) $ (52,179 ) Basic net income (loss) per share $ 0.07 $ (0.09 ) $ (0.22 ) Diluted net income (loss) per share 0.06 (0.09 ) (0.22 ) Weighted average shares: Basic 254,665 247,024 239,855 Diluted 260,027 247,024 239,855 The accompanying notes are an integral part of these Consolidated Financial Statements.45QUANTUM CORPORATIONCONSOLIDATED STATEMENTS OF COMPREHENSIVE INCOME (LOSS)(In thousands) For the year ended March 31, 2015 2014 2013 Net income (loss) $ 16,760 $ (21,474 ) $ (52,179 ) Other comprehensive income (loss), net of taxes: Foreign currency translation adjustments (3,490 ) 679 (583 ) Net unrealized gain (loss) on revaluation of long-term intercompany balances, net of taxes of $200, $(67) and $51, respectively 750 (251 ) 192 Total other comprehensive income (loss) (2,740 ) 428 (391 ) Total comprehensive income (loss) $ 14,020 $ (21,046 ) $ (52,570 ) The accompanying notes are an integral part of these Consolidated Financial Statements.46QUANTUM CORPORATIONCONSOLIDATED STATEMENTS OF CASH FLOWS(In thousands) For the year ended March 31, 2015 2014 2013 Cash flows from operating activities: Net income (loss) $ 16,760 $ (21,474 ) $ (52,179 ) Adjustments to reconcile net income (loss) to net cash provided by operating activities: Depreciation 8,281 10,713 12,413 Amortization of intangible assets 3,697 8,902 13,299 Amortization and write off of debt issuance costs 1,896 1,634 1,347 Service parts lower of cost or market adjustment 3,698 11,307 10,081 Deferred income taxes (160 ) 36 (142 ) Share-based compensation 11,583 13,459 15,139 Gain on sale of assets (462 ) — — Gain on sale of other investments (13,574 ) — — Changes in assets and liabilities, net of effect of acquisition: Accounts receivable (22,554 ) (4,770 ) 11,880 Manufacturing inventories (19,688 ) 13,352 (2,098 ) Service parts inventories (1,010 ) 2,675 3,735 Accounts payable 12,849 (5,881 ) (8,630 ) Accrued warranty (1,897 ) (1,404 ) (66 ) Deferred revenue (2,721 ) 8,651 (370 ) Accrued restructuring charges (3,548 ) 3,619 3,009 Accrued compensation 11,318 (6,140 ) (1,663 ) Other assets and liabilities 1,566 795 1,980 Net cash provided by operating activities 6,034 35,474 7,735 Cash flows from investing activities: Purchases of property and equipment (3,241 ) (5,957 ) (10,099 ) Proceeds from sale of assets 462 — — Change in restricted cash (250 ) 426 1,113 Purchases of other investments (22 ) (1,118 ) (2,169 ) Return of principal from other investments 112 — 247 Proceeds from sale of other investments 15,097 — — Payment for business acquisition, net of cash acquired (517 ) — — Net cash provided by (used in) investing activities 11,641 (6,649 ) (10,908 ) Cash flows from financing activities: Repayments of long-term debt — — (49,495 ) Borrowings of convertible subordinated debt, net — — 67,701 Repayments of convertible subordinated debt (50,000 ) (1,265 ) — Payment of taxes due upon vesting of restricted stock (2,378 ) (1,880 ) (2,036 ) Proceeds from issuance of common stock 3,737 4,430 4,805 Net cash provided by (used in) financing activities (48,641 ) 1,285 20,975 Effect of exchange rate changes on cash and cash equivalents (211 ) 39 (87 ) Net increase (decrease) in cash and cash equivalents (31,177 ) 30,149 17,715 Cash and cash equivalents at beginning of period 99,125 68,976 51,261 Cash and cash equivalents at end of period $ 67,948 $ 99,125 $ 68,976 Supplemental disclosure of cash flow information: Proceeds from sale of other investments included in other assets $ 1,564 $ — $ — Purchases of property and equipment included in accounts payable 429 649 354 Cash paid during the year for: Interest 8,498 8,247 5,672 Income taxes, net of refunds 750 574 2,596 47The accompanying notes are an integral part of these Consolidated Financial Statements.48QUANTUM CORPORATIONCONSOLIDATED STATEMENTS OF STOCKHOLDERS’ DEFICIT(In thousands) Common Stock Total Shares Amount Balances as of March 31, 2012 236,402 $ 2,364 $ 409,770 $ (466,418 ) $ 6,583 $ (47,701 ) Net loss — — — (52,179 ) — (52,179 ) Foreign currency translation adjustments — — — — (583 ) (583 ) Net unrealized gain on revaluation of long-term
intercompany balance, net of tax of $51— — — — 192 192 Shares issued under employee stock
purchase plan3,783 38 4,402 — — 4,440 Shares issued under employee stock incentive
plans, net2,895 29 (1,700 ) — — (1,671 ) Share-based compensation expense — — 15,139 — — 15,139 Balances as of March 31, 2013 243,080 2,431 427,611 (518,597 ) 6,192 (82,363 ) Net loss — — — (21,474 ) — (21,474 ) Foreign currency translation adjustments — — — — 679 679 Net unrealized loss on revaluation of long-term
intercompany balance, net of tax of $(67)— — — — (251 ) (251 ) Shares issued under employee stock
purchase plan3,220 32 3,424 — — 3,456 Shares issued under employee stock incentive
plans, net4,110 41 (947 ) — — (906 ) Share-based compensation expense — — 13,459 — — 13,459 Balances as of March 31, 2014 250,410 2,504 443,547 (540,071 ) 6,620 (87,400 ) Net income — — — 16,760 — 16,760 Foreign currency translation adjustments — — — — (3,490 ) (3,490 ) Net unrealized gain on revaluation of long-term
intercompany balance, net of tax of $200— — — — 750 750 Shares issued under employee stock
purchase plan2,790 28 2,865 — — 2,893 Shares issued under employee stock incentive
plans, net5,008 50 (1,584 ) — — (1,534 ) Share-based compensation expense — — 11,583 — — 11,583 Balances as of March 31, 2015 258,208 $ 2,582 $ 456,411 $ (523,311 ) $ 3,880 $ (60,438 ) The accompanying notes are an integral part of these Consolidated Financial Statements.49NOTE 1: BASIS OF PRESENTATIONQuantum Corporation (“Quantum”, the “Company”, “us” or “we”), is a leading expert in scale-out storage, archive and data protection, providing solutions for capturing, sharing, transforming and preserving digital assets over the entire data lifecycle. Our customers, ranging from small businesses to large/multi-national enterprises, trust us to address their most demanding content workflow challenges. We provide solutions for storing and protecting information in physical, virtual and cloud environments that are designed to help customers Be Certain™ they have an end-to-end storage foundation to maximize the value of their data by making it accessible whenever and wherever needed, retaining indefinitely and reducing total cost and complexity. We work closely with a broad networkset of distributors, value-added resellers (“VARs”), direct marketing resellers (“DMRs”), original equipment manufacturers (“OEMs”)business skills, a strong educational background in engineering and other suppliers to meet customers’ evolving needs. Our stock is traded on the New York Stock Exchange under the symbol QTM.The accompanying Consolidated Financial Statements include the accounts of Quantum and our wholly-owned subsidiaries. All intercompany accounts and transactions have been eliminated. The preparation of our Consolidated Financial Statements in conformity with generally accepted accounting principles (“GAAP”) in the U.S. requires management to make estimates and assumptions that affect the reported amount of assets and liabilities at the date of the financial statements and the reported amount of revenues and expenses during the period. We base estimates on historical experience and on various assumptions about the future that are believed to be reasonable based on available information. Our reported financial position or results of operations may be materially different under different conditions or when using different estimates and assumptions, particularly with respect to significant accounting policies, which are discussed below. In the event that estimates or assumptions prove to differ from actual results, adjustments are made in the current period to reflect this current information.NOTE 2: SUMMARY OF SIGNIFICANT ACCOUNTING POLICIESRevenue RecognitionRevenue consists of sales of hardware, software and services, as well as royalties we earn for the license of certain intellectual property. Revenue is recognized from the sale of products and services when it is realized or realizable and earned. Revenue is considered realized and earned when: persuasive evidence of an arrangement exists; delivery has occurred or services have been rendered; the price to the buyer is fixed or determinable; and when collectability is reasonably assured. Royalty revenue is recognized when earned or amounts can be reasonably estimated.Multiple Element ArrangementsWe enter into sales arrangements with customers that contain multiple deliverables such as hardware, software and services, and these arrangements require assessment of each deliverable to determine its estimated selling price. Additionally, we use judgment in order to determine the appropriate timing of revenue recognition and to assess whether any software and non-software components function together to deliver a tangible product’s essential functionality in order to ensure the arrangement is properly accounted for as software or hardware revenue. The majority of our products are hardware products which contain software essential to the overall functionality of the product. Hardware products are generally sold with customer field support agreements.For arrangements with multiple elements, arrangement consideration is first allocated between software (consisting of nonessential and stand-alone software) and non-software deliverables on a relative fair value basis.Arrangement consideration in such multiple element transactions is allocated to each non-software element based on the fair value hierarchy, where the selling price for an element is based on vendor-specific objective evidence (“VSOE”), if available; third-party evidence (“TPE”), if VSOE is not available; or the best estimate of selling price (“BESP”), if neither VSOE nor TPE is available. For BESP, we consider our discounting and internal pricing practices.For software deliverables, we allocate revenue between multiple elements based on software revenue recognition guidance, which requires revenue earned on software arrangements involving multiple elements to be allocated to each element based on the relative fair values of those elements. The fair value of an element must be based on VSOE. Where fair value of delivered elements is not available, revenue is recognized on the “residual method” based on the fair value of undelivered elements. If evidence of fair value of one or more undelivered elements does not exist, all revenue is deferred and recognized at the earlier of the delivery of those elements or the establishment of fair value of the remaining undelivered elements.50Product Revenue — HardwareRevenue for hardware products sold to distributors, VARs, DMRs, OEMs and end users is generally recognized upon shipment. When significant post-delivery obligations exist, the related revenue is deferred until such obligations are fulfilled. If there are customer acceptance criteria in the contract, we recognize revenue upon end user acceptance.In the period revenue is recognized, allowances are provided for estimated future price adjustments, such as rebates, price protection and future product returns. These allowances are based on programs in existence at the time revenue is recognized, plans regarding future price adjustments, the customers’ master agreements and historical product return rates. Since we have historically been able to reliably estimate the amount of allowances required, we recognize revenue, net of projected allowances, upon shipment to our customers. If we were unable to reliably estimate the amount of revenue adjustments in any specific reporting period, then we would be required to defer recognition of the revenue until the rights had lapsed and we were no longer under any obligation to reduce the price or accept the return of the product.Product Revenue — SoftwareFor software products, we generally recognize revenue upon delivery of the software. Revenue from post-contract customer support agreements, which entitle software customers to both telephone support and any unspecified upgrades and enhancements during the term of the agreement, is classified as product revenue and recognized ratably over the term of the support agreement.We license certain software to customers under licensing agreements that allow those customers to embed our software into specific products they offer. As consideration, licensees pay us a fee based on the amount of sales of their products that incorporate our software. On a periodic and timely basis, the licensees provide us with reports listing their sales to end users for which they owe us license fees. As the reports substantiate delivery has occurred, we recognize revenue based on the information in these reports or when amounts can be reasonably estimated.Service RevenueRevenue for service is generally recognized upon services being rendered. Service revenue primarily consists of customer field support agreements for our hardware products. For customer field support agreements, revenue equal to the separately stated price of these service contracts for our hardware products is initially deferred and recognized as revenue ratably over the contract period.Royalty RevenueWe license certain intellectual property to third party manufacturers under arrangements that are represented by master contracts. The master contracts give the third party manufacturers rights to the intellectual property which include allowing them to either manufacture or include the intellectual property in products for resale. As consideration, the licensees pay us a per-unit royalty for sales of their products that incorporate our intellectual property. On a periodic and timely basis, the licensees provide us with reports listing units sold to end users subject to the royalties. As the reports substantiate delivery has occurred, we recognize revenue based on the information in these reports or when amounts can be reasonably estimated.Service Cost of RevenueWe classify expenses as service cost of revenue by estimating the portion of our total cost of revenue that relates to providing field support to our customers under contract. These estimates are based upon a variety of factors, including the nature of the support activity and the level of infrastructure required to support the activities from which we earn service revenue. In the event our service business changes, our estimates of cost of service revenue may be impacted.Shipping and Handling FeesShipping and handling fees are included in cost of revenue and were $12.3 million, $13.6 million and $16.0 million in fiscal 2015, 2014 and 2013, respectively.Research and Development CostsExpenditures relating to the development of new products and processes are expensed as incurred. These costs include expenditures for employee compensation, materials used in the development effort, other internal costs, as well as expenditures for third party professional services. We have determined that technological feasibility for our software products is reached shortly before the products are released to manufacturing. Costs incurred after technological feasibility is established have not been material. We expense software-related research and development costs as incurred.51Advertising ExpenseWe expense advertising costs as incurred. Advertising expense for the years ended March 31, 2015, 2014 and 2013 was $7.6 million, $8.4 million and $8.2 million, respectively.Restructuring ChargesIn recent periods and over the past several years, we have recorded significant restructuring charges related to the realignment and restructuring of our business operations. These charges represent expenses incurred in connection with strategic planning, certain cost reduction programs and acquisition integrations that we have implemented and consist of the cost of involuntary termination benefits, facilities charges, asset write-offs and other costs of exiting activities or geographies.The charges for involuntary termination costs and associated expenses often require the use of estimates, primarily related to the number of employees to be paid severance and the amounts to be paid, largely based on30 years of service and statutory requirements. Assumptions to estimate facility exit costs include the ability to secure sublease income largely based on market conditions, the likelihood and amounts of a negotiated settlement for contractual lease obligations and other exit costs. Other estimates for restructuring charges consist of the realizable value of assets including associated disposal costs and termination fees with third parties for other contractual commitments.Share-Based CompensationThe majority of our share-based awards are measured based on the fair market value of the underlying stock on the date of grant, We use the Black-Scholes stock option pricing model to estimate the fair value of stock option awards at the date of grant. For awards that contain market conditions, we use a Monte-Carlo simulation model to estimate the fair value of share-based awards. Both the Black-Scholes and Monte-Carlo models require the use of highly subjective assumptions, including expected life, expected volatility and expected risk-free rate of return. Other reasonable assumptions in either model could provide differing results. We calculate a forfeiture rate to estimate the share-based awards that will ultimately vest based on types of awards and historicaldiverse professional experience. Additionally, for awards which are performance based, we make estimates as to the probability of the underlying performance being achieved.Foreign Currency Translation and TransactionsAssets, liabilities and operations of foreign offices and subsidiaries are recorded based on the functional currency of the entity. For a majority of our foreign operations, the functional currency is the U.S. dollar. The assets and liabilities of foreign offices with a local functional currency are translated, for consolidation purposes, at current exchange rates from the local currency to the reporting currency, the U.S. dollar. The resulting gains or losses are reported as a component of other comprehensive income. Foreign exchange gains and losses from changes in the exchange rates underlying intercompany balances that are of a long-term investment nature are also reported as a component of other comprehensive income. Assets and liabilities denominated in other than the functional currency are remeasured each month with the remeasurement gain or loss recorded in other income and expense in the Consolidated Statements of Operations. Foreign currency gains and losses recorded in other income and expense were a $0.2 million gain in fiscal 2015, a $0.3 million gain in fiscal 2014 and a $0.5 million loss in fiscal 2013.Derivative InstrumentsDerivative instruments are carried at fair value on our Consolidated Balance Sheets. The fair values of the derivative financial instruments generally represent the estimated amounts we would expect to receive or pay upon termination of the contracts as of the reporting date. We did not hold any material derivative instruments during fiscal 2015, 2014 or 2013. 52Income TaxesWe recognize deferred tax assets and liabilities due to the effect of temporary differences between the carrying amounts of assets and liabilities for financial reporting purposes and the amounts used for income tax purposes. We also reduce deferred tax assets by a valuation allowance if it is more likely than not that some or all of the deferred tax asset will not be realized.We recognize the benefit from a tax position only if it is more-likely-than-not that the position would be sustained upon audit based solely on the technical merits of the tax position. The calculation of our tax liabilities requires judgment related to uncertainties in the application of complex tax regulations. It is inherently difficult and subjective to estimate such amounts, as we have to determine the probability of various possible outcomes. We reevaluate these uncertain tax positions on a quarterly basis. This evaluation is based on factors including, but not limited to, changes in facts or circumstances, changes in tax law, effectively settled issues under audit and new audit activity. A change in recognition or measurement would result in the recognition of a tax benefit or an additional tax charge to the provision.We recognize interest and penalties related to uncertain tax positions in the income tax provision in the Consolidated Statements of Operations. To the extent accrued interest and penalties do not become payable, amounts accrued will be reduced and reflected as a reduction of the overall income tax provision in the period that such determination is made.Cash Equivalents, Restricted Cash and Other InvestmentsWe consider all highly liquid debt instruments with a maturity of 90 days or less at the time of purchase to be cash equivalents. Cash equivalents are carried at fair value, which approximates their cost.Restricted cash is comprised of bank guarantees and similar required minimum balances that serve as cash collateral in connection with various items including insurance requirements, value added taxes, ongoing tax audits and leases in certain countries.Investments in private technology venture limited partnerships are currently accounted for using the equity method because we are deemed to have influence. Ownership interests in these limited partnerships are accounted for under the equity method unless our interest is so minor that we have virtually no influence over the partnership operating and financial policies, in which case the cost method is used.Investments in other privately held companies are accounted for under the cost method unless we hold aincludes significant stake. We review non-marketable equity investments on a regular basis to determine if there has been any impairment of value which is other than temporary by reviewing their financial information, gaining knowledge of any new financing or other business agreements and assessing their operating viability. In fiscal 2015, we sold our investment in a privately held company that was accounted for under the cost method and recorded a $13.6 million gain in other income and expense in the Consolidated Statements of Operations. Investments in non-marketable equity investments are recorded in other long-term assets in the Consolidated Balance Sheets.Allowance for Doubtful AccountsWe perform ongoing credit evaluations of our customers’ financial condition and, for the majority of our customers, require no collateral. For customers that do not meet our credit standards, we often require a form of collateral, such as cash deposits or letters of credit, prior to the completion of a transaction. These credit evaluations require significant judgment and are based on multiple sources of information. We analyze such factors as our historical bad debt experience, industry and geographic concentrations of credit risk, current economic trends and changes in customer payment terms. We maintain an allowance for doubtful accounts based on historical experience and expected collectability of outstanding accounts receivable. We record bad debt expense in general and administrative expenses.Manufacturing InventoriesOur manufacturing inventory is stated at the lower of cost or market, with cost computed on a first-in, first-out (“FIFO”) basis. Adjustments to reduce the cost of manufacturing inventory to its net realizable value, if required, are made for estimated excess, obsolete or impaired balances. Factors influencing these adjustments include declines in demand, rapid technological changes, product life cycle and development plans, component cost trends, product pricing, physical deterioration and quality issues. Revisions to these adjustments would be required if these factors differ from our estimates.53Service Parts InventoriesOur service parts inventories are stated at the lower of cost or market. We carry service parts because we generally provide product warranty for one to three years and earn revenue by providing enhanced and extended warranty and repair service during and beyond this warranty period. Service parts inventories consist of both component parts, which are primarily used to repair defective units, and finished units, which are provided for customer use permanently or on a temporary basis while the defective unit is being repaired. Defective parts returned from customers that can be repaired are repaired and put back into service parts inventories at their current carrying value. We record adjustments to reduce the carrying value of service parts inventory to its net realizable value, and we dispose of parts with no use and a net realizable value of zero. Factors influencing these adjustments include product life cycles, end of service life plans and volume of enhanced or extended warranty service contracts. Estimates of net realizable value involve significant estimates and judgments about the future, and revisions would be required if these factors differ from our estimates.Property and EquipmentProperty and equipment are carried at cost, less accumulated depreciation and amortization, computed on a straight-line basis over the estimated useful lives of the assets as follows:Machinery and equipment3 to 5 yearsComputer equipment3 to 5 yearsERP software10 yearsOther software3 yearsFurniture and fixtures5 yearsOther office equipment5 yearsLeasehold improvementsLife of leaseAmortizable Intangible and Other Long-lived AssetsWe review the useful lives of amortizable intangible and other long-lived assets (“long-lived assets”) quarterly and review long-lived assets for impairment whenever events or changes in circumstances indicate the carrying amount of such assets may not be recoverable. The company operates as a single reporting unit for business and operating purposes, and our impairment evaluation also treats the company as a single asset group. Impairment indicators we consider include a significant decrease in the market price of our long-lived asset group, adverse changes in the extent or manner in which our long-lived assets are being used, adverse changes in the business climate that could affect the value of our long-lived assets, a current period operating or cash flow loss combined with a history of operating or cash flow losses or a projection or forecast that demonstrates continuing losses associated with the use of our long-lived assets and an expectation that it is more likely than not our long-lived assets will be sold or otherwise disposed of significantly before the end of their previously estimated useful life. If we identify impairment indicators, we evaluate recoverability using an undiscounted cash flow approach. Estimates of future cash flows incorporate company forecasts and our expectations of future use of our long-lived assets, and these factors are impacted by market conditions. If impairment is indicated, an impairment charge is recorded to write the long-lived assets down to their estimated fair value.54GoodwillWe evaluate goodwill for impairment annually during the fourth quarter of our fiscal year, or more frequently when indicators of impairment are present. We operate as a single reporting unit and consider the company as a whole when reviewing impairment factors. In addition to comparing the carrying value of the reporting unit to its fair value, because we have negative book value, we perform a qualitative analysis to determine whether it is more likely than not that the fair value of goodwill is less than its carrying amount. Some of the impairment indicators we consider include significant differences between the carrying amount and the estimated fair value of our assets and liabilities; macroeconomic conditions such as a deterioration in general economic condition or limitations on accessing capital; industry and market considerations such as a deterioration in the environment in which we operate and an increased competitive environment; cost factors such as increases in raw materials, labor, or other costs that have a negative effect on earnings and cash flows; overall financial performance such as negative or declining cash flows or a decline in actual or planned revenue or earnings compared with actual and projected results of relevant prior periods; other relevant events such as litigation, changes in management, key personnel, strategy or customers; the testing for recoverability of our long-lived assets and a sustained decrease in share price. We evaluate the significance of identified events and circumstances on the basis of the weight of evidence along with how they could affect the relationship between the reporting unit's fair value and carrying amount, including positive mitigating events and circumstances. If we determine it is more likely than not that the fair value of goodwill is less than its carrying amount, then a second step is performed to quantify the amount of goodwill impairment. If impairment is indicated, a goodwill impairment charge is recorded to write the goodwill down to its implied fair value.Accrued WarrantyWe generally warrant our hardware products against certain defects for periods ranging from 1 to 3 years from the date of sale. Our tape automation systems, disk backup systems and scale-out storage solutions may carry service agreements with customers that choose to extend or upgrade the warranty service. We use a combination of internal resources and third party service providers to supply field service and support. If the actual costs were to differ significantly from our estimates, we would record the impact of these unforeseen costs or cost reductions in subsequent periods.We estimate future failure rates based upon historical product failure trends as well as anticipated future failure rates if believed to be significantly different from historical trends. Similarly, we estimate future costs of repair based upon historical trends and anticipated future costs if they are expected to significantly differ, for example due to negotiated agreements with third parties. We use a consistent model and exercise considerable judgment in determining the underlying estimates. Our model requires an element of subjectivity for all of our products. For example, historical rates of return are not completely indicative of future return rates and we must therefore exercise judgment with respect to future deviations from our historical return rate. When actual failure rates differ significantly from our estimates, we record the impact in subsequent periods and update our assumptions and forecasting models accordingly. As our newer products mature, we are able to improve our estimates with respect to these products. It is reasonably likely that assumptions will be updated for failure rates and, therefore, our accrued warranty estimate could change in the future.Business CombinationsWe allocate the purchase price paid to the assets acquired and liabilities assumed in a business combination at their estimated fair values as of the acquisition date. Any excess purchase price above the identified net tangible and intangible assets and assumed liabilities is allocated to goodwill. We consider fair value to be the price that would be received to sell an asset or paid to transfer a liability in an orderly transaction between market participants at the measurement date. We estimate fair value using the fair value hierarchy for the tangible and intangible assets acquired as well as liabilities and contingencies assumed from the acquired company.Common Stock RepurchasesDuring fiscal 2000, the Board of Directors authorized us to repurchase up to $700 million of our common stock in open market or private transactions. As of March 31, 2015 and 2014, there was $87.9 million remaining on our authorization to repurchase Quantum common stock. Our ability to repurchase our common stock is restricted unless we meet certain thresholds under the terms of our Wells Fargo credit agreement.Fair Value of Financial InstrumentsWe use exit prices, that is the price to sell an asset or transfer a liability, to measure assets and liabilities that are within the scope of the fair value measurements guidance. We classify these assets and liabilities based on the following fair value hierarchy:Level 1:Quoted (observable) market prices in active markets for identical assets or liabilities.55Level 2:Observable inputs other than Level 1, such as quoted prices for similar assets or liabilities; quoted prices in markets that are not active; or other inputs that are observable or can be corroborated by observable market data for substantially the full term of the asset or liability.Level 3:Prices or valuations that require inputs that are both significant to the fair value measurement and unobservable.The assets measured and recorded at fair value on a recurring basis consist of money market funds which are valued using quoted market prices at the respective balance sheet dates and are level 1 fair value measurements (in thousands): As of March 31, 2015 2014 Money market funds $ 34,278 $ 93,077 We have certain non-financial assets that are measured at fair value on a non-recurring basis when there is an indicator of impairment, and they are recorded at fair value only when an impairment is recognized. These assets include property and equipment, amortizable intangible assets and goodwill. We did not record impairments to any non-financial assets in fiscal 2015 or fiscal 2014. We do not have any non-financial liabilities measured and recorded at fair value on a non-recurring basis.Our financial liabilities were comprised primarily of convertible subordinated debt at March 31, 2015 and 2014. The carrying value and fair value based on quoted market prices in less active markets (level 2 fair value measurement) were as follows (in thousands): As of March 31, 2015 2014 Carrying Value Fair Value Carrying Value Fair Value Convertible subordinated debt $ 153,735 $ 166,551 $ 203,735 $ 203,820 Risks and UncertaintiesAs is typical in the information storage industry, a significant portion of our customer base is concentrated among a small number of OEMs, distributors and large VARs. The loss of any one of our more significant customers, or a significant decrease in the sales volume with one of these significant customers, could have a material adverse effect on our results of operations and financial condition. Furthermore, if there is a downturn in general economic conditions, the resulting effect on IT spending could also have a material adverse effect on our results of operations and financial condition. We also face risks and uncertainties since our competitors in one area may be customers or suppliers in another.A limited number of products comprise a significant majority of our sales, and due to increasingly rapid technological change in the industry, our future operating results depend on our ability to develop and successfully introduce new products.Concentration of Credit RiskWe currently invest our excess cash in deposits with major banks and in money market funds. In the past, we have also held investments in short-term debt securities of companies with strong credit ratings from a variety of industries, and we may make investments in these securities in the future. We have not experienced any material losses on these investments and limit the amount of credit exposure to any one issuer and to any one type of investment.We sell products to customersachievements in a wide variety of industriesdisciplines and he has demonstrated leadership in a variety of management roles. In addition, throughout his career Mr. Krall has had a strong focus on market-driven product development, corporate strategy and global operating expertise. Further, his experience as a worldwide basis. In countries or industries where we are exposed to material credit risk, we may require collateral, including cash depositsmember of many public and lettersprivate company Boards provides him with an enhanced perspective on an array of credit, prior to the completion of a transaction. We do not believe we have significant credit risk beyond that provided for in the financial statements in the ordinary course of business.Sales to our top five customers represented 31% of revenue in fiscal 2015 and fiscal 2014 and 32% of revenue in fiscal 2013. We had no customers that comprised 10% or greater of revenue in fiscal 2015, fiscal 2014 or fiscal 2013.56Recently Adopted Accounting PronouncementsIn July 2013,Mr. Gregg J. Powers serves as Chairman and Chief Executive Officer of Private Capital Management LLC (along with its successor entities “PCM”), a provider of equity portfolio management. After joining PCM in 1988, he became co-portfolio manager during the Financial Accounting Standards Board (“FASB”) issued Accounting Standards Update ("ASU") No. 2013-11, Income Taxes (Topic 740): Presentationmid-1990s, focusing on the firm’s primary underwriting of an Unrecognized Tax Benefit When a Net Operating Loss Carryforward, a Similar Tax Loss, or a Tax Credit Carryforward Exists (“ASU 2013-11”). ASU 2013-11 requires an entity to present an unrecognized tax benefit as a reductioninvestments in technology, healthcare and telecommunications. He was named President of a deferred tax asset for a net operating loss (“NOL”) carryforward, or similar tax loss or tax credit carryforward, rather than as a liability when (1) the uncertain tax position would reduce the NOL or other carryforward under the tax lawPCM in 1999, Chief Executive Officer in 2008 and Chairman in 2009. As portfolio manager, Mr. Powers oversees all aspects of the applicable jurisdiction and (2) the entity intends to use the deferred tax asset for that purpose. ASU 2013-11 does not require new recurring disclosures. ASU 2013-11 is effective for fiscal years, and interim periods within those years, beginning after December 15, 2013. We adopted ASU 2013-11 prospectively in the first quarterinvestment of fiscal 2015. Adoption did not impact our statementsPCM client portfolios. He also currently serves as Chairman of financial position or results of operations.Recent Accounting PronouncementsIn May 2014, the FASB issued ASU No. 2014-09, Revenue from Contracts with Customers (Topic 606) (“ASU 2014-09”). ASU 2014-09 requires entities to recognize revenue through the application of a five-step model, which includes identification of the contract, identification of the performance obligations, determination of the transaction price, allocation of the transaction price to the performance obligations and recognition of revenue as the entity satisfies the performance obligations. ASU 2014-09 will become effective for us beginning April 1, 2017, or fiscal 2018. We are currently evaluating the guidance to determine the potential impact on our financial condition, results of operations, cash flows and financial statement disclosures.In August 2014, the FASB issued ASU No. 2014-15, Presentation of Financial Statements – Going Concern (Topic 205-40): Disclosure of Uncertainties about an Entity's Ability to Continue as a Going Concern (“ASU 2014-15”). ASU 2014-15 requires that management assess an entity’s ability to continue as a going concern by incorporating and expanding upon certain principles that are currently in U.S. auditing standards. ASU 2014-15 is effective for annual periods ending after December 15, 2016, and for annual periods and interim periods thereafter. We plan to adopt ASU 2014-15 as of the end of our fiscal year ending March 31, 2017 and do not anticipate adoption will impact our statements of financial position or results of operations.In April 2015, the FASB issued ASU No. 2015-03, Interest - Imputation of Interest(Topic 835-30):Simplifying the Presentation of Debt Issuance Costs ("ASU 2015-03"). ASU 2015-03 requires that debt issuance costs related to a recognized debt liability be presented in the balance sheet as a direct deduction from the carrying amount of that debt liability, consistent with debt discounts. The recognition and measurement guidance for debt issuance costs is not affected by ASU 2015-03. ASU 2015-03 is effective for financial statements issued for fiscal years beginning after December 15, 2015, and interim periods within those fiscal years. Early adoption is permitted. We plan to adopt ASU 2015-03 beginning April 1, 2015 and we will reclassify debt issuance costs from other current and long-term assets to convertible subordinated debt on the Consolidated Balance Sheets; we do not otherwise anticipate adoption will materially impact our statements of financial position or results of operations.NOTE 3: ACQUISITIONOn July 29, 2014, we acquired a majority of the assets of Symform, Inc., a Washington corporation, for cash of approximately $0.5 million. The assets, consisting primarily of Symform technology, were recorded as purchased technology and are expected to enhance our cloud software capabilities and service offerings for data protection and scale-out storage. This acquisition was recorded as a business combination and the effect was not material to our financial position, results of operations or cash flows.NOTE 4: BALANCE SHEET DETAILSCash, cash equivalents and restricted cash consisted of (in thousands): As of March 31, 2015 2014 Cash $ 36,291 $ 8,808 Money market funds 34,278 93,077 $ 70,569 $ 101,885 57Manufacturing inventories consisted of (in thousands): As of March 31, 2015 2014 Finished goods $ 28,022 $ 18,069 Work in process 58 1,056 Materials and purchased parts 22,194 15,690 $ 50,274 $ 34,815 Service parts inventories consisted of (in thousands): As of March 31, 2015 2014 Finished goods $ 18,143 $ 17,926 Component parts 6,497 7,703 $ 24,640 $ 25,629 Property and equipment consisted of (in thousands): As of March 31, 2015 2014 Machinery and equipment $ 122,339 $ 119,783 Furniture and fixtures 5,816 6,127 Leasehold improvements 20,309 20,116 148,464 146,026 Less: accumulated depreciation (133,811 ) (128,452 ) $ 14,653 $ 17,574 NOTE 5: INTANGIBLE ASSETS AND GOODWILLIntangible AssetsAcquired intangible assets are amortized over their estimated useful lives, which generally range from one to eight years. In estimating the useful lives of intangible assets, we considered the following factors:The cash flow projections used to estimate the useful lives of the intangible assets showed a trend of growth that was expected to continue for an extended period of time;Our tape automation products, disk backup systems and scale-out storage solutions, in particular, have long development cycles; these products have experienced long product life cycles; andOur ability to leverage core technology into data protection and scale-out storage solutions and, therefore, to extend the lives of these technologies.Acquired IPR&D is amortized over its estimated useful life once technological feasibility is reached. If IPR&D is determined to not have technological feasibility or is abandoned, we write off the IPR&D in that period.Following is the weighted average amortization period for our amortizable intangible assets:Amortization(Years)Purchased technology6.2Trademarks6.0Customer lists8.0All intangible assets6.758Intangible amortization within our Consolidated Statements of Operations for the years ended March 31, 2015, 2014 and 2013 follows (in thousands): For the year ended March 31, 2015 2014 2013 Purchased technology $ 913 $ 1,476 $ 3,775 Trademarks — — 244 Customer lists 2,784 7,426 9,280 $ 3,697 $ 8,902 $ 13,299 The following table provides a summary of the carrying value of intangible assets (in thousands): As of March 31, 2015 2014 Purchased technology $ 179,992 $ (179,261 ) $ 731 $ 179,475 $ (178,348 ) $ 1,127 Trademarks 3,900 (3,900 ) — 3,900 (3,900 ) — Customer lists 66,219 (66,219 ) — 76,019 (73,235 ) 2,784 $ 250,111 $ (249,380 ) $ 731 $ 259,394 $ (255,483 ) $ 3,911 The total expected future amortization related to amortizable intangible assets is provided in the table below (in thousands): Amortization Fiscal 2016 $ 280 Fiscal 2017 175 Fiscal 2018 138 Fiscal 2019 103 Fiscal 2020 35 Total as of March 31, 2015 $ 731 We evaluate our amortizable intangible and other long-lived assets for impairment whenever indicators of impairment exist and concluded the carrying amount of our long-lived assets was recoverable and there was no impairment in fiscal 2015, 2014 and 2013. In fiscal 2015 and fiscal 2014, we wrote off $9.8 million and $31.0 million, respectively, of fully amortized intangible assets related to prior acquisitions. In-process research and development of $0.1 million reached technological feasibility during fiscal 2014, was transferred to amortizable purchased technology intangible assets and is being amortized over its estimated useful life.GoodwillThe following provides a summary of the carrying value of goodwill (in thousands): Goodwill Net Amount Balances as of March 31, 2015 and March 31, 2014 $ 394,613 $ (339,000 ) $ 55,613 Our annual impairment evaluation for goodwill in the fourth quarters of fiscal 2015, 2014 and 2013 did not indicate any impairment of our goodwill in fiscal 2015, 2014 and 2013.59NOTE 6: ACCRUED WARRANTYThe following table details the change in the accrued warranty balance (in thousands): For the year ended March 31, 2015 2014 Beginning balance $ 6,116 $ 7,520 Additional warranties issued 6,146 8,508 Adjustments for warranties issued in prior fiscal years (185 ) (228 ) Settlements (7,858 ) (9,684 ) Ending balance $ 4,219 $ 6,116 We warrant our products against certain defects for one to three years. A provision for estimated future costs and estimated returns for repair or replacement relating to warranty is recorded when products are shipped and revenue recognized. Our estimate of future costs to satisfy warranty obligations is primarily based on historical trends and, if believed to be significantly different from historical trends, estimates of future failure rates and future costs of repair. Future costs of repair include materials consumed in the repair, labor and overhead amounts necessary to perform the repair. If we determine in a future period that either actual failure rates or actual costs of repair were to differ from our estimates, we record the impact of those differences in that future period.NOTE 7: DEBTConvertible Subordinated Debt4.50% NotesOn October 31, 2012, we issued $60 million aggregate principal amount of 4.50% convertible subordinated notes due November 15, 2017, and on November 6, 2012 we issued an additional $10 million aggregate principal amount of 4.50% convertible subordinated notes due November 15, 2017 pursuant to an over-allotment provision (“4.50% notes”). These notes are convertible into shares of our common stock at a conversion rate of 607.1645 shares per $1,000 principal amount, a conversion price of approximately $1.65 per share. We may not redeem the notes prior to their maturity date although investors may convert the 4.50% notes into Quantum common stock until November 14, 2017 at their option. In addition, since purchasers are qualified institutional investors, as defined in Rule 144A under the Securities Act of 1933 (“Securities Act”), the 4.50% notes have not been registered under the Securities Act. We pay 4.50% interest per annum on the principal amount of the 4.50% notes semi-annually on May 15 and November 15 of each year beginning in May 2013. Interest began to accrue on October 31, 2012. The terms of the 4.50% notes are governed by an agreement dated October 31, 2012 between Quantum and U.S. Bank National Association. The 4.50% notes are subordinated to any existing indebtedness and other liabilities. We incurred and capitalized $2.3 million of fees for the 4.50% notes which are included in other long-term assets in our Consolidated Balance Sheets. These fees are amortized to interest expense over the term of the notes.3.50% NotesOn November 15, 2010, we issued $135 million aggregate principal amount of 3.50% convertible subordinated notes due November 15, 2015 with a conversion price of $4.33 per share of our common stock (“3.50% notes”). We may not redeem the 3.50% notes prior to their maturity date although investors may convert the 3.50% notes into Quantum common stock until November 14, 2015 at their option. In addition, since purchasers are qualified institutional investors, as defined in Rule 144 under the Securities Act, the 3.50% notes have not been registered under the Securities Act. We pay 3.50% interest per annum on the principal amount of the 3.50% notes semi-annually on May 15 and November 15 of each year. The terms of the 3.50% notes are governed by an agreement dated November 15, 2010 between Quantum and U.S. Bank National Association. The 3.50% notes are subordinated to any existing indebtedness and other liabilities. During fiscal 2015, the 3.50% notes were reclassified from convertible subordinated debt, long-term to convertible subordinated debt, current as they are due November 15, 2015. We incurred and capitalized $5 million of loan fees in fiscal 2011 for the 3.50% notes which are included in other current assets in our Consolidated Balance Sheets. These fees are amortized to interest expense over the term of the notes.60On March 11, 2014, we entered into a private transaction with a note holder to purchase $1.3 million of aggregate principal amount of notes for $1.3 million. On January 28, 2015, we entered into a private transaction with a note holder to purchase $50 million of aggregate principal amount for $51 million . In connection with this transaction, we recorded a loss on debt extinguishment of $1.3 million comprised of the loss of $1 million from the notes purchased and a write-off of $0.3 million of unamortized debt issuance costs related to the purchased notes. We also paid accrued interest on the purchased notes of $0.4 million. We funded these transactions using cash on hand.Wells Fargo Credit AgreementOn March 29, 2012, we refinanced the secured credit agreement with Credit Suisse by entering into a senior secured credit agreement (“WF credit agreement”) with Wells Fargo Capital Finance, LLC. We incurred and capitalized $1.0 million of fees related to the WF credit agreement which are included in other long-term assets in our Consolidated Balance Sheets. These fees are being amortized to interest expense over the term of the WF credit agreement in the Consolidated Statements of Operations .On April 24, 2014, the WF credit agreement was amended to allow us to use proceeds from the credit agreement to repay the convertible subordinated notes so long as we have a fixed charge coverage ratio of 1.5 and liquidity of $25 million. The amendment also impacted the available line, maturity date and certain covenants and compliance obligations which are reflected below. In addition, there were amendments in fiscal 2013 and fiscal 2014, including an amendment to allow the assignment of one third of the total revolver commitment to Silicon Valley Bank and other conforming and related modifications.Under the WF credit agreement, as amended, we have the ability to borrow the lesser of $75 million or the amount of the monthly borrowing base under a senior secured revolving credit facility. The WF credit agreement matures March 29, 2017 so long as an amount sufficient to repay the 3.50% notes is available for borrowing under the WF credit agreement or is deposited in a WF controlled account prior to August 16, 2015. Otherwise, the WF credit agreement matures on August 16, 2015. Quarterly, we are required to pay a .375% commitment fee on undrawn amounts under the revolving credit facility.There is a blanket lien on all of our assets under the WF credit agreement in addition to certain financial and reporting covenants. We have letters of credit totaling $1 million, reducing the maximum amount available to borrow by this amount at March 31, 2015.The interest rate on amounts borrowed is based on an election by us of an annual rate equal to (1) a base rate established by Wells Fargo plus an applicable margin of 1.0% to 1.5%, based on availability levels under the WF credit agreement or (2) the LIBOR rate plus an applicable margin ranging from 2.0% and 2.5%, based on availability levels under the WF credit agreement. The base rate is defined in the WF credit agreement.The WF credit agreement contains customary covenants, including cross-default provisions, as well as financial covenants. Average liquidity must exceed $15 million each month. The fixed charge coverage ratio is required to be greater than 1.2 for the 12 month period ending on the last day of any month in which the covenant is applicable. This covenant is applicable only in months in which borrowings exceed $5 million at any time during the month and was not applicable in fiscal 2015. To avoid triggering mandatory field audits and Wells Fargo controlling our cash receipts, we must maintain liquidity of at least $20 million at all times. The fixed charge coverage ratio, average liquidity and liquidity are defined in the WF credit agreement and/or amendments. Certain schedules in the compliance certificate must be filed monthly if borrowings exceed $5 million; otherwise they are to be filed quarterly.As of March 31, 2015, and during fiscal 2015, we were in compliance with all covenants and had no outstanding balance on the line of credit.Debt MaturitiesA summary of the scheduled maturities for our outstanding debt as of March 31, 2015 follows (in thousands): Debt Maturity Fiscal 2016 $ 83,735 Fiscal 2017 — Fiscal 2018 70,000 Total as of March 31, 2015 $ 153,735 61NOTE 8: RESTRUCTURING CHARGESThe following summarizes the type of restructuring expense for fiscal 2015, 2014 and 2013 (in thousands): For the year ended March 31, 2015 2014 2013 Restructuring expense related to cost of revenue $ — $ 539 $ — Restructuring expense in operating expense 1,666 10,675 10,171 $ 1,666 $ 11,214 $ 10,171 For the year ended March 31, 2015 2014 2013 Severance and benefits $ 406 $ 6,139 $ 8,251 Facilities 1,250 4,303 1,920 Other 10 772 — $ 1,666 $ 11,214 $ 10,171 Fiscal 2015Restructuring charges in fiscal 2015 were primarily due to facilities costs of $1.3 million as a result of further consolidating our facilities in the U.S.Fiscal 2014Restructuring charges in fiscal 2014 were primarily due to strategic management decisions to outsource our manufacturing operations and further consolidate repair and service activities, inclusive of exiting manufacturing facilities. In addition, we had additional consolidation in research and development, sales and marketing and administrative activities and teams to align our workforce with our continuing operations plans. Severance and benefits charges of $6.1 million in fiscal 2014 were attributable to positions eliminated worldwide, with the majority of positions eliminated in the U.S. Facility restructuring charges of $4.3 million in fiscal 2014 were primarily due to accruing the remaining lease obligation for the vacated portion of our manufacturing facility in the U.S, reduced by estimated future sublease amounts. Other restructuring charges of $0.8 million were primarily due to charges related to cost of sales as a result of our manufacturing outsource decision.Fiscal 2013Restructuring charges in fiscal 2013 were primarily due to severance and benefits expenses of $8.3 million for positions eliminated in both the U.S. and internationally across most functions of the business. Facility restructuring charges for fiscal 2013 were primarily due to accruing the remaining lease obligation for a vacant facility in the U.S.62The following tables show the activity and the estimated timing of future payouts for accrued restructuring (in thousands): Facilities Other Total Balance as of March 31, 2012 $ 1,312 $ 440 $ — $ 1,752 Restructuring costs 8,815 1,920 — 10,735 Restructuring charge reversal (564 ) — — (564 ) Cash payments (6,852 ) (315 ) — (7,167 ) Balance as of March 31, 2013 2,711 2,045 — 4,756 Restructuring costs 7,522 4,392 772 12,686 Restructuring charge reversal (1,383 ) (89 ) — (1,472 ) Cash payments (7,276 ) (607 ) (702 ) (8,585 ) Other non-cash — 983 — 983 Balance as of March 31, 2014 1,574 6,724 70 8,368 Restructuring costs 749 1,680 13 2,442 Restructuring charge reversal (343 ) (430 ) (3 ) (776 ) Cash payments (1,791 ) (3,617 ) (80 ) (5,488 ) Other non-cash — 300 — 300 Balance as of March 31, 2015 $ 189 $ 4,657 $ — $ 4,846 Estimated timing of future payouts: Facilities Total Fiscal 2016 $ 75 $ 3,780 $ 3,855 Fiscal 2017 to 2021 114 877 991 $ 189 $ 4,657 $ 4,846 Facility restructuring accruals will be paid in accordance with the respective facility lease terms and amounts above are net of estimated sublease amounts.NOTE 9: STOCK INCENTIVE PLANS AND SHARE-BASED COMPENSATIONDescription of Stock Incentive Plans2012 Long-Term Incentive PlanWe have a stockholder approved 2012 Long-Term Incentive Plan (the “Plan”) which had 34.3 million shares authorized at March 31, 2015. There were 12.9 million shares available for grant and 18.7 million stock options and restricted shares that were outstanding under the Plan as of March 31, 2015, which expire at various times through April 2018.Stock options under the Plan are granted at prices determined by the Board of Directors but at not less thanof Alere, Inc., a global leader in near-patient diagnosis, monitoring and health information technology. Mr. Powers has a Bachelor of Science degree in Finance from the fair market value. The majorityUniversity of restricted stock units granted to employees vest over three to four years. Stock optionFlorida. He is the Chair of Quantum’s Corporate Governance and restricted stock grants to nonemployee directors typically vest over one year. Both stock optionsNominating Committee. Mr. Powers offers critical investor insights and restricted stock units granted under the Plan are subject to forfeiture if employment terminates.Other Stock Incentive PlansIn additionshareholder representation to the Plan, we have other stock incentive plans which are inactive for future share grant purposes, including plans assumed in acquisitions, under which stock options, stock appreciation rights, stock purchase rights, restricted stock awardsQuantum Board, helping to guide the Company’s strategic direction and long-term performance awardsoverall operational and financial performance. He also brings deep financial expertise, providing an understanding of corporate finance, accounting and capital markets.employees, consultants, officersMarch 2003, Mr. Press served as a General Partner of Hyde Park Holdings, Inc., a private equity investment firm. Mr. Press currently serves as a director and affiliates were authorized (“Other Plans”).63Stock options granted and assumed under the Other Plans generally vest over one to four years and expire seven to ten years after the grant date, and restricted stock granted under the Other Plans generally vests over one to four years. The Other Plans have been terminated, and outstanding stock options and restricted stock units granted and assumed remain outstanding and continue to be governed by the terms and conditionsa member of the respective Other Plan. Stock optionsNominating and restricted stock granted underCorporate Governance Committee of Newcastle Investment Corp (NYSE: NCT) a real estate investment trust. From March 2008 to November 2009, Mr. Press served as a director and member of the Other Plans are subjectGovernance & Nominating Committee of Coherent Inc., a manufacturer of laser based photonic products. From December 2011 to forfeiture if employment terminates. Stock options underFebruary 2013, Mr. Press served as a director and member of the Other Plans were grantedCompensation Committee of SeaBright Holdings, Inc., a specialty provider of multi-jurisdictional workers’ compensation insurance. From 2001 to June 2011, Mr. Press served as a director of GM Network Ltd., a private holding company providing Internet-based digital currency services. Mr. Press received his MA degree from Oxford University and an MBA degree from Harvard Business School. Mr. Press is a member of the Company’s Corporate Governance and Nominating Committee. We believe that Mr. Press’s financial expertise and over 25 years of experience investing in a broad range of public and private companies together with his public company board experience would make him well qualified to serve on the Board.prices determined byHitachi Data Systems, starting as corporate counsel and eventually becoming President and Chief Executive Officer, a position he held from 2006 to May 2007. He also served as President and Chief Operating Officer from 2002 to 2006 and Chief Operating Officer from 2000 to 2002. Mr. Roberson began his technology career at Amdahl Corporation in 1980 following posts as adjunct professor at Golden Gate University School of Law and research director at UC Hastings College of the Law. He also serves on the Board of Directors, butBrocade Communications Systems, Inc., a networking solutions company. In addition, Mr. Roberson has significant previous experience serving as a board member of public companies in the software and technology industries, including International Game Technology Corporation, where he served on the board from 2008 to 2013, Spansion Corporation (2005-2008), and Integrated Device Technology Corporation (2004-2005). Mr. Roberson holds a Bachelor of Social Ecology degree from the University of California at not less thanIrvine, and a law degree from Golden Gate University School of Law in San Francisco. He also studied financial management at Harvard Business School. He is the fair market value, and stock options assumed were governed by the respective acquisition agreement. Stock options under the Other Plans expire at various times through June 2021.Stock Purchase PlanWe have an employee stock purchase plan (the “Purchase Plan”) that allows for the purchase of stock at a 15% discount to fair market value at the date of grant or the exercise date, whichever value is less. The Purchase Plan is qualified under Section 423Chair of the Internal Revenue Code. The maximum numberQuantum’s Audit Committee and a member of shares that may be issued under the Purchase Plan is 64.3 million shares. As of March 31, 2015, 58.7 million shares had been issued. Under the Purchase Plan, rights to purchase shares are granted during the secondCompany’s Leadership and fourth quarter of each fiscal year. The Purchase Plan allows a maximum amount of two million shares to be purchased in any six month offering period. Employees purchased 2.8 million shares, 3.2 million shares and 3.8 million shares of common stock under the Purchase Plan in fiscal 2015, 2014 and 2013, respectively. The weighted-average price of stock purchased under the Purchase Plan was $1.04, $1.07 and $1.17 in fiscal 2015, 2014 and 2013, respectively. There were 5.6 million shares available for issuance as of March 31, 2015.Determining Fair ValueWe use the Black-Scholes stock option valuation model for estimating fair value of stock options granted under our plans and rights to acquire stock granted under our Purchase Plan. We amortize the fair value of stock options on a ratable basis over the requisite service periods, which are generally the vesting periods. The expected life of awards granted represents the period of time that they are expected to be outstanding. We determine the expected life based on historical experience with similar awards, giving considerationCompensation Committee. Mr. Roberson brings to the contractual terms, exercise patterns and post-vesting forfeitures. We estimate volatility based onQuantum Board vast storage industry knowledge that lends keen insight into the historical volatility of our common stock over the most recent period corresponding with the estimated expected lifenature of the award. We base the risk-free interest rate used in the Black-Scholes stock option valuation modelCompany’s business, enabling him to provide meaningful guidance on the implied yield currently available on U.S. Treasury zero-coupon issues with an equivalent term equalstrategic direction, technology innovation and growth opportunities.expected life of the award. We have not paid any cash dividends on our common stock and do not anticipate paying any cash dividends in the foreseeable future. We use historical data to estimate forfeitures and record share-based compensation for those awards that are expected to vest. We adjust share-based compensation for actual forfeitures.We granted 0.8 million RSUs with market conditions (“market RSUs”) in fiscal 2014 and estimated the fair value of these market RSUs using a Monte Carlo simulation model. The number of market RSUs is dependent on Quantum’s common stock achieving certain 60-day average stock price targets as of specified dates, which vest immediately to two years after the specified dates. The Monte Carlo model requires the input of assumptions including expected volatility, risk-free interest rate and expected term in order to simulate a large number of possible outcomes to provide an estimated fair value of the market RSUs. We used an expected volatility of 66%, a risk free interest rate of 0.5% and expected terms of ten months, twenty-two months and thirty-four months that mirrors the various vesting dates of the awards. The estimated grant date fair value of the market RSUs was $0.7 million which will be recognized over the respective vesting periods of the awards.We granted 2.4 million and 0.2 million of RSUs with performance conditions (“performance RSUs”) in fiscal 2015 and fiscal 2014, respectively, and the fair values of the performance RSUs at the grant date were $3.0 million and $0.2 million, respectively. Performance RSUs become eligible for vesting based on Quantum achieving certain revenue and operating income targets through the end of the fiscal year when the performance RSUs were granted. Share-based compensation expense for performance RSUs is recognized when it is probable that the performance conditions will be achieved. The revenue and operating income targets of the fiscal 2015 performance RSUs were achieved and $0.4 million of share-based compensation expense was recognized during fiscal 2015. The performance RSUs granted in fiscal 2014 were canceled in accordance with the grant agreement as the revenue and operating income targets of fiscal 2014 were not met; and, therefore no share-based compensation expense was recognized.Stock OptionsNo stock options were granted in fiscal 2015, 2014Board, or 2013.Restricted StockThe fair value of our restricted stock is the intrinsic value as of the grant date.64Stock Purchase PlanThe weighted-average fair values and the assumptions used in calculating fair values during each fiscal period are as follows: For the year ended March 31, 2015 2014 2013 Option life (in years) 0.5 0.5 0.5 Risk-free interest rate 0.07 % 0.07 % 0.13 % Stock price volatility 36.58 % 43.71 % 69.73 % Weighted-average grant date fair value $ 0.36 $ 0.40 $ 0.48 Share-Based Compensation ExpenseThe following tables summarize share-based compensation expense (in thousands): For the year ended March 31, 2015 2014 2013 Share-based compensation expense: Cost of revenue $ 1,489 $ 1,963 $ 2,389 Research and development 2,559 3,430 3,665 Sales and marketing 3,506 4,097 4,699 General and administrative 4,029 3,969 4,386 Total share-based compensation expense $ 11,583 $ 13,459 $ 15,139 For the year ended March 31, 2015 2014 2013 Share-based compensation by type of award: Stock options $ 617 $ 826 $ 1,681 Restricted stock 10,102 11,356 11,630 Stock purchase plan 864 1,277 1,828 Total share-based compensation expense $ 11,583 $ 13,459 $ 15,139 The total share-based compensation cost capitalized as part of inventory as of March 31, 2015 and 2014 was not material. During fiscal 2015, 2014 and 2013, no tax benefit was realized for the tax deduction from stock option exercises and other awards due to tax benefit carryforwards and tax ordering requirements.As of March 31, 2015, there was less than $0.1 million of total unrecognized compensation cost related to stock options granted under our plans. This unrecognized compensation cost is expected to be recognized over a weighted-average period of less than one year. Total intrinsic value of stock options exercised for the years ended March 31, 2015, 2014 and 2013 was $0.4 million, $0.4 million and $0.3 million, respectively. We settle stock option exercises by issuing additional common shares.As of March 31, 2015, there was $12.4 million of total unrecognized compensation cost related to nonvested restricted stock. The unrecognized compensation cost for restricted stock is expected to be recognized over a weighted-average period of 1.6 years. Total fair value of awards vested during the years ended March 31, 2015, 2014 and 2013 was $7.7 million, $6.2 million and $7.4 million, respectively, based on the fair value of our common stock on the award's vest date. We issue additional common shares upon vesting of restricted stock units.65Stock ActivityStock OptionsA summary of activity relating to all of our stock option plans is as follows (stock options and intrinsic value in thousands): Stock Options Outstanding as of March 31, 2014 7,997 $ 1.78 Exercised (866 ) 0.97 Forfeited (117 ) 2.14 Expired (2,070 ) 2.83 Outstanding as of March 31, 2015 4,944 $ 1.47 1.72 $ 2,039 Vested and expected to vest at March 31, 2015 4,944 $ 1.47 1.72 $ 2,039 Exercisable as of March 31, 2015 4,916 $ 1.46 1.71 $ 2,039 The following table summarizes information about stock options outstanding and exercisable as of March 31, 2015 (stock options in thousands):Range of Exercise Prices $0.11 — $0.63 52 $ 0.49 3.20 52 $ 0.49 $0.77 — $0.98 3,019 0.98 1.25 3,019 0.98 $1.00 — $1.35 233 1.15 1.26 233 1.15 $1.61 — $2.17 204 1.80 0.43 204 1.80 $2.52 — $2.93 1,436 2.53 2.90 1,408 2.53 4,944 $ 1.47 1.72 4,916 $ 1.46 Expiration dates ranged from April 2015 to June 2021 for stock options outstanding at March 31, 2015. Prices for stock options exercised during the three-year period ended March 31, 2015, ranged from $0.11 to $2.08.Restricted StockA summary of activity relating to our restricted stock follows (shares in thousands): Shares Nonvested as March 31, 2014 12,108 $ 1.80 Granted 10,348 1.24 Vested (6,013 ) 2.10 Forfeited (2,652 ) 1.35 Nonvested as March 31, 2015 13,791 $ 1.34 NOTE 10: 401K PLANSubstantially all of the U.S. employees are eligible to make contributions to our 401(k) savings and investment plan. We typically make discretionary contributionshas been appointed to the plan by matchingBoard, pursuant to a percentagesettlement agreement (the “Settlement Agreement”) between the Company and Starboard Value LP and certain of our employees’ contributions. Employer contributions were $2.4 million, $2.6 million and $2.8 million in fiscal 2015,its affiliates (“Starboard”) dated July 28, 2014, and 2013, respectively.66NOTE 11: INCOME TAXESPre-tax income (loss) reflected in the Consolidated Statements of Operations for the years ended March 31, 2015, 2014 and 2013 follows (in thousands): For the year ended March 31, 2015 2014 2013 U.S $ 13,507 $ (22,549 ) $ (52,940 ) Foreign 3,971 2,292 1,922 $ 17,478 $ (20,257 ) $ (51,018 ) Income tax provision consists of the following (in thousands): For the year ended March 31, 2015 2014 2013 Federal: $ (138 ) $ — $ — State: Current 125 76 231 Foreign: Current 890 1,096 1,090 Deferred (159 ) 45 (160 ) Total foreign 731 1,141 930 Income tax provision $ 718 $ 1,217 $ 1,161 The income tax provision differs from the amount computed by applying the federal statutory rate of 35% to income (loss) before income taxes as follows (in thousands): For the year ended March 31, 2015 2014 2013 Expense (benefit) at federal statutory rate $ 6,117 $ (7,090 ) $ (17,856 ) State taxes 125 76 300 Unbenefited (benefited) losses and credits (4,727 ) 7,974 18,715 Contingent tax reserves 103 460 (130 ) Foreign rate differential (778 ) (218 ) 120 Other (122 ) 15 12 $ 718 $ 1,217 $ 1,161 67Significant components of deferred tax assets and liabilities are as follows (in thousands): As of March 31, 2015 2014 Deferred tax assets: Inventory valuation method $ 1,588 $ 1,742 Accrued warranty expense 1,624 2,336 Distribution reserves 4,283 1,950 Loss carryforwards 75,262 81,012 Tax credits 185,578 191,372 Restructuring charge accruals 1,866 3,191 Other accruals and reserves not currently deductible for tax purposes 34,490 32,465 304,691 314,068 Less valuation allowance (252,475 ) (261,337 ) Deferred tax asset $ 52,216 $ 52,731 Deferred tax liabilities: Depreciation $ (4,302 ) $ (3,570 ) Acquired intangibles (4,920 ) (2,794 ) Tax on unremitted foreign earnings (15,968 ) (17,245 ) Other (26,093 ) (28,330 ) Deferred tax liability $ (51,283 ) $ (51,939 ) Net deferred tax asset $ 933 $ 792 The valuation allowance decreased $8.9 million and $8.0 million in fiscal years 2015 and 2014, respectively, and increased $17.0 million in fiscal year 2013. The decrease in the valuation allowance during fiscal year 2015 was primarily due to NOL usage and expiring tax credits.A reconciliation of the gross unrecognized tax benefits follows (in thousands): For the year ended March 31, 2015 2014 2013 Beginning balance $ 32,449 $ 32,549 $ 32,744 Settlement and effective settlements with tax authorities and related remeasurements — (488 ) (60 ) Lapse of statute of limitations — — (135 ) Increase in balances related to tax positions taken in prior period — 388 — Ending balance $ 32,449 $ 32,449 $ 32,549 During fiscal 2015, excluding interest and penalties, there was no changedescribed in our unrecognized tax benefits. Including interest and penalties, the total unrecognized tax benefit at March 31, 2015 was $33.5 million, all of which, if recognized, would favorably affect the effective tax rate. At March 31, 2015 accrued interest and penalties totaled $1.1 million. Our practice is to recognize interest and penalties related to income tax matters in income tax provision in the Consolidated Statements of Operations. Unrecognized tax benefits, including interest and penalties, were recorded in other long-term liabilities in the Consolidated Balance Sheets.We file our tax returns as prescribed by the laws of the jurisdictions in which we operate. Our U.S. tax returns have been audited for years through 2002 by the Internal Revenue Service. In other major jurisdictions, we are generally open to examination for the most recent three to five fiscal years. Although timing of the resolution and closure on audits is highly uncertain, we do not believe it is likely that the unrecognized tax benefits would materially change in the next 12 months.68As of March 31, 2015, we had federal net operating loss and tax credit carryforwards of approximately $259.3 million and $140.0 million, respectively. Our federal net operating loss carryforwards include $33.6 million attributable to excess tax deductions from stock option exercises, and are not included in the deferred tax assets shown above. The benefit of these loss carryforwards will be credited to equity when realized. The net operating loss and tax credit carryforwards expire in varying amounts beginning in fiscal 2016 if not previously utilized, the utilization of which is limited under the tax law ownership change provision. These carryforwards include $11.1 million of acquired net operating losses and $10.7 million of credits.Certain changes in stock ownership could result in a limitation on the amount of net operating loss and tax credit carryovers that can be utilized each year. Should the company undergo such a change in stock ownership, it could severely limit the usage of these carryover tax attributes against future income, resulting in additional tax charges.Due to our history of net losses and the difficulty in predicting future results, we believe that we cannot rely on projections of future taxable income to realize the deferred tax assets. Accordingly, we have established a full valuation allowance against our U.S. net deferred tax assets. Significant management judgment is required in determining our deferred tax assets and liabilities and valuation allowances for purposes of assessing our ability to realize any future benefit from our net deferred tax assets. We intend to maintain this valuation allowance until sufficient positive evidence exists to support the reversal of the valuation allowance. Our income tax expense recorded in the future will be reduced to the extent that sufficient positive evidence materializes to support a reversal of, or decrease in, our valuation allowance.NOTE 12: NET INCOME (LOSS) PER SHAREEquity Instruments OutstandingWe have stock options and restricted stock units granted under various stock incentive plans that, upon exercise and vesting, respectively, would increase shares outstanding. We have 4.50% convertible subordinated notes which are convertible at the option of the holders at any time prior to maturity into shares of Quantum common stock at a conversion price of $1.65 per share. We also have 3.50% convertible subordinated notes which are convertible at the option of the holders at any time prior to maturity into shares of Quantum common stock at a conversion price of $4.33 per share. Both the 4.50% and the 3.50% notes, if converted, would increase shares outstanding.In June 2009, we issued a warrant to EMC Corporation to purchase 10 million shares of our common stock at a $0.38 per share exercise price. Only in the event of a change of control of Quantum will this warrant vest and be exercisable. The warrant expires seven years from the date of issuance or three years after change of control, whichever occurs first. Due to these terms, no share-based compensation expense related to this warrant has been recorded to date.Net Income (Loss) per ShareThe following table sets forth the computation of basic and diluted net income (loss) per share (in thousands, except per-share data): For the year ended March 31, 2015 2014 2013 Numerator: Net income (loss) $ 16,760 $ (21,474 ) $ (52,179 ) Denominator: Weighted average shares: Basic 254,665 247,024 239,855 Dilutive shares from stock plans 5,362 — — Diluted 260,027 247,024 239,855 Basic net income (loss) per share $ 0.07 $ (0.09 ) $ (0.22 ) Diluted net income (loss) per share 0.06 (0.09 ) (0.22 ) 69Dilutive and potentially dilutive common shares from stock incentive plans are determined by applying the treasury stock method to the assumed exercise of outstanding options and the assumed vesting of outstanding restricted stock units. The dilutive impact related to our convertible subordinated notes is determined by applying the if-converted method, which includes adding the related weighted average shares to the denominator and the related interest expense to net income.The computations of diluted net income (loss) per share for the periods presented exclude the following because the effect would have been anti-dilutive:For fiscal 2015, 2014 and 2013, there were 29.0 million, 31.1 million and 31.2 million, respectively, of weighted average shares related to the 3.50% convertible subordinated notes that were excluded. For fiscal 2015, 2014 and 2013, $5.3 million, $5.7 million and $5.7 million, respectively, of related interest expense was excluded.For fiscal 2015, 2014 and 2013, there were 42.5 million, 42.5 million and 17.6 million, respectively, of weighted average shares related to the 4.50% of convertible subordinated notes that were excluded. For fiscal 2015, 2014 and 2013, $3.6 million, $3.6 million and $1.5 million, respectively, of related interest expense was excluded.Stock options to purchase 2.4 million, 12.8 million and 17.3 million weighted average shares in fiscal 2015, 2014 and 2013, respectively, were excluded.Unvested restricted stock units of less than 0.1 million, 11.0 million, and 10.1 million weighted average shares for fiscal 2015, 2014 and 2013, respectively, were excluded.NOTE 13: COMMITMENTS AND CONTINGENCIESLease CommitmentsWe lease certain facilities under non-cancelable lease agreements and also have equipment leases for various types of office equipment. Some of the leases have renewal options ranging from one to ten years and others contain escalation clauses. These leases are operating leases.In February 2006, we leased a campus facility in Colorado Springs, Colorado, comprised of three buildings in three separate operating leases with initial terms of five, seven and 15 years. In August 2010, we negotiated lower lease rates and a five year extension on one of the buildings. In March 2015, we entered into a sublease agreement to sublease a portion of one of the buildings. The future minimum lease payment schedule below includes $18.8 million of lease payments and $4.9 million of sublease rental income for this Colorado Springs campus.Rent expense was $7.0 million in fiscal 2015, $10.3 million in fiscal 2014 and $11.3 million in fiscal 2013. Sublease income was immaterial in fiscal 2015, 2014 and 2013.Future minimum lease payments and sublease rental income are as follows (in thousands): Lease Payments Sublease Rental Income Total For the year ending March 31, 2016 $ 9,107 $ (587 ) $ 8,520 2017 6,610 (959 ) 5,651 2018 6,124 (936 ) 5,188 2019 5,523 (909 ) 4,614 2020 4,032 (943 ) 3,089 Thereafter 4,459 (813 ) 3,646 $ 35,855 $ (5,147 ) $ 30,708 Commitments to Purchase InventoryWe use contract manufacturers for our manufacturing operations. Under these arrangements, the contract manufacturer procures inventory to manufacture products based upon our forecast of customer demand. We have similar arrangements with certain other suppliers. We are responsible for the financial impact on the supplier or contract manufacturer of any reduction or product mix shift in the forecast relative to materials that the third party had already purchased under a prior forecast. Such a variance in forecasted demand could require a cash payment for inventory in excess of current customer demand or for costs of excess or obsolete inventory. As of March 31, 2015, we had issued non-cancelable commitments for $46.0 million to purchase inventory from our contract manufacturers and suppliers.70Legal ProceedingsOn February 18, 2014, Crossroads Systems, Inc. (“Crossroads”) filed a patent infringement lawsuit against Quantum in the U.S. District Court for the Western District of Texas, alleging infringement of U.S. Patents 6,425,035 and 7,934,041. An amended complaint filed on April 15, 2014 also alleged infringement of U.S. patent 7,051,147. Crossroads asserts that we have incorporated Crossroads' patented technology into our StorNext QX and Q-Series lines of disk array products, and into our Scalar libraries. Crossroads seeks unspecified monetary damages and injunctive relief. Crossroads has already dismissed all claims of infringement with respect to the StorNext QX and Q-Series products. We believe the probability that we will pay material damages related to this lawsuit is remote.On September 23, 2014, we filed a lawsuit against Crossroads in the U.S. District Court for the Northern District of California alleging patent infringement of our patent 6,766,412 by Crossroad’s StrongBox VSeries Library Solution product. We are seeking injunctive relief and the recovery of monetary damages. On December 4, 2014, we amended our complaint alleging infringement of a second patent, 5,940,849, related to Crossroad's SPHiNX product line. On December 16, 2014, we withdrew the amended complaint alleging infringement of the second patent, 5,940,849.IndemnificationsWe have certain financial guarantees, both express and implied, related to product liability and potential infringement of intellectual property. Other than certain product liabilities recorded as of March 31, 2015 and 2014, we did not record a liability associated with these guarantees, as we have little or no history of costs associated with such indemnification requirements. Contingent liabilities associated with product liability may be mitigated by insurance coverage that we maintain.In the normal course of business to facilitate transactions of our services and products, we indemnify certain parties with respect to certain matters. We have agreed to hold certain parties harmless against losses arising from a breach of representations or covenants, or out of intellectual property infringement or other claims made against certain parties. These agreements may limit the time within which an indemnification claim can be made and the amount of the claim. In addition, we have entered into indemnification agreements with our officers and directors, and our bylaws contain similar indemnification obligations to our agents.It is not possible to determine the maximum potential amount under these indemnification agreements due to the limited history of our indemnification claims and the unique facts and circumstances involved in each particular agreement. Historically, payments made by us under these agreements have not had a material impact on our operating results, financial position or cash flows.NOTE 14: GEOGRAPHIC INFORMATIONThe company operates in one reportable segment.Revenue, attributed to regions based on the location of customers, and long-lived assets, comprised of property and equipment, by region were as follows (in thousands): As of and for the year ended March 31, 2015 2014 2013 Revenue Revenue Revenue Americas $ 14,063 $ 340,811 $ 16,759 $ 359,259 $ 20,182 $ 378,514 Europe 421 152,186 524 143,508 756 151,676 Asia Pacific 169 60,098 291 50,398 518 57,249 $ 14,653 $ 553,095 $ 17,574 $ 553,165 $ 21,456 $ 587,439 71Revenue for Americas regions outside of the United States is immaterial. Following are revenues attributable to each of our product groups, services and royalties (in thousands): For the year ended March 31, 2015 2014 2013 Tape automation systems $ 152,205 $ 174,438 $ 206,112 Disk backup systems* 54,845 50,217 74,255 Devices and media 62,642 70,680 68,724 Scale-out storage solutions* 85,887 52,983 49,819 Service 155,674 147,199 144,037 Royalty 41,842 57,648 44,492 Total revenue $ 553,095 $ 553,165 $ 587,439 *Revenue from disk backup systems and scale-out storage solutions was previously included in a caption entitled disk systems and software solutions. Previously reported amounts have been reclassified to conform to current period presentation.NOTE 15: UNAUDITED QUARTERLY FINANCIAL DATA For the year ended March 31, 2015 (In thousands, except per share data) Revenue $ 128,128 $ 135,106 $ 142,063 $ 147,798 Gross margin 55,526 61,929 65,067 62,164 Net income (loss) (4,324 ) 1,248 6,931 12,905 Basic net income (loss) per share (0.02 ) 0.00 0.03 0.05 Diluted net income (loss) per share (0.02 ) 0.00 0.03 0.04 For the year ended March 31, 2014 Revenue $ 147,849 $ 131,479 $ 145,869 $ 127,968 Gross margin 69,835 56,392 61,373 52,020 Net income (loss) 3,281 (7,893 ) (2,458 ) (14,404 ) Basic and diluted net income (loss) per share 0.01 (0.03 ) (0.01 ) (0.06 ) 72SCHEDULE IICONSOLIDATED VALUATION AND QUALIFYING ACCOUNTSAllowance for doubtful accounts (in thousands): Deductions (i) For the year ended: March 31, 2015 $ 88 $ 40 $ (101 ) $ 27 March 31, 2014 62 (39 ) 65 88 March 31, 2013 217 3 (158 ) 62 ____________________(i) Uncollectible accounts written off, net of recoveries.ITEM 9.CHANGES IN AND DISAGREEMENTS WITH ACCOUNTANTS ON ACCOUNTING AND FINANCIAL DISCLOSURENone.ITEM 9A. CONTROLS AND PROCEDURESAttached as exhibits to this AnnualCurrent Report on Form 10-K are certifications of our Chief Executive Officer (“CEO”)8-K filed with the SEC on July 29, 2014. Mr. DiNardo was initially recommended to the Corporate Governance and Chief Financial Officer (“CFO”), which are requiredNominating Committee for nomination to the Board at the 2013 Annual Meeting and Mr. Fuller at the 2014 Annual Meeting pursuant to Rule 13a-14a settlement agreement between the Company and Starboard Value LP and certain of the Securities Exchange Act of 1934,its affiliates dated May 13, 2013 (the “2013 Settlement Agreement”), as amended (the “Exchange Act”). This “Controls and Procedures” section of this Annualdescribed in our Current Report on Form 8-K filed with the SEC on May 14, 2013. In April 2016, Mr. Press replaced Philip Black who was initially recommended for election pursuant to the 2013 Settlement Agreement and had been a director since May 2013.includes information concerningregarding the controlsnames, biographical information and controls evaluation referencedbusiness experience of our executive officers required by Item 401 of Regulation S-K was provided in the certifications. This sectionPart I of the Annual Report on Form 10-K should be read in conjunction withOriginal Filing under the certificationscaption “Executive Officers and the reportManagement Team.”PricewaterhouseCoopers LLP as described below for a more complete understandingMr. Roberson, Chair of the matters presented.Evaluationcommittee, Mr. Andersen and Mr. Auvil, all of Disclosure Controlswhom are independent directors, including all applicable enhanced independence requirements for audit committee members under NYSE listing standards and ProceduresWe evaluated the effectiveness of the designSEC rules, and operation of our disclosure controls and proceduresare financially literate, as defined in Rules 13a-15(e)the applicable NYSE listing standards and 15d-15(e) underSEC rules and regulations. Our Board has determined that David E. Roberson is an audit committee financial expert as defined by SEC rules. The Audit Committee, which generally meets at least twice per quarter, once prior to quarterly earnings releases and again prior to the Exchange Act asfiling of the end of the period covered by this Annual Report on Form 10-K. This control evaluation was performed under the supervisionCompany’s quarterly and annual reports with the participation of management, including our CEO and CFO. Disclosure controls and procedures are designed to ensure that information required to be disclosed in our reports filed underSEC, appoints the Exchange Act, such as this Annual Report on Form 10-K, is recorded, processed, summarized and reported within the time periods specified by the SEC. Disclosure controls are also designed to ensure that such information is accumulated and communicated to our management, including the CEO and CFO, as appropriate, to allow timely decisions regarding required disclosure.Based on the controls evaluation, our CEO and CFO have concluded that as of the end of the period covered by this Annual Report on Form 10-K, our disclosure controls were effective.73Management's Report on Internal Control over Financial ReportingOur management is responsible for establishing and maintaining adequate internal control over financial reporting, as such term is defined in Exchange Act Rules 13a-15(f) and 15d-15(f). Under the supervision and with the participation of our management, including our CEO and CFO, we conducted an evaluation of the effectiveness of our internal control over financial reporting as of March 31, 2015 based on the criteria for effective control over financial reporting described in Internal Control - Integrated Framework (2013) issued by the Committee of Sponsoring Organizations of the Treadway Commission (COSO). Based on the results of our evaluation, our management concluded that our internal control over financial reporting was effective as of March 31, 2015 to provide reasonable assurance regarding the reliability of financial reporting and preparation of financial statements for external reporting purposes in accordance with generally accepted accounting principles.PricewaterhouseCoopers LLP, ourCompany’s independent registered public accounting firm has issued an attestation report regarding its assessment ofand is responsible for approving the services performed by the Company’s independent registered public accounting firm and for reviewing and evaluating the Company’s accounting principles and its systems of internal control over financial reporting as of March 31, 2015, as set forth ataccounting controls. At each meeting, the beginning of Part II, Item 8 "Financial Statements and Supplementary Data" of this Annual Report on Form 10-K.Limitations on Effectiveness of ControlsOurAudit Committee first meets with Company management including our CEO and CFO, does not expect that our disclosure controls or our internal control over financial reporting will prevent all errors and all fraud. A control system, no matter how well conceived and operated, can provide only reasonable, not absolute, assurance that the objectives of the control system are met. Further, the design of a control system must reflect the fact that there are resource constraints, and the benefits of controls must be considered relativeCompany’s independent registered public accounting firm in order to their costs. Because ofreview financial results and conduct other appropriate business. In addition, the inherent limitations in all control systems, no evaluation of controls can provide absolute assurance that all control issues and instances of fraud, if any, within the Company have been detected. These inherent limitations include the realities that judgments in decision-making can be faulty, and that breakdowns can occur because of simple error or mistake. Additional controls can be circumvented by the individual acts of some persons, by collusion of two or more people, or by management override of the controls. The design of any system of controls also is based in part upon certain assumptions about the likelihood of future events, and there can be no assurance that any design will succeed in achieving its stated goals under all potential future conditions; over time, controls may become inadequate because of changes in conditions, or the degree of complianceAudit Committee regularly meets separately with the policies or procedures may deteriorate. BecauseCompany’s independent registered public accounting firm without the presence of the inherent limitations in a cost-effective control system, misstatements due to error or fraud may occur and not be detected.Changes in Internal Controls over Financial ReportingThere was no change in our internal control over financial reporting during the fourth quarter of fiscal 2015 that has materially affected, or is reasonably likely to materially affect, our internal controls over financial reporting.ITEM 9B. OTHER INFORMATIONNone.PART IIIITEM 10. DIRECTORS, EXECUTIVE OFFICERS AND CORPORATE GOVERNANCEThe information required by this item with respect to our directors, audit committee and audit committee financial expert is incorporated by reference to the information set forth in our proxy statement for the 2015 Annual Meeting of Stockholders to be filedmanagement, as well as with the Commission within 120 days afterCompany’s management and with the endCompany’s Internal Audit department. The Audit Committee held a total of ourten (10) meetings during the fiscal year ended March 31, 2015. For information pertaining to our executive officers, refer2016 (“Fiscal 2016”).section captioned “Executive Officers & Management Team”, Item 1 "Business"procedures by which directors may recommend nominees for our board of this Annual Report on Form 10-K.“Corporate74Governance.“Governance Documents.” Copies of our Corporate Governance Principles are available free upon request by a stockholder. The charters of our Audit Committee, Leadership and Compensation Committee and Corporate Governance and Nominating Committee are also available on our website at http://www.quantum.com, where they may be found by clicking “About Us” from the home page and then choosing “Investor Relations” and then “Corporate Governance.“Governance Documents.” Copies of these committee charters are available free upon request by a stockholder.ITEM 11. EXECUTIVE COMPENSATIONThe informationthis item is incorporatedSEC rules to furnish the Company with copies of all forms that they file pursuant to Section 16(a). Based solely on its review of the copies of such reports received by referencethe Company and on written representations from certain reporting persons, the Company believes that all required filings were timely made during Fiscal 2016, except for one filing for Mr. Stedman reporting the surrendering of shares to satisfy tax withholding obligations upon the vesting of restricted stock units, which was late due to an administrative error.information set forthexecutive officers of the Company who served as our principal executive officer and principal financial officer during Fiscal 2016, as well as the three executive officers who were the next most highly-compensated executive officers as of the end of Fiscal 2016. Our named executive officers for Fiscal 2016 are:● ● ● ● ● ● proxy statementscale-out storage portfolio, which is a high performance storage solution engineered to optimize demanding workflows and accelerate time to insight. We also expanded Q-Cloud® offerings with the launch of Q-Cloud Vault, a new service that enables users to take advantage of secure, low-cost public cloud storage for long-term retention of digital assets. We began offering LTO-7 to our tiered storage portfolio, more than doubling the capacity over previous generations and enabling low-cost, energy-efficient and secure storage for protecting and retaining data.● ● ● ● ● ● ● ● ● ● ● ● ● ● ● ● ● ● ● ● ● ● ● ● Company Annual
Revenue
($MM)Market
Capitalization
($MM)Black Box Corporation $ 970 $ 365 Calix, Inc. $ 381 $ 533 Checkpoint Systems, Inc. $ 688 $ 571 Cray Inc. $ 502 $ 1,178 Datalink Corporation $ 612 $ 280 Electronics for Imaging $ 758 $ 2,093 Emulex $ 447 $ 457 Extreme Networks $ 525 $ 508 Harmonic Inc. $ 461 $ 605 Imation Corp. $ 782 $ 142 Integrated Device Technology, Inc. $ 493 $ 2,429 Polycom $ 1,345 $ 1,823 Qlogic Corporation $ 467 $ 796 Riverbed Technology $ 1,074 $ 3,007 ShoreTel, Inc. $ 340 $ 419 Silicon Graphics International Corp. $ 530 $ 336 SuperMicro Computer $ 1,467 $ 1,202 Median $ 530 $ 571 Quantum (November 2014) $ 533 $ 314 ● ● ● ● ● ● 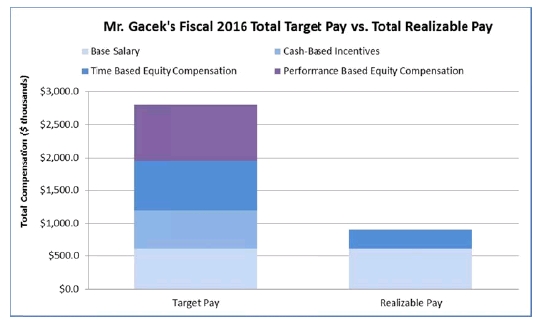
Named Executive Increase Officer Title Fiscal 2015 Salary % Fiscal 2016 Salary Jon W. Gacek President & CEO $600,000 —% $600,000 Christopher S. Willis(1) Interim SVP & CFO $— —% $237,505 William C. Britts SVP, WW Sales & Marketing $370,004 —% $370,004 Robert S. Clark SVP, Product Operations $370,000 8.11% $400,000 Geoffrey G. Stedman(1) SVP, StorNext Solutions $— —% $295,000 Linda M. Breard Former SVP & CFO $360,000 3.61% $373,000 filedmarket competitive.Named Executive Officer Title Fiscal 2015 Target Fiscal 2016 Target Jon W. Gacek President & CEO 100% 100% Christopher S. Willis Interim SVP & CFO —% 35% William C. Britts(1) SVP, WW Sales & Marketing 50% 50% Robert S. Clark SVP, Product Operations 50% 50% Geoffrey G. Stedman SVP, StorNext Solutions —% 50% Linda M. Breard Former SVP & CFO 50% 50% ● ● ● ● 120 days after the established guidelines based on the following factors:● ● ● ● ● Executive Officer Title Restricted Stock Units
AwardedPerformance-based
Restricted Stock UnitsJon W. Gacek President & CEO 445,000 500,000 Christopher S. Willis Interim SVP & CFO 45,000 19,286 William C. Britts SVP, WW Sales & Marketing 160,000 106,667 Robert S. Clark SVP, Product Operations 160,000 106,667 Geoffrey G. Stedman SVP, StorNext Solutions 160,000 106,667 Linda M. Breard Former SVP & CFO 100,000 * 66,667 * ended March 31, 2015.MEMBERS OF THE LEADERSHIP AND COMPENSATION COMMITTEE David A. Krall, Chair Louis DiNardo David E. Roberson (1) This report of the Leadership and Compensation Committee of the Board of Directors shall not be deemed “soliciting material,” nor is it to be deemed filed with the SEC, nor incorporated by reference in any filing of the Company under the Securities Act of 1933, as amended, or the Securities Exchange Act of 1934, as amended, whether made before or after the date hereof and irrespective of any general incorporation language in any such filing. ● Discretion provided to the Committee to set targets, monitor performance and determine final payouts; ● Additional oversight of the compensation programs by a broad-based group of functions within the Company, including Human Resources, Finance and Legal and at multiple levels within the Company; ● A balanced mix of compensation programs that focus our employees on achieving both short and long-term objectives, that include both performance-based and non performance-based pay, and that provide a balanced mix of cash and equity compensation; ● An annual review by the Committee of target compensation levels for our executive officers, including a review of the alignment of executive compensation with performance; ● Caps on the maximum funding under the Company’s annual bonus program, including the Executive Officer Incentive Plan and the Quantum Incentive Plan; ● An insider trading policy which expressly prohibits buying Company shares on margin or using or pledging owned shares as collateral for loans and engaging in transactions in publicly-traded options, such as puts and calls, and other derivative securities with respect to the Company’s securities. This extends to any hedging or similar transaction designed to decrease the risks associated with holding Company securities; ● Incentives focused on the use of reportable and broad-based internal financial metrics (non-GAAP operating income and revenue); ● Pay positioning targeted at the market median based on a reasonable competitive peer group and published surveys; ● ● Risk mitigators, including stock ownership guidelines for the CEO and Board of Directors and stock pledging policies are in place. Name and
Principal PositionYear Salary(1) Bonus(2) Stock Awards(3) Option
AwardsNon-Equity
Incentive Plan
Compensation(4)Change in
Pension Value
and
Nonqualified
Deferred
Compensation
Earnings(5)All Other
Compensation(6)Total Jon W. Gacek 2016 $ 600,000 $ — 752,050 $ — $ — $ — $ 2,769 $ 1,354,819 President and Chief Executive Officer 2015 $ 600,000 $ — 1,224,375 $ — $ 301,210 $ — $ 11,031 $ 2,136,616 2014 $ 600,000 $ — 1,900,208 $ — $ — $ — $ 3,500 $ 2,503,708 Christopher S. Willis 2016 $ 234,813 $ — 76,050 $ — $ — $ — $ 1,575 $ 312,438 Interim Senior Vice President & CFO(7) William C. Britts 2016 $ 370,004 $ — 270,400 $ — $ 30,814 $ — $ 4,474 $ 675,692 Senior Vice President, WW Sales 2015 $ 370,004 $ — 376,250 $ — $ 271,988 $ — $ 7,687 $ 1,025,929 and Mktg 2014 $ 364,619 $ — 312,750 $ — $ 62,000 $ — $ 8,412 $ 747,781 Robert S. Clark 2016 $ 391,923 $ — 270,400 $ — $ — $ — $ 6,262 $ 668,585 Senior Vice President, Product Operations 2015 $ 365,962 $ — 376,250 $ — $ 92,873 $ — $ 12,769 $ 847,854 2014 $ 350,962 $ — 312,750 $ — $ — $ — $ 7,771 $ 671,483 Geoffrey G. Stedman 2016 $ 289,615 $ — 270,400 $ — $ — $ — $ 1,428 $ 561,443 Senior Vice President,StorNext Solutions(7) Linda M. Breard 2016 $ 317,854 $ — 169,000 $ — $ — $ — $ 37,897 $ 524,751 Former Senior Vice President & CFO 2015 $ 357,308 $ — 301,000 $ — $ 90,363 $ — $ 8,000 $ 756,671 2014 $ 347,308 $ — 278,000 $ — $ — $ — $ 7,327 $ 632,635 (1) The amounts reported in the Salary column for Fiscal 2016 represent the dollar value of the cash base salaries earned in Fiscal 2016. (2) No bonuses were paid to our named executive officers with respect to Fiscal 2016. Bonuses were last paid for performance achieved in Fiscal 2015. (3) The amounts reported represent the fair value, calculated in accordance with ASC Topic 718 for share-based payment transactions and exclude the impact of estimated and actual forfeitures related to service-based vesting conditions. The assumptions used in the calculation of the value are disclosed under “Note 9: Stock Incentive Plans and Share-Based Compensation” in the Company’s Annual Report on Form 10-K filed with the SEC on June 3, 2016. The fair value of performance-based restricted units is based on the actual shares earned after the close of the fiscal year. For Fiscal 2016, company performance was not met and no performance-based restricted units were earned for any officers including Mr. Gacek. (4) The amounts reported in this column represent performance-based cash incentive payments paid pursuant to Quantum’s Executive Officer Incentive Plan and may include amounts earned in a given fiscal year but not paid until the subsequent year. For Mr. Britts, the total amount reported includes a total cash commission payment of $30,814 under the Fiscal 2016 Sales Compensation Plan. (5) There is no Change in Pension Value and no Non-Qualified Deferred Compensation Earnings reportable as the Company does not maintain a defined benefit or actuarial pension plan nor was there any compensation that was deferred. (6) The amounts listed in All Other Compensation column of the Summary Compensation Table for Fiscal 2016 consist of the following: Name 401(k) Matching
Contributions(a) Severance Payments Financial Planning(b) Vacation Paid upon
Termination(c) Other Comp(d) Jon W. Gacek $ 2,769 $ 0 $ 0 $ 0 $ 0 Christopher S. Willis $ 1,575 $ 0 $ 0 $ 0 $ 0 William C. Britts $ 4,474 $ 0 $ 0 $ 0 $ 0 Robert S. Clark $ 2,562 $ 0 $ 3,500 $ 0 $ 200 Geoffrey G. Stedman $ 1,428 $ 0 $ 0 $ 0 $ 0 Linda M. Breard $ 2,077 $ 0 $ 2,183 $ 33,437 $ 200 (a) 401(k) matching contributions were made for the first quarter of FY2016 only. (b) Payments include reimbursement for financial counseling and tax preparation services. (c) Payments include accrued vacation time paid out upon termination. (d) Payments include $200 reimbursement for fitness center membership. ITEM (7)Mr. Willis and Mr. Stedman were not named executive officers in fiscal years 2014 or 2015. Estimated Future Payouts Under
Non-Equity Incentive Plan Awards(1)
Equity Incentive Plan Awards(2)All
Other
Stock
Awards:
Number
of Shares
of Stock
or Units
(#)(3)All Other
Option
Awards:
Number of
Securities
Underlying
Options
(#)Exercise
or Base
Price of
Option
Awards
($/Sh)Grant
Date Fair
Value of
Stock and
Option
Awards(4)Name Grant
Date Threshold
($) Target
($) Maximum
($)(5) Threshold
(#) Target
(#) Maximum
(#) Jon W. Gacek 07/01/15 — — — — — — 445,000 — — $ 752,050 07/01/15 — — — 250,000 500,000 750,000 — — — $ 845,000 — $ 600,000 $ 900,000 — — — — — — — Christopher S. Willis 07/01/15 — — — — — — 45,000 — — $ 76,050 07/01/15 — — — 9,643 19,286 28,929 — — — $ 32,593 — $ 83,127 $ 124,690 — — — — — — — William C. Britts 07/01/15 — — — — — — 160,000 — — $ 270,400 07/01/15 — — — 53,334 106,667 160,000 — — — $ 180,267 — $ 185,002 $ 277,503 — — — — — — — — $ 200,000(6) — — — — — — — — Robert S. Clark 07/01/15 — — — — — — 160,000 — — $ 270,400 07/01/15 — — — 53,334 106,667 160,000 — — — $ 180,267 — $ 200,000 $ 300,000 — — — — — — — Geoffrey G. Stedman 07/01/15 — — — — — — 160,000 — — $ 270,400 07/01/15 — — — 53,334 106,667 160,000 — — — $ 180,267 — $ 147,500 $ 221,250 — — — — — — — Linda M. Breard 07/01/15 — — — — — — 100,000 — — $ 169,000 07/01/15 — — — 333,334 66,667 100,000 — — — $ 112,667 — $ 186,500 $ 279,750 — — — — — — — (1) The amounts reported reflect payout at target and maximum with a cap of 150% of target. (2) Performance-based Restricted Stock Units are earned only if the Company exceeds certain revenue and operating income targets as of March 31, 2016. For Fiscal 2016, the Company had to have achieved significant performance for the performance-based restricted stock units to be granted at threshold, target or maximum levels resulting in 50%, 100% or 150% awards respectively. Performance was not achieved for Fiscal 2016 and no performance-based shares were earned for executives or any other employees. (3) Restricted Stock Units will vest (based on continued employment) in equal installments annually over four years on each anniversary of the award’s grant date. (4) The amounts reported were computed in accordance with ASC 718, excluding the effect of estimated and actual forfeitures. See “Note 9: Stock Incentive Plans and Share-Based Compensation” in the Company’s Annual Report on Form 10-K filed on June 3, 2016, regarding assumptions underlying the valuation of equity awards. For performance-based restricted stock units, the report Grant Date Fair Value of the shares is based on the value of the shares granted on July 1, 2015. (5) The Company’s Executive Officer Incentive Plan provides that no executive officer’s actual award under the plan may, for any period of three consecutive fiscal years, exceed $15 million. These awards are subject to an annual payout cap of 150% of the executive officer’s annual bonus payment target. (6) Amount reflects sales commissions target payments pursuant to the Fiscal Year 2016 Sales Compensation Plan based on the sale of the Company’s branded products and branded services. The applicable quota for Fiscal 2016 was $509.0 million. Name Option Awards Stock Awards Number of
Securities
Underlying
Unexercised
Options
Securities
Underlying
Unexercised
OptionsEquity
Incentive
Plan
Awards:
Number of
Securities
Underlying
Unexercised
Unearned
Options Option
Exercise
Price
($) Option
Expiration
Date Number
of Shares
or Units of
Stock
That Have
Not
Vested
(#) Market
Value of
Shares or
Units of
Stock
That
Have Not
Vested
($) Equity
Incentive
Plan
Awards:
Number of
Unearned
Shares,
Units, or
Other
Rights
That Have
Not Vested
(#) Equity
Incentive
Plan
Awards:
Market
or
Payout
Value of
Unearned
Shares,
Units, or
Other
Rights
That Have
Not Vested
($)(#) (#) Exercisable Unexercisable (#) Jon W. Gacek 1,300,000 (1) $ 2.52 4/1/2018 216,666 (3) $ 132,166 400,000 (6) $ 244,000 500,000 (2) $ 0.98 7/1/2016 500,000 (4) $ 305,000 445,000 (10) $ 271,450 153,000 (5) $ 93,330 Christopher S. Willis 90,000 (2) $ 0.98 7/1/2016 16,666 (7) $ 10,166 33,333 (4) $ 20,333 45,000 (10) $ 27,450 4,371 (5) $ 2,666 William C. Britts 275,000 (2) $ 0.98 7/1/2016 75,000 (7) $ 45,750 166,666 (4) $ 101,666 160,000 (10) $ 97,600 34,000 (5) $ 20,740 Robert S. Clark 100,000 (8) $ 2.59 4/1/2017 75,000 (7) $ 45,750 37,500 (2) $ 0.98 7/1/2016 166,666 (4) $ 101,666 14,584 (9) $ 0.77 4/1/2016 160,000 (10) $ 97,600 34,000 (5) $ 20,740 Geoffrey G. Stedman 83,000 (11) $ 50,630 160,000 (10) $ 97,600 34,000 (5) $ 20,740 Linda M. Breard 187,500 (2) $ 0.98 4/28/2016 (1) Granted 4/1/11; 25% vested on 4/1/12, and remainder will vest 1/48thmonthly, subject to continued employment. (2) Granted 7/1/09; 25% vested on 7/1/10, 50% vested on 7/1/11, 25% vested on 7/1/12. (3) Granted 9/1/13; vest annually over three years beginning 9/1/13, subject to continued employment. (4) Granted on 7/1/14; vest annually over three years beginning 7/1/14, subject to continued employment. (5) Granted on 7/1/14; Shares earned on 3/31/15 as performance condition threshold was satisfied. Vest annually over three years beginning 7/1/14, subject to continued employment. (6) Granted on 9/1/13; Vesting is dependent on Quantum’s common stock achieving certain 60-day average stock price targets as of specified dates, which vest immediately to two years after the specified dates, subject to continued employment. 200,000 shares canceled on each of 7/1/14 and 7/1/15 as performance condition for first two performance periods had not been satisfied. (7) Granted 7/1/13; vest annually over three years beginning 7/1/13, subject to continued employment. (8) Granted 4/1/10; 25% vested on 4/1/11, and remainder will vest 1/48thmonthly, subject to continued employment. (9) Granted 4/1/09; 25% vested on 3/1/10, and remainder will vest 1/48thmonthly, subject to continued employment. (10) Granted 7/1/15; vest annually over four years beginning 7/1/15, subject to continued employment. (11) Granted 4/1/14; vest annually over three years beginning 4/1/14, subject to continued employment. Option Awards Stock Awards Name Number of
Shares Acquired
on Exercise (#) Value Realized on
Exercise ($) Number of Shares
Acquired on
Vesting (#) Value Realized on
Vesting ($)(1)Jon W. Gacek — — 543,167 $ 917,952 Christopher S. Willis — — 48,853 $ 82,562 William C. Britts — — 225,334 $ 380,814 Robert S. Clark — — 242,000 $ 408,980 Geoffrey G. Stedman — — 100,000 $ 70,238 Linda M. Breard — — 196,934 $ 332,818 (1) The amount reported is calculated by multiplying the number of shares that vested by the market price of the underlying shares of the Company’s Common Stock on the vesting date. ● a lump sum payment equal to 200% of his then established base compensation; ● a lump sum payment equal to 200% of his target annual bonus; ● payment of COBRA premiums for twelve (12) months; and ● vesting of any unvested equity-based compensation award then held by him. ● a lump sum payment equal to 150% of the executive officer’s then established base compensation; ● a lump sum payment equal to 150% of the executive officer’s target annual bonus; ● payment of COBRA premiums for twelve (12) months; and ● vesting of any unvested equity-based compensation award then held by the executive officer. Potential Payments Upon: Name Type of Benefit Involuntary Termination
within 12 Months After a
Change of Control Involuntary Termination
Not Associated with a
Change of ControlJon W. Gacek Cash Severance Payments $ 2,400,000 $ 600,000 Vesting Acceleration(1) $ 801,946 $ 0 Continued Coverage of Employee Benefits(2) $ 12,969 $ 12,969 Total Termination Benefits: $ 3,214,915 $ 612,969 Christopher S. Willis Cash Severance Payments $ 320,632 $ 0 Vesting Acceleration(1) $ 60,615 $ 0 Continued Coverage of Employee Benefits(2) $ 23,282 $ 0 Total Termination Benefits: $ 404,529 $ 0 William C. Britts Cash Severance Payments $ 832,509 $ 370,004 Vesting Acceleration(1) $ 265,756 $ 0 Continued Coverage of Employee Benefits(2) $ 23,054 $ 0 Total Termination Benefits: $ 1,121,319 $ 370,004 Robert S. Clark Cash Severance Payments $ 900,000 $ 0 Vesting Acceleration(1) $ 265,756 $ 0 Continued Coverage of Employee Benefits(2) $ 13,045 $ 0 Total Termination Benefits: $ 1,178,801 $ 0 Geoffrey G. Stedman Cash Severance Payments $ 663,750 $ 0 Vesting Acceleration(1) $ 168,970 $ 0 Continued Coverage of Employee Benefits(2) $ 14,722 $ 0 Total Termination Benefits: $ 847,442 $ 0 Linda M. Breard Cash Severance Payments $ 559,500 $ 0 Vesting Acceleration(1) $ 199,591 $ 0 Continued Coverage of Employee Benefits(2) $ 23,232 $ 0 Total Termination Benefits(3): $ 782,323 $ 0 (1) Reflects the aggregate market value of outstanding and unvested stock option grants and restricted stock unit awards. For unvested stock options, the aggregate market value is computed by multiplying (i) the difference between $0.61 and the exercise price of the option, by (ii) the number of shares of the Company’s Common Stock underlying the unvested stock options at March 31, 2016. For unvested restricted stock unit awards, the aggregate market value is computed by multiplying (i) $0.61, by (ii) the number of unvested restricted stock unit awards outstanding at March 31, 2016. In the event of vesting acceleration or other modifications of share-based awards, we account for such modifications in accordance with ASC 718. (2) Assumes continued coverage of employee benefits at the Fiscal 2016 COBRA premium rate for health, dental, and vision coverage. (3) Ms. Breard voluntarily terminated employment effective January 26, 2016, and while the total termination benefits reflect the potential payments she would have received as an employee during a change of control, Ms. Breard did not receive any actual severance payments in association with her resignation. Compensation Element Quantum Board Compensation Program Board Service – Cash ➢ Annual cash retainer: $50,000 ➢Meeting fees: none Board Service – Equity ➢Initial award: restricted stock units with grant date value of $125,000 ➢Annual award: restricted stock units with grant date value of $100,000 Committee Chair Service ➢Annual cash retainers: ➢Meeting fees: none Committee Member Service ➢Annual cash retainers: ➢Meeting fees: none Lead Director / Chairman ➢Annual cash retainer: $25,000 Name Fees Earned
or Paid in
Cash(1)Stock
Awards
(2)(4)Option
Awards
(3)(4)Non Equity
Incentive Plan
CompensationChange in
Pension
Value and
Nonqualified
Deferred
Compensation
EarningsAll Other
Compensation Total Andersen, Robert J.* $ 50,000 $ 150,000 $ 0 $ 0 $ 0 $ 0 $ 200,000 Auvil III, Paul R.** $ 47,500 $ 100,000 $ 0 $ 0 $ 0 $ 0 $ 147,500 Black, Philip*** $ 61,250 $ 100,000 $ 0 $ 0 $ 0 $ 0 $ 161,250 DiNardo, Louis $ 61,250 $ 100,000 $ 0 $ 0 $ 0 $ 0 $ 161,250 Fuller, Dale L. $ 57,500 $ 100,000 $ 0 $ 0 $ 0 $ 0 $ 157,500 Krall, David A. $ 67,500 $ 100,000 $ 0 $ 0 $ 0 $ 0 $ 167,500 Powers, Gregg J. $ 61,250 $ 100,000 $ 0 $ 0 $ 0 $ 0 $ 161,250 Roberson, David E. $ 85,000 $ 100,000 $ 0 $ 0 $ 0 $ 0 $ 185,000 Smith, Jeffrey C.*** $ 15,000 $ 100,000 $ 0 $ 0 $ 0 $ 0 $ 115,000 * Mr. Andersen joined the Board effective May 6, 2015. ** Effective October 2015, Mr. Auvil declined to receive any further cash fees in connection with his service on the Company’s Board. *** Mr. Smith resigned effective May 6, 2015, and Mr. Black resigned effective February 3, 2016. (1) Name Board Retainer Committee
Membership
Retainer Committee Chair
Retainer Chairman
Retainer Total Fees Earned
or
Paid in CashAndersen, Robert J. $ 43,750 $ 6,250 $ — $ 50,000 Auvil III, Paul R. $ 25,000 $ 10,000 $ — $ 12,500 $ 47,500 Black, Philip $ 50,000 $ 11,250 $ — $ — $ 61,250 DiNardo, Louis $ 50,000 $ 7,500 $ 3,750 $ — $ 61,250 Fuller, Dale L. $ 50,000 $ 7,500 $ — $ — $ 57,500 Krall, David A. $ 50,000 $ 10,000 $ 7,500 $ — $ 67,500 Powers, Gregg J. $ 50,000 $ 7,500 $ 3,750 $ — $ 61,250 Roberson, David E. $ 50,000 $ 22,500 $ 12,500 $ — $ 85,000 Smith, Jeffrey C. $ 12,500 $ 2,500 $ — $ — $ 15,000 (2) On June 1, 2015, Mr. Andersen received 64,767 restricted stock units. On September 1, 2015, the Company’s non-employee directors received the following awards: Messrs. Auvil, Black, DiNardo, Fuller, Krall, Powers, and Roberson each received an annual award of 90,090 restricted stock units and Mr. Andersen received 22,523 restricted stock units. The value of these awards was computed in accordance with Statement of Financial Accounting Standards Accounting Standards Codification Topic 718, Compensation – Stock Compensation (“ASC 718”). Assumptions used in the calculation of the value are disclosed under “Stock Incentive Plans and Share-Based Compensation” in the Company’s Annual Report on Form 10-K filed with the SEC on June 6, 2016. (3) No stock options were granted to the non-employee directors in Fiscal 2016. (4) Outstanding equity awards held by each of the non-employee directors as of March 31, 2016 were as follows: Total Equity Awards Options Awards Name Outstanding Outstanding Outstanding Andersen, Robert J. 76,028 — 76,028 Auvil III, Paul R. 45,044 66,000 111,044 Black, Philip — — — DiNardo, Louis 45,044 — 45,044 Fuller, Dale L. 72,698 — 72,698 Krall, David A. 45,044 — 45,044 Powers, Gregg J. 45,044 — 45,044 Roberson, David E. 45,044 — 45,044 Smith, Jeffrey C. — — — Item 12. SECURITY OWNERSHIP OF CERTAIN BENEFICIAL OWNERS AND MANAGEMENT AND RELATED STOCKHOLDER MATTERS discloses our equity compensation plantable sets forth as of June 30, 2016 certain information (securities in thousands): As of March 31, 2015 18,698 $ 0.31 12,935 36 $ 0.76 — 18,734 $ 0.31 12,935 ____________________(1)Included in the stockholder approved plans are 13.8 million restricted stock units with a zero purchase price. The weighted average exercise price of outstanding stock options for stockholder approved plans is $1.47.(2)Advanced Digital Information Corporation’s 1999 Stock Incentive Compensation Plan was assumed by Quantum on August 22, 2006 according to the terms detailed in the Agreement and Plan of Merger dated May 2, 2006 (“Merger Agreement”). Outstanding stock options granted under this plan continue to be governed by the terms and conditions of this plan; however, the number of stock options and exercise prices of the outstanding stock options were changed in accordance with the formula in the Merger Agreement for the right to purchase Quantum common stock.(3)The Pancetera 2008 Stock Incentive Compensation Plan was assumed by Quantum on June 13, 2011 according to the terms detailed in the Agreement and Plan of Merger dated June 13, 2011 (“Pancetera Merger Agreement”). Outstanding stock options and restricted shares granted under this plan continue to be governed by the terms and conditions of this plan; however, the number of stock options and restricted shares and exercise prices of the outstanding stock options were changed in accordance with the formula in the Pancetera Merger Agreement for the right to purchase Quantum common stock.We also have an employee stock purchase plan with 5.6 million shares available for issuance that has been approved by stockholders.The remaining information required by this item is incorporated by referencerespect to the information set forth in our proxy statementbeneficial ownership of the Company’s Common Stock by (i) each person known by the Company to be the beneficial owner of more than five percent of the outstanding shares of Common Stock, (ii) each of the Company’s directors, (iii) each of the named executive officers and (iv) all current directors and executive officers as a group. Unless otherwise indicated, the business address for the 2015 Annual Meeting of Stockholders to be filed with the Commission within 120 days after the end of our fiscal year ended March 31, 2015.Name Number of
Shares
Beneficially
Owned(1)Approximate
Percentage of
Class(2)5% or Greater Stockholders: Private Capital Management LLC 17,075,228 (3) 6.41% 8889 Pelican Bay Boulevard, Suite 500 Naples, FL 34108 Starboard Value LP 42,417,263 (4) 15.92% 777 Third Avenue, 18th Floor New York, NY 10017 VIEX Capital Advisors, LLC 29,531,722 (5) 11.08% 825 Third Avenue 33rd Floor New York, NY 10022 Directors and Named Executive Officers: Robert J. Andersen 49,277 (6) * Paul R. Auvil III 597,509 (7) * Linda M. Breard 581,667 (8) * William C. Britts 1,264,442 (9) * Robert S. Clark 737,715 (10) * Louis DiNardo 292,871 (11) * Dale L. Fuller 197,542 (12) * Jon W. Gacek 3,801,157 (13) 1.43% David A. Krall 342,354 (14) * Gregg J. Powers 17,075,228 (15) 6.41% Clifford Press — (16) * David E. Roberson 329,263 (17) * Geoff G. Stedman 189,435 (18) * Christopher S. Willis 341,546 (19) * All current directors and executive officers as a group (15 persons) 26,050,969 (20) 9.78% 75ITEM 13.(*)CERTAIN RELATIONSHIPS AND RELATED TRANSACTIONS, AND DIRECTOR INDEPENDENCEThe information required by this item is incorporated by reference to the information set forth in our proxy statement for the 2015 Annual Meeting of Stockholders to be filed with the Commission within 120 days after the end of our fiscal year ended March 31, 2015.ITEM 14. PRINCIPAL ACCOUNTING FEES AND SERVICESThe information required by this item is incorporated by reference to the information set forth in our proxy statement for the 2015 Annual Meeting of Stockholders to be filed with the Commission within 120 days after the end of our fiscal year ended March 31, 2015.76PART IVITEM 15. EXHIBITS, FINANCIAL STATEMENT SCHEDULESUpon written request, we will provide, without charge, a copy of our Annual Report on Form 10-K, including the Consolidated Financial Statements, financial statement schedules and any exhibits for our most recent fiscal year. All requests should be sent to:Investor RelationsQuantum CorporationBrinlea Johnson or Allise FurlaniInvestor RelationsThe Blueshirt Group(212) 331-8424 or (212) 331-8433ir@quantum.com(a) The following documents are filed as a part of this Report:1.Financial Statements—Our Consolidated Financial Statements are listed in the Index to Consolidated Financial Statements.2.Financial Statement Schedules — Our consolidated valuation and qualifying accounts (Schedule II) financial statement schedule is listed in the Index to Consolidated Financial Statements. All other schedules have been omitted because the information required to be set forth therein is not applicable or is shown in the Consolidated Financial Statements or the notes hereto.(b) Exhibits77 Incorporated by Reference Exhibit Description Form File No. Exhibit(s) Filing Date 2.1 Agreement and Plan of Merger by and between Registrant, Pancetera Software, Inc., Quarry Acquisition Corporation and Henrik Rosendahl as the stockholder representative, dated June 13, 2011. 10-Q 001-13449 10.8 August 9, 2011 3.1 Amended and Restated Certificate of Incorporation of Registrant. 8-K 001-13449 3.1 August 16, 2007 3.2 Amended and Restated By-laws of Registrant, as amended. 8-K 001-13449 3.1 December 5, 2008 3.3 Certificate of Designation of Rights, Preferences and Privileges of Series B Junior Participating Preferred Stock. S-3 333-109587 4.7 October 9, 2003 3.4 Certification of Amendment to the Bylaws of Quantum Corporation, as adopted on January 20, 2010. 8-K 001-13449 3.1 January 26, 2010 4.1 Indenture for 3.50% Convertible Senior Subordinated Notes due 2015, between the Registrant and U.S. Bank National Association, as trustee, dated November 15, 2010, including the form of 3.50% Convertible Senior Subordinated Note due 2015. 8-K 001-13449 4.1 November 15, 2010 4.2 Indenture for 4.50% Convertible Senior Subordinated Notes due 2017, between the Registrant and U.S. Bank National Association, as trustee, dated October 31, 2012, including the form of 4.50% Convertible Senior Subordinated Note due 2017. 8-K 001-13449 4.1 October 31, 2012 10.1 Form of Indemnification Agreement between Registrant and the Named Executive Officers and Directors. * 8-K 001-13449 10.4 April 4, 2007 10.2 Chief Executive Change of Control Agreement between Registrant and Jon W. Gacek. * 8-K 001-13449 10.3 April 5, 2011 10.3 Form of Officer Change of Control Agreement between Registrant and each of Registrant’s Executive Officers (Other than the Executive Chairman and the CEO). * 8-K 001-13449 10.5 April 5, 2011 10.4 Form of Amended and Restated Director Change of Control Agreement between Registrant and the Directors (Other than the Executive Chairman and the CEO). * 8-K 001-13449 10.2 May 10, 2011 10.5 Quantum Corporation 2012 Long-Term Incentive Plan as amended.* 8-K 001-13449 10.1 September 9, 2014 10.6 Form of Restricted Stock Unit Agreement (U.S. Employees), under the Quantum Corporation 2012 Long-Term Incentive Plan. * 10-Q/A 001-13449 10.2 February 15, 2013 10.7 Form of Restricted Stock Unit Agreement (Non-U.S. Employees), under the Quantum Corporation 2012 Long-Term Incentive Plan. * 10-Q/A 001-13449 10.3 February 15, 2013 10.8 Form of Restricted Stock Unit Agreement (Directors), under the Quantum Corporation 2012 Long-Term Incentive Plan. * 10-Q/A 001-13449 10.4 February 15, 2013 10.9 Quantum Corporation Employee Stock Purchase Plan, as amended. *‡ 10.10 Quantum Corporation Executive Officer Incentive Plan. *‡ 78 Incorporated by Reference Exhibit Description Form File No. Exhibit(s) Filing Date 10.11 Advanced Digital Information Corporation Amended and Restated 1999 Stock Incentive Plan. * S-8 001-13449 4.4 August 25, 2006 10.12 Employment Offer Letter, dated March 31, 2011, between Registrant and Jon W. Gacek. * 8-K 001-13449 10.1 April 5, 2011 10.13 Amendment to Employment Offer Letter between Registrant and Jon W. Gacek. * 10-Q 001-13449 10.1 February 8, 2013 10.14 Employment Offer Letter, dated August 31, 2006, between Registrant and William C. Britts. * 8-K 001-13449 10.1 September 7, 2006 10.15 Amendment to Employment Offer Letter between Registrant and William C. Britts. * 10-Q 001-13449 10.6 November 7, 2008 10.16 Amendment to Employment Offer Letter between Registrant and William C. Britts. * 10-Q 001-13449 10.3 February 5, 2010 10.17 Offer Letter of Mr. David A. Krall, dated August 11, 2011. * 8-K 001-13449 10.1 August 22, 2011 10.18 Offer Letter, dated May 2, 2011, between Registrant and David E. Roberson. * 8-K 001-13449 10.1 May 10, 2011 10.19 Offer Letter, dated August 20, 2007, between Registrant and Paul Auvil. * 8-K 001-13449 10.1 August 29, 2007 10.20 Offer Letter, dated August 7, 2013, between Registrant and Mr. Philip Black.* 10-Q 001-13449 10.2 November 12, 2013 10.21 Offer Letter, dated August 7, 2013, between Registrant and Louis DiNardo.* 10-Q 001-13449 10.3 November 12, 2013 10.22 Offer Letter, dated August 7, 2013, between Registrant and Gregg J. Powers.* 10-Q 001-13449 10.4 November 12, 2013 10.23 Offer Letter, dated August 29, 2014, between Registrant and Dale L. Fuller.*‡ 10.24 Offer Letter, dated May 1, 2015, between Registrant and Robert J. Andersen.*‡ 10.25 Form of Agreement to Advance Legal Fees between the Registrant and certain of its Executive Officers.*‡ 10.26 Credit Agreement, dated March 29, 2012, by and among the Registrant, Wells Fargo Capital Finance, LLC, as Administrative Agent, and the Lenders party thereto. 10-K 001-13449 10.22 June 14, 2012 10.27 Security Agreement, dated March 29, 2012, among the Registrant and Wells Fargo Capital Finance, LLC. 8-K 001-13449 10.2 April 2, 2012 10.28 First Amendment to Credit Agreement, dated June 28, 2012, among Registrant, the lenders identified therein, and Wells Fargo Capital Finance, LLC, as the administrative agent for the lenders. 8-K 001-13449 10.1 June 28, 2012 10.29 Fourth Amendment to Credit Agreement and First Amendment to Security Agreement, dated January 31, 2013, among Registrant, the lenders identified therein, and Wells Fargo Capital Finance, LLC, as the administrative agent for the lenders. 8-K 001-13449 10.1 February 6, 2013 10.30 Consent and Fifth Amendment to Credit Agreement, dated February 6, 2014, by and among Wells Fargo Capital Finance, LLC, as administrative agent, the lenders that are parties thereto, and Quantum Corporation 8-K 001-13449 10.1 April 29, 2014 79 Incorporated by Reference Exhibit Description Form File No. Exhibit(s) Filing Date 10.31 Sixth Amendment to Credit Agreement and Second Amendment to Security Agreement, dated April 24, 2014, by and among Wells Fargo Capital Finance, LLC, as administrative agent, the lenders that are parties thereto, and Quantum Corporation. 8-K 001-13449 10.2 April 29, 2014 10.32 Agreement for Purchase and Sale of Real Property, dated as November 18, 2005, among Registrant, SELCO Service Corporation and CS/Federal Drive LLC, as amended by Amendments 1 through 6. 8-K 001-13449 10.1 February 10, 2006 10.33 Lease Agreement, dated February 6, 2006, between Registrant and CS/Federal Drive AB LLC (for Building A). 8-K 001-13449 10.2 February 10, 2006 10.34 Lease Agreement, dated February 6, 2006, between Registrant and CS/Federal Drive AB LLC (for Building B). 8-K 001-13449 10.3 February 10, 2006 10.35 First Amendment dated August 1, 2010 to Lease Agreement between Registrant and CS/Federal Drive AB LLC (for Building B). ‡ 10.36 Lease Agreement, dated February 6, 2006, between Registrant and CS/Federal Drive AB LLC (for Building C). 8-K 001-13449 10.4 February 10, 2006 10.37 First Amendment dated August 1, 2010 to Lease Agreement between Registrant and CS/Federal Drive AB LLC (for Building C). ‡ 10.38 Patent Cross License Agreement, dated February 27, 2006, between Registrant and Storage Technology Corporation. 8-K 001-13449 10.1 March 3, 2006 10.39 Warrant Purchase Agreement, dated as of June 3, 2009, by and between Quantum Corporation and EMC Corporation. 8-K 001-13449 10.1 June 9, 2009 10.40 First Amendment to the Purchase Agreement, dated as of June 17, 2009, by and between Quantum Corporation and EMC Corporation. 8-K 001-13449 10.1 June 23, 2009 10.41 Agreement, dated as of May 13, 2013, by and among Registrant, Starboard Value LP, and certain of its affiliates. 8-K 001-13449 10.1 May 14, 2013 10.42 Agreement, dated as of July 28, 2014, by and among Registrant and Starboard Value L.P. and certain of its affiliates 8-K 001-13449 10.1 July 29, 2014 12.1 Ratio of Earnings to Fixed Charges. ‡ 21 Quantum Subsidiaries. ‡ 23 Consent of Independent Registered Public Accounting Firm, PricewaterhouseCoopers LLP. ‡ 24 Power of Attorney (see signature page). 31.1 Certification of the Chief Executive Officer pursuant to Section 302(a) of the Sarbanes-Oxley Act of 2002. ‡ 31.2 Certification of the Chief Financial Officer pursuant to Section 302(a) of the Sarbanes-Oxley Act of 2002. ‡ 32.1 Certification of Chief Executive Officer pursuant to 18 U.S.C. section 1350, as adopted pursuant to section 906 of the Sarbanes-Oxley act of 2002. † 32.2 Certification of Chief Financial Officer pursuant to 18 U.S.C. section 1350, as adopted pursuant to section 906 of the Sarbanes-Oxley act of 2002. † 101.INS XBRL Instance Document. †† 80(1) Except pursuant to applicable community property laws or as indicated in the footnotes to this table, to the Company’s knowledge, each stockholder identified in the table possesses sole voting and investment power with respect to all shares of Common Stock shown as beneficially owned by such stockholder. 101.SCHXBRL Taxonomy Extension Schema Document. †† 101.CAL(2) Applicable percentage ownership is based on 266,468,683 shares of Common Stock outstanding as of June 30, 2016. Beneficial ownership is determined in accordance with the rules of the SEC, based on factors including voting and investment power with respect to shares. Shares of Common Stock subject to options currently exercisable, or exercisable within 60 days after June 30, 2016, are considered beneficially owned by the holder, but such shares are not deemed outstanding for the purposes of computing the percentage ownership of any other person. (3) Information is based on a Schedule 13F as of March 31, 2016 filed with the Securities and Exchange Commission by Private Capital Management, LLC, a Delaware limited liability corporation (“PCM”). PCM holds 16,245,857 shares and has shared voting and dispositive power with respect to these shares. Mr. Powers, the CEO and Portfolio Manager of PCM, owns 586,500 shares. In addition, as compensation for Mr. Powers’ services on Quantum’s board of directors, Quantum granted to Pelican Bay Holdings LLC 242,871 shares of Common Stock. Mr. Powers is the sole member of Pelican Bay Holdings LLC. (4) Information is based on Schedules 13D/A filed with the Securities and Exchange Commission on January 26, 2016 and on April 6, 2016 and on Forms 4 filed with the Securities and Exchange Commission on January 22, January 25, March 16 and March 18, 2016, respectively by Starboard Value LP and its affiliates. Starboard Value and Opportunity Master Fund Ltd. (“Starboard V&O Fund”) beneficially owns and has sole voting and dispositive power with respect to 24,582,539 shares, which includes 13,791,742 shares issuable upon the conversion of Quantum Corporation’s 4.50% convertible senior notes due November 2017 (the “Notes”). Starboard Value and Opportunity S LLC (“Starboard LLC”) beneficially owns and has sole voting and dispositive power with respect to 5,269,399 shares, which includes 2,850,637 shares issuable upon the conversion of the Notes. Starboard Value and Opportunity C LP (“Starboard Value C LP”) beneficially owns and has sole voting and dispositive power with respect to 2,457,479 shares, which includes 482,696 shares issuable upon the conversion of the Notes. Starboard Value R LP (“Starboard R LP”), as the general partner of Starboard C LP, and Starboard Value R GP LLC, as the general partner of Starboard R LP, may each be deemed to beneficially own and have sole voting and dispositive power with respect to the shares owned by Starboard C LP. 8,244,277 shares are held in an account managed by Starboard Value LP (the “Starboard Value LP Account”), which includes 4,459,623 shares issuable upon the conversion of the Notes. Each of Starboard Value LP, as the investment manager of Starboard V&O Fund, Starboard C LP and the Starboard Value LP Account, and as the manager of Starboard LLC, Starboard Value GP LLC (“Starboard Value GP”), as the general partner of Starboard Value LP, Starboard Principal Co LP (“Principal Co”), as a member of Starboard Value GP, and Starboard Principal Co GP LLC (“Principal GP”), as the general partner of Principal Co, may be deemed to beneficially own and have sole voting and dispositive power with respect to the aggregate of 40,553,694 shares owned by Starboard V&O Fund, Starboard LLC, Starboard C LP and held in the Starboard Value LP Account. Each of Messrs. Jeffrey C. Smith, Mark R. Mitchell and Peter A. Feld, as members of Principal GP and as members of each of the Management Committee of Starboard Value GP and the Management Committee of Principal GP, may be deemed to beneficially own and have shared voting and dispositive power with respect to the aggregate of 40,553,694 shares owned by Starboard V&O Fund, Starboard LLC, Starboard C LP and held in the Starboard Value LP Account. In addition, Mr. Smith beneficially owns 137,565 shares of Common Stock, granted to him as compensation for his services on Quantum’s board of directors. (5) Information is based on Schedules 13D and 13D/A filed with the Securities and Exchange Commission on December 28, 2015, January 21, 2016, February 2, 2016, April 28, 2016, June 2, 2016 and June 7, 2016 by VIEX Capital Advisors, LLC ("VIEX Capital"), VIEX Special Opportunities Fund III, LP ("VSO III") and their affiliates. VIEX Opportunities Fund, LP - Series One ("VIEX Series One") beneficially owns and has shared voting and dispositive power with respect to 7,407,865 shares. VIEX Opportunities Fund, LP - Series Two (VIEX Series Two") beneficially owns and has shared voting and dispositive power with respect to 1,413,191 shares. Each of VSO III and VIEX Special Opportunities GP III LLC, as the general partner of VSO III, beneficially own and have shared voting and dispositive power with respect to 20,710,666 shares. VIEX GP, LLC ("VIEX GP"), as the general partner of VIEX Series One and VIEX Series Two beneficially owns and has shared voting and dispositive power with respect to 8,821,056 shares. Each of VIEX Capital, as the investment manager of VIEX Series One and VIEX Series Two, and Eric Singer, as the managing member of VIEX GP and VIEX Capital, beneficially own and have shared voting and dispositive power with respect to 29,531,722 shares, which constitutes the shares owned by VIEX Series One, VIEX Series Two and VSO III. VSO III and its affiliates disclaim the beneficial ownership of the reported shares except to the extent of their pecuniary interest therein. (6) XBRL Taxonomy Extension Calculation Linkbase Document. ††Represents shares of Common Stock.(7) Represents 531,509 shares of Common Stock and 66,000 shares subject to Common Stock options exercisable at June 30, 2016, or within sixty (60) days thereafter. (8) Represents shares of Common Stock. (9) Represents 774,109 shares of Common Stock, 198,333 service-based restricted stock units that will vest on July 1, 2016, 17,000 performance-based restricted stock units that will vest on July 1, 2016, and 275,000 shares subject to Common Stock options exercisable at June 30, 2016, or within sixty (60) days thereafter. (10) Represents 370,298 shares of Common Stock, 198,333 service-based restricted stock units that will vest on July 1, 2016, 17,000 performance-based restricted stock units that will vest on July 1, 2016, and 152,084 shares subject to Common Stock options exercisable at June 30, 2016, or within sixty (60) days thereafter. (11) Represents shares of Common Stock. (12) Represents shares of Common Stock. (13) Represents 1,346,741 shares of Common Stock, 577,916 service-based restricted stock units that will vest on July 1, 2016, 76,500 performance-based restricted stock units that will vest on July 1, 2016, and 1,800,000 shares subject to Common Stock options exercisable at June 30, 2016, or within sixty (60) days thereafter. (14) Represents shares of Common Stock. (15) As compensation for Mr. Powers’ services on Quantum’s board of directors, Quantum granted to Pelican Bay Holdings LLC 242,871 shares of Common Stock. Mr. Powers is the sole member of Pelican Bay Holdings LLC. Mr. Powers also owns 586,500 shares. In addition, Mr. Powers, the CEO and Portfolio Manager of PCM, holds shared voting and dispositive power with respect to 16,245,857 shares held in PCM managed accounts. Mr. Powers disclaims beneficial ownership for these shares, and PCM and Mr. Powers disclaim the existence of a group with respect to any third party. (16) Mr. Clifford was appointed to Quantum’s board of directors on April 1, 2016. None of his restricted stock units are vested at June 30, 2016, or within sixty (60) days thereafter. (17) Represents shares of Common Stock. (18) Represents 132,435 shares of Common Stock, 40,000 service-based restricted stock units that will vest on July 1, 2016 and 17,000 performance-based restricted stock units that will vest on July 1, 2016. (19) Represents 204,778 shares of Common Stock, 44,583 service-based restricted stock units that will vest on July 1, 2016, 2,185 performance-based restricted stock units that will vest on July 1, 2016, and 90,000 shares subject to Common Stock options exercisable at June 30, 2016, or within sixty (60) days thereafter. (20) Represents 22,062,720 shares of Common Stock, 1,400,830 service-based restricted stock units that will vest at June 30, 2016 or within sixty (60) days thereafter, 154,335 performance-based restricted stock units that will vest at June 30, 2016 or within sixty (60) days thereafter, and 2,433,084 shares subject to Common Stock options vested or exercisable at June 30, 2016, or within sixty (60) days thereafter. Amounts in thousands 2016 Total 2015 Total Audit Fees (1) $ 1,518 $ 1,300 Audit-related Fees — 20 Tax Fees (2) 154 92 All Other Fees — — Total $ 1,672 $ 1,412 (1) Audit fees include the audit of Quantum’s annual financial statements, review of financial statements included in Quantum’s Quarterly Reports on Form 10-Q and services that are normally provided by the independent registered public accounting firm in connection with foreign statutory and regulatory filings or engagements for those fiscal years and include services in connection with assisting the Company in its compliance with its obligations under Section 404 of the Sarbanes-Oxley Act and related regulations. Audit fees also include advice on audit and accounting matters that arose during, or as a result of, the audit or the review of interim financial statements, including the application of proposed accounting rules, statutory audits required by non-U.S. jurisdictions and discussions on internal control matters. 101.DEF(2) This category consists of professional services rendered by PricewaterhouseCoopers LLP for tax compliance and tax consulting. The tax compliance services principally include preparation and/or review of various tax returns, assistance with tax return supporting documentation and tax return audit assistance. The tax consulting services principally include advice regarding mergers and acquisitions, international tax structure and other strategic tax planning opportunities. All such services were approved by the Audit Committee. Exhibit No. XBRL Taxonomy Extension Definition Linkbase Document. ††Description 101.LAB31.1XBRL Taxonomy Extension Label Linkbase Document. ††Certification of the Chief Executive Officer pursuant to Section 302(a) of the Sarbanes-Oxley Act of 2002 101.PRE31.2XBRL Taxonomy Extension Presentation Linkbase Document. ††* Indicates management contract or compensatory plan, contract or arrangement.‡Filed herewith.†Furnished herewith.††XBRL (Extensible Business Reporting Language) information is furnished and not filed herewith, is not a part of a registration statement or prospectus for purposes of sections 11 or 12Certification of the SecuritiesChief Financial Officer pursuant to Section 302(a) of the Sarbanes-Oxley Act of 1933, is deemed not filed for purposes of section 18 of the Securities Exchange Act of 1934, and otherwise is not subject to liability under these sections.200281SIGNATUREBy: /s/ Fuad Ahmad QUANTUM CORPORATIONFuad Ahmad/s/ LINDA M. BREARDLinda M. BreardChief Financial Officer (Principal Financial and Chief Accounting Officer) Date:June 12, 201582POWER OF ATTORNEYKNOW ALL PERSONS BY THESE PRESENTS, that each person whose signature appears below constitutes and appoints Jon W. Gacek and Linda M. Breard, jointly and severally, his or her attorneys-in-fact, each with the power of substitution, for him or her in any and all capacities, to sign any amendments to this Annual Report on Form 10-K, and to file the same, with exhibits thereto and other documents in connection therewith, with the Securities and Exchange Commission, hereby ratifying and confirming all that each of said attorneys-in-fact, or his or her substitute or substitutes, may do or cause to be done by virtue hereof.Pursuant to the requirements of the Securities Exchange Act of 1934, this Report has been signed below by the following persons in the capacities and on June 12, 2015.Officer) SignatureTitle/s/ JON W. GACEKDirector, President and Chief Executive OfficerJon W. Gacek(Principal Executive Officer)/s/ LINDA M. BREARDChief Financial OfficerLinda M. Breard(Principal Financial and Chief Accounting Officer)/s/ ROBERT J. ANDERSENDirectorRobert J. Andersen/s/ PAUL R. AUVIL IIIDirectorPaul R. Auvil III/s/ PHILIP BLACKDirectorPhilip Black/s/ LOUIS DINARDODirectorLouis DiNardo/s/ DALE L. FULLERDirectorDale L. Fuller/s/ DAVID A. KRALLDirectorDavid A. Krall/s/ GREGG J. POWERSDirectorGregg J. Powers/s/ DAVID E. ROBERSONDirectorDavid E. RobersonDate: July 27, 2016 83