UNITED STATESSECURITIES AND EXCHANGE COMMISSION
Washington, D.C. 20549
FORM 10-K
x ANNUAL REPORT PURSUANT TO SECTION 13 OR 15(d) OF THE SECURITIES
EXCHANGE ACT OF 1934
For the fiscal year ended December 31, 20152018
OR
¨ TRANSITION REPORT PURSUANT TO SECTION 13 OR 15(d) OF THE SECURITIES EXCHANGE ACT OF 1934
Commission File Number 001-36720
Upland Software, Inc.
(Exact name of registrant as specified in its charter)
|
| |
| Delaware | 27-2992077 |
(State or other jurisdiction of incorporation or organization) | (I.R.S. Employer Identification Number) |
Austin, Texas 78701
(512) 960-1010
(Address, including zip code, and telephone number, including area code, of registrant’s principal executive offices)
Securities registered pursuant to Section 12(b) of the Act:
|
| | |
| Title of each class | | Name of each exchange on which registered |
| Common Stock, par value $0.0001 per share | | The NASDAQNasdaq Global Market |
None
Indicate by check mark if the registrant is a well-known seasoned issuer, as defined in Rule 405 of the Securities Act. Yes ¨ No x
Indicate by check mark if the registrant is not required to file reports pursuant to Section 13 or Section 15(d) of the Act. Yes ¨ No x
Indicate by check mark whether the registrant (1) has filed all reports required to be filed by Section 13 or 15(d) of the Securities Exchange Act of 1934 during the preceding 12 months (or for such shorter period that the registrant was required to file such reports), and (2) has been subject to such filing requirements for the past 90 days. Yes x No ¨
Indicate by check mark whether the registrant has submitted electronically and posted on its corporate Web site, if any, every Interactive Data File required to be submitted and posted pursuant to Rule 405 of Regulation S-T (§ 232.405 of this chapter) during the preceding 12 months (or for such shorter period that the registrant was required to submit and post such files). Yes x No ¨
Indicate by check mark if disclosure of delinquent filers pursuant to Item 405 of Regulation S-K (§ 229.405 of this chapter) is not contained herein, and will not be contained, to the best of registrant’s knowledge, in definitive proxy or information statements incorporated by reference in Part III of this Form 10-K or any amendment to this Form 10-K. x
Indicate by check mark whether the registrant is a large accelerated filer, an accelerated filer, a non-accelerated filer, or a smaller reporting company, or an emerging growth company. See the definitions of “large accelerated filer,” “accelerated filer”filer,” “smaller reporting company,” and “smaller reporting“emerging growth company” in Rule 12b-2 of the Exchange Act.
|
| | | |
| Large accelerated filer | ¨ | Accelerated filer | ¨x |
| | | | |
| Non-accelerated filer | x (Do not check if a smaller reporting company)
¨ | Smaller reporting company | ¨ |
| | | |
| | Emerging growth company | x |
If an emerging growth company, indicate by check mark if the registrant has elected not to use the extended transition period for complying with any new or revised financial accounting standards provided pursuant to Section 13(a) of the Exchange Act. x
Indicate by check mark whether the registrant is a shell company (as defined in Rule 12b-2 of the Act). Yes ¨ No x
The aggregate market value of the registrant’s common stock held by non-affiliates of the registrant was approximately $66.5$568 million based upon the closing price of $9.22$34.37 of such common stock on The NASDAQthe Nasdaq Global Market on June 30, 201529, 2018 (the last business day of the registrant’s most recently completed second fiscal quarter). Shares of common stock held as of June 30, 201529, 2018 by each director and executive officer of the registrant, as well as shares held by each holder of 10% of the common stock known to the registrant, have been excluded for purposes of the foregoing calculation. This determination of affiliate status is not a conclusive determination for other purposes.
As of March 24, 2016, 16,751,4481, 2019, 21,494,738 shares of the registrant’s Common Stock were outstanding.
Documents incorporated by reference:
Certain portions, as expressly described in this Annual Report on Form 10-K, of the registrant’s Proxy Statement for the 20162019 Annual Meeting of the Stockholders, to be filed not later than 120 days after the end of the year covered by this Annual Report, are incorporated by reference into Part III of this Annual Report where indicated.
TABLE OF CONTENTS
|
| | |
| PART I | |
| | |
| | |
| | |
| | |
| | |
| | |
| | |
| PART II | |
| | |
| | |
| | |
| | |
| | |
| | | |
| | | |
| | | |
| | | |
| | | |
| | | |
| | | |
| | | |
| | |
| | |
| | |
| | |
| PART III | |
| | |
| | |
| | |
| | |
| | |
| | |
| PART IV | |
| | |
| | |
| |
PART I
Special Note Regarding Forward Looking Statements
This Annual Report on Form 10-K contains “forward-looking statements” within the meaning of Section 27A of the Securities Act, and Section 21E of the Securities Exchange Act of 1934, as amended (the “Exchange Act”). Forward-looking statements generally relate to future events or our future financial or operating performance. Forward-looking statements may be identified by the use of forward-looking words such as “anticipate,” “believe,” “may,” “will,” “continue,” “seek,” “estimate,” “intend,” “hope,” “predict,” “could,” “should,” “would,” “project,” “plan,” “expect” or the negative or plural of these words or similar expressions, although not all forward-looking statements contain these words. These forward-looking statements include, but are not limited to, statements concerning the following:
our financial performance and our ability to achieve or sustain profitability or predict future results;
our plans regarding future acquisitions and our ability to consummate and integrate acquisitions;
our ability to obtain financing in the future on acceptable terms or at all;
our expectations with respect to revenue, cost of revenue and operating expenses in future periods;
our ability to attract and retain customers;
our ability to successfully enter new markets and manage our international expansion;
our ability to comply with privacy laws and regulations;
our ability to deliver high-quality customer service;
the growth of demand for enterprise work management applications;
our plans regarding, and our ability to effectively manage, our growth;
our plans regarding future acquisitions and our ability to consummate and integrate acquisitions;
maintaining our senior management team and key personnel;
our ability to maintain and expand our direct sales organization;
the performance of our resellers;
our ability to obtain financing in the future on acceptable terms or at all;
our ability to adapt to changing market conditions and competition;
our ability to successfully enter new markets and manage our international expansion;
the operation and reliability of our third-party data centers;
our ability to adapt to technological change and continue to innovate;
economic and financial conditions;
our ability to integrate our applications with other software applications;
maintaining and expanding our relationships with third parties;
costs associated with defending intellectual property infringement and other claims;
our ability to maintain, protect and enhance our brand and intellectual property;
our ability to comply with privacy laws and regulations;
our expectations with respect to revenue, cost of revenue and operating expenses in future periods;
our expectations with regard to trends, such as seasonality, which affect our business;
our expectations aswith regard to revenue from perpetual licenses and professional services;
our beliefs regarding the paymentsufficient duration of dividends;our patents;
our plans with respect to foreign currency exchange risk and inflation;
our beliefs regarding how our applications benefit customers and what our competitive strengths are; and
other risk factors included under “Risk Factors” in this Annual Report on Form 10-K.
the operation and reliability of our third-party data centers; and
our expectations as to the payment of dividends;
You should not rely upon forward-looking statements as predictions of future events. We have based the forward-looking statements contained in this Annual Report on Form 10-K primarily on our current expectations and projections about future events and trends that we believe may affect our business, financial condition, results of operations, and prospects. The outcome of the events described in these forward-looking statements is subject to risks, uncertainties, and other factors, including those described in the section titled “Risk Factors” and elsewhere in this Annual Report on Form 10-K. Moreover, we operate in a very competitive and rapidly changing environment. New risks and uncertainties emerge from time to time, and it is not possible for us to predict all risks and uncertainties that could have an impact on the forward-looking statements contained in this Annual Report on Form 10-K. We cannot assure you that the results, events, and circumstances reflected in the forward-looking statements will be achieved or occur, and actual results, events, or circumstances could differ materially from those described in the forward-looking statements.
The forward-looking statements made in this Annual Report on Form 10-K relate only to events as of the date on which the statements are made. We undertake no obligation to update any forward-looking statements made in this Annual Report on Form 10-K to reflect events or circumstances after the date of this Annual Report on Form 10-K or to reflect new information or the occurrence of unanticipated events, except as required by law. We may not actually achieve the plans, intentions, or expectations disclosed in our forward-looking statements and you should not place undue reliance on our forward-looking statements. Our forward-looking statements do not reflect the potential impact of any future acquisitions, mergers, dispositions, joint ventures, or investments we may make.
All references to “Upland,” “we,” “us” or “our” mean Upland Software, Inc.
Item 1. Business
We are a leading provider ofUpland provides cloud-based enterprise work management software. We define enterprise work management software as software applications that enableenables organizations to plan, manage and execute projects and work. Our applications are easy-to-use, highly scalable and offer real-time collaboration for knowledge workers distributed on a local or global scale. Oursoftware applications address enterprise work challenges in the following enterprise solution categories:
Customer Experience Management. Upland Customer Experience Management, or CXM, solutions enable organizations to manage customer relationships across multiple channels - including email, short message service, or SMS, multimedia messaging service, or MMS, web, social, and mobile apps. Upland products within this solution suite include Upland Mobile Messaging, Rant & Rave, Adestra, and RightAnswers.
Sales Enablement. Upland Sales Enablement solutions enable sales organizations to automate delivery of processes, sales activities, content, systems, and metrics at multiple stages of the sales process. Upland products within this solution suite include Qvidian, RO Innovation, and LeadLander.
Professional Services Automation. Upland Professional Services Automation, or PSA, solutions enable service organizations to manage professional services delivery and related functions. Upland products within this solution suite include Tenrox, RightAnswers, FileBound, RO Innovation, and Qvidian.
Project and Information Technology (IT)Financial Management. Upland Project and Financial Management. Enables customers solutions enable enterprises to manage their organization’s projects, professional workforceproject portfolios and IT costs.track, analyze and manage information technology (“IT”), cloud, and telecom spending. Upland products within this solution suite include PowerSteering, Eclipse PPM, RightAnswers, and ComSci.
Enterprise Knowledge Management. Upland Enterprise Knowledge Management, or KM, solutions enable knowledge-sharing across different departments within an enterprise. Upland products within this solution suite include RightAnswers, Tenrox, and PowerSteering.
Secure Document Services. Upland Secure Document Services solutions enable enterprises to manage and automate document intensive business processes with data security through scan and fax platforms, data monitoring and breach prevention capabilities, and the automated routing of content to its final destination. Upland products within this solution suite include AccuRoute, FileBound, and InterFAX.
WorkflowDocument Lifecycle Automation. EnablesUpland Document Lifecycle solutions enable users to digitize, organize, automate, integrate, analyze and optimize high volume processes. Upland products within this solution suite include AccuRoute, FileBound, Qvidian, and RO Innovation.
Our customers currently use our applications in the following functional areas:
Project Management. Business leaders and Project Management Offices, or PMOs, use our applications to automate document-intensive workflows among internal functional areas as well asoptimize project portfolios, balance capacity against demand, improve financial-based decision making, align execution of projects to strategy across large organizations, and manage the entire project delivery lifecycle. Our applications deliver value to project management across a variety of use cases including continuous improvement, enterprise IT, new product development, and services departments along with their partnersindustry depth in higher education, public sector, and supply chain.healthcare IT.
Digital EngagementInformation Technology. Enables customersIT departments use our applications to effectively engage withmanage a variety of IT activities and resources across the enterprise. Our applications help information technology departments ensure they are delivering against the objectives of the business by helping them select and prioritize the right investments, gain greater control of resource demand and allocation, and track and report benefit realization. Our applications enable executives to gain better insight into IT spending to help prevent cost overruns and understand the nature of consumption.
Business Operations. Different functional departments use our applications to streamline operations and accelerate business performance across their customers, prospectsvalue chain. Upland solutions in this area range from supply chain collaboration and community via the webfactory management, back office document and vendor management, to applications that improve sales responsiveness.
Sales and Marketing. Sales and marketing teams employ our applications to drive growth through deeper customer engagement, reduced sales cycle times, and overall improved collaboration between sales, marketing, and other customer-facing functions. We offer applications that help organizations to build their online and mobile technologies.brand presence, engage their target audiences across multiple communications channels, collaborate on the creation and publication of content, and gain increased control over marketing workflows, activities, and budgets.
We sell
Call Center. Customer service and support environments use our software applications primarily through a direct sales organization comprised of inside sales and field sales personnel. In addition to our direct sales organization, we have an indirect sales organization, which sells to distributors and value-added resellers. We employ a land-and-expand go-to-market strategy. After we demonstrate the value of an initial application to an organization, our sales and account management teams work to expand the adoption of that initial application across the organization, and cross-sell additional applications to addressenable agents to resolve issues and to engage customers. We offer applications that improve customer experience and reduce call volume and cycle times through customer self-service tools and Voice of Customer, or VoC, technology that captures customer sentiment in real-time. Upland also offers tools that improve call center agent productivity by providing more direct access to knowledge and to customer sentiment thereby improving both inbound call outcomes and proactive outbound success. Additional solutions help call center leadership to manage agent performance and measure real-time performance relative to call resolution and customer sentiment, improve performance through gamification, and gather agent feedback to keep employee engagement high.
Human Resources and Legal. Human resources, or HR, legal departments, and law firms use our applications to improve collaboration and operational control and streamline routine processes. We offer applications that automate document management and workflow including, contracts, records, and other enterprise workdocumentation that require enhanced security and compliance requirements. Other applications support HR-specific workflows including onboarding, employee management, needs of the organization. Our customer success organization supports our direct sales efforts by managing the post-sale customer lifecycle.termination, HR support, and time and expense management.
Our subscription agreements are typically sold either on a per-seat basis or on a minimum contracted volume basis with overage fees billed in arrears, depending on the application being sold. We service customers ranging from large global corporations and government agencies to small- and medium-sized businesses. We have more than 2,000 customers with over 235,000 users across a broad range of industries, including financial services, retail, technology, manufacturing, education, consumer goods, media, telecommunications, government, food and beverage, healthcare and life sciences.
We have achieved significant growth and scale in a relatively short period of time. Through a series of acquisitions and integrations, we have establishedbuilt a diverse family of software applications under the Upland brand that are delivered through seven enterprise solution suites, each of which addresses a specific enterprise work management need. For the twelve months ended December 31, 20152018, compared to the twelve months ended December 31, 2014,2017, our total revenue grew from $64.6$98.0 million to $69.9$149.9 million, representing an 8%a 53% period-over-period growth rate. On a constant currency basis, total revenue increased by $8.3 million, or 13%. For the twelve months ended December 31, 20152018, compared to the twelve months ended December 31, 2014,2017, our subscription and support revenue grew from $48.6$85.5 million to $57.2$136.6 million, representing an 18%a 60% period-over-period growth rate. On a constant currency basis, subscription and support revenue increased by $11.0 million, or 23%. See Note 1612 Revenue Recognition, of the Notes to Condensed Consolidated Financial Statements for more information regarding our revenue as it relates to domestic and foreign operations.
To support continued growth, we intend to continue to pursue acquisitions within our core enterprise solution suites of complementary technologies and businesses. This will expand our customer base and market access, resulting in increased benefits of scale. Consistent with our growth strategy, we have made a total of 20 acquisitions in the 7 years ending December 31, 2018.
The operating platform that we use to transform acquired companies and maintain a consistently high level of operating performance is called UplandOne. This platform consists of six key areas:
High-Touch Customer Success Program. Customer success is a continuous journey based on open communication and establishing clear goals towards value realization and maximum customer success. To achieve this, we have institutionalized a set of unique customer commitments and deliverables we call the Upland Customer Success Program that includes onboarding and training, a dedicated customer success representative, upgraded success plans, quarterly virtual user conferences, periodic executive outreach and Net Promoter Score, or NPS, surveys, and an ongoing customer feedback loop.
Quality-Focused R&D. Our approach to R&D at Upland is straight-forward: prioritize customer need, leverage a metrics-driven agile approach with visibility and accountability, and deploy the most up-to-date development systems to ensure quality is built into every step of development.
Customer-Driven Innovation. Customer feedback is at the heart of the Upland customer experience. New features are added and prioritized in our product roadmaps, and then fine-tuned, based on direct customer input. Requests from our Premier Success Plan customers are given additional priority weighting for new features and minor issue resolution. Product feedback outlets include customer success account management, quarterly virtual user conferences, annual customer advisory boards, and Upland’s online communities.
Expert Professional Services. Through our Professional Services organization, Upland is committed to delivering the most value from a customer’s Upland investment in the shortest possible time. Once we engage on a project, we dedicate a team to the planning, configuration, integration, launch, administration and maintenance of the application.
24x7 Global Support. Upland Global support includes:prioritized issue escalation and resolution;online and phone support, 24/7/365;access to a community to share and discuss best practices, support tips, training materials, and custom reports; aknowledge-base with alerts, service recommendations, and troubleshooting content;unlimited case submissions and real-time case updates;andfull support across the globe. For customers
that have more urgent support requirements, Upland Premier Success Plans provide enhanced response times and availability for the most severe support requests.
Enterprise Cloud Platform. Upland’s products run on an enterprise-class cloud environment - delivering power, reliability, and flexibility. We utilize Amazon Web Services, or AWS, for all our cloud-based products and move acquired products to AWS in connection with our acquisition integration program. Upland’s cloud technology gives customers the freedom from legacy applications without having to compromise security or scalability. Our applications are scalable and can support large deployments while maintaining required performance levels.
Our operating results in a given period can fluctuate based on the mix of subscription and support, perpetual license, and professional services revenue. For the twelve months ended December 31, 20152018, 2017 and 2014,2016, our subscription and support revenue accounted for 82%91%, 87% and 75%88% of total revenue, respectively. Our customer agreements for program and portfolio management, project management and collaboration, and professional services automation typically are sold on a per-seat basis with terms varying from one to three years, paid in advance. Our customer agreements for workflow automation and enterprise content management and financial management historically have been sold on a volume basis with a one-year term, paid in advance. We generally seek to enter into multi-year contracts with our customers when possible. In each case, our customer agreements provide us with revenue visibility over a number of quarters. We typically negotiate the total number of seats or total minimum contracted volume a customer is entitled to use as part of its subscription, but these seats or minimum contracted volume may not be fully utilized over the term of the agreement. In addition, where customers exceed the minimum contracted volume, additional overage fees are billed in arrears.
Historically, we have sold certain of our applications under perpetual licenses, which also are paid in advance. For the twelve months ended December 31, 20152018, 2017 and 2014,2016, our perpetual license revenue accounted for 3%, 4% and 4% 2%of total revenue, respectively. We expect perpetual license revenue to decrease as a percentage of revenue in the future. The support agreements related to our perpetual licenses are typically one-year in duration and entitle the customer to
support and unspecified upgrades. The revenue related to such support agreements is included as part of our subscription and support revenue.
Professional services revenue consists of fees related to implementation, data extraction, integration and configuration, and training on our applications. For the twelve months ended December 31, 20152018, 2017 and 2014,2016, our professional services revenue accounted for 14%6%, 9% and 21%10% of total revenue, respectively. We expect professional services revenue to decrease as a percentage of revenue in future periods due to customer expansion initiatives which have driven more focus on expanding existing customer recurring revenue and less focus on new customer professional service projects.
We have historically experienced seasonality in terms of when we enter into customer agreements. We sign a significantly higher percentage of agreements with new customers, and renew agreements with existing customers, in the fourth quarter of each calendar year as our customers tend to follow budgeting cycles at the end of the calendar year. Our cash flow from operations has historically been higher in the first quarter of each calendar year than in other quarters. This seasonality is reflected to a much lesser extent, and sometimes is not immediately apparent, in our revenue, due to the fact that we defer revenue recognition. In addition, seasonality may be difficult to observe in our financial results during periods in which we acquire businesses as such results typically are most significantly impacted by such acquisitions. We expect this seasonality to continue, or possibly increase in the future, which may cause fluctuations in our operating results and financial metrics.
To support continued growth, we intend to pursue acquisitions of complementary technologies, products and businesses to enhance the features and functionalities of our applications, expand our customer base and provide access to new markets and increased benefits of scale. We will prioritize acquisitions within the enterprise functions we currently serve, including information technology, process excellence, finance, professional services and marketing, as well as pursue acquisitions that serve other enterprise functions. Consistent with our growth strategy, we have made a total of nine acquisitions in the four years ending December 31, 2015.
We completed our initial public offering in November 2014 and our common stock is listed on the Nasdaq Global Market under the symbol “UPLD.”
Industry Background
A Rapidly Changing Business Environment
The continued growth of an information-based economy driven by technological innovation and globalization is causing a fundamental change in the business environment and the way work is done. To be successful, organizations must be able to quickly adapt to changes in this complex and rapidly evolving environment and optimize the utilization of their people, time and money. These changes have given rise to a large and growing group of knowledge workers who operate in dynamic work settings as part of geographically dispersed and virtual teams. To be successful, these knowledge workers must quickly synthesize, analyze and act on large amounts of information and collaborate effectively at any time, from anywhere and on any device.
Legacy Processes and Systems are Insufficient
Many organizations continue to utilize manual processes and traditional tools, such as paper-based techniques, spreadsheets and email, as well as legacy on-premise enterprise systems, to manage knowledge work. The limitations of these processes and systems include siloed and disparate information, limited visibility and transparency, poor collaboration among teams, lost productivity and misalignment of work efforts and overall business objectives. In addition, legacy on-premise enterprise systems can be expensive and time intensive to implement, inflexible and difficult to use, and costly to upgrade and maintain. Today, legacy processes and systems are being disrupted and replaced by cloud-based enterprise work management software that improves visibility, collaboration and productivity.
The Impact of Cloud-Based Enterprise Work Management Software
Enterprise work management software is an emerging category of software applications that enable organizations to effectively plan, manage and execute projects and work in order to maximize work capacity, productivity and profitability. Recently, cloud computing and SaaS have begun to transform enterprise work management with rapid speed-to-value, low total cost of ownership and reduced financial risk. As a result of these benefits, the annual growth rate of the SaaS market is expected to be significantly greater than the worldwide application software market.
The enterprise-grade applications market is growing at an accelerated rate. According to IDC, the market for enterprise applications is expected to reach $201.7 billion by 2019, representing a 6.6% CAGR. IDC estimates that the worldwide demand for public cloud will grow at a compound annual growth rate of 15.6% by 2019. Comparatively, the worldwide on-premise application software market will grow at a CAGR of 3.9%. By 2019, IDC postulates cloud-based software will have a significant business impact, driving growth and accounting for at least $1 of every $4.59 spent on software-as-a-service.We believe the ability of cloud-based software to deliver a flexible, scalable, cost-efficient, easy-to-use and collaborative platform to knowledge workers distributed on a local or global scale will significantly accelerate the adoption of cloud-based enterprise work management software applications.
Cloud-based enterprise work management software applications can increase work capacity, productivity and profitability by reducing manual processes and isolated silos of information, and by enhancing collaboration across organizations. While cloud-based enterprise work management software applications may be adopted on an individual basis, we believe they deliver the greatest value when multiple applications are deployed, as an end-to- end management process for prioritizing, allocating, managing and monitoring resources and work throughout the enterprise. We provide a diverse offering of software applications that address a broad range of enterprise work management needs.
We currently participate in various areas of enterprise work management, including the markets that IDC identifies as worldwide project and portfolio management, worldwide business process management software, worldwide financial performance and strategy management applications, worldwide collaborative applications and worldwide content management software. Within these markets our family of cloud-based software applications address enterprise work functions in program and portfolio management, project management and collaboration, workflow automation and enterprise content management, professional services automation and financial management. While these markets today are largely served by legacy on-premise enterprise systems, we believe there will continue to be increased market adoption of cloud-based enterprise work management software applications.
The Upland Approach
Our software applications are designed for the way people work today. Unlike legacy solutions, our applications have been developed with the unique requirements of today’s knowledge worker in mind. We enable knowledge workers to interact, collaborate and make business decisions using real-time information from a wide variety of sources, at any time, from anywhere and on any device.
Our award-winning family of cloud-based software applications deliver the functionality required to effectively plan, manage and execute projects and work. Our innovative applications allow our customers to more effectively manage the rapid pace of change and complexity in today’s work environment. Our applications are highly scalable, flexible and secure and provide our customers with a modern and intuitive user experience. Organizations currently use our applications in the following functional areas:
Information Technology. Information technology departments use our applications to manage a variety of information technology activities and resources, such as projects and application portfolios. Our applications help information technology departments ensure they are delivering against the objectives of the business by helping to select and prioritize the right investments, gain greater control of resource demand and allocation, and track and report benefit realization. Our applications enable executives to gain better insight into information technology spending to help prevent cost overruns and understand the nature of consumption. By enabling information technology teams to make more informed decisions with real-time visibility across the complete information technology portfolio, our
applications empower information technology departments to shift from a cost center to a more strategic enterprise function.
Process Excellence and Operations. Process excellence, Lean Six Sigma and similar functional groups within organizations use our applications to facilitate critical process improvement efforts. Our applications help provide high-level visibility and tracking of process excellence programs, automate processes and streamline workflows while improving process governance. Process improvement and similar business transformation initiatives continue to be a key driver of corporate performance, especially among large global corporations.
Finance. Finance departments use our applications as a cost allocation tool to assess and validate proposed investments and initiatives of a particular line of business, as well as increase the visibility and governance of capital expenditures and cost-cutting projects and deepen the understanding of actual resource utilization and costs. Our applications help improve collaboration between finance departments and particular lines of business, in addition to streamlining compliance and accounting workflows.
Professional Services. Professional services organizations, such as consulting or software development firms, employ our applications to streamline service delivery and optimize utilization of billable resources. In addition, service- oriented departments within organizations, such as customer service and support teams, utilize our applications to more effectively budget, plan and track provision of services and improve capacity planning and forecasting.
Marketing. Marketing teams employ our applications to enhance their overall marketing effectiveness. We offer applications that help customers build their online and mobile brand presence, engage their target audiences, collaborate on the creation and publication of content, and gain increased control over marketing workflows, activities and budgets. Our applications empower marketing and communications organizations to more effectively manage the influx of projects, information, processes and systems necessary to meet today’s modern marketing requirements.
We believe our applications benefit customers in the following ways:
Our applications enable our customers to more effectively align programs, initiatives, investments and projects with overall business objectives, helping ensure the right work is done at the right time. This alignment drives increased productivity and optimizes the allocation and utilization of people, time and money within organizations.
Our applications help customers to more effectively manage projects and tasks by enabling real-time visibility, collaboration, structured workflows and access to the right content and information. This provides teams of distributed workers with clarity into priorities and expectations as well as the tools to execute effectively, resulting in increased productivity, transparency, accountability, and the ability to respond rapidly to change.
Our applications collect and make available real-time data regarding the planning, management and execution of projects and work processes across teams and business units This enables a more complete view of teams, projects and resources at anytime from anywhere.
Our applications provide analytics and reporting capabilities that transform disparate data in real-time into actionable intelligence, enabling users to make better informed business decisions. Our applications enable organizations to conduct dynamic and sophisticated “what-if” and scenario analyses that can improve their ability to respond effectively to changing business conditions.
Customers can easily access our cloud-based applications with an Internet browser. Our applications do not require large up-front software expenditures or significant ongoing infrastructure or information technology support. In addition, our applications have modern look and feel that helps provide a consistent user experience across our applications.
Our applications are highly configurable, which provides us with flexibility to meet the unique business requirements of individual customers. Our applications are also scalable and are able to support large
deployments while maintaining required performance levels. We provide tools to help our customers manage the critical elements of application security, including authentication, authorization and regulatory compliance.
Our Competitive Strengths
TheWe believe the following competitive strengths are keys to our success:
Large, attractivediversified customer base. Our customer base is highly diverse and spans a broad array of industries, including financial services, retail, technology, manufacturing, legal, education, consumer goods, media, telecommunications, government, non-profit, food and beverage, healthcare and life sciences. We service customers of varying size, ranging from large global corporations and government agencies to small- and medium-sized businesses. We have a highly referenceable customer base that we leverage to help us acquire new customers. We have over 2,0009,000 customers, with no customer accounting for more than 3% of our revenue.
Diversified family of software applicationssolutions. We offer a family of cloud-based enterprise work management software applicationssolutions that addresses a broad range of enterprise work management needs, from strategic planning to task execution.needs. We believe this benefits our customers as compared to many of our cloud-based competitors who offer only a single point solution for a more limited and discrete work management need. Our applications address the information technology, process excellence, finance, professional services and marketing functions within organizations.
Recurring revenue model with high visibility. We believe we have a highlyan attractive operating model due to the recurring nature of our subscription revenue, which results in greater visibility and predictability of future revenue and enhances our ability to effectively manage our business. In addition, the cloud-based nature of our model accommodates significant additional business volume with limited incremental costs, providing us with opportunities to improve our operating margins.
Proven M&A capability. We have a proven ability to successfully identify, acquire and integrate complementary businesses to grow our company, as evidenced by the eleven20 acquisitions we have completed since the beginning of 2012. We have a dedicated and experienced corporate development team that continually monitors hundreds of companies in order to maintain a robust pipeline of potential acquisition candidates. We believe that our acquisition experience and strategy givesgive us a competitive advantage in identifying additional opportunities to expand our family of software applications to better serve our customers.
Experienced, proven management team. Our management team has significant operating experience and previously occupied key leadership roles at both private and public companies. In addition, our management’s extensive knowledge of the industry and experience in building businesses organically and through strategic acquisitions has enabled us to quickly establish a leading position within the enterprise work management software market.
Cloud-based platformdelivery. We deliver our software applications and functionality primarily through the cloud, with no hardware or software installation required by our customers. This delivery model allows us to provide reliable, cost-effective applications to our customers, add subscribers with minimal incremental expenseeffort and deploy new functionality and upgrades quickly and efficiently. We
believe our cloud-based delivery model provides us with a competitive advantage over legacy processes and on-premise systems.
Commitment to customer success. We have a dedicated customer success organization whose mission is to drive adoption, value realization, retention, and loyalty across our customer base. Our focus on enabling our customers’ success is a key reason our annual net dollar retention rate, as defined in “Item 7. - Management's Discussion and Analysis” herein, was 90% in fiscal 2015.98% as of December 31, 2018. Our commitment to customer success has enabled us to expand our footprint within customer organizations and facilitate the ongoing adoption of our enterprise work management software applications. We utilize NPS methodology to track our progress and drive continuous improvement.
Our Strategy for Growth
Our objective is to beWe believe the world’s leading provider of enterprise work management software. The key elements of our strategy for growth are as follows:
Acquire complementary software businesses. We intend to pursue acquisitions of complementary technologies, products, and businesses to expand our product families and customer base, and to provide access to new markets and increased benefits of scale. Our experienced corporate development team continually monitors a pipeline of potential acquisition candidates, many of which are smaller in scale or address only limited enterprise challenges, which often operate outside the scope of some of our larger competitors. We believe that our acquisition experience and strategy give us a competitive advantage in identifying additional opportunities to expand our family of cloud-based applications to better serve our customers. We intend to prioritize acquisitions within the solution categories we currently offer.
Increase sales to existing customers. We believe there is a significant opportunity to expand the adoption of our applications within our existing customers,customer organizations, particularly within divisions or departments that have not previously used our applications. We also intend to cross-sell additional applications to our existing customers, as very few of our customers currently use more than one of our applications. In addition, we intend to add new applications to our family of applications that will address additional functions within the enterprise work management spectrum. We believe these initiatives will significantly increase the value of our platform to our customers, further strengthen our competitive position, and drive increased adoption of multiple applications by our customers.
Add new customers. We maintain direct sales and marketing capabilities in order to further grow our customer base. We also maintain indirect sales channels through alliances with strategic partners that can leverage our applications with their complementary services and technologies they provide.technologies. In addition, we continue to expand the range of integrations between our software and third-party applications and platforms, which we believe make our applications more attractive to a broader audience of potential customers.
Acquire complementary software businesses. We intend to pursue acquisitions of complementary technologies, products and businesses to enhance the features and functionality of our applications, expand our customer base and provide access to new markets and increased benefits of scale. Our dedicated and experienced corporate development team continually monitors hundreds of companies in order to maintain a robust pipeline of potential acquisition candidates, many of which are smaller scale or address only limited enterprise work management challenges, which often operate outside the scope of some of our larger competitors. We believe that our acquisition experience and strategy gives us a competitive advantage in identifying additional opportunities to expand our family of cloud-based applications to better serve our customers. We will prioritize acquisitions within the enterprise functions we currently serve, including Project & IT Management, Workflow Automation and Digital Engagement.
Expand globally. We believe there is a significantan opportunity to grow sales of our applications globally. In fiscal 2015, 2014,During the years ended December 31, 2018, 2017, and 2013,2016, approximately 19%22%, 22%18%, and 24%16%, respectively, of our revenue was derived from sales outside the United States. Over the next several years, we willplan to continue to evaluate growth opportunities outside the United States through selective acquisitions, the hiring of additional sales personnel, and entering into strategic partnerships.
Improve and enhance applications. We willintend to continue to invest in research and development and work closely with our customers to identify and improve new applications, features and functionalities that address customer requirements across the enterprise work management spectrum. We also intend to continue to expand the breadth of our applications with additional analytics, third-party integrations, and social and mobile capabilities to meet the evolving needs of today’s knowledge workers.
Our Products
We provide a family of cloud-based enterprise work management software applications under the Upland brand. Our applications are easy-to-deploy, highly configurable, scalable, flexible and secure. We provide applications for the information technology, process excellence, finance, professional services and marketing functions within organizations, as described below.
Program and Portfolio Management. Our program and portfolio management application is used by our customers to gain high-level visibility across their organizations and improve their top-down governance of programs, initiatives, investments and projects without necessitating the detailed task and resource tracking required by legacy project management systems. Our customers use these capabilities to:
gather, develop and assess ideas and proposed investments;
prioritize and select projects and investments according to business value and strategic fit;
more effectively allocate resources in alignment with business objectives;
respond quickly to change with real-time visibility into status and the ability to evaluate the impact of potential changes; and
gauge performance against strategic objectives, execution-level indicators and financial metrics.
Our program and portfolio management application currently is used within the information technology, finance and process excellence functions of organizations.
Project Management and Collaboration. Our project management and collaboration application is used by our customers to improve collaboration and the execution of projects, unstructured work and unscheduled tasks. Our customers use these capabilities to:
plan and schedule projects and work in order to improve resource utilization;
gain real-time visibility into work status, issues and risks;
track costs associated with projects and work; and
increase the quality and speed of execution with customizable templates and workflows.
Our project management and collaboration application currently is used within the information technology, marketing and professional services functions of organizations.
Workflow Automation and Enterprise Content Management. Our workflow automation and enterprise content management applications are used by our customers to automate document-based workflows by capturing, storing and routing content, assigning work tasks and creating audit trails for operations such as healthcare records, loan processing, human resource processes and accounts receivable and payable processing. Our customers use these capabilities to:
empower collaboration by providing a way for employees, suppliers and partners to access, share and update content from anywhere;
streamline workflows by creating custom rules to process and route content for approval;
automatically capture, index, classify and organize enterprise content in a secure, central repository with document retention policies to meet business and compliance requirements; and
apply and enforce document retention policies to meet business and compliance requirements.
Our workflow automation and enterprise content management applications are currently used within the information technology, finance, marketing and process excellence functions of organizations.
Digital Engagement Management. Our digital engagement applications are used by customers to connect and communicate with their target markets in order to build brand relationships or drive a particular program outcome via website and mobile devices, providing a timely and highly relevant customer experience. Additionally, our digital engagement management applications are used by enterprise marketers and media companies to create, maintain and deliver websites that enhance and influence customer engagement. These applications empower non-technical staff to create, manage, publish, analyze and refine content and social media assets without information technology intervention. Our customers use these capabilities to:
streamline the process for creating and managing website content;
deliver more relevant, personalized content to website visitors based on the tracking of individual visitor behavior.
integrate user-generated content, such as polls, surveys, blogs, ratings and comments, into their websites;
engage entire target audiences with one-on-one text message conversations to achieve optimal results;
reach the correct person at exactly the right moment through list segmentation and scheduling;
provide timely alerts and reminders on important events based on user preferences;
respond to users instantly, answering questions via text message;
manage all mobile communications from a single place, keeping track of all users and actions;
analyze campaign performance at all levels and every action;
run surveys, polls and quizzes to gather information and engage users; and
ensure security and privacy of information through comprehensive policies, procedures and technical controls.
Professional Services Automation. Our professional services automation applications are used by customers to more effectively manage their project and service-based knowledge workers to better manage employee-related expenses and client billing while improving scheduling, utilization and alignment of human capital. Our customers use these capabilities to:
create resource capacity plans;
align available skills, expertise and capacity with project requirements;
more efficiently plan and schedule projects;
track resource and expense allocation for specific projects, activity types or budget categories;
analyze workforce performance;
streamline timesheet review, approval and reporting processes;
manage time, travel and entertainment expenses; and
streamline project cost reporting, billing and revenue recognition processes.
Our professional services automation applications currently are used within the information technology, marketing, finance, and professional services functions of organizations.
Financial Management. Our financial management application is used by our customers to gain visibility into the cost, quality and value of services the information technology and finance functions deliver to organizations. This increased transparency helps our customers improve alignment during planning and budgeting processes, and validate proposed investments and initiatives of a particular line of business. Our customers use these capabilities to:
quantify and understand the total cost of ownership of information technology applications and services;
establish product and unit-costing metrics for benchmarking and/or chargeback;
provide information technology and finance departments with the ability to chargeback business units for applications and services, including cloud services, based on metered consumption;
provide business managers with insights into their consumption of information technology services to better utilize information technology services with business goals and objectives;
leverage utilization and capacity metrics for “what-if” analysis and modeling;
analyze fixed versus variable information technology-related costs to identify opportunities for savings; and
support demand-based budgeting and forecasting processes.
Our financial management application currently is used within the information technology and finance functions of organizations.
Customers
We have more than 2,000service customers with over 235,000 users.ranging from large global corporations and government agencies to small- and medium-sized businesses. Our customers operate in a wide variety of
industries, including financial services, retail, technology, manufacturing, legal, education, consumer goods, media, and telecommunications, government,
non-profit, food and beverage, healthcare and life sciences, chemicals, and travel and hospitality. For the year ended December 31, 2018 approximately 80% of our recurring revenue was generated from what we consider to be major accounts, those customers with contracted annual recurring revenue of $25,000 or more. No customer represented more than 3% of our revenue as offor the year ended December 31, 2015.2018.
Sales
We sell our software applications primarily through a direct sales organization comprised of inside sales and field sales personnel. In addition to our direct sales organization, we have an indirect sales organization that sells to distributors and value-added resellers. We employ a land-and-expand go-to-market strategy. After we demonstrate the value of an initial application to an organization,a customer, our sales and account management teams work to expand the adoption of that initial application across the organization, as well ascustomer, and cross-sell additional applications to address other enterprise work management needs of the organization.customer. Our direct sales team is organized by product line of business. All ofcustomer success organization supports our direct sales personnel sell our applicationsefforts by managing the post-sale customer lifecycle.
Our subscription agreements are typically sold either on a per-seat basis or on a minimum contracted volume basis with overage fees billed in arrears, depending on the application being sold. Contract terms typically range from one to three years and professional services across multiple industries.are prepaid annually in advance.
Marketing
Our marketing activities are designed to build awareness of the Upland brand and the individual product brands,solutions we offer, generate thought leadership, and create demand, resulting in leads and opportunities for our sales organizations. We focus a significant portion of our marketing activities on our existing installed base of customers to drive expansion and cross-sell opportunities. Our marketing programs target decision makers and influencers participatingwho participate in a buying cycle, including the chief information officer, the chief marketing officer, the chief financial officer, the director of process excellence, and other key technology and business managers. Our principal marketing programs include:
use of our website to provide information about us and our software applications, as well as educational opportunities for potential customers;
field marketing events for customers and prospective customers;
participation in, and sponsorship of, executive events, trade shows, and industry events;
our online virtual user conferences;
integrated digital marketing campaigns, including email, online advertising, blogs, and webinars;
public relations, analyst relations, and social media initiatives; and
sales representatives who respond to incoming leads to convert them into new sales opportunities.
Customer Success
Our customer success organization is structured to manage all aspects of our post-sale customer lifecycle. This organization consists of dedicated teams with a mission to drive adoption of our applications,products, value realization, retention, and loyalty across our customer base. Our customer success organization has four core functional areas with strategic focus on customer relationship management:
Customer Care. Our customer care team assists customers throughout their lifecycle with the Upland family of applications by making service offerings available to all customers as part of their standard customer agreements, including webinars, virtual user group meetingsconferences, and conferences. In particular, we hold a user conference featuring a variety of keynote and customer speakers, panelists and presentations. Conference attendees also gain insight into our recent application enhancements and participate in interactive sessions that give them the opportunity to express opinions on new features and functionality.online community engagement.
Professional Services. Our professional services team is responsible for coordinating all activities relating to the implementation, transition, and on-boarding of new customers and assisting new customers with the addition of new applications to their accounts. Typical professional services engagements vary in length from a few weeks to several months depending on the size and scope of the engagement and are in addition to services provided under our standard customer agreement and are fee-based.fee-
based. In addition, our project managers and consultants work closely with our customers to provide services that help customers maximize the utility of our applications. Our continuing education services, known as Upland University, provide our clients with access to product tutorials and information on new applications and platform features, as well as offer tailored training programs to meet specific client needs.
Account Management. We assign each customer a regionally alignedan account team with a relationship manager who functions as the customer’s single point of contact and advocate within Upland. Our account management teams are trained on all of our applications and work closely with the relationship manager to ensure that our customers receive high-quality consultative service.
Customer Support. We offer support from all of our office locations as well as our offshore Center of Excellence in Egypt and India, to help our customers maximize the return on their investment in our applications. We provide 24/77/365 customer support around the world through our online customer support portal. In addition, our customer support team manages and administers the Upland customer community forum and knowledge base repository.
Our customer success organization manages programs to reinforce the ongoing business value of our applications and promote the Upland “customer for life” program.applications. These service offerings include:
Health Checks and Program Reviews: Engages where we engage core users and business buyer sponsors to deliver a detailed scorecard and recommendation report.
Advisory and Retained Services: Provides that provide our customers with access to a specific customer success contact with priority scheduling and periodic checkpoints.
System Deployment and Adoption Analysis: Analyzes programs to analyze system configuration and usage patterns, resulting in best practice recommendations on improving user adoption and compliance.
Consumption Review and Recommendations: Delivers designed to deliver best practice recommendations for implementation strategy and a roadmap proposal for aligning the system with customers’ evolving process maturity to increase application usage.
Premier Success Services Program: ProvidesPlans that provide a bundled services, support, and product experience offering with three service-level options tailoredtiers (standard, gold and platinum) designed to maximize customers’ value relativeprovide maximum customer value.
Executive Outreach where we promote open communication between the Upland leadership team, which is fully committed to making sure customers are delighted with their specific needs.Upland experience, and customer executives.
Technology and Operations
Our cloud-based family of applications utilizes a multi-tenant architecture and our customers access our applications using a secure Internet connection through a standard web browser. We rely on generally available off-the-shelf software licensed from third parties. Our applications are easy to deploy, highly configurable, scalable, flexible, and secure, and provide our customers with a modern and intuitive user experience.
We use storage area networkhave partnered with AWS to provide the hardware atand infrastructure necessary to provide our data center locationsservices to our customers. AWS facilities provide 24/7/365 security, biometric access controls, redundant networking, power and environmental systems, and monitoring. Upland Software designs and operates the infrastructure architecture with fully redundant subsystems, highly available configurations, and defense in depth security zones.
Our applications are built on highly available and modular architectures that has been designed for high performance and data-loss prevention. We believe these systems have the capability and scalability to enable us to meet our anticipated growth for the foreseeable future.
We employ a modular application architecture to balance customer workloads across multiple servers andservers. This allows us to provide a flexible method for scaling customers without impacting other parts of the server environment. This architecture is designed to allow us to providearchitectural environment while maintaining the high levels of uptime required by our customers. We employ capacity planning techniques to ensure we have required capacity for our forecasted growth.customers require.
We offerOur family of applications offers high levels of security by segregatingthrough logical data segregation of each customer’s data from the data of other customers and bythrough limiting access to our platform to only those individuals authorized by our customers. In addition, sensitive customer data is encrypted “at rest” and “in transit” over secure connections to redundant storage in a secondary location.
We maintain a formal and comprehensive security program designed to ensurehelp preserve the security and integrity of customer data, protect against security threats or data breaches, and prevent unauthorized access to the data of our customers. We strictly regulate and limit all access to servers and networks at our production and remote backup facilities. Periodic security audits are conducted by an external third-party and include firewall penetration testing and vulnerability scans. In addition, sensitive customer data is encrypted. Encrypted backup files are transmitted over secure connections to a redundant server storage device in a secondary data center. Our data center facilities employ advanced measures to ensure physical integrity, including redundant power and cooling systems, and advanced fire and flood prevention.
All users are authenticated, authorized and validated before they can access our system. Users must have a valid user ID and associated password to log onto our user interface. Our configurable security model allows different groups of users to have different levels of access to our applications. Security groups and policies are
delivered or can be created based on a customer’s unique access requirements.
We currently serve our customers from secure, third-party, American National Standards Institute Tier 3 data center facilities, located in the United States and other countries. Our data centers are designed to host computer systems with fully redundant subsystems and compartmentalized security zones. While we procure and operate all infrastructure equipment delivering our applications, third parties operate the data centers that we use. These facilities provide 24/7 security, biometric access controls, systems security, redundant networking, N+1 power and environmental controls. Our contracts with these third party data center providers are typically for a term of three years. While we believe that these data centers have sufficient capacity to meet our anticipated growth for the foreseeable future, we have instituted a new initiative to consolidate our data centers for higher efficiency.
We voluntarily obtain third-party security examinations relating to security and data privacy in accordance with the Service Organization Control (SOC) and Statement on Standards for Attestation Engagements (SSAE) No. 16, Reporting on Controls at a Service Organization. Our SOC examination is conducted every year by an independent third-party auditor and addresses, among other areas, our physical and environmental safeguards for production data centers, data availability and integrity procedures, change management procedures and logical security procedures.data.
Research and Development
We focus our research and development efforts on customer-driven innovation, third-party integrations and continually enhancing the performance, reliability, security, usability, and scalability of our applications.
In addition to internal resources, we utilize partners, contractors and offshore resources to improve efficiencies and our ability to deliver. Our research and development expenses were $15.8 million, $26.2 million, $10.3 million in fiscal years 2015, 2014, and 2013, respectively. See audited financial statement Note 17 Related Party Transactions regarding an $11.2 million charge to research and development costs in fiscal 2014.
Competition
The overall market for enterprise work management software ismarkets we serve are rapidly evolving and subject to changing technology, shifting customer needs, and frequent introductions of new applications. The intensity and nature of our competition varies significantly across our range of enterprise work management applications. We believe there are a limited number of direct competitorscompete against larger enterprise software companies that provide a comprehensive cloud-based enterprise work management software offering. However,full suite of Software as a Service, or SaaS, solutions focused on the functional areas we serve or the problems our solutions address. We face competition both from point solution providers, including legacy on-premise enterprise systems, and other cloud-based work management software vendors that may address one or more of the functional elements of our applications, but are not designed to address a broad range of enterprise work management needs.applications. In addition, we face competition from manual processes and traditional tools, such as paper-based techniques,procedures, spreadsheets, and email.
We believe the principal competitive factors in our market include the following:
breadth and depth of application functionality;
ease of deployment and use of applications;
total cost of ownership;
levels of customer support satisfaction;
brand awareness and reputation;
capability for configurability, integration, scalability, and reliability of applications;
ability to innovate and respond to customer needs rapidly; and
level of integration among applications and with other enterprise systems.
We believe that we compete favorably on the basis of these factors. Our ability to remain competitive will
largely depend on the strength of our applications, the effectiveness of our sales and marketing efforts, the quality of our customer success organization, and our ability to acquire complementary technologies, products, and businesses to enhance the features and functionality of our applications.
Intellectual Property and Proprietary Rights
We rely on a combination of trademark, copyright, trade secret, and patent laws in the United States and other jurisdictions as well as confidentiality procedures and contractual provisions to protect our intellectual property. We believe
Backlog
Backlog represents future billings under our non-cancelable agreements that have not been invoiced or paid and; accordingly, not recorded in deferred revenue. Until such time as these amounts are invoiced or paid, they are not recorded in revenues, deferred revenue or elsewhere in our consolidated financial statements. As of December 31, 2018 our backlog was approximately $65.7 million.
Our subscription contracts are generally 1 to 3 years in length, and therefore the durationsubstantial majority of our patentsbacklog is adequate relativeexpected to be recognized as revenue within the expected livesone-year contract term. Revenue for any period is a function of revenue recognized from deferred revenue, backlog under contracts in existence at the beginning of the period, as well as contract renewals and new customer contracts during the period. As a result, our backlog at the beginning of any period is not necessarily indicative of our service offerings.future performance. Our presentation of backlog may differ from other companies in our industry.
Employees
As of December 31, 2015,2018, we had 342667 employees, with the majority of our employees being located in the United States, or Canada.Canada and the United Kingdom. None of our employees are covered by a collective bargaining agreement. We have never experienced a strike or similar work stoppage, and we consider our relations with our employees to be good.
Legal Proceedings
From time to time, we may become involved in legal proceedings arising in the ordinary course of our business. We are not presently a party to any legal proceedings that we believe would, individually or taken together, have a material adverse effect on our business, operating results, financial condition or cash flows.
Information about Segment and Geographic Revenue
We operate and manage our business as a single operating segment. See our consolidated financial statements for a discussion of revenues, operating loss, net loss and total assets. The Company’s revenues are principally generated in the United States, which accounted for 81%, 76%, and 75% of consolidated revenues for the years ended December 31, 2015, 2014, and 2013, respectively. Revenues from international business accounted for 19%, 22%, and 24% of consolidated revenues for the years ended December 31, 2015, 2014, and 2013, respectively. See Note 16 of the Notes to Condensed Consolidated Financial Statements for more information regarding our revenue as it relates to domestic and foreign operations.
Available Information
We were incorporated in Delaware in 2010. Our principal executive offices are located at 401 Congress Avenue, Suite 1850, Austin, TX 78701. Our telephone number at that location is (855) 944-7526.(512) 960-1010. Our website address is www.uplandsoftware.com. Information on our website is not part of this report and should not be relied upon in determining whether to make an investment decision. The inclusion of our website address in this report does not include or incorporate by reference into this report any information on our website.
Our annual reports on Form 10-K, quarterly reports on Form 10-Q, current reports on Form 8-K and amendments to those reports filed or furnished pursuant to Section 13(a) or 15(d) of the Securities Exchange Act of 1934, as amended, are available free of charge through our website as soon as reasonably practicable after they are electronically filed with or furnished to the SEC. The public may read and copy the materials we file with the SEC at the SEC’s Public Reference Room at 100 F Street, NE, Washington, DC 20549. The public may obtain information on the operation of the Public Reference Room by calling the SEC at 1-800-SEC-0330. Additionally, the SEC maintains an internet site that contains reports, proxy, and information statements, and other information. The address of the SEC’s website is www.sec.gov.
Item 1A. Risk Factors
15
Risks Related to Our Business
We have a limited operating history and may be unable to achieve or sustain profitability or accurately predict our future results.
We were formed in July 2010 and acquired our first business and commenced operations in September 2011. Prior to September 2011, our business activity was devoted to raising capital, building infrastructure and reviewing potential acquisitions. As such, we have a very limited operating history of selling our products and professional services to third parties. Our limited operating history makes it difficult to evaluate our current business and future prospects and may increase the risk of your investment. We incurred net losses of $13.7 million, $20.1 million and $9.2 million in fiscal 2015, 2014, and 2013, respectively. As of December 31, 2015, we had an accumulated deficit of $48.9 million. Our losses in prior periods and accumulated deficit reflect the investments we have made to date to grow our business. We expect to have significant operating expenses in the future to further support and grow our business, including expanding the range of integrations between our software and third-party applications and platform, expanding our direct and indirect sales capabilities, pursuing acquisitions of complementary businesses, investing in our data center infrastructure and research and development and increasing our international presence, and as a result we may be unable to achieve or sustain profitability or accurately predict our future results. You should not consider our recent growth in revenue as indicative of our future performance, and we cannot assure you that we will achieve profitability in the future, nor that if we do become profitable, we will sustain profitability.
Our growth is dependentdepends on our ability to retain existing customers, and secure additional subscriptions, and cross-sell opportunities from existing customers, andwhile nonrenewals and downgrades could harm our future operating results.
In order for us to improve our operating results, it is important that our customers renew or upgrade their agreements with us when the applicable contract term expires, which is typicallyand also purchase additional applications from us. Typically contract terms are one to three years for subscription agreements, and one year for perpetual license agreements, and also purchase additional applications from us.agreements. Upon expiration, customers can renew their existing subscriptions, upgrade their subscriptions to add more seats or additional minimum contracted volume, downgrade their subscriptions to fewer seats or lower minimum contracted volume, or not renew. A renewal constitutes renewing an existing contract for an application under the same terms, and an upgrade includes purchasing additional seats or volume under an existing contract. We may also cross-sell additional applications to existing customers. Our ability to grow revenue and achieve profitability depends, in part, on customer renewals, customer upgrades, and cross-sales to existing customers exceeding downgrades and nonrenewals.non-renewals. However, we may not be able to increase our penetration within our existing customer base as anticipated, and we may not otherwise retain subscriptions from existing customers. Our customers may choose to not renew or upgrade their subscriptions, or may downgrade, because of several factors, including dissatisfaction with our prices, features or performance relative to competitive offerings, reductions in our customers’ spending levels, unused seats or volume, or limited adoption or use of our applications. In addition, we may not be successful in cross-selling new applications to our existing customers. If our customers do not upgrade or renew their subscriptions or purchase additional applications from us, or if they downgrade their subscriptions, our revenue may grow more slowly than expected or may decline, and our financial performance may be adversely affected.
Any failure to offer high-quality customer service may adversely affect our relationships with our customers and our financial results.
Our customers depend on our customer success organization to manage the post-sale customer lifecycle, including to implement new applications for our customers, provide training and ongoing education services, and resolve technical issues relating to our applications. We may be unable to respond quickly enough to accommodate short-term increases in demand for our customer success services. We also may be unable to modify the format of our customer success services to compete with changes in similar services provided by our competitors. Increased customer demand for these services, without corresponding revenue, could increase costs and adversely affect our operating results. In addition, our sales process is highly dependent on the reliable functional operation of our applications, our business reputation, and positive recommendations from our existing customers. Any failure to maintain high-quality customer service, or a market perception that we do not maintain high-quality customer service, could adversely affect our reputation, our ability to sell our applications to existing and prospective customers, and our business, operating results, and financial position.
If the market for cloud-based enterprise work management applications develops more slowly than we expect, or declines, our business could be adversely affected.
The market for cloud-based enterprise work management applications is not as mature as the market for legacy on-premise enterprise systems, and it is uncertain whether cloud-based applications will achieve and sustain high levels of customer demand and market acceptance. Our success will depend to a substantial extent on increased adoption of cloud-based applications, and of our enterprise work management software applications in particular. Many large organizations have invested substantial personnel and financial resources to integrate legacy on-premise enterprise systems into their businesses, and therefore may be reluctant or unwilling to migrate to cloud-based applications or away from their traditional vendors or to new practices because of the organizational changes often required to successfully implement new enterprise work management systems. In addition, we do not know whether the adoption of enterprise work management software will continue to grow and displace manual processes and traditional tools, such as paper-based techniques, spreadsheets and email. It is difficult to predict customer adoption rates and demand for our applications, the future growth rate and size of the cloud-based software application market or the entry of competitive products. The expansion of the cloud-based software application market depends on a number of factors, including the cost, performance and perceived value associated with cloud-based applications, as well as the ability of cloud-based application companies to address security and privacy concerns. If other cloud-based software application providers experience security incidents, loss of customer data, disruptions in delivery or other problems, the market for cloud-based applications as a whole, including our enterprise work management applications, may be negatively affected. If cloud-based applications do not achieve widespread adoption, or there is a reduction in demand for cloud-based applications caused by a lack of customer acceptance, technological challenges, weakening economic conditions, security or privacy concerns, competing technologies and products, decreases in corporate spending or otherwise, our revenues may decrease and our business could be adversely affected.
If we fail to manage our growth effectively, we may be unable to execute our business plan and maintain high levels of customer satisfaction.
We have recently experienced a period of rapid growth in our personnel and operations. In particular, we increased our number of full-time employees from three as of December 31, 2011 to 342667 as of December 31, 2015,2018, and have also increased the size of our customer base. In addition, our revenue grew from $712,000 in fiscal 2011 to $69.9$149.9 million in fiscal 2015.2018. Acquisitions are a primary component of our growth strategy, and as a result, we anticipate that we will continue to experience further rapid growth in our personnel and operations in the future. Our growth has placed, and future growth will place, a significant strain on our managerial, administrative, operational, financial, and other resources. To manage the expected growth of our personnel and operations, we will need to continue to improve our operational, financial and management controls, and our reporting systems and procedures. Failure to effectively manage our growth could result in difficulty or delays in deploying our applications, declines in quality or customer satisfaction, increases in costs, and difficulties in introducing new features or other operational difficulties, and any of these difficulties could adversely impact our business performance and results of operations.
We have made, and expect to continue to make, acquisitions as a primary component of our growth strategy. We may not be able to identify suitable acquisition candidates or consummate acquisitions on acceptable terms, or we may be unable to successfully integrate acquisitions, which could disrupt our operations and adversely impact our business and operating results.
A primary component of our growth strategy has been to acquire complementary businesses to grow our company. For example, we acquired the businesses of PowerSteering Software, Inc., Tenrox Inc., and LMR Solutions, LLC dba EPM Live in fiscal 2012 and2012; the businesses of FileBound Solutions, Inc. and Marex Group Inc., ComSci, LLC, and Clickability Inc., in fiscal 2013,2013; the businesses of Solution Q Inc. and Mobile Commons, Inc., in fiscal 2014, and2014; Ultriva Inc. in 2015; and the businesses of LeadLander, Inc., HipCricket, Inc., and Advanced Processing and Imaging, Inc. in fiscal 2015.2016. In 2017, we acquired the businesses of Omtool, Ltd., RightAnswers, Inc., Waterfall International, Inc., and Qvidian Corporation. In 2018, we acquired the businesses of Interfax Communications Ltd, References-Online, Inc., Rapide Communication Ltd. (“Rant & Rave”), and Adestra Ltd. We intend to continue to pursue acquisitions of complementary technologies, products, and businesses as a primary component of our growth strategy to enhance the features and functionality of our applications, expand our customer base, and provide access to new markets, and increase benefits of scale. Acquisitions involve certain known and unknown risks that could cause our actual growth or operating results to differ from our expectations. For example:
we may not be able to identify suitable acquisition candidates or to consummate acquisitions on acceptable terms;
we may pursue international acquisitions, which inherently pose more risks than domestic acquisitions;
we compete with others to acquire complementary products, technologies, and businesses, which may result in decreased availability of, or increased price for, suitable acquisition candidates;
we may not be able to obtain the necessary financing, on favorable terms or at all, to finance any or all of our potential acquisitions;
we may ultimately fail to consummate an acquisition even if we announce that we plan to acquire a technology, product, or business; and
acquired technologies, products, or businesses may not perform as we expect, and we may fail to realize anticipated revenue and profits.
In addition, our acquisition strategy may divert management’s attention away from our existing business, resulting in the loss of key customers or employees, and expose us to unanticipated problems or legal liabilities, including responsibility as a successor for undisclosed or contingent liabilities of acquired businesses or assets.
If we fail to conduct due diligence on our potential targets effectively, we may, for example, not identify problems at target companies or fail to recognize incompatibilities or other obstacles to successful integration. Our inability to successfully integrate future acquisitions could impede us from realizing all of the benefits of those acquisitions and could severely weaken our business operations. The integration process may disrupt our business and, if new technologies, products, or businesses are not implemented effectively, may preclude the realization of
the full benefits expected by us and could harm our results ofor operations. In addition, the overall integration of new technologies, products, or businesses may result in unanticipated problems, expenses, liabilities, and competitive responses. The difficulties of integrating an acquisition include, among other things:
issues in integrating the target company’s technologies, products, or businesses with ours;
incompatibility of marketing and administration methods;
maintaining employee morale and retaining key employees;
integrating the cultures of both companies;
preserving important strategic customer relationships;
consolidating corporate and administrative infrastructures and eliminating duplicative operations; and
coordinating and integrating geographically separate organizations.
In addition, even if the operations of an acquisition are integrated successfully, we may not realize the full benefits of the acquisition, including the synergies, cost savings, or growth opportunities that we expect. These benefits may not be achieved within the anticipated time frame, or at all.
Further, acquisitions may cause us to:
issue common stock that would dilute our current stockholders’ ownership percentage;
use a substantial portion of our cash resources;
increase our interest expense, leverage, and debt service requirements if we incur additional debt to pay for an acquisition;
assume liabilities for which we do not have indemnification from the former owners; further, indemnification obligations may be subject to dispute or concerns regarding the creditworthiness of the former owners;
record goodwill and non-amortizable intangible assets that are subject to impairment testing and potential impairment charges;
experience volatility in earnings due to changes in contingent consideration related to acquisition earn-out liability estimates;
incur amortization expenses related to certain intangible assets;
lose existing or potential contracts as a result of conflict of interest issues;
become subject to adverse tax consequences or deferred compensation charges;
incur large and immediate write-offs; or
become subject to litigation.
We depend on our senior management team and the loss of one or more key personnel, or an inability to attract and retain highly skilled personnel may impair our ability to grow our business.
Our success depends, in part, upon the continued services of our key executive officers, including John T. McDonald, Michael D. Hill, and Timothy W. Mattox, as well as other key personnel. We do not have employment agreements with most of our executive officers or other key personnel that require them to continue to work for us for any specified period and,period; therefore, they may terminate employment with us at any time with no advance notice. The replacement of our senior management team or other key personnel likely would involve significant time and costs, and the loss of these employees may significantly delay or prevent the achievement of our business objectives.
We face intense competition for qualified individuals from numerous technology and software companies. If we fail to attract and retain suitably qualified individuals, including software engineers and sales personnel, our ability to implement our business plan and develop and maintain our applications could be adversely affected. As a result, our ability to compete would decrease, our operating results would suffer, and our revenue would decrease.
Failure to maintain and expand our sales organization may negatively impact our revenue growth.
We sell our applications primarily through a direct sales organization comprised of inside sales and field sales personnel. In addition, we have an indirect sales organization, which sells to distributors and value-added resellers. Growing sales to both new and existing customers is, in part, dependent on our ability to maintain and expand our
sales force. Identifying, recruiting and training additional sales personnel requires significant time, expense, and attention. It can take several quarters or longer before our sales representatives are fully-trained and productive. Our business may be adversely affected if our efforts to expand and train our sales organization do not generate a corresponding increase in revenue. In particular, if we are unable to hire, develop, and retain sales personnel, or if our new sales personnel are unable to achieve expected sales productivity levels in a reasonable period of time or at all, our revenue may grow more slowly than expected or decline and our business may be harmed.
Because we generally recognize revenue from our customers over the terms of their agreements but incur most costs associated with generating such agreements in advance, rapid growth in our customer base may increase our losses in the short-term.
Expenses associated with acquiring customers, such as the expenses related to our sales organizations and related commissions, are generally expensed as incurred, while most of our revenue is recognized ratably over the life of the applicable agreements. Therefore, increased sales will result in our recognition of more costs than revenue during the early periods covered by such agreements, even in cases where the agreements are expected to be profitable for us over their full terms. As a result, even if we are successful in increasing our customer base, our short-term operating results may suffer.
We recognize revenue from customers over the term of the related agreement; therefore, downturns or upturns in our business may not be immediately reflected in our operating results.
We recognize revenue from customer agreements ratably over the terms of these agreements. As a result, a significant portion of the revenue we report in each quarter is generated from customer agreements entered into during previous periods, which is reflected as deferred revenue on our balance sheet. Consequently, a decline in new or renewed agreements, or a downgrade of renewed agreements to fewer seats or less minimum contracted volume, in any one quarter may not be fully reflected in our revenue in that quarter. Such a decline, however, will negatively affect our revenue in future quarters. Accordingly, the effect of significant downturns in sales and market acceptance of our applications, and potential changes in our pricing policies or rates of renewals, may not be fully reflected in our results of operations until future periods. Similarly, it would be difficult for us to rapidly increase our revenue through new sales, renewals, and upgrades of existing customer agreements, or through additional cross-selling opportunities, in a given period due to the timing of revenue recognition inherent in our subscription model.
Perpetual license revenue is unpredictable, and a material increase or decrease in perpetual license revenue from period to period can produce substantial variation in the total revenue and earnings we recognize in a given period.
Perpetual license revenue reflects the revenue recognized from sales of perpetual licenses relating to our workflow automation and enterprise content management applications to new customers and additional licenses for such applications to existing customers. We generally recognize the license fee portion of the arrangement in advance. Perpetual licenses of our workflow automation and enterprise content management applications are sold through third-party resellers, and as such, the timing of sales of perpetual licenses is difficult to predict with the timing of recognition of associated revenue unpredictable. A material increase or decrease in the sale of perpetual licenses from period to period could produce substantial variation in the revenue we recognize. Accordingly, comparing our perpetual license revenue on a period to period basis may not be a meaningful indicator of a trend or future results.
Our quarterly operating results may fluctuate in the future. As a result, we may fail to meet or exceed the expectations of research analysts or investors, which could cause our stock price to decline, and you may lose part or all of your investment.
Our quarterly operating results may fluctuate as a result of a variety of factors, many of which are outside of our control. Accordingly, the results of any one quarter may not fully reflect the underlying performance of our business and should not be relied upon as an indication of future performance. If our quarterly operating results or outlook fall below the expectations of research analysts or investors, the price of our common stock could decline substantially. Fluctuations in our quarterly operating results or outlook may be due to a number of factors, including, but not limited to:
the extent to which our existing customers purchase additional seats or volume for our applications, and the timing and terms of those purchases;
the extent to which our existing customers renew their customer agreements for our applications and the timing and terms of those renewals;
the extent to which we cross-sell additional applications to our existing customers and the timing and terms of such cross-selling;
the addition or loss of customers, including through acquisitions or consolidations;
the extent to which new customers are attracted to our applications to satisfy their enterprise work management needs;
the rate of adoption and market acceptance of enterprise work management applications;
the mix of our revenue, particularly between product and professional services revenue, for which the timing of revenue recognition is substantially different;
changes in the gross profit we realize on our applications and professional services due to our differing revenue recognition policies applicable to subscription, and product, and professional services revenue and other variables;
the extent to which we enter into multi-year contracts, in which the support fees are typically paid in advance;
the announcement or adoption of new regulations and policy mandates or changes to existing regulations and policy mandates;
future accounting pronouncements or changes in our accounting policies;
unforeseen litigation and intellectual property infringement;
the number and size of new customers and the number and size of renewals in a particular period;
changes in our pricing policies or those of our competitors;
the mix of applications sold during a period;
the timing and expenses related to the acquisition of technologies, products, or businesses, and potential future charges for impairment of goodwill from such acquisitions;
the amount and timing of operating expenses, including those related to the maintenance and expansion of our business, operations and infrastructure;
the amount and timing of expenses related to the development of new products and technologies, including enhancements to our applications;
the amount and timing of commissions earned by our sales personnel;
the timing and success of new applications introduced by us or new offerings offered by our competitors;
the length of our sales cycles;
changes in the competitive dynamics of our industry, including consolidation among competitors, customers, or strategic collaborators;
our ability to manage our existing business and future growth, including increases in the number of customers using our applications;
the seasonality of our business or cyclical fluctuations in our industry;
the timing and expenses related to any international expansion efforts we may undertake and the success of such efforts;
various factors related to disruptions in access and delivery of our cloud-based applications, errors or defects in our applications, privacy and data security, and exchange rate fluctuations, each of which is described elsewhere in these risk factors; and
general economic, industry, and market conditions.
We may need financing in the future, and any additional financing may result in restrictions on our operations or substantial dilution to our stockholders. We may seek to renegotiate or refinance our loan facility, and we may be unable to do so on acceptable terms or at all.
We have funded our operations since inception primarily through equity financings, cash from operations, and cash available under our loan facility. We may need to raise funds in the future, for example, to expand our business, acquire complementary businesses, develop new technologies, respond to competitive pressures, or react to unanticipated situations. We may try to raise additional funds through public or private financings, strategic relationships, or other arrangements. Our ability to obtain debt or equity funding will depend on a number of factors, including market conditions, our operating performance, and investor interest. Additional funding may not be available to us on acceptable terms or at all. If adequate funds are not available, we may be required to reduce expenditures, including curtailing our growth strategies, reducing our product-development efforts, or foregoing acquisitions. If we succeed in raising additional funds through the issuance of equity or convertible securities, it could result in substantial dilution to existing stockholders. If we raise additional funds through the issuance of debt securities or preferred stock, these new securities would have rights, preferences, and privileges senior to those of the holders of our common stock. In addition, any debt financing obtained by us in the future or issuance of preferred stock could involve restrictive covenants relating to our capital raising activities and other financial and operational matters, which may make it more difficult for us to obtain additional capital and to pursue business opportunities, including potential acquisitions. Additionally, we may need to renegotiate the terms of our loan facility, and our lender may be unwilling to do so, or may agree to such changes subject to additional restrictive covenants on our operations and ability to raise capital.
Our loan facility contains operating and financial covenants that may restrict our business and financing activities.
On May 14, 2015,December 12, 2018, we enteredexpanded into a $60$400.0 million loan facility with Wells Fargo Capital Finance. The facility is comprised of a $25$285.0 million term loan, a $10$30.0 million revolving credit facility and a $10$30.0 million delayed draw term loan for acquisitions.acquisitions, of which none has been drawn to date. Additionally, the facility provides for an uncommitted $15$55.0 million accordion loan to further support future acquisitions and an additional $10allowance of $20.0 million of subordinated seller notes for acquisitions. As of December 31, 2015, there was $24.4 million outstanding under the credit facility, all of which was outstanding under the term loan portion and none was outstanding under the revolving portion of the credit facility.
Our obligations and the obligations of the co-borrowers and any guarantors under the Wells Fargo loan facility are secured by a security interest in substantially all of our assets and assets of the co-borrowers’ and of any guarantors, including intellectual property. The terms of the credit facility limits, among other things, our ability to
•sell, lease, license or otherwise dispose of assets;
•undergo a change in control;
•consolidate or merge with or into other entities;
•make or own loans, investments and acquisitions;
•create, incur or assume guarantees in respect of obligations of other persons;
•create, incur or assume liens and other encumbrances; or
•pay dividends or make distributions on, or purchase or redeem, our capital stock.
Furthermore, the Wells Fargo loan facility requires us and our subsidiaries to comply with certain financial covenants. The operating and other restrictions and covenants in the loan facility, and in any future financing arrangements that we may enter into, may restrict our ability to finance our operations, engage in certain business activities, or expand or fully pursue our business strategies, or otherwise limit our discretion to manage our business. Our ability to comply with these restrictions and covenants may be affected by events beyond our control, and we may not be able to meet those restrictions and covenants. A breach of any of the restrictions and covenants could result in a default under the loan facility or any future financing arrangements, which could cause any outstanding indebtedness under the loan facility or under any future financing arrangements to become immediately due and payable, and result in the termination of commitments to extend further credit.
If we are unable to increase market awareness of our company and our applications, our revenue may not continue to grow, or may decline.
Market awareness of our company and our applications is essential to our ability to generate new leads for expanding our business and our continued growth. If we fail to sufficiently invest in our marketing programs or they are unsuccessful in creating market awareness of our company and our applications, our revenue may grow more slowly than expected or may decline, and our financial performance may be adversely affected.
The markets in which we participate are intensely competitive, and if we do not compete effectively, our operating results could be adversely affected.
The overall market for enterprise work management software is rapidly evolving and subject to changing technology, shifting customer needs and frequent introductions of new applications. The intensity and nature of our competition varies significantly across our family of enterprise work management software applications. Many of our competitors and potential competitors are larger and have greater brand name recognition, longer operating histories, larger marketing budgets, and significantly greater resources than we do. Some of our smaller competitors may offer applications on a stand-alone basis at a lower price than usour price due to lower overhead or other factors, while some of our larger competitors may offer applications at a lower price in an attempt to cross-sell additional products in the future or retain a customer using a different application.
We believe there are a limited number of direct competitors that provide a comprehensive enterprise work management software offering. However, we face competition both from point solution providers, including legacy on-premise enterprise systems, and other cloud-based work management software vendors that may address one or more of the functional elements of our applications, but are not designed to address a broad range of enterprise work management needs. In addition, we face competition from manual processes and traditional tools, such as paper-based techniques, spreadsheets, and email.
If our competitors’ products, servicesservice, or technologies become more accepted than our enterprise work management applications, if they are successful in bringing their products or services to market earlier than ours, or if their products or services are more technologically capable than ours, our revenues could be adversely affected.
Mergers of, or other strategic transactions by, our competitors could weaken our competitive position or reduce our revenue.
If one or more of our competitors were to merge or partner with another of our competitors, the change in the competitive landscape could adversely affect our ability to compete effectively. In order to take advantage of customer demand for cloud-based software applications, vendors of legacy systems are expanding their cloud-based enterprise workplace management applications through acquisitions and organicinternal development. A potential result of such expansion is that certain of our current or potential competitors may be acquired by third parties with greater available resources and the ability to further invest in product improvements and initiate or withstand substantial price competition. Our competitors also may establish or strengthen cooperative relationships with our current or future value-added resellers, third-party consulting firms or other parties with whom we have relationships, thereby
limiting our ability to promote our applications. Disruptions in our business caused by these events could reduce our revenue.
Our growth and long-term success depends, in part, on our ability to expand our international sales and operations.
A core component ofAs our growth strategy is international expansion. For fiscal 2015operations have expanded, we have established and 2014, we generated approximately 19% and 22% , respectively, of our revenue from sales outsidecurrently maintain offices in the United States. We currently maintain international offices and have sales, marketing, support or research and development personnel inStates, Canada, and the United Kingdom. As weWe have limited experience in operating in foreign jurisdictions and expect to continue to expand our international footprint, we will be increasingly susceptible to the risks associatedrelationship with international operations. We havecustomers. Managing a global organization is difficult, time-consuming and expensive. Because of our limited operating historyexperiences with international operations, any international efforts that we may undertake may not be successful in creating demand for our applications outside of the United States and Canada andU.S. or in effectively selling subscriptions to our ability to manage oursolutions in all of the international markets that we enter. In addition, conducting international operations successfully requires significant resources and management attention and is subjectsubjects us to particular challenges of supporting a rapidly growing business in an environment of diverse cultures, languages, customs, legal systems, alternative dispute systems and economic, political and regulatory systems. In addition, we expect to incur significant costs associated with expanding our international operations,risks, including hiring personnel internationally. The risks and challenges associated with doing business internationally and our international expansion include:the following:
uncertain political and economic climates;
lack of familiarity and burdens of complying with foreign laws, accounting and legal standards, regulatory requirements, tariffs and other barriers;
unexpected changes in regulatory requirements, taxes, trade laws, tariffs, export quotas, custom duties or other trade restrictions;
lack of experience in connection with the localization of our applications, including translation into foreign languages and adaptation for local practices, and associated expenses and regulatory requirements;
difficulties in adapting to differing technology standards;
different pricing environments, longer sales cycles and accounts receivable payment cycles and difficulties in collecting accounts receivable;
difficulties in managing and staffing international operations, including differing legal and cultural expectations for employee relationships, and increased travel, infrastructure and legal compliance costs associated with international operations;
fluctuations in exchange rates that may increase the volatility of our foreign-based revenue and expenses;
potentially adverse tax consequences, including the complexities of foreign value-added tax, goods and services tax and other transactional taxes;
reduced or varied protection for intellectual property rights in some countries;
difficulties in managing and adapting to differing cultures and customs;
data privacy laws whichthat require that customer data to be stored and processed in a designated territory subject to laws different than the United States;
sales and customer service challenges associated with operating in different countries;
data privacy laws that require certain opt-in steps and restrict use and sharing of personally identifiable information than those required by the U.S. privacy laws;
new and different sources of competition as well as laws and business practices favoring local competitors and local employees;
compliance with anti-bribery laws, including compliance with the Foreign Corrupt Practices Act;
increased financial accounting and reporting burdens and complexities; and
restrictions on the repatriation of earnings.
Further, our international expansion efforts may be hindered by lower levels of cloud adoption and increased price sensitivity for our applications or other cloud-based offerings in international markets. As a result of these and other factors, international expansion may be more difficult, take longer, and not generate the results we anticipate, which could negatively impact our growth and business.
Fluctuations in the exchange rate of foreign currencies could result in losses on currency transactions.
Our customers are generally invoiced in the currency of the country in which they are located. In addition, we incur a portion of our operating expenses in foreign currencies, including Canadian dollars, British pounds and Euros, and in the future, as we expand into other foreign countries, we expect to incur operating expenses in other foreign currencies. In addition, our customers are generally invoiced in the currency of the country in which they are located. WeAs a result, we are exposed to foreign exchange rate fluctuations as the financial results of our international operations are translated from the local functional currency into U.S. dollars upon consolidation. A decline in the U.S. dollar relative to foreign functional currencies would increase our non-U.S. revenue and improve our operating results. Conversely, if the U.S. dollar strengthens relative to foreign functional currencies, our revenue and operating results would be adversely affected. We have not previously engaged in foreign currency hedging. If we decide to hedge our foreign currency exchange rate exposure, we may not be able to hedge effectively due to lack of experience, unreasonable costs, or illiquid markets.
Our sales cycles can be lengthy and variable, which may cause changes in our operating results.
Our sales cycle can vary substantially from customer to customer. A number of factors influence the length and variability of our sales cycles, including, for example:
the need to educate potential customers about the uses and benefits of our applications;
the duration of the commitment customers make in their agreements with us, which are typically one to three years;
the discretionary nature of potential customers’ purchasing and budget cycles and decisions;
the competitive nature of potential customers’ evaluation and purchasing processes;
the functionality demands of potential customers;
fluctuations in the enterprise work management needs of potential customers;
the announcement or planned introduction of new products by us or our competitors; and
the purchasing approval processes of potential customers.
Our sales cycles can make it difficult to predict the quarter in which revenue from a new customer may first be recognized. We may incur significant sales and marketing expenses and invest significant time and effort in anticipation of a sale that may never occur or only occur in a smaller amount or at a later date than anticipated. Delays inherent to our sales cycles could cause significant variability in our revenue and operating results for any particular period.
We have a limited history with our pricing models, and as a result, we may be forced to change the prices we charge for our applications or the pricing models upon which they are based.
We have limited experience with respect to determining the optimal prices and pricing models for certain of our applications and certain geographic markets. As the markets for our applications mature, or as competitors introduce products or services that compete with ours, including bundling competing offerings with additional products or services, we may be unable to attract new customers at the same price or based on the same pricing models as we have used historically. As a result, in the future we may be required to reduce our prices, which could adversely affect our financial performance. In addition, we may offer volume price discounts based on the number of seats purchased by a customer or the number of our applications purchased by a customer, which would effectively reduce the prices we charge for our applications. Also, we may be unable to renew existing customer agreements or enter into new customer agreements at the same prices or upon the same terms that we have historically, which could have a material adverse effect on our financial position.
Any disruption of service at the data centers that house our equipment and deliver our applications or with our hosting service provider could harm our business.
While we procureOur reputation and operate all infrastructure equipment deliveringability to attract, retain, and serve our applications,customer is dependent upon the reliable performance of our computer systems and those of third parties operate the data centers that we use. While we control and have access to our servers and all of the other components of our network that are locatedutilize in our external data centers, we do not control the operation of these data centers and we are therefore vulnerable to disruptions, power outages or other issues the data centers experience. We have experienced and expect that we will in the future experience interruptions, delays and outages in service and availability from time to time.
The owners of our data centers have no obligation to renew their agreements with us on commercially reasonable terms, or at all. If we are unable to renew these agreements on commercially reasonable terms, or if one of our data center operators is acquired, weoperations. These systems may be required to transfer our servers and other infrastructure to new data centers, and we may incur significant costs and possible service interruption in connection with doing so.
Our data centers are vulnerablesubject to damage or interruption from human error, malicious acts, earthquakes, hurricanes, tornadoes, floods, fires, war,adverse weather conditions, other natural disasters, terrorist attacks, power losses, hardware failures, systems failures,loss, telecommunications failures, computer viruses, computer denial of service attacks, or other attempts to harm these systems. Interruptions in these systems, or with the Internet in general, could make our service unavailable or degraded or otherwise hinder our ability to deliver application data to our customers. Service
interruptions, errors in our software, or the unavailability of computer systems used in our operations could diminish the overall attractiveness of our applications to existing and potential customers.
Our servers and those of third parties we use in our operations are vulnerable to computer viruses, physical or electronic break-ins, and similar events. For example, certain ofdisruptions. We have implemented security protocols within our data centersapplications; however, we have no assurance that our systems are located in an area known for seismic activity, increasingcompletely secure. Our insurance does not cover expenses related to disruptions to our susceptibilityservice or unauthorized access to the risk that an earthquake could significantly harm the operations of this facility. The occurrence of a natural disasterour applications. Any significant disruption to our service or an act of terrorism, vandalism or other misconduct, a decisionaccess to close the data centers without adequate notice or other unanticipated problemsour systems could result in lengthy interruptionsa loss of customers and adversely affect our business and results of operation.
We utilize our own communications and computer hardware systems located either in availabilityour facilities or in that of a third-party Web hosting provider. In addition, we utilize third-party hosting services in connection with our business operations and have migrated our applications to Amazon Web Services (AWS), a third-party hosting platform. Problems faced by us or our third-party hosting providers, including technological or business-related disruptions, could adversely impact the experience of our applications.
Any changes in third-party service levels at our data centers or any errors, defects, disruptions or other performance problems with our applications could harm our reputation and may damage our customers’ businesses. Interruptions in availability of our applications might reduce our revenue, cause us to issue credits to customers, subject us to potential liability, and cause customers to terminate their subscriptions or decide not to renew their subscriptions with us.customers.
If we fail to adequately manage our data center or hosting infrastructure capacity, our existing customers may experience service outages, and our new customers may experience delays in the deployment of our applications.
We have experienced significant growth in the number of seats and volume of data that our hosting infrastructure supports. We seek to maintain sufficient excess capacity in our operations infrastructure to meet the needs of all of our customers. We also seek to maintain excess capacity to facilitate the rapid provision of new customer deployments and the expansion of existing customer deployments. However, obtaining new data center infrastructure requires lead time. If we do not accurately predict our infrastructure capacity requirements with sufficient lead time, our customers could experience service impairment that may subject us to financial penalties and liabilities and cause us to lose customers. If our data center infrastructure capacity fails to keep pace with increased subscriptions, customers may experience delays or reductions in the quality of our service as we seek to obtain additional capacity, which could harm our reputation and harm our business. As we add data center or hosting infrastructure capacity and support personnel in advance of anticipated growth, our cost of product revenue will increase, and if the anticipated revenue growth does not occur, our product gross profit will be adversely affected both in terms of absolute dollars and as a percentage of total revenues in any particular quarterly or annual period.
Security breaches may harmActual or perceived security vulnerabilities in our business.solutions and services or cyberattacks on our networks could have a material adverse impact on our business, results of operations and financial condition.
Our applications involve the storage and transmission of our customers’ proprietary and confidential information, including personal or identifying information regarding their employees and customers. Any security breaches, unauthorized access, unauthorized usage, virus, or similar breach or disruption could result in loss of confidential information, damage to our reputation, early termination of our contracts, litigation, regulatory investigations, indemnity obligations, or other liabilities. If our security measures or those of our third-party data centers, such as Amazon Web Services) are breached as a result of third-party action, employee error, malfeasance or otherwise, and, as a result, someone obtainsresulting in unauthorized access to customer data, our reputation will be damaged, our business may suffer, and we could incur significant liability. Unauthorized parties may attempt to misappropriate or compromise our confidential information or that of third parties, create system disruptions, product or service vulnerabilities or cause shutdowns. These perpetrators of cyberattacks also may be able to develop and deploy viruses, worms, malware and other malicious software programs that directly or indirectly attack our products, services or infrastructure (including our third party cloud service providers). Because the techniques used to obtain unauthorized access or sabotage systems change frequently and generally are not identified until they are launched against a target, we may be unable to anticipate these techniques or to implement adequate preventative measures. Any or all of these issues could negatively affect our ability to attract new customers, cause existing customers to elect not to renew or upgrade their subscriptions, result in reputational damage, or subject us to third-party lawsuits, regulatory fines, or other action or liability, which could adversely affect our operating results. In addition, to the extent we are diverting our resources to address and mitigate these vulnerabilities, it may hinder our ability to deliver and support our solutions and customers in a timely manner. Despite our efforts to build secure services, we can make no assurance that we will be able to detect, prevent, timely and adequately address, or mitigate the negative effects of cyberattacks or other security breaches.
Our success depends on our ability to adapt to technological change and continue to innovate.
The overall market for enterprise work management software is rapidly evolving and subject to changing technology, shifting customer needs, and frequent introductions of new applications. Our ability to attract new customers and increase revenue from existing customers will depend, in large part, on our ability to develop or acquire new applications and enhance and improve existing applications. To achieve market acceptance for our applications, we must effectively anticipate and offer applications that meet changing customer demands in a timely manner. Customers may require features and capabilities thatnot offered by our current applications do not have.applications. We may
experience difficulties that could delay or prevent our development, acquisition, or implementation of new applications and enhancements.
If we are unable to successfully develop or acquire new enterprise work management capabilities and functionality, enhance our existing applications to anticipate and meet customer preferences, sell our applications into new markets, or adapt to changing industry standards in enterprise work management, our revenue and results of operations would be adversely affected.
Adverse economic conditions may reduce our customers’ ability to spend money on information technology or enterprise work management software, or our customers may otherwise choose to reduce their spending on information technology or enterprise work management software, which may adversely impact our business.
Our business depends on the overall demand for information technology and enterprise work management software spend and on the economic health of our current and prospective customers. If worldwide economic conditions become unstable, our existing customers and prospective customers may re-evaluate their decision to purchase our applications. Weak global economic conditions or a reduction in information technology or enterprise work management software spending by our customers could harm our business in a number of ways, including longer sales cycles and lower prices for our applications.
We rely on third-party software that is required for the development and deployment of our applications, which may be difficult to obtain or which could cause errors or failures of our applications.
We rely on software licensed from or hosted by third parties to offer our applications. In addition, we may need to obtain licenses from third parties to use intellectual property associated with the development of our applications, which might not be available to us on acceptable terms, or at all. Any loss of the right to use any software required for the development, maintenance, and delivery of our applications could result in delays in the provision of our applications until equivalent technology is either developed by us or, if available, is identified, obtained and integrated, which could harm our business. Any errors or defects in third-party software could result in errors or a failure of our applications, which could harm our business.
If our applications contain serious errors or defects, we may lose revenue and market acceptance, and we may incur costs to defend or settle product liabilityproduct-related claims.
Complex software applications such as ours often contain errors or defects, particularly when first introduced or when new versions or enhancements are released. Our current and future applications may contain serious defects.
Since our customers use our applications for critical business purposes, defects or other performance problems could negatively impact our customers and could result in:
loss or delayed market acceptance and sales;
breach of warranty or product liability claims;other claims for damages;
sales credits or refunds for prepaid amounts related to unused subscription services;
canceled contracts and loss of customers;
diversion of development and customer service resources; and
injury to our reputation.
The costs incurred in correcting any material errors or defects might be substantial and could adversely affect our operating results. Although our customer agreements typically contain provisions designed to limit our exposure
to certain of the claims above, existing or future laws or unfavorable judicial decisions could negate these limitations. Even if not successful, a product liabilitybreach of warranty or other claim brought against us would likely be a distraction to management, time-consuming and costly to resolve, and could seriously damage our reputation in the marketplace, making it harder for us to sell our applications. Additionally, our errors and omissions insurance may be inadequate or may not be available in the future on acceptable terms, or at all, and our policy may not cover all claims made against us andus. Further, defending a suit, regardless of its merit, could be costly and divert management’s attention.
If we fail to integrate our applications with other software applications and competitive or adjacent offerings that are developed by others, or fail to make our applications available on mobile and other handheld devices, our applications may become less marketable, less competitive or obsolete, and our operating results could be harmed.
Our applications integrate with a variety of other software applications, and also with competing and adjacent third-party offerings, and weofferings. We need to continuously modify and enhance our platform to adapt to changes in cloud-enabled hardware, software, networking, browser and database technologies. Any failure of our applications to integrate effectively with other software applications and product offerings could reduce the demand for our applications or result in customer dissatisfaction and harm to our business. If we are unable to respond to changes in the applications and tools with which our applications integrate in a cost-effective manner, our applications may become less marketable, less competitive, or obsolete. Competitors may also impede our attempts to create integration between our applications and competitive offerings, which may decrease demand for our applications. In addition, an increasing number of individuals within organizations are utilizing devices other than personal computers, such as mobile phones, tablets and other handheld devices, to access the Internet and corporate resources and to conduct business. If we cannot effectively make our applications available on these devices, we may experience difficulty attracting and retaining customers.
If we fail to develop and maintain relationships with third parties, our business may be harmed.
Our business depends in part on the development and maintenance of technology integration, joint sales, and reseller relationships. Maintaining relationships with third parties requires significant time and resources, as does integrating third-party content and technology. Further, third parties may not perform as expected under any relationships thatinto which we may enter, into, and we may have disagreements or disputes with third parties that could negatively affect our brandsbrand and reputation. If we are unsuccessful in establishing or maintaining relationships with third parties, our ability to compete in the marketplace or to grow our revenue could be impaired, and our operating results could suffer.
Our use of open source software could negatively affect our ability to sell our applications and subject us to possible litigation.
A portion of our applications incorporate open source software, and we expect to continue to incorporate open source software in the future. Few of the licenses applicable to open source software have been interpreted by courts, and their application to the open source software integrated into our proprietary software may be uncertain. Moreover, we cannot provide any assurance that we have not incorporated additional open source software in our applications in a manner that is inconsistent with the terms of the license or our current policies and procedures. If we fail to comply with these licenses, we may be subject to certain requirements, including requirements that we offer our applications that incorporate the open source software for no cost, that we make available source code for modifications or derivative works we create based upon, incorporating or using the open source software, and that we license such modifications or derivative works under the terms of applicable open source licenses. If an author or other third party that distributes such open source software were to allege that we had not complied with the conditions of one or more of these licenses, we could be required to incur significant legal expenses defending against such allegations and could be subject to significant damages, enjoined from the sale of our applications that contained the open source software, and required to comply with the foregoing conditions, which could disrupt the distribution and sale of some of our applications. In addition, there have been claims challenging the ownership of open source software against companies that incorporate open source software into their products. As a result, we could be subject to suits by parties claiming infringement due to the reliance by our applications on certain open source software. Litigation could be costly for us to defend, have a negative effect on our operating results and
financial condition, or require us to devote additional research and development resources to change our applications.
Certain of our operating results and financial metrics are difficult to predict as a result of seasonality.
We have historically experienced seasonality in terms of when we enter into customer agreements. We sign a significantly higher percentage of agreements with new customers, and renew agreements with existing customers, in the fourth quarter of each calendar year as our customers tend to follow budgeting cycles at the end of the calendar year. Our cash flow from operations has historically been higher in the first quarter of each calendar year than in other quarters. This seasonality is reflected to a much lesser extent, and sometimes is not immediately apparent, in our revenue, due to the fact that we defer revenue recognition. In addition, seasonality may be difficult
to observe in our financial results during periods in which we acquire businesses, as such results typically are most significantly impacted by such acquisitions. We expect this seasonality to continue, or possibly increase in the future, which may cause fluctuations in our operating results and financial metrics. If our quarterly operating results or outlook fall below the expectations of research analysts or investors, the price of our common stock could decline substantially.
We could incur substantial costs as a result of any claim of infringement of another party’s intellectual property rights.
In recent years, there has been significant litigation involving patents and other intellectual property rights in our industry. Companies providing software are increasingly bringing and becoming subject to suits alleging infringement of proprietary rights, particularly patent rights, and to the extent we gain greater market visibility, we face a higher risk of being the subject of intellectual property infringement claims. We do not have a significant patent portfolio, which could prevent us from deterring patent infringement claims through our own patent portfolio, and our competitors and others may now and in the future have significantly larger and more mature patent portfolios than we have. The risk of patent litigation has been amplified by the increase in the number of a type of patent holder, which we refer to as a non-practicing entity, whose sole business is to assert such claims and against whom our own intellectual property portfolio may provide little deterrent value. We could incur substantial costs in prosecuting or defending any intellectual property litigation. If we sue to enforce our rights or are sued by a third-party that claims that our applications infringe its rights, the litigation could be expensive and could divert our management resources. Moreover, our acquisition strategy could expose us to additional risk of intellectual property litigation as we acquire new businesses with diverse software offerings and intellectual property assets.
In addition, in most instances, we have agreed to indemnify our customers against claims that our applications infringe the intellectual property rights of third parties. Our business could be adversely affected by any significant disputes between us and our customers as to the applicability or scope of our indemnification obligations to them. Any intellectual property litigation to which we might become a party, or for which we are required to provide indemnification, may require us to do one or more of the following:
cease selling or using applications that incorporate the intellectual property that we allegedly infringe;
make substantial payments for legal fees, settlement payments or other costs or damages;
obtain a license, which may not be available on reasonable terms or at all, to sell or use the relevant technology; or
redesign the allegedly infringing applications to avoid infringement, which could be costly, time-consuming or impossible.
If we are required to make substantial payments or undertake any of the other actions noted above as a result of any intellectual property infringement claims against us or any obligation to indemnify our customers for such claims, such payments or actions could harm our business.
We could incur substantial costs in protecting our intellectual property from infringement, and any failure to protect our intellectual property could impair our business.
Our success and ability to compete depend, in part, upon our intellectual property. We seek to protect the source code for our proprietary software and other proprietary technology and information under a combination of copyright, trade secrets, and patent law, and we seek to protect our brands through trademark law. Our policy is to
enter into confidentiality agreements, or agreements with confidentiality provisions, with our employees, consultants, vendors, and customers, and to control access to our software, documentation, and other proprietary information. Despite these precautions, it may be possible for unauthorized parties to copy our software or other proprietary technology or information, or to develop similar software independently.
Despite our efforts to protect our proprietary rights, unauthorized parties may attempt to copy aspects of our applications or to obtain and use information that we regard as proprietary. Policing unauthorized use of our applications is difficult, and we are unable to determine the extent to which piracy of our software exists or will occur in the future. Litigation may be necessary in the future to enforce our intellectual property rights, protect our trade secrets, determine the validity and scope of the proprietary rights of others, or defend against claims of infringement or invalidity. Such litigation could be costly, time-consuming, and distracting to management, result in
a diversion of resources or the narrowing or invalidation of portions of our intellectual property, and have a material adverse effect on our business, operating results, and financial condition. Furthermore, our efforts to enforce our intellectual property rights may be met with defenses, counterclaims, and countersuits attacking the validity and enforceability of our intellectual property rights or alleging that we infringe the counterclaimant’s own intellectual property. These steps may be inadequate to protect our intellectual property. Third parties may challenge the validity or ownership of our intellectual property, and these challenges could cause us to lose our rights, in whole or in part, to such intellectual property or narrow its scope such that it no longer provides meaningful protection. We will not be able to protect our intellectual property if we are unable to enforce our rights or if we do not detect unauthorized use of our intellectual property. Despite our precautions, it may be possible for unauthorized third parties to copy our products and use information that we regard as proprietary to create products and services that compete with ours. Some license provisions protecting against unauthorized use, copying, transfer, and disclosure of our applications may be unenforceable under the laws of certain jurisdictions and foreign countries. Further, the laws of some countries do not protect proprietary rights to the same extent as the laws of the United States. To the extent we expand our international activities, our exposure to unauthorized copying, transfer, and use of our applications and proprietary technology or information may increase.
There can be no assurance that our means of protecting our proprietary rights will be adequate or that our competitors will not independently develop similar technology. If we fail to meaningfully protect our intellectual property, our business, brands, operating results and financial condition could be materially harmed.
Unanticipated changes in our effective tax rate or challenges by tax authorities could harm our future results.
We are subject to income taxes in the United States and various non-U.S. jurisdictions. Our effective tax rate could be adversely affected by changes in the allocation of our pre-tax earnings and losses among countries with differing statutory tax rates, in certain non-deductible expenses as a result of acquisitions, in the valuation of our deferred tax assets and liabilities, or in federal, state, local or non-U.S. tax laws and accounting principles, including increased tax rates, new tax laws or revised interpretations of existing tax laws and precedents. In particular, the United States is currently considering various changes to the U.S. taxation of international business activities, which, if enacted, could impact the U.S. taxation of our non-U.S. earnings as well as our cash maintained outside the United States. Increases in our effective tax rate would adversely affect our operating results.
In addition, weWe may be subject to income tax audits by various tax jurisdictions throughout the world, many of which have not established clear guidance on the tax treatment of cloud-based companies. The application of tax laws in such jurisdictions may be subject to diverging and sometimes conflicting interpretations by tax authorities in these jurisdictions. Although we believe our income tax liabilities are reasonably estimated and accounted for in accordance with applicable laws and principles, an adverse resolution of one or more uncertain tax positions in any period could have a material impact on the results of operations for that period.
Taxing authorities may successfully assert that we should have collected or, in the future, should collect additional sales and use taxes, and we could be subject to liability with respect to past or future sales, which could adversely affect our results of operations.
We have not historically filed sales and use tax returns or collected sales and use taxes in all jurisdictions in which we have sales, based on our belief that such taxes are not applicable. Taxing authorities may seek to impose such taxes on us, including for past sales, which could result in penalties and interest. Any such tax assessments may adversely affect the results of our operations.
Taxing authorities could reallocate our taxable income among our subsidiaries, which could increase our consolidated tax liability.
We conduct integrated operations internationally through subsidiaries in various tax jurisdictions pursuant to transfer pricing arrangements between our subsidiaries and between our subsidiaries and us. If two or more affiliated companies are located in different countries, the tax laws or regulations of each country generally require that transfer prices be the same as those between unrelated companies dealing at arms’ length and that contemporaneous
documentation is maintained to support the transfer prices. While we believe that we operate in compliance with applicable transfer pricing laws and intend to continue to do so, our transfer pricing procedures are not binding on applicable tax authorities. If tax authorities in any of these countries were to successfully challenge
our transfer prices as not reflecting arms’ length transactions, they could require us to adjust our transfer prices and thereby reallocate our income to reflect these revised transfer prices, which could result in a higher tax liability to us. Such reallocations may subject us to interest and penalties that would increase our consolidated tax liability, and could adversely affect our financial condition, results of operations, and cash flows.
Our ability to use our net operating loss carryforwards and certain other tax attributes may be limited.
As of December 31, 2015,2018, we had federal net operating loss carryforwards of approximately $70$204.8 million and research and development credit carryforwards of approximately $1.2$3.5 million, which begin expiring in 2017.2019. Under Sections 382 and 383 of the Internal Revenue Code of 1986, as amended, or the Code, if a corporation undergoes an “ownership change,” the corporation’s ability to use its pre-change net operating loss carryforwards and other pre- change tax attributes, such as research tax credits, to offset its post-change income and taxes may be limited. In general, an “ownership change” occurs if there is a cumulative change in our ownership by “5% shareholders” that exceeds 50 percentage points over a rolling three-year period. Similar rules apply under state tax laws. Based on analysis of acquired net operating losses and credits, utilization of our net operating losses and research and development credits will be subject to annual limitations. The annual limitation will result in the expiration of $16.2$82.6 million of federal net operating losses and $0.8$3.5 million of research and development credit carryforwards before utilization. In the event that it is determined that we have in the past experienced additional ownership changes, or if we experience one or more ownership changes as a result of future transactions in our stock, then we may be further limited in our ability to use our net operating loss carryforwards and other tax assets to reduce taxes owed on the net taxable income that we earn. Any such limitations on the ability to use our net operating loss carryforwards and other tax assets could adversely impact our business, financial condition, and operating results. As of December 31, 2018 we also had foreign net operating loss carryforwards of approximately $24.8 million, which carry forward indefinitely.
Changes in laws or regulations related to the Internet may diminish the demand for our applications, and any failure of the Internet infrastructure could have a negative impact on our business.
We deliver our cloud-based applications through the Internet. Federal, state or foreign government bodies or agencies have in the past adopted, and may in the future adopt, laws or regulations affecting data privacy and the use of the Internet. In addition, government agencies or private organizations may begin to impose taxes, fees, or other charges for accessing the Internet or on commerce conducted via the Internet. Increased enforcement of existing laws and regulations, as well as any laws, regulations, or changes that may be adopted or implemented in the future, could limit the growth of the use of cloud-based applications or communications generally, result in a decline in the use of the Internet and the viability of cloud-based applications such as ours, and reduce the demand for our applications.
The success of our enterprise work management software applications depends on the development and maintenance of the Internet infrastructure. This includes maintenance of a reliable network backbone with the necessary speed, data capacity and security, as well as the timely development of complementary products for providing reliable Internet access and services. The Internet has experienced, and is likely to continue to experience, significant growth in the amount of traffic and may be unable to support such demands. In addition, problems caused by viruses, worms, malware, and similar programs may harm the performance of the Internet. Any outages and delays in the Internet could reduce the level of usage of our services, which could materially adversely affect our business, financial condition, results of operations, and prospects.
Privacy concerns and laws or other domestic or foreign regulations may reduce the effectiveness of our applications and adversely affect our business.
Our customers can use our applications to collect, use, and store personal or identifying information regarding their customers and employees. Federal, state and foreign government bodies and agencies have adopted, are considering adopting, or may adopt laws and regulations regarding the collection, use, storage, and disclosure of personal information obtained from individuals. The costs of compliance with, and other burdens imposed by, such laws and regulations that are applicable to the businesses of our customers may limit the use and adoption of our
applications and reduce overall demand, or lead to significant fines, penalties or liabilities for any noncompliance with such privacy laws. For example, the European Union and many countries in Europe have stringent privacy laws and regulations that may impact our ability to profitably operate in certain European countries. Furthermore, privacy concerns may cause our customers to resist providing the personal data necessary to allow them to use our applications effectively. Even the perception of privacy concerns, whether or not valid, may inhibit market adoption
of our applications in certain industries. All of these domestic and international legislative and regulatory initiatives may adversely affect our customers’ ability to process, handle, store, use, and transmit demographic and personal information from their customers and employees, which could reduce demand for our applications.
In addition to government activity, privacy advocacy groups and the technology and other industries are considering various new, additional, or different self-regulatory standards that may place additional burdens on us. If the processing of personal information were to be curtailed in this manner, our applications would be less effective, which may reduce demand for our applications and adversely affect our business.
We are subject to governmental export and import controls that could impair our ability to compete in international markets due to licensing requirements and subject us to liability if we are not in compliance with applicable laws.
Our applications are subject to export control and import laws and regulations, including the U.S. Export Administration Regulations, U.S. Customs regulations, and various economic and trade sanctions regulations administered by the U.S. Treasury Department’s Office of Foreign Assets Controls. Exports of our applications must be made in compliance with these laws and regulations. If we fail to comply with these laws and regulations, we and certain of our employees could be subject to substantial civil or criminal penalties, including: the possible loss of export or import privileges; fines, which may be imposed on us and responsible employees or managers; and, in extreme cases, the incarceration of responsible employees or managers. Obtaining the necessary authorizations, including any required license, for a particular sale may be time-consuming, is not guaranteed, and may result in the delay or loss of sales opportunities. In addition, changes in our applications or changes in applicable export or import regulations may create delays in the introduction and sale of our applications in international markets, prevent our customers with international operations from deploying our applications, or, in some cases, prevent the export or import of our applications to certain countries, governments, or persons altogether. Any change in export or import regulations, shift in the enforcement or scope of existing regulations, or change in the countries, governments, persons or technologies targeted by such regulations, could also result in decreased use of our applications, or in our decreased ability to export or sell our applications to existing or potential customers with international operations. Any decreased use of our applications or limitation on our ability to export or sell our applications would likely adversely affect our business.
Furthermore, we incorporate encryption technology into certain of our applications. Various countries regulate the import of certain encryption technology, including through import permitting and licensing requirements, and have enacted laws that could limit our ability to distribute our applications or could limit our customers’ ability to implement our applications in those countries. Encrypted applications and the underlying technology may also be subject to export control restrictions. Governmental regulation of encryption technology and regulation of imports or exports of encryption products, or our failure to obtain required import or export approval for our applications, when applicable, could harm our international sales and adversely affect our revenue. Compliance with applicable regulatory requirements regarding the export of our applications, including with respect to new releases of our applications, may create delays in the introduction of our applications in international markets, prevent our customers with international operations from deploying our applications throughout their globally-distributed systems or, in some cases, prevent the export of our applications to some countries altogether.
Moreover, U.S. export control laws and economic sanctions programs prohibit the shipment of certain products and services to countries, governments, and persons that are subject to U.S. economic embargoes and trade sanctions. Even though we take precautions to prevent our applications from being shipped or provided to U.S. sanctions targets, our applications and services could be shipped to those targets or provided by third parties despite such precautions. Any such shipment could have negative consequences, including government investigations, penalties and reputational harm.
If we are unable to implement and maintain effective internal controls over financial reporting in the future, investors may lose confidence in the accuracy and completeness of our financial reports, and the market price of our common stock may be negatively affected.
As a public company, we are required to maintain internal controls over financial reporting and to report any material weaknesses in such internal controls. Section 404 of the Sarbanes-Oxley Act requires that we evaluate
and determine the effectiveness of our internal controls over financial reporting. Our independent registered public accounting firm will not be required to formally attest to the effectiveness of our internal control over financial reporting until the later of our second annual report or the first annual report required to be filed with the SEC following the date we are no longer an “emerging growth company” as defined in the JOBS Act. If we have a material weakness in our internal controls over financial reporting, we may not detect errors on a timely basis, and our financial statements may be materially misstated. We are in the process of designing and implementing the internal controls over financial reporting required to comply with this obligation, which process will be time consuming, costly and complicated. We may need additional finance and accounting personnel with certain skill sets to assist us with the reporting requirements we will encounter as a public company and to support our anticipated growth. In addition, implementing internal controls may distract our officers and employees, entail substantial costs to modify our existing processes, and take significant time to complete.
In the future, if we identify material weaknesses in our internal controls over financial reporting, if we are unable to comply with the requirements of Section 404 of the Sarbanes-Oxley Act in a timely manner, if we are unable to assert that our internal controls over financial reporting are effective, or if our independent registered public accounting firm is not required to express an opinion due to the provisions of the JOBS Act or is unable to express an opinion as to the effectiveness of our internal controls over financial reporting, investors may lose confidence in the accuracy and completeness of our financial reports andreports; the market price of our common stock could be negatively affected,affected; and we could become subject to investigations by the stock exchange on which our securities are listed, the Securities and Exchange Commission or the SEC,(SEC), or other regulatory authorities, which could require additional financial and management resources.
We will incur increasedsignificant costs and demands upon management as a result of complying with the laws and regulations affecting public companies, which could harm our operating results.
As a public company, we will incur significant legal, accounting, investor relations, and other expenses, that we did not incur as a private company, including costs associated with public company reporting requirements. We also have incurred and will incur costs associated with current corporate governance requirements, including requirements under Section 404 and other provisions of the Sarbanes-Oxley Act, as well as rules implemented by the SEC and the exchange on which we list our common stock. We expect theseThese rules and regulations tomay substantially increase our legal and financial compliance costs and to make some activities more time-consuming and costly. We are unable to currently estimate these costs with any degree of certainty. We also expect that, asAs a public company, it will beis more difficult and more expensive for us to obtain director and officer liability insurance, and we may be required to incur substantially higher costs to obtain coverage or to accept reduced policy limits and coverage. As a result, it may be more difficult for us to attract and retain qualified individuals to serve on our board of directors or as our executive officers.
We are an “emerging growth company,” and any decision on our part to comply with certain reduced disclosure requirements applicable to emerging growth companies could make our common stock less attractive to investors.
We are an “emerging growth company,” as defined in the JOBS Act and, for as long as we continue to be an emerging growth company, we may choose to take advantage of certain exemptions from various reporting requirements applicable to other public companies including, but not limited to: not being required to have our internal control over financial reporting audited by our independent registered public accounting firm pursuant to Section 404 of the Sarbanes-Oxley Act; reduced disclosure obligations regarding executive compensation in our periodic reports and proxy statements; and exemptions from the requirements to hold a nonbinding advisory vote on executive compensation and to obtain stockholder approval of any golden parachute payments not previously approved. We may take advantage of these provisions for up to five years oruntil such earlier time that we are no longer an “emerging growth company.” We will remain an “emerging growth company” for up to five years, although, we would cease to be an “emerging growth company” upon the earliest of the first fiscal year following the fifth anniversary of the consummation of our initial public offering; the first fiscal year after our annual gross revenue is $1 billionDecember 31, 2019 or more; the date on which we have, during the previous three-year period, issued more than $1 billion in non-convertible debt securities; or the date on which we are deemed to be a “large accelerated filer” as defined in the Securities Exchange Act of 1934, or the Exchange Act.securities. To the extent we take advantage of any of these reduced reporting burdens in this Annual Report or in future filings, the information that we provide our security holders may be different than you might get from other
public companies in which you hold equity interests. We cannot predict if
investors will find our common stock less attractive because we may rely on these exemptions. If some investors find our common stock less attractive as a result, there may be a less active trading market for our common stock, and our stock price may be more volatile.
Under Section 107(b) of the JOBS Act, emerging growth companies can delay adopting new or revised accounting standards until such time as those standards apply to private companies. We are choosing to “opt out” of such extended transition period, however, and as a result, we will comply with new or revised accounting standards on the relevant dates on which adoption of such standards is required for non-emerging growth companies. Section 107 of the JOBS Act provides that our decision to opt out of the extended transition period for complying with new or revised accounting standards is irrevocable. The requirements of being a public company may strain our resources and divert management’s attentionattention.
The uncertainty surrounding the implementation and effect of Brexit may cause increased economic volatility, affecting our operations and business.
On June 23, 2016, voters in the United Kingdom (“UK”) approved an advisory referendum to withdraw from membership in the European Union (“E.U.”), this proposed exit (referred to as Brexit) could cause disruptions to, and create uncertainty surrounding, our business in the UK and E.U., including affecting our relationships with our existing and future customers, suppliers and employees. As a result, Brexit could have an adverse effect on our future business, financial results and operations. The formal process for the UK leaving the E.U. began in March 2017, when the UK served notice to the European Council under Article 50 of the Treaty of Lisbon. The long-term nature of the UK’s relationship with the E.U. is unclear and there is considerable uncertainty as to when any relationship will be agreed upon and implemented. The announcement of Brexit has resulted in significant volatility in global stock market and currency exchange rate fluctuations that resulted in strengthening of the U.S. dollar relative to other foreign currencies in which we conduct business. The political and economic instability created by Brexit has caused and may continue to cause significant volatility in global financial markets and uncertainty regarding the regulation of data protection in the UK. Brexit could also have the effect of disrupting the free movement of goods, services, and people between the UK, the E.U., and elsewhere. The effects of Brexit will depend on any agreements the UK makes to retain access to E.U. markets either during a transitional period or more permanently. Brexit could lead to legal uncertainty and potentially divergent national laws and regulations as the UK determines which E.U. laws to replace or replicate. Further, uncertainty around these and related issues could lead to adverse effects on the economy of the UK and the other economies in which we operate. There can be no assurance that any or all of these events will not have a material adverse effect on our business operations, results of operations and financial condition.
Risks Related to Ownership of Our Common Stock
The market price of our common stock may be volatile, which could result in substantial losses for investors.
The market price of our common stock could be subject to significant fluctuations. Some of the factors that may cause the market price of our common stock to fluctuate include:
actual or anticipated changes in the estimates of our operating results that we provide to the public, our failure to meet these projections or changes in recommendations by securities analysts that elect to follow our common stock;
price and volume fluctuations in the overall equity markets from time to time;
significant volatility in the market price and trading volume of comparable companies;
changes in the market perception of enterprise work management software generally or in the effectiveness of our applications in particular;
disruptions in our services due to computer hardware, software or network problems;
announcements of technological innovations, new products, strategic alliances or significant agreements by us or by our competitors;
announcements of new customer agreements or upgrades and customer downgrades or cancellations or delays in customer purchases;
litigation involving us;
our ability to successfully consummate and integrate acquisitions;
investors’ general perception of us;
recruitment or departure of key personnel;
sales of our common stock by us or our stockholders;
fluctuations in the trading volume of our shares or the size of our public float; and
general economic, legal, industry and market conditions and trends unrelated to our performance.
In the past, following periods of volatility in the market price of a company’s securities, securities class action litigation has often been brought against that company. Because of the potential volatility of our stock price, we may become the target of securities litigation in the future. If we were to become involved in securities litigation, it could result in substantial costs, divert management’s attention and resources from our business and adversely affect our business.
If securities or industry analysts do not publish, or cease publishing, research or reports about us, our business or our market, if they publish negative evaluations of our stock, or if we fail to meet the expectations of analysts, the price of our stock and trading volume could decline.
The trading market for our common stock will be influenced by the research and reports that industry or securities analysts may publish about us, our business, our market or our competitors. If few analysts commence coverage of us, the trading price of our stock would likely decrease if one or more of the analysts covering our business downgrade their evaluation of our stock, the price of our stock could decline. If one or more of these analysts cease to cover our stock, we could lose visibility in the market for our stock, which in turn could cause our stock price to decline. Furthermore, if our operating results fail to meet analysts’ expectations our stock price would likely decline.
Sales of a substantial number of shares of our common stock in the public market by our existing stockholders could cause our stock price to fall.
The price of our common stock could decline if there are substantial sales of our common stock in the public stock market. CertainOn December 12, 2018, we filed a shelf registration statement on Form S-3. If we sell a significant amount of stock at one time, our stockholders have rights, subject to some conditions, to require us to file registration statements covering up to 6,834,476 shares or to includestock price could be negatively impacted by such shares in registration statements that we may file for ourselves or other stockholders.sale. We also have registered shares of common stock that we may issue under our stock-based compensation plans, which can be freely sold in the public market upon issuance, subjectissuance. Our 2014 Equity Incentive Plan provides for automatic increases to the lock-up agreementsnumber of shares available for issuance thereunder and the restrictions imposedwe undertake each year to add those shares to a registration statement on Form S-8. These increases could have a negative effect on our affiliates under Rule 144 understock price as the Securities Act.holders of such shares elect to sell their shares.
Our existing directors, executive officers and principal stockholders have substantial control over us, which could limit your ability to influence the outcome of key transactions, including a change of control.
As of December 31, 2015,2018, our directors, executive officers, principal stockholders and their affiliates beneficially owned or controlled, directly or indirectly, a majority of our outstanding common stock. As a result, these stockholders, acting together, could have significant influence over the outcome of matters submitted to our stockholders for approval, including the election or removal of directors, any amendments to our certificate of incorporation or bylaws and any merger, consolidation or sale of all or substantially all of our assets, and over the management and affairs of our company. This concentration of ownership may also have the effect of delaying or preventing a change in control of our company or discouraging others from making tender offers for our shares and might affect the market price of our common stock.
Because we do not expect to pay any dividends on our common stock for the foreseeable future, our investors may never receive a return on their investment.
We do not anticipate that we will pay any cash dividends to holders of our common stock in the foreseeable future. Instead, we plan to retain any earnings to maintain and expand our existing operations. In addition, our ability to pay cash dividends is currently limited by the terms of our existing loan facility, which prohibits our payment of dividends on our capital stock without prior consent, and any future credit facility may contain terms prohibiting or limiting the amount of dividends that may be declared or paid on our common stock. Accordingly,
investors must rely on sales of their common stock after price appreciation, which may never occur, as the only way to realize any return on their investment.
Anti-takeover provisions in our amended and restated certificate of incorporation and our amended and restated bylaws, as well as provisions of Delaware law, might discourage, delay or prevent a change in control of our company or changes in our board of directors or management and, therefore, depress the trading price of our common stock.
Provisions in our certificate of incorporation and bylaws, as amended and restated, , will contain provisions that may depress the market price of our common stock by acting to discourage, delay or prevent a merger, acquisition or other change in control that stockholders may consider favorable, including transactions in which you might otherwise receive a premium for your shares of our common stock. These provisions may also prevent or frustrate attempts by our stockholders to replace or remove members of our board of directors or our management. These provisions include the following:
our certificate of incorporation provides for a classified board of directors with staggered three-year terms so that not all members of our board of directors are elected at one time;
directors may be removed by stockholders only for cause;
our board of directors has the right to elect directors to fill a vacancy created by the expansion of the board of directors or the resignation, death or removal of a director, which prevents stockholders from being able to fill vacancies on our board of directors;
special meetings of our stockholders may be called only by our Chief Executive Officer, our board of directors or holders of not less than the majority of our issued and outstanding capital stock limiting the ability of minority stockholders to take certain actions without an annual meeting of stockholders;
our stockholders may not act by written consent unless the action to be effected and the taking of such action by written consent are approved in advance by our board of directors and, as a result, a holder, or holders, controlling a majority of our capital stock would generally not be able to take certain actions without holding a stockholders’ meeting;
our certificate of incorporation prohibits cumulative voting in the election of directors. This limits the ability of minority stockholders to elect director candidates;
stockholders must provide timely notice to nominate individuals for election to the board of directors or to propose matters that can be acted upon at an annual meeting of stockholders and, as a result, these provisions may discourage or deter a potential acquirer from conducting a solicitation of proxies to elect the acquirer’s own slate of directors or otherwise attempting to obtain control of us; and
our board of directors may issue, without stockholder approval, shares of undesignated preferred stock, making it possible for our board of directors to issue preferred stock with voting or other rights or preferences that could impede the success of any attempt to acquire us.
As a Delaware corporation, we are also subject to provisions of Delaware law, including Section 203 of the Delaware General Corporation Law, which limits the ability of stockholders owning in excess of 15% of our outstanding voting stock from engaging in certain business combinations with us.
Any provision of our certificate of incorporation and bylaws or Delaware law that has the effect of delaying or deterring a change in control could limit the opportunity for our stockholders to receive a premium for their shares of our common stock and could also affect the price that some investors are willing to pay for our common stock. The existence of the foregoing provisions and anti-takeover measures could limit the price that investors might be willing to pay in the future for shares of our common stock. They could also deter potential acquirers of our company, thereby reducing the likelihood that you could receive a premium for your common stock in an acquisition.
| |
| Item 1B. | Unresolved Staff Comments |
None.
Our principal corporate offices are located in Austin, Texas, where we occupy approximately 9,8969,900 square feet of space under a subleaselease that expires in March 2020. We occupy additional leased facilities for operations of approximately 16,987 square feet in Montreal, Quebec; approximately 22,950 square feet in Lincoln, Nebraska; approximately 9,645 square feet in Carlsbad, California; approximately 7,740 square feet in San Francisco, California; and approximately 7,488 square feet in Toronto, Ontario.
June 2025. We also occupy additional leasedlease office facilities of less than 5,000 square feet each for operationsdomestically located in Medford, Massachusetts; Iselin,California, Massachusetts, Nebraska, New Jersey; Brooklyn, New York; Cupertino, California;Jersey and London, England.Ohio. Internationally we lease office space in Australia, Canada, Ireland, Israel and the United Kingdom. We believe that our facilitiesproperties are adequategenerally suitable to meet our needs for our current needs andthe foreseeable future. In addition, to the extent we require additional space in the future, we believe that suitable additional or substitute space willit would be readily available as needed to accommodate planned expansion of our operations. on commercially reasonable terms.
Item 3. Legal Proceedings
From time to time, we may become involved in legal proceedings arising in the ordinary course of our business. We are not presently a party to any legal proceedings that we believe would, individually or taken together, have a material adverse effect on our business, operating results, financial condition, or cash flows.
| |
| Item 4. | Mine Safety Disclosures |
Not applicable.
PART II
Item 5. Market for Registrant’s Common Equity, Related Stockholder Matters and Issuer Purchases of Equity Securities
Market Information
Our common stock is traded on the NASDAQ Global Market, or NASDAQ,Nasdaq, under the symbol “UPLD”.
OnAs of March 24, 2016,1, 2019, the last reported sales price of our common stock on the Nasdaq Global Market was $35.28 and there were 72 holders39 stockholders of record of our common stock. Because many of ourstock, including Broadridge, which holds shares of common stock are held by brokers and other institutions on behalf of stockholders, this number is not indicative of the total number of stockholders represented by these stockholders of record.
The table below sets forth the high and low sales prices per share of our common stock as reported on the NASDAQ for the periods indicated:
|
| | | |
| | Sales Price Per Share |
| Year Ended December 31, 2015 | Low | | High |
| Fourth quarter | $6.77 | | $8.12 |
| Third Quarter | $7.59 | | $9.18 |
| Second Quarter | $5.91 | | $9.22 |
| First Quarter | $6.81 | | $10.05 |
| Fourth quarter (from November 6, 2014) | $8.60 | | $12.20 |
We have never declared or paid dividends on our common stock. We do not expect to pay dividends on our common stock for the foreseeable future. Instead, we anticipate that all of our earnings will be used for the operation and growth of our business. Any future determination to declare cash dividends would be subject to the discretion of our board of directors and would depend upon various factors, including our results of operations, financial condition and liquidity requirements, restrictions that may be imposed by applicable law and our contracts, and other factors deemed relevant by our board of directors. In addition, the terms of our loan facility currently restrict our ability to pay dividends.
Performance Graph
Notwithstanding any statement to the contrary in any of our filings with the SEC, the following information shall not be deemed “filed” with the SEC or “soliciting material” under the Securities Exchange Act of 1934 and shall not be incorporated by reference into any such filings irrespective of any general incorporation language contained in such filing.
The following graph compares the total cumulative stockholder return on our common stock with the total cumulative return of the NASDAQNasdaq Computer Technology Index (the “Computer Technology Index”) and the S&P 500 Composite Index during the period commencing on November 6, 2014, the initial trading day of our common stock, and ending on December 31, 2015.2018. The graph assumes a $100 investment at the beginning of the period in our common stock, the stocks represented in the S&P 500 Composite Index and the stocks represented in NASDAQ Computer Technology Index, and reinvestment of any dividends. The Computer Technology Index is designed to represent a cross section of widely-held U.S. corporations involved in various phases of the computer industry. The Computer Technology Index is market-value (capitalization) weighted, based on the aggregate market value of its 27 component stocks. Historical stock price performance should not be relied upon as an indication of future stock price performance.
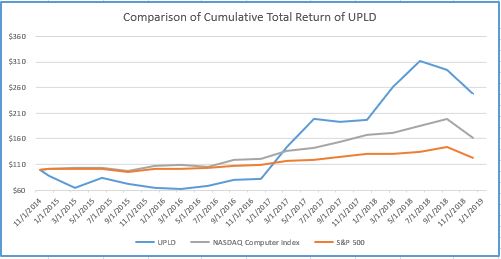
Recent Sales of Unregistered Securities
As previously disclosed, onIn November 13, 2015,2016, the Company acquired all outstandingissued 24,587 shares of Ultriva, Inc.,common stock valued at approximately $200,000 as a cloud-based supply chain work management software provider. The purchase price consideration included approximately 179,000 sharesresult of the Company’s common stock and up to an additional $0.2 millionescrow release in shares are being held for 12 months by us as security for indemnification claims. Such issuance was made pursuant to an exemption under Regulation D, as promulgated underconnection with the Securities Act.
acquisition of Ultriva, Inc.
Issuer Purchases of Equity Securities
None.
Equity Compensation Plan Information
For information regarding securities authorized for issuance under equity compensation plans, see Part III, Item 12 of this Annual Report on Form 10-K.
| |
| Item 6. | Selected Financial Data |
The following selected historical consolidated financial data below should be read in conjunction with Item 7: “Management’s Discussion and Analysis of Financial Condition and Results of Operations,” our consolidated financial statements and the related notes appearing in Item 8: “Financial Statements and Supplementary Data” of this Annual Report on Form 10-K to fully understand factors that may affect the comparability of the information presented below.
The consolidated statements of operations data for the years ended December 31, 2015, 2014,2018, 2017, and 20132016 and the selected consolidated balance sheet data as of December 31, 20152018 and 2014December 31, 2017 are derived from our audited consolidated financial statements appearing in Item 8: “Financial Statements and Supplementary Data” of this Annual Report on Form 10-K. The statement of operations data for the yearyears ended December 31, 20122015 and 2014 and the selected consolidated balance sheet data as of December 31, 20132016, 2015, and 20122014 are derived from our consolidated financial statements not included in this Annual Report on Form 10-K. To obtain further information about our historical results, including our historical acquisitions, for which results of operations are included in our
consolidated financial statements beginning on the dates of acquisition, you should read the following selected consolidated financial data in conjunction with our consolidated financial statements and related notes, the information in the section of this filing titled “Management’s Discussion and Analysis of Financial Condition and Results of Operations” and the other financial information included elsewhere in this filing. Our historical results are not necessarily indicative of the results to be expected in the future, and our interim results are not necessarily indicative of the results to be expected in the future.
|
| | | | | | | | | | | | | | | |
| | Year Ended December 31, |
| | 2015 | | 2014 | | 2013 | | 2012 |
| | (dollars in thousands, except share and per share data) |
| Consolidated Statements of Operations Data: |
| Revenue: | | | | | |
| Subscription and support | $ | 57,193 |
| | $ | 48,625 |
| | $ | 30,887 |
| | $ | 18,281 |
|
| Perpetual license | 2,805 |
| | 2,787 |
| | 2,003 |
| | 641 |
|
| Total product revenue | 59,998 |
| | 51,412 |
| | 32,890 |
| | 18,922 |
|
| Professional services | 9,913 |
| | 13,162 |
| | 8,303 |
| | 3,841 |
|
| Total revenue | 69,911 |
| | 64,574 |
| | 41,193 |
| | 22,763 |
|
| Cost of revenue: | | | | | | | |
| Subscription and support | 19,586 |
| | 14,042 |
| | 7,787 |
| | 4,189 |
|
| Professional services | 7,085 |
| | 9,079 |
| | 5,680 |
| | 3,121 |
|
| Total cost of revenue | 26,671 |
| | 23,121 |
| | 13,467 |
| | 7,310 |
|
| Gross profit | 43,240 |
| | 41,453 |
| | 27,726 |
| | 15,453 |
|
| Operating expenses: | | | | | | | |
| Sales and marketing | 12,965 |
| | 14,670 |
| | 10,625 |
| | 6,331 |
|
| Research and development | 15,778 |
| | 26,165 |
| | 10,340 |
| | 5,308 |
|
| Refundable Canadian tax credits | (470 | ) | | (1,094 | ) | | (583 | ) | | (728 | ) |
| General and administrative | 18,201 |
| | 13,561 |
| | 6,832 |
| | 4,574 |
|
| Depreciation and amortization | 4,534 |
| | 4,310 |
| | 3,670 |
| | 1,812 |
|
| Acquisition-related expenses | 2,455 |
| | 2,186 |
| | 1,461 |
| | 1,933 |
|
| Total operating expenses | 53,463 |
| | 59,798 |
| | 32,345 |
| | 19,230 |
|
| Loss from operations | (10,223 | ) | | (18,345 | ) | | (4,619 | ) | | (3,777 | ) |
| Other expense: | | | | | | | |
| Interest expense, net | (1,858 | ) | | (1,951 | ) | | (2,797 | ) | | (528 | ) |
| Other income (expense), net | (544 | ) | | 101 |
| | (431 | ) | | (65 | ) |
| Total other expense | (2,402 | ) | | (1,850 | ) | | (3,228 | ) | | (593 | ) |
| Loss before provision for income taxes | (12,625 | ) | | (20,195 | ) | | (7,847 | ) | | (4,370 | ) |
| Provision for income taxes | (1,039 | ) | | 78 |
| | (708 | ) | | 72 |
|
| Loss from continuing operations | (13,664 | ) | | (20,117 | ) | | (8,555 | ) | | (4,298 | ) |
| Income (loss) from discontinued operations | — |
| | — |
| | (642 | ) | | 1,791 |
|
| Net loss | $ | (13,664 | ) | | $ | (20,117 | ) | | $ | (9,197 | ) | | $ | (2,507 | ) |
| Preferred stock dividends and accretion | — |
| | (1,524 | ) | | (98 | ) | | (44 | ) |
| Net loss attributable to common shareholders | $ | (13,664 | ) | | $ | (21,641 | ) | | $ | (9,295 | ) | | $ | (2,551 | ) |
| Net loss per common share: | | | | | | | |
|
| | | | | | | | | | | | | | | |
| Loss from continuing operations per common share, basic and diluted | $ | (0.91 | ) | | $ | (4.43 | ) | | $ | (7.23 | ) | | $ | (5.78 | ) |
| Income (loss) from discontinued operations per common share, basic and diluted | $ | — |
| | $ | — |
| | $ | (0.54 | ) | | $ | 2.39 |
|
| Net loss per common share, basic and diluted | $ | (0.91 | ) | | $ | (4.43 | ) | | $ | (7.77 | ) | | $ | (3.39 | ) |
| Weighted-average common shares outstanding, basic and diluted | 14,939,601 |
| | 4,889,901 |
| | 1,196,668 |
| | 751,416 |
|
|
| | | | | | | | | | | | | | |
| | December 31, |
| | 2015 | | 2014 | | 2013 | | 2012 |
| | (dollars in thousands) |
| Consolidated Balance Sheet Data: | | | | | | | |
| Cash and cash equivalents | $ | 18,473 |
| | $ | 30,988 |
| | $ | 4,703 |
| | 3,892 |
|
| Property and equipment, net | 6,001 |
| | 3,930 |
| | 3,942 |
| | 1,407 |
|
| Intangible assets, net | 31,526 |
| | 34,751 |
| | 34,747 |
| | 26,388 |
|
| Goodwill | 47,422 |
| | 45,146 |
| | 33,630 |
| | 21,093 |
|
| Total assets | 122,414 |
| | 135,686 |
| | 94,847 |
| | 67,808 |
|
| Deferred revenue | 19,939 |
| | 21,376 |
| | 17,036 |
| | 16,502 |
|
| Total liabilities | 62,144 |
| | 64,289 |
| | 60,191 |
| | 44,495 |
|
| Redeemable convertible preferred stock | — |
| | — |
| | 50,538 |
| | 27,492 |
|
| Total stockholders’ equity (deficit) | 60,270 |
| | 71,397 |
| | (15,882 | ) | | (4,179 | ) |
|
| | | | | | | | | | | | | | | | | | | |
| | Year Ended December 31, |
| | 2018(1) | | 2017 | | 2016 | | 2015 | | 2014 |
| | (dollars in thousands, except share and per share data) |
| Consolidated Statements of Operations Data: | | |
| Revenue: | | | | | | | |
| Subscription and support | $ | 136,578 |
| | $ | 85,467 |
| | $ | 65,552 |
| | $ | 57,193 |
| | $ | 48,625 |
|
| Perpetual license | 3,902 |
| | 4,346 |
| | 1,650 |
| | 2,805 |
| | 2,787 |
|
| Total product revenue | 140,480 |
| | 89,813 |
| | 67,202 |
| | 59,998 |
| | 51,412 |
|
| Professional services | 9,405 |
| | 8,139 |
| | 7,565 |
| | 9,913 |
| | 13,162 |
|
| Total revenue | 149,885 |
| | 97,952 |
| | 74,767 |
| | 69,911 |
| | 64,574 |
|
| Cost of revenue: | | | | | | | | | |
| Subscription and support | 42,881 |
| | 28,454 |
| | 22,734 |
| | 19,586 |
| | 14,042 |
|
| Professional services | 5,708 |
| | 5,193 |
| | 4,831 |
| | 7,085 |
| | 9,079 |
|
| Total cost of revenue | 48,589 |
| | 33,647 |
| | 27,565 |
| | 26,671 |
| | 23,121 |
|
| Gross profit | 101,296 |
| | 64,305 |
| | 47,202 |
| | 43,240 |
| | 41,453 |
|
| Operating expenses: | | | | | | | | | |
| Sales and marketing | 20,935 |
| | 15,307 |
| | 12,160 |
| | 12,965 |
| | 14,670 |
|
| Research and development | 21,320 |
| | 15,795 |
| | 14,919 |
| | 15,778 |
| | 26,165 |
|
| Refundable Canadian tax credits | (406 | ) | | (542 | ) | | (513 | ) | | (470 | ) | | (1,094 | ) |
| General and administrative | 32,041 |
| | 23,291 |
| | 18,286 |
| | 18,201 |
| | 13,561 |
|
| Depreciation and amortization | 14,272 |
| | 6,498 |
| | 5,291 |
| | 4,534 |
| | 4,310 |
|
| Acquisition-related expenses | 18,728 |
| | 15,092 |
| | 5,583 |
| | 2,455 |
| | 2,186 |
|
| Total operating expenses | 106,890 |
| | 75,441 |
| | 55,726 |
| | 53,463 |
| | 59,798 |
|
| Loss from operations | (5,594 | ) | | (11,136 | ) | | (8,524 | ) | | (10,223 | ) | | (18,345 | ) |
| Other expense: | | | | | | | | | |
| Interest expense, net | (13,273 | ) | | (6,582 | ) | | (2,781 | ) | | (1,858 | ) | | (1,951 | ) |
| Other income (expense), net | (1,781 | ) | | 289 |
| | (678 | ) | | (544 | ) | | 101 |
|
| Total other expense | (15,054 | ) | | (6,293 | ) | | (3,459 | ) | | (2,402 | ) | | (1,850 | ) |
| Loss before provision for income taxes | (20,648 | ) | | (17,429 | ) | | (11,983 | ) | | (12,625 | ) | | (20,195 | ) |
| Benefit from (provision for) income taxes | 9,809 |
| | (1,296 | ) | | (1,530 | ) | | (1,039 | ) | | 78 |
|
| Net loss | (10,839 | ) | | (18,725 | ) | | (13,513 | ) | | (13,664 | ) | | (20,117 | ) |
| Preferred stock dividends and accretion | — |
| | — |
| | — |
| | — |
| | (1,524 | ) |
| Net loss attributable to common shareholders | $ | (10,839 | ) | | $ | (18,725 | ) | | $ | (13,513 | ) | | $ | (13,664 | ) | | $ | (21,641 | ) |
| Net loss per common share: | | | | | | | | | |
| Net loss per common share, basic and diluted | $ | (0.54 | ) | | $ | (1.02 | ) | | $ | (0.82 | ) | | $ | (0.91 | ) | | $ | (4.43 | ) |
| Weighted-average common shares outstanding, basic and diluted | 19,985,528 |
| | 18,411,247 |
| | 16,472,799 |
| | 14,939,601 |
| | 4,889,901 |
|
(1) We adopted the new revenue standard on January 1, 2018 using the modified retrospective method. Revenue for the twelve months ended December 31, 2018 increased $0.2 million as a result of the application of the new revenue standard. In addition, sales commissions, included in 'Sales and marketing', decreased $2.4 million due to the requirement under then new standard to capitalize costs associated with obtaining a contract. During the twelve months ended December 31, 2018, the effect on earnings per share of the adoption of ASC 606 was an increase in earnings per share of $0.13. Refer to Note 2. Summary of Significant Accounting Policies and Note 12. Revenue Recognition to our consolidated financial statements for further discussion regarding the adoption of ASC 606.
|
| | | | | | | | | | | | | | | |
| | Year Ended December 31, |
| | 2015 | | 2014 | | 2013 | | 2012 |
| | (in thousands, except %) |
| Other Financial Data: | | | | | | | |
Annualized recurring revenue value at year-end(1) | $ | 58,918 |
| | $ | 56,800 |
| | $ | 49,061 |
| | $ | 27,093 |
|
Annual net dollar retention rate(2) | 90 | % | | 96 | % | | 90 | % | | n/a |
|
Adjusted EBITDA(3) | $ | 4,143 |
| | $ | 4,213 |
| | $ | 3,576 |
| | $ | 3,998 |
|
|
| | | | | | | | | | | | | | | | | | | |
| | Year Ended December 31, |
| | 2018 | | 2017 | | 2016 | | 2015 | | 2014 |
| | (dollars in thousands) |
| Consolidated Balance Sheet Data: | | | | | | | | | |
| Cash and cash equivalents | $ | 16,738 |
| | $ | 22,326 |
| | $ | 28,758 |
| | $ | 18,473 |
| | $ | 30,988 |
|
| Property and equipment, net | 2,827 |
| | 2,927 |
| | 4,356 |
| | 6,001 |
| | 3,930 |
|
| Intangible assets, net | 179,572 |
| | 70,043 |
| | 28,512 |
| | 31,526 |
| | 34,751 |
|
| Goodwill | 225,322 |
| | 154,607 |
| | 69,097 |
| | 47,422 |
| | 45,146 |
|
| Total assets | 483,198 |
| | 281,259 |
| | 150,588 |
| | 122,414 |
| | 135,686 |
|
| Deferred revenue | 58,204 |
| | 45,377 |
| | 23,799 |
| | 19,939 |
| | 21,376 |
|
| Total liabilities | 395,891 |
| | 189,844 |
| | 91,575 |
| | 62,144 |
| | 64,289 |
|
| Total stockholders’ equity (deficit) | 87,307 |
| | 91,415 |
| | 59,013 |
| | 60,270 |
| | 71,397 |
|
|
| | | | | | | | | | | | | | | | | | | |
| | Year Ended December 31, |
| | 2018 | | 2017 | | 2016 | | 2015 | | 2014 |
| | (dollars in thousands, except %) |
| Other Financial Data: | | | | | | | | | |
Annualized recurring revenue value at year-end(1) | $ | 131,919 |
| | $ | 106,099 |
| | $ | 63,968 |
| | $ | 58,918 |
| | $ | 56,800 |
|
Annual net dollar retention rate(2) | 98 | % | | 93 | % | | 95 | % | | 90 | % | | 96 | % |
Adjusted EBITDA(3) | $ | 53,105 |
| | $ | 30,316 |
| | $ | 12,616 |
| | $ | 4,143 |
| | $ | 4,213 |
|
| |
| (1) | Annualized recurring revenue value at year-end. The value as of December 31 equals the monthly value of our recurring revenue contracts measured as of December 31 multiplied by 12. This measure excludes the revenue value of certain uncontracted overage fees and on-demand service fees. See “Management’s Discussion and Analysis of Financial Condition and Results of Operations-Key Metrics” for additional discussion of this key metric. |
| |
| (2) | Annual net dollar retention rate. We define annual net dollar retention rate as of December 31 as the aggregate annualized recurring revenue value at December 31 from those customers that were also customers as of December 31 of the prior fiscal year, divided by the aggregate annualized recurring revenue value from all customers as of December 31 of the prior fiscal year. This measure excludes the revenue value of certain uncontracted overage fees and on-demand service fees. See “Management’s Discussion and Analysis of Financial Condition and Results of Operations-Key Metrics” for additional discussion of this key metric. |
| |
| (3) | Adjusted EBITDA. We monitor our Adjusted EBITDA to help us evaluate the effectiveness and efficiency of our operations. Adjusted EBITDA is a non-GAAP financial measure. We define Adjusted EBITDA as net income (loss), calculated in accordance with GAAP, plus net income (loss) from discontinued operations, depreciation and amortization expense, interest expense, net, other expense (income), net, provision for income taxes, stock-based compensation expense, acquisition-related expenses, stock-based compensation expense granted to related party vendors, non-recurring litigation costs, and one-time purchase accounting adjustments to fair value deferred revenue acquired in business combinations. Prior to the filing of this Annual Report on Form 10-K, we did not include purchase accounting adjustments for deferred revenue as a component of Adjusted EBITDA, and as such, the prior year Adjusted EBITDA amounts presented herein have been recast to reflect the inclusion of purchase accounting adjustments for deferred revenue. |
The following table presents a reconciliation of net loss to Adjusted EBITDA: | | | | Year Ended December 31, | Year Ended December 31, |
| | 2015 | | 2014 | | 2013 | | 2012 | 2018 | | 2017 | | 2016 | | 2015 | | 2014 |
| | (dollars in thousands) | (dollars in thousands) |
| Net Loss | $ | (13,664 | ) | | $ | (20,117 | ) | | $ | (9,197 | ) | | $ | (2,507 | ) | |
| Net income (loss) from discontinued operations | — |
| | — |
| | 642 |
| | (1,791 | ) | |
| Net loss | | $ | (10,839 | ) | | $ | (18,725 | ) | | $ | (13,513 | ) | | $ | (13,664 | ) | | $ | (20,117 | ) |
| Depreciation and amortization expense | 8,451 |
| | 7,457 |
| | 5,310 |
| | 2,472 |
| 21,347 |
| | 11,914 |
| | 9,794 |
| | 8,451 |
| | 7,457 |
|
| Interest expense, net | 1,858 |
| | 1,951 |
| | 2,797 |
| | 528 |
| 13,273 |
| | 6,582 |
| | 2,781 |
| | 1,858 |
| | 1,951 |
|
| Other expense (income), net | 544 |
| | (101 | ) | | 431 |
| | 65 |
| 1,781 |
| | (289 | ) | | 678 |
| | 544 |
| | (101 | ) |
| Provision for income taxes | 1,039 |
| | (78 | ) | | 708 |
| | (72 | ) | (9,809 | ) | | 1,296 |
| | 1,530 |
| | 1,039 |
| | (78 | ) |
| Stock-based compensation expense | 2,741 |
| | 1,077 |
| | 498 |
| | 92 |
| 14,130 |
| | 9,977 |
| | 4,333 |
| | 2,741 |
| | 1,077 |
|
| Acquisition-related expense | 2,455 |
| | 2,186 |
| | 1,461 |
| | 1,933 |
| 18,728 |
| | 15,092 |
| | 5,583 |
| | 2,455 |
| | 2,186 |
|
| Stock-based compensation expense - related party vendor | — |
| | 11,220 |
| | — |
| | — |
| — |
| | — |
| | — |
| | — |
| | 11,220 |
|
| Nonrecurring litigation expense | 406 |
| | 256 |
| | — |
| | — |
| |
| Non-recurring litigation costs | | — |
| | — |
| | 25 |
| | 406 |
| | 256 |
|
| Purchase accounting deferred revenue discount | 313 |
| | 362 |
| | 926 |
| | 3,278 |
| 4,494 |
| | 4,469 |
| | 1,405 |
| | 313 |
| | 362 |
|
| Adjusted EBITDA | $ | 4,143 |
| | $ | 4,213 |
| | $ | 3,576 |
| | $ | 3,998 |
| $ | 53,105 |
| | $ | 30,316 |
| | $ | 12,616 |
| | $ | 4,143 |
| | $ | 4,213 |
|
We believe that Adjusted EBITDA provides useful information to management, investors and others in understanding and evaluating our operating results for the following reasons:
Adjusted EBITDA is widely used by investors and securities analysts to measure a company’s operating performance without regard to items that can vary substantially from company to company depending upon their financing, capital structures and the method by which assets were acquired;
our management uses Adjusted EBITDA in conjunction with GAAP financial measures for planning purposes, in the preparation of our annual operating budget, as a measure of our operating performance, to assess the effectiveness of our business strategies and to communicate with our board of directors concerning our financial performance because Adjusted EBITDA eliminates the impact of items that we do not consider indicative of our core operating performance; and
Adjusted EBITDA provides more consistency and comparability with our past financial performance, facilitates period-to-period comparisons of our operations and also facilitates comparisons with other companies, many of which use similar non-GAAP financial measures to supplement their GAAP results.
Adjusted EBITDA should not be considered as an alternative to net loss or any other measure of financial performance calculated and presented in accordance with GAAP. The use of Adjusted EBITDA as an analytical tool has limitations such as:
depreciation and amortization are non-cash charges, and the assets being depreciated or amortized will often have to be replaced in the future and Adjusted EBITDA does not reflect cash requirements for such replacements; however, much of the depreciation and amortization currently reflected relates to amortization of acquired intangible assets as a result of business combination purchase accounting adjustments, which will not need to be replaced in the future;
Adjusted EBITDA may not reflect changes in, or cash requirements for, our working capital needs or contractual commitments;
Adjusted EBITDA does not reflect the potentially dilutive impact of stock-based compensation;
Adjusted EBITDA does not reflect interest or tax payments that could reduce cash available for use; and
other companies, including companies in our industry, might calculate Adjusted EBITDA or similarly titled measures differently, which reduces their usefulness as comparative measures.
Because of these limitations, you should consider Adjusted EBITDA together with other financial performance measures, including various cash flow metrics, net loss and our other GAAP results.
The following tables present stock-based compensation, depreciation and amortization included in the respective line items in our Consolidated Statement of Operations:
| | | | Year Ended December 31, | Year Ended December 31, |
| | 2015 | | 2014 | | 2013 | | 2012 | 2018 | | 2017 | | 2016 | | 2015 | | 2014 |
| | (dollars in thousands) | (dollars in thousands) |
| Stock-based compensation: | | | | | | | | | | | | | | | | |
| Cost of revenue | $ | 42 |
| | $ | 49 |
| | $ | 16 |
| | $ | — |
| $ | 654 |
| | $ | 436 |
| | $ | 44 |
| | $ | 42 |
| | $ | 49 |
|
| Research and development | 203 |
| | 61 |
| | 12 |
| | — |
| 1,250 |
| | 796 |
| | 204 |
| | 203 |
| | 61 |
|
| Sales and marketing | 65 |
| | 39 |
| | 15 |
| | — |
| 533 |
| | 232 |
| | 105 |
| | 65 |
| | 39 |
|
| General and administrative | 2,431 |
| | 928 |
| | 455 |
| | 92 |
| 11,693 |
| | 8,513 |
| | 3,980 |
| | 2,431 |
| | 928 |
|
| Total | $ | 2,741 |
| | $ | 1,077 |
| | $ | 498 |
| | $ | 92 |
| $ | 14,130 |
| | $ | 9,977 |
| | $ | 4,333 |
| | $ | 2,741 |
| | $ | 1,077 |
|
| | | | Year Ended December 31, | Year Ended December 31, |
| | 2015 | | 2014 | | 2013 | | 2012 | 2018 | | 2017 | | 2016 | | 2015 | | 2014 |
| | (dollars in thousands) | (dollars in thousands) |
| Depreciation: | | | | | | | | | | | | | | | | |
| Cost of Revenue | $ | 1,800 |
| | $ | 1,303 |
| | $ | 455 |
| | $ | — |
| |
| General and administrative | 452 |
| | 987 |
| | 348 |
| | 325 |
| |
| Cost of revenue | | $ | 1,644 |
| | $ | 1,904 |
| | $ | 2,030 |
| | $ | 1,800 |
| | $ | 1,303 |
|
| Depreciation and amortization | | 607 |
| | 712 |
| | 657 |
| | 452 |
| | 987 |
|
| Total | $ | 2,252 |
| | $ | 2,290 |
| | $ | 803 |
| | $ | 325 |
| $ | 2,251 |
| | $ | 2,616 |
| | $ | 2,687 |
| | $ | 2,252 |
| | $ | 2,290 |
|
| | | | Year Ended December 31, | Year Ended December 31, |
| | 2015 | | 2014 | | 2013 | | 2012 | 2018 | | 2017 | | 2016 | | 2015 | | 2014 |
| | (dollars in thousands) | (dollars in thousands) |
| Amortization: | | | | | | | | | | | | | | | | |
| Cost of Revenue | $ | 2,116 |
| | $ | 1,844 |
| | $ | 1,185 |
| | $ | 662 |
| |
| General and administrative | 4,083 |
| | 3,323 |
| | 3,322 |
| | 1,487 |
| |
| Cost of revenue | | $ | 5,431 |
| | $ | 3,512 |
| | $ | 2,473 |
| | $ | 2,116 |
| | $ | 1,844 |
|
| Depreciation and amortization | | 13,665 |
| | 5,786 |
| | 4,634 |
| | 4,083 |
| | 3,323 |
|
| Total | $ | 6,199 |
| | $ | 5,167 |
| | $ | 4,507 |
| | $ | 2,149 |
| $ | 19,096 |
| | $ | 9,298 |
| | $ | 7,107 |
| | $ | 6,199 |
| | $ | 5,167 |
|
| |
| Item 7. | Management’s Discussion and Analysis of Financial Condition and Results of Operations |
You should read the following discussion of our financial condition and results of operations in conjunction with the consolidated financial statements and the notes thereto included elsewhere in this Annual Report on Form 10-K. The following discussion contains forward-looking statements that reflect our plans, estimates and beliefs. Our actual results could differ materially from those discussed in the forward-looking statements. Factors that could cause or contribute to these differences include those discussed below and elsewhere in this Annual Report on Form 10-K, particularly in Item 1A: “Risk Factors.”
This section and other parts of this Annual Report on Form 10-K contain forward-looking statements that involve risks and uncertainties. Forward-looking statements may be identified by the use of forward-looking words such as “anticipate,” “believe,” “may,” “will,” “continue,” “seek,” “estimate,” “intend,” “hope,” “predict,” “could,” “should,” “would,” “project,” “plan,” “expect” or the negative or plural of these words or similar expressions, although not all forward-looking statements contain these words. Forward-looking statements are not guarantees of future performance and our actual results may differ significantly from the results discussed in the
forward-looking statements. Factors that might cause such differences include, but are not limited to, those discussed in the subsection entitled Item 1A: “Risk Factors” above, which are incorporated herein by reference. The following discussion should be read in conjunction with the consolidated financial statements and notes thereto included in Item 8: “Financial Statements and Supplementary Data” of this Annual Report on Form 10-K. All information presented herein is based on our fiscal calendar. Unless otherwise stated, references in this report to particular years or quarters refer to our fiscal years ended December 31 and the associated quarters of those fiscal years. We assume no obligation to revise or update any forward-looking statements for any reason, except as required by law.
Overview
We are a leading provider ofprovide cloud-based enterprise work management software. We define enterprise work management software as software applications that enable organizations to plan, manage and execute projects and work. Our family of applications enables users to manage their projects, professional workforce and IT investments, automate document-intensive business processes, and effectively engage with their customers, prospects, and community via the web and mobile technologies.
The continued growth of an information-based economy driven by technological innovation and globalization is causing a fundamental shift in the way work is done. These changes havehas given rise to a large and growing group of knowledge workers who operate in dynamic work environments as part of geographically dispersed and virtual teams. McKinsey estimates that, as of May, 2013, there were more than 200 million knowledge workers globally. We believe that manual processes and legacy on- premise enterprise systems are insufficient to address the needs of the modern work environment. In order for knowledge workers to be successful, they need to interact with intuitive enterprise work systems in a collaborative way, including real-time access at any time, from anywhere and on any device.access. Today, legacy processes and systems are being disrupted and replaced by cloud-based enterprise work management software that improves visibility, collaboration and productivity.
In response to these changes, we are helping transform how work gets done by providing organizations and their knowledge workers with software applications that better align resources with business objectives and increase visibility, governance, collaboration, quality of customer experience, and responsiveness to changes in the business environment. This results in increased work capacity, higher productivity, better execution, and greater levels of customer engagement. Our applications are easy-to-use, highly scalable, and offer real-time collaboration for knowledge workers distributed on a local or global scale. Our software applications address enterprise work challenges in the following enterprise solution categories:
Customer Experience Management. Upland Customer Experience Management, or CXM, solutions enable organizations to manage customer relationships across multiple channels - including email, SMS, MMS, web, social, and mobile apps. Upland products within this solution suite include Upland Mobile Messaging, Rant & Rave, Adestra, and RightAnswers.
Sales Enablement. Upland Sales Enablement solutions enable sales organizations to automate delivery of processes, sales activities, content, systems, and metrics at multiple stages of the sales process. Upland products within this solution suite include Qvidian, RO Innovation, and LeadLander.
Professional Services Automation. Upland Professional Services Automation, or PSA, solutions enable services organizations to manage professional services delivery and related functions. Upland products within this solution suite include Tenrox, RightAnswers, FileBound, RO Innovation, and Qvidian.
Project and Information Technology (IT)Financial Management. Upland Project and Financial Management. Enables customers solutions enable enterprises to manage their organization’s projects, professional workforceproject portfolios and track, analyze and manage IT, costs.cloud, and telecom spending. Upland products within this solution suite include PowerSteering, Eclipse PPM, RightAnswers, and ComSci.
Enterprise Knowledge Management. Upland Enterprise Knowledge Management, or KM, solutions enable knowledge-sharing across different departments within an organization. Upland products within this solution suite include RightAnswers, Tenrox, and PowerSteering.
Secure Document Services. Upland Secure Document Services solutions enable organizations to manage and automate document intensive business processes with security of data through scan and fax platforms, data monitoring and breach prevention capabilities, and the automated routing of content to its final destination. Upland products within this solution suite include AccuRoute, FileBound, and InterFAX.
WorkflowDocument Lifecycle Automation. Enables customersUpland Document Lifecycle solutions enable users to digitize, organize, automate, document-intensive workflows among internal functional areas as well as with their partnersintegrate, analyze and supply chain.
Digital Engagement. Enables customers to effectively engage with their customers, prospectsoptimize high volume processes. Upland products within this solution suite include AccuRoute, FileBound, Qvidian, and community via the web and mobile technologies.RO Innovation.
We sell our software applications primarily through a direct sales organization comprised of inside sales and field sales personnel. In addition to our direct sales organization, we have an indirect sales organization, which sells to distributors and value-added resellers. We employ a land-and-expand go-to-market strategy. After we demonstrate the value of an initial application to an organization,a customer, our sales and account management teams work to expand the adoption of that initial application across the organization,customer, as well as cross-sell additional applications to address other enterprise work management needs of the organization.customer. Our customer success organization supports our direct sales efforts by managing the post-sale customer lifecycle.
Our subscription agreements are typically sold either on a per-seat basis or on a minimum contracted volume basis with overage fees billed in arrears, depending on the application being sold. We service customers ranging from large global corporations and government agencies to small- and medium-sized businesses. We have more than 2,0009,000 customers with over 235,0001,000,000 users across a broad range of industries,
including financial services, retail, technology, manufacturing, legal, education, consumer goods, media, telecommunications, government, non-profit, food and beverage, healthcare and life sciences.
We have achieved significant growth and scale in a relatively short period of time. Through a series of acquisitions and integrations, we have established a diverse family of software applications under the Upland brand and in the product solution categories listed above, each of which addresses a specific enterprise work management need. Our revenue has grown from $22.8 million in fiscal 2012 to $69.9$149.9 million in fiscal 2015,2018, representing a 207%558% period-over-period growth rate. Historically, our revenues have been primarily generated in the United States, however, as a result of acquisitions made over the past three years of companies with more international presence, domestic revenue as a percentage of total revenue has decreased. During the year ended December 31, 2018 domestic revenue as a percent of total revenue decreased to 78% compared to 84% during the year ended December 31, 2016. We expect this trend to continue in 2019 as a result of the acquisitions of Rant & Rave and Adestra during the fourth quarter of 2018, as a majority of each company's operations reside outside the United States. See Note 16 of12 Revenue Recognition in the Notes to Consolidated Financial Statements for more information regarding our revenue as it relates to domestic and foreign operations.
Our operating results in a given period can fluctuate based on the mix of subscription and support, perpetual license and professional services revenue. For the years ended December 31, 2015, 2014,2018, 2017 and 2013,2016, our subscription and support revenue accounted for 82%91%, 75%87%, and 75%88%, respectively of our total revenue in both periods. Our customer agreements for program and portfolio management, project management and collaboration, and professional services automation typically are sold on a per-seat basis with terms varying from one to three years, paid in advance. Our customer agreements for workflow automation and enterprise content management and financial management historically have been sold on a volume basis with a one-year term, paid in advance. We generally seek to enter into multi-year contracts with our customers when possible. In each case, our customer agreements provide us with revenue visibility over a number of quarters. We typically negotiate the total number of seats or total minimum contracted volume a customer is entitled to use as part of its subscription, but these seats or minimum contracted volume may not be fully utilized over the term of the agreement. In addition, where customers exceed the minimum contracted volume, additional overage fees are billed in arrears.
revenue. Historically, we have sold certain of our applications under perpetual licenses, which also are paid in advance. For the years ended December 31, 2015, 2014,2018, 2017 and 2013,2016, our perpetual license revenue accounted for 4%3%, 4%, and 5%2% of our total revenue, respectively. We expect perpetual license revenue to decrease as a percentage of revenue in the future. The support agreements related to our perpetual licenses are one-year in duration and entitle the customer to support and unspecified upgrades. The revenue related to such support agreements is included as part of our subscription and support revenue.
Professional services revenue consists of fees related to implementation, data extraction, integration and configuration and training on our applications. For the years ended
December 31, 2015, 2014,2018, 2017 and 2013,2016, our professional services revenue accounted for 14%6%, 21%9%, and 20%10%, respectively. We expect the proportional revenue contribution of product and professional services revenue to shift more to product revenue and less to professional services revenue in future periods.
We have historically experienced seasonality in terms of when we enter into customer agreements. We sign a significantly higher percentage of agreements with new customers, and renew agreements with existing customers, in the fourth quarter of each calendar year as our customers tend to follow budgeting cycles at the end of the calendar year. Our cash flow from operations has historically been higher in the first quarter of each calendar year than in other quarters. This seasonality is reflected to a much lesser extent, and sometimes is not immediately apparent, in our revenue, due to the fact that we defer revenue recognition. In addition, seasonality may be difficult to observe in our financial results during periods in which we acquire businesses as such results typically are most significantly impacted by such acquisitions. We expect this seasonality to continue, or possibly increase in the future, which may cause fluctuations in our operating results and financial metrics.
To support continued growth, we intend to pursue acquisitions of complementary technologies, products and businesses to enhance the features and functionalities ofbusinesses. This will expand our applications, expand ourproduct families, customer base, and providemarket access, to new markets andresulting in increased benefits of scale. We will prioritize acquisitions within theour current enterprise functions we currently serve, including information technology, process excellence, finance, professional services and marketing,solution categories as well as pursue acquisitions that serve other enterprise functions.described in Item 1. Business herein. Consistent with our growth strategy, we have made ninea total of sixteen acquisitions in the foursix years ending December 31, 2015.2018.
20122018 Acquisitions
PowerSteeringInterfax. . In February 2012, we acquiredOn March 21, 2018, the business ofCompany’s wholly owned subsidiary, PowerSteering Software Inc.Limited, a limited liability company organized and existing under the laws of England and Wales (“PowerSteering UK”), or PowerSteering, a providercompleted its purchase of the shares comprising the entire issued share capital of Interfax Communications Limited (“Interfax”), an Irish-based software company providing secured cloud-based programmessaging solutions, including enterprise cloud fax and portfolio management software, for $13.0 million. The
acquisition of PowerSteering enabled our customers to gain high-level visibility across their organizations and improve top-down governance in management of programs, initiatives, investments and projects.
Tenrox.secure document distribution. In February 2012, we acquired the business of Tenrox Inc., or Tenrox, a provider of cloud-based professional services automation software, for $15.3 million. Theconnection with this acquisition, of Tenrox provided us with additional access to the professional services market and provided our customers with the ability to more effectively manage their knowledge workers to better track work, expenses and client billing while improving scheduling, utilization and alignment of human capital. In addition, following the Tenrox acquisition, we began selling Timesheet.com, a Tenrox product for professional services automation, as a separate application.
EPM Live. In November 2012, we acquired the business of LMR Solutions, LLC, dba EPM Live, or EPM Live, a provider of cloud-based and perpetual license-based project management and collaboration software, with a combination of cash, seller notes and equity, for total consideration of $7.7 million. The acquisition of EPM Live added a software application focused on improving collaboration and the execution of both projects and unstructured work.
2013 Acquisitions
FileBound. In May 2013, we acquired the businesses of FileBound Solutions, Inc. and Marex Group, Inc., together FileBound, a provider of cloud-based and perpetual license-based workflow automation and enterprise content management software, with a combination of cash, seller notes and equity, for total consideration of $14.7 million. The acquisition of FileBound provided our customers the ability to automate document-based workflows and control access and distribution of their content to boost productivity, encourage collaboration and improve compliance.
ComSci. In November 2013, we acquired the business of ComSci LLC, or ComSci, a provider of cloud-based financial management software, with a combination of cash and equity, for total consideration of $7.6 million, with additional contingent consideration payable if certain performance targets are achieved. The acquisition of ComSci enabled our customers to have visibility into the cost, quality and value of internal services delivered within their organizations.
Clickability. In December 2013, we acquired the business of Clickability, Inc., or Clickability, a cloud-based platform for web content management, for $12.3 million. The acquisition of Clickability provided an enterprise content management software application that is used by enterprise marketers and media companies to create, maintain and deliver websites that shape visitor experiences and empower non-technical staff to create, management, publish, analyze and refine content and social media assets without information technology intervention. For accounting purposes, the acquisition of Clickability was recorded as of December 31, 2013 and, accordingly, the operations of Clickability had no impact on our statement of operations.
2014 Acquisitions
Solution Q. In November 2014, the Company also acquired 100%certain assets related to Interfax’s business from a United States based reseller of the outstanding capital of Solution Q Inc. (Solution Q)Interfax’s products. The purchase price consideration paid for total purchase consideration of $6.1Interfax was $33.6 million which includesin cash of $4.5 million,at closing, net of $0.4 million of cash acquired of $1.4 million, and 150,977 shares of the Company’s common stock with a fair value of $1.6 million. Solution Q provides mid-market organizations an easy-to-use, turnkey solution$5.0 million cash holdback payable over 18 months (subject to reduction for their project management and portfolio visibility needs.indemnification claims). Revenues recorded since the acquisition date for the year endedthrough December 31, 20142018 were approximately $0.3$12.1 million.
In addition, In connection with the acquisition of Interfax, certain assets and customer relationships of their U.S. reseller (“Marketech”) were purchased for $2.0 million, excluding potential future earn-out payments valued at $0.3 million tied to additional performance-based goals.
Mobile Commons.RO Innovation In December 2014,. On June 28, 2018, the Company acquired 100%completed its purchase of the outstanding capital of Mobile Commons,RO Innovation, Inc. (Mobile Commons)(“RO Innovation”), a cloud-based customer reference solution for totalcreating, deploying, managing, and measuring customer reference and sales enablement content. The purchase price consideration of $10.2paid was approximately $12.3 million includingin cash of $5.7 million,payable at closing, net of $0.3 million of cash acquired 386,253 shares of common stock$0.2 million, a $1.8 million cash holdback payable in 12 months (subject to reduction for indemnification claims) and potential future earn-out payments for up to $7.5 million valued at $4.5$0.0 million and excluding potential additional consideration for incremental additional revenue described below. The Company agreed to pay additional considerationas of up to $1.5 million in both cash and common stock to the selling shareholders of Mobile Commonsacquisition date based on the achievementprobability of certain incremental revenue targets during fiscal 2015. The acquisition-date fair valueattainment of the contingent payment was measured based on the probability-adjusted present value of the consideration expected to be transferred, which amounted to $0.5 million. Mobile Commons’ enterprise-class application drives and manages digital engagement through two-way SMS programs and campaigns.future performance-based goals. Revenues recorded since the acquisition date for the year endedthrough December 31, 20142018 were
approximately $0.5$3.0 million.
2015 Acquisitions
Ultriva. Rant & Rave.On November 13, 2015,October 3, 2018, the Company acquired 100%Company’s wholly owned subsidiary, PowerSteering UK, completed its purchase of the outstandingshares comprising the entire issued share capital of Ultriva, Inc. (Ultriva)Rapide Communication LTD, a private company limited by shares organized and existing under the laws of England and Wales doing business as Rant & Rave (“Rant & Rave”), a leading provider of cloud-based customer engagement solutions. The purchase price paid for total purchase consideration of $7.2Rant & Rave was $58.5 million which includesin cash of $5.6 million,at closing, net of $0.4 million of cash acquired, 179,298 shares of the Company’s common stock withand a fair value of $1.4$6.5 million and an additional $200,000cash holdback payable in shares of common stock, subject12 months (subject to indemnification claims, one year from the date of the acquisition. Ultriva provides cloud-based supply chain work management software.claims). Revenues recorded since the acquisition date through December 31, 2018 were approximately $5.4 million.
Adestra. On December 12, 2018, the Company completed its purchase of Adestra Ltd. (“Adestra”), a leading provider of enterprise-grade email marketing, transaction and automation software. The purchase price paid was $56.0 million in cash paid at closing, net of cash acquired, and a $4.2 million cash holdback payable in 12 months (subject to indemnification claims). Revenues recorded since the acquisition date through December 31, 2018 were approximately $0.6 million.
2017 Acquisitions
Omtool. On January 11, 2017, Upland completed its acquisition of Omtool, Ltd. (“Omtool”), an enterprise document capture, fax, and workflow solution company. The purchase price paid for Omtool was $19.3 million (net of cash acquired).
RightAnswers. On April 21, 2017, the Company acquired RightAnswers, Inc. (“RightAnswers”), a cloud-based knowledge management system. The purchase price was $17.4 million, in cash at closing (net of $0.1 million cash acquired) and a $2.5 million cash holdback payable in one year (subject to indemnification claims), and excludes potential future earn-out payments valued at $4.0 million tied to additional performance-based goals, towards which $1.0 million was paid in September 2017 and an additional final payment of $2.0 million was paid during the year ended December 31, 2015 were2018.
Waterfall. On July 13, 2017, the Company acquired Waterfall International Inc. (“Waterfall”), a cloud-based mobile messaging platform. The purchase price consideration paid was approximately $0.5 million.$24.4 million in cash at closing (net of $0.4 million of cash acquired) and a $1.5 million cash holdback payable in 18 months (subject to indemnification claims). The foregoing excludes an additional potential $3.0 million in earnout payments tied to performance-based conditions, towards which $2.2 million was paid during the year ended December 31, 2018 based on the final earn-out calculation.
Qvidian. On November 16, 2017, the Company acquired Qvidian Corporation (“Qvidian”), a provider of cloud-based RFP and sales-proposal automation software. The purchase price consideration paid by the Company was $50 million, of which $30 million came from cash on-hand and $20 million from our credit facility.
2016 Acquisitions
Leadlander.LeadLander. On January 7, 2016, Upland completed its purchase of substantially all of the assets of LeadLander, Inc. (“LeadLander”), a California-based website analytics provider. The purchase price consideration paid was approximately $8.2$8.0 million in cash payable at closing (net of $0.2$0.4 million of cash acquired) and a $1.2 million cash holdback payable in 12 months (subject to indemnification claims). The foregoing excludes additional potential earnout payments tied to
performance-based conditions. In addition to the cash consideration described above, the Asset Purchase Agreement included a contingent share consideration component pursuant to which Upland expects to issueissued an aggregate of
approximately $2.4 million in shares of its common stock on July 25, 2016. The Company also paid additional consideration of $2.4 million in March 2017 in cash to the seller after July 7, 2016selling shareholders of LeadLander based on the achievement of certain minimal post-closing performance-based conditions.revenue targets during 2016 and 2017 and no further payments are expected to be made as of December 31, 2018.
Hipcricket.HipCricket. On March 14, 2016, Upland completed its purchase of substantially all of the assets of Hipcricket,HipCricket, Inc. (“HipCricket”), a cloud-based mobile messaging software provider. The consideration paid to the seller consisted of our issuance of one million shares of our common stock and the transfer of our EPM Live product business. The value of the shares on the closing date of the transaction was approximately $6.2$5.7 million, and the fair value of our EPM Live product business was approximately $6.0$5.9 million. Prior to the transaction, Hipcricket
HipCricket was owned by an affiliate of ESW Capital, LLC, which is a shareholder of Upland. Raymond James & Co. provided a fairness opinion to Upland in connection with the transaction.
Our acquisitions may haveAdvanced Processing & Imaging. On April 27, 2016, Upland acquired Advanced Processing & Imaging, Inc., a material adverse impact on our resultscontent management platform driving workflow in governments and schools. The purchase price consideration consisted of operations, including$4.1 million in cash payable at closing (net of $0.1 million of cash acquired), and a potential material adverse impact on our cost of revenue$0.8 million cash holdback payable in the short term, as we seek12 months (subject to integrate our acquired businesses over the following six to twelve months in order to achieve additional operating efficiencies. In addition, as we grow our business, we continue to face many challenges and risks. We might encounter difficulties identifying, acquiring and integrating complementary products, technologies and businesses. Over time, as competition increases we may experience pricing pressure. We also may experience seat downgrades or a reduction in minimum contracted volume that could negatively impact our business. Seat downgrades or reductions in minimum contracted volume could occur for several reasons, including dissatisfaction with our prices or features relative to competitive offerings, reductions in our customers’ spending levels, unused seats or minimum contracted volume or limited adoption by our customers of our applications. Our strategic initiatives will require expenditure of capital and the attention of management, and we may not succeed in executing on our growth plan.indemnification claims).
Additionally, while cloud computing and SaaS have begun to transform enterprise work management for many organizations, other organizations, particularly those with legacy on-premise systems, have been slower to adopt cloud-based enterprise work management software applications such as ours. Until such organizations are ready to transition to cloud-based systems, we may face challenges in convincing such organizations to adopt our cloud-based enterprise work management applications or be required to make on-premise systems available instead of our cloud-based systems.
Initial Public Offering
In November 2014, we completed an initial public offering (the “IPO”), in connection with which we issued 3,846,154 shares of common stock for proceeds of $38.8 million, net of underwriting discounts and commissions and other offering costs. See Note 11 to the audited consolidated financial statements included elsewhere in this Annual Report for further details.
Key Metrics
In addition to the GAAP financial measures described below in “—Components“Components of Operating Results,” we regularly review the following key metrics to evaluate and identify trends in our business, measure our performance, prepare financial projections and make strategic decisions:decisions (in thousands of dollars, except %):
| | | | Year Ended December 31, | | | | | | | |
| | 2015 | | 2014 | | 2013 | | 2012 | Year Ended December 31, |
| | (in thousands, except %) | 2018 | | 2017 | | 2016 |
| Other Financial Data: | | | | | | | | | | | | |
Annualized recurring revenue value at year-end(1) | $ | 58,918 |
| | $ | 56,800 |
| | $ | 49,061 |
| | $ | 27,093 |
| $ | 131,919 |
| | $ | 106,099 |
| | $ | 63,968 |
|
Annual net dollar retention rate(2) | 90 | % | | 96 | % | | 90 | % | | n/a |
| 98 | % | | 93 | % | | 95 | % |
Adjusted EBITDA(3) | $ | 4,143 |
| | $ | 4,213 |
| | $ | 3,576 |
| | $ | 3,998 |
| $ | 53,105 |
| | $ | 30,316 |
| | $ | 12,616 |
|
| |
| (1) | Annualized recurring revenue value at year-end. The value as of December 31 equals the monthly value of our recurring revenue contracts measured as of December 31 multiplied by 12. This measure excludes the revenue value of uncontracted overage fees and on-demand service fees. See “Management’s Discussion and Analysis of Financial Condition and Results of Operations-Key Metrics” for additional discussion of this key metric. |
| |
| (2) | Annual net dollar retention rate. We define annual net dollar retention rate as of December 31 as the aggregate annualized recurring revenue value at December 31 from those customers that were also customers as of December 31 of the prior fiscal year, divided by the aggregate annualized recurring revenue value from all customers as of December 31 of the prior fiscal year. This measure excludes the revenue value of uncontracted overage fees and on-demand service fees. See “Management’s Discussion and Analysis of Financial Condition and Results of Operations-Key Metrics” for additional discussion of this key metric. |
| |
| (3) | Adjusted EBITDA. We monitor our Adjusted EBITDA to help us evaluate the effectiveness and efficiency of our operations. Adjusted EBITDA is a non-GAAP financial measure. We define Adjusted EBITDA as net income (loss), calculated in accordance with GAAP, plus net income (loss) from discontinued operations, depreciation and amortization expense, interest expense, net, other expense (income), net, provision for income taxes, stock-based compensation expense, acquisition-related expenses, non-recurring litigation costs, and purchase accounting adjustments for deferred revenue. Prior to the filing of thisthe Annual Report on Form 10-K for the year ended December 31, 2017, we did not include purchase accounting adjustments for deferred revenue as a component of Adjusted EBITDA, and as such, the prior year Adjusted EBITDA amounts for years ended prior to December 31, 2017 presented herein have been recast to reflect the inclusion of purchase accounting adjustments for deferred revenue. |
The following table presents a reconciliation of net loss from continuing operations, the most comparable GAAP measure, to Adjusted EBITDA for each of the periods indicated.indicated (in thousands).
| | | | Year Ended December 31, | | | | | | | |
| | 2015 | | 2014 | | 2013 | | 2012 | Year Ended December 31, |
| | (dollars in thousands) | 2018 | | 2017 | | 2016 |
| Net loss | $ | (13,664 | ) | | $ | (20,117 | ) | | $ | (9,197 | ) | | $ | (2,507 | ) | $ | (10,839 | ) | | $ | (18,725 | ) | | $ | (13,513 | ) |
| Income (loss) from discontinued operations | — |
| | — |
| | 642 |
| | (1,791 | ) | |
| Depreciation and amortization expense | 8,451 |
| | 7,457 |
| | 5,310 |
| | 2,472 |
| 21,347 |
| | 11,914 |
| | 9,794 |
|
| Interest expense, net | 1,858 |
| | 1,951 |
| | 2,797 |
| | 528 |
| 13,273 |
| | 6,582 |
| | 2,781 |
|
| Other expense (income), net | 544 |
| | (101 | ) | | 431 |
| | 65 |
| 1,781 |
| | (289 | ) | | 678 |
|
| Provision for income taxes | 1,039 |
| | (78 | ) | | 708 |
| | (72 | ) | (9,809 | ) | | 1,296 |
| | 1,530 |
|
| Stock-based compensation expense | 2,741 |
| | 1,077 |
| | 498 |
| | 92 |
| 14,130 |
| | 9,977 |
| | 4,333 |
|
| Acquisition-related expenses | 2,455 |
| | 2,186 |
| | 1,461 |
| | 1,933 |
| |
| Stock-based compensation expense --- related party vendor | — |
| | 11,220 |
| | — |
| | — |
| |
| Acquisition-related expense | | 18,728 |
| | 15,092 |
| | 5,583 |
|
| Non-recurring litigation costs | 406 |
| | 256 |
| | — |
| | — |
| — |
| | — |
| | 25 |
|
| Purchase accounting deferred revenue discount | 313 |
| | 362 |
| | 926 |
| | 3,278 |
| 4,494 |
| | 4,469 |
| | 1,405 |
|
| Adjusted EBITDA | $ | 4,143 |
| | $ | 4,213 |
| | $ | 3,576 |
| | $ | 3,998 |
| $ | 53,105 |
| | $ | 30,316 |
| | $ | 12,616 |
|
We believe that Adjusted EBITDA provides useful information to management, investors and others in understanding and evaluating our operating results for the following reasons:
Adjusted EBITDA is widely used by investors and securities analysts to measure a company’s operating performance without regard to items that can vary substantially from company to company depending upon their financing, capital structures and the method by which assets were acquired;
our management uses Adjusted EBITDA in conjunction with GAAP financial measures for planning purposes, in the preparation of our annual operating budget, as a measure of our operating performance, to assess the effectiveness of our business strategies and to communicate with our board of directors concerning our financial performance because Adjusted EBITDA eliminates the impact of items that we do not consider indicative of our core operating performance;
Adjusted EBITDA provides more consistency and comparability with our past financial performance, facilitates period-to-period comparisons of our operations and also facilitates comparisons with other companies, many of which use similar non-GAAP financial measures to supplement their GAAP results; and
Adjusted EBITDA should not be considered as an alternative to net loss or any other measure of financial performance calculated and presented in accordance with GAAP. The use of Adjusted EBITDA as an analytical tool has limitations such as:
depreciation and amortization are non-cash charges, and the assets being depreciated or amortized will often have to be replaced in the future and Adjusted EBITDA does not reflect cash requirements for such replacements; however, much of the depreciation and amortization currently reflected relates to amortization of acquired intangible assets as a result of business combination purchase accounting adjustments, which will not need to be replaced in the future;
Adjusted EBITDA may not reflect changes in, or cash requirements for, our working capital needs or contractual commitments;
Adjusted EBITDA does not reflect the potentially dilutive impact of stock-based compensation;
Adjusted EBITDA does not reflect interest or tax payments that could reduce cash available for use; and,
other companies, including companies in our industry, might calculate Adjusted EBITDA or similarly titled measures differently, which reduces their usefulness as comparative measures.
Because of these limitations, you should consider Adjusted EBITDA together with other financial performance measures, including various cash flow metrics, net loss and our other GAAP results.
Components of Operating Results
Revenue
Subscription and support revenue. We derive our subscription revenue from fees paid to us by our customers for use of our cloud-based applications. We recognize the revenue associated with subscription agreements ratably over the term of the agreement provided all criteria required for revenue recognition have been met.as the customer receives and consumes the benefits of the cloud services through the contract period. Our subscription agreements are typically one to three years.
Our support revenue consists of maintenance fees associated with our perpetual licenses and hosting fees paid to us by our customers. Typically, when purchasing a perpetual license, a customer also purchases maintenance for which we charge a fee, priced as a percentage of the perpetual license fee. Maintenance agreements include the right to support and unspecified upgrades. We recognize the revenue associated with maintenance ratably over the term of the contract. In limited instances, at the customer’s option, we may host the software purchased by a customer under a perpetual license on systems at our third-party data centers.
Perpetual license revenue. Perpetual license revenue reflects the revenue recognized from sales of perpetual licenses to new customers and additional perpetual licenses to existing customers. We generally recognize the license fee portion of the arrangement up-front at a point in advance, provided all revenue recognition criteria are satisfied. Our perpetual license agreements are typically one year.time when the software is made available to the customer.
Professional services revenue. Professional services revenue consists of fees related to implementation, data extraction, integration and configuration and training on our applications. We generally recognize the revenue associated with these professional services on aover time and materials basis as we deliverservices are performed. Revenues for fixed price services are generally recognized over time applying input methods to estimate progress to completion. Revenues for consumption-based services are generally recognized as the services or provide training to our customers.are performed.
Cost of Revenue
Cost of product revenue. Cost of product revenue consists primarily of personnel and related costs of our customer success and cloud operations teams, including salaries, benefits, bonuses, payroll taxes, stock-based compensation, and allocated overhead, as well as software license fees, hosting costs, Internet connectivity, and depreciation expenses directly related to delivering our applications. We expect that cost of revenues may increase in the future depending on the growth rate of our new customers and billings and our need to support the implementation, hosting and support of those new customers. We intend to continue to invest additional resources in
expanding the delivery capability of our applications. As we add data centerhosting infrastructure capacity and support personnel in advance of anticipated growth, our cost of product revenue will increase, and if such anticipated revenue growth does not occur, our product gross profit will be adversely affected both in terms of absolute dollars and as a percentage of total revenues in any particular quarterly or annual period. Our cost of product revenue is generally expensed as the costs are incurred.
Cost of professional services revenue. Cost of professional services revenue consists primarily of personnel and related costs, including salaries, benefits, bonuses, payroll taxes, stock-based compensation, and allocated overhead, as well as the costs of contracted third-party vendors and reimbursable expenses. As most of our personnel are employed on a full-time basis, our cost of professional services revenue is largely fixed in the short-term, while our professional services revenue may fluctuate, leading to fluctuations in professional services gross profit. We expect that cost of professional services as a percentage of total revenues could fluctuate from period to period depending on the growth of our professional services business, the timing of sales of applications, and any associated costs relating to the delivery of services. Our cost of professional services revenue is generally expensed as costs are incurred.
Operating Expenses
Our operating expenses are classified into six categories: sales and marketing, research and development, refundable Canadian tax credits, general and administrative, depreciation and amortization and acquisition-related expenses. For each category, other than refundable Canadian tax credits and depreciation and amortization, the largest expense component is personnel and related costs, which includes salaries, employee benefit costs, bonuses, commissions, stock-based compensation, and payroll taxes. Operating expenses also include allocated overhead costs for facilities, which are allocated to each department based on relative department headcount. Operating expenses are generally recognized as incurred.
Sales and marketing. Sales and marketing expenses primarily consist of personnel and related costs for our sales and marketing staff, including salaries, benefits, commissions, bonuses, payroll taxes, stock-based compensation and allocated overhead, as well as costs of promotional events, corporate communications, online marketing, product marketing and other brand-building activities. We expense sales commissions when the initial customer contract is signed and upon any renewal as our obligation to pay a sales commission arises at these times. Sales and marketing expenses may fluctuate as a percentage of total revenues for a variety of reasons including due to the timing of such expenses, in any particular quarterly or annual period.
Research and development. Research and development expenses primarily consist of personnel and related costs of our research and development staff, including salaries, benefits, bonuses, payroll taxes, stock-based compensation, allocated overhead, and costs of certain third-party contractors. Research and development costs related to the development of our software applications are generally recognized as incurred. For example, we are parties to a technology services agreement pursuant to which we generally recognize expenses for services as they are received. See Note 1715 Related Party Transactions, of the Notes to Consolidated Financial Statements for more information regarding how expenses under such agreement are recognized. We have devoted our product development efforts primarily to enhancing the functionality, and expanding the capabilities, of our applications.
Refundable Canadian tax credits. Investment tax credits are accounted for as a reduction of research and development costs. Credits are accrued in the year in which the research and development costs of the capital expenditures are incurred, provided that we are reasonably certain that the credits will be received. The investment tax credit must be examined and approved by the tax authorities, and it is possible that the amounts granted will differ from the amounts recorded.
General and administrative. General and administrative expenses primarily consist of personnel and related costs for our executive, administrative, finance, information technology, legal, accounting and human resource staff, including salaries, benefits, bonuses, payroll taxes, stock-based compensation, allocated overhead, professional fees, and other corporate expenses. We have recently incurred, and expect to continue to incur, additional expenses as we grow our operations, and operate as a newly public company, including potentially higher legal, corporate insurance, accounting and auditing expenses, and the additional costs of enhancing and maintaining our internal control environment through the adoption of new corporate policies.environment. General and administrative
expenses may fluctuate as a percentage of revenue, and overtime we expect that general and administrative expenses will decrease as a percent of revenue due to operational efficiencies.
Depreciation and amortization. Depreciation and amortization expenses primarily consist of depreciation and amortization of acquired intangible assets as a result of business combination purchase accounting adjustments. The valuation of identifiable intangible assets reflects management’s estimates based on, among other factors, use of established valuation methods. Customer relationships are valued using an income approach, which estimates fair value based on the earnings and cash flow capacity of the subject asset and are amortized over a 10-yearseven to ten-year period. The value of the trade name intangibles are determined using a relief from royalty method, which estimates fair value based on the value the owner of the asset receives from not having to pay a royalty to use the asset and are amortized over mostly a three-year period. Developed technology is valued using a cost-to-recreate approach and is amortized over a four- to seven-year period.
Acquisition-related expenses. Acquisition-related expenses consist of one-time costs in connection with each of our acquisitions, including legal fees, accounting fees, financing fees, restructuringtransformation costs, integration costs, and other transactional fees and bonuses. We intend to continue executing our focused strategy of acquisitions to
enhance the features and functionality of our applications, expand our customer base, and provide access to new markets and increased benefits of scale.
Total Other Expense
Total other expense consists primarily of changes in the estimated fair value of our preferred stock warrant liabilities, amortization of deferred financing costs over the term of the related loan facility, revaluation of contingent consideration, and interest expense on outstanding debt, including amortization of debt discount and effect of beneficial conversion features in our convertible promissory notes payable.issuance costs.
Income Taxes
Because we have not generated domestic net income in any period to date, we have recorded a full valuation allowance against our domestic net deferred tax assets, exclusive of tax deductible goodwill. We have historically not recorded any material provision for federal or state income taxes, other than deferred taxes related to tax deductible goodwill and current taxes in certain separate company filing states. The balance of the tax provision for fiscalthe years ended December 31, 2015, 2014,2018, 2017, and 2013,2016, outside of tax deductible goodwill and current taxes in separate filing states, is related to foreign income taxes, primarily operations of our Canadian and UK subsidiaries. Realization of any of our domestic deferred tax assets depends upon future earnings, the timing and amount of which are uncertain. Based on analysis of acquired net operating losses, utilization of our net operating losses will be subject to annual limitations due to the ownership change rules under the Internal Revenue Code of 1986, as amended, or the Code, and similar state provisions. In the event we have subsequent changes in ownership, the availability of net operating losses and research and development credit carryovers could be further limited.
Results of Operations
Consolidated Statements of Operations Data
The following tables set forth our results of operations for the specified periods, as well as our results of operations for the specified periods as a percentage of revenue. The period-to-period comparisons of results of operations are not necessarily indicative of results for future periods.periods (dollars in thousands, except share and per share data).
| | | | Year Ended December 31, | | | | | | | | | | | | |
| | 2015 | | 2014 | | 2013 | Year Ended December 31, |
| | Amount | Percent of Revenue | | Amount | Percent of Revenue | | Amount | Percent of Revenue | 2018 | | 2017 | | 2016 |
| | (dollars in thousands, except share and per share data) | Amount | Percent of Revenue | | Amount | Percent of Revenue | | Amount | Percent of Revenue |
| Revenue: | | | | | | | | | | | | | | | | | |
| Subscription and support | $ | 57,193 |
| | 82 | % | | $ | 48,625 |
| | 75 | % | | $ | 30,887 |
| | 75 | % | $ | 136,578 |
| | 91% | | $ | 85,467 |
| | 87% | | $ | 65,552 |
| | 88% |
| Perpetual license | 2,805 |
| | 4 | % | | 2,787 |
| | 4 | % | | 2,003 |
| | 5 | % | 3,902 |
| | 3% | | 4,346 |
| | 4% | | 1,650 |
| | 2% |
| Total product revenue | 59,998 |
| | 86 | % | | 51,412 |
| | 79 | % | | 32,890 |
| | 80 | % | 140,480 |
| | 94% | | 89,813 |
| | 91% | | 67,202 |
| | 90% |
| Professional services | 9,913 |
| | 14 | % | | 13,162 |
| | 21 | % | | 8,303 |
| | 20 | % | 9,405 |
| | 6% | | 8,139 |
| | 9% | | 7,565 |
| | 10% |
| Total revenue | 69,911 |
| | 100 | % | | 64,574 |
| | 100 | % | | 41,193 |
| | 100 | % | 149,885 |
| | 100% | | 97,952 |
| | 100% | | 74,767 |
| | 100% |
| Cost of revenue: | | | | | | | | | | | | | | | | | |
Subscription and support (1)(2) | 19,586 |
| | 28 | % | | 14,042 |
| | 22 | % | | 7,787 |
| | 19 | % | 42,881 |
| | 29% | | 28,454 |
| | 29% | | 22,734 |
| | 30% |
| Professional services | 7,085 |
| | 10 | % | | 9,079 |
| | 14 | % | | 5,680 |
| | 14 | % | 5,708 |
| | 3% | | 5,193 |
| | 5% | | 4,831 |
| | 7% |
| Total cost of revenue | 26,671 |
| | 38 | % | | 23,121 |
| | 36 | % | | 13,467 |
| | 33 | % | 48,589 |
| | 32% | | 33,647 |
| | 34% | | 27,565 |
| | 37% |
| Gross profit | 43,240 |
| | 62 | % | | 41,453 |
| | 64 | % | | 27,726 |
| | 67 | % | 101,296 |
| | 68% | | 64,305 |
| | 66% | | 47,202 |
| | 63% |
| Operating expenses: | | | | | | | | | | | | | | | | | |
Sales and marketing (1) | 12,965 |
| | 19 | % | | 14,670 |
| | 23 | % | | 10,625 |
| | 26 | % | 20,935 |
| | 14% | | 15,307 |
| | 16% | | 12,160 |
| | 16% |
Research and development (1) | 15,778 |
| | 23 | % | | 26,165 |
| | 41 | % | | 10,340 |
| | 25 | % | 21,320 |
| | 14% | | 15,795 |
| | 16% | | 14,919 |
| | 20% |
| Refundable Canadian tax credits | (470 | ) | | (1 | )% | | (1,094 | ) | | (2 | )% | | (583 | ) | | (1 | )% | (406 | ) | | —% | | (542 | ) | | (1)% | | (513 | ) | | (1)% |
General and administrative (1) | 18,201 |
| | 26 | % | | 13,561 |
| | 21 | % | | 6,832 |
| | 17 | % | 32,041 |
| | 21% | | 23,291 |
| | 24% | | 18,286 |
| | 24% |
| Depreciation and amortization | 4,534 |
| | 6 | % | | 4,310 |
| | 7 | % | | 3,670 |
| | 9 | % | 14,272 |
| | 10% | | 6,498 |
| | 7% | | 5,291 |
| | 7% |
| Acquisition-related expenses | 2,455 |
| | 3 | % | | 2,186 |
| | 3 | % | | 1,461 |
| | 3 | % | 18,728 |
| | 12% | | 15,092 |
| | 15% | | 5,583 |
| | 9% |
| Total operating expenses | 53,463 |
| | 76 | % | | 59,798 |
| | 93 | % | | 32,345 |
| | 79 | % | 106,890 |
| | 71% | | 75,441 |
| | 77% | | 55,726 |
| | 75% |
| Loss from operations | (10,223 | ) | | (14 | )% | | (18,345 | ) | | (29 | )% | | (4,619 | ) | | (12 | )% | |
| Gain (loss) from operations | | (5,594 | ) | | (3)% | | (11,136 | ) | | (11)% | | (8,524 | ) | | (12)% |
| Other Expense: | | | | | | | | | | | | | | | | | |
| Interest expense, net | (1,858 | ) | | (3 | )% | | (1,951 | ) | | (3 | )% | | (2,797 | ) | | (7 | )% | (13,273 | ) | | (9)% | | (6,582 | ) | | (7)% | | (2,781 | ) | | (4)% |
| Other expense, net | (544 | ) | | — | % | | 101 |
| | — | % | | (431 | ) | | (1 | )% | |
| Other income (expense), net | | (1,781 | ) | | (1)% | | 289 |
| | 1% | | (678 | ) | | (1)% |
| Total other expense | (2,402 | ) | | (3 | )% | | (1,850 | ) | | (3 | )% | | (3,228 | ) | | (8 | )% | (15,054 | ) | | (10)% | | (6,293 | ) | | (6)% | | (3,459 | ) | | (5)% |
| Loss before provision for income taxes | (12,625 | ) | | (17 | )% | | (20,195 | ) | | (32 | )% | | (7,847 | ) | | (20 | )% | (20,648 | ) | | (13)% | | (17,429 | ) | | (17)% | | (11,983 | ) | | (17)% |
| Provision for income taxes | (1,039 | ) | | (3 | )% | | 78 |
| | 1 | % | | (708 | ) | | (1 | )% | 9,809 |
| | 6% | | (1,296 | ) | | (2)% | | (1,530 | ) | | (1)% |
| Loss from continuing operations | (13,664 | ) | | (20 | )% | | (20,117 | ) | | (31 | )% | | (8,555 | ) | | (21 | )% | |
| Income (loss) from discontinued operations | — |
| | | | — |
| | | | (642 | ) | | | |
| Net loss | $ | (13,664 | ) | | (20 | )% | | $ | (20,117 | ) | | (31 | )% | | $ | (9,197 | ) | | (21 | )% | |
| Preferred stock dividends and accretion | — |
| | — | % | | (1,524 | ) | | (3 | )% | | (98 | ) | | (2 | )% | |
Net loss attributable to common shareholders (3) | $ | (13,664 | ) | | (20 | )% | | $ | (21,641 | ) | | (34 | )% | | $ | (9,295 | ) | | (23 | )% | |
Net loss (3) | | (10,839 | ) | | (7)% | | (18,725 | ) | | (19)% | | (13,513 | ) | | (18)% |
| Net loss per common share: | | | | | | | | | | | | | | | | | |
| Loss from continuing operations per common share, basic and diluted | $ | (0.91 | ) | | | | $ | (4.43 | ) | | | | $ | (7.23 | ) | | | $ | (0.54 | ) | | $ | (1.02 | ) | | $ | (0.82 | ) | |
| Loss from discontinued operations per common share, basic and diluted | $ | — |
| | | | $ | — |
| | | | $ | (0.54 | ) | | | |
| Loss per common share, basic and diluted | $ | (0.91 | ) | | | | $ | (4.43 | ) | | | | $ | (7.77 | ) | | | |
Weighted-average common shares outstanding, basic and diluted (3) | 14,939,601 |
| | | | 4,889,901 |
| | | | 1,196,668 |
| | | 19,985,528 |
| | 18,411,247 |
| | 16,472,799 |
| |
| |
| (1) | Includes stock-based compensation. See 'Item 6. Selected Financial Data' herein for a detail of stock based compensation by operating expense line item. |
| |
| (2) | Includes depreciation and amortization of $3,916,000, $3,147,000,$7,075,000, $5,416,000, and $1,640,000$4,503,000 in 2015, 2014,2018, 2017, and 2013,2016, respectively. |
| |
| (3) | See NoteNote 8 Net Loss Per Share, of the Notes to our consolidated financial statementsConsolidated Financial Statements included elsewhere in this 10-K for a discussion and reconciliation of historical net loss attributable to common stockholders and weighted average shares outstanding for historical basic and diluted net loss per share calculations. |
Comparison of Fiscal Years Ended December 31, 20152018 and 2014December 31, 2017
Revenue
| |
| Year Ended December 31, | Year Ended December 31, |
| 2015 |
| 2014 |
| Change | 2018 |
| 2017 |
| Change |
| Amount |
| Percent of Revenue |
| Amount |
| Percent of Revenue |
| Amount |
| % Change | Amount |
| Percent of Revenue |
| Amount |
| Percent of Revenue |
| Amount |
| % Change |
| (dollars in thousands) | (dollars in thousands) |
| Revenue: |
|
|
|
|
|
|
|
|
|
|
|
|
|
|
|
|
|
| Subscription and support | $ | 57,193 |
|
| 82 | % |
| $ | 48,625 |
|
| 75 | % |
| $ | 8,568 |
|
| 18 | % | $ | 136,578 |
|
| 91% |
| $ | 85,467 |
|
| 87% |
| $ | 51,111 |
|
| 60% |
| Perpetual license | 2,805 |
|
| 4 | % |
| 2,787 |
|
| 4 | % |
| 18 |
|
| 1 | % | 3,902 |
|
| 3% |
| 4,346 |
|
| 4% |
| (444 | ) |
| (10)% |
| Total product revenue | 59,998 |
|
| 86 | % |
| 51,412 |
|
| 79 | % |
| 8,586 |
|
| 17 | % | 140,480 |
|
| 94% |
| 89,813 |
|
| 91% |
| 50,667 |
|
| 56% |
| Professional services | 9,913 |
|
| 14 | % |
| 13,162 |
|
| 21 | % |
| (3,249 | ) |
| (25 | )% | 9,405 |
|
| 6% |
| 8,139 |
|
| 9% |
| 1,266 |
|
| 16% |
| Total revenue | $ | 69,911 |
|
| 100 | % |
| $ | 64,574 |
|
| 100 | % |
| $ | 5,337 |
|
| 8 | % | $ | 149,885 |
|
| 100% |
| $ | 97,952 |
|
| 100% |
| $ | 51,933 |
|
| 53% |
Total revenue was $69.9$149.9 million in 2015,2018, compared to $64.6$98.0 million in 2014,2017, an increase of $5.3$51.9 million, or 8%53%. Of the increase in total revenue, $11.2$51.9 million was due to the acquisitions we closed in 2014 and 2015. The organic business' total revenue decreased by $2.3 million in 2015 compared to 2014 due to the change in the foreign currency exchange rate between the Canadian dollar versus the U.S. dollar for those periods. Therefore, on a constant currency basis, our organic total revenue decreased by $3.6 million, or 6%. This decline in organic revenue is primarily due to the decline in professional services revenues in accordance with our plan to focus on growing higher margin recurring revenues and de-emphasizing lower-margin professional services revenues.after January 11, 2017.
Subscription and support revenue was $57.2$136.6 million in 2015,2018, compared to $48.6$85.5 million in 2014,2017, an increase of $8.6$51.1 million, or 18%60%. Of the increase in subscription and support revenue, $10.1$48.8 million was due to the acquisitions we closed in 2014 and 2015. Subscription and support revenue for the organic business declined by $1.9 million in 2015 compared to 2014 due to the change in the foreign currency exchange rate between the Canadian dollar versus the U.S. dollar for those periods. Therefore, on a constant currency basis, ourafter January 11, 2017. The organic subscription and support revenue increased by $0.4$2.3 million, or 1%3%.
Perpetual license revenue was $2.8$3.8 million in 2015,2018, compared to $2.8$4.3 million in 2014, remaining relatively flat year-over-year.2017, a decrease of $0.5 million, or 10%. The acquisitions we closed in late 2014after January 11, 2017 contributed a $0.3 million increase in perpetual license revenue. The organic perpetual revenue in 2015 as compared to 2014. This increase was offsetdeclined by a $0.3$0.8 million, decrease in the organic portion of our business.or 19%.
Professional services revenue was $9.9$9.4 million in 2015,2018, compared to $13.2$8.1 million in 2014, a decrease2017, an increase of $3.3$1.3 million, or 25%16%. The acquisitions we closed in 2014 and 2015after January 11, 2017 contributed a $0.8$2.8 million increase to professional services revenue. The organic portion of our professional services business decreased by $0.4 million in 2015 compared to 2014 due to the change in the foreign currency exchange rate between the Canadian dollar versus the U.S. dollar for those periods. Therefore, on a constant currency basis, our organic professional services revenue decreaseddeclined by $3.7$1.5 million, or 28%21%. As mentioned above, this is in accordance with our plan to focus ongrowing higher margin recurring revenues and de-emphasizing lower-margin professional services revenues.
Cost of Revenue and Gross Profit Percentage
| |
| Year Ended December 31, | Year Ended December 31, |
| 2015 |
| 2014 |
| Change | 2018 |
| 2017 |
| Change |
| Amount |
| Percent of Revenue |
| Amount |
| Percent of Revenue |
| Amount |
| % Change | Amount |
| Percent of Revenue |
| Amount |
| Percent of Revenue |
| Amount |
| % Change |
| (dollars in thousands) | (dollars in thousands) |
| Cost of revenue: |
|
|
|
|
|
|
|
|
|
|
|
|
|
|
|
|
|
|
Subscription and support (1) | $ | 19,586 |
|
| 28 | % |
| $ | 14,042 |
|
| 22 | % |
| $ | 5,544 |
|
| 39 | % | $ | 42,881 |
|
| 29% |
| $ | 28,454 |
|
| 29% |
| $ | 14,427 |
|
| 51% |
| Professional services | 7,085 |
|
| 10 | % |
| 9,079 |
|
| 14 | % |
| (1,994 | ) |
| (22 | )% | 5,708 |
|
| 3% |
| 5,193 |
|
| 5% |
| 515 |
|
| 10% |
| Total cost of revenue | 26,671 |
|
| 38 | % |
| 23,121 |
|
| 36 | % |
| 3,550 |
|
| 15 | % | 48,589 |
|
| 32% |
| 33,647 |
|
| 34% |
| 14,942 |
|
| 44% |
| Gross profit | $ | 43,240 |
|
| 62 | % |
| $ | 41,453 |
|
| 64 | % |
| $ | 1,787 |
|
| 4 | % | $ | 101,296 |
|
| 68% |
| $ | 64,305 |
|
| 66% |
| $ | 36,991 |
|
| 58% |
| (1) Includes depreciation and amortization expense as follows: | (1) Includes depreciation and amortization expense as follows: |
|
|
|
|
|
|
| (1) Includes depreciation and amortization expense as follows: |
|
|
|
|
| Depreciation | $ | 1,800 |
|
| 3 | % |
| $ | 1,303 |
|
| 2 | % |
| $ | 497 |
|
| 38 | % | $ | 1,644 |
| | 1% | | $ | 1,904 |
| | 2% | | $ | (260 | ) | | (14)% |
| Amortization | $ | 2,116 |
|
| 3 | % |
| $ | 1,844 |
|
| 3 | % |
| $ | 272 |
|
| 15 | % | $ | 5,431 |
| | 4% | | $ | 3,512 |
| | 4% | | $ | 1,919 |
| | 55% |
Cost of subscription and support revenue was $19.6$42.9 million in 2015,2018, compared to $14.0$28.5 million in 2014,2017, an increase of $5.6$14.4 million, or 39%51%. Of theThe acquisitions closed after January 11, 2017 contributed to a $15.6 million increase in cost of subscription and support revenue, $3.5revenue. Of the $15.6 million increase, $6.8 million was due to mobile messaging costs associated with the Waterfall and Rant & Rave acquisitions, we closed in 2014 and 2015. The acquisitions contributed a cost increase primarily due to a $1.3 million increase in hosting cost, $0.9 million in personnel and related cost, $0.6 million in software cost, and $0.3 million in amortization of intangibles. Cost of subscription and support revenue for the organic portion of our business increased $2.1 million primarily due to a $1.2$2.8 million increase in personnel and related costs, largely due to investment in the customer support and customer success organizations, $0.5$2.1 million increase in depreciation and amortization costs, $1.7 million was due to telephony costs
related to the acquisition of Interfax, $1.1 million was due to hosting and infrastructure costs, and the remaining $1.1 million from miscellaneous costs. The organic portion of our business contributed to a $1.2 million decrease. Of the $1.2 million decrease, $0.4 million was due to a decrease in depreciation and amortization expense for data center and hosting equipment, andprimarily due to a decrease in amortization expense of acquired intangible assets created from our purchase business combinations accounting, $0.3 million in data center hosting fees.was related to personnel and related costs, most of which were the result of our planned operating efficiencies, $0.3 million was related to contractor costs, and the remaining $0.2 million was related to miscellaneous costs.
Cost of professional services revenue was $7.1$5.7 million in 2015,2018, compared to $9.1$5.2 million in 2014, a decrease2017, an increase of $2.0$0.5 million, or 22%10%. Of the decreaseThe acquisitions we closed after January 11, 2017 contributed a $1.5 million increase in cost of professional services revenue. Of the $1.5 million increase, $1.2 million was attributable to personnel and related costs, $0.2 million is attributable to contractor fees, and the remaining $0.1 million was due to miscellaneous expenses. Cost of professional services revenue thefor organic business decreased $2.6$1.0 million primarily due todriven by a $1.7$0.7 million decreasereduction in personnel and related cost, $0.5costs, $0.2 million decrease inattributable to the reduction of contractor fees and $0.3a $0.1 million decreasereduction in employee operational bonus,miscellaneous expenses, most of which are the result of our planned operating efficiencies. The acquisitions we closed in 2014 and 2015 contributed an increase in cost primarily due to a $0.6 million increase to cost of professional services revenue. The primary component of cost of professional services revenue from the acquisitions was due to $0.4 million in personnel and related costs.
Operating Expenses
Sales and Marketing Expense
|
| | | | | | | | | | | | | | | | | | | | |
| Year Ended December 31, |
| 2015 |
| 2014 |
| Change |
| Amount |
| Percent of Revenue |
| Amount |
| Percent of Revenue |
| Amount |
| % Change |
| (dollars in thousands) |
| Sales and marketing | $ | 12,965 |
|
| 19 | % |
| $ | 14,670 |
|
| 23 | % |
| $ | (1,705 | ) |
| (12 | )% |
|
| | | | | | | | | | | | | | | | | |
| Year Ended December 31, |
| 2018 |
| 2017 |
| Change |
| Amount |
| Percent of Revenue |
| Amount |
| Percent of Revenue |
| Amount |
| % Change |
| (dollars in thousands) |
| Sales and marketing | $ | 20,935 |
|
| 14% |
| $ | 15,307 |
|
| 16% |
| $ | 5,628 |
|
| 37% |
Sales and marketing expense was $13.0$20.9 million in 2015,2018, compared to $14.7$15.3 million in 2014, a decrease2017, an increase of $1.7$5.6 million, or 12%37%. Of the decreaseThe acquisitions we closed after January 11, 2017 contributed an increase of $5.4 million in sales and marketing expense $3.4comprised of $4.6 million of personnel and related costs, $0.5 million of increased general marketing spend, and the remaining $0.3 million was driven by miscellaneous costs. The organic business contributed a $0.2 million increase to sales and marketing expense, which was attributable primarily to an increase in personnel and related costs.
Research and Development Expense
|
| | | | | | | | | | | | | | | | | |
| Year Ended December 31, |
| 2018 |
| 2017 |
| Change |
| Amount |
| Percent of Revenue |
| Amount |
| Percent of Revenue |
| Amount |
| % Change |
| (dollars in thousands) |
| Research and development: |
|
|
|
|
|
|
|
|
|
|
|
| Research and development | $ | 21,320 |
|
| 14% |
| $ | 15,795 |
|
| 16% |
| $ | 5,525 |
|
| 35% |
| Refundable Canadian tax credits | (406 | ) |
| —% |
| (542 | ) |
| —% |
| 136 |
|
| (25)% |
| Total research and development | $ | 20,914 |
|
| 14% |
| $ | 15,253 |
|
| 16% |
| $ | 5,661 |
|
| 37% |
Research and development expense was $21.3 million in 2018, compared to $15.8 million in 2017, an increase of $5.5 million, or 35%. The $5.0 million increase from acquisitions closed after January 11, 2017 was comprised of $3.8 million in personnel and related costs, $1.0 million in contractor fees, and $0.2 million of miscellaneous expenses. The organic portion of our business contributed to a $0.5 million increase in research and development costs primarily from increased stock compensation expense.
Refundable Canadian tax credits were $0.4 million in 2018, or flat compared to $0.5 million in 2017.
General and Administrative Expense
|
| | | | | | | | | | | | | | | | | |
| Year Ended December 31, |
| 2018 |
| 2017 |
| Change |
| Amount |
| Percent of Revenue |
| Amount |
| Percent of Revenue |
| Amount |
| % Change |
| (dollars in thousands) |
| General and administrative | $ | 32,041 |
|
| 21% |
| $ | 23,291 |
|
| 24% |
| $ | 8,750 |
|
| 38% |
General and administrative expense was $32.0 million in 2018, compared to $23.3 million in 2017, an increase of $8.7 million, or 38%. The acquisitions we closed after January 11, 2017 contributed a $1.6 million dollar increase to general and administrative expense, which $0.9 million was related to personnel and related expense, $0.4 million was related to administrative fees, and the remaining $0.3 million was related to miscellaneous expenses. General and administrative costs for the organic portion of our business increased by $7.1 million which was related to increases of $3.2 million in non-cash stock compensation expense, $2.1 million in personnel and related expense, $1.0 million in contractor spend, $0.5 million in third party software and equipment, and $0.3 million in miscellaneous expenses.
Depreciation and Amortization Expense
|
| | | | | | | | | | | | | | | | | |
| Year Ended December 31, |
| 2018 |
| 2017 |
| Change |
| Amount |
| Percent of Revenue |
| Amount |
| Percent of Revenue |
| Amount |
| % Change |
| (dollars in thousands) |
| Depreciation and amortization: | | | | | | | | | | | |
| Depreciation | $ | 607 |
| | 1% | | $ | 712 |
| | 1% | | $ | (105 | ) | | (15)% |
| Amortization | 13,665 |
| | 9% | | 5,786 |
| | 6% | | 7,879 |
| | 136% |
| Total depreciation and amortization | $ | 14,272 |
| | 10% | | $ | 6,498 |
| | 7% | | $ | 7,774 |
| | 120% |
Depreciation and amortization expense was $14.3 million in 2018, compared to $6.5 million in 2017, an increase of $7.8 million, or 120%. The acquisitions we closed after January 11, 2017 contributed a $8.4 million increase with the majority resulting from amortization of acquired intangible assets created from our purchase business combinations accounting. The organic portion of our business saw a $0.6 million decrease in depreciation and amortization cost primarily due to a decrease in amortization expense of acquired intangible assets created from our purchase business combinations accounting.
Acquisition-related Expense
|
| | | | | | | | | | | |
| Year Ended December 31, |
| 2018 |
| 2017 |
| Change |
| Amount |
| Percent of Revenue |
| Amount |
| Percent of Revenue |
| Amount |
| % Change |
| (dollars in thousands) |
| Acquisition-related expense | $18,728 |
| 12% |
| $15,092 |
| 15% |
| $3,636 |
| 24% |
Acquisition-related expense was $18.7 million in 2018, compared to $15.1 million in 2017, an increase of $3.6 million, or 24%. The Company made four acquisitions during both 2018 and 2017, respectively. We typically incur acquisition-related expenses for the first year subsequent to each acquisition, with the majority of these cost being incurred within 6 months from the date of acquisition. These expenses can vary based on the size and timing of each transaction. Acquisition-related expenses incurred during the twelve months ended December 31, 2018 increased primarily as a result of the increased size of the four acquisitions made in 2018 compared to the four acquisitions closed in 2017. Cumulative purchase consideration for the 2018 acquisitions was $178.6 million compared to $123.2 million for our 2017 acquisitions. In addition, while our 2017 and 2018 transactions closed
throughout each respective year, the three acquisitions closed in 2016, totaling $31.6 million in purchase consideration, occurred during the first half 2016. As a result, we incurred more acquisition related expenses corresponding to prior year acquisitions during the twelve months ended December 31, 2018 compared to the same period in 2017.
Other Expense, net
|
| | | | | | | | | | | | | | | | | |
| Year Ended December 31, |
| 2018 |
| 2017 |
| Change |
| Amount |
| Percent of Revenue |
| Amount |
| Percent of Revenue |
| Amount |
| % Change |
| (dollars in thousands) |
| Other Expense: |
|
|
|
|
|
|
|
|
|
|
|
| Interest expense, net | $ | (13,273 | ) |
| (9)% |
| $ | (6,582 | ) |
| (7)% |
| $ | (6,691 | ) |
| 102% |
| Other income (expense), net | (1,781 | ) |
| (1)% |
| 289 |
|
| 1% |
| (2,070 | ) |
| (716)% |
| Total other expense | $ | (15,054 | ) |
| (10)% |
| $ | (6,293 | ) |
| (6)% |
| $ | (8,761 | ) |
| 139% |
Interest expense was $13.3 million in 2018, compared to $6.6 million for 2017, an increase of $6.7 million, or 102%. The increase is attributable to increased borrowing under our expanded debt facility to support acquisitions.
Other expense was $1.8 million in 2018, compared to other income of $0.3 million in 2017, an increase of $2.1 million, or 716%. The increase is primarily attributable to increased estimated earnout and holdbacks related to our acquisitions during the twelve month period ended December 31, 2018 compared to the same period in 2017.
Benefit from (Provision for) Income Taxes
|
| | | | | | | | | | | | | | | | | |
| Year Ended December 31, |
| 2018 |
| 2017 |
| Change |
| Amount |
| Percent of Revenue |
| Amount |
| Percent of Revenue |
| Amount |
| % Change |
| (dollars in thousands) |
| Benefit from (provision for) income taxes | $ | 9,809 |
|
| 7% |
| $ | (1,296 | ) |
| (1)% |
| $ | 11,105 |
|
| (857)% |
Benefit from income taxes was $9.8 million in 2018, compared to a provision for income taxes of $1.3 million in 2017, a decrease in provision for income taxes of $11.1 million, or 857%. In 2018 we recorded a benefit from income taxes that was principally attributable to the release of valuation allowance and state and foreign taxes. Approximately $10.1 million of the release of valuation allowance is attributable to acquisitions of domestic entities with deferred tax liabilities that, upon acquisition, allowed us to recognize certain deferred tax assets that had previously been offset by a valuation allowance. Additional valuation allowance was released during the year due to the creation of indefinite life deferred tax assets related to net operating loss and disallowed interest carryforwards. The creation of these indefinite life deferred tax assets allowed us to utilize a portion of our historic indefinite life deferred tax liability related to tax deductible goodwill to recognize additional deferred tax assets that had previously been offset by a valuation allowance. The foreign provision for income taxes in 2018 is principally attributable to net income generated in Canada after reduction for tax credits generated and carried forward . Because we have not generated domestic net income in any period to date, we have recorded a full valuation allowance against our domestic net deferred tax assets, exclusive of any remaining tax deductible goodwill after application of indefinite life deferred tax assets. Realization of any of our domestic deferred tax assets depends upon future earnings, the timing and amount of which are uncertain. Based on analysis of acquired net operating losses, utilization of our net operating losses will be subject to annual limitations due to the ownership change rules under the Code and similar state provisions. In the event we have subsequent changes in ownership, the availability of net operating losses and research and development credit carryovers could be further limited. Income Taxes, of the
Notes to Consolidated Financial Statements for more information regarding our income taxes as they relate to foreign and domestic operations.
Comparison of Years Ended December 31, 2017 and December 31, 2016
Revenue
|
| | | | | | | | | | | | | | | | | |
| | Year Ended December 31, |
| | 2017 | | 2016 | | Change |
| | Amount | | Percent of Revenue | | Amount | | Percent of Revenue | | Amount | | % Change |
| | (dollars in thousands) |
| Revenue: | | | | | | | | | | | |
| Subscription and support | $ | 85,467 |
| | 87% | | $ | 65,552 |
| | 88% | | $ | 19,915 |
| | 30% |
| Perpetual license | 4,346 |
| | 4% | | 1,650 |
| | 2% | | 2,696 |
| | 163% |
| Total product revenue | 89,813 |
| | 91% | | 67,202 |
| | 90% | | 22,611 |
| | 34% |
| Professional services | 8,139 |
| | 9% | | 7,565 |
| | 10% | | 574 |
| | 8% |
| Total revenue | $ | 97,952 |
| | 100% | | $ | 74,767 |
| | 100% | | $ | 23,185 |
| | 31% |
Total revenue was $98.0 million in 2017, compared to $74.8 million in 2016, an increase of $23.2 million, or 31%. Of the increase in total revenue, $23.6 million was due to the acquisitions we closed in 2017 and 2016. Total revenue declined by $0.8 million due to the divestiture of the EPM Live product line at the end of February 2016 and increased by $0.4 million from organic total revenues, or 1% in 2017 compared to 2016.
Subscription and support revenue was $85.5 million in 2017, compared to $65.6 million in 2016, an increase of $19.9 million, or 30%. Of the increase in subscription and support revenue, $19.1 million was due to the acquisitions we closed in 2017 and 2016. Subscription and support revenue declined by $0.5 million due to the divestiture of the EPM Live product line at the end of February 2016. The organic subscription and support revenue increased by $1.3 million, or 2%.
Perpetual license revenue was $4.3 million in 2017, compared to $1.7 million in 2016, an increase of $2.7 million, or 163%. The acquisitions we closed in 2017 and 2016 contributed a $2.9 million increase in perpetual license revenue. Perpetual license revenue declined by $0.1 million due to the divestiture of the EPM Live product line at the end of February 2016 . The organic perpetual revenue declined by $0.1 million, or 8%.
Professional services revenue was $8.1 million in 2017, compared to $7.6 million in 2016, an increase of $0.6 million, or 8%. The acquisitions we closed in 2017 and 2016 contributed a $1.6 million increase to professional services revenue. Professional services revenue declined by $0.2 million due to the divestiture of the EPM Live product line at the end of February 2016. The organic professional services revenue declined by $0.8, or 11%.
Cost of Revenue and Gross Profit Percentage
|
| | | | | | | | | | | | | | | | | |
| | Year Ended December 31, |
| | 2017 | | 2016 | | Change |
| | Amount | | Percent of Revenue | | Amount | | Percent of Revenue | | Amount | | % Change |
| | (dollars in thousands) |
| Cost of revenue: | | | | | | | | | | | |
Subscription and support (1) | $ | 28,454 |
| | 29% | | $ | 22,734 |
| | 30% | | $ | 5,720 |
| | 25% |
| Professional services | 5,193 |
| | 5% | | 4,831 |
| | 7% | | 362 |
| | 7% |
| Total cost of revenue | 33,647 |
| | 34% | | 27,565 |
| | 37% | | 6,082 |
| | 22% |
| Gross profit | $ | 64,305 |
| | 66% | | $ | 47,202 |
| | 63% | | $ | 17,103 |
| | 36% |
| | | | | | | | | | | | |
(1) Includes depreciation and amortization expense as follows: | | | | | | | |
| Depreciation | $ | 1,904 |
| | 2% | | $ | 2,030 |
| | 3% | | $ | (126 | ) | | (6)% |
| Amortization | $ | 3,512 |
| | 4% | | $ | 2,473 |
| | 3% | | $ | 1,039 |
| | 42% |
Cost of subscription and support revenue was $28.5 million in 2017, compared to $22.7 million in 2016, an increase of $5.7 million, or 25%. The 2017 and 2016 acquisitions contributed to a $6.5 million increase in cost of subscription and support revenue. Of the $6.5 million increase, $2.4 million was due to mobile messaging costs associated with the Waterfall acquisition, $1.5 million increase in personnel and related costs, $1.1 million increase in depreciation and amortization costs, $0.5 million was due to cloud hosting and infrastructure, $0.4 million was due to third party software and equipment costs, and the remaining $0.6 million from miscellaneous costs. The divestiture of the EPM Live product line in Q1 2016 contributed to $0.3 million decrease in cost of subscription and support revenue, which was driven by a $0.1 million decrease to personnel and related costs, $0.1 million from depreciation and amortization, and $0.1 million from reduced third party software and equipment costs. The organic portion of our business contributed to a $0.5 million decrease, related to personnel and related costs, most of which were the result of our planned operating efficiencies.
Cost of professional services revenue was $5.2 million in 2017, compared to $4.8 million in 2016, an increase of $0.4 million, or 7%. The acquisitions we closed in 2017 and 2016 contributed a $1.3 million increase in cost of professional services revenue. Of the $1.3 million increase, $1.2 million was attributable to the organic business primarily due to a $1.5 million decrease in sales and solution consultant personnel and related cost, $0.6costs and $0.1 million decrease in marketing program expense, $0.4 million decrease in sales commission expense, $0.4 million decrease in marketing trade show expense, and ais attributable to contractor fees. The divestiture of the EPM Live product line at the end of February 2016 contributed to $0.3 million decrease in bad debt expense,cost of professional services, which was attributable to reduced personnel and related costs. Cost of professional services revenue for organic business decreased $0.6 million driven by a $0.3 million reduction in personnel and related costs, $0.2 million attributable to the reduction of contractor fees and a $0.1 million reduction in miscellaneous expenses, most of which are the result of our planned operating efficiencies.
Operating Expenses
Sales and Marketing Expense
|
| | | | | | | | | | | | | | | | | |
| | Year Ended December 31, |
| | 2017 | | 2016 | | Change |
| | Amount | | Percent of Revenue | | Amount | | Percent of Revenue | | Amount | | % Change |
| | (dollars in thousands) |
| Sales and marketing | $ | 15,307 |
| | 16% | | $ | 12,160 |
| | 16% | | $ | 3,147 |
| | 26% |
Sales and marketing expense was $15.3 million in 2017, compared to $12.2 million in 2016, an increase of $3.1 million, or 26%. The acquisitions we closed in 20142017 and 20152016 contributed an increase of
$1.7 $4.4 million in sales and marketing expense comprised of $2.3 million of personnel and related costs, $1.4 million of commission expense, $0.3 million of increased general marketing spend, and the remaining $0.4 million was driven by
miscellaneous costs. The divestiture of the EPM Live product line in February 2016 contributed to a decrease of $0.1 million in sales and marketing expense comprised of personnel and related expenses. The organic business contributed a $1.1 million decrease to sales and marketing expense, which was attributable primarily due to $0.8a decrease in commission expense of $0.7 million and marketing program expenses of $0.4 million.
Research and Development Expense
|
| | | | | | | | | | | | | | | | | |
| | Year Ended December 31, |
| | 2017 | | 2016 | | Change |
| | Amount | | Percent of Revenue | | Amount | | Percent of Revenue | | Amount | | % Change |
| | (dollars in thousands) |
| Research and development: | | | | | | | | | | | |
| Research and development | $ | 15,795 |
| | 16% | | $ | 14,919 |
| | 20% | | $ | 876 |
| | 6% |
| Refundable Canadian tax credits | (542 | ) | | —% | | (513 | ) | | (1)% | | (29 | ) | | 6% |
| Total research and development | $ | 15,253 |
| | 16% | | $ | 14,406 |
| | 19% | | $ | 847 |
| | 6% |
Research and development expense was $15.8 million in 2017, compared to $14.9 million in 2016, an increase of $0.9 million, or 6%. The $2.6 million increase from acquisitions closed in 2017 and 2016 was comprised of $2.0 million in personnel and related costs, $0.3 million in sales commissions,contractor fees, and $0.3 million of miscellaneous expenses. The divestiture of the EPM Live product in marketing programs,February 2016 contributed a decrease of $0.2 million in research and development expense comprised of $0.1 million of personnel and related costs and $0.1 million inof contractor fees.
Research and Development Expense
|
| | | | | | | | | | | | | | | | | | | | |
| Year Ended December 31, |
| 2015 |
| 2014 |
| Change |
| Amount |
| Percent of Revenue |
| Amount |
| Percent of Revenue |
| Amount |
| % Change |
| (dollars in thousands) |
| Research and development: |
|
|
|
|
|
|
|
|
|
|
|
| Research and development | $ | 15,778 |
|
| 23 | % |
| $ | 26,165 |
|
| 41 | % |
| $ | (10,387 | ) |
| (40 | )% |
| Refundable Canadian tax credits | (470 | ) |
| (1 | )% |
| (1,094 | ) |
| (2 | )% |
| 624 |
|
| (57 | )% |
| Total research and development | $ | 15,308 |
|
| 22 | % |
| $ | 25,071 |
|
| 39 | % |
| $ | (9,763 | ) |
| (39 | )% |
Research and development expense was $15.8 million in 2015, compared The organic portion of our business contributed to $26.2 million in 2014, a decrease of $10.4 million, or 40%. In January 2014, we issued 1,803,574 shares of common stock in connection with an amendment of a technology services agreement with a related party and took a non-cash charge of $11.2 million. Our agreement with the related party is viewed as a fixed purchase commitment contract that obligates us to annual purchase commitments even if we do not take delivery of the contracted services. Since the amended agreement still requires payments for future services that we believe are not discounted from amounts charged to other customers, we believe the fair value of the common stock consideration provided to the related party to amend the agreement does not represent an asset and, accordingly, was expensed immediately. The remaining $1.1$1.5 million decrease in research and development expense for our organic business was primarily due to a decrease incosts from reduced personnel and related costcosts as a result of our planned operating efficiencies.
Refundable Canadian tax credits were $0.5 million in the product development organization, most2017, or flat compared to $0.5 million in 2016.
General and Administrative Expense
|
| | | | | | | | | | | | | | | | | |
| | Year Ended December 31, |
| | 2017 | | 2016 | | Change |
| | Amount | | Percent of Revenue | | Amount | | Percent of Revenue | | Amount | | % Change |
| | (dollars in thousands) |
| General and administrative | $ | 23,291 |
| | 24% | | $ | 18,286 |
| | 24% | | $ | 5,005 |
| | 27% |
General and administrative expense was $23.3 million in 2017, compared to $18.3 million in 2016, an increase of $5.0 million, or 27%. The acquisitions we closed in 2017 and 2016 contributed a $0.6 million dollar increase to general and administrative expense, which are$0.6 million was related to personnel and related expense , which were the result of our planned operating efficiencies. The acquisitions we closeddivestiture of the EPM Live product in 2014 and 2015February 2016 contributed a $1.9 million increase in research and development expense primarily due to $1.6 million in personnel and related cost largely for product development and quality assurance.
Refundable Canadian tax credits were $0.5 million in 2015 compared to $1.1 million in 2014, a decrease of $0.6 million, or 57%. This decrease is primarily due to the favorable Canadian Revenue Agency tax audit results that were recognized in the fourth quarter of 2014.
General and Administrative Expense
|
| | | | | | | | | | | | | | | | | | | | |
| Year Ended December 31, |
| 2015 |
| 2014 |
| Change |
| Amount |
| Percent of Revenue |
| Amount |
| Percent of Revenue |
| Amount |
| % Change |
| (dollars in thousands) |
| General and administrative | $ | 18,201 |
|
| 26 | % |
| $ | 13,561 |
|
| 21 | % |
| $ | 4,640 |
|
| 34 | % |
General and administrative expense was $18.2 million in 2015, compared to $13.6 million in 2014, an increase of $4.6 million, or 34%. Of the increasehad minimal impact in general and administrative expenses, $2.5 million is fromexpense. General and administrative costs for the organic businessesportion of our business increased by $4.4 million which was primarily duerelated to a $1.9 millionan increase in personnel and related cost, $1.5 million increase in employee stock-basednon-cash stock compensation expense, and $0.3 million increase in business insurance, all of which is primarily due to cost increases necessary to operate as a public company. The organic cost increases were partially offset by a $0.5 million decrease in facility and other office related costs, $0.5 million decrease in outsourced professional service fees, and $0.1 million decrease in recruiter fees, most of which are the result of our planned operating efficiencies. The remaining $2.1 million increase in general and administrative expense was attributable to the acquisitions we closed in 2014 and 2015 primarily due to personnel and related costs.expense.
Depreciation and Amortization Expense
| |
| Year Ended December 31, | Year Ended December 31, |
| 2015 |
| 2014 |
| Change | 2017 | | 2016 | | Change |
| Amount |
| Percent of Revenue |
| Amount |
| Percent of Revenue |
| Amount |
| % Change | Amount | | Percent of Revenue | | Amount | | Percent of Revenue | | Amount | | % Change |
| (dollars in thousands) | (dollars in thousands) |
| Depreciation and amortization: |
|
|
|
|
|
|
|
|
|
|
| | | | | | |
| Depreciation | $ | 452 |
|
| 1 | % |
| $ | 987 |
|
| 2 | % |
| $ | (535 | ) |
| (54 | )% | $ | 712 |
| | 1% | | $ | 657 |
| | 1% | | $ | 55 |
| | 8% |
| Amortization | 4,083 |
|
| 5 | % |
| 3,323 |
|
| 5 | % |
| 760 |
|
| 23 | % | 5,786 |
| | 6% | | 4,634 |
| | 6% | | 1,152 |
| | 25% |
| Total depreciation and amortization | $ | 4,534 |
|
| 6 | % |
| $ | 4,310 |
|
| 7 | % |
| $ | 224 |
|
| 5 | % | $ | 6,498 |
| | 7% | | $ | 5,291 |
| | 7% | | $ | 1,207 |
| | 23% |
Depreciation and amortization expense was $4.5$6.5 million in 2015,2017, compared to $4.3$5.3 million in 2014,2016, an increase of $0.2$1.2 million, or 5%23%. The acquisitions we closed in 20142017 and 20152016 contributed a $0.9$2.3 million increase with the majority resulting from amortization of intangibles expense.acquired intangible assets created from our purchase business combinations accounting. The organic businesses realizedportion of our business saw a $0.7$1.1 million decrease in depreciation of equipment and other depreciable assetsamortization cost primarily due to planned operating efficiencies.a decrease in amortization expense of acquired intangible assets created from our purchase business combinations accounting. This divestiture of the EPM Live product in February 2016 did not have a significant impact to depreciation and amortization expense.
Acquisition-related Expense
|
| | | | | | | | | | | | | | | | | | | | |
| Year Ended December 31, |
| 2015 |
| 2014 |
| Change |
| Amount |
| Percent of Revenue |
| Amount |
| Percent of Revenue |
| Amount |
| % Change |
| (dollars in thousands) |
| Acquisition-related expense | $ | 2,455 |
|
| 4 | % |
| $ | 2,186 |
|
| 3 | % |
| $ | 269 |
|
| 12 | % |
|
| | | | | | | | | | | |
| | Year Ended December 31, |
| | 2017 | | 2016 | | Change |
| | Amount | | Percent of Revenue | | Amount | | Percent of Revenue | | Amount | | % Change |
| | (dollars in thousands) |
| Acquisition-related expense | $15,092 | | 15% | | $5,583 | | 7% | | $9,509 | | 170% |
One-time acquisition-related expense was $2.5$15.1 million in 2015,2017, compared to $2.2$5.6 million in 2014,2016, an increase of $0.3$9.5 million, or 12%170%. The one-time acquisition-related expenses vary byCompany made four acquisitions during 2017, this acquisition and these costs are expensed as incurred such thatactivity was substantially more than the one-time acquisition-related expenses from our acquisitionthree acquisitions closed in late 2013 were expensed in both 2013 and 2014, such costs for our acquisitions in late 2014 were expensed in both 2014 and 2015, and much of the one-time acquisition-related expenses for our acquisition in late 2015 were expensed in 2015.2016. As a result, year-over-year comparisons of these expenses are not necessarily meaningful due to their one-time nature.
Other Expense, net
| |
| Year Ended December 31, | Year Ended December 31, |
| 2015 |
| 2014 |
| Change | 2017 | | 2016 | | Change |
| Amount |
| Percent of Revenue |
| Amount |
| Percent of Revenue |
| Amount |
| % Change | Amount | | Percent of Revenue | | Amount | | Percent of Revenue | | Amount | | % Change |
| (dollars in thousands) | (dollars in thousands) |
| Other Expense: |
|
|
|
|
|
|
|
|
|
|
| | | | | | |
| Interest expense, net | $ | (1,858 | ) |
| (3 | )% |
| $ | (1,951 | ) |
| (3 | )% |
| $ | 93 |
|
| (5 | )% | $ | (6,582 | ) | | (7)% | | $ | (2,781 | ) | | (4)% | | $ | (3,801 | ) | | 137% |
| Other income (expense), net | (544 | ) |
| — | % |
| 101 |
|
| — | % |
| (645 | ) |
| (639 | )% | 289 |
| | 1% | | (678 | ) | | (1)% | | 967 |
| | (143)% |
| Total other expense | $ | (2,402 | ) |
| (3 | )% |
| $ | (1,850 | ) |
| (3 | )% |
| $ | (552 | ) |
| 30 | % | $ | (6,293 | ) | | (6)% | | $ | (3,459 | ) | | (5)% | | $ | (2,834 | ) | | 82% |
Interest expense was $1.9$6.6 million in 2015,2017, compared to $2.0$2.8 million for 2014,2016, an increase of $3.8 million, or 137%. The increase is attributable to increased borrowing under our expanded debt facility to support acquisitions.
Other income was $0.3 million in 2017, compared to other expense of $0.7 million in 2016, a decrease of $0.1$1.0 million, or 5%143%.
Other expense The decrease in expenses was $0.5driven by the loss on the divestiture of EPM Live of $0.7 million in 2015, compared to other income of $0.1 million in 2014, an increase of $0.6 million, or 639%. The increase in other expense was primarily due to loss on foreign currency translation.February 2016.
(Provision for) Benefit from Income Taxes
|
| | | | | | | | | | | | | | | | | | | | |
| Year Ended December 31, |
| 2015 |
| 2014 |
| Change |
| Amount |
| Percent of Revenue |
| Amount |
| Percent of Revenue |
| Amount |
| % Change |
| (dollars in thousands) |
| (Provision for) Benefit from Income Taxes | $ | (1,039 | ) |
| (1 | )% |
| $ | 78 |
|
| — | % |
| $ | (1,117 | ) |
| (1,432 | )% |
|
| | | | | | | | | | | | | | | | | |
| | Year Ended December 31, |
| | 2017 | | 2016 | | Change |
| | Amount | | Percent of Revenue | | Amount | | Percent of Revenue | | Amount | | % Change |
| | (dollars in thousands) |
| (Provision for) Benefit from Income Taxes | $ | (1,296 | ) | | (1)% | | $ | (1,530 | ) | | (2)% | | $ | 234 |
| | (15)% |
Provision for income taxes was $1.0$1.3 million in 2015,2017, compared to the benefit from income taxes of $0.1$1.5 million in 2014, an increase2016, a decrease in provision for income taxes of $1.1$0.2 million, or 1,432%15%. In 2015,2017 we recorded income taxes that were principally attributable to state and foreign taxes, other than deferred taxes related to tax deductible goodwill. The foreign provision for income taxes in 20152017 is principally attributable to net income generated in excess of net operating loss carryforwardsCanada after reduction for tax credits generated and reduction of tax credit carryforwards in Canada.carried forward. Because we have not generated domestic net income in any period to date, we have recorded a full valuation allowance against our domestic net deferred tax assets, exclusive of tax deductible goodwill. Realization of any of our domestic deferred tax assets depends upon future earnings, the timing and amount of which are uncertain. Based on analysis of acquired net operating losses, utilization of our net operating losses will be subject to annual limitations due to the ownership change rules under the Code and similar state provisions. In the event we have subsequent changes in ownership, the availability of net operating losses and research and development credit carryovers could be further limited. See Note 6 Income Taxes, of the Notes to Consolidated Financial Statements for more information regarding our income taxes as they relate to foreign and domestic operations.
Comparison of Fiscal Years Ended December 31, 2014 and 2013
Revenue
|
| | | | | | | | | | | | | | | | | | | | |
| | Year Ended December 31, |
| | 2014 | | 2013 | | Change |
| | Amount | | Percent of Revenue | | Amount | | Percent of Revenue | | Amount | | % Change |
| | (dollars in thousands) |
| Revenue: | | | | | | | | | | | |
| Subscription and support | $ | 48,625 |
| | 75 | % | | $ | 30,887 |
| | 75 | % | | $ | 17,738 |
| | 57 | % |
| Perpetual license | 2,787 |
| | 4 | % | | 2,003 |
| | 5 | % | | 784 |
| | 39 | % |
| Total product revenue | 51,412 |
| | 79 | % | | 32,890 |
| | 80 | % | | 18,522 |
| | 56 | % |
| Professional services | 13,162 |
| | 21 | % | | 8,303 |
| | 20 | % | | 4,859 |
| | 59 | % |
| Total revenue | $ | 64,574 |
| | 100 | % | | $ | 41,193 |
| | 100 | % | | $ | 23,381 |
| | 57 | % |
Total revenue was $64.6 million in 2014, compared to $41.2 million in 2013, an increase of $23.4 million, or 57%. Of the increase in total revenue, $21.7 million was due to the 2013 and 2014 acquisitions. The remaining $1.7 million increase in total revenue was due to the organic portion of our business. Additionally, total revenue from our Canada operations were $1.2 million lower in 2014 compared to 2013 due to the change in the foreign currency exchange rate between the Canadian dollar versus the U.S. dollar for those periods. Therefore, on a constant currency basis, our organic revenue increased organically by $2.9 million, or 7%.
Subscription and support revenue increased $17.7 million, or 57%, in 2014 as compared to 2013. Of the increase in subscription and support revenue, $17.3 million was due to the 2013 and 2014 acquisitions. The organic portion of our business contributed $0.4 million to the subscription and support revenue. Additionally, subscription and support revenue from our Canada operations were $0.9 million lower in 2014 compared to 2013 due to the change in the foreign currency exchange rate between the Canadian dollar versus the U.S. dollar for those periods. Therefore, on a constant currency basis, our organic subscription and support revenue increased organically by $1.3 million, or 4%.
Perpetual license revenue increased $0.8 million, or 39%, in 2014 as compared to 2013. The 2013 and 2014 acquisitions contributed $0.9 million in perpetual license revenue in 2014 as compared to 2013. This increase was partially offset by a $0.1 million decrease in the organic portion of our business. Additionally, perpetual license revenue from our Canada operations were $0.1 million lower in 2014 compared to 2013 due to the change in the foreign currency exchange rate between the Canadian dollar versus the U.S. dollar for those periods.
Professional services revenue increased $4.9 million, or 59%, in 2014 as compared to 2013. Of the increase in professional services revenue, $3.6 million was due to the 2013 and 2014 acquisitions. The organic portion of our business contributed an increase of $1.3 million to professional services revenue. Additionally, professional services revenue from our Canada operations were $0.2 million lower in 2014 compared to 2013 due to the change in the foreign currency exchange rate between the Canadian dollar versus the U.S. dollar for those periods. Therefore, on a constant currency basis, our organic professional services revenue increased organically by $1.5 million, or 18%.
Cost of Revenue and Gross Margin
|
| | | | | | | | | | | | | | | | | | | | |
| | Year Ended December 31, |
| | 2014 | | 2013 | | Change |
| | Amount | | Percent of Revenue | | Amount | | Percent of Revenue | | Amount | | % Change |
| | (dollars in thousands) |
| Cost of revenue: | | | | | | | | | | | |
Subscription and support (1) | $ | 14,042 |
| | 22 | % | | $ | 7,787 |
| | 19 | % | | $ | 6,255 |
| | 80 | % |
| Professional services | 9,079 |
| | 14 | % | | 5,680 |
| | 14 | % | | 3,399 |
| | 60 | % |
| Total cost of revenue | 23,121 |
| | 36 | % | | 13,467 |
| | 33 | % | | 9,654 |
| | 72 | % |
| Gross profit | $ | 41,453 |
| | 64 | % | | $ | 27,726 |
| | 67 | % | | $ | 13,727 |
| | 50 | % |
| | | | | | | | | | | | |
(1) Includes depreciation and amortization expense as follows: | | | | | | | |
| Depreciation | $ | 1,303 |
| | 2 | % | | $ | 455 |
| | 1 | % | | $ | 848 |
| | 186 | % |
| Amortization | $ | 1,844 |
| | 3 | % | | $ | 1,185 |
| | 3 | % | | $ | 659 |
| | 56 | % |
Cost of subscription and support revenue was $14.0 million in 2014, compared to $7.8 million in 2013, an increase of $6.3 million, or 80%. Of the increase in cost of subscription and support revenue, $5.3 million was due to the 2013 and 2014 acquisitions. The acquisitions contributed a $1.4 million increase in travel and related costs, a $1.3 million increase in depreciation and amortization, a $1.2 million increase in personnel and related costs, a $0.8 million increase in data center hosting fees, a $0.4 million increase in software fees, a $0.1 million increase in contractor fees, and a $0.1 million increase in the facility allocation. Cost of subscription and support revenue for the organic portion of our business increased $1.0 million primarily due to a $1.2 million increase in personnel and related costs, a $0.5 million increase in server license and software fees, a $0.4 million increase in contractor fees, a $0.2 million increase in data center hosting fees, and a $0.2 million increase in depreciation and amortization. These increases were partially offset by a $1.5 million decrease in travel and related costs and a $0.1 million decrease in recruiting fees.
Cost of professional services revenue was $9.1 million in 2014, compared to $5.7 million in 2013, an increase of $3.4 million, or 60%. Of the increase in cost of professional services revenue, $2.3 million was due to the 2013 and 2014 acquisitions. The acquisitions contributed a $1.3 million increase in personnel and related costs and a $1.0 million increase in contractor fees. Cost of professional services revenue for the organic portion of our business increased $1.1 million primarily due to a $0.5 million increase in personnel and related costs, a $0.4 million increase in other operating expenses primarily due to an accounting reclass entry within cost of revenue, and a $0.2 million increase in contractors.
Operating Expenses
|
| | | | | | | | | | | | | | | | | | | | |
| | Year Ended December 31, |
| | 2014 | | 2013 | | Change |
| | Amount | | Percent of Revenue | | Amount | | Percent of Revenue | | Amount | | % Change |
| | (dollars in thousands) |
| Sales and marketing | $ | 14,670 |
| | 23 | % | | $ | 10,625 |
| | 26 | % | | $ | 4,045 |
| | 38 | % |
Sales and marketing expense was $14.7 million for 2014, compared to $10.6 million for 2013, an increase of $4.0 million, or 38%. Of the increase in sales and marketing, $2.6 million was attributable to the 2013 and 2014 acquisitions. The increase from acquisitions was due to a $1.9 million increase in personnel and related costs, a $0.4 million increase in marketing programs and trade shows, a $0.2 million increase in contractor fees, and a $0.1 million increase in bad debt expense. Sales and marketing expense for the organic portion of our business increased $1.4 million primarily due to a $0.3 million increase in contractor fees, a $0.3 million increase in personnel and related costs, a $0.2 million increase in software fees, a $0.2 million increase in travel and related costs, a $0.1 million increase in recruiting fees, and a $0.1 million increase in marketing subscriptions.
|
| | | | | | | | | | | | | | | | | | | | |
| | Year Ended December 31, |
| | 2014 | | 2013 | | Change |
| | Amount | | Percent of Revenue | | Amount | | Percent of Revenue | | Amount | | % Change |
| | (dollars in thousands) |
| Research and development: | | | | | | | | | | | |
| Research and development | $ | 26,165 |
| | 41 | % | | $ | 10,340 |
| | 25 | % | | $ | 15,825 |
| | 153 | % |
| Refundable Canadian tax credits | (1,094 | ) | | (2 | )% | | (583 | ) | | (1 | )% | | (511 | ) | | 88 | % |
| Total research and development | $ | 25,071 |
| | 39 | % | | $ | 9,757 |
| | 24 | % | | $ | 15,314 |
| | 157 | % |
Research and development expense was $26.2 million for 2014, compared to $10.3 million for 2013, an increase of $15.8 million, or 153%. In January 2014, we issued 1,803,574 shares of common stock in connection with an amendment of a technology services agreement with a related party and took a non-cash charge of $11.2 million. Our agreement with the related party is viewed as a fixed purchase commitment contract that obligates us to annual purchase commitments even if we do not take delivery of the contracted services. Since the amended agreement still requires payments for future services that we believe are not discounted from amounts charged to other customers, we believe the fair value of the common stock consideration provided to the related party to amend the agreement does not represent an asset and, accordingly, was expensed immediately. The remaining $1.0 million increase in research and development expense for our organic businesses was primarily due to a $0.7 million increase in personnel and related costs, a $0.1 million increase in travel and related costs, and a $0.1 million increase in software and equipment expense. The 2013 and 2014 acquisitions contributed a $3.6 million increase in research and development expense primarily due to a $3.2 million increase in personnel and related costs, and a $0.3 million increase in contractor fees.
Refundable Canadian tax credits were $1.1 million for 2014 compared to $0.6 million for 2013 an increase of $0.5 million, or 88%. This increase is primarily due to favorable Canadian Revenue Agency tax audit results.
|
| | | | | | | | | | | | | | | | | | | | |
| | Year Ended December 31, |
| | 2014 | | 2013 | | Change |
| | Amount | | Percent of Revenue | | Amount | | Percent of Revenue | | Amount | | % Change |
| | (dollars in thousands) |
| General and administrative | $ | 13,561 |
| | 21 | % | | $ | 6,832 |
| | 17 | % | | $ | 6,729 |
| | 98 | % |
General and administrative expense was $13.6 million for 2014, compared to $6.8 million for 2013, an increase of $6.7 million, or 98%. Of the increase in general and administrative expenses, $4.0 million is from the organic businesses due to a $1.0 million increase in outsourced legal (including $0.3 million of non-recurring litigation costs incurred during the quarter ended December 31, 2014), audit, tax, and human resource fees, a $1.0 million increase in contractor fees, a $0.5 million increase in recruiting fees, a $0.5 million increase in employee stock-based compensation expense, a $0.4 million increase in management fee allocations, a $0.4 million increase in software and equipment related expenses, and a $0.2 million increase in travel and related costs. The remaining $2.7 million increase in general and administrative expense was attributable to the 2013 and 2014 acquisitions. The acquisitions contributed a $1.5 million increase in personnel and related costs, a $0.8 million increase in facility and other office related expenses, a $0.2 million increase in contractor fees, and a $0.1 million increase in recruiting and outsourced service fees.
|
| | | | | | | | | | | | | | | | | | | | |
| | Year Ended December 31, |
| | 2014 | | 2013 | | Change |
| | Amount | | Percent of Revenue | | Amount | | Percent of Revenue | | Amount | | % Change |
| | (dollars in thousands) |
| Depreciation and amortization: | | | | | | | | | | | |
| Depreciation | $ | 987 |
| | 2 | % | | $ | 348 |
| | 1 | % | | $ | 639 |
| | 184 | % |
| Amortization | 3,323 |
| | 5 | % | | 3,322 |
| | 8 | % | | 1 |
| | — | % |
| Total depreciation and amortization | $ | 4,310 |
| | 7 | % | | $ | 3,670 |
| | 9 | % | | $ | 640 |
| | 17 | % |
Depreciation and amortization expense was $4.3 million for 2014, compared to $3.7 million for 2013, an increase of $0.6 million, or 17%. The 2013 and 2014 acquisitions contributed $1.3 million to the increase with the majority resulting from amortization expense. The organic businesses contributed a $0.7 million decrease primarily due to the $1.1 million impairment charge of the PowerSteering trade name that occurred in 2013. See Note 5 of the Notes to Consolidated Financial Statements for more information regarding the impairment charge which is noted in Goodwill and Other Intangible Assets.
|
| | | | | | | | | | | | | | | | | | | | |
| | Year Ended December 31, |
| | 2014 | | 2013 | | Change |
| | Amount | | Percent of Revenue | | Amount | | Percent of Revenue | | Amount | | % Change |
| | (dollars in thousands) |
| Acquisition-related expense | $ | 2,186 |
| | 3 | % | | $ | 1,461 |
| | 3 | % | | $ | 725 |
| | 50 | % |
One-time acquisition related expense was $2.2 million for 2014, compared to $1.5 million for 2013, an increase of $0.7 million, or 50%. The increase was due to acquisition-related expenses for the acquisitions we closed in late 2013, being incurred partially in 2014, and the acquisitions we closed in late 2014 also being incurred and accrued in 2014.
Other Expense, net
|
| | | | | | | | | | | | | | | | | | | | |
| | Year Ended December 31, |
| | 2014 | | 2013 | | Change |
| | Amount | | Percent of Revenue | | Amount | | Percent of Revenue | | Amount | | % Change |
| | (dollars in thousands) |
| Other Expense: | | | | | | | | | | | |
| Interest expense, net | $ | (1,951 | ) | | (3 | )% | | $ | (2,797 | ) | | (7 | )% | | $ | 846 |
| | (30 | )% |
| Other income (expense), net | 101 |
| | — | % | | (431 | ) | | (1 | )% | | 532 |
| | (123 | )% |
| Total other expense | $ | (1,850 | ) | | (3 | )% | | $ | (3,228 | ) | | (8 | )% | | $ | 1,378 |
| | (43 | )% |
Interest expense was $2.0 million for 2014, compared to $2.8 million for 2013, a decrease in interest expense of $0.8 million, or 30%. The decrease was primarily due to the effect of a beneficial conversion feature on convertible promissory notes payable which resulted in higher non-cash interest expense for 2013.
Other income was $0.1 million for 2014, compared to other expense of $0.4 million for 2013, a decrease in expense of $0.5 million, or 123%. The decrease in other expense was primarily due to gains on foreign currency translation.
Benefit from (Provision for) Income Taxes
|
| | | | | | | | | | | | | | | | | | | | |
| | Year Ended December 31, |
| | 2014 | | 2013 | | Change |
| | Amount | | Percent of Revenue | | Amount | | Percent of Revenue | | Amount | | % Change |
| | (dollars in thousands) |
| Benefit from (provision for) Income Taxes | $ | 78 |
| | 1 | % | | $ | (708 | ) | | (1 | )% | | $ | 786 |
| | (111 | )% |
Benefit from income taxes was $0.1 million for 2014, compared to the provision for income taxes of $0.7 million for 2013, a decrease in provision for income taxes of $0.8 million, or 111%. In 2014 and 2013, we recorded income taxes that were principally attributable to state and foreign taxes, other than deferred taxes related to tax deductible goodwill. The foreign benefit for income taxes in 2014 is attributable to changes in deferred taxes, primarily generation of a net operating loss for the current year in Canada. Because we have not generated domestic net income in any period to date, we have recorded a full valuation allowance against our domestic net deferred tax assets, exclusive of tax deductible goodwill. Realization of any of our domestic deferred tax assets depends upon future earnings, the timing and amount of which are uncertain. Based on analysis of acquired net operating losses, utilization of our net operating losses will be subject to annual limitations due to the ownership change rules under the Code and similar state provisions. In the event we have subsequent changes in ownership, the availability of net operating losses and research and development credit carryovers could be further limited.
Liquidity and Capital Resources
To date, we have financed our operations primarily through capital raising both through private placements of preferred stock and common stock andincluding sales of our common stock, in our initial public offering, cash from operating activities, and to a lesser extent, borrowing under our loancredit facility, and the issuance of seller notes. notes to sellers in some of our acquisitions. We believe that current cash and cash equivalents, cash flows from operating activities, availability under our existing credit facility, as discussed below, and the ability to offer and sell securities pursuant to our registration statement, as discussed below, will be sufficient to fund our operations for at least the next twelve months. In addition, we intend to utilize the sources of capital available to us under our Credit Facility and registration statement to support our continued growth via acquisitions within our core enterprise solution suites of complementary technologies and businesses.
As of December 31, 2015,2018, we had cash and cash equivalents of $18.5$16.7 million, $20.0$60.0 million of available borrowingscommitted capital under our loancredit facility, $55.0 million available under the uncommitted accordion in our credit facility, and $24.4$283.2 million of borrowings outstanding under our loancredit facility. See further discussionAs of December 31, 2017 we had $113.8 million of borrowings outstanding under our credit facility. Our cash and cash equivalents held by our foreign subsidiaries was $13.4 million as of December 31, 2018. If these funds are needed for our domestic operations, we would be required to accrue and pay U.S. taxes to repatriate these funds. However, our intent is to permanently reinvest these funds outside the heading Loan Facility Note 7U.S. and our current plans do not demonstrate a need to repatriate them to fund our domestic operations. We do not provide for federal income taxes on the audited consolidated financial statements included elsewhere in this Annual Report for further details.undistributed earnings of our foreign subsidiaries.
On November 12, 2014, the Company completed its initial public offering, or IPO,As of 3,846,154 sharesDecember 31, 2018 and December 31, 2017, we had a working capital deficit of common stock, at a price of $12.00 per share, before underwriting discounts and commissions. The Company sold all of such shares. The IPO generated net proceeds of approximately $42.9 million, after deducting underwriting discounts and commissions. Expenses incurred by us for the IPO were approximately $4.1$40.4 million and were recorded against the proceeds received from the IPO. The Company has used,a deficit of $23.5 million, respectively, which included $57.6 million and plans to use, the proceeds to finance growth by investing in or acquiring complementary companies, products, or technologies, growing sales of its applications globally, and improving and enhancing its applications.
The following table summarizes our cash flows for the periods indicated (including cash flows from discontinued operations): |
| | | | | | | | | | | |
| Year Ended December 31, |
| 2015 | | 2014 | | 2013 |
| (dollars in thousands) |
| Consolidated Statements of Cash Flow Data: | | | | | |
| Net cash provided by (used in) operating activities | $ | (1,503 | ) | | $ | 1,177 |
| | $ | (239 | ) |
| Net cash used in investing activities | (9,411 | ) | | (7,078 | ) | | (28,565 | ) |
| Net cash provided by (used in) financing activities | (1,221 | ) | | 32,384 |
| | 29,564 |
|
| Effect of exchange rate fluctuations on cash | (380 | ) | | (198 | ) | | 51 |
|
| Change in cash and cash equivalents | (12,515 | ) | | 26,285 |
| | 811 |
|
| Cash and cash equivalents, beginning of period | 30,988 |
| | 4,703 |
| | 3,892 |
|
| Cash and cash equivalents, end of period | $ | 18,473 |
| | $ | 30,988 |
| | $ | 4,703 |
|
Cash Flows from Operating Activities
Cash used in operating activities is significantly influenced by the amount of cash we invest in personnel and infrastructure to support the anticipated growth of our business. Our operating assets and liabilities consist primarily of receivables from clients and unbilled professional services, accounts payable and accrued expenses and deferred revenues. The volume of professional services rendered and the related timing of collections on those bookings, as well as payments of our accounts payable and accrued payroll and related benefits affect these account balances.
Our cash provided by operating activities for the year ended 2015 primarily reflects our net loss of $13.7 million, offset by non-cash expenses that included $8.5 million of depreciation and amortization, $0.2$43.8 million of deferred income taxes, $1.0 millionrevenue recorded as a current liability as of foreign currency re-measurement loss, $0.4 million of non-cash interest expense,December 31, 2018 and $2.7 million of non-cash stock compensation expense. Working capital sources of cash included a $0.7 million decrease in accounts receivable, a $1.9 million decrease in prepaids and other, and a $0.2 million increase in accounts payable. These sources of cash were offset by a $2.8 million decrease in accrued expenses and other liabilities and a $0.6 million decrease in deferred revenue.
Our cash provided by operating activities for the year ended 2014 primarily reflects our net loss of $20.1 million, offset by non-cash expenses that included a $11.2 million charge for the 1,803,574 shares of common stock
issued to DevFactory, $7.5 million of depreciation and amortization, $0.6 million of non-cash interest expense, and $1.1 million of non-cash stock compensation expense. Working capital sources of cash included a $0.5 million decrease in prepaids and other assets, a $2.6 million increase inDecember 31, 2017, respectively. This deferred revenue and a $0.6 million increasewill be recognized in accounts payable. These sources of cash were offset by a $1.6 million increase in accounts receivable and a $0.9 million decrease in accrued expenses and other liabilities .
Our cash used in operating activities for fiscal 2013 primarily reflects our net loss of $9.2 million, offset by non-cash expenses that included $5.6 million of depreciation and amortization, $1.6 million of non-cash interest expense, and $0.5 million of non-cash stock compensation expense. Working capital sources of cash included $2.9 million decrease in accounts receivable and $2.2 million of increases in accrued expenses and other liabilities. These sources of cash were offset by a $1.6 million increase in prepaids and other, a $1.1 million decrease in accounts payable, and a $1.0 million decrease in deferred revenue. A substantial source of cash is providedfuture periods as a result of invoicing for subscriptions in advance, which is recorded as deferred revenue, and is included on our consolidated balance sheet as a liability. Deferred revenue consists of the unearned portion of booked fees for our software subscriptions and support, which is amortized into revenueunderlying performance obligations are delivered in accordance with our revenue recognition policy. We assess our liquidity, in part, through an analysis of new subscriptions booked, expected cash receipts on new and existing subscriptions, and our ongoing operating expense requirements.
Cash Flows from Investing Activities
Our primary investing activities have consisted of acquisitions of complementary technologies, products and businesses. As our business grows, we expect our primary investing activities to continue to further expand our family of software applications and infrastructure and support additional personnel. For fiscal 2015, 2014 and 2013 cash used in investing activities for business combinations consisted of $7.7 million, $6.2 million and $28.2 million, respectively. In addition, for fiscal 2015, 2014 and 2013, we used $1.0 million, $0.9 million and $0.3 million, respectively, for the purchases of property and equipment.
Cash Flows from Financing Activities
Our primary financing activities have consisted of capital raised to fund our operations as well as proceeds from debt obligations entered into to finance our operations. For fiscal 2015, cash provided by financing activities consisted primarily of $24.1 million in proceeds from debt, offset by $23.9 million for repayment of debt. For fiscal 2014, cash provided by financing activities consisted primarily of $38.8 million in proceeds from the issuance of common stock, net of issuance costs in our November, 2014 IPO and $5.7 million in proceeds from debt, offset by $10.9 million for repayment of debt. For fiscal 2013, cash provided by financing activities consisted primarily of $19.7 million in proceeds from the issuance of preferred stock and $28.0 million in proceeds from debt, offset by $17.5 million for repayment of debt.
Loan and Security AgreementsCredit Facility
On May 14, 2015, Upland Software, Inc. (the “Company”)we entered into a Credit Agreementcredit agreement (the “Credit Agreement”) with a consortium of lenders (the “Lenders”), Wells Fargo Capital Finance, as agent, providing for a secured credit facility (the “Loan Facility”) that replaces and refinances (i) the Company’s existing Loan and Security Agreement dated March 5, 2012 between the Company, certain of its subsidiaries, and Comerica Bank,each of the lenders named in the Credit Facility. From time to time we enter into amendments to the Credit Facility typically to expand the available borrowing limit in order to fund the Company's acquisitions. Refer to the 'Amendments' section below for a summary of the significant changes made to our Credit Facility as amended (the “U.S. Comerica Agreement”) and (ii) an existing Canadian Loan and Security Agreement dated February 10, 2012 with Comerica Bank, as amended (the “Canadian Comerica Agreement”).a result of current year amendments.
As of December 31, 2015, there was (i) $0.02018 the Credit Facility, as amended, now provides for a $400.0 million credit facility, including a $283.2 million outstanding term loan, a $30.0 million delayed draw term loan commitment, a $30.0 million revolving loan commitment, and a $55.0 million uncommitted accordion.
Amendments
During the year ended December 31, 2018 we entered into amendments six through nine (the “Amendments”) in U.S. revolving loansconnection with our 2018 acquisitions. The main provision of The Amendments provide for, among other things:
Expansion of the Credit Facility from $200 million as of December 31, 2017 to $400.0 million as of December 31, 2018;
A favorable adjustment to decrease the overall applicable interest rate for accounts outstanding under the Credit Agreement, (ii) $0.0 million drawn on the Canadian revolving credit facility, (iii) $18.5 million in U.S. term loans outstanding under the Credit Agreement; and (iv) $5.9 million in Canadian term loans outstanding under the Credit Agreement.
Loans
The Credit Agreement provides for upFacility by 50 to $60.0 million of financing credit as outlined below.
The Credit Agreement provides (i) a U.S. revolving credit facility150 basis points resulting in an aggregate principaleffective interest rate as of December 31, 2018 6.40%, down from the previous effective interest rate as of December 31, 2017 of approximately 7.0%;
A favorable adjustment to the leverage ratio to increase the amount of upfunded indebtedness to $9.0 million (the “U.S. Revolver”), (ii) a U.S. termEBITDA (as defined in the Amendment) to 4.75 to 1.00 during 2018, along with additional leverage ratio improvements throughout the remainder of the loan facility in an aggregate principal amount of upterm;
A favorable increase to $19.0 million (the “U.S. Term Loan”), (iii) athe recurring revenue ratio future draw condition to the delayed draw term loan facility in an aggregate principal amount of upfrom 1.25:1.0 to $10.0 million (the “DDTL”). (iv) a Canadian revolving credit facility in an aggregate principal amount of up to $1.0 million (the “Canadian Revolver”1.50:1.0; and together with the U.S. Revolver, the “Revolver”); and (ii) a Canadian term loan facility in an aggregate principal amount of up to $6.0 million (the “Canadian Term Loan” and, together with the U.S. Term Loan, the “Term Loan”).
The Credit Agreement also includes provisions for optional, uncommitted increasesAn increase in the maximum size of the loan facility available under the Credit Agreement by an aggregate principal amount of $15.0 million upon the satisfaction of the terms and conditions set forthfixed charge coverage ratio (as defined in the Credit Agreement.Facility) from 1.10 to 1.25;
In addition,
A waiver of the requirement that Interfax Communications Limited, Data Guard Limited and Return Fax 2000 Limited become Canadian Guarantors and join the Canadian Guarantee and Security Agreement as Grantors; and
Clarification of certain definitions within the Credit Agreement permits the Borrowers to incur subordinated, unsecured indebtedness owing to sellers in connection with the consummation of one or more permitted acquisitions upon the satisfaction of the terms and conditions set forth in the Facility.
Credit Agreement so long as the aggregate principal amount for all such subordinated, unsecured indebtedness does not exceed $10.0 million at any one time outstanding.
Terms of Revolver
Loans under the Revolver are available up to the lesser of (i) $10.0 million (the “Maximum Revolver Amount”) or (ii) the result of (a) 0.80 multiplied by (subject to step-downs beginning June 30, 2016) of certain subsidiaries' recurring revenues on a trailing twelve month basis, minus (b) the outstanding balance of the Term Loans and any swing line loans made under the Credit Agreement (such amount, the “Credit Amount”). The Revolver provides a subfacility whereby Borrowers may request letters of credit (the “Letters of Credit”) in an aggregate amount not to exceed, at any one time outstanding, $0.5 million and $0.25 million, from the U.S & Canadian facilities, respectively. The aggregate amount of outstanding Letters of Credit are reserved against the credit availability under the Maximum Revolver Amount and the Credit Amount.
Loans under the Revolver may be borrowed, repaid and reborrowed until May 14, 2020 (the “Maturity Date”), at which time all amounts borrowed under the Credit Agreement must be repaid.
Terms of Term LoansFacility Covenants
The Term Loans are repayable, on a quarterly basis beginning September 30, 2015, by an amount equal to 5.0% per annum of the original principal amount of such loan. Any amount remaining unpaid is due and payable in full on the Maturity Date.
Terms of Delay Draw Term Loan
Pursuant to the terms of the Credit Agreement, the DDTL is to be used to finance acquisitions. The DDTL can be drawn upon until May 14, 2017. The DDTL is repayable, on a quarterly basis, by an amount equal to 5.0% per annum of the original funded amount of the DDTL. Any amount remaining unpaid would be due and payable in full on the Maturity Date.
Other Terms of Loan Facility
At the option of the Company, U.S. loans accrue interest at a per annum rate based on (i) the U.S. base rate plus a margin ranging from 3.0% to 4.0% depending on the leverage ratio or (ii) the LIBOR rate determined in accordance with the Credit Agreement (based on 1, 2, 3 or 6-month interest periods) plus a margin ranging from 4.0% to 5.0% depending on the leverage ratio. The U.S. base rate is a rate equal to the highest of the federal funds rate plus a margin equal to 0.5%, the LIBOR rate for a 1-month interest period plus 1.0% and Wells Fargo Capital Finance’s prime rate.
At the option of the Company, the Canadian loans accrue interest at a per annum rate based on (i) the Canadian prime rate or the U.S. base rate plus a margin ranging from 3.0% to 4.0% depending on the leverage ratio or (ii) the LIBOR rate determined in accordance with the Credit Agreement (based on 1, 2, 3 or 6-month interest periods) (or the Canadian BA rate determined in accordance with the Credit Agreement for obligations in Canadian dollars) plus a margin ranging from 4.0% to 5.0% depending on the leverage ratio.
Accrued interest on the loans will be paid monthly, or, with respect to loans that are accruing interest based on the LIBOR rate or Canadian BA rate, at the end of the applicable LIBOR or Canadian BA interest rate period.
Lenders are entitled to a premium (the “Prepayment Premium”) in the event of certain prepayments of the loans in an amount equal to (i) from May 14, 2015 to May 14, 2016, 2.0% times the sum of (a) the Maximum Revolver Amount plus (b) the outstanding principal amount of the Term Loan and DDTL on the date immediately prior to the date of the prepayment (such sum, the “Prepayment Amount”) (ii) from May 14, 2016 to May 14, 2017, 1.0% times the Prepayment Amount and (iii) during the period from and after May 14, 2017 to the Maturity Date, 0.0% times the Prepayment Amount. The Company may also be subject to prepayment fees in the case of commitment reductions of the Revolver and also may be obligated to prepay loans upon the occurrence of certain events.
The Company is also obligated to pay other customary servicing fees, letter of credit fees and unused credit facility fees.
The Loan Facility contains customary affirmative and negative covenants. The negative covenants limit the ability of the Company and its subsidiaries to, among other things (in each case subject to customary exceptions for a credit facility of this size and type):
Incur additional indebtedness or guarantee indebtedness of others;
Create liens on their assets;
Make investments, including certain acquisitions;
Enter into mergers or consolidations;
Dispose of assets;
Pay dividends and make other distributions on the Company’s capital stock, and redeem and repurchase the Company’s capital stock;
Enter into transactions with affiliates; and
Prepay indebtedness or make changes to certain agreements.
While the Credit Facility restricts us from incurring additional indebtedness, management believes the sources of debt and equity available to us under the S-3 and Credit Facility provide adequate sources of capital to fund our operations and support our continued growth. We were in compliance with all Credit Facility covenants as of December 31, 2018.
See Note 7 - Debt, of the Notes to Consolidated Financial Statements for more information regarding our Credit Faciliy and outstanding debt as of December 31, 2018.
Registration Statement
On December 12, 2018, the Company filed a registration statement on Form S-3 (File No. 333-228767) (the “S-3”), to register Upland securities in an aggregate amount of up to $250.0 million for offerings from time to time. In connection with the filing of the S-3 the Company withdrew its previous registration statement filed on May 12, 2017 which registered Upland securities in an aggregate amount of up to $75.0 million of which $29.0 million in aggregate offering price remained available for issuance at the time of withdrawal.
The Loan Facility also contains financial covenantsfollowing table summarizes our cash flows for the periods indicated (including cash flows from discontinued operations): |
| | | | | | | | | | | |
| Year Ended December 31, |
| 2018 | | 2017 | | 2016 |
| (dollars in thousands) |
| Consolidated Statements of Cash Flow Data: | | | | | |
| Net cash provided by operating activities | $ | 7,347 |
| | $ | 7,716 |
| | $ | 3,875 |
|
| Net cash used in investing activities | (161,686 | ) | | (110,775 | ) | | (13,229 | ) |
| Net cash provided by financing activities | 149,923 |
| | 96,178 |
| | 19,525 |
|
| Effect of exchange rate fluctuations on cash | (1,172 | ) | | 449 |
| | 114 |
|
| Change in cash and cash equivalents | (5,588 | ) | | (6,432 | ) | | 10,285 |
|
| Cash and cash equivalents, beginning of period | 22,326 |
| | 28,758 |
| | 18,473 |
|
| Cash and cash equivalents, end of period | $ | 16,738 |
| | $ | 22,326 |
| | $ | 28,758 |
|
Cash Flows from Operating Activities
Cash used in operating activities is significantly influenced by the amount of cash we invest in personnel and infrastructure to support the anticipated growth of our business. Our operating assets and liabilities consist primarily of receivables from clients and unbilled professional services, accounts payable and accrued expenses and deferred revenues. The timing of our subscription and support billings, the volume of professional services rendered, the amount of perpetual licenses sold, and the related timing of collections on those bookings, as well as payments of our accounts payable and accrued payroll and related benefits affect these account balances.
Our cash provided by operating activities for the year ended 2018 primarily reflects our net loss of $10.8 million, partially offset by non-cash expenses that require certain subsidiaries to maintain (i)included $21.3 million of depreciation and amortization, $2.4 million in amortization of deferred commissions costs, $0.3 million of deferred income taxes, $0.9 million of non-cash interest expense, and $14.1 million of non-cash stock compensation expense. Working capital uses of cash included a minimum liquidity$2.8 million increase in Prepaids and other, a $3.4 million decrease in accounts payable, a $17.6 million decrease in accrued expenses and other liabilities and a $5.2 million increase in accounts receivable. These uses of cash were partially offset by a $7.9 million increase in deferred revenue.
Our cash provided by operating activities for the year ended 2017 primarily reflects our net loss of $18.7 million, partially offset by non-cash expenses that included $11.9 million of depreciation and amortization, $0.3 million of deferred income taxes, $0.6 million of non-cash interest expense, and $10.0 million (which shall be $8.0of non-cash stock compensation expense. Working capital sources of cash included a $1.6 million oncedecrease in Prepaids and other, a $1.3 million increase in accounts payable, a $3.7 million increase in accrued expenses and other liabilities and a $2.8 million increase in deferred revenue. These sources of cash were partially offset by a $4.7 million increase in accounts receivable.
Our cash provided by operating activities for the Company achieves trailing four quarters adjusted EBITDAyear ended 2016 primarily reflects our net loss of at least $8.0 million) at all times. This covenant is subsequently replaced$13.5 million, offset by certainnon-cash expenses that included $9.8 million of depreciation and amortization, $0.5 million of deferred income taxes, $0.1 million of foreign currency re-measurement loss, $0.3 million of non-cash interest expense, and $4.3 million of non-cash stock compensation expense. Working capital sources of cash included a $0.4 million decrease in accounts receivable, a $0.6 million decrease in prepaids and other financial covenants that are required to be met based on various levelsassets, a $0.4 million decrease in accrued expenses and other liabilities and a $2.2 million decrease in deferred revenue. These sources of operating results of the U.S.cash were offset by a $0.4 million decrease in accounts receivable and Canadian subsidiaries. These financial covenants become more restrictive starting September 30, 2017. If an event of default occurs, at the election of the Lenders, a default interest rate shall apply on all obligations during an event of default, at a rate per annum equal to 2.00% above the applicable interest rate.
The Loan Facility limits the Company's ability to buyback its capital stock, subject to restrictions including a minimum liquidity requirement of $20.0$1.5 million before and after any such buyback.
Termination of Prior Credit Agreements
On May 14, 2015, the Company terminated the U.S. Comerica Agreement and the Canadian Comerica Agreement. In conjunction with the terminations, the Company expensed unamortized deferred financing costs of $0.2 million.
Interest Rate and Financing Costsincrease in accounts payable.
Cash interest costs averaged 5.2% underFlows from Investing Activities
Our primary investing activities have consisted of acquisitions of complementary technologies, products and businesses. As our business grows, we expect our primary investing activities to continue to further expand our family of software applications and infrastructure and support additional personnel. For the new Credit Agreementyears ended December 31, 2018, 2017 and 2016, cash used in investing activities for business combinations consisted of $160.8 million, $110.3 million and $12.2 million, respectively. In addition, for the years ended December 31, 2018, 2017 and 2016, we used $0.9 million, $0.4 million and $0.7 million, respectively, for the purchases of property and equipment. Further, for the years ended December 31, 2018, 2017 and 2016, we used $0.0 million, $0.1 million, and $0.4 million, respectively, for the purchases of customer relationships.
Cash Flows from Financing Activities
Our primary financing activities have consisted of capital raised to fund our operations as well as proceeds from debt obligations entered into to finance our operations. For the year ended December 31, 2015. In addition,2018, cash provided by financing activities consisted primarily of $172.4 million in proceeds from debt and $0.8 million for proceeds from issuance of common stock, net of issuance costs, partially offset by $9.4 million in taxes paid related to net share settlements of equity award and $4.7 million for repayment of debt. For fiscal 2017, cash provided by financing activities consisted primarily of $74.5 million in proceeds from debt, partially offset by $11.9 million for repayment of debt and $43.8 million for proceeds from issuance of common stock, net of issuance costs. For fiscal 2016, cash provided by financing activities consisted primarily of $31.0 million in proceeds from debt, partially offset by $7.2 million for repayment of debt. For the Company incurred $1.2 million of financing costs associated with the Credit Agreement in the yearyears ended December 31, 2015. These financing costs will be amortized2018, 2017 and 2016 cash
used for additional consideration to non-cash interest expense over the termsellers of the Credit Agreement.businesses was $8.1 million, $5.4 million, and $2.1 million, respectively, and payments on capital leases was $1.1 million, $1.5 million, and $1.7 million, respectively.
Contractual Payment Obligations
The following table summarizes our future contractual obligations as of December 31, 20152018 (in thousands):
| | | Contractual Obligations | Payment Due by Period | Payment Due by Period |
| | Total | | Less than 1 Year | | 1-3 Years | | 3-5 Years | | More Than 5 Years | Total | | Less than 1 Year | | 1-3 Years | | >3-5 Years | | More Than 5 Years |
Debt Obligations | 24,874 |
| | 1,750 |
| | 2,500 |
| | 20,624 |
| | — |
| $ | 283,218 |
| | $ | 7,125 |
| | $ | 23,156 |
| | $ | 252,937 |
| | $ | — |
|
Interest on Debt Obligations (2) | | $ | 61,915 |
| | $ | 18,045 |
| | $ | 34,474 |
| | $ | 9,396 |
| | $ | — |
|
| Capital Lease Obligations | 4,782 |
| | 1,845 |
| | 2,447 |
| | 490 |
| | — |
| $ | 613 |
| | $ | 605 |
| | $ | 8 |
| | $ | — |
| | $ | — |
|
| Operating Lease Obligations | 5,229 |
| | 1,874 |
| | 2,410 |
| | 944 |
| | — |
| |
| Purchase Commitments | 2,308 |
| | 2,308 |
| | | | | | | |
Operating Lease Obligations (3) | | $ | 6,483 |
| | $ | 2,719 |
| | $ | 1,989 |
| | $ | 1,073 |
| | $ | 702 |
|
Purchase Commitments (4) | | $ | 8,298 |
| | $ | 6,273 |
| | $ | 2,025 |
| | $ | — |
| | $ | — |
|
| Total | 37,193 |
| | 7,778 |
| | 7,357 |
| | 22,058 |
| | — |
| $ | 360,527 |
| | $ | 34,767 |
| | $ | 61,652 |
| | $ | 263,406 |
| | $ | 702 |
|
| |
| (1) | Future debt maturities of long-term debt exclude debt discounts and consist of obligations under our Credit Facility. See “Liquidity and Capital Resources” above for further discussion regarding our Credit Facility. |
| |
| (2) | Future interest on debt obligations calculated using the interest rate effective as of December 31, 2018. To the extent interest rates change in future periods, our contractual obligations for interest payments will change. See “Item 7A. Quantitative and Qualitative Disclosures About Market Risk” for further discussion. |
| |
| (3) | We lease office equipment under capital leases that are substantially complete by the end of 2019. |
| |
| (4) | We lease office space under operating leases that expire between 2019 and 2025. Operating lease obligations above do not include the impact of future rental income related to agreements we have entered into to sublet excess office space as a result of our transformation activities. |
| |
| (5) | We define a purchase commitment as an agreement that is enforceable and legally binding and that specifies all significant terms, including: fixed or minimum services to be used; fixed, minimum or variable price provisions; and the approximate timing of the transaction. Obligations under contracts that we can cancel without a significant penalty are not included. In addition, Purchase orders are not included as they represent authorizations to purchase rather than binding agreements. |
We have an outstanding purchase commitment with Amazon Web Services to support its cloud infrastructure in conjunction with the consolidation and elimination of a substantial portion of its physical cloud infrastructure formerly maintained around the United States, Canada and the UK.
Future debt maturities of long-term debt exclude debt discounts and consist of obligations under the Company's U.S. Loan Agreement, Canadian Loan Agreement, and seller notes.
The Company leases office space under operating leases that expire between 2015 and 2020. The company also leases computer equipment under capital leases.
The Company hasWe have an outstanding purchase commitment in 20162019 for software development services from DevFactory FZ-LLC (“DevFactory”) pursuant to a technology services agreement in the amount of $2.3$4.9 million. The agreement has an initial term that expires on December 31, 2017, with an optionSee Note 15 - Related Party Transactions, of the Notes to Consolidated Financial Statements for either party to renew annually for up to five years. For years after 2016, themore information regarding our purchase commitment amount for software development services will be equal to the prior year purchase commitment increased (decreased) by the percentage change in total revenue for the prior year as compared to the preceding year. For example, if 2016 total revenues increase by 10% as compared to 2015 total revenues, then the 2017 purchase commitment will increase by approximately $230,000 from the 2016 purchase commitment amount to approximately $2.5 million.this related party.
The Company has a letter of credit for an office lease with a bank in the amount of $100,000.
Off-Balance Sheet Arrangements
During the years ended December 31, 2015, 2014,2018, 2017, and 2013,2016, we did not have any relationships with unconsolidated organizations or financial partnerships, such as structured finance or special-purpose entities, that would have been established for the purpose of facilitating off-balance sheet arrangements or other contractually narrow or limited purposes.
Critical Accounting Policies and the Use of Estimates
We prepare our consolidated financial statements in accordance with generally accepted accounting principles in the United States. The preparation of consolidated financial statements also requires us to make estimates and assumptions that affect the reported amounts of assets, liabilities, revenue, costs and expenses and related disclosures. We base our estimates on historical experience and on various other assumptions that we believe to be reasonable under the circumstances. Actual results could differ significantly from the estimates made by our management. To the extent that there are differences between our estimates and actual results, our future financial statement presentation, financial condition, results of operations and cash flows will be affected. We believe that the accounting policies discussed below are critical to understanding our historical and future performance, as these policies relate to the more significant areas involving management’s judgments and estimates.
The following critical accounting policies reflect significant judgments and estimates used in the preparation of our consolidated financial statements:
•revenue recognition and deferred revenue;recognition;
•stock-based compensation;
•income taxes;
•business combinations; and
•business combinations and the recoverability of goodwill and long-lived assets.other intangibles.
Revenue Recognition
TheRevenues are recognized when control of the promised goods or services is transferred to our customers, in an amount that reflects the consideration we expect to be entitled to in exchange for those goods or services over the term of the agreement. We enter into contracts that can include various combinations of products and services, which are generally capable of being distinct and accounted for as separate performance obligations. Revenues are recognized net of sales credits and allowances. Revenue is recognized net of any taxes collected from customers, which are subsequently remitted to governmental authorities. Revenue is recognized based on the following five step model in accordance with ASC 606, Revenue from Contracts with Customers:
Identification of the contract with a customer
Identification of the performance obligations in the contract
Determination of the transaction price
Allocation of the transaction price to the performance obligations in the contract
Recognition of revenue when, or as, the Company derives revenue from product revenue, consistingsatisfies a performance obligation
Revenue-generating activities consist of subscription and support, and perpetual licenses, and professional services revenues. The Company recognizes revenue when all of the following criteria are met: persuasive evidence of an arrangement exists, delivery of the product or services has occurred, no Company obligations with regard to implementation considered essential to the functionality remain, the fee is fixed or determinable and collectability is probable.revenues within a single operating segment.
Subscription and Support RevenueRevenues
The Company derivesOur software solutions are available for use as hosted application arrangements under subscription revenues by providing its software-as-a-service solutionfee agreements without licensing perpetual rights to customers in whichthe software. Subscription fees from these applications are recognized over time on a ratable basis over the customer does notagreement term beginning on the date the our solution is made available to the customer. As our customers have the rightaccess to take possession of the software, but can use the software for the contracted term. The Company accounts for these arrangements as service contracts. Subscription and support revenues are recognized on a straight-line basisour solutions over the term of the contractual arrangement, typically onecontract agreement we believe this method of revenue recognition provides a faithful depiction of the transfer of services provided. Our subscription contracts are generally 1 to three years.3 years in length. Amounts that have been invoiced and that are due are recorded in accounts receivable and deferred revenuerevenues or revenue,revenues, depending on whenwhether the criteria for revenue recognition arecriteria have been met. Revenue from usage-based servicesAdditional fees for monthly usage above the levels included in the standard subscription fee are recognized inas revenue at the end of each month in which such usageand is reported.
The Company may provide hosting services to customers who purchased a perpetual license. Such hosting services are recognized ratably over the applicable term of the arrangement. These hosting arrangements are typically for a period of one to three years.
Software maintenance agreements provide technical support and the right to unspecified upgrades on an if-and-when-available basis. Revenue from maintenance agreements is recognized ratably over the life of the related agreement, which is typically one year.invoiced concurrently.
Perpetual License RevenueRevenues
The CompanyWe also records revenue from the sales of proprietary software products under perpetual licenses. For license agreementsRevenue from distinct on-premises licenses is recognized upfront at the point in which customer acceptancetime when the software is a conditionmade available to earning the license fees, revenue is not recognized until acceptance occurs. The Company’scustomer. Our products do not require significant customization. Revenue on arrangements with customers who are not the ultimate users (primarily resellers) is not recognized until the product is delivered to the end user. Perpetual licenses are sold along with software maintenance and, sometimes, hosting agreements. When vendor specific objective evidence (VSOE) of fair value exists for the software maintenance and hosting agreement, the perpetual license is recognized under the residual method whereby the fair value of the undelivered software maintenance and hosting agreement is deferred and the remaining contract value is recognized immediately for the delivered perpetual license. When VSOE of fair value does not exist for the either the software maintenance or hosting agreement, the entire contract value is recognized ratably over the underlying software maintenance and/or hosting period.
Professional Services Revenue
Professional services provided with subscription and support licenses and perpetual licenses consist of implementation fees, data extraction, configuration, and training. The Company’sOur implementation and configuration services do not involve significant customization of the software and are not considered essential to the functionality. Revenues from professional services are recognized over time as such services are provided when VSOE of fair value existsperformed. Revenues for such services and all undelivered elements such as software maintenance and/or hosting agreements. VSOE of fair value for services is based upon thefixed price charged when these services are sold separately, and is typically an hourly rate. When VSOE of fair value does not existgenerally recognized over time applying input methods to estimate progress to completion. Revenues for software maintenance and/or hosting agreements, revenues from professionalconsumption-based services are recognized ratably over the underlying software maintenance and/or hosting period.
Professional services, when sold with the subscription arrangements, are accounted for separately when these services have value to the customer on a standalone basis and there is objective and reliable evidence of fair value for each deliverable. When accounted for separately, revenues aregenerally recognized as the services are renderedperformed.
Messaging-related Revenue
We recognize subscription revenue for timeour digital engagement application which provides short code connectivity for its two-way SMS programs and material contracts. For those arrangements wherecampaigns. We evaluate whether it is appropriate to recognize revenue based on the elements dogross amount billed to its customers for these services. Since the we are primarily obligated in these transactions, have latitude in establishing prices associated with its messaging program management services, is responsible for fulfillment of the transaction, and has credit risk, revenue is recorded on a gross basis. While none of the factors individually are considered presumptive or determinative, in reaching conclusions on gross versus net revenue recognition, we place the most weight on the analysis of whether or not qualify aswe are the primary obligor in the arrangement.
Significant Judgments
Performance Obligations and Standalone Selling Price
A performance obligation is a separatepromise in a contract to transfer a distinct good or service to the customer and is the unit of accounting, the Company recognizes professionalaccounting. Determining whether products and services ratably over the contractual life of the related application subscription arrangement. Currently, all professional services are considered distinct performance obligations that should be accounted for separately as allversus together may require significant judgment. We have valuecontracts with customers that often include multiple performance obligations, usually including professional services sold with either individual or multiple subscriptions or perpetual licenses.. For these contracts, we account for individual performance obligations separately if they are distinct by allocating the contract's total transaction price to each performance obligation in an amount based on the customer onrelative standalone selling price, or SSP, of each distinct good or service in the contract.
Judgment is required to determine the SSP for each distinct performance obligation. A residual approach is only applied in limited circumstances when a standalone basis.
Multiple Element Arrangements
The Company enters into arrangementsparticular performance obligation has highly variable and uncertain SSP and is bundled with multiple-elementother performance obligations that generally include subscriptions and implementation and other professional services.
For multiple-element arrangements, arrangement considerationhave observable SSP. A contract's transaction price is allocated to deliverableseach distinct performance obligation and recognized as revenue when, or as, the performance obligation is satisfied. We determine the SSP based on their relative selling price. In order to treat deliverables in a multiple-element arrangement as separate units of accounting, the elements must have standalone value upon delivery. If the elements have standalone value upon delivery, each element must be accounted for separately. The Company’s subscription services have standalone value as such services are often sold separately. In determining whether implementationour overall pricing objectives, taking into consideration market conditions and other professional services have standalone value apart from the subscription services, the Company considers various factors, including the availabilityvalue of the services from other vendors. The Company has concluded that the implementation services included in multiple-element arrangements have standalone value. As a result, when implementation and other professional services are sold in a multiple-element arrangement, the arrangement consideration is allocated to the identified separate units based on a relative selling price hierarchy. The selling price for a element is based on its VSOE of selling price, if available, third-party evidence of selling price, or TPE, if VSOE is not available or best estimate of selling price, or BESP, if neither VSOE nor TPE is available. The Company has not established VSOE for its subscription services due to lack of pricing consistency, the introduction of new services and other factors. The Company has determined that TPE is not a practical alternative due to differences in its service offerings compared to other parties and the availability of relevant third-party pricing information. Accordingly, the Company uses BESP to determine the relative selling price.
The Company determined BESP by considering its overall pricing objectives and market conditions. Significant pricing practices taken into consideration include the Company’s discounting practices, the size and volume of its transactions, customer characteristics, price lists, go-to-market strategy,our contracts, historical standalone sales, customer demographics, geographic locations, and agreement prices. As the Company’s go-to-market strategies evolve,number and types of users within our contracts.
Other Considerations
We evaluate whether we are the principal (i.e., report revenues on a gross basis) or agent (i.e., report revenues on a net basis) for vendor reseller agreements. Generally, we report revenues from these types of contracts on a gross basis, meaning the amounts billed to customers are recorded as revenues, and expenses incurred are recorded as cost of revenues. Where we are the principal, it may modifyfirst obtains control of the inputs to the specific good or service and directs their use to create the combined output. We control is evidenced by its pricing practicesinvolvement in the future,integration of the good or service on its platform before it is transferred to its customers, and is further supported by the Company being primarily responsible to its customers and having a level of discretion in establishing pricing. Revenues provided from agreements in which could result in changes in relative selling prices,we are an agent are immaterial.
Payment terms and conditions vary by contract type, although terms generally include both VSOE and BESP.
Deferred Revenue
Deferred revenue represents either customer advance payments or billings for whicha requirement of payment within 30 to 60 days. In instances where the aforementionedtiming of revenue recognition criteriadiffers from the timing of invoicing, we have determined our contracts generally do not yet been met.
Stock-Based Compensation
Stock options awardedinclude a significant financing component. The primary purpose of our invoicing terms is to employeesprovide customers with simplified and directors are measuredpredictable ways of purchasing our products and services, not to receive financing from our customers or to provide customers with financing. Example includes invoicing at fair value at each grant date. The Company accounts for stock-based compensation in accordancethe beginning of a subscription term with authoritative accounting principles which require all share-based compensation to employees, including grants of employee stock options, to be recognized in the financial statements based on their estimated fair value. Compensation expense is determined under the fair value method using the Black-Scholes option pricing model andrevenue recognized ratably over the contract period.
Contract Balances
The timing of revenue recognition, billings and cash collections can result in billed accounts receivable, unbilled receivables (contract assets), and deferred revenues (contract liabilities). Billings scheduled to occur after the performance obligation has been satisfied and revenue recognition has occurred result in contract assets. Contract assets that are expected to be billed during the succeeding twelve-month period are recorded in 'Prepaid and other current assets', and the
remaining portion is recorded in 'Other assets' on the accompanying consolidated balance sheets at the end of each reporting period. A contract liability results when we receive prepayments or deposits from customers in advance for implementation, maintenance and other services, as well as initial subscription fees. Customer prepayments are generally applied against invoices issued to customers when services are performed and billed. We recognize contract liabilities as revenues upon satisfaction of the underlying performance obligations. Contract liabilities that are expected to be recognized as revenues during the succeeding twelve-month period are recorded in 'Deferred revenue' and the remaining portion is recorded in 'Deferred revenue noncurrent' on the accompanying consolidated balance sheets at the end of each reporting period.
Stock-Based Compensation
We measure all share-based payments, including grants of options to purchase common stock and the issuance of restricted stock or restricted stock units to employees, service providers and board members, using a fair-value based method. We record forfeitures as they occur. The cost of services received from employees and non-employees in exchange for awards vest. of equity instruments is recognized in the consolidated statement of operations based on the estimated fair value of those awards on the grant date and amortized on a straight-line basis over the requisite service period. We use the Black-Scholes option-pricing model to determine the fair values of stock option awards. For restricted stock and restricted stock units, fair value is based on the closing price of our common stock on the grant date.
The Black-Scholes option pricing model used to compute share-based compensation expense requires extensive use of accounting judgment and financial estimates. Items requiring estimation include the expected term option holders will retain their vested stock options before exercising them, the estimated volatility of the Company’s common stock price over the expected term of each stock option, and the number of stock options that will be forfeited prior to the completion of their vesting requirements. Application of alternative assumptions could result in significantly different share-based compensation amounts being recorded in the financial statements. The following table summarizes the weighted-average grant-date fair value of options granted in 2015, 2014,2018, 2017, and 20132016 and the assumptions used to develop their fair values. As there was no public market for its common stock prior to November 2014, the Company estimates the volatility of its common stock based on the volatility of publicly traded
shares of comparable companies' common stock. The Company's decision to use the volatility of comparable stock was based upon the Company'sour assessment that this information is more representative of future stock price trends than the Company'sour historical volatility. The Company estimates the expected term using the simplified method, which calculates the expected term as the midpoint between the vesting date and the contractual termination date of each award. The dividend yield assumption is based on historical and expected future dividend payouts. The risk-free interest rate is based on observed market interest rates appropriate for the term of each options.
| | | | Year Ended December 31, | Year Ended December 31, |
| | 2015 | | 2014 | | 2013 | 2018 | | 2017 | | 2016 |
| Weighted average grant-date fair value of options | $3.01 | | $3.76 | | $0.91 | $11.42 | | $7.47 | | $3.23 |
| Expected volatility | 42.5% - 44.0% | | 54.1% - 55.2% | | 53.3% | 33.4% | | 35.0% | | 42.5% |
| Risk-free interest rate | 1.7% - 1.9% | | 1.6% - 1.9% | | 1.6% | 2.8% | | 1.1% - 2.0% | | 1.2% |
| Expected life in years | 5.93 | | 6.29 | | 6.29 | 5.00 | | 5.00 | | 5.93 |
| Dividend yield | — | | — | | — | — | | — | | — |
Income Taxes
The Company uses the asset and liability method of accounting for income taxes. Under this method, deferred tax assets and liabilities are recognized for the expected future tax consequences of temporary differences between the carrying amounts and the tax bases of assets and liabilities. Deferred tax assets and liabilities are measured using enacted tax rates expected to apply to taxable income in the years in which those temporary differences are expected to be recovered or settled. The effect of a change in tax rates on deferred tax assets and liabilities will be recognized in the period that includes the enactment date. A valuation allowance is established against the deferred tax assets to reduce their carrying value to an amount that is more likely than not to be realized.
The Company has adopted a permanent reinvestment position whereby foreign earnings for foreign subsidiaries are
expected to be reinvested and future earnings are not expected to be repatriated. As a result of this policy, no tax
liability has been accrued in anticipation of future dividends from foreign subsidiaries.
The Company accounts for uncertainty of income taxes based on a “more likely than not” threshold for the recognition and derecognition of tax positions, which includes the accounting for interest and penalties.
Business Combinations
We apply the provisions of ASC 805, Business Combinations, in accounting for our acquisitions which requires the acquisition purchase price to be allocated to the tangible and intangible assets acquired and liabilities assumed based on their estimated fair values at the acquisition dates. The excess of the purchase price over these estimated fair values is recorded to goodwill.
Significant estimates and assumptions, including fair value estimates, are used to determine the fair value of assets acquired, liabilities assumed and contingent consideration transfered as well as the useful lives of long-lived assets acquired. During the measurement period, which may be up to one year from the acquisition date, we may record adjustments to the assets acquired and liabilities assumed with the corresponding offset to goodwill based on changes to our initial estimates and assumptions. Upon conclusion of the measurement period or final determination of the values of assets acquired and liabilities assumed, whichever comes first, any subsequent adjustments are recorded to acquisition related expenses in our consolidated statement of operations.
Tangible assets are valued at their respective carrying amounts, which approximates their estimated fair value. The valuation of identifiable intangible assets reflects management’s estimates based on, among other factors, use of established valuation methods. Customer relationships are valued using an income approach, which estimates fair value based on the earnings and cash flow capacity of the subject asset. The value of the marketing-related intangibles is determined using a relief-from-royalty method, which estimates fair value based on the value the owner of the asset receives from not having to pay a royalty to use the asset. Developed technology is valued using a cost-to-recreate approach.
The purchase price transfered in our acquisitions often contain holdback and contingent consideration provisions. Holdbacks are subject to reduction for indemnification claims and are typically payable within 12 to 18 months of the acquisition date. Contingent consideration typically includes earnout payments payable within 12 to 18 months of the date of acquisition based on attainment of certain performance goals. Contingent consideration liabilities are recorded at fair value on the acquisition date and are remeasured periodically based on the then assessed fair value and adjusted if necessary. Holdback and contingent consideration liabilities are recorded in due to sellers in our consolidated balance sheet. Any changes in fair value of the contingent consideration subsequent to the measurement period are recorded to operating income (expense) in our statement of operations.
Goodwill and Other Intangibles
Goodwill arises from business combinations and is measured as the excess of the cost of the business acquired over the sum of the acquisition-date fair value of tangible and identifiable intangible assets acquired, less any liabilities assumed.
Goodwill is evaluated for impairment annually in October or more frequently when an event occurs or circumstances change that indicate the carrying value may not be recoverable. The events and circumstances considered by the Company include the business climate, legal factors, operating performance indicators and competition.competition.The company adopted ASU 2017-04, Intangibles - Goodwill and Other: Simplifying the Test for Goodwill Impairment during the first quarter of 2018 which eliminated step 2 from the goodwill impairment test.
The Company evaluatesAs we operate as one reporting unit, the recoverability of goodwill using a two-step impairment process testedtest is performed at the reporting unit level. Theconsolidated entity level by comparing the estimated fair value of the Company has one reporting unit for goodwill impairment purposes. Into the its carrying value. We have elected to first step,assess qualitative factors to determine whether it is more likely than not that the fair value of theour single reporting unit is compared toless than its carrying value. Based on the book value, including goodwill. In the casequalitative assessment, if it is determined that theit is more likely than not that our fair value is less than its carrying value we would compare the bookcarrying value a second step is performed that comparesof the impliedCompany's single reporting unit to its fair value and recognize any excess carrying value as an impairment loss.
Determining the fair value of goodwill is subjective in nature and often involves the use of estimates and assumptions including, without limitation, use of estimates of future prices and volumes for our products, capital needs, economic trends and other factors which are inherently difficult to forecast. If actual results, or the book value of goodwill. The fair value for the implied goodwill is determined based on the difference between the fair value of the reporting unitplans and the net fair value of the identifiable assets and liabilities, excluding goodwill. If the implied fair value of the goodwill is lessestimates used in future impairment analyses are lower than the book value,original estimates used to assess the difference is recognized as an impairment charge in the consolidated statementrecoverability of operations. No goodwillthese assets, we could incur impairment charges were recordedin a future period. The annual impairment test was performed as of October 31, 2018. No impairment of goodwill was identified during the years ended December 31, 2015, 2014,2018, 2017, or 2013.2016.
Identifiable intangible assets consist of customer relationships, marketing-related intangible assets and developed technology. Intangible assets with definite lives are amortized over their estimated useful lives on a straight-line basis. The straight-line method of amortization represents the Company’sour best estimate of the distribution of the economic value of the identifiable intangible assets.
Recent Accounting Pronouncements
71
Intangible assets are reviewed for impairment whenever events or changesFor information with respect to recent accounting pronouncements and the impact of these pronouncements on our consolidated financial statements, refer to Note 2. Significant Accounting Policies to our consolidated financial statements included in circumstances indicate the carrying amountPart II, Item 8, “Financial Statements and Supplementary Data” of intangible assets may not be recoverable. Conditions that would necessitate an impairment assessment include a significant decline in the observable market value of an asset, a significant change in the extent or manner in which an asset is used or any other significant adverse change that would indicate that the carrying amount of an asset or group of assets may not be recoverable. The Company evaluates the recoverability of intangible assets by comparing their carrying amounts to the future net undiscounted cash flows expected to be generated by the intangible assets. If such intangible assets are considered to be impaired, the impairment to be recognized is measured as the amount by which the carrying amount of the intangible assets exceeds the fair value of the assets.
The Company determines fair value based on discounted cash flows using a discount rate commensurate with the risk inherent in the Company’s current business model for the specific intangible asset being valued. The Company determined there was an impairment of the PowerSteering trade name of $1.1 million during 2013. There were no such impairments during 2015 and 2014.this Form 10-K.
Other Key Accounting Policies
We also have other key accounting policies, which involve the use of estimates, judgments, and assumptions that are significant to understanding our results. See Note 2 “SummarySummary of Significant Accounting Policies”Policies, of the Notes to the consolidated financial statementsConsolidated Financial Statements included in this Annual Report. Of those policies, we believe that the accounting policies enumerated above involve the greatest degree of complexity and exercise of judgment by our management.
We evaluate our estimates, judgments and assumptions on an ongoing basis, and while we believe that our estimates, judgments and assumptions are reasonable, they are based upon information available at the time. Actual results may differ significantly from these estimates under different assumptions, judgments or conditions.
Under Section 107(b) of the JOBS Act, emerging growth companies can delay adopting new or revised accounting standards until such time as those standards apply to private companies. We are choosing to “opt out” of such extended transition period, however, and, as a result, we will comply with new or revised accounting standards on the relevant dates on which adoption of such standards is required for non-emerging growth companies. Section 107 of the JOBS Act provides that our decision to opt out of the extended transition period for complying with new or revised accounting standards is irrevocable.
Recent See Note 2 Summary of Significant Accounting Pronouncements
In May 2014, the FASB issued FASB ASU No. 2014-09, Revenue from Contracts with Customers (Topic 606), which supersedes the revenue recognition requirements in ASC 605, Revenue Recognition. The core principle of ASU 2014-09 is that an entity should recognize revenue to depict the transfer of promised goods or services to customers in an amount that reflects the consideration to which the entity expects to be entitled in exchange for those goods or services. The guidance provides a five-step process to achieve that core principle. ASU 2014-09 requires disclosures enabling users of financial statements to understand the nature, amount, timing and uncertainty of revenue and cash flows arising from contracts with customers. Additionally, qualitative and quantitative disclosures are required about contracts with customers, significant judgments and changes in judgments, and assets recognized from the costs to obtain or fulfill a contract. In August 2015, the FASB issued FASB ASU No. 2015-14, Revenue from Contracts with Customers (Topic 606): Deferral of the Effective Date, which deferred the effective date of ASU 2014-09 by one year. ASU 2014-09 is now effective for annual reporting periods beginning after December 15, 2017, including interim periods within that reporting period, using one of two retrospective application methods. Early application is permitted only as of annual reporting periods beginning after December 15, 2016, including interim reporting periods within that reporting period. The Company is currently evaluating the effect that the adoption of ASU 2014-09 and ASU 2015-14 will have on its financial statements as well as the timing and method of adoption.
In August 2014, the FASB issued FASB ASU No. 2014-15, Presentation of Financial Statements - Going Concern (Subtopic 205-40): Disclosure of Uncertainties about an Entity's Ability to Continue as a Going Concern. The new standard provides guidance around management's responsibility to evaluate whether there is substantial doubt about an entity's ability to continue as a going concern and to provide related footnote disclosures. The new
standard is effective for fiscal years, and interim periods within those fiscal years, beginning after December 15, 2016, with early adoption permitted. The adoption of this standard is not expected to have a material impact on our financial statements.
In April 2015, the FASB issued FASB ASU No. 2015-03 Interest—Imputation of Interest (Subtopic 835-30): Simplifying the Presentation of Debt Issuance Costs. Under this revised guidance, debt issuance costs should be presented in the balance sheet as a direct deduction from the carrying value of the associated debt, consistent with the presentation of a debt discount. The recognition and measurement guidance for debt issuance costs are not affected by the amendments in this update. This revised guidance is effective for annual periods beginning after December 15, 2015, and interim periods within those fiscal years, with early adoption permitted. The Company has adopted this standard in the second quarter of 2015. The December 31, 2014 balance sheet was retrospectively adjusted to reclassify $0.1 million from Other non-current assets to a reductionPolicies, of the Notes payable liability.to Consolidated Financial Statement for more information.
In September 2015, the FASB issued ASU 2015-16, Business Combinations (Topic 805): Simplifying the Accounting for Measurement-Period Adjustments. ASU 2015-16 eliminates the requirement that an acquirer in a business combination account for measurement-period adjustments retrospectively. Instead, an acquirer will recognize a measurement-period adjustment during the period in which it determines the amount of the adjustment. The guidance is effective for public business entities for fiscal years beginning after December 15, 2015, and interim periods within those fiscal years, with early adoption permitted. The Company has adopted this standard as of January 1, 2015 and such adoption did not have a significant effect on the Company's financial statements.
In November 2015, the FASB issued ASU 2015-17, Income Taxes (Topic 740): Balance Sheet Classification of Deferred Taxes. ASU 2015-17 eliminates the requirement for an entity to separate deferred income taxes and liabilities into current and noncurrent amounts in a classified statement of financial position. To simplify the presentation of deferred income taxes, the amendments in this Update require that deferred tax liabilities and assets be classified as noncurrent in a classified statement of financial position. The guidance is effective for public business entities for fiscal years beginning after December 15, 2016, and interim periods within those fiscal years, with early adoption permitted. The Company is currently evaluating the effect that the adoption of ASU 2015-17 will have on its financial statements.
Item 7A. Quantitative and Qualitative Disclosures About Market Risk
We have operations both within the United States and internationally, and we are exposed to market risks in the ordinary course of our business. These risks primarily include interest rate, foreign exchange and inflation risks, as well as risks relating to changes in the general economic conditions in the countries where we conduct business. The statement of operations impact is mitigated by having an offsetting liability in deferred revenue to partially or completely offset against the outstanding receivable if an account should become uncollectible. Our cash balances are kept in customary operating accounts, a portion of which are insured by the Federal Deposit Insurance Corporation, and uninsured money market accounts. The majority of our cash balances in money market accounts are with Wells Fargo, our lender under our loan facility. To date, we have not used derivative instruments to mitigate the impact of our market risk exposures. We also have not used, nor do we intend to use, derivatives for trading or speculative purposes.
Interest Rate Risk
Our exposure to market risk for changes in interest rates primarily relates to our cash equivalents and any variable rate indebtedness.
The primary objective of our investment activities is to preserve principal while maximizing yields without significantly increasing risk. This objective is accomplished currently by making diversified investments, consisting only of money market mutual funds and certificates of deposit.
Any draws under our loan and security agreements bear interest at a variable rate tied to the prime rate. As of December 31, 2015,2018, we had a principal balance of $18.5$278.0 million under our U.S. Loan Agreement and $5.9$5.2 million
under our Canadian Loan Agreement. As of December 31, 2014,2017, we had a principal balance of $16.5$108.5 million under our U.S. Loan Agreement and $0.4$5.3 million under our Canadian Loan Agreement. Based on the principal balance outstanding on our Credit Facility as of December 31, 2018, a hypothetical change of 100 basis points would result in a maximum potential change to interest expense of $0.3 million annually.
Foreign Currency Exchange Risk
Our results of operations and cash flows are subject to fluctuations due to changes in foreign currency exchange rates. In addition, we incur a portion of our operating expenses in foreign currencies, including Canadian dollars, British pounds and Euros, and in the future as we expand into other foreign countries, we expect to incur operating expenses in other foreign currencies. In addition, our customers are generally invoiced in the currency of the country in which they are located. We are exposed to foreign exchange rate fluctuations as the financial results of our international operations are translated from the local functional currency into U.S. dollars upon consolidation. A
decline in the U.S. dollar relative to foreign functional currencies would increase our non-U.S. revenue and improve our operating results. Conversely, if the U.S. dollar strengthens relative to foreign functional currencies, our revenue and operating results would be adversely affected. The effect of a hypothetical 10% change in foreign currency exchange rates applicable to our business would have resulted in a change in revenue of $1.3$3.2 million for the year ended December 31, 2015.2018. To date, we have not engaged in any hedging strategies. As our international operations grow, we will continue to reassess our approach to manage our risk relating to fluctuations in foreign currency exchange rates.
The non-financial assets and liabilities of our foreign subsidiaries are translated into United States dollars using the exchange rates in effect at the balance sheet date. The related translation adjustments are recorded in a separate component of stockholders' equity in accumulated other comprehensive loss. In addition, we have a foreign currency denominated intercompany loan that was used to fund the acquisition of a foreign subsidiary during the year ended December 31, 2018. Due to the long-term nature of the loan, the foreign currency gains (losses) resulting from remeasurement are recognized as a component of accumulated other comprehensive income (loss).
Inflation
We do not believe that inflation had a material effect on our business, financial condition or results of operations in the last three fiscal years. If our costs were to become subject to significant inflationary pressures, we may not be able to fully offset such higher costs through price increases. Our inability or failure to do so could harm our business, financial condition and results of operations.
| |
| Item 8. | Financial Statements and Supplementary Data |
UPLAND SOFTWARE, INC.
INDEX TO CONSOLIDATED FINANCIAL STATEMENTS
Report of Independent Registered Public Accounting Firm
TheTo the Stockholders and the Board of Directors and Shareholders of Upland Software, Inc.
Opinion on the Financial Statements
We have audited the accompanying consolidated balance sheets of Upland Software, Inc. (the “Company”“Company“) as of December 31, 20152018 and 2014, and2017, the related consolidated statements of operations, comprehensive loss, stockholders’ equity, (deficit), and cash flows, for each of the three years in the period ended December 31, 2015. 2018, and the related notes (collectively referred to as the “consolidated financial statements“). In our opinion, the consolidated financial statements present fairly, in all material respects, the financial position of the Company as of December 31, 2018 and 2017, and the results of its operations and its cash flows for each of the three years in the period ended December 31, 2018, in conformity with U.S. generally accepted accounting principles.
Adoption of ASU No. 2014-09
As discussed in Note 12 to the consolidated financial statements, the Company changed its method for accounting for revenue in 2018 due to the adoption of ASU No. 2014-09, Revenue from Contracts with Customers (Topic 606).
Basis for Opinion
These financial statements are the responsibility of the Company’sCompany's management. Our responsibility is to express an opinion on thesethe Company’s financial statements based on our audits. We are a public accounting firm registered with the Public Company Accounting Oversight Board (United States) (PCAOB) and are required to be independent with respect to the Company in accordance with the U.S. federal securities laws and the applicable rules and regulations of the Securities and Exchange Commission and the PCAOB.
We conducted our audits in accordance with the standards of the Public Company Accounting Oversight Board (United States).PCAOB. Those standards require that we plan and perform the audit to obtain reasonable assurance about whether the financial statements are free of material misstatement. Wemisstatement, whether due to error or fraud. The Company is not required to have, nor were notwe engaged to perform, an audit of the Company’sits internal control over financial reporting. OurAs part of our audits included considerationwe are required to obtain an understanding of internal control over financial reporting as a basis for designing audit procedures that are appropriate in the circumstances, but not for the purpose of expressing an opinion on the effectiveness of the Company’sCompany's internal control over financial reporting. Accordingly, we express no such opinion. An audit also includes
Our audits included performing procedures to assess the risks of material misstatement of the financial statements, whether due to error or fraud, and performing procedures that respond to those risks. Such procedures included examining, on a test basis, evidence supportingregarding the amounts and disclosures in the financial statements, assessingstatements. Our audits also included evaluating the accounting principles used and significant estimates made by management, andas well as evaluating the overall presentation of the financial statement presentation.statements. We believe that our audits provide a reasonable basis for our opinion.
In our opinion, the financial statements referred to above present fairly, in all material respects, the consolidated financial position of Upland Software, Inc. at December 31, 2015 and 2014, and the consolidated results of its operations and its cash flows for each of the three years in the period ended December 31, 2015, in conformity with U.S. generally accepted accounting principles.
/s/ Ernst & Young LLP
We have served as the Company‘s auditor since 2013.
Austin, Texas
March 30, 201615, 2019
Upland Software, Inc.
Consolidated Balance Sheets
| | | | | | | December 31, |
| (in thousands, except share and per share amounts) | December 31,
2015 | | December 31,
2014 | 2018 | | 2017 |
| Assets | | | | | | |
| Current assets: | | | | | | |
| Cash and cash equivalents | $ | 18,473 |
| | $ | 30,988 |
| $ | 16,738 |
| | $ | 22,326 |
|
| Accounts receivable, net of allowance of $581 and $890 at December 31, 2015 and 2014, respectively | 13,972 |
| | 14,559 |
| |
| Accounts receivable (net of allowance of $1,405 and $1,069 at December 31, 2018 and December 31, 2017, respectively) | | 40,841 |
| | 26,504 |
|
| Deferred commissions, current | | 2,633 |
| | — |
|
| Unbilled receivables | | 3,694 |
| | 891 |
|
| Prepaid and other | 2,603 |
| | 2,069 |
| 3,382 |
| | 1,965 |
|
| Total current assets | 35,048 |
| | 47,616 |
| 67,288 |
| | 51,686 |
|
| Canadian tax credits receivable | 2,018 |
| | 3,959 |
| 1,573 |
| | 1,196 |
|
| Property and equipment, net | 6,001 |
| | 3,930 |
| 2,827 |
| �� | 2,927 |
|
| Intangible assets, net | 31,526 |
| | 34,751 |
| 179,572 |
| | 70,043 |
|
| Goodwill | 47,422 |
| | 45,146 |
| 225,322 |
| | 154,607 |
|
| Deferred commissions, noncurrent | | 6,292 |
| | — |
|
| Other assets | 399 |
| | 284 |
| 324 |
| | 800 |
|
| Total assets | $ | 122,414 |
| | $ | 135,686 |
| $ | 483,198 |
| | $ | 281,259 |
|
| Liabilities and stockholders’ equity | | | | | | |
| Current liabilities: | | | | | | |
| Accounts payable | $ | 2,548 |
| | $ | 2,258 |
| $ | 3,494 |
| | $ | 3,887 |
|
| Accrued compensation | 2,441 |
| | 2,372 |
| 6,581 |
| | 5,157 |
|
| Accrued expenses and other | 5,173 |
| | 4,304 |
| |
| Accrued expenses and other current liabilities | | 16,666 |
| | 12,148 |
|
| Deferred revenue | 19,931 |
| | 21,182 |
| 57,626 |
| | 43,807 |
|
| Due to seller | 2,409 |
| | 4,365 |
| |
| Current maturities of notes payable (includes unamortized discount of $250 and $38 at December 31, 2015 and 2014, respectively, based on imputed interest rate of 6.6%) | 1,500 |
| | 10,964 |
| |
| Due to sellers | | 17,267 |
| | 7,839 |
|
| Current maturities of notes payable (includes unamortized discount of $1,109 and $699 at December 31, 2018 and December 31, 2017, respectively) | | 6,015 |
| | 2,301 |
|
| Total current liabilities | 34,002 |
| | 45,445 |
| 107,649 |
| | 75,139 |
|
| Commitments and contingencies (Note 9) |
| |
| |
| Canadian tax credit liability to sellers | 368 |
| | 1,616 |
| |
| Notes payable, less current maturities (includes unamortized discount of $758 and $117 at December 31, 2015 and 2014, respectively, based on imputed interest rate of 6.6%) | 22,366 |
| | 12,327 |
| |
| Deferred revenue | 8 |
| | 194 |
| |
| Notes payable, less current maturities (includes unamortized discount of $2,381 and $1,969 at December 31, 2018 and December 31, 2017, respectively) | | 273,713 |
| | 108,843 |
|
| Deferred revenue, noncurrent | | 578 |
| | 1,570 |
|
| Noncurrent deferred tax liability, net | 2,818 |
| | 3,006 |
| 13,311 |
| | 3,262 |
|
| Other long-term liabilities | 2,582 |
| | 1,701 |
| 640 |
| | 1,030 |
|
| Total liabilities | 62,144 |
| | 64,289 |
| 395,891 |
| | 189,844 |
|
| Stockholders’ equity: | | | | | | |
| Common stock, $0.0001 par value; 50,000,000 shares authorized: 15,746,288 and 15,249,118 shares issued and outstanding as of December 31, 2015 and 2014 respectively | 2 |
| | 2 |
| |
| Preferred stock, $0.0001 par value; 5,000,000 shares authorized; no shares issued and outstanding as of December 31, 2018; no shares issued and outstanding as of December 31, 2017, respectively | | — |
| | — |
|
| Common stock, $0.0001 par value; 50,000,000 shares authorized: 21,489,112 and 20,768,401 shares issued and outstanding as of December 31, 2018 and December 31, 2017, respectively) | | 2 |
| | 2 |
|
| Additional paid-in capital | 112,447 |
| | 108,337 |
| 180,481 |
| | 174,944 |
|
| Accumulated other comprehensive loss | (3,289 | ) | | (1,716 | ) | (7,501 | ) | | (2,403 | ) |
| Accumulated deficit | (48,890 | ) | | (35,226 | ) | (85,675 | ) | | (81,128 | ) |
| Total stockholders’ equity | 60,270 |
| | 71,397 |
| 87,307 |
| | 91,415 |
|
| Total liabilities and stockholders’ equity | $ | 122,414 |
| | $ | 135,686 |
| $ | 483,198 |
| | $ | 281,259 |
|
See accompanying notes.
Upland Software, Inc.
Consolidated Statements of Operations
| | | (in thousands, except share and per share amounts) | Year Ended December 31, | Year Ended December 31, |
| | 2015 | | 2014 | | 2013 | 2018 | | 2017 | | 2016 |
| Revenue: | | | | | | | | | | |
| Subscription and support | $ | 57,193 |
| | $ | 48,625 |
| | $ | 30,887 |
| $ | 136,578 |
| | $ | 85,467 |
| | $ | 65,552 |
|
| Perpetual license | 2,805 |
| | 2,787 |
| | 2,003 |
| 3,902 |
| | 4,346 |
| | 1,650 |
|
| Total product revenue | 59,998 |
| | 51,412 |
| | 32,890 |
| 140,480 |
| | 89,813 |
| | 67,202 |
|
| Professional services | 9,913 |
| | 13,162 |
| | 8,303 |
| 9,405 |
| | 8,139 |
| | 7,565 |
|
| Total revenue | 69,911 |
| | 64,574 |
| | 41,193 |
| 149,885 |
| | 97,952 |
| | 74,767 |
|
| Cost of revenue: | | | | | | | | | | |
| Subscription and support | 19,586 |
| | 14,042 |
| | 7,787 |
| 42,881 |
| | 28,454 |
| | 22,734 |
|
| Professional services | 7,085 |
| | 9,079 |
| | 5,680 |
| 5,708 |
| | 5,193 |
| | 4,831 |
|
| Total cost of revenue | 26,671 |
| | 23,121 |
| | 13,467 |
| 48,589 |
| | 33,647 |
| | 27,565 |
|
| Gross profit | 43,240 |
| | 41,453 |
| | 27,726 |
| 101,296 |
| | 64,305 |
| | 47,202 |
|
| Operating expenses: | | | | | | | | | | |
| Sales and marketing | 12,965 |
| | 14,670 |
| | 10,625 |
| 20,935 |
| | 15,307 |
| | 12,160 |
|
| Research and development | 15,778 |
| | 26,165 |
| | 10,340 |
| 21,320 |
| | 15,795 |
| | 14,919 |
|
| Refundable Canadian tax credits | (470 | ) | | (1,094 | ) | | (583 | ) | (406 | ) | | (542 | ) | | (513 | ) |
| General and administrative | 18,201 |
| | 13,561 |
| | 6,832 |
| 32,041 |
| | 23,291 |
| | 18,286 |
|
| Depreciation and amortization | 4,534 |
| | 4,310 |
| | 3,670 |
| 14,272 |
| | 6,498 |
| | 5,291 |
|
| Acquisition-related expenses | 2,455 |
| | 2,186 |
| | 1,461 |
| 18,728 |
| | 15,092 |
| | 5,583 |
|
| Total operating expenses | 53,463 |
| | 59,798 |
| | 32,345 |
| 106,890 |
| | 75,441 |
| | 55,726 |
|
| Loss from operations | (10,223 | ) | | (18,345 | ) | | (4,619 | ) | (5,594 | ) | | (11,136 | ) | | (8,524 | ) |
| Other expense: | | | | | | | | | | |
| Interest expense, net | (1,858 | ) | | (1,951 | ) | | (2,797 | ) | (13,273 | ) | | (6,582 | ) | | (2,781 | ) |
| Other income (expense), net | (544 | ) | | 101 |
| | (431 | ) | (1,781 | ) | | 289 |
| | (678 | ) |
| Total other expense | (2,402 | ) | | (1,850 | ) | | (3,228 | ) | (15,054 | ) | | (6,293 | ) | | (3,459 | ) |
| Loss before provision for income taxes | (12,625 | ) | | (20,195 | ) | | (7,847 | ) | (20,648 | ) | | (17,429 | ) | | (11,983 | ) |
| Provision for income taxes | (1,039 | ) | | 78 |
| | (708 | ) | |
| Loss from continuing operations | (13,664 | ) | | (20,117 | ) | | (8,555 | ) | |
| Income (loss) from discontinued operations, net of tax of $0, $0, and $642 for 2015, 2014, and 2013, respectively | — |
| | — |
| | (642 | ) | |
| Benefit from (provision for) income taxes | | 9,809 |
| | (1,296 | ) | | (1,530 | ) |
| Net loss | $ | (13,664 | ) | | $ | (20,117 | ) | | $ | (9,197 | ) | $ | (10,839 | ) | | $ | (18,725 | ) | | $ | (13,513 | ) |
| Preferred stock dividends and accretion | — |
| | (1,524 | ) | | (98 | ) | |
| Net loss attributable to common shareholders | $ | (13,664 | ) | | $ | (21,641 | ) | | $ | (9,295 | ) | |
| Net loss per common share: | | | | | | | | | | |
| Loss from continuing operations per common share, basic and diluted | $ | (0.91 | ) | | $ | (4.43 | ) | | $ | (7.23 | ) | |
| Income (loss) from discontinued operations per common share, basic and diluted | $ | — |
| | $ | — |
| | $ | (0.54 | ) | |
| Net loss per common share, basic and diluted | $ | (0.91 | ) | | $ | (4.43 | ) | | $ | (7.77 | ) | $ | (0.54 | ) | | $ | (1.02 | ) | | $ | (0.82 | ) |
| Weighted-average common shares outstanding, basic and diluted | 14,939,601 |
| | 4,889,901 |
| | 1,196,668 |
| 19,985,528 |
| | 18,411,247 |
| | 16,472,799 |
|
See accompanying notes.
Upland Software, Inc.
Consolidated Statements of Comprehensive Loss
| | | (in thousands) | Year Ended December 31, | Year Ended December 31, |
| | 2015 | | 2014 | | 2013 | 2018 | | 2017 | | 2016 |
| Net loss | $ | (13,664 | ) | | $ | (20,117 | ) | | $ | (9,197 | ) | $ | (10,839 | ) | | $ | (18,725 | ) | | $ | (13,513 | ) |
| Foreign currency translation adjustment | (1,573 | ) | | (943 | ) | | (669 | ) | (5,098 | ) | | 749 |
| | 137 |
|
| Comprehensive loss | $ | (15,237 | ) | | $ | (21,060 | ) | | $ | (9,866 | ) | $ | (15,937 | ) | | $ | (17,976 | ) | | $ | (13,376 | ) |
See accompanying notes.
Upland Software, Inc.
Consolidated Statement of Stockholders’ Equity (Deficit) |
| | | | | | | | | | | | | | | | | | | | | | |
| (in thousands, except share amounts) | Common Stock | | | | Additional
Paid-In
Capital | | Accumulated
Other
Comprehensive
Loss | | Accumulated
Deficit | | Total
Stockholders’
Equity (Deficit) |
| | Shares | | Amount | |
| Balance at December 31, 2012 | 1,695,720 |
| | $ | — |
| | $ | — |
| | $ | (104 | ) | | $ | (4,075 | ) | | $ | (4,179 | ) |
| Issuance of common stock in business combination | 155,599 |
| | — |
| | 275 |
| | — |
| | — |
| | 275 |
|
| Accretion of preferred stock | — |
| | — |
| | (47 | ) | | — |
| | — |
| | (47 | ) |
| Preferred stock dividends | — |
| | — |
| | (51 | ) | | — |
| | — |
| | (51 | ) |
| Stock-based compensation | — |
| | — |
| | 98 |
| | — |
| | — |
| | 98 |
|
| Distribution associated with spin-off | — |
| | — |
| | (275 | ) | | — |
| | (1,837 | ) | | (2,112 | ) |
| Foreign currency translation adjustment | — |
| | — |
| | — |
| | (669 | ) | | — |
| | (669 | ) |
| Net loss | — |
| | — |
| | — |
| | — |
| | (9,197 | ) | | (9,197 | ) |
| Balance at December 31, 2013 | 1,851,319 |
| | — |
| | — |
| | (773 | ) | | (15,109 | ) | | (15,882 | ) |
| Issuance of common stock upon conversion of preferred stock | 6,834,476 |
| | 1 |
| | 52,312 |
| | — |
| | — |
| | 52,313 |
|
| Issuance of common stock in initial public offering | 3,846,154 |
| | 1 |
| | 38,845 |
| | — |
| | — |
| | 38,846 |
|
| Issuance of common stock to related party (Note 17) | 1,803,574 |
| | — |
| | 11,219 |
| | — |
| | — |
| | 11,219 |
|
| Issuance of common stock in business combination | 577,486 |
| | — |
| | 6,146 |
| | — |
| | — |
| | 6,146 |
|
| Issuance of restricted stock | 335,673 |
| | — |
| | — |
| | — |
| | — |
| | — |
|
| Exercise of stock options | 436 |
| | — |
| | 1 |
| | — |
| | — |
| | 1 |
|
| Accretion of preferred stock | — |
| | — |
| | (70 | ) | | — |
| | — |
| | (70 | ) |
| Preferred stock dividends | — |
| | — |
| | (1,454 | ) | | — |
| | — |
| | (1,454 | ) |
| Stock-based compensation | — |
| | — |
| | 729 |
| | — |
| | — |
| | 729 |
|
| Conversion of warrants from preferred to common | — |
| | — |
| | 609 |
| | — |
| | — |
| | 609 |
|
| Foreign currency translation adjustment | — |
| | — |
| | — |
| | (943 | ) | | — |
| | (943 | ) |
| Net loss | — |
| | — |
| | — |
| | — |
| | (20,117 | ) | | (20,117 | ) |
| Balance at December 31, 2014 | 15,249,118 |
| | 2 |
| | 108,337 |
| | (1,716 | ) | | (35,226 | ) | | 71,397 |
|
| Issuance of common stock in business combination | 233,679 |
| | — |
| | 1,386 |
| | — |
| | — |
| | 1,386 |
|
| Issuance of stock under Company plans, net of shares withheld for tax | 263,491 |
| | — |
| | 27 |
| | — |
| | — |
| | 27 |
|
| Issuance of stock, net of issuance costs | — |
| | — |
| | (44 | ) | | — |
| | — |
| | (44 | ) |
| Stock-based compensation | — |
| | — |
| | 2,741 |
| | — |
| | — |
| | 2,741 |
|
| Other comprehensive loss | — |
| | — |
| | — |
| | (1,573 | ) | | — |
| | (1,573 | ) |
| Net loss | — |
| | — |
| | — |
| | — |
| | (13,664 | ) | | (13,664 | ) |
| Balance at December 31, 2015 | 15,746,288 |
| | $ | 2 |
| | $ | 112,447 |
| | $ | (3,289 | ) | | $ | (48,890 | ) | | $ | 60,270 |
|
|
| | | | | | | | | | | | | | | | | | | | | | |
| (in thousands, except share amounts) | Common Stock | | Additional
Paid-In
Capital | | Accumulated
Other
Comprehensive
Loss | | Accumulated
Deficit | | Total
Stockholders’
Equity |
| | Shares | | Amount | |
| Balance at December 31, 2015 | 15,746,288 |
| | $ | 2 |
| | $ | 112,447 |
| | $ | (3,289 | ) | | $ | (48,890 | ) | | $ | 60,270 |
|
| Issuance of common stock in business combination | 1,344,463 |
| | — |
| | 8,300 |
| | — |
| | — |
| | 8,300 |
|
| Issuance of stock under Company plans, net of shares withheld for tax | 694,537 |
| | — |
| | (514 | ) | | — |
| | — |
| | (514 | ) |
| Stock-based compensation | — |
| | — |
| | 4,333 |
| | — |
| | — |
| | 4,333 |
|
| Other comprehensive loss | — |
| | — |
| | — |
| | 137 |
| | — |
| | 137 |
|
| Net loss | — |
| | — |
| | — |
| | — |
| | (13,513 | ) | | (13,513 | ) |
| Balance at December 31, 2016 | 17,785,288 |
| | $ | 2 |
| | $ | 124,566 |
| | $ | (3,152 | ) | | $ | (62,403 | ) | | $ | 59,013 |
|
| Issuance of stock under Company plans, net of shares withheld for tax | 843,579 |
| | — |
| | (2,163 | ) | | — |
| | — |
| | (2,163 | ) |
| Issuance of stock, net of issuance costs | 2,139,534 |
| | — |
| | 42,564 |
| | — |
| | — |
| | 42,564 |
|
| Stock-based compensation | — |
| | — |
| | 9,977 |
| | — |
| | — |
| | 9,977 |
|
| Other comprehensive loss | — |
| | — |
| | — |
| | 749 |
| | — |
| | 749 |
|
| Net loss | — |
| | — |
| | — |
| | — |
| | (18,725 | ) | | (18,725 | ) |
| Balance at December 31, 2017 | 20,768,401 |
| | $ | 2 |
| | $ | 174,944 |
| | $ | (2,403 | ) | | $ | (81,128 | ) | | $ | 91,415 |
|
| Issuance of common stock in business combination | 911 |
| | — |
| | (61 | ) | | — |
| | — |
| | (61 | ) |
| Issuance of stock under Company plans, net of shares withheld for tax | 719,800 |
| | — |
| | (8,511 | ) | | — |
| | — |
| | (8,511 | ) |
| Issuance of stock, net of issuance costs | — |
| | — |
| | (21 | ) | | — |
| | — |
| | (21 | ) |
| Stock-based compensation | — |
| | — |
| | 14,130 |
| | — |
| | — |
| | 14,130 |
|
| Cumulative ASC 606 adjustments | — |
| | — |
| | — |
| | — |
| | 6,292 |
| | 6,292 |
|
| Other comprehensive loss | — |
| | — |
| | — |
| | (5,098 | ) | | — |
| | (5,098 | ) |
| Net loss | — |
| | — |
| | — |
| | — |
| | (10,839 | ) | | (10,839 | ) |
| Balance at December 31, 2018 | 21,489,112 |
| | $ | 2 |
| | $ | 180,481 |
| | $ | (7,501 | ) | | $ | (85,675 | ) | | $ | 87,307 |
|
See accompanying notes.
Upland Software, Inc.
Consolidated Statements of Cash Flows
| | | (in thousands) | | Year Ended December 31, | Year Ended December 31, |
| | | 2015 | | 2014 | | 2013 | 2018 | | 2017 | | 2016 |
| Operating activities | | | | | | | | | | | |
| Net loss | | $ | (13,664 | ) | | $ | (20,117 | ) | | $ | (9,197 | ) | $ | (10,839 | ) | | $ | (18,725 | ) | | $ | (13,513 | ) |
| Adjustments to reconcile net loss to net cash provided by (used in) operating activities: | | | | | | | |
| Adjustments to reconcile net loss to net cash provided by operating activities: | | | | | | |
| Depreciation and amortization | | 8,451 |
| | 7,457 |
| | 5,595 |
| 21,347 |
| | 11,914 |
| | 9,794 |
|
| Deferred income taxes | | 207 |
| | (295 | ) | | (104 | ) | 268 |
| | (262 | ) | | 529 |
|
| Foreign currency re-measurement loss | | 981 |
| | — |
| | — |
| |
| Amortization of deferred commissions | | 2,367 |
| | — |
| | — |
|
| Foreign currency re-measurement (gain) loss | | 305 |
| | (382 | ) | | (64 | ) |
| Non-cash interest and other expense | | 376 |
| | 589 |
| | 1,585 |
| 874 |
| | 592 |
| | 327 |
|
| Non-cash stock compensation expense | | 2,741 |
| | 1,077 |
| | 498 |
| 14,130 |
| | 9,977 |
| | 4,333 |
|
| Stock-based compensation—related party vendor | | — |
| | 11,220 |
| | — |
| |
| Loss on disposal of business | | — |
| | — |
| | 746 |
|
| Non-cash loss on retirement of fixed assets | | — |
| | (19 | ) | | 276 |
|
| Changes in operating assets and liabilities, net of purchase business combinations: | | | | | | | | | | | |
| Accounts receivable | | 741 |
| | (1,579 | ) | | 2,941 |
| (5,212 | ) | | (4,710 | ) | | (361 | ) |
| Prepaids and other | | 1,873 |
| | 484 |
| | (1,617 | ) | (2,798 | ) | | 1,555 |
| | 648 |
|
| Accounts payable | | 157 |
| | 639 |
| | (1,113 | ) | (3,399 | ) | | 1,254 |
| | (1,453 | ) |
| Accrued expenses and other liabilities | | (2,796 | ) | | (924 | ) | | 2,176 |
| (17,615 | ) | | 3,715 |
| | 413 |
|
| Deferred revenue | | (570 | ) | | 2,626 |
| | (1,003 | ) | 7,919 |
| | 2,807 |
| | 2,200 |
|
| Net cash provided by (used in) operating activities | | (1,503 | ) | | 1,177 |
| | (239 | ) | |
| Net cash provided by operating activities | | 7,347 |
| | 7,716 |
| | 3,875 |
|
| Investing activities | | | | | | | | | | | |
| Purchase of property and equipment | | (956 | ) | | (861 | ) | | (263 | ) | (935 | ) | | (396 | ) | | (670 | ) |
| Purchase of customer relationships | | (791 | ) | | — |
| | — |
| — |
| | (55 | ) | | (408 | ) |
| Purchase business combinations, net of cash acquired | | (7,664 | ) | | (6,217 | ) | | (28,175 | ) | (160,751 | ) | | (110,324 | ) | | (12,151 | ) |
| Cash included in distribution of spin-off | | — |
| | — |
| | (127 | ) | |
| Net cash provided by (used in) investing activities | | (9,411 | ) | | (7,078 | ) | | (28,565 | ) | |
| Net cash used in investing activities | | (161,686 | ) | | (110,775 | ) | | (13,229 | ) |
| Financing activities | | | | | | | | | | | |
| Payments on capital leases | | (1,020 | ) | | (541 | ) | | (351 | ) | (1,136 | ) | | (1,497 | ) | | (1,683 | ) |
| Proceeds from notes payable, net of issuance costs | | 24,083 |
| | 5,685 |
| | 28,036 |
| 172,397 |
| | 74,538 |
| | 30,992 |
|
| Payments on notes payable | | (23,907 | ) | | (10,910 | ) | | (17,516 | ) | (4,689 | ) | | (11,912 | ) | | (7,190 | ) |
| Issuance of preferred stock, net of issuance costs | | — |
| | (97 | ) | | 19,716 |
| |
| Taxes paid related to net share settlement of equity awards | | (9,400 | ) | | (3,387 | ) | | — |
|
| Issuance of common stock, net of issuance costs | | (18 | ) | | 38,846 |
| | — |
| 807 |
| | 43,797 |
| | (515 | ) |
| Additional consideration paid to sellers of businesses | | (359 | ) | | (599 | ) | | (321 | ) | (8,056 | ) | | (5,361 | ) | | (2,079 | ) |
| Net cash provided by (used in) financing activities | | (1,221 | ) | | 32,384 |
| | 29,564 |
| |
| Net cash provided by financing activities | | 149,923 |
| | 96,178 |
| | 19,525 |
|
| Effect of exchange rate fluctuations on cash | | (380 | ) | | (198 | ) | | 51 |
| (1,172 | ) | | 449 |
| | 114 |
|
| Change in cash and cash equivalents | | (12,515 | ) | | 26,285 |
| | 811 |
| (5,588 | ) | | (6,432 | ) | | 10,285 |
|
| Cash and cash equivalents, beginning of period | | 30,988 |
| | 4,703 |
| | 3,892 |
| 22,326 |
| | 28,758 |
| | 18,473 |
|
| Cash and cash equivalents, end of period | | $ | 18,473 |
| | $ | 30,988 |
| | $ | 4,703 |
| $ | 16,738 |
| | $ | 22,326 |
| | $ | 28,758 |
|
| Supplemental disclosures of cash flow information | | | | | | | |
| Supplemental disclosures of cash flow information: | | | | | | |
| Cash paid for interest | | $ | 1,523 |
| | $ | 1,382 |
| | $ | 1,221 |
| $ | 12,429 |
| | $ | 6,012 |
| | $ | 2,455 |
|
| Cash paid for taxes | | $ | 314 |
| | $ | 252 |
| | $ | 287 |
| $ | 3,348 |
| | $ | 1,782 |
| | $ | 488 |
|
| Noncash investing and financing activities | | | | | | | |
| Notes payable issued to sellers in business combination | | $ | — |
| | $ | — |
| | $ | 3,500 |
| |
| Noncash investing and financing activities: | | | | | | |
| Business combination consideration including holdbacks and earnouts | | $ | 17,713 |
| | $ | 9,132 |
| | $ | 5,100 |
|
| Equipment acquired pursuant to capital lease obligations | | $ | 3,428 |
| | $ | 1,572 |
| | $ | 649 |
| $ | — |
| | $ | 50 |
| | $ | 1,293 |
|
| Issuance of common stock in business combination | | $ | — |
| | $ | — |
| | $ | 8,300 |
|
See accompanying notes.
Upland Software, Inc.
Notes to Consolidated Financial Statements
1. Organization and Nature of Operations
Upland Software, Inc. (“Upland” or the “Company”) is a leading provider of cloud-based enterprise work management software. Upland’s software applications help organizations better optimize the allocation and utilization of their people, time, and money. Upland provides a family of cloud-based enterprise work management software applications for the information technology, process excellence, finance, professional services, and marketing functions within organizations. Upland’s software applications address a broad range of enterprise work management needs, from strategic planning to task execution.
2. Summary of Significant Accounting Policies
Basis of Presentation
These consolidated financial statements have been prepared in conformity with accounting principles generally accepted in the United States, or GAAP. The condensed consolidated financial statements include the accounts of the Company and its wholly owned subsidiaries. All intercompany accounts and transactions have been eliminated in consolidation. Certain prior period amounts have been reclassified to confirmconform to the current period presentation.
Use of Estimates
The preparation of the accompanying consolidated financial statements in conformity with GAAP requires management to make estimates and assumptions that affect the reported amounts of assets and liabilities, disclosure of contingent assets and liabilities at the date of the consolidated financial statements, and the reported amounts of revenues and expenses. Significant items subject to such estimates include those related to revenue recognition, deferred commissions, allowance for doubtful accounts, stock-based compensation, acquired intangible assets, the useful lives of intangible assets and property and equipment, and income taxes. In accordance with GAAP, management bases its estimates on historical experience and on various other assumptions that management believes are reasonable under the circumstances. Management regularly evaluates its estimates and assumptions using historical experience and other factors; however, actual results could differ from those estimates.
Cash and Cash Equivalents
Cash and cash equivalents consist of cash deposits and liquid investments with original maturities of three months or less when purchased. Cash equivalents are stated at cost, which approximates market value, because of the short maturity of these instruments.
Accounts Receivable and Allowance for Doubtful Accounts
The Company extends credit to the majority of its customers. Issuance of credit is based on ongoing credit evaluations by the Company of customers’ financial condition and generally requires no collateral. Trade accounts receivable are recorded at the invoiced amount and do not bear interest. Invoices generally require payment within 30 days from the invoice date. The Company generally does not charge interest on past due payments, although the Company's contracts with its customers usually allow it to do so.
The Company maintains an allowance for doubtful accounts to reserve for potential uncollectible receivables. The allowance is based upon the creditworthiness of the Company’s customers, the customers’ historical payment experience, the age of the receivables and current market conditions. Provisions for potentially uncollectible accounts are recorded in sales and marketing expenses. The Company writes off accounts receivable balances to the allowance for doubtful accounts when it becomes likely that they will not be collected.
The following table presents the changes in the allowance for doubtful accounts (in thousands): | | | | Year Ended December 31, | Year Ended December 31, |
| | 2015 | | 2014 | | 2013 | 2018 | | 2017 | | 2016 |
| Balance at beginning of year | $ | 890 |
| | $ | 454 |
| | $ | 321 |
| $ | 1,069 |
| | $ | 658 |
| | $ | 581 |
|
| Provision | 412 |
| | 829 |
| | 725 |
| 875 |
| | 1,069 |
| | 863 |
|
| Acquisitions | — |
| | 400 |
| | 295 |
| |
| Divestitures | | — |
| | — |
| | (230 | ) |
| Writeoffs, net of recoveries | (721 | ) | | (793 | ) | | (887 | ) | (539 | ) | | (658 | ) | | (556 | ) |
| Balance at end of year | $ | 581 |
| | $ | 890 |
| | $ | 454 |
| $ | 1,405 |
| | $ | 1,069 |
| | $ | 658 |
|
Concentrations of Credit Risk and Significant Customers
Financial instruments that potentially subject the Company to credit risk consist of cash and cash equivalents and accounts receivable. The Company’s cash and cash equivalents are placed with high-quality financial institutions, which, at times, may exceed federally insured limits. The Company has not experienced any losses in these accounts, and the Company does not believe it is exposed to any significant credit risk related to cash and cash equivalents. The Company provides credit, in the normal course of business, to a number of its customers. The Company performs periodic credit evaluations of its customers and generally does not require collateral. No individual customer represented more than 10% of total revenues ornor more than 10% of accounts receivable in the years ended December 31, 2015, 2014,2018, 2017, or 2013.2016.
Property and Equipment
Property and equipment are carried at cost, less accumulated depreciation and amortization. Depreciation of property and equipment is computed using the straight-line method over each asset’s useful life. Leasehold improvements are amortized over the shorter of the lease term or of the estimated useful lives of the related assets. Upon retirement or disposal, the cost of each asset and the related accumulated depreciation are removed from the accounts and any resulting gain or loss is credited or charged to income. Repairs, maintenance, and minor replacements are expensed as incurred. The estimated useful lives of property and equipment are as follows: |
| |
| Computer hardware and equipment | 3 - 5 years |
| Purchased software and licenses | 3 - 5 years |
| Furniture and fixtures | 7 years |
| Leasehold improvements | Lesser of estimated useful life or lease term |
Business Combinations
We apply the provisions of ASC 805, Business Combinations, in accounting for our acquisitions which requires the acquisition purchase price to be allocated to the tangible and intangible assets acquired and liabilities assumed based on their estimated fair values at the acquisition dates. The excess of the purchase price over these estimated fair values is recorded to goodwill.
Significant estimates and assumptions, including fair value estimates, are used to determine the fair value of assets acquired, liabilities assumed and contingent consideration transfered as well as the useful lives of long-lived assets acquired. During the measurement period, which may be up to one year from the acquisition date, we may record adjustments to the assets acquired and liabilities assumed with the corresponding offset to goodwill based on changes to our intial estimates and assumptions. Upon conclusion of the measurement period or final determination of the values of assets acquired and liabilities assumed, whichever comes first, any subsequent adjustments are recorded to acquisition related expenses in our consolidated statement of operations.
Tangible assets are valued at their respective carrying amounts, which approximates their estimated fair value. The valuation of identifiable intangible assets reflects management’s estimates based on, among other factors, use of established valuation methods. Customer relationships are valued using an income approach, which estimates fair
value based on the earnings and cash flow capacity of the subject asset. The value of the marketing-related intangibles is determined using a relief-from-royalty method, which estimates fair value based on the value the owner of the asset receives from not having to pay a royalty to use the asset. Developed technology is valued using a cost-to-recreate approach.
The purchase price transfered in our acquisitions often contain holdback and contingent consideration provisions. Holdbacks are subject to reduction for indemnification claims and are typically payable within 12 to 18 months of the acquisition date. Contingent consideration typically includes earnout payments payable within 12 to 18 months of the date of acquisition based on attainment of certain performance goals. Contingent consideration liabilities are recorded at fair value on the acquisition date and are remeasured periodically based on the then assessed fair value and adjusted if necessary. Holdback and contingent consideration liabilities are recorded in due to sellers in our consolidated balance sheet. Any changes in fair value of the contingent consideration subsequent to the measurement period are recorded to operating income (expense) in our statement of operations.
Goodwill and Other Intangibles
Goodwill arises from business combinations and is measured as the excess of the cost of the business acquired over the sum of the acquisition-date fair value of tangible and identifiable intangible assets acquired, less any liabilities assumed.
Goodwill is evaluated for impairment annually in October or more frequently when an event occurs or circumstances change that indicate the carrying value may not be recoverable. The events and circumstances considered by the Company include the business climate, legal factors, operating performance indicators and competition.competition.The company adopted ASU 2017-04, Intangibles - Goodwill and Other: Simplifying the Test for Goodwill Impairment during the first quarter of 2018 which eliminated step 2 from the goodwill impairment test.
The Company evaluatesAs we operate as one reporting unit, the recoverability of goodwill using a two-step impairment process testedtest is performed at the reporting unit level. Theconsolidated entity level by comparing the estimated fair value of the Company has one reporting unit for goodwill impairment purposes. Into the its carrying value. We have elected to first step,assess qualitative factors to determine whether it is more likely than not that the fair value of theour single reporting unit is compared toless than its carrying value. Based on the book value, including goodwill. Inqualitative assessment, if it is determined that it is more likely than not that the case that theCompany's fair value is less than its carrying value we would compare the bookcarrying value a second step is performed that comparesof the impliedCompany's single reporting unit to its fair value and recognize any excess carrying value as an impairment loss.
Determining the fair value of goodwill is subjective in nature and often involves the use of estimates and assumptions including, without limitation, use of estimates of future prices and volumes for our products, capital needs, economic trends and other factors which are inherently difficult to forecast. If actual results, or the book value of goodwill. The fair value for the implied goodwill is determined based on the difference between the fair value of the reporting unitplans and the net fair value of the identifiable assets and liabilities, excluding goodwill. If the implied fair
value of the goodwill is lessestimates used in future impairment analyses are lower than the book value,original estimates used to assess the difference is recognized as an impairment charge in the consolidated statementrecoverability of operations. No goodwillthese assets, we could incur impairment charges were recordedin a future period. The annual impairment test was performed as of October 31, 2018. No impairment of goodwill was identified during the years ended December 31, 2015, 2014,2018, 2017, or 2013.2016.
Identifiable intangible assets consist of customer relationships, marketing-related intangible assets and developed technology. Intangible assets with definite lives are amortized over their estimated useful lives on a straight-line basis. The straight-line method of amortization represents the Company’s best estimate of the distribution of the economic value of the identifiable intangible assets.
Intangible assets are reviewed for impairment whenever events or changes in circumstances indicate the carrying amount of intangible assets may not be recoverable. Conditions that would necessitate an impairment assessment include a significant decline in the observable market value of an asset, a significant change in the extent or manner in which an asset is used or any other significant adverse change that would indicate that the carrying amount of an asset or group of assets may not be recoverable. The Company evaluates the recoverability of intangible assets by comparing their carrying amounts to the future net undiscounted cash flows expected to be generated by the intangible assets. If such intangible assets are considered to be impaired, the impairment to be recognized is measured as the amount by which the carrying amount of the intangible assets exceeds the fair value of the assets.
The Company determines fair value based on discounted cash flows using a discount rate commensurate with the risk inherent in the Company’s current business model for the specific intangible asset being valued. The Company determined there was an impairment of the PowerSteering trade name of $1.1 million during 2013. There were no such impairments of our intangible assets during 2015 and 2014.the years ended December 31, 2018, 2017 or 2016.
Long-Lived Assets
Long-lived assets are reviewed for impairment whenever events or circumstances indicate their carrying value may not be recoverable. When such events or circumstances arise, an estimate of future undiscounted cash flows
produced by the asset, or the appropriate grouping of assets, is compared to the asset's carrying value to determine whether impairment exists. If the asset is determined to be impaired, the impairment loss is measured based on the excess of its carrying value over its fair value. Assets to be disposed of are reported at the lower of the carrying value or net realizable value. No indicators of impairment were identified during the years ended December 31, 2015, 2014,2018, 2017, or 2013.2016.
Software Development Costs
Software development costs are expensed as incurred until the point the Company establishes technological feasibility. Technological feasibility is established upon the completion of a working model. Costs incurred by the Company between establishment of technological feasabilityfeasibility and the point at which the product is ready for general release are capitalized, subject to their recoverability, and amortized over the economic life of the related products. Because the Company believes its current process for developing its software products essentially results in the completion of a working product concurrent with the establishment of technological feasibility, no software development costs have been capitalized to date. There were no software development costs required to be capitalized under ASC 985-20, Costs of Software to be Sold, Leased or Marketed, and under ASC 350-40, Internal-Use Software.
Canadian Tax Credits
Canadian tax credits related to current expenses are accounted for as a reduction of the research and development costs. Such credits relate to the Company's operations in Canada and are not dependent upon taxable income. Credits are accrued in the year in which the research and development costs or the capital expenditures are incurred, provided the Company is reasonably certain that the credits will be received. The government credit must be examined and approved by the tax authorities, and it is possible that the amounts granted will differ from the amounts recorded.
Deferred FinancingDebt Issuance Costs
The Company capitalizes underwriting, legal, and other direct costs incurred related to the issuance of debt, which are recorded as deferred chargesa direct deduction from the carrying amount of the related debt liability and amortized to interest expense over the term of the related debt using the effective interest rate method. Upon the extinguishment of the related debt, any unamortized capitalized deferred financing costs are recorded to interest expense. In 2014,2018 and 2017, the Company had no write offs of deferred financing costs and in 2016 the Company wrote off approximately $0.4$0.1 million of deferred financing costs associated with a financing facility no longer required after the initial public offering. In 2013, the Company wrote off approximately $0.2 million of deferred financing costs in connection with the refinancingexpansion of its debt facility. In 2015, the Company wrote off approximately $0.2 million of deferred financing costs associated with its Comerica facility replaced by the new Wells Fargo facility.
Fair Value of Financial Instruments
The Company accounts for financial instruments in accordance with the authoritative guidance on fair value measurements and disclosures for financial assets and liabilities. This guidance defines fair value, establishes a framework for measuring fair value in accordance with GAAP, and expands disclosures about fair value measurements. The guidance also establishes a three-tier fair value hierarchy, which prioritizes the inputs used in measuring fair value.
These tiers include Level 1, defined as observable inputs, such as quoted prices in active markets; Level 2, defined as inputs other than quoted prices in active markets that are either directly or indirectly observable; and Level 3, defined as unobservable inputs in which little or no market data exists, therefore, requiring an entity to develop its own assumptions.
The Company’s financial instruments consist principally of cash and cash equivalents, accounts receivable, and accounts payable, long–term debt and warrant liabilities. The carrying value of cash and cash equivalents, accounts receivable, and accounts payable approximate fair value, primarily due to short maturities. The carrying values of the Company’s debt instruments approximated their fair value based on rates currently available to the Company. The carrying values of warrant liabilities are marked to the market at each reporting period.
Revenue Recognition
TheOn January 1, 2018, the Company derivesadopted ASU 2014-09, Revenue from Contracts with Customers. Refer to Note 12 Revenue Recognition for a detailed discussion of accounting policies related to revenue from product revenue, consisting of subscription, support and perpetual licenses, and professional services revenues. The Company recognizes revenue when all of the following criteria are met: persuasive evidence of an arrangement exists, delivery of the product or services has occurred, no Company obligations with regard to implementation considered essential to the functionality remain, the fee is fixed or determinable and collectability is probable.
Subscription and Support Revenue
The Company derives subscription revenues by providing its software-as-a-service solution to customers in which the customer does not have the right to take possession of the software, but can use the software for the contracted term. The Company accounts for these arrangements as service contracts. Subscription and support revenues are recognized on a straight-line basis over the term of the contractual arrangement, typically one to three years. Amounts that have been invoiced and that are due are recorded inrecognition, including deferred revenue or revenue, depending on when the criteria for revenue recognition are met. Revenue from usage-based services are recognized in the month in which such usage is reported.
The Company may provide hosting services to customers who purchased a perpetual license. Such hosting services are recognized ratably over the applicable term of the arrangement. These hosting arrangements are typically for a period of one to three years.
Software maintenance agreements provide technical support and the right to unspecified upgrades on an if-and-when-available basis. Revenue from maintenance agreements is recognized ratably over the life of the related agreement, which is typically one year.
Perpetual License Revenue
The Company also records revenue from the sales of proprietary software products under perpetual licenses. For license agreements in which customer acceptance is a condition to earning the license fees, revenue is not recognized until acceptance occurs. The Company’s products do not require significant customization. Revenue on arrangements with customers who are not the ultimate users (primarily resellers) is not recognized until the product is delivered to the end user. Perpetual licenses are sold along with software maintenance and, sometimes, hosting agreements. When vendor specific objective evidence (VSOE) of fair value exists for the software maintenance and hosting agreement, the perpetual license is recognized under the residual method whereby the fair value of the undelivered software maintenance and hosting agreement is deferred and the remaining contract value is recognized immediately for the delivered perpetual license. When VSOE of fair value does not exist for the either the software maintenance or hosting agreement, the entire contract value is recognized ratably over the underlying software maintenance and/or hosting period.
Professional Services Revenue
Professional services provided with perpetual licenses consist of implementation fees, data extraction, configuration, and training. The Company’s implementation and configuration services do not involve significant customization of the software and are not considered essential to the functionality. Revenues from professional services are recognized as such services are provided when VSOE of fair value exists for such services and all undelivered elements such as software maintenance and/or hosting agreements. VSOE of fair value for services is based upon the price charged when these services are sold separately, and is typically an hourly rate. When VSOE of fair value does not exist for software maintenance and/or hosting agreements, revenues from professional services are recognized ratably over the underlying software maintenance and/or hosting period.
Professional services, when sold with the subscription arrangements, are accounted for separately when these services have value to the customer on a standalone basis and there is objective and reliable evidence of fair value for each deliverable. When accounted for separately, revenues are recognized as the services are rendered for time and material contracts. For those arrangements where the elements do not qualify as a separate unit of accounting, the Company recognizes professional services ratably over the contractual life of the related application subscription arrangement. Currently, all professional services are accounted for separately as all have value to the customer on a standalone basis.
Multiple Element Arrangements
The Company enters into arrangements with multiple-element that generally include subscriptions and implementation and other professional services.
For multiple-element arrangements, arrangement consideration is allocated to deliverables based on their relative selling price. In order to treat deliverables in a multiple-element arrangement as separate units of accounting, the elements must have standalone value upon delivery. If the elements have standalone value upon delivery, each element must be accounted for separately. The Company’s subscription services have standalone value as such services are often sold separately. In determining whether implementation and other professional services have standalone value apart from the subscription services, the Company considers various factors including the availability of the services from other vendors. The Company has concluded that the implementation services included in multiple-element arrangements have standalone value. As a result, when implementation and other professional services are sold in a multiple-element arrangement, the arrangement consideration is allocated to the identified separate units based on a relative selling price hierarchy. The selling price for a element is based on its VSOE of selling price, if available, third-party evidence of selling price, or TPE, if VSOE is not available or best estimate of selling price, or BESP, if neither VSOE nor TPE is available. The Company has not established VSOE for its subscription services due to lack of pricing consistency, the introduction of new services and other factors. The Company has determined that TPE is not a practical alternative due to differences in its service offerings compared to other parties and the availability of relevant third-party pricing information. Accordingly, the Company uses BESP to determine the relative selling price.
The Company determined BESP by considering its overall pricing objectives and market conditions. Significant pricing practices taken into consideration include the Company’s discounting practices, the size and volume of its transactions, customer characteristics, price lists, go-to-market strategy, historical standalone sales and agreement
prices. As the Company’s go-to-market strategies evolve, it may modify its pricing practices in the future, which could result in changes in relative selling prices, and include both VSOE and BESP.
Deferred Revenue
Deferred revenue represents either customer advance payments or billings for which the aforementioned revenue recognition criteria have not yet been met.
Messaging-related Revenue
The Company recognizes subscription revenue for its digital engagement application which provides short code connectivity for its two-way SMS programs and campaigns. The Company evaluates whether it is appropriate to recognize revenue based on the gross amount billed to its customers for these services. Since the Company is primarily obligated in these transactions, has latitude in establishing prices associated with its messaging program management services, is responsible for fulfillment of the transaction, and has credit risk, revenue is recorded on a gross basis. While none of the factors individually are considered presumptive or determinative, in reaching conclusions on gross versus net revenue recognition, the Company places the most weight on the analysis of whether or not it is the primary obligor in the arrangement.commissions.
Cost of Revenue
Cost of revenue primarily consists of salaries and related expenses (e.g. bonuses, employee benefits, and payroll taxes) for personnel directly involved in the delivery of services and products directly to customers. Cost of revenue also includes the amortization of acquired technology.
Customer Contract Acquisition Costs
Costs associated with the acquisition or origination of customer contracts are expensed as incurred.
Customer Relationship Acquisition Costs
Costs associated with the acquisition or origination of customer relationships are capitalized as customer relationship assets as incurred and amortized over the estimated life of the acquired contracts.customer relationship.
Advertising Costs
Advertising costs are expensed in the period incurred. Advertising expenses included in saleswere $79,000, $33,000 and marketing expense were $347,000 $283,000 and $175,000$59,000 for the years ended December 31, 2015, 2014,2018, 2017, or 2013,2016, respectively. Advertising costs are recorded in sales and marketing expenses in the accompanying consolidated statement of operations.
Income Taxes
The Company uses the asset and liability method of accounting for income taxes. Under this method, deferred tax assets and liabilities are recognized for the expected future tax consequences of temporary differences between the carrying amounts and the tax bases of assets and liabilities. Deferred tax assets and liabilities are measured using enacted tax rates expected to apply to taxable income in the years in which those temporary differences are expected to be recovered or settled. The effect of a change in tax rates on deferred tax assets and liabilities will be recognized in the period that includes the enactment date. A valuation allowance is established against the deferred tax assets to reduce their carrying value to an amount that is more likely than not to be realized.
The Company has adopted a permanent reinvestment position whereby foreign earnings for foreign subsidiaries are expected to be reinvested and future earnings are not expected to be repatriated. As a result of this policy, no tax liability has been accrued in anticipation of future dividends from foreign subsidiaries.
The Company accounts for uncertainty of income taxes based on a “more likely than not” threshold for the recognition and derecognition of tax positions, which includes the accounting for interest and penalties.
Stock-Based Compensation
Stock options awarded to employees and directors are measured at fair value at each grant date. The Company accounts for stock-based compensation in accordance with authoritative accounting principles which requireWe measure all
share-based compensation to employees,payments, including grants of employee stock options to bepurchase common stock and the issuance of restricted stock or restricted stock units to employees, service providers and board members, using a fair-value based method. We record forfeitures as they occur. The cost of services received from employees and non-employees in exchange for awards of equity instruments is recognized in the financial statementsconsolidated statement of operations based on theirthe estimated fair value. Compensation expense is determined undervalue of those awards on the grant date and amortized on a straight-line basis over the requisite service period. We use the Black-Scholes option-pricing model to determine the fair values of stock option awards. For restricted stock and restricted stock units, fair value method usingis based on the Black-Scholes option pricing model and recognized ratably overclosing price of our common stock on the period the awards vest. grant date.
The Black-Scholes option pricing model used to compute share-based compensation expense requires extensive use of accounting judgment and financial estimates. Items requiring estimation include the expected term option holders will retain their vested stock options before exercising them, the estimated volatility of the Company’s common stock price over the expected term of each stock option, and the number of stock options that will be forfeited prior to the completion of their vesting requirements. Application of alternative assumptions could result in significantly different share-based compensation amounts being recorded in the financial statements. The following table summarizes the weighted-average grant-date fair value of options granted in 2015, 2014,2018, 2017, and 20132016 and the assumptions used to develop their fair values. As there was no public market for its common stock prior to November 2014, the Company estimates the volatility of its common stock based on the volatility of publicly traded shares of comparable companies' common stock. The Company's decision to use the volatility of comparable stock was based upon the Company's assessment that this information is more representative of future stock price trends than the Company's historical volatility. The Company estimates the expected term using the simplified method, which calculates the expected term as the midpoint between the vesting date and the contractual termination date of each award. The dividend yield assumption is based on historical and expected future dividend payouts. The risk-free interest rate is based on observed market interest rates appropriate for the term of each options.
| | | | Year Ended December 31, | Year Ended December 31, |
| | 2015 | | 2014 | | 2013 | 2018 | | 2017 | | 2016 |
| Weighted average grant-date fair value of options | $3.01 | | $3.76 | | $0.91 | $11.42 | | $7.47 | | $3.23 |
| Expected volatility | 42.5% - 44.0% | | 54.1% - 55.2% | | 53.3% | 33.4% | | 35.0% | | 42.5% |
| Risk-free interest rate | 1.7% - 1.9% | | 1.6% - 1.9% | | 1.6% | 2.8% | | 1.1% - 2.0% | | 1.2% |
| Expected life in years | 5.93 | | 6.29 | | 6.29 | 5.00 | | 5.00 | | 5.93 |
| Dividend yield | — | | — | | — | — | | — | | — |
Comprehensive Loss
The Company utilizes the guidance in Accounting Standards Codification (ASC) Topic 220, Comprehensive Income, for the reporting and display of comprehensive loss and its components in the consolidated financial statements. Comprehensive loss comprises net loss and cumulative foreign currency translation adjustments. The accumulated comprehensive loss as of December 31, 2015, 2014,2018, 2017, and 20132016 was due to foreign currency translation adjustments.
Foreign Currency Transactions
The functional currency of our foreign subsidiaries are the local currencies. Results of operations for foreign subsidiaries are translated in United State dollars using the average exchange rates on a monthly basis during the year. The assets and liabilities of those subsidiaries are translated into United States dollars using the exchange rates in effect at the balance sheet date. The related translation adjustments are recorded in a separate component of stockholders' equity in accumulated other comprehensive loss. Foreign currency transaction gains and losses are included in theother income (expense) in our statements of operations and includeoperations. For the impact of revaluation of certainyear ended December 31, 2018 foreign currency denominated net assets or liabilities held internationally.transaction gains were $293,000. For the years ended December 31, 2015, 2014,2017 and 2013,2016 foreign currency transaction losses were $515,000, $2,000$178,000, and $550,000,$271,000, respectively.
Basic and Diluted Net Loss per Common Share
The Company usesWe have a foreign currency denominated intercompany loan that was used to fund the two-class method to compute net loss per common share because the Company has issued securities, other than common stock, that contractually entitle the holders to participate in dividends and earningsacquisition of the Company. The two-class method requires earnings for the period to be allocated between common stock and participating securities based upon their respective rights to receive distributed and undistributed earnings. Holders
of the Company’s Series A, B, B-1, B-2 and C preferred stock are entitled, on a pari passu basis, to receive dividends when, as, and if declared by the board of directors, prior and in preference to any declaration or payment of any dividend on the common stock until such time as the total dividends paid on each share of Series A, B, B-1, B-2 and C preferred stock is equal to the original issue price of the shares. As a result, all series of the Company’s preferred stock are considered participating securities. All of the outstanding preferred stock was converted to common stock upon the Company's initial public offering in November 2014.
Under the two-class method, for periods with net income, basic net income per common share is computed by dividing the net income attributable to common stockholders by the weighted-average number shares of common stock outstandingforeign subsidiary during the period. Net income attributable to common stockholders is computed by subtracting from net income the portion of current year earnings that the participating securities would have been entitled to receive pursuant to their dividend rights had all of the year’s earnings been distributed. No such adjustment to earnings is made during periods with a net loss, as the holders of the participating securities have no obligation to fund losses. Diluted net loss per common share is computed under the two-class method by using the weighted-average number of shares of common stock outstanding plus, for periods with net income attributable to common stockholders, the potential dilutive effects of stock options and warrants. In addition, the Company analyzes the potential dilutive effect of the outstanding participating securities under the if-converted method when calculating diluted earnings per share, in which it is assumed that the outstanding participating securities convert into common stock at the beginning of the period. The Company reports the more dilutive of the approaches as its diluted net income per share during the period. Due to net losses for the years ended December 31, 2015, 2014, and 2013, basic and diluted net loss per share were2018. Due to the same,long-term nature of the loan, the foreign currency gains (losses) resulting from remeasurement are recognized as a component of accumulated other comprehensive income (loss). During the effectyear ended December 31, 2018, a foreign currency translation adjustment of all potentially dilutive securities would have been anti-dilutive.$1.4 million was recognized as a component of accumulated other comprehensive income (loss) related to this long-term intercompany loan.
Recent Accounting Pronouncements
Recently issued accounting pronouncements not yet adopted
In August 2018, the FASB issued ASU 2018-13, Fair Value Measurement (Topic 820): Disclosure Framework — Changes to the Disclosure Requirements for Fair Value Measurement, to eliminate, add and modify certain disclosure requirements for fair value measurements. Entities will no longer be required to disclose the amount of and reasons for transfers between Level 1 and Level 2 of the fair value hierarchy, but public companies will be required to disclose the range and weighted average used to develop significant unobservable inputs for Level 3 fair value measurements. The guidance is effective for annual and interim periods beginning after December 15, 2019, but entities are permitted to early adopt either the entire standard or only the provisions that eliminate or modify the requirements. The Company is currently evaluating how to apply the new guidance.
In January 2018, the FASB issued ASU 2018-02 Income Statement - Reporting Comprehensive Income (ASC 220): Reclassification of Certain Tax Effects from Accumulated Other Comprehensive Income (AOCI), which gives entities the option to reclassify to retained earnings the tax effects resulting from the Tax Act related to items in Additional Other Comprehensive Income (AOCI) that the FASB refers to as having been “stranded” in AOCI. The guidance is effective for annual and interim periods beginning after December 15, 2018, and is applicable to the Company in 2019; however, early adoption is permitted. The Company is currently evaluating the effect that the adoption of ASU 2018-02 will have on its financial statements.
In February 2016, the FASB issued ASU 2016-02, Leases (Topic 842). The new standard supersedes the present U.S. GAAP standard on leases and requires substantially all leases to be reported on the balance sheet as right-of-use assets and lease obligations. ASU 2016-02 is effective for annual reporting periods beginning after December 15, 2018, and interim reporting periods within those annual reporting periods. Early adoption is permitted and in the original guidance the modified retrospective application was required, however, in July 2018 the FASB issued ASU 2018-11 which permits entities with another transition method in which the effective date would be the date of initial application of transition. Under this optional transition method, we would recognize a cumulative-effect adjustment to the opening balance of retained earnings in the period of adoption. We expect to elect the optional transition method. We plan to adopt the new standard on its effective date of January 1, 2019. We anticipate adoption of the standard will not significantly impact results. We are evaluating the election of the practical expedients upon transition that would retain the lease classification and initial direct costs for any leases that exist prior to adoption of the standard. We are in the process of cataloging our existing lease contracts and implementing changes to our systems. We currently estimate $4.7 million to $6.2 million of right-of-use assets and lease liabilities will be recognized on our balances sheet as of January 1, 2019 primarily related to our office facilities.
In June 2016, the FASB issued ASU 2016-13, Financial Instruments - Credit Losses: Measurement of Credit Losses on Financial Instruments, which changes the impairment model for most financial assets. The new model uses a forward-looking expected loss method, which will generally result in earlier recognition of allowances for losses. ASU 2016-13 is effective for annual and interim periods beginning after December 15, 2019 and early adoption is permitted for annual and interim periods beginning after December 15, 2018. The Company is currently evaluating the effect that the adoption of ASU 2016-13 will have on its financial statements.
Recently adopted accounting pronouncements
In August 2018, the FASB issued ASU 2018-15, Intangibles-Goodwill and Other-Internal-Use Software (ASC 350-40): Customer’s Accounting for Implementation Costs Incurred in a Cloud Computing Arrangement (“CCA“) That Is a Service Contract, which requires hosting arrangements that are service contracts to follow the guidance for internal-use software to determine which implementation costs can be capitalized. ASU 2018-15 is effective either prospectively or retrospectively for fiscal years beginning after December 15, 2019, and interim periods within those fiscal years, with early adoption permitted. We early adopted ASU 2018-15 on a prospective basis during the fourth quarter of 2018. As a result of the adoption of ASU 2018-15 certain implementation costs related to CCAs that are service contracts will now be capitalized as “other assets” in the Company's consolidated balance sheet in accordance with ASC 350-40. All implementation costs related to these arrangements were previously expensed as incurred prior to adoption of ASU 2018-15. Capitalized implementation costs will be amortized to operating expense over the non-cancelbale term of the underlying agreement plus any reasonably certain renewal periods. There was no material impact to our financial statements upon adoption of ASU 2018-15.
In June 2018, the Financial Accounting Standards Board (“FASB”) issued Accounting Standard Update (“ASU”) 2018-07 Compensation—Stock Compensation (Topic 718): Improvements to Nonemployee Share-Based Payment Accounting which simplifies the accounting for share-based payments to nonemployees by aligning it with the accounting for share-based payments to employees, with certain exceptions. For public business entities, the guidance is effective for annual periods beginning after December 15, 2018, and interim periods within those annual periods, however, early adoption is permitted. Although nonemployee directors do not satisfy the definition of employee, under FASB guidance, the Company's nonemployee directors acting in their role as members of a board of directors are treated as employees as those directors were elected by the Company's shareholders. Therefore, awards granted to these nonemployee directors for their services as directors already were accounted for as employee awards. We adopted ASU 2018-07 during the second quarter of 2018 with no material impact on our financial statements.
In May 2014, the FASB issued FASB ASU No. 2014-09, Revenue from Contracts with Customers (Topic 606), which supersedes theto replace existing revenue recognition requirementsrules with a single comprehensive model to use in ASC 605, Revenue Recognition. The core principle ofaccounting for revenue arising from contracts with customers. Under this ASU 2014-09and the associated subsequent amendments (collectively, “ASC 606”), revenue is that an entity should recognize revenue to depict the transferrecognized when a customer obtains control of promised goods or services to customers infor an amount that reflects the consideration to which the entity expects to be entitledreceive in exchange for those goods or services. The guidance provides a five-step process to achieve that core principle. ASU 2014-09In addition, ASC 606 requires disclosures enabling usersexpanded disclosure of financial statements to understand the nature, amount, timing and uncertainty of revenue and cash flows arising from contracts with customers. Additionally, qualitative
The Company adopted ASC 606 on January 1, 2018 for all contracts using the modified retrospective method. We recognized the cumulative effect of initially applying the new revenue standard as an adjustment to the opening balance of accumulated deficit. The comparative information has not been restated and quantitative disclosurescontinues to be reported under the accounting standards in effect for those periods. We expect the impact of the adoption of the new revenue standard to be immaterial to our net income on an ongoing basis.
A majority of our sales revenue continues to be recognized ratably over the applicable term of the respective subscription or maintenance contracts. For most sales commissions formerly expensed as incurred, other than for perpetual license commissions which will continue to be expensed as incurred, we are requirednow amortizing these costs to the consolidated statements of income over the shorter of 1) the expected life of our customer relationships, which we have determined to be approximately 6 years, or 2) the life of the related technology.
For further discussion about contracts with customers, significant judgmentsthe financial statement impact and changes in judgments, and assets recognized fromto Significant Accounting Policies impacted by the costs to obtain or fulfill a contract. adoption of 2014-09 (Topic 606) see Note 12 Revenue Recognition.
In August 2015,January 2017, the FASB issued FASB ASU No. 2015-14, Revenue from Contracts with Customers (Topic 606): Deferral2017-01, Clarifying the Definition of a Business, which revises the definition of a business and assists in the evaluation of when a set of transferred assets and activities is a business. ASU 2017-01 is effective for interim and annual reporting periods beginning after December 15, 2017, and should be applied prospectively. Early adoption is permitted under certain circumstances. The Company adopted ASU 2017-01 during the first quarter of 2018. No impact on the financial statements was recorded as a result of the Effective Date, which deferred the effective dateadoption of ASU 2014-092017-01.
In January 2017, the FASB issued ASU 2017-04, Intangibles - Goodwill and Other: Simplifying the Test for Goodwill Impairment. ASU 2017-04 eliminates step two of the goodwill impairment test and specifies that goodwill impairment should be measured by one year.comparing the fair value of a reporting unit with its carrying amount. Additionally, the amount of goodwill allocated to each reporting unit with a zero or negative carrying amount of net assets should be disclosed. ASU 2014-092017-04 is now effective for annual or interim goodwill impairment tests performed in fiscal years beginning after December 15, 2019; early adoption is permitted. The Company adopted ASU 2017-04 during the first quarter of 2018. No impact on the financial statements was recorded as a result of the adoption of ASU 2017-04.
In August 2016, the FASB issued ASU 2016-15, Classification of Certain Cash Receipts and Cash Payments. ASU 2016-15 is intended to add or clarify guidance on the classification of certain cash receipts and payments in the statement of cash flows and to eliminate the diversity in practice related to such classifications. The guidance in ASU 2016-15 is required for annual reporting periods beginning after December 15, 2017, including interim periods within that reporting period, using one of two retrospective application methods. Early application is permitted only as of annual reporting periods beginning after December 15, 2016, including interim reporting periods within that reporting period. The Company is currently evaluating the effect that the adoption of ASU 2014-09 and ASU 2015-14 will have on its financial statements.
In August 2014, the FASB issued FASB ASU No. 2014-15, Presentation of Financial Statements - Going Concern (Subtopic 205-40): Disclosure of Uncertainties about an Entity's Ability to Continue as a Going Concern. The new standard provides guidance around management's responsibility to evaluate whether there is substantial doubt about an entity's ability to continue as a going concern and to provide related footnote disclosures. The new standard is effective for fiscal years, and interim periods within those fiscal years, beginning after December 15, 2016, with early adoption permitted. The adoption of this standard is not expected to have a material impact on the Company's financial statements.
In April 2015, the FASB issued FASB ASU No. 2015-03 Interest—Imputation of Interest (Subtopic 835-30): Simplifying the Presentation of Debt Issuance Costs. Under this revised guidance, debt issuance costs should be presented in the balance sheet as a direct deduction from the carrying value of the associated debt, consistent with the presentation of a debt discount. The recognition and measurement guidance for debt issuance costs are not affected by the amendments in this update. This revised guidance is effective for annual periods beginning after December 15, 2015, and interim periods within those fiscal years, with early adoption permitted.
The Company has adopted this standard in the second quarter of 2015. The December 31, 2014 balance sheet was retrospectively adjusted to reclassify $0.1 million from Other non-current assets to a reduction of the Notes payable liability.
In September 2015, the FASB issued ASU 2015-16, Business Combinations (Topic 805): Simplifying the Accounting for Measurement-Period Adjustments. ASU 2015-16 eliminates the requirement that an acquirer in a business combination account for measurement-period adjustments retrospectively. Instead, an acquirer will recognize a measurement-period adjustment during the period in which it determines the amount of the adjustment. The guidance is effective for public business entities for fiscal years beginning after December 15, 2015, and interim periods within those fiscal years, with early adoption permitted. The Company has adopted this standard asASU 2016-15 during the first quarter of January 1, 2015 and such adoption did not have a significant effect on the Company's financial statements.2017. No additional disclosure was
In November 2015, the FASB issued ASU 2015-17, Income Taxes (Topic 740): Balance Sheet Classification of Deferred Taxes. ASU 2015-17 eliminates the requirement for an entity to separate deferred income taxes and liabilities into current and noncurrent amounts in a classified statement of financial position. To simplify the presentation of deferred income taxes, the amendments in this Update require that deferred tax liabilities and assets be classified as noncurrent in a classified statement of financial position. The guidance is effective for public business entities for fiscal years beginning after December 15, 2016, and interim periods within those fiscal years, with early adoption permitted. The Company is currently evaluating the effect that
deemed necessary upon the adoption of ASU 2015-17 will have2016-15. No impact on itsthe financial statements.
In February 2016, the FASB issued ASU 2016-02, Leases (Topic 842). The core change with ASU 2016-2 is the requirement for the recognitionstatements was recorded as a result of lease assets and lease liabilities by lessees for those leases classified as operating leases under previous GAAP. The new standard is effective for fiscal years, and interim periods within those fiscal years, beginning after December 15, 2018, with early adoption permitted. The Company is currently evaluating the effect that the adoption of ASU 2016-02 will have on its financial statements.2016-15.
3. Acquisitions
2013We perform quantitative and qualitative analyses to determine the significance of each acquisition, to our consolidated financial statements. Based on these analyses the below acquisitions were deemed to be insignificant on an individual and cumulative basis, with the exception of Qvidian Corporation, a Delaware corporation (“Qvidian”) and Rapide Communication LTD, a private company limited by shares organized and existing under the laws of England and Wales doing business as Rant & Rave (“Rant & Rave”). Refer to the pro formas disclosed below.
2018 Acquisitions
On May 16, 2013,March 21, 2018, the Company’s wholly owned subsidiary, PowerSteering Software Limited, a limited liability company organized and existing under the laws of England and Wales (“PowerSteering UK”), completed its purchase of the shares comprising the entire issued share capital of Interfax Communications Limited (“Interfax”), an Irish-based software company providing secured cloud-based messaging solutions, including enterprise cloud fax and secure document distribution. In connection with this acquisition, the Company also acquired 100%certain assets related to Interfax’s business from a United States based reseller of the outstanding capital of FileBound Solutions, Inc. and Marex Group, Inc. (together FileBound)Interfax’s products. The purchase price consideration paid for total purchase consideration of $14.7Interfax was $33.6 million which includesin cash at closing, net of $182,000, notescash acquired of $1.4 million, and a $5.0 million cash holdback payable over 18 months (subject to the seller of $3,500,000 (at present rate) and 106,572 shares of the Company’s series B-1 preferred stock with a fair value of $624,000. FileBound provides cloud-based enterprise content management software products that enable customers to automate document-based workflows and control access and distribution of their content to boost productivity, encourage collaboration and improve compliance.reduction for indemnification claims). Revenues recorded since the acquisition date through December 31, 2018 were approximately $12.1 million.
In addition, in connection with the acquisition of Interfax, we acquired certain assets and customer relationships of their U.S. reseller (“Marketech”) for $2.0 million, excluding potential future earn-out payments of $1.0 million valued at $0.3 million as of the acquisition dated based on the probability of attainment of future performance-based goals.
On June 27, 2018, the Company completed its purchase of RO Innovation, Inc. (“RO Innovation”), a cloud-based customer reference solution for creating, deploying, managing, and measuring customer reference and sales enablement content. The purchase price consideration paid was approximately $12.3 million in cash payable at closing, net of cash acquired of $0.2 million and a $1.8 million cash holdback payable in 12 months (subject to reduction for indemnification claims) and potential future earn-out payments for up to $7.5 million valued at $0.0 million as of the acquisition date based on the probability of attainment of future performance-based goals. Revenues recorded since the acquisition date through December 31, 2018 were approximately $3.0 million.
On October 3, 2018, the Company’s wholly owned subsidiary, PowerSteering UK, completed its purchase of the shares comprising the entire issued voting share capital of Rant & Rave, a leading provider of cloud-based customer engagement solutions. The purchase price paid for Rant & Rave was $58.5 million in cash at closing, net of cash acquired, and a $6.5 million cash holdback payable in 12 months (subject to indemnification claims). Revenues recorded since the acquisition date through December 31, 2018 were approximately $5.4 million.
The pro forma statements of operations data for years ended December 31, 2018 and December 31, 2017, shown in table below, give effect to the Rant & Rave acquisition, described above, as if it had occurred at January 1, 2017. These amounts have been calculated after applying our accounting policies and adjusting the results of Rant & Rave to reflect: the reversal and deferral of commissions expense, the costs of debt financing incurred to acquire Rant & Rave, the additional intangible amortization and the adjustments to acquired deferred revenue that would have been recognized assuming the fair value adjustments had been applied and incurred since January 1, 2017. This pro forma data is presented for informational purposes only and does not purport to be indicative of our future results of operations. The table below shows the Pro forma statements of operations data for the respective years ending December 31 (in thousands):
|
| | | | | | | |
| | 2018 | | 2017 |
| Revenue | $ | 167,450 |
| | $ | 118,696 |
|
Net loss (1) | $ | (14,086 | ) | | $ | (24,867 | ) |
(1) While some recurring adjustments impact the pro forma figures presented, the decrease in pro forma net loss compared to our net loss presented on the consolidated statements of operations for the year ended December 31, 2013 were approximately $4,959,000.2018 includes nonrecurring adjustment removing acquisition costs from 2018 and reflects these costs in the year ended 2017, the year the acquisition was assumed to be completed for pro forma purposes.
On November 7, 2013,December 12, 2018, the Company acquired 100%completed its purchase of the outstanding interestAdestra Ltd. (“Adestra”), a leading provider of ComSci, LLC. (ComSci) for totalenterprise-grade email marketing, transaction and automation software. The purchase consideration of $7.6price paid was $56.0 million which includesin cash paid at closing, net of $104,000, 155,599 shares of the Company’s common stock, 155,598 shares of the company’s B-2 preferred stock withcash acquired, and a fair value of $949,000, and $750,000$4.2 million cash holdback payable in 12 months (subject to be paid in November 2014. ComSci provides cloud-based financial management software products that enable organizations to have visibility into the cost, quality, and value of internal services delivered within their organizations.indemnification claims). Revenues recorded since the acquisition date through December 31, 2018 were approximately $0.6 million.
2017 Acquisitions
On January 10, 2017, Upland completed its acquisition of Omtool, Ltd., an enterprise document capture, fax, and workflow solution company. The purchase price paid for Omtool was $19.3 million (net of cash acquired).
On April 21, 2017, the Company acquired RightAnswers, Inc. (“RightAnswers”), a cloud-based knowledge management system. The purchase price was $17.4 million, in cash at closing (net of $0.1 million cash acquired) and a $2.5 million cash holdback payable in one year (subject to indemnification claims) and excludes potential future earn-out payments valued at $4.0 million at the date of acquisition tied to additional performance-based goals, towards which $1.0 million was paid in September 2017 and an additional final payment of $2.0 million was paid during the year ended December 31, 2018.
On July 12, 2017, the Company acquired Waterfall International Inc. (“Waterfall”), a cloud-based mobile messaging platform. The purchase price consideration paid was approximately $24.4 million in cash at closing (net of $0.4 million of cash acquired) and a $1.5 million cash holdback payable in 18 months (subject to reduction for indemnification claims). The foregoing excludes potential future earn-out payments valued at $3.0 million at the date of acquisition tied to performance-based conditions, towards which $2.2 million was paid during the year ended December 31, 2018 based on the final earn-out calculation.
On November 16, 2017, Upland Software, Inc., a Delaware corporation (the “Company” or “Upland”) completed its acquisition of the entire issued voting share capital of Qvidian Corporation, a Delaware corporation (“Qvidian”), a Massachusetts-based provider of cloud-based RFP and sales-proposal automation software. The purchase price consideration paid by the Company was $50 million in cash.
The pro forma statements of operations data for years ended December 31, 2017 and December 31, 2016, shown in table below, give effect to the Qvidian acquisition, described above, as if it had occurred at January 1, 2016. These amounts have been calculated after applying our accounting policies and adjusting the results of Qvidian to reflect: the costs of debt financing incurred to acquire Qvidian, the additional intangible amortization and the adjustments to acquired deferred revenue that would have been occurred assuming the fair value adjustments had been applied and incurred since January 1, 2016. This pro forma data is presented for informational purposes only and does not purport to be indicative of our future results of operations. The table below shows the Pro forma statements of operations data for the respective years ending December 31 (in thousands):
|
| | | | | | | |
| | 2017 | | 2016 |
| Revenue | $ | 115,707 |
| | $ | 89,906 |
|
Net loss (1) | $ | (13,679 | ) | | $ | (14,370 | ) |
(1) While some recurring adjustments impact the pro forma figures presented, the decrease in pro forma net loss compared to our net loss on the consolidated statements of operations for the year ended December 31, 2013 were approximately $937,000.
On December 23, 2013,2017 includes nonrecurring adjustment removing acquisition costs from 2017 and reflects these costs in the Company acquired 100% ofyear ended 2016, the outstanding capital of Clickability, Inc. (Clickability) for total purchase consideration of $12.3 million. Clickability provides cloud-based enterprise content management software products that are used by enterprise marketers and media companies to create, maintain and deliver web sites that shape visitor experiences and empower nontechnical staff to create, manage, publish, analyze and refine content and social media assets without IT intervention. For accounting purposes,year the acquisition of Clickability was recorded on December 31, 2013 and, accordingly, the operations of Clickability had no impact on the Company’s statement of operations. The operations of Clickability from
December 23, 2013assumed to December 31, 2013 were not material.be completed for pro forma purposes.
2014
2016 Acquisitions
On November 21, 2014, the Company acquired 100%January 7, 2016, Upland completed its purchase of substantially all of the outstanding capitalassets of Solution QLeadLander, Inc. (Solution Q) for total(LeadLander), a website analytics provider. The purchase price consideration paid was approximately $8.0 million in cash payable at closing (net of $6.1 million, which includes cash of $4.5 million, net ofapproximately $0.4 million of cash acquired,acquired) and 150,977 sharesa $1.2 million cash holdback payable in 12 months (subject to indemnification claims), which was fully paid after December 31, 2016.
In addition to the cash consideration described above, the Asset Purchase Agreement included a contingent share consideration component pursuant to which Upland issued an aggregate of the Company’s$2.4 million in common stock with a fair value of $1.6 million. Solution Q provides mid-market organizations an easy-to-use, turnkey solution for their project management and portfolio visibility needs. Revenues recorded since the acquisition date for the year ended December 31, 2014 were approximately $0.3 million.
On December 10, 2014, the Company acquired 100% of the outstanding capital of Mobile Commons, Inc. (Mobile Commons) for total purchase consideration of $10.2 million including cash of $5.7 million, net of $0.3 million of cash acquired, 386,253 shares of common stock valued at $4.5 million and excluding potential additional consideration for incremental additional revenue described below.on July 25, 2016. The Company agreed to payalso paid additional consideration of up to $1.5$2.4 million in bothMarch 2017 in cash and common stock to the selling shareholders of Mobile CommonsLeadLander based on the achievement of certain incremental revenue targets during fiscal 2015.2016 and 2017 and no further payments are expected to be made as of December 31, 2018.
On March 14, 2016, Upland completed its purchase of substantially all of the assets of HipCricket, Inc., a cloud-based mobile messaging software provider. The acquisition-dateconsideration paid to the seller consisted of our issuance of one million shares of our common stock and the transfer of our EPM Live product business. The value of the shares on the closing date of the transaction was approximately $5.7 million and the fair value of the contingent paymentour EPM Live product business was measured basedapproximately $5.9 million. The Company recognized a loss on the probability-adjusted presenttransfer in conjunction with the EPM Live net asset value of approximately $0.7 million in Other expense, net. Prior to the consideration expectedtransaction, HipCricket was owned by an affiliate of ESW Capital, LLC, which is a shareholder of Upland. Raymond James & Co. provided a fairness opinion to be transferred, which amounted to $0.5 million. Mobile Commons’ enterprise-class application drives and manages digital engagement through two-way SMS programs and campaigns. Revenues recorded sinceUpland in connection with the acquisition date for the year ended December 31, 2014 were approximately $0.5 million.
2015 Acquisitionstransaction.
On November 13, 2015, the CompanyApril 27, 2016, Upland acquired 100%Advanced Processing & Imaging, Inc., a content management platform driving workflow in governments and schools. The purchase price consideration consisted of the outstanding capital$4.1 million in cash payable at closing (net of Ultriva, Inc. (Ultriva) for total purchase consideration of $7.2 million, which includes cash of $5.6 million, net of $0.4$0.1 million of cash acquired, 179,298 shares of the Company’s common stock withacquired), and a fair value of $1.4$0.8 million and an additional $200,000cash holdback payable in shares of common stock, subject12 months (subject to indemnification claims, one year from the date of the acquisition. Ultriva provides cloud-based supply chain work management software. Revenues recorded since the acquisition date for the year ended December 31, 2015 were approximately $0.5 million.
claims).
The Company recorded the purchase of the acquisitions described above using the acquisition method of accounting and, accordingly, recognized the assets acquired and liabilities assumed at their fair values as of the date of the acquisition. The results of operations of the acquisitions are included in the Company’s consolidated results of operations beginning with the date of the acquisition. The purchase price allocations for the 20152016 acquisitions of LeadLander, HipCricket, and API, the 2017 acquisitions of Omtool, RightAnswers, Waterfall and Qvidian and the 2018 acquisition of RO Innovation are final, and the 2018 acquisitions of Interfax, Rant & Rave and Adestra are preliminary as the Company has not obtained and evaluated all of the detailed information, including the valuation of assets acquired and liabilities assumed, necessary to finalize the opening balance sheet amounts including an analysis of acquired accounts receivable, accrued expenses and deferred revenue balances.in all respects. Management has recorded the preliminary purchase price allocations based upon acquired company information that is currently available. Management expects to finalize its purchase price allocations in mid-2016.the first half of 2019 for Interfax, Rant & Rave and Adestra.
The following condensed table presents the preliminary and final acquisition-date fair value of the assets acquired and liabilities assumed for the acquisitions, as well as assets and liabilities (in thousands):
| | | | | | | | | | | | | | | | Preliminary | | Finalized |
| | Ultriva | | Solution Q | | Mobile Commons | | FileBound | | ComSci | | Clickability | Adestra | | Rant & Rave | | Interfax | | RO Innovation | | Qvidian | | Waterfall | | Right Answers | | Omtool |
| Year Acquired | 2015 | | 2014 | | 2014 | | 2013 | | 2013 | | 2013 | 2018 | | 2018 | | 2018 | | 2018 | | 2017 | | 2017 | | 2017 | | 2017 |
| | | | | | | | | | | | | | | | | | | | | | | | | | | |
| Cash | $ | 383 |
| | $ | 352 |
| | $ | 286 |
| | $ | 182 |
| | $ | 104 |
| | $ | — |
| $ | 145 |
| | $ | 696 |
| | $ | 1,396 |
| | $ | 197 |
| | $ | 468 |
| | $ | 100 |
| | $ | 139 |
| | $ | 2,957 |
|
| Accounts receivable | 737 |
| | 893 |
| | 1,242 |
| | 1,940 |
| | 951 |
| | 1,773 |
| 2,925 |
| | 3,482 |
| | 1,587 |
| | 1,563 |
| | 1,907 |
| | 1,477 |
| | 2,164 |
| | 784 |
|
| Other current assets | 41 |
| | 24 |
| | 147 |
| | 153 |
| | 47 |
| | 297 |
| 1,395 |
| | 3,836 |
| | 1,341 |
| | 1,299 |
| | 335 |
| | 608 |
| | 246 |
| | 464 |
|
| Canadian tax credit receivable | — |
| | 71 |
| | — |
| | — |
| | — |
| | — |
| |
| Property and equipment | 16 |
| | 28 |
| | 54 |
| | 927 |
| | 61 |
| | 1,519 |
| 796 |
| | 131 |
| | 286 |
| | 15 |
| | 108 |
| | 23 |
| | 408 |
| | 58 |
|
| Customer relationships | 1,820 |
| | 2,230 |
| | 1,620 |
| | 3,600 |
| | 2,000 |
| | 4,400 |
| 29,823 |
| | 29,981 |
| | 22,577 |
| | 6,688 |
| | 30,160 |
| | 6,400 |
| | 10,500 |
| | 4,400 |
|
| Trade name | 140 |
| | 100 |
| | 130 |
| | 320 |
| | 180 |
| | 250 |
| 992 |
| | 1,099 |
| | 649 |
| | 111 |
| | 227 |
| | 110 |
| | 180 |
| | 170 |
|
| Technology | 960 |
| | 540 |
| | 1,150 |
| | 2,040 |
| | 810 |
| | 2,500 |
| 6,696 |
| | 6,565 |
| | 5,236 |
| | 1,670 |
| | 5,739 |
| | 2,800 |
| | 2,300 |
| | 3,180 |
|
| Noncompetes | | — |
| |
|
| | — |
| | 1,148 |
| | — |
| | — |
| | — |
| | — |
|
| Goodwill | 4,700 |
| | 5,206 |
| | 7,244 |
| | 7,188 |
| | 3,851 |
| | 3,401 |
| 26,363 |
| | 32,575 |
| | 13,832 |
| | 7,568 |
| | 29,199 |
| | 18,575 |
| | 15,680 |
| | 14,081 |
|
| Other assets | 32 |
| | 14 |
| | 47 |
| | 21 |
| | 8 |
| | — |
| — |
| | — |
| | 14 |
| | — |
| | 8 |
| | — |
| | — |
| | 33 |
|
| Total assets acquired | 8,829 |
| | 9,458 |
| | 11,920 |
| | 16,371 |
| | 8,012 |
| | 14,140 |
| 69,135 |
| | 78,365 |
| | 46,918 |
| | 20,259 |
| | 68,151 |
| | 30,093 |
| | 31,617 |
| | 26,127 |
|
| Accounts payable | (197 | ) | | (52 | ) | | (313 | ) | | (113 | ) | | (260 | ) | | (154 | ) | (543 | ) | | (1,577 | ) | | (737 | ) | | (229 | ) | | (388 | ) | | (605 | ) | | (139 | ) | | (219 | ) |
| Accrued expense and other | (284 | ) | | (223 | ) | | (463 | ) | | (266 | ) | | (106 | ) | | (100 | ) | (1,916 | ) | | (6,114 | ) | | (2,817 | ) | | (1,921 | ) | | (403 | ) | | (1,136 | ) | | (2,108 | ) | | (915 | ) |
| Deferred tax liabilities | — |
| | (428 | ) | | — |
| | — |
| | — |
| | — |
| (5,680 | ) | | (3,896 | ) | | (3,364 | ) | | (2,129 | ) | | (7,971 | ) | | — |
| | — |
| | — |
|
| Deferred revenue | (760 | ) | | (2,242 | ) | | (144 | ) | | (1,342 | ) | | (78 | ) | | (1,605 | ) | (1,322 | ) | | (2,019 | ) | | — |
| | (1,817 | ) | | (9,389 | ) | | (1,220 | ) | | (5,479 | ) | | (2,779 | ) |
| Canadian tax credit liability to seller | — |
| | (39 | ) | | — |
| | — |
| | — |
| | — |
| |
| Total liabilities assumed | (1,241 | ) | | (2,984 | ) | | (920 | ) | | (1,721 | ) | | (444 | ) | | (1,859 | ) | (9,461 | ) | | (13,606 | ) | | (6,918 | ) | | (6,096 | ) | | (18,151 | ) | | (2,961 | ) | | (7,726 | ) | | (3,913 | ) |
| Total consideration | $ | 7,588 |
| | $ | 6,474 |
| | $ | 11,000 |
| | $ | 14,650 |
| | $ | 7,568 |
| | $ | 12,281 |
| $ | 59,674 |
| | $ | 64,759 |
| | $ | 40,000 |
| | $ | 14,163 |
| | $ | 50,000 |
| | $ | 27,132 |
| | $ | 23,891 |
| | $ | 22,214 |
|
TangibleDuring the measurement period, which may be up to one year from the acquisition date, we record adjustments to the assets were valued at their respective carrying amounts, which approximates theiracquired and liabilities assumed with the corresponding offset to goodwill based on changes to our estimates and assumptions. The significant measurement period adjustments booked during the twelve month period ended December 31, 2018 include the following. The change in the preliminary acquisition-date fair value of assets and liabilities for Qvidian was was primarily related to a $15.7 million increase in the estimated fair value.value of customer relationships due to a change in estimates upon completion of our final valuation. This change was partially offset by an $8.0 million increase to deferred tax liabilities attributable to completion of the analysis of the deferred tax assets and liabilities at the time of acquisition following finalization of the of the valuation. The valuation of identifiable intangible assets reflects management’s estimates based on, among other factors, use of established valuation methods. Customer relationships were valued using an income approach, which estimateschange in the preliminary acquisition-date fair value based onof assets and liabilities for Interfax during the earnings and cash flow capacityyear ended December 31, 2018 was primarily related to a decrease of $5.7 million in the subject asset. Theestimated fair value of customer relationships due to changes in estimates upon completion of our final valuation.
The goodwill of $157.9 million for the marketing-related intangibles was determined using a relief-from-royalty method, which estimates fair value based onabove acquisitions is primarily attributable to the valuesynergies expected to arise after the owner of the asset receives from not having to pay a royalty to use the asset. Developed technology was valued using a cost-to-recreate approach.
acquisition. Goodwill for FileBound, and ComSci is deductible for tax purposes.purposes is $11.3 million for our LeadLander acquisition, $8.0 million for HipCricket, $3.7 million for Waterfall, $2.4 million (at the time of the acquisition) for Interfax, and $2.5 million for RO Innovation. There was no Goodwill deductible for tax purposes for our API, Omtool, RightAnswers, Qvidian Rant & Rave and Adestra acquisitions.
Total one-time transaction costs incurred with respect to acquisition activity in the years ended December 31, 2018, 2017, and 2016 were $7.5 million, $6.1 million, and $3.6 million, respectively. These costs are included in 'Acquisitions and related costs' in our consolidated statement of operations.
4. Fair Value Measurements
Fair value is defined as the exit price, or the amount that would be received to sell an asset or paid to transfer a liability in an orderly transaction between market participants as of the measurement date.
|
| | | | | | | | | | | | | | | |
| | Fair Value Measurements at December 31, 2014 |
| | Level 1 | | Level 2 | | Level 3 | | Total |
| Liabilities: | | | | | | | |
| Earnout consideration liability | $ | — |
| | $ | — |
| | $ | 500 |
| | $ | 500 |
|
|
| | | | | | | | | | | | | | | |
| | Fair Value Measurements at December 31, 2015 |
| | Level 1 | | Level 2 | | Level 3 | | Total |
| Liabilities: | | | | | | | |
| Earnout consideration liability | $ | — |
| | $ | — |
| | $ | 500 |
| | $ | 500 |
|
92quoted prices in active markets that are either directly or indirectly observable; and Level 3, defined as unobservable inputs in which little or no market data exists, which therefore requires an entity to develop its own assumptions.
In November 2014,As of December 31, 2018 and 2017 the outstanding warrantsCompany has contingent accrued earnout business acquisition consideration liabilities for which fair values are measured as Level 3 instruments. These contingent consideration liabilities were converted to preferred stock,recorded at fair value on the acquisition date and are remeasured periodically based on the then the preferred stock was converted to common stockassessed fair value and adjusted if necessary. The increases or decreases in the fair value of contingent consideration payable can result from changes in anticipated revenue levels or changes in assumed discount periods and rates. As the correspondingfair value measure is based on significant inputs that are not observable in the market, they are categorized as Level 3.
Changes to the fair value of earnout liabilities are recorded to other expense, net. Liabilities measured at fair value on a recurring basis are summarized below (in thousands):
|
| | | | | | | | | | | | | | | |
| | Fair Value Measurements at December 31, 2018 |
| | Level 1 | | Level 2 | | Level 3 | | Total |
| Liabilities: | | | | | | | |
| Earnout consideration liability | $ | — |
| | $ | — |
| | $ | 1,396 |
| | $ | 1,396 |
|
|
| | | | | | | | | | | | | | | |
| | Fair Value Measurements at December 31, 2017 |
| | Level 1 | | Level 2 | | Level 3 | | Total |
| Liabilities: | | | | | | | |
| Earnout consideration liability | $ | — |
| | $ | — |
| | $ | 3,576 |
| | $ | 3,576 |
|
As of December 31, 2018 the Level 3 earnout consideration liability consists of amounts associated with the acquisition Marketech in March 2018 and RO Innovations in June 2018. Settlements of Level 3 earnout consideration for the year ended December 31, 2018 included a $2.0 million earnout paid in February 2018 for RightAnswers, all of which was reclassed to additional paid-in capital. accrued as of December 31, 2017, and a $2.2 million earnout paid in November 2018 for Waterfall, which included $1.6 million that was accrued as of December 31, 2017.
The following table presents additional information about liabilities measured at fair value on a recurring basis and for which we have utilized significant unobservable (Level 3) inputs to determine fair value: |
| | | |
| Ending balance at December 31, 2013 | $ | 525 |
|
| Change in fair value of preferred stock warrants | 83 |
|
| Conversion of preferred stock warrants to common warrants and to common stock | (608 | ) |
| Earnout consideration liability | 500 |
|
| Ending balance at December 31, 2014 | 500 |
|
| Ending balance at December 31, 2015 | $ | 500 |
|
|
| | | | | | | |
| | December 31, |
| | 2018 | | 2017 |
| Beginning balance | $ | 3,576 |
| | $ | 2,500 |
|
| | | | |
| Remeasurement adjustments: | | | |
(Gains) or losses included in earnings (1) | 1,627 |
| | (617 | ) |
| | | | |
| Acquisitions and settlements: | | | |
| Acquisitions | 321 |
| | 5,226 |
|
| Settlements | (4,128 | ) | | (3,533 | ) |
| Ending balance | $ | 1,396 |
| | $ | 3,576 |
|
| |
| (1) | Recorded as a component of other operating income (expense) in the Company's statement of operations. |
Quantitative Information about Level 3 Fair Value Measurements
The significant unobservable inputs used in the fair value measurement of the earnoutCompany's contingent consideration was determined usingliabilities designated as Level 3 are as follows:
|
| | | | | | | |
| | Fair Value at December 31, 2018 | | Valuation Technique | | Significant Unobservable Inputs |
Contingent acquisition consideration: (Marketech and RO Innovation) | $ | 1,396 |
| | Binary option model | | Expected future annual revenue streams and probability of achievement |
|
| | | | | | | |
| | Fair Value at December 31, 2017 | | Valuation Technique | | Significant Unobservable Inputs |
Contingent acquisition consideration: (RightAnswers and Waterfall) | $ | 3,576 |
| | Binary option model | | Expected future annual revenue streams and probability of achievement |
Sensitivity to Changes in Significant Unobservable Inputs
As presented in the Binary Option model based ontable above, the presentsignificant unobservable inputs used in the fair value measurement of contingent consideration related to business acquisitions are forecasts of expected future annual revenues as developed by the probability-weighted earnout consideration.Company's management and the probability of achievement of those revenue forecast. Significant increases (decreases) in these unobservable inputs in isolation would likely result in a significantly (lower) higher fair value measurement.
Debt
The Company believes the carrying value of its long-term debt at December 31, 20152018 approximates its fair value based on the variable interest rate feature or based upon interest rates currently available to the Company.”
The carrying value and estimated fair value of our debt at December 31, 20152018 and 2014December 31, 2017 is $24,874$283.2 million and $23,446,$113.8 million, respectively, based on valuation methodologies using interest rates currently available to the Company which are Level 2 inputs.
5. Goodwill and Other Intangible Assets
Changes in the Company’s goodwill balance for each of the two years in the period ended December 31, 20152018 are summarized in the table below (in thousands): | | | Balance at December 31, 2013 | $ | 33,630 |
| |
| Balance at December 31, 2016 | | $ | 69,097 |
|
| Acquired in business combinations | 12,313 |
| 88,819 |
|
| Adjustment related to prior year business combinations | | 17 |
|
| Adjustment related to finalization of business combinations | | (4,232 | ) |
| Foreign currency translation adjustment | (797 | ) | 906 |
|
| Balance at December 31, 2014 | $ | 45,146 |
| |
| Balance at December 31, 2017 | | $ | 154,607 |
|
| Acquired in business combinations | 4,700 |
| 70,139 |
|
| Adjustment due to finalization of 2014 business combination | (120 | ) | |
| Adjustment related to prior year business combinations | | (7,051 | ) |
| Adjustment related to finalization of current year business combinations | | 8,685 |
|
| Foreign currency translation adjustment | (2,304 | ) | (1,058 | ) |
| Balance at December 31, 2015 | $ | 47,422 |
| |
| Balance at December 31, 2018 | | $ | 225,322 |
|
Intangible assets, net, include the estimated acquisition-date fair values of customer relationships, marketing-related assets, and developed technology that the Company recorded as part of its business acquisitions purchases and from
acquisitions of customer relationships. The following is a summary of the Company’s intangible assets, net (in thousands):
| | | | Estimated Useful
Life (Years) | | Gross
Carrying Amount | | Accumulated
Amortization | | Net Carrying
Amount | Estimated Useful
Life (Years) | | Gross
Carrying Amount | | Accumulated
Amortization | | Net Carrying
Amount |
| December 31, 2015 | | | | | | | | |
| December 31, 2018 | | | | | | | | |
| Customer relationships | 1-10 | | $ | 31,848 |
| | $ | 9,054 |
| | $ | 22,794 |
| 1-10 | | $ | 173,592 |
| | $ | 30,650 |
| | $ | 142,942 |
|
| Trade name | 1-3 | | 2,909 |
| | 2,476 |
| | 433 |
| 1.5-10 | | 6,113 |
| | 3,334 |
| | 2,779 |
|
| Developed technology | 4-7 | | 13,808 |
| | 5,509 |
| | 8,299 |
| 4-7 | | 48,943 |
| | 16,049 |
| | 32,894 |
|
| Non-Compete Agreements | | 3 | | $ | 1,148 |
| | $ | 191 |
| | $ | 957 |
|
| Total intangible assets | | $ | 48,565 |
| | $ | 17,039 |
| | $ | 31,526 |
| | $ | 229,796 |
| | $ | 50,224 |
| | $ | 179,572 |
|
| | | | Estimated Useful Life (Years) | | Gross Carrying Amount | | Accumulated Amortization | | Net Carrying Amount | Estimated Useful Life (Years) | | Gross Carrying Amount | | Accumulated Amortization | | Net Carrying Amount |
| December 31, 2014 | | | | | | | |
| December 31, 2017 | | | | | | | |
| Customer relationships | 10 | | $ | 30,053 |
| | $ | 5,813 |
| | $ | 24,240 |
| 5-10 | | $ | 69,061 |
| | $ | 18,040 |
| | $ | 51,021 |
|
| Trade name | 1-3 | | 2,812 |
| | 2,027 |
| | 785 |
| 1.5 | | 3,431 |
| | 2,900 |
| | 531 |
|
| Developed technology | 4-7 | | 13,305 |
| | 3,579 |
| | 9,726 |
| 4-7 | | 29,308 |
| | 10,817 |
| | 18,491 |
|
| Total intangible assets | | $ | 46,170 |
| | $ | 11,419 |
| | $ | 34,751 |
| | $ | 101,800 |
| | $ | 31,757 |
| | $ | 70,043 |
|
The following table summarizes the Company’s weighted-average amortization period, in total and by major finite-lived intangible asset class, by acquisitionfor intangibles acquired during the year ended December 31 (in years):
| | | | 2015 | | 2014 | 2018 | | 2017 | | 2016 |
| Customer relationships | 9.3 | | 9.7 | 9.8 | | 9.0 | | 9.3 |
| Trade name | 2.9 | | 2.8 | 8.7 | | 1.5 | | 2.8 |
| Developed technology | 6.4 | | 6.4 | 6.0 | | 6.4 | | 6.3 |
| Non-Compete Agreements | | 3.0 | | 0.0 | | 0.0 |
| Total weighted-average amortization period | 8.1 | | 8.4 | 9.0 | | 8.2 | | 8.0 |
The Company periodically reviews the estimated useful lives of its identifiable intangible assets, taking into consideration any events or circumstances that might result in either a diminished fair value or revised useful life. In 2013, management changed its intention to use the PowerSteering trade name on a Company-wide basis and, accordingly, changed the useful life of such trade name from indefinite to a definite life of three years. As a result, the Company recorded an amortization charge of $1.1 million in 2013 related to the PowerSteering trade name. Management has determined there have been no other indicators of impairment or change in the useful life during the years ended December 31, 2015, 2014,2018, 2017, and 2013.2016. Total amortization expense was $6.1 million, $5.2$19.0 million and $4.8$9.6 million, and $7.2 million during the years ended December 31, 2015, 2014,2018, 2017, and 2013,2016, respectively.
Estimated annual amortization expense for the next five years and thereafter is as follows (in thousands):
| | | | Amortization Expense | Amortization Expense |
| Year ending December 31: | | |
| 2016 | $ | 6,626 |
| |
| 2017 | 5,537 |
| |
| 2018 | 5,228 |
| |
| 2019 | 4,389 |
| 27,011 |
|
| 2020 | 3,394 |
| 24,912 |
|
| 2021 and thereafter | 6,352 |
| |
| 2021 | | 23,992 |
|
| 2022 | | 21,691 |
|
| 2023 and thereafter | | 81,966 |
|
| Total | $ | 31,526 |
| $ | 179,572 |
|
6. Income Taxes
The Tax Act was enacted in December 2017. The Tax Act significantly changes U.S. tax law by, among other things, lowering U.S. corporate income tax rates, implementing a territorial tax system and imposing a one-time transition tax on deemed repatriated earnings of foreign subsidiaries. The Tax Act reduced the U.S. corporate income tax rate from 35% to 21%, effective January 1, 2018.
While the Tax Act provides for a modified territorial tax system, beginning in 2018, global intangible low-taxed income (“GILTI”) provisions will be applied providing an incremental tax on low taxed foreign income. The GILTI provisions require us to include in our U.S. income tax return foreign subsidiary earnings in excess of an allowable return on the foreign subsidiary’s tangible assets. Under U.S. GAAP, the Company is allowed to make an accounting policy choice of either (1) treating taxes due on future U.S. inclusions in taxable income related to GILTI as a current-period expense when incurred (the “period cost method”) or (2) factoring such amounts into the Company’s measurement of its deferred taxes (the “deferred method”). The Company has selected the "period cost method" as its accounting policy with respect to the new GILTI tax rules.
The Company's loss from continuing operations before income taxes for the years ended December 31, was as follows (in thousands):
| | | | 2015 | | 2014 | | 2013 | 2018 | | 2017 | | 2016 |
| Income (loss) before provision for income taxes: | | | | | | |
| Loss before provision for income taxes: | | | | | | |
| United States | $ | (13,254 | ) | | $ | (18,455 | ) | | $ | (9,267 | ) | $ | (23,350 | ) | | $ | (22,748 | ) | | $ | (14,242 | ) |
| Foreign | 629 |
| | (1,740 | ) | | 1,420 |
| 2,702 |
| | 5,319 |
| | 2,259 |
|
| | $ | (12,625 | ) | | $ | (20,195 | ) | | $ | (7,847 | ) | $ | (20,648 | ) | | $ | (17,429 | ) | | $ | (11,983 | ) |
The components of the provision (benefit) for income taxes attributable to continuing operations are as follows (in thousands):
| | | | 2015 | | 2014 | | 2013 | 2018 | | 2017 | | 2016 |
| Current | | | | | | | | | | |
| Federal | $ | — |
| | $ | — |
| | $ | — |
| $ | 177 |
| | $ | — |
| | $ | — |
|
| State | (100 | ) | | 54 |
| | 18 |
| 253 |
| | 177 |
| | 37 |
|
| Foreign | 932 |
| | 163 |
| | 1,136 |
| 2,328 |
| | 1,381 |
| | 964 |
|
| Total Current | $ | 832 |
| | $ | 217 |
| | $ | 1,154 |
| $ | 2,758 |
| | $ | 1,558 |
| | $ | 1,001 |
|
| | | | | | | | | | | |
| Deferred | | | | | | | | | | |
| Federal | $ | 293 |
| | $ | 300 |
| | $ | (417 | ) | $ | (9,866 | ) | | $ | (168 | ) | | $ | 727 |
|
| State | 31 |
| | 10 |
| | (67 | ) | (1,584 | ) | | 128 |
| | 131 |
|
| Foreign | (117 | ) | | (605 | ) | | 38 |
| (1,117 | ) | | (222 | ) | | (329 | ) |
| Total Deferred | 207 |
| | (295 | ) | | (446 | ) | (12,567 | ) | | (262 | ) | | 529 |
|
| | $ | 1,039 |
| | $ | (78 | ) | | $ | 708 |
| |
| (Benefit from) provision for income taxes | | $ | (9,809 | ) | | $ | 1,296 |
| | $ | 1,530 |
|
As of December 31, 2015,2018, the Company had U.S. federal net operating loss carryforwards of approximately $70 million.$204.8 million and research and development credit carryforwards of approximately $1.2$3.5 million. The net operating loss and credit carryforwards will expire beginning in 2017,2019, if not utilized. Utilization of the net operating losses and tax credits may be subject to substantial annual limitation due to the “change of ownership” provisions of the Internal Revenue Code of 1986. The annual limitation will result in the expiration of approximately $16.2$82.6 million of net operating losses and $0.8$3.5 million of credit carryforwards before utilization. As of December 31, 2018 we also had foreign net operating loss carryforwards of approximately $24.8 million, which carry forward indefinitely.
Deferred income taxes reflect the net tax effects of temporary differences between the carrying amounts of assets and liabilities for financial reporting purposes and the amounts used for income tax purposes. Significant components of the Company’s deferred taxes as of December 31 are as follows (in thousands):
| | | | 2015 | | 2014 | 2018 | | 2017 | | 2016 |
| Deferred tax assets: | | | | | | | | |
| Current deferred tax assets: | | | | |
| Accrued expenses and allowances | $ | 793 |
| | $ | 733 |
| $ | 1,871 |
| | $ | 1,715 |
| | $ | 993 |
|
| Deferred revenue | 671 |
| | 549 |
| 4 |
| | — |
| | 573 |
|
| Other | 22 |
| | 62 |
| |
| Valuation allowance for current deferred tax assets | (1,183 | ) | | (964 | ) | |
| Net current deferred tax assets | 303 |
| | 380 |
| |
| Noncurrent deferred tax assets: | | | | |
| Intangible assets | | | — |
| |
| Stock compensation | 582 |
| | 350 |
| 743 |
| | 901 |
| | 1,054 |
|
| Net operating loss and tax credit carryforwards | 20,871 |
| | 16,755 |
| 33,579 |
| | 26,810 |
| | 24,895 |
|
| Disallowed interest expense carryforwards | | 2,888 |
| | — |
| | — |
|
| Capital expenses | | 205 |
| | 294 |
| | 307 |
|
| Other | 174 |
| | 61 |
| 723 |
| | 129 |
| | 176 |
|
| Valuation allowance for noncurrent deferred tax assets | (17,324 | ) | | (12,143 | ) | (15,507 | ) | | (15,730 | ) | | (24,588 | ) |
| Net noncurrent deferred tax assets | $ | 4,303 |
| | $ | 5,023 |
| |
| Net deferred tax assets | | $ | 24,506 |
| | $ | 14,119 |
| | $ | 3,410 |
|
| | | | | | | |
| Deferred tax liabilities: | | | | | | | | |
| Current deferred tax liabilities: | | | | |
| Deferred revenue | | — |
| | (401 | ) | | — |
|
| Prepaid expenses | $ | (1 | ) | | $ | (1 | ) | (61 | ) | | (58 | ) | | (31 | ) |
| Total current deferred tax liabilities | (1 | ) | | (1 | ) | |
| Noncurrent deferred tax liabilities: | | | | |
| Stock compensation | — |
| | — |
| |
| Capital expenses | (2 | ) | | (202 | ) | |
| Intangible assets | (6,481 | ) | | (7,217 | ) | (33,518 | ) | | (15,298 | ) | | (5,716 | ) |
| Goodwill | (561 | ) | | (252 | ) | (2,012 | ) | | (1,214 | ) | | (1,029 | ) |
| Tax credit carryforwards | (379 | ) | | (737 | ) | (302 | ) | | (410 | ) | | (38 | ) |
| Total noncurrent deferred tax liabilities | (7,423 | ) | | (8,408 | ) | |
| Net current deferred tax asset | $ | 302 |
| | $ | 379 |
| |
| Net noncurrent deferred tax liability | $ | (3,120 | ) | | $ | (3,385 | ) | |
| Deferred commissions | | (1,924 | ) | | — |
| | — |
|
| Net deferred tax liabilities | | $ | (37,817 | ) | | $ | (17,381 | ) | | $ | (6,814 | ) |
| Net deferred taxes | $ | (2,818 | ) | | $ | (3,006 | ) | $ | (13,311 | ) | | $ | (3,262 | ) | | $ | (3,404 | ) |
Due to the uncertainty surrounding the timing of realizing the benefits of its domestic favorable tax attributes in future tax returns, the Company has placed a valuation allowance against its domestic net deferred tax asset, exclusive of goodwill. During the year ended December 31, 20152018 and 2014,2017, the valuation allowance increaseddecreased by approximately $5.4$0.2 million and $7.5$8.8 million, respectively, due primarily to operations, acquisitions, and acquisitions.the impact of changes in tax law. The valuation allowance change included a reduction of $10.1 million due to acquired net deferred tax liabilities as a result of domestic business combinations, which was recorded as an income tax benefit in the year ended December 31, 2018.
At December 31, 2018, we did not provide deferred income taxes on temporary differences resulting from earnings of certain foreign subsidiaries which are indefinitely reinvested. The reversal of these temporary differences could result in additional tax; however, it is not practicable to estimate the amount of any unrecognized deferred income tax liabilities at this time. Deferred income taxes are provided as necessary with respect to earnings that are not indefinitely reinvested.
The Company’s provision for income taxes differs from the expected tax expense (benefit) amount computed by applying the statutory federal income tax rate of 34% to income before taxes due to the following:
| | | | 2015 | | 2014 | | 2013 | 2018 | | 2017 | | 2016 |
| Federal statutory rate | 34.0 | % | | 34.0 | % | | 34.0 | % | 21.0 | % | | 34.0 | % | | 34.0 | % |
| State taxes, net of federal benefit | 3.5 |
| | 3.5 |
| | 4.3 |
| 4.6 | % | | 4.7 | % | | 1.2 | % |
| Tax credits | (0.2 | ) | | (1.1 | ) | | (5.3 | ) | 0.4 | % | | 1.0 | % | | (0.1 | )% |
| Effect of foreign operations | (2.2 | ) | | 0.1 |
| | 2.0 |
| (2.1 | )% | | 2.1 | % | | 1.1 | % |
| Stock compensation | (2.9 | ) | | — |
| | — |
| 12.3 | % | | 7.9 | % | | (1.7 | )% |
| Permanent items and other | (3.3 | ) | | (1.7 | ) | | (13.7 | ) | (6.6 | )% | | (0.5 | )% | | (1.6 | )% |
| Effect of Tax Act | | — | % | | (43.7 | )% | | — | % |
| Tax carryforwards not benefited | (37.1 | ) | | (34.4 | ) | | (30.3 | ) | 17.9 | % | | (12.9 | )% | | (45.7 | )% |
| | (8.2 | )% | | 0.4 | % | | (9.0 | )% | 47.5 | % | | (7.4 | )% | | (12.8 | )% |
Under ASC 740-10,, Income Taxes - Overall, the Company periodically reviews the uncertainties and judgments related to the application of complex income tax regulations to determine income tax liabilities in several jurisdictions. The Company uses a “more likely than not” criterion for recognizing an asset for unrecognized income tax benefits or a liability for uncertain tax positions. The Company has determined it has the following unrecognized assets or liabilities related to uncertain tax positions as of December 31, 2015.2018. The Company does not anticipate any significant changes in such uncertainties and judgments during the next 12 months. To the extent the Company is required to recognize interest and penalties related to unrecognized tax liabilities, this amount will be recorded as an accrued liability, (in thousands).
In the fourth quarter of 2015, the Company recorded approximately $399,000 of additional income tax expense for tax matters that related to prior periods. The Company has concluded that the correction of the error in prior period amounts is not material to the current period or any previously reported periods.
| | | Balance at January 1, 2013 | $ | 70 |
| |
| Balance at December 31, 2016 | | $ | 705 |
|
| Additional based on tax positions related to the current year | — |
| — |
|
| Additions for tax positions of prior years | — |
| — |
|
| Reductions for tax positions of prior years | (7 | ) | (225 | ) |
| Settlements | — |
| — |
|
| Balance at December 31, 2013 | $ | 63 |
| |
| Balance at December 31, 2017 | | $ | 480 |
|
| Additional based on tax positions related to the current year | — |
| — |
|
| Additions for tax positions of prior years | — |
| 1,526 |
|
| Reductions for tax positions of prior years | (10 | ) | — |
|
| Settlements | — |
| — |
|
| Balance at December 31, 2014 | $ | 53 |
| |
| Additional based on tax positions related to the current year | — |
| |
| Additions for tax positions of prior years | 568 |
| |
| Reductions for tax positions of prior years | — |
| |
| Settlements | — |
| |
| Balance at December 31, 2015 | $ | 621 |
| |
| Balance at December 31, 2018 | | $ | 2,006 |
|
Due to the existence of the valuation allowance, future changes in our unrecognized tax benefits will not materially impact the Company’s effective tax rate. If the Company were to recognize unrecognized tax benefits as of December 31, 2015, $399,0002018, $0.6 million would impact the effective tax rate.
The Company’s assessment of its unrecognized tax benefits is subject to change as a function of the Company’s financial statement audit.
The Company recognizes interest and penalties related to uncertain tax positions in income tax expense. As of December 31, 2015,2018, the Company had no$0.2 million accrued interest or penalties related to uncertain tax positions.
The Company and its subsidiaries file tax returns in the U.S. federal jurisdiction and in several state and foreign jurisdictions. The Company is no longer subject to U.S. federal income tax examinations for years ending before December 31, 20122015 and is no longer subject to state and local or foreign income tax examinations by tax authorities for years ending before December 31, 2011.2014. The Company is not currently under audit for federal, state or any foreign jurisdictions.
7. Debt
Long-term debt consisted of the following at December 31, 20152018 and 2014December 31, 2017 (in thousands):
|
| | | | | | | |
| | December 31, |
| | 2015 | | 2014 |
| Senior secured loans (includes unamortized discount of $1,008 and $155 at December 31, 2015 and December 31, 2014, respectively, based on imputed interest rate of 6.6%) | $ | 23,366 |
| | $ | 16,791 |
|
| Revolving credit facility | — |
| | 3,000 |
|
| Seller notes due 2015 | — |
| | 3,000 |
|
| Seller notes due 2016 | 500 |
| | 500 |
|
| | 23,866 |
| | 23,291 |
|
| Less current maturities | (1,500 | ) | | (10,964 | ) |
| Total long-term debt | $ | 22,366 |
| | $ | 12,327 |
|
|
| | | | | | | |
| | December 31, |
| | 2018 | | 2017 |
| Senior secured loans (includes unamortized discount of $3,490 and $2,668 at December 31, 2018 and December 31, 2017, respectively, based on an imputed interest rate of 6.8%) | $ | 279,728 |
| | $ | 111,144 |
|
| Less current maturities | (6,015 | ) | | (2,301 | ) |
| Total long-term debt | $ | 273,713 |
| | $ | 108,843 |
|
Loan and Security Agreements
Loan and Security AgreementsCredit Facility
On May 14, 2015, Upland Software, Inc. (the “Company”)we entered into a Credit Agreementcredit agreement (the “Credit Agreement”) with a consortium of lenders (the “Lenders”), Wells Fargo Capital Finance, as agent, providing for a secured credit facility (the “Loan Facility”) that replaces and refinances (i) the Company’s existing Loan and Security Agreement dated March 5, 2012 between the Company, certain of its subsidiaries, and Comerica Bank,each of the lenders named in the Credit Facility. From time to time we enter into amendments to the Credit Facility typically to expand the available borrowing limit in order to fund the Company's acquisitions. During the year ended December 31, 2018 we entered into amendments six through nine (the “Amendments”) in connection with our 2018 acquisitions. The main provision of The Amendments provide for, among other things:
Expansion of the Credit Facility from $200 million as amended (the “U.S. Comerica Agreement”) and (ii) an existing Canadian Loan and Security Agreement dated February 10, 2012 with Comerica Bank, as amended (the “Canadian Comerica Agreement”).
As of December 31, 2015, there was (i) $0.02017 to $400.0 million in U.S. revolving loansas of December 31, 2018;
A favorable adjustment to decrease the overall applicable interest rate for accounts outstanding under the Credit Agreement, (ii) $0.0 million drawn onFacility;
A favorable adjustment to the leverage ratio to increase the amount of funded indebtedness to EBITDA (as defined in the Credit Facility);
A favorable increase to the recurring revenue ratio future draw condition to the delayed draw term loan facility;
A waiver of the requirement that Interfax Communications Limited, Data Guard Limited and Return Fax 2000 Limited become Canadian Guarantors and join the Canadian revolving credit facility, (iii) $18.5 million in U.S. term loans outstanding underGuarantee and Security Agreement as Grantors;
Clarification of certain definitions within the Credit Agreement;Facility; and (iv) $5.9 million
An increase in Canadian term loans outstanding underthe fixed charge coverage ratio (as defined in the Credit Agreement.Facility).
Loans
The Credit AgreementFacility, as amended, provides for up to $60.0a $400.0 million credit facility, including (i) a fully drawn $285.0 million term loan, (ii) a fully available $30.0 million delayed draw term loan commitment (the “DDTL”) , (iii) a fully available $30.0 million revolving loan commitment, and (iv) a $55.0 million uncommitted accordion.
Specifically, the Credit Facility provides for $285.0 million of financing creditterm debt comprised of (i) a fully drawn U.S. term loan facility in an aggregate principal amount of $279.8 million (the “U.S. Term Loan”), and (ii) a fully drawn Canadian term loan facility in an aggregate principal amount of $5.2 million (the “Canadian Term Loan”) (the Canadian Term Loan and the U.S. Term Loan together are referred to as outlined below.the “Term Loans”).
TheIn addition, the Credit AgreementFacility also provides for revolvers of $30.0 million, comprised of (i) a U.S. revolving credit facility in an aggregate principal amount of up to $9.0$29.0 million (the “U.S. Revolver”), and (ii) a U.S. term loan facility in an aggregate principal amount of up to $19.0 million (the “U.S. Term Loan”), (iii) a delayed draw term loan facility in an aggregate principal amount of up to $10.0 million (the “DDTL”). (iv) a Canadian revolving credit facility in an aggregate principal amount of up to $1.0 million (the “Canadian Revolver”) (the Canadian Revolver and together with the U.S. Revolver are referred to as the “Revolver”);.
As of December 31, 2018, there were no amounts drawn on its U.S. Revolver or Canadian Revolver loans outstanding under the Credit Facility, and (ii) a Canadian term loan facilitythere was $283.2 million outstanding on the Term Loans comprised of (i)
$278.0 million in an aggregate principal amount of up to $6.0 million (the “Canadian Term Loan” and, together with the U.S. Term Loan outstanding under the “Term Loan”).Credit Facility, and (ii) $5.2 million in the Canadian Term Loan outstanding under the Credit Facility.
Terms of Term Loans
Under the terms of the Credit Facility, as amended, the Term Loans are repayable, on a quarterly basis by an amount equal to 2.5% per annum on or before September 30, 2020, after which the remaining balance is payable on a straight-line basis by an amount equal to 5.0% per annum thereafter until the facility’s maturity date of August 2, 2022.
The Amendments also, among other things, provides for updates to the following (i) a favorable adjustment to decrease the overall applicable interest rate for accounts outstanding under the Credit Agreement also includes provisions for optional, uncommitted increasesFacility by 50 to 150 basis points resulting in an effective interest rate as of December 31, 2018 6.40% down from the previous effective interest rate as of December 31, 2017 of approximately 7.0%; (ii) a favorable adjustment to the leverage ratio to increase the amount of funded indebtedness to EBITDA (as defined in the maximum sizeCredit Facility) to 4.75 to 1.00 during 2018, along with additional leverage ratio improvements throughout the remainder of the loan term; (iii) a favorable increase to the recurring revenue ratio future draw condition to the delayed draw term loan facility available underfrom 1.25:1.0 to 1.50:1.0; and (iv) an increase in the Credit Agreement by an aggregate principal amount of $15.0 million upon the
satisfaction of the terms and conditions set forthfixed charge coverage ratio (as defined in the Credit Agreement.Facility) from 1.10 to 1.25.
Also, the maximum amount of purchase consideration payable in respect of an individual permitted acquisition is $40.0 million and in respect of all permitted acquisitions is $175.0 million. In addition, the Credit Agreement permits the Borrowers to incur subordinated, unsecuredamount of permitted indebtedness owing to sellers in connection withof businesses is $20.0 million.
Terms of Delay Draw Term Loan
Pursuant to the consummation of one or more permitted acquisitions upon the satisfactionterms of the terms and conditions set forth inCredit Facility, the Credit Agreement so long as$30.0 million DDTL is to be used to finance acquisitions. The DDTL, if all or a portion is drawn, is repayable, on a quarterly basis, by an amount equal to 2.5% per annum on or before September 30, 2020, after which the aggregate principal amount for all such subordinated, unsecured indebtedness does not exceed $10.0 million at any one time outstanding.existing 5.0% per annum is due thereafter until the facility’s maturity date of August 2, 2022.
Terms of Revolver
Loans under the Revolver are available up to the lesser of (i) $10.0$30.0 million (the “Maximum Revolver Amount”) or (ii) the resultmaximum facility amount of (a) 0.80 multiplied by (subject to step-downs beginning June 30, 2016)$345.0 million, less the sum of certain subsidiaries' recurring revenues on a trailing twelve month basis, minus (b)any amount of Revolver usage plus the outstanding balance of the Term Loans and any swing line loansother uses of the capacity made under the Credit AgreementFacility (such amount, the “Credit Amount”). The Revolver provides a subfacility whereby Borrowersthe Company may request letters of credit (the “Letters of Credit”) in an aggregate amount not to exceed, at any one time outstanding, $0.5 million and $0.25 million, from the U.S &and Canadian facilities, respectively. The aggregate amount of outstanding Letters of Credit areis reserved against the credit availability under the Maximum Revolver Amount and the Credit Amount.
Loans under the Revolver may be borrowed, repaid and reborrowed until May 14, 2020August 2, 2022 (the “Maturity Date”), at which time all amounts borrowed under the Credit AgreementFacility must be repaid.
Terms of Term Loans
The Term Loans are repayable, on a quarterly basis beginning September 30, 2015, by an amount equal to 5.0% per annum of the original principal amount of such loan. Any amount remaining unpaid is due and payable in full on the Maturity Date.
Terms of Delay Draw Term Loan
Pursuant to the terms of the Credit Agreement, the DDTL is to be used to finance acquisitions. The DDTL can be drawn upon until May 14, 2017. The DDTL is repayable, on a quarterly basis, by an amount equal to 5.0% per annum of the original funded amount of the DDTL. Any amount remaining unpaid would be due and payable in full on the Maturity Date.
Other Terms of LoanCredit Facility
At the option of the Company, U.S. loans accrue interest at a per annum rate based on (i) the U.S. base rate plus a margin ranging from 3.0%2.75% to 4.0%3.00% depending on the leverage ratio or (ii) the U.S. LIBOR rate determined in accordance with the Credit AgreementFacility (based on 1, 2, 3 or 6-month interest periods) plus a margin ranging from 4.0%3.75% to 5.0%4.00% depending on the leverage ratio. The U.S. base rate is a rate equal to the highest of (i) the federal funds rate plus a margin equal to 0.5%, the U.S. LIBOR rate for a 1-month interest period plus 1.0%, and (ii) Wells Fargo Capital Finance’s prime rate.
At the option of the Company, the Canadian loans accrue interest at a per annum rate based on (i) the Canadian prime rate or the U.S. base rate plus a margin ranging from 3.0%2.75% to 4.0%3.00% depending on the leverage ratio or (ii) the U.S. LIBOR rate determined in accordance with the Credit AgreementFacility (based on 1, 2, 3 or 6-month interest periods) (or the Canadian BABankers' Acceptance (“Canadian BA”) rate determined in accordance with the Credit AgreementFacility for obligations in Canadian dollars) plus a margin ranging from 4.0%3.75% to 5.0%4.00% depending on the leverage ratio.
Accrued interest on the loans will be paid monthly, or, with respect to loans that are accruing interest based on the U.S. LIBOR rate or Canadian BA rate, at the end of the applicable U.S. LIBOR or Canadian BA interest rate period.
Lenders are entitled to a premium (the “Prepayment Premium”) in the event of certain prepayments of the loans in an amount equal toas follows: (i) from May 14, 2015August 2, 2017 to May 14, 2016,August 1, 2018, 2.0% times the sum of (a) the Maximum Revolver Amount plus (b) the outstanding principal amount of the Term LoanLoans and DDTL on the date immediately prior to the date of the prepayment (such sum, the “Prepayment Amount”) and (ii) from May 14, 2016August 2, 2018 to May 14, 2017,August 1, 2019, 1.0% times the Prepayment Amount and (iii) during the period from and after May 14, 2017August 2, 2019 to the Maturity Date, 0.0% times the Prepayment Amount. The Company may also be subject to prepayment fees in the case of commitment
reductions of the Revolver and also may be obligated to prepay loans upon the occurrence of certain events.
The Company is also obligated to pay other customary servicing fees, letter of credit fees and unused credit facility fees.
The LoanCredit Facility contains customary affirmative and negative covenants. The negative covenants limit the ability of the Company and its subsidiaries to, among other things (in each case subject to customary exceptions for a credit facility of this size and type):
Incur additional indebtedness or guarantee indebtedness of others;
Create liens on their assets;
Make investments, including certain acquisitions;
Enter into mergers or consolidations;
Dispose of assets;
Pay dividends and make other distributions on the Company’s capital stock, and redeem and repurchase the Company’s capital stock;
Enter into transactions with affiliates; and
Prepay indebtedness or make changes to certain agreements.
The Loan Facility also containsThere are certain financial covenants that require certain subsidiaries to maintain (i) a minimum liquidity of $10.0 million (which shall be $8.0 million once the Company achieves trailing four quarters adjusted EBITDA of at least $8.0 million) at all times. This covenant is subsequently replaced by certain other financial covenants that are required to be met based on various levels of operating results of the U.S. and Canadian subsidiaries. These financial covenants becomebecame more restrictive starting SeptemberJune 30, 2017.2019. If an event of default occurs, at the election of the Lenders, a default interest rate shall apply on all obligations during an event of default, at a rate per annum equal to 2.00% above the applicable interest rate.
The LoanCredit Facility limitspermits the Company's ability to buyback up to $10.0 million of its capital stock, subject to restrictions including a minimum liquidity requirement of $20.0$25.0 million before and after any such buyback.
TerminationAny borrowings and letters of Priorcredit pursuant to our Credit Agreements
On May 14, 2015, the Company terminated the U.S. Comerica Agreement and the Canadian Comerica Agreement. In conjunction with the terminations, the Company expensed unamortized deferred financing costsFacility are secured by substantially all of $0.2 million.our assets, including our intellectual property.
Interest Rate and Financing CostsDebt Discount
Cash interest costs averaged 5.2%6.6% under the new Credit AgreementFacility for the year ended December 31, 2015.2018. In addition, the Company incurred $1.2$1.7 million of financing costs associated with the Credit AgreementFacility in the year ended December 31, 2015.2018. These financing costs will be amortized to non-cash interest expense over the term of the Credit Agreement.Facility.
Seller Notes
In May 2013, the Company issued seller notes payable in connection with the acquisition of FileBound. The notes havehad an aggregate principal amount of $3.5 million with 5% stated interest. $3.0 million of the notes were paid in May 2015, and $500,000 of the notes are duewere paid in May 2016.
Debt Maturities
FutureUnder the terms of the Credit Facility, future debt maturities of long-term debt excluding debt discounts at December 31, 20152018 are as follows, (in thousands):
| | | Year ending December 31: | | |
| 2016 | $ | 1,750 |
| |
| 2017 | 1,250 |
| |
| 2018 | 1,250 |
| |
| 2019 | 1,250 |
| $ | 7,125 |
|
| 2020 | 19,374 |
| 8,906 |
|
| 2021 | | 14,250 |
|
| 2022 | | 252,938 |
|
| 2023 | | — |
|
| Thereafter | — |
| — |
|
| | $ | 24,874 |
| $ | 283,219 |
|
Convertible Promissory Notes
In October 2013, the Company issued $4.9 million of promissory notes to investors bearing interest at 5% per annum with a maturity date of October 2014. Such promissory notes are automatically converted into shares of preferred stock upon the occurrence of a qualified financing. The conversion price for the shares of preferred stock is 80% of the price paid by other investors in the qualified financing. Such conversion price represents a beneficial conversion feature in the amount of $1.2 million which was recorded as interest expense. In December 2013, all of the promissory notes were converted into shares of Series C preferred stock. Immediately prior to the closing of the Company's initial public offering on November 12, 2014, all outstanding shares of preferred stock were converted to shares of the Company's common stock.
8. Net Loss Per Share
The following table sets for the computations of loss per share (in thousands, except share and per share amounts):
|
| | | | | | | | | | | |
| | December 31, |
| | 2015 | | 2014 | | 2013 |
| Numerators: | | | | | |
| Loss from continuing operations attributable to common stockholders | $ | (13,664 | ) | | $ | (20,117 | ) | | $ | (8,555 | ) |
| Income (loss) from discontinued operations attributable to common stockholders | — |
| | — |
| | (642 | ) |
| Preferred stock dividends and accretion | — |
| | (1,524 | ) | | (98 | ) |
| Net loss attributable to common stockholders | $ | (13,664 | ) | | $ | (21,641 | ) | | $ | (9,295 | ) |
| Denominator: | | | | | |
| Weighted–average common shares outstanding, basic and diluted | 14,939,601 |
| | 4,889,901 |
| | 1,196,668 |
|
| Loss from continuing operations per share, basic and diluted | $ | (0.91 | ) | | $ | (4.43 | ) | | $ | (7.23 | ) |
| Loss from discontinued operations per share, basic and diluted | — |
| | — |
| | (0.54 | ) |
| Net loss per common share, basic and diluted | $ | (0.91 | ) | | $ | (4.43 | ) | | $ | (7.77 | ) |
|
| | | | | | | | | | | |
| | December 31, |
| | 2018 | | 2017 | | 2016 |
| Numerators: | | | | | |
| Net loss | $ | (10,839 | ) | | $ | (18,725 | ) | | $ | (13,513 | ) |
| Denominator: | | | | | |
| Weighted–average common shares outstanding, basic and diluted | 19,985,528 |
| | 18,411,247 |
| | 16,472,799 |
|
| Net loss per common share, basic and diluted | $ | (0.54 | ) | | $ | (1.02 | ) | | $ | (0.82 | ) |
Due to the net losses incurred for the years ended December 31, 2015, 2014,2018, 2017, and 2013,2016, basic and diluted loss per share were the same, as the effect of all potentially dilutive securities would have been anti-dilutive. The following table sets forth the anti-dilutive common share equivalents:equivalents excluded from the weighted-average shares used to calculate diluted net loss per common share:
|
| | | | | | | | |
| | December 31, |
| | 2015 | | 2014 | | 2013 |
| Redeemable convertible preferred stock: | | | | | |
| Series A preferred stock | — |
| | — |
| | 2,821,181 |
|
| Series B preferred stock | — |
| | — |
| | 1,701,909 |
|
| Series B–1 preferred stock | — |
| | — |
| | 237,740 |
|
| Series B–2 preferred stock | — |
| | — |
| | 155,598 |
|
| Series C preferred stock | — |
| | — |
| | 1,918,048 |
|
| Stock options | 778,385 |
| | 665,216 |
| | 357,991 |
|
| Restricted stock | 513,943 |
| | 438,939 |
| | 240,280 |
|
| Total anti–dilutive common share equivalents | 1,292,328 |
| | 1,104,155 |
| | 7,432,747 |
|
|
| | | | | | | | |
| | December 31, |
| | 2018 | | 2017 | | 2016 |
| Stock options | 408,899 |
| | 549,907 |
| | 759,719 |
|
| Restricted stock | 997,014 |
| | 1,047,480 |
| | 839,477 |
|
| Total anti–dilutive common share equivalents | 1,405,913 |
| | 1,597,387 |
| | 1,599,196 |
|
9. Commitments and Contingencies
Future minimum payments for operating and capital lease obligations and purchase commitments are as follows (in thousands):
|
| | | | | | | | | | | |
| | Capital
Leases | | Operating
Leases | | Purchase Commitments |
| 2019 | $ | 605 |
| | $ | 2,719 |
| | $ | 6,273 |
|
| 2020 | 8 |
| | 1,269 |
| | 1,350 |
|
| 2021 | — |
| | 720 |
| | 675 |
|
| 2022 | — |
| | 584 |
| | — |
|
| 2023 | — |
| | 489 |
| | — |
|
| Thereafter | — |
| | 702 |
| | — |
|
| Total minimum lease payments | 613 |
| | $ | 6,483 |
| | $ | 8,298 |
|
| Less amount representing interest | (81 | ) | | | | |
| Present value of capital lease obligations | 532 |
| | | | |
| Less current portion of capital lease obligations | (544 | ) | | | | |
| Long-term capital lease obligations | $ | (12 | ) | | | | |
Operating Leases
The Company leases office space under operating leases that expire between 20162019 and 2020.
Future2025. The terms of the Company's non-cancelable operating lease arrangements typically contain fixed rent increases over the term of the lease, rent holidays and provide for additional renewal periods. Rent expense on these operating leases is recognized over the term of the lease on a straight-line basis. The excess of rent expense over future minimum lease payments underdue has been reported in 'Accrued expenses and other current liabilities' and 'Other long-term liabilities' in the accompanying consolidated balance sheets.
Total office rent expense for the years ended December 31, 2018, 2017, and 2016 were approximately $1.9 million, $3.8 million, and $2.1 million, respectively. The $3.8 million office rent expense in 2017 includes approximately $2.3 million of transformation charges in conjunction with the closures of the Omtool & RightAnswers offices, the remainder represents $1.5 million in operating rent expense.
The Company has entered into sublease agreements related to excess office space as a result of the Company's transformation activities connected to the Omtool and Right Answers acquisitions. Both sublease agreements end in 2020. For the years ended December 31, 2018, 2017, and 2016 the Company recognized rental income related to theses leases, as offsets to rental expense, of $0.3 million, $0.3 million and $0.0 million, respectively. Operating lease obligations in the future minimum payments table above do not include the impact of future rental income of $0.4 million related to these subleases as of December 31, 2018.
Capital Leases
The current and long-term portion of capital lease obligations are as follows (in thousands):recorded in other current liabilities and other long-term liabilities line items on the balance sheet, respectively. The Company's capital lease agreements are generally for four years and contain a bargain purchase option at the end of the lease term.
|
| | | | | | | | | | | |
| | Capital
Leases | | Operating
Leases | | Purchase Commitments |
| 2016 | $ | 1,845 |
| | $ | 1,874 |
| | $ | 2,308 |
|
| 2017 | 1,378 |
| | 1,439 |
| | — |
|
| 2018 | 1,069 |
| | 972 |
| | — |
|
| 2019 | 477 |
| | 733 |
| | — |
|
| 2020 | 13 |
| | 211 |
| | — |
|
| Thereafter | — |
| | — |
| | — |
|
| Total minimum lease payments | 4,782 |
| | $ | 5,229 |
| | $ | 2,308 |
|
| Less amount representing interest | (549 | ) | | | | |
| Present value of capital lease obligations | 4,233 |
| | | | |
| Less current portion of capital lease obligations | (1,654 | ) | | | | |
| Long-term capital lease obligations | $ | 2,579 |
| | | | |
The Company has an outstanding purchase commitment in 20162019 for software development services from DevFactory FZ-LLC (“DevFactory”) pursuant to a technology services agreement in the amount of $2.3$4.9 million. The agreement hasOn March 28, 2017, the Company and DevFactory executed an amendment to extend the initial term that expires onof the agreement to December 31, 2017, with an2021. Additionally, the Company amended the option for either party to renew annually for up to five years.one additional year. The effective date of the amendment was January 1, 2017. For years after 2016,2019, the purchase commitment amount for software development services will be equal to the prior year purchase commitment increased (decreased) by the percentage change in total revenue for the prior year as compared to the preceding year. For example, if 20162019 total revenues increase by 10% as compared to 20152018 total revenues, then the 20172020 purchase commitment will increase by approximately $230,000$0.5 million from the 20162019 purchase commitment amount to approximately $2.5$5.4 million.
Total rent expense for the years ended December 31, 2015, 2014, and 2013 were approximately $2.1 million, $1.9 million, and $0.8 million, respectively. The current and long-term portion of capital lease obligations are recorded
in other current liabilities and other long-term liabilities line items on the balance sheet, respectively. Capital lease agreements are generally for four years and contain a bargain purchase option at the end of the lease term.
Litigation
In the normal course of business, the Company may become involved in various lawsuits and legal proceedings. While the ultimate results of these matters cannot be predicted with certainty, management does not expect them to have a material adverse effect on the consolidated financial position or results of operations of the Company.
10. Property and Equipment, Net
Property and equipment consisted of the following (in thousands) at: |
| | | | | | | |
| | December 31, 2015 | | December 31, 2014 |
| Equipment (including equipment under capital lease of $6,199 and $3,028, respectively) | $ | 11,599 |
| | $ | 7,712 |
|
| Furniture and fixtures (including furniture under capital lease of $143 and $0 at December 31, 2015 and 2014, respectively) | 484 |
| | 502 |
|
| Leasehold improvements | 819 |
| | 574 |
|
| Accumulated depreciation (including for equipment and furniture under capital lease of $2,218 and $1,194 at December 31, 2015 and 2014, respectively) | (6,901 | ) | | (4,858 | ) |
| Property and equipment, net | $ | 6,001 |
| | $ | 3,930 |
|
|
| | | | | | | |
| | December 31, |
| | 2018 | | 2017 |
| Equipment (including equipment under capital lease of $5,773 and $6,234 at December 31, 2018 and 2017, respectively) | $ | 10,703 |
| | $ | 9,861 |
|
| Furniture and fixtures | 434 |
| | 263 |
|
| Leasehold improvements | 1,012 |
| | 769 |
|
| Accumulated depreciation (including for equipment under capital lease of $4,962 and $4,329 at December 31, 2018 and 2017, respectively) | (9,322 | ) | | (7,966 | ) |
| Property and equipment, net | $ | 2,827 |
| | $ | 2,927 |
|
Amortization of assets recorded under capital leases is included with depreciation expense. Depreciation and amortization expense on property and equipment was $2.3 million, $2.3$2.6 million and $791,000$2.7 million for the years ended December 31, 2015, 2014,2018, 2017, and 2013,2016, respectively. The Company recorded no impairment of property and equipment and recorded no gains or losses on the disposal of property and equipment of $0.0 million, $0.0 million, and $0.2 million during the years ended December 31, 2015, 2014,2018, 2017, and 2013.2016.
11. Stockholders' Equity
Common and Preferred Stock
All share and per share information for all periods presented has been adjusted to reflect the effect of a 6.099-for-one reverse stock split in November 2014. Our certificate of incorporation authorizes shares of stock as follows: 50,000,000 shares of common stock and 5,000,000 shares of preferred stock. The common and preferred stock have a par value of $0.0001 per share. No shares of preferred stock are issued or outstanding.
Each share of common stock is entitled to one vote at all meetings of stockholders. The number of authorized shares of common stock may be increased or decreased (but not below the number of shares thereof then outstanding) by the affirmative vote of the holders of shares of capital stock of the Company representing a majority of the votes represented by all outstanding shares of capital stock of the Company entitled to vote. The holders of common stock are also entitled to receive dividends, when, if and as declared by our board of directors, whenever funds are legally available therefore, subject to the priority rights of any outstanding preferred stock.
In July and October 2010,March 2016, the Company issued 1,582,635 shares of restricted stock to three stockholders of the Company at $0.0001 per share for aggregate proceeds of $965. In October 2012, the Company issued 113,085 shares of restricted stock to an employee of the Company at $1.22 per share for aggregate proceeds of $138,000. These shares are subject to a repurchase option. If the holder’s status as an employee or service provider to the Company terminates, then the Company shall have the option to repurchase any shares that have not yet been released from the repurchase option at a price per share equal to the original purchase price.
In November 2013, the Company issued 155,599 shares of common stock valued at $275,000 in connection with the acquisition of ComSci.
In January 2014, the Company issued 1,803,574 shares of common stock to this company in connection with the amendment of such technology services agreement and took a noncash charge of $11.2 million recorded in research and development expenses.
In September 2014, the Company granted 294,010 shares of restricted stock with a grant-date fair value of $8.73. The restricted stock has restrictions which vest over three years from date of grant for 40,990 shares and over four years from the date of grant for 253,020 shares. The grant-date fair value of the shares is recognized over the requisite vesting period. If vesting periods are not achieved, the shares will be forfeited by the employee.
In November 2014, the Company granted 41,664 shares of restricted stock with a grant-date fair value of $12.00 to members of the Board of Directors. The restricted stock has restrictions which vest fully after twelve months from date of grant. The grant-date fair value of the shares is recognized over the requisite vesting period. If vesting periods are not achieved, the shares will be forfeited by the respective Director.
In November, 2014, the Company issued 3,846,154 shares of common stock, at a price of $12.00 per share, before underwriting discounts and commissions. The IPO generated net proceeds of approximately $42.9 million, after deducting underwriting discounts and commissions. Expenses incurred by us for the IPO were approximately $4.1 million and will be recorded against the proceeds received from the IPO.
In November 2014, the Company issued 6,834,476 share of common stock for conversion of all outstanding shares of preferred stock on a one-to-one basis in connection with the Company's IPO.
In November 2014, the Company issued 150,977 shares of common stock valued at $1.6 million in connection with the acquisition of Solution Q. In addition, the company issued 65,570 shares of common stock to two employees valued at $0.7 million. The restricted stock has restrictions which vest fully two years from date of grant. The grant-date fair value of the shares is recognized over the requisite vesting period. If vesting periods are not achieved, the shares will be forfeited by the respective employee.
In December 2014, the Company agreed to issue 386,253 shares of common stock valued at $4.5 million in connection with the acquisition of Mobile Commons. As of December 31, 2014, 316,747 shares of common stock were issued to certain former shareholders of Mobile Commons, 44,192 shares were being held in escrow for eighteen (18) months and subject to indemnification claims by the Company and an additional 25,314 shares were reserved for issuance upon the completion of certain documentation by certain former shareholders of Mobile Commons.
In November 2015, the Company agreed to issue 179,2981,000,000 shares of common stock valued at approximately $1,388,000$5,700,000 in connection with the acquisition of Ultriva. HipCricket, Inc.
In addition,July, 2016, the companyCompany issued 45,767318,302 shares of common stock to an employee valued at approximately $0.4 million.$2,400,000 in connection with the acquisition of LeadLander, Inc.
In November, 2016, the Company issued 24,587 shares of common stock valued at approximately $200,000 in connection with the acquisition of Ultriva, Inc.
On May 12, 2017, the Company filed a registration statement on Form S-3 (File No. 333-217977) (the “S-3”), to register Upland securities in an aggregate amount of up to $75.0 million for offerings from time to time. The restricted stock has restrictions which vest at three different events duringS-3 was amended on May 22, 2017 and declared effective on May 26, 2017. On June 6, 2017, the year followingCompany completed a registered underwritten public offering pursuant to the acquisition.S-3. The grant-date fair valuenet proceeds of the offering were approximately $42.7 million, net of issuance costs, in exchange for 2,139,534 shares is recognized overof common stock.
On December 12, 2018, the requisite vesting period. If vesting periods are not achieved,Company filed a registration statement on Form S-3 (File No. 333-228767) (the “Form S-3”), to register Upland securities in an aggregate amount of up to $250.0 million for offerings from time to time. In connection with the shares will be forfeited byfiling of the respective employee.Form S-3 the Company withdrew its previous registration statement filed on May 12, 2017.
Stock Compensation Plans
The Company maintains two stock-based compensation plans, the 2010 Stock Option Plan (the “2010 Plan”) and the 2014 Stock Option Plan (the “2014 Plan”), which are described below.
2010 Plan
At December 31, 2015,2018, there were 383,073113,536 options outstanding under the 2010 Plan. Following the effectiveness of the Company’s 2014 Plan (the "2014 Plan") in November 2014, no further awards have been made under the 2010 Plan, although each option previously granted under the 2010 Plan will remain outstanding subject to its terms. Any such shares of common stock that are subject to awards under the 2010 Plan which are forfeited or lapse unexercised and would otherwise have been returned to the share reserve under the 2010 Plan instead will be available for issuance under the 2014 Plan.
2014 Plan
In November 2014, the Company adopted the 2014 Plan, providing for the granting of incentive stock options, as defined by the Internal Revenue Code, to employees and for the grant of non-statutory stock options, stock appreciation rights, restricted stock, restricted stock units, performance units and performance shares to employees, directors and consultants. The 2014 Plan also provides for the automatic grant of option awards to our non-employee directors. As of December 31, 2015,2018, there were 395,312295,363 options outstanding under the 2014 Plan, and shares of common stock reserved for issuance under the 2014 Plan consist of 184,513 shares of common stock.623,000 shares. In addition, the number of shares available for issuance under the 2014 Plan will be increased annually in an amount equal to the least of (i) 4% of the outstanding Shares on the last day of the immediately preceding Fiscal Year or (ii) such number of Shares determined by the Board. At December 31, 2015,2018, there were 195,834997,014 restricted stock unitsshares outstanding under the 2014 Plan.
Under both the 2010 Plan and 2014 Plan options granted to date generally vest over a four or three year period, with a maximum term of ten years. The Company also grants restricted stock awards (“RSAs”) which generally vest annually over a three or four year period. Shares issued upon any stock option exercise and restricted under the 2010 Plan or 2014 Plan will be issued from the Company's authorized but unissued shares.
Stock Option Activity
A summary of the Company’s stock option activity under all Plans is as follows: |
| | | | | | | | | | | | | |
| | | Number of
Options
Outstanding | | Weighted–
Average
Exercise
Price | | Weighted–
Average
Remaining
Contractual Life
(In Years) | | Weighted-
Average Fair
Value
per Share |
| Outstanding at December 31, 2012 | | 187,622 |
| | $ | 1.04 |
| | 9.65 | | $ | 0.67 |
|
| Options granted | | 191,045 |
| | 1.77 |
| | | | 0.91 |
|
| Options forfeited | | (20,676 | ) | | 1.28 |
| | | | 0.79 |
|
| Outstanding at December 31, 2013 | | 357,991 |
| | $ | 1.40 |
| | 9.16 | | $ | 0.79 |
|
| Options granted | | 386,797 |
| | 7.03 |
| | | | 3.76 |
|
| Options exercised | | (435 | ) | | 1.77 |
| | | | 0.93 |
|
| Options forfeited | | (79,143 | ) | | 3.87 |
| | | | 2.09 |
|
| Outstanding at December 31, 2014 | | 665,210 |
| | $ | 4.39 |
| | 8.78 | | $ | 2.37 |
|
| Options granted | | 420,616 |
| | 6.93 |
| | | | 6.93 |
|
| Options exercised | | (106,338 | ) | | 2.17 |
| | | | 2.24 |
|
| Options forfeited | | (201,100 | ) | | 5.62 |
| | | | 4.99 |
|
| Outstanding at December 31, 2015 | | 778,388 |
| | $ | 5.75 |
| | 8.39 | | $ | 5.75 |
|
| Options vested and expected to vest at December 31, 2013 | | 59,106 |
| | $ | 0.79 |
| | 8.04 | | |
| Options vested and exercisable at December 31, 2013 | | 56,675 |
| | $ | 0.79 |
| | 8.04 | | |
| Options vested and expected to vest at December 31, 2014 | | 149,907 |
| | $ | 1.58 |
| | 7.81 | | |
| Options vested and exercisable at December 31, 2014 | | 149,907 |
| | $ | 1.58 |
| | 7.81 | | |
| Options vested and expected to vest at December 31, 2015 | | 769,142 |
| | $ | 5.72 |
| | 8.37 | | |
| Options vested and exercisable at December 31, 2015 | | 244,631 |
| | $ | 3.78 |
| | 6.91 | | |
|
| | | | | | | | | | | | | |
| | | Number of
Options
Outstanding | | Weighted–
Average
Exercise
Price | | Weighted–
Average
Remaining
Contractual Term (in Years) | | Aggregate Intrinsic Value (in thousands) |
| Outstanding at December 31, 2017 | | 549,907 |
| | $ | 7.36 |
| | | | |
| Options granted | | 4,378 |
| | 33.39 |
| | | | |
| Options exercised | | (145,313 | ) | | 6.12 |
| | | | |
| Options forfeited | | — |
| | — |
| | | | |
| Options expired | | (73 | ) | | 1.79 |
| | | | |
| Outstanding at December 31, 2018 | | 408,899 |
| | $ | 8.09 |
| | 6.53 | | $ | 7,835 |
|
| Options vested and expected to vest at December 31, 2018 | | 408,616 |
| | $ | 8.08 |
| | 6.53 | | $ | 7,831 |
|
| Options vested and exercisable at December 31, 2018 | | 401,149 |
| | $ | 7.95 |
| | 6.50 | | $ | 7,727 |
|
The aggregate intrinsic value of options exercised at December 31, 2018, 2017, and 2016, was approximately $3.7 million, $3.5 million and $0.1 million , respectively. The total fair value of options vested during the years ended December 31, 20152018, 2017, and 2014,2016 was approximately $0.6$0.4 million, $1.0 million and $1.2$1.0 million , respectively. The aggregate intrinsic value of options outstanding at December 31, 2015 and 2014, was approximately $1.3 million and $3.4 million, respectively. The aggregate intrinsic value of options exercised at December 31, 2015 and 2014, was approximately $0.6 million and $6 thousand, respectively. The aggregate intrinsic value of options exercisable, vested and expected to vest at December 31, 2015 and 2014 was approximately $1.3 million and $1.2 million. The total fair value of employee options vested during the years ended December 31, 2015 and 2014 was approximately $804,000 and $106,000, respectively. Unvested shares as of December 31, 2015 and 2014 have a weighted-average grant date fair value of $3.53 and $2.79 per share, respectively.
Total stock-based compensation was approximately $2.7 million, $1.1 million and $0.5 million for the years ended December 31, 2015, 2014 and 2013, respectively. As of December 31, 2015, $1.3 million of2018, $41,000 unrecognized compensation cost related to stock options is expected to be recognized over a weighted-average period of 2.130.40 years.
The Company received approximately $106,000$0.9 million in cash from option exercises under the respective Plans in 2015.2018. The Company issued shares from amounts reserved under the respective Plans upon the exercise of these stock options. The Company does not currently expect to repurchase shares from any source to satisfy such obligation under any of the Company’s stock option Plans. The exercise of stock options during the year ended December 31, 2015 2018 resulted in an excess tax deduction of approximately $45,000.$1.8 million. The expected tax benefitsbenefit of approximately $16,000$0.5 million is included as part of the deferred tax asset associated with this excess tax deduction will be recorded in additional paid-in capital on the Company’s consolidated balance sheet upon utilization of the net operating losses in which these deductions are included.loss carryforwards, currently fully offset by a valuation allowance.
Restricted Stock Awards
A summary of the Company’s restricted stock activity under the 2010 and 2014 Plan is as follows:
|
| |
| Number of
Restricted Shares
Outstanding |
Unvested balances at December 31, 2012 | 739,544 |
Awards granted | — |
Awards vested | (499,265) |
Unvested balances at December 31, 2013 | 240,279 |
Awards granted | 401,244 |
Awards vested | (202,584) |
Unvested balances at December 31, 2014 | 438,939 |
Awards granted | 242,500 |
Awards vested | (144,268) |
Awards forfeited | (23,228) |
Unvested balances at December 31, 2015 | 513,943 |
|
| | | | |
| | | Number of
Restricted Shares
Outstanding | | Weighted-Average Grant Date Fair Value |
| Unvested balances at December 31, 2017 | | 1,047,480 | | $13.35 |
| Awards granted | | 840,241 | | $29.00 |
| Awards vested | | (873,706) | | $16.18 |
| Awards forfeited | | (17,001) | | $21.04 |
| Unvested balances at December 31, 2018 | | 997,014 | | $23.93 |
During 2015 and 2014,2018, 873,706 restricted stock awards hadvested with a weighted average grant date fair value of $7.53 and $1.22$16.18 per share, respectively.share. For restricted stock awards, grant date fair value is equal to the closing stock price on the day of the event. As of December 31, 2018, $22.0 million of unrecognized compensation cost related to unvested restricted stock awards is expected to be recognized over a weighted-average period of 1.8 years.
The vesting of restricted stock during the year ended December 31, 2018 resulted in an excess tax deduction of approximately $10.3 million. The expected tax benefit of approximately $2.7 million is included as part of the deferred tax asset associated with net operating loss carryforwards, currently fully offset by a valuation allowance.
Share-based Compensation
The Company recognized share-based compensation expense from all awards in the following expense categories (in thousands):
| | | | Year Ended December 31, | Year Ended December 31, |
| | 2015 | | 2014 | | 2013 | 2018 | | 2017 | | 2016 |
| Cost of subscription and support revenue | $ | 47 |
| | $ | 30 |
| | $ | 9 |
| |
| Cost of professional services revenue | (5 | ) | | 19 |
| | 8 |
| |
| Cost of revenue | | $ | 654 |
| | $ | 436 |
| | $ | 44 |
|
| Research and development | | 1,250 |
| | 796 |
| | 204 |
|
| Sales and marketing | 65 |
| | 39 |
| | 15 |
| 533 |
| | 232 |
| | 105 |
|
| Research and development | 203 |
| | 61 |
| | 12 |
| |
| General and administrative | 2,431 |
| | 929 |
| | 454 |
| 11,693 |
| | 8,513 |
| | 3,980 |
|
| Total | $ | 2,741 |
| | $ | 1,078 |
| | $ | 498 |
| $ | 14,130 |
| | $ | 9,977 |
| | $ | 4,333 |
|
12. Redeemable Convertible Preferred StockRevenue Recognition
| |
▪ | In 2011, the Company issued 2,652,110 shares of Series A redeemable convertible preferred stock for aggregate proceeds of $16.0 million, net of issuance costs of $199,000. |
| |
▪ | In January 2012, the Company issued 169,054 shares of Series A redeemable convertible preferred stock for aggregate proceeds of $1.0 million, net of issuance costs of $24,000. |
| |
▪ | In January 2012, the Company issued 1,701,909 shares of Series B redeemable convertible preferred stock for aggregate proceeds of $10.4 million, net of issuance costs of $22,000. |
| |
▪ | In November 2012, the Company issued 131,168 shares of Series B-1 redeemable convertible preferred stock valued at $800,000 in connection with the acquisition of EPM Live. Such shares are subject to forfeiture obligations based upon continued employment over a 24-month period. The Company is accounting for such shares as compensation as the shares vest. At December 31, 2014, all shares are now fully amortized. |
| |
▪ | In May 2013, the Company issued 106,572 shares of B-1 redeemable convertible preferred stock valued at $624,000 in connection with the acquisition of FileBound. |
| |
▪ | In November 2013, the Company issued 155,598 shares of Series B-2 redeemable convertible preferred stock valued at $949,000 in connection with the acquisition of ComSci. |
| |
▪ | In December 2013, the Company issued 1,918,048 shares of Series C redeemable convertible preferred stock for aggregate proceeds of $19.7 million, net of issuance costs of $82,000. The proceeds from the issuance of Series C preferred stock included the conversion of $4.9 million of convertible promissory bridge notes and accrued interest payable. |
| |
▪ | In November 2014, all of the shares of preferred stock were converted into 6,834,476 shares of common stock on a one-to-one basis in connection with the Company's IPO. |
DividendsRevenue Recognition Policy
Dividends on shares of Series C redeemable convertible preferred stock shall begin to accrue on a daily basis at a rate of 8% per annum, shall be cumulative, and shall compound on an annual basis. Series C redeemable convertible preferred stock dividends shall be due and payable upon the earliest of (i) any liquidation, dissolution, or winding upRevenues are recognized when control of the Company; (ii)promised goods or services is transferred to the redemption ofCompany's customers, in an amount that reflects the Series C redeemable convertible preferred stock; or (iii)consideration the payment of any dividends with respectCompany expects to common stock or Series A, B, B–1 redeemable convertible Preferred Stock. Cumulative dividends on shares of Series C redeemable convertible preferred stock shall cease to accrue and all accrued and unpaid cumulative dividends shall be canceled and any rights to such dividends shall terminate at the time such share of Series C redeemable convertible preferred stock is converted to common stock.
The holders of outstanding shares of Series A, B, B–1, and B–2 redeemable convertible preferred stock shall be entitled to receive dividends,in exchange for those goods or services over the term of the agreement, generally when made available to the customers. We enter into contracts that can include various combinations of products and services, which are generally capable of being distinct and accounted for as separate performance obligations. Revenues are recognized net of sales credits and if declared by the Board of Directors, outallowances. Revenue is recognized net of any assets legallytaxes collected from customers, which are subsequently remitted to governmental authorities.
Revenue is recognized based on the following five step model in accordance with ASC 606, Revenue from Contracts with Customers:
Identification of the contract with a customer
Identification of the performance obligations in the contract
Determination of the transaction price
Allocation of the transaction price to the performance obligations in the contract
Recognition of revenue when, or as, the Company satisfies a performance obligation
Performance obligations under our contracts consist of subscription and support, perpetual licenses, and professional services revenues within a single operating segment.
Subscription and Support Revenues
The Company's software solutions are available for use as hosted application arrangements under subscription fee agreements without licensing perpetual rights to the software. Subscription fees from these applications are recognized over time on a ratable basis over the customer agreement term beginning on the date the Company's solution is made available to the customer. As our customers have access to use our solutions over the term of the contract agreement we believe this method of revenue recognition provides a faithful depiction of the transfer of services provided. Our subscription contracts are generally 1 to 3 years in length. Amounts that have been invoiced are recorded in accounts receivable and deferred revenues or revenues, depending on whether the revenue recognition criteria have been met. Additional fees for monthly usage above the levels included in the standard subscription fee are recognized as revenue at the annual rateend of $0.49 per share payableeach month and is invoiced concurrently.
Perpetual License Revenues
The Company also records revenue from the sales of proprietary software products under perpetual licenses. Revenue from distinct on-premises licenses is recognized upfront at the point in preference and priority to any declaration or payment of any distribution on common stock. No dividends shall betime when the software is made with respectavailable to the common stock unless dividends oncustomer. The Company’s products do not require significant customization.
Professional Services Revenue
Professional services provided with subscription and support licenses and perpetual licenses consist of implementation fees, data extraction, configuration, and training. The Company’s implementation and configuration services do not involve significant customization of the Preferred Stock have been declaredsoftware and paid or set aside for paymentare not considered essential to the preferred stockholders. The rightfunctionality. Revenues from professional services are recognized over time as such services are performed. Revenues for fixed price services are generally recognized over time applying input methods to receive dividends on shares of Series A, B, B–1 and B–2 redeemable convertible preferred stock shall not be cumulative, and no rightestimate progress to dividends shall accrue to holders of Series A, B, B–1 and B–2 redeemable convertible preferred stock by reason ofcompletion. Revenues for consumption-based services are generally recognized as the fact that dividends on said sharesservices are not declared or paid. Payment of any dividends to the holders of Series A, B, B–1, and B–2 redeemable convertible preferred stock shall be on a pro rata basis.performed.
13. Preferred Stock WarrantsMessaging-related Revenue
The Company had 19,675 Series recognizes subscription revenue for its digital engagement application which provides short code connectivity for its two-way SMS programs and campaigns. The Company evaluates whether it is appropriate to recognize revenue based on the gross amount billed to its customers for these services. Since the Company is primarily obligated in these transactions, has latitude in establishing prices associated with its messaging program management services, is responsible for fulfillment of the transaction, and has credit risk, revenue is recorded on a gross basis. While none of the factors individually are considered presumptive or determinative, in reaching conclusions on gross versus net revenue recognition, the Company places the most weight on the analysis of whether or not it is the primary obligor in the arrangement.
Significant Judgments
Performance Obligations and Standalone Selling Price
A preferred stock warrantsperformance obligation is a promise in a contract to transfer a distinct good or service to the customer and 56,839 Series B redeemable convertible preferred stock warrants outstandingis the unit of accounting. Determining whether products and services are considered distinct performance obligations that should be accounted for separately versus together may require significant judgment. The Company has contracts with customers that often include multiple performance obligations, usually including professional services sold with either individual or multiple subscriptions or perpetual licenses. For these contracts, the Company accounts for individual performance obligations separately if they are distinct by allocating the contract's total transaction price to each performance obligation in an amount based on the relative standalone selling price, or SSP, of each distinct good or service in the contract.
Judgment is required to determine the SSP for each distinct performance obligation. A residual approach is only applied in limited circumstances when a particular performance obligation has highly variable and uncertain SSP and is bundled with other performance obligations that have observable SSP. A contract's transaction price is allocated to each distinct performance obligation and recognized as revenue when, or as, the performance obligation is satisfied. We determine the SSP based on our overall pricing objectives, taking into consideration market conditions and other factors, including the value of our contracts, historical standalone sales, customer demographics, geographic locations, and the number and types of users within our contracts.
Other Considerations
The Company evaluates whether it is the principal (i.e., report revenues on a gross basis) or agent (i.e., report revenues on a net basis) for vendor reseller agreements. Generally, the Company reports revenues from these types of contracts on a gross basis, meaning the amounts billed to customers are recorded as revenues, and expenses incurred are recorded as cost of revenues. Where the Company is the principal, it first obtains control of the inputs to the specific good or service and directs their use to create the combined output. The Company's control is evidenced by its involvement in the integration of the good or service on its platform before it is transferred to its customers, and is further supported by the Company being primarily responsible to its customers and having a level of discretion in establishing pricing. Revenues provided from agreements in which the Company is an agent are immaterial.
Payment terms and conditions vary by contract type, although terms generally include a requirement of payment within 30 to 60 days and include no general rights of return. In instances where the timing of revenue recognition differs from the timing of invoicing, we have determined our contracts generally do not include a significant financing component. The primary purpose of our invoicing terms is to provide customers with simplified and predictable ways of purchasing our products and services, not to receive financing from our customers or to provide customers with financing. Example includes invoicing at the beginning of a subscription term with revenue recognized ratably over the contract period.
Contract Balances
The timing of revenue recognition, billings and cash collections can result in billed accounts receivable, unbilled receivables (contract assets), and deferred revenues (contract liabilities). Billings scheduled to occur after the performance obligation has been satisfied and revenue recognition has occurred result in contract assets. Contract assets are expected to be billed during the succeeding twelve-month period and are recorded in 'Unbilled receivables' in our consolidated statement of operations. A contract liability results when we receive prepayments or deposits from customers in advance for implementation, maintenance and other services, as well as initial subscription fees. Customer prepayments are generally applied against invoices issued to customers when services are performed and billed. We recognize contract liabilities as revenues upon satisfaction of the underlying performance obligations. Contract liabilities that are expected to be recognized as revenues during the succeeding twelve-month period are recorded in 'Deferred revenue' and the remaining portion is recorded in 'Deferred revenue noncurrent' on the accompanying consolidated balance sheets at the end of each reporting period.
Unbilled Receivables
Unbilled receivables represent amounts for which the Company has recognized revenue, pursuant to its revenue recognition policy, for software licenses already delivered and professional services already performed, but billed in arrears and for which the Company believes it has an unconditional right to payment. As of December 31, 2018 and 2017 unbilled receivables were $3.7 million and $0.9 million, respectively.
Deferred Commissions
Sales commissions earned by our sales force are considered incremental and recoverable costs of obtaining a contract with a customer. Deferred commissions and other costs for a particular customer agreement for initial contracts are amortized over the expected life of the customer relationships, which has been determined to be approximately 6 years based on historical data and managements judgment, once revenue recognition criteria are met. We utilized the 'portfolio approach' practical expedient permitted under ASC 606-10-10-4, which allows entities to apply the guidance to a portfolio of contracts with similar characteristics as the effects on the financial statements of this approach would not differ materially from applying the guidance to individual contracts. The portion of capitalized costs expected to be amortized during the succeeding twelve-month period is recorded in current assets as deferred commissions, current, and the remainder is recorded in long-term assets as deferred commissions, net of current portion. Amortization expense is included in sales and marketing expenses in the accompanying condensed consolidated statements of operations. Deferred commissions are reviewed for impairment whenever events or circumstances indicate their carrying value may not be recoverable consistent with the Company's long-lived assets policy as described in Note 2. No indicators of impairment were identified during the year ended December 31, 2018.
The following table presents the activity impacting deferred commissions for the year ended December 31, 2018 (in thousands):
|
| | | |
| | December 31, |
| | 2018 |
| Deferred commissions beginning balance | $ | — |
|
| Adoption of ASC 606 | 6,517 |
|
| Capitalized deferred commissions | 4,775 |
|
| Amortization of deferred commissions | (2,367 | ) |
| Deferred commissions ending balance | $ | 8,925 |
|
Deferred Revenue
Deferred revenue represents either customer advance payments or billings for which the aforementioned revenue recognition criteria have not yet been met.
Deferred revenue is mainly unearned revenue related to subscription and support services. During the twelve months ended December 31, 2018, we recognized $40.5 million of subscription services revenue that was included in the deferred revenue balances at the beginning of the period, which excludes the $5.2 million in deferred revenue we recorded related to our 2018 acquisitions as discussed in Note 3. Acquisitions. Professional services revenue recognized in the same period from deferred revenue balances at the beginning of the period was $2.8 million.
Remaining Performance Obligations
As of December 31, 2018, approximately $114.8 million of revenue is expected to be recognized from remaining performance obligations for subscription contracts. We expect to recognize revenue on approximately 72% of these remaining performance obligations over the next 12 months, with the balance recognized thereafter. Revenue from remaining performance obligations for professional services contracts as of December 31, 2013 with an exercise price of $6.10 per share. All of these warrants were issued in connection with the Comerica loan agreements described in Note 7. The warrants were converted to warrants to purchase common stock in November 2014. See Note 4.2018 was not material.
The fair value of warrants to purchase convertible preferred stock was determined using the Black-Scholes option pricing model.
14. Employee Benefit PlansDisaggregated Revenue
The Company has established two voluntary defined contribution retirement plans qualifying under Section 401(k) of the Internal Revenue Code. The Company made no contributions to the 401(k) plans for the years ended December 31, 2015, 2014,disaggregates revenue from contracts with customers by geography and 2013.
15. Discontinued Operations
On November 6, 2013, the Company distributed all of the shares of its Visionael subsidiary to the Company’s stockholders in a spin-off. Since all shares of the subsidiary were distributed in 2013, the Company’s consolidated statements of operations have been presented to show the discontinued operations of the subsidiary separately from continuing operations for all periods presented. Since the transaction was between entities under common control, the distribution of the shares of the subsidiary did not result in a gain or loss on distributionrevenue generating activity, as it was recorded at historical carrying values.
16. Domesticbelieves it best depicts how the nature, amount, timing and Foreign Operationsuncertainty of revenue and cash flows are affected by economic factors
Revenue by geography is based on the ship-to address of the customer, which is intended to approximate where the customers' users are located. The ship-to country is generally the same as the billing country. The Company has operations primarily in the U.S., CanadaUnited Kingdom and Europe.Canada. Information about these operations is presented below (in thousands):
| | | | December 31, | December 31, |
| | 2015 | | 2014 | | 2013 | 2018 | | 2017 | | 2016 |
| Revenues: | | | | | | | | | | |
| U.S. | $ | 56,778 |
| | $ | 50,661 |
| | $ | 31,166 |
| |
| Subscription and support: | | | | | | |
| United States | | $ | 106,628 |
| | $ | 72,355 |
| | $ | 55,846 |
|
| United Kingdom | | 11,189 |
| | 3,127 |
| | 4,674 |
|
| Canada | 4,280 |
| | 3,713 |
| | 3,509 |
| 5,395 |
| | 3,838 |
| | 3,522 |
|
| Other International | 8,853 |
| | 10,200 |
| | 6,518 |
| 13,366 |
| | 6,147 |
| | 1,510 |
|
| Total Revenues | $ | 69,911 |
| | $ | 64,574 |
| | $ | 41,193 |
| |
| Total subscription and support revenue | | 136,578 |
| | 85,467 |
| | 65,552 |
|
| Perpetual license: | | | | | | |
| United States | | 2,378 |
| | 2,099 |
| | 1,300 |
|
| United Kingdom | | 94 |
| | 218 |
| | 150 |
|
| Canada | | 303 |
| | 70 |
| | 66 |
|
| Other International | | 1,127 |
| | 1,959 |
| | 134 |
|
| Total perpetual license revenue | | 3,902 |
| | 4,346 |
| | 1,650 |
|
| Professional services: | | | | | | |
| United States | | 7,321 |
| | 5,388 |
| | 5,388 |
|
| United Kingdom | | 487 |
| | 494 |
| | 1,556 |
|
| Canada | | 591 |
| | 471 |
| | 502 |
|
| Other International | | 1,006 |
| | 1,786 |
| | 119 |
|
| Total perpetual license revenue | | 9,405 |
| | 8,139 |
| | 7,565 |
|
| Total revenue | | $ | 149,885 |
| | $ | 97,952 |
| | $ | 74,767 |
|
Financial Statement Impact of Adoption of ASC 606
108The cumulative effect of the changes made to our consolidated January 1, 2018 balance sheet for the adoption of ASC 606 were as follows (in thousands):
|
| | | | | | | | | | | |
| | December 31, |
| | 2015 | | 2014 | | 2013 |
| Identifiable long-lived assets: | | | | | |
| U.S. | $ | 5,501 |
| | $ | 3,330 |
| | $ | 3,310 |
|
| Canada | 469 |
| | 600 |
| | 632 |
|
| Other International | 31 |
| | — |
| | — |
|
| Total identifiable long-lived assets | $ | 6,001 |
| | $ | 3,930 |
| | $ | 3,942 |
|
|
| | | | | | | | | | | |
| Balance Sheet | Balance at December 31, 2017 | | Adjustments Due to ASC 606 | | Balance at January 1, 2018 |
| Assets | | | | | |
| Deferred commissions, current | $ | — |
| | $ | 2,070 |
| | $ | 2,070 |
|
| Deferred commissions, noncurrent | — |
| | 4,447 |
| | 4,447 |
|
| | | | | | |
| Liabilities | | | | | |
| Deferred revenue (current) | 43,807 |
| | 225 |
| | 44,032 |
|
| | | | | | |
| Equity | | | | | |
| Accumulated deficit | $ | (81,128 | ) | | $ | 6,292 |
| | $ | (74,836 | ) |
In accordance with the new revenue standard requirements, the disclosure of the impact of adoption on our consolidated balance sheet, statement of operations and statement of cash flows for the periods ended December 31, 2018 was as follows (in thousands):
|
| | | | | | | | | | | |
| | As of December 31, 2018 |
| Balance Sheet | As Reported | | Balances Without Adoption of ASC 606 | | Effect of Change
Higher/ (Lower) |
| Assets | | | | | |
| Deferred commissions, current | $ | 2,633 |
| | $ | — |
| | $ | 2,633 |
|
| Deferred commissions, noncurrent | 6,292 |
| | — |
| | 6,292 |
|
| | | | | | |
| Liabilities | | | | | |
| Deferred revenue (current) | 57,626 |
| | 57,777 |
| | (151 | ) |
| | | | | | |
| Equity | | | | | |
| Accumulated earnings (deficit) | $ | (85,675 | ) | | $ | (89,464 | ) | | $ | 3,789 |
|
|
| | | | | | | | |
| | Twelve Months Ended December 31, 2018 |
| Statement of Operations | As Reported | | Balances Without Adoption of ASC 606 | | Effect of Change
Higher/ (Lower) |
| Revenues | | | | | |
| Perpetual license | 3,902 |
| | 3,751 |
| | 151 |
|
| | | | | | |
| Operating expenses | | | | | |
| Sales & marketing | 20,935 |
| | 23,287 |
| | (2,352 | ) |
During the twelve months ended December 31, 2018, the effect on earnings per share of the adoption of ASC 606 was an increase in earnings per share of $0.13.
17.13. Employee Benefit Plans
The Company has established two voluntary defined contribution retirement plans qualifying under Section 401(k) of the Internal Revenue Code. The Company made no contributions to the 401(k) plans for the years ended December 31, 2018, 2017, and 2016.
14. Segment and Geographic Information
ASC 280, Segment Reporting, establishes standards for reporting information about operating segments. It defines operating segments as components of an enterprise about which separate financial information is available that is evaluated regularly by the chief operating decision-maker (“CODM”) in deciding how to allocate resources and in assessing performance. Our Chief Executive Officer is considered to be our CODM. Our CODM manages the business as a multi-product business that utilizes its model to deliver software products to customers regardless of their geography or IT environment. Operating results are reviewed by the CODM primarily at the consolidated entity level, with the exception of recurring product level revenue, for purposes of making resource allocation decisions and for evaluating financial performance. Accordingly, we considered ourselves to be in a single operating and reporting segment structure.
Revenue
See Note 12 Revenue Recognition for a detail of revenue by geography.
Identifiable Long-Lived Assets
|
| | | | | | | | | | | |
| | December 31, |
| | 2018 | | 2017 | | 2016 |
| Identifiable long-lived assets: | | | | | |
| United States | $ | 1,648 |
| | $ | 2,768 |
| | $ | 4,054 |
|
| United Kingdom | 756 |
| | 14 |
| | 18 |
|
| Canada | 77 |
| | 145 |
| | 284 |
|
| Other International | 346 |
| | — |
| | — |
|
| Total identifiable long-lived assets | $ | 2,827 |
| | $ | 2,927 |
| | $ | 4,356 |
|
15. Related Party Transactions
In 2013, the Company borrowed and repaid monies from andWe are a party to an investor in the Company pursuant to promissory notes (see Note 7). During the fiscal years ended December 31, 2015, 2014, and 2013, the Company purchased software development services pursuant to a technology services agreementthree agreements with a companycompanies controlled by a non-management investor in the Company in the amount of $2.1 million, $2.1 million, and $2.1 million, respectively. In January 2014,Company:
On March 28, 2017, the Company issued 1,803,574 sharesand DevFactory executed an amendment to the agreement to extend the initial term to December 31, 2021. Additionally, the Company amended the option for either party to renew annually for one additional year. The effective date of common stock to this company in connection with the amendment was January 1, 2017. DevFactory is an affiliate of such technology services agreement and took a noncash chargeESW Capital LLC, which holds more than 5% of $11.2 million recorded in research and development expenses.the Company's capital stock. The Company has an outstanding purchase commitment in 2019 for software development services pursuant to a technology services agreement in 2016 in the amount of $2.3$4.9 million. For years after 2016,2019, the purchase commitment amount for software development services will be equal to the prior year purchase commitment increased (decreased) by the percentage change in total revenue for the prior year as compared to the preceding year. For example, if 20162019 total revenues increase by 10% as compared to 20152018 total revenues, then the 20172020 purchase commitment will increase by approximately $230,000$0.5 million from the 20162019 purchase commitment amount to approximately $2.5$5.4 million. During the years ended December 31, 2018, 2017, and 2016, the Company purchased software development services pursuant to a technology services
agreement with DevFactory FZ-LLC (“DevFactory”), in the amount of $3.2 million, $2.4 million, and $2.3 million, respectively. At December 31, 20152018 and 2014,December 31, 2017, amounts included in accounts payable owed to this company totaled $0.7none and $0.6 million, and $0.4 million, respectively.
When the Company receives requested services as detailed by statements of work pursuant to the software development agreement, it determines whether such software development costs should be capitalized as either internally-used software or software to be sold or otherwise marketed. If such costs are not capitalizable, the Company expenses such costs as the services are received. If the Company anticipates Invoicing is based on hourly contractor rates that it will not utilize the full amount of the annual minimum fee, the estimated unused portion of the annual minimum feemanagement believes is expensed at that time.in line with industry pricing.
The Company also purchased approximately $6,000 in services from Crossover, Inc. (“Crossover”), a company controlled by ESW Capital, LLC (a non-management investor) of approximately $3.2 million, $3.0 million, and $1.8 million during the years ended December 31, 2018, 2017, and 2016, respectively. Crossover provides a non-management investor inproprietary technology system to help the Company. ThereCompany identify, screen, select, assign, and connect with necessary resources from time to time to perform technology software development and other services throughout the Company, and track productivity of such resources. While there are no purchase commitments with this company, andCrossover, the Company continueswill continue to use their services in 2016.
The Company has an arrangement with a former subsidiary to provide management, human resource/payroll and administrative services, the fees for which during 2015 totaled $360,000 and are expected to be similar in 2016.
18. Subsequent Events
The Company has evaluated subsequent events through the date the consolidated financial statements were available for issuance.
On January 7, 2016, Upland completed its purchase of substantially all of the assets of a California-based
website analytics provider. The purchase price consideration paid was approximately $8.2 million in cash
payable at closing (net of $0.2 million of cash acquired) and a $1.2 million cash holdback payable in 12 months
(subject to indemnification claims). The foregoing excludes additional potential earnout payments tied to
performance-based conditions.
In addition to the cash consideration described above, the Asset Purchase Agreement included a
contingent share consideration component pursuant to which Upland expects to issue an aggregate of
approximately $2.4 million in common stock (to be determined on trigger date) of its common stock to the seller after July 7, 20162019. Invoicing is based on certain minimal post-closing performance-based conditions.
hourly contractor rates that management believes is in line with industry pricing.
On March 14, 2016, Upland completed its purchase of substantially all of the assets of Hipcricket,HipCricket, Inc., a
cloud-based mobile messaging software provider. The consideration paid to the seller consisted of our issuance of
one million shares of our common stockprovider, and completed the transfer of ourits EPM Live product business. The value of the
shares on the closing date of the transaction was approximately $6.2 million and the residual value of our EPM Live product business was approximately $6.0 million. The Company is currently evaluating whether a gain or loss will be recognized in conjunction with the EPM Live net asset value. Prior to the transaction, HipcricketHipCricket was owned by an affiliate of ESW Capital, LLC, which is a shareholder of Upland. Raymond James & Co. provided a fairness opinion to Upland in connection with the transaction.
Refer to Note 3 - Acquisitions for a description of the transaction. Relating to this transaction, the Company provided certain transition services to and received certain transition services from the affiliate. The cost offsets earned by the Company for these services during the year ended December 31, 2016 totaled $0.7 million and the fees owed to the affiliate by the Company for these services during the year ended December 31, 2016 totaled $0.1 million. The Company has had no transactions with the affiliate subsequent to the year ended December 31, 2016.
The Company recordedhas an arrangement with a former subsidiary, Visionael Corporation (“Visionael”), to provide management, human resource/payroll, and administrative services. John T. McDonald, the purchaseCompany's Chief Executive Officer and Chairman of the acquisitions described above usingBoard, beneficially holds an approximate 26.18% interest in Visionael. The Company received fees from this arrangement during the acquisition methodyears ended December 31, 2018, 2017, and 2016 totaled $60,000, $285,000, and $360,000, respectively, and are expected to be approximately $60,000 in 2019.
16. Subsequent Events
In accordance with ASC Topic 855, “Subsequent Events”, which establishes general standards of accounting for and accordingly, recognizeddisclosure of events that occur after the assets acquired and liabilities assumed at their fair values as of thebalance sheet date of the acquisition. The purchase price allocations for the 2016 acquisitionsbut before financial statements are preliminary asissued, the Company has not obtained and evaluated all ofevents and transactions that occurred after December 31, 2018 through the detailed information necessary to finalizedate the opening balance sheet amounts in all respects. Management has recordedconsolidated financial statements were available for issuance. During this period the purchase price allocations based upon acquired company information that is currently available. Management expects to finalize its purchase price allocations in mid-2016.Company did not have any material reportable subsequent events.
19.17. Quarterly Results (Unaudited)
The following table sets forth our unaudited quarterly condensed consolidated statements of operations data for each of the last eight quarters through December 31, 2015.2018. The data has been prepared on the same basis as the audited consolidated financial statements and related notes included elsewhere in this Annual Report, and you should read the following tables together with such financial statements. The quarterly results of operations include all normal recurring adjustments necessary for a fair presentation of this data. Results of interim periods are not necessarily indicative of results for the entire year and are not necessarily indicative of future results.
| | | | 2018 Quarters | | 2017 Quarters |
| | | | | | | | | | | | | | | | | | First | | Second | | Third | | Fourth | | First | | Second | | Third | | Fourth |
| | 3/31/14 | | 6/30/14 | | 9/30/14 | | 12/31/14 | | 3/31/15 | | 6/30/15 | | 9/30/15 | | 12/31/15 | (dollars in thousands, except per share data) |
| Consolidated Statements of Operations Data: | | Consolidated Statements of Operations Data: |
| Revenue: | | | | | | | | | | | | | | | | | | | | | | | | | | | | | | |
| Subscription and support | $ | 11,737 |
| | $ | 11,805 |
| | $ | 12,368 |
| | $ | 12,715 |
| | $ | 14,322 |
| | $ | 14,023 |
| | $ | 14,129 |
| | $ | 14,719 |
| $ | 27,729 |
| | $ | 33,154 |
| | $ | 33,919 |
| | $ | 41,776 |
| | $ | 18,135 |
| | $ | 19,407 |
| | $ | 23,169 |
| | $ | 24,756 |
|
| Perpetual license | 440 |
| | 657 |
| | 850 |
| | 840 |
| | 811 |
| | 846 |
| | 540 |
| | 608 |
| 1,626 |
| | 683 |
| | 915 |
| | 678 |
| | 694 |
| | 1,746 |
| | 856 |
| | 1,050 |
|
| Total product revenue | 12,177 |
| | 12,462 |
| | 13,218 |
| | 13,555 |
| | 15,133 |
| | 14,869 |
| | 14,669 |
| | 15,327 |
| 29,355 |
| | 33,837 |
| | 34,834 |
| | 42,454 |
| | 18,829 |
| | 21,153 |
| | 24,025 |
| | 25,806 |
|
| Professional services | 3,436 |
| | 3,749 |
| | 3,057 |
| | 2,920 |
| | 2,395 |
| | 2,809 |
| | 2,436 |
| | 2,273 |
| 2,260 |
| | 2,109 |
| | 2,310 |
| | 2,726 |
| | 1,923 |
| | 2,128 |
| | 2,047 |
| | 2,041 |
|
| Total revenue | 15,613 |
| | 16,211 |
| | 16,275 |
| | 16,475 |
| | 17,528 |
| | 17,678 |
| | 17,105 |
| | 17,600 |
| 31,615 |
| | 35,946 |
| | 37,144 |
| | 45,180 |
| | 20,752 |
| | 23,281 |
| | 26,072 |
| | 27,847 |
|
| Cost of revenue: | | | | | | | | | | | | | | | | | | | | | | | | | | | | | | |
Subscription and support(1)(2) | 3,258 |
| | 3,346 |
| | 3,488 |
| | 3,950 |
| | 4,732 |
| | 4,841 |
| | 4,771 |
| | 5,242 |
| 9,249 |
| | 9,580 |
| | 10,566 |
| | 13,486 |
| | 5,893 |
| | 6,676 |
| | 7,737 |
| | 8,148 |
|
Professional services(1) | 2,397 |
| | 2,340 |
| | 2,305 |
| | 2,037 |
| | 1,908 |
| | 1,732 |
| | 1,677 |
| | 1,768 |
| 1,396 |
| | 1,269 |
| | 1,517 |
| | 1,526 |
| | 1,135 |
| | 1,327 |
| | 1,376 |
| | 1,355 |
|
| Total cost of revenue | 5,655 |
| | 5,686 |
| | 5,793 |
| | 5,987 |
| | 6,640 |
| | 6,573 |
| | 6,448 |
| | 7,010 |
| 10,645 |
| | 10,849 |
| | 12,083 |
| | 15,012 |
| | 7,028 |
| | 8,003 |
| | 9,113 |
| | 9,503 |
|
| Gross profit | 9,958 |
| | 10,525 |
| | 10,482 |
| | 10,488 |
| | 10,888 |
| | 11,105 |
| | 10,657 |
| | 10,590 |
| 20,970 |
| | 25,097 |
| | 25,061 |
| | 30,168 |
| | 13,724 |
| | 15,278 |
| | 16,959 |
| | 18,344 |
|
| Operating expenses: | | | | | | | | | | | | | | | | | | | | | | | | | | | | | | |
Sales and marketing(1) | 3,136 |
| | 4,015 |
| | 3,767 |
| | 3,752 |
| | 3,532 |
| | 3,446 |
| | 2,929 |
| | 3,058 |
| 4,408 |
| | 5,248 |
| | 5,299 |
| | 5,980 |
| | 3,221 |
| | 4,037 |
| | 4,258 |
| | 3,791 |
|
Research and development(1) | 14,899 |
| | 3,494 |
| | 3,793 |
| | 3,979 |
| | 3,926 |
| | 4,152 |
| | 3,852 |
| | 3,848 |
| 4,891 |
| | 5,286 |
| | 5,400 |
| | 5,743 |
| | 3,477 |
| | 4,003 |
| | 4,092 |
| | 4,223 |
|
| Refundable Canadian tax credits | (136 | ) | | (138 | ) | | (138 | ) | | (682 | ) | | (121 | ) | | (122 | ) | | (115 | ) | | (112 | ) | (102 | ) | | (203 | ) | | (99 | ) | | (2 | ) | | (117 | ) | | (112 | ) | | (195 | ) | | (118 | ) |
General and administrative(1) | 2,623 |
| | 3,053 |
| | 3,555 |
| | 4,330 |
| | 5,119 |
| | 4,714 |
| | 4,494 |
| | 3,874 |
| 7,000 |
| | 8,464 |
| | 8,011 |
| | 8,566 |
| | 5,904 |
| | 6,576 |
| | 5,084 |
| | 5,727 |
|
| Depreciation and amortization | 1,055 |
| | 1,066 |
| | 1,067 |
| | 1,122 |
| | 1,014 |
| | 1,063 |
| | 1,130 |
| | 1,327 |
| 2,130 |
| | 3,853 |
| | 3,606 |
| | 4,683 |
| | 1,164 |
| | 1,299 |
| | 1,648 |
| | 2,387 |
|
| Acquisition-related expenses | 290 |
| | 231 |
| | 108 |
| | 1,557 |
| | 545 |
| | 360 |
| | 176 |
| | 1,374 |
| 3,102 |
| | 3,140 |
| | 2,497 |
| | 9,989 |
| | 3,691 |
| | 2,278 |
| | 4,399 |
| | 4,724 |
|
| Total operating expenses | 21,867 |
| | 11,721 |
| | 12,152 |
| | 14,058 |
| | 14,015 |
| | 13,613 |
| | 12,466 |
| | 13,369 |
| 21,429 |
| | 25,788 |
| | 24,714 |
| | 34,959 |
| | 17,340 |
| | 18,081 |
| | 19,286 |
| | 20,734 |
|
| Income (loss) from operations | (11,909 | ) | | (1,196 | ) | | (1,670 | ) | | (3,570 | ) | | (3,127 | ) | | (2,508 | ) | | (1,809 | ) | | (2,779 | ) | |
| Loss from operations | | (459 | ) | | (691 | ) | | 347 |
| | (4,791 | ) | | (3,616 | ) | | (2,803 | ) | | (2,327 | ) | | (2,390 | ) |
| Other expense: | | | | | | | | | | | | | | | | | | | | | | | | | | | | | | |
| Interest expense, net | (415 | ) | | (419 | ) | | (397 | ) | | (720 | ) | | (347 | ) | | (576 | ) | | (462 | ) | | (473 | ) | (2,494 | ) | | (3,143 | ) | | (3,118 | ) | | (4,518 | ) | | (935 | ) | | (1,160 | ) | | (2,277 | ) | | (2,210 | ) |
| Loss on debt extinguishment | | — |
| | — |
| | — |
| | — |
| | — |
| | (1,634 | ) | | 1,634 |
| | — |
|
| Other expense, net | 114 |
| | (482 | ) | | 60 |
| | 409 |
| | (512 | ) | | (12 | ) | | 137 |
| | (157 | ) | 303 |
| | (524 | ) | | (744 | ) | | (816 | ) | | (112 | ) | | (18 | ) | | (130 | ) | | 549 |
|
| Total other expense | (301 | ) | | (901 | ) | | (337 | ) | | (311 | ) | | (859 | ) | | (588 | ) | | (325 | ) | | (630 | ) | (2,191 | ) | | (3,667 | ) | | (3,862 | ) | | (5,334 | ) | | (1,047 | ) | | (2,812 | ) | | (773 | ) | | (1,661 | ) |
| Loss before provision for income taxes | (12,210 | ) | | (2,097 | ) | | (2,007 | ) | | (3,881 | ) | | (3,986 | ) | | (3,096 | ) | | (2,134 | ) | | (3,409 | ) | (2,650 | ) | | (4,358 | ) | | (3,515 | ) | | (10,125 | ) | | (4,663 | ) | | (5,615 | ) | | (3,100 | ) | | (4,051 | ) |
| Provision for income taxes | (410 | ) | | (280 | ) | | (438 | ) | | 1,206 |
| | 243 |
| | (238 | ) | | (190 | ) | | (854 | ) | (511 | ) | | (872 | ) | | (735 | ) | | 11,927 |
| | (951 | ) | | (196 | ) | | (406 | ) | | 257 |
|
| Loss from continuing operations | (12,620 | ) | | (2,377 | ) | | (2,445 | ) | | (2,675 | ) | | (3,743 | ) | | (3,334 | ) | | (2,324 | ) | | (4,263 | ) | |
| Income (loss) from discontinued operations | — |
| | — |
| | — |
| | — |
| | — |
| | — |
| | — |
| | — |
| |
| Net income (loss) | (12,620 | ) | | (2,377 | ) | | (2,445 | ) | | (2,675 | ) | | (3,743 | ) | | (3,334 | ) | | (2,324 | ) | | (4,263 | ) | $ | (3,161 | ) | | $ | (5,230 | ) | | $ | (4,250 | ) | | $ | 1,802 |
| | $ | (5,614 | ) | | $ | (5,811 | ) | | $ | (3,506 | ) | | $ | (3,794 | ) |
| Preferred stock dividends and accretion | (435 | ) | | (440 | ) | | (445 | ) | | (204 | ) | | — |
| | — |
| | — |
| | — |
| |
| Net loss attributable to common shareholders | $ | (13,055 | ) | | $ | (2,817 | ) | | $ | (2,890 | ) | | $ | (2,879 | ) | | $ | (3,743 | ) | | $ | (3,334 | ) | | $ | (2,324 | ) | | $ | (4,263 | ) | |
| Net loss per common share: | | | | | | | | | | | | | | | | |
| Loss from continuing operations per common share, basic and diluted | $ | (4.48 | ) | | $ | (0.80 | ) | | $ | (0.80 | ) | | $ | (0.30 | ) | | $ | (0.25 | ) | | $ | (0.22 | ) | | $ | (0.16 | ) | | $ | (0.28 | ) | |
| (1) includes stock-based compensation | | | | | | | | | | | | | | | | |
| (2) Includes depreciation and amortization | | | | | | | | | | | | | | | | |
| Net income (loss) per common share: | | | | | | | | | | | | | | | | |
| Basic | | $ | (0.16 | ) | | $ | (0.26 | ) | | $ | (0.21 | ) | | $ | 0.09 |
| | $ | (0.33 | ) | | $ | (0.33 | ) | | $ | (0.18 | ) | | $ | (0.19 | ) |
Diluted (2) | | $ | (0.16 | ) | | $ | (0.26 | ) | | $ | (0.21 | ) | | $ | 0.09 |
| | $ | (0.33 | ) | | $ | (0.33 | ) | | $ | (0.18 | ) | | $ | (0.19 | ) |
| |
| (1) | During the fourth quarter of 2018 we recorded income tax benefits primarily related to our acquisition of companies with deferred tax liabilities that we recorded at the time of acquisition. These deferred tax liabilities enabled us to recognize $10.1 million of our historic deferred tax assets that had previously been offset by our valuation allowance. This reduction in our valuation allowance was recorded as a tax benefit on our consolidated statement of operations. |
| |
| (2) | For all quarters, with the exception of the quarter ended December 31, 2018, basic and diluted net loss per share and weighted average common shares outstanding were the same as any additional common stock equivalents would have been anti-dilutive due to the net losses incurred during these periods. |
PART III
Item 9. Changes in and Disagreements with Accountants on Accounting and Financial Disclosure
None.
| |
| Item 9A. | Controls and Procedures |
Evaluation of Disclosure Controls and Procedures
Under the supervision and with the participation of our management, including our Chief Executive Officer and our Chief Financial Officer (our principal executive officer and principal financial officer, respectively), we have evaluated our disclosure controls and procedures as defined in Rules 13a-15(e) and 15d-15(e) under the Securities Exchange Act of 1934 as of December 31, 2015.2018. Based upon that evaluation, the Chief Executive Officer and the Chief Financial Officer have concluded that, as of December 31, 2015,2018, the Company's disclosure controls and procedures were effective in ensuring information required to be disclosed by the Company in reports that it files or submits under the Securities Exchange Act of 1934 is recorded, processed, summarized and reported within the time periods specified in the rules and forms of the SEC and is accumulated and communicated to the Company's management, including the Chief Executive Officer and Chief Financial Officer, as appropriate to allow timely decisions regarding required disclosure.
Our management, including our Chief Executive Officer and Chief Financial Officer, does not expect that our disclosure controls and procedures will prevent or detect all errors and all fraud. Disclosure controls and procedures, no matter how well designed, operated and managed, can provide only reasonable assurance that the objectives of the disclosure controls and procedures are met. Because of the inherent limitations of disclosure controls and procedures, no evaluation of such disclosure controls and procedures can provide absolute assurance that all control issues and instances of fraud, if any, have been detected.
Management’s Annual Report on Internal Control Over Financial Reporting
Our management is responsible for establishing and maintaining adequate internal control over financial reporting, as such term is defined in Exchange Act Rules 13a-15(f) and 15d-15(f). Because of its inherent limitations, internal control over financial reporting may not prevent or detect misstatements. Also, projections of any evaluation of effectiveness to future periods are subject to the risk that controls may become inadequate because of changes in conditions, or that the degree of compliance with policies or procedures may deteriorate. Our management, with the participation of our Chief Executive Officer and Chief Financial Officer, assessed the effectiveness of our internal control over financial reporting as of December 31, 2015.2018. In making this assessment, our management used the criteria set forth by the Committee of Sponsoring Organizations of the Treadway Commission, or COSO, in Internal Control - Integrated Framework (2013).
Management has excluded Interfax, Rant & Rave and Adestra from its assessment of the effectiveness of internal control over financial reporting as of December 31, 2018, as the acquisition of Interfax was completed in the first quarter of 2018 and the acquisitions of Rant & Rave and Adestra were completed during the fourth quarter of 2018. Interfax, Rant & Rave and Adestra represented 8.7%, 15.5% and 14.4%, respectively, of our total assets and 8.1%, 3.6% and 0.4%, respectively, of our total revenue for the year ended December 31, 2018.
Based on our evaluation using those criteria, our management has concluded that, as of December 31, 2015,2018, our internal control over financial reporting was effective to provide reasonable assurance regarding the reliability of financial reporting and the preparation of financial statements for external purposes in accordance with generally accepted accounting principles.
This Annual Report on Form 10-K does not include an attestation report of our registered public accounting firm on our internal control over financial reporting due to an exemption established by the JOBS Act for "emerging“emerging growth companies."”
Changes in Internal Control over Financial Reporting
There have been no changes in our internal control over financial reporting during the fourth quarter of fiscal 20152018 that have materially affected, or are reasonably likely to materially affect, our internal control over financial reporting.
| |
| Item 9B. | Other Information |
None.On March 7, 2019, we issued a press release and filed a Current Report on Form 8-K setting forth our 2018 financial results. Subsequent to the issuance of that press release and the filing of the related Form 8-K, the Company and its external auditors determined that the $890,000 paid in respect of stamp tax obligations for the acquisitions of InterFAX, Rant & Rave and Adestra should be accounted for as acquisition-related costs rather than purchase consideration.
After giving effect to this change, the Company’s acquisition-related expense for the fourth quarter ended December 31, 2018 was $10.0 million instead of $9.1 million as initially reported. The Company’s acquisition-related expense for the year ended December 31, 2018 was $18.7 million instead of $17.8 million as initially reported. This change affects the Company’s GAAP net income for the quarter as reported in its March 7th press release, which was $1.8 million instead of $2.7 million as initially reported, and the GAAP net income per diluted share for the quarter, which was $0.09 per diluted share instead of $0.13 as initially reported. GAAP net loss for the year was $10.8 million instead of $9.9 million as initially reported, and GAAP net loss per diluted share for the year, was $0.54 per diluted share instead of $0.50 as initially reported.
PART III
| |
| Item 10. | Directors, Officers and Corporate Governance |
We have adopted a code of ethics that applies to the Company’s directors, officers and employees, including the Chief Executive Officer and the Chief Financial Officer and any other persons performing similar functions. The text of our code of ethics, “Code of Business Conduct and Ethics,” has been posted on our website at
http://investor.uplandsoftware.com/code-of-conduct. We will provide a copy of the code of ethics without charge upon request to Corporate Secretary, Upland Software, Inc., 401 Congress Ave., Suite 1850, Austin, Texas 78701.
Additional information required by this item is incorporated by reference from our definitive proxy statement for the 20162019 Annual Meeting of Stockholders under the headings “Proposal One: Election of Directors,” “Section 16(a) Beneficial Ownership Reporting Compliance,” “Directors and Corporate Governance” and “Executive Officers.”
| |
| Item 11. | Executive Compensation |
The information required by this item is incorporated by reference from our definitive proxy statement for the 20162019 Annual Meeting of Stockholders, under the headings “Executive Compensation” and “Directors and Corporate Governance-Compensation Committee Interlocks and Insider Participation.”
Amendments to Executive Employment Agreements
On March 13, 2019, the Company entered amendments to each of those certain Executive Employment Agreements dated as of March 28, 2017, by and between the Company and each of (i) John T. McDonald, the Company’s Chief Executive Officer and Chairman of the Board (filed as Exhibit 10.21 to the Company’s Annual Report on Form 10-K filed on March 30, 2017) (the “McDonald Employment Agreement Amendment”), (ii) Timothy W. Mattox, the Company’s Chief Operating Officer and President (filed as Exhibit 10.22 to the Company’s Annual Report on Form 10-K filed on March 30, 2017) (the “Mattox Employment Agreement Amendment”) and (iii) Michael D. Hill, the Company’s Chief Financial Officer, Secretary and Treasurer (filed as Exhibit 10.23 to the Company’s Annual Report on Form 10-K filed on March 30, 2017) (the “Hill Employment Agreement Amendment” and together with the McDonald Employment Agreement Amendment and the Mattox Employment Agreement Amendment, the “Employment Agreement Amendments”).
The McDonald Employment Agreement Amendment increases Mr. McDonalds’s target bonus from 100 to 200 percent of Mr. McDonald’s base salary, with 75% of his bonus attributable to the Company’s achievement of its merger and acquisition objectives and 25% of his bonus attributable to the Company’s achievement of its corporate and financial objectives. The Mattox Employment Agreement Amendment increases Mr. Mattox’s target bonus from
100 to 150 percent of Mr. Mattox’s base salary, with 50% of his bonus attributable to the Company’s achievement of its merger and acquisition objectives and 50% of his bonus attributable to the Company’s achievement of its corporate and financial objectives. The Hill Employment Agreement Amendment increases Mr. Hill’s target bonus from 100 to 125 percent of Mr. Hill’s base salary, with 50% of his bonus attributable to the Company’s achievement of its merger and acquisition objectives and 50% of his bonus attributable to the Company’s achievement of its corporate and financial objectives.
The foregoing description of the Employment Agreement Amendments is not complete and is qualified in its entirety by reference to the complete text of the McDonald Employment Agreement Amendment, the Mattox Employment Agreement Amendment and the Hill Employment Agreement Amendment, copies of which are filed as Exhibit 10.23, 10.24 and 10.25, respectively to this Annual Report on Form 10-K and incorporated herein by reference.
| |
| Item 12. | Security Ownership of Certain Beneficial Owners and Management and Related Stockholder Matters |
The information required by this item is incorporated by reference from our definitive proxy statement for the 20162019 Annual Meeting of Stockholders under the headings “Equity Compensation Plan Information” and “Security Ownership of Certain Beneficial Owners and Management.”
| |
| Item 13. | Certain Relationships, and Related Transactions, and Director Independence |
The information required by this item is incorporated by reference from our definitive proxy statement for the 20162019 Annual Meeting of Stockholders under the headings “Certain Relationships and Related Party Transactions” and “Directors and Corporate Governance-Director Independence.”
| |
| Item 14. | Principal Accounting Fees and Services |
The information required by this item is incorporated by reference from our definitive proxy statement for the 20162019 Annual Meeting of Stockholders under the heading “Proposal Two: Ratification of Selection of Independent Registered Public Accounting Firm.”
PART IV
Item 15. Exhibits and Financial Statement Schedules
(a) Financial Statements
The financial statements filed as part of this Annual Report on Form 10-K are listed on the "Index“Index to Consolidated Financial Statements"Statements” included in Item 8 herein.
(b) Exhibits
See Exhibit Index at the end of this Annual Report on Form 10-K, which is incorporated by reference.
(c) Financial Statement SchedulesThe following schedule is filed as part of this Annual Report onItem 16. Form 10-K:10-K Summary
Not applicable.
Schedule II-Valuation and Qualifying Accounts
This schedule has been omitted as the required information has been included in the notes to the consolidated financial statements.
EXHIBIT INDEX
|
| | | | | |
| | | Incorporated by Reference |
Exhibit
No. | Description of Exhibit |
Form |
File No. |
Exhibit |
Filing Date |
| | S-1 | 333-198574 | 2.1 | September 4, 2014 |
| | S-1 | 333-198574 | 2.2 | September 4, 2014 |
| | S-1 | 333-198574 | 2.3 | September 4, 2014 |
| | S-1 | 333-198574 | 2.4 | September 4, 2014 |
| | S-1 | 333-198574 | 2.5 | September 4, 2014 |
| | S-1 | 333-198574 | 2.6 | September 4, 2014 |
| | 8-K | 001-36720 | 10.1 | November 16, 2017 |
| | 8-K | 001-36720 | 10.1 | October 3, 2018 |
| | 10-K | 001-36720 | 3.1 | March 30, 2016 |
| | 10-K | 001-36720 | 3.2 | March 30, 2016 |
| | S-1 | 333-198574 | 4.1 | September 4, 2014 |
| | S-1 | 333-198574 | 10.2 | October 27, 2014 |
| | S-1 | 333-198574 | 10.3.1 | September 4, 2014 |
| | S-1 | 333-198574 | 10.4 | September 4, 2014 |
| | S-1 | 333-198574 | 10.4.1 | September 4, 2014 |
| | S-1 | 333-198574 | 10.4.2 | September 4, 2014 |
| | S-1 | 333-198574 | 10.4.3 | September 4, 2014 |
| | S-1 | 333-198574 | 10.5 | September 4, 2014 |
|
| | | | | |
| | | Incorporated by Reference |
| | S-1 | 333-198574 | 10.5.1 | September 4, 2014 |
| | S-1 | 333-198574 | 10.6 | October 27, 2014 |
| | S-1 | 333-198574 | 10.7 | October 27, 2014 |
| | S-1 | 333-198574 | 10.7.1 | October 27, 2014 |
| | S-1 | 333-198574 | 10.8 | October 27, 2014 |
| | S-1 | 333-198574 | 10.8.1 | October 27, 2014 |
| | S-1 | 333-198574 | 10.9 | October 27, 2014 |
| | S-1 | 333-198574 | 10.9.1 | October 27, 2014 |
| | S-1 | 333-198574 | 10.12 | September 4, 2014 |
| | 10-K | 001-36720 | 10.13 | March 31, 2015 |
| | S-1 | 333-198574 | 10.17 | September 4, 2014 |
| | S-1 | 333-198574 | 10.17.1 | September 4, 2014 |
| | | | | |
| | S-1 | 333-198574 | 10.18 | September 4, 2014 |
| | S-1 | 333-198574 | 10.19 | September 4, 2014 |
| | S-1 | 333-198574 | 10.37 | October 27, 2014 |
| | 10-K | 001-36720 | 10.18.1 | March 30, 2017 |
| | S-1 | 333-198574 | 10.39 | September 4, 2014 |
| | 8-K | 001-36720 | 10.1 | June 22, 2015 |
| | 10-Q | 001-36720 | 10.1 | August 14, 2015 |
| | 10-K | 001-36720 | 10.18.1 | March 30, 2017 |
| | 10-K | 001-36720 | 10.18.2 | March 30, 2017 |
| | 10-K | 001-36720 | 10.18.3 | March 30, 2017 |
| | 10-Q | 001-36720 | 10.1 | August 14, 2017 |
|
| | | | | |
| | | Incorporated by Reference |
| | 10-Q | 001-36720 | 10.1 | November 14, 2017 |
| | 10-Q | 001-36720 | 10.1 | May 5, 2018 |
| | 10-Q | 001-36720 | 10.1 | August 9, 2018 |
| | 10-Q | 001-36720 | 10.1 | November 11, 2018 |
| | | | | |
| | 10-Q | 001-36720 | 10.2 | August 14, 2015 |
| | 10-Q | 001-36720 | 10.3 | August 14, 2015 |
| | 10-K | 001-36720 | 10.21 | March 30, 2017 |
| | 10-K | 001-36720 | 10.22 | March 30, 2017 |
| | 10-K | 001-36720 | 10.23 | March 30, 2017 |
| | | | | |
| | | | | |
| | | | | |
| | | | | |
| | | | | |
| | | | | |
| | | | | |
| | | | | |
| | | | | |
| | | | | |
|
| | | | | |
| | Incorporated by Reference |
| 101.INS | XBRL Instance Document | | | | |
| 101.SCH | XBRL Taxonomy Extension Schema | | | | |
| 101.CAL | XBRL Taxonomy Extension Calculation Linkbase | | | | |
| 101.LAB | XBRL Taxonomy Extension Label Linkbase | | | | |
| 101.PRE | XBRL Taxonomy Extension Presentation Linkbase | | | | |
| 101.DEF | XBRL Taxonomy Extension Definition Linkbase | | | | |
+ Indicates management contract, compensatory plan or arrangement.
* Filed herewith.
(1) The material contained in Exhibit 32.1 and Exhibit 32.2 is not deemed “filed” with the SEC and is not to be incorporated by reference into any filing of the Company under the Securities Act of 1933 or the Securities Exchange Act of 1934, whether made before or after the date hereof and irrespective of any general incorporation language contained in such filing, except to the extent that the Company specifically incorporates it by reference.
SIGNATURES
Pursuant to the requirement of Sections 13 or 15(d) of the Securities Exchange Act of 1934, the Registrant has duly caused this report to be signed on its behalf by the undersigned, thereunto duly authorized.
Date: March 30, 201615, 2019
|
| | |
| | Upland Software, Inc. |
| | | |
| | By: | /s/ John T. McDonald |
| | | John T. McDonald |
| | | Chief Executive Officer and Chairman |
POWER OF ATTORNEY
KNOW ALL PERSONS BY THESE PRESENTS, that each person whose signature appears below hereby constitutes and appoints John T. McDonald and Michael D. Hill and each of them, as his true and lawful attorney-in-fact and agent with full power of substitution, for him in any and all capacities, to sign any and all amendments to this Annual Report on Form 10-K, and to file the same, with all exhibits thereto and other documents in connection therewith, with the Securities and Exchange Commission, granting unto said attorney-in-fact and agent the full power and authority to do and perform each and every act and thing requisite and necessary to be done in connection therewith, as fully for all intents and purposes as he might or could do in person, hereby ratifying and confirming all that said attorney-in-fact and agent, or his substitute, may lawfully do or cause to be done by virtue thereof.
Pursuant to the requirements of the Securities Exchange Act of 1934, this report has been signed below by the following persons on behalf of the registrant and in the capacities and on the dates indicated:
|
| | | | |
| Signature | | Title | | Date |
| | | | | |
| /s/ John T. McDonald | | Chief Executive Officer and Chairman | | March 30, 201615, 2019 |
| John T. McDonald | | (Principal Executive Officer) | | |
| | | | | |
| /s/ Michael D. Hill | | Chief Financial Officer, Secretary and Treasurer | | March 30, 201615, 2019 |
| Michael D. Hill | | (Principal Financial Officer and Principal Accounting Officer) | | |
| | | | | |
/s/ John D. ThorntonJoe C. Ross | | Director | | March 30, 201615, 2019 |
John D. ThorntonJoe C. Ross | | | | |
| | | | | |
/s/ Steven SarracinoDavid May | | Director | | March 30, 201615, 2019 |
Steven SarracinoDavid May | | | | |
| | | | | |
| /s/ Stephen E. Courter | | Director | | March 30, 201615, 2019 |
| Stephen E. Courter | | | | |
| | | | | |
| /s/ Rodney C. Favaron | | Director | | March 30, 201615, 2019 |
| Rodney C. Favaron | | | | |
EXHIBIT INDEX
Note regarding removal of exhibits: Regulation S-K allows you to remove Item 10 exhibits entered into more than 2 years ago for which performance has been completed (and which are not material for some other reason). Additionally, if an executive has been gone for the last fiscal year, there is no need to his his/her contract in the exhibits. Please consider whether any of your material contracts (Item 10 contracts) should be removed. Please note this rule does NOT apply to other items like Item 2 or Item 4. There is no clear guidance for Items 2 and 4, but the general thinking is that if those agreements have terminated and there are no outstanding obligations under them, and they are not referenced in the 10-K, they can be removed.
|
| | | | | |
| | | Incorporated by Reference |
Exhibit
No. | Description of Exhibit |
Form |
File No. |
Exhibit |
Filing Date |
| 2.1 | Agreement and Plan of Merger by and among the Registrant, Steering Wheel Acquisition Corp., PowerSteering Software, Inc. and Michael Pehl, as Stockholder representative, dated February 3, 2012 | S-1 | 333-198574 | 2.1 | September 4, 2014 |
| 2.2 | Stock Purchase Agreement by and among the Registrant, Tenrox Inc., the stockholders named therein and Novacap II, L.P. and Aramazd Israilian, as representatives, dated February 10, 2012 | S-1 | 333-198574 | 2.2 | September 4, 2014 |
| 2.3 | Membership Interest Purchase Agreement by and among the Registrant, LMR Solutions, LLC, Joseph Larscheid and Cheryl Larscheid, dated November 13, 2012 | S-1 | 333-198574 | 2.3 | September 4, 2014 |
| 2.4 | Stock Purchase Agreement by and among the Registrant, Marex Group Inc., FileBound Solutions, Inc., the Selling Stockholders (as defined therein) and Rex Lamb, as representative of the Selling Stockholders, dated May 16, 2013 | S-1 | 333-198574 | 2.4 | September 4, 2014 |
| 2.5 | Membership Interest Purchase Agreement by and among the Registrant, Upland Software, Inc., ComSci, LLC and Robert Svec, dated November 7, 2013 | S-1 | 333-198574 | 2.5 | September 4, 2014 |
| 2.6 | Stock Purchase Agreement by and among the Registrant, Clickability, Inc. and Limelight Networks, Inc. dated December 23, 2013 | S-1 | 333-198574 | 2.6 | September 4, 2014 |
| 3.1* | Amended and Restated Certificate of Incorporation, as currently in effect | | | | |
| 3.2* | Amended and Restated Bylaws, as currently in effect | | | | |
| 4.1 | Amended and Restated Investors’ Rights Agreement among the Registrant and certain stockholders, dated December 20, 2013 | S-1 | 333-198574 | 4.1 | September 4, 2014 |
| 4.2 | Restricted Stock Agreement between the Registrant, Joseph Larscheid and Cheryl Larscheid, dated November 14, 2012 | S-1 | 333-198574 | 4.4 | September 4, 2014 |
| 4.3 | Market Standoff Agreement between the Registrant and Robert Svec, dated November 6, 2013 | S-1 | 333-198574 | 4.5 | September 4, 2014 |
| 4.4 | Warrant to Purchase Series A Preferred Stock issued to Comerica Bank dated February 10, 2012 | S-1 | 333-198574 | 4.8 | September 4, 2014 |
| 4.5 | Warrant to Purchase Series B Preferred Stock issued to Comerica Bank dated March 5, 2012 | S-1 | 333-198574 | 4.9 | September 4, 2014 |
| 4.6 | Warrant to Purchase Series B Preferred Stock issued to Comerica Bank dated April 11, 2013 | S-1 | 333-198574 | 4.10 | September 4, 2014 |
| 4.7 | Warrant to Purchase Common Stock issued to Entrepreneurs Foundation of Central Texas dated November 6, 2013 | S-1 | 333-198574 | 4.11 | September 4, 2014 |
|
| | | | | |
| | | Incorporated by Reference |
| 4.8 | Restricted Stock Agreement between the Registrant, Craig MacInnis, Karen Smiley-MacInnis, and John David MacInnis, dated November 20, 2014 | 10-K | 001-36720 | 4.8 | March 31, 2015 |
| 4.9 | Restricted Stock Agreement between the Registrant, Bradley Robbins, Carla Robbins, and Debbie-Anne Michelle Dias, dated November 20, 2014 | 10-K | 001-36720 | 4.9 | March 31, 2015 |
| 4.10 | Specimen Common Stock Certificate | 10-Q | 001-36720 | 4.1 | May 15, 2015 |
| 10.1+ | Form of Indemnification Agreement for directors and officers | S-1 | 333-198574 | 10.2 | October 27, 2014 |
| 10.2+ | Amended and Restated 2010 Stock Plan, as amended September 2, 2014 | S-1 | 333-198574 | 10.3.1 | September 4, 2014 |
| 10.3+ | Form of Stock Option Agreement under Amended and Restated 2010 Stock Plan (Standard) | S-1 | 333-198574 | 10.4 | September 4, 2014 |
| 10.3.1+ | Form of Stock Option Agreement under Amended and Restated 2010 Stock Plan (Former ComSci, LLC Employees) | S-1 | 333-198574 | 10.4.1 | September 4, 2014 |
| 10.3.2+ | Form of Stock Option Agreement under Amended and Restated 2010 Stock Plan (Executive) | S-1 | 333-198574 | 10.4.2 | September 4, 2014 |
| 10.3.3+ | Form of Amendment to Stock Option Agreement under Amended and Restated 2010 Stock Plan with Certain Executives | S-1 | 333-198574 | 10.4.3 | September 4, 2014 |
| 10.4+ | Form of Restricted Stock Purchase Agreement under Amended and Restated 2010 Stock Plan | S-1 | 333-198574 | 10.5 | September 4, 2014 |
| 10.4.1+ | Form of Amendment to Restricted Stock Purchase Agreement under Amended and Restated 2010 Stock Plan | S-1 | 333-198574 | 10.5.1 | September 4, 2014 |
| 10.5+ | 2014 Equity Incentive Plan | S-1 | 333-198574 | 10.6 | October 27, 2014 |
| 10.6+ | Form of Stock Option Award Agreement under 2014 Equity Incentive Plan | S-1 | 333-198574 | 10.7 | October 27, 2014 |
| 10.6.1+ | Form of Stock Option Award Agreement under 2014 Equity Incentive Plan (Executive) | S-1 | 333-198574 | 10.7.1 | October 27, 2014 |
| 10.7+ | Form of Restricted Stock Purchase Agreement under 2014 Equity Incentive Plan | S-1 | 333-198574 | 10.8 | October 27, 2014 |
| 10.7.1+ | Form of Restricted Stock Purchase Agreement under 2014 Equity Incentive Plan (Executive) | S-1 | 333-198574 | 10.8.1 | October 27, 2014 |
| 10.8+ | Form of Restricted Stock Unit Award Agreement under 2014 Equity Incentive Plan | S-1 | 333-198574 | 10.9 | October 27, 2014 |
| 10.8.1+ | Form of Restricted Stock Unit Award Agreement under 2014 Equity Incentive Plan (Executive) | S-1 | 333-198574 | 10.9.1 | October 27, 2014 |
| 10.9+ | Offer of Employment between the Registrant and John T. McDonald, dated July 23, 2010 | S-1 | 333-198574 | 10.10 | September 4, 2014 |
| 10.10+ | Employment Agreement between the Registrant and John T. McDonald, dated May 9, 2014 | S-1 | 333-198574 | 10.12 | September 4, 2014 |
| 10.11+ | Offer of Employment between the Registrant and R. Brian Henley, dated January 10, 2013 | S-1 | 333-198574 | 10.11 | September 4, 2014 |
| 10.12+ | Employment Agreement between the Registrant and R. Brian Henley, dated July 25, 2014 | S-1 | 333-198574 | 10.11.1 | September 4, 2014 |
| 10.13+ | Offer of Employment between the Registrant and Timothy Mattox, dated July 7, 2014 | 10-K | 001-36720 | 10.13 | March 31, 2015 |
| 10.14+ | Restricted Stock Purchase Agreement between the Registrant and John T. McDonald, dated July 23, 2010 | S-1 | 333-198574 | 10.14 | September 4, 2014 |
| 10.15+ | Restricted Stock Purchase Agreement between the Registrant and John T. McDonald, dated October 18, 2010 | S-1 | 333-198574 | 10.15 | September 4, 2014 |
|
| | | | | |
| | | Incorporated by Reference |
| 10.16+ | Restricted Stock Purchase Agreement between the Registrant and John T. McDonald, dated September 2, 2014 | S-1 | 333-198574 | 10.16 | September 4, 2014 |
| 10.17+ | Restricted Stock Purchase Agreement between the Registrant and R. Brian Henley, dated September 2, 2014 | S-1 | 333-198574 | 10.16.1 | September 4, 2014 |
| 10.18+ | Restricted Stock Purchase Agreement between the Registrant and Timothy Mattox, dated September 2, 2014 | 10-K | 001-36720 | 10.18 | March 31, 2015 |
| 10.19 | Office Lease between the Registrant and TPG-401 Congress LLC, dated February 27, 2014 | S-1 | 333-198574 | 10.17 | September 4, 2014 |
| 10.20 | First Amendment to Office Lease between Registrant and TPG-401 Congress LLC | S-1 | 333-198574 | 10.17.1 | September 4, 2014 |
| 10.21 | Lease Agreement between Tenrox Inc. and A.R.E. Quebec, dated November 5, 2012, as amended | S-1 | 333-198574 | 10.18 | September 4, 2014 |
| 10.22 | Sublease Agreement between Marex Properties, LLC and Marex Group Inc., dated May 10, 2013 | S-1 | 333-198574 | 10.19 | September 4, 2014 |
| 10.23 | Loan and Security Agreement and Joinder between the Registrant, Visionael Corporation, PowerSteering Software, Inc., LMR Solutions LLC, Marex Group, Inc., FileBound Solutions, Inc., ComSci, LLC, ComSci, Inc. and Comerica Bank, dated March 5, 2012, as amended through December 6, 2013 | S-1 | 333-198574 | 10.20 | September 4, 2014 |
| 10.23.1 | Ninth Amendment to Loan and Security Agreement, Joinder and Consent between Registrant, Upland Software I, Inc., Upland Software III, Inc., Upland Software IV, Inc., Upland Software V, Inc., Upland Software VI, LLC, Upland Software VII, Inc., Upland IX, LLC and Comerica Bank, dated March 23, 2015 | 10-K | 001-36720 | 10.23.1 | March 31, 2015 |
| 10.24 | Security Agreement between Tenrox Inc. and Comerica Bank, dated March 5, 2012, as amended | S-1 | 333-198574 | 10.21 | September 4, 2014 |
| 10.25 | Unconditional Guaranty by Tenrox Inc., dated March 5, 2012 | S-1 | 333-198574 | 10.22 | September 4, 2014 |
| 10.26 | Affirmation of Guaranty Documents by Tenrox Inc. for the benefit of Comerica Bank, dated December 3, 2012, as amended through May 16, 2013 | S-1 | 333-198574 | 10.23 | September 4, 2014 |
| 10.26.1 | Amendment to and Affirmation of Guaranty Documents between Upland Software II, Inc. and Comerica Bank, dated March 23, 2015 | 10-K | 001-36720 | 10.26.1 | March 31, 2015 |
| 10.27 | Loan and Security Agreement between Tenrox, Inc., successor to Silverback Two Canada Merger Corporation, and Comerica Bank, dated February 10, 2012, as amended through December 6, 2013 | S-1 | 333-198574 | 10.24 | September 4, 2014 |
| 10.27.1 | Eighth Amendment to Loan and Security Agreement, Joinder and Consent between Upland Software Inc., Solution Q Inc. and Comerica Bank, dated March 23, 2015 | 10-K | 001-36720 | 10.27.1 | March 31, 2015 |
| 10.28 | Pledge and Security Agreement between the Registrant and Comerica Bank, dated February 10, 2012, as amended through May 16, 2013 | S-1 | 333-198574 | 10.25 | September 4, 2014 |
| 10.28.1 | Amendment No. 6 to Pledge and Security Agreement between Registrant and Comerica Bank, dated March 23, 2015 | 10-K | 001-36720 | 10.28.1 | March 31, 2015 |
| 10.29 | Security Agreement between Marex Group, Inc. and Comerica Bank, dated May 16, 2013, as amended through December 6, 2013 | S-1 | 333-198574 | 10.26 | September 4, 2014 |
| 10.29.1 | Amendment No. 3 to Security Agreement between Upland Software IV, Inc. and Comerica Bank, dated March 23, 2015 | 10-K | 001-36720 | 10.29.1 | March 31, 2015 |
|
| | | | | |
| | | Incorporated by Reference |
| 10.30 | Security Agreement between LMR Solutions LLC and Comerica Bank, dated December 3, 2012, as amended through December 6, 2013 | S-1 | 333-198574 | 10.27 | September 4, 2014 |
| 10.30.1 | Amendment No. 5 to Security Agreement between Upland Software III, LLC and Comerica Bank, dated March 23, 2015 | 10-K | 001-36720 | 10.30.1 | March 31, 2015 |
| 10.31 | Security Agreement between PowerSteering Software Inc. and Comerica Bank, dated February 10, 2012, as amended through March 19, 2014 | S-1 | 333-198574 | 10.28 | October 27, 2014 |
| 10.31.1 | Amendment No. 6 to Security Agreement between Upland Software I, Inc. and Comerica Bank, dated March 23, 2015 | 10-K | 001-36720 | 10.31.1 | March 31, 2015 |
| 10.32 | Security Agreement between Tenrox Inc. and Comerica Bank, dated February 10, 2012, as amended through December 6, 2013 | S-1 | 333-198574 | 10.29 | October 27, 2014 |
| 10.32.1 | Amendment No. 6 to Security Agreement between Upland Software II, Inc. and Comerica Bank, dated March 23, 2015 | 10-K | 001-36720 | 10.32.1 | March 31, 2015 |
| 10.33 | Unconditional Guaranty by Marex Group, Inc., dated May 16, 2013 | S-1 | 333-198574 | 10.30 | September 4, 2014 |
| 10.34 | Unconditional Guaranty by LMR Solutions LLC, dated December 3, 2012 | S-1 | 333-198574 | 10.31 | September 4, 2014 |
| 10.35 | Unconditional Guaranty by PowerSteering Software Inc., dated February 10, 2012 | S-1 | 333-198574 | 10.32 | September 4, 2014 |
| 10.36 | Unconditional Guaranty by Tenrox Inc., dated February 10, 2012 | S-1 | 333-198574 | 10.33 | September 4, 2014 |
| 10.37 | Unconditional Guaranty by the Registrant, dated February 10, 2012 | S-1 | 333-198574 | 10.34 | September 4, 2014 |
| 10.38 | Amendment to and Affirmation of Guaranty Documents and Waiver by Tenrox Inc. for the benefit of Comerica Bank, dated April 11, 2013 | S-1 | 333-198574 | 10.35 | September 4, 2014 |
| 10.39 | Note Purchase Agreement between the Registrant and the Investors listed on Schedule I thereto, dated October 9, 2013, as amended | S-1 | 333-198574 | 10.40 | September 4, 2014 |
| 10.40 | Series C Preferred Stock Purchase Agreement among the Registrant and the Investors listed on the Schedule of Investors thereto, dated December 20, 2013 | S-1 | 333-198574 | 10.36 | September 4, 2014 |
| 10.41 | Amended and Restated Technology Services Agreement between the Registrant and DevFactory FZ-LLC, dated January 1, 2014 | S-1 | 333-198574 | 10.37 | October 27, 2014 |
| 10.42 | Letter Agreement between the Registrant and DevFactory FZ-LLC, dated January 1, 2014 | S-1 | 333-198574 | 10.38 | September 4, 2014 |
| 10.43 | Stock Purchase Agreement between the Registrant and DevFactory FZ-LLC, dated January 27, 2014 | S-1 | 333-198574 | 10.39 | September 4, 2014 |
| 10.44 | Unconditional Guaranty by Upland IX, LLC, dated March 23, 2015 | 10-K | 001-36720 | 10.44 | March 31, 2015 |
| 10.45 | Security Agreement between Upland IX, LLC and Comerica Bank, dated March 23, 2015 | 10-K | 001-36720 | 10.45 | March 31, 2015 |
| 10.46 | Lease by and between Lincoln One, LLC and the Registrant dated June 19, 2015 | 8-K | 001-36720 | 10.1 | June 22, 2015 |
| 10.47 | Credit Agreement by and between the Registrant and Wells Fargo Finance, dated May 14, 2015 | 10-Q | 001-36720 | 10.1 | August 14, 2015 |
| 10.48 | Guaranty and Security Agreement by and between the Registrant and Wells Fargo Capital Finance, dated May 14, 2015 | 10-Q | 001-36720 | 10.2 | August 14, 2015 |
|
| | | | | |
| | | Incorporated by Reference |
| 10.49 | Canadian Guarantee and Security Agreement by and between the Registrant and Wells Fargo Capital Finance, dated May 14, 2015 | 10-Q | 001-36720 | 10.3 | August 14, 2015 |
| 21.1 | List of subsidiaries of Upland Software, Inc. | 10-K | 001-36720 | 21.1 | August 14, 2015 |
| 23.1* | Consent of Ernst & Young LLP, Independent Registered Public Accounting Firm | | | | |
| 24.1* | Power of Attorney (included on signature pages hereto) | | | | |
| 31.1* | Certification of the Principal Executive Officer Required Under Rules 13a-14(a) and 15d-14(a) of the Securities Act of 1934, as amended, as adopted pursuant to Section 302 of the Sarbanes-Oxley Act of 2002 | | | | |
| 31.2* | Certification of the Principal Financial Officer Required Under Rules 13a-14(a) and 15d-14(a) of the Securities Act of 1934, as amended, as adopted pursuant to Section 302 of the Sarbanes-Oxley Act of 2002 | | | | |
| 32.1*(1) | Certification of Principal Executive Officer Required Under Rules 13a-14(a) and 15d-14(a) of the Securities Exchange Act of 1934, as amended, and 18 U.S.C. Section 1350 as adopted pursuant to Section 906 of the Sarbanes-Oxley Act of 2002 | | | | |
| 32.2*(1) | Certification of Principal Financial Officer Required Under Rules 13a-14(a) and 15d-14(a) of the Securities Exchange Act of 1934, as amended, and 18 U.S.C. Section 1350 as adopted pursuant to Section 906 of the Sarbanes-Oxley Act of 2002 | | | | |
| 101.INS | XBRL Instance Document | | | | |
| 101.SCH | XBRL Taxonomy Extension Schema | | | | |
| 101.CAL | XBRL Taxonomy Extension Calculation Linkbase | | | | |
| 101.LAB | XBRL Taxonomy Extension Label Linkbase | | | | |
| 101.PRE | XBRL Taxonomy Extension Presentation Linkbase | | | | |
| 101.DEF | XBRL Taxonomy Extension Definition Linkbase | | | | |
+ Indicates management contract, compensatory plan or arrangement.
* Filed herewith.
(1) The material contained in Exhibit 32.1 and Exhibit 32.2 is not deemed “filed” with the SEC and is not to be incorporated by reference into any filing of the Company under the Securities Act of 1933 or the Securities Exchange Act of 1934, whether made before or after the date hereof and irrespective of any general incorporation language contained in such filing, except to the extent that the Company specifically incorporates it by reference.