UNITED STATES
SECURITIES AND EXCHANGE COMMISSION
WASHINGTON, DC 20549
Form 10-K
|
| | |
| (Mark One) |
| ý | | ANNUAL REPORT PURSUANT TO SECTION 13 OR 15(d) OF THE SECURITIES EXCHANGE ACT OF 1934 |
| | | For the fiscal year ended September 30, 20162018 |
| | | or |
|
| | |
| o | | TRANSITION REPORT PURSUANT TO SECTION 13 OR 15(d) OF THE SECURITIES EXCHANGE ACT OF 1934 |
| | | For the transition period from to |
Commission file number: 814-00794
GOLUB CAPITAL BDC, INC.
(Exact Name of Registrant as Specified in its Charter)
|
| | |
| Delaware | | 27-2326940 |
(State or Other Jurisdiction of Incorporation or Organization) | | (I.R.S. Employer Identification No.) |
150 South Wacker Drive, Suite 800, Chicago, IL666 Fifth Avenue, 18th Floor, New York, NY | | 6060610103 |
| (Address of Principal Executive Offices) | | (Zip Code) |
(312) 205-5050(212) 750-6060
(Registrant’s Telephone Number, Including Area Code)
Securities registered pursuant to Section 12(b) of the Act:
|
| | |
| Title of Each Class | | Name of Each Exchange on Which Registered |
| Common Stock, par value $0.001 per share | | The NASDAQ Stock Market LLC |
Securities registered pursuant to Section 12(g) of the Act: None
Indicate by check mark if the registrant is a well-known seasoned issuer, as defined in Rule 405 of the Securities Act.
Yes o No ý
Indicate by check mark if the registrant is not required to file reports pursuant to Section 13 or 15(d) of the Act.
Yes o No ý
Indicate by check mark whether the registrant: (1) has filed all reports required to be filed by Section 13 or 15(d) of the Securities Exchange Act of 1934 during the preceding 12 months (or for such shorter period that the registrant was required to file such reports), and (2) has been subject to such filing requirements for the past 90 days.
Yes ý No o
Indicate by check mark whether the registrant has submitted electronically and posted on its corporate Web site, if any, every Interactive Data File required to be submitted and posted pursuant to Rule 405 of Regulation S-T (§232.405 of this chapter) during the preceding 12 months (or for such shorter period that the registrant was required to submit and post such files).Yes.
Yes o No oý
Indicate by check mark if disclosure of delinquent filers pursuant to Item 405 of Regulation S-K is not contained herein, and will not be contained, to the best of the registrant’s knowledge, in definitive proxy or information statements incorporated by reference in Part III of this Form 10-K or any amendment to this Form 10-K.
Yes ý No o
Indicate by check mark whether the registrant is a large accelerated filer, an accelerated filer, a non-accelerated filer or a smaller reporting company. See definitions of “large accelerated filer”, “accelerated filer” and “smaller reporting company” in Rule 12b-2 of the Exchange Act. (Check one):
|
| | | | | | |
Large accelerated filer xþ | | Accelerated filer o | |
Non-accelerated filer o | | Smaller reporting company o |
Emerging growth company o | |
If an emerging growth company, indicate by check mark if the registrant has elected not to use the extended transition period for complying with any new or revised financial accounting standards provided pursuant to Section 13(a) of the Exchange Act. o
Indicate by check mark whether the registrant is a shell company (as defined in Rule 12b-2 of the Securities Exchange Act of 1934).Yes o No ý
The aggregate market value of common stock held by non-affiliates of the registrant on March 31, 20162018 based on the closing price on that date of $17.31$17.89 on the Nasdaq Global Select Market was approximately $891.7$1,071.0 million. For the purposes of calculating this amount only, all directors and executive officers of the registrant have been treated as affiliates. There were 55,059,06760,165,454 shares of the registrant’s common stock outstanding as of November 16, 2016.28, 2018.
DOCUMENTS INCORPORATED BY REFERENCE
Portions of the registrant’s proxy statement to be filed with the Securities and Exchange Commission pursuant to Regulation 14A in connection with the registrant’s 20172019 Annual Meeting of Stockholders, which will be filed subsequent to the date hereof, are incorporated by reference into Part III of this Form 10-K. Such proxy statement will be filed with the Securities and Exchange Commission not later than 120 days following the end of the registrant’s fiscal year ended September 30, 2016.2018.
|
| | |
| Part I. | | |
| | |
| | |
| | |
| | |
| | |
| | |
| Part II. | | |
| | |
| | |
| | |
| | |
| | |
| | |
| | |
| | |
| Part III. | | |
| | |
| | |
| | |
| | |
| | |
| Part IV. | | |
| | |
| | | |
PART I
In this annual report on Form 10-K, except as otherwise indicated, the terms:
“we,” “us,” “our” and “Golub Capital BDC” refer to Golub Capital BDC, Inc., a Delaware corporation, and its consolidated subsidiaries;
“Holdings” refers to Golub Capital BDC 2010-1 Holdings LLC, a Delaware limited liability company, or LLC, our direct subsidiary;
“2010 Issuer” refers to Golub Capital BDC 2010-1 LLC, a Delaware LLC, our indirect subsidiary;
“2014 Issuer” refers to Golub Capital BDC CLO 2014 LLC, a Delaware LLC, our direct subsidiary;
"2018 Issuer" refers to Golub Capital BDC CLO III LLC, a Delaware LLC, our indirect subsidiary;
“CLO Depositor” refers to Golub Capital BDC CLO III Depositor LLC, a Delaware LLC, our direct subsidiary.
“Controlling Class” refers to the most senior class of notes then outstanding of the 20102014 Issuer or the 20142018 Issuer, as applicable;
“"2010 Debt Securitization”Securitization" refers to the $350.0 million term debt securitization that we completed on July 16, 2010, as most recently amended on October 20, 2016 and redeemed on July 20, 2018, in which the 2010 Issuer issued an aggregate of $350.0 million of notes, or the “2010 Notes,” including $205.0 million of Class A-Refi 2010 Notes, which bearbore interest at a rate of three-month London Interbank Offered Rate, or LIBOR, plus 1.90%, $10.0 million of Class B-Refi 2010 Notes, which bearbore interest at a rate of three-month LIBOR plus 2.40% and $135.0 million face amount of Subordinated 2010 Notes that dodid not bear interest;
“2014 Debt Securitization” refers to the $402.6 million term debt securitization that we completed on June 5, 2014, as most recently amended on March 23, 2018, in which the 2014 Issuer issued an aggregate of $402.6 million of notes, or the “2014 Notes,” including $191.0 million of Class A-1A-1-R 2014 Notes, which bear interest at a rate of three-month LIBOR, plus 1.75%0.95%, $20.0 million of Class A-2 2014 Notes, which bore interest at a rate of three-month LIBOR plus 1.45% through December 4, 2015 and bear interest at three-month LIBOR plus 1.95% thereafter, $35.0 million of Class BA-2-R 2014 Notes, which bear interest at a rate of three-month LIBOR plus 2.50%0.95%, $37.5$35.0 million of Class CB-R 2014 Notes, which bear interest at a rate of three-month LIBOR plus 3.50%1.40%, $37.5 million of Class C-R 2014 Notes, which bear interest at a rate of three-month LIBOR plus 1.55%, and $119.1 million of LLC equitymembership interests that do not bear interest;
"2018 Debt Securitization" refers to the $602.4 million term debt securitization that we completed on November 16, 2018, in which the 2018 Issuer issued an aggregate of $602.4 million of notes, or the “2018 Notes,” including $327.0 million of Class A 2018 Notes, which bear interest at a rate of three-month LIBOR, plus 1.48%, $61.2 million of Class B 2018 Notes, which bear interest at a rate of three-month LIBOR plus 2.10%, $20.0 million of Class C-1 2018 Notes, which bear interest at a rate of three-month LIBOR plus 2.80%, $38.8 million of Class C-2 2018 Notes, which bear interest at a rate of three-month LIBOR plus 2.65%, $42.0 million of Class D 2018 Notes, which bear interest at a rate of three-month LIBOR plus 2.95%, and $113.4 million of Subordinated 2018 Notes that do not bear interest;
“Funding” refers to Golub Capital BDC Funding, LLC, a Delaware LLC, our direct subsidiary;
“Credit Facility” refers to the amended and restated senior secured revolving credit facility that Funding originally entered into on July 21, 2011, as most recently amended on March 1, 2016,September 21, 2018, with Wells Fargo Securities, LLC, as administrative agent, and Wells Fargo Bank, N.A., as lender and collateral agent, that currently allows for borrowing up to $200$170 million and that bears interest at a rate of one-month LIBOR plus 2.25%2.15% per annum through the reinvestment period, which ends September 20, 2019, and through the stated maturity date of September 21, 2023;
"MS Credit Facility" refers to the amended senior secured credit facility that the 2010 Issuer originally entered into on July 29, 2017,20, 2018 and recently amended on November 1, 2018, with Morgan Stanley Bank, N.A., as lender, Morgan Stanley Senior Secured Funding, Inc. as administrative agent, and U.S. Bank National Association, as collateral agent for the administrative agent and the lenders, that currently allows for borrowing up to $450 million and that bears interest at a rate of one-month LIBOR plus 2.75% for1.90% per annum through the reinvestment period, which ends on January 18, 2019, and bears interest at a rate of
one-month LIBOR plus 2.15% following the reinvestment period through the stated maturity date of July 30, 2020;March 20, 2019;
“Revolver Funding”"Revolving Credit Facilities" refers to Golub Capital BDC Revolver Funding LLC, a Delaware LLC, our direct subsidiary;
“Revolver” referscollectively to the $15.0 million revolving line of credit that Revolver Funding entered into on November 22, 2013 with The PrivateBankCredit Facility and Trust Company, or PrivateBank, as lenderthe MS Credit Facility, and administrative agent, and terminated on October 21, 2015 that bore interest, at the election of Revolver Funding, ateach a rate of either one-, two- or three-month LIBOR plus 3.50% per annum or PrivateBank’s prime rate plus 1.50% per annum and had a stated maturity date of November 22, 2020;"Revolving Credit Facility";
“Adviser Revolver” refers to the $20.0 million line of credit with GC Advisors;
“SBIC Funds” refers collectively to our consolidated subsidiaries, GC SBIC IV, L.P.,GC SBIC V, L.P. and GC SBIC V,VI, L.P.;
“SLF” refers to Senior Loan Fund LLC, an unconsolidated Delaware LLC, in which we co-invest with RGA Reinsurance Company, or RGA, primarily in senior secured loans. SLF is capitalized as transactions are completed and all portfolio and investment decisions in respect of SLF must be approved by representatives of each of the members (with unanimous approval required from either (i) one representative of each of us and RGA or (ii) both representatives of each of us and RGA currently)RGA). As of September 30, 2016,2018, we owned 87.5% of both the outstanding subordinated notes and LLC equity interests of SLF. As of September 30, 2016,2018, SLF had subordinated note commitments from its members totaling $160.0 million and LLC equity interest subscriptions from its members totaling $40.0 million. We$200.0 million of which we have committed to fund $140.0 million of subordinated notes and $35.0 million of LLC equity interest subscriptions to SLF;$175.0 million;
“GC Advisors” refers to GC Advisors LLC, a Delaware LLC, our investment adviser;
“Administrator” refers to Golub Capital LLC, a Delaware LLC, an affiliate of GC Advisors and our administrator; and
“Golub Capital” refers, collectively, to the activities and operations of Golub Capital Incorporated, Golub Capital LLC (formerly Golub Capital Management LLC), which entity employs all of Golub Capital’s investment professionals, GC Advisors and associated investment funds and their respective affiliates.
Item 1. Business
GENERAL
We are an externally managed, closed-end, non-diversified management investment company that has elected to be regulated as a business development company under the Investment Company Act of 1940, as amended, or the 1940 Act. In addition, for U.S. federal income tax purposes, we have elected to be treated as a regulated investment company, or RIC, under Subchapter M of the Internal Revenue Code of 1986, as amended, or the Code. We were formed in November 2009 to continue and expand the business of our predecessor, Golub Capital Master Funding LLC, which commenced operations in July 2007, to2007. We make investments primarily in senior secured, one stop (a loan that combines characteristics of traditional first lien senior secured loans and second lien or subordinated loans), second lien and subordinated (a loan that ranksother senior only to a borrower’s equity securities and ranks junior to all of such borrower’s other indebtedness in priority of payment)secured loans of and warrants and minority equity securities in, U.S. middle-market companies that are, in most cases, sponsored by private equity firms. We structureGC Advisors structures our one stop loans as senior secured loans, and we obtain security interests in the assets of the portfolio company that serve as collateral in support of the repayment of these loans. This collateral may take the form of first-priority liens on the assets of the portfolio company. In many cases, we together with our affiliates are the sole lenders of one stop loans, which can afford us additional influence over the borrower in terms of monitoring and, if necessary, remediation in the event of underperformance.
In this annual report on Form 10-K, the term “middle-market” generally refers to companies having earnings before interest, taxes, depreciation and amortization, or EBITDA, of between $10.0 million and $50.0less than $100.0 million annually.
Our investment objective is to generate current income and capital appreciation by investing primarily in one stop and other senior secured and one stop loans of U.S. middle-market companies. We may also selectively invest in second lien and subordinated loans of, and warrants and minority equity securities in U.S. middle-market companies. We intend to achieve our investment objective by (1) accessing the established loan origination channels developed by Golub Capital, a leading lender to middle-market companies with over $18.0$25.0 billion in capital under management as of September 30, 2016,2018, (2) selecting investments within our core middle-market company focus, (3) partnering with experienced private equity firms, or sponsors, in many cases with whom Golub Capital has invested alongside in the past, (4) implementing the disciplined underwriting standards of Golub Capital and (5) drawing upon the aggregate experience and resources of Golub Capital.
We seek to create a portfolio that includes primarily one stop and other senior secured and one stop loans by primarily investing approximately $5.0 million to $30.0 million of capital, on average, in the securities of U.S. middle-market companies. We may also selectively invest more than $30.0 million in some of our portfolio companies and generally expect that the size of our individual investments will vary proportionately with the size of our capital base.
We generally invest in securities that have been rated below investment grade by independent rating agencies or that would be rated below investment grade if they were rated. These securities, which may be referred to as “junk,” have predominantly speculative characteristics with respect to the issuer’s capacity to pay interest and repay principal. In addition, many of our debt investments have floating interest rates that reset on a periodic basis and typically do not fully pay down principal prior to maturity, which may increase our risk of losing part or all of our investment.
Information Available
Our address is 150 South Wacker Drive, Suite 800, Chicago, IL 60606.666 Fifth Avenue, 18th Floor, New York, NY 10103. Our phone number is (312) 205-5050,(212) 750-6060, and our internet address is www.golubcapitalbdc.com. We make available, free of charge, on our website our proxy statement, annual report on Form 10-K, quarterly reports on Form 10-Q, current reports on Form 8-K and amendments to those reports as soon as reasonably practicable after we electronically file such material with, or furnish it to, the U.S. Securities and Exchange Commission, or SEC. Information contained on our website is not incorporated by reference into this annual report on Form 10-K and you should not consider information contained on our website to be part of this annual report on Form 10-K or any other report we file with the SEC.
The SEC also maintains a website that contains reports, proxy and information statements and other information we file with the SEC at www.sec.gov. Copies of these reports, proxy and information statements and other information may also be obtained, after paying a duplicating fee, by electronic request at publicinfo@sec.gov, or by writing the SEC’s Public Reference Section, 100 F Street, N.E., Washington, D.C. 20549-0102. You may also read and copy such reports, proxy and information statements at the SEC’s Public Reference Room. Information on the operation of the Public Reference Room may be obtained by calling the SEC at 1-800-SEC-0330.1-202-551-8090.
Our Adviser
Our investment activities are managed by our investment adviser, GC Advisors. GC Advisors is responsible for sourcing potential investments, conducting research and due diligence on prospective investments and equity sponsors, analyzing investment opportunities, structuring our investments and monitoring our investments and portfolio companies on an ongoing basis. GC Advisors was organized in September 2008 and is a registered investment adviser under the Investment Advisers Act of 1940, as amended, or the Advisers Act. Under our amended and restated investment advisory agreement, or the Investment Advisory Agreement, with GC Advisors, we pay GC Advisors a base management fee and an incentive fee for its services. See “Business — Management Agreements — Management Fee” for a discussion of the base management fee and incentive fee, including the cumulative income incentive fee and the income and capital gains incentive fee, payable by us to GC Advisors. Unlike most closed-end funds whose fees are based on assets net of leverage, our base management fee is based on our average-adjusted gross assets (including leverage but adjusted to exclude cash and cash equivalents so that investors do not pay the base management fee on such assets) and, therefore, GC Advisors benefits when we incur debt or use leverage. For purposes of the Investment Advisory Agreement, cash equivalents means U.S. government securities and commercial paper instruments maturing within 270 days of purchase. Additionally, under the incentive fee structure, GC Advisors benefits when capital gains are recognized and, because it determines when a holding is sold, GC Advisors controls the timing of the recognition of capital gains. Our board of directors is charged with protecting our interests by monitoring how GC Advisors addresses these and other conflicts of interest associated with its management services and compensation. While not expected to review or approve each borrowing, our independent directors periodically review GC Advisors’ services and fees as well as its portfolio management decisions and portfolio performance. In connection with these reviews, our independent directors consider whether our fees and expenses (including those related to leverage) remain appropriate. See “Business — Management Agreements — Board Approval of the Investment Advisory Agreement.”
GC Advisors is an affiliate of Golub Capital and pursuant to a staffing agreement, or the Staffing Agreement, Golub Capital LLC makes experienced investment professionals available to GC Advisors and provides access to the senior investment personnel of Golub Capital LLC and its affiliates. The Staffing Agreement provides GC Advisors with access to investment opportunities, which we refer to in the aggregate as deal flow, generated by Golub Capital LLC and its affiliates in the ordinary course of their businesses and commits the members of GC Advisors’ investment committee to serve in that capacity. As our investment adviser, GC Advisors is obligated to allocate investment opportunities among us and its other clients fairly and equitably over time in accordance with its allocation policy. See “Management’s Discussion and Analysis of Financial Condition and Results of Operations — Related Party Transactions.” However, there can be no assurance that such opportunities will be allocated to us fairly or equitably in the short-term or over time. GC Advisors seeks to capitalize on the significant deal origination, credit underwriting, due diligence, investment structuring, execution, portfolio management and monitoring experience of Golub Capital LLC’s investment professionals.
An affiliate of GC Advisors, the Administrator, provides the administrative services necessary for us to operate. See “Business — Management Agreements — Administration Agreement” for a discussion of the fees and expenses (subject to the review and approval of our independent directors) we are required to reimburse to the Administrator.
About Golub Capital
Golub Capital, founded in 1994, is a leading lender to middle-market companies, with a long track record of investing in senior secured, one stop, second lien and subordinated loans. As of September 30, 2016,2018, Golub Capital managedhad over $13.1$25.0 billion of invested or available capital for senior secured, one stop, second lien and subordinated loan investments in middle-market companies.under management. Since its inception, Golub Capital has closed deals with over 200250 middle-market sponsors and repeat transactions with over 130160 sponsors.
Golub Capital’s middle-market lending group is managed by a four-member senior management team consisting of Lawrence E. Golub, David B. Golub, Andrew H. Steuerman and Gregory W. Cashman. As of September 30, 2016,2018, Golub Capital’s more than 90100 investment professionals had an average of over 12 years of investment experience and were supported by more than 185250 administrative and back office personnel that focus on operations, finance, legal and compliance, accounting and reporting, marketing, information technology and office management.
Investment Criteria/Guidelines
Our investment objective is to generate current income and capital appreciation by investing primarily in one stop and other senior secured loans of U.S. middle market companies. We seek to generate strong risk-adjusted net returns by assembling a portfolio of investments across a broad range of industries and private equity investors.
We primarily target U.S. middle-market companies controlled by private equity investors that require capital for growth, acquisitions, recapitalizations, refinancings and leveraged buyouts. We may also make opportunistic loans to independently owned and publicly held middle-market companies. We seek to partner with strong management teams executing long-term growth strategies. Target businesses will typically exhibit some or all of the following characteristics:
annual EBITDA of $10.0less than $100.0 million to $75.0 million;annually;
sustainable leading positions in their respective markets;
scalable revenues and operating cash flow;
experienced management teams with successful track records;
stable, predictable cash flows with low technology and market risks;
a substantial equity cushion in the form of capital ranking junior to our investment;
low capital expenditures requirements;
a North American base of operations;
strong customer relationships;
products, services or distribution channels having distinctive competitive advantages;
defensible niche strategy or other barriers to entry; and
demonstrated growth strategies.
While we believe that the criteria listed above are important in identifying and investing in prospective portfolio companies, not all of these criteria will be met by each prospective portfolio company.
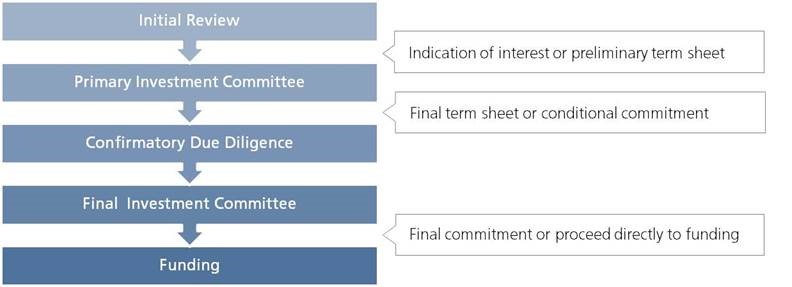
Investment Process Overview
We view our investment process as consisting of four distinct phases described below:
Origination. GC Advisors sources investment opportunities through access to a network of over 10,000 individual contacts developed in the financial services and related industries by Golub Capital and managed through a proprietary customer relationship database. Among these contacts is an extensive network of private equity firms and relationships with leading middle-market senior lenders. The senior deal professionals of Golub Capital supplement these leads through personal visits and marketing campaigns. It is their responsibility to identify specific opportunities, to refine opportunities through candid exploration of the underlying facts and circumstances and to apply creative and flexible thinking to solve clients’ financing needs. Golub Capital’s origination personnel are located in offices in Chicago, New York and San Francisco. Each originator maintains long-standing customer relationships and is responsible for covering a specified target market. We believe those originators’ strength and breadth of relationships across a wide range of markets generate numerous financing opportunities, which we believe enables GC Advisors to be highly selective in recommending investments to us.
Underwriting. We utilize the systematic, consistent approach to underwriting developed by Golub Capital, with a particular focus on determining the value of a business in a downside scenario. The key criteria that we consider include (1) strong and resilient underlying business fundamentals, (2) a substantial equity cushion in the form of capital ranking junior in right of payment to our investment and (3) a conclusion that overall “downside” risk is manageable. While the size of our equity cushion will vary over time and across industries, the equity cushion generally sought by GC Advisors today is between 35% and 45%50% of total portfolio capitalization. We generally focus on the criteria developed by Golub Capital for evaluating prospective portfolio companies, and we put more emphasis on credit considerations (such as (1) loan-to-value ratio (which is the amount of our loan divided by the enterprise value of the company in which we are investing), (2) the ability of the company to maintain a liquidity cushion through economic cycles and in downside scenarios, (3) the ability of the company to service its fixed
charge obligations under a variety of scenarios and (4) its anticipated strategic value in a downturn) than on profit potential and loan pricing. Our due diligence process for middle-market credits will typically entail:
a thorough review of historical and pro forma financial information;
on-site visits;
interviews with management and employees;
a review of loan documents and material contracts;
third-party “quality of earnings” accounting due diligence;
when appropriate, background checks on key managers and research relating to the company’s business, industry, markets, customers, suppliers, products and services and competitors; and
the commission of third-party market studies when appropriate.
The following chart illustrates the stages of Golub Capital’s evaluation and underwriting process:
ILLUSTRATIVE DEAL EVALUATION PROCESS
Execution. In executing transactions for us, GC Advisors utilizes the due diligence process developed by Golub Capital. Through a consistent approach to underwriting and careful attention to the details of execution, it seeks to close deals as fast or faster than competitive financing providers while maintaining discipline with respect to credit, pricing and structure to ensure the ultimate success of the financing. Upon completion of due diligence, the investment team working on an investment delivers a memorandum to GC Advisors’ investment committee. Once an investment has been approved by the investment committee, it moves through a series of steps towards negotiation of final documentation. Upon completion of final documentation, a loan is funded upon the execution of an investment committee memorandum by members of GC Advisors’ investment committee.
Monitoring. We view active portfolio monitoring as a vital part of our investment process. We consider board observation rights, where appropriate, regular dialogue with company management and sponsors and detailed, internally generated monitoring reports to be critical to our performance. Golub Capital has developed a monitoring template that is designed to reasonably ensure compliance with these standards. This template is used by GC Advisors as a tool to assess investment performance relative to our investment plan.
As part of the monitoring process, GC Advisors regularly assesses the risk profile of each of our investments and rates each of them based on an internal system developed by Golub Capital and its affiliates. This system is not generally accepted in our industry or used by our competitors. It is based on the following categories, which we refer to as GC Advisors’ internal performance rating:
|
| | |
| Internal Performance Ratings |
| Rating | | Definition |
| 5 | | Involves the least amount of risk in our portfolio. The borrower is performing above expectations, and the trends and risk factors are generally favorable. |
| 4 | | Involves an acceptable level of risk that is similar to the risk at the time of origination. The borrower is generally performing as expected, and the risk factors are neutral to favorable. |
| 3 | | Involves a borrower performing below expectations and indicates that the loan’s risk has increased somewhat since origination. The borrower may be out of compliance with debt covenants; however, loan payments are generally not past due. |
| 2 | | Involves a borrower performing materially below expectations and indicates that the loan’s risk has increased materially since origination. In addition to the borrower being generally out of compliance with debt covenants, loan payments may be past due (but generally not more than 180 days past due). |
| 1 | | Involves a borrower performing substantially below expectations and indicates that the loan’s risk has substantially increased since origination. Most or all of the debt covenants are out of compliance and payments are substantially delinquent. Loans rated 1 are not anticipated to be repaid in full and we will reduce the fair market value of the loan to the amount we anticipate will be recovered. |
Our internal performance ratings do not constitute any rating of investments by a nationally recognized statistical rating organization or represent or reflect any third-party assessment of any of our investments.
For any investment rated 1, 2 or 3, GC Advisors will increase its monitoring intensity and prepare regular updates for the investment committee, summarizing current operating results and material impending events and suggesting recommended actions.
GC Advisors monitors and, when appropriate, changes the internal performance ratings assigned to each investment in our portfolio. In connection with our valuation process, GC Advisors and our board of directors review these internal performance ratings on a quarterly basis.
The following table shows the distribution of our investments on the 1 to 5 internal performance rating scale at fair value as of September 30, 20162018 and 2015:2017:
| | | | | September 30, 2016 | | September 30, 2015 | | September 30, 2018 | | September 30, 2017 |
Internal Performance Rating | | Investments at Fair Value (In thousands) | | Percentage of Total Investments | | Investments at Fair Value (In thousands) | | Percentage of Total Investments | | | Investments at Fair Value (In thousands) | | Percentage of Total Investments | | Investments at Fair Value (In thousands) | | Percentage of Total Investments |
| 5 | | $ | 93,768 |
| | 5.7 | % | | $ | 134,142 |
| | 8.8 | % | | $ | 113,873 |
| | 6.4 | % | | $ | 91,525 |
| | 5.5 | % |
| 4 | | 1,380,274 |
| | 83.1 | | 1,298,558 |
| | 84.9 | | | 1,455,754 |
| | 81.6 |
| | 1,378,316 |
| | 81.8 |
|
| 3 | | 176,464 |
| | 10.6 | | 87,687 |
| | 5.7 | | | 195,414 |
| | 11.0 |
| | 212,629 |
| | 12.6 |
|
| 2 | | 9,950 |
| | 0.6 | | 9,397 |
| | 0.6 | | | 17,250 |
| | 1.0 |
| | 249 |
| | 0.0* |
|
| 1 | | 156 |
| | 0.0 | * | | — |
| | — | | | 550 |
| | 0.0* |
| | 2,296 |
| | 0.1 |
|
| Total | | $ | 1,660,612 |
| | 100.0 | % | | $ | 1,529,784 |
| | 100.0 | % | | $ | 1,782,841 |
| | 100.0 | % | | $ | 1,685,015 |
| | 100.0 | % |
|
| |
| * | Represents an amount less than 0.1%. |
Investment Committee
GC Advisors’ investment committee, which is comprised of officers of GC Advisors, evaluates and approves all of our investments, subject to the oversight of our board of directors. The investment committee process is intended to bring the diverse experience and perspectives of the committee’s members to the analysis and consideration of each investment. The investment committee currently consists of Lawrence E. Golub, David B. Golub, Andrew H. Steuerman and Gregory W. Cashman. The investment committee serves to provide investment consistency and adherence to our core investment philosophy and policies. The investment committee also determines appropriate investment sizing and suggests ongoing monitoring requirements.
In addition to reviewing investments, investment committee meetings serve as a forum to discuss credit views and outlooks. Potential transactions and deal flow are reviewed on a regular basis. Members of the investment team
are encouraged to share information and credit views with the investment committee early in their analysis. We believe this process improves the quality of the analysis and assists the deal team members to work more efficiently.
Each transaction is presented to the investment committee in a formal written report. All of our new investments must be approved by a consensus of the investment committee. Each member of the investment committee performs a similar role for other investment funds, accounts or other investment vehicles, collectively referred to as accounts, sponsored or managed by Golub Capital and its affiliates.
Investment Structure
Once we have determined that a prospective portfolio company is suitable for investment, we work with the management of that company and its other capital providers to structure an investment. We negotiate among these parties to agree on how our investment is expected to perform relative to the other capital in the portfolio company’s capital structure.
We structure our investments, which typically have maturities of three to seven years as described below. Our loans typically provide for moderate loan amortization in the early years of the loan, with the majority of the amortization deferred until loan maturity, and there is a risk of loss if the borrower is unable to pay the lump sum or refinance the amount at maturity.
Senior Secured Loans. When we structure investments in senior secured loans, we obtain security interests in the assets of the portfolio company that serve as collateral in support of the repayment of such loans. This collateral may take the form of first-priority liens on the assets of the portfolio company borrower.
One Stop Loans. We structure our one stop loans as senior secured loans. We obtain security interests in the assets of the portfolio company that serve as collateral in support of the repayment of these loans. This collateral may take the form of first-priority liens on the assets of the portfolio company. In many cases, we are the sole lender, or we together with our affiliates are
the sole lenders, of one stop loans, which can afford us additional influence over the borrower in terms of monitoring and, if necessary, remediation in the event of underperformance.
One stop loans include loans to technology companies undergoing strong growth due to new services, increased adoption and/or entry into new markets. We refer to loans to these companies as late stage lending loans. Other targeted characteristics of late stage lending businesses include strong customer revenue retention rates, a diversified customer base and backing from growth equity or venture capital firms. In some cases, the borrower’s high revenue growth is supported by a high level of discretionary spending. As part of the underwriting of such loans and consistent with industry practice, we may adjust our characterization of the earnings of such borrowers for a reduction or elimination of such discretionary expenses, if appropriate.
Second Lien Loans. We structure these investments as junior, secured loans. We obtain security interests in the assets of the portfolio company that serve as collateral in support of the repayment of such loans. This collateral may take the form of second priority liens on the assets of a portfolio company.
Subordinated Loans. We structure these investments as unsecured, subordinated loans that provide for relatively high, fixed interest rates that provide us with significant current interest income. Subordinated loans rank senior only to a borrower’s equity securities and rank junior to all of such borrower’s other indebtedness in priority of payment. These loans typically have interest-only payments (often representing a combination of cash pay and payment-in-kind, or PIK, interest) in the early years. Subordinated loan investments are generally more volatile than secured loans and may involve a greater risk of loss of principal. In addition, the PIK feature of many subordinated loans, which effectively operates as negative amortization of loan principal, increases credit risk exposure over the life of the loan.
Subordinated loan investments are generally more volatile than secured loans and may involve a greater risk of loss of principal. In addition, the PIK feature of many subordinated loans, which effectively operates as negative amortization of loan principal, increases credit risk exposure over the life of the loan.
Warrants and Minority Equity Securities. In some cases, we may purchase minority equity interests or receive nominally priced warrants or options to buy a minority equity interest in the portfolio company in connection with a loan, which can allow us to achieve additional investment return from this equity interest. We may structure such warrants to include provisions protecting our rights as a minority-interest holder, as well as a “put,” or right to sell such securities back to the issuer, upon the occurrence of specified events.
Senior Loan Fund. We have invested in SLF, which as of September 30, 2016,2018, consisted of a portfolio of loans to 62 different borrowers in industries similar to the companies in our portfolio. SLF invests primarily in senior secured loans of middle market companies, which debt securities that are expected to be secured by a first lien on some or all of the issuer’s assets, including traditional senior debt and any related revolving or similar credit facility, in generally the same manner as our senior secured and one stop loans. SLF may also invest in more liquid senior secured loans.
We tailor the terms of each investment to the facts and circumstances of the transaction and the prospective portfolio company, negotiating a structure that protects our rights and manages our risk while creating incentives for the portfolio company to achieve its business plan and improve its operating results. We seek to limit the downside potential of our investments by:
selecting investments that we believe have a very low probability of loss;
requiring a total return on our investments that we believe will compensate us appropriately for credit risk; and
negotiating covenants in connection with our investments that afford our portfolio companies as much flexibility in managing their businesses as possible, consistent with the preservation of our capital. Such restrictions may include affirmative and negative covenants, default penalties, lien protection, change of control provisions and board rights.
We expect to hold most of our investments to maturity or repayment, but we may sell some of our investments earlier if a liquidity event occurs, such as a sale, recapitalization or worsening of the credit quality of the portfolio company.
Investments
We seek to create a portfolio that includes primarily one stop and other senior secured and one stop loans by investing approximately $5.0 million to $30.0 million of capital, on average, in the securities of middle-market companies. Set forth below is a list of our ten largest portfolio company investments as of September 30, 2016,2018, as well as the top ten industries in which we were invested as of September 30, 2016,2018, in each case excluding SLF, calculated as a percentage of our total investments as of such date.
|
| | | | | | | |
| Portfolio Company | | Fair Value of Investments (In thousands) | | Percentage of Total Investments |
| Atkins Nutritionals, Inc | | $ | 41,138 |
| | 2.5 | % |
| Market Track, LLC | | 36,115 |
| | 2.2 |
|
| DCA Investment Holding, LLC | | 34,998 |
| | 2.1 |
|
| Vetcor Professional Practices LLC | | 32,243 |
| | 1.9 |
|
| First Watch Restaurants, Inc. | | 31,424 |
| | 1.9 |
|
| Accellos, Inc. | | 31,051 |
| | 1.9 |
|
| Certara L.P. | | 30,329 |
| | 1.8 |
|
| Integration Appliance, Inc. | | 30,152 |
| | 1.8 |
|
| Chase Industries, Inc. | | 28,186 |
| | 1.7 |
|
| NTS Technical Systems | | 26,746 |
| | 1.6 |
|
| | | $ | 322,382 |
| | 19.4 | % |
|
| | | | | | |
| Portfolio Company | Investments at
Fair Value
(In thousands) | | Percentage of Total Investments |
| Transaction Data Systems, Inc. | $ | 39,066 |
| | 2.2 | % |
| Diligent Corporation | 38,848 |
| | 2.2 |
|
| MRI Software LLC | 38,474 |
| | 2.2 |
|
| Massage Envy, LLC | 36,735 |
| | 2.1 |
|
| Appriss Holdings, Inc. | 36,005 |
| | 2.0 |
|
| DCA Investment Holding, LLC | 35,783 |
| | 2.0 |
|
| Captive Resources Midco, LLC | 34,706 |
| | 1.9 |
|
| Integration Appliance, Inc. | 34,406 |
| | 1.9 |
|
| eSolutions, Inc. | 31,483 |
| | 1.8 |
|
| Vendavo, Inc. | 30,268 |
| | 1.7 |
|
| | $ | 355,774 |
| | 20.0 | % |
| | | Industry | | Fair Value of Investments (In thousands) | | Percentage of Total Investments | Investments at
Fair Value
(In thousands) | | Percentage of Total Investments |
| Diversified/Conglomerate Service | | $ | 466,037 |
| | 26.1 | % |
| Healthcare, Education and Childcare | | $ | 327,287 |
| | 19.7 | % | 333,736 |
| | 18.7 |
|
| Diversified/Conglomerate Service | | 274,198 |
| | 16.5 |
| |
| Electronics | | 146,319 |
| | 8.8 |
| 130,472 |
| | 7.3 |
|
| Retail Stores | | 112,738 |
| | 6.3 |
|
| Beverage, Food and Tobacco | | 145,658 |
| | 8.8 |
| 99,608 |
| | 5.6 |
|
| Retail Stores | | 137,940 |
| | 8.3 |
| |
| Diversified/Conglomerate Manufacturing | | 84,306 |
| | 5.1 |
| 96,663 |
| | 5.4 |
|
| Personal, Food and Miscellaneous Services | | 66,198 |
| | 4.0 |
| |
| Leisure, Amusement, Motion Pictures, Entertainment | | 81,907 |
| | 4.6 |
|
| Personal and Non Durable Consumer Products (Mfg. Only) | | 69,912 |
| | 3.9 |
|
| Buildings and Real Estate | | 65,255 |
| | 3.7 |
|
| Aerospace and Defense | | 59,120 |
| | 3.6 |
| 47,891 |
| | 2.7 |
|
| Leisure, Amusement, Motion Pictures, Entertainment | | 51,397 |
| | 3.1 |
| |
| Printing and Publishing | | 46,814 |
| | 2.8 |
| |
| | | $ | 1,339,237 |
| | 80.7 | % | $ | 1,504,219 |
| | 84.3 | % |
Managerial Assistance
As a business development company, we offer, and must provide upon request, managerial assistance to our portfolio companies. This assistance would involve an arrangement to provide significant guidance and counsel concerning the management, operations or business objectives and policies of the portfolio company. The Administrator or an affiliate of the Administrator provides such managerial assistance on our behalf to portfolio companies that request this assistance. We may receive fees for these services and reimburse the Administrator or an affiliate of the Administrator, as applicable, for its allocated costs in providing such assistance, subject to the review and approval by our board of directors, including our independent directors.
Competition
Our primary competitors in providing financing to middle-market companies include public and private funds, other business development companies, commercial and investment banks, commercial financing companies and, to the extent they provide an alternative form of financing, private equity and hedge funds. Many of our competitors are substantially larger and have considerably greater financial, technical and marketing resources than we do. For example, we believe some competitors may have access to funding sources that are not available to us. In addition, some of our competitors may have higher risk tolerances or different risk assessments, which could allow them to consider a wider variety of investments and establish more
relationships than us. Furthermore, many of our competitors are not subject to the regulatory restrictions that the 1940 Act imposes on us as a business development company or to the source-of-income, asset diversification and distribution requirements we must satisfy to maintain our qualification as a RIC.
We use the expertise of the investment professionals of Golub Capital and its affiliates to which we have access to assess investment risks and determine appropriate pricing for our investments in portfolio companies. In addition, the relationships of the senior members of Golub Capital and its affiliates enable us to learn about, and compete effectively for, financing opportunities with attractive middle-market companies in the industries in which we invest. See “Risk Factors — Risks Relating to our Business and Structure — We operate in a highly competitive market for investment opportunities, which could reduce returns and result in losses.”
Administration
We do not have any direct employees, and our day-to-day investment operations are managed by GC Advisors. We have a chief executive officer, chief financial officer, chief compliance officer, managing director and director of corporate strategy, and to the extent necessary, our board of directors may elect to hire additional personnel going forward. Our officers are officers and/or employees of Golub Capital LLC, an affiliate of GC Advisors, and our allocable portion of the cost of our chief financial officer and chief compliance officer and their respective staffs is paid by us pursuant to the administration agreement, or the Administration Agreement, with the Administrator. See “Business - Management Agreements - Administration Agreement.”
MANAGEMENT AGREEMENTS
GC Advisors is located at 150 South Wacker Drive, Suite 800, Chicago, IL 60606.666 Fifth Avenue, 18th Floor, New York, NY 10103. GC Advisors is registered as an investment adviser under the Advisers Act. All of theThe beneficial interests in GC Advisors are majority owned, indirectly, by two affiliated trusts. The trustees of those trusts are David B. GolubStephen A. Kepniss and David L. Finegold. Subject to the overall supervision of our board of directors and in accordance with the 1940 Act, GC Advisors manages our day-to-day operations and provides investment advisory services to us. Under the terms of the Investment Advisory Agreement, GC Advisors:
determines the composition of our portfolio, the nature and timing of the changes to our portfolio and the manner of implementing such changes;
identifies, evaluates and negotiates the structure of the investments we make;
executes, closes, services and monitors the investments we make;
determines the securities and other assets that we purchase, retain or sell;
performs due diligence on prospective portfolio companies; and
provides us with such other investment advisory, research and related services as we may, from time to time, reasonably require for the investment of our funds.
GC Advisors’ services under the Investment Advisory Agreement are not exclusive. Subject to the requirements of the 1940 Act, GC Advisors may enter into one or more sub-advisory agreements under which GC Advisors may obtain assistance in fulfilling its responsibilities under the Investment Advisory Agreement.
Management Fee
Pursuant to the Investment Advisory Agreement, we pay GC Advisors a fee for investment advisory and management services consisting of two components — a base management fee and an incentive fee. The cost of both the base management fee and the incentive fee is ultimately borne by our stockholders.
The base management fee is calculated at an annual rate equal to 1.375% of our average adjusted gross assets at the end of the two most recently completed calendar quarters (excluding cash and cash equivalents but including assets purchased with borrowed funds and securitization-related assets)assets and cash collateral on deposit with custodian). Additionally, GC Advisors is voluntarily excluding assets funded with secured borrowing proceeds from the management fee. For services rendered under the Investment Advisory Agreement, the base management fee is payable quarterly in arrears. The base management fee is calculated based on the average value of our gross assets at the end of the two most recently completed calendar quarters, and appropriately adjusted for any share issuances or repurchases during a current calendar quarter. Base management fees for any partial month or quarter are appropriately pro-rated. For purposes of the Investment Advisory Agreement, cash equivalents means U.S. government securities and commercial paper instruments maturing within 270 days of purchase. To the extent that GC Advisors or any of its affiliates provides investment advisory, collateral management or other similar services to a subsidiary of ours, the base management fee shall be reduced by an amount equal to the product of (1) the total fees paid to GC Advisors by such subsidiary for such services and (2)
the percentage of such subsidiary’s total equity, including membership interests and any class of notes not exclusively held by one or more third parties, that is owned, directly or indirectly, by us.
We pay GC Advisors an incentive fee. We have structured the calculation of the incentive fee to include a fee limitation such that an incentive fee for any quarter can only be paid to GC Advisors if, after such payment, the cumulative incentive fees paid to GC Advisors since April 13, 2010, the effective date of our election to become a business development company, would be less than or equal to 20.0% of our Cumulative Pre-Incentive Fee Net Income (as defined below).
We accomplish this limitation by subjecting each quarterly incentive fee payable under the Income and Capital Gains Incentive Fee Calculation (as defined below) to a cap, or the Incentive Fee Cap. The Incentive Fee Cap in any quarter is equal to the difference between (a) 20.0% of Cumulative Pre-Incentive Fee Net Income and (b) cumulative incentive fees of any kind paid to GC Advisors by us since April 13, 2010. To the extent the Incentive Fee Cap is zero or a negative value in any quarter, no incentive fee would be payable in that quarter. “Cumulative Pre-Incentive Fee Net Income” is equal to the sum of (a) Pre-Incentive Fee Net Investment Income (as defined below) for each period since April 13, 2010 and (b) cumulative aggregate realized capital gains, cumulative aggregate realized
capital losses, cumulative aggregate unrealized capital depreciation and cumulative aggregate unrealized capital appreciation since April 13, 2010.
“Pre-Incentive Fee Net Investment Income” means interest income, dividend income and any other income (including any other fees such as commitment, origination, structuring, diligence and consulting fees or other fees that we receive from portfolio companies but excluding fees for providing managerial assistance) accrued during the calendar quarter, minus operating expenses for the calendar quarter (including the base management fee, taxes, any expenses payable under the Investment Advisory Agreement and the Administration Agreement, any expenses of securitizations and any interest expense and dividends paid on any outstanding preferred stock, but excluding the incentive fee). Pre-Incentive Fee Net Investment Income includes, in the case of investments with a deferred interest feature such as market discount, debt instruments with PIK interest, preferred stock with PIK dividends, and zero coupon securities, accrued income that we have not yet received in cash. GC Advisors does not return to us amounts paid to it on accrued income that we have not yet received in cash if such income is not ultimately received by us in cash. If we do not ultimately receive income, a loss would be recognized, reducing future fees.
Incentive fees are calculated as described below and payable quarterly in arrears (or, upon termination of the Investment Advisory Agreement, as of the termination date).
Income and Capital Gains Incentive Fee Calculation
The income and capital gains incentive fee calculation, or the Income and Capital Gains Incentive Fee Calculation, has two parts: the income component and the capital gains component. The income component is calculated quarterly in arrears based on our Pre-Incentive Fee Net Investment Income for the immediately preceding calendar quarter.
Pre-Incentive Fee Net Investment Income does not include any realized capital gains, realized capital losses or unrealized capital appreciation or depreciation. Because of the structure of the income component, it is possible that an incentive fee may be calculated under this formula with respect to a period in which we have incurred a loss. For example, if we receive Pre-Incentive Fee Net Investment Income in excess of the hurdle rate (as defined below) for a calendar quarter, the income component will result in a positive value and an incentive fee will be paid subject to the Incentive Fee Cap.
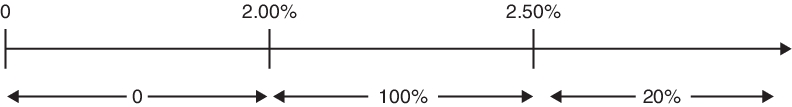
Pre-Incentive Fee Net Investment Income, expressed as a rate of return on the value of our net assets (defined as total assets less indebtedness and before taking into account any incentive fees payable during the period) at the end of the immediately preceding calendar quarter, is compared to a fixed “hurdle rate” of 2.0% quarterly. If market interest rates rise, we may be able to invest our funds in debt instruments that provide for a higher return, which would increase our Pre-Incentive Fee Net Investment Income and make it easier for GC Advisors to surpass the fixed hurdle rate and receive an incentive fee based on such net investment income. Our Pre-Incentive Fee Net Investment Income used to calculate this part of the incentive fee is also included in the amount of our total assets (excluding cash and cash equivalents but including assets purchased with borrowed funds and securitization-related assets and cash collateral on deposit with custodian)assets) used to calculate the 1.375% base management fee, which fee is payable on all of our assets managed by GC Advisors.
We calculate the income component of the Income and Capital Gains Incentive Fee Calculation with respect to our Pre-Incentive Fee Net Investment Income quarterly, in arrears, as follows:
zero in any calendar quarter in which the Pre-Incentive Fee Net Investment Income does not exceed the hurdle rate;
100.0% of our Pre-Incentive Fee Net Investment Income with respect to that portion of such Pre-Incentive Fee Net Investment Income, if any, that exceeds the hurdle rate but is less than 2.5% in any calendar quarter. We refer to this portion of our Pre-Incentive Fee Net Investment Income (which exceeds the hurdle rate but is less than 2.5%) as the “catch-up” provision. The catch-up is meant to provide GC Advisors with 20.0% of the Pre-Incentive Fee Net Investment Income as if a hurdle rate did not apply if this net investment income exceeds 2.5% in any calendar quarter; and
20.0% of the amount of our Pre-Incentive Fee Net Investment Income, if any, that exceeds 2.5% in any calendar quarter.
The sum of these calculations yields the “Income Incentive Fee”. This amount is appropriately adjusted for any share issuances or repurchases during the quarter.
The following is a graphical representation of the Income Incentive Fee calculation:
Quarterly Income Component of Income and Capital Gains Incentive Fee Calculation Based on Net Income
Pre-Incentive Fee Net Investment Income
(Expressed as a Percentage of the Value of Net Assets)
Percentage of Pre-Incentive Fee Net Investment Income Allocated to Income Component of Income and Capital Gains Incentive Fee Calculation
The second part of the Income and Capital Gains Incentive Fee Calculation, or the Capital Gain Incentive Fee, equals (a) 20.0% of our Capital Gain Incentive Fee Base (as defined below), if any, calculated in arrears as of the end of each calendar year (or upon termination of the Investment Advisory Agreement, as of the termination date), commencing with the calendar year ending December 31, 2010, less (b) the aggregate amount of any previously paid Capital Gain Incentive Fees. On August 5, 2014, we amended the Investment Advisory Agreement, effective as of June 30, 2014, to provide that the Capital Gain Incentive Fee Base is reduced by the amount of any unamortized deferred financing costs, if and to the degree that such costs exceed unrealized capital appreciation. Our “Capital Gain Incentive Fee Base” equals (1) the sum of (i) our realized capital gains, if any, on a cumulative positive basis from April 13, 2010 through the end of each calendar year, (ii) all realized capital losses on a cumulative basis and (iii) all unrealized capital depreciation on a cumulative basis less (2) all unamortized deferred financing costs, if and to the extent such costs exceed all unrealized capital appreciation on a cumulative basis.
The cumulative aggregate realized capital losses are calculated as the sum of the amounts by which (a) the net sales price of each investment in our portfolio when sold is less than (b) the accreted or amortized cost basis of such investment.
The cumulative aggregate realized capital gains are calculated as the sum of the differences, if positive, between (a) the net sales price of each investment in our portfolio when sold and (b) the accreted or amortized cost basis of such investment.
The aggregate unrealized capital depreciation is calculated as the sum of the differences, if negative, between (a) the valuation of each investment in our portfolio as of the applicable Capital Gain Incentive Fee calculation date and (b) the accreted or amortized cost basis of such investment.
The Capital Gain Incentive Fee payable as calculated under the Investment Advisory Agreement (as described above) for each of the years ended September 30, 2018, 2017 and 2016 2015was $2.3 million, $0.4 million and 2014 was $0. However, in accordance with U.S. generally accepted accounting principles, or GAAP, we are required to accrue for the Capital Gain Incentive Fee on a quarterly basis and are further required to include the aggregate unrealized capital appreciation on investments when calculating the capital gain incentive fee accrual, as if such unrealized capital appreciation were realized, even though such unrealized capital appreciation is not permitted to be considered in calculating the fee actually payable under the Investment Advisory Agreement. If the Capital Gain Incentive Fee Base, adjusted as required by GAAP to include unrealized appreciation, is positive at the end of a period, then GAAP requires us to accrue a capital gain incentive fee equal to 20% of such amount, less the aggregate amount of the actual Capital Gain Incentive Fees paid or capital gain incentive fees accrued under GAAP in all prior periods. If such amount is negative, then there is no accrual for such period. The resulting accrual under GAAP for any capital gain incentive fee payable in a given period may result in additional expense if such cumulative amount is greater than in the prior period or a reversal of previously recorded expense if such cumulative amount is less than in the prior period. There can be no assurance that such unrealized capital appreciation will be realized in the future. Since inception through September 30, 2016,Any payment due under the terms of the Investment Advisory Agreement is calculated in arrears at the end of each calendar year, and we have not made anypaid a $1.2 million Capital Gain Incentive Fee payments.calculated in accordance with the Investment Advisory Agreement as of December 31, 2017. We did not pay any capital gain incentive fee under the Investment Advisory Agreement for any period ended prior to December 31, 2017. For the years ended September 30, 2016, 20152018, 2017 and 2014,2016, we accrued a capital gainsgain incentive fee payable under GAAP of $1.2$1.5 million, $2.7$2.8 million, and $96,000,$1.2 million, respectively.
The sum of the Income Incentive Fee and the Capital Gain Incentive Fee is the “Incentive Fee”.
Cap on Fees
The Incentive Fee will not be paid at any time if, after such payment, the cumulative Incentive Fees paid to date would be greater than 20.0% of our Cumulative Pre-Incentive Fee Net Income since April 13, 2010. If, for any relevant period, the
Incentive Fee Cap calculation results in our paying less than the amount of the Incentive Fee calculated above, then the difference between the Incentive Fee and the Incentive Fee Cap will not be paid by us, and will not be received by GC Advisors as an Incentive Fee either at the end of such relevant period or at the end of any future period. For the avoidance of doubt, our stockholders benefit from a reduction in the amount of Incentive Fees that we pay, and that they pay indirectly, equal to the sum of the differences, if any, between the Incentive Fee and the Incentive Fee Cap.
Examples of Quarterly Incentive Fee Calculation
Example 1 — Income Related Portion of Incentive Fee(1):
Assumptions
Hurdle rate(2) = 2.00%
Management fee(3) = 0.344%
Other expenses (legal, accounting, custodian, transfer agent, etc.)(4) = 0.35%
| |
| (1) | The hypothetical amount of Pre-Incentive Fee Net Investment Income shown is based on a percentage of total net assets. In addition, the example assumes that during the most recent four full calendar quarter period ending on or prior to the date the payment set forth in the example is to be made, the sum of (a) our aggregate distributions to our stockholders and (b) our change in net assets (defined as total assets less indebtedness and before taking into account any incentive fees payable during the period) is at least 8.0% of our net assets at the beginning of such period (as adjusted for any share issuances or repurchases). |
| |
| (2) | Represents a quarter of the 8.0% annualized hurdle rate. |
| |
| (3) | Represents a quarter of the 1.375% annualized management fee. |
| |
| (4) | Excludes offering expenses. |
Alternative 1
Additional Assumptions
Investment income (including interest, dividends, fees, etc.) = 1.25%
Pre-Incentive Fee Net Investment Income (investment income – (management fee + other expenses)) = 0.556%
Pre-Incentive Fee Net Investment Income does not exceed the hurdle rate, therefore there is no Incentive Fee.
Alternative 2
Additional Assumptions
Investment income (including interest, dividends, fees, etc.) = 2.80%
Pre-Incentive Fee Net Investment Income (investment income – (management fee + other expenses)) = 2.106%
Pre-Incentive Fee Net Investment Income exceeds hurdle rate, therefore there is an Incentive Fee.
|
| | |
| Incentive Fee | = | 100% × “catch-up” + the greater of 0% AND (20% × (Pre-Incentive Fee Net Investment Income – 2.50%)) |
| | = | (100% × (2.106% – 2.00%)) + 0% |
| | = | 100% × 0.106% |
| | = | 0.106% |
Alternative 3
Additional Assumptions
Investment income (including interest, dividends, fees, etc.) = 3.50%
Pre-Incentive Fee Net Investment Income (investment income – (management fee + other expenses)) = 2.806%
Pre-Incentive Fee Net Investment Income exceeds hurdle rate, therefore there is an Incentive Fee.
|
| | |
| Incentive Fee | = | 100% × “catch-up” + the greater of 0% AND (20% × (Pre-Incentive Fee Net Investment Income – 2.50%)) |
| | = | (100% × (2.50% – 2.00%)) + (20% × (2.806% – 2.50%)) |
| | = | 0.50% + (20% × 0.306%) |
| | = | 0.50% + 0.061% |
| | = | 0.561% |
Example 2 — Capital Gain Incentive Fee:
Alternative 1:1
Assumptions
|
| | |
| | Year 1: | $20 million investment made in Company A (“Investment A”) and $30 million investment made in Company B (“Investment B”) |
| | Year 2: | Investment A is sold for $15 million and fair market value (“FMV”) of Investment B determined to be $29 million |
| | Year 3: | FMV of Investment B determined to be $27 million |
| | Year 4: | Investment B sold for $25 million |
The Capital Gain Incentive Fee, if any, would be:
|
| | |
| | Year 1: | None (No sales transactions) |
| | Year 2: | None (Sales transaction resulted in a realized capital loss on Investment A) |
| | Year 3: | None (No sales transactions) |
| | Year 4: | None (Sales transaction resulted in a realized capital loss on Investment B) |
Each quarterly incentive fee payable on the Income and Capital Gains Incentive Fee Calculation is subject to the Incentive Fee Cap. Below are the necessary adjustments to the Incentive Fee payable to adhere to the Incentive Fee Cap.
|
| | |
| | Year 1: | No adjustment; no realized capital losses or unrealized capital depreciation |
| | Year 2: | Investment A sold at a $5 million loss. Investment B has unrealized capital depreciation of $1 million. Therefore, GC Advisors would not be paid on the $6 million realized/unrealized loss which would result in a lower Incentive Fee by $1.2 million. |
| | Year 3: | Investment B has unrealized capital depreciation of $2 million. Therefore, GC Advisors would not be paid on the $2 million unrealized capital depreciation, which would result in a lower Incentive Fee by $400,000. |
| | Year 4: | Investment B sold at a $5 million loss. Investment B was previously marked down by $3 million; therefore, we would realize a $5 million loss on Investment B and reverse the previous $3 million in unrealized capital depreciation. The net effect would be a loss of $2 million. GC Advisors would not be paid on the $2 million loss which would result in a lower Incentive Fee by $400,000. |
Alternative 2
Assumptions
|
| | |
| | Year 1: | $20 million investment made in Company A (“Investment A”), $30 million investment made in Company B (“Investment B”) and $25 million investment made in Company C (“Investment C”) |
| | Year 2: | FMV of Investment A determined to be $18 million, FMV of Investment B determined to be $25 million and FMV of Investment C determined to be $25 million |
| | Year 3: | Investment A sold for $18 million. FMV of Investment B determined to be $24 million and FMV of Investment C determined to be $25 million. |
| | Year 4: | FMV of Investment B determined to be $22 million. Investment C sold for $24 million. |
| | Year 5: | Investment B sold for $20 million |
The Capital Gain Incentive Fee, if any, would be:
|
| | |
| | Year 1: | None (No sales transactions) |
| | Year 2: | None (No sales transactions) |
| | Year 3: | None (Sales transaction resulted in a realized capital loss on Investment A) |
| | Year 4: | None (Sales transaction resulted in a realized capital loss on Investment C) |
| | Year 5: | None (Sales transaction resulted in a realized capital loss on Investment B) |
Each quarterly Incentive Fee payable on the Income and Capital Gains Incentive Fee Calculation is subject to the Incentive Fee Cap. Below are the necessary adjustments to the Incentive Fee payable to adhere to the Incentive Fee Cap.
|
| | |
| | Year 1: | No adjustment; no realized capital losses or unrealized capital depreciation. |
| | Year 2: | Investment A has unrealized capital depreciation of $2 million. Investment B has unrealized capital depreciation of $5 million. Therefore, GC Advisors would not be paid on the $7 million unrealized capital depreciation which would result in a lower Incentive Fee by $1.4 million. |
| | Year 3: | Investment A sold at a $2 million loss. Investment A was previously marked down by $2 million; therefore, we would realize a $2 million loss on Investment A and reverse the previous $2 million in unrealized capital depreciation. Investment B has additional unrealized capital depreciation of $1 million. The net effect would be a loss of $1 million. GC Advisors would not be paid on the $1 million loss, which would result in a lower Incentive Fee by $200,000. |
| | Year 4: | Investment B has additional unrealized capital depreciation of $2 million. Investment C sold at a $1 million realized loss. Therefore, GC Advisors would not be paid on the $3 million realized/unrealized loss which would result in a lower Incentive Fee by $600,000. |
| | Year 5: | Investment B sold at a $10 million loss. Investment B was previously marked down by $8 million; therefore, we would realize a $10 million loss on Investment B and reverse the previous $8 million in unrealized capital depreciation. The net effect would be a loss of $2 million. GC Advisors would not be paid on the $2 million loss, which would result in a lower Incentive Fee by $400,000. |
Alternative 3
Assumptions
|
| | |
| | Year 1: | $25 million investment made in Company A (“Investment A”) and $20 million investment made in Company B (“Investment B”) |
| | Year 2: | Investment A is sold for $30 million, FMV of Investment B determined to be $21 million and $2 million of unamortized deferred financing costs |
| | Year 3: | FMV of Investment B determined to be $23 million and $1 million of unamortized deferred financing costs |
| | Year 4: | Investment B sold for $23 million and $0 of unamortized deferred financing costs |
The Capital Gain Incentive Fee, if any, would be:
|
| | |
| | Year 1: | None (No sales transactions) |
| | Year 2: | $800,000 (20% multiplied by (i) $5 million realized capital gains on sale of Investment A less (ii) $1 million unamortized deferred financing costs ($2 million of unamortized deferred financing costs less $1 million of unrealized gain)) |
| | Year 3: | $200,000 (20% multiplied by $5 million realized capital gains on sale of Investment A) less $800,000 (Capital GainsGain Incentive Fee paid in year 2) |
| | Year 4: | $600,000 (20% multiplied by $8 million realized capital gains on sale of Investment A and Investment B less Capital GainsGain Incentive Fee paid in years 2 and 3). |
Each quarterly Incentive Fee payable on the Income and Capital Gains Incentive Fee Calculation is subject to the Incentive Fee Cap. Below are the necessary adjustments to the Incentive Fee payable to adhere to the Incentive Fee Cap.
|
| | |
| | Year 1: | No adjustment necessary |
| | Year 2: | No adjustment necessary. GC Advisors would not be paid on the $1 million unrealized gain on Investment B. |
| | Year 3: | No adjustment necessary. GC Advisors would not be paid on the $3 million unrealized gain on Investment B. |
| | Year 4: | No adjustment necessary |
Payment of Our Expenses
All investment professionals of GC Advisors and/or its affiliates, when and to the extent engaged in providing investment advisory and management services to us, and the compensation and routine overhead expenses of personnel allocable to these services to us, are provided and paid for by GC Advisors and/or its affiliates and not by us. We bear all other out-of-pocket costs and expenses of our operations and transactions. See “Management’s Discussion and Analysis of Financial Condition and Results of Operations — Overview — Expenses.”
Duration and Termination
Unless terminated earlier as described below, the Investment Advisory Agreement will continue in effect from year to year if approved annually by our board of directors or by the affirmative vote of the holders of a majority of our outstanding voting securities, and, in either case, if also approved by a majority of our directors who are not “interested persons,” as that term is defined in the 1940 Act, of us or GC Advisors. The Investment Advisory Agreement automatically terminates in the event of its assignment, as defined in the 1940 Act, by GC Advisors and may be terminated by either party without penalty upon not less than 60 days’ written notice to the other. The holders of a majority of our outstanding voting securities, by vote, may also terminate the Investment Advisory Agreement without penalty. See “Risk Factors — Risks Relating to our Business and Structure — We are dependent upon GC Advisors for our future success and upon their access to the investment professionals and partners of Golub Capital and its affiliates.”
Indemnification
The Investment Advisory Agreement provides that, absent willful misfeasance, bad faith or gross negligence in the performance of its duties or by reason of the reckless disregard of its duties and obligations, GC Advisors and its officers, managers, partners, agents, employees, controlling persons, members and any other person or entity affiliated with it are entitled to indemnification from us for any damages, liabilities, costs and expenses (including reasonable attorneys’ fees and amounts reasonably paid in settlement) arising from the rendering of GC Advisors’ services under the Investment Advisory Agreement or otherwise as our investment adviser.
Board Approval of the Investment Advisory Agreement
At a meeting of our board of directors held in May 2016,2018, our board of directors voted unanimously to reapprove the Investment Advisory Agreement. In reaching a decision to approve the Investment Advisory Agreement, the board of directors reviewed a significant amount of information and considered, among other things:
the nature, extent and quality of services provided to us by GC Advisors;
the relative investment performance of us since April 1, 20152016 and since our inception;
the fees paid by other comparable business development companies; and
various other matters.
Based on the information reviewed and the considerations detailed above, our board of directors, including all of the directors who are not “interested persons,” as that term is defined in the 1940 Act, of us or GC Advisors, concluded that the investment advisory fee rates and terms are fair and reasonable in relation to the services provided and approved the renewal of the Investment Advisory Agreement for a one year term.
Administration Agreement
Pursuant to the Administration Agreement, the Administrator furnishes us with office facilities and equipment and provides clerical, bookkeeping, recordkeeping and other administrative services at such facilities. Under the Administration Agreement, the Administrator performs, or oversees the performance of, our required administrative services, which include being responsible for the financial records that we are required to maintain and preparing reports to our stockholders and reports filed with the SEC. In addition, the Administrator assists us in determining and publishing our net asset value, oversees the preparation and filing of our tax returns and the printing and dissemination of reports to our stockholders, and generally oversees the payment of our expenses and the performance of administrative and professional services rendered to us by others. The Administrator may retain third parties to assist in providing administrative services to us. To the extent that the Administrator outsources any of its functions, we pay the fees associated with such functions on a direct basis without profit to
the Administrator. We reimburse the Administrator for the allocable portion (subject to review and approval of our board of directors) of the Administrator’s overhead and other expenses incurred by it in performing its obligations under the Administration Agreement, including rent, the fees and expenses associated with performing compliance functions and our allocable portion of the cost of our chief financial officer and chief compliance officer and their respective staffs. Our board of directors reviews the expenses reimbursed to the Administrator, including any allocation of expenses among us and other entities for which the Administrator provides similar services, to determine that these expenses are reasonable and comparable to administrative services charged by unaffiliated third-party asset managers. In addition, if requested to provide managerial assistance to our portfolio companies, the Administrator is paid an additional amount based on the cost of the services provided, which shall not exceed the amount we receive from such portfolio companies for providing this assistance. In May 2016,2018, the Administration Agreement was renewed for a one-year term with the unanimous approval of our board of directors. The Administration Agreement may be terminated by either party without penalty upon 60 days’ written notice to the other party.
Indemnification
The Administration Agreement provides that, absent willful misfeasance, bad faith or negligence in the performance of its duties or by reason of the reckless disregard of its duties and obligations, the Administrator and its officers, managers, partners, agents, employees, controlling persons, members and any other person or entity affiliated with it are entitled to indemnification from us for any damages, liabilities, costs and expenses (including reasonable attorneys’ fees and amounts reasonably paid in settlement) arising from the rendering of the Administrator’s services under the Administration Agreement or otherwise as our administrator.
License Agreement
We have entered into a license agreement with Golub Capital LLC under which Golub Capital LLC has granted us a non-exclusive, royalty-free license to use the name “Golub Capital”. Under this agreement, we will have a right to use the “Golub Capital” name and the agreement will remain in effect for so long as GC Advisors or one of its affiliates remains our investment adviser. Other than with respect to this limited license, we will have no legal right to the “Golub Capital” name.
Staffing Agreement
We do not have any internal management capacity or employees. We depend on the diligence, skill and network of business contacts of the senior investment professionals of GC Advisors to achieve our investment objective. GC Advisors is an affiliate of Golub Capital LLC and depends upon access to the investment professionals and other resources of Golub Capital LLC and its affiliates to fulfill its obligations to us under the Investment Advisory Agreement. GC Advisors also depends upon Golub Capital LLC to obtain access to deal flow generated by the professionals of Golub Capital LLC and its affiliates. Under the Staffing Agreement, Golub Capital LLC provides GC Advisors with the resources necessary to fulfill these obligations. The Staffing Agreement provides that Golub Capital LLC will make available to GC Advisors experienced investment professionals and access to the senior investment personnel of Golub Capital LLC for purposes of evaluating, negotiating, structuring, closing and monitoring our investments. The Staffing Agreement also includes a commitment that the members of GC Advisors’ investment committee serve in such capacity. The Staffing Agreement remains in effect until terminated and may be terminated by either party without penalty upon 60 days’ written notice to the other party. Services under the Staffing Agreement are provided to GC Advisors on a direct cost reimbursement basis, and such fees are not our obligation.
REGULATION
General
We are a business development company under the 1940 Act and have elected to be treated as a RIC under the Code. The 1940 Act contains prohibitions and restrictions relating to transactions between business development companies and their affiliates (including any investment advisers), principal underwriters and affiliates of those affiliates or underwriters and requires that a majority of the directors of a business development company be persons other than “interested persons,” as that term is defined in the 1940 Act. In addition, the 1940 Act provides that we may not change the nature of our business so as to cease to be, or withdraw our election as, a business development company without the approval of a majority of our outstanding voting securities.
We may invest up to 100% of our assets in securities acquired directly from issuers in privately negotiated transactions. With respect to such securities, we may, for the purpose of public resale, be deemed an “underwriter,” as that term is defined in the Securities Act of 1933, as amended, or the Securities Act. Our intention is to not write (sell) or buy put or call options to manage risks associated with the publicly traded securities of our portfolio companies, except that we may enter into hedging transactions to manage the risks associated with interest rate fluctuations. However, we may purchase or otherwise receive warrants to purchase the common stock of our portfolio companies in connection with acquisition financing or other investments. Similarly, in connection with an acquisition, we may acquire rights to require the issuers of acquired securities or their affiliates to repurchase them under certain circumstances. We also do not intend to acquire securities issued by any investment company in excess of the limits imposed by the 1940 Act. With regard to that portion of our portfolio invested in securities issued by investment companies, it should be noted that such investments might subject our stockholders to additional
expenses. None of these policies, or any of our other policies, is fundamental and each may be changed without stockholder approval. To the extent we adopt any fundamental policies; no person from whom we borrow will have, in his or her capacity as lender or debt holder, either a veto power or a vote in approving or changing any of our fundamental policies.
Qualifying Assets
Under the 1940 Act, a business development company may not acquire any asset other than assets of the type listed in Section 55(a) of the 1940 Act, which are referred to as “qualifying assets,” unless, at the time the acquisition is made, qualifying assets represent at least 70% of the company’s total assets. The principal categories of qualifying assets relevant to our business are the following:
| |
| (1) | Securities purchased in transactions not involving any public offering from the issuer of such securities, which issuer (subject to certain limited exceptions) is an eligible portfolio company, or from any person who is, or has been during the preceding 13 months, an affiliated person of an eligible portfolio company, or from any other person, subject to such rules as may be prescribed by the SEC. An eligible portfolio company is defined in the 1940 Act as any issuer that: |
| |
| ◦ | is organized under the laws of, and has its principal place of business in, the United States; |
| |
| ◦ | is not an investment company (other than a small business investment company, or SBIC, wholly owned by the business development company) or a company that would be an investment company but for certain exclusions under the 1940 Act; and |
| |
| ◦ | satisfies either of the following: |
| |
| ▪ | does not have any class of securities listed on a national securities exchange or has any class of securities listed on a national securities exchange subject to a $250.0 million market capitalization maximum; or |
| |
| ▪ | is controlled by a business development company or a group of companies including a business development company, the business development company actually exercises a controlling influence over the management or policies of the eligible portfolio company, and, as a result, the business development company has an affiliated person who is a director of the eligible portfolio company. |
| |
| (2) | Securities of any eligible portfolio company which we control. |
| |
| (3) | Securities purchased in a private transaction from a U.S. issuer that is not an investment company or from an affiliated person of the issuer, or in transactions incident to such a private transaction, if the issuer is in bankruptcy and subject to reorganization or if the issuer, immediately prior to the purchase of its securities, was unable to meet its obligations as they came due without material assistance other than conventional lending or financing arrangements. |
| |
| (4) | Securities of an eligible portfolio company purchased from any person in a private transaction if there is no ready market for such securities and we already own 60% of the outstanding equity of the eligible portfolio company. |
| |
| (5) | Securities received in exchange for or distributed on or with respect to securities described above, or pursuant to the exercise of warrants or rights relating to such securities. |
| |
| (6) | Cash, cash equivalents, U.S. government securities or high-quality debt securities that mature in one year or less from the date of investment. |
The regulations defining and interpreting qualifying assets may change over time. We may adjust our investment focus as needed to comply with and/or take advantage of any regulatory, legislative, administrative or judicial actions in this area.
We look through our consolidated subsidiaries to the underlying holdings (considered together with portfolio assets held outside of our consolidated subsidiaries) for purposes of determining compliance with the 70% qualifying assets requirement of the 1940 Act. At least 70% of our assets will be eligible assets.
Managerial Assistance to Portfolio Companies
A business development company must have been organized and have its principal place of business in the United States and must be operated for the purpose of making investments in the types of securities described in (1), (2) or (3) above. However, in order to count portfolio securities as qualifying assets for the purpose of the 70% test, the business development company must either control the issuer of the securities or must offer to make available to the issuer of the securities significant managerial assistance; except that, when the business development company purchases such securities in conjunction with one or more other persons acting together, one of the other persons in the group may make available such managerial assistance. Making available significant managerial assistance means any arrangement whereby the business development company, through its directors, officers or employees, offers to provide, and, if accepted, does so provide, significant guidance and counsel concerning the management, operations or business objectives and policies of a portfolio company. The Administrator or an affiliate of the Administrator provides such managerial assistance on our behalf to portfolio companies that request this assistance.
Temporary Investments
Pending investment in other types of qualifying assets, as described above, our investments may consist of cash, cash equivalents, U.S. government securities, repurchase agreements and high-quality debt investments that mature in one year or less from the date of investment, which we refer to, collectively, as temporary investments, so that 70% of our assets are qualifying assets or temporary investments. Typically, we will invest in U.S. Treasury bills or in repurchase agreements, so long as the agreements are fully collateralized by cash or securities issued by the U.S. government or its agencies. A repurchase agreement involves the purchase by an investor, such as us, of a specified security and the simultaneous agreement by the seller to repurchase it at an agreed-upon future date and at a price that is greater than the purchase price by an amount that reflects an agreed-upon interest rate. There is no percentage restriction on the proportion of our assets that may be invested in such repurchase agreements. However, if more than 25% of our total assets constitute repurchase agreements from a single counterparty, we would generally not meet the Diversification Tests, as defineddiversification tests described in section 851(b)(3) of the Code in order to qualify as a RIC for U.S. federal income tax purposes. Accordingly, we do not intend to enter into repurchase agreements with a single counterparty in excess of this limit. GC Advisors will monitor the creditworthiness of the counterparties with which we enter into repurchase agreement transactions.
Senior Securities
We are permitted, under specified conditions, to issue multiple classes of indebtedness and one class of stock senior to our common stock if our asset coverage, as that term is defined in the 1940 Act, is at least equal to 200% immediately after each such issuance. The Small Business Credit Availability Act, or SBCAA, which was signed into law on March 23, 2018, among other things, amended Section 61(a) of the 1940 Act to add a new Section 61(a)(2) that reduces the asset coverage requirement applicable to business development companies from 200% to 150% so long as the business development company meets certain disclosure requirements and obtains certain approvals. The reduced asset coverage requirement would permit a business development company to have a ratio of total consolidated assets to outstanding indebtedness of 2:1 as compared to a maximum of 1:1 under the 200% asset coverage requirement. Effectiveness of the reduced asset coverage requirement to a business development company requires approval by either (1) a “required majority,” as defined in Section 57(o) of the 1940 Act, of such business development company’s board of directors with effectiveness one year after the date of such approval or (2) a majority of votes cast at a special or annual meeting of such business development company’s stockholders at which a quorum is present, which is effective the day after such stockholder approval. On November 27, 2018, our board of directors recommended that we seek stockholder approval to reduce our asset coverage requirement to 150% at our annual stockholder meeting scheduled for February 5, 2019. To the extent stockholder approval is received, we currently intend to target a GAAP debt-to-equity ratio of about 1.0x. In addition, while any senior securities remain outstanding, we must make provisions to prohibit any distribution to our stockholders or the repurchase of such securities or shares unless we meet the applicable asset coverage ratios at the time of the distribution or repurchase. We may also borrow amounts up to 5% of the value of our total assets for temporary or emergency purposes without regard to asset coverage.coverage, provided that any such borrowings in excess of 5% of the value of our total assets would be subject to the asset coverage ratio requirements of the 1940 Act, even if for temporary or emergency purposes. We consolidate our financial results with all of our wholly-owned subsidiaries, including Holdings, Funding, the 2010 Issuer and the 2014 Issuer, for financial reporting purposes and measure our compliance with the leverage test applicable to business development companies under the 1940 Act on a consolidated basis. On September 13, 2011, we received exemptive relief from the SEC to permit us to exclude the debt of our SBIC subsidiaries from our 200% asset coverage test under the 1940 Act. As such, our ratio of total consolidated assets to outstanding indebtedness may be less than 200%. even if we do not received stockholder approval to the modified asset coverage requirement permitted by Section 61(a)(2) of the 1940 Act. This provides us with increased investment flexibility but also increases our risks related to leverage.
For a discussion of the risks associated with leverage, see “Risk Factors — Risks Relating to our Business and Structure — Regulations governing our operation as a business development company affect our ability to, and the way in which we, raise additional capital. As a business development company, the necessity of raising additional capital exposes us to risks, including the typical risks associated with leverage.”
Codes of Ethics
We and GC Advisors have each adopted a code of ethics pursuant to Rule 17j-1 under the 1940 Act that establishes procedures for personal investments and restricts certain personal securities transactions. Personnel subject to each code may invest in securities for their personal investment accounts, including securities that may be purchased or held by us, so long as such investments are made in accordance with the code’s requirements. You may read and copy the code of ethics from our website at www.golubcapitalbdc.com, from the SEC’s website at www.sec.gov, or at the SEC’s Public Reference Room in Washington, D.C. See “Business — General — Information Available.” In addition, each code of ethics is attached as an exhibit to this annual report on Form 10-K.
Proxy Voting Policies and Procedures
We have delegated our proxy voting responsibility to GC Advisors. The proxy voting policies and procedures of GC Advisors are set out below. The guidelines are reviewed periodically by GC Advisors and our directors who are not “interested persons” and, accordingly, are subject to change.
Introduction
As an investment adviser registered under the Advisers Act, GC Advisors has a fiduciary duty to act solely in our best interests. As part of this duty, GC Advisors recognizes that it must vote our securities in a timely manner free of conflicts of interest and in our best interests.
GC Advisors’ policies and procedures for voting proxies for its investment advisory clients are intended to comply with Section 206 of, and Rule 206(4)-6 under, the Advisers Act.
Proxy Policies
GC Advisors votes proxies relating to our portfolio securities in what it perceives to be the best interest of our stockholders. GC Advisors reviews on a case-by-case basis each proposal submitted to a stockholder vote to determine its effect on the portfolio securities we hold. In most cases GC Advisors will vote in favor of proposals that GC Advisors believes are likely to
increase the value of the portfolio securities we hold. Although GC Advisors will generally vote against proposals that may have a negative effect on our portfolio securities, GC Advisors may vote for such a proposal if there exist compelling long-term reasons to do so.
Our proxy voting decisions are made by GC Advisors’ chief executive officer and president. To ensure that GC Advisors’ vote is not the product of a conflict of interest, GC Advisors requires that (1) anyone involved in the decision-making process disclose to its chief compliance officer any potential conflict that he or she is aware of and any contact that he or she has had with any interested party regarding a proxy vote and (2) employees involved in the decision-making process or vote administration are prohibited from revealing how GC Advisors intends to vote on a proposal in order to reduce any attempted influence from interested parties. Where conflicts of interest may be present, GC Advisors will disclose such conflicts to us, including our independent directors, and may request guidance from us on how to vote such proxies.
Proxy Voting Records
You may obtain information without charge about how GC Advisors voted proxies during the most recent 12-month period ended September 30, 20162018 by making a written request for proxy voting information to: Golub Capital BDC, Inc., Attention: Investor Relations, 150 South Wacker Drive, Suite 800, Chicago, IL 60606,666 Fifth Avenue, 18th Floor, New York, NY 10103, or by calling Golub Capital BDC, Inc. collect at (312) 205-5050.(212) 750-6060.
Privacy Principles
We are committed to maintaining the privacy of our stockholders and to safeguarding their nonpublic personal information. The following information is provided to help you understand what personal information we collect, how we protect that information and why, in certain cases, we may share information with select other parties.
Generally, we do not receive any nonpublic personal information relating to our stockholders, although certain nonpublic personal information of our stockholders may become available to us. We do not disclose any nonpublic personal information about our stockholders or former stockholders to anyone, except as permitted by law or as is necessary in order to service stockholder accounts (for example, to a transfer agent or third-party administrator).
We restrict access to nonpublic personal information about our stockholders to employees of GC Advisors and its affiliates with a legitimate business need for the information. We will maintain physical, electronic and procedural safeguards designed to protect the nonpublic personal information of our stockholders.
Other
Under the 1940 Act, we are required to provide and maintain a bond issued by a reputable fidelity insurance company to protect us against larceny and embezzlement. Furthermore, as a business development company, we are prohibited from protecting any director or officer against any liability to us or our stockholders arising from willful misfeasance, bad faith, gross negligence or reckless disregard of the duties involved in the conduct of such person’s office.
We and GC Advisors are required to adopt and implement written policies and procedures reasonably designed to prevent violation of relevant federal securities laws, review these policies and procedures annually for their adequacy and the effectiveness of their implementation, and designate a chief compliance officer to be responsible for administering these policies and procedures.
We may also be prohibited under the 1940 Act from knowingly participating in certain transactions with our affiliates without the prior approval of our board of directors who are not interested persons and, in some cases, prior approval by the SEC. The SEC has interpreted the business development company prohibition on transactions with affiliates to prohibit “joint transactions” among entities that share a common investment adviser. The staff of the SEC has granted no-action relief permittingpursuant to which purchases by us and other accounts sponsored or managed by GC Advisors or its affiliates of a single class of privately placed securities are permitted provided that the adviser negotiates no term other than price and certain other conditions are met. Any co-investment would be made subject to compliance with existing regulatory guidance, applicable regulations and our allocation procedures. If opportunities arise that would otherwise be appropriate for us and for another account sponsored or managed by GC Advisors to make different investments in the same issuer, GC Advisors will need to decide which account will proceed with the investment. Moreover, in certain circumstances, we may be unable to invest in an issuer in which another account sponsored or managed by GC Advisors has previously invested.
We andOn February 27, 2017, GC Advisors have submitted anand certain other funds and accounts sponsored or managed by GC Advisors and its affiliates, received exemptive application torelief from the SEC to permitthat permits us greater flexibility to negotiate the terms of co-investments if our board of directors determines that it would be advantageous for us to co-invest with other accounts sponsored or managed by GC Advisors or its affiliates in a manner consistent with our investment objectives, positions, policies, strategies and restrictions as well as regulatory requirements and other pertinent factors. We believe that co-investment by us and accounts sponsored or managed by the GC Advisors and its affiliates may afford us additional investment opportunities and the ability to achieve greater diversification.
Under the terms of thethis exemptive relief, requested by the exemptive application, a “required majority” (as defined in Section 57(o) of the 1940 Act) of our independent directors wouldis required to make certain conclusions in connection with a co-investment transaction, including that (1) the terms of the proposed transaction are reasonable and fair to us and our stockholders and do not involve overreaching of us or our stockholders on the part of any person concerned and (2) the transaction is consistent with the interests of our stockholders and is consistent with our investment strategies and policies. There is no assurance that our application for exemptive relief will be granted by the SEC or that, if granted, it will be on the terms set forth above.
Sarbanes-Oxley Act
The Sarbanes-Oxley Act of 2002, as amended, or the Sarbanes-Oxley Act, imposes a variety of regulatory requirements on companies with a class of securities registered under the Securities Exchange Act of 1934, as amended, or the Exchange Act, and their insiders. Many of these requirements affect us. For example:
our principal executive officer and principal financial officer must certify the accuracy of the financial statements contained in our periodic reports;
our periodic reports must disclose our conclusions about the effectiveness of our disclosure controls and procedures;
our management must prepare an annual report regarding its assessment of our internal control over financial reporting, which must be audited by our independent registered public accounting firm; and
our periodic reports must disclose whether there were significant changes in our internal controls over financial reporting or in other factors that could significantly affect these controls subsequent to the date of their evaluation, including any corrective actions with regard to significant deficiencies and material weaknesses.
The Sarbanes-Oxley Act requires us to review our current policies and procedures to determine whether we comply with the Sarbanes-Oxley Act and the regulations promulgated under such act. We will continue to monitor
our compliance with all regulations that are adopted under the Sarbanes-Oxley Act and will take actions necessary to ensure that we comply with that act.
Small Business Investment Company Regulations
We operate the SBIC Funds as wholly-owned subsidiaries of the Company. The SBIC Funds each may rely on an exclusion from the definition of “investment company” under the 1940 Act. As such, neithernone of these subsidiaries will elect to be regulated as a business development company under the 1940 Act.
The SBIC Funds each have investment objectives substantially similar to ours and make similar types of investments in accordance with SBIC regulations.
The licenses approved by the U.S. Small Business Administration, or SBA, for the SBIC Funds allow the SBIC Funds to incur leverage by issuing SBA-guaranteed debentures, subject to the issuance of a capital commitment and certain approvals by the SBA and customary procedures. SBA-guaranteed debentures carry long-term fixed rates that are generally lower than rates on comparable bank and other debt, have a maturity of ten years, require semi-annual payments of interest and do not require any principal prior to maturity. Under the regulations applicable to SBICs, an SBIC may have outstanding debentures guaranteed by the SBA generally in an amount of up to twice its regulatory capital, which generally equates to the amount of its equity capital. SBIC regulations currently limit the amount that a single SBIC subsidiary may borrow to a maximum of $150.0$175.0 million, assuming that it has at least $75.0$87.5 million of equity capital. The SBICs are subject to regulation and oversight by the SBA, including requirements with respect to maintaining certain minimum financial ratios and other covenants.
Under present SBIC regulations, the maximum amount of SBA-guaranteed debentures that may be issued by multiple licensees under common management is $350.0 million and the maximum amount that may be issued by a single SBIC licensee is $150.0$175.0 million. As of September 30, 2016,2018, GC SBIC IV, L.P., or SBIC IV, and GC SBIC V, L.P., or SBIC V, and GC SBIC VI, L.P., or SBIC VI, had $115.0 million, $150.0 million, and $127.0$50.0 million of outstanding SBA guaranteed debenture commitments, respectively. The original amount committed to SBIC IV by the SBA was $150.0 million. In March 2018 and September 2017, SBIC IV repaid $10.0 million and $25.0 million, respectively, of the aggregate principal amount of the SBA-guaranteed debentures respectively.outstanding at the time and $10.0 million and $25.0 million, respectively, of debenture commitments were terminated.
SBICs are designed to stimulate the flow of private equity capital to eligible small businesses. Under SBIC regulations, SBICs may make loans to eligible small businesses, invest in the equity securities of such businesses and provide them with consulting and advisory services.
Under present SBIC regulations, eligible small businesses generally include businesses that (together with their affiliates) have a tangible net worth not exceeding $19.5 million and have average annual net income after U.S. federal income taxes not exceeding $6.5 million (average net income to be computed without benefit of any carryover loss) for the two most recent fiscal years. In addition, an SBIC must devote 25% of its investment activity to “smaller” concerns, as defined by the SBA. A smaller concern generally includes businesses that have a tangible net worth not exceeding $6.0 million and have average annual net income after U.S. federal income taxes not exceeding $2.0 million (average net income to be computed without benefit of any net carryover loss) for the two most recent fiscal years. SBIC regulations also provide alternative size standard criteria to
determine eligibility for designation as an eligible small business or smaller concern, which criteria depend on the primary industry in which the business is engaged and are based on such factors as the number of employees and gross revenue. However, once an SBIC has invested in a company, it may continue to make follow on investments in the company, regardless of the size of the company at the time of the follow on investment, up to the time of the company’s initial public offering, if any.
The SBA prohibits an SBIC from providing funds to small businesses for certain purposes, such as relending or investing outside the United States, to businesses engaged in a few prohibited industries and to certain “passive” (i.e., non-operating) companies. In addition, without prior SBA approval, an SBIC may not invest an amount equal to more than approximately 30% of the SBIC’s regulatory capital in any one company and its affiliates.
The SBA places certain limitations on the financing terms of investments by SBICs in portfolio companies (such as limiting the permissible interest rate on debt securities held by an SBIC in a portfolio company). An SBIC may exercise control over a small business for a period of up to seven years from the date on which the SBIC initially acquires its control position. This control period may be extended for an additional period of time with the SBA’s prior written approval.
The SBA restricts the ability of an SBIC to lend money to any of its officers, directors and employees or to invest in affiliates thereof. The SBA also prohibits, without prior SBA approval, a “change of control” of an SBIC or transfers that would result in any person (or a group of persons acting in concert) owning 10% or more of a class of capital stock of a licensed SBIC. A “change of control” is any event which would result in the transfer of the power, direct or indirect, to direct the management and policies of a SBIC, whether through ownership, contractual arrangements or otherwise.
SBICs must invest idle funds that are not being used to make loans in investments permitted under SBIC regulations in certain types of securities including direct obligations of, or obligations guaranteed as to principal and interest by, the U.S. government, which mature within 15 months from the date of the investment.
SBICs are periodically examined and audited by the SBA’s staff to determine their compliance with SBIC regulations and are periodically required to file certain forms with the SBA.
Neither the SBA nor the U.S. government or any of its agencies or officers has approved any ownership interest to be issued by us or any obligation that we or any of our subsidiaries may incur.
Election to Be Taxed as a RIC
As a business development company, we have elected to be treated as a RIC under Subchapter M of the Code. As a RIC, we generally will not havebe subject to pay corporate-level U.S. federal income taxes on any net ordinary income or capital gains that we timely distribute as dividends for U.S. federal income tax purposes to our stockholders as dividends.stockholders. To qualify as a RIC, we must, among other things, meet certain source-of-income and asset diversification requirements (as described below). In addition, we must distribute to our stockholders, for each taxable year, dividends for U.S. federal income tax purposes of an amount at least equal to 90% of our “investment company taxable income,” which is generally our net ordinary income plus the excess of realized net short-term capital gains over realized net long-term capital losses and determined without regard to any deduction for dividends paid, or the Annual Distribution Requirement. Although not required for us to maintain our RIC tax status, in order to preclude the imposition of a 4% nondeductible federal excise tax imposed on RICs, we must distribute dividends for U.S. federal income tax purposes to our stockholders in respect of each calendar year dividends of an amount at least equal to the sum of (1) 98% of our net ordinary income (taking into account certain deferrals and elections) for the calendar year, (2) 98.2% of the excess (if any) of our realized capital gains over our realized capital losses, or capital gain net income (adjusted for certain ordinary losses), generally for the one-year period ending on October 31 of the calendar year and (3) the sum of any net ordinary income plus capital gains net income for preceding years that were not distributed during such years and on which we paid nodid not incur any liability to pay federal income tax, or the Excise Tax Avoidance Requirement.
Taxation as a RIC
If we:
qualify as a RIC; and
satisfy the Annual Distribution Requirement;
then we will not be subject to U.S. federal income tax on the portion of our investment company taxable income and net capital gain, defined as net long-term capital gains in excess of net short-term capital losses, we distribute as dividends for U.S. federal income tax purposes to our stockholders. We will be subject to U.S. federal income tax at regular corporate rates on any net income or net capital gain not distributed as dividends to our stockholders.
In order to qualify as a RIC for U.S. federal income tax purposes, we must, among other things:
qualify to be treated as a business development company under the 1940 Act at all times during each taxable year;
derive in each taxable year at least 90% of our gross income from dividends, interest, payments with respect to certain securities loans, gains from the sale of stock or other securities, or other income derived with respect to our business of investing in such stock or securities, and net income derived from interests in “qualified publicly traded partnerships” (partnerships that are traded on an established securities market or tradable on a secondary market, other than partnerships that derive 90% of their income from interest, dividends and other permitted RIC income), or the 90% Income Test; and
diversify our holdings, or the Diversification Tests, so that at the end of each quarter of the taxable year:
at least 50% of the value of our assets consists of cash, cash equivalents, U.S. government securities, securities of other RICs, and other securities if such other securities of any one issuer do not represent more than 5% of the value of our assets or more than 10% of the outstanding voting securities of the issuer; and
no more than 25% of the value of our assets is invested in the securities, other than U.S. government securities or securities of other RICs, of one issuer or of two or more issuers that are controlled, as determined under applicable tax rules, by us and that are engaged in the same or similar or related trades or businesses or in the securities of one or more qualified publicly traded partnerships.
We may invest in partnerships, including qualified publicly traded partnerships, which may result in our being subject to state, local or foreign income, franchise or other tax liabilities.
In addition, we are subject to ordinary income and capital gain distribution requirements under U.S. federal excise tax rules for each calendar year. If we do not meet the required distributions we will be subject to a 4% nondeductible federal excise tax on the undistributed amount. The failure to meet U.S. federal excise tax distribution requirements will not cause us to lose our RIC status.
A RIC is limited in its ability to deduct expenses in excess of its investment company taxable income. If our deductible expenses in a given taxable year exceed our investment company taxable income, we may incur a net operating loss for that taxable year. However, a RIC is not permitted to carry forward net operating losses to subsequent taxable years and such net operating losses do not pass through to its stockholders. In addition, deductible expenses can be used only to offset investment company taxable income, not net capital gain. A RIC may not use any net capital losses (that is, the excess of realized capital losses over realized capital gains) to offset its investment company taxable income, but may carry forward such net capital losses, and use them to offset future capital gains, indefinitely. Due to these limits on deductibility of expenses and net capital losses, we may for tax purposes have aggregate taxable income for several taxable years that we are required to distribute and that is taxable to our stockholders even if such taxable income is greater than the net income we actually earn during those taxable years. Furthermore, a portfolio company in which we hold equity or debt instruments may face financial difficulty that requires us to work out, modify, or otherwise restructure such equity or debt instruments. Any such restructuring could, depending upon the terms of the restructuring, cause us to incur unusable or nondeductible losses or recognize future non-cash taxable income. Any underwriting fees paid by us are not deductible.deductible in computing our investment company taxable income. We may be required to recognize taxable income in circumstances in which we do not receive cash. For example, if we hold debt obligationsinstruments that are treated under applicable tax rules as having original issue discount (such as debt instruments with PIK interest or, in certain cases, with increasing interest rates or issued with warrants), we must include in income each year a portion of the original issue discount that accrues over the life of the obligation, regardless of whether cash representing such income is received by us in the same taxable year. Because any original issue discount accrued will be included in our investment company taxable income for the taxable year of accrual, we may be required to make a distribution to our stockholders in order to satisfy the Annual Distribution Requirement, even though we will not have received any corresponding cash amount.
Certain of our investment practices may be subject to special and complex U.S. federal income tax provisions that may, among other things, (1) treat dividends that would otherwise constitute qualified dividend income as non-qualified dividend income, (2) treat dividends that would otherwise be eligible for the corporate dividends received deduction as ineligible for such treatment, (3) disallow, suspend or otherwise limit the allowance of certain losses or deductions, (4) convert lower-taxed long-term capital gain into higher-taxed short-term capital gain or ordinary income, (5) convert an ordinary loss or a deduction into a capital loss (the deductibility of which is more limited), (6) cause us to recognize income or gain without a corresponding receipt of cash, (7) adversely affect the time as to when a purchase or sale of stock or securities is deemed to occur, (8) adversely alter the characterization of certain complex financial transactions and (9) produce income that will not be qualifying income for purposes of the 90% Income Test. We intend to monitor our transactions and may make certain tax elections to mitigate the effect of these provisions and prevent our ability to be subject to tax as a RIC.
Gain or loss realized by us from warrants acquired by us as well as any loss attributable to the lapse of such warrants generally will be treated as capital gain or loss. Such gain or loss generally will be long term or short term, depending on how long we held a particular warrant.
Although we do not presently expect to do so, we are authorized to borrow funds and to sell assets in order to satisfy distribution requirements. However, under the 1940 Act, we are not permitted to make distributions to our
stockholders while our debt obligations and other senior securities are outstanding unless certain “asset coverage” tests are met. See “Business — Regulation — Senior Securities.” Moreover, our ability to dispose of assets to meet our distribution requirements may be limited by (1) the illiquid nature of our portfolio and/or (2) other requirements relating to our qualification as a RIC, including the Diversification Tests. If we dispose of assets in order to meet the Annual Distribution Requirement or the Excise Tax Avoidance Requirement, we may make such dispositions at times that, from an investment standpoint, are not advantageous.
Some of the income and fees that we may recognize, such as fees for providing managerial assistance, certain fees earned with respect to our investments, income recognized for in a work-out or restructuring of a portfolio investment, or income recognized from an equity investment in an operating partnership, will not satisfy the 90% Income Test. In order to ensuremanage the risk that such income and fees do notmight disqualify us as a RIC for a failure to satisfy the 90% Income Test, we may be required to recognize such income and fees indirectly through one or more entities treated as corporations for U.S. federal income tax purposes. Such
corporations will be requiredsubject to pay U.S. corporate income tax as well as state and local tax on their earnings, which ultimately will reduce our return on such income and fees.
Failure to Qualify as a RIC
If we were unable to qualify for treatment as a RIC and are unable to cure the failure, for example, by disposing of certain investments quickly or raising additional capital to prevent the loss of RIC status, we generally would be subject to tax on all of our taxable income at regular corporate rates. The Code provides some relief from RIC disqualification due to failures to comply with the 90% Income Test and the Diversification Tests, although there may be additional taxes due in such cases. We cannot assure you that we would qualify for any such relief should we fail the 90% Income Test or the Diversification Tests.
Should failure occur;occur, not only would all our taxable income be subject to tax at regular corporate rates, we would not be able to deduct dividend distributions to stockholders, nor would they be required to be made. Distributions, including distributions of net long-term capital gain, would generally be taxable to our stockholders as ordinary dividend income to the extent of our current and accumulated earnings and profits. Subject to certain limitations under the Code, certain corporate stockholders would be eligible to claim dividends received deduction with respect to such dividends and non-corporate stockholders would generally be able to treat such dividends as “qualified dividend income,” which is subject to reduced rates of U.S. federal income tax. Distributions in excess of our current and accumulated earnings and profits would be treated first as a return of capital to the extent of the stockholder’s tax basis, and any remaining distributions would be treated as a capital gain. If we fail to qualify as a RIC, we may be subject to regular corporate tax on any net built-in gains with respect to certain of our assets (i.e., the excess of the aggregate gains, including items of income, over aggregate losses that would have been realized with respect to such assets if we had been liquidated) that we elect to recognize on requalification or when recognized over the next five taxable years.
Item 1A. Risk Factors
You should carefully consider these risk factors, together with all of the other information included in this annual report on Form 10-K and the other reports and documents filed by us with the SEC. The risks set out below are not the only risks we face. Additional risks and uncertainties not presently known to us or not presently deemed material by us may also impair our operations and performance. If any of the following events occur, our business, financial condition, results of operations and cash flows could be materially and adversely affected. In such case, our net asset value and the trading price of our common stock could decline, and you may lose all or part of your investment. The risk factors described below are the principal risk factors associated with an investment in us as well as those factors generally associated with an investment company with investment objectives, investment policies, capital structure or trading markets similar to ours.
Risks Relating to Our Business and Structure
We are subject to risks associated with the current interest rate environment and to the extent we use debt to finance our investments, changes in interest rates will affect our cost of capital and net investment income.
Since the economic downturn that began in mid-2007, interest rates have remained low. Because longer-term inflationary pressure is likely to result from the U.S. government’s fiscal policies and challenges during this time, we will likely experience rising interest rates, rather than falling rates, at some point in the future and have begun to see modestexperienced increases to LIBOR.LIBOR in 2018.
To the extent we borrow money or issue debt securities or preferred stock to make investments, our net investment income will depend, in part, upon the difference between the rate at which we borrow funds or pay interest or dividends on such debt securities or preferred stock and the rate at which we invest these funds. In addition, many of our debt investments and borrowings have floating interest rates that reset on a periodic basis, and many of our investments are subject to interest rate floors. As a result, a change in market interest rates could have a material adverse effect on our net investment income, in particular with respect to increases from current levels to the level of the interest rate floors on certain investments. In periods of rising interest rates, our cost of funds will increase because the interest rates on the majority of amounts we have borrowed are floating, which could reduce our net investment income to the extent any debt investments have fixed interest rates, and the interest rate on investments with an interest rate floor will not increase until interest rates exceed the applicable floor. We may use interest rate risk management techniques in an effort to limit our exposure to interest rate fluctuations. Such techniques may include various interest rate hedging activities to the extent permitted by the 1940 Act and applicable commodities laws. These activities may limit our ability to participate in the benefits of lower interest rates with respect to the hedged borrowings. Adverse developments resulting from changes in interest rates or hedging transactions could have a material adverse effect on our business, financial condition and results of operations.
You should also be aware that a rise in the general level of interest rates typically will lead to higher interest rates applicable to our debt investments, which may result in an increase of the amount of incentive fees payable to GC Advisors. Also, an increase in interest rates available to investors could make an investment in our common stock less attractive if we are not able to increase our distribution rate, which could reduce the value of our common stock.
In July 2017, the head of the United Kingdom Financial Conduct Authority announced the desire to phase out the use of LIBOR by the end of 2021. There is currently no definitive information regarding the future utilization of LIBOR or of any particular replacement rate. As such, the potential effect of any such event on our cost of capital and net investment income cannot yet be determined. In addition, any further changes or reforms to the determination or supervision of LIBOR may result in a sudden or prolonged increase or decrease in reported LIBOR, which could have an adverse impact on the market value for or value of any LIBOR-linked securities, loans, and other financial obligations or extensions of credit held by or due to us and could have a material adverse effect on our business, financial condition and results of operations.
Global capital markets could enter a period of severe disruption and instability. These conditions have historically affected and could again materially and adversely affect debt and equity capital markets in the United States and around the world and our business.
The U.S. and global capital markets experiencedhave in the past and may in the future experience periods of extreme volatility and disruption during the economic downturn that began in mid-2007,downturns and the U.S. economy was in a recession for several consecutive calendar quarters during the same period. In 2010, a financial crisis emerged in Europe, triggered by highrecessions. Increases to budget deficits and risingor direct and
contingent sovereign debt, which createdmay create concerns about the ability of certain nations to continue to service their sovereign debt obligations. Risksobligations, and risks resulting from such debt crisis and any futuresuch debt crisis in Europe, the United States or any similar crisis elsewhere could have a detrimental impact on the global economic recovery,economy, sovereign and non-sovereign debt in certain countries and the financial condition of financial institutions generally. In July and August 2015, Greece reached agreements with its creditors for bailoutsAusterity measures that provide aid in exchange for certain austerity measures. These and similar austerity measurescountries may agree to as part of any debt crisis or disruptions to major financial trading markets may adversely affect world economic conditions and have an adverse impact on our business and that of our portfolio companies. In the second quarter of 2015, stock prices in China experienced a significant drop, resulting primarily from continued sell-off of shares trading in Chinese markets. In August 2015, Chinese authorities sharply devalued China's currency. In June 2016, the United Kingdom held a referendum in which voters approved an exit from the European Union, and the implications of the United Kingdom’s pending withdrawal from the European Union are unclear at present. In November 2016, votersMarket and economic disruptions, which may be caused by political trends and government actions in the United States elected a new presidentor elsewhere, have in the past and the implications of a new presidential administration are unclear at present. These market and economic disruptions affected, and these and other similar market and economic disruptions may in the future affect, the U.S. capital markets, which could adversely affect our business and that of our portfolio companies and the broader financial and credit markets and have reducedreduce the availability of debt and equity capital for the market as a whole and to financial firms, in particular. At various times, thesesuch disruptions have resulted in, and may in the future result, a lack of liquidity in parts of the debt capital markets, significant write-offs
in the financial services sector and the repricing of credit risk. TheseSuch conditions may reoccuroccur for a prolonged period of time again orand may materially worsen in the future, including as a result of U.S. government shutdowns or further downgrades to the U.S. government’s sovereign credit rating or the perceived credit worthiness of the United States or other large global economies. Unfavorable economic conditions, including future recessions, also could increase our funding costs, limit our access to the capital markets or result in a decision by lenders not to extend credit to us. We may in the future have difficulty accessing debt and equity capital on attractive terms, or at all, and a severe disruption and instability in the global financial markets or deteriorations in credit and financing conditions may cause us to reduce the volume of loans we originate and/or fund, adversely affect the value of our portfolio investments or otherwise have a material adverse effect on our business, financial condition, results of operations and cash flows.
We are dependent upon GC Advisors for our success and upon their access to the investment professionals and partners of Golub Capital and its affiliates.
We do not have any internal management capacity or employees. We depend on the diligence, skill and network of business contacts of the senior investment professionals of GC Advisors to achieve our investment objective. GC Advisors’ investment committee, which consists of two members of our board of directors and two additional employees of Golub Capital LLC, provides oversight over our investment activities. We also cannot assure you that we will replicate the historical results achieved for other Golub Capital funds by members of the investment committee, and we caution you that our investment returns could be substantially lower than the returns achieved by them in prior periods. We expect that GC Advisors will evaluate, negotiate, structure, close and monitor our investments in accordance with the terms of the Investment Advisory Agreement. We can offer no assurance, however, that the senior investment professionals of GC Advisors will continue to provide investment advice to us. If these individuals do not maintain their existing relationships with Golub Capital LLC and its affiliates and do not develop new relationships with other sources of investment opportunities, we may not be able to identify appropriate replacements or grow our investment portfolio. The loss of any member of GC Advisors’ investment committee or of other senior investment professionals of GC Advisors and its affiliates would limit our ability to achieve our investment objective and operate as we anticipate. This could have a material adverse effect on our financial condition, results of operations and cash flows.
The Staffing Agreement provides that Golub Capital LLC makes available to GC Advisors experienced investment professionals and provides access to the senior investment personnel of Golub Capital LLC for purposes of evaluating, negotiating, structuring, closing and monitoring our investments. We are not a party to the Staffing Agreement and cannot assure you that Golub Capital LLC will fulfill its obligations under the agreement. If Golub Capital LLC fails to perform, we cannot assure you that GC Advisors will enforce the Staffing Agreement, that such agreement will not be terminated by either party or that we will continue to have access to the investment professionals of Golub Capital LLC and its affiliates or their information and deal flow.
Our business model depends to a significant extent upon strong referral relationships with sponsors. Any inability of GC Advisors to maintain or develop these relationships, or the failure of these relationships to generate investment opportunities, could adversely affect our business.
We depend upon Golub Capital LLC’s relationships with sponsors, and we intend to rely to a significant extent upon these relationships to provide us with potential investment opportunities. If Golub Capital LLC fails to maintain such relationships, or to develop new relationships with other sponsors or sources of investment opportunities, we will not be able to grow our investment portfolio. In addition, individuals with whom the
principals of Golub Capital LLC have relationships are not obligated to provide us with investment opportunities, and, therefore, we can offer no assurance that these relationships will generate investment opportunities for us in the future.
Our financial condition, results of operations and cash flows depend on our ability to manage our business effectively.
Our ability to achieve our investment objective depends on our ability to manage our business and to grow. This depends, in turn, on GC Advisors’ ability to identify, invest in and monitor companies that meet our investment criteria. The achievement of our investment objectives on a cost-effective basis depends upon GC Advisors’ execution of our investment process, its ability to provide competent, attentive and efficient services to us and, to a lesser extent, our access to financing on acceptable terms. GC Advisors has substantial responsibilities under the Investment Advisory Agreement, as well as responsibilities in connection with the management of other accounts sponsored or managed by GC Advisors, members of GC Advisors’ investment committee or Golub Capital LLC and its affiliates. The personnel of the Administrator and its affiliates may be called upon to provide managerial assistance to our portfolio companies. These activities may distract them or slow our rate of investment. Any failure to manage our business and our future growth effectively could have a material adverse effect on our business, financial condition, results of operations and cash flows.
There are significant potential conflicts of interest that could affect our investment returns.
As a result of our arrangements with GC Advisors and its affiliates and GC Advisors’ investment committee, there may be times when GC Advisors or such persons have interests that differ from those of our securityholders, giving rise to a conflict of interest.
Conflicts related to obligations GC Advisors’ investment committee, GC Advisors or its affiliates have to other clients and conflicts related to fees and expenses of such other clients.
The members of GC Advisors’ investment committee serve or may serve as officers, directors or principals of entities that operate in the same or a related line of business as we do or of accounts sponsored or managed by GC Advisors or its affiliates. Currently, our officers and directors also serve as officers and directors of Golub Capital Investment Corporation, or GCIC, and Golub Capital BDC 3, Inc., or GBDC 3, each a closed-end, non-diversified management investment company that has also elected to be regulated as a business development company under the 1940 Act. Similarly, GC Advisors or its affiliates currently manage and may have other clients with similar or competing investment objectives. In serving in these multiple capacities, they may have obligations to other clients or investors in those entities, the fulfillment of which may not be in the best interests of us or our stockholders. For example, Lawrence E. Golub and David B. Golub have management responsibilities for other accounts managed or sponsored by GC Advisors or its affiliates, including GCIC.GCIC and GBDC 3. Our investment objective may overlap with the investment objectives of such affiliated accounts. For example, GC Advisors currently manages GCIC, GBDC 3 and several private funds, that are pursuing an investment strategy similar to ours, some of which may seek additional capital from time to time, that are pursuing an investment strategy similar to ours, and we may compete with these and other accounts sponsored or managed by GC Advisors and its affiliates for capital and investment opportunities. As a result, those individuals may face conflicts in the allocation of investment opportunities among us and other accounts advised by or affiliated with GC Advisors. Certain of these accounts may provide for higher management or incentive fees, greater expense reimbursements or overhead allocations, or permit GC Advisors and its affiliates to receive higher origination and other transaction fees, all of which may contribute to this conflict of interest and create an incentive for GC Advisors to favor such other accounts. For example, the 1940 Act restricts GC Advisors from receiving more than a 1% fee in connection with loans that we acquire, or originate, a limitation that does not exist for certain other accounts. GC Advisors seeks to allocate investment opportunities among eligible accounts in a manner that is fair and equitable over time and consistent with its allocation policy. However, we can offer no assurance that such opportunities will be allocated to us fairly or equitably in the short-term or over time, and there can be no assurance that we will be able to participate in all investment opportunities that are suitable to us.
GC Advisors’ investment committee, GC Advisors or its affiliates may, from time to time, possess material non-public information, limiting our investment discretion.
Principals of GC Advisors and its affiliates and members of GC Advisors’ investment committee may serve as directors of, or in a similar capacity with, companies in which we invest, the securities of which are purchased or sold on our behalf. In the event that material nonpublic information is obtained with respect to such companies, or we become subject to trading restrictions under the internal trading policies of those companies or as a result of
applicable law or regulations, we could be prohibited for a period of time from purchasing or selling the securities of such companies, and this prohibition may have an adverse effect on us.
Our management and incentive fee structure may create incentives for GC Advisors that are not fully aligned with the interests of our stockholders and may induce GC Advisors to make certain investments, including speculative investments.
In the course of our investing activities, we pay management and incentive fees to GC Advisors. The management fee is based on our average adjusted gross assets and the incentive fee is computed and paid on income, both of which include leverage. As a result, investors in our common stock will invest on a “gross” basis and receive distributions on a “net” basis after expenses, resulting in a lower rate of return than one might achieve through direct investments. Because these fees are based on our average adjusted gross assets, GC Advisors benefits when we incur debt or use leverage. Under certain circumstances, the use of leverage may increase the likelihood of default, on our debt or other leverage, which would disfavor ornegatively impact our securityholders.
Additionally, the incentive fee payable by us to GC Advisors may create an incentive for GC Advisors to cause us to realize capital gains or losses that may not be in the best interests of us or our stockholders. Under the incentive fee structure, GC Advisors benefits when we recognize capital gains and, because GC Advisors determines when an investment is sold, GC Advisors controls the timing of the recognition of such capital gains. Our board of directors is charged with protecting our stockholders’ interests by monitoring how GC Advisors addresses these and other conflicts of interest associated with its management services and compensation.
The part of the management and incentive fees payable to GC Advisors that relates to our net investment income is computed and paid on income that may include interest income that has been accrued but not yet received in cash, such as market discount, debt instruments with PIK interest, preferred stock with PIK dividends, zero coupon securities, and other deferred interest instruments and may create an incentive for GC Advisors to make investments on our behalf that are riskier or more speculative than would be the case in the absence of such compensation arrangement. This fee structure may be considered to involvegive rise to a conflict of interest for GC Advisors to the extent that it may encourage GC Advisors to favor debt financings that provide for deferred interest, rather than current cash payments of interest. Under these investments, we accrue the interest over the life of the investment but do not receive the cash income from the investment until the end of the term. Our net investment income used to calculate the income portion of our investment fee, however, includes accrued interest. GC
Advisors may have an incentive to invest in deferred interest securities in circumstances where it would not have done so but for the opportunity to continue to earn the fees even when the issuers of the deferred interest securities would not be able to make actual cash payments to us on such securities. This risk could be increased because GC Advisors is not obligated to reimburse us for any fees received even if we subsequently incur losses or never receive in cash the deferred income that was previously accrued.
The valuation process for certain of our portfolio holdings creates a conflict of interest.
The majority of our portfolio investments are expected to be made in the form of securities that are not publicly traded. As a result, our board of directors will determine the fair value of these securities in good faith. In connection with that determination, investment professionals from GC Advisors may provide our board of directors with portfolio company valuations based upon the most recent portfolio company financial statements available and projected financial results of each portfolio company. In addition, Lawrence E. Golub and David B. Golub have an indirect pecuniary interest in GC Advisors. The participation of GC Advisors’ investment professionals in our valuation process, and the indirect pecuniary interest in GC Advisors by Lawrence E. Golub and David B. Golub, could result in a conflict of interest as GC Advisors’ management fee is based, in part, on our average adjusted gross assets and our incentive fees will be based, in part, on unrealized gains and losses.
Conflicts related to other arrangements with GC Advisors or its affiliates.
We have entered into a license agreement with Golub Capital LLC under which Golub Capital LLC has granted us a non-exclusive, royalty-free license to use the name “Golub Capital”. In addition, we pay to the Administrator our allocable portion of overhead and other expenses incurred by the Administrator in performing its obligations under the Administration Agreement, such as rent and our allocable portion of the cost of our chief financial officer and chief compliance officer and their respective staffs. These arrangements create conflicts of interest that our board of directors must monitor.
The Investment Advisory Agreement and the Administration Agreement were not negotiated on an arm’s-length basis and may not be as favorable to us as if they had been negotiated with an unaffiliated third party.
The Investment Advisory Agreement and the Administration Agreement were negotiated between related parties. Consequently, their terms, including fees payable to GC Advisors, may not be as favorable to us as if they had been negotiated with an unaffiliated third party. For example, certain accounts managed by GC Advisors have lower management, incentive or other fees than those charged under the Investment Advisory Agreement and/or a reduced ability to recover expenses and overhead than may be recovered by the Administrator under the Administration Agreement. In addition, we may choose not to enforce, or to enforce less vigorously, our rights and remedies under these agreements and the Adviser Revolver because of our desire to maintain our ongoing relationship with GC Advisors, the Administrator and their respective affiliates. Any such decision, however, would breach our fiduciary obligations to our stockholders.
Our ability to enter into transactions with our affiliates will be restricted, which may limit the scope of investments available to us.
We are prohibited under the 1940 Act from participating in certain transactions with our affiliates without the prior approval of our independent directors and, in some cases, the SEC. Any person that owns, directly or indirectly, five percent or more of our outstanding voting securities is our affiliate for purposes of the 1940 Act, and we are generally prohibited from buying or selling any security from or to such affiliate, absent the prior approval of our independent directors. We consider GC Advisors and its affiliates to be our affiliates for such purposes. The 1940 Act also prohibits certain “joint” transactions with certain of our affiliates, which could include investments in the same portfolio company, without prior approval of our independent directors and, in some cases, the SEC. We are prohibited from buying or selling any security from or to, among others, any person who owns more than 25% of our voting securities or certain of that person’s affiliates, or entering into prohibited joint transactions with such persons, absent the prior approval of the SEC.
We may, however, invest alongside GC Advisors’ and its affiliates’ other clients in certain circumstances where doing so is consistent with applicable law and SEC staff interpretations. For example, we may invest alongside such accounts consistent with guidance promulgated by the SEC staff permitting us and such other accounts to purchase interests in a single class of privately placed securities so long as certain conditions are met, including that GC Advisors, acting on our behalf and on behalf of its other clients, negotiates no term other than price. We may also invest alongside GC Advisors’ other clients as otherwise permissible under regulatory guidance, applicable regulations and GC Advisors’ allocation policy. Under this allocation policy, if an investment opportunity is appropriate for us and another similar eligible account, the opportunity will be allocated pro rata based on the relative capital available for investment of each of us and such other eligible accounts, subject to minimum and maximum investment size limits. However, we can offer no assurance that investment opportunities will be allocated to us fairly or equitably in the short-term or over time.
In situations in which co-investment with other accounts sponsored or managed by GC Advisors or its affiliates is not permitted or appropriate, such as when, in the absence of exemptive relief described below, we and such other entities may make investments in the same issuer or where the different investments could be expected to result in a conflict between our interests and those of other GC Advisors clients, GC Advisors needs to decide whether we or such other entity or entities will
proceed with such investments. GC Advisors makes these determinations based on its policies and procedures, which generally require that such investment opportunities be offered to eligible accounts on a basis that is fair and equitable over time, including, for example, through random or rotational methods. Moreover, in certain circumstances, we may be unable to invest in an issuer in which an account sponsored or managed by GC Advisors or its affiliates has previously invested. Similar restrictions limit our ability to transact business with our officers or directors or their affiliates. These restrictions may limit the scope of investment opportunities that would otherwise be available to us.
We andOn February 27, 2017, GC Advisors have submitted an application forand certain other funds and accounts sponsored or managed by GC Advisors and its affiliates, received exemptive relief from the SEC to permitthat permits us greater flexibility to negotiate the terms of co-investments if our board of directorsBoard determines that it would be advantageous for us to co-invest with other accounts sponsored or managed by GC Advisors or its affiliates in a manner consistent with our investment objectives, positions, policies, strategies and restrictions as well as regulatory requirements and other pertinent factors. We believe that co-investments by us and other accounts sponsored or managed by GC Advisors and its affiliates may afford us additional investment opportunities and an ability to achieve greater diversification. Accordingly, our application forUnder the terms of this exemptive relief, seeks an exemptive order that would permit us to invest with accounts sponsored or managed by GC Advisors or its affiliatesa “required majority” (as defined in the same portfolio companies under circumstances in which such investments would otherwise not be permitted underSection 57(o) of the 1940 Act. We expect that such exemptive relief permitting co-investments, if granted, would apply only ifAct) of our independent directors reviewis required to make certain conclusions in connection with a co-investment transaction, including that (1) the terms of the proposed transaction are reasonable and approve each co-investment.fair to us and our stockholders and do not involve overreaching of us or our stockholders on the part of any person concerned and (2) the transaction is consistent with the interests of our stockholders and is consistent with our investment strategies and policies.
We may be the target of litigation.
We may be the target of securities litigation in the future, particularly if the trading price of our common stock fluctuates significantly. We could also generally be subject to litigation, including derivative actions by our stockholders. Any litigation could result in substantial costs and divert management’s attention and resources from our business and cause a material adverse effect on our business, financial condition and results of operations.
We operate in a highly competitive market for investment opportunities, which could reduce returns and result in losses.
A number of entities compete with us to make the types of investments that we plan to make. We compete with public and private funds, commercial and investment banks, commercial financing companies and, to the extent they provide an alternative form of financing, private equity and hedge funds. Many of our competitors are substantially larger and have considerably greater financial, technical and marketing resources than we do. For example, we believe some of our competitors may have access to funding sources that are not available to us. In addition, some of our competitors may have higher risk tolerances or different risk assessments, which could allow them to consider a wider variety of investments and establish more relationships than us. Furthermore, many of our competitors are not subject to the regulatory restrictions that the 1940 Act imposes on us as a business development company or the source of income, asset diversification and distribution requirements we must satisfy to maintain our qualification as a RIC. The competitive pressures we face may have a material adverse effect on our business, financial condition, results of operations and cash flows. As a result of this competition, we may not be able to take advantage of attractive investment opportunities from time to time, and we may not be able to identify and make investments that are consistent with our investment objective.
With respect to the investments we make, we do not seek to compete based primarily on the interest rates we offer, and we believe that some of our competitors may make loans with interest rates that will be lower than the rates we offer. In the secondary market for acquiring existing loans, we compete generally on the basis of pricing terms. With respect to all investments, we may lose some investment opportunities if we do not match our competitors’ pricing, terms and structure. However, if we match our competitors’ pricing, terms and structure, we may experience decreased net interest income, lower yields and increased risk of credit loss. We may also compete for investment opportunities with accounts managed or sponsored by GC Advisors or its affiliates. Although GC Advisors allocates opportunities in accordance with its allocation policy, allocations to such other accounts will reduce the amount and frequency of opportunities available to us and may not be in the best interests of us and our securityholders. Moreover, the performance of investments will not be known at the time of allocation.
We will be subject to corporate-level income tax if we are unable to qualify as a RIC.
In order to be subject to tax as a RIC under the Code, we must meet certain source-of-income, asset diversification and distribution requirements. The distribution requirement for a RIC is satisfied if we distribute to our stockholders dividends for U.S. federal income tax purposes of an amount generally at least equal to 90% of our investment company taxable income, which is generally our net ordinary income plus the excess of our net short-term capital gains in excess of our net long-term capital losses, determined without regard to any deduction for dividends paid, to our stockholders on an annual basis. We are subject, to the extent we use debt financing, to certain asset coverage ratio requirements under the 1940 Act and financial covenants under loan and credit agreements that could, under certain circumstances, restrict us from making distributions necessary to qualify as a RIC. If we are unable to obtain cash from other sources, we may fail to qualifybe subject to tax as a RIC and, thus, may be subject to corporate-level income tax. To qualify as a RIC, we must also meet certain asset diversification requirements at the end of each quarter of our taxable year. Failure to meet these requirements may result in our having to dispose of certain investments quickly in order to
prevent the loss of our qualification as a RIC. Because most of our investments are in private or thinly traded public companies, any such dispositions could be made at disadvantageous prices and may result in substantial losses. If we fail to qualify as a RIC for any reason and become subject to corporate-level income tax, the resulting corporate taxes could substantially reduce our net assets, the amount of income available for distributions to stockholders and the amount of our distributions and the amount of funds available for new investments. Such a failure would have a material adverse effect on us and our securityholders. See “Business — Taxation as a RIC.”
We may need to raise additional capital to grow because we must distribute most of our income.
We may need additional capital to fund new investments and grow our portfolio of investments. We intend to access the capital markets periodically to issue debt or equity securities or borrow from financial institutions in order
to obtain such additional capital. Unfavorable economic conditions could increase our funding costs, limit our access to the capital markets or result in a decision by lenders not to extend credit to us. A reduction in the availability of new capital could limit our ability to grow. In addition, we are required to distribute each taxable year an amount at least equal to 90% of our net ordinaryinvestment company taxable income, and net short-term capital gains in excess of net long-term capital losses, ifdetermined without regard to any deduction for dividends paid as dividends for U.S. federal income tax purposes, to our stockholders to maintain our qualificationability to be subject to tax as a RIC. As a result, these earnings are not available to fund new investments. An inability to access the capital markets successfully could limit our ability to grow our business and execute our business strategy fully and could decrease our earnings, if any, which may have an adverse effect on the value of our securities. Furthermore, to the extent we are not able to raise capital and are at or near our targeted leverage ratios, we may receive smaller allocations, if any, on new investment opportunities under GC Advisors’ allocation policy and have, in the past, received such smaller allocations under similar circumstances.
We may have difficulty paying our required distributions if we recognize income before, or without, receiving cash representing such income.
For U.S. federal income tax purposes, we include in income certain amounts that we have not yet received in cash, such as the accretion of original issue discount. This may arise if we receive warrants in connection with the making of a loan and in other circumstances, or through contracted PIK interest, which represents contractual interest added to the loan balance and due at the end of the loan term. Such original issue discount, which could be significant relative to our overall investment activities, or increases in loan balances as a result of contracted PIK arrangements, is included in income before we receive any corresponding cash payments. We also may be required to include in income certain other amounts that we do not receive in cash.
That part of the incentive fee payable by us that relates to our net investment income is computed and paid on income that may include interest that has been accrued but not yet received in cash, such as market discount, debt instruments with PIK interest, preferred stock with PIK dividends and zero coupon securities. If a portfolio company defaults on a loan that is structured to provide accrued interest, it is possible that accrued interest previously used in the calculation of the incentive fee will become uncollectible, and GC Advisors will have no obligation to refund any fees it received in respect of such accrued income.
Since in certain cases we may recognize income before or without receiving cash representing such income, we may have difficulty meeting the Annual Distribution Requirement. In such a case, we may have to sell some of our investments at times we would not consider advantageous, raise additional debt or equity capital or reduce new investment originations to meet these distribution requirements. If we are not able to obtain such cash from other sources, we may fail to qualify as a RIC and thus be subject to corporate-level income tax. See “Business — Taxation as a RIC.”
Regulations governing our operation as a business development company affect our ability to, and the way in which we, raise additional capital. As a business development company, the necessity of raising additional capital exposes us to risks, including the typical risks associated with leverage.
We may issue debt securities or preferred stock and/or borrow money from banks or other financial institutions, which we refer to collectively as “senior securities,” up to the maximum amount permitted by the 1940 Act. Under the provisions of the 1940 Act, we are permitted as a business development company to issue senior securities in amounts such that our asset coverage, as defined in the 1940 Act, equals at least 200% (or 150% upon receipt of certain approvals and subject to certain disclosure requirements) of gross assets (other than the SBA debentures of an SBIC subsidiary, as permitted by exemptive relief we have been granted by the SEC) less all liabilities and indebtedness not represented by senior securities, after each issuance of senior securities (other than the SBA debentures of an SBIC subsidiary, as permitted by exemptive relief we have been granted by the SEC). If the value of our assets declines, we may be unable to satisfy this ratio. If that happens, we may be required to sell a portion of our investments and, depending on the nature of our leverage, repay a portion of our indebtedness at a time when such sales may be disadvantageous. This could have a material adverse effect on our operations and we may not be able to make distributions in an amount sufficient to be subject to tax as a RIC, or at all. Also, any amounts that we use to service our indebtedness would not be available for distributions to our common stockholders. If we issue senior securities, we will be exposed to typical risks associated with leverage, including an increased risk of loss. As of September 30, 2016,2018, we had $865.2$845.7 million of outstanding borrowings, including $215.0 million outstanding under the 2010 Debt Securitization and $246.0$197.5 million outstanding under the 2014 Debt Securitization.
In the absence of an event of default, no person or entity from which we borrow money has a veto right or voting power over our ability to set policy, make investment decisions or adopt investment strategies. If we issue
preferred stock, which is another form of leverage, the preferred stock would rank “senior” to common stock in our capital structure, preferred stockholders would have separate voting rights on certain matters and might have other rights, preferences or privileges more favorable than those of our common stockholders, and the issuance of preferred stock could have the effect of delaying, deferring or preventing a transaction or a change of control that might involve a premium price for holders of our common stock or otherwise be in yourthe best interest.interest of our common stockholders. Holders of our common stock will directly or indirectly bear all of the costs associated with offering and servicing any preferred stock that we issue. In addition, any interests of preferred stockholders may not necessarily align with the interests of holders of our common stock and the rights of holders of shares of preferred stock to receive dividendsdistributions would be senior to those of holders of shares of our common stock. We do not, however, anticipate issuing preferred stock in the next 12 months.
We are not generally able to issue and sell our common stock at a price below net asset value per share. We may, however, sell our common stock, or warrants, options or rights to acquire our common stock, at a price below the then-current net asset value per share of our common stock if our board of directors determines that such sale is in the best interests of us and our stockholders, and if our stockholders approve such sale. In any such case, the price at which our securities are to be issued and sold may not be less than a price that, in the determination of our board of directors, closely approximates the market value of such securities (less any distributing commission or discount). If we raise additional funds by issuing common stock or senior securities convertible into, or exchangeable for, our common stock, then the percentage ownership of our stockholders at that time will decrease, and youholders of our common stock might experience dilution.
We intend to finance our investments with borrowed money, which will magnify the potential for gain or loss on amounts invested and may increase the risk of investing in us.
The use of leverage magnifies the potential for gain or loss on amounts invested. The use of leverage is generally considered a speculative investment technique and increases the risks associated with investing in our securities. The amount of leverage that we employ will depend on GC Advisors’ and our board of directors’ assessment of market and other factors at the time of any proposed borrowing. We cannot assure you that we will be able to obtain credit at all or on terms acceptable to us. We may issue senior debt securities to banks, insurance companies and other lenders. Lenders of these senior securities will have fixed dollar claims on our assets that are superior to the claims of our common stockholders, and we would expect such lenders to seek recovery against our assets in the event of a default. We may pledge up to 100% of our assets and may grant a security interest in all of our assets under the terms of any debt instruments we may enter into with lenders. The terms of our existing indebtedness require us to comply with certain financial and operational covenants, and we expect similar covenants in future debt instruments. Failure to comply with such covenants could result in a default under the applicable credit facility or debt instrument if we are unable to obtain a waiver from the applicable lender or holder, and such lender or holder could accelerate repayment under such indebtedness and negatively affect our business, financial condition, results of operations and cash flows. In addition, under the terms of any credit facility or other debt instrument we enter into, we are likely to be required by its terms to use the net proceeds of any investments that we sell to repay a portion of the amount borrowed under such facility or instrument before applying such net proceeds to any other uses. If the value of our assets decreases, leveraging would cause our net asset value to decline more sharply than it otherwise would have had we not leveraged, thereby magnifying losses or eliminating our equity stake in a leveraged investment. Similarly, any decrease in our net investment income will cause our net income to decline more sharply than it would have had we not borrowed. Such a decline would also negatively affect our ability to make distributions on our common stock or any outstanding preferred stock. Our ability to service our debt depends largely on our financial performance and is subject to prevailing economic conditions and competitive pressures. Our common stockholders bear the burden of any increase in our expenses as a result of our use of leverage, including interest expenses and any increase in the base management fee payable to GC Advisors.
On September 13, 2011, we received exemptive relief from the SEC allowing us to modify the asset coverage requirement to exclude the SBA debentures from this calculation. As such, our ratio of total consolidated assets to outstanding indebtedness may be less than 200%. even if we do not receive approval for the modified asset coverage requirement permitted by Section 61(a)(2) of the 1940 Act. This provides us with increased investment flexibility but also increases our risks related to leverage.
The following table illustrates the effect of leverage on returns from an investment in our common stock as of September 30, 2016,2018, assuming various annual returns, net of expenses. The calculations in the table below are hypothetical and actual returns may be higher or lower than those appearing in the table below.
|
| | | | | | | | | |
| | Assumed Return on Our Portfolio (Net of Expenses) |
| | -10% | | -5% | | 0% | | 5% | | 10% |
Corresponding return to common stockholder(1) | -22.78% | | -12.79% | | -2.80% | | 7.20% | | 17.19% |
|
| | | | | | | | | |
| | Assumed Return on Our Portfolio (Net of Expenses) |
| | -10% | | -5% | | 0% | | 5% | | 10% |
Corresponding return to common stockholder(1) | -22.24% | | -12.77% | | -3.30% | | 6.17% | | 15.65% |
| |
(1) | Assumes $1,756.5$1,835.6 million in total assets, $865.2$845.7 million in debt and secured borrowings outstanding and $878.8$968.9 million in net assets as of September 30, 20162018 and an effective annual interest rate of 2.84%3.78% as of September 30, 2016.2018. |
Based on our outstanding indebtedness of $865.2$845.7 million as of September 30, 20162018 and the effective annual interest rate of 2.84%3.78% as of that date, our investment portfolio would have been required to experience an annual return of at least 1.40%1.70% to cover annual interest payments on the outstanding debt.
New legislation may permit us to incur additional leverage.
Business development companies are generally able to issue senior securities such that their asset coverage, as defined in the 1940 Act, equals at least 200% of gross assets less all liabilities and indebtedness not represented by senior securities, after each issuance of senior securities. In March 2018, the SBCAA amended Section 61(a) of the 1940 Act to add a new Section 61(a)(2) that reduces the asset coverage requirement applicable to business development companies from 200% to 150% so long as the business development company meets certain disclosure requirements and obtains certain approvals. The reduced asset coverage requirement would permit a business development company to have a ratio of total consolidated assets to outstanding indebtedness of 2:1 as compared to a maximum of 1:1 under the 200% asset coverage requirement. Effectiveness of the reduced asset coverage requirement to a business development company requires approval by either (1) a “required majority,” as defined in Section 57(o) of the 1940 Act, of such business development company’s board of directors with effectiveness one year after the date of such approval or (2) a majority of votes cast at a special or annual meeting of such business development company’s stockholders at which a quorum is present, which is effective the date after such stockholder approval. On November 27, 2018, our board of directors recommended that we seek shareholder approval to reduce our asset coverage requirement to 150.0% at our annual meeting of stockholders currently scheduled for February 5, 2019. To the extent stockholder approval is received, we currently intend to target a GAAP debt-to-equity ratio of about 1.0x. If we were to receive either the requisite stockholder or board approval and comply with the applicable disclosure requirements, we would be able to incur additional indebtedness, which may increase our risks related to leverage. In addition, our management fee is based on our average adjusted gross assets, which includes leverage and, as a result, if we were to incur additional leverage, management fees paid to GC Advisors would increase.
We are subject to risks associated with the 20102014 Debt Securitization and the 20142018 Debt Securitization.
As a result of the 20102014 Debt Securitization and the 20142018 Debt Securitization, we are subject to a variety of risks, including those set forth below. We use the term “debt securitization” in this Annual Reportannual report on Form 10-K to describe a form of secured borrowing under which an operating company (sometimes referred to as an “originator” or “sponsor”) acquires or originates mortgages, receivables, loans or other assets that earn income, whether on a one-time or recurring basis (collectively, “income producing assets”), and borrows money on a non-recourse basis against a legally separate pool of loans or other income producing assets. In a typical debt securitization, the originator transfers the loans or income producing assets to a single-purpose, bankruptcy-remote subsidiary (also referred to as a “special purpose entity”), which is established solely for the purpose of holding loans and income producing assets and issuing debt secured by these income producing assets. The special purpose entity completes the borrowing through the issuance of notes secured by the loans or other assets. The special purpose entity may issue the notes in the capital markets to a variety of investors, including banks, non-bank financial institutions and other investors. In each of the 20102014 Debt Securitization and the 20142018 Debt Securitization, institutional investors purchased the notes issued by the 20102014 Issuer and the 20142018 Issuer, respectively, in a private placement.placements.
We are subject to certain risks as a result of our indirect interests in the junior notes and membership interests of the 2010 Issuer and our direct interests in the junior notes and membership interests of the 2014 Issuer.
Under the terms of the master loan sale agreement governing the 2010 Debt Securitization, (1) we sold and/or contributed to Holdings all of our ownership interest in our portfolio loans and participations for the purchase price and other consideration set forth in such master loan sale agreement and (2) Holdings, in turn, sold and/or contributed to the 2010 Issuer all of its ownership interest in such portfolio loans and participations for the purchase price and other consideration set forth in such master loan sale agreement. Following these transfers, the 2010 Issuer and not Holdings or us, held all of the ownership interest in such portfolio loans and participations. As a result of the 2010 Debt Securitization, we held indirectly through Holdings, as of September 30, 2016, the Subordinated 2010 Notes as well as membership interests, which comprise 100% of the equityour indirect interests in the 2010 Issuerjunior notes and following the October 20, 2016 refinancingmembership interests of the Class B 2010 Notes, the Class B-Refi 2010 Notes. 2018 Debt Securitization.
Under the terms of the loan sale agreement governing the 2014 Debt Securitization, we sold and/or contributed to the 2014 Issuer all of our ownership interest in our portfolio loans and participations for the purchase price and
other consideration set forth in such loan sale agreement. Following this transfer, the 2014 Issuer held all of the ownership interest in such portfolio loans and participations. As a result of the 2014 Debt Securitization and as of September 30, 2016,2018, we held the Class CC-R 2014 Notes as well as all of the membership interests of the 2014 Issuer. As a result, we consolidate the financial statements of Holdings, the 20102014 Issuer, as well as our other subsidiaries, in our consolidated financial statements.
Two loan sale agreements govern the 2018 Debt Securitization. Under the terms of the loan sale agreement entered into upon closing on November 16, 2018 (the “Closing Date”) of the 2018 Debt Securitization (the “Closing Date Loan Sale Agreement”), which provides for the sale of assets on the Closing Date to satisfy risk retention requirements, (1) we transferred to GC Advisors a portion of our ownership interest in the portfolio company investments securing the 2018 Debt Securitization for the purchase price and other consideration set forth in the Closing Date Loan Sale Agreement and (2) immediately thereafter, GC Advisors sold to the 2018 Issuer all of its ownership interest in such portfolio loans for the purchase price and other consideration set forth in the Closing Date Loan Sale Agreement. Under the terms of the other loan sale agreement governing the 2018 Debt Securitization (the “Depositor Loan Sale Agreement”), which provides for the sale of assets on the Closing Date as well as future sales from us to the 2018 Issuer through the CLO Depositor, (1) we sold and/or contributed to the CLO Depositor the remainder of our ownership interest in the portfolio company investments securing the 2018 Debt Securitization and participations for the purchase price and other consideration set forth in the Depositor Loan Sale Agreement and (2) CLO Depositor, in turn, sold to the 2018 Issuer all of its ownership interest in such portfolio loans and participations for the purchase price and other consideration set forth in one of the loan sale agreements. Following these transfers, the 2018 Issuer, and not GC Advisors, CLO Depositor or us, held all of the 2014ownership interest in such portfolio company investments and participations. As a result of the 2018 Debt Securitization, we held indirectly through the CLO Depositor, as of November 16, 2018, the Class C-2 2018 Notes, the Class D 2018 Notes and the Subordinated 2018 Notes as well as membership interests, which comprise 100% of the equity interests, in the 2018 Issuer. As a result, we consolidate the financial statements of the 2018 Issuer, as well as our other subsidiaries, in our consolidated financial statements.
Because each of Holdings, the 20102014 Issuer, the CLO Depositor and the 20142018 Issuer is disregarded as an entity separate from its owner for U.S. federal income tax purposes, the sale or contribution by us to Holdings and by Holdings to the 20102014 Issuer and the sale orand contribution by us to the 2014CLO Depositor and the CLO Depositor to the 2018 Issuer did not constitute a taxable event for U.S. federal income tax purposes. If the U.S. Internal Revenue Service were to take a contrary position, there could be a material adverse effect on our business, financial condition, results of operations or cash flows. We may, from time to time, hold asset-backed securities, or the economic equivalent thereof, issued by a securitization vehicle sponsored by another business development company to the extent permitted under the 1940 Act.
The Class B-Refi 2010 Notes, Subordinated 2010 Notes and membership interests in the 2010 Issuer are subordinated obligations of the 2010 Issuer and the Class CC-R 2014 Notes are subordinated obligations of the 2014 Issuer and the Class C-2 Notes, the Class D Notes, Subordinated Notes, and membership interests are subordinated obligations of the 2018 Issuer and we may not receive cash from the 20102014 Issuer or the 20142018 Issuer.
The Class B-Refi 2010 Notes are subordinated in priority of payment to the Class A-Refi 2010 Notes issued by the 2010 Issuer and are subject to certain payment restrictions set forth in the indenture governing the 2010 Notes. Therefore, Holdings only receives cash distributions on the Class B-Refi 2010 Notes if the 2010 Issuer has made all cash interest payments in respect of the issued Class A-Refi 2010 Notes, and we only receive cash distributions in respect of our indirect ownership of the 2010 Issuer to the extent that Holdings receives any cash distributions in respect of its direct ownership of the 2010 Issuer. Consequently, to the extent that the value of the 2010 Issuer’s portfolio of loan investments has been reduced as a result of conditions in the credit markets, or as a result of defaulted loans or individual fund assets, the value of the Class B-Refi 2010 Notes at their redemption could be reduced. In addition, if the 2010 Issuer does not meet the asset coverage tests or the interest coverage test set forth in the documents governing the 2010 Debt Securitization, cash would be diverted from the Class B-Refi 2010 Notes to first pay the Class A-Refi 2010 Notes in amounts sufficient to cause such tests to be satisfied.
The Subordinated 2010 Notes are the most junior class of notes issued by the 2010 Issuer, are subordinated in priority of payment to every other class of notes issued by the 2010 Issuer and are subject to certain payment restrictions set forth in the indenture governing the 2010 Notes. Therefore, Holdings only receives cash distributions on the Subordinated 2010 Notes if the 2010 Issuer has made all cash interest payments to all other notes it has issued, and we only receive cash distributions in respect of our indirect ownership of the 2010 Issuer to the extent that Holdings receives any cash distributions in respect of its direct ownership of the 2010 Issuer. The Subordinated 2010 Notes are also unsecured and rank behind all of the secured creditors, known or unknown, of the 2010 Issuer, including the holders of the senior notes it has issued. Consequently, to the extent that the value of the 2010 Issuer’s portfolio of loan investments has been reduced as a result of conditions in the credit markets, or as a result of defaulted loans or individual fund assets, the value of the Subordinated 2010 Notes at their redemption could be reduced. In addition, if the 2010 Issuer does not meet the asset coverage tests or the interest coverage test set forth in the documents governing the 2010 Debt Securitization, cash would be diverted from the Subordinated 2010 Notes to first pay the Class A-Refi 2010 Notes and Class B-Refi 2010 Notes in amounts sufficient to cause such tests to be satisfied.
The membership interests in the 2010 Issuer represent all of the equity interest in the 2010 Issuer. As such, the holder of the membership interests is the residual claimant on distributions, if any, made by the 2010 Issuer after holders of all 2010 Notes have been paid in full on each payment date or upon maturity of such notes under the 2010 Debt Securitization documents. Such payments may be made by the 2010 Issuer only to the extent permitted under the 2010 Debt Securitization documents on any payment date or upon payment in full of the notes issued by the 2010 Issuer.
The Class CC-R 2014 Notes are the most junior class of notes issued by the 2014 Issuer, are subordinated in priority of payment to the Class AA-R 2014 Notes and the Class BB-R 2014 Notes and are subject to certain payment restrictions set forth in the indenture governing the 2014 Notes. Therefore, we only receive cash distributions on the Class CC-R 2014 Notes if the 2014 Issuer has made all cash interest payments to all other notes it has issued. Consequently, to the extent that the value of the 2014 Issuer’s portfolio of loan investments has been reduced as a result of conditions in the credit markets, or as a result of defaulted loans or individual fund assets, the value of the Class CC-R 2014 Notes at their redemption could be reduced. If the 2014 Issuer does not meet the asset coverage tests or the interest coverage test set forth in the documents governing the 2014 Debt Securitization, cash would be diverted from the Class CC-R 2014 Notes to first pay the Class AA-R 2014 Notes and Class BB-R 2014 Notes in amounts sufficient to cause such tests to be satisfied.
The 2014 Issuer is the residual claimant on funds, if any, remaining after holders of all classes of 2014 Notes have been paid in full on each payment date or upon maturity of such notes under the 2014 Debt Securitization documents. The membership interests in the 2014 Issuer represent all of the equity interest in the 2014 Issuer, and, as the holder of the membership interests, we may receive distributions, if any, only to the extent that the 2014 Issuer makes distributions out of funds remaining after holders of all classes of 2014 Notes have been paid in full on each payment date any amounts due and owing on such payment date or upon maturity of such 2014 Notes. In the event that we fail to receive cash indirectly from the 2010 Issuer or directly from the 2014 Issuer, we could be unable to make such distributions in amounts sufficient to maintain our statusability to be subject to tax as a RIC, or at all.
The Class C-2 2018 Notes are subordinated in priority of payment to the each of the Class A 2018 Notes and the Class B 2018 Notes issued by the 2018 Issuer and are subject to certain payment restrictions set forth in the indenture governing the 2018 Notes. Therefore, the CLO Depositor only receives cash distributions on the Class C-2 2018 Notes if the 2018 Issuer has made all cash interest payments in respect of the issued Class A 2018 Notes and Class B 2018 Notes, and we only receive cash distributions in respect of our indirect ownership of the Class C-2 2018 Notes to the extent that the CLO Depositor receives any cash distributions in respect of its direct ownership of the Class C-2 2018 Notes. Consequently, to the extent that the value of the 2018 Issuer’s portfolio of loan investments has been reduced as a result of conditions in the credit markets, or as a result of defaulted loans or individual fund assets, the value of the Class C-2 2018 Notes at their redemption could be reduced. In addition, if the 2018 Issuer does not meet the asset coverage tests or the interest coverage test set forth in the documents governing the 2018 Debt Securitization, cash would be diverted from the Class C-2 2018 Notes to first pay the Class A 2018 Notes and the Class B 2018 Notes in amounts sufficient to cause such tests to be satisfied.
The Class D 2018 Notes are subordinated in priority of payment to the each of the Class A 2018 Notes, the Class B 2018 Notes, the Class C-1 2018 Notes and the Class C-2 2018 Notes issued by the 2018 Issuer and are subject to certain payment restrictions set forth in the indenture governing the 2018 Notes. Therefore, the CLO Depositor only receives cash distributions on the Class D 2018 Notes if the 2018 Issuer has made all cash interest payments in respect of the issued Class A 2018 Notes, Class B 2018 Notes, Class C-1 2018 Notes and Class C-2 2018 Notes, and we only receive cash distributions in respect of our indirect ownership of the Class D 2018 Notes to the extent that the CLO Depositor receives any cash distributions in respect of its direct ownership of the Class D 2018 Notes. Consequently, to the extent that the value of the 2018 Issuer’s portfolio of loan investments has been reduced as a result of conditions in the credit markets, or as a result of defaulted loans or individual fund assets, the value of the Class D 2018 Notes at their redemption could be reduced. In addition, if the 2018 Issuer does not meet the asset coverage tests or the interest coverage test set forth in the documents governing the 2018 Debt Securitization, cash would be diverted from the Class D 2018 Notes to first pay the Class A 2018 Notes, the Class B 2018 Notes, Class C-1 2018 Notes and the Class C-2 2018 Notes in amounts sufficient to cause such tests to be satisfied.
The Subordinated 2018 Notes are the most junior class of notes issued by the 2018 Issuer, are subordinated in priority of payment to every other class of notes issued by the 2018 Issuer and are subject to certain payment restrictions set forth in the indenture governing the 2018 Notes. Therefore, the CLO Depositor only receives cash distributions on the Subordinated 2018 Notes if the 2018 Issuer has made all cash interest payments to all other notes it has issued, and we only receive cash distributions in respect of our indirect ownership of the Subordinated 2018 Notes to the extent that the CLO Depositor receives any cash distributions in respect of its direct ownership of the Subordinated 2018 Notes. The Subordinated 2018 Notes are also unsecured and rank behind all of the secured creditors, known or unknown, of the 2018 Issuer, including the holders of the senior notes it has issued. Consequently, to the extent that the value of the 2018 Issuer’s portfolio of loan investments has been reduced as a result of conditions in the credit markets, or as a result of defaulted loans or individual fund assets, the value of the Subordinated 2018 Notes at their redemption could be reduced. In addition, if the 2018 Issuer does not meet the asset coverage tests or the interest coverage test set forth in the documents governing the 2018 Debt Securitization, cash would be diverted from the Subordinated 2018 Notes to first pay the Class A 2018 Notes, Class B 2018 Notes, Class C-1 2018 Notes, the Class C-2 2018 Notes and the Class D 2018 Notes in amounts sufficient to cause such tests to be satisfied.
The membership interests in the 2018 Issuer represent all of the equity interest in the 2018 Issuer. As such, the holder of the membership interests is the residual claimant on distributions, if any, made by the 2018 Issuer after holders of all 2018 Notes have been paid in full on each payment date or upon maturity of such notes under the 2018 Debt Securitization documents. Such payments may be made by the 2018 Issuer only to the extent permitted under the 2018 Debt Securitization documents on any payment date or upon payment in full of the notes issued by the 2018 Issuer.
The interests of holders of the senior classes of securities issued by the 20102014 Issuer and the 20142018 Issuer may not be aligned with our interests.
The Class A-Refi 2010 Notes are the debt obligations ranking senior in right of payment to other securities issued by the 2010 Issuer in the 2010 Debt Securitization. As such, there are circumstances in which the interests of holders of the Class A-Refi 2010 Notes may not be aligned with the interests of holders of the other classes of notes issued by, and membership interests of, the 2010 Issuer. For example, under the terms of the Class A-Refi 2010 Notes, holders of the Class A-Refi 2010 Notes have the right to receive payments of principal and interest prior to holders of the Class B-Refi 2010 Notes, the Subordinated 2010 Notes and the membership interests of the 2010 Issuer.
The Class AA-R 2014 Notes are the debt obligations ranking senior in right of payment to other securities issued by the 2014 Issuer in the 2014 Debt Securitization. As such, there are circumstances in which the interests of holders of the Class AA-R 2014 Notes may not be aligned with the interests of holders of the other classes of notes issued by, and membership interests of, the 2014 Issuer. For example, under the terms of the Class AA-R 2014 Notes,
holders of the Class AA-R 2014 Notes have the right to receive payments of principal and interest prior to holders of the Class BB-R 2014 Notes, the Class CC-R 2014 Notes and the 2014 Issuer.
The Class A 2018 Notes are the debt obligations ranking senior in right of payment to other securities issued by the 2018 Issuer in the 2018 Debt Securitization. As such, there are circumstances in which the interests of holders of the Class A 2018 Notes may not be aligned with the interests of holders of the other classes of notes issued by, and membership interests of, the 2018 Issuer. For example, under the terms of the Class A 2018 Notes, holders of the Class A 2018 Notes have the right to receive payments of principal and interest prior to holders of the Class B- 2018 Notes, the Class C-1 2018 Notes, the Class C-2 2018 Notes, the Class D 2018 Notes, the Subordinated 2018 Notes and the 2018 Issuer.
For as long as the Class A-Refi 2010 Notes remain outstanding, holders of the Class A-Refi 2010 Notes comprise the Controlling Class under the 2010 Debt Securitization. If the Class A-Refi 2010 Notes are paid in full, the Class B-Refi 2010 Notes would comprise the Controlling Class under the 2010 Debt Securitization; however, there is no assurance that Holdings will continue to hold the Class B-Refi 2010 Notes, which may be transferred to a third party. For as long as the Class AA-R 2014 Notes remain outstanding, holders of the Class AA-R 2014 Notes comprise the Controlling Class under the 20102014 Debt Securitization. If the Class AA-R 2014 Notes are paid in full, the Class BB-R 2014 Notes would comprise the Controlling Class under the 2014 Debt Securitization. For as long as the Class A 2018 Notes remain outstanding, holders of the Class A 2018 Notes comprise the Controlling Class under the 2018 Debt Securitization. If the Class A 2018 Notes are paid in full, the Class B 2018 Notes would comprise the Controlling Class under the 2018 Debt Securitization. Holders of the Controlling Class under the 20102014 Debt Securitization and 20142018 Debt Securitization have the right to act in certain circumstances with respect to the portfolio loans in ways that may benefit their interests but not the interests of holders of more junior classes of notes and membership interests, including by exercising remedies under the indenture in the 20102014 Debt Securitization and the 20142018 Debt Securitization, as applicable.
If an event of default has occurred and acceleration occurs in accordance with the terms of the indenture for either the 20102014 Debt Securitization or the 20142018 Debt Securitization, the Controlling Class of such debt securitization, as the most senior class of notes then outstanding in such debt securitization will be paid in full before any further payment or distribution on the more junior classes of notes and membership interests. In addition, if an event of default under the 20102014 Debt Securitization or 2014the 2018 Debt Securitization, as applicable occurs, holders of a majority of the Controlling Class of the applicable debt securitization may be entitled to determine the remedies to be exercised under the applicable indenture, subject to the terms of such indenture. For example, upon the occurrence of an event of default with respect to the notes issued by the 20102014 Issuer, the trustee or holders of a majority of the Controlling Class may declare the principal, together with any accrued interest, of all the notes of such class and any junior classes to be immediately due and payable. This would have the effect of accelerating the principal on such notes, triggering a repayment obligation on the part of the 20102014 Issuer. If at such time the portfolio loans were not performing well, the 20102014 Issuer may not have sufficient proceeds available to enable the trustee under the indenture to repay the obligations of holders of the Class B-Refi 2010 Notes or Subordinated 2010C-R 2014 Notes, or to pay a dividend to holders of the membership interests.
Remedies pursued by the Controlling Class could be adverse to the interests of the holders of the notes that are subordinated to the Controlling Class (which would include the Class B-Refi and Subordinated 2010C-R 2014 Notes to the extent the Class A-Refi 2010A-R 2014 Notes constitute the Controllingor Class or the Subordinated 2010 Notes to the extent the Class B-Refi 2010B-R 2014 Notes constitute the Controlling Class and the Class C 2014C‑2 2018 Notes, Class D 2018 Notes and Subordinated 2018 Notes to the extent the Class A 20142018 Notes, Class B 2018 Notes, Class C-1 2018 Notes and Class C-2 2018 Notes, or Class B 2014D 2018 Notes constitute the Controlling Class,)Class), and the Controlling Class will have no obligation to consider any possible adverse effect on such other interests. Thus, we cannot assure you that any remedies pursued by the Controlling Class will be in the best interests of Holdingsthe CLO Depositor or us or that Holdingsthe CLO Depositor or we will receive any payments or distributions upon an acceleration of the notes. In a liquidation under the 20102014 Debt Securitization, the Subordinated 2010Class C-R 2014 Notes will be deemedsubordinated to payment of the Class A-R 2014 Notes and Class B-R 2014 Notes and may not be paid in full onceto the extent funds remaining after payment of the Class A-Refi 2010A-R 2014 Notes and Class B-Refi 2010B-R 2014 Notes are paid in full.insufficient. In addition, under the 20102014 Debt Securitization, after the Class A-Refi 2010A-R 2014 Notes and Class B-R 2014 Notes are paid in full, Holdingsthe holder of the Class C-R 2014 Notes will be the only remaining noteholder and may amend the applicable indenture to, among other things, direct the assignment of any remaining assets to other wholly-owned subsidiaries for a price less than the fair market value of such assets with the difference in price to be considered an equity contribution to such subsidiaries. In a liquidation under the 20142018 Debt Securitization, the Class C 2014C-2 2018 Notes, Class D 2018 Notes and Subordinated 2018 Notes will be subordinated to payment of the Class A 20142018 Notes, Class B 2018 Notes and, in the case of the Class B 2014D 2018 Notes and Subordinated 2018 Notes only, the Class C-1 2018 Notes, and may not be paid in full to the extent funds remaining after payment of the Class A 20142018 Notes, Class B 2018 Notes and, in the case of the Class B 2014D 2018 Notes and Subordinated 2018 Notes only, the Class C-1 2018 Notes are insufficient. In addition, under the 20142018 Debt Securitization, after the Class A 20142018 Notes, Class B 2018 Notes and Class B 2014 C-1 2018
Notes are paid in full, the holder of the Class C 2014 NotesCLO Depositor will be the only remaining noteholder and may amend the applicable indenture to, among other things, direct the assignment of any remaining assets to other wholly-owned subsidiaries for a price less than the fair market value of such assets with the difference in price to be considered an equity contribution to such subsidiaries. Any failure of the 20102014 Issuer or the 20142018 Issuer to make distributions on the notes we indirectly or directly hold, whether as a result of an event of default, liquidation or otherwise, could have a material adverse effect on our business, financial condition, results of operations and cash flows and may result in an inability of us to make distributions sufficient to maintain our statusability to be subject to tax as a RIC.
RIC, or at all.
The 20102014 Issuer or the 2014and 2018 Issuer may fail to meet certain asset coverage tests.
Under the documents governing the 20102014 Debt Securitization, there are two asset coverage tests applicable to the Class A-Refi 2010A-R 2014 Notes, the Class B-R 2014 Notes and the Class B-Refi 2010C-R 2014 Notes, and the documents governing the 20142018 Debt Securitization provide for the same two asset coverage tests applicable to the Class A 20142018 Notes, the Class B 20142018 Notes, the Class C-1 2018 Notes, the Class C-2 2018 Notes and the Class C 2014D 2018 Notes.
The first such test compares the amount of interest received on the portfolio loans held by the 20102014 Issuer or the 20142018 Issuer, as applicable, to the amount of interest payable in respect of the Class A-Refi 2010 Notes and Class B-Refi 2010 Notes, with respect to the 2010 Issuer and the Class AA-R 2014 Notes, the Class BB-R 2014 Notes and the Class CC-R 2014 Notes, with respect to the 2014 Issuer, and the Class A 2018 Notes, the Class B 2018 Notes, the Class C-1 2018 Notes, the Class C-2 2018 Notes and the Class D 2018 Notes, with respect to the 2018 Issuer. To meet this first test, in the case of the 2010 Debt Securitization, interest received on the portfolio loans must equal at least 115% of the interest payable in respect of the notes issued by the 2010 Issuer; and, in the case of the 2014 Debt Securitization, interest received on the portfolio loans must equal at least 120% of the interest payable in respect of the Class AA-R 2014 Notes and Class BB-R 2014 Notes, taken together, and at least 110% of the interest payable in respect of the Class CC-R 2014 Notes, and, in the case of the 2018 Debt Securitization, interest received on the portfolio loans must equal at least 120% of the interest payable in respect of the Class A 2018 Notes and Class B 2018 Notes, taken together, at least 110% of the interest payable in respect of the Class C-1 2018 Notes and the Class C-2 2018 Notes, taken together, and at least 105% of the interest payable in respect of the Class D 2018 Notes.
The second such test compares the principal amount of the portfolio loans of the applicable debt securitization to the aggregate outstanding principal amount of the Class A-Refi 2010 Notes and Class B-Refi 2010 Notes, with respect to the 2010 Debt Securitization, and the Class AA-R 2014 Notes, the Class BB-R 2014 Notes and the Class CC-R 2014 Notes, with respect to the 2014 Debt Securitization. To meet this second test at any time inSecuritization, and the case ofClass A 2018 Notes, the 2010Class B 2018 Notes, the Class C-1 2018 Notes, the Class C-2 2018 Notes and the Class D 2018 Notes, with respect to the 2018 Debt Securitization, the aggregate principal amount of the portfolio loans must equal at least 158% of the outstanding principal amount of the applicable 2010 Notes, taken together.Securitization. To meet this second test at any time in the case of the 2014 Debt Securitization, the aggregate principal amount of the portfolio loans must equal at least 153.6% of the Class AA-R 2014 Notes and the Class BB-R 2014 Notes, taken together, and 136.1% of the Class CC-R 2014 Notes. To meet this second test at any time in the case of the 2018 Debt Securitization, the aggregate principal amount of the portfolio loans must equal at least 145.6% of the Class A 2018 Notes and Class B 2018 Notes, taken together, at least 126.7% of the Class C-1 2018 Notes and Class C-2 2018 Notes, taken together, and at least 116.7% of the Class D 2018 Notes.
If any asset coverage test with respect to the Class A-Refi 2010A-R 2014 Notes, the Class B-R 2014 Notes or Class B-Refi 2010C-R 2014 Notes is not met, proceeds from the portfolio of loan investments that otherwise would have been distributed to the holders of the Subordinated 2010Class C-R 2014 Notes and Holdingsthe 2014 Issuer will instead be used to redeem first the Class A-Refi 2010A-R 2014 Notes and then the Class B-Refi 2010B-R 2014 Notes, to the extent necessary to satisfy the applicable asset coverage tests on a pro forma basis after giving effect to all payments made in respect of the notes, which we refer to as a mandatory redemption, or to obtain the necessary ratings confirmation. If any asset coverage test with respect to the Class A 20142018 Notes, the Class B 20142018 Notes, Class C-1 2018 Notes, Class C-2 2018 Notes or Class C 2014D 2018 Notes is not met, proceeds from the portfolio of loan investments that otherwise would have been distributed to the holders of the Class C 2014C-1 2018 Notes, Class C-2 2018 Notes, Class D 2018 Notes or Subordinated 2018 Notes and the 20142018 Issuer will instead be used to redeem first the Class A 20142018 Notes, then the Class B 2018 Notes and then the Class B 2014C-1 2018 Notes and Class C-2 2018 Notes, to the extent necessary to satisfy the applicable asset coverage tests on a pro forma basis after giving effect to all payments made in respect of the notes, which we refer to as a mandatory redemption, or to obtain the necessary ratings confirmation.
The value of the Class BB-R 2014 Notes, Class C-2 2018 Notes, Class D 2018 Notes, or Subordinated 2018 Notes could be adversely affected by a mandatory redemption because such redemption could result in the applicable notes being redeemed at par at a time when they are trading in the secondary market at a premium to their stated principal amount and when other investments bearing the same rate of interest may be difficult or expensive to acquire. A mandatory redemption could also result in a shorter investment duration than a holder of such notes may have wanted or anticipated, which could, in turn, result in such a holder incurring breakage costs on related hedging transactions. In addition, the reinvestment period under the 20102018 Debt Securitization may extend
through as late as July 20, 2018,January 15, 2023, which could affect the value of the collateral securing the Class B-Refi 2010C-2 2018 Notes, and the reinvestment period under the 2014 Debt Securitization may extend through as late as April 28,Class D 2018 which could affect the value of the collateral securing the Class C 2014Notes, or Subordinated 2018 Notes.
We may be required to assume liabilities of the 20102014 Issuer and the 20142018 Issuer and are indirectly liable for certain representations and warranties in connection with the 20102014 Debt Securitization and 20142018 Debt Securitization.
As part of the 2010 Debt Securitization, we entered into a master loan sale agreement under which we would be required to repurchase any loan (or participation interest therein) which was sold to the 2010 Issuer in breach of any representation or warranty made by us with respect to such loan on the date such loan was sold. To the extent we fail to satisfy any such repurchase obligation, the trustee of the 2010 Debt Securitization may, on behalf of the 2010 Issuer, bring an action against us to enforce these repurchase obligations.
The structure of the 2010 Debt Securitization is intended to prevent, in the event of our bankruptcy or the bankruptcy of Holdings, the consolidation of the 2010 Issuer with our operations or those of Holdings. The structure of the 2014 Debt Securitization is intended to prevent, in the event of our bankruptcy, the consolidation of the 2014 Issuer with our operations. The structure of the 2018 Debt Securitization is intended to prevent, in the event of our bankruptcy or the bankruptcy of the CLO Depositor, the consolidation of the 2018 Issuer with our operations or those of the CLO Depositor. If the true sale of the assets in the 20102014 Debt Securitization or 2014and the 2018 Debt Securitization, as applicable, were not respected in the event of our insolvency, a trustee or debtor-in-possession might reclaim the assets of the 20102014 Issuer and the 20142018 Issuer for our estate. However, in doing so, we would become directly liable for all of the indebtedness then outstanding under the 20102014 Debt Securitization and the 20142018 Debt Securitization, which would equal the full amount of debt of the 20102014 Issuer and the 20142018 Issuer reflected on our consolidated balance sheet. In addition, we cannot assure you that the recovery in the event we were
consolidated with the 20102014 Issuer or 2014the 2018 Issuer for purposes of any bankruptcy proceeding would exceed the amount to which we would otherwise be entitled as an indirect holder of the Subordinated 2010 Notes and the holder of the Class CC-R 2014 Notes, and the indirect holder of the Class C-2 2018 Notes and Class D 2018 Notes had we not been consolidated with the 20102014 Issuer and the 20142018 Issuer.
In addition, in connection with each of the 20102014 Debt Securitization and the 20142018 Debt Securitization, we indirectly gave the lenders certain customary representations with respect to the legal structure of the 20102014 Issuer and the 20142018 Issuer, respectively, and the quality of the assets transferred to each entity. We remain indirectly liable for any breach of such representations for the life of the 20102014 Debt Securitization and the 20142018 Debt Securitization, respectively.
The 20102018 Issuer may issue additional Subordinated 2010 Notes and the 2014 Issuer may issue additional 20142018 Notes.
Under the terms of the 20102018 Debt Securitization documents, the 20102018 Issuer could issue additional Subordinated 20102018 Notes and use the net proceeds of such issuance to purchase additional portfolio loans. Any such additional issuance, however, would require the consent of the collateral manager to the 20102018 Debt Securitization, the CLO Depositor and the approval of a majoritysupermajority of the Subordinated 20102018 Notes. Among the other conditions that must be satisfied in connection with an additional issuance of Subordinated 20102018 Notes, the aggregate principal amount of all additional issuances of Subordinated 20102018 Notes may not exceed $97 million;100% of the 2010respective original outstanding principal amount of the Subordinated 2018 Notes; the 2018 Issuer must notify each rating agency of such issuance prior to the issuance date; and the terms of the Subordinated 20102018 Notes to be issued must be identical to the terms of previously issued Subordinated 20102018 Notes (except that all moniesthe interest due on such additional Subordinated 20102018 Notes will accrue from the issue date of such notes and that the pricesinterest rate and price of such Subordinated 20102018 Notes domay be lower (but not have to be identical tohigher) than those of the initial Subordinated 20102018 Notes). We do not expect to cause the 20102018 Issuer to issue any additional Subordinated 20102018 Notes at this time. We may amend the 20102018 Debt Securitization documents from time to time, and without amendment, the 20102018 Debt Securitization documents do not provide for additional issuances of Class A-Refi 2010 Notes or Class B-Refi 2010A 2018 Notes. The total purchase price for any additional Subordinated 20102018 Notes that may be issued may not always equal 100% of the par value of such 20102018 Notes, depending on several factors, including fees and closing expenses.
Under the terms of the 2014 Debt Securitization documents, the 2014 Issuer could issue additional 2014 Notes in any class at any time during the reinvestment period on a pro rata basis for each class of notes or, if additional Class A 2014 Notes are not being issued, on a pro rata basis for all classes that are subordinate to the Class A 2014 Notes and use the net proceeds of such issuance to purchase additional portfolio loans or for another permitted use as provided in the 2014 Debt Securitization documents. Any such additional issuance, however, would require the consent of the collateral manager to the 2014 Debt Securitization and either the holders of a majority the Class A 2014 Notes or, in the case of an additional issuance of Class A 2014 Notes, the holders of a supermajority of the Class A 2014 Notes. Among the other conditions that must be satisfied in connection with an additional issuance of 2014 Notes, the aggregate principal amount of all additional issuances of any class of 2014 Notes may not exceed 100% of the outstanding principal amount of such class of 2014 Notes; the 2014 Issuer must notify each rating agency of such issuance prior to the issuance date and such rating agency, if it then rates any class of 2014 Notes, must confirm in writing that no immediate withdrawal or reduction with respect to its then-current rating of any such class of 2014 Notes will occur as a result of such issuance; and the terms of the 2014 Notes to be issued must be identical to the terms of previously issued 2014 Notes of the same class (except that all monies due on such additional 2014 Notes will accrue from the issue date of such notes and that the prices of such 2014 Notes do not have to be identical to those of the initial 2014 Notes). We do not expect to cause the 2014 Issuer to issue any additional 2014 Notes at this time. The total purchase price for any additional 2014 Notes that may be issued may not always equal 100% of the par value of such 2014 Notes, depending on several factors, including fees and closing expenses.
We are subject to risks associated with the Revolving Credit Facility.Facilities.
On July 21, 2011, Funding, our wholly owned subsidiary, entered into the Credit Facility, a senior secured revolving credit facility. As a result of theour Revolving Credit Facility,Facilities, we are subject to a variety of risks, including those set forth below.
Our interests in Funding and 2010 Issuer are subordinated and we may not receive cash on our equity interests from Funding.Funding and 2010 Issuer.
We own directly or indirectly 100% of the equity interests in Funding.Funding and 2010 Issuer. We consolidate the financial statements of Funding and 2010 Issuer in our consolidated financial statements and treat the indebtedness of Fundingunder the Revolving Credit Facilities as our leverage. Our interests in Funding and 2010 Issuer are subordinated in priority of payment to every other obligation of Funding and 2010 Issuer and are subject to certain payment restrictions set forth in theeach Revolving Credit Facility. We receive cash distributions on our equity interests in Funding and 2010 Issuer only if Funding hasand 2010 Issuer have made all required cash interest payments to the respective lenders and no default exists under the respective Revolving Credit Facility. We cannot assure you that
distributions on the assets held by Funding or 2010 Issuer will be sufficient to make any distributions to us or that such distributions will meet our expectations.
We receive cash from Funding or 2010 Issuer only to the extent that we receive distributions on our equity interests in Funding. Funding and 2010 Issuer. Funding and 2010 Issuer each may make distributions on itstheir equity interests only to the extent permitted by the payment priority provisions of the applicable Revolving Credit Facility. TheEach of the Revolving Credit FacilityFacilities generally provides that payments on suchthe respective interests may not be made on any payment date unless all amounts owing to the lenders and other secured parties are paid in full. In addition, if Funding doesor 2010 do not meet the asset coverage tests or the interest coverage test set forth in the documents of the applicable Revolving Credit Facility, documents,a default would occur. In the event of a default under either Revolving Credit Facility document, cash would be diverted from us to first pay the
Lender applicable lender and other secured parties in amounts sufficient to cause such tests to be satisfied. In the event that we fail to receive cash from Funding and/or 2010 Issuer, we could be unable to make distributions to our stockholders in amounts sufficient to maintain our status as a RIC, or at all. We also could be forced to sell investments in portfolio companies at less than their fair value in order to continue making such distributions.
Our equity interests in Funding and 2010 Issuer rank behind all of the secured and unsecured creditors, known or unknown, of Funding and 2010 Issuer, as applicable, including the lenders in the respective Revolving Credit Facility. Consequently, to the extent that the value of Funding’s or 2010 Issuer's portfolio of loan investments has been reduced as a result of conditions in the credit markets, defaulted loans, capital gains and losses on the underlying assets, prepayment or changes in interest rates, the returnreturns on our investmentinvestments in Funding or 2010 Issuer could be reduced. Accordingly, our investmentinvestments in each of Funding and 2010 Issuer may be subject to up to 100% loss.
The ability to sell investments held by Funding and 2010 Issuer is limited.
TheEach of the Revolving Credit Facility placesFacilities place significant restrictions on our ability, as servicer, to sell investments. As a result, there may be times or circumstances during which we are unable to sell investments or take other actions that might be in our best interests.
We are subject to risks associated with our SBIC Funds.
As a result of our SBIC Funds, we are subject to a variety of risks, including those set forth below.
Our interests in the SBIC Funds are subordinated and we may not receive cash on our equity interests from either of the SBIC Funds.
We own 100% of the equity interests in SBIC IV, SBIC V and SBIC V.VI. We consolidate the financial statements of each of the SBIC Funds in our consolidated financial statements. Our interests in the SBIC Funds are subordinated in priority of payment to the SBA-guaranteed debentures issued by the respective SBIC Fund. We receive cash from SBIC IV, SBIC V and SBIC VVI only to the extent that we receive distributions on our equity interests in each such SBIC Fund. Our SBIC Funds may be limited by SBA regulations governing SBICs from making certain distributions to us unless we request a waiver of the SBA restrictions. We cannot assure you that the SBA would grant any such waiver. In the event that we fail to receive cash from our SBIC Funds, we could be unable to make distributions to our stockholders in amounts sufficient to maintain our status as a RIC, or at all. We also could be forced to sell investments in portfolio companies at less than their fair value in order to continue making such distributions.
Our SBIC Funds are licensed by the SBA and are subject to SBA regulations which limit the scope of investments available to the SBIC Funds.
Our wholly-owned subsidiaries, SBIC IV, SBIC V and SBIC V,VI, received licenses to operate as SBICs under the Small Business Act of 1958, as amended, or the 1958 Act, and are regulated by the SBA. The SBA places certain limitations on the financing terms of investments by SBICs in portfolio companies and regulates the types of financings and prohibits investing in certain industries. Compliance with SBIC requirements may cause our SBIC Funds to invest at less competitive rates in order to qualify investments under the SBA regulations.
Further, SBA regulations require that a licensed SBIC be periodically examined and audited by the SBA to determine its compliance with the relevant regulations. If our SBIC Funds fail to comply with applicable regulations, the SBA could, depending on the severity of the violation, limit or prohibit their use of debentures, declare outstanding debentures immediately due and payable, and/or limit them from making new investments. In addition, the SBA could revoke or suspend our SBIC Funds’ licenses for willful or repeated violation of, or willful
or repeated failure to observe, any provision of the 1958 Act or any rule or regulation promulgated thereunder. These actions by the SBA could have a material adverse effect on our business, financial condition and results of operations.
Our ability to invest in public companies may be limited in certain circumstances.
To maintain our status as a business development company, we are not permitted to acquire any assets other than “qualifying assets” specified in the 1940 Act unless, at the time the acquisition is made, at least 70% of our total assets are qualifying assets (with certain limited exceptions). Subject to certain exceptions for follow-on investments and investments in distressed companies, an investment in an issuer that has outstanding securities listed on a national securities exchange may be treated as qualifying assets only if such issuer has a common equity market capitalization that is less than $250.0 million at the time of such investment.
We may enter into reverse repurchase agreements, which are another form of leverage.
We may enter into reverse repurchase agreements as part of our management of our temporary investment portfolio. Under a reverse repurchase agreement, we will effectively pledge our assets as collateral to secure a short-term loan. Generally, the other party to the agreement makes the loan in an amount equal to a percentage of the fair value of the pledged collateral. At the maturity of the reverse repurchase agreement, we will be required to repay the loan and correspondingly receive back our collateral. While used as collateral, the assets continue to pay principal and interest which are for the benefit of us.
Our use of reverse repurchase agreements, if any, involves many of the same risks involved in our use of leverage, as the proceeds from reverse repurchase agreements generally will be invested in additional securities. There is a risk that the market value of the securities acquired in the reverse repurchase agreement may decline below the price of the securities that we have sold but remain obligated to purchase. In addition, there is a risk that the market value of the securities retained by us may decline. If a buyer of securities under a reverse repurchase agreement were to file for bankruptcy or experience insolvency, we may be adversely affected. Also, in entering into reverse repurchase agreements, we would bear the risk of loss to the extent that the proceeds of such agreements at settlement are less than the fair value of the underlying securities being pledged. In addition, due to the interest costs associated with reverse repurchase agreements, our net asset value would decline, and, in some cases, we may be worse off than if we had not used such agreements.
Adverse developments in the credit markets may impair our ability to enter into new debt financing arrangements.
During the economic downturn in the United States that began in mid-2007, many commercial banks and other financial institutions stopped lending or significantly curtailed their lending activity. In addition, in an effort to stem losses and reduce their exposure to segments of the economy deemed to be high risk, some financial institutions limited routine refinancing and loan modification transactions and even reviewed the terms of existing facilities to identify bases for accelerating the maturity of existing lending facilities. To the extent these circumstances arise again in the future, it may be difficult for us to finance the growth of our investments on acceptable economic terms, or at all and one or more of our leverage facilities could be accelerated by the lenders.
If we do not invest a sufficient portion of our assets in qualifying assets, we could fail to qualify as a business development company or be precluded from investing according to our current business strategy.
As a business development company, we may not acquire any assets other than “qualifying assets” unless, at the time of and after giving effect to such acquisition, at least 70% of our total assets are qualifying assets. See “Business — Regulation — Qualifying Assets.”
In the future, we believe that most of our investments will constitute qualifying assets. However, we may be precluded from investing in what we believe are attractive investments if such investments are not qualifying assets for purposes of the 1940 Act. If we do not invest a sufficient portion of our assets in qualifying assets, we could violate the 1940 Act provisions applicable to business development companies. As a result of such violation, specific rules under the 1940 Act could prevent us, for example, from making follow-on investments in existing portfolio companies (which could result in the dilution of our position) or could require us to dispose of investments at inappropriate times in order to come into compliance with the 1940 Act. If we need to dispose of such investments quickly, it could be difficult to dispose of such investments on favorable terms. We may not be able to find a buyer for such investments and, even if we do find a buyer, we may have to sell the investments at a substantial loss. Any
such outcomes would have a material adverse effect on our business, financial condition, results of operations and cash flows.
Failure to qualify as a business development company willwould decrease our operating flexibility
If we do not maintain our status as a business development company, we would be subject to regulation as a registered closed-end investment company under the 1940 Act. As a registered closed-end investment company, we would be subject to substantially more regulatory restrictions under the 1940 Act which would significantly decrease our operating flexibility.
The majority of our portfolio investments are recorded at fair value as determined in good faith by our board of directors and, as a result, there may be uncertainty as to the value of our portfolio investments.
The majority of our portfolio investments take the form of securities that are not publicly traded. The fair value of securities and other investments that are not publicly traded may not be readily determinable, and we value these securities at fair value as determined in good faith by our board of directors, including to reflect significant events affecting the value of our securities. As discussed in more detail under “Management’s Discussion and Analysis of Financial Condition and Results of Operations —- Critical Accounting Policies,” most, if not all, of our investments (other than cash and cash equivalents) are classified as Level 3 under Accounting Standards Codification, or ASC, Topic 820, Fair Value Measurement and Disclosure, as amended, or ASC Topic 820, as amended.820. This means that our portfolio valuations are based on unobservable inputs and our own assumptions about how market participants would price the asset or liability in question. Inputs into the determination of fair value of our portfolio investments require significant management judgment or estimation. Even if observable market data are available, such information may be the result of consensus pricing information or broker quotes, which may include a disclaimer that the broker would not be held to such a price in an actual transaction. The non-binding nature of consensus pricing and/or quotes accompanied by disclaimers materially reduces the reliability of such information.
We have retained the services of several independent service providers to review the valuation of these securities. At least once annually, the valuation for each portfolio investment for which a market quote is not readily available is reviewed by an independent valuation firm. The types of factors that the board of directors may take into account in determining the fair value
of our investments generally include, as appropriate, comparison to publicly traded securities, including such factors as yield, maturity and measures of credit quality, the enterprise value of a portfolio company, the nature and realizable value of any collateral, the portfolio company’s ability to make payments and its earnings and discounted cash flow, the markets in which the portfolio company does business and other relevant factors. Because such valuations, and particularly valuations of private securities and private companies, are inherently uncertain, may fluctuate over short periods of time and may be based on estimates, our determinations of fair value may differ materially from the values that would have been used if a ready market for these securities existed. Our net asset value could be adversely affected if our determinations regarding the fair value of our investments were materially higher than the values that we ultimately realize upon the disposal of such securities.
We adjust quarterly the valuation of our portfolio to reflect our board of directors’ determination of the fair value of each investment in our portfolio. Any changes in fair value are recorded in our consolidated statement of operations as net change in unrealized appreciation or depreciation.
We may experience fluctuations in our quarterly operating results.
We could experience fluctuations in our quarterly operating results due to a number of factors, including the interest rate payable on the debt securities we acquire, the default rate on such securities, the number and size of investments we originate or acquire, the level of our expenses, variations in and the timing of the recognition of realized and unrealized gains or losses, the degree to which we encounter competition in our markets and general economic conditions. In light of these factors, results for any period should not be relied upon as being indicative of our performance in future periods.
New or modified laws or regulations governing our operations may adversely affect our business.
We and our portfolio companies are subject to regulation by laws at the U.S. federal, state and local levels. These laws and regulations, as well as their interpretation, may change from time to time, including as the result of interpretive guidance or other directives from the U.S. President and others in the executive branch, and new laws, regulations and interpretations may also come into effect. Any such new or changed laws or regulations could have a material adverse effect on our business.
In particular the Dodd-Frank Wall Street Reform and Consumer Protection Act, or Dodd-Frank, impacts many aspects of the financial services industry, and it requires the development and adoption of many implementing regulations over the next several years. The effects of Dodd-Frank on the financial services industry will depend, in large part, upon the extent to which regulators exercise the authority granted to them and the approaches taken in implementing regulations. President Trump and certain members of Congress have indicated that they will seek to amend or repeal portions of Dodd-Frank and to overhaul the Code, among other federal laws, which may create regulatory uncertainty in the near term, and in March 2018 the U.S. Senate passed a bill that eased financial regulations and reduced oversight for certain entities. While the impact of Dodd-Frank and any federal tax reform legislation on us and our portfolio companies may not be known for an extended period of time, Dodd-Frank and any tax reform enacted as law, including future rules implementing its provisions and the interpretation of those rules, along with other legislative and regulatory proposals directed at the financial services industry or affecting taxation that are proposed or pending in the U.S. Congress, may negatively impact the operations, cash flows or financial condition of us or our portfolio companies, impose additional costs on us or our portfolio companies, intensify the regulatory supervision of us or our portfolio companies or otherwise adversely affect our business or the business of our portfolio companies. In addition, if we do not comply with applicable laws and regulations, we could lose any licenses that we then hold for the conduct of our business and may be subject to civil fines and criminal penalties.
Additionally, changes to the laws and regulations governing our operations, including those associated with RICs, may cause us to alter our investment strategy in order to avail ourselves of new or different opportunities or result in the imposition of corporate-level taxes on us. Such changes could result in material differences to our strategies and plans and may shift our investment focus from the areas of expertise of GC Advisors to other types of investments in which GC Advisors may have little or no expertise or experience. Any such changes, if they occur, could have a material adverse effect on our results of operations and the value of your investment. If we invest in commodity interests in the future, GC Advisors may determine not to use investment strategies that trigger additional regulation by the U.S. Commodity Futures Trading Commission, or CFTC, or may determine to operate subject to CFTC regulation, if applicable. If we or GC Advisors were to operate subject to CFTC regulation, we may incur additional expenses and would be subject to additional regulation.
In addition, certain regulations applicable to debt securitizations implementing credit risk retention requirements that have taken effect or will take effect in both the U.S. and in Europe may adversely affect certain amendments to or new issuances by the 2010 Debt Securitization or the 2014 Debt Securitization and may adversely affect or prevent us from entering into any future securitization transaction. The impact of these risk retention rules on the loan securitization market are uncertain, and such rules may cause an increase in our cost of funds under or may prevent us from completing any future securitization transactions or certain amendments to or new issuances by our existing debt securitizations. On October 21, 2014, U.S. risk retention rules adopted pursuant to Section 941 of Dodd-Frank or the U.S.(the "U.S. Risk Retention Rules,Rules") were issued.issued and became effective with respect to collateralized loan obligation ("CLOs") on December 24, 2016. The U.S. Risk Retention Rules require the sponsor (directly or through a majority-owned affiliate) of a debt securitization subject to such rules, such as collateralized loan obligations,CLOs, in the absence of an exemption, to retain an economic interest, or the Retention Interest, in the credit risk of the assets being securitized in the form of an eligible horizontal residual interest, an eligible vertical interest, or a combination thereof, in accordance with the requirements of the U.S. Risk Retention Rules. TheDue to the interplay of the 1940 Act restrictions on principal and joint transactions and the U.S. Risk Retention Rules, become effective December 24, 2016. We currently usewe sought no-action relief to ensure that we could engage in CLO financing under the 2010 Debt Securitization1940 Act and 2014 Debt Securitizationthe risk retention rules mandated by Section 941 of Dodd-Frank. On September 7, 2018 we received a no-action letter from the staff (the “Staff”) of the Division of Investment Management of the SEC that states that the Staff would not recommend that the SEC take any enforcement action under Section 57(a) of the1940 Act, or Rule 17d-1 under the 1940 Act against us or GC Advisors if we were to acquire CLO equity as a sourceRetention Interest in the manner described in a letter submitted to the Staff on behalf of long-term balance sheet financing for portfoliosus.
However, the no-action relief we received did not address whether or not the CLO transactions described therein would satisfy the requirements of middle-market loans. Generally, the financing costs associatedU.S. Risk Retention Rules. As a general matter, available interpretive authority to date addressing the U.S. Risk Retention Rules applicable to CLOs is limited, and there is limited judicial decisional authority or applicable agency interpretation that has directly addressed any of the risk retention approaches taken with debt
securitizations of this type are significantly more favorable thanrespect to CLOs. Accordingly, there can be no assurance that the financing costsapplicable federal agencies will agree that any CLO transaction we would incurundertake, or the manner in connection with a traditional senior secured credit facility. However, it is unclear whetherwhich we will be able to use these types of debt securitizations to finance our existing loans or to originate future loans in compliancehold any retention interests, complies with the U.S. Risk Retention Rules after December 24, 2016.Rules. If we ever determined that undertaking CLO transactions would subject us or any of our affiliates to unacceptable regulatory risk, our ability to execute CLOs may be limited or otherwise curtailed. Given the more attractive financing costs associated with these types of debt securitization as opposed to other types of financing available (such as traditional senior secured facilities), this would, in turn, increase our financing costs. Any associated increase in financing costs would ultimately be borne by our common stockholders.
On February 3, 2017, President Trump signed Executive Order 13772 announcing the Administration's policy to regulate the U.S. financial system in a manner consistent with certain "Core Principles," including regulation that is efficient, effective and appropriately tailored. The Executive Order directed the Secretary of the Treasury, in
consultation with the heads of the member agencies of the Financial Stability Oversight Council, to report to the President on the extent to which existing laws, regulations and other government policies promote the Core Principles and to identify any laws, regulations or other government policies that inhibit federal regulation of the U.S. financial system. On June 12, 2017, the U.S. Department of the Treasury published the first of several reports in response to the Executive Order on the depository system covering banks and other savings institutions. On October 6, 2017, the Treasury released a second report outlining ways to streamline and reform the U.S. regulatory system for capital markets, followed by a third report, on October 26, 2017, examining the current regulatory framework for the asset management and insurance industries. Subsequent reports are expected to address: retail and institutional investment products and vehicles; non-bank financial institutions; financial technology; and financial innovation.
On December 22, 2017, the Tax Cuts and Jobs Act was enacted into law. The Tax Cuts and Jobs Act makes significant changes to the U.S. income tax rules applicable to both individuals and entities, including corporations. The Tax Cuts and Jobs Act includes provisions that, among other things, reduce the U.S. corporate tax rate from 35 percent to 21 percent, introduce a capital investment deduction, limit the interest deduction, limit the use of net operating losses to offset future taxable income, repeal the corporate alternative minimum tax and make extensive changes to the U.S. international tax system. The Tax Cuts and Jobs Act is complex and far-reaching, and we cannot predict the impact its enactment will have on us, our subsidiaries, our portfolio companies and the holders of our securities.
On May 24, 2018, President Trump signed into law the Economic Growth, Regulatory Relief, and Consumer Protection Act, which increased from $50 billion to $250 billion the asset threshold for designation of "systemically important financial institutions" or "SIFIs" subject to enhanced prudential standards set by the Federal Reserve Board, staggering application of this change based on the size and risk of the covered bank holding company. On May 30, 2018, the Federal Reserve Board voted to consider changes to the Volcker Rule that would loosen compliance requirements for all banks. The effect of this change and any further rules or regulations are and could be complex and far-reaching, and the change and any future laws or regulations or changes thereto could negatively impact our operations, cash flows or financial condition, impose additional costs on us, intensify the regulatory supervision of us or otherwise adversely affect our business, financial condition and results of operations.
Over the last several years, there also has been an increase in regulatory attention to the extension of credit outside of the traditional banking sector, raising the possibility that some portion of the non-bank financial sector will be subject to new regulation. While it cannot be known at this time whether any regulation will be implemented or what form it will take, increased regulation of non-bank credit extension could negatively impact our operations, cash flows or financial condition, impose additional costs on us, intensify the regulatory supervision of us or otherwise adversely affect our business, financial condition and results of operations.
Changes to U.S. tariff and import/export regulations may have a negative effect on our portfolio companies and, in turn, harm us.
There has been ongoing discussion and commentary regarding potential significant changes to U.S. trade policies, treaties and tariffs. The current U.S. presidential administration, along with the U.S. Congress, has created significant uncertainty about the future relationship between the United States and other countries with respect to trade policies, treaties and tariffs. These developments, or the perception that any of them could occur, may have a material adverse effect on global economic conditions and the stability of global financial markets, and may significantly reduce global trade and, in particular, trade between the impacted nations and the United States. Any of these factors could depress economic activity and restrict our portfolio companies' access to suppliers or customers and have a material adverse effect on their business, financial condition and results of operations, which in turn would negatively impact us.
Our board of directors may change our investment objective, operating policies and strategies without prior notice or stockholder approval.
Our board of directors has the authority, except as otherwise provided in the 1940 Act, to modify or waive our investment objective and certain of our operating policies and strategies without prior notice and without stockholder approval. However, absent stockholder approval, we may not change the nature of our business so as to cease to be, or withdraw our election as, a business development company. Under Delaware law, we also cannot be dissolved without prior stockholder approval. We cannot predict the effect any changes to our current investment objective, operating policies and strategies would have on our business, operating results and the price of our
common stock. Nevertheless, any such changes could adversely affect our business and impair our ability to make distributions.
Provisions of the General Corporation Law of the State of Delaware and our certificate of incorporation and bylaws could deter takeover attempts and have an adverse effect on the price of our common stock.
The General Corporation Law of the State of Delaware, or the DGCL, contains provisions that may discourage, delay or make more difficult a change in control of us or the removal of our directors. Our certificate of incorporation and bylaws contain provisions that limit liability and provide for indemnification of our directors and officers. These provisions and others also may have the effect of deterring hostile takeovers or delaying changes in control or management. We are subject to Section 203 of the DGCL, the application of which is subject to any applicable requirements of the 1940 Act. This section generally prohibits us from engaging in mergers and other business combinations with stockholders that beneficially own 15% or more of our voting stock, or with their affiliates, unless our directors or stockholders approve the business combination in the prescribed manner. If our board of directors does not approve a business combination, Section 203 of the DGCL may discourage third parties from trying to acquire control of us and increase the difficulty of consummating such an offer.
We have also adopted measures that may make it difficult for a third party to obtain control of us, including provisions of our certificate of incorporation classifying our board of directors in three classes serving staggered three-year terms, and provisions of our certificate of incorporation authorizing our board of directors to classify or reclassify shares of our preferred stock in one or more classes or series, to cause the issuance of additional shares of our stock, and to amend our certificate of incorporation, without stockholder approval, to increase or decrease the number of shares of stock that we have authority to issue.in certain instances. These provisions, as well as other provisions of our certificate of incorporation and bylaws, may delay, defer or prevent a transaction or a change in control that might otherwise be in the best interests of our securityholders.
GC Advisors can resign on 60 days’ notice, and we may not be able to find a suitable replacement within that time, resulting in a disruption in our operations that could adversely affect our financial condition, business and results of operations.
GC Advisors has the right to resign under the Investment Advisory Agreement at any time upon not less than 60 days’ written notice, whether we have found a replacement or not. If GC Advisors resigns, we may not be able to find a new investment adviser or hire internal management with similar expertise and ability to provide the same or equivalent services on acceptable terms within 60 days, or at all. If we are unable to do so quickly, our operations are likely to experience a disruption, our business, financial condition, results of operations and cash flows as well as our ability to pay distributions are likely to be adversely affected and the market price of our shares may decline. In addition, the coordination of our internal management and investment activities is likely to suffer if we are unable to identify and reach an agreement with a single institution or group of executives having the expertise possessed by GC Advisors and its affiliates. Even if we are able to retain comparable management, whether internal or external, the integration of such management and their lack of familiarity with our investment objective may result in additional costs and time delays that may adversely affect our business, financial condition, results of operations and cash flows.
The Administrator can resign on 60 days’ notice, and we may not be able to find a suitable replacement, resulting in a disruption in our operations that could adversely affect our financial condition, business and results of operations.
The Administrator has the right to resign under the Administration Agreement at any time upon not less than 60 days’ written notice, whether we have found a replacement or not. If the Administrator resigns, we may not be able to find a new administrator or hire internal management with similar expertise and ability to provide the same or equivalent services on acceptable terms, or at all. If we are unable to do so quickly, our operations are likely to experience a disruption, our financial condition, business and results of operations as well as our ability to pay distributions are likely to be adversely affected and the market price of our shares may decline. In addition, the coordination of our internal management and administrative activities is likely to suffer if we are unable to identify and reach an agreement with a service provider or individuals with the expertise possessed by the Administrator. Even if we are able to retain a comparable service provider or individuals to perform such services, whether internal or external, their integration into our business and lack of familiarity with our investment objective may result in additional costs and time delays that may adversely affect our business, financial condition, results of operations and cash flows.
We incur significant costs as a result of being a publicly traded company.
As a publicly traded company, we incur legal, accounting and other expenses, including costs associated with the periodic reporting requirements applicable to a company whose securities are registered under the Exchange Act, as well as additional corporate governance requirements, including requirements under the Sarbanes-Oxley Act and other rules implemented by the SEC.
Our compliance with Section 404 of the Sarbanes-Oxley Act involves significant expenditures, and non-compliance with Section 404 of the Sarbanes-Oxley Act would adversely affect us and the market price of our common stock.
We are required to report on our internal control over financial reporting pursuant to Section 404 of the Sarbanes-Oxley Act and related rules and regulations of the SEC. As a result, we incur expenses that may negatively impact our financial performance and our ability to make distributions. This process also results in a diversion of management’s time and attention. We cannot ensure that our evaluation, testing and remediation process is effective or that our internal control over financial reporting will be effective. In the event that we are unable to maintain compliance with Section 404 of the Sarbanes-Oxley Act and related rules, we and the market price of our securities would be adversely affected.
We are highly dependent on information systems and systems failures or cyberattacks could significantly disrupt our business, which may, in turn, negatively affect the market price of our common stock and our ability to pay dividends and other distributions.
Our business depends on the communications and information systems of GC Advisors and its affiliates. These systems are subject to potential attacks, including through adverse events that threaten the confidentiality, integrity or availability of our information resources (i.e., cyber incidents). These attacks could involve gaining unauthorized access to our information systems for purposes of misappropriating assets, stealing confidential information, corrupting data or causing operational disruption and result in disrupted operations, misstated or unreliable financial data, liability for stolen assets or information, increased cybersecurity protection and insurance costs, litigation and damage to our business relationships, any of which could, in turn, have a material adverse effect on our operating results and negatively affect the market price of our securities and our ability to pay dividends and other distributions to our securityholders. As our reliance on technology has increased, so have the risks posed to our information systems, both internal and those provided by GC Advisors and third-party service providers.
Our business and operations could be negatively affected if we become subject to stockholder activism, which could cause us to incur significant expense, hinder the execution of our investment strategy or impact our stock price.
Stockholder activism, which could take many forms, including making public demands that we consider certain strategic alternatives, engaging in public campaigns to attempt to influence our corporate governance and/or our management, and commencing proxy contests to attempt to elect the activists’ representatives or others to our board of directors, or arise in a variety of situations, has been increasing in the business development company space recently. While we are currently not subject to any stockholder activism, due to the potential volatility of our stock price and for a variety of other reasons, we may in the future become the target of stockholder activism. Stockholder activism could result in substantial costs and divert management’s and our board of directors’ attention and resources from our business. Additionally, such stockholder activism could give rise to perceived uncertainties as to our future and adversely affect our relationships with service providers and our portfolio companies. Also, we may be required to incur significant legal and other expenses related to any activist stockholder matters. Further, our stock price could be subject to significant fluctuation or otherwise be adversely affected by the events, risks and uncertainties of any stockholder activism.
Risks Relating to Our Investments
Economic recessions or downturns could impair our portfolio companies and defaults by our portfolio companies will harm our operating results.
Many of our portfolio companies are susceptible to economic slowdowns or recessions and may be unable to repay our loans during these periods. Therefore, our non-performing assets are likely to increase and the value of our portfolio is likely to decrease during these periods. Adverse economic conditions may decrease the value of collateral securing some of our loans and the value of our equity investments. Economic slowdowns or recessions could lead to financial losses in our portfolio and a decrease in revenues, net income and assets. Unfavorable economic conditions also could increase our funding costs, limit our access to the capital markets or result in a
decision by lenders not to extend credit to us. These events could prevent us from increasing our investments and harm our operating results.
A portfolio company’s failure to satisfy financial or operating covenants imposed by us or other lenders could lead to defaults and, potentially, termination of its loans and foreclosure on its assets, which could trigger cross-defaults under other agreements and jeopardize our portfolio company’s ability to meet its obligations under the debt securities that we hold. We may incur expenses to the extent necessary to seek recovery upon default or to negotiate new terms with a defaulting portfolio company. In addition, lenders in certain cases can be subject to lender liability claims for actions taken by them when they
become too involved in the borrower’s business or exercise control over a borrower. It is possible that we could become subject to a lender’s liability claim, including as a result of actions taken if we render managerial assistance to the borrower.
Our debt investments may be risky and we could lose all or part of our investments.
The debt that we invest in is typically not initially rated by any rating agency, but we believe that if such investments were rated, they would be below investment grade (rated lower than “Baa3” by Moody’s Investors Service, lower than “BBB-” by Fitch Ratings or lower than “BBB-” by Standard & Poor’s Ratings Services), which under the guidelines established by these entities is an indication of having predominantly speculative characteristics with respect to the issuer’s capacity to pay interest and repay principal. Bonds that are rated below investment grade are sometimes referred to as “high yield bonds” or “junk bonds.” Therefore, our investments may result in an above average amount of risk and volatility or loss of principal.
Our investments in leveraged portfolio companies may be risky, and you could lose all or part of your investment.
Investment in leveraged companies involves a number of significant risks. Leveraged companies in which we invest may have limited financial resources and may be unable to meet their obligations under their debt securities that we hold. Such developments may be accompanied by a deterioration in the value of any collateral and a reduction in the likelihood of our realizing any guarantees that we may have obtained in connection with our investment. Smaller leveraged companies also may have less predictable operating results and may require substantial additional capital to support their operations, finance their expansion or maintain their competitive position.
Our investments in private and middle-market portfolio companies are risky, and you could lose all or part of your investment.
Investment in private and middle-market companies involves a number of significant risks. Generally, little public information exists about these companies, and we rely on the ability of GC Advisors’ investment professionals to obtain adequate information to evaluate the potential returns from investing in these companies. If GC Advisors is unable to uncover all material information about these companies, it may not make a fully informed investment decision, and we may lose money on our investments. Middle-market companies generally have less predictable operating results and may require substantial additional capital to support their operations, finance expansion or maintain their competitive position. Middle-market companies may have limited financial resources, may have difficulty accessing the capital markets to meet future capital needs and may be unable to meet their obligations under their debt securities that we hold, which may be accompanied by a deterioration in the value of any collateral and a reduction in the likelihood of our realizing any guarantees we may have obtained in connection with our investment. In addition, such companies typically have shorter operating histories, narrower product lines and smaller market shares than larger businesses, which tend to render them more vulnerable to competitors’ actions and market conditions, as well as general economic downturns. Additionally, middle-market companies are more likely to depend on the management talents and efforts of a small group of persons. Therefore, the death, disability, resignation or termination of one or more of these persons could have a material adverse impact on our portfolio company and, in turn, on us. Middle-market companies also may be parties to litigation and may be engaged in rapidly changing businesses with products subject to a substantial risk of obsolescence. In addition, our executive officers, directors and GC Advisors may, in the ordinary course of business, be named as defendants in litigation arising from our investments in the portfolio companies.
The lack of liquidity in our investments may adversely affect our business.
We may invest all of our assets in illiquid securities, and a substantial portion of our investments in leveraged companies are and will be subject to legal and other restrictions on resale or will otherwise be less liquid than more broadly traded public securities. The illiquidity of these investments may make it difficult for us to sell such investments if the need arises. In addition, if we are required to liquidate all or a portion of our portfolio quickly, we
may realize significantly less than the value at which we have previously recorded our investments. We may also face other restrictions on our ability to liquidate an investment in a portfolio company to the extent that we, GC Advisors, Golub Capital or any of its affiliates have material nonpublic information regarding such portfolio company.
Price declines and illiquidity in the corporate debt markets may adversely affect the fair value of our portfolio investments, reducing our net asset value through increased net unrealized depreciation.
As a business development company, we are required to carry our investments at market value or, if no market value is ascertainable, at fair value as determined in good faith by our board of directors. As part of the valuation process, we may take into account the following types of factors, if relevant, in determining the fair value of our investments:
a comparison of the portfolio company’s securities to publicly traded securities;
the enterprise value of the portfolio company;
the nature and realizable value of any collateral;
the portfolio company’s ability to make payments and its earnings and discounted cash flow;
the markets in which the portfolio company does business; and
changes in the interest rate environment and the credit markets generally that may affect the price at which similar investments may be made in the future and other relevant factors.
When an external event such as a purchase transaction, public offering or subsequent equity sale occurs, we use the pricing indicated by the external event to corroborate our valuation. We record decreases in the market values or fair values of our investments as unrealized depreciation. Declines in prices and liquidity in the corporate debt markets may result in significant net unrealized depreciation in our portfolio. The effect of all of these factors on our portfolio may reduce our net asset value by increasing net unrealized depreciation in our portfolio. Depending on market conditions, we could incur substantial realized losses and may suffer additional unrealized losses in future periods, which could have a material adverse effect on our business, financial condition, results of operations and cash flows.
Our portfolio companies may prepay loans, which may reduce our yields if capital returned cannot be invested in transactions with equal or greater expected yields.
The loans in our investment portfolio may be prepaid at any time, generally with little advance notice. Whether a loan is prepaid will depend both on the continued positive performance of the portfolio company and the existence of favorable financing market conditions that allow such company the ability to replace existing financing with less expensive capital. As market conditions change, we do not know when, and if, prepayment may be possible for each portfolio company. In some cases, the prepayment of a loan may reduce our achievable yield if the capital returned cannot be invested in transactions with equal or greater expected yields, which could have a material adverse effect on our business, financial condition and results of operations.
Our portfolio companies may be unable to repay or refinance outstanding principal on their loans at or prior to maturity, and rising interests rates may make it more difficult for portfolio companies to make periodic payments on their loans.
Our portfolio companies may be unable to repay or refinance outstanding principal on their loans at or prior to maturity. This risk and the risk of default is increased to the extent that the loan documents do not require the portfolio companies to pay down the outstanding principal of such debt prior to maturity. In addition, if general interest rates rise, there is a risk that our portfolio companies will be unable to pay escalating interest amounts, which could result in a default under their loan documents with us. Rising interestsinterest rates could also cause portfolio companies to shift cash from other productive uses to the payment of interest, which may have a material adverse effect on their business and operations and could, over time, lead to increased defaults. Any failure of one or more portfolio companies to repay or refinance its debt at or prior to maturity or the inability of one or more portfolio companies to make ongoing payments following an increase in contractual interest rates could have a material adverse effect on our business, financial condition, results of operations and cash flows.
We have not yet identified the portfolio company investments we will acquire.
While we currently hold a portfolio of investments, we have not yet identified additional potential investments for our portfolio that we will acquire with the proceeds of any offering of securities or repayments of investments currently in our portfolio. Privately negotiated investments in illiquid securities or private middle-market companies require substantial due diligence and structuring, and we cannot assure you that we will achieve our anticipated investment pace. As a result, you will be unable to evaluate any future portfolio company investments prior to purchasing our shares of common stock. Additionally, GC Advisors selects all of our investments, and our stockholders will have no input with respect to such investment decisions. These factors increase the uncertainty, and thus the risk, of investing in our securities. We anticipate that we will use substantially all of the net proceeds of any offering of our securities within approximately six months following the completion of any offering of our securities, depending on the availability of appropriate investment opportunities consistent with our investment objectives and market conditions. Until such appropriate investment opportunities can be found, we may also invest the net proceeds in cash, cash equivalents, U.S. government securities and high-quality debt investments that mature in one year or less from the date of investment. We expect these temporary investments to earn yields substantially lower than the income that we expect to receive in respect of our targeted investment types. As a result, any distributions we make during this period may be substantially smaller than the distributions that we expect to pay when our portfolio is fully invested.
We are a non-diversified investment company within the meaning of the 1940 Act, and therefore we are not limited with respect to the proportion of our assets that may be invested in securities of a single issuer.
We are classified as a non-diversified investment company within the meaning of the 1940 Act, which means that we are not limited by the 1940 Act with respect to the proportion of our assets that we may invest in securities of a single issuer. To the extent that we assume large positions in the securities of a small number of issuers, our net asset value may fluctuate to a greater extent than that of a diversified investment company as a result of changes in the financial condition or the market’s assessment of the issuer. We may also be more susceptible to any single economic or regulatory occurrence than a diversified investment company. Beyond our asset diversification requirements as a RIC under the Code, we do not have fixed guidelines for diversification, and our investments could be concentrated in relatively few portfolio companies. Although we are classified as a non-diversified investment company within the meaning of the 1940 Act, we maintain the flexibility to operate as a diversified investment company and have done so for an extended period of time. To the extent that we operate as a non-diversified investment company in the future, we may be subject to greater risk.
Our portfolio may be concentrated in a limited number of portfolio companies and industries, which will subject us to a risk of significant loss if any of these companies defaults on its obligations under any of its debt instruments or if there is a downturn in a particular industry.
Our portfolio may be concentrated in a limited number of portfolio companies and industries. As a result, the aggregate returns we realize may be significantly and adversely affected if a small number of investments perform poorly or if we need to write down the value of any one investment. Additionally, while we are not targeting any specific industries, our investments may be concentrated in relatively few industries. For example, although we classify the industries of our portfolio companies by end-market (such as healthcare andor business services) and not by the products or services (such as software) directed to those end-markets, many of our portfolio companies principally provide software products or services, which exposes us to
downturns in that sector. As a result, a downturn in any particular industry in which we are invested could also significantly impact the aggregate returns we realize.
We may hold the debt securities of leveraged companies that may, due to the significant volatility of such companies, enter into bankruptcy proceedings.
Leveraged companies may experience bankruptcy or similar financial distress. The bankruptcy process has a number of significant inherent risks. Many events in a bankruptcy proceeding are the product of contested matters and adversary proceedings and are beyond the control of the creditors. A bankruptcy filing by an issuer may adversely and permanently affect the issuer. If the proceeding is converted to a liquidation, the value of the issuer may not equal the liquidation value that was believed to exist at the time of the investment. The duration of a bankruptcy proceeding is also difficult to predict, and a creditor’s return on investment can be adversely affected by delays until the plan of reorganization or liquidation ultimately becomes effective. The administrative costs of a bankruptcy proceeding are frequently high and would be paid out of the debtor’s estate prior to any return to creditors. Because the standards for classification of claims under bankruptcy law are vague, our influence with respect to the class of securities or other obligations we own may be lost by increases in the number and amount of
claims in the same class or by different classification and treatment. In the early stages of the bankruptcy process, it is often difficult to estimate the extent of, or even to identify, any contingent claims that might be made. In addition, certain claims that have priority by law (for example, claims for taxes) may be substantial.
Depending on the facts and circumstances of our investments and the extent of our involvement in the management of a portfolio company, upon the bankruptcy of a portfolio company, a bankruptcy court may recharacterize our debt investments as equity interests and subordinate all or a portion of our claim to that of other creditors. This could occur even though we may have structured our investment as senior debt.
Our failure to make follow-on investments in our portfolio companies could impair the value of our portfolio.
Following an initial investment in a portfolio company, we may make additional investments in that portfolio company as “follow-on” investments, in seeking to:
increase or maintain in whole or in part our position as a creditor or equity ownership percentage in a portfolio company;
exercise warrants, options or convertible securities that were acquired in the original or subsequent financing; or
preserve or enhance the value of our investment.
We have discretion to make follow-on investments, subject to the availability of capital resources. Failure on our part to make follow-on investments may, in some circumstances, jeopardize the continued viability of a portfolio company and our initial investment, or may result in a missed opportunity for us to increase our participation in a successful portfolio company. Even if we have sufficient capital to make a desired follow-on investment, we may elect not to make a follow-on investment because we may not want to increase our level of risk, because we prefer other opportunities or because of regulatory or other considerations. Our ability to make follow-on investments may also be limited by GC Advisors’ allocation policy.
Because we generally do not hold controlling equity interests in our portfolio companies, we may not be able to exercise control over our portfolio companies or to prevent decisions by management of our portfolio companies that could decrease the value of our investments.
To the extent we do not hold controlling equity positions in our portfolio companies, we are subject to the risk that a portfolio company may make business decisions with which we disagree, and that the management and/or stockholders of a portfolio company may take risks or otherwise act in ways that are adverse to our interests. Due to the lack of liquidity of the debt and equity investments that we typically hold in our portfolio companies, we may not be able to dispose of our investments in the event we disagree with the actions of a portfolio company and may therefore suffer a decrease in the value of our investments.
Our portfolio companies may incur debt that ranks equally with, or senior to, our investments in such companies and such portfolio companies may not generate sufficient cash flow to service their debt obligations to us.
We have invested a portion of our capital in second lien and subordinated loans issued by our portfolio companies and intend to continue to do so in the future. Our portfolio companies may have, or may be permitted to incur, other debt that ranks equally with, or senior to, the debt securities in which we invest. Such subordinated investments are subject to greater risk of default than senior obligations as a result of adverse changes in the financial condition of the obligor or in general economic conditions. If we make a subordinated investment in a portfolio company, the portfolio company may be highly leveraged, and its relatively high debt-to-equity ratio may create increased risks that its operations might not generate sufficient cash flow to service all of its debt obligations. By their terms, such debt instruments may provide that the holders are entitled to receive payment of interest or principal on or before the dates on which we are entitled to receive payments in respect of the securities in which we
invest. These debt instruments would usually prohibit the portfolio companies from paying interest on or repaying our investments in the event of and during the continuance of a default under such debt. Also, in the event of insolvency, liquidation, dissolution, reorganization or bankruptcy of a portfolio company, holders of securities ranking senior to our investment in that portfolio company would typically be entitled to receive payment in full before we receive any distribution in respect of our investment. After repaying senior creditors, the portfolio company may not have any remaining assets to use for repaying its obligation to us where we are junior creditor. In the case of debt ranking equally with debt securities in which we invest, we would have to share any distributions on an equal and ratable basis with other creditors holding such debt in the event of an insolvency, liquidation, dissolution, reorganization or bankruptcy of the relevant portfolio company.
Additionally, certain loans that we make to portfolio companies may be secured on a second priority basis by the same collateral securing senior secured debt of such companies. The first priority liens on the collateral will secure the portfolio company’s obligations under any outstanding senior debt and may secure certain other future debt that may be permitted to be incurred by the portfolio company under the agreements governing the loans. The holders of obligations secured by first priority liens on the collateral will generally control the liquidation of, and be entitled to receive proceeds from, any realization of the collateral to repay their obligations in full before us. In addition, the value of the collateral in the event of liquidation will depend on market and economic conditions, the availability of buyers and other factors. There can be no assurance that the proceeds, if any, from sales of all of the collateral would be sufficient to satisfy the loan obligations secured by the second priority liens after payment in full of all obligations secured by the first priority liens on the collateral. If such proceeds were not sufficient to repay amounts outstanding under the loan obligations secured by the second priority liens, then we, to the extent not repaid from the proceeds of the sale of the collateral, will only have an unsecured claim against the portfolio company’s remaining assets, if any.
We have made in the past, and may make in the future, unsecured loans to portfolio companies, meaning that such loans will not benefit from any interest in collateral of such companies. Liens on a portfolio company’s collateral, if any, will secure the portfolio company’s obligations under its outstanding secured debt and may secure certain future debt that is permitted to be incurred by the portfolio company under its secured loan agreements. The holders of obligations secured by such liens will generally control the liquidation of, and be entitled to receive proceeds from, any realization of such collateral to repay their obligations in full before us. In addition, the value of such collateral in the event of liquidation will depend on market and economic conditions, the availability of buyers and other factors. There can be no assurance that the proceeds, if any, from sales of such collateral would be sufficient to satisfy our unsecured loan obligations after payment in full of all loans secured by collateral. If such proceeds were not sufficient to repay the outstanding secured loan obligations, then our unsecured claims would rank equally with the unpaid portion of such secured creditors’ claims against the portfolio company’s remaining assets, if any.
The rights we may have with respect to the collateral securing any junior priority loans we make to our portfolio companies may also be limited pursuant to the terms of one or more intercreditor agreements that we enter into with the holders of senior debt. Under a typical intercreditor agreement, at any time that obligations that have the benefit of the first priority liens are outstanding, any of the following actions that may be taken in respect of the collateral will be at the direction of the holders of the obligations secured by the first priority liens:
the ability to cause the commencement of enforcement proceedings against the collateral;
the ability to control the conduct of such proceedings;
the approval of amendments to collateral documents;
releases of liens on the collateral; and
waivers of past defaults under collateral documents.
We may not have the ability to control or direct such actions, even if our rights as junior lenders are adversely affected.
The disposition of our investments may result in contingent liabilities.
A significant portion of our investments involve private securities. In connection with the disposition of an investment in private securities, we may be required to make representations about the business and financial affairs of the portfolio company typical of those made in connection with the sale of a business. We may also be required to indemnify the purchasers of such investment to the extent that any such representations turn out to be inaccurate or with respect to potential liabilities. These arrangements may result in contingent liabilities that ultimately result in funding obligations that we must satisfy through our return of distributions previously made to us.
GC Advisors’ liability is limited, and we have agreed to indemnify GC Advisors against certain liabilities, which may lead GC Advisors to act in a riskier manner on our behalf than it would when acting for its own account.
Under the Investment Advisory Agreement and the collateral management agreements for each of the 20102014 Debt Securitization and the 20142018 Debt Securitization, GC Advisors does not assume any responsibility to us other than to render the services called for under those agreements, and it is not responsible for any action of our board of directors in following or declining to follow GC Advisors’ advice or recommendations. Under the terms of the
Investment Advisory Agreement and each of the collateral management agreements GC Advisors, its officers, members, personnel, and any person controlling or controlled by GC Advisors are not liable to us, any subsidiary of ours, our directors, our stockholders or any subsidiary’s stockholders or partners for acts or omissions performed in accordance with and pursuant to the Investment Advisory Agreement and the collateral management agreements, except those resulting from acts constituting gross negligence, willful misconduct, bad faith or reckless disregard of GC Advisors’ duties under the Investment Advisory Agreement and the collateral management agreements. In addition, we have agreed to indemnify GC Advisors and each of its officers, directors, members, managers and employees from and against any claims or liabilities, including reasonable legal fees and other expenses reasonably incurred, arising out of or in connection with our business and operations or any action taken or omitted on our behalf pursuant to authority granted by the Investment Advisory Agreement and the collateral management agreements, except where attributable to gross negligence, willful misconduct, bad faith or reckless disregard of such person’s duties under the Investment Advisory Agreement and the collateral management agreements. These protections may lead GC Advisors to act in a riskier manner when acting on our behalf than it would when acting for its own account.
WeOur investments in foreign companies may involve significant risks in addition to the risks inherent in U.S. investments.
Our investment strategy contemplates potential investments in foreign companies. Investing in foreign companies may expose us to additional risks not typically associated with investing in U.S. companies. These risks include changes in exchange control regulations, political and social instability, expropriation, imposition of foreign taxes (potentially at confiscatory levels), less liquid markets, less available information than is generally the case in the United States, higher transaction costs, less government supervision of exchanges, brokers and issuers, less developed bankruptcy laws, difficulty in enforcing contractual obligations, lack of uniform accounting and auditing standards and greater price volatility. Although we expect most of our investments will be U.S. dollar denominated, our investments that are denominated in a foreign currency will be subject to the risk that the value of a particular currency will change in relation to one or more other currencies. Among the factors that may affect currency values are trade balances, the level of short-term interest rates, differences in relative values of similar assets in different currencies, long-term opportunities for investment and capital appreciation and political developments. We may employ hedging techniques to minimize these risks, under hedging transactions and may become subjectbut we cannot assure you that such strategies will be effective or without risk to risks if we invest in foreign securities.
us. As of September 30, 2016,2018, we were invested in two securities of four non-U.S. companies. Securities issued by non U.S.non-U.S. companies are not “qualifying assets” under the 1940 Act, and we may invest in non-U.S. companies, including emerging market issuers, to the limited extent such investments are permitted under the 1940 Act.
We expect that these investments would focus on the same types of investments thatmay expose ourselves to risks if we makeengage in U.S. middle-market companies and accordingly would be complementary to our overall strategy and enhance the diversity of our holdings. Investing in securities of emerging market issuers involves many risks including economic, social, political, financial, tax and security conditions in the emerging market, potential inflationary economic environments, regulation by foreign governments, different accounting standards and political uncertainties. Economic, social, political, financial, tax and security conditions also could negatively affect the value of emerging market companies. These factors could include changes in the emerging market government’s economic and fiscal policies, the possible imposition of, or changes in, currency exchange laws or other laws or restrictions applicable to the emerging market companies or investments in their securities and the possibility of fluctuations in the rate of exchange between currencies.hedging transactions.
We have engaged in and may in the future may engage inenter into hedging transactions, which may expose us to the limited extentrisks associated with such transactions are permitted under the 1940 Act and applicable commodities laws. Engaging in hedging transactions or investing in foreign securities would entail additional risks to our stockholders.transactions. We could, for example, usemay utilize instruments such as forward contracts, currency options and interest rate swaps, caps, collars and floors and, if we were to invest in foreign securities, we could use instruments such as forward contracts or currency options and borrow under a credit facility in currencies selected to minimize our foreign currency exposure. In each such case, we generally would seek to hedge against fluctuations ofin the relative values of our portfolio positions from changes in currency exchange rates and market interest rates or currency exchange rates. Use of these hedging instruments may include counter-party credit risk. Hedging against a decline in the values of our portfolio positions woulddoes not eliminate the possibility of fluctuations in the values of such positions or prevent losses if the values of thesuch positions declined.decline. However, such hedging couldcan establish other positions designed to gain from those same developments, thereby offsetting the decline in the value of such portfolio positions. Such hedging transactions couldmay also limit the opportunity for gain if the values of the underlying portfolio positions increased.should increase. Moreover, it mightmay not be possible to hedge against an exchange rate or interest rate fluctuation that is so generally anticipated that we are not able to enter into a hedging transaction at an acceptable price. Use of a hedging transaction could involve counterparty credit risk.
The success of anyour hedging transaction we may enter intotransactions will depend on our ability to correctly predict movements in currencies and interest rates. Therefore, while we may enter into hedgingsuch transactions to seek to reduce currency exchange rate and interest rate risks, unanticipated changes in currency exchange rates or interest rates couldmay result in poorer overall investment performance than if we had not engaged in any such hedging transactions. In addition, the degree of correlation between price movements of the instruments used in a hedging strategy and price movements in the portfolio positions being hedged couldmay vary. Moreover, for a variety of reasons, we mightmay not seek to (or be able to) establish a perfect correlation between thesuch hedging instruments and the portfolio holdings being hedged. Any such imperfect correlation couldmay prevent us from achieving the intended hedge and expose us to risk of loss. In addition, it mightmay not be possible to hedge fully or perfectly against currency fluctuations affecting the value of securities
denominated in non-U.S. currencies because the value of those securities is likely to fluctuate as a result of factors not related to currency fluctuations. Our ability to engage in hedging transactions may also be adversely affected by rules adopted by the CFTC.
We may not realize gains from our equity investments.
When we invest in one stop, second lien and subordinated loans, we may acquire warrants or other equity securities of portfolio companies as well. We may also invest in equity securities directly. To the extent we hold equity investments, we will attempt to dispose of them and realize gains upon our disposition of them. However, the equity interests we receive may not appreciate in value and may decline in value. As a result, we may not be able to realize gains from our equity interests, and any gains that we do realize on the disposition of any equity interests may not be sufficient to offset any other losses we experience.
Risks Relating to Our Common Stock
Investing in our common stock may involve an above average degree of risk.
The investments we make in accordance with our investment objective may result in a higher amount of risk than alternative investment options and a higher risk of volatility or loss of principal. Our investments in portfolio companies involve higher levels of risk, and therefore, an investment in our shares may not be suitable for someone with lower risk tolerance.
Shares of closed-end investment companies, including business development companies, often trade at a discount to their net asset value.
Shares of closed-end investment companies, including business development companies, may trade at a discount from net asset value. This characteristic of closed-end investment companies and business development companies is separate and distinct from the risk that our net asset value per share may decline. We cannot predict whether our common stock will trade at, above or below net asset value.
There is a risk that investors in our equity securities may not receive distributions or that our distributions may not grow over time and a portion of our distributions may be a return of capital.
We intend to make distributions on a quarterly basis to our stockholders out of assets legally available for distribution. We cannot assure you that we will achieve investment results that will allow us to make a specified level of cash distributions or year-to-year increases in cash distributions. Our ability to pay distributions might be adversely affected by the impact of one or more of the risk factors described in this annual report on Form 10-K. Due to the asset coverage test applicable to us under the 1940 Act as a business development company, we may be limited in our ability to make distributions. If we declare a dividenddistribution and if more stockholders opt to receive cash distributions rather than participate in our dividend reinvestment plan, we may be forced to sell some of our investments in order to make cash dividenddistribution payments. To the extent we make distributions to stockholders that include a return of capital, such portion of the distribution essentially constitutes a return of the stockholder’s investment. Although such return of capital may not be taxable, such distributions may increase an investor’s tax liability for capital gains upon the future sale of our common stock. Although such return of capital may not be taxable, such distributions would generally decrease a stockholder’s basis in our common stock and may therefore increase such stockholder’s tax liability for capital gains upon the future sale of such stock. A return of capital distribution may cause a stockholder to recognize a capital gain from the sale of our common stock even if the stockholder sells its shares for less than the original purchase price.
The market price of our common stock may fluctuate significantly.
The market price and liquidity of the market for our securities may be significantly affected by numerous factors, some of which are beyond our control and may not be directly related to our operating performance. These factors include:
significant volatility in the market price and trading volume of securities of business development companies or other companies in our sector, which are not necessarily related to the operating performance of the companies;
changes in regulatory policies, accounting pronouncements or tax guidelines, particularly with respect to RICs and business development companies;
loss of our qualification as a RIC or business development company;
changes in market interest rates and decline in the prices of debt,
changes in earnings or variations in operating results;
changes in the value of our portfolio investments;
changes in accounting guidelines governing valuation of our investments;
any shortfall in revenue or net income or any increase in losses from levels expected by investors or securities analysts;
departure of GC Advisors’ or any of its affiliates’ key personnel;
operating performance of companies comparable to us;
general economic trends and other external factors; and
loss of a major funding source.
Our stockholders will experience dilution in their ownership percentage if they do not participate in our dividend reinvestment plan.
All distributions declared in cash payable to stockholders that are participants in our dividend reinvestment plan are automatically reinvested in shares of our common stock. As a result, our stockholders that do not participate in our dividend reinvestment plan will experience dilution in their ownership percentage of our common stock over time.
Our stockholders may receive shares of our common stock as dividends, which could result in adverse tax consequences to them.
In order to satisfy the annual distribution requirement applicable to RICs, we have the ability to declare a large portion of a dividend in shares of our common stock instead of in cash. As long as a portion of such dividend is paid in cash (which portion may be as low as 20% of such dividend) and certain requirements are met, the entire distribution will be treated as a dividend for U.S. federal income tax purposes. As a result, a stockholder generally would be subject to tax on 100% of the fair market value of the dividend on the date the dividend is received by the stockholder in the same manner as a cash dividend, even though most of the dividend was paid in shares of our common stock. We currently do not intend to pay dividends in shares of our common stock.
Sales of substantial amounts of our common stock in the public market may have an adverse effect on the market price of our common stock.
Sales of substantial amounts of our common stock, or the availability of such common stock for sale, could adversely affect the prevailing market prices for our common stock. If this occurs and continues, it could impair our ability to raise additional capital through the sale of securities should we desire to do so.
Item 1B. Unresolved Staff Comments
None.
Item 2. Properties
Properties
We do not own any real estate or other physical properties materially important to our operation. Our headquarters are located at 150 South Wacker Drive, Suite 800, Chicago, IL 60606666 Fifth Avenue, 18th Floor, New York, NY 10103 and are provided by Golub Capital LLC pursuant to the Administration Agreement. We believe that our office facilities are suitable and adequate to our business.
Item 3. Legal Proceedings
Golub Capital BDC,We, GC Advisors and Golub Capital LLC aremay, from time to time, be involved in legal and regulatory proceedings arising out of their respective operations in the normal course of business or otherwise. While there can be no assurance of the ultimate disposition of any such proceedings, each of us, GC Advisors and Golub Capital LLC do not believe it is currently subject to any material legal proceedings.
Item 4. Mine Safety Disclosures
Not applicable.
PART II
Item 5. Market for Registrant’s Common Equity, Related Stockholder Matters and Issuer Purchases of Equity Securities
Price Range of Common Stock
Our common stock began trading on April 15, 2010 and is currently traded on The Nasdaq Global Select Market under the symbol “GDBC”“GBDC”. The following table lists the high and low closing sale price for our common stock, the closing sale price as a percentage of net asset value, or NAV, and quarterly distributions per share. | | | Period | | NAV(1) | | Closing Sales Price | | Premium of High Sales Price to NAV(2) | | Premium (Discount) of Low Sales Price to NAV(2) | | Dividends and Distributions Declared | | NAV(1) | | Closing Sales Price | | Premium of High Sales Price to NAV(2) | | Premium (Discount) of Low Sales Price to NAV(2) | |
Distributions Declared | |
| High | | Low | | High | | Low | | |
| Fiscal year ended September 30, 2016 | | |
| | |
| | |
| | |
| | |
| | |
| |
| Fiscal year ended September 30, 2018 | | | |
| | |
| | |
| | |
| | |
| | |
| |
| Fourth quarter | | $ | 15.96 |
| | $ | 19.75 |
| | $ | 18.18 |
| | 23.7 | % | | 13.9 | % | | $ | 0.32 |
| | $ | 16.10 |
| | $ | 19.14 |
| | $ | 18.40 |
| | 18.9 | % | | 14.3 | % | | $ | 0.32 |
| |
| Third quarter | | 15.88 |
| | 18.08 |
| | 16.84 |
| | 13.9 |
| | 6.0 |
| | 0.32 |
| | 16.15 |
| | 18.67 |
| | 17.83 |
| | 15.6 |
| | 10.4 |
| | 0.32 |
| |
| Second Quarter | | 15.85 |
| | 17.38 |
| | 15.23 |
| | 9.7 |
| | (3.9 | ) | | 0.32 |
| | 16.11 |
| | 18.44 |
| | 17.62 |
| | 14.5 |
| | 9.4 |
| | 0.32 |
| |
| First Quarter | | 15.89 |
| | 17.47 |
| | 16.12 |
| | 9.9 |
| | 1.4 |
| | 0.32 |
| | 16.04 |
| | 19.41 |
| | 18.20 |
| | 21.0 |
| | 13.5 |
| | 0.40 |
| (3) |
| Fiscal year ended September 30, 2015 | | |
| | |
| | |
| | |
| | |
| | |
| |
| Fiscal year ended September 30, 2017 | | | |
| | |
| | |
| | |
| | |
| | |
| |
| Fourth quarter | | $ | 15.80 |
| | $ | 17.13 |
| | $ | 15.90 |
| | 8.4 | % | | 0.6 | % | | $ | 0.32 |
| | $ | 16.08 |
| | $ | 19.71 |
| | $ | 18.24 |
| | 22.6 | % | | 13.4 | % | | $ | 0.32 |
| |
| Third quarter | | 15.74 |
| | 17.90 |
| | 16.56 |
| | 13.7 |
| | 5.2 |
| | 0.32 |
| | 16.01 |
| | 20.44 |
| | 19.10 |
| | 27.7 |
| | 19.3 |
| | 0.32 |
| |
| Second Quarter | | 15.61 |
| | 18.04 |
| | 17.05 |
| | 15.6 |
| | 9.2 |
| | 0.32 |
| | 15.88 |
| | 19.88 |
| | 18.38 |
| | 25.2 |
| | 15.7 |
| | 0.32 |
| |
| First Quarter | | 15.55 |
| | 18.15 |
| | 16.15 |
| | 16.7 |
| | 3.9 |
| | 0.32 |
| |
First Quarter (40 | | | 15.74 |
| | 18.76 |
| | 17.55 |
| | 19.2 |
| | 11.5 |
| | 0.57 |
| (4) |
| |
(1) | NAV per share is determined as of the last day in the relevant quarter and therefore may not reflect the NAV per share on the date of the high and low closing sales prices. The NAVs shown are based on outstanding shares at the end of the each period. |
| |
(2) | Calculated as of the respective high or low closing sales price divided by the quarter-end NAV. |
| |
(3) | Includes a special distribution of $0.08 per share. |
| |
(4) | Includes a special distribution of $0.25 per share. |
The last reported price for our common stock on November 15, 201627, 2018 was $17.79$18.55 per share. As of November 15, 2016,27, 2018, we had 298382 stockholders of record.
Distributions
Our distributions, if any, are determined by the board of directors. We elected to be treated as a RIC under Subchapter M of the Code. In order to be subject to tax as a RIC, we must distribute to our stockholders dividends for U.S. federal income tax purposes each tax year of an amount at least equal to 90% of our net ordinary income and net short-term capital gains in excess of our net long-term capital losses, or investment company taxable income, determined without regard to any deduction for dividends paid. In addition, we are subject to ordinary income and capital gain distribution requirements under U.S. federal excise tax rules for each calendar year. If we do not meet the required distributions we will be subject to a 4% nondeductible federal excise tax on the undistributed amount.
The following table reflects the cash distributions, including dividends and returns of capital per share that we have declared on our common stock.
|
| | | | | | |
| Record Dates | | Payment Date | | Dividends and Distributions Declared |
| Fiscal year ended September 30, 2016 | | | | |
|
| September 5, 2016 | | September 29, 2016 | | $ | 0.32 |
|
| June 6, 2016 | | June 29, 2016 | | 0.32 |
|
| March 7, 2016 | | March 30, 2016 | | 0.32 |
|
| December 11, 2015 | | December 29, 2015 | | 0.32 |
|
| Total | | | | $ | 1.28 |
|
|
| | | | | | |
| Record Dates | | Payment Date | |
Distributions Declared |
| Fiscal year ended September 30, 2018 | | | | |
|
| September 6, 2018 | | September 28, 2018 | | $ | 0.32 |
|
| June 8, 2018 | | June 28, 2018 | | 0.32 |
|
| March 8, 2018 | | March 30, 2018 | | 0.32 |
|
December 12, 2017 (1) | | December 28, 2017 | | 0.40 |
|
| Total | | | | $ | 1.36 |
|
|
| | | | | | |
| Fiscal year ended September 30, 2015 | | | | |
|
| September 7, 2015 | | September 29, 2015 | | $ | 0.32 |
|
| June 18, 2015 | | June 29, 2015 | | 0.32 |
|
| March 20, 2015 | | March 27, 2015 | | 0.32 |
|
| December 18, 2014 | | December 29, 2014 | | 0.32 |
|
| Total | | | | $ | 1.28 |
|
|
| | | | | | |
| Fiscal year ended September 30, 2017 | | | | |
|
| September 6, 2017 | | September 29, 2017 | | $ | 0.32 |
|
| June 6, 2017 | | June 29, 2017 | | 0.32 |
|
| March 7, 2017 | | March 30, 2017 | | 0.32 |
|
December 12, 2016 (2) | | December 29, 2016 | | 0.57 |
|
| Total | | | | $ | 1.53 |
|
(1) Includes a special distribution of $0.08 per share.
(2) Includes a special distribution of $0.25 per share.
On November 14, 2016,27, 2018, our board of directors declared a quarterly distribution of $0.32 per share and a special distribution of $0.25$0.12 per share both of which are payable on December 29, 201628, 2018 to holders of record as of December 12, 2016.2018.
We have adopted a dividend reinvestment plan that provides for reinvestment of our dividends and other distributions on behalf of our stockholders. As a result, if our board of directors authorizes, and we declare, a cash dividend or other distribution, then our stockholders who participate in our dividend reinvestment plan will have their cash distribution reinvested in additional shares of our common stock, rather than receiving the cash distribution.
Stock Performance Graph
This graph compares the stockholder return on our common stock from September 30, 20112012 to September 30, 20162018 with that of the NASDAQ Financial 100 Stock Index and the Standard & Poor’s 500 Stock Index. This graph assumes that on September 31, 2011,30, 2012, $100 was invested in our common stock, the NASDAQ Financial 100 Stock Index, and the Standard & Poor’s 500 Stock Index. The graph also assumes the reinvestment of all cash distributions prior to any tax effect. The graph and other information furnished under this Part II Item 5 of this annual report on Form 10-K shall not be deemed to be “soliciting material” or to be “filed” with the SEC or subject to Regulation 14A or 14C under, or to the liabilities of Section 18 of, the Exchange Act. The stock price performance included in the below graph is not necessarily indicative of future stock performance.
Item 6. Selected Consolidated Financial Data
The following selected consolidated financial data of Golub Capital BDC, Inc. as of and for the yearyears ended September 30, 2018, 2017 and 2016 is derived from the consolidated financial statements that have been audited by Ernst & Young LLP, independent registered public accounting firm. The following selected consolidated financial data of Golub Capital BDC, Inc. as of and for the years ended September 30, 2015 2014, 2013 and 20122014 is derived from the consolidated financial statements that have been audited by RSM US LLP (formerly McGladrey LLP through October 25, 2015), independent registered public accounting firm. The financial data should be read in conjunction with our consolidated financial statements and related notes thereto and “Management’s Discussion of Financial Condition and Analysis of Results of Operations and Financial Condition”Operations” included elsewhere in this annual report on Form 10-K.
| | | | Golub Capital BDC | | Golub Capital BDC, Inc. |
| | As of and for the years ended September 30, | | As of and for the years ended September 30, |
| | 2016 | | 2015 | | 2014 | | 2013 | | 2012 | | 2018 | | 2017 | | 2016 | | 2015 | | 2014 |
| | (In thousands, except per share data) | | (In thousands, except per share data) |
| Statement of Operations Data: | |
| | |
| | |
| | |
| | |
| | |
| | |
| | |
| | |
| | |
|
| Total investment income | $ | 127,871 |
| | $ | 119,968 |
| | $ | 109,526 |
| | $ | 83,774 |
| | $ | 57,859 |
| | $ | 152,171 |
| | $ | 137,764 |
| | $ | 127,871 |
| | $ | 119,968 |
| | $ | 109,526 |
|
| Base management fee | 22,020 |
| | 20,330 |
| | 17,053 |
| | 11,749 |
| | 8,495 |
| | 24,214 |
| | 23,815 |
| | 22,020 |
| | 20,330 |
| | 17,053 |
|
| Incentive fee | 7,266 |
| | 10,226 |
| | 10,128 |
| | 9,844 |
| | 6,228 |
| | 13,110 |
| | 7,560 |
| | 7,266 |
| | 10,226 |
| | 10,128 |
|
Interest and other debt financing expenses | 27,724 |
| | 24,510 |
| | 20,227 |
| | 12,427 |
| | 10,781 |
| | 33,174 |
| | 31,534 |
| | 27,724 |
| | 24,510 |
| | 20,227 |
|
| All other expenses | 5,881 |
| | 5,905 |
| | 5,583 |
| | 5,359 |
| | 4,479 |
| | 5,652 |
| | 5,309 |
| | 5,881 |
| | 5,905 |
| | 5,583 |
|
| Net investment income | 64,980 |
| (1 | ) | 58,997 |
|
| 56,535 |
|
| 44,395 |
|
| 27,876 |
| | |
Net realized gain (loss) on investments and derivative instruments | 6,254 |
| | 9,354 |
| | 5,384 |
| | (1,363 | ) | | (3,372 | ) | | |
Net change in unrealized appreciation (depreciation) on investments, derivative instruments and secured borrowings | (2,030 | ) | | 2,440 |
| | 3,469 |
| | 3,488 |
| | 7,256 |
| | |
Net investment income(1) | | 76,021 |
| | 69,546 |
| | 64,980 |
| | 58,997 |
| | 56,535 |
|
| Net realized gain (loss) on investments, secured borrowings, and foreign currency transactions | | 17,536 |
| | 9,402 |
| | 6,254 |
| | 9,354 |
| | 5,384 |
|
| Net change in unrealized appreciation (depreciation) on investments, secured borrowings and foreign currency translation | | (11,587 | ) | | 3,340 |
| | (2,030 | ) | | 2,440 |
| | 3,469 |
|
Net increase/(decrease) in net assets resulting from operations | 69,204 |
|
|
| 70,791 |
|
| 65,388 |
|
| 46,520 |
|
| 31,760 |
| | 81,970 |
| | 82,288 |
| | 69,204 |
| | 70,791 |
| | 65,388 |
|
| Per share data: | |
| | |
| | |
| | |
| | |
| | |
| | |
| | |
| | |
| | |
|
| Net asset value | $ | 15.96 |
| | $ | 15.80 |
| | $ | 15.55 |
| | $ | 15.21 |
| | $ | 14.60 |
| | $ | 16.10 |
| | $ | 16.08 |
| | $ | 15.96 |
| | $ | 15.80 |
| | $ | 15.55 |
|
| Net investment income | 1.25 |
| (1 | ) | 1.20 |
| | 1.26 |
| | 1.29 |
| | 1.15 |
| | |
Net realized gain (loss) on investments and derivative instruments | 0.12 |
| | 0.19 |
| | 0.11 |
| | (0.04 | ) | | (0.14 | ) | | |
Net change in unrealized appreciation
(depreciation) on investments,
derivative instruments and secured
borrowings | (0.04 | ) | | 0.05 |
| | 0.07 |
| | 0.10 |
| | 0.30 |
| | |
Net increase/(decrease) in net assets
resulting from operations | 1.33 |
| | 1.44 |
| | 1.44 |
| | 1.35 |
| | 1.31 |
| | |
Net investment income(1) | | 1.27 |
| | 1.23 |
| | 1.25 |
| | 1.20 |
| | 1.26 |
|
| Net realized gain (loss) on investments, secured borrowings and foreign currency transactions | | 0.29 |
| | 0.16 |
| | 0.12 |
| | 0.19 |
| | 0.11 |
|
| Net change in unrealized appreciation (depreciation) on investments, secured borrowings, and foreign currency translation | | (0.19 | ) | | 0.06 |
| | (0.04 | ) | | 0.05 |
| | 0.07 |
|
| Net increase in net assets resulting from operations | | 1.37 |
| | 1.45 |
| | 1.33 |
| | 1.44 |
| | 1.44 |
|
| Per share distributions declared | 1.28 |
| | 1.28 |
| | 1.28 |
| | 1.28 |
| | 1.28 |
| | 1.36 |
| | 1.53 |
| | 1.28 |
| | 1.28 |
| | 1.28 |
|
| From net investment income | 1.04 |
| | 1.18 |
| | 1.28 |
| | 1.15 |
| | 1.24 |
| | 1.31 |
| | 1.51 |
| | 1.04 |
| | 1.18 |
| | 1.28 |
|
| From capital gains | 0.24 |
| | 0.10 |
| | — |
| | — |
| | — |
| | 0.05 |
| | 0.02 |
| | 0.24 |
| | 0.10 |
| | — |
|
| From return of capital | — |
| | — |
| | — |
| | 0.13 |
| | 0.04 |
| | — |
| | — |
| | — |
| | — |
| | — |
|
| Dollar amount of distributions declared | 66,879 |
| | 62,969 |
| | 57,823 |
| | 45,394 |
| | 31,556 |
| | 81,307 |
| | 86,443 |
| | 66,879 |
| | 62,969 |
| | 57,823 |
|
| From net investment income | 54,461 |
| | 58,152 |
| | 57,823 |
| | 40,605 |
| | 30,484 |
| | 78,328 |
| | 85,304 |
| | 54,461 |
| | 58,152 |
| | 57,823 |
|
| From capital gains | 12,418 |
| | 4,817 |
| | — |
| | — |
| | — |
| | 2,979 |
| | 1,139 |
| | 12,418 |
| | 4,817 |
| | — |
|
| From return of capital | — |
| | — |
| | — |
| | 4,789 |
| | 1,072 |
| | — |
| | — |
| | — |
| | — |
| | — |
|
| | | | Golub Capital BDC | | Golub Capital BDC, Inc. |
| | As of and for the years ended September 30, | | As of and for the years ended September 30, |
| | 2016 | | 2015 | | 2014 | | 2013 | | 2012 | | 2018 | | 2017 | | 2016 | | 2015 | | 2014 |
| | (In thousands, except per share data) | | (In thousands, except per share data) |
| Balance Sheet data at period end: | |
| | |
| | |
| | |
| | |
| | |
| | |
| | |
| | |
| | |
|
| Investments, at fair value | $ | 1,660,612 |
| | $ | 1,529,784 |
| | $ | 1,347,612 |
| | $ | 1,024,645 |
| | $ | 672,910 |
| | $ | 1,782,841 |
| | $ | 1,685,015 |
| | $ | 1,660,612 |
| | $ | 1,529,784 |
| | $ | 1,347,612 |
|
Cash, restricted cash and cash equivalents | 89,540 |
| | 97,484 |
| | 79,943 |
| | 54,717 |
| | 50,927 |
| | |
| Other assets | 6,357 |
| (2) | 6,158 |
| (2) | 6,318 |
| (2) | 4,552 |
| (2) | 4,361 |
| (2) | |
| Cash, cash equivalents, foreign currencies and restricted cash and cash equivalents | | 45,705 |
| | 62,558 |
| | 89,540 |
| | 97,484 |
| | 79,943 |
|
Interest receivable and other assets(2) | | 7,006 |
| | 6,603 |
| | 6,357 |
| | 6,158 |
| | 6,318 |
|
Total assets | 1,756,509 |
| (2) | 1,633,426 |
| (2) | 1,433,873 |
| (2) | 1,083,914 |
| (2) | 728,198 |
| (2) | 1,835,552 |
| | 1,754,176 |
| | 1,756,509 |
| | 1,633,426 |
| | 1,433,873 |
|
| Total debt | 865,175 |
| | 813,605 |
| | 697,539 |
| | 420,909 |
| | 352,300 |
| | 845,683 |
| | 781,100 |
| | 865,175 |
| | 813,605 |
| | 697,539 |
|
Total liabilities | 877,684 |
| (2) | 822,556 |
| (2) | 701,134 |
| (2) | 425,678 |
| (2) | 353,069 |
| (2) | 866,698 |
| | 796,230 |
| | 877,684 |
| | 822,556 |
| | 701,134 |
|
| Total net assets | 878,825 |
| | 810,870 |
| | 732,739 |
| | 658,236 |
| | 375,129 |
| | 968,854 |
| | 957,946 |
| | 878,825 |
| | 810,870 |
| | 732,739 |
|
| Other data: | |
| | |
| | |
| | |
| | |
| | | | |
| | |
| | |
| | |
|
Weighted average yield on
income producing investments at fair
value(3) | 7.6% | | 7.8% | | 8.3% | | 9.1% | | 9.3% | | 8.3% | | 7.8% | | 7.6% | | 7.8% | | 8.3% |
Number of portfolio companies at
period end | 183 | | 164 | | 145 | | 135 | | 121 | | 199 | | 185 | | 183 | | 164 | | 145 |
| |
(1) | Net investment income for the yearyears ended September 30, 2017 and 2016 is shown after a net expense of $17,000 and $333,000, respectively, for U.S. federal excise tax. |
| |
(2) | On October 1, 2015, we adopted Accounting Standards Update, or ASU, 2015-03 which requires that debt issuance costs related to a recognized debt liability to be presented on the balance sheet as a direct deduction from the carrying amount of the debt liability rather than as an asset. Adoption of ASU 2015-03 requires the changes to be applied retrospectively. |
| |
(3) | Weighted average yield on income producing investments is computed by dividing (a) income from interest, including subordinated notes in SLF, and fees excluding amortization of capitalized fees and discounts on accruing loans and debt securities by (b) total income producing investments at fair value. |
Item 7. Management’s Discussion and Analysis of Financial Condition and Results of Operations
The information contained in this section should be read in conjunction with our audited consolidated financial statements and related notes thereto appearing elsewhere in this annual report on Form 10-K. In this report, “we,” “us,” “our” and “Golub Capital BDC” refer to Golub Capital BDC, Inc. and its consolidated subsidiaries.
Forward-Looking Statements
Some of the statements in this annual report on Form 10-K constitute forward-looking statements, which relate to future events or our future performance or financial condition. The forward-looking statements contained in this annual report on Form 10-K involve risks and uncertainties, including statements as to:
our future operating results;
our business prospects and the prospects of our portfolio companies;
the effect of investments that we expect to make and the competition for those investments;
our contractual arrangements and relationships with third parties;
actual and potential conflicts of interest with GC Advisors LLC, or GC Advisors, and other affiliates of Golub Capital LLC, collectively, Golub Capital;
the dependence of our future success on the general economy and its effect on the industries in which we invest;
the ability of our portfolio companies to achieve their objectives;
the use of borrowed money to finance a portion of our investments;
the adequacy of our financing sources and working capital;
the timing of cash flows, if any, from the operations of our portfolio companies;
general economic and political trends and other external factors;
the ability of GC Advisors to locate suitable investments for us and to monitor and administer our investments;
the ability of GC Advisors or its affiliates to attract and retain highly talented professionals;
our ability to qualify and maintain our qualification as a regulated investment company, or RIC,
and as a business development company;
general price and volume fluctuations in the stock markets;
the impact on our business of the Dodd-Frank Wall Street Reform and Consumer Protection Act and the rules and regulations issued thereunder;thereunder and any actions toward repeal thereof; and
the effect of changes to tax legislation and our tax position.
Such forward-looking statements may include statements preceded by, followed by or that otherwise include the words “may,” “might,” “will,” “intend,” “should,” “could,” “can,” “would,” “expect,” “believe,” “estimate,” “anticipate,” “predict,” “potential,” “plan” or similar words. The forward looking statements contained in this annual report on Form 10-K involve risks and uncertainties. Our actual results could differ materially from those implied or expressed in the forward-looking statements for any reason, including the factors set forth as “Risk Factors” and elsewhere in this our annual report on Form 10-K.
We have based the forward-looking statements included in this report on information available to us on the date of this report. Actual results could differ materially from those anticipated in our forward-looking statements and future results could differ materially from historical performance. You are advised to consult any additional disclosures that we may make directly to you or through reports that we have filed or in the future may file with the Securities and Exchange Commission, or the SEC, including annual reports on Form 10-K, registration statements on Form N-2, quarterly reports on Form 10-Q and current reports on Form 8-K. This annual report on Form 10-K contains statistics and other data that have been obtained from or compiled from information made available by third-party service providers. We have not independently verified such statistics or data.
Overview
We are an externally managed, closed-end, non-diversified management investment company that has elected to be regulated as a business development company under the 1940 Act. In addition, for U.S. federal income tax purposes, we have elected to be treated as a RIC under Subchapter M of the Code. As a business development
company and a RIC, we are also subject to certain constraints, including limitations imposed by the 1940 Act and the Code.
Our shares are currently listed on The NASDAQNasdaq Global Select Market under the symbol “GBDC”.
Our investment objective is to generate current income and capital appreciation by investing primarily in one stop (a loan that combines characteristics of traditional first lien senior secured loans and one stopsecond lien or subordinated loans and that are often referred to by other middle-market lenders as unitranche loans) and other senior secured loans of U.S. middle-market companies. We may also selectively invest in second lien and subordinated loans of, and warrants and minority equity securities in U.S. middle-market companies. We intend to achieve our investment objective by
(1) accessing the established loan origination channels developed by Golub Capital, a leading lender to U.SU.S. middle-market companies with over $18.0$25.0 billion in capital under management as of September 30, 2016,2018, (2) selecting investments within our core middle-market company focus, (3) partnering with experienced private equity firms, or sponsors, in many cases with whom Golub Capital has invested alongside in the past, (4) implementing the disciplined underwriting standards of Golub Capital and (5) drawing upon the aggregate experience and resources of Golub Capital.
Our investment activities are managed by GC Advisors and supervised by our board of directors of which a majority of the members are independent of us, GC Advisors and its affiliates.
Under the Investment Advisory Agreement, which was most recently reapproved by our board of directors in May 2016,2018, we have agreed to pay GC Advisors an annual base management fee based on our average adjusted gross assets as well as an incentive fee based on our investment performance. Under the Administration Agreement, we are provided with certain administrative services by an administrator, or the Administrator, which is currently Golub Capital LLC. Under the Administration Agreement, we have agreed to reimburse the Administrator for our allocable portion (subject to the review and approval of our independent directors) of overhead and other expenses incurred by the Administrator in performing its obligations under the Administration Agreement.
We seek to create a portfolio that includes primarily one stop and other senior secured and one stop loans by primarily investing approximately $5.0 million to $30.0 million of capital, on average, in the securities of U.S. middle-market companies. We may also selectively invest more than $30.0 million in some of our portfolio companies and generally expect that the size of our individual investments will vary proportionately with the size of our capital base.
We generally invest in securities that have been rated below investment grade by independent rating agencies or that would be rated below investment grade if they were rated. These securities, which may be referred to as “junk,” have predominantly speculative characteristics with respect to the issuer’s capacity to pay interest and repay principal. In addition, many of our debt investments have floating interest rates that reset on a periodic basis and typically do not fully pay down principal prior to maturity, which may increase our risk of losing part or all of our investment.
As of September 30, 20162018 and September 30, 2015,2017, our portfolio at fair value was comprised of the following:
| | | | | As of September 30, 2016 | | As of September 30, 2015 | | As of September 30, 2018 | | As of September 30, 2017 |
| Investment Type | | Investments at Fair Value (In thousands) | | Percentage of
Total
Investments | | Investments at Fair Value (In thousands) | | Percentage of Total Investments | | Investments at Fair Value (In thousands) | | Percentage of
Total
Investments | | Investments at Fair Value (In thousands) | | Percentage of Total Investments |
| Senior secured | | $ | 162,849 |
| | 9.8 | % | | $ | 197,329 |
| | 12.9 | % | | $ | 231,169 |
| | 13.0 | % | | $ | 195,029 |
| | 11.6 | % |
| One stop | | 1,304,467 |
| | 78.5 |
| | 1,134,222 |
| | 74.1 |
| | 1,430,196 |
| | 80.2 |
| | 1,334,084 |
| | 79.2 |
|
| Second lien | | 27,909 |
| | 1.7 |
| | 39,774 |
| | 2.6 |
| | 9,435 |
| | 0.5 |
| | 9,434 |
| | 0.6 |
|
| Subordinated debt | | 1,427 |
| | 0.1 |
| | 1,715 |
| | 0.1 |
| | 251 |
| | 0.0 | * | | 59 |
| | 0.0 | * |
Subordinated notes in SLF(1) | | 77,301 |
| | 4.7 |
| | 76,563 |
| | 5.0 |
| |
LLC equity interests in SLF(1) | | 26,927 |
| | 1.6 |
| | 22,373 |
| | 1.5 |
| | 71,084 |
| | 4.0 |
| | 95,015 |
| | 5.6 |
|
| Equity | | 59,732 |
| | 3.6 |
| | 57,808 |
| | 3.8 |
| | 40,706 |
| | 2.3 |
| | 51,394 |
| | 3.0 |
|
| Total | | $ | 1,660,612 |
| | 100.0 | % | | $ | 1,529,784 |
| | 100.0 | % | | $ | 1,782,841 |
| | 100.0 | % | | $ | 1,685,015 |
| | 100.0 | % |
|
| |
| * | Represents an amount less than 0.1%. |
| |
(1) | Proceeds from the subordinated notes and LLC equity interests invested in SLF were utilized by SLF to invest in senior secured loans. |
One stop loans include loans to technology companies undergoing strong growth due to new services, increased adoption and/or entry into new markets. We refer to loans to these companies as late stage lending loans. Other targeted characteristics of late stage lending businesses include strong customer revenue retention rates, a diversified customer base and backing from growth equity or venture capital firms. In some cases, the borrower’s high revenue growth is supported by a high level of discretionary spending. As part of the underwriting of such loans and consistent with industry practice, we may adjust our characterization of the earnings of such borrowers for a reduction or elimination of such discretionary expenses, if appropriate. As of September 30, 20162018 and 2015,2017, one stop loans included $128.4$169.4 million and $88.2$138.6 million, respectively, of late stage lending loans at fair value.
As of September 30, 2016, 20152018, 2017 and 2014,2016, we had debt and equity investments in 183, 164199, 185 and 145183 portfolio companies, respectively, and investments in subordinated notes and LLC equity interestsan investment in SLF.
The following table shows the weighted average income yield and weighted average investment income yield of our income producing debtearning portfolio company investments, which represented nearly 100% of our debt investments, as well as the total return based on our average net asset value, and the total return based on the change in the quoted market price of our stock and assuming distributions were reinvested in accordance with our dividend reinvestment plan, or DRIP, in each case for the years ended September 30, 2016, 20152018, 2017 and 20142016 was as follows:
| | | | For the years ended September 30, | For the years ended September 30, |
| | 2016 | | 2015 | | 2014 | 2018 | | 2017 | | 2016 |
Weighted average income yield(1)(2) | 7.6% | | 7.8% | | 8.3% | 8.3% | | 7.8% | | 7.6% |
Weighted average investment income yield(2)(3) | 8.2% | | 8.4% | | 9.0% | 8.9% | | 8.4% | | 8.2% |
Total return based on average net asset value(4) | | 8.5% | | 9.1% | | 8.4% |
Total return based on market value(5) | | 7.7% | | 10.2% | | 25.4% |
| |
(1) | For the years ended September 30, 2018 and 2017, the weighted average income yield and weighted average investment income yield do not reflect interest income from subordinated notes in SLF, which were redeemed on December 30, 2016. |
| |
(2) | Represents income from interest, including subordinated notes in SLF, and fees, excluding amortization of capitalized fees and discounts, divided by the average fair value of earning debt investments.portfolio company investments, and does not represent a return to any investor in us. |
| |
(2)(3)
| Represents income from interest, including subordinated notes in SLF, fees and amortization of capitalized fees and discounts divided by the average fair value of earning debt investments.portfolio investments, and does not represent a return to any investor in us. |
| |
(4) | Total return based on average net asset value is calculated as (a) the net increase in net assets resulting from operations divided by (b) the daily average of total net assets. Total return does not include sales load. |
| |
(5) | Total return based on market value assumes distributions are reinvested in accordance with the DRIP. Total return does not include sales load. |
Revenues: We generate revenue in the form of interest and fee income on debt investments and capital gains and distributions, if any, on portfolio company investments that we originate or acquire. Our debt investments, whether in the form of senior secured, one stop, second lien or subordinated loans, typically have a term of three to seven years and bear interest at a fixed or floating rate. In some instances, we receive payments on our debt investments based on scheduled amortization of the outstanding balances. In addition, we receive repayments of some of our debt investments prior to their scheduled maturity date. The frequency or volume of these repayments fluctuates significantly from period to period. Our portfolio activity also reflects the proceeds of sales of securities. In some cases, our investments provide for deferred interest payments or PIK interest. The principal amount of loans and any accrued but unpaid interest generally become due at the maturity date. In addition, we may generate revenue in the form of commitment, origination, amendment, structuring or due diligence fees, fees for providing managerial assistance and consulting fees. Loan origination fees, original issue discount and market discount or premium are
capitalized, and we accrete or amortize such amounts as interest income. We record prepayment premiums on loans as fee income. For additional details on revenues, see “Critical Accounting Policies-Revenue Recognition”.Policies—Revenue Recognition.”
We recognize realized gains or losses on investments based on the difference between the net proceeds from the disposition and the amortized cost basis of the investment or derivative instrument, without regard to unrealized gains or losses previously recognized. We record current period changes in fair value of investments and derivative instruments that are measured at fair value as a component of the net change in unrealized appreciation (depreciation) on investments in the consolidated statementsConsolidated Statements of operations.Operations.
Expenses: Our primary operating expenses include the payment of fees to GC Advisors under the Investment Advisory Agreement and interest expense on our outstanding debt. We bear all other out-of-pocket costs and expenses of our operations and transactions, including:
calculating our NAV (including the cost and expenses of any independent valuation firm);
fees and expenses incurred by GC Advisors payable to third parties, including agents, consultants or other advisors, in monitoring financial and legal affairs for us and in monitoring our investments and performing due diligence on our prospective portfolio companies or otherwise relating to, or associated with, evaluating and making investments, which fees and expenses may include, among other items, due diligence reports, appraisal reports, any studies that may be commissioned by GC Advisors and travel and lodging expenses;
expenses related to unsuccessful portfolio acquisition efforts;
offerings of our common stock and other securities;
administration fees and expenses, if any, payable under the Administration Agreement (including payments based upon our allocable portion of the Administrator’s overhead in performing its obligations under the Administration Agreement, including rent and the allocable portion of the cost of our chief compliance officer, chief financial officer and their respective staffs);
fees payable to third parties, including agents, consultants or other advisors, relating to, or associated with, evaluating and making investments in portfolio companies, including costs associated with meeting financial sponsors;
transfer agent, dividend agent and custodial fees and expenses;
U.S. federal and state registration and franchise fees;
all costs of registration and listing our shares on any securities exchange;
U.S. federal, state and local taxes;
independent directors’ fees and expenses;
costs of preparing and filing reports or other documents required by the SEC or other regulators;
costs of any reports, proxy statements or other notices to stockholders, including printing costs;
costs associated with individual or group stockholders;
costs associated with compliance under the Sarbanes-Oxley Act;
our allocable portion of any fidelity bond, directors and officers/errors and omissions liability insurance, and any other insurance premiums;
direct costs and expenses of administration, including printing, mailing, long distance telephone, copying, secretarial and other staff, independent auditors and outside legal costs;
proxy voting expenses; and
all other expenses incurred by us or the Administrator in connection with administering our business.
We expect our general and administrative expenses to be relatively stable or decline as a percentage of total assets during periods of asset growth and to increase during periods of asset declines.
Prior to the redemption of the 2010 Notes and termination of the documents governing the 2010 Debt Securitization on July 20, 2018, GC Advisors served as collateral manager for the 2010 Issuer, our indirect subsidiary, under a collateral management agreement, or the 2010 Collateral Management Agreement, isand was entitled to receive an annual fee in an amount equal to 0.35% of the principal balance of the portfolio loans held by the 2010 Issuer at the beginning of the collection period relating to each payment date, which iswas payable in arrears on each payment date. Under the 2010 Collateral Management Agreement, the term “collection period” refers‘‘collection period’’ referred to a quarterly period running from the day after the end of the prior collection period to the fifth business day of the calendar month in which a payment date occurs. Following the redemption of the 2010 Notes on July 20, 2018, the 2010 Collateral Management Agreement was terminated.
GC Advisors, as collateral manager for the 2014 Issuer, our wholly-owned subsidiary, under a collateral management agreement, or the 2014 Collateral Management Agreement, is entitled to receive an annual fee in an amount equal to 0.25% of the principal balance of the portfolio loans held by the 2014 Issuer at the beginning of the collection period relating to each payment date, which is payable in arrears on each payment date. Under the 2014 Collateral Management Agreement, the term “collection period”‘‘collection period’’ refers to a quarterly period running from the day after the end of the prior collection period to the tenth business day prior to the payment date.
Collateral management fees arewere paid directly by the 2010 Issuer and are paid by the 2014 Issuer to GC Advisors and are offset against the management fees payable under the Investment Advisory Agreement. In addition, the 2010 Issuer and 2014 Issuer paid Wells Fargo Securities, LLC structuring and placement fees for its services in connection with the initial structuring and subsequent amendments ofto the 2010 Debt Securitization and the initial structuring of the 2014 Debt Securitization. Term debt securitizations are also known as collateralized loan obligations and are a form of secured financing incurred by us, which is consolidated by us and subject to our overall asset coverage requirement. The 2010 Issuer, the 2014 Issuer and 20142018 Issuer also agreed to pay ongoing administrative expenses to the trustee, collateral manager, independent accountants, legal counsel, rating agencies and independent managers in connection with developing and maintaining reports, and providing required services in connection with the administration of the 2010 Debt Securitization, and the 2014 Debt Securitization, or,and 2018 Debt Securitization, and collectively the Debt Securitizations, as applicable.
We believe that these administrative expenses approximate the amount of ongoing fees and expenses that we would be required to pay in connection with a traditional secured credit facility. Our common stockholders indirectly bear all of these expenses.
Recent Developments
On November 14, 2016,1, 2018, the 2018 Issuer entered into a purchase agreement, or the Purchase Agreement, with Golub Capital BDC CLO III Depositor LLC, as depositor, and Morgan Stanley & Co. LLC, as the initial purchaser, or the Initial Purchaser, pursuant to which the 2018 Issuer agreed to sell the 2018 Notes to the Initial Purchaser as part of the 2018 Debt Securitization. Term debt securitizations are also known as CLOs and are a form of secured financing incurred by the Company, which are consolidated by the Company and subject to its overall asset coverage requirement.
On November 1, 2018, we entered into an amendment to the documents governing the MS Credit Facility. The MS Credit Facility amendment increased the borrowing capacity under the MS Credit Facility from $300.0 million to $450.0 million. The other material terms of the MS Credit Facility were unchanged.
On November 16, 2018, we completed the 2018 Debt Securitization. The 2018 Notes were issued by the 2018 Issuer and are backed by a diversified portfolio of senior secured and second lien loans. The transaction was executed through a private placement of approximately $327.0 million of AAA/AAA Class A 2018 Notes, which bear interest at the three-month LIBOR plus 1.48%; $61.2 million of AA Class B 2018 Notes, which bear interest at the three-month LIBOR plus 2.10%; $20.0 million of A Class C-1 2018 Notes, which bear interest at the three-month LIBOR plus 2.80%; $38.8 million of A Class C-2 2018 Notes, which bear interest at the three-month LIBOR plus 2.65%; $42.0 million of BBB- Class D 2018 Notes, which bear interest at the three-month LIBOR plus 2.95%; and $113.4 million of Subordinated 2018 Notes which do not bear interest. We indirectly retained all of the Class C-2, Class D and Subordinated 2018 Notes. The 2018 Notes are scheduled to mature on January 20, 2031.
A portion of the proceeds of the private placement of the 2018 Notes, net of expenses, was used to repay all amounts outstanding under the MS Credit Facility, following which the agreements governing the MS Credit Facility were terminated.
We entered into two loan sale agreements which govern the 2018 Debt Securitization. Under the terms of the loan sale agreement entered into upon the Closing Date Loan Sale Agreement, which provides for the sale of assets on the Closing Date to satisfy risk retention requirements, (1) we transferred to GC Advisors a portion of our ownership interest in the portfolio company investments securing the 2018 Debt Securitization for the purchase price and other consideration set forth in the Closing Date Loan Sale Agreement and (2) immediately thereafter, GC
Advisors sold to the 2018 Issuer all of its ownership interest in such portfolio loans for the purchase price and other consideration set forth in the Closing Date Loan Sale Agreement. Under the terms of the other loan sale agreement governing the 2018 Debt Securitization Depositor Loan Sale Agreement, which provides for the sale of assets on the Closing Date as well as future sales from us to the 2018 Issuer through CLO Depositor, (3) we sold and/or contributed to the CLO Depositor the remainder of its ownership interest in the portfolio company investments securing the 2018 Debt Securitization and participations for the purchase price and other consideration set forth in the Depositor Loan Sale Agreement and (4) CLO Depositor, in turn, sold to the 2018 Issuer all of its ownership interest in such portfolio loans and participations for the purchase price and other consideration set forth in one of the loan sale agreements. Following these transfers, the 2018 Issuer, and neither GC Advisors, the CLO Depositor nor us, held all of the ownership interest in such portfolio company investments and participations. We made customary representations, warranties and covenants in these loan sale agreements.
The 2018 Notes are the secured obligations of the 2018 Issuer, and an indenture governing the 2018 Notes includes customary covenants and events of default. The 2018 Notes have not been, and will not be, registered under the Securities Act of 1933, as amended, or any state “blue sky” laws and may not be offered or sold in the United States absent registration with the Securities and Exchange Commission or an applicable exemption from registration.
GC Advisors, will serve as collateral manager to the 2018 Issuer under a collateral management agreement and will receive a fee for providing these services in an amount equal to 0.25% of the principal balance of the portfolio loans held by the 2018 Issuer at the beginning of the collection period relating to each payment date, which is payable in arrears on each payment date. Pursuant to the Investment Advisory Agreement, the total fees paid to GC Advisors for rendering collateral management services, which are less than the management fee payable under the Investment Advisory Agreement, will be offset against such management fee.
Under the 2018 Collateral Management Agreement, the term ‘‘collection period’’ refers to a quarterly period commencing on the third business day prior to the preceding collection period to the and ending on (but excluding) the third business day prior to the payment date. Pursuant to the Investment Advisory Agreement, the total fees paid to GC Advisors for rendering these collateral management services, which are less than the management fee payable under the Investment Advisory Agreement, will be offset against such management fee. In addition, the 2018 Issuer paid Morgan Stanley & Co. LLC structuring and placement fees for its services in connection with the structuring of the 2018 Debt Securitization.
On November 27, 2018, our board of directors recommended that we seek shareholder approval to reduce our asset coverage requirement to 150.0% at our annual meeting of stockholders currently scheduled for February 5, 2019. To the extent stockholder approval is received, we currently intend to target a GAAP debt-to-equity ratio of about 1.0x.
On November 27, 2018, we entered into a definitive agreement to merge with GCIC with us as the surviving entity. Our board of directors and the board of directors of GCIC, including all of the respective independent directors, have approved the merger agreement and the transactions contemplated therein. Under the terms of the proposed merger, stockholders of GCIC will receive 0.865 shares of our stock for each share of GCIC, subject to adjustment only in the event of reclassification, recapitalization, or similar transaction by either company. The combined company will remain externally managed by GC Advisors and our officers and directors will remain in their current roles. The combined company will continue to trade under the ticker GBDC on the Nasdaq Global Select Market. Consummation of the proposed merger is subject to our and GCIC stockholder approvals, customary regulatory approvals and other closing conditions. Assuming satisfaction of these conditions, the transaction is expected to close in the first half of 2019.
As a result of the merger, we will be subject to certain additional risks, which will be set forth in the joint proxy statement/prospectus for the merger that we anticipate filing with the SEC in December 2018.
In connection with the closing of the merger, it is our board of directors' intention to increase the dividend per quarter to $0.33 per share; provided that our board of directors' reserves the right to revisit this intention if market conditions or our prospects meaningfully change.
On November 27, 2018, our board of directors declared a quarterly distribution of $0.32 per share and a special distribution of $0.25$0.12 per share both of which are payable on December 29, 201628, 2018 to holders of record as of December 12, 2016.2018.
On October 20, 2016, the 2010 Issuer amended the 2010 Debt Securitization to, among other things, (a) refinance the issued Class A 2010 Notes by redeeming in full the $203.0 million of Class A 2010 Notes and issuing new Class A-Refi 2010 Notes in an aggregate principal amount of $205.0 million that bear interest at a rate of three-month LIBOR plus 1.90%, (b) refinance the Class B 2010 Notes by redeeming in full the $12.0 million of Class B 2010 Notes and issuing new Class B-Refi 2010 Notes in an aggregate principal amount of $10.0 million that bear interest at a rate of three-month LIBOR plus 2.40% and (c) extend the reinvestment period applicable to the 2010 Issuer to July 20, 2018. Following the refinancing, Holdings retained the Class B-Refi 2010 Notes, which will be eliminated from the consolidated statements of financial condition in consolidation.
Market Trends
We have identified the following trends that may affect our business:
Target Market. We believe that small and middle-market companies in the United States with annual revenues between $10.0 million and $2.5 billion represent a significant growth segment of the U.S. economy and often require substantial capital investments to grow. Middle-market companies have generated a significant number of investment opportunities for investment funds managed or advised by Golub Capital, and we believe that this market segment will continue to produce significant investment opportunities for us.
Specialized Lending Requirements. We believe that several factors render many U.S. financial institutions ill-suited to lend to U.S. middle-market companies. For example, based on the experience of our management team, lending to U.S. middle-market companies (1) is generally more labor intensive than lending to larger companies due to the smaller size of each investment and the fragmented nature of information for such companies, (2) requires due diligence and underwriting practices consistent with the demands and economic limitations of the middle-market and (3) may also require more extensive ongoing monitoring by the lender.
Demand for Debt Capital. We believe there is a large pool of uninvested private equity capital for middle-market companies. We expect private equity firms will seek to leverage their investments by combining equity capital with senior secured loans and subordinated debt from other sources, such as us.
Competition from Bank Lenders. We believe that many commercial and investment banks have, in recent years, de-emphasized their service and product offerings to middle-market businesses in favor of lending to large corporate clients and managing capital markets transactions. In addition, these lenders may be constrained in their ability to underwrite and hold bank loans for middle-market issuers as they seek to meet existing and future regulatory capital requirements. We believe these factors may result in opportunities for alternative funding sources to middle-market companies and therefore more market opportunities for us.
Market Environment: We believe that as part of the path of economic recovery following the credit crisis, there has been increased competition for new middle-market investments due to some new non-bank finance companies that have entered the market and due to improving financial performance of middle-market companies. However, we believe that our scale and strong market position will continue to allow us to find investment opportunities with attractive risk-adjusted returns.
Consolidated Results of Operations
Consolidated operating results for the years ended September 30, 2016, 20152018, 2017 and 20142016 are as follows:
| | | | For the years ended September 30, | | Variances | For the years ended September 30, | | Variances |
| | 2016 | | 2015 | | 2014 | | 2016 vs. 2015 | | 2015 vs. 2014 | 2018 | | 2017 | | 2016 | | 2018 vs. 2017 | | 2017 vs. 2016 |
| | (In thousands) | (In thousands) |
| Interest income | $ | 106,184 |
| | $ | 103,404 |
| | $ | 93,225 |
| | $ | 2,780 |
| | $ | 10,179 |
| $ | 131,274 |
| | $ | 119,313 |
| | $ | 106,184 |
| | $ | 11,961 |
| | $ | 13,129 |
|
| Income from accretion of discounts and origination fees | 8,662 |
| | 9,002 |
| | 9,158 |
| | (340 | ) | | (156 | ) | 9,660 |
| | 9,497 |
| | 8,662 |
| | 163 |
| | 835 |
|
| Interest income from subordinated notes of SLF | 6,939 |
| | 3,735 |
| | 1,947 |
| | 3,204 |
| | 1,788 |
| |
Interest and dividend income from investments in SLF(1) | | 8,099 |
| | 6,568 |
| | 11,038 |
| | 1,531 |
| | (4,470 | ) |
| Dividend income | 4,638 |
| | 1,562 |
| | 1,766 |
| | 3,076 |
| | (204 | ) | 624 |
| | 629 |
| | 539 |
| | (5 | ) | | 90 |
|
| Fee income | 1,448 |
| | 2,265 |
| | 3,430 |
| | (817 | ) | | (1,165 | ) | 2,514 |
| | 1,757 |
| | 1,448 |
| | 757 |
| | 309 |
|
| Total investment income | 127,871 |
|
| 119,968 |
|
| 109,526 |
|
| 7,903 |
|
| 10,442 |
| 152,171 |
| | 137,764 |
| | 127,871 |
| | 14,407 |
| | 9,893 |
|
| Total expenses | 62,558 |
| | 60,971 |
| | 52,991 |
| | 1,587 |
| | 7,980 |
| 76,150 |
| | 68,201 |
| | 62,558 |
| | 7,949 |
| | 5,643 |
|
| Net investment income - before excise tax | 65,313 |
|
| 58,997 |
|
| 56,535 |
|
| 6,316 |
|
| 2,462 |
| 76,021 |
| | 69,563 |
| | 65,313 |
| | 6,458 |
| | 4,250 |
|
| Excise tax | 333 |
| | — |
| | — |
|
| 333 |
| | — |
| — |
| | 17 |
| | 333 |
| | (17 | ) | | (316 | ) |
| Net investment income - after excise tax | 64,980 |
| | 58,997 |
| | 56,535 |
| | 5,983 |
| | 2,462 |
| 76,021 |
| | 69,546 |
| | 64,980 |
| | 6,475 |
| | 4,566 |
|
| Net realized gain (loss) on investments | 6,254 |
| | 9,354 |
| | 5,384 |
| | (3,100 | ) | | 3,970 |
| |
Net change in unrealized appreciation (depreciation) on investments, and secured borrowings | (2,030 | ) | | 2,440 |
| | 3,469 |
| | (4,470 | ) | | (1,029 | ) | |
| Net realized gain (loss) on investments and foreign currency transactions | | 17,536 |
| | 9,402 |
| | 6,254 |
| | 8,134 |
| | 3,148 |
|
| Net change in unrealized appreciation (depreciation) on investments, foreign currency translation and secured borrowings | | (11,587 | ) | | 3,340 |
| | (2,030 | ) | | (14,927 | ) | | 5,370 |
|
| Net increase in net assets resulting from operations | $ | 69,204 |
|
| $ | 70,791 |
|
| $ | 65,388 |
|
| $ | (1,587 | ) |
| $ | 5,403 |
| $ | 81,970 |
| | $ | 82,288 |
| | $ | 69,204 |
| | $ | (318 | ) | | $ | 13,084 |
|
Average earning portfolio company investments, at fair value | $ | 1,500,250 |
| | $ | 1,404,556 |
| | $ | 1,195,099 |
| | $ | 95,694 |
| | $ | 209,457 |
| |
Average debt outstanding(1) | $ | 826,366 |
| | $ | 752,567 |
| | $ | 587,624 |
| | $ | 73,799 |
| | $ | 164,943 |
| |
Average earning debt investments, at fair value(2) | | $ | 1,602,119 |
| | $ | 1,554,527 |
| | $ | 1,417,547 |
| | $ | 47,592 |
| | $ | 136,980 |
|
| Average investments in subordinated notes of SLF, at fair value | | — |
| | 19,267 |
| | 82,703 |
| | (19,267 | ) | | (63,436 | ) |
Average earning portfolio company investments, at fair value(2) | | $ | 1,602,119 |
| | $ | 1,573,794 |
|
| $ | 1,500,250 |
| | $ | 28,325 |
| | $ | 73,544 |
|
| |
(1) | For the year ended September 30, 2018, the investment in SLF represents the investment in LLC equity interests in SLF. For the years ended September 30, 2017 and 2016, 2015the investments in SLF include our investments in both subordinated notes (prior to their redemption by SLF on December 30, 2016) and 2014, we have excluded $0.5 million, $0.4 million and $14.4 million, respectively, of secured borrowings, at fair value, which were the result of participations and partial loan sales that didLLC equity interests in SLF. |
| |
(2) | Does not meet the definition of a “participating interest”, as definedinclude our investment in the guidance to ASC Topic 860 — Transfers and Servicing, or ASC Topic 860.LLC equity interests in SLF. |
Net income can vary substantially from period to period for various reasons, including the recognition of realized gains and losses and unrealized appreciation and depreciation. As a result, annual comparisons of net income may not be meaningful.
Investment Income
Investment income increased from the year ended September 30, 20152017 to the year ended September 30, 2018 by $14.4 million primarily as a result of an increase in the average earning debt investments balance, which is the average balance of accruing loans in our investment portfolio, of $47.6 million, an increase in LIBOR and an increase in income from our investments in SLF attributable to increase in income from our investments in SLF. Investment income increased from the year ended September 30, 2016 to the year ended September 30, 2017 by $7.9$9.9 million primarily as a result of an increase in the average earning investment balance, which is the annual average balance of accruing loans in our investment portfolio, of $95.7 million and an increase in income from our investments in SLF of $6.0$137.0 million. These increases were partially offset by a decline in fee income from our investments in SLF of $0.8$4.5 million that was primarily driven by a decrease in prepayment fees. Investment income increased from the year ended September 30, 2014attributable to the year ended September 30, 2015 by $10.4 million as a result of an increase in the average earning investment balance, of $209.5 million and an increase in interest income from subordinated notes of SLF of $1.8 million. These increases were partially offset by a decline in the weighted average investment income yieldcredit performance of 0.6%, which was driven primarily by interest rate compression on new investments, and a decline in fee income of $1.2 million that was primarily driven by a decrease in prepayment fees.SLF's portfolio.
The income yield by debt security type for the years ended September 30, 2016, 20152018, 2017 and 20142016 was as follows:
| | | | For the years ended September 30, | For the years ended September 30, |
| | 2016 | | 2015 | | 2014 | 2018 | | 2017 | | 2016 |
| Senior secured | 6.3% | | 6.5% | | 7.1% | 7.1% | | 6.4% | | 6.3% |
| One stop | 7.7% | | 7.9% | | 8.3% | 8.5% | | 7.9% | | 7.7% |
| Second lien | 9.9% | | 9.5% | | 11.7% | 10.1% | | 10.3% | | 9.9% |
| Subordinated debt | 5.2% | | 8.1% | | 10.1% | 15.0% | | 8.8% | | 5.2% |
Subordinated notes in SLF(1) | 8.4% | | 8.3% | | 7.3% | N/A | | 8.5% | | 8.4% |
| |
(1) | SLF’s proceeds from the subordinated notes were utilized by SLF to invest in senior secured loans. SLF redeemed the outstanding balance on the subordinated notes on December 30, 2016. |
Income yields on one stop and senior secured and one stop investments declinedloans increased for each of the yearsyear ended September 30, 2016 and 20152018 primarily due to a continued general trendthe rise in LIBOR. As of interest rate compression on new investments.September 30, 2018, we have one second lien investment and two subordinated debt investments as shown in the Consolidated Schedule of Investments. Due to the limited number of second lien and subordinated debt investments, in our portfolio,annual income yields on second lien and subordinated debt investments can be significantly impacted by the addition, subtraction or refinancing of one investment. The increase in the annualized income yield on second lien investments was driven by a contractual rate change on one investment representing 34% of the $27.9 million, at fair value, of second lien investments held. As of September 30, 2016, we have three second lien investments and two subordinated debt investments as shown in the Consolidated Schedule of Investments.
Income yield on subordinated notes of SLF for the year ended September 30, 2016 as compared to the year ended September 30, 2015 remained relatively stable. The increase in the income yield on subordinated notes of SLF for the year ended September 30, 2015 as compared to the year ended September 30, 2014 is a result of the subordinated notes accruing interest at the rate of LIBOR plus 8.0% for the full year ended September 30, 2015 as compared to a partial year for the year ended September 30, 2014. In January 2014, the spread on the subordinated notes was increased to LIBOR plus 8.0% from LIBOR plus 4.0% subsequent to the closing of the senior secured revolving credit facility, or the SLF Credit Facility, with Wells Fargo Securities, LLC, as administrative agent, and Wells Fargo Bank, N.A., as lender, entered into by Senior Loan Fund II LLC, a wholly-owned subsidiary of SLF, or SLF II, which, as amended, allows SLF II to borrow up to $300.0 million, subject to leverage and borrowing base restrictions.
For additional details on investment yields and asset mix, refer to the “Liquidity and Capital Resources —- Portfolio Composition, Investment Activity and Yield” section below.
Expenses
The following table summarizes our expenses:expenses for the years ended September 30, 2018, 2017 and 2016:
| | | | | For the years ended September 30, | | Variances | For the years ended September 30, | | Variances |
| | | 2016 | | 2015 | | 2014 | | 2016 vs. 2015 | | 2015 vs. 2014 | 2018 | | 2017 | | 2016 | | 2018 vs. 2017 | | 2017 vs. 2016 |
| | | (In thousands) | (In thousands) | | |
| Interest and other debt financing expenses | | $ | 23,540 |
| | $ | 20,004 |
| | $ | 17,197 |
| | $ | 3,536 |
| | $ | 2,807 |
| $ | 29,859 |
| | $ | 28,245 |
| | $ | 23,540 |
| | $ | 1,614 |
| | $ | 4,705 |
|
| Amortization of debt issuance costs | | 4,184 |
| | 4,506 |
| | 3,030 |
| | (322 | ) | | 1,476 |
| 3,315 |
| | 3,289 |
| | 4,184 |
| | 26 |
| | (895 | ) |
| Base management fee | | 22,020 |
| | 20,330 |
| | 17,053 |
| | 1,690 |
| | 3,277 |
| 24,214 |
| | 23,815 |
| | 22,020 |
| | 399 |
| | 1,795 |
|
| Income Incentive Fee | | 6,022 |
| | 7,489 |
| | 10,032 |
| | (1,467 | ) | | (2,543 | ) | |
| Capital gain incentive fee accrued under GAAP | | 1,244 |
| | 2,737 |
| | 96 |
| | (1,493 | ) | | 2,641 |
| |
| Income incentive fee | | 11,652 |
| | 4,741 |
| | 6,022 |
| | 6,911 |
| | (1,281 | ) |
| Capital gain incentive fee | | 1,458 |
| | 2,819 |
| | 1,244 |
| | (1,361 | ) | | 1,575 |
|
| Professional fees | | 2,814 |
| | 2,942 |
| | 2,451 |
| | (128 | ) | | 491 |
| 2,721 |
| | 2,396 |
| | 2,814 |
| | 325 |
| | (418 | ) |
| Administrative service fee | | 2,209 |
| | 2,372 |
| | 2,527 |
| | (163 | ) | | (155 | ) | 2,456 |
| | 2,340 |
| | 2,209 |
| | 116 |
| | 131 |
|
| General and administrative expenses | | 525 |
| | 591 |
| | 605 |
| | (66 | ) | | (14 | ) | 475 |
| | 556 |
| | 525 |
| | (81 | ) | | 31 |
|
| Total expenses | | $ | 62,558 |
| | $ | 60,971 |
| | $ | 52,991 |
| | $ | 1,587 |
| | $ | 7,980 |
| $ | 76,150 |
| | $ | 68,201 |
| | $ | 62,558 |
| | $ | 7,949 |
| | $ | 5,643 |
|
Average debt outstanding(1) | | $ | 822,823 |
| | $ | 872,980 |
| | $ | 826,366 |
| | $ | (50,157 | ) | | $ | 46,614 |
|
| |
| (1) | As of September 30, 2018and 2017, there were no secured borrowings outstanding. For the year ended September 30, 2016, we have excluded $0.5 million of secured borrowings, at fair value, which were the result of participations and partial loan sales that did not meet the definition of a “participating interest”, as defined in the guidance to Accounting Standards Codification, or ASC, Topic 860 — Transfers and Servicing, or ASC Topic 860. |
Interest Expense
Interest and other debt financing expenses increased by $1.6 million from the year ended September 30, 20152017 to the year ended September 30, 2018 primarily due to the increase in LIBOR which was partially offset by a decrease in the weighted average of outstanding borrowings from $873.0 million for the year ended September 30, 2017 to $822.8 million for the year ended September 30, 2018. The decrease in our debt was primarily driven by a decrease in the weighted average of outstanding borrowings on the Credit Facility from $138.8 million as of September 30, 2017 to $103.0 million as of September 30, 2018. The effective average interest rate on our outstanding debt
increased to 4.0% for the year ended September 30, 2018 from 3.6% for the year ended September 30, 2017 primarily due to the increase in LIBOR.
Interest and other debt financing expenses increased by $4.7 million from the year ended September 30, 2016 to the year ended September 30, 2017 primarily due to the increase in the weighted average of outstanding borrowings from $826.4 million for the year ended September 30, 2016 to $873.0 million for the year ended September 30, 2017 and an increase in the effective annual interest rate. The effective average interest rate on our outstanding debt increased to 3.6% for the year ended September 30, 2017 from 3.4% for the year ended September 30, 2016 primarily due to anthe increase in the weighted averageLIBOR.
Amortization of outstanding borrowingsdebt issuance costs remained relatively stable from $752.6 million for the year ended September 30, 20152017 to $826.4 million for the year ended September 30, 2016. The increase in our2018 as new debt was primarily drivenissuance costs associated with the new or amended debt facilities were offset by an increase in our usethe full amortization of previous costs incurred. Amortization of debt under our SBA debentures through our SBICs, which had outstanding balances of $277.0 million outstanding as of September 30, 2016 and $225.0 million as of September 30, 2015. The effective annual average interest rate on our outstanding debt increased slightly to 3.4% forissuance costs declined from the year ended September 30, 2016 from 3.3% for the year ended September 30, 2015 primarily due to an increase in LIBOR.
Interest and other debt financing expenses increased from the year ended September 30, 2014 to the year ended September 30, 2015 primarily due to an increase in the weighted average of outstanding borrowings from $587.6 million for the year ended September 30, 2014 to $752.6 million for the year ended September 30, 2015. The increase in our debt was driven by an increase in our use of debt under the Credit Facility Funding, a wholly-owned subsidiary of ours, to $127.3 million2017 as of September 30, 2015 from an outstanding balance of $27.4 million as of September 30, 2014 as well as the increase in our use of debt under our SBA debentures through the SBICs; which had outstanding balances of $225.0 million outstanding as of September 30, 2015 and $208.8 million as of September 30, 2014.
Amortization of debt issuance costs declined modestly from the year ended September 30, 2015 to the year ended September 30, 2016 as initial debt issuance cost associated with 2010 Issuer fully amortized. Amortization of debt issuance costs increased by $1.5 million from the year ended September 30, 2014 to the year ended September 30, 2015 primarily due to a full year of amortization of the additional capitalized debt issuance costs associated with the 2014 Debt Securitization. The increase in amortization$125.0 million of debt issuance costs resulted in an increase in our effective annual average interest rate on our outstanding debt from 3.2% for the year ended September 30, 2014 to 3.3% for the year ended September 30, 2015.SBIC IV debentures fully amortized.
Management Fee
The base management fee increased as a result of a sequential increase in average adjusted gross assets from 20142016 to 2016. The administrative service fee decreased from the year ended September 30, 2015 to the year ended September 30, 2016 and from the year ended September 30, 2014 to the year ended September 30, 2015 due to efficiencies gained by the Administrator in servicing a growing portfolio.2018.
Incentive Fees
The incentive fee payable under the Investment Advisory Agreement consists of two parts: (1) the Income Incentive Fee and (2) the Capital Gain Incentive Fee. The Income Incentive Fee decreasedincreased by $1.5$6.9 million from the year ended September 30, 20152017 to the year ended September 30, 2016 and2018, primarily as a result of the increase in net investment income. As the Company remains in the "catch-up" provision of the Income Incentive Fee calculation, the increase in net investment income causes a corresponding increase in the Income Incentive Fee until the Company is fully through the "catch-up" provision. The Income Incentive Fee decreased by $2.5$1.3 million from the year ended September 30, 20142016 to the year ended September 30, 20152017 as the interest rate compression on new investments and the decline of second lien and subordinated debt investments in our portfolio caused a decline in our Pre-Incentive Fee Net Investment Income, expressed as a rate of return on the value of our net assets. Due to this decline, we wereFor the year ended September 30, 2018, while still not fully through the "catch-up" provision in any quarter of the incentive fee calculation. For the year ended September 30, 2016, the Income Incentive Fee expensecalculation, the Income Incentive Fee as a percentage of Pre-Incentive Fee Net Investment Income was 8.3%increased to 18.7% compared to 10.8%6.1% for the year ended September 30, 20152017 and 15.0%8.3% for the year ended September 30, 2014.2016.
The Capital Gain Incentive Fee payable as calculated under the Investment Advisory Agreement for each of the years ended September 30, 2018, 2017, and 2016 2015was $2.3 million, $0.4 million and 2014 was $0.$0.0 million, respectively. However, in accordance with generally accepted accounting principles in the United States of America, or GAAP, we are required to include the aggregate unrealized capital appreciation on investments in the calculation and accrue a capital gain incentive fee as if such unrealized capital appreciation were realized, even though such unrealized capital appreciation is not permitted to be considered
in calculating the fee actually payable under the Investment Advisory Agreement. The capital gain incentive fee accrual which was calculated in accordance with GAAP as of September 30, 2018 and 2017 was $7.2 million and $6.9 million, respectively. Any payment due under the terms of the Investment Advisory Agreement is calculated in arrears at the end of each calendar year, and we paid a $1.2 million Capital Gain Incentive Fee calculated in accordance with the Investment Advisory Agreement as of December 31, 2017. The Company did not pay any Capital Gain Incentive Fee calculated under the Investment Advisory Agreement as of any date prior to December 31, 2017.
The accrual for capital gain incentive fee under GAAP was $1.5 million, or $0.02 per share, for the year ended September 30, 2018, $2.8 million, or $0.05 per share, for the year ended September 30, 2017, and $1.2 million, or $0.03 per share, for the year ended September 30, 2016, $2.7 million, or $0.06 per share, for the year ended September 30, 2015 and $96,000, or less than $0.01 per share, for the year ended September 30, 2014.2016. The decrease in accruals for a capital gain incentive fee under GAAP for the year ended September 30, 20162018 from the year ended September 30, 20152017 was primarily the result of unrealized depreciation of debt and equity investments. The increase in accruals for a capital gain incentive fee under GAAP for the year ended September 30, 20152017 from the year ended September 30, 20142016 was primarily the
result of realized gains on the sale of equity investments and unrealized appreciation of debt and equity investments.
For additional details on the liquidationunrealized appreciation and depreciation of equity investments, refer to the “Net Realized and Unrealized Gains and Losses” section below.
Professional Fees, Administrative Service Fee, and General and Administrative Expenses
In total, professional fees, the administrative service fee, and general and administrative expenses increased by $0.4 million from the year ended September 30, 2017 to the year ended September 30, 2018 and decreased by $0.2 million from the year ended September 30, 2016 to the year ended September 30, 2017. In general, we expect certain of our operating expenses, including professional fees, the administrative service fee, and other general and administrative expenses to decline as a percentage of our total assets during periods of growth and increase as a percentage of our total assets during periods of asset declines.
The Administrator pays for certain expenses incurred by us. These expenses are subsequently reimbursed in cash. Total expenses reimbursed by us to the Administrator for the years ended September 30, 2016, 20152018, 2017 and 20142016 were $2.4 million, $1.0$2.3 million and $1.4$2.4 million, respectively.
As of September 30, 20162018 and 2015,2017, included in accounts payable and accrued expenses were $0.6$0.4 million and $0.6$0.8 million, respectively, for accrued expenses paid on behalf of us by the Administrator.
Excise Tax Expense
We have elected to be treated as a RIC under Subchapter M of the Code and operate in a manner so as to qualify for the tax treatment applicable to RICs. In order to be subject to tax as a RIC, we are required to meet certain source of income and asset diversification requirements, as well as timely distribute to to our stockholders dividends for U.S. federal income tax purposes of an amount generally at least equal to 90% of investment company taxable income, as defined by the Code, and determined without regard to any deduction for dividends paid for each tax year. We have made and intend to continue to make the requisite distributions to our stockholders that will generally relieve us from U.S. federal income taxes.
Depending on the level of taxable income earned in a tax year, we may choose to retain taxable income in excess of current year distributions into the next tax year in an amount less than what would trigger payments of U.S. federal income tax under Subchapter M of the Code. We may then be required to payincur a 4% excise tax on such income. To the extent that we determine that our estimated current year annual taxable income may exceed estimated current year distributions, we accrue excise tax, if any, on estimated excess taxable income as taxable income is earned. For the yearyears ended September 30, 2018, 2017 and 2016, we recordedincurred a net expense of $0, $17,000 and $333,000, respectively, for U.S. federal excise tax. For each of the years ended September 30, 2015 and 2014, we recorded no U.S. federal excise tax expense.
Net Realized and Unrealized Gains and Losses
The following table summarizes our net realized and unrealized gains (losses) for the periods presented:years ended September 30, 2018, 2017 and 2016:
| | | | For the years ended September 30, | | Variances | For the years ended September 30, | | Variances |
| | 2016 | | 2015 | | 2014 | | 2016 vs. 2015 | | 2015 vs. 2014 | 2018 | | 2017 | | 2016 | | 2018 vs. 2017 | | 2017 vs. 2016 |
| | (In thousands) | (In thousands) |
| Net realized gain (loss) on investments | $ | 6,254 |
| | $ | 9,354 |
| | $ | 5,384 |
| | $ | (3,100 | ) | | $ | 3,970 |
| $ | 17,454 |
| | $ | 9,402 |
| | $ | 6,254 |
| | $ | 8,052 |
| | $ | 3,148 |
|
| Net realized gain (loss) | 6,254 |
| | 9,354 |
| | 5,384 |
| | (3,100 | ) | | 3,970 |
| |
| Foreign currency transactions | | 82 |
| | — |
| | — |
| | 82 |
| | — |
|
| Net realized gain (loss) on investments and foreign currency transactions | | $ | 17,536 |
| | $ | 9,402 |
| | $ | 6,254 |
| | $ | 8,134 |
| | $ | 3,148 |
|
| Unrealized appreciation on investments | 32,943 |
| | 26,469 |
| | 24,748 |
| | 6,474 |
| | 1,721 |
| 25,126 |
| | 28,008 |
| | 32,943 |
| | (2,882 | ) | | (4,935 | ) |
| Unrealized (depreciation) on investments | (31,411 | ) | | (23,258 | ) | | (21,221 | ) | | (8,153 | ) | | (2,037 | ) | (34,832 | ) | | (26,640 | ) | | (31,411 | ) | | (8,192 | ) | | 4,771 |
|
Unrealized appreciation on investments in SLF(1) | — |
| | — |
| | 75 |
| | — |
| | (75 | ) | — |
| | 1,969 |
| | — |
| | (1,969 | ) | | 1,969 |
|
Unrealized (depreciation) on investments in SLF(1) | (3,562 | ) | | (773 | ) | | (254 | ) | | (2,789 | ) | | (519 | ) | (1,881 | ) | | — |
| | (3,562 | ) | | (1,881 | ) | | 3,562 |
|
| Unrealized appreciation on secured borrowings | — |
| | 2 |
| | 126 |
| | (2 | ) | | (124 | ) | — |
| | 3 |
| | — |
| | (3 | ) | | 3 |
|
| Unrealized (depreciation) on secured borrowings | — |
| | — |
| | (5 | ) | | — |
| | 5 |
| |
Net change in unrealized appreciation (depreciation) on investments, investments in SLF, and secured borrowings | $ | (2,030 | ) | | $ | 2,440 |
| | $ | 3,469 |
| | $ | (4,470 | ) | | $ | (1,029 | ) | |
| Net change in unrealized appreciation (depreciation) on investments, investments in SLF, secured borrowings and foreign currency | | $ | (11,587 | ) | | $ | 3,340 |
| | $ | (2,030 | ) | | $ | (14,927 | ) | | $ | 5,370 |
|
| |
(1) | Unrealized appreciation and (depreciation) on investments in SLF includeincludes our investmentsinvestment in subordinated notes and LLC equity interests in SLF. |
For the year ended September 30, 2018, we had a net realized gain on investments and foreign currency transactions of $17.5 million primarily due to realized gains on the sale of equity securities in more than 20 portfolio company investments, partially offset by the realized loss on the sale or disposition of three under-performing debt investments.
For the year ended September 30, 2018, we had $25.1 million in unrealized appreciation on 158 portfolio company investments, which was offset by $34.8 million in unrealized depreciation on 169 portfolio company investments. Unrealized appreciation during the year ended September 30, 2018 resulted from an increase in fair value primarily due to the rise in market prices of portfolio company investments. Unrealized depreciation primarily resulted from the reversal of the net unrealized appreciation associated with the sales of portfolio company investments, the amortization of discounts, and negative credit related adjustments that caused a reduction in fair value.
For the year ended September 30, 2018, we had $1.9 million in unrealized depreciation on our investment in SLF LLC equity interests, which was primarily driven by net negative credit related adjustments associated with SLF's investment portfolio.
For the year ended September 30, 2017 we had a net realized gain on investments of $9.4 million primarily due to net realized gains on the sale of equity securities in 18 portfolio company investments and net gains on the sale of debt investments to SLF, which was partially offset by a net realized loss on the sale of a debt and equity investment in a single portfolio company.
For the year ended September 30, 2017, we had $28.0 million in unrealized appreciation on 186 portfolio company investments, which was partially offset by $26.6 million in unrealized depreciation on 192 portfolio company investments. Unrealized appreciation during the year ended September 30, 2017 resulted from an increase in fair value primarily due to the rise in market prices of portfolio company investments and the reversal of prior period unrealized depreciation associated with the non-accrual portfolio company investments that were sold and written-off. Unrealized depreciation primarily resulted from the amortization of discounts, negative credit related adjustments that caused a reduction in fair value and the reversal of the net unrealized appreciation associated with the sales of portfolio company investments.
For the year ended September 30, 2017, we had $2.0 million in unrealized appreciation on our investment in SLF LLC equity interests. Unrealized appreciation on the SLF LLC equity interests was primarily driven by increased net investment income at SLF.
For the year ended September 30, 2016, we had $32.9 million in unrealized appreciation on 143 portfolio company investments, which was partially offset by $31.4 million in unrealized depreciation on 142 portfolio company investments. Unrealized appreciation during the year ended September 30, 2016 resulted from an increase in fair value primarily due to the rise in market prices of portfolio company investments and the reversal of prior period unrealized depreciation associated with the non-accrual portfolio company investments that were sold and written-off. Unrealized depreciation primarily resulted from the amortization of discounts, negative credit related adjustments that caused a reduction in fair value and the reversal of the net unrealized appreciation associated with the sales of portfolio company investments.
For the year ended September 30, 2016, we had $3.6 million in unrealized depreciation on our investment in SLF LLC equity interests. Unrealized depreciation on the SLF LLC equity interests was driven by negative credit related adjustments associated with SLF’s investment portfolio that was primarily driven by one portfolio company investment taken to non-accrual status.
We also had $6.3 million in net realized gains on investments, during the year ended September 30, 2016, primarily due to the sale of, or capital gain distributions received from, several equity investments and the sale of debt investments to SLF that were partially offset by the realized loss on the sale of one non-accrual portfolio company investment and the write off of one non-accrual portfolio company investment.
For the year ended September 30, 2015,2016, we had $26.5 million in unrealized appreciation on 130 portfolio company investments, which was partially offset by $23.3 million in unrealized depreciation on 133 portfolio company investments. Unrealized depreciation primarily resulted from the amortization of discounts and negative credit related adjustments that caused a reduction in fair value. Unrealized appreciation during the year ended September 30, 2015 resulted from an increase in fair value primarily due to the rise in market prices and a reversal of prior period unrealized depreciation.
For the year ended September 30, 2015, we had $0.8$3.6 million in unrealized depreciation on our investmentinvestments in SLF LLC equity interests. Unrealized depreciation on the SLF LLC equity interests was driven by negative credit-relatedcredit related adjustments associated with SLF'sSLF’s investment portfolio.
We also had $9.4 million in net realized gains on investments during the year ended September 30, 2015,portfolio that was primarily as a result of the sale of several equity investments which were partially offsetdriven by realized losses on two non-accrual portfolio companies.
For the year ended September 30, 2014, we had $24.7 million in unrealized appreciation on 119one portfolio company investments, which was partially offset by $21.2 million in unrealized depreciation on 125 portfolio company investments. Unrealized depreciation primarily resulted from the amortization of discounts and negative credit related adjustments that caused a reduction in fair value. Unrealized appreciation during the year ended September 30, 2014 resulted from an increase in fair value primarily dueinvestment taken to the rise in market prices and a reversal of prior period unrealized depreciation.non-accrual status.
For the year ended September 30, 2014, we had $75,000 in unrealized appreciation on our investment in SLF subordinated notes, which was offset by $0.3 million in unrealized depreciation on our investment in SLF LLC equity interests. The unrealized appreciation was the result of the reversal of the prior period unrealized depreciation following the increase in the contractual rate on the subordinate notes to one-month LIBOR plus 8.0% subsequent to the closing of the SLF Credit Facility. Unrealized depreciation on the SLF LLC equity interests was driven by negative credit-related adjustments associated with SLF's investment portfolio as well as the offsetting impact of the pricing on the subordinated notes.
We also had $5.4 million in net realized gains on investments during the year ended September 30, 2014, primarily as a result of the sale of several equity investments which were partially offset by realized losses on the sale of one underperforming portfolio company and the write off of two non-accrual portfolio companies.
Liquidity and Capital Resources
For the year ended September 30, 2018, we experienced a net decrease in cash, cash equivalents, foreign currencies and restricted cash and cash equivalents of $16.9 million. During the period, cash used in operating activities was $8.6 million, primarily as a result of fundings of portfolio investments of $646.6 million, partially offset by the proceeds from principal payments and sales of portfolio investments of $558.7 million and net investment income of $76.0 million. Lastly, cash used in financing activities was $8.3 million, primarily driven by borrowings on debt of $760.5 million that were partially offset by repayments of debt of $695.9 million and distributions paid of $71.1 million.
For the year ended September 30, 2017, we experienced a net decrease in cash, cash equivalents, foreign currencies and restricted cash and cash equivalents of $27.0 million. During the period, cash provided by operating activities was $62.2 million, primarily as a result of fundings of portfolio investments of $588.2 million, partially offset by the proceeds from principal payments and sales of portfolio investments of $588.2 million and net investment income of $69.5 million. Lastly, cash used in financing activities was $89.2 million, primarily driven by borrowings on debt of $545.0 million and net proceeds of an aggregate of $74.0 million from two equity offerings that were offset by repayments of debt of $628.6 million and distributions paid of $76.8 million.
For the year ended September 30, 2016, we experienced a net increasedecrease in cash, cash equivalents, foreign currencies and restricted cash and cash equivalents of $5.5$7.9 million. During the period, wecash used $56.1 million in operating activities was $56.1 million, primarily as a result of fundings of portfolio investments of $654.8 million. This wasmillion, partially offset by the proceeds from principal payments and sales of portfolio investments of $538.6 million and net investment income of $65.0 million. During the same period, cash provided by investment activities of $13.4 million was driven by the decrease in restricted cash and cash equivalents. Lastly, cash provided byused in financing activities was $48.1 million, primarily due to net proceeds of an aggregate of $58.6 million from one equity offering and one private placement and net borrowings on debt of $440.7$51.5 million, partially offset by repayments of debt of $389.2 million and distributions paid of $59.5 million.
For the year ended September 30, 2015, we experienced a net increase in cash and cash equivalents of $0.3 million. During the period we used $103.3 million in operating activities, primarily as a result of fundings of portfolio investments of $858.1 million. This was partially offset by proceeds from principal payments and sales of portfolio investments of $699.1 million and net investment income of $59.0 million. During the same period, cash used in investment activities of $17.2 million was driven by the increase in restricted cash and cash equivalents. Lastly, cash provided by financing activities was $120.8 million, primarily due to net proceeds of an aggregate of $67.6 million from one equity offering and borrowings on debt of $503.2 million, partially offset by repayments of debt of $387.1 million and distributions paid of $60.0 million.
For the year ended September 30, 2014, we experienced a net decrease in cash and cash equivalents of $11.2 million. During the period we used $255.6 million in operating activities, primarily as a result of fundings of portfolio investments of $878.6 million. This was partially offset by proceeds from principal payments and sales of portfolio investments of $573.2 million and net investment income of $56.5 million. During the same period, cash used in investment activities of $36.4 million was driven by the increase in restricted cash and cash equivalents. Lastly, cash provided by financing activities was $280.8 million, primarily due to net proceeds of an aggregate of $64.2 million from one equity offering and borrowings on debt of $826.0 million, partially offset by repayments of debt of $540.9 million and distributions paid of $55.0 million.
As of September 30, 20162018 and 2015,2017, we had cash and cash equivalents of $10.9$5.9 million and $5.5$4.0 million, respectively. In addition, we had foreign currencies of $0.2 million as of September 30, 2018 and restricted cash and cash equivalents of $78.6$39.7 million and $92.0$58.6 million as of September 30, 20162018 and 2015,2017, respectively. Cash and cash equivalents are available to fund new investments, pay operating expenses and pay distributions. As of September 30, 2016, $53.82018, $14.7 million of our restricted cash and cash equivalents couldwill be used to fund new investments that meet the investment guidelines established in the Debt Securitizations, which are described in further detail in Note 7 to our consolidated financial statements, and for the payment of principal and interest expense on the notes issued in the 2014 Debt Securitizations. $12.8Securitization, which is described in further detail in Note 6 to our consolidated financial statements. As of September 30, 2018, $5.8 million of suchour restricted cash and cash equivalents could be used to fund investments that meet the guidelines under the Credit Facility as well as for the payment of interest expense and revolving debt of the Credit Facility. The remaining $12.0As of September 30, 2018, $8.1 million of our restricted cash and cash equivalents could be used to fund investments that meet the guidelines under the MS Credit Facility as well as for the payment of interest expense and revolving debt of the MS Credit Facility. As of September 30, 2018, $11.1 million of our restricted cash and cash equivalents could be used to fund new
investments that meet the regulatory and investment guidelines established by the SBA for our SBICs, which are described in further detail in Note 76 to our consolidated financial statements, and for interest expense and fees on our outstanding SBA debentures.
As of September 30, 2016,2018 and 2017, the Credit Facility allowed Funding to borrow up to $200.0$170.0 million and $225.0 million, respectively, at any one time outstanding, subject to leverage and borrowing base restrictions. As of September 30, 2018 and 2017, we had $136.0 million and $63.1 million outstanding under the Credit Facility, respectively. As of September 30, 2018 and 2017, subject to leverage and borrowing base restrictions, we had approximately $34.0 million and $161.9 million, respectively, of remaining commitments and $34.0 million and $95.0 million, respectively, of availability on the Credit Facility.
As of September 30, 2018, the MS Credit Facility allowed 2010 Issuer to borrow up to $300.0 million at any one time outstanding, subject to leverage and borrowing base restrictions. As of September 30, 2016 and 2015,2018, we had $234.7 million outstanding under the MS Credit Facility. As of September 30, 2018, subject to leverage and borrowing base restrictions, we had approximately $73.3$65.3 million and $72.7 million, respectively, of remaining commitments and $30.8$6.7 million and $40.1 million, respectively, of availability on the MS Credit Facility. As of September 30, 2016 and 2015, we had $126.7 million and $127.3 million outstanding under the Credit Facility, respectively.
On June 22, 2016, we entered into an unsecured revolving credit facility with GC Advisors, or the Adviser Revolver, which permittedpermits us to borrow up to $20.0 million at any one time outstanding. We entered into the Adviser Revolver in order to have the ability to borrow funds on a short-term basis and have in the past repaid, and generally intend in the future to repay, borrowings under the Adviser Revolver within the same quarter in which they are drawn. As of September 30, 2016,2018 and 2017, we had no amounts outstanding on the Adviser Revolver which was not in existence as of September 30, 2015.
On October 21, 2015, the Company and Revolver Funding terminated the Revolver with Private Bank. There were no borrowings outstanding on the Revolver at the time of termination and Revolver Funding was released of all obligations under the Revolver, and all liens on the assets held by Revolver Funding collateralizing the Revolver were released. As ofRevolver.
September 30, 2015, subject to leverage and borrowing base restrictions, we had approximately $15.0 million of remaining commitments and $2.9 million of availability on the Revolver.
On July 16, 2010, we completed the 2010 Debt Securitization, which was subsequently increased to $350$350.0 million. As of September 30, 2016 and 2015, the 2010 Notes, consisted of $203.0 million of Class A 2010 Notes, which bear interest at a rate of three-month LIBOR rate, plus 1.74%, $12.0 million of Class B 2010 Notes, which bear interest at a rate of three-month LIBOR plus 2.40%, and $135.0 million face amount of Subordinated 2010 Notes that do not bear interest. The Class A and Class B 2010 Notes are included in the September 30, 2016 and 2015 consolidated statements of financial condition as our debt. The Subordinated 2010 Notes were eliminated in consolidation as of September 30, 2016 and 2015. As of September 30, 2016 and September 30, 2015, we had outstanding debt under the 2010 Debt Securitization of $215.0 million and $215.0 million, respectively.
On June 25, 2015, the 2010 Issuer amended the 2010 Debt Securitization to, among other things, (a) extend the reinvestment period two years to July 20, 2017, (b) make certain modifications for purposes of compliance with the loan securitization exclusion of the Volcker Rule and (c) modify the computation of the weighted average life test which relates to the loans securing the 2010 Debt Securitization.
On October 20, 2016, the 2010 Issuerwe further amended the 2010 Debt Securitization to, among other things, (a) refinance the issued Class A 2010 Notes, by redeeming in full the $203.0 million of Class A 2010 Notes and issuing new Class A-Refi 2010 Notes in an aggregate principal amount of $205.0 million that bear interest at a rate of three-month LIBOR plus 1.90%, (b) refinance the Class B 2010 Notes by redeeming in full the $12.0 million of Class B 2010 Notes and issuing new Class B-Refi 2010 Notes in an aggregate principal amount of $10.0 million that bear interest at a rate of three-month LIBOR plus 2.40%, and (c) extend the reinvestment period applicable to the 2010 Issuer to July 20, 2018. Following the refinancing, Golub Capital BDC 2010-1 Holdings LLC, our wholly-owned subsidiary, or Holdings, retained the Class B-Refi 2010 Notes.
As of September 30, 2017, the 2010 Notes consisted of $205.0 million of Class A-Refi 2010 Notes, which will bebore interest at a rate of three-month LIBOR plus 1.90%, $10.0 million of Class B-Refi 2010 Notes, which bore interest at a rate of three-month LIBOR plus 2.40%, and $135.0 million face amount of Subordinated 2010 Notes that did not bear interest. The Class A-Refi 2010 Notes are included in the September 30, 2017 Consolidated Statement of Financial Condition as our debt and the Class B-Refi 2010 Notes and Subordinated 2010 Notes were eliminated fromin consolidation. As of September 30, 2017, we had outstanding debt under the consolidated statements2010 Debt Securitization of financial condition in consolidation.$205.0 million. On July 20, 2018, the 2010 Notes were redeemed and, following such redemption, the agreements governing the 2010 Debt Securitization were terminated.
On June 5, 2014, we completed the 2014 Debt Securitization in which the 2014 Issuer issued an aggregate of $402.6 million of notes, or the 2014 Notes, including, prior to their redemption on March 23, 2018, $191.0 million of Class A-1 2014 Notes, which bearbore interest at a rate of three-month LIBOR plus 1.75%, $20.0 million of Class A-2 2014 Notes, which bearbore interest at a rate of three-month LIBOR plus 1.95%, $35.0 million of Class B 2014 Notes, which bearbore interest at a rate of three-month LIBOR plus 2.50%, $37.5 million of Class C 2014 Notes, which bearbore interest at a rate of three-month LIBOR plus 3.50%, and $119.1 million of LLC equity interests in the 2014 Issuer that do not bear interest. We retained all of the Class C 2014 Notes and LLC equity interests in the 2014 Issuer totaling $37.5 million and $119.1 million, respectively. On March 23, 2018, we amended the 2014 Debt Securitization to, among other things, (a) refinance the issued Class A-1 notes issued by the 2014 Issuer by redeeming in full the $191.0 million of Class A-1 2014 Notes and issuing new Class A-1-R 2014 Notes in an aggregate principal amount of $191.0 million that bear interest at a rate of three-month LIBOR plus 0.95%, (b) refinance the Class A-2 2014 Notes by redeeming in full the $20.0 million of Class A-2 2014 Notes and issuing new Class A-2-R 2014 Notes in an aggregate principal amount of $20.0 million that bear interest at a rate of three-month LIBOR plus 0.95%, (c) refinance the Class B 2014 Notes by redeeming in full the $35.0 million of Class B 2014
Notes and issuing new Class B-R 2014 Notes in an aggregate principal amount of $35.0 million that bear interest at a rate of three-month LIBOR plus 1.40%, (d) refinance the Class C 2014 Notes by redeeming in full the $37.5 million of Class C 2014 Notes and issuing new Class C-R 2014 Notes in an aggregate principal amount of $37.5 million that bear interest at a rate of three-month LIBOR plus 1.55%. The Class C-R 2014 Notes were retained by us, and we remain the sole owner of the equity of the 2014 Issuer.
The Class A-1-R, Class A-2-R and Class B-R 2014 Notes are included in the September 30, 2018 Consolidated Statements of Financial Condition as our debt and the Class C-R 2014 Notes and LLC equity interests in the 2014 Issuer were eliminated in consolidation. As of September 30, 2018, we had outstanding debt under the 2014 Debt Securitization of $197.5 million. The Class A-1, Class A-2 and Class B 2014 Notes are included in the September 30, 2016 and 2015 consolidated statements2017 Consolidated Statements of financial conditionFinancial Condition as our debt and the Class C 2014 Notes and LLC equity interests in the 2014 issuerIssuer were eliminated in consolidation. As of September 30, 2016 and 2015,2017, we had outstanding debt under the 2014 Debt Securitization of $246.0 million, respectively.million.
Under present SBIC regulations, the maximum amount of SBA-guaranteed debentures that may be issued by multiple licensees under common management is $350.0 million. Themillion and the maximum amount that a single SBIC licensee may issue is $150.0$175.0 million. On February 11, 2016, the SBA approved the application of GC SBIC V, L.P., or SBIC V, for an additional $75.0 million of debenture commitments bringing SBIC V’s total debenture commitments up to $150.0 million. GC SBIC IV, L.P., or SBIC IV, and SBIC V, our consolidated SBIC subsidiaries, may each borrow up to two times the amount of its regulatory capital, subject to customary regulatory requirements. As of September 30, 2016,2018, SBIC IV, SBIC V and SBIC VVI, had $115.0 million, $150.0 million and $127.0$12.5 million, respectively, of outstanding SBA-guaranteed debentures respectively, that mature between MarchSeptember 2021 and September 2026,March 2028, leaving incremental borrowing capacitydebenture commitments of $23.0$0.0 million, $0.0 million and $37.5 million for SBIC IV, SBIC V and SBIC VI, respectively, under present SBIC regulations. As of September 30, 2015,2017, SBIC IV, SBIC V and SBIC VVI had $150.0$125.0 million, $133.0 million and $75.0$9.0 million, respectively, of outstanding SBA-guaranteed debentures respectively.
Onthat mature between September 2021 and September 2027 leaving incremental debenture commitments of $0.0 million, $17.0 million and $41.0 million for SBIC IV, SBIC V and SBIC VI, respectively, under present SBIC regulations. The original amount committed to SBIC IV by the SBA was $150.0 million. In March 18, 2014, we priced a public offering of 3,500,000 shares of our common stock at a public offering price of $18.05 per share raising approximately $63.22018 and September 2017, SBIC IV repaid $10.0 million in gross proceeds. On March 21, 2014, the transaction closed, the shares were issued, and proceeds, net of underwriting discounts and commissions but before expenses, of $61.3$25.0 million, were received. On April 23, 2014, we sold an additional 166,855 shares of our common stock at a public offering price of $18.05 per share pursuant to the underwriters’ partial exerciserespectively, of the option to purchase additional shares granted in connection withaggregate principal amount of the public offering in March 2014.SBA-guaranteed debentures outstanding at the time and $10.0 million and $25.0 million, respectively, of debenture commitments were terminated.
In August 2016,2018, our board of directors reapproved a share repurchase program, or the Program, which allows us to repurchase up to $50.0$75.0 million of our outstanding common stock on the open market at prices below the NAV per share as reported in our then most recently published consolidated financial statements. The Program may be implemented at the discretion of management. The shares may be purchased from time to time at prevailing market prices, through open market transactions, including block transactions. We did not make any repurchases of our common stock during the years ended September 30, 2016, 20152018, 2017 and 2014.2016.
On April 10, 2015, we priced a public offering of 3,500,000 shares of our common stock at a public offering price of $17.42 per share, raising approximately $60.1 million in gross proceeds. On April 15, 2015, the transaction closed, the shares were issued, and proceeds, net of underwriting discounts and commissions but before expenses, of $59.1 million were received. On May 7, 2015, we sold an additional 502,292 shares of our common stock at a public offering price of $17.42 per share pursuant to the underwriters’ partial exercise of the option to purchase additional shares granted in connection with the public offering in April 2015.
On July 18, 2016, we entered into a securities purchase agreement with a third party institutional investor for the sale of 1,433,486 shares of our common stock at a price per share of $17.44 per share. On July 21, 2016, the transaction closed, the shares were issued and proceeds of $25.0 million were received.
On August 15, 2016, we priced a public offering of 1,750,000 shares of our common stock at a public offering price of $18.35 per share, raising approximately $32.1 million in gross proceeds. On August 19, 2016, the transaction closed, the shares were issued and proceeds, net of underwriting discounts and commissions but before expenses, of $31.1 million were received. On September 19, 2016, we sold an additional 136,970 shares of our common stock at a public offering price of $18.35 per share pursuant to the underwriters’ partial exercise of the option granted in connection with the public offering in August 2016.
On March 21, 2017, we priced a public offering of 1,750,000 shares of our common stock at a public offering price of $19.03 per share, raising approximately $33.3 million in gross proceeds. On March 24, 2017, the transaction closed, the shares were issued and proceeds, net of offering costs but before expenses, of $32.3 million were received. On April 6, 2017, we sold an additional 262,500 shares of our common stock at a public offering price of
$19.03 per share pursuant to the underwriter's exercise of the option granted in connection with the March 2017 offering. On June 6, 2017, we entered into an agreement to sell 1,750,000 shares of our common stock pursuant to an underwritten, public offering at a price to us of $18.71 per share. On June 12, 2017, the transaction closed, the shares were issued and proceeds, net of offering costs but before expenses, of $32.7 million were received. On July 5, 2017, we sold an additional 220,221 shares of our common stock pursuant to the underwriter's partial exercise of the option we granted in connection with the sale of shares in June 2017.
In accordance with the 1940 Act, with certain limited exceptions, we are onlycurrently allowed to borrow amounts such that our asset coverage, as defined in the 1940 Act, is at least 200% after such borrowing. The Small Business Credit Availability Act, or SBCAA, which was signed into law on March 23, 2018, among other things, amended Section 61(a) of the 1940 Act to add a new Section 61(a)(2) that reduces the asset coverage requirement applicable to business development companies from 200% to 150% so long as the business development company meets certain disclosure requirements and obtains certain approvals. The reduced asset coverage requirement would permit a business development company to have a ratio of total consolidated assets to outstanding indebtedness of 2:1 as compared to a maximum of 1:1 under the 200% asset coverage requirement. Effectiveness of the reduced asset coverage requirement to a business development company requires approval by either (1) a “required majority,” as defined in Section 57(o) of the 1940 Act, of such business development company’s board of directors with effectiveness one year after the date of such approval or (2) a majority of votes cast at a special or annual meeting of such business development company’s stockholders at which a quorum is present, which is effective the day after such stockholder approval. On November 27, 2018, our board of directors recommended that we seek shareholder approval to reduce our asset coverage requirement to 150.0% at our annual meeting of stockholders currently scheduled for February 5, 2019. To the extent stockholder approval is received, we currently intend to target a GAAP debt-to-equity ratio of about 1.0x.
On September 13, 2011, we received exemptive relief from the SEC allowing us to modify the asset coverage requirement to exclude the SBA debentures from thisour asset coverage calculation. As such, our ratio of total consolidated assets to outstanding indebtedness may be less than 200%. even if we do not approve the modified asset coverage requirement permitted by Section 61(a)(2) of the 1940 Act. This provides us with increased investment flexibility but also increases our risks related to leverage. As of September 30, 2016,2018, our asset coverage for borrowed amounts was 248.8%269.5% (excluding the SBA debentures).
As of September 30, 20162018 and September 30, 2015,2017, we had outstanding commitments to fund investments, excluding our investments in SLF, totaling $81.4$57.7 million and $121.5$60.5 million, respectively. These amounts may or may not be funded to the borrowing party now or in the future. The unfunded commitments relate to loans with various maturity dates, but the entire amount was eligible for funding to the borrowers, as of September 30, 2016 and 2015, respectively, subject to the terms of each loan’s respective credit agreement. As of September 30, 2016,2018, we believe that we had sufficient assets and liquidity to adequately cover future obligations under our unfunded commitments based on historical rates of drawings upon unfunded commitments, cash and restricted cash balances that we maintain, availability under our Credit Facility, MS Credit Facility and Adviser Revolver, and ongoing principal repayments on debt investments. In addition, we generally hold some syndicated loans in larger portfolio companies that are salablesaleable over a relatively short period to generate cash.
As the reinvestment period for our 2014 Debt Securitization expired on April 28, 2018, we are continuing to
explore expanding our secured debt financing facilities or entering into new secured debt financings, including term
debt securitizations and on November 16, 2018, we completed the 2018 Debt Securitization. See "— Recent Developments.”
Although we expect to fund the growth of our investment portfolio through the net proceeds from future securities offerings and through our dividend reinvestment planDRIP as well as future borrowings, to the extent permitted by the 1940 Act, we cannot assure you that our efforts to raise capital will be successful. In addition, we may, from time to time, amend or refinance our leverage facilities and securitization financings, to the extent permitted by applicable law. In addition to capital not being available, it also may not be available on favorable terms. To the extent we are not able to raise capital on what we believe are favorable terms, we will focus on optimizing returns by investing capital generated from repayments into new investments we believe are attractive from a risk/reward perspective. Furthermore, to the extent we are not able to raise capital and are at or near our targeted leverage ratios, we may receive smaller allocations, if any, on new investment opportunities under GC Advisors’ allocation policy and have, in the past, received such smaller allocations under similar circumstances.
Portfolio Composition, Investment Activity and Yield
As of September 30, 20162018 and 2015,2017, we had investments in 183199 and 164185 portfolio companies, respectively, with a total fair value of $1,556.4$1,711.8 million and $1,430.9$1,590.0 million, respectively, and had investments in subordinated notes and LLC equity interests in SLF with a total fair value of $104.2$71.1 million and $98.9$95.0 million, respectively.
The following table shows the asset mix of our new investment commitments for the years ended September 30, 2016, 20152018, 2017 and 2014:2016:
| | | | Years ended September 30, | Years ended September 30, |
| | 2016 | | 2015 | | 2014 | 2018 | | 2017 | | 2016 |
| | (In thousands) | | Percentage of Commitments | | (In thousands) | | Percentage of Commitments | | (In thousands) | | Percentage of Commitments | (In thousands) | | Percentage of Commitments | | (In thousands) | | Percentage of Commitments | | (In thousands) | | Percentage of
Commitments |
| Senior secured | $ | 124,392 |
| | 19.0 |
| % | $ | 225,442 |
| | 24.4 | % | | $ | 125,564 |
| | 13.0 | % | $ | 114,840 |
| | 17.2 | % | | $ | 129,134 |
| | 21.5 | % | | $ | 124,392 |
| | 19.0 | % |
| One stop | 505,058 |
| | 76.9 |
| | 626,459 |
| | 67.6 |
| | 743,174 |
| | 76.9 |
| 534,906 |
| | 80.1 |
| | 447,691 |
| | 74.7 |
| | 505,058 |
| | 76.9 |
|
| Subordinated debt | 42 |
| | — |
| * | — |
| | — |
| | — |
| | — |
| 184 |
| | 0.0 | * | | 12 |
| | 0.0 | * | | 42 |
| | 0.0 | * |
| Second lien | — |
| | 0.0 |
| | — |
| | — |
| | 39,413 |
| | 4.1 |
| |
Subordinated notes of SLF(1) | 9,620 |
| | 1.5 |
| | 50,974 |
| | 5.5 |
| | 34,658 |
| | 3.6 |
| |
LLC equity interests of SLF(1) | 10,820 |
| | 1.6 |
| | 13,904 |
| | 1.5 |
| | 10,039 |
| | 1.0 |
| |
| Equity securities | 6,528 |
| | 1.0 |
| | 9,494 |
| | 1.0 |
| | 13,631 |
| | 1.4 |
| |
Subordinated notes in SLF(1) | | — |
| | — |
| | 5,457 |
| | 0.9 |
| | 9,620 |
| | 1.5 |
|
LLC equity interests in SLF(1) | | 12,162 |
| | 1.8 |
| | 12,542 |
| | 2.1 |
| | 10,820 |
| | 1.6 |
|
| Equity | | 5,824 |
| | 0.9 |
| | 4,677 |
| | 0.8 |
| | 6,528 |
| | 1.0 |
|
| Total new investment commitments | $ | 656,460 |
| | 100.0 |
| % | $ | 926,273 |
| | 100.0 | % | | $ | 966,479 |
| | 100.0 | % | $ | 667,916 |
| | 100.0 | % | | $ | 599,513 |
| | 100.0 | % | | $ | 656,460 |
| | 100.0 | % |
* Represents an amount less than 0.1%.
| |
(1) | SLF’s proceeds from the subordinated notes and LLC equity interests were utilized by SLF to invest in senior secured loans. As of September 30, 2016,2018, SLF had investments in senior secured loans to 6232 different borrowers. |
For the years ended September 30, 2018, 2017 and 2016, we had approximately $495.5 million, $449.8 million and $366.2 million, excluding $78.7 million of proceeds from the repayment in full and termination of our investment in subordinated notes of SLF during the year ended 2017, respectively, in proceeds from principal payments and return of capital distributions of portfolio companies. For the years ended September 30, 2018, 2017 and 2016, we had sales of investments in 21, 72 and 44 portfolio companies, respectively, aggregating approximately $37.6 million, $138.4 million and $172.2 million, respectively, in net proceeds.
The following table summarizes portfolio composition and investment activity as of and for the years ended September 30, 2016, 20152018, 2017 and 2014:2016:
| | | | As of and for the years ended September 30, | As of and for the years ended September 30, |
| | 2016 | | 2015 | | 2014 | 2018 | | 2017 | | 2016 |
| | (In thousands) | (Dollars in thousands) |
| Investments, at fair value | $ | 1,556,384 |
| | $ | 1,430,848 |
| | $ | 1,312,781 |
| $ | 1,711,757 |
| | $ | 1,590,000 |
| | $ | 1,556,384 |
|
Number of portfolio companies (at period end)(1) | 183 |
| | 164 |
| | 145 |
| 199 |
| | 185 |
| | 183 |
|
Investment in SLF, at fair value(2) | $ | 104,228 |
| | $ | 98,936 |
| | $ | 34,831 |
| $ | 71,084 |
| | $ | 95,015 |
| | $ | 104,228 |
|
| New investment fundings | $ | 654,763 |
| | $ | 858,147 |
| | $ | 878,635 |
| $ | 646,595 |
| | $ | 588,169 |
| | $ | 654,763 |
|
| Principal payments and sales of portfolio investments | $ | 538,609 |
| | $ | 699,075 |
| | $ | 573,201 |
| $ | 558,664 |
| | $ | 588,173 |
| | $ | 538,609 |
|
| |
(1) | Excludes our investments in SLF. |
| |
(2) | TheAs of September 30, 2016, the investment in SLF includes the Company’sour investments in both subordinated notes and LLC equity interests in SLF. |
The following table shows the par,principal, amortized cost and fair value of our portfolio of investments by asset class:
| | | | As of September 30, 2016 (1) | | As of September 30, 2015 (2) | As of September 30, 2018(1) | | As of September 30, 2017(1) |
| | Par | | Amortized Cost | | Fair Value | | Par | | Amortized Cost | | Fair Value | Principal | | Amortized Cost | | Fair Value | | Principal | | Amortized Cost | | Fair Value |
| | (In thousands) | (In thousands) |
| Senior secured: | |
| | |
| | |
| | |
| | |
| | |
| |
| | |
| | |
| | |
| | |
| | |
|
| Performing | $ | 163,380 |
| | $ | 161,536 |
| | $ | 162,693 |
| | $ | 199,573 |
| | $ | 197,189 |
| | $ | 197,329 |
| $ | 230,230 |
| | $ | 228,028 |
| | $ | 229,886 |
| | $ | 196,296 |
| | $ | 194,357 |
| | $ | 195,089 |
|
Non-accrual (2) | 1,438 |
| | 1,433 |
| | 156 |
| | — |
| | — |
| | — |
| |
Non-accrual(2)(3) | | 2,834 |
| | 2,818 |
| | 1,283 |
| | 1,438 |
| | 1,433 |
| | (60 | ) |
| One stop: | |
| | |
| | |
| | |
| | |
| | |
| | | | | | | |
| | |
| | |
|
| Performing | 1,317,595 |
| | 1,299,211 |
| | 1,303,297 |
| | 1,135,805 |
| | 1,120,576 |
| | 1,127,735 |
| 1,435,004 |
| | 1,417,730 |
| | 1,425,854 |
| | 1,339,755 |
| | 1,322,220 |
| | 1,331,069 |
|
Non-accrual (2) | 3,899 |
| | 3,845 |
| | 1,170 |
| | 17,645 |
| | 17,078 |
| | 6,487 |
| 8,976 |
| | 8,910 |
| | 4,342 |
| | 8,870 |
| | 8,788 |
| | 3,015 |
|
| Second lien: | |
| | |
| | |
| | |
| | |
| | |
| | | | | | | |
| | |
| | |
|
| Performing | 27,909 |
| | 27,579 |
| | 27,909 |
| | 39,924 |
| | 39,464 |
| | 39,774 |
| 9,435 |
| | 9,338 |
| | 9,435 |
| | 9,434 |
| | 9,306 |
| | 9,434 |
|
Non-accrual (2) | — |
| | — |
| | — |
| | — |
| | — |
| | — |
| — |
| | — |
| | — |
| | — |
| | — |
| | — |
|
| Subordinated debt: | |
| | |
| | |
| | |
| | |
| | |
| | | | | | | |
| | |
| | |
|
| Performing | 1,750 |
| | 1,750 |
| | 1,427 |
| | 1,707 |
| | 1,707 |
| | 1,715 |
| 251 |
| | 251 |
| | 251 |
| | 59 |
| | 59 |
| | 59 |
|
Non-accrual (2) | — |
| | — |
| | — |
| | — |
| | — |
| | — |
| — |
| | — |
| | — |
| | — |
| | — |
| | — |
|
Subordinated notes of SLF (3) | |
| | |
| | |
| | |
| | |
| | |
| |
| Performing | 77,301 |
| | 77,301 |
| | 77,301 |
| | 76,563 |
| | 76,563 |
| | 76,563 |
| |
Non-accrual (2) | — |
| | — |
| | — |
| | — |
| | — |
| | — |
| |
LLC equity interests of SLF (3) | N/A |
| | 31,339 |
| | 26,927 |
| | N/A |
| | 23,222 |
| | 22,373 |
| |
LLC equity interests in SLF(4) | | N/A |
| | 75,407 |
| | 71,084 |
| | N/A |
| | 97,457 |
| | 95,015 |
|
| Equity | N/A |
| | 46,179 |
| | 59,732 |
| | N/A |
| | 41,515 |
| | 57,808 |
| N/A |
| | 38,170 |
| | 40,706 |
| | N/A |
| | 37,619 |
| | 51,394 |
|
| Total | $ | 1,593,272 |
|
| $ | 1,650,173 |
|
| $ | 1,660,612 |
|
| $ | 1,471,217 |
|
| $ | 1,517,314 |
|
| $ | 1,529,784 |
| $ | 1,686,730 |
| | $ | 1,780,652 |
| | $ | 1,782,841 |
| | $ | 1,555,852 |
| | $ | 1,671,239 |
| | $ | 1,685,015 |
|
| |
(1) | Fourteen27 and nine19 of our loans included a feature permitting a portion of the interest due on such loan to be PIK interest as of September 30, 20162018 and 2015,2017, respectively. |
| |
(2) | We refer to a loan as non-accrual when we cease recognizing interest income on the loan because we have stopped pursuing repayment of the loan or, in certain circumstances, it is past due 90 days or more on principal and interest or our management has reasonable doubt that principal or interest will be collected. See “— Critical Accounting Policies — Revenue Recognition.” |
| |
(3) | SLF's proceedsThe negative fair value is the result of the unfunded commitment being valued below par. |
| |
(4) | Proceeds from the subordinated notes and LLC equity interestinterests invested in SLF were utilized by SLF to invest in senior secured loans. |
As of September 30, 20162018 we had three debt investments on non-accrual status and 2015,non-accrual investments as a percentage of total investments at cost and fair value were 0.7% and 0.3%, respectively. As of September 30, 2017, we had three debt investments on non-accrual status and non-accrual investments as a percentage of total investments at cost and fair value were 0.6% and 0.2%, respectively. As of September 30, 2018 and September 30, 2017, the fair value of our debt investments including our investment in SLF subordinated notes, as a percentage of the outstanding parprincipal value was 98.8%99.1% and 98.5%98.9%, respectively.
The following table shows the weighted average rate, spread over LIBOR of floating rate and fees of investments originated and the weighted average rate of sales and payoffs of portfolio companies during the years ended September 30, 2016, 20152018, 2017 and 2014:2016:
| | | | For the years ended September 30, | For the years ended September 30, |
| | 2016 | | 2015 | | 2014 | 2018 | | 2017 | | 2016 |
Weighted average rate of new investment fundings(1) | 7.2% | | 6.7% | | 7.1% | 8.0% | | 7.1% | | 7.2% |
Weighted average spread over LIBOR of new floating rate investment fundings(1) | 6.2% | | 5.7% | | 6.0% | 6.0% | | 5.9% | | 6.2% |
| Weighted average rate of new fixed rate investment fundings | 10.7% | | 10.8% | | N/A | 9.6% | | 8.0% | | 10.7% |
| Weighted average fees of new investment fundings | 1.9% | | 1.5% | | 1.2% | 1.3% | | 1.5% | | 1.9% |
Weighted average rate of sales and payoffs of portfolio investments(2) | 7.0% | | 6.8% | | 7.9% | |
Weighted average rate of sales and payoffs of portfolio investments(1)(2) | | 8.3% | | 7.3% | | 7.0% |
Weighted average income yield (3)(4) | 7.6% | | 7.8% | | 8.3% | 8.3% | | 7.8% | | 7.6% |
| |
(1) | Excludes our subordinated note investments in SLF.SLF, which were redeemed on December 30, 2016. |
| |
(2) | Excludes exits on investments on non-accrual status. |
| |
(3) | Represents income from interest, including subordinated note investmentnotes in SLF, and fees, excluding amortization of capitalized fees and discounts, divided by the average fair value of earning debt investments.investments, and does not represent a return to any investor in us. |
| |
(4) | For the years ended September 30, 2018 and 2017, weighted average income yield does not reflect interest income from subordinated notes in SLF, which were redeemed on December 30, 2016. |
As of September 30, 2016, 93.3%2018, 98.6% and 93.6%98.6% of our debt portfolio at fair value and at amortized cost, respectively, had interest rate floors that limit the minimum applicable interest rates on such loans. As of September 30, 2015, 94.2%2017, 99.6% and 94.1%99.6% of our debt portfolio at fair value and at amortized cost, respectively, had interest rate floors that limit the minimum applicable interest rates on such loans.
As of September 30, 20162018 and 2015,2017, the portfolio median earnings before interest, taxes, depreciation and amortization, or EBITDA, for our portfolio companies (excluding SLF) was $26.0$26.2 million and $23.0$25.2 million, respectively. The portfolio median EBITDA data is based on the most recently reported trailing twelve monthtwelve-month EBITDA received from the portfolio company.
As part of the monitoring process, GC Advisors regularly assesses the risk profile of each of our investments and rates each of them based on an internal system developed by Golub Capital and its affiliates. This system is not generally accepted in our industry or used by our competitors. It is based on the following categories, which we refer to as GC Advisors’ internal performance ratings:
|
| | |
| | |
| Internal Performance Ratings |
| Rating | | Definition |
| 5 | | Involves the least amount of risk in our portfolio. The borrower is performing above expectations, and the trends and risk factors are generally favorable. |
| 4 | | Involves an acceptable level of risk that is similar to the risk at the time of origination. The borrower is generally performing as expected, and the risk factors are neutral to favorable. |
| 3 | | Involves a borrower performing below expectations and indicates that the loan’s risk has increased somewhat since origination. The borrower may be out of compliance with debt covenants; however, loan payments are generally not past due. |
| 2 | | Involves a borrower performing materially below expectations and indicates that the loan’s risk has increased materially since origination. In addition to the borrower being generally out of compliance with debt covenants, loan payments may be past due (but generally not more than 180 days past due). |
| 1 | | Involves a borrower performing substantially below expectations and indicates that the loan’s risk has substantially increased since origination. Most or all of the debt covenants are out of compliance and payments are substantially delinquent. Loans rated 1 are not anticipated to be repaid in full and we will reduce the fair market value of the loan to the amount we anticipate will be recovered. |
Our internal performance ratings do not constitute any rating of investments by a nationally recognized statistical rating organization or represent or reflect any third-party assessment of any of our investments.
For any investment rated 1, 2 or 3, GC Advisors will increase its monitoring intensity and prepare regular updates for the investment committee, summarizing current operating results and material impending events and suggesting recommended actions.
GC Advisors monitors and, when appropriate, changes the internal performance ratings assigned to each investment in our portfolio. In connection with our valuation process, GC Advisors and our board of directors review these internal performance ratings on a quarterly basis.
The following table shows the distribution of our investments on the 1 to 5 internal performance rating scale at fair value as of September 30, 2018 and 2017:
|
| | | | | | | | | | | | | | |
| | | As of September 30, 2018 | | As of September 30, 2017 |
Internal Performance Rating | | Investments at Fair Value (In thousands) | | Percentage of Total Investments | | Investments at Fair Value (In thousands) | | Percentage of Total Investments |
| 5 | | $ | 113,873 |
| | 6.4 | % | | $ | 91,525 |
| | 5.5 | % |
| 4 | | 1,455,754 |
| | 81.6 |
| | 1,378,316 |
| | 81.8 |
|
| 3 | | 195,414 |
| | 11.0 |
| | 212,629 |
| | 12.6 |
|
| 2 | | 17,250 |
| | 1.0 |
| | 249 |
| | 0.0* |
|
| 1 | | 550 |
| | 0.0* |
| | 2,296 |
| | 0.1 |
|
| Total | | $ | 1,782,841 |
| | 100.0 | % | | $ | 1,685,015 |
| | 100.0 | % |
|
| |
| * | Represents an amount less than 0.1%. |
Senior Loan Fund LLC
We co-invest with RGA Reinsurance Company, or RGA, in senior secured loans through SLF, an unconsolidated Delaware LLC. SLF is capitalized as transactions are completed and all portfolio and investment decisions in respect to SLF must be approved by the SLF investment committee consisting of two representatives of each of us and RGA (with unanimous approval required from (i) one representative of each of us and RGA or (ii) both representatives of each of us and RGA). SLF may cease making new investments upon notification of either member but operations will continue until all investments have been sold or paid-off in the normal course of business.
As of September 30, 2018, SLF is capitalized with subordinated notes andby LLC equity interest subscriptions from its members. On December 14, 2016, the SLF investment committee approved the recapitalization of the commitments of SLF’s members. On December 30, 2016, SLF’s members entered into additional LLC equity interest subscriptions totaling $160.0 million, SLF issued capital calls totaling $89.9 million to us and RGA and the subordinated notes previously issued by SLF were redeemed and terminated. As of September 30, 2016,2018 and 2017, we and RGA owned 87.5% and 12.5%, respectively, of both the outstanding subordinated notes and LLC equity interests. SLF’s profits and losses are allocated to us and RGA in accordance with our respective ownership interests.
As of September 30, 20162018 and 2015,2017, SLF had the following commitments from its members:members (in the aggregate):
|
| | | | | | | | | | | | | | | |
| | As of September 30, 2016 | | As of September 30, 2015 |
| | Committed | | Funded(1) | | Committed | | Funded(1) |
| | (Dollars in thousands) |
Subordinated note commitments (2) | $ | 160,000 |
| | $ | 88,344 |
| | $ | 160,000 |
| | $ | 87,500 |
|
LLC equity commitments (2) | 40,000 |
| | 35,816 |
| | 40,000 |
| | 26,540 |
|
| Total | $ | 200,000 |
| | $ | 124,160 |
| | $ | 200,000 |
| | $ | 114,040 |
|
|
| | | | | | | | | | | | | | | |
| | As of September 30, 2018 | | As of September 30, 2017 |
| | Committed | | Funded(1) | | Committed | | Funded(1) |
| | (In thousands) |
LLC equity commitments | $ | 200,000 |
| | $ | 86,180 |
| | $ | 200,000 |
| | $ | 111,380 |
|
| Total | $ | 200,000 |
| | $ | 86,180 |
| | $ | 200,000 |
| | $ | 111,380 |
|
| |
(1) | Funded subordinated note commitments are presented net of repayments subject to recall and funded LLC equity commitments are presented net of return of capital distributions subject to recall. |
| |
(2)
| Commitments presented are combined for us and RGA. |
As of September 30, 2016,2018, the senior secured revolving credit facility, or, as amended, the SLF Credit Facility, that Senior Loan Fund II LLC, a wholly-owned subsidiary of SLF, or SLF II, entered into with Wells Fargo Securities, LLC, as administrative agent, and Wells Fargo Bank, N.A., as lender, allows SLF II to borrow up to $300.0$104.6 million subject to leverage and borrowing base restrictions. The reinvestment period of the SLF Credit Facility ends May 13, 2017,ended August 29, 2018 and as of September 30, 2018, the maximum commitment is equal to advances outstanding. The stated maturity date is May 13,August 30, 2020. As of September 30, 20162018 and September 30, 2015,2017, SLF II had outstanding debt under the SLF Credit Facility of $214.1$104.6 million and $212.3$197.7 million, respectively.
Through the reinvestment period, As of September 30, 2018 the SLF Credit Facility bears interest at one-month LIBOR plus a rate between 1.75% and 2.25%, depending on the composition of the collateral asset portfolio,2.05% per annum. After the reinvestment period, the rate will reset to one-month LIBOR plus 2.75% per annum for the remaining term of the SLF Credit Facility.
As of September 30, 20162018 and 2015,2017, SLF had total assets at fair value of $332.8$186.3 million and $323.4$306.2 million, respectively. As of September 30, 2016 and 2015, SLF’s portfolio was comprised of first lien senior secured loans to 62 and 62 different borrowers, respectively. As of September 30, 20162018, SLF had one portfolio company investment on non-accrual status and the totalwith a fair value of non-accrual loans was $6.7$3.9 million. As of September 30, 2015,2017, SLF did not have anyhad one portfolio company investmentsinvestment on non-accrual status.status with a fair value of $0.3 million. The portfolio companies in SLF are in industries and geographies similar to those in which we may invest directly. Additionally, as of September 30, 20162018 and 2015,2017, SLF had commitments to fund various undrawn revolving credit and delayed draw loans to its portfolio companies totaling $24.1$5.9 million and $30.8$13.3 million, respectively.
Below is a summary of SLF’s portfolio, followed by a listing of the individual loansinvestments in SLF’s portfolio as of September 30, 20162018 and 2015:2017:
| | | | As of September 30, | | | | | |
| | 2016 | | 2015 | As of September 30, 2018 | | As of September 30, 2017 |
| | (Dollars in thousands) | (Dollars in thousands) |
Senior secured loans (1) | $ | 331,473 |
| | $ | 320,583 |
| $ | 183,668 |
| | $ | 301,583 |
|
Weighted average current interest rate on senior secured loans (2) | 6.0 | % | | 5.8 | % | 7.5 | % | | 6.4 | % |
| Number of borrowers in SLF | 62 |
| | 62 |
| 32 |
| | 50 |
|
Largest portfolio company investment(1) | $ | 13,050 |
| | $ | 12,734 |
| $ | 13,716 |
| | $ | 13,820 |
|
Total of five largest portfolio company investments(1) | $ | 61,118 |
| | $ | 59,917 |
| $ | 57,330 |
| | $ | 61,187 |
|
| |
(2) | Computed as the (a) annual stated interest rate on accruing senior secured loans divided by (b) total senior secured loans at principal amount. |
|
| | | | | | | | | | | | | | | | | | |
| SLF Investment Portfolio as of September 30, 2018 |
| Portfolio Company | | Business Description | | Investment Type | | Maturity Date | | Current Interest Rate(1) | | Principal ($) / Shares(2) | | Fair Value(3) |
| | | | | | | | | | | (In thousands) |
| 1A Smart Start LLC | | Home and Office Furnishings, Housewares, and Durable Consumer | | Senior Loan | | 02/2022 | | 7.0 |
| % | | $ | 2,073 |
| | $ | 2,084 |
|
1A Smart Start LLC(4) | | Home and Office Furnishings, Housewares, and Durable Consumer | | Senior Loan | | 02/2022 | | 6.7 |
| | | 922 |
| | 924 |
|
Advanced Pain Management Holdings, Inc. (5) | | Healthcare, Education and Childcare | | Senior Loan | | 11/2018 | | 7.2 |
| | | 6,561 |
| | 3,609 |
|
Advanced Pain Management Holdings, Inc.(5) | | Healthcare, Education and Childcare | | Senior Loan | | 11/2018 | | 7.2 |
| | | 449 |
| | 247 |
|
| Boot Barn, Inc. | | Retail Stores | | Senior Loan | | 06/2021 | | 6.9 |
| | | 9,533 |
| | 9,533 |
|
| Brandmuscle, Inc. | | Printing and Publishing | | Senior Loan | | 12/2021 | | 7.1 |
| | | 4,678 |
| | 4,674 |
|
Captain D's, LLC(4) | | Personal, Food and Miscellaneous Services | | Senior Loan | | 12/2023 | | 7.9 |
| | | 13 |
| | 13 |
|
Captain D's, LLC(4) | | Personal, Food and Miscellaneous Services | | Senior Loan | | 12/2023 | | 6.7 |
| | | 2,499 |
| | 2,499 |
|
| CLP Healthcare Services, Inc. | | Healthcare, Education and Childcare | | Senior Loan | | 12/2020 | | 7.9 |
| | | 8,502 |
| | 8,332 |
|
| CLP Healthcare Services, Inc. | | Healthcare, Education and Childcare | | Senior Loan | | 12/2020 | | 7.9 |
| | | 4,284 |
| | 4,198 |
|
| Community Veterinary Partners, LLC | | Personal, Food and Miscellaneous Services | | Senior Loan | | 10/2021 | | 7.9 |
| | | 2,417 |
| | 2,417 |
|
| Community Veterinary Partners, LLC | | Personal, Food and Miscellaneous Services | | Senior Loan | | 10/2021 | | 7.9 |
| | | 1,215 |
| | 1,215 |
|
| Community Veterinary Partners, LLC | | Personal, Food and Miscellaneous Services | | Senior Loan | | 10/2021 | | 7.9 |
| | | 40 |
| | 40 |
|
| Community Veterinary Partners, LLC | | Personal, Food and Miscellaneous Services | | Senior Loan | | 10/2021 | | 7.9 |
| | | 58 |
| | 58 |
|
DISA Holdings Acquisition Subsidiary Corp.(4) | | Diversified/Conglomerate Service | | Senior Loan | | 06/2022 | | 6.1 |
| | | 71 |
| | 71 |
|
DISA Holdings Acquisition Subsidiary Corp.(4) | | Diversified/Conglomerate Service | | Senior Loan | | 06/2022 | | 6.1 |
| | | 4,821 |
| | 4,821 |
|
| Encore GC Acquisition, LLC | | Healthcare, Education and Childcare | | Senior Loan | | 01/2020 | | 7.5 |
| | | 4,540 |
| | 4,540 |
|
Flexan, LLC(4) | | Chemicals, Plastics and Rubber | | Senior Loan | | 02/2020 | | 9.8 |
| | | 304 |
| | 304 |
|
| Flexan, LLC | | Chemicals, Plastics and Rubber | | Senior Loan | | 02/2020 | | 8.1 |
| | | 5,967 |
| | 5,967 |
|
| Flexan, LLC | | Chemicals, Plastics and Rubber | | Senior Loan | | 02/2020 | | 8.1 |
| | | 1,657 |
| | 1,657 |
|
Gamma Technologies, LLC(4) | | Electronics | | Senior Loan | | 06/2024 | | 7.7 |
| | | 10,186 |
| | 10,186 |
|
| III US Holdings, LLC | | Diversified/Conglomerate Service | | Senior Loan | | 09/2022 | | 9.0 |
| | | 4,927 |
| | 4,927 |
|
| Mediaocean LLC | | Senior loan | | Senior Loan | | 08/2020 | | N/A (8) | | — |
| | — |
|
| Jensen Hughes, Inc. | | Buildings and Real Estate | | Senior Loan | | 03/2024 | | 6.7 |
| | | 2,293 |
| | 2,293 |
|
| Jensen Hughes, Inc. | | Buildings and Real Estate | | Senior Loan | | 03/2024 | | 6.7 |
| | | 119 |
| | 119 |
|
| Jensen Hughes, Inc. | | Buildings and Real Estate | | Senior Loan | | 03/2024 | | 6.7 |
| | | 64 |
| | 64 |
|
Joerns Healthcare, LLC(4) | | Healthcare, Education and Childcare | | Senior Loan | | 05/2020 | | 8.3 |
| | | 8,745 |
| | 8,133 |
|
| Paradigm DKD Group, LLC | | Buildings and Real Estate | | Senior Loan | | 05/2020 | | 8.5 |
| | | 702 |
| | 524 |
|
| Paradigm DKD Group, LLC | | Buildings and Real Estate | | Senior Loan | | 05/2020 | | 8.5 |
| | | 1,957 |
| | 1,369 |
|
Pasternack Enterprises, Inc. and Fairview Microwave, Inc(4) | | Diversified/Conglomerate Manufacturing | | Senior Loan | | 07/2025 | | 6.2 |
| | | 5,318 |
| | 5,291 |
|
| Payless ShoeSource, Inc. | | Retail Stores | | Senior Loan | | 08/2022 | | 11.3 |
| | | 762 |
| | 528 |
|
| Polk Acquisition Corp. | | Automobile | | Senior Loan | | 06/2022 | | 7.5 |
| | | 93 |
| | 93 |
|
| Polk Acquisition Corp. | | Automobile | | Senior Loan | | 06/2022 | | 7.2 |
| | | 4,513 |
| | 4,513 |
|
| Polk Acquisition Corp. | | Automobile | | Senior Loan | | 06/2022 | | 7.2 |
| | | 53 |
| | 53 |
|
| Pyramid Healthcare, Inc. | | Healthcare, Education and Childcare | | Senior Loan | | 08/2019 | | 8.8 |
| | | 411 |
| | 411 |
|
| Pyramid Healthcare, Inc. | | Healthcare, Education and Childcare | | Senior Loan | | 08/2019 | | 8.8 |
| | | 10,152 |
| | 10,152 |
|
| Pyramid Healthcare, Inc. | | Healthcare, Education and Childcare | | Senior Loan | | 08/2019 | | 8.8 |
| | | 45 |
| | 45 |
|
| Pyramid Healthcare, Inc. | | Healthcare, Education and Childcare | | Senior Loan | | 08/2019 | | 8.8 |
| | | 148 |
| | 148 |
|
|
| | | | | | | | | | | | | | | | | | |
| SLF Loan Portfolio as of September 30, 2016 |
| Portfolio Company | | Business Description | | Investment Type | | Maturity Date | | Current Interest Rate(1) | | Principal/ Par Amount | | Fair Value(2) |
| | | | | | | | | | | (In thousands) |
1A Smart Start LLC(3) | | Home and Office Furnishings, Housewares, and Durable Consumer | | Senior loan | | 02/2022 | | 5.8 |
| % | | $ | 2,116 |
| | $ | 2,111 |
|
| ACTIVE Network, Inc. | | Electronics | | Senior loan | | 11/2020 | | 5.5 |
| | | 1,945 |
| | 1,938 |
|
| Advanced Pain Management Holdings, Inc. | | Healthcare, Education and Childcare | | Senior loan | | 02/2018 | | 6.3 |
| | | 6,805 |
| | 6,601 |
|
| Advanced Pain Management Holdings, Inc. | | Healthcare, Education and Childcare | | Senior loan | | 02/2018 | | 6.3 |
| | | 466 |
| | 452 |
|
Advanced Pain Management Holdings, Inc.(4) | | Healthcare, Education and Childcare | | Senior loan | | 02/2018 | | N/A |
| (5) | | — |
| | (35 | ) |
Aimbridge Hospitality, LLC (3) | | Hotels, Motels, Inns, and Gaming | | Senior loan | | 10/2018 | | 5.8 |
| | | 5,037 |
| | 5,037 |
|
| American Seafoods Group LLC | | Beverage, Food and Tobacco | | Senior loan | | 08/2021 | | 6.0 |
| | | 4,818 |
| | 4,806 |
|
| Argon Medical Devices, Inc. | | Healthcare, Education and Childcare | | Senior loan | | 12/2021 | | 5.8 |
| | | 3,895 |
| | 3,895 |
|
Arise Virtual Solutions, Inc.(3) | | Telecommunications | | Senior loan | | 12/2018 | | 7.8 |
| | | 10,804 |
| | 10,264 |
|
Arise Virtual Solutions, Inc.(3)(4) | | Telecommunications | | Senior loan | | 12/2018 | | N/A |
| (5) | | — |
| | (28 | ) |
Atkins Nutritionals, Inc.(3) | | Beverage, Food and Tobacco | | Senior loan | | 01/2019 | | 6.3 |
| | | 5,664 |
| | 5,664 |
|
| BMC Software, Inc. | | Electronics | | Senior loan | | 09/2020 | | 5.0 |
| | | 1,876 |
| | 1,813 |
|
| Boot Barn, Inc. | | Retail Stores | | Senior loan | | 06/2021 | | 5.5 |
| | | 10,667 |
| | 10,667 |
|
| Brandmuscle, Inc. | | Printing and Publishing | | Senior loan | | 12/2021 | | 5.8 |
| | | 4,948 |
| | 4,938 |
|
| C.B. Fleet Company, Incorporated | | Personal and Non Durable Consumer Products | | Senior loan | | 12/2021 | | 5.8 |
| | | 7,613 |
| | 7,613 |
|
| Checkers Drive-In Restaurants, Inc. | | Beverage, Food and Tobacco | | Senior loan | | 01/2022 | | 6.5 |
| | | 4,460 |
| | 4,427 |
|
| CLP Healthcare Services, Inc. | | Healthcare, Education and Childcare | | Senior loan | | 12/2020 | | 6.3 |
| | | 8,677 |
| | 8,677 |
|
| CLP Healthcare Services, Inc. | | Healthcare, Education and Childcare | | Senior loan | | 12/2020 | | 6.3 |
| | | 4,373 |
| | 4,373 |
|
| Community Veterinary Partners, LLC | | Personal, Food and Miscellaneous Services | | Senior loan | | 10/2021 | | 6.5 |
| | | 2,466 |
| | 2,454 |
|
| Community Veterinary Partners, LLC | | Personal, Food and Miscellaneous Services | | Senior loan | | 10/2021 | | 6.5 |
| | | 1,240 |
| | 1,234 |
|
CPI Buyer, LLC (Cole-Parmer)(3) | | Healthcare, Education and Childcare | | Senior loan | | 08/2021 | | 5.5 |
| | | 5,805 |
| | 5,776 |
|
Curo Health Services LLC(3) | | Healthcare, Education and Childcare | | Senior loan | | 02/2022 | | 6.5 |
| | | 5,910 |
| | 5,928 |
|
DentMall MSO, LLC(6) | | Retail Stores | | Senior loan | | 07/2019 | | 6.0 |
| | | 10,147 |
| | 6,088 |
|
DentMall MSO, LLC(6) | | Retail Stores | | Senior loan | | 07/2019 | | 6.0 |
| | | 1,000 |
| | 598 |
|
| DISA Holdings Acquisition Subsidiary Corp. | | Diversified/Conglomerate Service | | Senior loan | | 12/2020 | | 5.5 |
| | | 4,568 |
| | 4,431 |
|
| DISA Holdings Acquisition Subsidiary Corp. | | Diversified/Conglomerate Service | | Senior loan | | 12/2020 | | 5.5 |
| | | 255 |
| | 224 |
|
| EAG, INC. (Evans Analytical Group) | | Diversified/Conglomerate Service | | Senior loan | | 07/2017 | | 5.0 |
| | | 2,113 |
| | 2,113 |
|
Encore GC Acquisition, LLC(3) | | Healthcare, Education and Childcare | | Senior loan | | 01/2020 | | 6.3 |
| | | 4,773 |
| | 4,773 |
|
Encore GC Acquisition, LLC(3) | | Healthcare, Education and Childcare | | Senior loan | | 01/2020 | | 7.8 |
| | | 164 |
| | 164 |
|
Express Oil Change, LLC(3) | | Retail Stores | | Senior loan | | 12/2017 | | 6.0 |
| | | 4,841 |
| | 4,841 |
|
| Extreme Reach Inc. | | Broadcasting and Entertainment | | Senior loan | | 02/2020 | | 7.3 |
| | | 1,976 |
| | 1,998 |
|
| Federal-Mogul Corporation | | Automobile | | Senior loan | | 04/2021 | | 4.8 |
| | | 3,920 |
| | 3,799 |
|
| Flexan, LLC | | Chemicals, Plastics and Rubber | | Senior loan | | 02/2020 | | 6.3 |
| | | 6,090 |
| | 6,090 |
|
Harvey Tool Company, LLC(3) | | Diversified/Conglomerate Manufacturing | | Senior loan | | 03/2020 | | 6.0 |
| | | 3,108 |
| | 3,108 |
|
| Jensen Hughes, Inc. | | Diversified/Conglomerate Service | | Senior loan | | 12/2021 | | 6.3 |
| | | 2,342 |
| | 2,342 |
|
| Jensen Hughes, Inc. | | Diversified/Conglomerate Service | | Senior loan | | 12/2021 | | 6.0 |
| | | 104 |
| | 104 |
|
| Jensen Hughes, Inc. | | Diversified/Conglomerate Service | | Senior loan | | 12/2021 | | 6.2 |
| | | 65 |
| | 65 |
|
Joerns Healthcare, LLC(3) | | Healthcare, Education and Childcare | | Senior loan | | 05/2020 | | 6.0 |
| | | 9,598 |
| | 9,118 |
|
| Julio & Sons Company | | Beverage, Food and Tobacco | | Senior loan | | 12/2018 | | 6.5 |
| | | 6,834 |
| | 6,834 |
|
| Julio & Sons Company | | Beverage, Food and Tobacco | | Senior loan | | 12/2018 | | 6.5 |
| | | 1,061 |
| | 1,061 |
|
| Julio & Sons Company | | Beverage, Food and Tobacco | | Senior loan | | 12/2018 | | 6.5 |
| | | 596 |
| | 596 |
|
K&N Engineering, Inc.(3) | | Automobile | | Senior loan | | 07/2019 | | 6.8 |
| | | 3,781 |
| | 3,781 |
|
K&N Engineering, Inc.(3) | | Automobile | | Senior loan | | 07/2019 | | 5.3 |
| | | 179 |
| | 179 |
|
| Loar Group Inc. | | Aerospace and Defense | | Senior loan | | 01/2022 | | 5.8 |
| | | 2,233 |
| | 2,233 |
|
Mediaocean LLC(3) | | Diversified/Conglomerate Service | | Senior loan | | 08/2022 | | 5.8 |
| | | 3,137 |
| | 3,137 |
|
Northwestern Management Services, LLC(3) | | Healthcare, Education and Childcare | | Senior loan | | 10/2019 | | 6.5 |
| | | 4,288 |
| | 4,224 |
|
Northwestern Management Services, LLC(3) | | Healthcare, Education and Childcare | | Senior loan | | 10/2019 | | 6.5 |
| | | 470 |
| | 463 |
|
Northwestern Management Services, LLC(3) | | Healthcare, Education and Childcare | | Senior loan | | 10/2019 | | 7.5 |
| | | 1 |
| | 1 |
|
|
| | | | | | | | | | | | | | | | | | |
| SLF Loan Portfolio as of September 30, 2016 – (continued) |
| Portfolio Company | | Business Description | | Investment Type | | Maturity Date | | Current Interest Rate(1) | | Principal/ Par Amount | | Fair Value(2) |
| | | | | | | | | | | (In thousands) |
| Paradigm DKD Group, LLC | | Buildings and Real Estate | | Senior loan | | 11/2018 | | 6.5 |
| % | | $ | 1,998 |
| | $ | 1,958 |
|
| Paradigm DKD Group, LLC | | Buildings and Real Estate | | Senior loan | | 11/2018 | | 6.7 |
| | | 180 |
| | 166 |
|
Pasternack Enterprises, Inc. and Fairview Microwave, Inc(3) | | Diversified/Conglomerate Manufacturing | | Senior loan | | 05/2022 | | 6.0 |
| | | 1,640 |
| | 1,623 |
|
| Payless ShoeSource, Inc. | | Retail Stores | | Senior loan | | 03/2021 | | 5.0 |
| | | 1,955 |
| | 1,163 |
|
| Pentec Acquisition Sub, Inc. | | Healthcare, Education and Childcare | | Senior loan | | 05/2018 | | 6.3 |
| | | 1,419 |
| | 1,419 |
|
PetVet Care Centers LLC(3) | | Personal, Food and Miscellaneous Services | | Senior loan | | 12/2020 | | 5.8 |
| | | 5,895 |
| | 5,895 |
|
PetVet Care Centers LLC(3) | | Personal, Food and Miscellaneous Services | | Senior loan | | 12/2020 | | 5.8 |
| | | 1,219 |
| | 1,219 |
|
PowerPlan Holdings, Inc.(3) | | Utilities | | Senior loan | | 02/2022 | | 5.8 |
| | | 11,994 |
| | 11,994 |
|
| PPT Management, LLC | | Healthcare, Education and Childcare | | Senior loan | | 04/2020 | | 6.0 |
| | | 13,026 |
| | 13,026 |
|
| PPT Management, LLC | | Healthcare, Education and Childcare | | Senior loan | | 04/2020 | | 6.0 |
| | | 10 |
| | 10 |
|
Premise Health Holding Corp.(3) | | Healthcare, Education and Childcare | | Senior loan | | 06/2020 | | 5.5 |
| | | 11,891 |
| | 11,891 |
|
Pyramid Healthcare, Inc.(3) | | Healthcare, Education and Childcare | | Senior loan | | 08/2019 | | 6.8 |
| | | 8,354 |
| | 8,354 |
|
| Pyramid Healthcare, Inc. | | Healthcare, Education and Childcare | | Senior loan | | 08/2019 | | 7.8 |
| | | 373 |
| | 373 |
|
| R.G. Barry Corporation | | Personal, Food and Miscellaneous Services | | Senior loan | | 09/2019 | | 6.0 |
| | | 5,880 |
| | 5,821 |
|
Radiology Partners, Inc.(3) | | Healthcare, Education and Childcare | | Senior loan | | 09/2020 | | 6.5 |
| | | 7,072 |
| | 7,001 |
|
Radiology Partners, Inc.(3) | | Healthcare, Education and Childcare | | Senior loan | | 09/2020 | | 6.5 |
| | | 801 |
| | 792 |
|
Radiology Partners, Inc.(3) | | Healthcare, Education and Childcare | | Senior loan | | 09/2020 | | 6.5 |
| | | 510 |
| | 505 |
|
Radiology Partners, Inc.(3)(4) | | Healthcare, Education and Childcare | | Senior loan | | 09/2020 | | N/A |
| (5) | | — |
| | (6 | ) |
Radiology Partners, Inc.(3)(4) | | Healthcare, Education and Childcare | | Senior loan | | 09/2020 | | N/A |
| (5) | | — |
| | (3 | ) |
Reliant Pro ReHab, LLC(3) | | Healthcare, Education and Childcare | | Senior loan | | 12/2017 | | 6.0 |
| | | 3,337 |
| | 3,337 |
|
RSC Acquisition, Inc.(3) | | Insurance | | Senior loan | | 11/2022 | | 6.3 |
| | | 3,732 |
| | 3,732 |
|
RSC Acquisition, Inc.(3) | | Insurance | | Senior loan | | 11/2022 | | 6.3 |
| | | 172 |
| | 172 |
|
| RSC Acquisition, Inc. | | Insurance | | Senior loan | | 11/2020 | | 6.8 |
| | | 33 |
| | 33 |
|
Rubio's Restaurants, Inc.(3) | | Beverage, Food and Tobacco | | Senior loan | | 11/2018 | | 6.0 |
| | | 5,044 |
| | 5,044 |
|
| Rug Doctor LLC | | Personal and Non Durable Consumer Products | | Senior loan | | 06/2018 | | 6.3 |
| | | 7,780 |
| | 7,780 |
|
| Saldon Holdings, Inc. | | Diversified/Conglomerate Service | | Senior loan | | 09/2021 | | 5.5 |
| | | 2,718 |
| | 2,718 |
|
| Sarnova HC, LLC | | Healthcare, Education and Childcare | | Senior loan | | 01/2022 | | 5.8 |
| | | 3,722 |
| | 3,722 |
|
| SEI, Inc. | | Electronics | | Senior loan | | 07/2021 | | 5.8 |
| | | 8,711 |
| | 8,711 |
|
Self Esteem Brands, LLC(3) | | Leisure, Amusement, Motion Pictures, Entertainment | | Senior loan | | 02/2020 | | 5.0 |
| | | 6,342 |
| | 6,342 |
|
Severin Acquisition, LLC(3) | | Diversified/Conglomerate Service | | Senior loan | | 07/2021 | | 5.9 |
| | | 4,882 |
| | 4,858 |
|
| Smashburger Finance LLC | | Beverage, Food and Tobacco | | Senior loan | | 05/2018 | | 6.8 |
| | | 951 |
| | 932 |
|
| Smashburger Finance LLC | | Beverage, Food and Tobacco | | Senior loan | | 05/2018 | | 6.8 |
| | | 75 |
| | 74 |
|
| Smashburger Finance LLC | | Beverage, Food and Tobacco | | Senior loan | | 05/2018 | | 6.8 |
| | | 75 |
| | 73 |
|
| Smashburger Finance LLC | | Beverage, Food and Tobacco | | Senior loan | | 05/2018 | | 6.8 |
| | | 75 |
| | 73 |
|
| Smashburger Finance LLC | | Beverage, Food and Tobacco | | Senior loan | | 05/2018 | | 6.8 |
| | | 75 |
| | 73 |
|
Smashburger Finance LLC(4) | | Beverage, Food and Tobacco | | Senior loan | | 05/2018 | | N/A |
| (5) | | — |
| | (2 | ) |
Systems Maintenance Services Holding, Inc.(3) | | Electronics | | Senior loan | | 10/2019 | | 5.0 |
| | | 2,396 |
| | 2,396 |
|
Tate's Bake Shop, Inc.(3) | | Beverage, Food and Tobacco | | Senior loan | | 08/2019 | | 6.0 |
| | | 2,955 |
| | 2,955 |
|
| Teasdale Quality Foods, Inc. | | Grocery | | Senior loan | | 10/2020 | | 5.3 |
| | | 4,582 |
| | 4,566 |
|
Transaction Data Systems, Inc.(3) | | Diversified/Conglomerate Service | | Senior loan | | 06/2021 | | 6.3 |
| | | 5,260 |
| | 5,260 |
|
| Transaction Data Systems, Inc. | | Diversified/Conglomerate Service | | Senior loan | | 06/2020 | | 5.5 |
| | | 9 |
| | 8 |
|
| W3 Co. | | Oil and Gas | | Senior loan | | 03/2020 | | 5.8 |
| | | 2,924 |
| | 2,295 |
|
| Worldwide Express Operations, LLC | | Cargo Transport | | Senior loan | | 07/2019 | | 6.0 |
| | | 4,869 |
| | 4,869 |
|
| Worldwide Express Operations, LLC | | Cargo Transport | | Senior loan | | 07/2019 | | 6.0 |
| | | 100 |
| | 100 |
|
Young Innovations, Inc.(3) | | Healthcare, Education and Childcare | | Senior loan | | 01/2019 | | 5.3 |
| | | 3,804 |
| | 3,818 |
|
Young Innovations, Inc.(3) | | Healthcare, Education and Childcare | | Senior loan | | 01/2018 | | 6.8 |
| | | 122 |
| | 118 |
|
| Zest Holdings, LLC | | Healthcare, Education and Childcare | | Senior loan | | 08/2020 | | 5.8 |
| | | 5,282 |
| | 5,282 |
|
| | | | | | | | | | | | $ | 331,473 |
| | $ | 323,510 |
|
|
| | | | | | | | | | | | | | | | | | |
| SLF Investment Portfolio as of September 30, 2018 - (continued) |
| Portfolio Company | | Business Description | | Investment Type | | Maturity Date | | Current Interest Rate(1) | | Principal ($) / Shares(2) | | Fair Value(3) |
| | | | | | | | | | | (In thousands) |
RSC Acquisition, Inc.(4) | | Insurance | | Senior Loan | | 11/2021 | | 6.8 |
| % | | $ | 17 |
| | $ | 17 |
|
RSC Acquisition, Inc.(4) | | Insurance | | Senior Loan | | 11/2022 | | 6.7 |
| | | 3,824 |
| | 3,815 |
|
Rubio's Restaurants, Inc.(4) | | Beverage, Food and Tobacco | | Senior Loan | | 10/2019 | | 7.6 |
| | | 4,941 |
| | 4,941 |
|
| Rug Doctor LLC | | Personal and Non Durable Consumer Products (Mfg. Only) | | Senior Loan | | 04/2019 | | 7.6 |
| | | 991 |
| | 991 |
|
| Rug Doctor LLC | | Personal and Non Durable Consumer Products (Mfg. Only) | | Senior Loan | | 04/2019 | | 7.6 |
| | | 5,061 |
| | 5,061 |
|
| Sage Dental Management, LLC | | Healthcare, Education and Childcare | | Senior Loan | | 12/2020 | | 8.4 |
| | | 70 |
| | 64 |
|
| Sage Dental Management, LLC | | Healthcare, Education and Childcare | | Senior Loan | | 12/2020 | | 8.4 |
| | | 4,345 |
| | 3,997 |
|
| Sage Dental Management, LLC | | Healthcare, Education and Childcare | | Senior Loan | | 12/2020 | | 8.4 |
| | | 45 |
| | 42 |
|
| Sage Dental Management, LLC | | Healthcare, Education and Childcare | | Senior Loan | | 12/2020 | | 8.4 |
| | | 64 |
| | 59 |
|
Saldon Holdings, Inc. (4) | | Diversified/Conglomerate Service | | Senior Loan | | 09/2022 | | 6.4 |
| | | 2,354 |
| | 2,342 |
|
SEI, Inc.(4) | | Electronics | | Senior Loan | | 07/2023 | | 7.5 |
| | | 13,716 |
| | 13,716 |
|
Self Esteem Brands, LLC(4) | | Leisure, Amusement, Motion Pictures, Entertainment | | Senior Loan | | 02/2020 | | 7.0 |
| | | 10,142 |
| | 10,142 |
|
| Teasdale Quality Foods, Inc. | | Grocery | | Senior Loan | | 10/2020 | | 6.9 |
| | | 4,507 |
| | 4,416 |
|
| Teasdale Quality Foods, Inc. | | Grocery | | Senior Loan | | 10/2020 | | 6.9 |
| | | 486 |
| | 476 |
|
| Teasdale Quality Foods, Inc. | | Grocery | | Senior Loan | | 10/2020 | | 7.1 |
| | | 650 |
| | 637 |
|
| Teasdale Quality Foods, Inc. | | Grocery | | Senior Loan | | 10/2020 | | 7.1 |
| | | 239 |
| | 235 |
|
| Teasdale Quality Foods, Inc. | | Grocery | | Senior Loan | | 10/2020 | | 6.9 |
| | | 3,532 |
| | 3,460 |
|
| Upstream Intermediate, LLC | | Healthcare, Education and Childcare | | Senior Loan | | 01/2024 | | 6.6 |
| | | 2,830 |
| | 2,830 |
|
| W3 Co. | | Oil and Gas | | Senior Loan | | 03/2022 | | 8.2 |
| | | 1,253 |
| | 1,251 |
|
WHCG Management, LLC(4) | | Healthcare, Education and Childcare | | Senior Loan | | 03/2023 | | 7.4 |
| | | 7,900 |
| | 7,900 |
|
WIRB-Copernicus Group, Inc.(4) | | Healthcare, Education and Childcare | | Senior Loan | | 08/2022 | | 6.5 |
| | | 5,609 |
| | 5,609 |
|
| Total senior loan investments | | | | | | | | | | | $ | 183,668 |
| | $ | 178,053 |
|
| | | | | | | | | | | | |
Payless ShoeSource, Inc. (6)(7) | | Retail Stores | | LLC interest | | N/A | | N/A |
| | | 35 |
| | $ | 54 |
|
W3 Co. (6)(7) | | Oil and Gas | | LLC units | | N/A | | N/A |
| | | 3 |
| | 1,073 |
|
| Total equity investments | | | | | | | | | | | | | $ | 1,127 |
|
| | | | | | | | | | | | | | |
| Total investments | | | | | | | | | | | $ | 183,668 |
| | $ | 179,180 |
|
| |
(1) | Represents the weighted average annual current interest rate as of September 30, 2016. All interest rates are payable in cash.2018. |
| |
(2) | The total principal amount is presented for debt investments while the number of shares or units owned is presented for equity investments. |
| |
(3) | Represents the fair value in accordance with ASC Topic 820 - Fair Value Measurement, or ASC Topic 820. The determination of such fair value is not included in our board of directors’ valuation process described elsewhere herein. |
| |
(4) | We also hold a portion of the senior secured loan in this portfolio company. |
| |
(5) | Loan was on non-accrual status as of September 30, 2018, meaning that SLF has ceased recognizing interest income on the loan. |
| |
(6) | Equity investment received as a result of the portfolio company's debt restructuring. |
| |
(7) | Non-income producing securities. |
| |
(8) | The entire commitment was unfunded as of September 30, 2018. As such, no interest is being earned on this investment. |
|
| | | | | | | | | | | | | | | | | | |
| SLF Investment Portfolio as of September 30, 2017 |
| Portfolio Company | | Business Description | | Investment Type | | Maturity Date | | Current Interest Rate(1) | | Principal ($) / Shares(2) | | Fair Value(3) |
| | | | | | | | | | | (In thousands) |
| 1A Smart Start LLC | | Home and Office Furnishings, Housewares, and Durable Consumer | | Senior loan | | 02/2022 | | 6.1 |
| % | | $ | 2,094 |
| | $ | 2,105 |
|
| 1A Smart Start LLC | | Home and Office Furnishings, Housewares, and Durable Consumer | | Senior loan | | 02/2022 | | 5.8 |
| | | 928 |
| | 928 |
|
| Advanced Pain Management Holdings, Inc. | | Healthcare, Education and Childcare | | Senior loan | | 02/2018 | | 6.3 |
| | | 6,805 |
| | 5,784 |
|
| Advanced Pain Management Holdings, Inc. | | Healthcare, Education and Childcare | | Senior loan | | 02/2018 | | 6.3 |
| | | 466 |
| | 396 |
|
| Argon Medical Devices, Inc. | | Healthcare, Education and Childcare | | Senior loan | | 12/2021 | | 6.0 |
| | | 3,184 |
| | 3,184 |
|
Arise Virtual Solutions, Inc. (4) | | Telecommunications | | Senior loan | | 12/2018 | | 7.3 |
| | | 9,856 |
| | 9,856 |
|
| Boot Barn, Inc. | | Retail Stores | | Senior loan | | 06/2021 | | 5.8 |
| | | 10,073 |
| | 10,073 |
|
| Brandmuscle, Inc. | | Printing and Publishing | | Senior loan | | 12/2021 | | 6.1 |
| | | 4,851 |
| | 4,845 |
|
| CLP Healthcare Services, Inc. | | Healthcare, Education and Childcare | | Senior loan | | 12/2020 | | 6.6 |
| | | 8,590 |
| | 8,418 |
|
| CLP Healthcare Services, Inc. | | Healthcare, Education and Childcare | | Senior loan | | 12/2020 | | 6.6 |
| | | 4,328 |
| | 4,242 |
|
| Community Veterinary Partners, LLC | | Personal, Food and Miscellaneous Services | | Senior loan | | 10/2021 | | 6.8 |
| | | 2,442 |
| | 2,442 |
|
| Community Veterinary Partners, LLC | | Personal, Food and Miscellaneous Services | | Senior loan | | 10/2021 | | 6.8 |
| | | 1,227 |
| | 1,227 |
|
| Community Veterinary Partners, LLC | | Personal, Food and Miscellaneous Services | | Senior loan | | 10/2021 | | 6.8 |
| | | 59 |
| | 59 |
|
| Community Veterinary Partners, LLC | | Personal, Food and Miscellaneous Services | | Senior loan | | 10/2021 | | 6.8 |
| | | 41 |
| | 41 |
|
Curo Health Services LLC (4) | | Healthcare, Education and Childcare | | Senior loan | | 02/2022 | | 5.3 |
| | | 5,850 |
| | 5,867 |
|
| DISA Holdings Acquisition Subsidiary Corp. | | Diversified/Conglomerate Service | | Senior loan | | 12/2020 | | 5.5 |
| | | 4,401 |
| | 4,401 |
|
| DISA Holdings Acquisition Subsidiary Corp. | | Diversified/Conglomerate Service | | Senior loan | | 12/2020 | | 5.6 |
| | | 428 |
| | 428 |
|
| EAG, INC. | | Diversified/Conglomerate Service | | Senior loan | | 07/2018 | | 5.5 |
| | | 1,964 |
| | 1,964 |
|
| Encore GC Acquisition, LLC | | Healthcare, Education and Childcare | | Senior loan | | 01/2020 | | 6.8 |
| | | 4,725 |
| | 4,725 |
|
| Flexan, LLC | | Chemicals, Plastics and Rubber | | Senior loan | | 02/2020 | | 7.1 |
| | | 6,029 |
| | 6,029 |
|
| Flexan, LLC | | Chemicals, Plastics and Rubber | | Senior loan | | 02/2020 | | 7.1 |
| | | 1,686 |
| | 1,686 |
|
Flexan, LLC (4) | | Chemicals, Plastics and Rubber | | Senior loan | | 02/2020 | | 8.8 |
| | | 47 |
| | 47 |
|
Gamma Technologies, LLC (4) | | Electronics | | Senior loan | | 06/2021 | | 6.0 |
| | | 10,264 |
| | 10,264 |
|
| Harvey Tool Company, LLC | | Diversified/Conglomerate Manufacturing | | Senior loan | | 03/2020 | | 6.1 |
| | | 3,064 |
| | 3,064 |
|
| III US Holdings, LLC | | Diversified/Conglomerate Service | | Senior loan | | 09/2022 | | 7.9 |
| | | 5,044 |
| | 5,044 |
|
| Mediaocean LLC | | Senior loan | | Senior Loan | | 08/2020 | | N/A(10) | | — |
| | — |
|
| Jensen Hughes, Inc. | | Buildings and Real Estate | | Senior loan | | 12/2021 | | 6.3 |
| | | 2,293 |
| | 2,293 |
|
| Jensen Hughes, Inc. | | Buildings and Real Estate | | Senior loan | | 12/2021 | | 6.4 |
| | | 102 |
| | 102 |
|
| Jensen Hughes, Inc. | | Buildings and Real Estate | | Senior loan | | 12/2021 | | 6.4 |
| | | 64 |
| | 64 |
|
Joerns Healthcare, LLC (4) | | Healthcare, Education and Childcare | | Senior loan | | 05/2020 | | 7.8 |
| | | 8,745 |
| | 8,202 |
|
| Julio & Sons Company | | Beverage, Food and Tobacco | | Senior loan | | 12/2018 | | 6.7 |
| | | 6,762 |
| | 6,762 |
|
| Julio & Sons Company | | Beverage, Food and Tobacco | | Senior loan | | 12/2018 | | 6.7 |
| | | 2,226 |
| | 2,226 |
|
| Julio & Sons Company | | Beverage, Food and Tobacco | | Senior loan | | 12/2018 | | 6.7 |
| | | 822 |
| | 822 |
|
| Loar Group Inc. | | Aerospace and Defense | | Senior loan | | 01/2022 | | 6.0 |
| | | 2,164 |
| | 2,164 |
|
| Loar Group Inc. | | Aerospace and Defense | | Senior loan | | 01/2022 | | 6.0 |
| | | 1,492 |
| | 1,492 |
|
| Paradigm DKD Group, LLC | | Buildings and Real Estate | | Senior loan | | 11/2018 | | 6.2 |
| | | 1,977 |
| | 1,977 |
|
| Paradigm DKD Group, LLC | | Buildings and Real Estate | | Senior loan | | 11/2018 | | 6.2 |
| | | 596 |
| | 596 |
|
Park Place Technologies LLC (4) | | Electronics | | Senior loan | | 06/2022 | | 6.3 |
| | | 5,341 |
| | 5,287 |
|
|
| | | | | | | | | | | | | | | | | | |
| SLF Investment Portfolio as of September 30, 2017 - (continued) |
| Portfolio Company | | Business Description | | Investment
Type | | Maturity
Date | | Current Interest Rate(1) | | Principal ($) / Shares(2) | | Fair Value(3) |
| | | | | | | | | | | (In thousands) |
| Pasternack Enterprises, Inc. and Fairview Microwave, Inc. | | Diversified/Conglomerate Manufacturing | | Senior loan | | 05/2022 | | 6.2 |
| % | | $ | 5,372 |
| | $ | 5,372 |
|
| Payless ShoeSource, Inc. | | Retail Stores | | Senior loan | | 08/2022 | | 10.3 |
| | | 768 |
| | 757 |
|
| Polk Acquisition Corp. | | Automobile | | Senior loan | | 06/2022 | | 6.2 |
| | | 4,560 |
| | 4,469 |
|
| Polk Acquisition Corp. | | Automobile | | Senior loan | | 06/2022 | | 6.7 |
| | | 83 |
| | 81 |
|
| Polk Acquisition Corp. | | Automobile | | Senior loan | | 06/2022 | | 6.2 |
| | | 53 |
| | 52 |
|
PowerPlan Holdings, Inc. (4) | | Utilities | | Senior loan | | 02/2022 | | 6.5 |
| | | 11,365 |
| | 11,365 |
|
Premise Health Holding Corp. (4) | | Healthcare, Education and Childcare | | Senior loan | | 06/2020 | | 5.8 |
| | | 11,772 |
| | 11,772 |
|
| Pyramid Healthcare, Inc. | | Healthcare, Education and Childcare | | Senior loan | | 08/2019 | | 7.7 |
| | | 9,738 |
| | 9,738 |
|
| Pyramid Healthcare, Inc. | | Healthcare, Education and Childcare | | Senior loan | | 08/2019 | | 7.9 |
| | | 597 |
| | 597 |
|
| R.G. Barry Corporation | | Personal, Food and Miscellaneous Services | | Senior loan | | 09/2019 | | 6.2 |
| | | 5,217 |
| | 5,217 |
|
Radiology Partners, Inc. (4) | | Healthcare, Education and Childcare | | Senior loan | | 09/2020 | | 7.1 |
| | | 7,793 |
| | 7,793 |
|
Radiology Partners, Inc. (4) | | Healthcare, Education and Childcare | | Senior loan | | 09/2020 | | 7.1 |
| | | 595 |
| | 595 |
|
Radiology Partners, Inc. (4) | | Healthcare, Education and Childcare | | Senior loan | | 09/2020 | | 7.1 |
| | | 505 |
| | 505 |
|
Reliant Pro ReHab, LLC (4) | | Healthcare, Education and Childcare | | Senior loan | | 12/2017 | | 6.3 |
| | | 3,240 |
| | 3,240 |
|
RSC Acquisition, Inc. (4) | | Insurance | | Senior loan | | 11/2022 | | 6.6 |
| | | 3,864 |
| | 3,864 |
|
| RSC Acquisition, Inc. | | Insurance | | Senior loan | | 11/2020 | | 6.1 |
| | | 15 |
| | 15 |
|
Rubio's Restaurants, Inc. (4) | | Beverage, Food and Tobacco | | Senior loan | | 11/2018 | | 6.1 |
| | | 4,992 |
| | 4,992 |
|
| Rug Doctor LLC | | Personal and Non Durable Consumer Products (Mfg. Only) | | Senior loan | | 06/2018 | | 6.6 |
| | | 5,792 |
| | 5,792 |
|
| Sage Dental Management, LLC | | Healthcare, Education and Childcare | | Senior loan | | 10/2019 | | 7.0 |
| | | 4,782 |
| | 4,686 |
|
| Sage Dental Management, LLC | | Healthcare, Education and Childcare | | Senior loan | | 10/2019 | | 7.8 |
| | | 70 |
| | 69 |
|
| Sage Dental Management, LLC | | Healthcare, Education and Childcare | | Senior loan | | 10/2019 | | 7.0 |
| | | 50 |
| | 49 |
|
| Sage Dental Management, LLC | | Healthcare, Education and Childcare | | Senior loan | | 10/2019 | | 8.8 |
| | | 34 |
| | 33 |
|
Saldon Holdings, Inc. (4) | | Diversified/Conglomerate Service | | Senior loan | | 09/2022 | | 5.8 |
| | | 2,521 |
| | 2,490 |
|
| Sarnova HC, LLC | | Healthcare, Education and Childcare | | Senior loan | | 01/2022 | | 6.0 |
| | | 3,684 |
| | 3,684 |
|
| SEI, Inc. | | Electronics | | Senior loan | | 07/2021 | | 6.0 |
| | | 13,820 |
| | 13,820 |
|
Self Esteem Brands, LLC (4) | | Leisure, Amusement, Motion Pictures, Entertainment | | Senior loan | | 02/2020 | | 6.0 |
| | | 11,313 |
| | 11,313 |
|
Severin Acquisition, LLC (4) | | Diversified/Conglomerate Service | | Senior loan | | 07/2021 | | 6.1 |
| | | 4,832 |
| | 4,830 |
|
| Severin Acquisition, LLC | | Diversified/Conglomerate Service | | Senior loan | | 07/2021 | | 6.0 |
| | | 5,290 |
| | 5,265 |
|
| Severin Acquisition, LLC | | Diversified/Conglomerate Service | | Senior loan | | 07/2021 | | 6.2 |
| | | 668 |
| | 670 |
|
Severin Acquisition, LLC (5) | | Diversified/Conglomerate Service | | Senior loan | | 07/2021 | | N/A |
| (6) | | — |
| | (1 | ) |
| Smashburger Finance LLC | | Beverage, Food and Tobacco | | Senior loan | | 05/2018 | | 6.8 |
| | | 867 |
| | 754 |
|
| Smashburger Finance LLC | | Beverage, Food and Tobacco | | Senior loan | | 05/2018 | | 6.8 |
| | | 68 |
| | 60 |
|
| Smashburger Finance LLC | | Beverage, Food and Tobacco | | Senior loan | | 05/2018 | | 6.8 |
| | | 68 |
| | 59 |
|
| Smashburger Finance LLC | | Beverage, Food and Tobacco | | Senior loan | | 05/2018 | | 6.8 |
| | | 68 |
| | 59 |
|
| Smashburger Finance LLC | | Beverage, Food and Tobacco | | Senior loan | | 05/2018 | | 6.8 |
| | | 68 |
| | 59 |
|
Smashburger Finance LLC (5) | | Beverage, Food and Tobacco | | Senior loan | | 05/2018 | | N/A |
| (6) | | — |
| | (15 | ) |
Stomatcare DSO, LLC (7) | | Healthcare, Education and Childcare | | Senior loan | | 05/2022 | | 6.2% PIK | | 625 |
| | 329 |
|
Tate's Bake Shop, Inc. (4) | | Beverage, Food and Tobacco | | Senior loan | | 08/2019 | | 6.3 |
| | | 2,926 |
| | 2,926 |
|
| Teasdale Quality Foods, Inc. | | Grocery | | Senior loan | | 10/2020 | | 5.5 |
| | | 4,553 |
| | 4,553 |
|
|
| | | | | | | | | | | | | | | | | | |
| SLF Investment Portfolio as of September 30, 2017 - (continued) |
| Portfolio Company | | Business Description | | Investment
Type | | Maturity
Date | | Current Interest Rate(1) | | Principal ($) / Shares(2) | | Fair Value(3) |
| | | | | | | | | | | (In thousands) |
| Teasdale Quality Foods, Inc. | | Grocery | | Senior loan | | 10/2020 | | 6.1 |
| % | | $ | 3,567 |
| | $ | 3,567 |
|
| Teasdale Quality Foods, Inc. | | Grocery | | Senior loan | | 10/2020 | | 6.1 |
| | | 687 |
| | 687 |
|
| Teasdale Quality Foods, Inc. | | Grocery | | Senior loan | | 10/2020 | | 6.0 |
| | | 514 |
| | 514 |
|
| Teasdale Quality Foods, Inc. | | Grocery | | Senior loan | | 10/2020 | | 6.1 |
| | | 252 |
| | 252 |
|
| Transaction Data Systems, Inc. | | Diversified/Conglomerate Service | | Senior loan | | 06/2021 | | 6.6 |
| | | 7,393 |
| | 7,393 |
|
| Transaction Data Systems, Inc. | | Diversified/Conglomerate Service | | Senior loan | | 06/2020 | | 5.8 |
| | | 22 |
| | 21 |
|
| W3 Co. | | Oil and Gas | | Senior loan | | 03/2022 | | 7.3 |
| | | 1,266 |
| | 1,269 |
|
WHCG Management, LLC (4) | | Healthcare, Education and Childcare | | Senior loan | | 03/2023 | | 6.1 |
| | | 7,980 |
| | 7,980 |
|
| WIRB-Copernicus Group, Inc. | | Healthcare, Education and Childcare | | Senior loan | | 08/2022 | | 6.3 |
| | | 5,666 |
| | 5,666 |
|
Young Innovations, Inc. (4) | | Healthcare, Education and Childcare | | Senior loan | | 01/2019 | | 6.3 |
| | | 10,369 |
| | 10,369 |
|
Young Innovations, Inc. (4) | | Healthcare, Education and Childcare | | Senior loan | | 01/2019 | | 6.3 |
| | | 209 |
| | 209 |
|
| Total senior loan investments | | | | | | | | | | | $ | 301,583 |
| | $ | 298,941 |
|
| | | | | | | | | | | | | | |
Payless ShoeSource, Inc. (8)(9) | | Retail Stores | | LLC interest | | N/A | | N/A |
| | | 35 |
| | $ | 843 |
|
W3 Co. (8)(9) | | Oil and Gas | | LLC units | | N/A | | N/A |
| | | 3 |
| | 1,146 |
|
| Total equity investments | | | | | | | | | | | | | $ | 1,989 |
|
| | | | | | | | | | | | | | |
| Total investments | | | | | | | | | | | $ | 301,583 |
| | $ | 300,930 |
|
| |
(1) | Represents the weighted average annual current interest rate as of September 30, 2017. |
| |
(2) | The total principal amount is presented for debt investments while the number of shares or units owned is presented for equity investments. |
| |
(3) | Represents the fair value in accordance with ASC Topic 820. The determination of such fair value is not included in our board of directors’ valuation process described elsewhere herein. |
| |
(3)(4)
| We also hold a portion of the first lien senior secured loan in this portfolio company. |
| |
(4)(5)
| The negative fair value is the result of the unfunded commitment being valued below par. |
| |
(5)(6)
| The entire commitment was unfunded atas of September 30, 2016.2017. As such, no interest is being earned on this investment. |
| |
(6)(7)
| Loan was on non-accrual status as of September 30, 2016,2017, meaning that SLF has ceased recognizing interest income on the loan. |
|
| | | | | | | | | | | | | | | | | | |
| SLF Loan Portfolio as of September 30, 2015 |
| Portfolio Company | | Business Description | | Investment Type | | Maturity Date | | Current Interest Rate(1) | | Principal/ Par Amount | | Fair Value(2) |
| | | | | | | | | | | (In thousands) |
| 1011778 B.C. ULC (New Red Finance/Burger King) | | Beverage, Food and Tobacco | | Senior loan | | 12/2021 | | 3.8 |
| % | | $ | 2,271 |
| | $ | 2,264 |
|
5.11, Inc.(3) | | Textiles and Leather | | Senior loan | | 02/2020 | | 6.0 |
| | | 3,162 |
| | 3,172 |
|
| Acosta, Inc. | | Diversified/Conglomerate Service | | Senior loan | | 09/2021 | | 4.3 |
| | | 2,978 |
| | 2,938 |
|
| ACTIVE Network, Inc. | | Electronics | | Senior loan | | 11/2020 | | 5.5 |
| | | 1,965 |
| | 1,951 |
|
| Aderant North America, Inc. | | Diversified/Conglomerate Service | | Senior loan | | 12/2018 | | 5.3 |
| | | 4,195 |
| | 4,195 |
|
| Advanced Pain Management Holdings, Inc. | | Healthcare, Education and Childcare | | Senior loan | | 02/2018 | | 6.3 |
| | | 6,946 |
| | 6,807 |
|
| Advanced Pain Management Holdings, Inc. | | Healthcare, Education and Childcare | | Senior loan | | 02/2018 | | 6.3 |
| | | 475 |
| | 460 |
|
Advanced Pain Management Holdings, Inc.(4) | | Healthcare, Education and Childcare | | Senior loan | | 02/2018 | | N/A |
| (5) | | — |
| | (23 | ) |
| Affordable Care Inc. | | Personal, Food and Miscellaneous Services | | Senior loan | | 12/2018 | | 5.5 |
| | | 3,976 |
| | 3,976 |
|
| Aimbridge Hospitality, LLC | | Hotels, Motels, Inns, and Gaming | | Senior loan | | 10/2018 | | 5.8 |
| | | 5,204 |
| | 5,204 |
|
| ARG IH Corporation | | Beverage, Food and Tobacco | | Senior loan | | 11/2020 | | 4.8 |
| | | 4,370 |
| | 4,385 |
|
Arise Virtual Solutions, Inc.(3)(4) | | Telecommunications | | Senior loan | | 12/2018 | | N/A |
| (5) | | — |
| | (23 | ) |
Arise Virtual Solutions, Inc.(3) | | Telecommunications | | Senior loan | | 12/2018 | | 6.8 |
| | | 11,729 |
| | 11,494 |
|
Atkins Nutritionals, Inc(3) | | Beverage, Food and Tobacco | | Senior loan | | 01/2019 | | 6.3 |
| | | 5,872 |
| | 5,879 |
|
| Atrium Innovations | | Personal and Non Durable Consumer Products | | Senior loan | | 02/2021 | | 4.3 |
| | | 3,520 |
| | 3,336 |
|
| BJ’s Wholesale Club, Inc. | | Retail Stores | | Senior loan | | 09/2019 | | 4.5 |
| | | 2,957 |
| | 2,934 |
|
| BMC Software, Inc. | | Electronics | | Senior loan | | 09/2020 | | 5.0 |
| | | 1,895 |
| | 1,729 |
|
| Brickman Group Ltd. LLC | | Farming and Agriculture | | Senior loan | | 12/2020 | | 4.0 |
| | | 1,980 |
| | 1,954 |
|
| C.B. Fleet Company, Incorporated | | Personal and Non Durable Consumer Products | | Senior loan | | 10/2020 | | 5.4 |
| | | 5,630 |
| | 5,630 |
|
| C.B. Fleet Company, Incorporated | | Personal and Non Durable Consumer Products | | Senior loan | | 10/2020 | | 5.4 |
| | | 696 |
| | 696 |
|
| CLP Healthcare Services, Inc. | | Healthcare, Education and Childcare | | Senior loan | | 12/2020 | | 5.8 |
| | | 4,417 |
| | 4,401 |
|
| Connect Merger Sub, Inc. | | Telecommunications | | Senior loan | | 04/2020 | | 4.8 |
| | | 3,935 |
| | 3,820 |
|
CPI Buyer, LLC (Cole-Parmer)(3) | | Healthcare, Education and Childcare | | Senior loan | | 08/2021 | | 5.5 |
| | | 5,955 |
| | 5,925 |
|
Curo Health Services LLC(3) | | Healthcare, Education and Childcare | | Senior loan | | 02/2022 | | 6.5 |
| | | 5,970 |
| | 5,990 |
|
| DentMall MSO, LLC | | Retail Stores | | Senior loan | | 07/2019 | | 6.0 |
| | | 10,251 |
| | 10,046 |
|
| DentMall MSO, LLC | | Retail Stores | | Senior loan | | 07/2019 | | 6.0 |
| | | 1,000 |
| | 946 |
|
| Dialysis Newco, Inc. | | Healthcare, Education and Childcare | | Senior loan | | 04/2021 | | 4.5 |
| | | 2,469 |
| | 2,470 |
|
| DISA Holdings Acquisition Subsidiary Corp. | | Diversified/Conglomerate Service | | Senior loan | | 12/2020 | | 5.5 |
| | | 4,614 |
| | 4,384 |
|
| DISA Holdings Acquisition Subsidiary Corp. | | Diversified/Conglomerate Service | | Senior loan | | 12/2020 | | 6.8 |
| | | 96 |
| | 43 |
|
| EAG, INC. (Evans Analytical Group) | | Diversified/Conglomerate Service | | Senior loan | | 07/2017 | | 5.0 |
| | | 2,245 |
| | 2,245 |
|
| Extreme Reach Inc. | | Broadcasting and Entertainment | | Senior loan | | 01/2020 | | 6.8 |
| | | 5,612 |
| | 5,591 |
|
| Federal-Mogul Corporation | | Automobile | | Senior loan | | 04/2021 | | 4.8 |
| | | 3,960 |
| | 3,769 |
|
GSDM Holdings Corp.(3) | | Healthcare, Education and Childcare | | Senior loan | | 06/2019 | | 5.3 |
| | | 1,782 |
| | 1,782 |
|
Hygenic Corporation, The(3) | | Personal and Non Durable Consumer Products | | Senior loan | | 10/2020 | | 6.0 |
| | | 4,515 |
| | 4,515 |
|
Integrated Supply Network, LLC(3) | | Automobile | | Senior loan | | 02/2020 | | 6.3 |
| | | 12,000 |
| | 12,000 |
|
Integrated Supply Network, LLC(3) | | Automobile | | Senior loan | | 02/2020 | | 6.9 |
| | | 734 |
| | 734 |
|
| Joerns Healthcare, LLC | | Healthcare, Education and Childcare | | Senior loan | | 05/2020 | | 6.2 |
| | | 9,696 |
| | 9,647 |
|
| Julio & Sons Company | | Beverage, Food and Tobacco | | Senior loan | | 09/2017 | | 6.5 |
| | | 6,906 |
| | 6,906 |
|
| Julio & Sons Company | | Beverage, Food and Tobacco | | Senior loan | | 09/2017 | | 6.5 |
| | | 254 |
| | 254 |
|
K&N Engineering, Inc.(3) | | Automobile | | Senior loan | | 07/2019 | | 5.3 |
| | | 3,865 |
| | 3,749 |
|
K&N Engineering, Inc.(3) | | Automobile | | Senior loan | | 07/2019 | | 5.3 |
| | | 183 |
| | 177 |
|
K&N Engineering, Inc.(3)(4) | | Automobile | | Senior loan | | 07/2019 | | N/A |
| (5) | | — |
| | (6 | ) |
| Mister Car Wash Holdings, Inc. | | Automobile | | Senior loan | | 08/2021 | | 5.0 |
| | | 2,970 |
| | 2,971 |
|
| National Veterinary Associates, Inc. | | Personal, Food and Miscellaneous Services | | Senior loan | | 08/2021 | | 4.8 |
| | | 990 |
| | 991 |
|
Netsmart Technologies, Inc.(3) | | Diversified/Conglomerate Service | | Senior loan | | 02/2019 | | 6.3 |
| | | 10,448 |
| | 10,448 |
|
Netsmart Technologies, Inc.(3) | | Diversified/Conglomerate Service | | Senior loan | | 02/2019 | | 7.5 |
| | | 231 |
| | 231 |
|
| Northwestern Management Services, LLC | | Healthcare, Education and Childcare | | Senior loan | | 10/2017 | | 6.3 |
| | | 3,912 |
| | 3,912 |
|
| Northwestern Management Services, LLC | | Healthcare, Education and Childcare | | Senior loan | | 10/2017 | | 7.0 |
| | | 147 |
| | 147 |
|
| Northwestern Management Services, LLC | | Healthcare, Education and Childcare | | Senior loan | | 10/2017 | | 6.3 |
| | | 47 |
| | 47 |
|
|
| | | | | | | | | | | | | | | | | | |
| SLF Loan Portfolio as of September 30, 2015 – (continued) |
| Portfolio Company | | Business Description | | Investment Type | | Maturity Date | | Current Interest Rate(1) | | Principal/ Par Amount | | Fair Value(2) |
| | | | | | | | | | | (In thousands) |
| Octane Fitness, LLC | | Leisure, Amusement, Motion Pictures, Entertainment | | Senior loan | | 10/2018 | | 6.5 |
| % | | $ | 7,718 |
| | $ | 7,718 |
|
| Paradigm DKD Group, LLC | | Buildings and Real Estate | | Senior loan | | 11/2018 | | 6.8 |
| | | 2,037 |
| | 2,037 |
|
| Paradigm DKD Group, LLC | | Buildings and Real Estate | | Senior loan | | 11/2018 | | 6.9 |
| | | 292 |
| | 292 |
|
| Pasternack Enterprises, Inc. | | Diversified/Conglomerate Manufacturing | | Senior loan | | 12/2017 | | 6.3 |
| | | 1,044 |
| | 1,044 |
|
| Payless ShoeSource, Inc. | | Retail Stores | | Senior loan | | 03/2021 | | 5.0 |
| | | 1,975 |
| | 1,580 |
|
PetVet Care Centers LLC(3) | | Personal, Food and Miscellaneous Services | | Senior loan | | 12/2020 | | 5.5 |
| | | 5,955 |
| | 5,955 |
|
PetVet Care Centers LLC(3) | | Personal, Food and Miscellaneous Services | | Senior loan | | 12/2020 | | 5.5 |
| | | 646 |
| | 646 |
|
PowerPlan Holdings, Inc.(3) | | Utilities | | Senior loan | | 02/2022 | | 6.3 |
| | | 12,000 |
| | 12,000 |
|
Premise Health Holding Corp.(3) | | Healthcare, Education and Childcare | | Senior loan | | 06/2020 | | 5.5 |
| | | 11,921 |
| | 11,921 |
|
Premise Health Holding Corp.(3) | | Healthcare, Education and Childcare | | Senior loan | | 06/2020 | | 5.5 |
| | | 283 |
| | 283 |
|
| R.G. Barry Corporation | | Personal, Food and Miscellaneous Services | | Senior loan | | 09/2019 | | 6.0 |
| | | 6,272 |
| | 6,209 |
|
Reliant Pro ReHab, LLC(3) | | Healthcare, Education and Childcare | | Senior loan | | 06/2017 | | 6.0 |
| | | 4,225 |
| | 4,225 |
|
Renaissance Pharma (U.S.) Holdings Inc. | | Healthcare, Education and Childcare | | Senior loan | | 05/2018 | | 5.0 |
| | | 3,758 |
| | 3,758 |
|
Renaissance Pharma (U.S.) Holdings Inc. | | Healthcare, Education and Childcare | | Senior loan | | 05/2018 | | 6.3 |
| | | 71 |
| | 71 |
|
Rubio’s Restaurants, Inc(3) | | Retail Stores | | Senior loan | | 11/2018 | | 6.0 |
| | | 5,095 |
| | 5,095 |
|
Rug Doctor LLC(3) | | Personal and Non Durable Consumer Products | | Senior loan | | 12/2016 | | 6.3 |
| | | 9,769 |
| | 9,769 |
|
| Scientific Games International, Inc. | | Hotels, Motels, Inns, and Gaming | | Senior loan | | 10/2020 | | 6.0 |
| | | 3,935 |
| | 3,891 |
|
| SEI, Inc. | | Electronics | | Senior loan | | 07/2021 | | 5.8 |
| | | 8,799 |
| | 8,711 |
|
Self Esteem Brands, LLC(3) | | Leisure, Amusement, Motion Pictures, Entertainment | | Senior loan | | 02/2020 | | 5.0 |
| | | 7,930 |
| | 7,930 |
|
| Smashburger Finance LLC | | Beverage, Food and Tobacco | | Senior loan | | 05/2018 | | 6.3 |
| | | 960 |
| | 960 |
|
| Smashburger Finance LLC | | Beverage, Food and Tobacco | | Senior loan | | 05/2018 | | 6.3 |
| | | 75 |
| | 75 |
|
| Smashburger Finance LLC | | Beverage, Food and Tobacco | | Senior loan | | 05/2018 | | 6.3 |
| | | 75 |
| | 75 |
|
| Spear Education, LLC | | Healthcare, Education and Childcare | | Senior loan | | 08/2019 | | 6.0 |
| | | 5,960 |
| | 5,960 |
|
| Spear Education, LLC | | Healthcare, Education and Childcare | | Senior loan | | 08/2019 | | 6.0 |
| | | 500 |
| | 500 |
|
Syncsort Incorporated(3) | | Electronics | | Senior loan | | 03/2019 | | 5.8 |
| | | 8,860 |
| | 8,860 |
|
Systems Maintenance Services Holding, Inc.(3) | | Electronics | | Senior loan | | 10/2019 | | 5.0 |
| | | 2,415 |
| | 2,415 |
|
| Take 5 Oil Change, L.L.C. | | Automobile | | Senior loan | | 07/2018 | | 6.3 |
| | | 6,647 |
| | 6,647 |
|
| Take 5 Oil Change, L.L.C. | | Automobile | | Senior loan | | 07/2018 | | 6.3 |
| | | 187 |
| | 187 |
|
| Tate’s Bake Shop, Inc. | | Beverage, Food and Tobacco | | Senior loan | | 08/2019 | | 5.8 |
| | | 2,978 |
| | 2,978 |
|
| Teasdale Quality Foods, Inc. | | Grocery | | Senior loan | | 10/2020 | | 5.3 |
| | | 4,651 |
| | 4,651 |
|
| Transaction Data Systems, Inc. | | Diversified/Conglomerate Service | | Senior loan | | 06/2021 | | 5.5 |
| | | 4,545 |
| | 4,545 |
|
| W3 Co. | | Oil and Gas | | Senior loan | | 03/2020 | | 5.8 |
| | | 2,954 |
| | 2,516 |
|
WII Components, Inc.(3) | | Home and Office Furnishings, Housewares, and Durable Consumer | | Senior loan | | 07/2018 | | 5.3 |
| | | 3,008 |
| | 3,008 |
|
Young Innovations, Inc.(3) | | Healthcare, Education and Childcare | | Senior loan | | 01/2019 | | 5.3 |
| | | 4,018 |
| | 4,018 |
|
| | | | | | | | | | | | $ | 320,583 |
| | $ | 317,623 |
|
| |
(1)(8)
| RepresentsEquity investment received as a result of the weighted average annual current interest rate as of September 30, 2015. All interest rates are payable in cash.portfolio company's debt restructuring. |
| |
(2)(9)
| Represents the fair value in accordance with ASC Topic 820. The determination of such fair value is not included in our board of directors’ valuation process described elsewhere herein.Non-income producing. |
| |
(3)
| We also hold a portion of the senior loan in this portfolio company. |
| |
(4)
| The negative fair value is the result of the unfunded commitment being valued below par. |
| |
(5)(10)
| The entire commitment was unfunded atas of September 30, 2015.2017. As such, no interest is being earned on this investment. |
WeAs of September 30, 2018, we have committed to fund $140.0 million of subordinated notes and $35.0$175.0 million of LLC equity interest subscriptionsinterests to SLF. The amortized cost, net of principal repayments that are subject to recall, and fair value of the subordinated notes in SLF held by us was $77.3 million and $77.3 million, respectively, as of September 30, 2016, and $76.6 million and $76.6 million, respectively, as of September 30, 2015. As of September 30, 2016, the subordinated notes pay a weighted average interest rate of three-month LIBOR plus 8.0%. For the years ended2018 and September 30, 2016 and 2015, we earned interest income of $6.92017, $75.4 million and $3.7 million, respectively, on the subordinated notes. As of September 30, 2016 and 2015, $23.2 million and $9.3$97.5 million, respectively, of our LLC equity interest subscriptionscommitment to SLF had been called and contributed, net of return of capital distributions subject to recall. For the years ended September 30, 20162018, and 2015,2017, we received $4.1$8.1 million and $1.4$4.9 million, respectively, in dividend income from the SLF LLC equity interests.
The subordinated notes issued by SLF and previously held by us were redeemed on December 30, 2016, and therefore no interest income was earned for the year ended September 30, 2018. For the year ended September 30, 2017, we earned interest income of $1.6 million on the subordinated notes.
For the years ended September 30, 20162018 and 2015,2017, we earned a total return on our weighted average capital invested in SLF of 6.6% and 7.1%7.8%, respectively. The annualized total return on weighted average capital invested is
calculated by dividing total income earned on our investments in SLF subordinated notes and LLC equity interests by the combined daily average of our investments in (1) the principal of the SLF subordinated notes, if any, and (2) the NAV of the SLF LLC equity interests.
Below is certain summarized financial information for SLF as of and for the years ended September 30, 20162018 and 2015:September 30, 2017:
|
| | | | | | | |
| | As of September 30, |
| | 2016 | | 2015 |
| | (In thousands) |
| Selected Balance Sheet Information, at fair value | |
| | |
|
| Investments, at fair value | $ | 323,510 |
| | $ | 317,623 |
|
Cash and other assets (1) | 7,281 |
| | 5,772 |
|
| Receivable from investments sold | 1,995 |
| | — |
|
Total assets (1) | $ | 332,786 |
| | $ | 323,395 |
|
| Senior credit facility | $ | 214,050 |
| | $ | 212,300 |
|
Unamortized debt issuance costs (1) | (949 | ) | | (2,464 | ) |
| Other liabilities | 567 |
| | 489 |
|
Total liabilities (1) | 213,668 |
| | 210,325 |
|
| Subordinated notes and members’ equity | 119,118 |
| | 113,070 |
|
Total liabilities and members' equity (1) | $ | 332,786 |
| | $ | 323,395 |
|
|
| | | | | | | |
| | September 30, 2018 | | September 30, 2017 |
| | (In thousands) |
| Selected Balance Sheet Information, at fair value | |
| | |
|
| Investments, at fair value | $ | 179,180 |
| | $ | 300,930 |
|
| Cash and other assets | 7,127 |
| | 5,305 |
|
| Other assets | 19 |
| | — |
|
| Total assets | $ | 186,326 |
| | $ | 306,235 |
|
| Senior credit facility | $ | 104,622 |
| | $ | 197,700 |
|
| Unamortized debt issuance costs | (18 | ) | | (712 | ) |
| Other liabilities | 484 |
| | 658 |
|
| Total liabilities | 105,088 |
| | 197,646 |
|
| Members’ equity | 81,238 |
| | 108,589 |
|
| Total liabilities and members' equity | $ | 186,326 |
| | $ | 306,235 |
|
|
| | | | | | | |
| | Years ended September 30, |
| | 2016 | | 2015 |
| | (In thousands) |
| Selected Statement of Operations Information: | |
| | |
|
| Interest income | $ | 22,016 |
| | $ | 10,906 |
|
| Fee income | 84 |
| | 4 |
|
| Total investment income | 22,100 |
|
| 10,910 |
|
| Interest expense | 15,715 |
| | 7,701 |
|
| Administrative service fee | 457 |
| | 249 |
|
| Other expenses | 151 |
| | 103 |
|
| Total expenses | 16,323 |
|
| 8,053 |
|
| Net investment income | 5,777 |
| | 2,857 |
|
| Net realized gains (losses) on investments | (479 | ) | | 9 |
|
Net change in unrealized appreciation (depreciation) on investments, subordinated notes and secured borrowings | (4,685 | ) | | (2,206 | ) |
| Net increase (decrease) in net assets | $ | 613 |
|
| $ | 660 |
|
| |
(1)
| On October 1, 2015, SLF adopted ASU 2015-03 which requires that debt issuance costs related to recognized debt liability to be presented on the balance sheet as a direct deduction from the carrying amount of the debt liability rather than as an asset. Adoption of ASU 2015-03 requires the changes to be applied retrospectively. |
|
| | | | | | | |
| | Years ended September 30, |
| | 2018 | | 2017 |
| | (In thousands) |
| Selected Statement of Operations Information: | | | |
| Interest income | $ | 18,285 |
| | $ | 21,455 |
|
| Fee income | 202 |
| | 5 |
|
| Total investment income | 18,487 |
| | 21,460 |
|
| Interest and other debt financing expenses | 6,687 |
| | 10,236 |
|
| Administrative service fee | 404 |
| | 477 |
|
| Other expenses | 93 |
| | 131 |
|
| Total expenses | 7,184 |
| | 10,844 |
|
| Net investment income | 11,303 |
| | 10,616 |
|
| Net realized gains (losses) on investments | — |
| | (7,379 | ) |
| Net change in unrealized appreciation (depreciation) on investments | (4,197 | ) | | 4,647 |
|
| Net increase (decrease) in members' equity | $ | 7,106 |
| | $ | 7,884 |
|
Prior to their termination, SLF has elected to fair value the subordinated notes issued to us and RGA under ASC Topic 825 — Financial Instruments, or ASC Topic 825. The subordinated notes are valued by calculating the net present value of the future expected cash flow streams using an appropriate risk-adjusted discount rate model. For the year ended September 30, 2016, SLF did not recognize any unrealized depreciation or unrealized appreciation on the subordinated notes. For the year ended September 30, 2015, SLF recognized $0.1 million in unrealized appreciation on the subordinated notes. The following table presents the difference between fair value and the aggregate contractual principal amounts of subordinated notes for which the fair value option has been elected asAs of September 30, 20162018 and 2015:September 30, 2017, SLF had no subordinated notes outstanding.
|
| | | | | | | | | | | | | | | | | | | | | | | |
| | As of September 30, 2016 | | As of September 30, 2015 |
| | (In thousands) | | (In thousands) |
| | Par Value | | Carrying Value | | Fair Value | | Par Value | | Carrying Value | | Fair Value |
| Subordinated notes | $ | 88,344 |
| | $ | 88,344 |
| | $ | 88,344 |
| | $ | 87,500 |
| | $ | 87,500 |
| | $ | 87,500 |
|
Contractual Obligations and Off-Balance Sheet Arrangements
A summary of our significant contractual payment obligations as of September 30, 20162018 is as follows:
|
| | | | | | | | | | | | | | | | | | | |
| | Payments Due by Period (In millions) |
| | Total | | Less Than 1 Year | | 1 – 3 Years | | 3 – 5 Years | | More Than 5 Years |
| 2010 Debt Securitization | $ | 215.0 |
| | $ | — |
| | $ | — |
| | $ | — |
| | $ | 215.0 |
|
| 2014 Debt Securitization | 246.0 |
| | — |
| | — |
| | — |
| | 246.0 |
|
| SBA debentures | 277.0 |
| | — |
| | — |
| | 55.3 |
| | 221.7 |
|
| Credit Facility | 126.7 |
| | — |
| | — |
| | 126.7 |
| | — |
|
| Adviser Revolver | — |
| | — |
| | — |
| | — |
| | — |
|
Unfunded commitments (1) | 81.4 |
| | 81.4 |
| | — |
| | — |
| | — |
|
Total contractual obligations (2) | $ | 946.1 |
| | $ | 81.4 |
|
| $ | — |
|
| $ | 182.0 |
|
| $ | 682.7 |
|
|
| | | | | | | | | | | | | | | | | | | |
| | Payments Due by Period (In millions) |
| | Total | | Less Than 1 Year | | 1 – 3 Years | | 3 – 5 Years | | More Than 5 Years |
| 2014 Debt Securitization | $ | 197.5 |
| | $ | — |
| | $ | — |
| | $ | — |
| | $ | 197.5 |
|
| SBA debentures | 277.6 |
| | — |
| | 35.3 |
| | 103.0 |
| | 139.3 |
|
| Credit Facility | 136.0 |
| | — |
| | — |
| | 136.0 |
| | — |
|
| MS Credit Facility | 234.7 |
| | 234.7 |
| | — |
| | — |
| | — |
|
Unfunded commitments(1) | 57.7 |
| | 57.7 |
| | — |
| | — |
| | — |
|
| Total contractual obligations | $ | 903.5 |
| | $ | 292.4 |
| | $ | 35.3 |
| | $ | 239.0 |
| | $ | 336.8 |
|
| |
(1) | Unfunded commitments represent all amounts unfunded commitments to fund investments, excluding our investments in SLF, as of September 30, 2016.2018. These amounts may or may not be funded to the borrowing party now or in the future. The unfunded commitments relate to loans with various maturity dates, but we are showing this amount in the less than one year category as this entire amount was eligible for funding to the borrowers as of September 30, 2016,2018, subject to the terms of each loan’s respective credit agreement. |
| |
(2)
| Total contractual obligations exclude $0.5 million of secured borrowings. |
We may become a party to financial instruments with off-balance sheet risk in the normal course of our business to meet the financial needs of our portfolio companies. These instruments may include commitments to extend credit and involve, to varying degrees, elements of liquidity and credit risk in excess of the amount recognized in the balance sheet. As of September 30, 20162018 and 2015,September 30, 2017, we had outstanding commitments to fund investments, excluding our investments in SLF, totaling $81.4$57.7 million and $121.5$60.5 million, respectively. We havehad commitments of up to $66.4$99.6 million and $75.2$77.5 million to SLF as of September 30, 20162018 and 2015,September 30, 2017, respectively, thatwhich may be contributed primarily for the purpose of funding new investments approved by the SLF investment committee.
We have certain contracts under which we have material future commitments. We have entered into the Investment Advisory Agreement with GC Advisors in accordance with the 1940 Act. Under the Investment Advisory Agreement, GC Advisors provides us with investment advisory and management services. For these services, we pay (1) a management fee equal to a percentage of the average adjusted value of our gross assets and (2) an incentive fee based on our performance. To the extent that GC Advisors or any of its affiliates provides investment advisory, collateral management or other similar services to a subsidiary of ours, we reduce the base management fee by an amount equal to the product of (1) the total fees paid to GC Advisors by such subsidiary for such services and (2) the percentage of such subsidiary’s total equity that is owned, directly or indirectly, by us.
Under the Administration Agreement, the Administrator furnishes us with office facilities and equipment, provides us with clerical, bookkeeping and record keeping services at such facilities and provides us with other administrative services necessary to conduct our day-to-day operations. We reimburse the Administrator for the allocable portion (subject to the review and approval of our board of directors) of overhead and other expenses incurred by it in performing its obligations under the Administration Agreement, including rent, the fees and expenses associated with performing compliance functions and our allocable portion of the cost of our chief
financial officer and chief compliance officer and their respective staffs. The Administrator also provides on our behalf managerial assistance to those portfolio companies to which we are required to offer to provide such assistance.
If any of the contractual obligations discussed above are terminated, our costs under any new agreements that we enter into may increase. In addition, we would likely incur significant time and expense in locating alternative parties to provide the services we receive under our Investment Advisory Agreement and our Administration Agreement. Any new investment advisory agreement would also be subject to approval by our stockholders.
Distributions
We intend to make quarterly distributions to our stockholders as determined by our board of directors. For additional details on distributions, see “Income taxes”“Dividends and distributions” in Note 2 to our consolidated financial statements.
We may not be able to achieve operating results that will allow us to make distributions at a specific level or to increase the amount of our distributions from time to time. In addition, we may be limited in our ability to make distributions due to the asset coverage requirements applicable to us as a business development company under the 1940 Act. If we do not distribute a certain percentage of our income annually, we will suffer adverse U.S. federal income tax consequences, including the possible loss of our ability to be subject to tax as a RIC. We cannot assure stockholders that they will receive any distributions.
Because federal income tax regulations differ from GAAP, distributions in accordance with tax regulations may differ from net investment income and realized gains recognized for financial reporting purposes. Differences may be permanent or temporary. Permanent differences are reclassified within capital accounts in the financial statements to reflect their tax character. For example, permanent differences in classification may result from the treatment of distributions paid from short-term gains as ordinary income dividends for tax purposes. Temporary differences arise when certain items of income, expense, gain or loss are recognized at some time in the future.
To the extent our taxable earnings fall below the total amount of our distributions for any tax year, a portion of those distributions may be deemed a return of capital to our stockholders for U.S. federal income tax purposes. Thus, the source of a distribution to our stockholders may be the original capital invested by the stockholder rather than our income or gains. Stockholders should read any written disclosure accompanying a dividenddistribution payment carefully and should not assume that the source of any distribution is our ordinary income or gains.
We have adopted an “opt out” dividend reinvestment plan for our common stockholders. As a result, if we declare a distribution, our stockholders’ cash distributions will be automatically reinvested in additional shares of our common stock unless a stockholder specifically “opts out” of our dividend reinvestment plan. If a stockholder opts out, that stockholder will receive cash distributions. Although distributions paid in the form of additional shares of our common stock will generally be subject to U.S. federal, state and local taxes in the same manner as cash distributions, stockholders participating in our dividend reinvestment plan will not receive any corresponding cash distributions with which to pay any such applicable taxes.
Related Party Transactions
We have entered into a number of business relationships with affiliated or related parties, including the following:
We entered into the Investment Advisory Agreement with GC Advisors. Mr. Lawrence Golub, our chairman, is a manager of GC Advisors, and Mr. David Golub, our chief executive officer, is a manager of GC Advisors, and each of Messrs. Lawrence Golub and David Golub owns an indirect pecuniary interest in GC Advisors.
Golub Capital LLC provides, and other affiliates of Golub Capital have historically provided, us with the office facilities and administrative services necessary to conduct day-to-day operations pursuant to our Administration Agreement.
We have entered into a license agreement with Golub Capital LLC, pursuant to which Golub Capital LLC has granted us a non-exclusive, royalty-free license to use the name “Golub Capital.”
Under the Staffing Agreement, Golub Capital LLC has agreed to provide GC Advisors with the resources necessary to fulfill its obligations under the Investment Advisory Agreement. The Staffing Agreement provides that Golub Capital LLC will make available to GC Advisors experienced investment professionals and provide access to the senior investment personnel of Golub Capital LLC for purposes of evaluating, negotiating, structuring, closing and monitoring our investments. The Staffing Agreement also includes a commitment that the members of GC Advisors’ investment committee will serve in such capacity. Services under the Staffing Agreement are provided on a direct cost reimbursement basis. We are not a party to the Staffing Agreement.
GC Advisors serves as collateral manager to the 20102014 Issuer and the 20142018 Issuer under the 2014 Collateral Management Agreement and the 2018 Collateral Management Agreement, respectively, and prior to the redemption of the 2010 Notes on July 20, 2018, served as the collateral management agreements and receives a feemanager to the 2010 Issuer under the 2010 Collateral Management Agreement. Fees payable to GC Advisors for providing these services that is offset against the base management fee payable by us under the Investment Advisory Agreement.
We have entered into the Adviser Revolver with GC Advisors in order to have the ability to borrow funds on a short-term basis.
In our common stock offering that closed on April 15, 2015, Mr. William M. Webster IV purchased 5,000 shares at
During the public offering price per share. In addition, infirst nine months of the offering that closed on August 15, 2016, Mr. John T. Baily purchased 8,250 shares at the public offering price per share.
From Jaunary 1, 2016 through September 30, 2016,calendar year 2018, the Golub Capital Employee Grant Program Rabbi Trust, or (the Trust),the Trust, purchased approximately $1.5$7.2 million of shares, or 95,035396,099 shares, of our common stock for the purpose of awarding incentive compensation to employees of Golub Capital. During calendar year 2015,2017, the Trust purchased approximately $16.0$17.7 million of shares, or 952,051955,896 shares, of our common stock, for the purpose of awarding incentive compensation to employees of Golub Capital. During calendar year 2014, the Trust purchased approximately $14.5 million of shares, or 835,271 shares, of our common stock, for the purpose of awarding incentive compensation to employees of Golub Capital.
GC Advisors also sponsors or manages, and may in the future sponsor or manage, other investment funds, accounts or investment vehicles (together referred to as “accounts”) that have investment mandates that are similar, in whole and in part, with ours. For example, GC Advisors presently serves as the investment adviser to Golub Capital Investment Corporation and Golub Capital BDC 3, Inc., each an unlisted business development company that commenced operations on December 31, 2014, which primarily focuses on investing in one stop and other senior secured and one stop loans. In addition, our officers and directors serve in similar capacities for Golub Capital Investment Corporation.Corporation and Golub Capital BDC 3, Inc. GC Advisors and its affiliates may determine that an investment is appropriate for us and for one or more of those other accounts. In such event, depending on the availability of such investment and other appropriate factors, and pursuant to GC Advisors’ allocation policy, GC Advisors or its affiliates may determine that we should invest side-by-side with one or more other accounts. We do not intend to make any investments if they are not permitted by applicable law and interpretive positions of the SEC and its staff, or if they are inconsistent with GC Advisors’ allocation procedures.
In addition, we have adopted a formal code of ethics that governs the conduct of our and GC Advisors’ officers, directors and employees. Our officers and directors also remain subject to the duties imposed by both the 1940 Act and the General Corporation Law of the State of Delaware.
Critical Accounting Policies
The preparation of financial statements and related disclosures in conformity with GAAP requires management to make estimates and assumptions that affect the reported amounts of assets and liabilities, disclosure of contingent assets and liabilities at the date of the financial statements and revenues and expenses during the periods reported. Actual results could materially differ from those estimates. We have identified the following items as critical accounting policies.
Fair Value Measurements
We value investments for which market quotations are readily available at their market quotations. However, a readily available market value is not expected to exist for many of the investments in our portfolio, and we value these portfolio investments at fair value as determined in good faith by our board of directors under our valuation policy and process.
Valuation methods may include comparisons of the portfolio companies to peer companies that are public, determination of the enterprise value of a portfolio company, discounted cash flow analysis and a market interest rate approach. The factors that are taken into account in fair value pricing investments include: available current market data, including relevant and applicable market trading and transaction comparables; applicable market yields and multiples; security covenants; call protection provisions; information rights; the nature and realizable value of any collateral; the portfolio company’s ability to make payments, its earnings and discounted cash flows and the markets in which it does business; comparisons of financial ratios of peer companies that are public; comparable merger and acquisition transactions; and the principal market and enterprise values. When an external event such as a purchase transaction, public offering or subsequent equity sale occurs, we will consider the pricing indicated by the external event to corroborate the private equity valuation. Due to the inherent uncertainty of determining the fair value of investments that do not have a readily available market value, the fair value of the investments may differ significantly from the values that would have been used had a readily available market value existed for such investments and may differ materially from values that may ultimately be received or settled.
Our board of directors is ultimately and solely responsible for determining, in good faith, the fair value of investments that are not publicly traded, whose market prices are not readily available on a quarterly basis or any other situation where portfolio investments require a fair value determination.
With respect to investments for which market quotations are not readily available, our board of directors undertakes a multi-step valuation process each quarter, as described below:
Our quarterly valuation process begins with each portfolio company investment being initially valued by the investment professionals of GC Advisors responsible for credit monitoring.
Preliminary valuation conclusions are then documented and discussed with our senior management and GC Advisors.
The audit committee of our board of directors reviews these preliminary valuations.
At least once annually the valuation for each portfolio investment, subject to a de minimis threshold, is reviewed by an independent valuation firm.
The board of directors discusses valuations and determines the fair value of each investment in our portfolio in good faith.
Determination of fair values involves subjective judgments and estimates. Under current auditingaccounting standards, the notes to our consolidated financial statements refer to the uncertainty with respect to the possible effect of such valuations, and any change in such valuations, on our consolidated financial statements.
We follow ASC Topic 820 for measuring fair value. Fair value is the price that would be received in the sale of an asset or paid to transfer a liability in an orderly transaction between market participants at the measurement date. Where available, fair value is based on observable market prices or parameters, or derived from such prices or parameters. Where observable prices or inputs are not available, valuation models are applied. These valuation models involve some level of management estimation and judgment, the degree of which is dependent on the price transparency for the assets or liabilities or market and the assets’ or liabilities’ complexity. Our fair value analysis includes an analysis of the value of any unfunded loan commitments. Assets and liabilities are categorized for disclosure purposes based upon the level of judgment associated with the inputs used to measure their value. The valuation hierarchical levels are based upon the transparency of the inputs to the valuation of the asset or liability as of the measurement date. The three levels are defined as follows:
Level 1: Inputs are unadjusted, quoted prices in active markets for identical assets or liabilities at the measurement date.
Level 2: Inputs include quoted prices for similar assets or liabilities in active markets and inputs that are observable for the assets or liabilities, either directly or indirectly, for substantially the full term of the assets or liabilities.
Level 3: Inputs include significant unobservable inputs for the assets or liabilities and include situations where there is little, if any, market activity for the assets or liabilities. The inputs into the determination of fair value are based upon the best information available and may require significant management judgment or estimation.
In certain cases, the inputs used to measure fair value may fall into different levels of the fair value hierarchy. In such cases, an asset’s or a liability’s categorization within the fair value hierarchy is based on the lowest level of input that is significant to the fair value measurement. Our assessment of the significance of a particular input to the fair value measurement in its entirety requires judgment, and we consider factors specific to the asset or liability. We assess the levels of assets and liabilities at each measurement date, and transfers between levels are recognized on the actual date of the event or change in circumstances that caused the transfers. There were no transfers among Level 1, 2 and 3 of the fair value hierarchy for assets and liabilities during the years ended September 30, 2016, 20152018, 2017 and 2014.2016. The following section describes the valuation techniques used by us to measure different assets and liabilities at fair value and includes the level within the fair value hierarchy in which the assets and liabilities are categorized.
Valuation of Investments
Level 1 investments are valued using quoted market prices. Level 2 investments are valued using market consensus prices that are corroborated by observable market data and quoted market prices for similar assets and liabilities. Level 3 investments are valued at fair value as determined in good faith by our board of directors, based on input of management, the audit committee and independent valuation firms that have been engaged at the direction of our board of directors to assist in the valuation of each portfolio investment without a readily available market quotation at least once during a trailing twelve-month period under a valuation policy and a consistently applied valuation process. This valuation process is conducted at the end of each fiscal quarter, with approximately 25% (based on the number of portfolio companies) of our valuations of debt and equity investments without readily available market quotations subject to review by an independent valuation firm. As of September 30, 20162018 and 2015,
September 30, 2017, with the exception of money market funds included in cash and cash equivalents and restricted cash and cash equivalents (Level 1 investments) and investments measured at fair value using the NAV, all investments were valued using Level 3 inputs of the fair value hierarchy.
When determining fair value of Level 3 debt and equity investments, we may take into account the following factors, where relevant: the enterprise value of a portfolio company, the nature and realizable value of any collateral, the portfolio company’s ability to make payments and its earnings and discounted cash flows, the markets in which the portfolio company does business, comparisons to publicly traded securities, and changes in the interest rate environment and the credit markets generally that may affect the price at which similar investments may be made and other relevant factors. The primary method for determining enterprise value uses a multiple analysis whereby appropriate multiples are applied to the portfolio company’s EBITDA. A portfolio company’s EBITDA may include pro-forma adjustments for items such as acquisitions, divestitures, or expense reductions. The enterprise value analysis is performed to determine the value of equity investments and to determine if debt investments are credit impaired. If debt investments are credit impaired, we will use the enterprise value analysis or a liquidation basis analysis to determine fair value. For debt investments that are not determined to be credit impaired, we use a market interest rate yield analysis to determine fair value.
In addition, for certain debt investments, we may base our valuation on indicative bid and ask prices provided by an independent third party pricing service. Bid prices reflect the highest price that we and others may be willing to pay. Ask prices represent the lowest price that we and others may be willing to accept. We generally use the midpoint of the bid/ask range as our best estimate of fair value of such investment.
Due to the inherent uncertainty of determining the fair value of Level 3 investments that do not have a readily available market value, the fair value of the investments may differ significantly from the values that would have been used had a market existed for such investments and may differ materially from the values that may ultimately be received or settled. Further, such investments are
generally subject to legal and other restrictions or otherwise are less liquid than publicly traded instruments. If we were required to liquidate a portfolio investment in a forced or liquidation sale, we may realize significantly less than the value at which such investment had previously been recorded.
Our investments are subject to market risk. Market risk is the potential for changes in the value due to market changes. Market risk is directly impacted by the volatility and liquidity in the markets in which the investments are traded.
Valuation of Secured Borrowings
We have elected the fair value option under ASC Topic 825 relating to accounting for debt obligations at their fair value for our secured borrowings, which arise due to partial loan sales that do not meet the criteria for sale treatment under ASC Topic 860— Transfers and Servicing, or ASC Topic 860. All secured borrowings as of September 30, 2016 and 2015 were valued using Level 3 inputs under the fair value hierarchy, and our approach to determining fair value of Level 3 secured borrowings is consistent with our approach to determining fair value of the Level 3 investments that are associated with these secured borrowings as previously described.Valuation of Other Financial Assets and Liabilities
Fair value of our debt is estimated using Level 3 inputs by discounting remaining payments using comparable market rates or market quotes for similar instruments at the measurement date, if available.
Revenue Recognition:
Our revenue recognition policies are as follows:
Investments and Related Investment Income: Interest income is accrued based upon the outstanding principal amount and contractual interest terms of debt investments. Premiums, discounts, and origination fees are amortized or accreted into interest income over the life of the respective debt investment. For investments with contractual PIK interest, which represents contractual interest accrued and added to the principal balance that generally becomes due at maturity, we do not accrue PIK interest if the portfolio company valuation indicates that the PIK interest is not likely to be collectible. In addition, we may generate revenue in the form of amendment, structuring or due diligence fees, fees for providing managerial assistance, consulting fees and prepayment premiums on loans and record these fees as fee income when received.earned. Loan origination fees, original issuesissue discount and market discount or premium are capitalized, and we accrete or amortize such amounts as interest income. We record prepayment premiums on loans as fee income. Dividend income on preferred equity securities is recorded as dividend income on an accrual basis to the extent that such amounts are payable by the portfolio company and are expected to be collected. Dividend income on common equity securities is recorded on the record date for private portfolio companies or on the ex-dividend date for publicly traded portfolio companies. Distributions received from LLC and limited partnership, or LP, investments are evaluated to determine if the distribution should be recorded as dividend income or a return of
capital. Generally, we will not record distributions from equity investments in LLCs and LPs as dividend income unless there are sufficient accumulated tax-basis earnings and profits in the LLC or LP prior to the distribution. Distributions that are classified as a return of capital are recorded as a reduction in the cost basis of the investment.
We account for investment transactions on a trade-date basis. Realized gains or losses on investments are measured by the difference between the net proceeds from the disposition and the cost basis of investment, without regard to unrealized gains or losses previously recognized. We report changes in fair value of investments from the prior period that is measured at fair value as a component of the net change in unrealized appreciation (depreciation) on investments in our consolidated statementConsolidated Statements of operations.Operations.
Non-accrual: Loans may be left on accrual status during the period we are pursuing repayment of the loan. Management reviews all loans that become past due 90 days or more on principal and interest or when there is reasonable doubt that principal or interest will not be collected for possible placement on non-accrual status. We generally reverse accrued interest when a loan is placed on non-accrual. Additionally, any original issue discount and market discount are no longer accreted to interest income as of the date the loan is placed on non-accrual status. Interest payments received on non-accrual loans may be recognized as income or applied to principal depending upon management’s judgment. We restore non-accrual loans to accrual status when past due principal and interest is paid and, in our management’s judgment, are likely to remain current. The total fair value of our non-accrual loans was $1.3 million and $6.5$5.6 million as of September 30, 20162018 and 2015, respectively.$3.0 million as of September 30, 2017.
Partial loan sales: We follow the guidance in ASC Topic 860, when accounting for loan participations and other partial loan sales. Such guidance requires a participation or other partial loan sale to meet the definition of a “participating interest”, as defined in the guidance, in order for sale treatment to be allowed. Participations or other partial loan sales that do not meet the definition of a participating interest remain on our statements of assets and liabilities and the proceeds are recorded as a secured borrowing until the definition is met. Secured borrowings are carried at fair value to correspond with the related investments, which are carried at fair value.
Income taxes:
See "Consolidated“Consolidated Results of Operations - Expenses - Excise Tax Expense"Expense.”
Item 7A. Quantitative and Qualitative Disclosures about Market Risk
We are subject to financial market risks, including changes in interest rates. Many of the loans in our portfolio have floating interest rates, and we expect that our loans in the future may also have floating interest rates. These loans are usually based on a floating LIBOR and typically have interest rate reset provisions that adjust applicable interest rates under such loans to current market rates on a quarterly basis. The loans that are subject to the floating LIBOR rates are also subject to a minimum base rate, or floor, that we charge on our loans if the current market rates are below the respective floors. As of September 30, 20162018 and 2015,2017, the weighted average LIBOR floor on the loans subject to floating interest rates was 1.04%1.01% and 1.08%1.04%, respectively. Prior to their redemption on October 20, 2016, the Class A and B 2010 Notes issued as part of the 2010 Debt Securitization had floating interest rate provisions based on three-month LIBOR that resetsreset quarterly as dodid the Class A-Refi and Class B-Refi 2010 Notes issued in connection with the refinancing of the 2010 Debt Securitization. In addition,Securitization prior to their redemption on July 20, 2018. Prior to their redemption on March 23, 2018, the Class A-1, A-2 and B 2014 Notes issued as part of the 2014 Debt Securitization havehad floating interest rate provisions based on three-month LIBOR that reset quarterly as do the Class A-1-R, A-2-R and B-R 2014 Notes issued in connection with the refinancing of the 2014 Debt Securitization. In addition, the Credit Facility has aand prior to its termination on November 16, 2018, the MS Credit Facility had floating interest rate provisionprovisions based on one-month LIBOR that resetsreset daily. As of September 30, 2016 and 2015, the weighted average LIBOR floor on the secured borrowings, which reset quarterly, was 1.00% and 1.00%, respectively. We expect that other credit facilities into which we enter in the future may have floating interest rate provisions.
Assuming that the consolidated statementConsolidated Statement of financial conditionFinancial Condition as of September 30, 20162018 were to remain constant and that we took no actions to alter interest rate sensitivity as of such date, the following table shows the annualized impact of hypothetical base rate changes in interest rates.
| | | Change in interest rates | | Increase (decrease) in interest income | | Increase (decrease) in interest expense | | Net increase (decrease) in investment income | | Increase (decrease) in interest income | | Increase (decrease) in interest expense | | Net increase (decrease) in investment income |
| | | (In thousands) | | (In thousands) |
| Down 25 basis points | | $ | (237 | ) | | $ | (1,469 | ) | | $ | 1,232 |
| | $ | (4,164 | ) | | $ | (1,420 | ) | | $ | (2,744 | ) |
| Up 50 basis points | | 5,219 |
| | 2,941 |
| | 2,278 |
| | 8,327 |
| | 2,841 |
| | 5,486 |
|
| Up 100 basis points | | 13,167 |
| | 5,881 |
| | 7,286 |
| | 16,654 |
| | 5,682 |
| | 10,972 |
|
| Up 150 basis points | | 21,123 |
| | 8,822 |
| | 12,301 |
| | 24,981 |
| | 8,523 |
| | 16,458 |
|
| Up 200 basis points | | 29,079 |
| | 11,763 |
| | 17,316 |
| | 33,308 |
| | 11,364 |
| | 21,944 |
|
Although we believe that this analysis is indicative of our sensitivity to interest rate changes as of September 30, 2016,2018, it does not adjust for changes in the credit market, credit quality, the size and composition of the assets in our portfolio and other business developments, including borrowings under the 2018 Debt Securitizations,Securitization, the 2014 Debt Securitization, the Credit Facility and the termination of the MS Credit Facility, or other borrowings, that could affect net increase in net assets resulting from operations, or net income. Accordingly, we can offer no assurances that actual results would not differ materially from the analysis above.
We may in the future hedge against interest rate fluctuations by using standard hedging instruments such as interest rate swaps, futures, options and forward contracts to the limited extent permitted under the 1940 Act and applicable commodities laws. While hedging activities may insulate us against adverse changes in interest rates, they may also limit our ability to participate in the benefits of lower interest rates with respect to the investments in our portfolio with fixed interest rates.
Item 8. Consolidated Financial Statements and Supplementary Data
Index to Consolidated Financial Statements
Management’s Report on Internal Control over Financial Reporting
The management of Golub Capital BDC, Inc. (“GBDC,” and collectively with its subsidiaries, the “Company,” “we,” “us,” “our” and “Golub Capital BDC”) is responsible for establishing and maintaining adequate internal control over financial reporting. Our internal control system is a process designed to provide reasonable assurance to our management and board of directors regarding the preparation and fair presentation of published financial statements.
Golub Capital BDC’s internal control over financial reporting includes policies and procedures that pertain to the maintenance of records that, in reasonable detail, accurately and fairly reflect transactions recorded necessary to permit the preparation of financial statements in accordance with U.S. generally accepted accounting principles. Our policies and procedures also provide reasonable assurance that receipts and expenditures are being made only in accordance with authorizations of management and the directors of Golub Capital BDC, and provide reasonable assurance regarding prevention or timely detection of unauthorized acquisition, use or disposition of our assets that could have a material effect on our financial statements.
All internal control systems, no matter how well designed, have inherent limitations. Therefore, even those systems determined to be effective can provide only reasonable assurance with respect to financial statement preparation and presentation. Also, projections of any evaluation of effectiveness as to future periods are subject to the risk that controls may become inadequate because of changes in conditions, or that the degree of compliance with the policies or procedures may deteriorate.
Management assessed the effectiveness of Golub Capital BDC’s internal control over financial reporting as of September 30, 2016.2018. In making this assessment, we used the criteria set forth by the Committee of Sponsoring Organizations of the Treadway Commission in Internal Control — Integrated Framework issued in 2013. Based on the assessment, management believes that, as of September 30, 2016,2018, our internal control over financial reporting is effective based on those criteria.
Golub Capital BDC’s independent registered public accounting firm that audited the financial statements has issued an audit report on the effectiveness of our internal control over financial reporting as of September 30, 2016.2018. This report appears on page 86.99.
Report of Independent Registered Public Accounting Firm
TheTo the Shareholders and the Board of Directors and Shareholders of Golub Capital BDC, Inc. and Subsidiaries
Opinion on the Financial Statements
We have audited the accompanying consolidated statementstatements of financial condition including the consolidated schedule of investments, of Golub Capital BDC, Inc. and Subsidiaries (collectively,(the Company), including the “Company”)consolidated schedules of investments, as of September 30, 2016,2018 and 2017, the related consolidated statements of operations, changes in net assets and cash flows for each of the year then ended. three years in the period ended September 30, 2018, and the related notes (collectively referred to as the “consolidated financial statements”). In our opinion, the consolidated financial statements present fairly, in all material respects, the financial position of the Company at September 30, 2018 and 2017, and the results of its operations, changes in its net assets, and its cash flows for each of the three years in the period ended September 30, 2018, in conformity with U.S. generally accepted accounting principles.
We also have audited, in accordance with the standards of the Public Company Accounting Oversight Board (United States) (PCAOB), the Company’s internal control over financial reporting as of September 30, 2018, based on criteria established in Internal Control-Integrated Framework issued by the Committee of Sponsoring Organizations of the Treadway Commission(2013 framework), and our report dated November 28, 2018 expressed an unqualified opinion thereon.
Basis for Opinion
These financial statements are the responsibility of the Company’s management. Our responsibility is to express an opinion on thesethe Company’s financial statements based on our audit.audits. We are a public accounting firm registered with the PCAOB and are required to be independent with respect to the Company in accordance with the U.S. federal securities laws and the applicable rules and regulations of the Securities and Exchange Commission and the PCAOB.
We conducted our auditaudits in accordance with the standards of the Public Company Accounting Oversight Board (United States).PCAOB. Those standards require that we plan and perform the audit to obtain reasonable assurance about whether the financial statements are free of material misstatement. An audit includesmisstatement, whether due to error or fraud. Our audits included performing procedures to assess the risks of material misstatement of the financial statements, whether due to error or fraud, and performing procedures that respond to those risks. Such procedures included examining, on a test basis, evidence supportingregarding the amounts and disclosures in the financial statements. An auditOur procedures included confirmation of investments owned as of September 30, 2018 and 2017, by correspondence with the trustees. Our audits also includes assessingincluded evaluating the accounting principles used and significant estimates made by management, as well as evaluating the overall presentation of the financial statement presentation. Our procedures included confirmation of investments owned as of September 30, 2016 by correspondence with the trustee or custodian, as applicable.statements. We believe that our audit providesaudits provide a reasonable basis for our opinion.
In our opinion,
/s/ Ernst & Young LLP
We have served as the financial statements referred to above present fairly, in all material respects,Company’s auditor since 2015.
Chicago, Illinois
November 28, 2018
Report of Independent Registered Public Accounting Firm
To the consolidated financial positionShareholders and the Board of Directors of Golub Capital BDC, Inc. and Subsidiaries as of September 30, 2016, and the consolidated results of their operations, changes in net assets, and cash flows for the year then ended, in conformity with U.S. generally accepted accounting principles.
Opinion on Internal Control over Financial Reporting
We also have audited in accordance with the standards of the Public Company Accounting Oversight Board (United States), Golub Capital BDC, Inc. and Subsidiaries’ internal control over financial reporting as of September 30, 2016,2018, based on criteria established in Internal Control-Integrated Framework issued by the Committee of Sponsoring Organizations of the Treadway Commission (2013 framework), and(the COSO criteria). In our report dated November 16, 2016 expressed an unqualified opinion, thereon.
/s/ Ernst & Young LLP
Chicago, Illinois
November 16, 2016
Report of Independent Registered Public Accounting Firm
To the Board of Directors and Stockholders
Golub Capital BDC, Inc. and Subsidiaries
(the Company) maintained, in all material respects, effective internal control over financial reporting as of September 30, 2018, based on the COSO criteria.
We also have audited, in accordance with the accompanyingstandards of the Public Company Accounting Oversight Board (United States) (PCAOB), the consolidated statementstatements of financial condition, including the consolidated scheduleschedules of investments, of Golub Capital BDC, Inc. and Subsidiaries (collectively, the “Company”)Company as of September 30, 2015,2018 and 2017, the related consolidated statements of operations, changes in net assets and cash flows for each of the three years in the period ended September 30, 2015 and 2014. These consolidated financial statements are the responsibility of the Company’s management. Our responsibility is to express an opinion on these financial statements based on our audits.
We conducted our audits in accordance with the standards of the Public Company Accounting Oversight Board (United States). Those standards require that we plan and perform the audit to obtain reasonable assurance about whether the consolidated financial statements are free of material misstatement. An audit also includes examining, on a test basis, evidence supporting the amounts and disclosures in the consolidated financial statements, assessing the accounting principles used and significant estimates made by management, as well as evaluating the overall financial statement presentation. Our procedures included confirmation of investments owned as of September 30, 2015, by correspondence with the custodian, loan agent or borrower. We believe that our audits provide a reasonable basis for our opinion.
In our opinion, the consolidated financial statements referred to above present fairly, in all material respects, the financial position of Golub Capital BDC, Inc. and Subsidiaries as of September 30, 2015,2018, and the results of their operationsrelated notes and their cash flowsour report dated November 28, 2018 expressed an unqualified opinion thereon.
Basis for the years ended September 30, 2015 and 2014, in conformity with U.S. generally accepted accounting principles.Opinion
/s/ RSM US LLP
Chicago, Illinois
November 17, 2015
Report of Independent Registered Public Accounting Firm
The Board of Directors and Shareholders of Golub Capital BDC, Inc. and Subsidiaries
We have audited Golub Capital BDC, Inc. and Subsidiaries’ (collectively, the “Company”) internal control over financial reporting as of September 30, 2016, based on criteria established in Internal Control-Integrated Framework issued by the Committee of Sponsoring Organizations of the Treadway Commission (2013 framework) (the COSO criteria). The Company’s management is responsible for maintaining effective internal control over financial reporting and for its assessment of the effectiveness of internal control over financial reporting included in the accompanying Management’s Report on Internal Control over Financial Reporting. Our responsibility is to express an opinion on the company’sCompany’s internal control over financial reporting based on our audit. We are a public accounting firm registered with the PCAOB and are required to be independent with respect to the Company in accordance with the U.S. federal securities laws and the applicable rules and regulations of the Securities and Exchange Commission and the PCAOB.
We conducted our audit in accordance with the standards of the Public Company Accounting Oversight Board (United States).PCAOB. Those standards require that we plan and perform the audit to obtain reasonable assurance about whether effective internal control over financial reporting was maintained in all material respects.
Our audit included obtaining an understanding of internal control over financial reporting, assessing the risk that a material weakness exists, testing and evaluating the design and operating effectiveness of internal control based on the assessed risk, and performing such other procedures as we considered necessary in the circumstances. We believe that our audit provides a reasonable basis for our opinion.
Definition and Limitations of Internal Control Over Financial Reporting
A company’s internal control over financial reporting is a process designed to provide reasonable assurance regarding the reliability of financial reporting and the preparation of financial statements for external purposes in accordance with generally accepted accounting principles. A company’s internal control over financial reporting includes those policies and procedures that (1) pertain to the maintenance of records that, in reasonable detail, accurately and fairly reflect the transactions and dispositions of the assets of the company; (2) provide reasonable assurance that transactions are recorded as necessary to permit preparation of financial statements in accordance with generally accepted accounting principles, and that receipts and expenditures of the company are being made only in accordance with authorizations of management and directors of the company; and (3) provide reasonable assurance regarding prevention or timely detection of unauthorized acquisition, use, or disposition of the company’s assets that could have a material effect on the financial statements.
Because of its inherent limitations, internal control over financial reporting may not prevent or detect misstatements. Also, projections of any evaluation of effectiveness to future periods are subject to the risk that controls may become inadequate because of changes in conditions, or that the degree of compliance with the policies or procedures may deteriorate.
In our opinion, Golub Capital BDC, Inc. and Subsidiaries maintained, in all material respects, effective internal control over financial reporting as of September 30, 2016, based on the COSO criteria.
We also have audited, in accordance with the standards of the Public Company Accounting Oversight Board (United States), the consolidated statement of financial condition, including the consolidated schedule of investments, of Golub Capital BDC, Inc. and Subsidiaries as of September 30, 2016, and the related consolidated statements of operations, changes in net assets and cash flows for the year then ended, and our report dated November 16, 2016 expressed an unqualified opinion thereon.
/s/ Ernst & Young LLP
Chicago, Illinois
November 16, 201628, 2018
Golub Capital BDC, Inc. and Subsidiaries
Consolidated Statements of Financial Condition
(In thousands, except share and per share data)
| | | | September 30, 2016 | | September 30, 2015 | September 30, 2018 | | September 30, 2017 |
| Assets | |
| | |
| |
| | |
|
| Investments, at fair value | |
| | |
| |
| | |
|
| Non-controlled/non-affiliate company investments | $ | 1,546,766 |
| | $ | 1,425,325 |
| $ | 1,704,473 |
| | $ | 1,586,293 |
|
| Non-controlled affiliate company investments | 9,618 |
| | 5,523 |
| 7,284 |
| | 3,707 |
|
| Controlled affiliate company investments | 104,228 |
| | 98,936 |
| 71,084 |
| | 95,015 |
|
| Total investments at fair value (amortized cost of $1,650,173 and $1,517,314, respectively) | 1,660,612 |
| | 1,529,784 |
| |
| Total investments at fair value (amortized cost of $1,780,652 and $1,671,239, respectively) | | 1,782,841 |
| | 1,685,015 |
|
| Cash and cash equivalents | 10,947 |
| | 5,468 |
| 5,878 |
| | 3,988 |
|
| Foreign currencies (cost of $159 and $0, respectively) | | 159 |
| | — |
|
| Restricted cash and cash equivalents | 78,593 |
| | 92,016 |
| 39,668 |
| | 58,570 |
|
| Interest receivable | 5,935 |
| | 5,700 |
| 6,664 |
| | 6,271 |
|
| Other assets | 422 |
| | 458 |
| 342 |
| | 332 |
|
| Total Assets | $ | 1,756,509 |
| | $ | 1,633,426 |
| $ | 1,835,552 |
| | $ | 1,754,176 |
|
| Liabilities | |
| | |
| |
| | |
|
| Debt | $ | 864,700 |
| | $ | 813,250 |
| $ | 845,683 |
| | $ | 781,100 |
|
| Less unamortized debt issuance costs | 5,627 |
| | 7,624 |
| 2,934 |
| | 4,273 |
|
| Debt less unamortized debt issuance costs | 859,073 |
| | 805,626 |
| 842,749 |
| | 776,827 |
|
| Secured borrowings, at fair value (proceeds of $471 and $351, respectively) | 475 |
| | 355 |
| |
| Interest payable | 3,229 |
| | 2,722 |
| 4,135 |
| | 3,800 |
|
| Management and incentive fees payable | 12,763 |
| | 11,754 |
| 17,671 |
| | 13,215 |
|
| Accounts payable and accrued expenses | 2,072 |
| | 2,042 |
| 2,069 |
| | 2,312 |
|
| Accrued trustee fees | 72 |
| | 57 |
| 74 |
| | 76 |
|
| Total Liabilities | 877,684 |
| | 822,556 |
| 866,698 |
| | 796,230 |
|
| Commitments and Contingencies (Note 9) | |
| | |
| |
| Commitments and Contingencies (Note 8) | | |
| | |
|
| Net Assets | |
| | |
| |
| | |
|
| Preferred stock, par value $0.001 per share, 1,000,000 shares authorized, zero shares issued and outstanding as of September 30, 2016 and September 30, 2015 | — |
| | — |
| |
| Common stock, par value $0.001 per share, 100,000,000 shares authorized, 55,059,067 and 51,300,193 shares issued and outstanding as of September 30, 2016 and September 30, 2015, respectively | 55 |
| | 51 |
| |
| Preferred stock, par value $0.001 per share, 1,000,000 shares authorized, zero shares issued and outstanding as of September 30, 2018 and September 30, 2017 | | — |
| | — |
|
| Common stock, par value $0.001 per share, 100,000,000 shares authorized, 60,165,454 and 59,577,293 shares issued and outstanding as of September 30, 2018 and September 30, 2017, respectively | | 60 |
| | 60 |
|
| Paid in capital in excess of par | 855,998 |
| | 790,713 |
| 949,547 |
| | 939,307 |
|
| Undistributed net investment income | 18,832 |
| | 4,230 |
| |
| Net unrealized appreciation (depreciation) on investments and secured borrowings | 13,104 |
| | 15,134 |
| |
| Net realized gain (loss) on investments | (9,164 | ) | | 742 |
| |
Distributable earnings (1) | | 19,247 |
| | 18,579 |
|
| Total Net Assets | 878,825 |
| | 810,870 |
| 968,854 |
| | 957,946 |
|
| Total Liabilities and Total Net Assets | $ | 1,756,509 |
| | $ | 1,633,426 |
| $ | 1,835,552 |
| | $ | 1,754,176 |
|
| Number of common shares outstanding | 55,059,067 |
| | 51,300,193 |
| 60,165,454 |
| | 59,577,293 |
|
| Net asset value per common share | $ | 15.96 |
| | $ | 15.80 |
| $ | 16.10 |
| | $ | 16.08 |
|
(1) See Note 2. Significant Accounting Policies and Recent Accounting Updates.
See Notes to Consolidated Financial Statements.
100
87
Golub Capital BDC, Inc. and Subsidiaries
Consolidated Statements of Operations
(In thousands, except share and per share data)
| | | | Years ended September 30, | Years ended September 30, |
| | 2016 | | 2015 | | 2014 | 2018 | | 2017 | | 2016 |
| Investment income | |
| | |
| | |
| | | | | |
| From non-controlled/non-affiliate company investments: | |
| | |
| | |
| | | | | |
| Interest income | $ | 114,186 |
| | $ | 112,406 |
| | $ | 102,158 |
| $ | 140,267 |
| | $ | 127,674 |
| | $ | 114,186 |
|
| Dividend income | 539 |
| | 212 |
| | 1,248 |
| 624 |
| | 629 |
| | 539 |
|
| Fee income | 1,448 |
| | 2,265 |
| | 3,259 |
| 2,514 |
| | 1,757 |
| | 1,448 |
|
| Total investment income from non-controlled/non-affiliate company investments | 116,173 |
|
| 114,883 |
| | 106,665 |
| 143,405 |
| | 130,060 |
| | 116,173 |
|
| From non-controlled affiliate company investments: | |
| | |
| | |
| | | | | |
| Interest income | 660 |
| | — |
| | 225 |
| 667 |
| | 1,136 |
| | 660 |
|
| Fee income | — |
| | — |
| | 171 |
| |
| Total investment income from non-controlled affiliate company investments | 660 |
|
| — |
| | 396 |
| 667 |
| | 1,136 |
| | 660 |
|
| From controlled affiliate company investments: | |
| | |
| | |
| | | | | |
| Interest income | 6,939 |
| | 3,735 |
| | 1,947 |
| — |
| | 1,639 |
| | 6,939 |
|
| Dividend income | 4,099 |
| | 1,350 |
| | 518 |
| 8,099 |
| | 4,929 |
| | 4,099 |
|
| Total investment income from controlled affiliate company investments | 11,038 |
|
| 5,085 |
| | 2,465 |
| 8,099 |
| | 6,568 |
| | 11,038 |
|
| Total investment income | 127,871 |
|
| 119,968 |
| | 109,526 |
| 152,171 |
| | 137,764 |
| | 127,871 |
|
| Expenses | |
| | |
| | |
| | | | | |
| Interest and other debt financing expenses | 27,724 |
| | 24,510 |
| | 20,227 |
| 33,174 |
| | 31,534 |
| | 27,724 |
|
| Base management fee | 22,020 |
| | 20,330 |
| | 17,053 |
| 24,214 |
| | 23,815 |
| | 22,020 |
|
| Incentive fee | 7,266 |
| | 10,226 |
| | 10,128 |
| 13,110 |
| | 7,560 |
| | 7,266 |
|
| Professional fees | 2,814 |
| | 2,942 |
| | 2,451 |
| 2,721 |
| | 2,396 |
| | 2,814 |
|
| Administrative service fee | 2,209 |
| | 2,372 |
| | 2,527 |
| 2,456 |
| | 2,340 |
| | 2,209 |
|
| General and administrative expenses | 525 |
| | 591 |
| | 605 |
| 475 |
| | 556 |
| | 525 |
|
| Total expenses | 62,558 |
|
| 60,971 |
| | 52,991 |
| 76,150 |
| | 68,201 |
| | 62,558 |
|
| Net investment income - before excise tax | 65,313 |
|
| 58,997 |
| | 56,535 |
| 76,021 |
| | 69,563 |
| | 65,313 |
|
| Excise tax | 333 |
| | — |
| | — |
| — |
| | 17 |
| | 333 |
|
| Net investment income - after excise tax | 64,980 |
| | 58,997 |
| | 56,535 |
| 76,021 |
| | 69,546 |
| | 64,980 |
|
| Net gain (loss) on investments and secured borrowings | |
| | |
| | |
| |
| Net realized gain (loss) on investments: | |
| | |
| | |
| |
| Net gain (loss) on investments and foreign currency | | | | | | |
| Net realized gain (loss) on investments and foreign currency transactions: | | | | | | |
| Non-controlled/non-affiliate company investments | 3,532 |
| | 9,354 |
| | 5,384 |
| 17,454 |
| | 15,844 |
| | 3,532 |
|
| Non-controlled affiliate company investments | 2,722 |
| | — |
| | — |
| — |
| | (6,442 | ) | | 2,722 |
|
| Net realized gain (loss) on investments | 6,254 |
|
| 9,354 |
| | 5,384 |
| |
| Net change in unrealized appreciation (depreciation) on investments: | |
| | |
| | |
| |
| Foreign currency transactions | | 82 |
| | — |
| | — |
|
| Net realized gain (loss) on investments and foreign currency transactions | | 17,536 |
| | 9,402 |
| | 6,254 |
|
| Net change in unrealized appreciation (depreciation) on investments and foreign currency translation: | | | | | | |
| Non-controlled/non-affiliate company investments | 4,702 |
| | 768 |
| | 3,052 |
| (11,212 | ) | | (3,878 | ) | | 4,702 |
|
| Non-controlled affiliate company investments | (3,170 | ) | | 2,443 |
| | 475 |
| 1,506 |
| | 5,246 |
| | (3,170 | ) |
| Controlled affiliate company investments | (3,562 | ) | | (773 | ) | | (179 | ) | (1,881 | ) | | 1,969 |
| | (3,562 | ) |
| Net change in unrealized appreciation (depreciation) on investments | (2,030 | ) |
| 2,438 |
| | 3,348 |
| |
| Net change in unrealized appreciation (depreciation) on investments and foreign currency translation | | (11,587 | ) | | 3,337 |
| | (2,030 | ) |
| Net change in unrealized appreciation (depreciation) on secured borrowings | — |
| | 2 |
| | 121 |
| — |
| | 3 |
| | — |
|
| Net gain (loss) on investments and secured borrowings | 4,224 |
|
| 11,794 |
| | 8,853 |
| |
| Net gain (loss) on investments, secured borrowings and foreign currency | | 5,949 |
| | 12,742 |
| | 4,224 |
|
| Net increase in net assets resulting from operations | $ | 69,204 |
|
| $ | 70,791 |
| | $ | 65,388 |
| 81,970 |
| | 82,288 |
| | 69,204 |
|
| Per Common Share Data | |
| | |
| | |
| | | | | |
| Basic and diluted earnings per common share | $ | 1.33 |
| | $ | 1.44 |
| | $ | 1.44 |
| $ | 1.37 |
| | $ | 1.45 |
| | $ | 1.33 |
|
| Dividends and distributions declared per common share | $ | 1.28 |
| | $ | 1.28 |
| | $ | 1.28 |
| $ | 1.36 |
| | $ | 1.53 |
| | $ | 1.28 |
|
| Basic and diluted weighted average common shares outstanding | 51,948,378 |
| | 49,017,777 |
| | 45,277,111 |
| 59,803,208 |
| | 56,913,064 |
| | 51,948,378 |
|
See Notes to Consolidated Financial Statements.
101
88
Golub Capital BDC, Inc. and Subsidiaries
Consolidated Statements of Changes in Net Assets
(In thousands, except share data) |
| | | | | | | | | | | | | | | | | | | | | | | | | | |
| | | | | | | | | | Net Unrealized | | | | |
| | | | | | | | | | Appreciation | | | | |
| | Common Stock | | Paid in Capital | | | | (Depreciation) on | | | | |
| | | | Par | | in Excess | | Undistributed Net | | Investments and | | Net Realized Gain | | Total |
| | Shares | | Amount | | of Par | | Investment Income | | secured borrowings | | (loss) on Investments | | Net Assets |
| Balance at September 30, 2013 | 43,282,932 |
| | $ | 43 |
| | $ | 652,669 |
| | $ | 2,725 |
| | $ | 9,225 |
| | $ | (6,426 | ) | | $ | 658,236 |
|
Issuance of common stock, net of offering and underwriting costs(1) | 3,666,855 |
| | 4 |
| | 64,102 |
| | — |
| | — |
| | — |
| | 64,106 |
|
| Net increase in net assets resulting from operations | — |
| | — |
| | — |
| | 56,535 |
| | 3,469 |
| | 5,384 |
| | 65,388 |
|
| Distributions to stockholders: | |
| | |
| | |
| | |
| | |
| | |
| | |
| Stock issued in connection with dividend reinvestment plan | 169,711 |
| | — |
| | 2,832 |
| | — |
| | — |
| | — |
| | 2,832 |
|
| Distributions from net investment income | — |
| | — |
| | — |
| | (57,823 | ) | | — |
| | — |
| | (57,823 | ) |
Tax reclassification of stockholders’ equity in accordance with generally accepted accounting principles | — |
| | — |
| | 876 |
| | 2,190 |
| | — |
| | (3,066 | ) | | — |
|
| Total Increase (decrease) for the period ended September 30, 2014 | 3,836,566 |
|
| 4 |
| | 67,810 |
| | 902 |
| | 3,469 |
| | 2,318 |
|
| 74,503 |
|
| Balance at September 30, 2014 | 47,119,498 |
| | $ | 47 |
| | $ | 720,479 |
| | $ | 3,627 |
| | $ | 12,694 |
| | $ | (4,108 | ) | | $ | 732,739 |
|
Issuance of common stock, net of offering and underwriting costs(2) | 4,002,292 |
| | 4 |
| | 67,366 |
| | — |
| | — |
| | — |
| | 67,370 |
|
| Net increase in net assets resulting from operations | — |
| | — |
| | — |
| | 58,997 |
| | 2,440 |
| | 9,354 |
| | 70,791 |
|
| Distributions to stockholders: | |
| | |
| | |
| | |
| | |
| | |
| | |
| Stock issued in connection with dividend reinvestment plan | 178,403 |
| | — |
| | 2,939 |
| | — |
| | — |
| | — |
| | 2,939 |
|
| Distributions from net investment income | — |
| | — |
| | — |
| | (58,152 | ) | | — |
| | — |
| | (58,152 | ) |
| Distributions from realized gain | — |
| | — |
| | — |
| | — |
| | — |
| | (4,817 | ) | | (4,817 | ) |
Tax reclassification of stockholders’ equity in accordance with
generally accepted accounting principles | — |
| | — |
| | (71 | ) | | (242 | ) | | — |
| | 313 |
| | — |
|
| Total Increase (decrease) for the period ended September 30, 2015 | 4,180,695 |
| | 4 |
| | 70,234 |
| | 603 |
| | 2,440 |
| | 4,850 |
| | 78,131 |
|
| Balance at September 30, 2015 | 51,300,193 |
| | $ | 51 |
| | $ | 790,713 |
| | $ | 4,230 |
| | $ | 15,134 |
| | $ | 742 |
| | $ | 810,870 |
|
Issuance of common stock, net of offering and underwriting costs(3) | 3,320,456 |
| | 3 |
| | 58,257 |
| | — |
| | — |
| | — |
| | 58,260 |
|
| Net increase in net assets resulting from operations | — |
| | — |
| | — |
| | 64,980 |
| | (2,030 | ) | | 6,254 |
| | 69,204 |
|
| Distributions to stockholders: | |
| | |
| | |
| | |
| | |
| | |
| |
|
|
| Stock issued in connection with dividend reinvestment plan | 438,418 |
| | 1 |
| | 7,369 |
| | — |
| | — |
| | — |
| | 7,370 |
|
| Distributions from net investment income | — |
| | — |
| | — |
| | (54,461 | ) | | — |
| | — |
| | (54,461 | ) |
| Distributions from realized gain | — |
| | — |
| | — |
| | — |
| | — |
| | (12,418 | ) | | (12,418 | ) |
Tax reclassification of stockholders’ equity in accordance with
generally accepted accounting principles | — |
| | — |
| | (341 | ) | | 4,083 |
| | — |
| | (3,742 | ) | | — |
|
| Total Increase (decrease) for the period ended September 30, 2016 | 3,758,874 |
| | 4 |
| | 65,285 |
| | 14,602 |
| | (2,030 | ) | | (9,906 | ) | | 67,955 |
|
| Balance at September 30, 2016 | 55,059,067 |
| | $ | 55 |
| | $ | 855,998 |
| | $ | 18,832 |
| | $ | 13,104 |
| | $ | (9,164 | ) | | $ | 878,825 |
|
|
| | | | | | | | | | | | | | | | | | |
| | Common Stock | | Paid in Capital in Excess of Par | | Distributable Earnings(1) | | Total Net Assets |
| | Shares | | Par Amount | | | |
| Balance at September 30, 2015 | 51,300,193 |
| | $ | 51 |
| | $ | 790,713 |
| | $ | 20,106 |
| | $ | 810,870 |
|
Issuance of common stock, net of offering and underwriting costs(2) | 3,320,456 |
| | 3 |
| | 58,257 |
| | — |
| | 58,260 |
|
| Net increase in net assets resulting from operations: | | | | | | | | | |
| Net investment income - after excise tax | — |
| | — |
| | — |
| | 64,980 |
| | 64,980 |
|
| Net realized gain (loss) on investments and foreign currency transactions | — |
| | — |
| | — |
| | 6,254 |
| | 6,254 |
|
| Net change in unrealized appreciation (depreciation) on investments, secured borrowings and foreign currency translation | — |
| | — |
| | — |
| | (2,030 | ) | | (2,030 | ) |
| Distributions to stockholders: | | | | | | | | | |
| Stock issued in connection with dividend reinvestment plan | 438,418 |
| | 1 |
| | 7,369 |
| | — |
| | 7,370 |
|
| Distributions from distributable earnings | — |
| | — |
| | — |
| | (66,879 | ) | | (66,879 | ) |
| Tax reclassification of stockholders' equity in accordance with generally accepted accounting principles | — |
| | — |
| | (341 | ) | | 341 |
| | — |
|
| Total increase (decrease) for the period ended September 30, 2016 | 3,758,874 |
| | 4 |
| | 65,285 |
| | 2,666 |
| | 67,955 |
|
| Balance at September 30, 2016 | 55,059,067 |
| | $ | 55 |
| | $ | 855,998 |
| | $ | 22,772 |
| | $ | 878,825 |
|
Issuance of common stock, net of offering and underwriting costs(3) | 3,982,721 |
| | $ | 4 |
| | $ | 73,610 |
| | $ | — |
| | $ | 73,614 |
|
| Net increase in net assets resulting from operations: | | | | | | | | | |
| Net investment income - after excise tax | — |
| | — |
| | — |
| | 69,546 |
| | 69,546 |
|
| Net realized gain (loss) on investments and foreign currency transactions | — |
| | — |
| | — |
| | 9,402 |
| | 9,402 |
|
| Net change in unrealized appreciation (depreciation) on investments, secured borrowings and foreign currency translation | — |
| | — |
| | — |
| | 3,340 |
| | 3,340 |
|
| Distributions to stockholders: | |
| | |
| | |
| | |
| | |
| Stock issued in connection with dividend reinvestment plan | 535,505 |
| | 1 |
| | 9,661 |
| | — |
| | 9,662 |
|
| Distributions from distributable earnings | — |
| | — |
| | — |
| | (86,443 | ) | | (86,443 | ) |
| Tax reclassification of stockholders' equity in accordance with generally accepted accounting principles | — |
| | — |
| | 38 |
| | (38 | ) | | — |
|
| Total increase (decrease) for the period ended September 30, 2017 | 4,518,226 |
| | 5 |
| | 83,309 |
| | (4,193 | ) | | 79,121 |
|
| Balance at September 30, 2017 | 59,577,293 |
| | $ | 60 |
| | $ | 939,307 |
| | $ | 18,579 |
| | $ | 957,946 |
|
| Net increase in net assets resulting from operations: | | | | | | | | | |
| Net investment income - after excise tax | — |
| | — |
| | — |
| | 76,021 |
| | 76,021 |
|
| Net realized gain (loss) on investments and foreign currency transactions | — |
| | — |
| | — |
| | 17,536 |
| | 17,536 |
|
| Net change in unrealized appreciation (depreciation) on investments, secured borrowings and foreign currency translation | — |
| | — |
| | — |
| | (11,587 | ) | | (11,587 | ) |
| Distributions to stockholders: | |
| | |
| | |
| | |
| | |
| Stock issued in connection with dividend reinvestment plan | 588,161 |
| | — |
| | 10,245 |
| | — |
| | 10,245 |
|
| Distributions from distributable earnings | — |
| | — |
| | — |
| | (81,307 | ) | | (81,307 | ) |
| Tax reclassification of stockholders' equity in accordance with generally accepted accounting principles | — |
| | — |
| | (5 | ) | | 5 |
| | — |
|
| Total increase (decrease) for the period ended September 30, 2018 | 588,161 |
| | — |
| | 10,240 |
| | 668 |
| | 10,908 |
|
| Balance at September 30, 2018 | 60,165,454 |
| | $ | 60 |
| | $ | 949,547 |
| | $ | 19,247 |
| | $ | 968,854 |
|
| |
(1) | On March 18, 2014, Golub Capital BDC, Inc. priced a public offering of 3,500,000 shares of its common stock at a public offering price of $18.05 per share. On April 23, 2014, Golub Capital BDC, Inc. sold an additional 166,855 shares of its common stock at a public offering price of $18.05 per share pursuant to the underwriters’ partial exercise of the option to purchase additional shares granted in connection with the public offering in March 2014.See Note 2. Significant Accounting Policies and Recent Accounting Updates |
| |
(2) | On April 10, 2015, Golub Capital BDC, Inc. priced a public offering of 3,500,000 shares of its common stock at a public offering price of $17.42 per share. On May 7, 2015, Golub Capital BDC, Inc. sold an additional 502,292 shares of its common stock at a public offering price of $17.42 per share pursuant to the underwriters’ partial exercise of the option to purchase additional shares granted in connection with the public offering in April 2015. |
| |
(3)
| On July 18, 2016, Golub Capital BDC, Inc. entered into a Securities Purchase Agreement between the Company and a third party institutional investor for the sale of 1,433,486 shares of Company's common stock at a price per share of $17.44 per share. On August 15, 2016, Golub Capital BDC, Inc. priced a public offering of 1,750,000 shares of its common stock at a public offering price of $18.35 per share. On September 19, 2016, Golub Capital BDC, Inc. sold an additional 136,970 shares of its common stock at a public offering price of $18.35 per share pursuant to the underwriters’ partial exercise of the option to purchase additional shares granted in connection with the public offering in August 2016. |
| |
(3) | On March 21, 2017, Golub Capital BDC, Inc. priced a public offering of 1,750,000 shares of its common stock at a public offering price of $19.03 per share. On April 6, 2017, Golub Capital BDC, Inc. sold an additional 262,500 shares of its common stock at a public offering price of $19.03 per share pursuant to the underwriter's exercise of the option to purchase additional shares granted in connection with the public offering in March 2017. On June 6, 2017, Golub Capital BDC, Inc. entered into an agreement to sell 1,750,000 shares of its common stock pursuant to an underwritten, public offering at a price to the Company of $18.71 per share. On July 5, 2017, Golub Capital BDC, Inc. sold an additional 220,221 shares of its common stock at a public offering price of $18.71 per share pursuant to the underwriters’ partial exercise of the option to purchase additional shares granted in connection with the public offering in June 2017. |
See Notes to Consolidated Financial Statements.
102
Golub Capital BDC, Inc. and Subsidiaries
Consolidated Statements of Cash Flows
(In thousands)
| | | | Years ended September 30, | Years ended September 30, |
| | 2016 | | 2015 | | 2014 | 2018 | | 2017 | | 2016 |
| Cash flows from operating activities | |
| | |
| | |
| |
| | |
| | |
| Net increase in net assets resulting from operations | $ | 69,204 |
| | $ | 70,791 |
| | $ | 65,388 |
| $ | 81,970 |
| | $ | 82,288 |
| | $ | 69,204 |
|
Adjustments to reconcile net increase in net assets resulting from operations to net cash (used in) provided by operating activities | |
| | |
| | |
| | | | | |
| Amortization of deferred financing costs | 4,184 |
| | 4,506 |
| | 3,030 |
| |
| Amortization of deferred debt issuance costs | | 3,315 |
| | 3,289 |
| | 4,184 |
|
| Accretion of discounts and amortization of premiums | (8,662 | ) | | (9,000 | ) | | (8,894 | ) | (9,641 | ) | | (9,495 | ) | | (8,662 | ) |
| Net realized (gain) loss on investments | (6,254 | ) | | (9,354 | ) | | (5,384 | ) | (17,454 | ) | | (9,402 | ) | | (6,254 | ) |
| Net realized (gain) loss on other short-term borrowings | | (152 | ) | | — |
| | — |
|
| Net change in unrealized (appreciation) depreciation on investments | 2,030 |
| | (2,438 | ) | | (3,348 | ) | 11,587 |
| | (3,337 | ) | | 2,030 |
|
| Net change in unrealized appreciation (depreciation) on secured borrowings | — |
| | (2 | ) | | (121 | ) | — |
| | (3 | ) | | — |
|
| Proceeds from (fundings of) revolving loans, net | (587 | ) | | (1,365 | ) | | 288 |
| 7,235 |
| | (331 | ) | | (587 | ) |
| Fundings of investments | (654,763 | ) | | (858,147 | ) | | (878,635 | ) | (646,595 | ) | | (588,169 | ) | | (654,763 | ) |
| Proceeds from principal payments and sales of portfolio investments | 538,609 |
| | 699,075 |
| | 573,201 |
| 558,664 |
| | 588,173 |
| | 538,609 |
|
| PIK interest | (1,201 | ) | | (941 | ) | | 69 |
| (1,622 | ) | | (1,839 | ) | | (1,201 | ) |
| Changes in operating assets and liabilities: | |
| | |
| | |
|
|
| |
|
| |
|
|
| Interest receivable | (235 | ) | | 91 |
| | (1,475 | ) | (393 | ) | | (336 | ) | | (235 | ) |
| Other assets | 36 |
| | 69 |
| | (291 | ) | (10 | ) | | 90 |
| | 36 |
|
| Interest payable | 507 |
| | (474 | ) | | 1,919 |
| 335 |
| | 571 |
| | 507 |
|
| Management and incentive fees payable | 1,009 |
| | 3,303 |
| | 2,872 |
| 4,456 |
| | 452 |
| | 1,009 |
|
| Payable for investments purchased | — |
| | — |
| | (3,677 | ) | |
| Accounts payable and accrued expenses | 30 |
| | 645 |
| | (581 | ) | (243 | ) | | 240 |
| | 30 |
|
| Accrued trustee fees | 15 |
| | (9 | ) | | 66 |
| (2 | ) | | 4 |
| | 15 |
|
| Net cash (used in) provided by operating activities | (56,078 | ) | | (103,250 | ) | | (255,573 | ) | (8,550 | ) | | 62,195 |
| | (56,078 | ) |
| Cash flows from investing activities | |
| | |
| | |
| |
| Net change in restricted cash and cash equivalents | 13,423 |
| | (17,208 | ) | | (36,400 | ) | |
| Net cash (used in) provided by investing activities | 13,423 |
| | (17,208 | ) | | (36,400 | ) | |
| Cash flows from financing activities | |
| | |
| | |
| |
| | |
| | |
| Borrowings on debt | 440,650 |
| | 503,200 |
| | 825,950 |
| 760,450 |
| | 545,000 |
| | 440,650 |
|
| Repayments of debt | (389,200 | ) | | (387,100 | ) | | (540,900 | ) | (695,867 | ) | | (628,600 | ) | | (389,200 | ) |
| Capitalized debt financing costs | (2,187 | ) | | (2,615 | ) | | (4,803 | ) | |
| Capitalized debt issuance costs | | (1,976 | ) | | (1,935 | ) | | (2,187 | ) |
| Proceeds from other short-term borrowings | | 9,511 |
| | — |
| | — |
|
| Repayments on other short-term borrowings | | (9,359 | ) | | — |
| | — |
|
| Proceeds from secured borrowings | 155 |
| | — |
| | 29,518 |
| — |
| | — |
| | 155 |
|
| Repayments on secured borrowings | (35 | ) | | (34 | ) | | (38,081 | ) | — |
| | (475 | ) | | (35 | ) |
| Proceeds from shares sold, net of underwriting costs | 58,555 |
| | 67,602 |
| | 64,170 |
| — |
| | 74,014 |
| | 58,555 |
|
| Offering costs paid | (295 | ) | | (232 | ) | | (64 | ) | — |
| | (400 | ) | | (295 | ) |
| Distributions paid | (59,509 | ) | | (60,030 | ) | | (54,991 | ) | (71,062 | ) | | (76,781 | ) | | (59,509 | ) |
| Net cash provided by (used in) financing activities | 48,134 |
| | 120,791 |
| | 280,799 |
| |
| Net change in cash and cash equivalents | 5,479 |
|
| 333 |
| | (11,174 | ) | |
| Cash and cash equivalents, beginning of period | 5,468 |
| | 5,135 |
| | 16,309 |
| |
| Cash and cash equivalents, end of period | $ | 10,947 |
| | $ | 5,468 |
| | $ | 5,135 |
| |
| Supplemental information: | |
| | |
| | |
| |
| Net cash (used in) provided by financing activities | | (8,303 | ) | | (89,177 | ) | | 48,134 |
|
| Net change in cash, cash equivalents, foreign currencies and restricted cash and cash equivalents | | (16,853 | ) | | (26,982 | ) | | (7,944 | ) |
| Cash, cash equivalents, foreign currencies and restricted cash and cash equivalents, beginning of period | | 62,558 |
| | 89,540 |
| | 97,484 |
|
| Cash, cash equivalents, foreign currencies and restricted cash and cash equivalents, end of period | | $ | 45,705 |
| | $ | 62,558 |
| | $ | 89,540 |
|
| Supplemental disclosure of cash flow information: | | |
| | |
| | |
| Cash paid during the period for interest | $ | 23,019 |
| | $ | 20,463 |
| | $ | 14,081 |
| $ | 29,523 |
| | $ | 27,662 |
| | $ | 23,019 |
|
| Taxes, including excise tax, paid during the period | 333 |
| | — |
| | — |
| — |
| | 17 |
| | 333 |
|
| Distributions declared during the period | (66,879 | ) | | (62,969 | ) | | (57,823 | ) | 81,307 |
| | 86,443 |
| | 66,879 |
|
See Notes to Consolidated Financial Statements.
103
Golub Capital BDC, Inc. and Subsidiaries
Consolidated Statements of Cash Flows - (continued)
(In thousands)
|
| | | | | | | | | | | |
| | Years ended September 30, |
| | 2018 | | 2017 | | 2016 |
| Supplemental disclosure of noncash operating activity: | | | | | |
| Funding of LLC equity interests in SLF | $ | — |
| | $ | (78,689 | ) | | $ | — |
|
| Proceeds from subordinated notes in SLF principal payment | — |
| | 78,869 |
| | — |
|
| Supplemental disclosure of noncash financing activity: |
|
| |
|
| |
|
|
| Proceeds from issuance of Class A-1-R, Class A-2-R, and Class B-R 2014 Notes | $ | 246,000 |
| | $ | — |
| | $ | — |
|
| Redemptions of Class A-1, Class A-2, and Class B 2014 Notes | (246,000 | ) | | — |
| | — |
|
| Proceeds from issuance of Class A-Refi 2010 Notes | — |
| | 205,000 |
| | — |
|
| Redemptions of Class A and Class B 2010 Notes | — |
| | (205,000 | ) | | — |
|
| Stock issued in connection with dividend reinvestment plan | 10,245 |
| | 9,662 |
| | 7,370 |
|
The following table provides a reconciliation of cash, cash equivalents, foreign currencies and restricted cash and cash equivalents reported within the Consolidated Statements of Financial Condition that sum to the total of the same such amounts in the Consolidated Statements of Cash Flows: |
| | | | | | | |
| | As of September 30, |
| | 2018 | | 2017 |
| Cash and cash equivalents | $ | 5,878 |
| | $ | 3,988 |
|
| Foreign currencies | 159 |
| | — |
|
| Restricted cash and cash equivalents | 39,668 |
| | 58,570 |
|
| Total cash, cash equivalents, foreign currencies and restricted cash and cash equivalents shown in the Consolidated Statements of Cash Flows | $ | 45,705 |
| | $ | 62,558 |
|
See Note 2. Significant Accounting Policies and Recent Accounting Updates for a description of restricted cash and cash equivalents.
See Notes to Consolidated Financial Statements.
104
Golub Capital BDC, Inc. and Subsidiaries
Consolidated Schedule of Investments
September 30, 20162018
(In thousands)
|
| | | | | | | | | | | | | | | | | | | | | | |
| | Investment Type | | Spread Above Index(1) | | Interest Rate(2) | | Maturity Date | | Principal/Par Amount(3) | | Amortized Cost | | Percentage of Net Assets | | Fair Value |
| Investments | | | | | | | | | |
| | |
| | |
| | |
|
| Non-controlled/non-affiliate company investments | | | | | | | | | |
| | |
| | |
| | |
|
| Debt investments | | | | | | | | | |
| | |
| | |
| | |
|
| Aerospace and Defense | | | | | | | | | |
| | |
| | |
| | |
|
ILC Dover, LP*^# | One stop | | L + 9.00% | | 8.00% cash/2.00% PIK | | 03/2020 | | $ | 17,730 |
| | $ | 17,592 |
| | 1.7 |
| % | $ | 15,070 |
|
| ILC Dover, LP | One stop | | L + 9.00% | | 8.00% cash/2.00% PIK | | 03/2019 | | 784 |
| | 776 |
| | 0.1 |
| | 667 |
|
NTS Technical Systems*^# | One stop | | L + 6.25% | | 7.25 | | 06/2021 | | 26,079 |
| | 25,721 |
| | 2.9 |
| | 25,557 |
|
NTS Technical Systems(4) | One stop | | L + 6.25% | | N/A(5) | | 06/2021 | | — |
| | (83 | ) | | — |
| | (71 | ) |
NTS Technical Systems(4) | One stop | | L + 6.25% | | N/A(5) | | 06/2021 | | — |
| | (39 | ) | | — |
| | (57 | ) |
Tresys Technology Holdings, Inc.(6) | One stop | | L + 6.75% | | 8.00% | | 12/2017 | | 3,899 |
| | 3,845 |
| | 0.1 |
| | 1,170 |
|
| Tresys Technology Holdings, Inc. | One stop | | L + 6.75% | | 8.00% | | 12/2017 | | 537 |
| | 535 |
| | 0.1 |
| | 537 |
|
Tronair Parent, Inc.(4) | Senior loan | | L + 4.50% | | N/A(5) | | 09/2021 | | — |
| | (1 | ) | | — |
| | — |
|
Whitcraft LLC*^ | One stop | | L + 6.50% | | 7.50% | | 05/2020 | | 13,504 |
| | 13,404 |
| | 1.5 |
| | 13,504 |
|
Whitcraft LLC(4) | One stop | | L + 6.50% | | N/A(5) | | 05/2020 | | — |
| | (1 | ) | | — |
| | — |
|
| | | | | | | | | | 62,533 |
| | 61,749 |
| | 6.4 |
| | 56,377 |
|
| Automobile | | | | | | | | | |
| | |
| | |
| | |
|
American Driveline Systems, Inc.* | Senior loan | | L + 5.75% | | 6.75% | | 03/2020 | | 1,798 |
| | 1,758 |
| | 0.2 |
| | 1,798 |
|
American Driveline Systems, Inc.^ | Senior loan | | L + 5.75% | | 6.75% | | 03/2020 | | 233 |
| | 229 |
| | — |
| | 233 |
|
| American Driveline Systems, Inc. | Senior loan | | P + 4.75% | | 8.25% | | 03/2020 | | 46 |
| | 40 |
| | — |
| | 46 |
|
CH Hold Corp. (Caliber Collision)*# | Senior loan | | L + 5.25% | | 6.25% | | 11/2019 | | 5,144 |
| | 5,108 |
| | 0.6 |
| | 5,144 |
|
Dent Wizard International Corporation* | Senior loan | | L + 4.75% | | 5.75% | | 04/2020 | | 2,469 |
| | 2,460 |
| | 0.3 |
| | 2,469 |
|
K&N Engineering, Inc.^ | Senior loan | | P + 3.25% | | 6.75% | | 07/2019 | | 2,821 |
| | 2,797 |
| | 0.3 |
| | 2,821 |
|
K&N Engineering, Inc.^ | Senior loan | | L + 4.25% | | 5.25% | | 07/2019 | | 133 |
| | 122 |
| | — |
| | 133 |
|
K&N Engineering, Inc.(4) | Senior loan | | L + 4.25% | | N/A(5) | | 07/2019 | | — |
| | (2 | ) | | — |
| | — |
|
OEConnection LLC* | Senior loan | | L + 5.00% | | 6.00% | | 06/2022 | | 4,883 |
| | 4,763 |
| | 0.6 |
| | 4,883 |
|
OEConnection LLC(4) | Senior loan | | L + 5.00% | | N/A(5) | | 06/2021 | | — |
| | (1 | ) | | — |
| | — |
|
Polk Acquisition Corp.* | Senior loan | | L + 5.00% | | 6.00% | | 06/2022 | | 4,734 |
| | 4,662 |
| | 0.5 |
| | 4,734 |
|
| Polk Acquisition Corp. | Senior loan | | L + 5.00% | | 6.00% | | 06/2022 | | 54 |
| | 53 |
| | — |
| | 54 |
|
| Polk Acquisition Corp. | Senior loan | | L + 5.00% | | 6.64% | | 06/2022 | | 18 |
| | 16 |
| | — |
| | 18 |
|
Polk Acquisition Corp.(4) | Senior loan | | L + 5.00% | | N/A(5) | | 06/2022 | | — |
| | (2 | ) | | — |
| | — |
|
T5 Merger Corporation^ | One stop | | L + 6.25% | | 7.25% | | 03/2022 | | 3,200 |
| | 3,148 |
| | 0.4 |
| | 3,168 |
|
T5 Merger Corporation(4) | One stop | | L + 6.25% | | N/A(5) | | 03/2022 | | — |
| | (2 | ) | | — |
| | (1 | ) |
| | | | | | | | | | 25,533 |
| | 25,149 |
| | 2.9 |
| | 25,500 |
|
| Banking | | | | | | | | | | | | | | | |
HedgeServ Holding L.P.*^# | One stop | | L + 8.00% | | 7.00% cash/2.00% PIK | 02/2019 | | 17,529 |
| | 17,451 |
| | 2.0 |
| | 17,529 |
|
HedgeServ Holding L.P.(4) | One stop | | L + 6.00% | | N/A(5) | | 02/2019 | | — |
| | (4 | ) | | — |
| | — |
|
| | | | | | | | | | 17,529 |
| | 17,447 |
| | 2.0 |
| | 17,529 |
|
| Beverage, Food and Tobacco | | | | | | | | | |
| | |
| | |
| | |
|
| Abita Brewing Co., L.L.C. | One stop | | L + 5.75% | | 6.75% | | 04/2021 | | 7,993 |
| | 7,871 |
| | 0.8 |
| | 7,194 |
|
Abita Brewing Co., L.L.C.(4) | One stop | | L + 5.75% | | 6.75% | | 04/2021 | | 4 |
| | 3 |
| | — |
| | (11 | ) |
ABP Corporation* | Senior loan | | L + 4.75% | | 6.00% | | 09/2018 | | 4,696 |
| | 4,667 |
| | 0.5 |
| | 4,461 |
|
| ABP Corporation | Senior loan | | P + 3.50% | | 7.25% | | 09/2018 | | 250 |
| | 247 |
| | — |
| | 225 |
|
Atkins Nutritionals, Inc*^ | One stop | | L + 8.50% | | 9.75% | | 04/2019 | | 21,636 |
| | 21,464 |
| | 2.5 |
| | 21,636 |
|
Atkins Nutritionals, Inc*^# | One stop | | L + 5.00% | | 6.25% | | 01/2019 | | 16,872 |
| | 16,752 |
| | 1.9 |
| | 16,872 |
|
Benihana, Inc.*^ | One stop | | L + 6.00% | | 7.25% | | 01/2019 | | 15,279 |
| | 15,064 |
| | 1.7 |
| | 14,973 |
|
| Benihana, Inc. | One stop | | P + 4.75% | | 7.92% | | 07/2018 | | 1,628 |
| | 1,599 |
| | 0.2 |
| | 1,585 |
|
C. J. Foods, Inc.* | One stop | | L + 5.00% | | 6.00% | | 05/2019 | | 3,141 |
| | 3,116 |
| | 0.4 |
| | 3,141 |
|
| C. J. Foods, Inc. | One stop | | L + 5.00% | | 6.00% | | 05/2019 | | 663 |
| | 656 |
| | 0.1 |
| | 663 |
|
C. J. Foods, Inc.(4) | One stop | | L + 5.00% | | N/A(5) | | 05/2019 | | — |
| | (5 | ) | | — |
| | — |
|
Firebirds International, LLC* | One stop | | L + 5.75% | | 7.00% | | 05/2018 | | 1,074 |
| | 1,067 |
| | 0.1 |
| | 1,074 |
|
|
| | | | | | | | | | | | | | | | | | | | | | | |
| | Investment Type | | Spread Above Index(1) | | Interest Rate(2) | | Maturity Date | | Principal ($) / Shares(3) | | Amortized Cost | | Percentage of Net Assets | | Fair
Value (4) |
| Investments | | | | | | | | | | |
| | |
| | |
| | |
|
| Non-controlled/non-affiliate company investments | | | | | | | | | | |
| | |
| | |
| | |
|
| Debt investments | | | | | | | | | | |
| | |
| | |
| | |
|
| Aerospace and Defense | | | | | | | | | | |
| | |
| | |
| | |
|
| ILC Dover, LP | Senior loan | | L + 4.75% | (c) | | 7.14% | | 12/2023 | | $ | 9,928 |
| | $ | 9,841 |
| | 1.0 |
| % | $ | 9,928 |
|
| NTS Technical Systems*^ | One stop | | L + 6.25% | (a) | | 8.36% | | 06/2021 | | 21,718 |
| | 21,508 |
| | 2.2 |
| | 21,718 |
|
NTS Technical Systems(5) | One stop | | L + 6.25% | | | N/A(6) | | 06/2021 | | — |
| | (53 | ) | | — |
| | — |
|
Tresys Technology Holdings, Inc.(7) | One stop | | L + 6.75% | (a) | | 8.99% | | 12/2018 | | 3,899 |
| | 3,845 |
| | 0.1 |
| | 780 |
|
Tresys Technology Holdings, Inc.(7) | One stop | | L + 6.75% | (a) | | 8.99% | | 12/2018 | | 659 |
| | 658 |
| | 0.1 |
| | 659 |
|
| Tronair Parent, Inc.^ | Senior loan | | L + 4.75% | (c) | | 7.56% | | 09/2023 | | 366 |
| | 363 |
| | 0.1 |
| | 366 |
|
| Tronair Parent, Inc. | Senior loan | | L + 4.50% | (a)(b)(c)(f) | | 7.03% | | 09/2021 | | 80 |
| | 79 |
| | — |
| | 80 |
|
| Whitcraft LLC*^ | One stop | | L + 6.25% | (c) | | 8.64% | | 04/2023 | | 12,439 |
| | 12,298 |
| | 1.3 |
| | 12,439 |
|
| Whitcraft LLC^ | One stop | | L + 6.25% | (c) | | 8.64% | | 04/2023 | | 194 |
| | 192 |
| | — |
| | 194 |
|
Whitcraft LLC(5) | One stop | | L + 6.25% | | | N/A(6) | | 04/2023 | | — |
| | (1 | ) | | — |
| | — |
|
Whitcraft LLC(5) | One stop | | L + 6.25% | | | N/A(6) | | 04/2023 | | — |
| | (2 | ) | | — |
| | — |
|
| | | | | | | | | | | 49,283 |
| | 48,728 |
| | 4.8 |
| | 46,164 |
|
| Automobile | | | | | | | | | | |
| | |
| | |
| | |
|
| Dent Wizard International Corporation* | Senior loan | | L + 4.00% | (a) | | 6.23% | | 04/2020 | | 4,477 |
| | 4,463 |
| | 0.5 |
| | 4,477 |
|
| Grease Monkey International, LLC*^ | Senior loan | | L + 5.00% | (a) | | 7.24% | | 11/2022 | | 4,863 |
| | 4,813 |
| | 0.5 |
| | 4,808 |
|
| Grease Monkey International, LLC | Senior loan | | L + 5.00% | (a) | | 7.24% | | 11/2022 | | 76 |
| | 75 |
| | — |
| | 75 |
|
| Grease Monkey International, LLC | Senior loan | | L + 5.00% | (a) | | 7.24% | | 11/2022 | | 27 |
| | 25 |
| | — |
| | 25 |
|
| Grease Monkey International, LLC | Senior loan | | L + 5.00% | (a) | | 7.24% | | 11/2022 | | 21 |
| | 20 |
| | — |
| | 20 |
|
Grease Monkey International, LLC(5) | Senior loan | | L + 5.00% | | | N/A(6) | | 11/2022 | | — |
| | (2 | ) | | — |
| | (2 | ) |
| Quick Quack Car Wash Holdings, LLC | One stop | | L + 6.50% | (a) | | 8.74% | | 04/2023 | | 8,751 |
| | 8,652 |
| | 0.9 |
| | 8,751 |
|
| Quick Quack Car Wash Holdings, LLC | One stop | | L + 6.50% | (a) | | 8.67% | | 04/2023 | | 150 |
| | 148 |
| | — |
| | 150 |
|
| Quick Quack Car Wash Holdings, LLC | One stop | | L + 6.50% | (a) | | 8.70% | | 04/2023 | | 40 |
| | 39 |
| | — |
| | 40 |
|
Quick Quack Car Wash Holdings, LLC(5) | One stop | | L + 6.50% | | | N/A(6) | | 04/2023 | | — |
| | (4 | ) | | — |
| | — |
|
| | | | | | | | | | | 18,405 |
| | 18,229 |
| | 1.9 |
| | 18,344 |
|
| Beverage, Food and Tobacco | | | | | | | | | | |
| | |
| | |
| | |
|
| Abita Brewing Co., L.L.C. | One stop | | L + 5.75% | (a) | | 7.99% | | 04/2021 | | 6,998 |
| | 6,926 |
| | 0.7 |
| | 6,998 |
|
| Abita Brewing Co., L.L.C. | One stop | | L + 5.75% | | | N/A(6) | | 04/2021 | | — |
| | — |
| | — |
| | — |
|
| C. J. Foods, Inc.*^ | One stop | | L + 6.25% | (c) | | 8.64% | | 05/2020 | | 8,582 |
| | 8,528 |
| | 0.9 |
| | 8,582 |
|
| C. J. Foods, Inc.^ | One stop | | L + 6.25% | (c) | | 8.64% | | 05/2020 | | 649 |
| | 647 |
| | 0.1 |
| | 649 |
|
| C. J. Foods, Inc. | One stop | | L + 6.25% | (c) | | 8.58% | | 05/2020 | | 517 |
| | 514 |
| | 0.1 |
| | 517 |
|
| Cafe Rio Holding, Inc.*^ | One stop | | L + 5.75% | (a) | | 7.99% | | 09/2023 | | 10,370 |
| | 10,220 |
| | 1.1 |
| | 10,370 |
|
| Cafe Rio Holding, Inc. | One stop | | L + 5.75% | (a) | | 7.99% | | 09/2023 | | 80 |
| | 79 |
| | — |
| | 80 |
|
| Cafe Rio Holding, Inc. | One stop | | L + 5.75% | (a) | | 7.99% | | 09/2023 | | 40 |
| | 37 |
| | — |
| | 40 |
|
| Cafe Rio Holding, Inc. | One stop | | P + 4.75% | (f) | | 10.00% | | 09/2023 | | 10 |
| | 8 |
| | — |
| | 10 |
|
| Fintech Midco, LLC | One stop | | L + 6.00% | (a) | | 8.25% | | 08/2024 | | 12,995 |
| | 12,868 |
| | 1.3 |
| | 12,865 |
|
Fintech Midco, LLC(5) | One stop | | L + 6.00% | | | N/A(6) | | 08/2024 | | — |
| | (1 | ) | | — |
| | (1 | ) |
Fintech Midco, LLC(5) | One stop | | L + 6.00% | | | N/A(6) | | 08/2024 | | — |
| | (2 | ) | | — |
| | (3 | ) |
| Firebirds International, LLC* | One stop | | L + 5.75% | (a) | | 7.89% | | 12/2018 | | 1,049 |
| | 1,048 |
| | 0.1 |
| | 1,049 |
|
| Firebirds International, LLC* | One stop | | L + 5.75% | (a) | | 7.89% | | 12/2018 | | 295 |
| | 295 |
| | — |
| | 295 |
|
| Firebirds International, LLC^ | One stop | | L + 5.75% | (a) | | 7.89% | | 12/2018 | | 95 |
| | 95 |
| | — |
| | 95 |
|
| Firebirds International, LLC | One stop | | L + 5.75% | (c) | | 7.99% | | 12/2018 | | 41 |
| | 41 |
| | — |
| | 41 |
|
| Firebirds International, LLC | One stop | | L + 5.75% | | | N/A(6) | | 12/2018 | | — |
| | — |
| | — |
| | — |
|
| Flavor Producers, LLC | Senior loan | | L + 4.75% | (c) | | 7.13% | | 12/2023 | | 2,155 |
| | 2,127 |
| | 0.2 |
| | 2,155 |
|
Flavor Producers, LLC(5) | Senior loan | | L + 4.75% | | | N/A(6) | | 12/2022 | | — |
| | (1 | ) | | — |
| | — |
|
See Notes to Consolidated Financial Statements.
91105
Golub Capital BDC, Inc. and Subsidiaries
Consolidated Schedule of Investments - (continued)
September 30, 2018
(In thousands)
|
| | | | | | | | | | | | | | | | | | | | | | | |
| | Investment Type | | Spread Above Index(1) | | Interest Rate(2) | | Maturity Date | | Principal ($) / Shares(3) | | Amortized Cost | | Percentage of Net Assets | | Fair
Value (4) |
| Beverage, Food and Tobacco - (continued) | | | | | | | | | | | | | | | | |
| FWR Holding Corporation^ | One stop | | L + 5.75% | (a) | | 7.99% | | 08/2023 | | $ | 5,259 |
| | $ | 5,194 |
| | 0.6 |
| % | $ | 5,259 |
|
| FWR Holding Corporation | One stop | | L + 5.75% | (a) | | 7.99% | | 08/2023 | | 65 |
| | 64 |
| | — |
| | 65 |
|
| FWR Holding Corporation | One stop | | L + 5.75% | (a)(f) | | 8.80% | | 08/2023 | | 42 |
| | 41 |
| | — |
| | 42 |
|
FWR Holding Corporation(5) | One stop | | L + 5.75% | | | N/A(6) | | 08/2023 | | — |
| | (1 | ) | | — |
| | — |
|
| Global Franchise Group, LLC* | Senior loan | | L + 5.75% | (a) | | 7.99% | | 12/2019 | | 3,220 |
| | 3,203 |
| | 0.3 |
| | 3,220 |
|
| Global Franchise Group, LLC | Senior loan | | L + 5.75% | | | N/A(6) | | 12/2019 | | — |
| | — |
| | — |
| | — |
|
| Global ID Corporation* | One stop | | L + 6.50% | (c) | | 8.84% | | 11/2021 | | 5,144 |
| | 5,104 |
| | 0.5 |
| | 5,144 |
|
| Global ID Corporation | One stop | | L + 6.50% | (c) | | 8.84% | | 11/2021 | | 72 |
| | 71 |
| | — |
| | 72 |
|
| Global ID Corporation | One stop | | L + 6.50% | | | N/A(6) | | 11/2021 | | — |
| | — |
| | — |
| | — |
|
Global ID Corporation(5) | One stop | | L + 6.50% | | | N/A(6) | | 11/2021 | | — |
| | (1 | ) | | — |
| | — |
|
| Hopdoddy Holdings, LLC | One stop | | L + 9.50% | (c) | | 10.31% cash/1.50% PIK | | 08/2020 | | 1,307 |
| | 1,301 |
| | 0.1 |
| | 1,307 |
|
| Hopdoddy Holdings, LLC | One stop | | L + 9.50% | (c) | | 10.34% cash/1.50% PIK | | 08/2020 | | 47 |
| | 47 |
| | — |
| | 47 |
|
| Hopdoddy Holdings, LLC | One stop | | L + 9.50% | (c) | | 10.32% cash/1.50% PIK | | 08/2020 | | 3 |
| | 2 |
| | — |
| | 3 |
|
Mendocino Farms, LLC(5) | One stop | | L + 8.50% | | | N/A(6) | | 06/2023 | | — |
| | (2 | ) | | — |
| | — |
|
| Mid-America Pet Food, L.L.C.*^ | One stop | | L + 6.00% | (c) | | 8.39% | | 12/2021 | | 10,752 |
| | 10,664 |
| | 1.1 |
| | 10,752 |
|
Mid-America Pet Food, L.L.C.(5) | One stop | | L + 6.00% | | | N/A(6) | | 12/2021 | | — |
| | (1 | ) | | — |
| | — |
|
| NBC Intermediate, LLC^ | Senior loan | | L + 4.25% | (a) | | 6.50% | | 09/2023 | | 2,079 |
| | 2,061 |
| | 0.2 |
| | 2,058 |
|
| NBC Intermediate, LLC * | Senior loan | | L + 4.25% | (a) | | 6.50% | | 09/2023 | | 1,097 |
| | 1,086 |
| | 0.1 |
| | 1,086 |
|
| NBC Intermediate, LLC | Senior loan | | P + 3.25% | (f) | | 8.50% | | 09/2023 | | 5 |
| | 4 |
| | — |
| | 4 |
|
| Purfoods, LLC | One stop | | L + 6.00% | (c) | | 8.31% | | 05/2021 | | 8,379 |
| | 8,270 |
| | 0.9 |
| | 8,379 |
|
| Purfoods, LLC | One stop | | N/A | | | 7.00% PIK | | 05/2026 | | 116 |
| | 116 |
| | — |
| | 116 |
|
| Purfoods, LLC | One stop | | L + 6.00% | (a) | | 8.15% | | 05/2021 | | 65 |
| | 64 |
| | — |
| | 65 |
|
| Purfoods, LLC^ | One stop | | L + 6.00% | (c) | | 8.39% | | 05/2021 | | 39 |
| | 39 |
| | — |
| | 39 |
|
| Purfoods, LLC | One stop | | L + 6.00% | (c) | | 8.39% | | 05/2021 | | 30 |
| | 30 |
| | — |
| | 30 |
|
| Purfoods, LLC | One stop | | L + 6.00% | (c) | | 8.39% | | 05/2021 | | 30 |
| | 30 |
| | — |
| | 30 |
|
| Purfoods, LLC | One stop | | L + 6.00% | (c) | | 8.33% | | 05/2021 | | 30 |
| | 30 |
| | — |
| | 30 |
|
| Purfoods, LLC^ | One stop | | L + 6.00% | (c) | | 8.39% | | 05/2021 | | 24 |
| | 23 |
| | — |
| | 24 |
|
| Purfoods, LLC^ | One stop | | L + 6.00% | (c) | | 8.39% | | 05/2021 | | 15 |
| | 15 |
| | — |
| | 15 |
|
| Purfoods, LLC^ | One stop | | L + 6.00% | (c) | | 8.39% | | 05/2021 | | 15 |
| | 15 |
| | — |
| | 15 |
|
| Purfoods, LLC^ | One stop | | L + 6.00% | (c) | | 8.39% | | 05/2021 | | 14 |
| | 14 |
| | — |
| | 14 |
|
| Purfoods, LLC^ | One stop | | L + 6.00% | (c) | | 8.39% | | 05/2021 | | 11 |
| | 11 |
| | — |
| | 11 |
|
| Purfoods, LLC^ | One stop | | L + 6.00% | (c) | | 8.39% | | 05/2021 | | 11 |
| | 11 |
| | — |
| | 11 |
|
| Purfoods, LLC^ | One stop | | L + 6.00% | (c) | | 8.39% | | 05/2021 | | 10 |
| | 10 |
| | — |
| | 10 |
|
Purfoods, LLC(5) | One stop | | L + 6.00% | | | N/A(6) | | 05/2021 | | — |
| | (1 | ) | | — |
| | — |
|
| Rubio's Restaurants, Inc.*^ | Senior loan | | L + 5.25% | (c) | | 7.64% | | 10/2019 | | 11,173 |
| | 11,000 |
| | 1.2 |
| | 11,173 |
|
Uinta Brewing Company^(7) | One stop | | L + 8.50% | (a) | | 10.74% | | 08/2019 | | 3,725 |
| | 3,716 |
| | 0.3 |
| | 2,459 |
|
Uinta Brewing Company(7) | One stop | | L + 8.50% | (a) | | 10.74% | | 08/2019 | | 693 |
| | 691 |
| | 0.1 |
| | 444 |
|
| | | | | | | | | | | 97,348 |
| | 96,350 |
| | 9.9 |
| | 95,666 |
|
| Broadcasting and Entertainment | | | | | | | | | | |
| | |
| | | | |
|
| TouchTunes Interactive Networks, Inc.^ | Senior loan | | L + 4.75% | (a) | | 6.99% | | 05/2021 | | 1,447 |
| | 1,444 |
| | 0.1 |
| | 1,447 |
|
| | | | | | | | | | | | | | | | | |
| Buildings and Real Estate | | | | | | | | | | | | | | | | |
| Brooks Equipment Company, LLC*^ | One stop | | L + 5.00% | (c) | | 7.31% | | 08/2020 | | 21,096 |
| | 20,996 |
| | 2.2 |
| | 21,096 |
|
| Brooks Equipment Company, LLC* | One stop | | L + 5.00% | (b)(c) | | 7.28% | | 08/2020 | | 2,634 |
| | 2,623 |
| | 0.3 |
| | 2,634 |
|
Brooks Equipment Company, LLC(5) | One stop | | L + 5.00% | | | N/A(6) | | 08/2020 | | — |
| | (6 | ) | | — |
| | — |
|
| Jensen Hughes, Inc. | Senior loan | | L + 4.50% | (a) | | 6.71% | | 03/2024 | | 500 |
| | 498 |
| | 0.1 |
| | 500 |
|
| Jensen Hughes, Inc. | Senior loan | | L + 4.50% | (a) | | 6.74% | | 03/2024 | | 153 |
| | 151 |
| | — |
| | 153 |
|
See Notes to Consolidated Financial Statements.
106
Golub Capital BDC, Inc. and Subsidiaries
Consolidated Schedule of Investments - (continued)
September 30, 2018
(In thousands)
|
| | | | | | | | | | | | | | | | | | | | | | | |
| | Investment Type | | Spread Above Index(1) | | Interest Rate(2) | | Maturity Date | | Principal ($) / Shares(3) | | Amortized Cost | | Percentage of Net Assets | | Fair
Value (4) |
| Buildings and Real Estate - (continued) | | | | | | | | | | | | | | | | |
| Jensen Hughes, Inc. | Senior loan | | L + 4.50% | (a) | | 6.65% | | 03/2024 | | $ | 29 |
| | $ | 29 |
| | — |
| % | $ | 29 |
|
| MRI Software LLC^ | One stop | | L + 5.50% | (c) | | 7.89% | | 06/2023 | | 23,684 |
| | 23,156 |
| | 2.4 |
| | 23,684 |
|
| MRI Software LLC*^ | One stop | | L + 5.50% | (c) | | 7.89% | | 06/2023 | | 13,744 |
| | 13,614 |
| | 1.4 |
| | 13,744 |
|
| MRI Software LLC^ | One stop | | L + 5.50% | (c) | | 7.89% | | 06/2023 | | 357 |
| | 354 |
| | 0.1 |
| | 357 |
|
| MRI Software LLC | One stop | | L + 5.50% | (c) | | 7.89% | | 06/2023 | | 295 |
| | 292 |
| | — |
| | 295 |
|
| MRI Software LLC | One stop | | L + 5.50% | (c) | | 7.89% | | 06/2023 | | 194 |
| | 192 |
| | — |
| | 194 |
|
| MRI Software LLC^ | One stop | | L + 5.50% | (a) | | 7.65% | | 06/2023 | | 165 |
| | 163 |
| | — |
| | 165 |
|
| MRI Software LLC | One stop | | L + 5.50% | (a) | | 7.67% | | 06/2023 | | 35 |
| | 32 |
| | — |
| | 35 |
|
MRI Software LLC(5) | One stop | | L + 5.50% | | | N/A(6) | | 06/2023 | | — |
| | (6 | ) | | — |
| | — |
|
| | | | | | | | | | | 62,886 |
| | 62,088 |
| | 6.5 |
| | 62,886 |
|
| Chemicals, Plastics and Rubber | | | | | | | | | | |
| | |
| | |
| | |
|
| Flexan, LLC* | One stop | | L + 5.75% | (c) | | 8.14% | | 02/2020 | | 2,310 |
| | 2,296 |
| | 0.3 |
| | 2,310 |
|
| Flexan, LLC^ | One stop | | L + 5.75% | (c) | | 8.14% | | 02/2020 | | 1,086 |
| | 1,081 |
| | 0.1 |
| | 1,086 |
|
| Flexan, LLC | One stop | | P + 4.50% | (f) | | 9.75% | | 02/2020 | | 11 |
| | 11 |
| | — |
| | 11 |
|
| Inhance Technologies Holdings LLC | One stop | | L + 5.25% | (b) | | 7.43% | | 07/2024 | | 6,880 |
| | 6,731 |
| | 0.7 |
| | 6,811 |
|
Inhance Technologies Holdings LLC(5) | One stop | | L + 5.25% | | | N/A(6) | | 07/2024 | | — |
| | (1 | ) | | — |
| | (1 | ) |
Inhance Technologies Holdings LLC(5) | One stop | | L + 5.25% | | | N/A(6) | | 07/2024 | | — |
| | (1 | ) | | — |
| | (2 | ) |
| | | | | | | | | | | 10,287 |
| | 10,117 |
| | 1.1 |
| | 10,215 |
|
| Diversified/Conglomerate Manufacturing | | | | | | | | | | |
| | |
| | |
| | |
|
| Chase Industries, Inc. | Senior loan | | L + 4.00% | (c) | | 6.34% | | 05/2025 | | 6,870 |
| | 6,756 |
| | 0.7 |
| | 6,870 |
|
| Chase Industries, Inc. | Senior loan | | L + 4.00% | (c) | | 6.34% | | 05/2023 | | 16 |
| | 14 |
| | — |
| | 16 |
|
| Chase Industries, Inc. | Senior loan | | L + 4.00% | (c) | | 6.38% | | 05/2025 | | 12 |
| | 8 |
| | — |
| | 12 |
|
| Inventus Power, Inc.*^ | One stop | | L + 6.50% | (a) | | 8.74% | | 04/2020 | | 7,285 |
| | 7,266 |
| | 0.7 |
| | 6,557 |
|
| Inventus Power, Inc. | One stop | | L + 6.50% | (a)(c) | | 8.78% | | 04/2020 | | 271 |
| | 270 |
| | — |
| | 236 |
|
| Onicon Incorporated*^ | One stop | | L + 5.50% | (a)(c) | | 7.88% | | 04/2022 | | 17,916 |
| | 17,784 |
| | 1.9 |
| | 17,916 |
|
Onicon Incorporated(5) | One stop | | L + 5.50% | | | N/A(6) | | 04/2022 | | — |
| | (3 | ) | | — |
| | — |
|
| Pasternack Enterprises, Inc. and Fairview Microwave, Inc | Senior loan | | L + 4.00% | (a)(f) | | 6.24% | | 07/2025 | | 5,634 |
| | 5,607 |
| | 0.6 |
| | 5,606 |
|
| Pasternack Enterprises, Inc. and Fairview Microwave, Inc | Senior loan | | L + 4.00% | | | N/A(6) | | 07/2023 | | — |
| | — |
| | — |
| | — |
|
| PetroChoice Holdings, Inc.^ | Senior loan | | L + 5.00% | (b) | | 7.20% | | 08/2022 | | 1,732 |
| | 1,700 |
| | 0.2 |
| | 1,732 |
|
| Plex Systems, Inc.*^ | One stop | | L + 7.50% | (a) | | 9.82% | | 06/2020 | | 18,797 |
| | 18,635 |
| | 1.9 |
| | 18,797 |
|
Plex Systems, Inc.(5) | One stop | | L + 7.50% | | | N/A(6) | | 06/2020 | | — |
| | (14 | ) | | — |
| | — |
|
| Reladyne, Inc.*^ | Senior loan | | L + 5.00% | (c) | | 7.34% | | 07/2022 | | 16,878 |
| | 16,691 |
| | 1.7 |
| | 16,878 |
|
| Reladyne, Inc.^ | Senior loan | | L + 5.00% | (c) | | 7.34% | | 07/2022 | | 173 |
| | 171 |
| | — |
| | 173 |
|
| Reladyne, Inc. | Senior loan | | L + 5.00% | (c) | | 7.34% | | 07/2022 | | 142 |
| | 141 |
| | — |
| | 142 |
|
Reladyne, Inc.(5) | Senior loan | | L + 5.00% | | | N/A(6) | | 07/2022 | | — |
| | (3 | ) | | — |
| | — |
|
| Source Refrigeration & HVAC, Inc.* | Senior loan | | L + 4.75% | (c) | | 7.14% | | 04/2023 | | 9,453 |
| | 9,352 |
| | 1.0 |
| | 9,453 |
|
| Source Refrigeration & HVAC, Inc. | Senior loan | | L + 4.75% | (c) | | 7.10% | | 04/2023 | | 111 |
| | 110 |
| | — |
| | 111 |
|
| Source Refrigeration & HVAC, Inc. | Senior loan | | P + 3.75% | (f) | | 9.00% | | 04/2023 | | 89 |
| | 86 |
| | — |
| | 89 |
|
| Source Refrigeration & HVAC, Inc. | Senior loan | | L + 4.75% | (c) | | 7.09% | | 04/2023 | | 57 |
| | 56 |
| | — |
| | 57 |
|
Source Refrigeration & HVAC, Inc.(5) | Senior loan | | L + 4.75% | | | N/A(6) | | 04/2023 | | — |
| | (2 | ) | | — |
| | — |
|
| Sunless Merger Sub, Inc. | Senior loan | | L + 5.00% | (a)(f) | | 7.28% | | 07/2019 | | 1,381 |
| | 1,384 |
| | 0.2 |
| | 1,381 |
|
| Sunless Merger Sub, Inc. | Senior loan | | P + 3.75% | (f) | | 8.75% | | 07/2019 | | 256 |
| | 256 |
| | — |
| | 256 |
|
| Togetherwork Holdings, LLC | One stop | | L + 6.50% | (a) | | 8.74% | | 03/2025 | | 9,158 |
| | 9,031 |
| | 0.9 |
| | 9,066 |
|
| Togetherwork Holdings, LLC | One stop | | L + 6.50% | (a) | | 8.74% | | 03/2025 | | 557 |
| | 549 |
| | 0.1 |
| | 552 |
|
| Togetherwork Holdings, LLC | One stop | | L + 6.50% | (a) | | 8.74% | | 03/2025 | | 116 |
| | 114 |
| | — |
| | 114 |
|
| Togetherwork Holdings, LLC | One stop | | L + 6.50% | (a) | | 8.74% | | 03/2025 | | 108 |
| | 106 |
| | — |
| | 107 |
|
See Notes to Consolidated Financial Statements.
107
Golub Capital BDC, Inc. and Subsidiaries
Consolidated Schedule of Investments - (continued)
September 30, 2018
(In thousands)
|
| | | | | | | | | | | | | | | | | | | | | | | |
| | Investment Type | | Spread Above Index(1) | | Interest Rate(2) | | Maturity Date | | Principal ($) / Shares(3) | | Amortized Cost | | Percentage of Net Assets | | Fair
Value (4) |
| Diversified/Conglomerate Manufacturing - (continued) | | | | | | | | | | | | | | | |
Togetherwork Holdings, LLC(5) | One stop | | L + 6.50% | | | N/A(6) | | 03/2024 | | $ | — |
| | $ | (1 | ) | | — |
| % | $ | (1 | ) |
Togetherwork Holdings, LLC(5) | One stop | | L + 6.50% | | | N/A(6) | | 03/2025 | | — |
| | (2 | ) | | — |
| | (1 | ) |
Togetherwork Holdings, LLC(5) | One stop | | L + 6.50% | | | N/A(6) | | 03/2025 | | — |
| | (3 | ) | | — |
| | (2 | ) |
| | | | | | | | | | | 97,012 |
| | 96,059 |
| | 9.9 |
| | 96,117 |
|
| Diversified/Conglomerate Service | | | | | | | | | | |
| | |
| | |
| | |
|
| Accela, Inc. | One stop | | L + 6.00% | (c) | | 8.39% | | 09/2023 | | 5,261 |
| | 5,193 |
| | 0.5 |
| | 5,261 |
|
Accela, Inc.(5) | One stop | | L + 6.00% | | | N/A(6) | | 09/2023 | | — |
| | (1 | ) | | — |
| | — |
|
| Agility Recovery Solutions Inc.*^ | One stop | | L + 6.50% | (a) | | 8.74% | | 03/2020 | | 13,809 |
| | 13,750 |
| | 1.4 |
| | 13,809 |
|
Agility Recovery Solutions Inc.(5) | One stop | | L + 6.50% | | | N/A(6) | | 03/2020 | | — |
| | (3 | ) | | — |
| | — |
|
| Anaqua, Inc.*^ | One stop | | L + 6.50% | (c) | | 8.85% | | 07/2022 | | 6,948 |
| | 6,867 |
| | 0.7 |
| | 6,948 |
|
Anaqua, Inc.(5) | One stop | | L + 6.50% | | | N/A(6) | | 07/2022 | | — |
| | (1 | ) | | — |
| | — |
|
| Apttus Corporation | One stop | | L + 7.85% | (e) | | 10.06% | | 01/2023 | | 4,127 |
| | 3,969 |
| | 0.4 |
| | 4,312 |
|
| Bazaarvoice, Inc. | One stop | | L + 8.00% | (a) | | 10.24% | | 02/2024 | | 8,958 |
| | 8,799 |
| | 0.9 |
| | 8,958 |
|
| Bazaarvoice, Inc. | One stop | | P + 7.00% | (f) | | 12.25% | | 02/2024 | | 30 |
| | 28 |
| | — |
| | 30 |
|
| Browz LLC | One stop | | L + 9.50% | (b) | | 10.17% cash/1.50% PIK | | 03/2023 | | 1,503 |
| | 1,473 |
| | 0.2 |
| | 1,503 |
|
| Browz LLC | One stop | | L + 9.50% | | | N/A(6) | | 03/2023 | | — |
| | — |
| | — |
| | — |
|
| Centrify Corporation* | One stop | | L + 6.25% | (c) | | 8.59% | | 08/2024 | | 10,974 |
| | 10,813 |
| | 1.1 |
| | 10,864 |
|
Centrify Corporation(5) | One stop | | L + 6.25% | | | N/A(6) | | 08/2024 | | — |
| | (2 | ) | | — |
| | (2 | ) |
| Clearwater Analytics, LLC*^ | One stop | | L + 5.00% | (a) | | 7.24% | | 09/2022 | | 8,532 |
| | 8,319 |
| | 0.9 |
| | 8,532 |
|
Clearwater Analytics, LLC(5) | One stop | | L + 5.00% | | | N/A(6) | | 09/2022 | | — |
| | (2 | ) | | — |
| | — |
|
| Cloudbees, Inc. | One stop | | L + 9.00% | (a) | | 10.61% cash/0.50% PIK | | 05/2023 | | 1,898 |
| | 1,841 |
| | 0.2 |
| | 1,870 |
|
| Cloudbees, Inc. | One stop | | L + 9.00% | | | N/A(6) | | 05/2023 | | — |
| | — |
| | — |
| | — |
|
| Confluence Technologies, Inc. | One stop | | L + 7.50% | (a) | | 9.65% | | 03/2024 | | 7,033 |
| | 6,889 |
| | 0.7 |
| | 7,033 |
|
| Confluence Technologies, Inc. | One stop | | P + 6.50% | (a)(f) | | 10.96% | | 03/2024 | | 16 |
| | 15 |
| | — |
| | 16 |
|
| Connexin Software, Inc. | One stop | | L + 8.50% | (a) | | 10.74% | | 02/2024 | | 2,401 |
| | 2,348 |
| | 0.3 |
| | 2,401 |
|
| Connexin Software, Inc. | One stop | | L + 8.50% | | | N/A(6) | | 02/2024 | | — |
| | — |
| | — |
| | — |
|
| Datto, Inc.* | One stop | | L + 8.00% | (a) | | 10.15% | | 12/2022 | | 11,156 |
| | 10,969 |
| | 1.2 |
| | 11,156 |
|
Datto, Inc.(5) | One stop | | L + 8.00% | | | N/A(6) | | 12/2022 | | — |
| | (1 | ) | | — |
| | — |
|
| Daxko Acquisition Corporation*^ | One stop | | L + 5.25% | (b) | | 7.54% | | 09/2023 | | 11,246 |
| | 11,014 |
| | 1.2 |
| | 11,246 |
|
Daxko Acquisition Corporation(5) | One stop | | L + 5.25% | | | N/A(6) | | 09/2023 | | — |
| | (1 | ) | | — |
| | — |
|
| Digital Guardian, Inc. | One stop | | L + 9.00% | (c) | | 10.33% cash/1.00% PIK | | 06/2023 | | 3,999 |
| | 3,952 |
| | 0.4 |
| | 3,999 |
|
| Digital Guardian, Inc. | Subordinated debt | | N/A | | | 8.00% PIK | | 01/2019 | | 184 |
| | 184 |
| | — |
| | 184 |
|
Digital Guardian, Inc.(5) | One stop | | L + 6.00% | | | N/A(6) | | 06/2023 | | — |
| | — |
| | — |
| | (2 | ) |
| Digital Guardian, Inc. | One stop | | L + 9.00% | | | N/A(6) | | 06/2023 | | — |
| | — |
| | — |
| | — |
|
| DISA Holdings Acquisition Subsidiary Corp.* | Senior loan | | L + 4.00% | (a)(f) | | 6.10% | | 06/2022 | | 2,006 |
| | 1,997 |
| | 0.2 |
| | 2,006 |
|
| DISA Holdings Acquisition Subsidiary Corp. | Senior loan | | L + 4.00% | (a) | | 6.10% | | 06/2022 | | 2 |
| | 2 |
| | — |
| | 2 |
|
DISA Holdings Acquisition Subsidiary Corp.(5) | Senior loan | | L + 4.00% | | | N/A(6) | | 06/2022 | | — |
| | (1 | ) | | — |
| | — |
|
| EGD Security Systems, LLC | One stop | | L + 6.25% | (c) | | 8.58% | | 06/2022 | | 11,114 |
| | 10,960 |
| | 1.1 |
| | 11,114 |
|
| EGD Security Systems, LLC^ | One stop | | L + 6.25% | (c) | | 8.56% | | 06/2022 | | 98 |
| | 97 |
| | — |
| | 98 |
|
| EGD Security Systems, LLC | One stop | | L + 6.25% | (c) | | 8.58% | | 06/2022 | | 75 |
| | 74 |
| | — |
| | 75 |
|
| EGD Security Systems, LLC^ | One stop | | L + 6.25% | (c) | | 8.59% | | 06/2022 | | 52 |
| | 52 |
| | — |
| | 52 |
|
| GS Acquisitionco, Inc. | One stop | | L + 5.00% | (a) | | 7.25% | | 05/2024 | | 22,840 |
| | 22,620 |
| | 2.3 |
| | 22,611 |
|
| GS Acquisitionco, Inc. | One stop | | L + 5.00% | (a) | | 7.25% | | 05/2024 | | 878 |
| | 870 |
| | 0.1 |
| | 869 |
|
GS Acquisitionco, Inc.(5) | One stop | | L + 4.75% | | | N/A(6) | | 05/2024 | | — |
| | (1 | ) | | — |
| | (1 | ) |
GS Acquisitionco, Inc.(5) | One stop | | L + 4.75% | | | N/A(6) | | 05/2024 | | — |
| | (5 | ) | | — |
| | (5 | ) |
| HealthcareSource HR, Inc.* | One stop | | L + 6.75% | (c) | | 9.14% | | 05/2020 | | 23,389 |
| | 23,203 |
| | 2.4 |
| | 23,389 |
|
HealthcareSource HR, Inc.(5) | One stop | | L + 6.75% | | | N/A(6) | | 05/2020 | | — |
| | (1 | ) | | — |
| | — |
|
See Notes to Consolidated Financial Statements.
108
Golub Capital BDC, Inc. and Subsidiaries
Consolidated Schedule of Investments - (continued)
September 30, 2018
(In thousands)
|
| | | | | | | | | | | | | | | | | | | | | | | |
| | Investment Type | | Spread Above Index(1) | | Interest Rate(2) | | Maturity Date | | Principal ($) / Shares(3) | | Amortized Cost | | Percentage of Net Assets | | Fair
Value (4) |
| Diversified/Conglomerate Service - (continued) | | | | | | | | | | | | | | | |
| Host Analytics, Inc. | One stop | | N/A | | | 8.50% cash/2.25% PIK | | 08/2021 | | $ | 3,169 |
| | $ | 3,131 |
| | 0.3 |
| % | $ | 3,169 |
|
| Host Analytics, Inc. | One stop | | N/A | | | 8.50% cash/2.25% PIK | | 08/2021 | | 2,656 |
| | 2,557 |
| | 0.3 |
| | 2,656 |
|
| Host Analytics, Inc. | One stop | | N/A | | | 8.50% cash/2.25% PIK | | 08/2021 | | 741 |
| | 733 |
| | 0.1 |
| | 741 |
|
Host Analytics, Inc.(5) | One stop | | N/A | | | N/A(6) | | 08/2021 | | — |
| | (6 | ) | | — |
| | — |
|
| ICIMS, Inc. | One stop | | L + 6.50% | (c) | | 8.64% | | 09/2024 | | 5,412 |
| | 5,305 |
| | 0.5 |
| | 5,304 |
|
ICIMS, Inc.(5) | One stop | | L + 6.50% | | | N/A(6) | | 09/2024 | | — |
| | (1 | ) | | — |
| | (1 | ) |
| III US Holdings, LLC | One stop | | L + 6.50% | | | N/A(6) | | 09/2022 | | — |
| | — |
| | — |
| | — |
|
| Imprivata, Inc. | Senior loan | | L + 4.00% | (c) | | 6.39% | | 10/2023 | | 13,045 |
| | 12,907 |
| | 1.3 |
| | 13,045 |
|
Imprivata, Inc.(5) | Senior loan | | L + 4.00% | | | N/A(6) | | 10/2023 | | — |
| | (2 | ) | | — |
| | — |
|
| Infogix, Inc. | One stop | | L + 6.00% | (c) | | 8.39% | | 04/2024 | | 3,330 |
| | 3,315 |
| | 0.3 |
| | 3,330 |
|
| Infogix, Inc. | One stop | | P + 5.00% | (f) | | 10.25% | | 04/2024 | | 9 |
| | 9 |
| | — |
| | 9 |
|
| Integral Ad Science, Inc. | One stop | | L + 7.25% | (a) | | 8.25% cash/1.25% PIK | | 07/2024 | | 5,000 |
| | 4,904 |
| | 0.5 |
| | 4,900 |
|
Integral Ad Science, Inc.(5) | One stop | | L + 6.00% | | | N/A(6) | | 07/2023 | | — |
| | (1 | ) | | — |
| | (1 | ) |
| Integration Appliance, Inc.*^ | One stop | | L + 7.25% | (a) | | 9.36% | | 08/2023 | | 34,762 |
| | 34,381 |
| | 3.6 |
| | 34,415 |
|
Integration Appliance, Inc.(5) | One stop | | L + 7.25% | | | N/A(6) | | 08/2023 | | — |
| | (7 | ) | | — |
| | (9 | ) |
| JAMF Holdings, Inc. | One stop | | L + 8.00% | (c) | | 10.32% | | 11/2022 | | 4,550 |
| | 4,475 |
| | 0.5 |
| | 4,550 |
|
JAMF Holdings, Inc.(5) | One stop | | L + 8.00% | | | N/A(6) | | 11/2022 | | — |
| | (1 | ) | | — |
| | — |
|
| Jobvite, Inc. | One stop | | L + 8.00% | (a) | | 10.15% | | 07/2023 | | 2,048 |
| | 1,979 |
| | 0.2 |
| | 1,968 |
|
| Jobvite, Inc. | One stop | | L + 8.00% | | | N/A(6) | | 07/2023 | | — |
| | — |
| | — |
| | — |
|
Jobvite, Inc.(5) | One stop | | L + 8.00% | | | N/A(6) | | 07/2023 | | — |
| | — |
| | — |
| | (1 | ) |
| Kareo, Inc. | One stop | | L + 9.00% | (a) | | 11.24% | | 06/2022 | | 4,518 |
| | 4,348 |
| | 0.5 |
| | 4,518 |
|
| Kareo, Inc. | One stop | | L + 9.00% | (a) | | 11.24% | | 06/2022 | | 332 |
| | 327 |
| | — |
| | 332 |
|
| Kareo, Inc. | One stop | | L + 9.00% | | | N/A(6) | | 06/2022 | | — |
| | — |
| | — |
| | — |
|
| Maverick Bidco Inc.* | One stop | | L + 6.25% | (c) | | 8.64% | | 04/2023 | | 17,468 |
| | 17,195 |
| | 1.8 |
| | 17,468 |
|
| Maverick Bidco Inc. | One stop | | L + 6.25% | (c) | | 8.59% | | 04/2023 | | 167 |
| | 166 |
| | — |
| | 167 |
|
| Maverick Bidco Inc. | One stop | | L + 6.25% | (c) | | 8.60% | | 04/2023 | | 34 |
| | 32 |
| | — |
| | 34 |
|
Maverick Bidco Inc.(5) | One stop | | L + 6.25% | | | N/A(6) | | 04/2023 | | — |
| | (3 | ) | | — |
| | — |
|
| Ministry Brands, LLC | Senior loan | | L + 4.00% | (a) | | 6.24% | | 12/2022 | | 866 |
| | 862 |
| | 0.1 |
| | 866 |
|
| Ministry Brands, LLC | Senior loan | | L + 4.00% | (a) | | 6.24% | | 12/2022 | | 496 |
| | 493 |
| | 0.1 |
| | 496 |
|
| Ministry Brands, LLC | Senior loan | | L + 4.00% | (a) | | 6.24% | | 12/2022 | | 9 |
| | 9 |
| | — |
| | 9 |
|
| MMan Acquisition Co.^ | One stop | | L + 6.00% | (c) | | 8.34% | | 08/2023 | | 9,726 |
| | 9,608 |
| | 1.0 |
| | 9,531 |
|
| MMan Acquisition Co. | One stop | | L + 6.00% | (c) | | 8.34% | | 08/2023 | | 100 |
| | 99 |
| | — |
| | 98 |
|
| Net Health Acquisition Corp. | One stop | | L + 5.50% | (a) | | 7.74% | | 12/2023 | | 3,857 |
| | 3,823 |
| | 0.4 |
| | 3,857 |
|
| Net Health Acquisition Corp. | One stop | | L + 5.50% | (a) | | 7.74% | | 12/2023 | | 540 |
| | 536 |
| | 0.1 |
| | 540 |
|
Net Health Acquisition Corp.(5) | One stop | | L + 5.50% | | | N/A(6) | | 12/2023 | | — |
| | (1 | ) | | — |
| | — |
|
| Netsmart Technologies, Inc. | Senior loan | | L + 3.75% | (a) | | 5.99% | | 06/2025 | | 1,737 |
| | 1,725 |
| | 0.2 |
| | 1,750 |
|
Netsmart Technologies, Inc.(5) | Senior loan | | L + 4.75% | | | N/A(6) | | 04/2023 | | — |
| | (6 | ) | | — |
| | — |
|
| Nextech Systems, LLC | One stop | | L + 6.00% | (a) | | 8.24% | | 03/2024 | | 10,357 |
| | 10,322 |
| | 1.1 |
| | 10,357 |
|
| Nextech Systems, LLC | One stop | | L + 6.00% | | | N/A(6) | | 03/2024 | | — |
| | — |
| | — |
| | — |
|
| Nexus Brands Group, Inc. | One stop | | L + 6.00% | (c) | | 8.33% | | 11/2023 | | 5,750 |
| | 5,689 |
| | 0.6 |
| | 5,750 |
|
| Nexus Brands Group, Inc. | One stop | | L + 6.00% | (c) | | 8.39% | | 11/2023 | | 91 |
| | 90 |
| | — |
| | 91 |
|
Nexus Brands Group, Inc.(5) | One stop | | L + 6.00% | | | N/A(6) | | 11/2023 | | — |
| | (1 | ) | | — |
| | — |
|
Nexus Brands Group, Inc.(5) | One stop | | L + 6.00% | | | N/A(6) | | 11/2023 | | — |
| | (1 | ) | | — |
| | — |
|
| Personify, Inc. | One stop | | L + 5.75% | (c) | | 8.14% | | 09/2024 | | 5,349 |
| | 5,296 |
| | 0.5 |
| | 5,295 |
|
Personify, Inc.(5) | One stop | | L + 5.75% | | | N/A(6) | | 09/2024 | | — |
| | (1 | ) | | — |
| | (1 | ) |
| Property Brands, Inc. | One stop | | L + 6.00% | (a) | | 8.24% | | 01/2024 | | 10,872 |
| | 10,655 |
| | 1.1 |
| | 10,872 |
|
| Property Brands, Inc.^ | One stop | | L + 6.00% | (a) | | 8.24% | | 01/2024 | | 219 |
| | 216 |
| | — |
| | 219 |
|
See Notes to Consolidated Financial Statements.
109
Golub Capital BDC, Inc. and Subsidiaries
Consolidated Schedule of Investments - (continued)
September 30, 2018
(In thousands)
|
| | | | | | | | | | | | | | | | | | | | | | | |
| | Investment Type | | Spread Above Index(1) | | Interest Rate(2) | | Maturity Date | | Principal ($) / Shares(3) | | Amortized Cost | | Percentage of Net Assets | | Fair
Value (4) |
| Diversified/Conglomerate Service - (continued) | | | | | | | | | | | | | | | |
Property Brands, Inc.(5) | One stop | | L + 6.00% | | | N/A(6) | | 01/2024 | | $ | — |
| | $ | (1 | ) | | — |
| % | $ | — |
|
Property Brands, Inc.(5) | One stop | | L + 6.00% | | | N/A(6) | | 01/2024 | | — |
| | (1 | ) | | — |
| | — |
|
| Saba Software, Inc.*^ | Senior loan | | L + 4.50% | (a) | | 6.74% | | 05/2023 | | 22,515 |
| | 22,217 |
| | 2.3 |
| | 22,515 |
|
Saba Software, Inc.(5) | Senior loan | | L + 4.50% | | | N/A(6) | | 05/2023 | | — |
| | (2 | ) | | — |
| | — |
|
| Saldon Holdings, Inc.* | Senior loan | | L + 4.25% | (a) | | 6.41% | | 09/2022 | | 750 |
| | 741 |
| | 0.1 |
| | 746 |
|
| Saldon Holdings, Inc. * | Senior loan | | L + 4.25% | (a) | | 6.41% | | 09/2022 | | 716 |
| | 713 |
| | 0.1 |
| | 713 |
|
| Telesoft, LLC* | One stop | | L + 5.00% | (c) | | 7.34% | | 07/2022 | | 4,160 |
| | 4,129 |
| | 0.4 |
| | 4,160 |
|
Telesoft, LLC(5) | One stop | | L + 5.00% | | | N/A(6) | | 07/2022 | | — |
| | (1 | ) | | — |
| | — |
|
| Transaction Data Systems, Inc.* | One stop | | L + 5.25% | (a) | | 7.50% | | 06/2021 | | 39,051 |
| | 38,889 |
| | 4.0 |
| | 39,051 |
|
| Transaction Data Systems, Inc. | One stop | | L + 5.25% | (c) | | 7.64% | | 06/2021 | | 15 |
| | 14 |
| | — |
| | 15 |
|
| Trintech, Inc.*^ | One stop | | L + 6.00% | (b) | | 8.20% | | 12/2023 | | 10,875 |
| | 10,756 |
| | 1.1 |
| | 10,875 |
|
| Trintech, Inc.^ | One stop | | L + 6.00% | (b) | | 8.20% | | 12/2023 | | 3,412 |
| | 3,375 |
| | 0.4 |
| | 3,412 |
|
| Trintech, Inc. | One stop | | L + 6.00% | (b) | | 8.20% | | 12/2023 | | 30 |
| | 28 |
| | — |
| | 30 |
|
| True Commerce, Inc.^ | One stop | | L + 5.75% | (c) | | 8.14% | | 11/2023 | | 5,610 |
| | 5,550 |
| | 0.6 |
| | 5,610 |
|
True Commerce, Inc.(5) | One stop | | L + 5.75% | | | N/A(6) | | 11/2023 | | — |
| | (1 | ) | | — |
| | — |
|
| Upserve, Inc. | One stop | | L + 5.50% | (a) | | 7.65% | | 07/2023 | | 2,969 |
| | 2,948 |
| | 0.3 |
| | 2,947 |
|
| Upserve, Inc. | One stop | | L + 5.50% | | | N/A(6) | | 07/2023 | | — |
| | — |
| | — |
| | — |
|
Upserve, Inc.(5) | One stop | | L + 5.50% | | | N/A(6) | | 07/2023 | | — |
| | (1 | ) | | — |
| | (1 | ) |
| Valant Medical Solutions, Inc. | One stop | | L + 11.00% | (a) | | 10.88% cash/2.25% PIK | | 10/2020 | | 828 |
| | 775 |
| | 0.1 |
| | 828 |
|
| Valant Medical Solutions, Inc. | One stop | | N/A | | | 6.00% PIK | | 02/2020 | | 149 |
| | 149 |
| | — |
| | 184 |
|
| Valant Medical Solutions, Inc. | One stop | | L + 11.00% | (a) | | 10.88% cash/2.25% PIK | | 10/2020 | | 10 |
| | 10 |
| | — |
| | 10 |
|
| Velocity Technology Solutions, Inc. | One stop | | L + 6.00% | (c) | | 8.39% | | 12/2023 | | 8,228 |
| | 8,103 |
| | 0.9 |
| | 8,228 |
|
Velocity Technology Solutions, Inc.(5) | One stop | | L + 6.00% | | | N/A(6) | | 12/2023 | | — |
| | (1 | ) | | — |
| | — |
|
| Vendavo, Inc.* | One stop | | L + 8.50% | (c) | | 10.81% | | 10/2022 | | 28,936 |
| | 28,441 |
| | 3.0 |
| | 28,936 |
|
Vendavo, Inc.(5) | One stop | | L + 8.50% | | | N/A(6) | | 10/2022 | | — |
| | (9 | ) | | — |
| | — |
|
| Vendor Credentialing Service LLC^ | One stop | | L + 5.75% | (a) | | 7.99% | | 11/2021 | | 12,115 |
| | 11,949 |
| | 1.3 |
| | 12,115 |
|
| Vendor Credentialing Service LLC | One stop | | L + 5.75% | | | N/A(6) | | 11/2021 | | — |
| | — |
| | — |
| | — |
|
| Verisys Corporation* | One stop | | L + 7.75% | (c) | | 10.14% | | 01/2023 | | 3,886 |
| | 3,844 |
| | 0.4 |
| | 3,886 |
|
Verisys Corporation(5) | One stop | | L + 7.75% | | | N/A(6) | | 01/2023 | | — |
| | (1 | ) | | — |
| | — |
|
| Workforce Software, LLC^ | One stop | | L + 6.50% | (c) | | 8.83% | | 06/2021 | | 5,790 |
| | 5,756 |
| | 0.6 |
| | 5,790 |
|
| Workforce Software, LLC | One stop | | L + 6.50% | (c) | | 8.81% | | 06/2021 | | 577 |
| | 571 |
| | 0.1 |
| | 577 |
|
Workforce Software, LLC(5) | One stop | | L + 6.50% | | | N/A(6) | | 06/2021 | | — |
| | (1 | ) | | — |
| | — |
|
| | | | | | | | | | | 456,361 |
| | 450,374 |
| | 47.0 |
| | 455,279 |
|
| Ecological | | | | | | | | | | | | | | | | |
| Pace Analytical Services, LLC | One stop | | L + 6.25% | (a) | | 8.49% | | 09/2022 | | 15,190 |
| | 14,912 |
| | 1.6 |
| | 15,190 |
|
| Pace Analytical Services, LLC^ | One stop | | L + 6.25% | (a) | | 8.49% | | 09/2022 | | 1,412 |
| | 1,396 |
| | 0.1 |
| | 1,412 |
|
| Pace Analytical Services, LLC | One stop | | L + 6.25% | (a) | | 8.48% | | 09/2022 | | 716 |
| | 709 |
| | 0.1 |
| | 716 |
|
| Pace Analytical Services, LLC* | One stop | | L + 6.25% | (a) | | 8.49% | | 09/2022 | | 346 |
| | 342 |
| | — |
| | 346 |
|
| Pace Analytical Services, LLC^ | One stop | | L + 6.25% | (a) | | 8.47% | | 09/2022 | | 118 |
| | 117 |
| | — |
| | 118 |
|
| Pace Analytical Services, LLC | One stop | | L + 6.25% | (a) | | 8.49% | | 09/2022 | | 10 |
| | 8 |
| | — |
| | 10 |
|
Pace Analytical Services, LLC(5) | One stop | | L + 6.25% | | | N/A(6) | | 09/2022 | | — |
| | (3 | ) | | — |
| | — |
|
| WRE Holding Corp.* | Senior loan | | L + 4.75% | (a) | | 6.99% | | 01/2023 | | 1,008 |
| | 999 |
| | 0.1 |
| | 1,008 |
|
| WRE Holding Corp. | Senior loan | | L + 4.75% | (a) | | 6.99% | | 01/2023 | | 42 |
| | 42 |
| | — |
| | 42 |
|
| WRE Holding Corp. | Senior loan | | L + 4.75% | (a) | | 6.99% | | 01/2023 | | 21 |
| | 21 |
| | — |
| | 21 |
|
| WRE Holding Corp. | Senior loan | | L + 4.75% | (a) | | 6.99% | | 01/2023 | | 5 |
| | 5 |
| | — |
| | 5 |
|
| | | | | | | | | | | 18,868 |
| | 18,548 |
| | 1.9 |
| | 18,868 |
|
See Notes to Consolidated Financial Statements.
110
Golub Capital BDC, Inc. and Subsidiaries
Consolidated Schedule of Investments - (continued)
September 30, 2018
(In thousands)
|
| | | | | | | | | | | | | | | | | | | | | | | |
| | Investment Type | | Spread Above Index(1) | | Interest Rate(2) | | Maturity Date | | Principal ($) / Shares(3) | | Amortized Cost | | Percentage of Net Assets | | Fair
Value (4) |
| Electronics | | | | | | | | | | |
| | |
| | |
| | |
|
| Appriss Holdings, Inc.*^ | One stop | | L + 6.25% | (c) | | 8.64% | | 05/2022 | | $ | 36,397 |
| | $ | 36,016 |
| | 3.7 |
| % | $ | 36,034 |
|
Appriss Holdings, Inc.(5) | One stop | | L + 6.25% | | | N/A(6) | | 05/2022 | | — |
| | (33 | ) | | — |
| | (29 | ) |
| Compusearch Software Holdings, Inc.*^ | Senior loan | | L + 4.25% | (c) | | 6.64% | | 05/2021 | | 2,067 |
| | 2,065 |
| | 0.2 |
| | 2,067 |
|
| Diligent Corporation* | One stop | | L + 5.50% | (d) | | 8.09% | | 04/2022 | | 26,132 |
| | 25,856 |
| | 2.7 |
| | 26,132 |
|
| Diligent Corporation | One stop | | L + 5.50% | (d) | | 8.09% | | 04/2022 | | 4,879 |
| | 4,816 |
| | 0.5 |
| | 4,879 |
|
| Diligent Corporation* | One stop | | L + 5.50% | (d) | | 8.09% | | 04/2022 | | 4,790 |
| | 4,700 |
| | 0.5 |
| | 4,790 |
|
| Diligent Corporation*^ | One stop | | L + 5.50% | (d) | | 8.09% | | 04/2022 | | 2,622 |
| | 2,586 |
| | 0.3 |
| | 2,622 |
|
| Diligent Corporation | One stop | | L + 5.50% | (c) | | 7.98% | | 04/2022 | | 102 |
| | 101 |
| | — |
| | 102 |
|
| Diligent Corporation | One stop | | L + 5.50% | (c) | | 8.03% | | 04/2022 | | 81 |
| | 80 |
| | — |
| | 81 |
|
| Diligent Corporation | One stop | | L + 5.50% | (c)(d) | | 8.03% | | 04/2022 | | 36 |
| | 35 |
| | — |
| | 36 |
|
Diligent Corporation(5) | One stop | | L + 5.50% | | | N/A(6) | | 04/2022 | | — |
| | (1 | ) | | — |
| | — |
|
Diligent Corporation(5) | One stop | | L + 5.50% | | | N/A(6) | | 04/2022 | | — |
| | (2 | ) | | — |
| | — |
|
| Gamma Technologies, LLC*^ | One stop | | L + 5.50% | (a) | | 7.74% | | 06/2024 | | 21,478 |
| | 21,297 |
| | 2.2 |
| | 21,478 |
|
Gamma Technologies, LLC(5) | One stop | | L + 5.50% | | | N/A(6) | | 06/2024 | | — |
| | (1 | ) | | — |
| | — |
|
| SEI, Inc.* | Senior loan | | L + 5.25% | (a) | | 7.49% | | 07/2023 | | 5,477 |
| | 5,428 |
| | 0.6 |
| | 5,477 |
|
| Sloan Company, Inc., The | One stop | | L + 13.00% | (c) | | 10.89% cash/4.50% PIK | | 04/2020 | | 6,467 |
| | 6,426 |
| | 0.5 |
| | 5,173 |
|
| Sloan Company, Inc., The | One stop | | L + 13.00% | (c) | | 10.89% cash/4.50% PIK | | 04/2020 | | 432 |
| | 432 |
| | — |
| | 346 |
|
| Sloan Company, Inc., The | One stop | | L + 13.00% | (c) | | 10.89% cash/4.50% PIK | | 04/2020 | | 50 |
| | 50 |
| | — |
| | 40 |
|
| Sovos Compliance*^ | One stop | | L + 6.00% | (a) | | 8.24% | | 03/2022 | | 9,234 |
| | 9,125 |
| | 1.0 |
| | 9,234 |
|
| Sovos Compliance^ | One stop | | L + 6.00% | (a) | | 8.24% | | 03/2022 | | 1,553 |
| | 1,536 |
| | 0.2 |
| | 1,553 |
|
| Sovos Compliance | One stop | | L + 6.00% | (a) | | 8.24% | | 03/2022 | | 173 |
| | 172 |
| | — |
| | 173 |
|
Sovos Compliance(5) | One stop | | L + 6.00% | | | N/A(6) | | 03/2022 | | — |
| | (1 | ) | | — |
| | — |
|
Sovos Compliance(5) | One stop | | L + 6.00% | | | N/A(6) | | 03/2022 | | — |
| | (2 | ) | | — |
| | — |
|
| Watchfire Enterprises, Inc. | Second lien | | L + 8.00% | (c) | | 10.39% | | 10/2021 | | 9,435 |
| | 9,338 |
| | 1.0 |
| | 9,435 |
|
| | | | | | | | | | | 131,405 |
| | 130,019 |
| | 13.4 |
| | 129,623 |
|
| Grocery | | | | | | | | | | | | | | | | |
| MyWebGrocer, Inc.* | One stop | | L + 5.00% | (d) | | 7.52% | | 09/2018 | | 14,271 |
| | 14,271 |
| | 1.5 |
| | 14,271 |
|
| Teasdale Quality Foods, Inc. | Senior loan | | L + 4.75% | (c) | | 6.92% | | 10/2020 | | 324 |
| | 321 |
| | — |
| | 317 |
|
| | | | | | | | | | | 14,595 |
| | 14,592 |
| | 1.5 |
| | 14,588 |
|
| Healthcare, Education and Childcare | | | | | | | | | | |
| | |
| | |
| | |
|
| Active Day, Inc. | One stop | | L + 6.00% | (a) | | 8.24% | | 12/2021 | | 13,265 |
| | 13,071 |
| | 1.3 |
| | 13,000 |
|
| Active Day, Inc.^ | One stop | | L + 6.00% | (a) | | 8.24% | | 12/2021 | | 1,024 |
| | 1,014 |
| | 0.1 |
| | 1,003 |
|
| Active Day, Inc.* | One stop | | L + 6.00% | (a) | | 8.24% | | 12/2021 | | 660 |
| | 655 |
| | 0.1 |
| | 646 |
|
| Active Day, Inc.* | One stop | | L + 6.00% | (a) | | 8.24% | | 12/2021 | | 456 |
| | 451 |
| | 0.1 |
| | 447 |
|
| Active Day, Inc. | One stop | | P + 5.00% | (f) | | 10.25% | | 12/2021 | | 22 |
| | 21 |
| | — |
| | 20 |
|
| Acuity Eyecare Holdings, LLC | One stop | | L + 6.75% | (b) | | 9.01% | | 03/2022 | | 2,564 |
| | 2,519 |
| | 0.3 |
| | 2,538 |
|
| Acuity Eyecare Holdings, LLC | One stop | | L + 6.75% | (b) | | 9.04% | | 03/2022 | | 203 |
| | 180 |
| | — |
| | 185 |
|
| Acuity Eyecare Holdings, LLC^ | One stop | | L + 6.75% | (b) | | 9.02% | | 03/2022 | | 149 |
| | 148 |
| | — |
| | 148 |
|
| Acuity Eyecare Holdings, LLC | One stop | | P + 5.75% | (f) | | 11.00% | | 03/2022 | | 10 |
| | 10 |
| | — |
| | 9 |
|
| ADCS Clinics Intermediate Holdings, LLC | One stop | | L + 5.75% | (b) | | 8.04% | | 05/2022 | | 21,065 |
| | 20,641 |
| | 2.1 |
| | 20,644 |
|
| ADCS Clinics Intermediate Holdings, LLC* | One stop | | L + 5.75% | (b) | | 8.04% | | 05/2022 | | 107 |
| | 106 |
| | — |
| | 105 |
|
| ADCS Clinics Intermediate Holdings, LLC | One stop | | L + 5.75% | (b) | | 8.04% | | 05/2022 | | 83 |
| | 82 |
| | — |
| | 81 |
|
| ADCS Clinics Intermediate Holdings, LLC | One stop | | L + 5.75% | (b) | | 8.04% | | 05/2022 | | 50 |
| | 49 |
| | — |
| | 48 |
|
| ADCS Clinics Intermediate Holdings, LLC* | One stop | | L + 5.75% | (b) | | 8.04% | | 05/2022 | | 31 |
| | 31 |
| | — |
| | 31 |
|
| Agilitas USA, Inc. | One stop | | L + 6.00% | (c) | | 8.34% | | 04/2022 | | 8,354 |
| | 8,295 |
| | 0.9 |
| | 8,187 |
|
| Agilitas USA, Inc. | One stop | | L + 6.00% | (c) | | 8.34% | | 04/2022 | | 10 |
| | 9 |
| | — |
| | 8 |
|
Agilitas USA, Inc.(5) | One stop | | L + 6.00% | | | N/A(6) | | 04/2022 | | — |
| | (1 | ) | | — |
| | — |
|
See Notes to Consolidated Financial Statements.
111
Golub Capital BDC, Inc. and Subsidiaries
Consolidated Schedule of Investments - (continued)
September 30, 2018
(In thousands)
|
| | | | | | | | | | | | | | | | | | | | | | | |
| | Investment Type | | Spread Above Index(1) | | Interest Rate(2) | | Maturity Date | | Principal ($) / Shares(3) | | Amortized Cost | | Percentage of Net Assets | | Fair
Value (4) |
| Healthcare, Education and Childcare - (continued) | | | | | | | | | | | | | | | |
Aris Teleradiology Company, LLC*(7) | Senior loan | | L + 5.50% | (c) | | 8.00% | | 03/2021 | | $ | 2,693 |
| | $ | 2,678 |
| | 0.1 |
| % | $ | 1,236 |
|
Aris Teleradiology Company, LLC(7) | Senior loan | | L + 5.50% | (c)(d) | | 8.01% | | 03/2021 | | 141 |
| | 140 |
| | — |
| | 47 |
|
| Avalign Technologies, Inc.^ | Senior loan | | L + 4.50% | (a) | | 6.75% | | 07/2021 | | 1,343 |
| | 1,340 |
| | 0.1 |
| | 1,343 |
|
| BIORECLAMATIONIVT, LLC*^ | One stop | | L + 6.25% | (a) | | 8.49% | | 01/2021 | | 16,852 |
| | 16,718 |
| | 1.7 |
| | 16,852 |
|
| BIORECLAMATIONIVT, LLC | One stop | | P + 5.25% | (f) | | 10.50% | | 01/2021 | | 100 |
| | 99 |
| | — |
| | 100 |
|
| CLP Healthcare Services, Inc.^ | Senior loan | | L + 5.50% | (c) | | 7.89% | | 12/2020 | | 3,884 |
| | 3,858 |
| | 0.4 |
| | 3,807 |
|
| DCA Investment Holding, LLC*^ | One stop | | L + 5.25% | (c) | | 7.64% | | 07/2021 | | 18,584 |
| | 18,393 |
| | 1.9 |
| | 18,584 |
|
| DCA Investment Holding, LLC*^ | One stop | | L + 5.25% | (c) | | 7.64% | | 07/2021 | | 13,329 |
| | 13,249 |
| | 1.4 |
| | 13,329 |
|
| DCA Investment Holding, LLC | One stop | | L + 5.25% | (c) | | 7.64% | | 07/2021 | | 2,450 |
| | 2,422 |
| | 0.3 |
| | 2,450 |
|
| DCA Investment Holding, LLC | One stop | | L + 5.25% | (c) | | 7.64% | | 07/2021 | | 151 |
| | 150 |
| | — |
| | 151 |
|
| DCA Investment Holding, LLC | One stop | | L + 5.25% | (c) | | 7.64% | | 07/2021 | | 149 |
| | 147 |
| | — |
| | 149 |
|
| DCA Investment Holding, LLC | One stop | | L + 5.25% | (c) | | 7.64% | | 07/2021 | | 47 |
| | 47 |
| | — |
| | 47 |
|
DCA Investment Holding, LLC(5) | One stop | | L + 5.25% | | | N/A(6) | | 07/2021 | | — |
| | (7 | ) | | — |
| | — |
|
DCA Investment Holding, LLC(5) | One stop | | L + 5.25% | | | N/A(6) | | 07/2021 | | — |
| | (9 | ) | | — |
| | — |
|
| Deca Dental Management LLC*^ | One stop | | L + 6.25% | (c) | | 8.64% | | 07/2020 | | 4,062 |
| | 4,040 |
| | 0.4 |
| | 4,062 |
|
| Deca Dental Management LLC | One stop | | L + 6.25% | (a)(c) | | 8.57% | | 07/2020 | | 494 |
| | 492 |
| | 0.1 |
| | 494 |
|
| Deca Dental Management LLC | One stop | | L + 6.25% | (a) | | 8.49% | | 07/2020 | | 50 |
| | 50 |
| | — |
| | 50 |
|
Deca Dental Management LLC(5) | One stop | | L + 6.25% | | | N/A(6) | | 07/2020 | | — |
| | (1 | ) | | — |
| | — |
|
| Dental Holdings Corporation | One stop | | L + 5.50% | (d) | | 8.02% | | 02/2020 | | 7,142 |
| | 7,081 |
| | 0.7 |
| | 7,142 |
|
| Dental Holdings Corporation | One stop | | L + 5.50% | (d) | | 8.02% | | 02/2020 | | 1,133 |
| | 1,126 |
| | 0.1 |
| | 1,133 |
|
| Dental Holdings Corporation | One stop | | L + 5.50% | (b) | | 7.67% | | 02/2020 | | 220 |
| | 214 |
| | — |
| | 220 |
|
| Elite Dental Partners LLC* | One stop | | L + 5.25% | (a) | | 7.49% | | 06/2023 | | 12,274 |
| | 12,101 |
| | 1.3 |
| | 12,274 |
|
| Elite Dental Partners LLC | One stop | | L + 5.25% | (a) | | 7.49% | | 06/2023 | | 115 |
| | 101 |
| | — |
| | 115 |
|
Elite Dental Partners LLC(5) | One stop | | L + 5.25% | | | N/A(6) | | 06/2023 | | — |
| | (1 | ) | | — |
| | — |
|
| ERG Buyer, LLC | One stop | | L + 5.50% | (c) | | 7.89% | | 05/2024 | | 13,183 |
| | 12,996 |
| | 1.4 |
| | 13,183 |
|
ERG Buyer, LLC(5) | One stop | | L + 5.50% | | | N/A(6) | | 05/2024 | | — |
| | (2 | ) | | — |
| | — |
|
ERG Buyer, LLC(5) | One stop | | L + 5.50% | | | N/A(6) | | 05/2024 | | — |
| | (11 | ) | | — |
| | — |
|
| eSolutions, Inc.*^ | One stop | | L + 6.50% | (a) | | 8.74% | | 03/2022 | | 31,722 |
| | 31,340 |
| | 3.3 |
| | 31,484 |
|
eSolutions, Inc.(5) | One stop | | L + 6.50% | | | N/A(6) | | 03/2022 | | — |
| | (1 | ) | | — |
| | (1 | ) |
| Excelligence Learning Corporation^ | One stop | | L + 6.00% | (a) | | 8.24% | | 04/2023 | | 4,805 |
| | 4,768 |
| | 0.5 |
| | 4,517 |
|
| Eyecare Services Partners Holdings LLC | One stop | | L + 6.25% | (c) | | 8.64% | | 05/2023 | | 7,926 |
| | 7,758 |
| | 0.8 |
| | 7,926 |
|
| Eyecare Services Partners Holdings LLC | One stop | | L + 6.25% | (c) | | 8.64% | | 05/2023 | | 576 |
| | 566 |
| | 0.1 |
| | 576 |
|
| Eyecare Services Partners Holdings LLC | One stop | | L + 6.25% | (c) | | 8.64% | | 05/2023 | | 355 |
| | 353 |
| | 0.1 |
| | 355 |
|
| Eyecare Services Partners Holdings LLC | One stop | | L + 6.25% | (c) | | 8.64% | | 05/2023 | | 172 |
| | 171 |
| | — |
| | 172 |
|
| Eyecare Services Partners Holdings LLC | One stop | | L + 6.25% | (c) | | 8.59% | | 05/2023 | | 100 |
| | 100 |
| | — |
| | 100 |
|
| Eyecare Services Partners Holdings LLC | One stop | | L + 6.25% | (c) | | 8.64% | | 05/2023 | | 58 |
| | 57 |
| | — |
| | 58 |
|
| Eyecare Services Partners Holdings LLC | One stop | | L + 6.25% | (c) | | 8.64% | | 05/2023 | | 51 |
| | 50 |
| | — |
| | 51 |
|
| Eyecare Services Partners Holdings LLC | One stop | | L + 6.25% | (c) | | 8.64% | | 05/2023 | | 33 |
| | 28 |
| | — |
| | 33 |
|
| Eyecare Services Partners Holdings LLC | One stop | | L + 6.25% | (c) | | 8.64% | | 05/2023 | | 32 |
| | 25 |
| | — |
| | 32 |
|
| Eyecare Services Partners Holdings LLC | One stop | | L + 6.25% | (c) | | 8.63% | | 05/2023 | | 25 |
| | 22 |
| | — |
| | 25 |
|
| G & H Wire Company, Inc.^ | One stop | | L + 5.75% | (a) | | 7.99% | | 09/2023 | | 5,425 |
| | 5,367 |
| | 0.6 |
| | 5,425 |
|
G & H Wire Company, Inc.(5) | One stop | | L + 5.75% | | | N/A(6) | | 09/2022 | | — |
| | (1 | ) | | — |
| | — |
|
| Immucor, Inc. | Senior loan | | L + 5.00% | (c) | | 7.39% | | 06/2021 | | 1,597 |
| | 1,597 |
| | 0.2 |
| | 1,626 |
|
| Joerns Healthcare, LLC*^ | One stop | | L + 6.00% | (c) | | 8.31% | | 05/2020 | | 3,497 |
| | 3,476 |
| | 0.3 |
| | 3,253 |
|
| Katena Holdings, Inc.^ | One stop | | L + 6.00% | (c) | | 8.39% | | 06/2021 | | 8,523 |
| | 8,466 |
| | 0.9 |
| | 8,352 |
|
| Katena Holdings, Inc.^ | One stop | | L + 6.00% | (c) | | 8.39% | | 06/2021 | | 833 |
| | 827 |
| | 0.1 |
| | 816 |
|
| Katena Holdings, Inc. | One stop | | L + 6.00% | (c) | | 8.39% | | 06/2021 | | 568 |
| | 562 |
| | 0.1 |
| | 557 |
|
See Notes to Consolidated Financial Statements.
112
Golub Capital BDC, Inc. and Subsidiaries
Consolidated Schedule of Investments - (continued)
September 30, 2018
(In thousands)
|
| | | | | | | | | | | | | | | | | | | | | | | |
| | Investment Type | | Spread Above Index(1) | | Interest Rate(2) | | Maturity Date | | Principal ($) / Shares(3) | | Amortized Cost | | Percentage of Net Assets | | Fair
Value (4) |
| Healthcare, Education and Childcare - (continued) | | | | | | | | | | | | | | | |
Katena Holdings, Inc.(5) | One stop | | L + 6.00% | | | N/A(6) | | 06/2021 | | $ | — |
| | $ | (1 | ) | | — |
| % | $ | (2 | ) |
| Lombart Brothers, Inc.^ | One stop | | L + 6.75% | (c) | | 9.14% | | 04/2022 | | 5,041 |
| | 4,938 |
| | 0.5 |
| | 4,966 |
|
Lombart Brothers, Inc.^(8) | One stop | | L + 6.75% | (c) | | 9.14% | | 04/2022 | | 1,648 |
| | 1,620 |
| | 0.2 |
| | 1,623 |
|
| Lombart Brothers, Inc. | One stop | | P + 5.50% | (f) | | 10.75% | | 04/2022 | | 29 |
| | 28 |
| | — |
| | 28 |
|
Lombart Brothers, Inc.(8) | One stop | | P + 5.50% | (f) | | 10.75% | | 04/2022 | | 8 |
| | 8 |
| | — |
| | 8 |
|
| Maverick Healthcare Group, LLC* | Senior loan | | L + 7.50% | (a) | | 7.89% cash/2.00% PIK | | 04/2017 | | 1,316 |
| | 1,316 |
| | 0.1 |
| | 1,316 |
|
| MD Now Holdings, Inc. | One stop | | L + 5.25% | (c) | | 7.64% | | 08/2024 | | 7,770 |
| | 7,619 |
| | 0.8 |
| | 7,692 |
|
MD Now Holdings, Inc.(5) | One stop | | L + 5.25% | | | N/A(6) | | 08/2024 | | — |
| | (1 | ) | | — |
| | (2 | ) |
MD Now Holdings, Inc.(5) | One stop | | L + 5.25% | | | N/A(6) | | 08/2024 | | — |
| | (1 | ) | | — |
| | (2 | ) |
| MWD Management, LLC & MWD Services, Inc. | One stop | | L + 5.25% | (c) | | 7.64% | | 06/2023 | | 5,866 |
| | 5,808 |
| | 0.6 |
| | 5,866 |
|
| MWD Management, LLC & MWD Services, Inc.^ | One stop | | L + 5.25% | (c) | | 7.64% | | 06/2023 | | 229 |
| | 228 |
| | — |
| | 229 |
|
MWD Management, LLC & MWD Services, Inc.(5) | One stop | | L + 5.25% | | | N/A(6) | | 06/2022 | | — |
| | (1 | ) | | — |
| | — |
|
MWD Management, LLC & MWD Services, Inc.(5) | One stop | | L + 5.25% | | | N/A(6) | | 06/2023 | | — |
| | (3 | ) | | — |
| | — |
|
| Oliver Street Dermatology Holdings, LLC | One stop | | L + 6.00% | (c) | | 8.39% | | 05/2022 | | 9,338 |
| | 9,156 |
| | 1.0 |
| | 9,338 |
|
| Oliver Street Dermatology Holdings, LLC | One stop | | L + 6.00% | (c) | | 8.39% | | 05/2022 | | 942 |
| | 929 |
| | 0.1 |
| | 942 |
|
| Oliver Street Dermatology Holdings, LLC* | One stop | | L + 6.00% | (c) | | 8.39% | | 05/2022 | | 210 |
| | 208 |
| | — |
| | 210 |
|
| Oliver Street Dermatology Holdings, LLC^ | One stop | | L + 6.00% | (c) | | 8.39% | | 05/2022 | | 151 |
| | 149 |
| | — |
| | 151 |
|
| Oliver Street Dermatology Holdings, LLC | One stop | | L + 6.00% | (c) | | 8.39% | | 05/2022 | | 133 |
| | 132 |
| | — |
| | 133 |
|
| Oliver Street Dermatology Holdings, LLC | One stop | | L + 6.00% | (c) | | 8.39% | | 05/2022 | | 116 |
| | 115 |
| | — |
| | 116 |
|
| Oliver Street Dermatology Holdings, LLC^ | One stop | | L + 6.00% | (c) | | 8.39% | | 05/2022 | | 90 |
| | 89 |
| | — |
| | 90 |
|
| Oliver Street Dermatology Holdings, LLC | One stop | | L + 6.00% | (c)(f) | | 8.85% | | 05/2022 | | 81 |
| | 80 |
| | — |
| | 81 |
|
| Oliver Street Dermatology Holdings, LLC | One stop | | L + 6.00% | (c) | | 8.39% | | 05/2022 | | 78 |
| | 78 |
| | — |
| | 78 |
|
| Oliver Street Dermatology Holdings, LLC^ | One stop | | L + 6.00% | (c) | | 8.39% | | 05/2022 | | 46 |
| | 45 |
| | — |
| | 46 |
|
| Oliver Street Dermatology Holdings, LLC* | One stop | | L + 6.00% | (c) | | 8.39% | | 05/2022 | | 41 |
| | 41 |
| | — |
| | 41 |
|
| Oliver Street Dermatology Holdings, LLC^ | One stop | | L + 6.00% | (c) | | 8.39% | | 05/2022 | | 32 |
| | 32 |
| | — |
| | 32 |
|
| Oliver Street Dermatology Holdings, LLC^ | One stop | | L + 6.00% | (c) | | 8.39% | | 05/2022 | | 30 |
| | 29 |
| | — |
| | 30 |
|
Oliver Street Dermatology Holdings, LLC(5) | One stop | | L + 6.00% | | | N/A(6) | | 05/2022 | | — |
| | (1 | ) | | — |
| | — |
|
| ONsite Mammography, LLC | One stop | | L + 6.75% | (a) | | 8.99% | | 11/2023 | | 3,064 |
| | 3,005 |
| | 0.3 |
| | 3,064 |
|
| ONsite Mammography, LLC | One stop | | L + 6.75% | (c)(d) | | 9.15% | | 11/2023 | | 22 |
| | 21 |
| | — |
| | 22 |
|
ONsite Mammography, LLC(5) | One stop | | L + 6.75% | | | N/A(6) | | 11/2023 | | — |
| | (1 | ) | | — |
| | — |
|
| Pinnacle Treatment Centers, Inc. | One stop | | L + 6.25% | (c) | | 8.59% | | 08/2021 | | 9,879 |
| | 9,724 |
| | 1.0 |
| | 9,879 |
|
| Pinnacle Treatment Centers, Inc. | One stop | | L + 6.25% | (b)(c) | | 8.52% | | 08/2021 | | 58 |
| | 57 |
| | — |
| | 58 |
|
| Pinnacle Treatment Centers, Inc.^ | One stop | | L + 6.25% | (c) | | 8.59% | | 08/2021 | | 55 |
| | 54 |
| | — |
| | 55 |
|
| Pinnacle Treatment Centers, Inc. | One stop | | L + 6.25% | (a) | | 8.46% | | 08/2021 | | 43 |
| | 42 |
| | — |
| | 43 |
|
| PPT Management Holdings, LLC^ | One stop | | L + 7.50% | (b)(f) | | 9.69% | | 12/2022 | | 10,713 |
| | 10,443 |
| | 0.9 |
| | 8,758 |
|
| PPT Management Holdings, LLC* | One stop | | L + 7.50% | (b)(c)(f) | | 9.69% | | 12/2022 | | 139 |
| | 140 |
| | — |
| | 114 |
|
| PPT Management Holdings, LLC | One stop | | L + 7.50% | (b)(f) | | 9.69% | | 12/2022 | | 84 |
| | 84 |
| | — |
| | 68 |
|
| PPT Management Holdings, LLC | One stop | | L + 7.50% | (b)(f) | | 9.69% | | 12/2022 | | 40 |
| | 31 |
| | — |
| | 32 |
|
PPT Management Holdings, LLC(5) | One stop | | L + 7.50% | (b)(f) | | 9.69% | | 12/2022 | | 7 |
| | 4 |
| | — |
| | (30 | ) |
| Riverchase MSO, LLC | Senior loan | | L + 5.25% | (c) | | 7.64% | | 10/2022 | | 4,930 |
| | 4,880 |
| | 0.5 |
| | 4,930 |
|
| Riverchase MSO, LLC | Senior loan | | L + 5.25% | (c) | | 7.63% | | 10/2022 | | 54 |
| | 53 |
| | — |
| | 54 |
|
| RXH Buyer Corporation*^ | One stop | | L + 5.75% | (c) | | 8.14% | | 09/2021 | | 17,083 |
| | 16,914 |
| | 1.8 |
| | 17,083 |
|
| RXH Buyer Corporation* | One stop | | L + 5.75% | (c) | | 8.14% | | 09/2021 | | 1,933 |
| | 1,915 |
| | 0.2 |
| | 1,933 |
|
| RXH Buyer Corporation | One stop | | P + 4.75% | (c)(f) | | 9.19% | | 09/2021 | | 92 |
| | 90 |
| | — |
| | 92 |
|
| SLMP, LLC^ | One stop | | L + 6.00% | (a) | | 8.24% | | 05/2023 | | 7,544 |
| | 7,406 |
| | 0.8 |
| | 7,544 |
|
| SLMP, LLC^ | One stop | | L + 6.00% | (a) | | 8.24% | | 05/2023 | | 298 |
| | 294 |
| | — |
| | 298 |
|
| SLMP, LLC | One stop | | N/A | | | 7.50% PIK | | 05/2027 | | 90 |
| | 90 |
| | — |
| | 90 |
|
See Notes to Consolidated Financial Statements.
113
Golub Capital BDC, Inc. and Subsidiaries
Consolidated Schedule of Investments - (continued)
September 30, 2018
(In thousands)
|
| | | | | | | | | | | | | | | | | | | | | | | |
| | Investment Type | | Spread Above Index(1) | | Interest Rate(2) | | Maturity Date | | Principal ($) / Shares(3) | | Amortized Cost | | Percentage of Net Assets | | Fair
Value (4) |
| Healthcare, Education and Childcare - (continued) | | | | | | | | | | | | | | | |
SLMP, LLC(5) | One stop | | L + 6.00% | | | N/A(6) | | 05/2023 | | $ | — |
| | $ | (1 | ) | | — |
| % | $ | — |
|
SLMP, LLC(5) | One stop | | L + 6.00% | | | N/A(6) | | 05/2023 | | — |
| | (1 | ) | | — |
| | — |
|
| Spear Education, LLC^ | One stop | | L + 6.25% | (c) | | 8.75% | | 08/2019 | | 4,597 |
| | 4,586 |
| | 0.5 |
| | 4,597 |
|
| Spear Education, LLC | One stop | | L + 6.25% | (c) | | 8.59% | | 08/2019 | | 74 |
| | 74 |
| | — |
| | 74 |
|
| Spear Education, LLC | One stop | | L + 6.25% | (c) | | 8.56% | | 08/2019 | | 26 |
| | 26 |
| | — |
| | 26 |
|
| Summit Behavioral Healthcare, LLC^ | Senior loan | | L + 4.75% | (c) | | 7.06% | | 10/2023 | | 8,777 |
| | 8,666 |
| | 0.9 |
| | 8,777 |
|
| Summit Behavioral Healthcare, LLC | Senior loan | | L + 4.75% | (c) | | 7.07% | | 10/2023 | | 65 |
| | 63 |
| | — |
| | 65 |
|
| Summit Behavioral Healthcare, LLC | Senior loan | | L + 4.75% | (c) | | 7.07% | | 10/2023 | | 27 |
| | 24 |
| | — |
| | 27 |
|
| WHCG Management, LLC* | Senior loan | | L + 5.00% | (c) | | 7.39% | | 03/2023 | | 2,370 |
| | 2,348 |
| | 0.3 |
| | 2,370 |
|
| WHCG Management, LLC | Senior loan | | L + 5.00% | (c) | | 7.35% | | 03/2023 | | 100 |
| | 99 |
| | — |
| | 100 |
|
WHCG Management, LLC(5) | Senior loan | | L + 5.00% | | | N/A(6) | | 03/2023 | | — |
| | (2 | ) | | — |
| | — |
|
| WIRB-Copernicus Group, Inc.*^ | Senior loan | | L + 4.25% | (a) | | 6.49% | | 08/2022 | | 10,901 |
| | 10,834 |
| | 1.1 |
| | 10,901 |
|
WIRB-Copernicus Group, Inc.(5) | Senior loan | | L + 4.25% | | | N/A(6) | | 08/2022 | | — |
| | (1 | ) | | — |
| | — |
|
WIRB-Copernicus Group, Inc.(5) | Senior loan | | L + 4.25% | | | N/A(6) | | 08/2022 | | — |
| | (2 | ) | | — |
| | — |
|
| | | | | | | | | | | 329,007 |
| | 324,822 |
| | 33.4 |
| | 323,259 |
|
| Home and Office Furnishings, Housewares, and Durable Consumer | | | | | | | | | | | | | | | |
| 1A Smart Start LLC* | Senior loan | | L + 4.50% | (a) | | 6.74% | | 02/2022 | | 548 |
| | 547 |
| | 0.1 |
| | 550 |
|
| CST Buyer Company^ | One stop | | L + 5.00% | (a) | | 7.24% | | 03/2023 | | 2,433 |
| | 2,378 |
| | 0.2 |
| | 2,433 |
|
CST Buyer Company(5) | One stop | | L + 5.00% | | | N/A(6) | | 03/2023 | | — |
| | (1 | ) | | — |
| | — |
|
| Plano Molding Company, LLC*^ | One stop | | L + 7.50% | (a) | | 9.67% | | 05/2021 | | 10,048 |
| | 9,937 |
| | 1.0 |
| | 9,848 |
|
| | | | | | | | | | | 13,029 |
| | 12,861 |
| | 1.3 |
| | 12,831 |
|
| Hotels, Motels, Inns, and Gaming | | | | | | | | | | |
| | |
| | |
| | |
|
| Aimbridge Hospitality, LLC*^ | One stop | | L + 5.00% | (a) | | 7.24% | | 06/2022 | | 9,941 |
| | 9,811 |
| | 1.0 |
| | 9,941 |
|
| Aimbridge Hospitality, LLC* | One stop | | L + 5.00% | (a) | | 7.24% | | 06/2022 | | 4,830 |
| | 4,764 |
| | 0.5 |
| | 4,830 |
|
| Aimbridge Hospitality, LLC | One stop | | L + 5.00% | (a) | | 7.24% | | 06/2022 | | 805 |
| | 794 |
| | 0.1 |
| | 805 |
|
| Aimbridge Hospitality, LLC | One stop | | L + 5.00% | (a) | | 7.24% | | 06/2022 | | 16 |
| | 15 |
| | — |
| | 16 |
|
Aimbridge Hospitality, LLC(5) | One stop | | L + 5.00% | | | N/A(6) | | 06/2022 | | — |
| | (1 | ) | | — |
| | — |
|
| | | | | | | | | | | 15,592 |
| | 15,383 |
| | 1.6 |
| | 15,592 |
|
| Insurance | | | | | | | | | | | | | | | | |
| Captive Resources Midco, LLC*^ | One stop | | L + 5.75% | (a) | | 7.99% | | 12/2021 | | 34,313 |
| | 33,908 |
| | 3.5 |
| | 34,313 |
|
Captive Resources Midco, LLC(5) | One stop | | L + 5.75% | | | N/A(6) | | 12/2021 | | — |
| | (18 | ) | | — |
| | — |
|
Captive Resources Midco, LLC(5) | One stop | | L + 5.75% | | | N/A(6) | | 12/2021 | | — |
| | (23 | ) | | — |
| | — |
|
| Internet Pipeline, Inc. | One stop | | L + 4.75% | (a) | | 7.00% | | 08/2022 | | 4,809 |
| | 4,715 |
| | 0.5 |
| | 4,809 |
|
| Internet Pipeline, Inc.* | One stop | | L + 4.75% | (a) | | 7.00% | | 08/2022 | | 2,077 |
| | 2,056 |
| | 0.2 |
| | 2,077 |
|
| Internet Pipeline, Inc.* | One stop | | L + 4.75% | (a) | | 7.00% | | 08/2022 | | 786 |
| | 778 |
| | 0.1 |
| | 786 |
|
Internet Pipeline, Inc.(5) | One stop | | L + 4.75% | | | N/A(6) | | 08/2021 | | — |
| | (1 | ) | | — |
| | — |
|
| RSC Acquisition, Inc. | Senior loan | | L + 4.25% | (c)(d)(f) | | 6.72% | | 11/2022 | | 4,380 |
| | 4,358 |
| | 0.5 |
| | 4,369 |
|
| RSC Acquisition, Inc. | Senior loan | | L + 4.25% | (d)(e) | | 6.76% | | 11/2021 | | 21 |
| | 21 |
| | — |
| | 21 |
|
RSC Acquisition, Inc.(5) | Senior loan | | L + 4.25% | | | N/A(6) | | 11/2022 | | — |
| | (2 | ) | | — |
| | (1 | ) |
| | | | | | | | | | | 46,386 |
| | 45,792 |
| | 4.8 |
| | 46,374 |
|
| Leisure, Amusement, Motion Pictures, Entertainment | | | | | | | | | | | | | | | |
| NFD Operating, LLC | One stop | | L + 7.00% | (a) | | 9.11% | | 06/2021 | | 2,302 |
| | 2,283 |
| | 0.2 |
| | 2,302 |
|
| NFD Operating, LLC | One stop | | L + 7.00% | | | N/A(6) | | 06/2021 | | — |
| | — |
| | — |
| | — |
|
PADI Holdco, Inc.(8)(9) | One stop | | E + 5.75% | (g) | | 5.75% | | 04/2023 | | 9,591 |
| | 9,591 |
| | 1.0 |
| | 9,313 |
|
| PADI Holdco, Inc.*^ | One stop | | L + 5.75% | (c) | | 8.14% | | 04/2023 | | 9,677 |
| | 9,465 |
| | 1.0 |
| | 9,677 |
|
| PADI Holdco, Inc. | One stop | | L + 5.75% | (c) | | 8.14% | | 04/2022 | | 125 |
| | 123 |
| | — |
| | 125 |
|
| Self Esteem Brands, LLC*^ | Senior loan | | L + 4.75% | (a) | | 6.99% | | 02/2020 | | 16,120 |
| | 16,069 |
| | 1.7 |
| | 16,120 |
|
See Notes to Consolidated Financial Statements.
114
Golub Capital BDC, Inc. and Subsidiaries
Consolidated Schedule of Investments - (continued)
September 30, 2018
(In thousands)
|
| | | | | | | | | | | | | | | | | | | | | | | |
| | Investment Type | | Spread Above Index(1) | | Interest Rate(2) | | Maturity Date | | Principal ($) / Shares(3) | | Amortized Cost | | Percentage of Net Assets | | Fair
Value (4) |
| Leisure, Amusement, Motion Pictures, Entertainment - (continued) | | | | | | | | | | | | |
Self Esteem Brands, LLC(5) | Senior loan | | L + 4.75% | | | N/A(6) | | 02/2020 | | $ | — |
| | $ | (3 | ) | | — |
| % | $ | — |
|
| Sunshine Sub, LLC | One stop | | L + 4.75% | (a) | | 6.99% | | 05/2024 | | 7,720 |
| | 7,575 |
| | 0.8 |
| | 7,720 |
|
Sunshine Sub, LLC(5) | One stop | | L + 4.75% | | | N/A(6) | | 05/2024 | | — |
| | (1 | ) | | — |
| | — |
|
Sunshine Sub, LLC(5) | One stop | | L + 4.75% | | | N/A(6) | | 05/2024 | | — |
| | (3 | ) | | — |
| | — |
|
| Teaching Company, The | One stop | | L + 4.75% | (c) | | 7.09% | | 07/2023 | | 10,855 |
| | 10,757 |
| | 1.1 |
| | 10,855 |
|
Teaching Company, The(5) | One stop | | L + 4.75% | | | N/A(6) | | 07/2023 | | — |
| | (1 | ) | | — |
| | — |
|
| Titan Fitness, LLC* | One stop | | L + 6.50% | (a) | | 8.61% | | 06/2021 | | 12,952 |
| | 12,846 |
| | 1.3 |
| | 12,952 |
|
| Titan Fitness, LLC* | One stop | | L + 6.50% | (a) | | 8.61% | | 06/2021 | | 1,954 |
| | 1,949 |
| | 0.2 |
| | 1,954 |
|
| Titan Fitness, LLC* | One stop | | L + 6.50% | (a) | | 8.61% | | 06/2021 | | 1,716 |
| | 1,712 |
| | 0.2 |
| | 1,716 |
|
| Titan Fitness, LLC^ | One stop | | L + 6.50% | (a) | | 8.61% | | 06/2021 | | 927 |
| | 920 |
| | 0.1 |
| | 927 |
|
Titan Fitness, LLC(5) | One stop | | L + 6.50% | | | N/A(6) | | 06/2021 | | — |
| | (9 | ) | | — |
| | — |
|
| WBZ Investment LLC | One stop | | L + 5.50% | (a) | | 7.64% | | 09/2020 | | 5,149 |
| | 5,049 |
| | 0.5 |
| | 5,097 |
|
WBZ Investment LLC(5) | One stop | | L + 5.50% | | | N/A(6) | | 09/2024 | | — |
| | — |
| | — |
| | (1 | ) |
| WBZ Investment LLC(5) | One stop | | L + 5.50% | | | N/A(6) | | 09/2024 | | — |
| | (2 | ) | | — |
| | (2 | ) |
| | | | | | | | | | | 79,088 |
| | 78,320 |
| | 8.1 |
| | 78,755 |
|
| Oil and Gas | | | | | | | | | | | | | | | | |
| Drilling Info Holdings, Inc. | Senior loan | | L + 4.25% | (b) | | 6.54% | | 07/2025 | | 14,413 |
| | 14,217 |
| | 1.5 |
| | 14,341 |
|
Drilling Info Holdings, Inc.(5) | Senior loan | | L + 4.25% | | | N/A(6) | | 07/2023 | | — |
| | (2 | ) | | — |
| | — |
|
Drilling Info Holdings, Inc.(5) | Senior loan | | L + 4.25% | | | N/A(6) | | 07/2025 | | — |
| | (4 | ) | | — |
| | (1 | ) |
| | | | | | | | | | | 14,413 |
| | 14,211 |
| | 1.5 |
| | 14,340 |
|
| Personal and Non Durable Consumer Products (Mfg. Only) | | | | | | | | | | | | | | | |
| Georgica Pine Clothiers, LLC | One stop | | L + 5.50% | (c) | | 7.89% | | 11/2021 | | 5,620 |
| | 5,562 |
| | 0.6 |
| | 5,620 |
|
| Georgica Pine Clothiers, LLC^ | One stop | | L + 5.50% | (c) | | 7.89% | | 11/2021 | | 490 |
| | 487 |
| | 0.1 |
| | 490 |
|
| Georgica Pine Clothiers, LLC* | One stop | | L + 5.50% | (c) | | 7.89% | | 11/2021 | | 344 |
| | 341 |
| | — |
| | 344 |
|
| Georgica Pine Clothiers, LLC | One stop | | L + 5.50% | (c)(f) | | 8.42% | | 11/2021 | | 46 |
| | 45 |
| | — |
| | 46 |
|
| IMPLUS Footwear, LLC | One stop | | L + 6.75% | (c) | | 9.14% | | 04/2021 | | 10,013 |
| | 9,913 |
| | 1.0 |
| | 10,013 |
|
| IMPLUS Footwear, LLC | One stop | | L + 6.75% | (c) | | 9.09% | | 04/2021 | | 1,763 |
| | 1,745 |
| | 0.2 |
| | 1,763 |
|
| IMPLUS Footcare, LLC | One stop | | L + 6.75% | (c) | | 9.14% | | 04/2021 | | 57 |
| | 57 |
| | — |
| | 57 |
|
| Massage Envy, LLC*^ | One stop | | L + 6.75% | (c)(f) | | 9.06% | | 09/2020 | | 34,835 |
| | 34,631 |
| | 3.6 |
| | 34,835 |
|
| Massage Envy, LLC^ | One stop | | L + 6.75% | (c) | | 9.06% | | 09/2020 | | 99 |
| | 98 |
| | — |
| | 99 |
|
| Massage Envy, LLC | One stop | | L + 6.75% | (c) | | 9.09% | | 09/2020 | | 64 |
| | 64 |
| | — |
| | 64 |
|
| Massage Envy, LLC^ | One stop | | L + 6.75% | (c)(f) | | 9.07% | | 09/2020 | | 48 |
| | 48 |
| | — |
| | 48 |
|
| Massage Envy, LLC | One stop | | L + 6.75% | (c)(f) | | 9.09% | | 09/2020 | | 42 |
| | 41 |
| | — |
| | 42 |
|
| Massage Envy, LLC^ | One stop | | L + 6.75% | (c)(f) | | 9.08% | | 09/2020 | | 40 |
| | 40 |
| | — |
| | 40 |
|
| Massage Envy, LLC^ | One stop | | L + 6.75% | (c)(f) | | 9.12% | | 09/2020 | | 38 |
| | 38 |
| | — |
| | 38 |
|
| Massage Envy, LLC^ | One stop | | L + 6.75% | (c)(f) | | 9.07% | | 09/2020 | | 35 |
| | 34 |
| | — |
| | 35 |
|
| Massage Envy, LLC^ | One stop | | L + 6.75% | (c)(f) | | 9.08% | | 09/2020 | | 19 |
| | 19 |
| | — |
| | 19 |
|
| Massage Envy, LLC^ | One stop | | L + 6.75% | (c)(f) | | 9.13% | | 09/2020 | | 15 |
| | 15 |
| | — |
| | 15 |
|
| Massage Envy, LLC | One stop | | L + 6.75% | (c) | | 9.09% | | 09/2020 | | 10 |
| | 9 |
| | — |
| | 10 |
|
Massage Envy, LLC(5) | One stop | | L + 6.75% | | | N/A(6) | | 09/2020 | | — |
| | (7 | ) | | — |
| | — |
|
| Orthotics Holdings, Inc.* | One stop | | L + 5.50% | (a) | | 7.74% | | 02/2020 | | 8,204 |
| | 8,166 |
| | 0.8 |
| | 8,040 |
|
Orthotics Holdings, Inc.*(8) | One stop | | L + 5.50% | (a) | | 7.74% | | 02/2020 | | 1,345 |
| | 1,338 |
| | 0.1 |
| | 1,318 |
|
Orthotics Holdings, Inc.(5)(8) | One stop | | L + 5.50% | | | N/A(6) | | 02/2020 | | — |
| | (1 | ) | | — |
| | — |
|
Orthotics Holdings, Inc.(5) | One stop | | L + 5.50% | | | N/A(6) | | 02/2020 | | — |
| | (6 | ) | | — |
| | (4 | ) |
| Team Technologies Acquisition Company^ | Senior loan | | L + 5.00% | (c)(f) | | 7.35% | | 12/2018 | | 4,242 |
| | 4,241 |
| | 0.5 |
| | 4,231 |
|
| Team Technologies Acquisition Company* | Senior loan | | L + 5.50% | (c)(f) | | 7.85% | | 12/2018 | | 782 |
| | 781 |
| | 0.1 |
| | 792 |
|
Team Technologies Acquisition Company(5) | Senior loan | | L + 5.00% | | | N/A(6) | | 12/2018 | | — |
| | — |
| | — |
| | (1 | ) |
| | | | | | | | | | | 68,151 |
| | 67,699 |
| | 7.0 |
| | 67,954 |
|
See Notes to Consolidated Financial Statements.
115
Golub Capital BDC, Inc. and Subsidiaries
Consolidated Schedule of Investments - (continued)
September 30, 2018
(In thousands)
|
| | | | | | | | | | | | | | | | | | | | | | | |
| | Investment Type | | Spread Above Index(1) | | Interest Rate(2) | | Maturity Date | | Principal ($) / Shares(3) | | Amortized Cost | | Percentage of Net Assets | | Fair
Value (4) |
| Personal, Food and Miscellaneous Services | | | | | | | | | | | | | | | | |
| Captain D's, LLC*^ | Senior loan | | L + 4.50% | (b) | | 6.71% | | 12/2023 | | $ | 3,965 |
| | $ | 3,913 |
| | 0.4 |
| % | $ | 3,965 |
|
| Captain D's, LLC | Senior loan | | P + 3.50% | (a)(f) | | 7.86% | | 12/2023 | | 20 |
| | 19 |
| | — |
| | 20 |
|
| Community Veterinary Partners, LLC^ | One stop | | L + 5.50% | (c) | | 7.89% | | 10/2021 | | 282 |
| | 280 |
| | — |
| | 282 |
|
| Community Veterinary Partners, LLC* | One stop | | L + 5.50% | (c) | | 7.89% | | 10/2021 | | 99 |
| | 97 |
| | — |
| | 99 |
|
| Community Veterinary Partners, LLC | One stop | | L + 5.50% | (c) | | 7.89% | | 10/2021 | | 75 |
| | 75 |
| | — |
| | 75 |
|
Community Veterinary Partners, LLC(5) | One stop | | L + 5.50% | | | N/A(6) | | 10/2021 | | — |
| | (3 | ) | | — |
| | — |
|
| Imperial Optical Midco Inc. | One stop | | L + 4.75% | (b) | | 7.04% | | 08/2023 | | 2,725 |
| | 2,685 |
| | 0.3 |
| | 2,684 |
|
| Imperial Optical Midco Inc. | One stop | | L + 4.75% | (b) | | 6.96% | | 08/2023 | | 44 |
| | 39 |
| | — |
| | 39 |
|
| Imperial Optical Midco Inc. | One stop | | L + 4.75% | | | N/A(6) | | 08/2023 | | — |
| | — |
| | — |
| | — |
|
| PPV Intermediate Holdings II, LLC | One stop | | N/A | | | 7.90% PIK | | 05/2023 | | 2 |
| | 2 |
| | — |
| | 2 |
|
PPV Intermediate Holdings II, LLC(5) | One stop | | L + 5.00% | | | N/A(6) | | 05/2023 | | — |
| | (1 | ) | | — |
| | — |
|
PPV Intermediate Holdings II, LLC(5) | One stop | | L + 5.00% | | | N/A(6) | | 05/2020 | | — |
| | (6 | ) | | — |
| | — |
|
| Ruby Slipper Cafe LLC, The | One stop | | L + 7.50% | (c) | | 9.85% | | 01/2023 | | 1,035 |
| | 1,026 |
| | 0.1 |
| | 1,035 |
|
| Ruby Slipper Cafe LLC, The | One stop | | L + 7.50% | (c) | | 9.82% | | 01/2023 | | 5 |
| | 5 |
| | — |
| | 5 |
|
| Ruby Slipper Cafe LLC, The | One stop | | L + 7.50% | (c) | | 9.84% | | 01/2023 | | 5 |
| | 4 |
| | — |
| | 5 |
|
| Southern Veterinary Partners, LLC | One stop | | L + 5.50% | (a) | | 7.74% | | 05/2025 | | 3,870 |
| | 3,812 |
| | 0.4 |
| | 3,870 |
|
| Southern Veterinary Partners, LLC | One stop | | L + 5.50% | (a) | | 7.74% | | 05/2025 | | 231 |
| | 228 |
| | — |
| | 231 |
|
| Southern Veterinary Partners, LLC | One stop | | L + 5.50% | (a) | | 7.74% | | 05/2025 | | 205 |
| | 203 |
| | — |
| | 205 |
|
| Southern Veterinary Partners, LLC | One stop | | L + 5.50% | (a) | | 7.74% | | 05/2025 | | 173 |
| | 170 |
| | — |
| | 173 |
|
| Southern Veterinary Partners, LLC | One stop | | L + 5.50% | (a) | | 7.74% | | 05/2025 | | 100 |
| | 97 |
| | — |
| | 100 |
|
| Southern Veterinary Partners, LLC | One stop | | L + 5.50% | (a) | | 7.74% | | 05/2025 | | 77 |
| | 76 |
| | — |
| | 77 |
|
| Southern Veterinary Partners, LLC | One stop | | L + 5.50% | (a) | | 7.74% | | 05/2025 | | 67 |
| | 66 |
| | — |
| | 67 |
|
| Southern Veterinary Partners, LLC | One stop | | L + 5.50% | (a) | | 7.74% | | 05/2025 | | 50 |
| | 48 |
| | — |
| | 50 |
|
Southern Veterinary Partners, LLC(5) | One stop | | L + 5.50% | | | N/A(6) | | 05/2023 | | — |
| | (2 | ) | | — |
| | — |
|
Southern Veterinary Partners, LLC(5) | One stop | | L + 5.50% | | | N/A(6) | | 05/2025 | | — |
| | (7 | ) | | — |
| | — |
|
| Veterinary Specialists of North America, LLC^ | One stop | | L + 5.50% | (a) | | 7.69% | | 07/2021 | | 7,331 |
| | 7,278 |
| | 0.8 |
| | 7,331 |
|
| Veterinary Specialists of North America, LLC^ | One stop | | L + 5.50% | (a) | | 7.74% | | 07/2021 | | 764 |
| | 755 |
| | 0.1 |
| | 764 |
|
| Veterinary Specialists of North America, LLC* | One stop | | L + 5.50% | (a) | | 7.74% | | 07/2021 | | 415 |
| | 413 |
| | 0.1 |
| | 415 |
|
| Veterinary Specialists of North America, LLC* | One stop | | L + 5.50% | (a) | | 7.74% | | 07/2021 | | 160 |
| | 160 |
| | — |
| | 160 |
|
| Veterinary Specialists of North America, LLC^ | One stop | | L + 5.50% | (a) | | 7.74% | | 07/2021 | | 123 |
| | 122 |
| | — |
| | 123 |
|
| Veterinary Specialists of North America, LLC* | One stop | | L + 5.50% | (a) | | 7.74% | | 07/2021 | | 62 |
| | 62 |
| | — |
| | 62 |
|
| Veterinary Specialists of North America, LLC | One stop | | L + 5.50% | (a) | | 7.74% | | 07/2021 | | 12 |
| | 10 |
| | — |
| | 12 |
|
Veterinary Specialists of North America, LLC(5) | One stop | | L + 5.50% | | | N/A(6) | | 07/2021 | | — |
| | (2 | ) | | — |
| | — |
|
| Wetzel's Pretzels, LLC* | One stop | | L + 6.75% | (a) | | 8.99% | | 09/2021 | | 8,922 |
| | 8,805 |
| | 0.9 |
| | 8,922 |
|
| Wetzel's Pretzels, LLC | One stop | | L + 6.75% | (a) | | 8.86% | | 09/2021 | | 3 |
| | 2 |
| | — |
| | 3 |
|
| | | | | | | | | | | 30,822 |
| | 30,431 |
| | 3.1 |
| | 30,776 |
|
| Printing and Publishing | | | | | | | | | | | | | | | | |
| Brandmuscle, Inc.^ | Senior loan | | L + 5.00% | (c) | | 7.39% | | 12/2021 | | 618 |
| | 614 |
| | 0.1 |
| | 622 |
|
| Messenger, LLC | One stop | | L + 6.00% | (a)(f) | | 8.23% | | 08/2023 | | 3,410 |
| | 3,343 |
| | 0.3 |
| | 3,376 |
|
| Messenger, LLC | One stop | | P + 5.00% | (f) | | 10.25% | | 08/2023 | | 3 |
| | 3 |
| | — |
| | 3 |
|
| | | | | | | | | | | 4,031 |
| | 3,960 |
| | 0.4 |
| | 4,001 |
|
| Retail Stores | | | | | | | | | | | | | | | | |
| Batteries Plus Holding Corporation | One stop | | L + 6.75% | (a) | | 8.99% | | 07/2022 | | 11,933 |
| | 11,739 |
| | 1.2 |
| | 11,933 |
|
Batteries Plus Holding Corporation(5) | One stop | | L + 6.75% | | | N/A(6) | | 07/2022 | | — |
| | (1 | ) | | — |
| | — |
|
| Cycle Gear, Inc.^ | One stop | | L + 6.50% | (c) | | 8.84% | | 01/2020 | | 10,321 |
| | 10,263 |
| | 1.1 |
| | 10,321 |
|
| Cycle Gear, Inc.^ | One stop | | L + 6.50% | (c) | | 8.84% | | 01/2020 | | 603 |
| | 600 |
| | 0.1 |
| | 603 |
|
Cycle Gear, Inc.(5) | One stop | | L + 6.50% | | | N/A(6) | | 01/2020 | | — |
| | (7 | ) | | — |
| | — |
|
See Notes to Consolidated Financial Statements.
116
Golub Capital BDC, Inc. and Subsidiaries
Consolidated Schedule of Investments - (continued)
September 30, 2018
(In thousands)
|
| | | | | | | | | | | | | | | | | | | | | | | |
| | Investment Type | | Spread Above Index(1) | | Interest Rate(2) | | Maturity Date | | Principal ($) / Shares(3) | | Amortized Cost | | Percentage of Net Assets | | Fair
Value (4) |
| Retail Stores - (continued) | | | | | | | | | | | | | | | | |
| DTLR, Inc.*^ | One stop | | L + 6.50% | (b) | | 8.68% | | 08/2022 | | $ | 22,732 |
| | $ | 22,466 |
| | 2.3 |
| % | $ | 22,732 |
|
| Elite Sportswear, L.P. | Senior loan | | L + 5.75% | (c) | | 8.14% | | 06/2020 | | 6,872 |
| | 6,815 |
| | 0.7 |
| | 6,872 |
|
| Elite Sportswear, L.P. | Senior loan | | L + 5.75% | (c) | | 8.14% | | 06/2020 | | 2,763 |
| | 2,740 |
| | 0.3 |
| | 2,763 |
|
| Elite Sportswear, L.P. | Senior loan | | L + 5.75% | (c) | | 8.14% | | 06/2020 | | 1,422 |
| | 1,413 |
| | 0.2 |
| | 1,422 |
|
| Elite Sportswear, L.P.* | Senior loan | | L + 5.75% | (c) | | 8.14% | | 06/2020 | | 466 |
| | 464 |
| | 0.1 |
| | 466 |
|
| Elite Sportswear, L.P. | Senior loan | | L + 5.75% | (c) | | 8.14% | | 06/2020 | | 216 |
| | 214 |
| | — |
| | 216 |
|
| Elite Sportswear, L.P.* | Senior loan | | L + 5.75% | (c) | | 8.14% | | 06/2020 | | 206 |
| | 205 |
| | — |
| | 206 |
|
| Elite Sportswear, L.P. | Senior loan | | L + 5.75% | | | N/A(6) | | 06/2020 | | — |
| | — |
| | — |
| | — |
|
Elite Sportswear, L.P.(5) | Senior loan | | L + 5.75% | | | N/A(6) | | 06/2020 | | — |
| | (3 | ) | | — |
| | — |
|
| Feeders Supply Company, LLC | One stop | | L + 5.75% | (a) | | 8.01% | | 04/2021 | | 4,826 |
| | 4,769 |
| | 0.5 |
| | 4,826 |
|
| Feeders Supply Company, LLC | Subordinated debt | | N/A | | | 12.50% cash/7.00% PIK | | 04/2021 | | 67 |
| | 67 |
| | — |
| | 67 |
|
| Feeders Supply Company, LLC | One stop | | L + 5.75% | | | N/A(6) | | 04/2021 | | — |
| | — |
| | — |
| | — |
|
| Marshall Retail Group LLC, The^ | One stop | | L + 6.00% | (c) | | 8.34% | | 08/2020 | | 11,922 |
| | 11,874 |
| | 1.2 |
| | 11,922 |
|
Marshall Retail Group LLC, The(5) | One stop | | L + 6.00% | | | N/A(6) | | 08/2019 | | — |
| | (9 | ) | | — |
| | — |
|
| Mills Fleet Farm Group LLC*^ | One stop | | L + 5.50% | (a) | | 7.74% | | 02/2022 | | 1,815 |
| | 1,743 |
| | 0.2 |
| | 1,815 |
|
| Paper Source, Inc.^ | One stop | | L + 6.25% | (c) | | 8.64% | | 09/2019 | | 12,255 |
| | 12,224 |
| | 1.3 |
| | 12,255 |
|
| Paper Source, Inc.* | One stop | | L + 6.25% | (c) | | 8.64% | | 09/2019 | | 1,628 |
| | 1,621 |
| | 0.2 |
| | 1,628 |
|
| Paper Source, Inc. | One stop | | P + 5.00% | (f) | | 10.25% | | 09/2019 | | 965 |
| | 960 |
| | 0.1 |
| | 965 |
|
Pet Holdings ULC*^(8)(10) | One stop | | L + 5.50% | (c) | | 7.84% | | 07/2022 | | 14,764 |
| | 14,575 |
| | 1.5 |
| | 14,764 |
|
Pet Holdings ULC*^(8)(10) | One stop | | L + 5.50% | (c) | | 7.84% | | 07/2022 | | 100 |
| | 99 |
| | — |
| | 100 |
|
Pet Holdings ULC(5)(8)(10) | One stop | | L + 5.50% | | | N/A(6) | | 07/2022 | | — |
| | (2 | ) | | — |
| | — |
|
| PetPeople Enterprises, LLC^ | One stop | | L + 5.00% | (a) | | 7.25% | | 09/2023 | | 3,114 |
| | 3,082 |
| | 0.3 |
| | 3,114 |
|
| PetPeople Enterprises, LLC | One stop | | N/A | | | 8.25% PIK | | 01/2019 | | 168 |
| | 168 |
| | — |
| | 168 |
|
| PetPeople Enterprises, LLC | One stop | | L + 5.00% | | | N/A(6) | | 09/2023 | | — |
| | — |
| | — |
| | — |
|
PetPeople Enterprises, LLC(5) | One stop | | L + 5.00% | | | N/A(6) | | 09/2023 | | — |
| | (1 | ) | | — |
| | — |
|
| | | | | | | | | | | 109,158 |
| | 108,078 |
| | 11.3 |
| | 109,158 |
|
| Telecommunications | | | | | | | | | | |
| | |
| | |
| | |
|
| NetMotion Wireless Holdings, Inc.*^ | One stop | | L + 6.25% | (c) | | 8.64% | | 10/2021 | | 6,393 |
| | 6,311 |
| | 0.7 |
| | 6,393 |
|
NetMotion Wireless Holdings, Inc.(5) | One stop | | L + 6.25% | | | N/A(6) | | 10/2021 | | — |
| | (1 | ) | | — |
| | — |
|
| | | | | | | | | | | 6,393 |
| | 6,310 |
| | 0.7 |
| | 6,393 |
|
| Textiles and Leather | | | | | | | | | | |
| | |
| | |
| | |
|
| SHO Holding I Corporation* | Senior loan | | L + 5.00% | (c) | | 7.34% | | 10/2022 | | 2,211 |
| | 2,181 |
| | 0.2 |
| | 2,122 |
|
| SHO Holding I Corporation | Senior loan | | L + 4.00% | (a)(c) | | 6.14% | | 10/2021 | | 15 |
| | 15 |
| | — |
| | 12 |
|
| | | | | | | | | | | 2,226 |
| | 2,196 |
| | 0.2 |
| | 2,134 |
|
| Utilities | | | | | | | | | | |
| | |
| | |
| | |
|
| Arcos, LLC | One stop | | L + 6.00% | (c) | | 8.39% | | 02/2021 | | 3,553 |
| | 3,519 |
| | 0.4 |
| | 3,553 |
|
| Arcos, LLC | One stop | | L + 6.00% | | | N/A(6) | | 02/2021 | | — |
| | — |
| | — |
| | — |
|
| | | | | | | | | | | 3,553 |
| | 3,519 |
| | 0.4 |
| | 3,553 |
|
| Total non-controlled/non-affiliate company debt investments | | | | | | | $ | 1,679,746 |
| | $ | 1,660,130 |
| | 171.8 |
| % | $ | 1,664,317 |
|
| | | | | | | | | | | | | | | | | |
Equity investments (11)(12) | | | | | | | | | | | | | | | | |
| Aerospace and Defense | | | | | | | | | | | | | | | | |
| NTS Technical Systems | Common stock | | N/A | | | N/A | | N/A | | 2 |
| | $ | 1,506 |
| | 0.1 |
| % | $ | 616 |
|
| NTS Technical Systems | Preferred stock | | N/A | | | N/A | | N/A | | — |
| | 256 |
| | — |
| | 323 |
|
| NTS Technical Systems | Preferred stock | | N/A | | | N/A | | N/A | | — |
| | 128 |
| | — |
| | 177 |
|
| Tresys Technology Holdings, Inc. | Common stock | | N/A | | | N/A | | N/A | | 295 |
| | 295 |
| | — |
| | — |
|
See Notes to Consolidated Financial Statements.
117
Golub Capital BDC, Inc. and Subsidiaries
Consolidated Schedule of Investments - (continued)
September 30, 2018
(In thousands)
|
| | | | | | | | | | | | | | | | | | | | | | | |
| | Investment Type | | Spread Above Index(1) | | Interest Rate(2) | | Maturity Date | | Principal ($) / Shares(3) | | Amortized Cost | | Percentage of Net Assets | | Fair
Value (4) |
| Aerospace and Defense - (continued) | | | | | | | | | | | | | | | | |
| Whitcraft LLC | Common stock | | N/A | | | N/A | | N/A | | 4 |
| | $ | 375 |
| | 0.1 |
| % | $ | 611 |
|
| | | | | | | | | | | | | 2,560 |
| | 0.2 |
| | 1,727 |
|
| Automobile | | | | | | | | | | | | | | | | |
| Grease Monkey International, LLC | LLC units | | N/A | | | N/A | | N/A | | 354 |
| | 354 |
| | 0.1 |
| | 512 |
|
| Polk Acquisition Corp. | LP interest | | N/A | | | N/A | | N/A | | 1 |
| | 144 |
| | — |
| | 95 |
|
| Quick Quack Car Wash Holdings, LLC | LLC units | | N/A | | | N/A | | N/A | | — |
| | 207 |
| | — |
| | 207 |
|
| | | | | | | | | | | | | 705 |
| | 0.1 |
| | 814 |
|
| Beverage, Food and Tobacco | | | | | | | | | | | | | | | | |
| Benihana, Inc. | LLC units | | N/A | | | N/A | | N/A | | 43 |
| | 699 |
| | 0.1 |
| | 856 |
|
| C. J. Foods, Inc. | Preferred stock | | N/A | | | N/A | | N/A | | — |
| | 75 |
| | 0.1 |
| | 505 |
|
| Cafe Rio Holding, Inc. | Common stock | | N/A | | | N/A | | N/A | | 2 |
| | 224 |
| | — |
| | 265 |
|
| Global ID Corporation | LLC interest | | N/A | | | N/A | | N/A | | 2 |
| | 242 |
| | — |
| | 346 |
|
| Hopdoddy Holdings, LLC | LLC units | | N/A | | | N/A | | N/A | | 27 |
| | 130 |
| | — |
| | 122 |
|
| Hopdoddy Holdings, LLC | LLC units | | N/A | | | N/A | | N/A | | 12 |
| | 36 |
| | — |
| | 35 |
|
| Mendocino Farms, LLC | Common stock | | N/A | | | N/A | | N/A | | 11 |
| | 50 |
| | — |
| | 50 |
|
| Purfoods, LLC | LLC interest | | N/A | | | N/A | | N/A | | 381 |
| | 381 |
| | 0.1 |
| | 527 |
|
| Rubio's Restaurants, Inc. | Preferred stock | | N/A | | | N/A | | N/A | | 2 |
| | 945 |
| | 0.1 |
| | 1,236 |
|
| Uinta Brewing Company | LP interest | | N/A | | | N/A | | N/A | | 462 |
| | 462 |
| | — |
| | — |
|
| | | | | | | | | | | | | 3,244 |
| | 0.4 |
| | 3,942 |
|
| Buildings and Real Estate | | | | | | | | | | | | | | | | |
| Brooks Equipment Company, LLC | Common stock | | N/A | | | N/A | | N/A | | 10 |
| | 1,021 |
| | 0.3 |
| | 2,369 |
|
| | | | | | | | | | | | | | | | | |
| Chemicals, Plastics and Rubber | | | | | | | | | | | | | | | | |
| Flexan, LLC | Preferred stock | | N/A | | | N/A | | N/A | | — |
| | 90 |
| | — |
| | 71 |
|
| Flexan, LLC | Common stock | | N/A | | | N/A | | N/A | | 1 |
| | — |
| | — |
| | — |
|
| Inhance Technologies Holdings LLC | LLC units | | N/A | | | N/A | | N/A | | — |
| | 70 |
| | — |
| | 70 |
|
| | | | | | | | | | | | | 160 |
| | — |
| | 141 |
|
| Diversified/Conglomerate Manufacturing | | | | | | | | | | | | | | | | |
| Inventus Power, Inc. | Preferred stock | | N/A | | | N/A | | N/A | | — |
| | 370 |
| | — |
| | — |
|
| Inventus Power, Inc. | LLC units | | N/A | | | N/A | | N/A | | — |
| | 54 |
| | — |
| | 48 |
|
| Inventus Power, Inc. | Common stock | | N/A | | | N/A | | N/A | | — |
| | — |
| | — |
| | — |
|
| Reladyne, Inc. | LP interest | | N/A | | | N/A | | N/A | | — |
| | 249 |
| | 0.1 |
| | 498 |
|
| Sunless Merger Sub, Inc. | LP interest | | N/A | | | N/A | | N/A | | 160 |
| | 160 |
| | — |
| | — |
|
| | | | | | | | | | | | | 833 |
| | 0.1 |
| | 546 |
|
| Diversified/Conglomerate Service | | | | | | | | | | | | | | | | |
| Accela, Inc. | LLC units | | N/A | | | N/A | | N/A | | 296 |
| | 296 |
| | — |
| | 325 |
|
| Agility Recovery Solutions Inc. | Preferred stock | | N/A | | | N/A | | N/A | | 67 |
| | 341 |
| | 0.1 |
| | 424 |
|
| Apttus Corporation | Preferred stock | | N/A | | | N/A | | N/A | | 18 |
| | 263 |
| | — |
| | 354 |
|
| Apttus Corporation | Warrant | | N/A | | | N/A | | N/A | | 34 |
| | 194 |
| | — |
| | 185 |
|
| Centrify Corporation | LP interest | | N/A | | | N/A | | N/A | | — |
| | 348 |
| | — |
| | 348 |
|
| Centrify Corporation | LP interest | | N/A | | | N/A | | N/A | | 123 |
| | — |
| | — |
| | — |
|
| Cloudbees, Inc. | Preferred stock | | N/A | | | N/A | | N/A | | 33 |
| | 207 |
| | — |
| | 207 |
|
| Cloudbees, Inc. | Warrant | | N/A | | | N/A | | N/A | | 29 |
| | 39 |
| | — |
| | 39 |
|
| Confluence Technologies, Inc. | LLC interest | | N/A | | | N/A | | N/A | | 1 |
| | 87 |
| | — |
| | 100 |
|
| Connexin Software, Inc. | LLC interest | | N/A | | | N/A | | N/A | | 69 |
| | 69 |
| | — |
| | 91 |
|
| Digital Guardian, Inc. | Warrant | | N/A | | | N/A | | N/A | | 57 |
| | 10 |
| | — |
| | 10 |
|
| DISA Holdings Acquisition Subsidiary Corp. | Common stock | | N/A | | | N/A | | N/A | | — |
| | 154 |
| | — |
| | 248 |
|
See Notes to Consolidated Financial Statements.
118
Golub Capital BDC, Inc. and Subsidiaries
Consolidated Schedule of Investments - (continued)
September 30, 2018
(In thousands)
|
| | | | | | | | | | | | | | | | | | | | | | | |
| | Investment Type | | Spread Above Index(1) | | Interest Rate(2) | | Maturity Date | | Principal ($) / Shares(3) | | Amortized Cost | | Percentage of Net Assets | | Fair
Value (4) |
| Diversified/Conglomerate Service - (continued) | | | | | | | | | | | | | | | | |
| GS Acquisitionco, Inc. | LP interest | | N/A | | | N/A | | N/A | | 1 |
| | $ | 98 |
| | — |
| % | $ | 127 |
|
| HealthcareSource HR, Inc. | LLC interest | | N/A | | | N/A | | N/A | | — |
| | 348 |
| | 0.1 |
| | 413 |
|
| Host Analytics, Inc. | Warrant | | N/A | | | N/A | | N/A | | 368 |
| | 134 |
| | 0.1 |
| | 384 |
|
| Jobvite, Inc. | Warrant | | N/A | | | N/A | | N/A | | 72 |
| | 47 |
| | — |
| | 47 |
|
| Kareo, Inc. | Warrant | | N/A | | | N/A | | N/A | | 23 |
| | 160 |
| | — |
| | 2 |
|
| Kareo, Inc. | Preferred stock | | N/A | | | N/A | | N/A | | 1 |
| | 4 |
| | — |
| | 5 |
|
| Maverick Bidco Inc. | LLC units | | N/A | | | N/A | | N/A | | 1 |
| | 369 |
| | 0.1 |
| | 437 |
|
| MMan Acquisition Co. | LP interest | | N/A | | | N/A | | N/A | | 263 |
| | 263 |
| | — |
| | 206 |
|
| Net Health Acquisition Corp. | LP interest | | N/A | | | N/A | | N/A | | — |
| | 346 |
| | 0.1 |
| | 388 |
|
| Nexus Brands Group, Inc. | LP interest | | N/A | | | N/A | | N/A | | — |
| | 136 |
| | — |
| | 155 |
|
| Personify, Inc. | LLC units | | N/A | | | N/A | | N/A | | 297 |
| | 297 |
| | — |
| | 297 |
|
| Project Alpha Intermediate Holding, Inc. | Common stock | | N/A | | | N/A | | N/A | | — |
| | 417 |
| | 0.1 |
| | 500 |
|
| Project Alpha Intermediate Holding, Inc. | Common stock | | N/A | | | N/A | | N/A | | 103 |
| | 4 |
| | — |
| | 51 |
|
| Property Brands, Inc. | Preferred stock | | N/A | | | N/A | | N/A | | 28 |
| | 284 |
| | — |
| | 307 |
|
| Valant Medical Solutions, Inc. | Warrant | | N/A | | | N/A | | N/A | | 5 |
| | 68 |
| | — |
| | 51 |
|
| Vendavo, Inc. | Preferred stock | | N/A | | | N/A | | N/A | | 1,017 |
| | 1,017 |
| | 0.1 |
| | 1,332 |
|
| Verisys Corporation | LLC interest | | N/A | | | N/A | | N/A | | 261 |
| | 261 |
| | — |
| | 239 |
|
| Vitalyst, LLC | Preferred stock | | N/A | | | N/A | | N/A | | — |
| | 61 |
| | — |
| | 88 |
|
| Vitalyst, LLC | Common stock | | N/A | | | N/A | | N/A | | 1 |
| | 7 |
| | — |
| | — |
|
| Workforce Software, LLC | LLC units | | N/A | | | N/A | | N/A | | 323 |
| | 323 |
| | 0.1 |
| | 371 |
|
| Xmatters, Inc. and Alarmpoint, Inc. | Preferred stock | | N/A | | | N/A | | N/A | | 242 |
| | 221 |
| | — |
| | 211 |
|
| Xmatters, Inc. and Alarmpoint, Inc. | Warrant | | N/A | | | N/A | | N/A | | 43 |
| | 34 |
| | — |
| | 16 |
|
| Xmatters, Inc. and Alarmpoint, Inc. | Preferred stock | | N/A | | | N/A | | N/A | | 10 |
| | 10 |
| | — |
| | 12 |
|
| | | | | | | | | | | | | 6,917 |
| | 0.8 |
| | 7,970 |
|
| Ecological | | | | | | | | | | | | | | | | |
| Pace Analytical Services, LLC | Common stock | | N/A | | | N/A | | N/A | | 3 |
| | 304 |
| | — |
| | 280 |
|
| | | | | | | | | | | | | | | | | |
| Electronics | | | | | | | | | | | | | | | | |
Diligent Corporation(13) | Preferred stock | | N/A | | | N/A | | N/A | | 56 |
| | 1 |
| | — |
| | 206 |
|
| Project Silverback Holdings Corp. | Preferred stock | | N/A | | | N/A | | N/A | | 3 |
| | 6 |
| | — |
| | — |
|
| SEI, Inc. | LLC units | | N/A | | | N/A | | N/A | | 340 |
| | 265 |
| | 0.1 |
| | 643 |
|
| Sloan Company, Inc., The | LLC units | | N/A | | | N/A | | N/A | | — |
| | 152 |
| | — |
| | — |
|
| Sloan Company, Inc., The | LLC units | | N/A | | | N/A | | N/A | | 2 |
| | 14 |
| | — |
| | — |
|
| | | | | | | | | | | | | 438 |
| | 0.1 |
| | 849 |
|
| Grocery | | | | | | | | | | | | | | | | |
| MyWebGrocer, Inc. | LLC units | | N/A | | | N/A | | N/A | | 1,418 |
| | 1,446 |
| | — |
| | — |
|
| MyWebGrocer, Inc. | Preferred stock | | N/A | | | N/A | | N/A | | 71 |
| | 165 |
| | — |
| | 41 |
|
| | | | | | | | | | | | | 1,611 |
| | — |
| | 41 |
|
| Healthcare, Education and Childcare | | | | | | | | | | | | | | | | |
| Active Day, Inc. | LLC interest | | N/A | | | N/A | | N/A | | 1 |
| | 614 |
| | 0.1 |
| | 446 |
|
| Acuity Eyecare Holdings, LLC | LLC interest | | N/A | | | N/A | | N/A | | 198 |
| | 198 |
| | — |
| | 196 |
|
| ADCS Clinics Intermediate Holdings, LLC | Preferred stock | | N/A | | | N/A | | N/A | | 1 |
| | 579 |
| | 0.1 |
| | 363 |
|
| ADCS Clinics Intermediate Holdings, LLC | Common stock | | N/A | | | N/A | | N/A | | — |
| | 6 |
| | — |
| | — |
|
Advanced Pain Management Holdings, Inc.(7) | Preferred stock | | N/A | | | N/A | | N/A | | 8 |
| | 829 |
| | — |
| | — |
|
Advanced Pain Management Holdings, Inc.(7) | Common stock | | N/A | | | N/A | | N/A | | 67 |
| | 67 |
| | — |
| | — |
|
Advanced Pain Management Holdings, Inc.(7) | Preferred stock | | N/A | | | N/A | | N/A | | 1 |
| | 64 |
| | — |
| | — |
|
| BIORECLAMATIONIVT, LLC | LLC units | | N/A | | | N/A | | N/A | | — |
| | 407 |
| | 0.1 |
| | 666 |
|
See Notes to Consolidated Financial Statements.
119
Golub Capital BDC, Inc. and Subsidiaries
Consolidated Schedule of Investments - (continued)
September 30, 2018
(In thousands)
|
| | | | | | | | | | | | | | | | | | | | | | | |
| | Investment Type | | Spread Above Index(1) | | Interest Rate(2) | | Maturity Date | | Principal ($) / Shares(3) | | Amortized Cost | | Percentage of Net Assets | | Fair
Value (4) |
| Healthcare, Education and Childcare - (continued) | | | | | | | | | | | | | | | |
| DCA Investment Holding, LLC | LLC units | | N/A | | | N/A | | N/A | | 8,637 |
| | $ | 864 |
| | 0.1 |
| % | $ | 1,073 |
|
| DCA Investment Holding, LLC | LLC units | | N/A | | | N/A | | N/A | | 87 |
| | 9 |
| | — |
| | — |
|
| Deca Dental Management LLC | LLC units | | N/A | | | N/A | | N/A | | 357 |
| | 357 |
| | 0.1 |
| | 428 |
|
| Dental Holdings Corporation | LLC units | | N/A | | | N/A | | N/A | | 883 |
| | 831 |
| | 0.1 |
| | 733 |
|
| Elite Dental Partners LLC | Common stock | | N/A | | | N/A | | N/A | | — |
| | 360 |
| | 0.1 |
| | 360 |
|
| Encore GC Acquisition, LLC | LLC units | | N/A | | | N/A | | N/A | | 18 |
| | 182 |
| | — |
| | 239 |
|
| Encore GC Acquisition, LLC | LLC units | | N/A | | | N/A | | N/A | | 18 |
| | — |
| | — |
| | 19 |
|
| ERG Buyer, LLC | LLC units | | N/A | | | N/A | | N/A | | — |
| | 349 |
| | 0.1 |
| | 349 |
|
| ERG Buyer, LLC | LLC units | | N/A | | | N/A | | N/A | | 4 |
| | 4 |
| | — |
| | 4 |
|
| Eyecare Services Partners Holdings LLC | LLC units | | N/A | | | N/A | | N/A | | — |
| | 133 |
| | — |
| | 147 |
|
| Eyecare Services Partners Holdings LLC | LLC units | | N/A | | | N/A | | N/A | | — |
| | 1 |
| | — |
| | 5 |
|
| G & H Wire Company, Inc. | LLC interest | | N/A | | | N/A | | N/A | | 148 |
| | 148 |
| | — |
| | 122 |
|
| IntegraMed America, Inc. | LLC interest | | N/A | | | N/A | | N/A | | — |
| | 417 |
| | — |
| | 172 |
|
| Katena Holdings, Inc. | LLC units | | N/A | | | N/A | | N/A | | — |
| | 387 |
| | — |
| | 293 |
|
| Lombart Brothers, Inc. | Common stock | | N/A | | | N/A | | N/A | | 1 |
| | 157 |
| | — |
| | 177 |
|
| MD Now Holdings, Inc. | LLC units | | N/A | | | N/A | | N/A | | 7 |
| | 68 |
| | — |
| | 68 |
|
| MWD Management, LLC & MWD Services, Inc. | LLC interest | | N/A | | | N/A | | N/A | | 182 |
| | 182 |
| | — |
| | 122 |
|
| Oliver Street Dermatology Holdings, LLC | LLC units | | N/A | | | N/A | | N/A | | 234 |
| | 234 |
| | — |
| | 346 |
|
| Pentec Acquisition Sub, Inc. | Preferred stock | | N/A | | | N/A | | N/A | | 1 |
| | 116 |
| | — |
| | 178 |
|
| Pinnacle Treatment Centers, Inc. | Preferred stock | | N/A | | | N/A | | N/A | | — |
| | 231 |
| | — |
| | 268 |
|
| Pinnacle Treatment Centers, Inc. | Common stock | | N/A | | | N/A | | N/A | | 2 |
| | 2 |
| | — |
| | 6 |
|
| Radiology Partners, Inc. | LLC units | | N/A | | | N/A | | N/A | | 43 |
| | 85 |
| | — |
| | 191 |
|
| Radiology Partners, Inc. | LLC units | | N/A | | | N/A | | N/A | | 11 |
| | 76 |
| | — |
| | 48 |
|
| RXH Buyer Corporation | LP interest | | N/A | | | N/A | | N/A | | 7 |
| | 683 |
| | — |
| | 290 |
|
| Sage Dental Management, LLC | LLC units | | N/A | | | N/A | | N/A | | — |
| | 249 |
| | — |
| | 28 |
|
| Sage Dental Management, LLC | LLC units | | N/A | | | N/A | | N/A | | 3 |
| | 3 |
| | — |
| | — |
|
| SLMP, LLC | LLC interest | | N/A | | | N/A | | N/A | | 289 |
| | 289 |
| | — |
| | 308 |
|
| Spear Education, LLC | LLC units | | N/A | | | N/A | | N/A | | — |
| | 62 |
| | — |
| | 75 |
|
| Spear Education, LLC | LLC units | | N/A | | | N/A | | N/A | | 1 |
| | 1 |
| | — |
| | 28 |
|
| SSH Corporation | Common stock | | N/A | | | N/A | | N/A | | — |
| | 40 |
| | — |
| | 187 |
|
| Summit Behavioral Healthcare, LLC | LLC interest | | N/A | | | N/A | | N/A | | 1 |
| | 68 |
| | — |
| | 73 |
|
| Summit Behavioral Healthcare, LLC | LLC interest | | N/A | | | N/A | | N/A | | 1 |
| | — |
| | — |
| | 3 |
|
| Surgical Information Systems, LLC | Common stock | | N/A | | | N/A | | N/A | | 4 |
| | 414 |
| | 0.1 |
| | 535 |
|
| U.S. Renal Care, Inc. | LP interest | | N/A | | | N/A | | N/A | | 1 |
| | 2,665 |
| | 0.2 |
| | 1,796 |
|
| WHCG Management, LLC | LLC interest | | N/A | | | N/A | | N/A | | — |
| | 246 |
| | — |
| | 135 |
|
| | | | | | | | | | | | | 12,677 |
| | 1.1 |
| | 10,477 |
|
| Insurance | | | | | | | | | | | | | | | | |
| Captive Resources Midco, LLC | LLC units | | N/A | | | N/A | | N/A | | 1 |
| | — |
| | 0.1 |
| | 393 |
|
| Internet Pipeline, Inc. | Preferred stock | | N/A | | | N/A | | N/A | | — |
| | 72 |
| | — |
| | 100 |
|
| Internet Pipeline, Inc. | Common stock | | N/A | | | N/A | | N/A | | 44 |
| | 1 |
| | — |
| | 174 |
|
| | | | | | | | | | | | | 73 |
| | 0.1 |
| | 667 |
|
| Leisure, Amusement, Motion Pictures, Entertainment | | | | | | | | | | | | | | | |
| LMP TR Holdings, LLC | LLC units | | N/A | | | N/A | | N/A | | 712 |
| | 712 |
| | 0.1 |
| | 1,151 |
|
| PADI Holdco, Inc. | LLC units | | N/A | | | N/A | | N/A | | — |
| | 414 |
| | — |
| | 454 |
|
| Titan Fitness, LLC | LLC units | | N/A | | | N/A | | N/A | | 7 |
| | 712 |
| | 0.2 |
| | 1,403 |
|
| WBZ Investment LLC | LLC interest | | N/A | | | N/A | | N/A | | 31 |
| | 49 |
| | — |
| | 49 |
|
| WBZ Investment LLC | LLC interest | | N/A | | | N/A | | N/A | | 21 |
| | 33 |
| | — |
| | 33 |
|
| WBZ Investment LLC | LLC interest | | N/A | | | N/A | | N/A | | 18 |
| | 27 |
| | — |
| | 27 |
|
See Notes to Consolidated Financial Statements.
120
Golub Capital BDC, Inc. and Subsidiaries
Consolidated Schedule of Investments - (continued)
September 30, 2018
(In thousands)
|
| | | | | | | | | | | | | | | | | | | | | | | |
| | Investment Type | | Spread Above Index(1) | | Interest Rate(2) | | Maturity Date | | Principal ($) / Shares(3) | | Amortized Cost | | Percentage of Net Assets | | Fair
Value (4) |
| Leisure, Amusement, Motion Pictures, Entertainment - (continued) | | | | | | | | | | | | | |
| WBZ Investment LLC | LLC interest | | N/A | | | N/A | | N/A | | 15 |
| | $ | 24 |
| | — |
| % | $ | 24 |
|
| WBZ Investment LLC | LLC interest | | N/A | | | N/A | | N/A | | 7 |
| | 10 |
| | — |
| | 10 |
|
| WBZ Investment LLC | LLC interest | | N/A | | | N/A | | N/A | | 1 |
| | 1 |
| | — |
| | 1 |
|
| | | | | | | | | | | | | 1,982 |
| | 0.3 |
| | 3,152 |
|
| Personal and Non Durable Consumer Products (Mfg. Only) | | | | | | | | | | | | | | | |
| Georgica Pine Clothiers, LLC | LLC units | | N/A | | | N/A | | N/A | | 11 |
| | 106 |
| | — |
| | 176 |
|
| Massage Envy, LLC | LLC interest | | N/A | | | N/A | | N/A | | 749 |
| | 210 |
| | 0.2 |
| | 1,490 |
|
| Team Technologies Acquisition Company | Common stock | | N/A | | | N/A | | N/A | | — |
| | 114 |
| | — |
| | 292 |
|
| | | | | | | | | | | | | 430 |
| | 0.2 |
| | 1,958 |
|
| Personal, Food and Miscellaneous Services | | | | | | | | | | | | | | | | |
| Captain D's, LLC | LLC interest | | N/A | | | N/A | | N/A | | 70 |
| | 70 |
| | — |
| | 64 |
|
| Community Veterinary Partners, LLC | Common stock | | N/A | | | N/A | | N/A | | 2 |
| | 244 |
| | — |
| | 310 |
|
| PPV Intermediate Holdings II, LLC | LLC interest | | N/A | | | N/A | | N/A | | 13 |
| | 13 |
| | — |
| | 13 |
|
| R.G. Barry Corporation | Preferred stock | | N/A | | | N/A | | N/A | | — |
| | 161 |
| | — |
| | 176 |
|
| Ruby Slipper Cafe LLC, The | LLC units | | N/A | | | N/A | | N/A | | 12 |
| | 123 |
| | — |
| | 151 |
|
| Southern Veterinary Partners, LLC | LLC units | | N/A | | | N/A | | N/A | | — |
| | 216 |
| | 0.1 |
| | 333 |
|
| Southern Veterinary Partners, LLC | LLC units | | N/A | | | N/A | | N/A | | 64 |
| | 2 |
| | — |
| | 24 |
|
| Veterinary Specialists of North America, LLC | LLC units | | N/A | | | N/A | | N/A | | — |
| | 106 |
| | — |
| | 185 |
|
| Wetzel's Pretzels, LLC | Common stock | | N/A | | | N/A | | N/A | | — |
| | 160 |
| | — |
| | 221 |
|
| | | | | | | | | | | | | 1,095 |
| | 0.1 |
| | 1,477 |
|
| Printing and Publishing | | | | | | | | | | | | | | | | |
| Brandmuscle, Inc. | LLC interest | | N/A | | | N/A | | N/A | | — |
| | 240 |
| | — |
| | 166 |
|
| | | | | | | | | | | | |
|
| |
|
| |
|
|
| Retail Stores | | | | | | | | | | | | | | | | |
| Batteries Plus Holding Corporation | LP interest | | N/A | | | N/A | | N/A | | 5 |
| | 529 |
| | 0.1 |
| | 816 |
|
| Cycle Gear, Inc. | LLC units | | N/A | | | N/A | | N/A | | 19 |
| | 248 |
| | — |
| | 463 |
|
| DTLR, Inc. | LLC interest | | N/A | | | N/A | | N/A | | 4 |
| | 411 |
| | 0.1 |
| | 734 |
|
| Elite Sportswear, L.P. | LLC interest | | N/A | | | N/A | | N/A | | — |
| | 165 |
| | — |
| | 36 |
|
| Feeders Supply Company, LLC | Preferred stock | | N/A | | | N/A | | N/A | | 2 |
| | 192 |
| | — |
| | 241 |
|
| Feeders Supply Company, LLC | Common stock | | N/A | | | N/A | | N/A | | — |
| | — |
| | — |
| | 52 |
|
| Marshall Retail Group LLC, The | LLC units | | N/A | | | N/A | | N/A | | 15 |
| | 154 |
| | — |
| | 95 |
|
| Paper Source, Inc. | Common stock | | N/A | | | N/A | | N/A | | 8 |
| | 1,387 |
| | 0.1 |
| | 606 |
|
Pet Holdings ULC(8)(10) | LP interest | | N/A | | | N/A | | N/A | | 455 |
| | 386 |
| | 0.1 |
| | 537 |
|
| | | | | | | | | | | | | 3,472 |
| | 0.4 |
| | 3,580 |
|
| | | | | | | | | | | | | | | | | |
| Total non-controlled/non-affiliate company equity investments | | | | | | | | | $ | 37,762 |
| | 4.2 |
| % | $ | 40,156 |
|
| | | | | | | | | | | | | | | | | |
| Total non-controlled/non-affiliate company investments | | | | | | | $ | 1,679,746 |
| | $ | 1,697,892 |
| | 176.0 |
| % | $ | 1,704,473 |
|
| | | | | | | | | | | | | | | | | |
Non-controlled affiliate company investments(14) | | | | | | | | | | | | | | | | |
| Debt investments | | | | | | | | | | | | | | | | |
| Diversified/Conglomerate Service | | | | | | | | | | | | | | | | |
Switchfly, LLC(8) | One stop | | P + 2.00% | (c)(f) | | 7.25% | | 04/2020 | | $ | 2,295 |
| | $ | 2,258 |
| | 0.2 |
| % | $ | 2,066 |
|
Switchfly, LLC(8) | One stop | | P + 2.00% | (f) | | 7.25% | | 06/2018 | | 192 |
| | 192 |
| | — |
| | 173 |
|
Switchfly, LLC(8) | One stop | | P + 2.00% | (f) | | 7.25% | | 04/2020 | | 17 |
| | 17 |
| | — |
| | 15 |
|
| | | | | | | | | | | 2,504 |
| | 2,467 |
| | 0.2 |
| | 2,254 |
|
See Notes to Consolidated Financial Statements.
121
Golub Capital BDC, Inc. and Subsidiaries
Consolidated Schedule of Investments - (continued)
September 30, 2018
(In thousands)
|
| | | | | | | | | | | | | | | | | | | | | | | |
| | Investment Type | | Spread Above Index(1) | | Interest Rate(2) | | Maturity Date | | Principal ($) / Shares(3) | | Amortized Cost | | Percentage of Net Assets | | Fair
Value (4) |
| Mining, Steel, Iron and Non-Precious Metals | | | | | | | | | | | | | | | | |
Benetech, Inc.*(8) | One stop | | L + 10.00% | (a) | | 10.24% cash/2.00% PIK | | 05/2019 | | $ | 4,257 |
| | $ | 4,255 |
| | 0.4 |
| % | $ | 4,257 |
|
Benetech, Inc.(8) | One stop | | P + 8.75% | (a)(f) | | 11.77% cash/2.00% PIK | | 05/2019 | | 223 |
| | 223 |
| | — |
| | 223 |
|
| | | | | | | | | | | 4,480 |
| | 4,478 |
| | 0.4 |
| | 4,480 |
|
| | | | | | | | | | | | | | | | | |
| Total non-controlled affiliate company debt investments | | | | | | | 6,984 |
| | 6,945 |
| | 0.6 |
| % | 6,734 |
|
| | | | | | | | | | | | | | | | | |
Equity Investments (11)(12) | | | | | | | | | | | | | | | | |
| Diversified/Conglomerate Service | | | | | | | | | | | | | | | | |
Switchfly LLC(8) | LLC units | | N/A | | | N/A | | N/A | | 408 |
| | $ | 408 |
| | 0.1 |
| % | $ | 534 |
|
| | | | | | | | | | | | | 408 |
| | 0.1 |
| | 534 |
|
| | | | | | | | | | | | | | | | | |
| Mining, Steel, Iron and Non-Precious Metals | | | | | | | | | | | | | | | | |
Benetech, Inc.(8) | LLC interest | | N/A | | | N/A | | N/A | | 56 |
| | $ | — |
| | — |
|
| $ | 16 |
|
Benetech, Inc.(8) | LLC interest | | N/A | | | N/A | | N/A | | 56 |
| | — |
| | — |
| | — |
|
| | | | | | | | | | | | | — |
| | — |
| | 16 |
|
| | | | | | | | | | | | | | | | | |
| Total non-controlled affiliate company equity investments | | | | | | | | | $ | 408 |
| | 0.1 |
| % | $ | 550 |
|
| | | | | | | | | | | | | | | | | |
| Total non-controlled affiliate company investments | | | | | | | $ | 6,984 |
| | $ | 7,353 |
| | 0.7 |
| % | $ | 7,284 |
|
| | | | | | | | | | | | | | | | | |
Controlled affiliate company investments(15) | | | | | | | | | | | | | | | | |
| Equity investments | | | | | | | | | | | | | | | | |
| Investment Funds and Vehicles | | | | | | | | | | | | | | | | |
Senior Loan Fund LLC(8)(16) | LLC interest | | N/A | | | N/A | | N/A | | 75,407 |
| | $ | 75,407 |
| | 7.3 |
| % | $ | 71,084 |
|
| | | | | | | | | | | | | | | | | |
| Total controlled affiliate company equity investments | | | | | | | | | $ | 75,407 |
| | 7.3 |
| % | $ | 71,084 |
|
| | | | | | | | | | | | | | | | | |
| Total investments | | | | | | | $ | 1,686,730 |
| | $ | 1,780,652 |
| | 184.0 |
| % | $ | 1,782,841 |
|
| | | | | | | | | | | | | | | | | |
| Cash and cash equivalents, foreign currencies and restricted cash and cash equivalents | | | | | |
| | |
| | |
| | |
|
| Cash, foreign currencies and restricted cash | | | | | |
| | $ | 35,173 |
| | 3.6 |
| % | $ | 35,173 |
|
| BlackRock Liquidity Funds T-Fund Institutional Shares (CUSIP 09248U718) | 2.00% (17) | | | | |
| | 10,532 |
| | 1.1 |
| | 10,532 |
|
| Total cash and cash equivalents, foreign currencies and restricted cash and cash equivalents | | | | | | $ | 45,705 |
| | 4.7 |
| % | $ | 45,705 |
|
| | | | | | | | | | | | | | | | | |
| Total investments and cash and cash equivalents, foreign currencies and restricted cash and cash equivalents | | | | | | $ | 1,826,357 |
| | 188.7 |
| % | $ | 1,828,546 |
|
|
| | |
* | | Denotes that all or a portion of the investment collateralizes the MS Credit Facility (as defined in Note 6). |
^ | | Denotes that all or a portion of the investment secures the notes offered in the 2014 Debt Securitization (as defined in Note 6). |
# | | Denotes that all or a portion of the investment collateralizes the Credit Facility (as defined in Note 6). |
| |
(1) | The majority of the investments bear interest at a rate that may be determined by reference to London Interbank Offered Rate ("LIBOR" or "L"), Euro Interbank Offered Rate ("EURIBOR" or "E") or Prime ("P") and which reset daily, monthly, quarterly, semiannually, or annually. For each, the Company has provided the spread over LIBOR, EURIBOR or Prime and the weighted average current interest rate in effect as of September 30, 2018. Certain investments are subject to a LIBOR, EURIBOR or Prime interest rate floor. For fixed rate loans, a spread above a reference rate is not applicable. Listed below are the index rates as of September 28, 2018, which was the last business day of the period on which LIBOR or EURIBOR was determined. The actual index rate for each loan listed may not be the applicable index rate outstanding as of September 28, 2018, as the loan may have priced or repriced based on an index rate prior to September 28, 2018. |
(a) Denotes that all or a portion of the loan was indexed to the 30-day LIBOR, which was 2.26% as of September 28, 2018.
See Notes to Consolidated Financial Statements.
122
Golub Capital BDC, Inc. and Subsidiaries
Consolidated Schedule of Investments - (continued)
September 30, 2018
(In thousands)
(b) Denotes that all or a portion of the loan was indexed to the 60-day LIBOR, which was 2.31% as of September 28, 2018.
(c) Denotes that all or a portion of the loan was indexed to the 90-day LIBOR, which was 2.40% as of September 28, 2018.
(d) Denotes that all or a portion of the loan was indexed to the 180-day LIBOR, which was 2.60% as of September 28, 2018.
(e) Denotes that all or a portion of the loan was indexed to the 360-day LIBOR, which was 2.92% as of September 28, 2018.
(f) Denotes that all or a portion of the loan was indexed to the Prime rate, which was 5.25% as of September 28, 2018.
(g) Denotes that all or a portion of the loan was indexed to the 90-day EURIBOR, which was -0.32% as of September 28, 2018.
| |
(2) | For portfolio companies with multiple interest rate contracts, the interest rate shown is a weighted average current interest rate in effect as of September 30, 2018. |
| |
(3) | The total principal amount is presented for debt investments while the number of shares or units owned is presented for equity investments. |
| |
(4) | The fair value of the investment was valued using significant unobservable inputs. See Note 5. Fair Value Measurements. |
| |
(5) | The negative fair value is the result of the capitalized discount on the loan or the unfunded commitment being valued below par. The negative amortized cost is the result of the capitalized discount being greater than the principal amount outstanding on the loan. |
| |
(6) | The entire commitment was unfunded as of September 30, 2018. As such, no interest is being earned on this investment. The investment may be subject to an unused facility fee. |
| |
(7) | Loan was on non-accrual status as of September 30, 2018, meaning that the Company has ceased recognizing interest income on the loan. |
| |
(8) | The investment is treated as a non-qualifying asset under Section 55(a) of the Investment Company Act of 1940, as amended (the “1940 Act”). Under the 1940 Act, the Company may not acquire any non-qualifying asset unless, at the time the acquisition is made, qualifying assets represent at least 70% of the Company's total assets. As of September 30, 2018, total non-qualifying assets at fair value represented 5.8% of the Company's total assets calculated in accordance with the 1940 Act. |
| |
(9) | Loan is denominated in foreign currency and is translated into U.S. dollars as of the valuation date or the date of the transaction. See Note 2. Significant Accounting Policies and Recent Accounting Updates - Foreign Currency Transactions. |
| |
(10) | The headquarters of this portfolio company is located in Canada. |
| |
(11) | Equity investments are non-income producing securities unless otherwise noted. |
| |
(12) | Ownership of certain equity investments may occur through a holding company or partnership. |
| |
(13) | The Company holds an equity investment that entitles it to receive preferential dividends. |
(14)As defined in the 1940 Act, the Company is deemed to be an "affiliated person" of the portfolio company as the Company owns five percent or more of the portfolio company's voting securities ("non-controlled affiliate"). Transactions related to investments in non-controlled affiliates for the year ended September 30, 2018 were as follows: |
| | | | | | | | | | | | | | | | | | | | | | | | | | | | | | | | | | | | | | | | |
| Portfolio Company | | Fair value as of September 30, 2017 | | Purchases (cost)(h) | | Redemptions (cost) | | Transfer in (out) | | Discount accretion | | Net change in unrealized gain/(loss) | | Fair value as of September 30, 2018 | | Net realized gain/(loss) | | Interest and fee income | | Dividend income |
| Benetech, Inc. | | $ | 3,707 |
| | $ | 222 |
| | $ | (551 | ) | | $ | — |
| | $ | 1 |
| | $ | 1,117 |
| | $ | 4,496 |
| | $ | — |
| | $ | 638 |
| | $ | — |
|
Switchfly LLC(i) | | — |
| | 254 |
| | — |
| | 2,120 |
| | 25 |
| | 389 |
| | 2,788 |
| | — |
| | 29 |
| | — |
|
| Total Non-Controlled Affiliates | | $ | 3,707 |
| | $ | 476 |
| | $ | (551 | ) | | $ | 2,120 |
| | $ | 26 |
| | $ | 1,506 |
| | $ | 7,284 |
| | $ | — |
| | $ | 667 |
| | $ | — |
|
|
| |
(h) | Purchases at cost includes amounts related to payment-in-kind ("PIK") interest capitalized and added to the principal balance of the respective loans. |
(i) | During the three months ended September 30, 2018, the Company's ownership increased to over five percent of the portfolio company's voting securities. |
(15)As defined in the 1940 Act, the Company is deemed to be both an "affiliated person" of and "control" this portfolio company as the Company owns more than 25% of the portfolio company's outstanding voting securities or has the power to exercise control over management or policies of such portfolio company (including through a management agreement) ("controlled affiliate"). Transactions related to investments in controlled affiliates for the year ended September 30, 2018 were as follows: |
| | | | | | | | | | | | | | | | | | | | | | | | | | | | | | | | | | | | | | | | |
| Portfolio Company | | Fair value as of September 30, 2017 | | Purchases (cost) | | Redemptions (cost) | | Transfer in (out) | | Discount accretion | | Net change in unrealized gain/(loss) | | Fair value as of September 30, 2018 | | Net realized gain/(loss) | | Interest and fee income | | Dividend income |
Senior Loan Fund LLC(j) | | $ | 95,015 |
| | $ | 12,163 |
| | $ | (34,213 | ) | | $ | — |
| | $ | — |
| | $ | (1,881 | ) | | $ | 71,084 |
| | $ | — |
| | $ | — |
| | $ | 8,099 |
|
| Total Controlled Affiliates | | $ | 95,015 |
| | $ | 12,163 |
| | $ | (34,213 | ) | | $ | — |
| | $ | — |
| | $ | (1,881 | ) | | $ | 71,084 |
| | $ | — |
| | $ | — |
| | $ | 8,099 |
|
|
| |
(j) | Together with RGA Reinsurance Company ("RGA"), the Company co-invests through Senior Loan Fund LLC ("SLF"). SLF is capitalized as transactions are completed and all portfolio and investment decisions in respect to SLF must be approved by the SLF investment committee consisting of two representatives of the Company and RGA (with unanimous approval required from (i) one representative of each of the Company and RGA or (ii) both representatives of each of the Company and RGA). Therefore, although the Company owns more than 25% of the voting securities of SLF, the Company does not believe that it has control over SLF for purposes of the 1940 Act or otherwise. |
| |
(16) | The Company receives quarterly profit distributions from its equity investment in SLF. See Note 4. Investments. |
| |
(17) | The rate shown is the annualized seven-day yield as of September 30, 2018. |
See Notes to Consolidated Financial Statements.
123
Golub Capital BDC, Inc. and Subsidiaries
Consolidated Schedule of Investments
September 30, 2017
(In thousands)
|
| | | | | | | | | | | | | | | | | | | | | | | |
| | Investment | | Spread Above Index(1) | Interest
Rate(2) | | Maturity Date | | Principal ($) / Shares(3) | | Amortized Cost | | Percentage of Net Assets | | Fair Value (16) |
| Investments | | | | | | | | | |
| | |
| | |
| | |
|
| Non-controlled/non-affiliate company investments | | | | | | | | | |
| | |
| | |
| | |
|
| Debt investments | | | | | | | | | |
| | |
| | |
| | |
|
| Aerospace and Defense | | | | | | | | | |
| | |
| | |
| | |
|
ILC Dover, LP*^# | One stop | | L + 9.00% | (a) | 8.24% cash/2.00% PIK | | 03/2020 | | $ | 17,617 |
| | $ | 17,521 |
| | 1.8 |
| % | $ | 17,617 |
|
| ILC Dover, LP | One stop | | L + 9.00% | (a)(c) | 8.24% cash/2.00% PIK | | 03/2019 | | 801 |
| | 797 |
| | 0.1 |
| | 801 |
|
NTS Technical Systems*^# | One stop | | L + 6.25% | (a) | 7.49% | | 06/2021 | | 21,773 |
| | 21,486 |
| | 2.3 |
| | 21,773 |
|
NTS Technical Systems(4) | One stop | | L + 6.25% | | N/A(5) | | 06/2021 | | — |
| | (72 | ) | | — |
| | — |
|
NTS Technical Systems(4) | One stop | | L + 6.25% | | N/A(5) | | 06/2021 | | — |
| | (120 | ) | | — |
| | — |
|
Tresys Technology Holdings, Inc.(6) | One stop | | L + 6.75% | (c) | 8.08% | | 12/2017 | | 3,899 |
| | 3,845 |
| | 0.1 |
| | 1,170 |
|
Tresys Technology Holdings, Inc.(6) | One stop | | L + 6.75% | (c) | 8.06% | | 12/2017 | | 659 |
| | 658 |
| | 0.1 |
| | 659 |
|
Tronair Parent, Inc.# | Senior loan | | L + 4.75% | (c)(e) | 6.06% | | 09/2023 | | 191 |
| | 189 |
| | — |
| | 191 |
|
| Tronair Parent, Inc. | Senior loan | | L + 4.50% | (c) | 5.81% | | 09/2021 | | 32 |
| | 31 |
| | — |
| | 31 |
|
Whitcraft LLC*^# | One stop | | L + 6.25% | (c) | 7.58% | | 04/2023 | | 12,564 |
| | 12,390 |
| | 1.3 |
| | 12,564 |
|
| Whitcraft LLC | One stop | | P + 5.25% | (e) | 9.50% | | 04/2023 | | 17 |
| | 16 |
| | — |
| | 17 |
|
Whitcraft LLC(4) | One stop | | L + 6.25% | | N/A(5) | | 04/2023 | | — |
| | (5 | ) | | — |
| | — |
|
| | | | | | | | | | 57,553 |
| | 56,736 |
| | 5.7 |
| | 54,823 |
|
| Automobile | | | | | | | | | |
| | |
| | |
| | |
|
Dent Wizard International Corporation* | Senior loan | | L + 4.75% | (a) | 5.98% | | 04/2020 | | 4,522 |
| | 4,499 |
| | 0.5 |
| | 4,522 |
|
OEConnection LLC* | Senior loan | | L + 5.00% | (c) | 6.33% | | 06/2022 | | 4,834 |
| | 4,735 |
| | 0.5 |
| | 4,852 |
|
OEConnection LLC^ | Senior loan | | L + 4.75% | (c) | 6.08% | | 06/2023 | | 2,590 |
| | 2,565 |
| | 0.3 |
| | 2,573 |
|
OEConnection LLC(4) | Senior loan | | L + 5.00% | | N/A(5) | | 06/2021 | | — |
| | (1 | ) | | — |
| | — |
|
T5 Merger Corporation*^ | One stop | | L + 6.25% | (a) | 7.49% | | 03/2022 | | 4,380 |
| | 4,312 |
| | 0.4 |
| | 4,380 |
|
T5 Merger Corporation* | One stop | | L + 6.25% | (a) | 7.48% | | 03/2022 | | 190 |
| | 188 |
| | — |
| | 190 |
|
T5 Merger Corporation* | One stop | | L + 6.25% | (a) | 7.48% | | 03/2022 | | 60 |
| | 59 |
| | — |
| | 60 |
|
| T5 Merger Corporation | One stop | | L + 6.50% | (a) | 7.74% | | 03/2022 | | 8 |
| | 6 |
| | — |
| | 8 |
|
| | | | | | | | | | 16,584 |
| | 16,363 |
| | 1.7 |
| | 16,585 |
|
| Banking | | | | | | | | | | | | | | | |
HedgeServ Holding L.P.*# | One stop | | L + 8.00% | (c) | 7.23% cash/2.00% PIK | 02/2019 | | 17,182 |
| | 17,147 |
| | 1.8 |
| | 17,182 |
|
HedgeServ Holding L.P.(4) | One stop | | L + 6.00% | | N/A(5) | | 02/2019 | | — |
| | (3 | ) | | — |
| | — |
|
| | | | | | | | | | 17,182 |
| | 17,144 |
| | 1.8 |
| | 17,182 |
|
| Beverage, Food and Tobacco | | | | | | | | | |
| | |
| | |
| | |
|
| Abita Brewing Co., L.L.C. | One stop | | L + 5.75% | (a) | 6.99% | | 04/2021 | | 7,763 |
| | 7,655 |
| | 0.8 |
| | 7,530 |
|
Abita Brewing Co., L.L.C.(4) | One stop | | L + 5.75% | | N/A(5) | | 04/2021 | | — |
| | (1 | ) | | — |
| | (2 | ) |
ABP Corporation* | Senior loan | | L + 4.75% | (c) | 6.07% | | 09/2018 | | 4,647 |
| | 4,632 |
| | 0.5 |
| | 4,647 |
|
| ABP Corporation | Senior loan | | P + 3.50% | (e) | 7.75% | | 09/2018 | | 334 |
| | 332 |
| | — |
| | 334 |
|
Benihana, Inc.*^ | One stop | | L + 7.00% | (a)(c) | 8.32% | | 01/2019 | | 16,099 |
| | 15,945 |
| | 1.7 |
| | 15,951 |
|
| Benihana, Inc. | One stop | | L + 7.00% | (c)(e) | 9.16% | | 07/2018 | | 1,726 |
| | 1,711 |
| | 0.2 |
| | 1,706 |
|
C. J. Foods, Inc.*^ | One stop | | L + 6.25% | (c) | 7.58% | | 05/2019 | | 5,205 |
| | 5,164 |
| | 0.5 |
| | 5,205 |
|
| C. J. Foods, Inc. | One stop | | L + 6.25% | (c) | 7.58% | | 05/2019 | | 656 |
| | 651 |
| | 0.1 |
| | 656 |
|
| C. J. Foods, Inc. | One stop | | L + 6.25% | (c) | 7.56% | | 05/2019 | | 129 |
| | 125 |
| | — |
| | 129 |
|
Cafe Rio Holding, Inc.*^ | One stop | | L + 5.75% | (c) | 7.08% | | 09/2023 | | 10,475 |
| | 10,294 |
| | 1.1 |
| | 10,371 |
|
Cafe Rio Holding, Inc.(4) | One stop | | L + 5.75% | | N/A(5) | | 09/2023 | | — |
| | (2 | ) | | — |
| | (1 | ) |
Cafe Rio Holding, Inc.(4) | One stop | | L + 5.75% | | N/A(5) | | 09/2023 | | — |
| | (5 | ) | | — |
| | (3 | ) |
Firebirds International, LLC* | One stop | | L + 5.75% | (c) | 7.06% | | 05/2018 | | 1,063 |
| | 1,058 |
| | 0.1 |
| | 1,063 |
|
Firebirds International, LLC* | One stop | | L + 5.75% | (c) | 7.06% | | 05/2018 | | 299 |
| | 297 |
| | — |
| | 299 |
|
Firebirds International, LLC^ | One stop | | L + 5.75% | (c) | 7.06% | | 12/2018 | | 96 |
| | 95 |
| | — |
| | 96 |
|
| Firebirds International, LLC | One stop | | L + 5.75% | | N/A(5) | | 12/2018 | | — |
| | — |
| | — |
| | — |
|
See Notes to Consolidated Financial Statements.
124
Golub Capital BDC, Inc. and Subsidiaries
Consolidated Schedule of Investments - (continued)
September 30, 20162017
(In thousands)
|
| | | | | | | | | | | | | | | | | | | | | | |
| | Investment Type | | Spread Above Index(1) | | Interest Rate(2) | | Maturity Date | | Principal/Par Amount(3) | | Amortized Cost | | Percentage of Net Assets | | Fair Value |
| Beverage, Food and Tobacco – (continued) | | | | | | | | | | | | | | | |
Firebirds International, LLC* | One stop | | L + 5.75% | | 7.00% | | 05/2018 | | $ | 302 |
| | $ | 300 |
| | — |
| % | $ | 302 |
|
| Firebirds International, LLC | One stop | | L + 5.75% | | 7.00% | | 05/2018 | | 55 |
| | 53 |
| | — |
| | 55 |
|
Firebirds International, LLC(4) | One stop | | L + 5.75% | | N/A(5) | | 05/2018 | | — |
| | (1 | ) | | — |
| | — |
|
First Watch Restaurants, Inc.*^# | One stop | | L + 6.00% | | 7.15% | | 12/2020 | | 25,596 |
| | 25,384 |
| | 2.9 |
| | 25,596 |
|
| First Watch Restaurants, Inc. | One stop | | P + 5.00% | | 8.05% | | 12/2020 | | 1,603 |
| | 1,596 |
| | 0.2 |
| | 1,603 |
|
| First Watch Restaurants, Inc. | One stop | | L + 6.00% | | 7.00% | | 12/2020 | | 1,258 |
| | 1,248 |
| | 0.1 |
| | 1,258 |
|
| First Watch Restaurants, Inc. | One stop | | L + 6.00% | | 7.00% | | 12/2020 | | 1,255 |
| | 1,246 |
| | 0.2 |
| | 1,255 |
|
First Watch Restaurants, Inc.(4) | One stop | | L + 6.00% | | N/A(5) | | 12/2020 | | — |
| | (8 | ) | | — |
| | — |
|
| Hopdoddy Holdings, LLC | One stop | | L + 8.00% | | 9.00% | | 08/2020 | | 660 |
| | 649 |
| | 0.1 |
| | 660 |
|
| Hopdoddy Holdings, LLC | One stop | | L + 8.00% | | N/A(5) | | 08/2020 | | — |
| | — |
| | — |
| | — |
|
Hopdoddy Holdings, LLC(4) | One stop | | L + 8.00% | | N/A(5) | | 08/2020 | | — |
| | (3 | ) | | — |
| | — |
|
| IT'SUGAR LLC | Subordinated debt | | N/A | | 8.00% | | 10/2017 | | 1,707 |
| | 1,707 |
| | 0.2 |
| | 1,384 |
|
| Purfoods, LLC | One stop | | L + 6.25% | | 7.25% | | 05/2021 | | 8,647 |
| | 8,449 |
| | 1.0 |
| | 8,647 |
|
| Purfoods, LLC | One stop | | N/A | | 7.00% PIK | | 05/2026 | | 101 |
| | 101 |
| | — |
| | 101 |
|
| Purfoods, LLC | One stop | | L + 6.25% | | 7.25% | | 05/2021 | | 25 |
| | 24 |
| | — |
| | 25 |
|
Purfoods, LLC(4) | One stop | | L + 6.25% | | N/A(5) | | 05/2021 | | — |
| | (1 | ) | | — |
| | — |
|
Restaurant Holding Company, LLC # | Senior loan | | L + 7.75% | | 8.75% | | 02/2019 | | 4,605 |
| | 4,581 |
| | 0.5 |
| | 4,513 |
|
Rubio's Restaurants, Inc*^ | Senior loan | | L + 4.75% | | 6.00% | | 11/2018 | | 8,919 |
| | 8,879 |
| | 1.0 |
| | 8,919 |
|
| Smashburger Finance LLC | Senior loan | | L + 5.50% | | 6.75% | | 05/2018 | | 87 |
| | 86 |
| | — |
| | 85 |
|
Smashburger Finance LLC(4) | Senior loan | | L + 5.50% | | N/A(5) | | 05/2018 | | — |
| | (2 | ) | | — |
| | — |
|
Surfside Coffee Company LLC^ | One stop | | L + 5.25% | | 6.25% | | 06/2020 | | 4,470 |
| | 4,436 |
| | 0.5 |
| | 4,470 |
|
| Surfside Coffee Company LLC | One stop | | L + 5.25% | | 6.25% | | 06/2020 | | 337 |
| | 329 |
| | — |
| | 337 |
|
| Surfside Coffee Company LLC | One stop | | L + 5.25% | | 6.25% | | 06/2020 | | 26 |
| | 25 |
| | — |
| | 26 |
|
Tate's Bake Shop, Inc.# | Senior loan | | L + 5.00% | | 6.00% | | 08/2019 | | 597 |
| | 593 |
| | 0.1 |
| | 597 |
|
Uinta Brewing Company^ | One stop | | L + 8.50% | | 9.50% | | 08/2019 | | 3,734 |
| | 3,713 |
| | 0.4 |
| | 3,622 |
|
| Uinta Brewing Company | One stop | | L + 8.50% | | 9.50% | | 08/2019 | | 308 |
| | 305 |
| | — |
| | 296 |
|
| | | | | | | | | | 137,528 |
| | 136,190 |
| | 15.4 |
| | 135,564 |
|
| Broadcasting and Entertainment | | | | | | | | | |
| | |
| | | | |
|
TouchTunes Interactive Networks, Inc.^ | Senior loan | | L + 4.75% | | 5.75% | | 05/2021 | | 1,477 |
| | 1,471 |
| | 0.2 |
| | 1,483 |
|
| | | | | | | | | | | | | | | | |
| Building and Real Estate | | | | | | | | | | | | | | | |
Brooks Equipment Company, LLC*^ | One stop | | L + 5.00% | | 6.00% | | 08/2020 | | 22,970 |
| | 22,747 |
| | 2.6 |
| | 22,970 |
|
Brooks Equipment Company, LLC(4) | One stop | | L + 5.00% | | N/A(5) | | 08/2020 | | — |
| | (13 | ) | | — |
| | — |
|
ITEL Laboratories, Inc.* | Senior loan | | L + 4.50% | | 5.75% | | 06/2018 | | 634 |
| | 631 |
| | 0.1 |
| | 634 |
|
| ITEL Laboratories, Inc. | Senior loan | | L + 4.50% | | N/A(5) | | 06/2018 | | — |
| | — |
| | — |
| | — |
|
| | | | | | | | | | 23,604 |
| | 23,365 |
| | 2.7 |
| | 23,604 |
|
| Containers, Packaging and Glass | | | | | | | | | |
| | |
| | |
| | |
|
Fort Dearborn Company*^ | Senior loan | | L + 4.75% | | 5.75% | | 10/2018 | | 2,980 |
| | 2,969 |
| | 0.3 |
| | 2,980 |
|
Fort Dearborn Company*^ | Senior loan | | L + 4.25% | | 5.25% | | 10/2017 | | 509 |
| | 508 |
| | 0.1 |
| | 509 |
|
| | | | | | | | | | 3,489 |
| | 3,477 |
| | 0.4 |
| | 3,489 |
|
| Diversified Conglomerate Manufacturing | | | | | | | | | |
| | |
| | |
| | |
|
Chase Industries, Inc.*^# | One stop | | L + 5.75% | | 6.81% | | 09/2020 | | 21,704 |
| | 21,556 |
| | 2.5 |
| | 21,704 |
|
Chase Industries, Inc.# | One stop | | L + 5.75% | | 7.13% | | 09/2020 | | 4,816 |
| | 4,784 |
| | 0.5 |
| | 4,816 |
|
Chase Industries, Inc.(4) | One stop | | L + 5.75% | | N/A(5) | | 09/2020 | | — |
| | (14 | ) | | — |
| | — |
|
Inventus Power, Inc*^ | One stop | | L + 5.50% | | 6.50% | | 04/2020 | | 8,409 |
| | 8,369 |
| | 0.9 |
| | 7,736 |
|
Inventus Power, Inc(4) | One stop | | L + 5.50% | | N/A(5) | | 04/2020 | | — |
| | (3 | ) | | — |
| | (42 | ) |
Onicon Incorporated*^# | One stop | | L + 6.00% | | 7.00% | | 04/2020 | | 13,422 |
| | 13,286 |
| | 1.5 |
| | 13,221 |
|
Onicon Incorporated(4) | One stop | | L + 6.00% | | N/A(5) | | 04/2020 | | — |
| | (6 | ) | | — |
| | (15 | ) |
Pasternack Enterprises, Inc. and Fairview Microwave, Inc# | Senior loan | | L + 5.00% | | 6.00% | | 05/2022 | | 2,460 |
| | 2,436 |
| | 0.3 |
| | 2,435 |
|
|
| | | | | | | | | | | | | | | | | | | | | | | |
| | Investment | | Spread Above Index(1) | Interest
Rate(2) | | Maturity Date | | Principal ($) / Shares(3) | | Amortized Cost | | Percentage of Net Assets | | Fair Value (16) |
| Beverage, Food and Tobacco - (continued) | | | | | | | | | | | | | | | |
Firebirds International, LLC(4) | One stop | | L + 5.75% | | N/A(5) | | 05/2018 | | $ | — |
| | $ | (1 | ) | | — |
| % | $ | — |
|
FWR Holding Corporation^ | One stop | | L + 6.00% | (c) | 7.40% | | 08/2023 | | 5,312 |
| | 5,234 |
| | 0.6 |
| | 5,259 |
|
| FWR Holding Corporation | One stop | | L + 6.00% | (a)(c) | 7.28% | | 08/2023 | | 18 |
| | 17 |
| | — |
| | 18 |
|
FWR Holding Corporation(4) | One stop | | L + 6.00% | | N/A(5) | | 08/2023 | | — |
| | (2 | ) | | — |
| | (2 | ) |
Global Franchise Group, LLC* | Senior loan | | L + 5.75% | (c) | 7.07% | | 12/2019 | | 3,530 |
| | 3,496 |
| | 0.4 |
| | 3,495 |
|
| Global Franchise Group, LLC | Senior loan | | L + 5.75% | | N/A(5) | | 12/2019 | | — |
| | — |
| | — |
| | — |
|
| Hopdoddy Holdings, LLC | One stop | | L + 8.00% | (a) | 9.24% | | 08/2020 | | 653 |
| | 645 |
| | 0.1 |
| | 653 |
|
| Hopdoddy Holdings, LLC | One stop | | L + 8.00% | (a) | 9.24% | | 08/2020 | | 266 |
| | 265 |
| | — |
| | 266 |
|
| Hopdoddy Holdings, LLC | One stop | | L + 8.00% | | N/A(5) | | 08/2020 | | — |
| | — |
| | — |
| | — |
|
| Julio & Sons Company | One stop | | L + 5.50% | | N/A(5) | | 12/2018 | | — |
| | — |
| | — |
| | — |
|
Mid-America Pet Food, L.L.C.^ | One stop | | L + 5.50% | (c) | 6.83% | | 12/2021 | | 5,640 |
| | 5,568 |
| | 0.6 |
| | 5,640 |
|
Mid-America Pet Food, L.L.C.(4) | One stop | | L + 5.50% | | N/A(5) | | 12/2021 | | — |
| | (1 | ) | | — |
| | — |
|
NBC Intermediate, LLC # | Senior loan | | L + 4.50% | (a) | 5.74% | | 09/2023 | | 2,288 |
| | 2,265 |
| | 0.2 |
| | 2,265 |
|
| NBC Intermediate, LLC | Senior loan | | L + 4.50% | | N/A(5) | | 09/2023 | | — |
| | — |
| | — |
| | — |
|
P&P Food Safety US Acquisition, Inc.* | One stop | | L + 6.50% | (c) | 7.82% | | 11/2021 | | 4,126 |
| | 4,083 |
| | 0.4 |
| | 4,126 |
|
| P&P Food Safety US Acquisition, Inc. | One stop | | P + 5.25% | (e) | 9.50% | | 11/2021 | | 13 |
| | 13 |
| | — |
| | 13 |
|
| Purfoods, LLC | One stop | | L + 6.25% | (c) | 7.57% | | 05/2021 | | 8,561 |
| | 8,407 |
| | 0.9 |
| | 8,561 |
|
| Purfoods, LLC | One stop | | N/A | | 7.00% PIK | | 05/2026 | | 109 |
| | 109 |
| | — |
| | 112 |
|
| Purfoods, LLC | One stop | | L + 6.25% | (a)(c) | 7.55% | | 05/2021 | | 70 |
| | 69 |
| | — |
| | 70 |
|
| Purfoods, LLC | One stop | | L + 6.25% | (c) | 7.58% | | 05/2021 | | 15 |
| | 15 |
| | — |
| | 15 |
|
| Purfoods, LLC | One stop | | L + 6.25% | (a) | 7.49% | | 05/2021 | | 15 |
| | 15 |
| | — |
| | 15 |
|
| Purfoods, LLC | One stop | | L + 6.25% | (c) | 7.58% | | 05/2021 | | 14 |
| | 14 |
| | — |
| | 14 |
|
| Purfoods, LLC | One stop | | L + 6.25% | (c) | 7.58% | | 05/2021 | | 11 |
| | 11 |
| | — |
| | 11 |
|
| Purfoods, LLC | One stop | | L + 6.25% | (c) | 7.58% | | 05/2021 | | 10 |
| | 10 |
| | — |
| | 10 |
|
Restaurant Holding Company, LLC# | Senior loan | | L + 7.75% | (a) | 8.99% | | 02/2019 | | 4,469 |
| | 4,455 |
| | 0.4 |
| | 4,246 |
|
Rubio's Restaurants, Inc.*^ | Senior loan | | L + 4.75% | (c) | 6.07% | | 11/2018 | | 8,828 |
| | 8,807 |
| | 0.9 |
| | 8,828 |
|
| Smashburger Finance LLC | Senior loan | | L + 5.50% | (c) | 6.83% | | 05/2018 | | 79 |
| | 79 |
| | — |
| | 69 |
|
Smashburger Finance LLC(4) | Senior loan | | L + 5.50% | | N/A(5) | | 05/2018 | | — |
| | (1 | ) | | — |
| | — |
|
Surfside Coffee Company LLC# | One stop | | L + 5.25% | (c) | 6.58% | | 06/2020 | | 4,436 |
| | 4,411 |
| | 0.5 |
| | 4,436 |
|
| Surfside Coffee Company LLC | One stop | | L + 5.25% | (c) | 6.58% | | 06/2020 | | 335 |
| | 334 |
| | — |
| | 335 |
|
| Surfside Coffee Company LLC | One stop | | L + 5.25% | (c) | 6.57% | | 06/2020 | | 30 |
| | 30 |
| | — |
| | 30 |
|
Tate's Bake Shop, Inc.^ | Senior loan | | L + 5.00% | (c) | 6.33% | | 08/2019 | | 591 |
| | 588 |
| | 0.1 |
| | 591 |
|
Uinta Brewing Company^ | One stop | | L + 8.50% | (a) | 9.74% | | 08/2019 | | 3,734 |
| | 3,720 |
| | 0.4 |
| | 3,622 |
|
| Uinta Brewing Company | One stop | | L + 8.50% | (a) | 9.74% | | 08/2019 | | 539 |
| | 535 |
| | 0.1 |
| | 517 |
|
| | | | | | | | | | 102,184 |
| | 101,141 |
| | 10.6 |
| | 101,196 |
|
| Broadcasting and Entertainment | | | | | | | | | | | | | | | |
TouchTunes Interactive Networks, Inc.^ | Senior loan | | L + 4.75% | (a) | 5.99% | | 05/2021 | | 1,462 |
| | 1,458 |
| | 0.2 |
| | 1,469 |
|
| | | | | | | | | |
|
| |
|
| |
|
| |
|
|
| Building and Real Estate | | | | | | | | | | | | | | | |
Brooks Equipment Company, LLC*^ | One stop | | L + 5.00% | (b)(c) | 6.32% | | 08/2020 | | 21,846 |
| | 21,687 |
| | 2.3 |
| | 21,846 |
|
Brooks Equipment Company, LLC* | One stop | | L + 5.00% | (c) | 6.32% | | 08/2020 | | 5,400 |
| | 5,366 |
| | 0.6 |
| | 5,400 |
|
| Brooks Equipment Company, LLC | One stop | | L + 5.00% | (a) | 6.24% | | 08/2020 | | 890 |
| | 880 |
| | 0.1 |
| | 890 |
|
Jensen Hughes, Inc.# | Senior loan | | L + 5.00% | (d) | 6.45% | | 12/2021 | | 153 |
| | 152 |
| | — |
| | 153 |
|
MRI Software LLC^ | One stop | | L + 6.00% | (c) | 7.33% | | 06/2023 | | 23,923 |
| | 23,312 |
| | 2.5 |
| | 23,683 |
|
MRI Software LLC# | One stop | | L + 6.00% | (c) | 7.33% | | 06/2023 | | 13,883 |
| | 13,744 |
| | 1.4 |
| | 13,744 |
|
| MRI Software LLC | One stop | | L + 6.00% | (c) | 7.32% | | 06/2023 | | 167 |
| | 165 |
| | — |
| | 165 |
|
MRI Software LLC(4) | One stop | | L + 6.00% | | N/A(5) | | 06/2023 | | — |
| | (3 | ) | | — |
| | (2 | ) |
See Notes to Consolidated Financial Statements.
92125
Golub Capital BDC, Inc. and Subsidiaries
Consolidated Schedule of Investments - (continued)
September 30, 20162017
(In thousands)
|
| | | | | | | | | | | | | | | | | | | | | | |
| | Investment Type | | Spread Above Index(1) | | Interest Rate(2) | | Maturity Date | | Principal/Par Amount(3) | | Amortized Cost | | Percentage of Net Assets | | Fair Value |
| Diversified Conglomerate Manufacturing – (continued) | | | | | | | | | | | | | | | |
PetroChoice Holdings, Inc.^ | Senior loan | | L + 5.00% | | 6.00% | | 08/2022 | | $ | 1,768 |
| | $ | 1,718 |
| | 0.2 |
| % | $ | 1,768 |
|
Plex Systems, Inc.*^ | One stop | | L + 7.50% | | 8.75% | | 06/2020 | | 18,797 |
| | 18,410 |
| | 2.1 |
| | 18,797 |
|
Plex Systems, Inc.(4) | One stop | | L + 7.50% | | N/A(5) | | 06/2020 | | — |
| | (30 | ) | | — |
| | — |
|
Reladyne, Inc.*# | Senior loan | | L + 5.25% | | 6.25% | | 07/2022 | | 10,149 |
| | 9,992 |
| | 1.2 |
| | 10,047 |
|
| Reladyne, Inc. | Senior loan | | L + 5.25% | | 6.25% | | 07/2022 | | 111 |
| | 110 |
| | — |
| | 110 |
|
| Reladyne, Inc. | Senior loan | | P + 4.25% | | 7.75% | | 07/2022 | | 26 |
| | 24 |
| | — |
| | 24 |
|
Reladyne, Inc.(4) | Senior loan | | L + 5.25% | | N/A(5) | | 07/2022 | | — |
| | (2 | ) | | — |
| | (1 | ) |
| Sunless Merger Sub, Inc. | Senior loan | | L + 5.00% | | 6.25% | | 07/2019 | | 1,503 |
| | 1,509 |
| | 0.2 |
| | 1,503 |
|
| Sunless Merger Sub, Inc. | Senior loan | | P + 3.75% | | 7.25% | | 07/2019 | | 151 |
| | 151 |
| | — |
| | 151 |
|
| | | | | | | | | | 83,316 |
| | 82,290 |
| | 9.4 |
| | 82,254 |
|
| Diversified Conglomerate Service | | | | | | | | | |
| | |
| | |
| | |
|
Accellos, Inc.*^# | One stop | | L + 5.75% | | 6.75% | | 07/2020 | | 31,051 |
| | 30,806 |
| | 3.5 |
| | 31,051 |
|
Accellos, Inc.(4) | One stop | | L + 5.75% | | N/A(5) | | 07/2020 | | — |
| | (13 | ) | | — |
| | — |
|
Actiance, Inc. *^ | One stop | | L + 9.00% | | 10.00% | | 04/2018 | | 2,900 |
| | 2,831 |
| | 0.3 |
| | 2,900 |
|
| Actiance, Inc. | One stop | | L + 9.00% | | N/A(5) | | 04/2018 | | — |
| | — |
| | — |
| | — |
|
Agility Recovery Solutions Inc.*^ | One stop | | L + 6.50% | | 7.50% | | 03/2020 | | 14,092 |
| | 13,950 |
| | 1.6 |
| | 14,092 |
|
Agility Recovery Solutions Inc.(4) | One stop | | L + 6.50% | | N/A(5) | | 03/2020 | | — |
| | (6 | ) | | — |
| | — |
|
Bomgar Corporation^ | One stop | | L + 7.50% | | 8.50% | | 06/2022 | | 4,888 |
| | 4,794 |
| | 0.6 |
| | 4,888 |
|
Bomgar Corporation(4) | One stop | | L + 7.50% | | N/A(5) | | 06/2022 | | — |
| | (2 | ) | | — |
| | — |
|
CIBT Holdings, Inc^ | Senior loan | | L + 5.25% | | 6.25% | | 06/2022 | | 1,973 |
| | 1,954 |
| | 0.2 |
| | 1,973 |
|
| CIBT Holdings, Inc | Senior loan | | L + 5.25% | | N/A(5) | | 06/2022 | | — |
| | — |
| | — |
| | — |
|
Clearwater Analytics, LLC# | One stop | | L + 7.50% | | 8.50% | | 09/2022 | | 10,050 |
| | 9,877 |
| | 1.1 |
| | 9,925 |
|
Clearwater Analytics, LLC(4) | One stop | | L + 7.50% | | N/A(5) | | 09/2022 | | — |
| | (2 | ) | | — |
| | (1 | ) |
Daxko Acquisition Corporation# | One stop | | L + 6.50% | | 7.50% | | 09/2022 | | 8,557 |
| | 8,430 |
| | 1.0 |
| | 8,472 |
|
Daxko Acquisition Corporation(4) | One stop | | L + 6.50% | | N/A(5) | | 09/2022 | | — |
| | (1 | ) | | — |
| | — |
|
| EGD Security Systems, LLC | One stop | | L + 6.25% | | 7.25% | | 06/2022 | | 11,114 |
| | 10,876 |
| | 1.3 |
| | 11,114 |
|
| EGD Security Systems, LLC | One stop | | L + 6.25% | | 7.25% | | 06/2022 | | 98 |
| | 96 |
| | — |
| | 98 |
|
EGD Security Systems, LLC(4) | One stop | | L + 6.25% | | N/A(5) | | 06/2022 | | — |
| | (2 | ) | | — |
| | — |
|
| HealthcareSource HR, Inc. | One stop | | L + 6.75% | | 7.75% | | 05/2020 | | 17,724 |
| | 17,416 |
| | 2.0 |
| | 17,724 |
|
HealthcareSource HR, Inc.(4) | One stop | | L + 6.75% | | N/A(5) | | 05/2020 | | — |
| | (1 | ) | | — |
| | — |
|
| Host Analytics, Inc. | One stop | | N/A | | 8.50% cash/2.25% PIK | | 02/2020 | | 3,028 |
| | 2,978 |
| | 0.3 |
| | 3,005 |
|
| Host Analytics, Inc. | One stop | | N/A | | 8.50% cash/2.25% PIK | | 08/2021 | | 2,552 |
| | 2,530 |
| | 0.3 |
| | 2,533 |
|
Host Analytics, Inc.(4) | One stop | | N/A | | N/A(5) | | 02/2020 | | — |
| | (8 | ) | | — |
| | (6 | ) |
III US Holdings, LLC# | One stop | | L + 6.00% | | 7.00% | | 09/2022 | | 5,510 |
| | 5,400 |
| | 0.6 |
| | 5,400 |
|
III US Holdings, LLC(4) | One stop | | L + 6.00% | | N/A(5) | | 09/2022 | | — |
| | (1 | ) | | — |
| | (1 | ) |
Integration Appliance, Inc.*^ | One stop | | L + 8.25% | | 9.50% | | 09/2020 | | 16,123 |
| | 15,986 |
| | 1.8 |
| | 16,123 |
|
| Integration Appliance, Inc. | One stop | | L + 8.25% | | 9.50% | | 09/2020 | | 7,914 |
| | 7,771 |
| | 0.9 |
| | 7,914 |
|
| Integration Appliance, Inc. | One stop | | L + 8.25% | | 9.50% | | 09/2020 | | 5,396 |
| | 5,307 |
| | 0.6 |
| | 5,396 |
|
Integration Appliance, Inc.* | One stop | | L + 8.25% | | 9.50% | | 09/2020 | | 719 |
| | 709 |
| | 0.1 |
| | 719 |
|
Integration Appliance, Inc.(4) | One stop | | L + 8.25% | | N/A(5) | | 09/2018 | | — |
| | (8 | ) | | — |
| | — |
|
Jensen Hughes, Inc.# | Senior loan | | L + 5.00% | | 6.00% | | 12/2021 | | 156 |
| | 155 |
| | — |
| | 156 |
|
Netsmart Technologies, Inc.# | Senior loan | | L + 4.75% | | 5.75% | | 04/2023 | | 1,772 |
| | 1,755 |
| | 0.2 |
| | 1,783 |
|
Netsmart Technologies, Inc.(4) | Senior loan | | L + 4.75% | | N/A(5) | | 01/1900 | | — |
| | (9 | ) | | — |
| | — |
|
Project Alpha Intermediate Holding, Inc.*# | One stop | | L + 8.25% | | 9.25% | | 08/2022 | | 17,257 |
| | 16,749 |
| | 1.9 |
| | 16,912 |
|
| PT Intermediate Holdings III, LLC | One stop | | L + 6.50% | | 7.50% | | 06/2022 | | 22,250 |
| | 21,719 |
| | 2.5 |
| | 22,250 |
|
| PT Intermediate Holdings III, LLC | One stop | | P + 5.50% | | 9.00% | | 06/2022 | | 25 |
| | 21 |
| | — |
| | 25 |
|
| Secure-24, LLC* | One stop | | L + 6.00% | | 7.25% | | 08/2017 | | 9,777 |
| | 9,723 |
| | 1.1 |
| | 9,777 |
|
Secure-24, LLC^ | One stop | | L + 6.00% | | 7.25% | | 08/2017 | | 1,430 |
| | 1,424 |
| | 0.2 |
| | 1,430 |
|
Secure-24, LLC(4) | One stop | | L + 6.00% | | N/A(5) | | 08/2017 | | — |
| | (1 | ) | | — |
| | — |
|
|
| | | | | | | | | | | | | | | | | | | | | | | |
| | Investment | | Spread Above Index(1) | Interest
Rate(2) | | Maturity Date | | Principal ($) / Shares(3) | | Amortized Cost | | Percentage of Net Assets | | Fair Value (16) |
| Building and Real Estate - (continued) | | | | | | | | | | | | | | | |
MRI Software LLC(4) | One stop | | L + 6.00% | (c) | N/A(5) | | 06/2023 | | $ | — |
| | $ | (7 | ) | | $ | — |
| % | $ | (5 | ) |
| | | | | | | | | | 66,262 |
| | 65,296 |
| | 6.9 |
| | 65,874 |
|
| Chemicals, Plastics and Rubber | | | | | | | | | |
| | |
| | |
| | |
|
Flexan, LLC* | One stop | | L + 5.75% | (c) | 7.08% | | 02/2020 | | 2,333 |
| | 2,316 |
| | 0.2 |
| | 2,333 |
|
| Flexan, LLC | One stop | | P + 4.50% | (e) | 8.75% | | 02/2020 | | 2 |
| | 1 |
| | — |
| | 2 |
|
| | | | | | | | | | 2,335 |
| | 2,317 |
| | 0.2 |
| | 2,335 |
|
| Diversified/Conglomerate Manufacturing | | | | | | | | | |
| | |
| | |
| | |
|
Chase Industries, Inc.*^# | One stop | | L + 5.75% | (c) | 7.05% | | 09/2020 | | 31,371 |
| | 31,164 |
| | 3.3 |
| | 31,371 |
|
Chase Industries, Inc.# | One stop | | L + 5.75% | (c) | 7.05% | | 09/2020 | | 4,771 |
| | 4,747 |
| | 0.5 |
| | 4,771 |
|
| Chase Industries, Inc. | One stop | | L + 5.75% | (a) | 6.99% | | 09/2020 | | 324 |
| | 313 |
| | — |
| | 324 |
|
Inventus Power, Inc.*^ | One stop | | L + 6.50% | (a) | 7.74% | | 04/2020 | | 8,140 |
| | 8,098 |
| | 0.7 |
| | 7,326 |
|
| Inventus Power, Inc. | One stop | | L + 6.50% | (a) | 7.74% | | 04/2020 | | 251 |
| | 248 |
| | — |
| | 198 |
|
Onicon Incorporated*^# | One stop | | L + 6.00% | (c) | 7.33% | | 04/2020 | | 12,878 |
| | 12,782 |
| | 1.3 |
| | 12,878 |
|
Onicon Incorporated(4) | One stop | | L + 6.00% | | N/A(5) | | 04/2020 | | — |
| | (4 | ) | | — |
| | — |
|
PetroChoice Holdings, Inc.^ | Senior loan | | L + 5.00% | (b) | 6.28% | | 08/2022 | | 1,750 |
| | 1,709 |
| | 0.2 |
| | 1,750 |
|
Plex Systems, Inc.*^ | One stop | | L + 7.50% | (d) | 8.96% | | 06/2020 | | 18,797 |
| | 18,527 |
| | 2.0 |
| | 18,797 |
|
Plex Systems, Inc.(4) | One stop | | L + 7.50% | | N/A(5) | | 06/2020 | | — |
| | (22 | ) | | — |
| | — |
|
Reladyne, Inc.*^# | Senior loan | | L + 5.00% | (a) | 6.24% | | 07/2022 | | 17,049 |
| | 16,812 |
| | 1.8 |
| | 16,879 |
|
Reladyne, Inc.(4) | Senior loan | | L + 5.00% | | N/A(5) | | 07/2022 | | — |
| | (2 | ) | | — |
| | (2 | ) |
Reladyne, Inc.(4) | Senior loan | | L + 5.00% | | N/A(5) | | 07/2022 | | — |
| | (5 | ) | | — |
| | (5 | ) |
Sunless Merger Sub, Inc.# | Senior loan | | L + 5.00% | (a)(e) | 6.27% | | 07/2019 | | 1,457 |
| | 1,463 |
| | 0.2 |
| | 1,457 |
|
| Sunless Merger Sub, Inc. | Senior loan | | P + 3.75% | (e) | 8.00% | | 07/2019 | | 326 |
| | 326 |
| | — |
| | 326 |
|
| | | | | | | | | | 97,114 |
| | 96,156 |
| | 10.0 |
| | 96,070 |
|
| Diversified/Conglomerate Service | | | | | | | | | |
| | |
| | |
| | |
|
Accela, Inc.# | One stop | | L + 6.25% | (c) | 7.58% | | 09/2023 | | 5,842 |
| | 5,754 |
| | 0.6 |
| | 5,783 |
|
| Accela, Inc. | One stop | | P + 5.25% | (e) | 9.50% | | 09/2023 | | 1 |
| | — |
| | — |
| | 1 |
|
Actiance, Inc.*^ | One stop | | L + 9.00% | (a) | 10.24% | | 10/2019 | | 3,962 |
| | 3,862 |
| | 0.4 |
| | 3,962 |
|
| Actiance, Inc. | One stop | | L + 9.00% | (a) | 10.24% | | 10/2019 | | 20 |
| | 20 |
| | — |
| | 20 |
|
Agility Recovery Solutions Inc.*^ | One stop | | L + 6.50% | (c) | 7.81% | | 03/2020 | | 13,924 |
| | 13,823 |
| | 1.4 |
| | 13,924 |
|
Agility Recovery Solutions Inc.(4) | One stop | | L + 6.50% | | N/A(5) | | 03/2020 | | — |
| | (4 | ) | | — |
| | — |
|
Anaqua, Inc.# | One stop | | L + 6.50% | (c) | 7.81% | | 07/2022 | | 7,018 |
| | 6,917 |
| | 0.7 |
| | 6,948 |
|
Anaqua, Inc.(4) | One stop | | L + 6.50% | | N/A(5) | | 07/2022 | | — |
| | (1 | ) | | — |
| | (1 | ) |
Bomgar Corporation^ | One stop | | L + 7.50% | (c) | 8.83% | | 06/2022 | | 4,839 |
| | 4,762 |
| | 0.5 |
| | 4,839 |
|
Bomgar Corporation(4) | One stop | | L + 7.50% | | N/A(5) | | 06/2022 | | — |
| | (2 | ) | | — |
| | — |
|
Clearwater Analytics, LLC*^ | One stop | | L + 7.50% | (a) | 8.74% | | 09/2022 | | 9,594 |
| | 9,451 |
| | 1.0 |
| | 9,594 |
|
| Clearwater Analytics, LLC | One stop | | L + 7.50% | (a) | 8.74% | | 09/2022 | | 9 |
| | 8 |
| | — |
| | 9 |
|
Daxko Acquisition Corporation*^ | One stop | | L + 6.50% | (a) | 7.74% | | 09/2022 | | 8,472 |
| | 8,366 |
| | 0.9 |
| | 8,472 |
|
| Daxko Acquisition Corporation | One stop | | L + 6.50% | | N/A(5) | | 09/2022 | | — |
| | — |
| | — |
| | — |
|
| EGD Security Systems, LLC | One stop | | L + 6.25% | (c) | 7.55% | | 06/2022 | | 11,114 |
| | 10,918 |
| | 1.1 |
| | 11,114 |
|
EGD Security Systems, LLC^ | One stop | | L + 6.25% | (a) | 7.49% | | 06/2022 | | 98 |
| | 97 |
| | — |
| | 98 |
|
| EGD Security Systems, LLC | One stop | | L + 6.25% | (a)(c) | 7.55% | | 06/2022 | | 35 |
| | 34 |
| | — |
| | 35 |
|
EGD Security Systems, LLC(4) | One stop | | L + 6.25% | | N/A(5) | | 06/2022 | | — |
| | (1 | ) | | — |
| | — |
|
HealthcareSource HR, Inc.* | One stop | | L + 6.75% | (c) | 8.08% | | 05/2020 | | 20,719 |
| | 20,439 |
| | 2.1 |
| | 20,719 |
|
HealthcareSource HR, Inc.(4) | One stop | | L + 6.75% | | N/A(5) | | 05/2020 | | — |
| | (1 | ) | | — |
| | — |
|
| Host Analytics, Inc. | One stop | | N/A | | 8.50% cash/2.25% PIK | | 08/2021 | | 3,098 |
| | 3,055 |
| | 0.3 |
| | 3,098 |
|
| Host Analytics, Inc. | One stop | | N/A | | 8.50% cash/2.25% PIK | | 08/2021 | | 2,597 |
| | 2,470 |
| | 0.3 |
| | 2,597 |
|
Host Analytics, Inc.(4) | One stop | | N/A | | N/A(5) | | 08/2021 | | — |
| | (7 | ) | | — |
| | — |
|
See Notes to Consolidated Financial Statements.
93126
Golub Capital BDC, Inc. and Subsidiaries
Consolidated Schedule of Investments - (continued)
September 30, 20162017
(In thousands)
|
| | | | | | | | | | | | | | | | | | | | | | |
| | Investment Type | | Spread Above Index(1) | | Interest Rate(2) | | Maturity Date | | Principal/Par Amount(3) | | Amortized Cost | | Percentage of Net Assets | | Fair Value |
| Diversified Conglomerate Service – (continued) | | | | | | | | | | | | | | | |
Severin Acquisition, LLC^ | Senior loan | | L + 5.38% | | 6.38% | | 07/2021 | | $ | 892 |
| | $ | 884 |
| | 0.1 |
| % | $ | 905 |
|
Severin Acquisition, LLC^ | Senior loan | | L + 5.00% | | 6.00% | | 07/2021 | | 794 |
| | 788 |
| | 0.1 |
| | 794 |
|
Severin Acquisition, LLC^ | Senior loan | | L + 5.38% | | 6.38% | | 07/2021 | | 607 |
| | 601 |
| | 0.1 |
| | 616 |
|
Severin Acquisition, LLC^ | Senior loan | | L + 4.88% | | 5.88% | | 07/2021 | | 196 |
| | 194 |
| | — |
| | 195 |
|
| Source Medical Solutions, Inc. | Second lien | | L + 11.00% | | 9.00% cash/3.00% PIK | 03/2018 | | 9,475 |
| | 9,340 |
| | 1.1 |
| | 9,475 |
|
Steelwedge Software, Inc.^ | One stop | | L + 10.00% | | 9.00% cash/2.00% PIK | 09/2020 | | 2,197 |
| | 2,109 |
| | 0.2 |
| | 2,197 |
|
| Steelwedge Software, Inc. | One stop | | L + 8.00% | | N/A(5) | | 09/2020 | | — |
| | — |
| | — |
| | — |
|
TA MHI Buyer, Inc. ^ | One stop | | L + 6.50% | | 7.50% | | 09/2021 | | 8,232 |
| | 8,172 |
| | 0.9 |
| | 8,232 |
|
TA MHI Buyer, Inc.* | One stop | | L + 6.50% | | 7.50% | | 09/2021 | | 1,281 |
| | 1,269 |
| | 0.2 |
| | 1,281 |
|
TA MHI Buyer, Inc. ^ | One stop | | L + 6.50% | | 7.50% | | 09/2021 | | 666 |
| | 659 |
| | 0.1 |
| | 666 |
|
TA MHI Buyer, Inc. ^ | One stop | | L + 6.50% | | 7.50% | | 09/2021 | | 237 |
| | 235 |
| | — |
| | 237 |
|
| TA MHI Buyer, Inc. | One stop | | L + 6.50% | | N/A(5) | | 09/2021 | | — |
| | — |
| | — |
| | — |
|
Trintech, Inc. *^# | One stop | | L + 6.00% | | 7.00% | | 10/2021 | | 10,959 |
| | 10,841 |
| | 1.3 |
| | 10,959 |
|
Trintech, Inc. (4) | One stop | | L + 6.00% | | N/A(5) | | 10/2021 | | — |
| | (1 | ) | | — |
| | — |
|
| Vendavo, Inc. | One stop | | L + 8.50% | | 9.50% | | 10/2019 | | 17,982 |
| | 17,717 |
| | 2.0 |
| | 17,672 |
|
Vendavo, Inc.(4) | One stop | | L + 8.50% | | N/A(5) | | 10/2019 | | — |
| | (9 | ) | | — |
| | (25 | ) |
| Vendor Credentialing Service LLC | One stop | | L + 6.00% | | 7.00% | | 11/2021 | | 10,194 |
| | 9,970 |
| | 1.2 |
| | 10,194 |
|
Vendor Credentialing Service LLC(4) | One stop | | L + 6.00% | | N/A(5) | | 11/2021 | | — |
| | (1 | ) | | — |
| | — |
|
| Vitalyst, LLC | Senior loan | | L + 5.25% | | 6.50% | | 09/2017 | | 1,385 |
| | 1,381 |
| | 0.2 |
| | 1,385 |
|
Vitalyst, LLC(4) | Senior loan | | L + 4.25% | | N/A(5) | | 09/2017 | | — |
| | — |
| | — |
| | (2 | ) |
Workforce Software, LLC^ | One stop | | L + 10.50% | | 4.50% cash/7.00% PIK | 06/2021 | | 5,039 |
| | 5,004 |
| | 0.6 |
| | 5,001 |
|
| Workforce Software, LLC | One stop | | L + 3.50% | | N/A(5) | | 06/2021 | | — |
| | — |
| | — |
| | — |
|
| Xmatters, Inc. and Alarmpoint, Inc. | One stop | | L + 8.50% | | 9.50% | | 08/2021 | | 4,629 |
| | 4,563 |
| | 0.5 |
| | 4,594 |
|
| Xmatters, Inc. and Alarmpoint, Inc. | One stop | | L + 8.50% | | N/A(5) | | 08/2021 | | — |
| | — |
| | — |
| | — |
|
| | | | | | | | | | 271,121 |
| | 266,919 |
| | 30.7 |
| | 270,028 |
|
| Ecological | | | | | | | | | | | | | | | |
| Pace Analytical Services, LLC | One stop | | L + 6.25% | | 7.25% | | 09/2022 | | 15,500 |
| | 15,074 |
| | 1.7 |
| | 15,345 |
|
Pace Analytical Services, LLC(4) | One stop | | L + 6.25% | | N/A(5) | | 09/2022 | | — |
| | (2 | ) | | — |
| | (1 | ) |
Pace Analytical Services, LLC(4) | One stop | | L + 6.25% | | N/A(5) | | 09/2022 | | — |
| | (6 | ) | | — |
| | (3 | ) |
| | | | | | | | | | 15,500 |
| | 15,066 |
| | 1.7 |
| | 15,341 |
|
| Electronics | | | | | | | | | |
| | |
| | |
| | |
|
Appriss Holdings, Inc.*# | Senior loan | | L + 5.25% | | 6.25% | | 11/2020 | | 15,451 |
| | 15,268 |
| | 1.7 |
| | 15,451 |
|
| Appriss Holdings, Inc. | Senior loan | | L + 5.25% | | 6.25% | | 11/2020 | | 800 |
| | 770 |
| | 0.1 |
| | 800 |
|
Compusearch Software Holdings, Inc.^ | Senior loan | | L + 4.25% | | 5.25% | | 05/2021 | | 1,308 |
| | 1,305 |
| | 0.1 |
| | 1,308 |
|
Diligent Corporation* | One stop | | L + 6.75% | | 7.75% | | 04/2022 | | 4,888 |
| | 4,786 |
| | 0.6 |
| | 4,888 |
|
Diligent Corporation(4) | One stop | | L + 6.75% | | N/A(5) | | 04/2022 | | — |
| | (2 | ) | | — |
| | — |
|
ECI Acquisition Holdings, Inc.*^# | One stop | | L + 6.25% | | 7.25% | | 03/2019 | | 21,668 |
| | 21,467 |
| | 2.5 |
| | 21,668 |
|
ECI Acquisition Holdings, Inc.* | One stop | | L + 6.25% | | 7.25% | | 03/2019 | | 1,403 |
| | 1,390 |
| | 0.2 |
| | 1,403 |
|
ECI Acquisition Holdings, Inc.(4) | One stop | | L + 6.25% | | N/A(5) | | 03/2019 | | — |
| | (9 | ) | | — |
| | — |
|
Gamma Technologies, LLC^# | One stop | | L + 5.00% | | 6.00% | | 06/2021 | | 18,001 |
| | 17,859 |
| | 2.0 |
| | 18,001 |
|
Gamma Technologies, LLC(4) | One stop | | L + 5.00% | | N/A(5) | | 06/2021 | | — |
| | (1 | ) | | — |
| | — |
|
Park Place Technologies LLC*# | One stop | | L + 5.25% | | 6.25% | | 06/2022 | | 12,466 |
| | 12,301 |
| | 1.4 |
| | 12,466 |
|
| Park Place Technologies LLC | One stop | | L + 5.25% | | 6.25% | | 06/2022 | | 100 |
| | 98 |
| | — |
| | 100 |
|
Sloan Company, Inc., The# | One stop | | L + 7.25% | | 8.25% | | 04/2020 | | 7,513 |
| | 7,411 |
| | 0.8 |
| | 7,138 |
|
| Sloan Company, Inc., The | One stop | | L + 7.25% | | 8.25% | | 04/2020 | | 6 |
| | 5 |
| | — |
| | 4 |
|
Sovos Compliance*^ | One stop | | L + 7.25% | | 8.25% | | 03/2022 | | 9,423 |
| | 9,247 |
| | 1.1 |
| | 9,234 |
|
Sovos Compliance(4) | One stop | | L + 7.25% | | N/A(5) | | 03/2022 | | — |
| | (1 | ) | | — |
| | (1 | ) |
Sparta Holding Corporation*^# | One stop | | L + 5.50% | | 6.50% | | 07/2020 | | 22,309 |
| | 22,131 |
| | 2.5 |
| | 22,309 |
|
Sparta Holding Corporation(4) | One stop | | L + 5.50% | | N/A(5) | | 07/2020 | | — |
| | (24 | ) | | — |
| | — |
|
|
| | | | | | | | | | | | | | | | | | | | | | | |
| | Investment | | Spread Above Index(1) | Interest
Rate(2) | | Maturity Date | | Principal ($) / Shares(3) | | Amortized Cost | | Percentage of Net Assets | | Fair Value (16) |
| Diversified/Conglomerate Service - (continued) | | | | | | | | | | | | | | |
III US Holdings, LLC(4) | One stop | | L + 6.50% | | N/A(5) | | 09/2022 | | $ | — |
| | $ | (1 | ) | | $ | — |
| % | $ | — |
|
Integration Appliance, Inc.*^ | One stop | | L + 8.25% | (c) | 9.57% | | 09/2020 | | 16,123 |
| | 16,020 |
| | 1.7 |
| | 16,123 |
|
| Integration Appliance, Inc. | One stop | | L + 8.25% | (c) | 9.57% | | 09/2020 | | 7,914 |
| | 7,806 |
| | 0.8 |
| | 7,914 |
|
| Integration Appliance, Inc. | One stop | | L + 8.25% | (c) | 9.57% | | 09/2020 | | 5,396 |
| | 5,329 |
| | 0.6 |
| | 5,396 |
|
| Integration Appliance, Inc. | One stop | | L + 8.25% | (c) | 9.57% | | 09/2020 | | 2,484 |
| | 2,462 |
| | 0.3 |
| | 2,484 |
|
| Integration Appliance, Inc. | One stop | | L + 8.25% | (c) | 9.57% | | 09/2020 | | 924 |
| | 917 |
| | 0.1 |
| | 924 |
|
Integration Appliance, Inc.* | One stop | | L + 8.25% | (c) | 9.57% | | 09/2020 | | 719 |
| | 712 |
| | 0.1 |
| | 719 |
|
Maverick Bidco Inc.*# | One stop | | L + 6.25% | (c) | 7.56% | | 04/2023 | | 17,645 |
| | 17,311 |
| | 1.8 |
| | 17,645 |
|
| Maverick Bidco Inc. | One stop | | L + 6.25% | (c) | 7.57% | | 04/2023 | | 27 |
| | 25 |
| | — |
| | 27 |
|
Maverick Bidco Inc.(4) | One stop | | L + 6.25% | | N/A(5) | | 04/2023 | | — |
| | (2 | ) | | — |
| | — |
|
MMan Acquisition Co.# | One stop | | L + 6.00% | (b) | 7.26% | | 08/2023 | | 9,824 |
| | 9,680 |
| | 1.0 |
| | 9,726 |
|
| MMan Acquisition Co. | One stop | | L + 6.00% | (c) | 7.33% | | 08/2023 | | 10 |
| | 9 |
| | — |
| | 9 |
|
Netsmart Technologies, Inc.# | Senior loan | | L + 4.50% | (c) | 5.83% | | 04/2023 | | 1,755 |
| | 1,740 |
| | 0.2 |
| | 1,779 |
|
Netsmart Technologies, Inc.(4) | Senior loan | | L + 4.75% | | N/A(5) | | 04/2023 | | — |
| | (8 | ) | | — |
| | — |
|
| PT Intermediate Holdings III, LLC | One stop | | L + 6.50% | (a) | 7.74% | | 06/2022 | | 22,028 |
| | 21,594 |
| | 2.3 |
| | 22,028 |
|
PT Intermediate Holdings III, LLC* | One stop | | L + 6.50% | (a) | 7.74% | | 06/2022 | | 2,177 |
| | 2,157 |
| | 0.2 |
| | 2,177 |
|
| PT Intermediate Holdings III, LLC | One stop | | L + 6.50% | (a)(e) | 7.90% | | 06/2022 | | 200 |
| | 197 |
| | — |
| | 200 |
|
Saba Software, Inc.# | One stop | | L + 5.50% | (a) | 6.74% | | 05/2023 | | 20,297 |
| | 19,967 |
| | 2.1 |
| | 20,297 |
|
Saba Software, Inc.(4) | One stop | | L + 5.50% | | N/A(5) | | 05/2023 | | — |
| | (2 | ) | | — |
| | — |
|
Saldon Holdings, Inc. * | Senior loan | | L + 4.50% | (a)(b) | 5.77% | | 09/2022 | | 803 |
| | 793 |
| | 0.1 |
| | 793 |
|
Secure-24, LLC*^ | One stop | | L + 5.00% | (c) | 6.33% | | 08/2019 | | 21,653 |
| | 21,479 |
| | 2.3 |
| | 21,653 |
|
Secure-24, LLC(4) | One stop | | L + 5.00% | | N/A(5) | | 08/2019 | | — |
| | (4 | ) | | — |
| | — |
|
Severin Acquisition, LLC^ | Senior loan | | L + 5.38% | (a) | 6.62% | | 07/2021 | | 883 |
| | 873 |
| | 0.1 |
| | 898 |
|
Severin Acquisition, LLC^ | Senior loan | | L + 5.00% | (a) | 6.24% | | 07/2021 | | 786 |
| | 778 |
| | 0.1 |
| | 789 |
|
Severin Acquisition, LLC^ | Senior loan | | L + 5.38% | (a) | 6.62% | | 07/2021 | | 601 |
| | 594 |
| | 0.1 |
| | 611 |
|
Severin Acquisition, LLC^ | Senior loan | | L + 4.88% | (a) | 6.12% | | 07/2021 | | 194 |
| | 192 |
| | — |
| | 194 |
|
| Switchfly, Inc. | One stop | | L + 10.00% | (c) | 9.80% cash/1.50% PIK | | 04/2020 | | 2,398 |
| | 2,296 |
| | 0.3 |
| | 2,398 |
|
| Switchfly, Inc. | One stop | | L + 10.00% | | N/A(5) | | 04/2020 | | — |
| | — |
| | — |
| | — |
|
Telesoft, LLC# | One stop | | L + 5.50% | (c) | 6.81% | | 07/2022 | | 4,192 |
| | 4,152 |
| | 0.4 |
| | 4,150 |
|
Telesoft, LLC(4) | One stop | | L + 5.50% | | N/A(5) | | 07/2022 | | — |
| | (1 | ) | | — |
| | (1 | ) |
Trintech, Inc.*^# | One stop | | L + 6.00% | (c) | 7.31% | | 10/2021 | | 12,096 |
| | 11,987 |
| | 1.3 |
| | 12,096 |
|
| Trintech, Inc. | One stop | | L + 6.00% | | N/A(5) | | 10/2021 | | — |
| | — |
| | — |
| | — |
|
| Vendavo, Inc. | One stop | | L + 8.50% | (c) | 9.80% | | 10/2019 | | 17,982 |
| | 17,804 |
| | 1.9 |
| | 17,982 |
|
Vendavo, Inc.(4) | One stop | | L + 8.50% | | N/A(5) | | 10/2019 | | — |
| | (6 | ) | | — |
| | — |
|
Vendor Credentialing Service LLC^ | One stop | | L + 6.00% | (a) | 7.24% | | 11/2021 | | 12,239 |
| | 12,018 |
| | 1.3 |
| | 12,239 |
|
Vendor Credentialing Service LLC(4) | One stop | | L + 6.00% | | N/A(5) | | 11/2021 | | — |
| | (1 | ) | | — |
| | — |
|
Verisys Corporation* | One stop | | L + 6.75% | (c) | 8.08% | | 01/2023 | | 3,926 |
| | 3,873 |
| | 0.4 |
| | 3,926 |
|
Verisys Corporation(4) | One stop | | L + 6.75% | | N/A(5) | | 01/2023 | | — |
| | (1 | ) | | — |
| | — |
|
Workforce Software, LLC^ | One stop | | L + 10.50% | (c) | 4.80% cash/7.00% PIK | | 06/2021 | | 5,343 |
| | 5,315 |
| | 0.6 |
| | 5,343 |
|
| Workforce Software, LLC | One stop | | L + 10.50% | (c) | 4.80% cash/7.00% PIK | | 06/2021 | | 50 |
| | 50 |
| | — |
| | 50 |
|
| Xmatters, Inc. and Alarmpoint, Inc. | One stop | | L + 9.25% | (a) | 9.74% cash/0.75% PIK | | 08/2021 | | 4,874 |
| | 4,803 |
| | 0.5 |
| | 4,874 |
|
| Xmatters, Inc. and Alarmpoint, Inc. | One stop | | L + 9.25% | (a) | 9.74% cash/0.75% PIK | | 08/2021 | | 20 |
| | 20 |
| | — |
| | 20 |
|
| | | | | | | | | | 286,905 |
| | 282,887 |
| | 29.9 |
| | 286,675 |
|
| Ecological | | | | | | | | | | | | | | | |
| Pace Analytical Services, LLC | One stop | | L + 6.00% | (a) | 7.24% | | 09/2022 | | 15,345 |
| | 14,994 |
| | 1.6 |
| | 15,345 |
|
Pace Analytical Services, LLC^ | One stop | | L + 6.00% | (a) | 7.24% | | 09/2022 | | 1,427 |
| | 1,406 |
| | 0.2 |
| | 1,427 |
|
| Pace Analytical Services, LLC | One stop | | L + 6.00% | (a) | 7.24% | | 09/2022 | | 349 |
| | 344 |
| | — |
| | 349 |
|
See Notes to Consolidated Financial Statements.
94127
Golub Capital BDC, Inc. and Subsidiaries
Consolidated Schedule of Investments - (continued)
September 30, 20162017
(In thousands)
|
| | | | | | | | | | | | | | | | | | | | | | |
| | Investment Type | | Spread Above Index(1) | | Interest Rate(2) | | Maturity Date | | Principal/Par Amount(3) | | Amortized Cost | | Percentage of Net Assets | | Fair Value |
| Electronics – (continued) | | | | | | | | | | | | | | | |
Syncsort Incorporated*^# | One stop | | L + 5.50% | | 6.50% | | 11/2021 | | $ | 16,609 |
| | $ | 16,325 |
| | 1.9 |
| % | $ | 16,609 |
|
Syncsort Incorporated(4) | One stop | | L + 5.50% | | N/A(5) | | 11/2021 | | — |
| | (2 | ) | | — |
| | — |
|
Systems Maintenance Services Holding, Inc.^ | Senior loan | | L + 4.00% | | 5.00% | | 10/2019 | | 2,603 |
| | 2,597 |
| | 0.3 |
| | 2,603 |
|
| Watchfire Enterprises, Inc. | Second lien | | L + 8.00% | | 9.00% | | 10/2021 | | 9,434 |
| | 9,274 |
| | 1.1 |
| | 9,434 |
|
| | | | | | | | | | 143,982 |
| | 142,195 |
| | 16.3 |
| | 143,415 |
|
| Grocery | | | | | | | | | | | | | | | |
MyWebGrocer, Inc.* | One stop | | L + 8.75% | | 10.00% | | 05/2017 | | 14,271 |
| | 14,190 |
| | 1.6 |
| | 14,271 |
|
Teasdale Quality Foods, Inc.# | Senior loan | | L + 4.75% | | 5.77% | | 10/2020 | | 726 |
| | 712 |
| | 0.1 |
| | 735 |
|
Teasdale Quality Foods, Inc.# | Senior loan | | L + 4.75% | | 5.77% | | 10/2020 | | 543 |
| | 538 |
| | 0.1 |
| | 551 |
|
| | | | | | | | | | 15,540 |
| | 15,440 |
| | 1.8 |
| | 15,557 |
|
| Healthcare, Education and Childcare | | | | | | | | | |
| | |
| | |
| | |
|
| Active Day, Inc. | One stop | | L + 6.00% | | 7.00% | | 12/2021 | | 13,538 |
| | 13,216 |
| | 1.5 |
| | 13,538 |
|
Active Day, Inc.(4) | One stop | | L + 6.00% | | N/A(5) | | 12/2021 | | — |
| | (1 | ) | | — |
| | — |
|
Active Day, Inc.(4) | One stop | | L + 6.00% | | N/A(5) | | 12/2021 | | — |
| | (37 | ) | | — |
| | — |
|
| ADCS Clinics Intermediate Holdings, LLC | One stop | | L + 5.75% | | 6.75% | | 05/2022 | | 21,496 |
| | 20,891 |
| | 2.4 |
| | 21,496 |
|
| ADCS Clinics Intermediate Holdings, LLC | One stop | | L + 5.75% | | 6.75% | | 05/2022 | | 109 |
| | 107 |
| | — |
| | 109 |
|
| ADCS Clinics Intermediate Holdings, LLC | One stop | | L + 5.75% | | 6.75% | | 05/2022 | | 32 |
| | 32 |
| | — |
| | 32 |
|
| ADCS Clinics Intermediate Holdings, LLC | One stop | | P + 4.75% | | 8.25% | | 05/2022 | | 27 |
| | 26 |
| | — |
| | 27 |
|
ADCS Clinics Intermediate Holdings, LLC(4) | One stop | | L + 5.75% | | N/A(5) | | 05/2022 | | — |
| | (4 | ) | | — |
| | — |
|
Agilitas USA, Inc.^ | Senior loan | | L + 4.00% | | 5.00% | | 10/2020 | | 2,125 |
| | 2,110 |
| | 0.2 |
| | 2,040 |
|
Aris Teleradiology Company, LLC* | Senior loan | | L + 4.75% | | 5.75% | | 03/2021 | | 941 |
| | 933 |
| | 0.1 |
| | 941 |
|
| Aris Teleradiology Company, LLC | Senior loan | | L + 4.75% | | N/A(5) | | 03/2021 | | — |
| | — |
| | — |
| | — |
|
| Avalign Technologies, Inc.^ | Senior loan | | L + 4.50% | | 5.50% | | 07/2021 | | 1,136 |
| | 1,132 |
| | 0.1 |
| | 1,136 |
|
BIORECLAMATIONIVT, LLC *^# | One stop | | L + 6.25% | | 7.25% | | 01/2021 | | 14,392 |
| | 14,177 |
| | 1.6 |
| | 14,392 |
|
BIORECLAMATIONIVT, LLC (4) | One stop | | L + 6.25% | | N/A(5) | | 01/2021 | | — |
| | (1 | ) | | — |
| | — |
|
California Cryobank, LLC^ | One stop | | L + 5.50% | | 6.50% | | 08/2019 | | 1,550 |
| | 1,542 |
| | 0.2 |
| | 1,550 |
|
| California Cryobank, LLC | One stop | | L + 5.50% | | 6.50% | | 08/2019 | | 234 |
| | 234 |
| | — |
| | 234 |
|
California Cryobank, LLC(4) | One stop | | L + 5.50% | | N/A(5) | | 08/2019 | | — |
| | (1 | ) | | — |
| | — |
|
Certara L.P.*^# | One stop | | L + 6.25% | | 7.25% | | 12/2018 | | 29,063 |
| | 28,870 |
| | 3.3 |
| | 29,063 |
|
Certara L.P.(4) | One stop | | L + 6.25% | | N/A(5) | | 12/2018 | | — |
| | (10 | ) | | — |
| | — |
|
CLP Healthcare Services, Inc.^ | Senior loan | | L + 5.25% | | 6.25% | | 12/2020 | | 3,964 |
| | 3,928 |
| | 0.5 |
| | 3,964 |
|
CPI Buyer, LLC (Cole-Parmer)*^ | Senior loan | | L + 4.50% | | 5.50% | | 08/2021 | | 7,740 |
| | 7,522 |
| | 0.9 |
| | 7,702 |
|
Curo Health Services LLC# | Senior loan | | L + 5.50% | | 6.50% | | 02/2022 | | 1,970 |
| | 1,955 |
| | 0.2 |
| | 1,976 |
|
DCA Investment Holding, LLC*^# | One stop | | L + 5.25% | | 6.25% | | 07/2021 | | 18,968 |
| | 18,634 |
| | 2.2 |
| | 18,968 |
|
DCA Investment Holding, LLC*^# | One stop | | L + 5.25% | | 6.25% | | 07/2021 | | 13,604 |
| | 13,460 |
| | 1.5 |
| | 13,604 |
|
| DCA Investment Holding, LLC | One stop | | P + 4.25% | | 7.75% | | 07/2021 | | 1,340 |
| | 1,325 |
| | 0.2 |
| | 1,340 |
|
Deca Dental Management LLC*^ | One stop | | L + 6.25% | | 7.25% | | 07/2020 | | 4,146 |
| | 4,100 |
| | 0.5 |
| | 4,146 |
|
| Deca Dental Management LLC | One stop | | L + 6.25% | | 7.25% | | 07/2020 | | 504 |
| | 496 |
| | 0.1 |
| | 504 |
|
| Deca Dental Management LLC | One stop | | L + 6.25% | | 7.25% | | 07/2020 | | 50 |
| | 49 |
| | — |
| | 50 |
|
Delta Educational Systems*(6) | Senior loan | | P + 4.75% | | 8.25% | | 12/2016 | | 1,438 |
| | 1,433 |
| | — |
| | 216 |
|
Delta Educational Systems(4)(6) | Senior loan | | L + 6.00% | | N/A(5) | | 12/2016 | | — |
| | — |
| | — |
| | (60 | ) |
| Dental Holdings Corporation | One stop | | L + 5.50% | | 6.50% | | 02/2020 | | 7,599 |
| | 7,480 |
| | 0.9 |
| | 7,599 |
|
| Dental Holdings Corporation | One stop | | L + 5.50% | | 6.50% | | 02/2020 | | 1,155 |
| | 1,143 |
| | 0.1 |
| | 1,155 |
|
| Dental Holdings Corporation | One stop | | P + 4.25% | | 7.75% | | 02/2020 | | 213 |
| | 204 |
| | — |
| | 213 |
|
| eSolutions, Inc. | One stop | | L + 6.50% | | 7.50% | | 03/2022 | | 12,866 |
| | 12,605 |
| | 1.5 |
| | 12,866 |
|
eSolutions, Inc.(4) | One stop | | L + 6.50% | | N/A(5) | | 03/2022 | | — |
| | (1 | ) | | — |
| | — |
|
G & H Wire Company, Inc.*^ | One stop | | L + 5.75% | | 6.75% | | 12/2017 | | 13,157 |
| | 13,112 |
| | 1.5 |
| | 13,157 |
|
| G & H Wire Company, Inc. | One stop | | P + 4.50% | | 8.00% | | 12/2017 | | 357 |
| | 355 |
| | — |
| | 357 |
|
Joerns Healthcare, LLC*^ | One stop | | L + 5.00% | | 6.00% | | 05/2020 | | 3,838 |
| | 3,802 |
| | 0.4 |
| | 3,647 |
|
|
| | | | | | | | | | | | | | | | | | | | | | | |
| | Investment | | Spread Above Index(1) | Interest
Rate(2) | | Maturity Date | | Principal ($) / Shares(3) | | Amortized Cost | | Percentage of Net Assets | | Fair Value (16) |
| Ecological - (continued) | | | | | | | | | | | | | | | |
| Pace Analytical Services, LLC | One stop | | L + 6.00% | (a) | 7.24% | | 09/2022 | | $ | 25 |
| | $ | 24 |
| | $ | — |
| % | $ | 25 |
|
Pace Analytical Services, LLC(4) | One stop | | L + 6.00% | | N/A(5) | | 09/2022 | | — |
| | (5 | ) | | — |
| | — |
|
WRE Holding Corp.# | Senior loan | | L + 4.75% | (a) | 5.99% | | 01/2023 | | 1,019 |
| | 1,008 |
| | 0.1 |
| | 1,019 |
|
| WRE Holding Corp. | Senior loan | | L + 4.75% | (a)(c) | 6.00% | | 01/2023 | | 7 |
| | 7 |
| | — |
| | 7 |
|
| WRE Holding Corp. | Senior loan | | L + 4.75% | | N/A(5) | | 01/2023 | | — |
| | — |
| | — |
| | — |
|
WRE Holding Corp.(4) | Senior loan | | L + 4.75% | | N/A(5) | | 01/2023 | | — |
| | (1 | ) | | — |
| | — |
|
| | | | | | | | | | 18,172 |
| | 17,777 |
| | 1.9 |
| | 18,172 |
|
| Electronics | | | | | | | | | |
| | |
| | |
| | |
|
Appriss Holdings, Inc.*^ | Senior loan | | L + 5.25% | (c) | 6.58% | | 11/2020 | | 15,295 |
| | 15,157 |
| | 1.6 |
| | 15,295 |
|
| Appriss Holdings, Inc. | Senior loan | | L + 5.25% | (b) | 6.53% | | 11/2020 | | 1,892 |
| | 1,869 |
| | 0.2 |
| | 1,892 |
|
Compusearch Software Holdings, Inc.^ | Senior loan | | L + 4.25% | (c) | 5.58% | | 05/2021 | | 1,735 |
| | 1,733 |
| | 0.2 |
| | 1,735 |
|
Diligent Corporation# | One stop | | L + 6.25% | (c) | 7.58% | | 04/2022 | | 4,928 |
| | 4,860 |
| | 0.5 |
| | 4,928 |
|
Diligent Corporation* | One stop | | L + 6.25% | (c) | 7.58% | | 04/2022 | | 4,839 |
| | 4,735 |
| | 0.5 |
| | 4,839 |
|
Diligent Corporation*^ | One stop | | L + 6.25% | (c) | 7.58% | | 04/2022 | | 2,648 |
| | 2,609 |
| | 0.3 |
| | 2,648 |
|
Diligent Corporation(4) | One stop | | L + 6.25% | | N/A(5) | | 04/2022 | | — |
| | (2 | ) | | — |
| | — |
|
Gamma Technologies, LLC^ | One stop | | L + 4.75% | (a) | 5.99% | | 06/2021 | | 7,555 |
| | 7,508 |
| | 0.8 |
| | 7,555 |
|
Gamma Technologies, LLC(4) | One stop | | L + 5.00% | | N/A(5) | | 06/2021 | | — |
| | (1 | ) | | — |
| | — |
|
LD Intermediate Holdings, Inc.*^ | Senior loan | | L + 5.88% | (c) | 7.19% | | 12/2022 | | 2,540 |
| | 2,362 |
| | 0.2 |
| | 2,390 |
|
Park Place Technologies LLC*^ | Senior loan | | L + 5.00% | (c) | 6.33% | | 06/2022 | | 15,751 |
| | 15,587 |
| | 1.6 |
| | 15,594 |
|
Park Place Technologies LLC(4) | One stop | | L + 5.00% | | N/A(5) | | 06/2022 | | — |
| | (2 | ) | | — |
| | (2 | ) |
Sloan Company, Inc., The# | One stop | | L + 7.25% | (c) | 8.58% | | 04/2020 | | 7,437 |
| | 7,364 |
| | 0.7 |
| | 7,065 |
|
| Sloan Company, Inc., The | One stop | | L + 7.25% | (c) | 8.57% | | 04/2020 | | 33 |
| | 32 |
| | — |
| | 30 |
|
Sovos Compliance*^ | One stop | | L + 6.00% | (a) | 7.24% | | 03/2022 | | 9,328 |
| | 9,186 |
| | 1.0 |
| | 9,235 |
|
Sovos Compliance(4) | One stop | | L + 6.00% | | N/A(5) | | 03/2022 | | — |
| | (2 | ) | | — |
| | (1 | ) |
Sovos Compliance Formerly Taxware, LLC^ | One stop | | L + 6.00% | (a) | 7.24% | | 03/2022 | | 1,569 |
| | 1,546 |
| | 0.2 |
| | 1,553 |
|
| Sovos Compliance Formerly Taxware, LLC | One stop | | L + 6.00% | | N/A(5) | | 03/2022 | | — |
| | — |
| | — |
| | — |
|
| Watchfire Enterprises, Inc. | Second Lien | | L + 8.00% | (c) | 9.33% | | 10/2021 | | 9,434 |
| | 9,306 |
| | 1.0 |
| | 9,434 |
|
| | | | | | | | | | 84,984 |
| | 83,847 |
| | 8.8 |
| | 84,190 |
|
| Grocery | | | | | | | | | | | | | | | |
MyWebGrocer, Inc.* | One stop | | L + 8.75% | (a) | 10.00% | | 10/2017 | | 14,271 |
| | 14,265 |
| | 1.5 |
| | 14,271 |
|
| | | | | | | | | | | | | | | | |
| Healthcare, Education and Childcare | | | | | | | | | |
| | |
| | |
| | |
|
| Active Day, Inc. | One stop | | L + 6.00% | (a) | 7.24% | | 12/2021 | | 13,401 |
| | 13,145 |
| | 1.4 |
| | 13,401 |
|
Active Day, Inc.^ | One stop | | L + 6.00% | (a) | 7.24% | | 12/2021 | | 1,034 |
| | 1,021 |
| | 0.1 |
| | 1,034 |
|
| Active Day, Inc. | One stop | | L + 6.00% | (a) | 7.24% | | 12/2021 | | 666 |
| | 660 |
| | 0.1 |
| | 666 |
|
| Active Day, Inc. | One stop | | L + 6.00% | (a) | 7.24% | | 12/2021 | | 460 |
| | 455 |
| | — |
| | 460 |
|
Active Day, Inc.(4) | One stop | | L + 6.00% | | N/A(5) | | 12/2021 | | — |
| | (1 | ) | | — |
| | — |
|
Active Day, Inc.(4) | One stop | | L + 6.00% | | N/A(5) | | 12/2021 | | — |
| | (3 | ) | | — |
| | — |
|
| Acuity Eyecare Holdings, LLC | One stop | | L + 6.75% | (b)(c) | 8.04% | | 03/2022 | | 3,614 |
| | 3,533 |
| | 0.4 |
| | 3,614 |
|
| Acuity Eyecare Holdings, LLC | One stop | | L + 6.75% | (c) | 8.06% | | 03/2022 | | 38 |
| | 36 |
| | — |
| | 38 |
|
Acuity Eyecare Holdings, LLC(4) | One stop | | L + 6.75% | | N/A(5) | | 03/2022 | | — |
| | (1 | ) | | — |
| | — |
|
| ADCS Clinics Intermediate Holdings, LLC | One stop | | L + 5.75% | (c) | 7.08% | | 05/2022 | | 21,281 |
| | 20,788 |
| | 2.2 |
| | 20,855 |
|
ADCS Clinics Intermediate Holdings, LLC* | One stop | | L + 5.75% | (c) | 7.08% | | 05/2022 | | 108 |
| | 107 |
| | — |
| | 106 |
|
| ADCS Clinics Intermediate Holdings, LLC | One stop | | P + 4.75% | (e) | 9.00% | | 05/2022 | | 95 |
| | 93 |
| | — |
| | 93 |
|
ADCS Clinics Intermediate Holdings, LLC* | One stop | | L + 5.75% | (c) | 7.08% | | 05/2022 | | 32 |
| | 31 |
| | — |
| | 31 |
|
| ADCS Clinics Intermediate Holdings, LLC | One stop | | P + 4.75% | (e) | 9.00% | | 05/2022 | | 5 |
| | 2 |
| | — |
| | 5 |
|
Agilitas USA, Inc.# | One stop | | L + 6.00% | (c) | 7.30% | | 04/2022 | | 8,439 |
| | 8,362 |
| | 0.9 |
| | 8,439 |
|
See Notes to Consolidated Financial Statements.
95128
Golub Capital BDC, Inc. and Subsidiaries
Consolidated Schedule of Investments - (continued)
September 30, 20162017
(In thousands)
|
| | | | | | | | | | | | | | | | | | | | | | |
| | Investment Type | | Spread Above Index(1) | | Interest Rate(2) | | Maturity Date | | Principal/Par Amount(3) | | Amortized Cost | | Percentage of Net Assets | | Fair Value |
| Healthcare, Education and Childcare – (continued) | | | | | | | | | | | | | | | |
Katena Holdings, Inc.^ | One stop | | L + 6.25% | | 7.25% | | 06/2021 | | $ | 8,699 |
| | $ | 8,627 |
| | 1.0 |
| % | $ | 8,699 |
|
| Katena Holdings, Inc. | One stop | | P + 5.25% | | 8.75% | | 06/2021 | | 850 |
| | 843 |
| | 0.1 |
| | 850 |
|
| Katena Holdings, Inc. | One stop | | P + 5.25% | | 8.75% | | 06/2021 | | 13 |
| | 12 |
| | — |
| | 13 |
|
| Lombart Brothers, Inc. | One stop | | L + 6.75% | | 7.75% | | 04/2022 | | 3,508 |
| | 3,411 |
| | 0.4 |
| | 3,508 |
|
| Lombart Brothers, Inc. | One stop | | L + 6.75% | | 7.75% | | 04/2022 | | 8 |
| | 7 |
| | — |
| | 8 |
|
Maverick Healthcare Group, LLC* | Senior loan | | L + 7.50% | | 7.25% cash/2.00% PIK | | 04/2017 | | 1,921 |
| | 1,915 |
| | 0.2 |
| | 1,921 |
|
| Northwestern Management Services, LLC (Sage Dental) | One stop | | L + 5.25% | | 6.50% | | 10/2019 | | 72 |
| | 71 |
| | — |
| | 71 |
|
| Northwestern Management Services, LLC (Sage Dental) | One stop | | P + 4.00% | | 7.50% | | 10/2019 | | 17 |
| | 16 |
| | — |
| | 16 |
|
Northwestern Management Services, LLC (Sage Dental)(4) | One stop | | L + 5.25% | | N/A(5) | | 10/2019 | | — |
| | (2 | ) | | — |
| | (3 | ) |
| Oliver Street Dermatology Holdings, LLC | One stop | | L + 6.50% | | 7.50% | | 05/2022 | | 8,605 |
| | 8,369 |
| | 1.0 |
| | 8,605 |
|
| Oliver Street Dermatology Holdings, LLC | One stop | | L + 6.50% | | 7.50% | | 05/2022 | | 58 |
| | 57 |
| | — |
| | 58 |
|
Oliver Street Dermatology Holdings, LLC(4) | One stop | | L + 6.50% | | N/A(5) | | 05/2022 | | — |
| | (3 | ) | | — |
| | — |
|
| Pinnacle Treatment Centers, Inc. | One stop | | L + 6.25% | | 7.25% | | 08/2021 | | 10,081 |
| | 9,812 |
| | 1.1 |
| | 9,980 |
|
| Pinnacle Treatment Centers, Inc. | One stop | | P + 5.00% | | 8.50% | | 08/2021 | | 5 |
| | 3 |
| | — |
| | 4 |
|
Pinnacle Treatment Centers, Inc.(4) | One stop | | L + 6.25% | | N/A(5) | | 08/2021 | | — |
| | (3 | ) | | — |
| | (1 | ) |
PPT Management, LLC# | One stop | | L + 5.00% | | 6.00% | | 04/2020 | | 4,179 |
| | 4,143 |
| | 0.5 |
| | 4,179 |
|
| PPT Management, LLC | One stop | | L + 5.00% | | 6.00% | | 04/2020 | | 137 |
| | 136 |
| | — |
| | 137 |
|
PPT Management, LLC(4) | One stop | | L + 5.00% | | N/A(5) | | 04/2020 | | — |
| | (1 | ) | | — |
| | — |
|
Premise Health Holding Corp.# | One stop | | L + 4.50% | | 5.50% | | 06/2020 | | 14,963 |
| | 14,881 |
| | 1.7 |
| | 14,963 |
|
Premise Health Holding Corp.(4) | One stop | | L + 4.50% | | N/A(5) | | 06/2020 | | — |
| | (16 | ) | | — |
| | — |
|
Pyramid Healthcare, Inc.# | One stop | | L + 5.75% | | 6.75% | | 08/2019 | | 1,484 |
| | 1,471 |
| | 0.2 |
| | 1,484 |
|
Radiology Partners, Inc.# | One stop | | L + 5.50% | | 6.50% | | 09/2020 | | 22,570 |
| | 22,295 |
| | 2.6 |
| | 22,344 |
|
| Radiology Partners, Inc. | One stop | | L + 5.50% | | 6.50% | | 09/2020 | | 708 |
| | 708 |
| | 0.1 |
| | 701 |
|
Radiology Partners, Inc.(4) | One stop | | L + 5.50% | | N/A(5) | | 09/2020 | | — |
| | (4 | ) | | — |
| | (4 | ) |
Radiology Partners, Inc.(4) | One stop | | L + 5.50% | | N/A(5) | | 09/2020 | | — |
| | (18 | ) | | — |
| | (8 | ) |
Reliant Pro ReHab, LLC* | Senior loan | | L + 5.00% | | 6.00% | | 12/2017 | | 2,548 |
| | 2,533 |
| | 0.3 |
| | 2,548 |
|
| Reliant Pro ReHab, LLC | Senior loan | | P + 4.00% | | 7.50% | | 12/2017 | | 59 |
| | 54 |
| | — |
| | 59 |
|
RXH Buyer Corporation*^ | One stop | | L + 5.75% | | 6.75% | | 09/2021 | | 17,435 |
| | 17,148 |
| | 1.9 |
| | 16,738 |
|
| RXH Buyer Corporation | One stop | | L + 5.75% | | 6.75% | | 09/2021 | | 1,973 |
| | 1,940 |
| | 0.2 |
| | 1,894 |
|
| RXH Buyer Corporation | One stop | | P + 4.75% | | 8.25% | | 09/2021 | | 35 |
| | 32 |
| | — |
| | 27 |
|
RXH Buyer Corporation(4) | One stop | | L + 5.75% | | N/A(5) | | 09/2021 | | — |
| | (14 | ) | | — |
| | (34 | ) |
| Southern Anesthesia and Surgical | One stop | | L + 5.50% | | 6.50% | | 11/2017 | | 5,537 |
| | 5,502 |
| | 0.6 |
| | 5,537 |
|
Southern Anesthesia and Surgical^ | One stop | | L + 5.50% | | 6.50% | | 11/2017 | | 2,715 |
| | 2,701 |
| | 0.3 |
| | 2,715 |
|
Southern Anesthesia and Surgical(4) | One stop | | L + 5.50% | | N/A(5) | | 11/2017 | | — |
| | (3 | ) | | — |
| | — |
|
Spear Education, LLC# | One stop | | L + 6.00% | | 7.00% | | 08/2019 | | 4,732 |
| | 4,697 |
| | 0.5 |
| | 4,732 |
|
| Spear Education, LLC | One stop | | L + 6.00% | | 7.00% | | 08/2019 | | 76 |
| | 76 |
| | — |
| | 76 |
|
| Spear Education, LLC | One stop | | L + 6.00% | | N/A(5) | | 08/2019 | | — |
| | — |
| | — |
| | — |
|
Summit Behavioral Holdings I, LLC* | One stop | | L + 5.00% | | 6.00% | | 06/2021 | | 4,382 |
| | 4,330 |
| | 0.5 |
| | 4,382 |
|
Summit Behavioral Holdings I, LLC(4) | One stop | | L + 5.00% | | N/A(5) | | 06/2021 | | — |
| | (1 | ) | | — |
| | — |
|
Summit Behavioral Holdings I, LLC(4) | One stop | | L + 5.00% | | N/A(5) | | 06/2021 | | — |
| | (2 | ) | | — |
| | — |
|
Surgical Information Systems, LLC^ | Senior loan | | L + 3.00% | | 4.50% | | 09/2018 | | 1,701 |
| | 1,699 |
| | 0.2 |
| | 1,701 |
|
U.S. Anesthesia Partners, Inc.# | One stop | | L + 5.00% | | 6.12% | | 12/2019 | | 5,882 |
| | 5,864 |
| | 0.7 |
| | 5,882 |
|
WIRB-Copernicus Group, Inc.*^ | Senior loan | | L + 5.00% | | 6.00% | | 08/2022 | | 9,912 |
| | 9,815 |
| | 1.1 |
| | 9,812 |
|
WIRB-Copernicus Group, Inc.(4) | Senior loan | | L + 5.00% | | N/A(5) | | 08/2022 | | — |
| | (1 | ) | | — |
| | (1 | ) |
Young Innovations, Inc.*# | Senior loan | | L + 4.25% | | 5.25% | | 01/2019 | | 1,733 |
| | 1,725 |
| | 0.2 |
| | 1,739 |
|
Young Innovations, Inc.* | Senior loan | | L + 4.75% | | 5.75% | | 01/2019 | | 304 |
| | 299 |
| | 0.1 |
| | 308 |
|
| Young Innovations, Inc. | Senior loan | | P + 3.25% | | 6.75% | | 01/2018 | | 34 |
| | 34 |
| | — |
| | 33 |
|
| | | | | | | | | | 314,488 |
| | 309,976 |
| | 35.4 |
| | 311,635 |
|
|
| | | | | | | | | | | | | | | | | | | | | | | |
| | Investment | | Spread Above Index(1) | Interest
Rate(2) | | Maturity Date | | Principal ($) / Shares(3) | | Amortized Cost | | Percentage of Net Assets | | Fair Value (16) |
| Healthcare, Education and Childcare - (continued) | | | | | | | | | | | | | | |
| Agilitas USA, Inc. | One stop | | L + 6.00% | (c) | 7.30% | | 04/2022 | | $ | 10 |
| | $ | 9 |
| | $ | — |
| % | $ | 10 |
|
Agilitas USA, Inc.(4) | One stop | | L + 6.00% | | N/A(5) | | 04/2022 | | — |
| | (1 | ) | | — |
| | — |
|
Aris Teleradiology Company, LLC* | Senior loan | | L + 5.50% | (c) | 6.83% | | 03/2021 | | 2,699 |
| | 2,679 |
| | 0.2 |
| | 2,322 |
|
| Aris Teleradiology Company, LLC | Senior loan | | L + 5.50% | (c) | 6.81% | | 03/2021 | | 25 |
| | 25 |
| | — |
| | 21 |
|
Avalign Technologies, Inc.^ | Senior loan | | L + 4.50% | (a) | 5.74% | | 07/2021 | | 1,442 |
| | 1,437 |
| | 0.2 |
| | 1,438 |
|
BIORECLAMATIONIVT, LLC*^# | One stop | | L + 5.75% | (a) | 6.99% | | 01/2021 | | 15,764 |
| | 15,586 |
| | 1.7 |
| | 15,764 |
|
| BIORECLAMATIONIVT, LLC | One stop | | P + 4.75% | (e) | 9.00% | | 01/2021 | | 55 |
| | 54 |
| | — |
| | 55 |
|
California Cryobank, LLC^ | One stop | | L + 5.50% | (c) | 6.83% | | 08/2019 | | 1,479 |
| | 1,473 |
| | 0.2 |
| | 1,479 |
|
California Cryobank, LLC^ | One stop | | L + 5.50% | (c) | 6.83% | | 08/2019 | | 567 |
| | 561 |
| | 0.1 |
| | 567 |
|
California Cryobank, LLC^ | One stop | | L + 5.50% | (c) | 6.83% | | 08/2019 | | 189 |
| | 189 |
| | — |
| | 189 |
|
California Cryobank, LLC(4) | One stop | | L + 5.50% | | N/A(5) | | 08/2019 | | — |
| | (1 | ) | | — |
| | — |
|
CLP Healthcare Services, Inc.^ | Senior loan | | L + 5.25% | (c) | 6.58% | | 12/2020 | | 3,924 |
| | 3,897 |
| | 0.4 |
| | 3,846 |
|
Curo Health Services LLC# | Senior loan | | L + 4.00% | (b)(c) | 5.31% | | 02/2022 | | 3,273 |
| | 3,261 |
| | 0.3 |
| | 3,283 |
|
DCA Investment Holding, LLC*^# | One stop | | L + 5.25% | (c) | 6.58% | | 07/2021 | | 18,776 |
| | 18,515 |
| | 2.0 |
| | 18,776 |
|
DCA Investment Holding, LLC*^# | One stop | | L + 5.25% | (c) | 6.58% | | 07/2021 | | 13,467 |
| | 13,355 |
| | 1.4 |
| | 13,467 |
|
DCA Investment Holding, LLC# | One stop | | L + 5.25% | (c) | 6.58% | | 07/2021 | | 2,475 |
| | 2,436 |
| | 0.3 |
| | 2,475 |
|
| DCA Investment Holding, LLC | One stop | | P + 4.25% | (e) | 8.50% | | 07/2021 | | 657 |
| | 645 |
| | 0.1 |
| | 657 |
|
DCA Investment Holding, LLC(4) | One stop | | L + 5.25% | | N/A(5) | | 07/2021 | | — |
| | (3 | ) | | — |
| | — |
|
Deca Dental Management LLC*^ | One stop | | L + 6.25% | (c) | 7.58% | | 07/2020 | | 4,086 |
| | 4,052 |
| | 0.4 |
| | 4,086 |
|
| Deca Dental Management LLC | One stop | | L + 6.25% | (a)(c) | 7.57% | | 07/2020 | | 497 |
| | 493 |
| | 0.1 |
| | 497 |
|
| Deca Dental Management LLC | One stop | | L + 6.25% | (a) | 7.49% | | 07/2020 | | 50 |
| | 50 |
| | — |
| | 50 |
|
Deca Dental Management LLC(4) | One stop | | L + 6.25% | | N/A(5) | | 07/2020 | | — |
| | (2 | ) | | — |
| | — |
|
Delta Educational Systems*(6) | Senior loan | | P + 6.75% | (e) | 9.00% cash/2.00% PIK | | 12/2018 | | 1,438 |
| | 1,433 |
| | — |
| | — |
|
Delta Educational Systems(4)(6) | Senior loan | | L + 6.00% | | N/A(5) | | 12/2018 | | — |
| | — |
| | — |
| | (60 | ) |
| Dental Holdings Corporation | One stop | | L + 5.50% | (c) | 6.81% | | 02/2020 | | 7,436 |
| | 7,339 |
| | 0.8 |
| | 7,287 |
|
| Dental Holdings Corporation | One stop | | L + 5.50% | (b) | 6.78% | | 02/2020 | | 1,133 |
| | 1,121 |
| | 0.1 |
| | 1,110 |
|
| Dental Holdings Corporation | One stop | | L + 5.50% | (c) | 6.82% | | 02/2020 | | 220 |
| | 211 |
| | — |
| | 198 |
|
eSolutions, Inc.*^ | One stop | | L + 6.50% | (a) | 7.74% | | 03/2022 | | 20,091 |
| | 19,787 |
| | 2.1 |
| | 20,091 |
|
eSolutions, Inc.(4) | One stop | | L + 6.50% | | N/A(5) | | 03/2022 | | — |
| | (1 | ) | | — |
| | — |
|
Excelligence Learning Corporation^ | One stop | | L + 6.00% | (a) | 7.24% | | 04/2023 | | 4,854 |
| | 4,809 |
| | 0.5 |
| | 4,854 |
|
| Eyecare Services Partners Holdings LLC | One stop | | L + 6.25% | (c) | 7.58% | | 05/2023 | | 8,006 |
| | 7,800 |
| | 0.8 |
| | 8,006 |
|
| Eyecare Services Partners Holdings LLC | One stop | | P + 5.25% | (e) | 9.50% | | 05/2023 | | 17 |
| | 14 |
| | — |
| | 17 |
|
Eyecare Services Partners Holdings LLC(4) | One stop | | L + 6.25% | | N/A(5) | | 05/2023 | | — |
| | (4 | ) | | — |
| | — |
|
Eyecare Services Partners Holdings LLC(4) | One stop | | L + 6.25% | | N/A(5) | | 05/2023 | | — |
| | (5 | ) | | — |
| | — |
|
G & H Wire Company, Inc.# | One stop | | L + 5.50% | (c) | 6.81% | | 09/2023 | | 5,642 |
| | 5,572 |
| | 0.6 |
| | 5,585 |
|
G & H Wire Company, Inc.(4) | One stop | | L + 5.50% | | N/A(5) | | 09/2023 | | — |
| | (1 | ) | | — |
| | (1 | ) |
Immucor, Inc. # | Senior loan | | L + 5.00% | (a) | 6.24% | | 06/2021 | | 1,613 |
| | 1,592 |
| | 0.2 |
| | 1,639 |
|
Joerns Healthcare, LLC*^ | One stop | | L + 6.50% | (c) | 7.82% | | 05/2020 | | 3,497 |
| | 3,462 |
| | 0.3 |
| | 3,281 |
|
| Kareo, Inc. | One stop | | L + 9.00% | (b) | 10.27% | | 06/2022 | | 4,518 |
| | 4,303 |
| | 0.5 |
| | 4,518 |
|
| Kareo, Inc. | One stop | | L + 9.00% | | N/A(5) | | 06/2022 | | — |
| | — |
| | — |
| | — |
|
Katena Holdings, Inc.^ | One stop | | L + 6.25% | (c) | 7.58% | | 06/2021 | | 8,611 |
| | 8,555 |
| | 0.9 |
| | 8,439 |
|
Katena Holdings, Inc.^ | One stop | | L + 6.25% | (c) | 7.58% | | 06/2021 | | 841 |
| | 836 |
| | 0.1 |
| | 824 |
|
| Katena Holdings, Inc. | One stop | | P + 5.25% | (e) | 9.50% | | 06/2021 | | 64 |
| | 63 |
| | — |
| | 62 |
|
Lombart Brothers, Inc.# | One stop | | L + 6.75% | (c) | 8.08% | | 04/2022 | | 3,631 |
| | 3,548 |
| | 0.4 |
| | 3,631 |
|
Lombart Brothers, Inc.#(7) | One stop | | L + 6.75% | (c) | 8.08% | | 04/2022 | | 1,664 |
| | 1,639 |
| | 0.2 |
| | 1,664 |
|
| Lombart Brothers, Inc. | One stop | | P + 5.50% | (e) | 9.75% | | 04/2022 | | 36 |
| | 35 |
| | — |
| | 36 |
|
Lombart Brothers, Inc.(7) | One stop | | L + 6.75% | | N/A(5) | | 04/2022 | | — |
| | — |
| | — |
| | — |
|
See Notes to Consolidated Financial Statements.
96129
Golub Capital BDC, Inc. and Subsidiaries
Consolidated Schedule of Investments - (continued)
September 30, 20162017
(In thousands)
|
| | | | | | | | | | | | | | | | | | | | | | |
| | Investment Type | | Spread Above Index(1) | | Interest Rate(2) | | Maturity Date | | Principal/Par Amount(3) | | Amortized Cost | | Percentage of Net Assets | | Fair Value |
| Home and Office Furnishings, Housewares, and Durable Consumer | | | | | | | | | | | | | | | |
Plano Molding Company, LLC*^# | One stop | | L + 6.50% | | 7.50% | | 05/2021 | | $ | 17,934 |
| | $ | 17,796 |
| | 1.9 |
| % | $ | 16,498 |
|
| Hotels, Motels, Inns, and Gaming | | | | | | | | | |
| | |
| | |
| | |
|
Aimbridge Hospitality, LLC^ | Senior loan | | L + 4.50% | | 5.75% | | 10/2018 | | 815 |
| | 804 |
| | 0.1 |
| | 815 |
|
| | | | | | | | | | | | | | | | |
| Insurance | | | | | | | | | | | | | | | |
Captive Resources Midco, LLC*^# | One stop | | L + 5.75% | | 6.75% | | 06/2020 | | 26,127 |
| | 25,876 |
| | 3.0 |
| | 26,127 |
|
Captive Resources Midco, LLC(4) | One stop | | L + 5.75% | | N/A(5) | | 06/2020 | | — |
| | (16 | ) | | — |
| | — |
|
Captive Resources Midco, LLC(4) | One stop | | L + 5.75% | | N/A(5) | | 06/2020 | | — |
| | (17 | ) | | — |
| | — |
|
Higginbotham Insurance Agency, Inc.* | Senior loan | | L + 5.25% | | 6.25% | | 11/2021 | | 1,301 |
| | 1,290 |
| | 0.1 |
| | 1,303 |
|
| Internet Pipeline, Inc. | One stop | | L + 7.25% | | 8.25% | | 08/2022 | | 4,910 |
| | 4,797 |
| | 0.6 |
| | 4,910 |
|
Internet Pipeline, Inc.(4) | One stop | | L + 7.25% | | N/A(5) | | 08/2021 | | — |
| | (1 | ) | | — |
| | — |
|
RSC Acquisition, Inc.# | Senior loan | | L + 5.25% | | 6.25% | | 11/2022 | | 629 |
| | 624 |
| | 0.1 |
| | 629 |
|
| | | | | | | | | | 32,967 |
| | 32,553 |
| | 3.8 |
| | 32,969 |
|
| Leisure, Amusement, Motion Pictures and Entertainment | | | | | | | | | | | | | | | |
NFD Operating, LLC* | One stop | | L + 7.00% | | 8.25% | | 06/2021 | | 2,349 |
| | 2,315 |
| | 0.3 |
| | 2,349 |
|
| NFD Operating, LLC | One stop | | L + 7.00% | | N/A(5) | | 06/2021 | | — |
| | — |
| | — |
| | — |
|
NFD Operating, LLC(4) | One stop | | L + 7.00% | | N/A(5) | | 06/2021 | | — |
| | (1 | ) | | — |
| | — |
|
Self Esteem Brands, LLC^ | Senior loan | | L + 4.00% | | 5.00% | | 02/2020 | | 2,934 |
| | 2,924 |
| | 0.3 |
| | 2,934 |
|
Self Esteem Brands, LLC(4) | Senior loan | | L + 4.00% | | N/A(5) | | 02/2020 | | — |
| | (3 | ) | | — |
| | — |
|
| Teaching Company, The | One stop | | L + 6.25% | | 7.25% | | 08/2020 | | 18,926 |
| | 18,705 |
| | 2.2 |
| | 18,926 |
|
| Teaching Company, The | One stop | | L + 6.25% | | 7.25% | | 08/2020 | | 40 |
| | 39 |
| | — |
| | 40 |
|
Titan Fitness, LLC* | One stop | | L + 6.50% | | 7.75% | | 09/2019 | | 13,223 |
| | 13,070 |
| | 1.5 |
| | 13,223 |
|
| Titan Fitness, LLC | One stop | | L + 6.50% | | 7.75% | | 09/2019 | | 1,747 |
| | 1,733 |
| | 0.2 |
| | 1,747 |
|
| Titan Fitness, LLC | One stop | | L + 6.50% | | 7.75% | | 09/2019 | | 582 |
| | 546 |
| | 0.1 |
| | 582 |
|
| Titan Fitness, LLC | One stop | | P + 5.25% | | 8.75% | | 09/2019 | | 419 |
| | 406 |
| | — |
| | 419 |
|
| | | | | | | | | | 40,220 |
| | 39,734 |
| | 4.6 |
| | 40,220 |
|
| Mining, Steel, Iron and Non-Precious Metals | | | | | | | | | | | | | | | |
Benetech, Inc.* | One stop | | L + 9.00% | | 10.25% | | 10/2017 | | 4,425 |
| | 4,413 |
| | 0.4 |
| | 3,894 |
|
| Benetech, Inc. | One stop | | P + 7.75% | | 11.25% | | 10/2017 | | 152 |
| | 149 |
| | — |
| | 20 |
|
| | | | | | | | | | 4,577 |
| | 4,562 |
| | 0.4 |
| | 3,914 |
|
| Oil and Gas | | | | | | | | | | | | | | | |
Drilling Info, Inc.^#(9) | One stop | | L + 5.50% | | 6.50% | | 06/2020 | | 1,806 |
| | 1,782 |
| | 0.2 |
| | 1,792 |
|
Drilling Info, Inc.(9) | One stop | | L + 5.50% | | 6.50% | | 06/2020 | | 516 |
| | 506 |
| | 0.1 |
| | 513 |
|
Drilling Info, Inc.(4)(9) | One stop | | L + 5.50% | | N/A(5) | | 06/2020 | | — |
| | (1 | ) | | — |
| | — |
|
| | | | | | | | | | 2,322 |
| | 2,287 |
| | 0.3 |
| | 2,305 |
|
| Personal and Non-Durable Consumer Products | | | | | | | | | | | | | | | |
| Georgica Pine Clothiers, LLC | One Stop | | L + 5.50% | | 6.50% | | 11/2021 | | 5,736 |
| | 5,638 |
| | 0.7 |
| | 5,736 |
|
Georgica Pine Clothiers, LLC^ | One Stop | | L + 5.50% | | 6.50% | | 11/2021 | | 500 |
| | 495 |
| | 0.1 |
| | 500 |
|
Georgica Pine Clothiers, LLC(4) | One Stop | | L + 5.50% | | N/A(5) | | 11/2021 | | — |
| | (1 | ) | | — |
| | — |
|
Massage Envy, LLC* | One Stop | | L + 7.25% | | 8.50% | | 09/2018 | | 15,151 |
| | 15,025 |
| | 1.7 |
| | 15,151 |
|
Massage Envy, LLC(4) | One Stop | | L + 7.25% | | N/A(5) | | 09/2018 | | — |
| | (6 | ) | | — |
| | — |
|
Orthotics Holdings, Inc *# | One Stop | | L + 5.00% | | 6.00% | | 02/2020 | | 8,375 |
| | 8,303 |
| | 0.9 |
| | 7,956 |
|
Orthotics Holdings, Inc *#(7) | One Stop | | L + 5.00% | | 6.00% | | 02/2020 | | 1,373 |
| | 1,361 |
| | 0.1 |
| | 1,304 |
|
| Orthotics Holdings, Inc | One Stop | | L + 5.00% | | 6.00% | | 02/2020 | | 139 |
| | 129 |
| | — |
| | 77 |
|
Orthotics Holdings, Inc (4) | One Stop | | L + 5.00% | | N/A(5) | | 02/2020 | | — |
| | (12 | ) | | — |
| | (70 | ) |
|
| | | | | | | | | | | | | | | | | | | | | | | |
| | Investment | | Spread Above Index(1) | Interest
Rate(2) | | Maturity Date | | Principal ($) / Shares(3) | | Amortized Cost | | Percentage of Net Assets | | Fair Value (16) |
| Healthcare, Education and Childcare - (continued) | | | | | | | | | | | | | | |
Maverick Healthcare Group, LLC* | Senior loan | | L + 7.50% | (a) | 7.25% cash/2.00% PIK | | 12/2017 | | $ | 1,959 |
| | $ | 1,959 |
| | $ | 0.2 |
| % | $ | 1,900 |
|
| Maverick Healthcare Group, LLC | Senior loan | | P + 6.50% | (e) | 5.25% cash/5.50% PIK | | 12/2017 | | 82 |
| | 82 |
| | — |
| | 82 |
|
MWD Management, LLC & MWD Services, Inc.# | One stop | | L + 5.25% | (c) | 6.58% | | 06/2023 | | 5,925 |
| | 5,854 |
| | 0.6 |
| | 5,925 |
|
MWD Management, LLC & MWD Services, Inc.(4) | One stop | | L + 5.25% | | N/A(5) | | 06/2022 | | — |
| | (1 | ) | | — |
| | — |
|
MWD Management, LLC & MWD Services, Inc.(4) | One stop | | L + 5.25% | | N/A(5) | | 06/2023 | | — |
| | (2 | ) | | — |
| | — |
|
| Oliver Street Dermatology Holdings, LLC | One stop | | L + 6.50% | (c) | 7.83% | | 05/2022 | | 9,434 |
| | 9,226 |
| | 1.0 |
| | 9,434 |
|
| Oliver Street Dermatology Holdings, LLC | One stop | | L + 6.50% | (c) | 7.83% | | 05/2022 | | 952 |
| | 938 |
| | 0.1 |
| | 952 |
|
| Oliver Street Dermatology Holdings, LLC | One stop | | L + 6.50% | (a)(b)(c) | 7.78% | | 05/2022 | | 201 |
| | 199 |
| | — |
| | 201 |
|
| Oliver Street Dermatology Holdings, LLC | One stop | | L + 6.50% | (c) | 7.81% | | 05/2022 | | 46 |
| | 45 |
| | — |
| | 46 |
|
Oliver Street Dermatology Holdings, LLC* | One stop | | L + 6.50% | (c) | 7.83% | | 05/2022 | | 42 |
| | 41 |
| | — |
| | 42 |
|
| Oliver Street Dermatology Holdings, LLC | One stop | | L + 6.50% | (c) | 7.83% | | 05/2022 | | 33 |
| | 32 |
| | — |
| | 33 |
|
| Oliver Street Dermatology Holdings, LLC | One stop | | L + 6.50% | (c) | 7.83% | | 05/2022 | | 30 |
| | 30 |
| | — |
| | 30 |
|
Oliver Street Dermatology Holdings, LLC(4) | One stop | | L + 6.50% | | N/A(5) | | 05/2022 | | — |
| | (1 | ) | | — |
| | — |
|
Oliver Street Dermatology Holdings, LLC(4) | One stop | | L + 6.50% | | N/A(5) | | 05/2022 | | — |
| | (1 | ) | | — |
| | — |
|
| Pinnacle Treatment Centers, Inc. | One stop | | L + 6.25% | (b) | 7.53% | | 08/2021 | | 9,980 |
| | 9,768 |
| | 1.0 |
| | 9,980 |
|
| Pinnacle Treatment Centers, Inc. | One stop | | P + 5.00% | (e) | 9.25% | | 08/2021 | | 30 |
| | 29 |
| | — |
| | 30 |
|
Pinnacle Treatment Centers, Inc.(4) | One stop | | L + 6.25% | | N/A(5) | | 08/2021 | | — |
| | (2 | ) | | — |
| | — |
|
PPT Management Holdings, LLC^ | One stop | | L + 6.00% | (c) | 7.33% | | 12/2022 | | 10,223 |
| | 10,022 |
| | 1.0 |
| | 10,018 |
|
| PPT Management Holdings, LLC | One stop | | L + 6.00% | (c) | 7.33% | | 12/2022 | | 135 |
| | 132 |
| | — |
| | 132 |
|
| PPT Management Holdings, LLC | One stop | | L + 6.00% | (a) | 7.24% | | 12/2022 | | 50 |
| | 46 |
| | — |
| | 46 |
|
Premise Health Holding Corp.*^# | One stop | | L + 4.50% | (c) | 5.83% | | 06/2020 | | 14,812 |
| | 14,753 |
| | 1.5 |
| | 14,812 |
|
Premise Health Holding Corp.(4) | One stop | | L + 4.50% | | N/A(5) | | 06/2020 | | — |
| | (12 | ) | | — |
| | — |
|
| Pyramid Healthcare, Inc. | One stop | | L + 6.50% | (a) | 7.74% | | 08/2019 | | 150 |
| | 148 |
| | — |
| | 150 |
|
Radiology Partners, Inc.^# | One stop | | L + 5.75% | (c) | 7.08% | | 09/2020 | | 22,345 |
| | 22,111 |
| | 2.3 |
| | 22,345 |
|
| Radiology Partners, Inc. | One stop | | L + 5.75% | (c) | 7.08% | | 09/2020 | | 925 |
| | 909 |
| | 0.1 |
| | 925 |
|
| Radiology Partners, Inc. | One stop | | L + 5.75% | (c) | 7.08% | | 09/2020 | | 701 |
| | 700 |
| | 0.1 |
| | 701 |
|
Radiology Partners, Inc.(4) | One stop | | L + 5.75% | | N/A(5) | | 09/2020 | | — |
| | (4 | ) | | — |
| | — |
|
Reliant Pro ReHab, LLC* | Senior loan | | L + 5.00% | (c) | 6.33% | | 12/2017 | | 2,474 |
| | 2,472 |
| | 0.3 |
| | 2,474 |
|
| Reliant Pro ReHab, LLC | Senior loan | | P + 4.00% | (e) | 8.25% | | 12/2017 | | 352 |
| | 351 |
| | — |
| | 352 |
|
Riverchase MSO, LLC# | Senior loan | | L + 5.25% | (c) | 6.58% | | 10/2022 | | 4,981 |
| | 4,917 |
| | 0.5 |
| | 4,981 |
|
| Riverchase MSO, LLC | Senior loan | | L + 5.25% | (c) | 6.58% | | 10/2022 | | 28 |
| | 27 |
| | — |
| | 28 |
|
RXH Buyer Corporation*^ | One stop | | L + 5.75% | (c) | 7.08% | | 09/2021 | | 17,259 |
| | 17,032 |
| | 1.8 |
| | 16,914 |
|
RXH Buyer Corporation* | One stop | | L + 5.75% | (c) | 7.08% | | 09/2021 | | 1,953 |
| | 1,928 |
| | 0.2 |
| | 1,914 |
|
| RXH Buyer Corporation | One stop | | L + 5.75% | (c)(e) | 7.61% | | 09/2021 | | 55 |
| | 52 |
| | — |
| | 51 |
|
| SLMP, LLC | One stop | | L + 6.00% | (a) | 7.24% | | 05/2023 | | 6,196 |
| | 6,050 |
| | 0.6 |
| | 6,196 |
|
| SLMP, LLC | One stop | | N/A | | 7.50% PIK | | 05/2027 | | 83 |
| | 83 |
| | — |
| | 83 |
|
SLMP, LLC(4) | One stop | | L + 6.00% | | N/A(5) | | 05/2023 | | — |
| | (1 | ) | | — |
| | — |
|
SLMP, LLC(4) | One stop | | L + 6.00% | | N/A(5) | | 05/2023 | | — |
| | (1 | ) | | — |
| | — |
|
Spear Education, LLC^ | One stop | | L + 6.00% | (c) | 7.30% | | 08/2019 | | 4,644 |
| | 4,622 |
| | 0.5 |
| | 4,644 |
|
| Spear Education, LLC | One stop | | L + 6.00% | (c) | 7.30% | | 08/2019 | | 75 |
| | 75 |
| | — |
| | 75 |
|
Spear Education, LLC(4) | One stop | | L + 6.00% | | N/A(5) | | 08/2019 | | — |
| | — |
| | — |
| | (1 | ) |
Summit Behavioral Holdings I, LLC* | One stop | | L + 5.00% | (a) | 6.24% | | 06/2021 | | 4,338 |
| | 4,297 |
| | 0.5 |
| | 4,338 |
|
| Summit Behavioral Holdings I, LLC | One stop | | L + 5.00% | (a) | 6.24% | | 06/2021 | | 113 |
| | 112 |
| | — |
| | 113 |
|
| Summit Behavioral Holdings I, LLC | One stop | | L + 5.00% | (a) | 6.24% | | 06/2021 | | 5 |
| | 5 |
| | — |
| | 5 |
|
WHCG Management, LLC* | Senior loan | | L + 4.75% | (c) | 6.08% | | 03/2023 | | 2,394 |
| | 2,367 |
| | 0.2 |
| | 2,394 |
|
WHCG Management, LLC(4) | Senior loan | | L + 4.75% | | N/A(5) | | 03/2023 | | — |
| | (1 | ) | | — |
| | — |
|
See Notes to Consolidated Financial Statements.
97130
Golub Capital BDC, Inc. and Subsidiaries
Consolidated Schedule of Investments - (continued)
September 30, 20162017
(In thousands)
|
| | | | | | | | | | | | | | | | | | | | | | |
| | Investment Type | | Spread Above Index(1) | | Interest Rate(2) | | Maturity Date | | Principal/Par Amount(3) | | Amortized Cost | | Percentage of Net Assets | | Fair Value |
| Personal and Non-Durable Consumer Products – (continued) | | | | | | | | | | | | | | | |
Orthotics Holdings, Inc (4)(7) | One Stop | | L + 5.00% | | N/A(5) | | 02/2020 | | $ | — |
| | $ | (1 | ) | | — |
| % | $ | (7 | ) |
Team Technologies Acquisition Company^ | Senior loan | | L + 5.00% | | 6.25% | | 12/2017 | | 4,660 |
| | 4,644 |
| | 0.5 |
| | 4,613 |
|
Team Technologies Acquisition Company# | Senior loan | | L + 5.50% | | 6.75% | | 12/2017 | | 859 |
| | 854 |
| | 0.1 |
| | 857 |
|
Team Technologies Acquisition Company(4) | Senior loan | | L + 5.00% | | N/A(5) | | 12/2017 | | — |
| | (1 | ) | | — |
| | (3 | ) |
| | | | | | | | | | 36,793 |
| | 36,428 |
| | 4.1 |
| | 36,114 |
|
| Personal and Non-Durable Consumer Products | | | | | | | | | | | | | | | |
| Community Veterinary Partners, LLC | One stop | | L + 5.50% | | 6.50% | | 10/2021 | | 16 |
| | 16 |
| | — |
| | 16 |
|
Focus Brands Inc.*^ | Second lien | | L + 9.00% | | 10.25% | | 08/2018 | | 9,000 |
| | 8,965 |
| | 1.0 |
| | 9,000 |
|
| Ignite Restaurant Group, Inc (Joe's Crab Shack)^ | One stop | | L + 7.00% | | 8.00% | | 02/2019 | | 4,322 |
| | 4,286 |
| | 0.5 |
| | 4,236 |
|
PetVet Care Centers LLC^ | Senior loan | | L + 4.75% | | 5.75% | | 12/2020 | | 5,837 |
| | 5,753 |
| | 0.7 |
| | 5,837 |
|
PetVet Care Centers LLC^ | Senior loan | | L + 4.75% | | 5.75% | | 12/2020 | | 1,219 |
| | 1,203 |
| | 0.1 |
| | 1,219 |
|
PetVet Care Centers LLC(4) | Senior loan | | L + 4.75% | | N/A(5) | | 12/2019 | | — |
| | (9 | ) | | — |
| | — |
|
Vetcor Professional Practices LLC*^# | One stop | | L + 6.25% | | 7.25% | | 04/2021 | | 29,043 |
| | 28,526 |
| | 3.3 |
| | 29,043 |
|
Vetcor Professional Practices LLC* | One stop | | L + 6.25% | | 7.25% | | 04/2021 | | 966 |
| | 956 |
| | 0.1 |
| | 966 |
|
| Vetcor Professional Practices LLC | One stop | | L + 6.25% | | 7.25% | | 04/2021 | | 550 |
| | 501 |
| | 0.1 |
| | 550 |
|
Vetcor Professional Practices LLC# | One stop | | L + 6.25% | | 7.25% | | 04/2021 | | 288 |
| | 285 |
| | — |
| | 288 |
|
| Vetcor Professional Practices LLC | One stop | | L + 6.25% | | 7.25% | | 04/2021 | | 236 |
| | 234 |
| | — |
| | 236 |
|
Vetcor Professional Practices LLC(4) | One stop | | L + 6.25% | | N/A(5) | | 04/2021 | | — |
| | (16 | ) | | — |
| | — |
|
Vetcor Professional Practices LLC(4) | One stop | | L + 6.25% | | N/A(5) | | 04/2021 | | — |
| | (4 | ) | | — |
| | — |
|
Veterinary Specialists of North America, LLC*^ | One stop | | L + 5.25% | | 6.25% | | 07/2021 | | 6,101 |
| | 6,029 |
| | 0.7 |
| | 6,041 |
|
| Veterinary Specialists of North America, LLC | One stop | | L + 5.25% | | 6.25% | | 07/2021 | | 64 |
| | 63 |
| | — |
| | 63 |
|
Veterinary Specialists of North America, LLC(4) | One stop | | L + 5.25% | | N/A(5) | | 07/2021 | | — |
| | (3 | ) | | — |
| | (3 | ) |
Veterinary Specialists of North America, LLC(4) | One stop | | L + 5.25% | | N/A(5) | | 07/2021 | | — |
| | (18 | ) | | — |
| | (13 | ) |
| Wetzel's Pretzels, LLC | One stop | | L + 6.75% | | 7.75% | | 09/2021 | | 7,064 |
| | 6,873 |
| | 0.8 |
| | 6,993 |
|
Wetzel's Pretzels, LLC(4) | One stop | | L + 6.75% | | N/A(5) | | 09/2021 | | — |
| | (1 | ) | | — |
| | — |
|
| | | | | | | | | | 64,706 |
| | 63,639 |
| | 7.3 |
| | 64,472 |
|
| Printing and Publishing | | | | | | | | | | | | | | | |
Brandmuscle, Inc.# | Senior loan | | L + 5.00% | | 6.00% | | 12/2021 | | 631 |
| | 624 |
| | 0.1 |
| | 636 |
|
Market Track, LLC*^# | One stop | | L + 7.00% | | 8.00% | | 10/2019 | | 28,603 |
| | 28,354 |
| | 3.3 |
| | 28,603 |
|
Market Track, LLC* | One stop | | L + 7.00% | | 8.00% | | 10/2019 | | 2,175 |
| | 2,156 |
| | 0.2 |
| | 2,175 |
|
Market Track, LLC# | One stop | | L + 7.00% | | 8.00% | | 10/2019 | | 2,141 |
| | 2,126 |
| | 0.2 |
| | 2,141 |
|
| Market Track, LLC | One stop | | L + 7.00% | | 8.00% | | 10/2019 | | 1,353 |
| | 1,334 |
| | 0.2 |
| | 1,353 |
|
| Market Track, LLC | One stop | | L + 7.00% | | 8.00% | | 10/2019 | | 1,284 |
| | 1,278 |
| | 0.1 |
| | 1,284 |
|
| Marketo, Inc. | One stop | | L + 9.50% | | 10.50% | | 08/2021 | | 9,940 |
| | 9,649 |
| | 1.1 |
| | 9,791 |
|
Marketo, Inc.(4) | One stop | | L + 9.50% | | N/A(5) | | 08/2021 | | — |
| | (2 | ) | | — |
| | (1 | ) |
| | | | | | | | | | 46,127 |
| | 45,519 |
| | 5.2 |
| | 45,982 |
|
| Retail Stores | | | | | | | | | | | | | | | |
| Batteries Plus Holding Corporation | One stop | | L + 6.75% | | 7.75% | | 07/2022 | | 13,860 |
| | 13,516 |
| | 1.6 |
| | 13,791 |
|
Batteries Plus Holding Corporation(4) | One stop | | L + 6.75% | | N/A(5) | | 07/2022 | | — |
| | (2 | ) | | — |
| | (1 | ) |
CVS Holdings I, LP*^# | One stop | | L + 6.25% | | 7.25% | | 08/2021 | | 22,283 |
| | 21,920 |
| | 2.5 |
| | 21,948 |
|
CVS Holdings I, LP* | One stop | | L + 6.25% | | 7.25% | | 08/2021 | | 321 |
| | 315 |
| | — |
| | 316 |
|
CVS Holdings I, LP(4) | One stop | | L + 6.25% | | N/A(5) | | 08/2020 | | — |
| | (3 | ) | | — |
| | (3 | ) |
CVS Holdings I, LP(4) | One stop | | L + 6.25% | | N/A(5) | | 08/2021 | | — |
| | (8 | ) | | — |
| | (6 | ) |
Cycle Gear, Inc.^ | One stop | | L + 6.50% | | 7.50% | | 01/2020 | | 10,533 |
| | 10,379 |
| | 1.2 |
| | 10,533 |
|
|
| | | | | | | | | | | | | | | | | | | | | | | |
| | Investment | | Spread Above Index(1) | Interest
Rate(2) | | Maturity Date | | Principal ($) / Shares(3) | | Amortized Cost | | Percentage of Net Assets | | Fair Value (16) |
| Healthcare, Education and Childcare - (continued) | | | | | | | | | | | | | | |
WHCG Management, LLC(4) | Senior loan | | L + 4.75% | | N/A(5) | | 03/2023 | | $ | — |
| | $ | (3 | ) | | $ | — |
| % | $ | — |
|
WIRB-Copernicus Group, Inc.*^ | Senior loan | | L + 5.00% | (c) | 6.33% | | 08/2022 | | 9,812 |
| | 9,733 |
| | 1.0 |
| | 9,812 |
|
| WIRB-Copernicus Group, Inc. | Senior loan | | L + 5.00% | | N/A(5) | | 08/2022 | | — |
| | — |
| | — |
| | — |
|
Young Innovations, Inc.* | Senior loan | | L + 5.00% | (c) | 6.33% | | 01/2019 | | 3,587 |
| | 3,566 |
| | 0.4 |
| | 3,587 |
|
| Young Innovations, Inc. | Senior loan | | L + 5.00% | (c) | 6.33% | | 01/2019 | | 9 |
| | 9 |
| | — |
| | 9 |
|
| | | | | | | | | | 328,333 |
| | 323,739 |
| | 33.9 |
| | 324,658 |
|
| Home and Office Furnishings, Housewares, and Durable Consumer | | | | | | | | | | | | | | |
CST Buyer Company^ | Senior loan | | L + 6.25% | (c) | 7.58% | | 03/2023 | | 2,642 |
| | 2,576 |
| | 0.3 |
| | 2,642 |
|
CST Buyer Company(4) | Senior loan | | L + 6.25% | | N/A(5) | | 03/2023 | | — |
| | (1 | ) | | — |
| | — |
|
Plano Molding Company, LLC*^# | One stop | | L + 7.50% | (a) | 8.74% | | 05/2021 | | 14,485 |
| | 14,331 |
| | 1.3 |
| | 12,312 |
|
| | | | | | | | | | 17,127 |
| | 16,906 |
| | 1.6 |
| | 14,954 |
|
| Hotels, Motels, Inns, and Gaming | | | | | | | | | |
| | |
| | |
| | |
|
Aimbridge Hospitality, LLC*^ | One stop | | L + 5.50% | (a) | 6.74% | | 06/2022 | | 10,041 |
| | 9,875 |
| | 1.0 |
| | 10,041 |
|
| Aimbridge Hospitality, LLC | One stop | | L + 5.50% | (a) | 6.74% | | 06/2022 | | 16 |
| | 15 |
| | — |
| | 16 |
|
Aimbridge Hospitality, LLC(4) | One stop | | L + 5.50% | | N/A(5) | | 06/2022 | | — |
| | (1 | ) | | — |
| | — |
|
| | | | | | | | | | 10,057 |
| | 9,889 |
| | 1.0 |
| | 10,057 |
|
| Insurance | | | | | | | | | | | | | | | |
Captive Resources Midco, LLC*^# | One stop | | L + 5.75% | (a) | 6.99% | | 06/2020 | | 24,253 |
| | 24,075 |
| | 2.5 |
| | 24,253 |
|
Captive Resources Midco, LLC(4) | One stop | | L + 5.75% | | N/A(5) | | 06/2020 | | — |
| | (12 | ) | | — |
| | — |
|
Captive Resources Midco, LLC(4) | One stop | | L + 5.75% | | N/A(5) | | 06/2020 | | — |
| | (13 | ) | | — |
| | — |
|
Higginbotham Insurance Agency, Inc.* | Senior loan | | L + 5.00% | (a) | 6.24% | | 11/2021 | | 1,595 |
| | 1,584 |
| | 0.2 |
| | 1,595 |
|
| Internet Pipeline, Inc. | One stop | | L + 7.25% | (a) | 8.49% | | 08/2022 | | 4,847 |
| | 4,743 |
| | 0.5 |
| | 4,917 |
|
Internet Pipeline, Inc.* | One stop | | L + 6.25% | (a) | 7.48% | | 08/2022 | | 2,098 |
| | 2,078 |
| | 0.2 |
| | 2,046 |
|
Internet Pipeline, Inc.* | One stop | | L + 6.25% | (a) | 7.48% | | 08/2022 | | 794 |
| | 786 |
| | 0.1 |
| | 775 |
|
Internet Pipeline, Inc.(4) | One stop | | L + 7.25% | | N/A(5) | | 08/2021 | | — |
| | (1 | ) | | — |
| | 1 |
|
RSC Acquisition, Inc.# | Senior loan | | L + 5.25% | (c) | 6.58% | | 11/2022 | | 919 |
| | 913 |
| | 0.1 |
| | 919 |
|
RSC Acquisition, Inc.(4) | Senior loan | | L + 5.25% | | N/A(5) | | 11/2022 | | — |
| | (1 | ) | | — |
| | — |
|
| | | | | | | | | | 34,506 |
| | 34,152 |
| | 3.6 |
| | 34,506 |
|
| Leisure, Amusement, Motion Pictures, Entertainment | | | | | | | | | | | | | | |
NFD Operating, LLC# | One stop | | L + 7.00% | (c) | 8.30% | | 06/2021 | | 2,325 |
| | 2,299 |
| | 0.2 |
| | 2,325 |
|
| NFD Operating, LLC | One stop | | L + 7.00% | | N/A(5) | | 06/2021 | | — |
| | — |
| | — |
| | — |
|
NFD Operating, LLC(4) | One stop | | L + 7.00% | | N/A(5) | | 06/2021 | | — |
| | (1 | ) | | — |
| | — |
|
PADI Holdco, Inc.*^# | One stop | | L + 6.50% | (c) | 7.84% | | 04/2023 | | 19,550 |
| | 19,278 |
| | 2.1 |
| | 19,550 |
|
| PADI Holdco, Inc. | One stop | | L + 6.50% | (b)(c) | 7.78% | | 04/2022 | | 72 |
| | 70 |
| | — |
| | 72 |
|
Self Esteem Brands, LLC*^# | Senior loan | | L + 4.75% | (a) | 5.99% | | 02/2020 | | 17,983 |
| | 17,889 |
| | 1.9 |
| | 17,983 |
|
Self Esteem Brands, LLC(4) | Senior loan | | L + 4.75% | | N/A(5) | | 02/2020 | | — |
| | (4 | ) | | — |
| | — |
|
| Teaching Company, The | One stop | | L + 7.00% | (a)(c) | 8.32% | | 08/2020 | | 18,835 |
| | 18,673 |
| | 1.9 |
| | 18,459 |
|
| Teaching Company, The | One stop | | L + 7.00% | (a)(e) | 8.24% | | 08/2020 | | 25 |
| | 24 |
| | — |
| | 23 |
|
Titan Fitness, LLC* | One stop | | L + 7.00% | (a) | 8.25% | | 09/2019 | | 13,088 |
| | 12,987 |
| | 1.4 |
| | 13,088 |
|
| Titan Fitness, LLC | One stop | | L + 7.00% | (a) | 8.25% | | 09/2019 | | 1,972 |
| | 1,962 |
| | 0.2 |
| | 1,972 |
|
Titan Fitness, LLC* | One stop | | L + 7.00% | (a) | 8.25% | | 09/2019 | | 1,733 |
| | 1,725 |
| | 0.2 |
| | 1,733 |
|
Titan Fitness, LLC(4) | One stop | | L + 7.00% | | N/A(5) | | 09/2019 | | — |
| | (9 | ) | | — |
| | — |
|
Titan Fitness, LLC(4) | One stop | | L + 7.00% | | N/A(5) | | 09/2019 | | — |
| | (14 | ) | | — |
| | — |
|
| | | | | | | | | | 75,583 |
| | 74,879 |
| | 7.9 |
| | 75,205 |
|
See Notes to Consolidated Financial Statements.
98131
Golub Capital BDC, Inc. and Subsidiaries
Consolidated Schedule of Investments - (continued)
September 30, 20162017
(In thousands)
|
| | | | | | | | | | | | | | | | | | | | | | |
| | Investment Type | | Spread Above Index(1) | | Interest Rate(2) | | Maturity Date | | Principal/Par Amount(3) | | Amortized Cost | | Percentage of Net Assets | | Fair Value |
| Retail Stores – (continued) | | | | | | | | | | | | | | | |
Cycle Gear, Inc.(4) | One stop | | L + 6.50% | | N/A(5) | | 01/2020 | | $ | — |
| | $ | (17 | ) | | — |
| % | $ | — |
|
Cycle Gear, Inc.(4) | One stop | | L + 6.50% | | N/A(5) | | 01/2020 | | — |
| | (9 | ) | | — |
| | — |
|
DTLR, Inc.*^ | One stop | | L + 6.50% | | 7.50% | | 10/2020 | | 11,394 |
| | 11,303 |
| | 1.3 |
| | 11,394 |
|
| Elite Sportswear, L.P. | Senior loan | | L + 5.00% | | 6.00% | | 03/2020 | | 2,821 |
| | 2,781 |
| | 0.3 |
| | 2,814 |
|
| Elite Sportswear, L.P. | Senior loan | | L + 5.25% | | 6.25% | | 03/2020 | | 1,451 |
| | 1,431 |
| | 0.2 |
| | 1,458 |
|
| Elite Sportswear, L.P. | Senior loan | | L + 5.25% | | 6.25% | | 03/2020 | | 220 |
| | 216 |
| | — |
| | 221 |
|
| Elite Sportswear, L.P. | Senior loan | | P + 3.75% | | 7.25% | | 03/2020 | | 117 |
| | 112 |
| | — |
| | 116 |
|
| Express Oil Change, LLC | Senior loan | | L + 5.00% | | 6.01% | | 12/2017 | | 1,210 |
| | 1,197 |
| | 0.1 |
| | 1,210 |
|
Express Oil Change, LLC^ | Senior loan | | L + 5.00% | | 6.00% | | 12/2017 | | 473 |
| | 470 |
| | 0.1 |
| | 473 |
|
| Feeders Supply Company, LLC | One stop | | L + 5.75% | | 6.75% | | 04/2021 | | 4,298 |
| | 4,211 |
| | 0.5 |
| | 4,298 |
|
| Feeders Supply Company, LLC | Subordinated debt | | N/A | | 12.50% cash/7.00% PIK | 04/2021 | | 43 |
| | 43 |
| | — |
| | 43 |
|
Feeders Supply Company, LLC(4) | One stop | | L + 5.75% | | N/A(5) | | 04/2021 | | — |
| | (1 | ) | | — |
| | — |
|
Marshall Retail Group, LLC, The^# | One stop | | L + 6.00% | | 7.00% | | 08/2020 | | 12,207 |
| | 12,107 |
| | 1.3 |
| | 11,474 |
|
| Marshall Retail Group, LLC, The | One stop | | L + 6.00% | | 7.00% | | 08/2019 | | 410 |
| | 392 |
| | — |
| | 278 |
|
Mills Fleet Farm Group LLC*^ | One stop | | L + 5.50% | | 6.50% | | 02/2022 | | 4,776 |
| | 4,641 |
| | 0.5 |
| | 4,776 |
|
Paper Source, Inc.*^# | One stop | | L + 6.25% | | 7.25% | | 09/2018 | | 12,757 |
| | 12,679 |
| | 1.5 |
| | 12,757 |
|
| Paper Source, Inc. | One stop | | L + 6.25% | | 7.25% | | 09/2018 | | 1,694 |
| | 1,680 |
| | 0.2 |
| | 1,694 |
|
| Paper Source, Inc. | One stop | | P + 5.00% | | 8.50% | | 09/2018 | | 339 |
| | 331 |
| | — |
| | 339 |
|
Pet Holdings ULC*^(7)(8) | One stop | | L + 5.50% | | 6.50% | | 07/2022 | | 14,775 |
| | 14,491 |
| | 1.7 |
| | 14,627 |
|
Pet Holdings ULC(7)(8) | One stop | | P + 4.50% | | 8.00% | | 07/2022 | | 37 |
| | 35 |
| | — |
| | 36 |
|
Pet Holdings ULC(4)(7)(8) | One stop | | L + 5.50% | | N/A(5) | | 07/2022 | | — |
| | (1 | ) | | — |
| | (1 | ) |
Sneaker Villa, Inc.*^ | One stop | | L + 7.75% | | 8.75% | | 12/2020 | | 12,467 |
| | 12,361 |
| | 1.4 |
| | 12,467 |
|
| | | | | | | | | | 128,486 |
| | 126,570 |
| | 14.4 |
| | 127,052 |
|
| Telecommunications | | | | | | | | | |
| | |
| | |
| | |
|
Arise Virtual Solutions, Inc.^ | One stop | | L + 6.50% | | 7.75% | | 12/2018 | | 1,382 |
| | 1,373 |
| | 0.2 |
| | 1,313 |
|
Arise Virtual Solutions, Inc.(4) | One stop | | L + 6.50% | | N/A(5) | | 12/2018 | | — |
| | (1 | ) | | — |
| | (4 | ) |
Hosting.com Inc.* | Senior loan | | L + 4.50% | | 5.75% | | 12/2017 | | 720 |
| | 717 |
| | 0.1 |
| | 720 |
|
| Hosting.com Inc. | Senior loan | | L + 4.50% | | 5.75% | | 12/2017 | | 82 |
| | 81 |
| | — |
| | 82 |
|
| | | | | | | | | | 2,184 |
| | 2,170 |
| | 0.3 |
| | 2,111 |
|
| Textile and Leather | | | | | | | | | |
| | |
| | |
| | |
|
SHO Holding I Corporation* | Senior loan | | L + 5.00% | | 6.00% | | 10/2022 | | 2,062 |
| | 2,016 |
| | 0.2 |
| | 2,062 |
|
SHO Holding I Corporation(4) | Senior loan | | L + 4.00% | | N/A(5) | | 10/2021 | | — |
| | (1 | ) | | — |
| | (1 | ) |
| | | | | | | | | | 2,062 |
| | 2,015 |
| | 0.2 |
| | 2,061 |
|
| Utilities | | | | | | | | | |
| | |
| | |
| | |
|
| Arcos, LLC | One stop | | L + 6.50% | | 7.50% | | 02/2021 | | 4,014 |
| | 3,944 |
| | 0.5 |
| | 4,014 |
|
| Arcos, LLC | One stop | | L + 6.50% | | N/A(5) | | 02/2021 | | — |
| | — |
| | — |
| | — |
|
PowerPlan Holdings, Inc.*# | Senior loan | | L + 4.75% | | 5.75% | | 02/2022 | | 6,790 |
| | 6,699 |
| | 0.8 |
| | 6,790 |
|
PowerPlan Holdings, Inc.(4) | Senior loan | | L + 4.75% | | N/A(5) | | 02/2021 | | — |
| | (6 | ) | | — |
| | — |
|
| | | | | | | | | | 10,804 |
| | 10,637 |
| | 1.3 |
| | 10,804 |
|
| Total non-controlled/non-affiliate company debt investments | | | | | | $ | 1,505,637 |
| | $ | 1,485,448 |
| | 169.2 |
| % | $ | 1,487,093 |
|
| | | | | | | | | |
|
| | |
| | |
| | |
Equity Investments (10)(11) | | | | | | | | | | | | | | | |
| Aerospace and Defense | | | | | | | | | | | | | | | |
| NTS Technical Systems | Common stock | | N/A | | N/A | | N/A | | 2 |
| | $ | 1,506 |
| | 0.2 |
| | $ | 1,317 |
|
| Tresys Technology Holdings, Inc. | Common stock | | N/A | | N/A | | N/A | | 295 |
| | 295 |
| | — |
| | — |
|
| Whitcraft LLC | Warrant | | N/A | | N/A | | N/A | | — |
| | — |
| | — |
| | 232 |
|
| Whitcraft LLC | Preferred stock B | | N/A | | N/A | | N/A | | 1 |
| | 670 |
| | 0.1 |
| | 1,194 |
|
| | | | | | | | | | | | 2,471 |
| | 0.3 |
| | 2,743 |
|
|
| | | | | | | | | | | | | | | | | | | | | | | |
| | Investment | | Spread Above Index(1) | Interest
Rate(2) | | Maturity Date | | Principal ($) / Shares(3) | | Amortized Cost | | Percentage of Net Assets | | Fair Value (16) |
| Oil and Gas | | | | | | | | | | | | | | | |
Drilling Info, Inc.*^# | One stop | | L + 6.25% | (b) | 7.52% | | 06/2020 | | $ | 6,399 |
| | $ | 6,362 |
| | 0.7 |
| % | $ | 6,351 |
|
| Drilling Info, Inc. | One stop | | L + 6.25% | | N/A(5) | | 06/2020 | | — |
| | — |
| | — |
| | — |
|
| | | | | | | | | | 6,399 |
| | 6,362 |
| | 0.7 |
| | 6,351 |
|
| Personal and Non Durable Consumer Products (Mfg. Only) | | | | | | | | | | | | | | |
| Georgica Pine Clothiers, LLC | One stop | | L + 5.50% | (c) | 6.83% | | 11/2021 | | 5,678 |
| | 5,600 |
| | 0.6 |
| | 5,678 |
|
Georgica Pine Clothiers, LLC^ | One stop | | L + 5.50% | (c) | 6.83% | | 11/2021 | | 495 |
| | 491 |
| | 0.1 |
| | 495 |
|
Georgica Pine Clothiers, LLC* | One stop | | L + 5.50% | (c) | 6.83% | | 11/2021 | | 347 |
| | 344 |
| | 0.1 |
| | 347 |
|
| Georgica Pine Clothiers, LLC | One stop | | L + 5.50% | (c) | 6.83% | | 11/2021 | | 58 |
| | 57 |
| | — |
| | 58 |
|
| IMPLUS Footwear, LLC | One stop | | L + 6.75% | (c) | 8.08% | | 04/2021 | | 10,307 |
| | 10,165 |
| | 1.1 |
| | 10,307 |
|
| IMPLUS Footwear, LLC | One stop | | L + 6.75% | (c) | 8.07% | | 04/2021 | | 1,815 |
| | 1,790 |
| | 0.2 |
| | 1,815 |
|
Massage Envy, LLC*^# | One stop | | L + 6.75% | (c)(e) | 8.09% | | 09/2020 | | 35,191 |
| | 34,868 |
| | 3.7 |
| | 35,191 |
|
| Massage Envy, LLC | One stop | | L + 6.75% | (a) | 7.99% | | 09/2020 | | 316 |
| | 306 |
| | — |
| | 316 |
|
| Massage Envy, LLC | One stop | | L + 6.75% | (c)(e) | 8.07% | | 09/2020 | | 100 |
| | 99 |
| | — |
| | 100 |
|
| Massage Envy, LLC | One stop | | L + 6.75% | (c) | 8.07% | | 09/2020 | | 40 |
| | 40 |
| | — |
| | 40 |
|
| Massage Envy, LLC | One stop | | L + 6.75% | (c)(e) | 8.08% | | 09/2020 | | 35 |
| | 35 |
| | — |
| | 35 |
|
| Massage Envy, LLC | One stop | | L + 6.75% | (c)(e) | 8.10% | | 09/2020 | | 15 |
| | 15 |
| | — |
| | 15 |
|
Massage Envy, LLC(4) | One stop | | L + 6.75% | | N/A(5) | | 09/2020 | | — |
| | (1 | ) | | — |
| | — |
|
Orthotics Holdings, Inc.*# | One stop | | L + 6.00% | (a) | 7.24% | | 02/2020 | | 8,290 |
| | 8,222 |
| | 0.8 |
| | 8,125 |
|
Orthotics Holdings, Inc.*#(7) | One stop | | L + 6.00% | (a) | 7.24% | | 02/2020 | | 1,359 |
| | 1,348 |
| | 0.1 |
| | 1,332 |
|
Orthotics Holdings, Inc.(4)(7) | One stop | | L + 6.00% | | N/A(5) | | 02/2020 | | — |
| | (1 | ) | | — |
| | — |
|
Orthotics Holdings, Inc.(4) | One stop | | L + 6.00% | | N/A(5) | | 02/2020 | | — |
| | (10 | ) | | — |
| | (4 | ) |
Team Technologies Acquisition Company^ | Senior loan | | L + 5.00% | (c)(e) | 6.32% | | 12/2017 | | 4,287 |
| | 4,284 |
| | 0.4 |
| | 4,278 |
|
Team Technologies Acquisition Company# | Senior loan | | L + 5.50% | (c)(e) | 6.82% | | 12/2017 | | 790 |
| | 789 |
| | 0.1 |
| | 799 |
|
Team Technologies Acquisition Company(4) | Senior loan | | L + 5.00% | | N/A(5) | | 12/2017 | | — |
| | — |
| | — |
| | (1 | ) |
| | | | | | | | | | 69,123 |
| | 68,441 |
| | 7.2 |
| | 68,926 |
|
| Personal, Food and Miscellaneous Services | | | | | | | | | | | | | | | |
| Community Veterinary Partners, LLC | One stop | | L + 5.50% | (c) | 6.83% | | 10/2021 | | 42 |
| | 41 |
| | — |
| | 42 |
|
Ignite Restaurant Group, Inc.^(6) | One stop | | P + 6.00% | (e) | 10.25% | | 02/2019 | | 4,312 |
| | 4,285 |
| | 0.1 |
| | 1,186 |
|
PetVet Care Centers LLC*^# | One stop | | L + 6.00% | (c) | 7.33% | | 06/2023 | | 16,780 |
| | 16,620 |
| | 1.8 |
| | 16,780 |
|
| PetVet Care Centers LLC | One stop | | L + 6.00% | (c) | 7.32% | | 06/2023 | | 430 |
| | 421 |
| | — |
| | 430 |
|
| PetVet Care Centers LLC | One stop | | L + 6.00% | (b) | 7.27% | | 06/2023 | | 69 |
| | 66 |
| | — |
| | 69 |
|
Southern Veterinary Partners, LLC# | One stop | | L + 5.00% | (a) | 6.24% | | 06/2020 | | 3,900 |
| | 3,873 |
| | 0.4 |
| | 3,900 |
|
| Southern Veterinary Partners, LLC | One stop | | L + 5.00% | (a) | 6.23% | | 06/2020 | | 160 |
| | 158 |
| | — |
| | 160 |
|
| Southern Veterinary Partners, LLC | One stop | | L + 5.00% | (a) | 6.23% | | 06/2020 | | 17 |
| | 17 |
| | — |
| | 17 |
|
Vetcor Professional Practices LLC*^# | One stop | | L + 6.00% | (c) | 7.33% | | 04/2021 | | 28,750 |
| | 28,348 |
| | 3.0 |
| | 28,750 |
|
Vetcor Professional Practices LLC* | One stop | | L + 6.00% | (c) | 7.33% | | 04/2021 | | 956 |
| | 949 |
| | 0.1 |
| | 956 |
|
Vetcor Professional Practices LLC# | One stop | | L + 6.00% | (c) | 7.33% | | 04/2021 | | 948 |
| | 934 |
| | 0.1 |
| | 948 |
|
| Vetcor Professional Practices LLC | One stop | | L + 6.00% | (c) | 7.33% | | 04/2021 | | 861 |
| | 849 |
| | 0.1 |
| | 861 |
|
Vetcor Professional Practices LLC# | One stop | | L + 6.00% | (c) | 7.33% | | 04/2021 | | 745 |
| | 745 |
| | 0.1 |
| | 745 |
|
Vetcor Professional Practices LLC^ | One stop | | L + 6.00% | (c) | 7.33% | | 04/2021 | | 725 |
| | 715 |
| | 0.1 |
| | 725 |
|
Vetcor Professional Practices LLC# | One stop | | L + 6.00% | (c) | 7.33% | | 04/2021 | | 285 |
| | 283 |
| | — |
| | 285 |
|
Vetcor Professional Practices LLC# | One stop | | L + 6.00% | (c) | 7.33% | | 04/2021 | | 233 |
| | 232 |
| | — |
| | 233 |
|
| Vetcor Professional Practices LLC | One stop | | L + 6.00% | (c) | 7.33% | | 04/2021 | | 219 |
| | 211 |
| | — |
| | 219 |
|
| Vetcor Professional Practices LLC | One stop | | L + 6.00% | (c) | 7.33% | | 04/2021 | | 17 |
| | 13 |
| | — |
| | 17 |
|
Veterinary Specialists of North America, LLC^ | One stop | | L + 5.25% | (c) | 6.56% | | 07/2021 | | 7,406 |
| | 7,334 |
| | 0.8 |
| | 7,406 |
|
| Veterinary Specialists of North America, LLC | One stop | | L + 5.25% | (c) | 6.58% | | 07/2021 | | 89 |
| | 74 |
| | — |
| | 89 |
|
See Notes to Consolidated Financial Statements.
99132
Golub Capital BDC, Inc. and Subsidiaries
Consolidated Schedule of Investments - (continued)
September 30, 20162017
(In thousands)
|
| | | | | | | | | | | | | | | | | | | | | | |
| | Investment Type | | Spread Above Index(1) | | Interest Rate(2) | | Maturity Date | | Principal/Par Amount(3) | | Amortized Cost | | Percentage of Net Assets | | Fair Value |
| Automobile | | | | | | | | | | | | | | | |
| K&N Engineering, Inc. | Preferred stock A | | N/A | | N/A | | N/A | | — |
| | $ | — |
| | — |
| % | $ | 27 |
|
| K&N Engineering, Inc. | Preferred stock B | | N/A | | N/A | | N/A | | — |
| | — |
| | — |
| | 27 |
|
| K&N Engineering, Inc. | Common stock | | N/A | | N/A | | N/A | | — |
| | — |
| | — |
| | 213 |
|
| Polk Acquisition Corp. | LP interest | | N/A | | N/A | | N/A | | 1 |
| | 144 |
| | 0.1 |
| | 144 |
|
| | | | | | | | | | | | 144 |
| | 0.1 |
| | 411 |
|
| Beverage, Food and Tobacco | | | | | | | | | | | | | | | |
| Atkins Nutritionals, Inc | LLC interest | | N/A | | N/A | | N/A | | 57 |
| | 746 |
| | 0.3 |
| | 2,630 |
|
| Benihana, Inc. | LLC units | | N/A | | N/A | | N/A | | 43 |
| | 699 |
| | 0.1 |
| | 501 |
|
| C. J. Foods, Inc. | Preferred stock | | N/A | | N/A | | N/A | | — |
| | 157 |
| | — |
| | 309 |
|
| First Watch Restaurants, Inc. | Common stock | | N/A | | N/A | | N/A | | 9 |
| | 964 |
| | 0.2 |
| | 1,712 |
|
| Hopdoddy Holdings, LLC | LLC interest | | N/A | | N/A | | N/A | | 27 |
| | 130 |
| | — |
| | 50 |
|
| Hopdoddy Holdings, LLC | LLC interest | | N/A | | N/A | | N/A | | 12 |
| | 36 |
| | — |
| | 14 |
|
| Julio & Sons Company | LLC interest | | N/A | | N/A | | N/A | | 521 |
| | 521 |
| | 0.1 |
| | 801 |
|
| Purfoods, LLC | LLC interest | | N/A | | N/A | | N/A | | 381 |
| | 381 |
| | — |
| | 381 |
|
| Richelieu Foods, Inc. | LP interest | | N/A | | N/A | | N/A | | 220 |
| | 220 |
| | 0.1 |
| | 588 |
|
| Rubio's Restaurants, Inc. | Preferred stock A | | N/A | | N/A | | N/A | | 2 |
| | 945 |
| | 0.3 |
| | 2,625 |
|
| Tate's Bake Shop, Inc. | LP interest | | N/A | | N/A | | N/A | | 462 |
| | 428 |
| | 0.1 |
| | 483 |
|
| Uinta Brewing Company | LP interest | | N/A | | N/A | | N/A | | 462 |
| | 462 |
| | — |
| | — |
|
| | | | | | | | | | | | 5,689 |
| | 1.2 |
| | 10,094 |
|
| Buildings and Real Estate | | | | | | | | | | | | | | | |
| Brooks Equipment Company, LLC | Common stock | | N/A | | N/A | | N/A | | 10 |
| | 1,021 |
| | 0.1 |
| | 1,248 |
|
| Chemicals, Plastics and Rubber | | | | | | | | | | | | | | | |
| Flexan, LLC | Preferred stock | | N/A | | N/A | | N/A | | — |
| | 73 |
| | — |
| | 75 |
|
| Flexan, LLC | Common stock | | N/A | | N/A | | N/A | | 1 |
| | — |
| | — |
| | — |
|
| | | | | | | | | | | | 73 |
| | — |
| | 75 |
|
| Diversified Conglomerate Manufacturing | | | | | | | | | | | | | | | |
| Chase Industries, Inc. | LLC units | | N/A | | N/A | | N/A | | 1 |
| | 1,186 |
| | 0.2 |
| | 1,666 |
|
| Inventus Power, Inc | Preferred stock | | N/A | | N/A | | N/A | | — |
| | 370 |
| | — |
| | 137 |
|
| Inventus Power, Inc | Common stock | | N/A | | N/A | | N/A | | — |
| | — |
| | — |
| | — |
|
| Reladyne, Inc. | LP interest | | N/A | | N/A | | N/A | | — |
| | 249 |
| | — |
| | 249 |
|
| Sunless Merger Sub, Inc. | LP interest | | N/A | | N/A | | N/A | | — |
| | 160 |
| | — |
| | — |
|
| | | | | | | | | | | | 1,965 |
| | 0.2 |
| | 2,052 |
|
| Diversified Conglomerate Service | | | | | | | | | | | | | | | |
| Actiance, Inc. | Warrant | | N/A | | N/A | | N/A | | 344 |
| | 95 |
| | — |
| | 99 |
|
| Agility Recovery Solutions Inc. | Preferred stock | | N/A | | N/A | | N/A | | 67 |
| | 341 |
| | 0.1 |
| | 610 |
|
| Bomgar Corporation | Common stock | | N/A | | N/A | | N/A | | 100 |
| | 108 |
| | — |
| | 108 |
|
| Bomgar Corporation | Common stock | | N/A | | N/A | | N/A | | 72 |
| | 1 |
| | — |
| | 1 |
|
| DISA Holdings Acquisition Subsidiary Corp. | Common stock | | N/A | | N/A | | N/A | | — |
| | 154 |
| | — |
| | 43 |
|
| HealthcareSource HR, Inc. | LLC interest | | N/A | | N/A | | N/A | | — |
| | 348 |
| | — |
| | 323 |
|
| Host Analytics, Inc. | Warrant | | N/A | | N/A | | N/A | | 180 |
| | — |
| | — |
| | 155 |
|
| Marathon Data Operating Co., LLC | LLC units | | N/A | | N/A | | N/A | | 1 |
| | 264 |
| | 0.1 |
| | 385 |
|
| Marathon Data Operating Co., LLC | LLC units | | N/A | | N/A | | N/A | | 1 |
| | 264 |
| | — |
| | — |
|
| Project Alpha Intermediate Holding, Inc. | Common stock | | N/A | | N/A | | N/A | | 1 |
| | 417 |
| | — |
| | 417 |
|
| Project Alpha Intermediate Holding, Inc. | Common stock | | N/A | | N/A | | N/A | | 103 |
| | 4 |
| | — |
| | 4 |
|
| Secure-24, LLC | LLC units | | N/A | | N/A | | N/A | | 263 |
| | 263 |
| | 0.1 |
| | 445 |
|
| Steelwedge Software, Inc. | Warrant | | N/A | | N/A | | N/A | | 36,575 |
| | 76 |
| | — |
| | 84 |
|
| TA MHI Buyer, Inc. | Preferred stock | | N/A | | N/A | | N/A | | — |
| | 202 |
| | — |
| | 260 |
|
| Vendavo, Inc. | Preferred stock A | | N/A | | N/A | | N/A | | 827 |
| | 827 |
| | 0.1 |
| | 852 |
|
| Vitalyst, LLC | Preferred stock A | | N/A | | N/A | | N/A | | — |
| | 61 |
| | — |
| | 44 |
|
|
| | | | | | | | | | | | | | | | | | | | | | | |
| | Investment | | Spread Above Index(1) | Interest
Rate(2) | | Maturity Date | | Principal ($) / Shares(3) | | Amortized Cost | | Percentage of Net Assets | | Fair Value (16) |
| Personal, Food and Miscellaneous Services - (continued) | | | | | | | | | | | | | | |
Veterinary Specialists of North America, LLC# | One stop | | L + 5.25% | (c) | 6.56% | | 07/2021 | | $ | 63 |
| | $ | 63 |
| | — |
| % | $ | 63 |
|
Veterinary Specialists of North America, LLC(4) | One stop | | L + 5.25% | | N/A(5) | | 07/2021 | | — |
| | (2 | ) | | — |
| | — |
|
| Wetzel's Pretzels, LLC | One stop | | L + 6.75% | (a) | 7.99% | | 09/2021 | | 6,472 |
| | 6,332 |
| | 0.7 |
| | 6,472 |
|
Wetzel's Pretzels, LLC(4) | One stop | | L + 6.75% | | N/A(5) | | 09/2021 | | — |
| | (1 | ) | | — |
| | — |
|
| | | | | | | | | | 73,479 |
| | 72,560 |
| | 7.3 |
| | 70,353 |
|
| Printing and Publishing | | | | | | | | | | | | | | | |
Brandmuscle, Inc.^ | Senior loan | | L + 5.00% | (c) | 6.33% | | 12/2021 | | 624 |
| | 619 |
| | 0.1 |
| | 629 |
|
| Marketo, Inc. | One stop | | L + 9.50% | (c) | 10.83% | | 08/2021 | | 9,940 |
| | 9,709 |
| | 1.0 |
| | 9,940 |
|
Marketo, Inc.(4) | One stop | | L + 9.50% | | N/A(5) | | 08/2021 | | — |
| | (1 | ) | | — |
| | — |
|
| | | | | | | | | | 10,564 |
| | 10,327 |
| | 1.1 |
| | 10,569 |
|
| Retail Stores | | | | | | | | | | |
|
| |
|
| |
|
|
| Batteries Plus Holding Corporation | One stop | | L + 6.75% | (a) | 7.99% | | 07/2022 | | 13,722 |
| | 13,440 |
| | 1.4 |
| | 13,722 |
|
Batteries Plus Holding Corporation(4) | One stop | | L + 6.75% | | N/A(5) | | 07/2022 | | — |
| | (2 | ) | | — |
| | — |
|
CVS Holdings I, LP*^# | One stop | | L + 6.25% | (a) | 7.49% | | 08/2021 | | 22,058 |
| | 21,773 |
| | 2.3 |
| | 22,058 |
|
CVS Holdings I, LP* | One stop | | L + 6.25% | (a) | 7.49% | | 08/2021 | | 318 |
| | 313 |
| | — |
| | 318 |
|
| CVS Holdings I, LP | One stop | | L + 6.25% | (a) | 7.49% | | 08/2021 | | 34 |
| | 28 |
| | — |
| | 34 |
|
CVS Holdings I, LP(4) | One stop | | L + 6.25% | | N/A(5) | | 08/2020 | | — |
| | (2 | ) | | — |
| | — |
|
Cycle Gear, Inc.^ | One stop | | L + 6.50% | (c) | 7.80% | | 01/2020 | | 10,427 |
| | 10,321 |
| | 1.1 |
| | 10,427 |
|
| Cycle Gear, Inc. | One stop | | L + 6.50% | (c) | 7.82% | | 01/2020 | | 607 |
| | 602 |
| | 0.1 |
| | 607 |
|
Cycle Gear, Inc.(4) | One stop | | L + 6.50% | | N/A(5) | | 01/2020 | | — |
| | (12 | ) | | — |
| | — |
|
DTLR, Inc.*^# | One stop | | L + 6.50% | (c) | 7.81% | | 08/2022 | | 22,962 |
| | 22,626 |
| | 2.4 |
| | 22,617 |
|
| Elite Sportswear, L.P. | Senior loan | | L + 5.25% | (c) | 6.58% | | 03/2020 | | 6,942 |
| | 6,854 |
| | 0.7 |
| | 6,957 |
|
| Elite Sportswear, L.P. | Senior loan | | L + 5.00% | (c) | 6.33% | | 03/2020 | | 2,792 |
| | 2,756 |
| | 0.3 |
| | 2,779 |
|
| Elite Sportswear, L.P. | Senior loan | | L + 5.25% | (c) | 6.58% | | 03/2020 | | 1,436 |
| | 1,423 |
| | 0.2 |
| | 1,439 |
|
Elite Sportswear, L.P.* | Senior loan | | L + 5.25% | (c) | 6.55% | | 03/2020 | | 471 |
| | 467 |
| | 0.1 |
| | 472 |
|
| Elite Sportswear, L.P. | Senior loan | | L + 5.25% | (c) | 6.58% | | 03/2020 | | 218 |
| | 215 |
| | — |
| | 218 |
|
Elite Sportswear, L.P.* | Senior loan | | L + 5.25% | (a) | 6.49% | | 03/2020 | | 208 |
| | 206 |
| | — |
| | 209 |
|
| Elite Sportswear, L.P. | One stop | | L + 5.00% | | N/A(5) | | 06/2018 | | — |
| | — |
| | — |
| | — |
|
Elite Sportswear, L.P.(4) | Senior loan | | L + 5.00% | | N/A(5) | | 03/2020 | | — |
| | (5 | ) | | — |
| | (4 | ) |
| Feeders Supply Company, LLC | One stop | | L + 5.75% | (a) | 6.99% | | 04/2021 | | 5,049 |
| | 4,966 |
| | 0.5 |
| | 5,049 |
|
| Feeders Supply Company, LLC | Subordinated debt | | N/A | | 12.50% cash/7.00% PIK | | 04/2021 | | 59 |
| | 59 |
| | — |
| | 59 |
|
| Feeders Supply Company, LLC | One stop | | L + 5.75% | | N/A(5) | | 04/2021 | | — |
| | — |
| | — |
| | — |
|
Marshall Retail Group LLC, The^# | One stop | | L + 6.00% | (c) | 7.30% | | 08/2020 | | 12,023 |
| | 11,950 |
| | 1.3 |
| | 12,023 |
|
| Marshall Retail Group LLC, The | One stop | | P + 4.75% | (e) | 9.00% | | 08/2019 | | 293 |
| | 279 |
| | — |
| | 293 |
|
Mills Fleet Farm Group LLC*^ | One stop | | L + 5.50% | (a) | 6.74% | | 02/2022 | | 1,815 |
| | 1,723 |
| | 0.2 |
| | 1,815 |
|
Paper Source, Inc.^# | One stop | | L + 6.25% | (c) | 7.58% | | 09/2019 | | 12,626 |
| | 12,558 |
| | 1.3 |
| | 12,626 |
|
Paper Source, Inc.* | One stop | | L + 6.25% | (c) | 7.58% | | 09/2019 | | 1,677 |
| | 1,666 |
| | 0.2 |
| | 1,677 |
|
| Paper Source, Inc. | One stop | | P + 5.00% | (e) | 9.25% | | 09/2019 | | 525 |
| | 515 |
| | 0.1 |
| | 525 |
|
Pet Holdings ULC*^(7)(8) | One stop | | L + 5.50% | (c) | 6.80% | | 07/2022 | | 14,627 |
| | 14,394 |
| | 1.5 |
| | 14,627 |
|
Pet Holdings ULC(7)(8) | One stop | | L + 5.50% | (c) | 6.81% | | 07/2022 | | 56 |
| | 55 |
| | — |
| | 56 |
|
Pet Holdings ULC(4)(7)(8) | One stop | | L + 5.50% | | N/A(5) | | 07/2022 | | — |
| | (2 | ) | | — |
| | — |
|
PetPeople Enterprises, LLC# | One stop | | L + 6.00% | (c) | 7.32% | | 09/2023 | | 3,145 |
| | 3,107 |
| | 0.3 |
| | 3,114 |
|
| PetPeople Enterprises, LLC | One stop | | N/A | | 8.25% PIK | | 01/2019 | | 155 |
| | 155 |
| | — |
| | 155 |
|
PetPeople Enterprises, LLC(4) | One stop | | L + 6.00% | | N/A(5) | | 09/2023 | | — |
| | — |
| | — |
| | (1 | ) |
PetPeople Enterprises, LLC(4) | One stop | | L + 6.00% | | N/A(5) | | 09/2023 | | — |
| | (1 | ) | | — |
| | — |
|
| | | | | | | | | | 134,245 |
| | 132,427 |
| | 14.0 |
| | 133,871 |
|
See Notes to Consolidated Financial Statements.
100133
Golub Capital BDC, Inc. and Subsidiaries
Consolidated Schedule of Investments - (continued)
September 30, 20162017
(In thousands)
|
| | | | | | | | | | | | | | | | | | | | | | |
| | Investment Type | | Spread Above Index(1) | | Interest Rate(2) | | Maturity Date | | Principal/Par Amount(3) | | Amortized Cost | | Percentage of Net Assets | | Fair Value |
| Diversified Conglomerate Service – (continued) | | | | | | | | | | | | | | | |
| Vitalyst, LLC | Common stock | | N/A | | N/A | | N/A | | 1 |
| | $ | 7 |
| | — |
| % | $ | — |
|
| Workforce Software, LLC | LLC units | | N/A | | N/A | | N/A | | 308 |
| | 308 |
| | 0.1 |
| | 308 |
|
| Xmatters, Inc. and Alarmpoint, Inc. | Warrant | | N/A | | N/A | | N/A | | 40 |
| | 32 |
| | — |
| | 32 |
|
| | | | | | | | | | | | 3,772 |
| | 0.5 |
| | 4,170 |
|
| Ecological | | | | | | | | | | | | | | | |
| Pace Analytical Services, LLC | LLC units | | N/A | | N/A | | N/A | | 2 |
| | 277 |
| | — |
| | 277 |
|
| | | | | | | | | | | | 277 |
| | — |
| | 277 |
|
| Electronics | | | | | | | | | | | | | | | |
| Diligent Corporation | Preferred stock | | N/A | | N/A | | N/A | | 83 |
| | 83 |
| | — |
| | 83 |
|
| ECI Acquisition Holdings, Inc. | Common stock | | N/A | | N/A | | N/A | | 9 |
| | 873 |
| | 0.1 |
| | 1,130 |
|
| Gamma Technologies, LLC | LLC units | | N/A | | N/A | | N/A | | 1 |
| | 134 |
| | — |
| | 188 |
|
| SEI, Inc. | LLC units | | N/A | | N/A | | N/A | | 340 |
| | 340 |
| | — |
| | 317 |
|
| Sloan Company, Inc., The | LLC units | | N/A | | N/A | | N/A | | — |
| | 122 |
| | — |
| | 23 |
|
| Sloan Company, Inc., The | LLC units | | N/A | | N/A | | N/A | | 1 |
| | 14 |
| | — |
| | — |
|
| Sparta Holding Corporation | Common stock | | N/A | | N/A | | N/A | | 1 |
| | 567 |
| | 0.1 |
| | 688 |
|
| Sparta Holding Corporation | Common stock | | N/A | | N/A | | N/A | | 235 |
| | 6 |
| | — |
| | 162 |
|
| Syncsort Incorporated | Preferred stock | | N/A | | N/A | | N/A | | 90 |
| | 226 |
| | 0.1 |
| | 313 |
|
| | | | | | | | | | | | 2,365 |
| | 0.3 |
| | 2,904 |
|
| Grocery | | | | | | | | | | | | | | | |
| MyWebGrocer, Inc. | LLC units | | N/A | | N/A | | N/A | | 1,418 |
| | 1,446 |
| | 0.2 |
| | 2,038 |
|
| MyWebGrocer, Inc. | Preferred stock | | N/A | | N/A | | N/A | | 71 |
| | 165 |
| | — |
| | 267 |
|
| | | | | | | | | | | | 1,611 |
| | 0.2 |
| | 2,305 |
|
| Healthcare, Education and Childcare | | | | | | | | | | | | | | | |
| Active Day, Inc. | LLC interest | | N/A | | N/A | | N/A | | 1 |
| | 614 |
| | 0.1 |
| | 706 |
|
| ADCS Clinics Intermediate Holdings, LLC | Preferred stock | | N/A | | N/A | | N/A | | 1 |
| | 579 |
| | 0.1 |
| | 579 |
|
| ADCS Clinics Intermediate Holdings, LLC | Common stock | | N/A | | N/A | | N/A | | — |
| | 6 |
| | — |
| | 6 |
|
| Advanced Pain Management Holdings, Inc. | Preferred stock | | N/A | | N/A | | N/A | | 8 |
| | 829 |
| | 0.1 |
| | 382 |
|
| Advanced Pain Management Holdings, Inc. | Common stock | | N/A | | N/A | | N/A | | 67 |
| | 67 |
| | — |
| | — |
|
| Advanced Pain Management Holdings, Inc. | Preferred stock | | N/A | | N/A | | N/A | | 1 |
| | 64 |
| | — |
| | 199 |
|
| BIORECLAMATIONIVT, LLC | LLC interest | | N/A | | N/A | | N/A | | — |
| | 365 |
| | 0.1 |
| | 399 |
|
| California Cryobank, LLC | LLC units | | N/A | | N/A | | N/A | | — |
| | 28 |
| | — |
| | 31 |
|
| California Cryobank, LLC | LLC units | | N/A | | N/A | | N/A | | — |
| | — |
| | — |
| | — |
|
| Certara L.P. | LP interest | | N/A | | N/A | | N/A | | — |
| | 635 |
| | 0.1 |
| | 1,266 |
|
| DCA Investment Holding, LLC | LLC units | | N/A | | N/A | | N/A | | 6,386 |
| | 864 |
| | 0.1 |
| | 940 |
|
| DCA Investment Holding, LLC | LLC units | | N/A | | N/A | | N/A | | 65 |
| | 9 |
| | — |
| | 146 |
|
| Deca Dental Management LLC | LLC units | | N/A | | N/A | | N/A | | 357 |
| | 357 |
| | — |
| | 392 |
|
| Dental Holdings Corporation | LLC units | | N/A | | N/A | | N/A | | 734 |
| | 775 |
| | 0.1 |
| | 925 |
|
| Encore GC Acquisition, LLC | LLC units | | N/A | | N/A | | N/A | | 14 |
| | 182 |
| | — |
| | 200 |
|
| Encore GC Acquisition, LLC | LLC units | | N/A | | N/A | | N/A | | 14 |
| | — |
| | — |
| | 36 |
|
| G & H Wire Company, Inc | LP interest | | N/A | | N/A | | N/A | | 102 |
| | 102 |
| | — |
| | 107 |
|
| Global Healthcare Exchange, LLC | Common stock | | N/A | | N/A | | N/A | | — |
| | 287 |
| | — |
| | 289 |
|
| Global Healthcare Exchange, LLC | Common stock | | N/A | | N/A | | N/A | | — |
| | 5 |
| | 0.1 |
| | 350 |
|
| IntegraMed America, Inc. | LLC interest | | N/A | | N/A | | N/A | | — |
| | 458 |
| | — |
| | 51 |
|
| IntegraMed America, Inc. | LLC interest | | N/A | | N/A | | N/A | | — |
| | 417 |
| | 0.1 |
| | 404 |
|
| Katena Holdings, Inc. | LLC units | | N/A | | N/A | | N/A | | — |
| | 387 |
| | 0.1 |
| | 459 |
|
| Lombart Brothers, Inc. | Common stock | | N/A | | N/A | | N/A | | — |
| | 106 |
| | — |
| | 106 |
|
| Northwestern Management Services, LLC | LLC units | | N/A | | N/A | | N/A | | — |
| | 249 |
| | — |
| | 335 |
|
| Northwestern Management Services, LLC | LLC units | | N/A | | N/A | | N/A | | 3 |
| | 3 |
| | — |
| | 215 |
|
| Oliver Street Dermatology Holdings, LLC | LLC units | | N/A | | N/A | | N/A | | 234 |
| | 234 |
| | — |
| | 234 |
|
|
| | | | | | | | | | | | | | | | | | | | | | | |
| | Investment | | Spread Above Index(1) | Interest
Rate(2) | | Maturity Date | | Principal ($) / Shares(3) | | Amortized Cost | | Percentage of Net Assets | | Fair Value (16) |
| Telecommunications | | | | | | | | | |
| | |
| | |
| | |
|
Arise Virtual Solutions, Inc.^ | One stop | | L + 6.00% | (c) | 7.33% | | 12/2018 | | $ | 1,260 |
| | $ | 1,256 |
| | 0.1 |
| % | $ | 1,260 |
|
| Arise Virtual Solutions, Inc. | One stop | | L + 6.00% | | N/A(5) | | 12/2018 | | — |
| | — |
| | — |
| | — |
|
NetMotion Wireless Holdings, Inc.*^# | One stop | | L + 6.25% | (c) | 7.58% | | 10/2021 | | 7,338 |
| | 7,249 |
| | 0.8 |
| | 7,338 |
|
NetMotion Wireless Holdings, Inc.(4) | One stop | | L + 6.25% | | N/A(5) | | 10/2021 | | — |
| | (1 | ) | | — |
| | — |
|
| | | | | | | | | | 8,598 |
| | 8,504 |
| | 0.9 |
| | 8,598 |
|
| Textile and Leather | | | | | | | | | |
| | |
| | |
| | |
|
SHO Holding I Corporation* | Senior loan | | L + 5.00% | (a) | 6.24% | | 10/2022 | | 2,233 |
| | 2,194 |
| | 0.2 |
| | 2,233 |
|
| SHO Holding I Corporation | Senior loan | | L + 4.00% | (a)(b) | 5.24% | | 10/2021 | | 16 |
| | 15 |
| | — |
| | 14 |
|
| | | | | | | | | | 2,249 |
| | 2,209 |
| | 0.2 |
| | 2,247 |
|
| Utilities | | | | | | | | | |
| | |
| | |
| | |
|
| Arcos, LLC | One stop | | L + 6.00% | (c) | 7.33% | | 02/2021 | | 3,679 |
| | 3,629 |
| | 0.4 |
| | 3,679 |
|
| Arcos, LLC | One stop | | L + 6.00% | | N/A(5) | | 02/2021 | | — |
| | — |
| | — |
| | — |
|
Power Plan Holdings, Inc.*^ | Senior loan | | L + 5.25% | (a) | 6.49% | | 02/2022 | | 6,434 |
| | 6,346 |
| | 0.7 |
| | 6,434 |
|
PowerPlan Holdings, Inc.* | Senior loan | | L + 5.25% | (a) | 6.49% | | 02/2022 | | 5,659 |
| | 5,606 |
| | 0.5 |
| | 5,659 |
|
PowerPlan Holdings, Inc.(4) | Senior loan | | L + 5.25% | | N/A(5) | | 02/2021 | | — |
| | (6 | ) | | — |
| | — |
|
| | | | | | | | | | 15,772 |
| | 15,575 |
| | 1.6 |
| | 15,772 |
|
| Total non-controlled/non-affiliate company debt investments | | | | | | $ | 1,551,043 |
| | $ | 1,531,357 |
| | 160.2 |
| % | $ | 1,534,909 |
|
| | | | | | | | | | | | |
| | |
| | |
Equity Investments (9)(10) | | | | | | | | | | |
|
| |
|
| |
|
|
| Aerospace and Defense | | | | | | | | | | | | | | | |
| NTS Technical Systems | Common stock | | N/A | | N/A | | N/A | | 2 |
| | $ | 1,506 |
| | 0.1 |
| % | $ | 835 |
|
| NTS Technical Systems | Preferred stock B | | N/A | | N/A | | N/A | | — |
| | 256 |
| | — |
| | 275 |
|
| NTS Technical Systems | Preferred stock A | | N/A | | N/A | | N/A | | — |
| | 128 |
| | — |
| | 150 |
|
| Tresys Technology Holdings, Inc. | Common stock | | N/A | | N/A | | N/A | | 295 |
| | 295 |
| | — |
| | — |
|
| Whitcraft LLC | Common stock | | N/A | | N/A | | N/A | | 4 |
| | 375 |
| | 0.1 |
| | 375 |
|
| | | | | | | | | | | | 2,560 |
| | 0.2 |
| | 1,635 |
|
| Automobile | | | | | | | | | | | | | | | |
| Polk Acquisition Corp. | LP interest | | N/A | | N/A | | N/A | | 1 |
| | 144 |
| | — |
| | 92 |
|
| | | | | | | | | | | | | | | | |
| Beverage, Food and Tobacco | | | | | | | | | | | | | | | |
| Atkins Nutritionals, Inc | LLC interest | | N/A | | N/A | | N/A | | 57 |
| | — |
| | 0.1 |
| | 578 |
|
| Benihana, Inc. | LLC units | | N/A | | N/A | | N/A | | 43 |
| | 699 |
| | — |
| | 357 |
|
| C. J. Foods, Inc. | Preferred stock | | N/A | | N/A | | N/A | | — |
| | 75 |
| | — |
| | 302 |
|
| Cafe Rio Holding, Inc. | Common stock | | N/A | | N/A | | N/A | | 2 |
| | 224 |
| | — |
| | 224 |
|
| Hopdoddy Holdings, LLC | LLC interest | | N/A | | N/A | | N/A | | 27 |
| | 130 |
| | — |
| | 89 |
|
| Hopdoddy Holdings, LLC | LLC interest | | N/A | | N/A | | N/A | | 12 |
| | 36 |
| | — |
| | 25 |
|
| Julio & Sons Company | LLC interest | | N/A | | N/A | | N/A | | 521 |
| | 521 |
| | 0.1 |
| | 1,012 |
|
| P&P Food Safety US Acquisition, Inc. | LLC interest | | N/A | | N/A | | N/A | | 2 |
| | 204 |
| | — |
| | 210 |
|
| Purfoods, LLC | LLC interest | | N/A | | N/A | | N/A | | 381 |
| | 381 |
| | — |
| | 411 |
|
| Richelieu Foods, Inc. | LP interest | | N/A | | N/A | | N/A | | 220 |
| | 220 |
| | 0.1 |
| | 580 |
|
| Rubio's Restaurants, Inc. | Preferred stock | | N/A | | N/A | | N/A | | 2 |
| | 945 |
| | 0.2 |
| | 1,951 |
|
| Tate's Bake Shop, Inc. | LP interest | | N/A | | N/A | | N/A | | 462 |
| | 428 |
| | 0.1 |
| | 647 |
|
| Uinta Brewing Company | LP interest | | N/A | | N/A | | N/A | | 462 |
| | 462 |
| | — |
| | — |
|
| | | | | | | | | | | | 4,325 |
| | 0.6 |
| | 6,386 |
|
| Buildings and Real Estate | | | | | | | | | | | | | | | |
| Brooks Equipment Company, LLC | Common stock | | N/A | | N/A | | N/A | | 10 |
| | 1,021 |
| | 0.1 |
| | 1,502 |
|
| | | | | | | | | | | | | | | | |
See Notes to Consolidated Financial Statements.
101134
Golub Capital BDC, Inc. and Subsidiaries
Consolidated Schedule of Investments - (continued)
September 30, 20162017
(In thousands)
|
| | | | | | | | | | | | | | | | | | | | | | |
| | Investment Type | | Spread Above Index(1) | | Interest Rate(2) | | Maturity Date | | Principal/Par Amount(3) | | Amortized Cost | | Percentage of Net Assets | | Fair Value |
| Healthcare, Education and Childcare – (continued) | | | | | | | | | | | | | | | |
| Pentec Acquisition Sub, Inc. | Preferred stock | | N/A | | N/A | | N/A | | 1 |
| | $ | 116 |
| | — |
| % | $ | 238 |
|
| Pinnacle Treatment Centers, Inc. | Preferred stock | | N/A | | N/A | | N/A | | 2 |
| | 221 |
| | — |
| | 221 |
|
| Pinnacle Treatment Centers, Inc. | Common stock | | N/A | | N/A | | N/A | | — |
| | 2 |
| | — |
| | 2 |
|
| Radiology Partners, Inc. | LLC units | | N/A | | N/A | | N/A | | 43 |
| | 85 |
| | — |
| | 149 |
|
| Reliant Pro ReHab, LLC | Preferred stock A | | N/A | | N/A | | N/A | | 2 |
| | 183 |
| | 0.1 |
| | 998 |
|
| RXH Buyer Corporation | LP interest | | N/A | | N/A | | N/A | | 7 |
| | 683 |
| | 0.1 |
| | 376 |
|
| Southern Anesthesia and Surgical | LLC units | | N/A | | N/A | | N/A | | 487 |
| | 487 |
| | 0.1 |
| | 594 |
|
| Spear Education, LLC | LLC units | | N/A | | N/A | | N/A | | — |
| | 62 |
| | — |
| | 65 |
|
| Spear Education, LLC | LLC units | | N/A | | N/A | | N/A | | 1 |
| | 1 |
| | — |
| | 41 |
|
| SSH Corporation | Common stock | | N/A | | N/A | | N/A | | — |
| | 40 |
| | — |
| | 92 |
|
| Surgical Information Systems, LLC | Common stock | | N/A | | N/A | | N/A | | 4 |
| | 414 |
| | 0.1 |
| | 482 |
|
| U.S. Renal Care, Inc. | LP interest | | N/A | | N/A | | N/A | | 1 |
| | 2,665 |
| | 0.3 |
| | 2,979 |
|
| Young Innovations, Inc. | LLC units | | N/A | | N/A | | N/A | | — |
| | 236 |
| | 0.1 |
| | 315 |
|
| Young Innovations, Inc. | Common stock | | N/A | | N/A | | N/A | | 2 |
| | — |
| | — |
| | 343 |
|
| | | | | | | | | | | | 12,817 |
| | 1.8 |
| | 15,652 |
|
| Insurance | | | | | | | | | | | | | | | |
| Captive Resources Midco, LLC | LLC units | | N/A | | N/A | | N/A | | 1 |
| | — |
| | 0.1 |
| | 186 |
|
| Internet Pipeline, Inc. | Preferred stock | | N/A | | N/A | | N/A | | — |
| | 98 |
| | — |
| | 113 |
|
| Internet Pipeline, Inc. | Common stock | | N/A | | N/A | | N/A | | 43 |
| | 1 |
| | — |
| | 35 |
|
| | | | | | | | | | | | 99 |
| | 0.1 |
| | 334 |
|
| Leisure, Amusement, Motion Pictures | | | | | | | | | | | | | | | |
| and Entertainment | | | | | | | | | | | | | | | |
| LMP TR Holdings, LLC | LLC units | | N/A | | N/A | | N/A | | 712 |
| | 712 |
| | 0.1 |
| | 782 |
|
| Titan Fitness, LLC | LLC units | | N/A | | N/A | | N/A | | 6 |
| | 712 |
| | 0.1 |
| | 777 |
|
| | | | | | | | | | | | 1,424 |
| | 0.2 |
| | 1,559 |
|
| Personal and Non-Durable Consumer | | | | | | | | | | | | | | | |
| Products | | | | | | | | | | | | | | | |
| C.B. Fleet Company, Incorporated | LLC units | | N/A | | N/A | | N/A | | 2 |
| | 134 |
| | 0.1 |
| | 270 |
|
| Georgica Pine Clothiers, LLC | LLC interest | | N/A | | N/A | | N/A | | 11 |
| | 106 |
| | — |
| | 116 |
|
| Massage Envy, LLC | LLC interest | | N/A | | N/A | | N/A | | 749 |
| | 749 |
| | 0.1 |
| | 1,149 |
|
| Team Technologies Acquisition Company | Common stock | | N/A | | N/A | | N/A | | — |
| | 114 |
| | — |
| | 246 |
|
| | | | | | | | | | | | 1,103 |
| | 0.2 |
| | 1,781 |
|
| Personal, Food and Miscellaneous Services | | | | | | | | | | | | | | | |
| Community Veterinary Partners, LLC | Common stock | | N/A | | N/A | | N/A | | 1 |
| | 114 |
| | — |
| | 144 |
|
| R.G. Barry Corporation | Preferred stock | | N/A | | N/A | | N/A | | — |
| | 161 |
| | — |
| | 156 |
|
| Vetcor Professional Practices LLC | LLC units | | N/A | | N/A | | N/A | | 766 |
| | 525 |
| | 0.1 |
| | 536 |
|
| Vetcor Professional Practices LLC | LLC units | | N/A | | N/A | | N/A | | 85 |
| | 85 |
| | 0.1 |
| | 624 |
|
| Veterinary Specialists of North America, LLC | LLC units | | N/A | | N/A | | N/A | | — |
| | 106 |
| | — |
| | 106 |
|
| Wetzel's Pretzels, LLC | Common stock | | N/A | | N/A | | N/A | | — |
| | 160 |
| | — |
| | 160 |
|
| | | | | | | | | | | | 1,151 |
| | 0.2 |
| | 1,726 |
|
| Printing and Publishing | | | | | | | | | | | | | | | |
| Brandmuscle, Inc. | LLC interest | | N/A | | N/A | | N/A | | — |
| | 240 |
| | — |
| | 273 |
|
| Market Track, LLC | Preferred stock | | N/A | | N/A | | N/A | | — |
| | 145 |
| | — |
| | 215 |
|
| Market Track, LLC | Common stock | | N/A | | N/A | | N/A | | 1 |
| | 145 |
| | 0.1 |
| | 344 |
|
| | | | | | | | | | | | 530 |
| | 0.1 |
| | 832 |
|
| Retail Stores | | | | | | | | | | | | | | | |
| Barcelona Restaurants, LLC | LP interest | | N/A | | N/A | | N/A | | 1,996 |
| | — |
| | 0.6 |
| | 5,507 |
|
| Batteries Plus Holding Corporation | LLC units | | N/A | | N/A | | N/A | | 5 |
| | 529 |
| | 0.1 |
| | 529 |
|
| Cycle Gear, Inc. | LLC interest | | N/A | | N/A | | N/A | | 19 |
| | 248 |
| | — |
| | 397 |
|
|
| | | | | | | | | | | | | | | | | | | | | | | |
| | Investment | | Spread Above Index(1) | Interest
Rate(2) | | Maturity Date | | Principal ($) / Shares(3) | | Amortized Cost | | Percentage of Net Assets | | Fair Value (16) |
| Chemicals, Plastics and Rubber | | | | | | | | | | | | | | | |
| Flexan, LLC | Preferred stock A | | N/A | | N/A | | N/A | | — |
| | $ | 90 |
| | 0.1 |
| % | $ | 108 |
|
| Flexan, LLC | Common stock | | N/A | | N/A | | N/A | | 1 |
| | — |
| | — |
| | 17 |
|
| | | | | | | | | | | | 90 |
| | 0.1 |
| | 125 |
|
| Diversified/Conglomerate Manufacturing | | | | | | | | | | | | | | | |
| Chase Industries, Inc. | LLC units | | N/A | | N/A | | N/A | | 1 |
| | 1,186 |
| | 0.2 |
| | 2,131 |
|
| Inventus Power, Inc. | Preferred stock | | N/A | | N/A | | N/A | | — |
| | 370 |
| | — |
| | — |
|
| Inventus Power, Inc. | Common stock | | N/A | | N/A | | N/A | | — |
| | — |
| | — |
| | — |
|
| Reladyne, Inc. | LP interest | | N/A | | N/A | | N/A | | — |
| | 249 |
| | 0.1 |
| | 463 |
|
| Sunless Merger Sub, Inc. | LP interest | | N/A | | N/A | | N/A | | 160 |
| | 160 |
| | — |
| | — |
|
| | | | | | | | | | | | 1,965 |
| | 0.3 |
| | 2,594 |
|
| Diversified/Conglomerate Service | | | | | | | | | | | | | | | |
| Accela, Inc. | LLC units | | N/A | | N/A | | N/A | | 296 |
| | 296 |
| | — |
| | 296 |
|
| Actiance, Inc. | Warrant | | N/A | | N/A | | N/A | | 510 |
| | 122 |
| | — |
| | 178 |
|
| Agility Recovery Solutions Inc. | Preferred stock | | N/A | | N/A | | N/A | | 67 |
| | 341 |
| | 0.1 |
| | 429 |
|
| Bomgar Corporation | Common stock | | N/A | | N/A | | N/A | | — |
| | 107 |
| | — |
| | 120 |
|
| Bomgar Corporation | Common stock | | N/A | | N/A | | N/A | | 72 |
| | 1 |
| | — |
| | 6 |
|
| DISA Holdings Acquisition Subsidiary Corp. | Common stock | | N/A | | N/A | | N/A | | — |
| | 154 |
| | — |
| | 150 |
|
| HealthcareSource HR, Inc. | LLC interest | | N/A | | N/A | | N/A | | — |
| | 348 |
| | 0.1 |
| | 371 |
|
| Host Analytics, Inc. | Warrant | | N/A | | N/A | | N/A | | 347 |
| | 130 |
| | — |
| | 277 |
|
| Marathon Data Operating Co., LLC | LLC units | | N/A | | N/A | | N/A | | 1 |
| | 264 |
| | 0.1 |
| | 550 |
|
| Marathon Data Operating Co., LLC | LLC units | | N/A | | N/A | | N/A | | 1 |
| | 264 |
| | 0.1 |
| | 986 |
|
| Maverick Bidco Inc. | LLC units | | N/A | | N/A | | N/A | | 1 |
| | 369 |
| | 0.1 |
| | 369 |
|
| MMan Acquisition Co. | LP interest | | N/A | | N/A | | N/A | | 263 |
| | 263 |
| | — |
| | 263 |
|
| Project Alpha Intermediate Holding, Inc. | Common stock | | N/A | | N/A | | N/A | | — |
| | 417 |
| | 0.1 |
| | 459 |
|
| Project Alpha Intermediate Holding, Inc. | Common stock | | N/A | | N/A | | N/A | | 103 |
| | 4 |
| | — |
| | 4 |
|
| Secure-24, LLC | LLC units | | N/A | | N/A | | N/A | | 263 |
| | 148 |
| | 0.1 |
| | 802 |
|
| Switchfly, Inc. | Warrant | | N/A | | N/A | | N/A | | 60 |
| | 85 |
| | — |
| | 136 |
|
| Vendavo, Inc. | Preferred stock | | N/A | | N/A | | N/A | | 894 |
| | 894 |
| | 0.1 |
| | 831 |
|
| Verisys Corporation | LLC interest | | N/A | | N/A | | N/A | | 261 |
| | 261 |
| | — |
| | 284 |
|
| Vitalyst, LLC | Preferred stock A | | N/A | | N/A | | N/A | | — |
| | 61 |
| | — |
| | 58 |
|
| Vitalyst, LLC | Common stock | | N/A | | N/A | | N/A | | 1 |
| | 7 |
| | — |
| | — |
|
| Workforce Software, LLC | LLC units | | N/A | | N/A | | N/A | | 308 |
| | 308 |
| | — |
| | 357 |
|
| Xmatters, Inc. and Alarmpoint, Inc. | Warrant | | N/A | | N/A | | N/A | | 43 |
| | 34 |
| | — |
| | 31 |
|
| | | | | | | | | | | | 4,878 |
| | 0.8 |
| | 6,957 |
|
| Ecological | | | | | | | | | | | | | | | |
| Pace Analytical Services, LLC | LLC units | | N/A | | N/A | | N/A | | 3 |
| | 304 |
| | — |
| | 364 |
|
| | | | | | | | | | | | 304 |
| | — |
| | 364 |
|
| Electronics | | | | | | | | | | | | | | | |
Diligent Corporation (11) | Preferred stock | | N/A | | N/A | | N/A | | 83 |
| | 66 |
| | — |
| | 121 |
|
| Gamma Technologies, LLC | LLC units | | N/A | | N/A | | N/A | | 1 |
| | 134 |
| | — |
| | 331 |
|
| Project Silverback Holdings Corp. | Preferred stock | | N/A | | N/A | | N/A | | 3 |
| | 6 |
| | — |
| | 256 |
|
| SEI, Inc. | LLC units | | N/A | | N/A | | N/A | | 340 |
| | 265 |
| | 0.1 |
| | 482 |
|
| Sloan Company, Inc., The | LLC units | | N/A | | N/A | | N/A | | — |
| | 122 |
| | — |
| | 1 |
|
| Sloan Company, Inc., The | LLC units | | N/A | | N/A | | N/A | | 1 |
| | 14 |
| | — |
| | — |
|
| | | | | | | | | | | | 607 |
| | 0.1 |
| | 1,191 |
|
See Notes to Consolidated Financial Statements.
102135
Golub Capital BDC, Inc. and Subsidiaries
Consolidated Schedule of Investments - (continued)
September 30, 20162017
(In thousands)
|
| | | | | | | | | | | | | | | | | | | | | | |
| | Investment Type | | Spread Above Index(1) | | Interest Rate(2) | | Maturity Date | | Principal/Par Amount(3) | | Amortized Cost | | Percentage of Net Assets | | Fair Value |
| Retail Stores – (continued) | | | | | | | | | | | | | | | |
| DentMall MSO, LLC | LLC units | | N/A | | N/A | | N/A | | 2 |
| | $ | 97 |
| | — |
| % | $ | — |
|
| DentMall MSO, LLC | LLC units | | N/A | | N/A | | N/A | | 2 |
| | — |
| | — |
| | — |
|
| Elite Sportswear, L.P. | LLC interest | | N/A | | N/A | | N/A | | — |
| | 83 |
| | — |
| | 111 |
|
| Express Oil Change, LLC | LLC interest | | N/A | | N/A | | N/A | | 81 |
| | 81 |
| | — |
| | 272 |
|
| Feeders Supply Company, LLC | Preferred stock | | N/A | | N/A | | N/A | | 2 |
| | 155 |
| | — |
| | 155 |
|
| Feeders Supply Company, LLC | Common stock | | N/A | | N/A | | N/A | | — |
| | — |
| | — |
| | — |
|
| Marshall Retail Group LLC, The | LLC units | | N/A | | N/A | | N/A | | 15 |
| | 154 |
| | — |
| | 46 |
|
| Paper Source, Inc. | Common stock | | N/A | | N/A | | N/A | | 8 |
| | 1,387 |
| | 0.2 |
| | 1,423 |
|
Pet Holdings ULC(7)(8) | LP interest | | N/A | | N/A | | N/A | | 455 |
| | 387 |
| | — |
| | 351 |
|
| RCP PetPeople LP | LP interest | | N/A | | N/A | | N/A | | 889 |
| | 889 |
| | 0.2 |
| | 1,556 |
|
| Sneaker Villa, Inc. | LLC interest | | N/A | | N/A | | N/A | | 4 |
| | 411 |
| | 0.1 |
| | 541 |
|
| | | | | | | | | | | | 4,421 |
| | 1.2 |
| | 10,888 |
|
| Utilities | | | | | | | | | | | | | | | |
| PowerPlan Holdings, Inc. | Common stock | | N/A | | N/A | | N/A | | — |
| | 303 |
| | 0.1 |
| | 349 |
|
| PowerPlan Holdings, Inc. | Common stock | | N/A | | N/A | | N/A | | 151 |
| | 3 |
| | — |
| | 273 |
|
| | | | | | | | | | | | 306 |
| | 0.1 |
| | 622 |
|
| | | | | | | | | | | | | | | | |
| Total non-controlled/non-affiliate company equity investments | | | | | | | | $ | 41,239 |
| | 6.8 |
| % | $ | 59,673 |
|
| | | | | | | | | | | | | | | | |
| Total non-controlled/non-affiliate company investments | | | | | | $ | 1,505,637 |
| | $ | 1,526,687 |
| | 176.0 |
| % | $ | 1,546,766 |
|
| | | | | | | | | | | | | | | | |
Non-controlled affiliate company investments(12) | | | | | | | | | | | | | | | |
| Debt investments | | | | | | | | | | | | | | | |
| Leisure, Amusement, Motion Pictures | | | | | | | | | | | | | | | |
| and Entertainment | | | | | | | | | | | | | | | |
Competitor Group, Inc.*#(7) | One stop | | L + 9.25% | | 5.00% cash/5.50% PIK | | 11/2018 | | 9,233 |
| | 8,837 |
| | 1.0 |
| | 8,540 |
|
Competitor Group, Inc.(7) | One stop | | L + 9.25% | | 5.00% cash/5.50% PIK | | 11/2018 | | 1,095 |
| | 1,063 |
| | 0.1 |
| | 1,013 |
|
Competitor Group, Inc.(7) | One stop | | L + 9.25% | | 5.00% cash/5.50% PIK | | 11/2018 | | 6 |
| | 6 |
| | — |
| | 6 |
|
| | | | | | | | | | 10,334 |
| | 9,906 |
| | 1.1 |
| | 9,559 |
|
| | | | | | | | | | | | | | | | |
| Total non-controlled affiliate company debt investments | | | | | | $ | 10,334 |
| | $ | 9,906 |
| | 1.1 |
| % | $ | 9,559 |
|
| | | | | | | | | | | | | | | | |
Equity Investments (10)(11) | | | | | | | | | | | | | | | |
| Leisure, Amusement, Motion Pictures | | | | | | | | | | | | | | | |
| and Entertainment | | | | | | | | | | | | | | | |
Competitor Group, Inc.*#(7) | Preferred stock | | N/A | | N/A | | N/A | | 4 |
| | $ | 4,226 |
| | — |
| | $ | 59 |
|
Competitor Group, Inc.(7) | LLC interest | | N/A | | N/A | | N/A | | 1 |
| | 714 |
| | — |
| | — |
|
Competitor Group, Inc.*#(7) | Common stock | | N/A | | N/A | | N/A | | 27 |
| | — |
| | — |
| | — |
|
| | | | | | | | | | | | $ | 4,940 |
| | — |
| | $ | 59 |
|
| | | | | | | | | | | | | | | | |
| Total non-controlled affiliate company equity investments | | | | | | | | $ | 4,940 |
| | — |
| % | $ | 59 |
|
| | | | | | | | | | | | | | | | |
| Total non-controlled affiliate company investments | | | | | | $ | 10,334 |
| | $ | 14,846 |
| | 1.1 |
| % | $ | 9,618 |
|
| | | | | | | | | | | | | | | | |
|
| | | | | | | | | | | | | | | | | | | | | | | |
| | Investment | | Spread Above Index(1) | Interest
Rate(2) | | Maturity Date | | Principal ($) / Shares(3) | | Amortized Cost | | Percentage of Net Assets | | Fair Value (16) |
| Grocery | | | | | | | | | | | | | | | |
| MyWebGrocer, Inc. | LLC units | | N/A | | N/A | | N/A | | 1,418 |
| | $ | 1,446 |
| | 0.2 |
| % | $ | 2,064 |
|
| MyWebGrocer, Inc. | Preferred stock | | N/A | | N/A | | N/A | | 71 |
| | 165 |
| | — |
| | 268 |
|
| | | | | | | | | | | | 1,611 |
| | 0.2 |
| | 2,332 |
|
| Healthcare, Education and Childcare | | | | | | | | | | | | | | | |
| Active Day, Inc. | LLC interest | | N/A | | N/A | | N/A | | 1 |
| | 614 |
| | 0.1 |
| | 718 |
|
| Acuity Eyecare Holdings, LLC | LLC interest | | N/A | | N/A | | N/A | | 198 |
| | 198 |
| | — |
| | 247 |
|
| ADCS Clinics Intermediate Holdings, LLC | Preferred stock | | N/A | | N/A | | N/A | | 1 |
| | 579 |
| | 0.1 |
| | 467 |
|
| ADCS Clinics Intermediate Holdings, LLC | Common stock | | N/A | | N/A | | N/A | | — |
| | 6 |
| | — |
| | — |
|
| Advanced Pain Management Holdings, Inc. | Preferred stock | | N/A | | N/A | | N/A | | 8 |
| | 829 |
| | — |
| | — |
|
| Advanced Pain Management Holdings, Inc. | Common stock | | N/A | | N/A | | N/A | | 67 |
| | 67 |
| | — |
| | — |
|
| Advanced Pain Management Holdings, Inc. | Preferred stock | | N/A | | N/A | | N/A | | 1 |
| | 64 |
| | — |
| | — |
|
| BIORECLAMATIONIVT, LLC | LLC interest | | N/A | | N/A | | N/A | | — |
| | 407 |
| | 0.1 |
| | 614 |
|
| California Cryobank, LLC | LLC units | | N/A | | N/A | | N/A | | — |
| | 28 |
| | — |
| | 36 |
|
| California Cryobank, LLC | LLC units | | N/A | | N/A | | N/A | | — |
| | 11 |
| | — |
| | 12 |
|
| California Cryobank, LLC | LLC units | | N/A | | N/A | | N/A | | — |
| | — |
| | — |
| | 12 |
|
| DCA Investment Holding, LLC | LLC units | | N/A | | N/A | | N/A | | 8,637 |
| | 864 |
| | 0.1 |
| | 938 |
|
| DCA Investment Holding, LLC | LLC units | | N/A | | N/A | | N/A | | 87 |
| | 9 |
| | — |
| | — |
|
| Deca Dental Management LLC | LLC units | | N/A | | N/A | | N/A | | 357 |
| | 357 |
| | 0.1 |
| | 410 |
|
| Dental Holdings Corporation | LLC units | | N/A | | N/A | | N/A | | 805 |
| | 805 |
| | 0.1 |
| | 550 |
|
| Encore GC Acquisition, LLC | LLC units | | N/A | | N/A | | N/A | | 18 |
| | 182 |
| | — |
| | 149 |
|
| Encore GC Acquisition, LLC | LLC units | | N/A | | N/A | | N/A | | 18 |
| | — |
| | — |
| | — |
|
| Eyecare Services Partners Holdings LLC | LLC units | | N/A | | N/A | | N/A | | — |
| | 133 |
| | — |
| | 133 |
|
| Eyecare Services Partners Holdings LLC | LLC units | | N/A | | N/A | | N/A | | — |
| | 1 |
| | — |
| | 1 |
|
| G & H Wire Company, Inc. | LLC interest | | N/A | | N/A | | N/A | | 148 |
| | 148 |
| | — |
| | 148 |
|
| IntegraMed America, Inc. | LLC interest | | N/A | | N/A | | N/A | | 1 |
| | 458 |
| | 0.1 |
| | 358 |
|
| IntegraMed America, Inc. | LLC interest | | N/A | | N/A | | N/A | | — |
| | 417 |
| | — |
| | 328 |
|
| Kareo, Inc. | Warrant | | N/A | | N/A | | N/A | | 22 |
| | 160 |
| | — |
| | 160 |
|
| Katena Holdings, Inc. | LLC units | | N/A | | N/A | | N/A | | — |
| | 387 |
| | — |
| | 258 |
|
| Lombart Brothers, Inc. | Common stock | | N/A | | N/A | | N/A | | — |
| | 132 |
| | — |
| | 176 |
|
| MWD Management, LLC & MWD Services, Inc. | LLC interest | | N/A | | N/A | | N/A | | 121 |
| | 121 |
| | — |
| | 121 |
|
| Oliver Street Dermatology Holdings, LLC | LLC units | | N/A | | N/A | | N/A | | 234 |
| | 234 |
| | 0.1 |
| | 313 |
|
| Pentec Acquisition Sub, Inc. | Preferred stock | | N/A | | N/A | | N/A | | 1 |
| | 116 |
| | — |
| | 248 |
|
| Pinnacle Treatment Centers, Inc. | Preferred stock | | N/A | | N/A | | N/A | | — |
| | 221 |
| | — |
| | 227 |
|
| Pinnacle Treatment Centers, Inc. | Common stock | | N/A | | N/A | | N/A | | 2 |
| | 2 |
| | — |
| | — |
|
| Radiology Partners, Inc. | LLC units | | N/A | | N/A | | N/A | | 43 |
| | 85 |
| | — |
| | 100 |
|
| Reliant Pro ReHab, LLC | Preferred stock A | | N/A | | N/A | | N/A | | 2 |
| | 183 |
| | 0.1 |
| | 869 |
|
| RXH Buyer Corporation | LP interest | | N/A | | N/A | | N/A | | 7 |
| | 683 |
| | — |
| | 239 |
|
| Sage Dental Management, LLC | LLC units | | N/A | | N/A | | N/A | | — |
| | 249 |
| | 0.1 |
| | 370 |
|
| Sage Dental Management, LLC | LLC units | | N/A | | N/A | | N/A | | 3 |
| | 3 |
| | — |
| | 134 |
|
| SLMP, LLC | LLC interest | | N/A | | N/A | | N/A | | 256 |
| | 256 |
| | — |
| | 256 |
|
| Spear Education, LLC | LLC units | | N/A | | N/A | | N/A | | — |
| | 62 |
| | — |
| | 71 |
|
| Spear Education, LLC | LLC units | | N/A | | N/A | | N/A | | 1 |
| | 1 |
| | — |
| | 23 |
|
| SSH Corporation | Common stock | | N/A | | N/A | | N/A | | — |
| | 40 |
| | — |
| | 61 |
|
| Surgical Information Systems, LLC | Common stock | | N/A | | N/A | | N/A | | 4 |
| | 414 |
| | 0.1 |
| | 688 |
|
| U.S. Renal Care, Inc. | LP interest | | N/A | | N/A | | N/A | | 1 |
| | 2,665 |
| | 0.1 |
| | 1,153 |
|
| WHCG Management, LLC | LLC interest | | N/A | | N/A | | N/A | | — |
| | 220 |
| | — |
| | 217 |
|
| Young Innovations, Inc. | LLC units | | N/A | | N/A | | N/A | | — |
| | 236 |
| | — |
| | 183 |
|
See Notes to Consolidated Financial Statements.
103136
Golub Capital BDC, Inc. and Subsidiaries
Consolidated Schedule of Investments - (continued)
September 30, 20162017
(In thousands)
|
| | | | | | | | | | | | | | | | | | | | | | |
| | Investment Type | | Spread Above Index(1) | | Interest Rate(2) | | Maturity Date | | Principal/Par Amount(3) | | Amortized Cost | | Percentage of Net Assets | | Fair Value |
Controlled affiliate company investments(13) | | | | | | | | | | | | |
| Debt investments | | | | | | | | | | | | | | | |
| Investment Funds and Vehicles | | | | | | | | | | | | | | | |
Senior Loan Fund LLC(7) | Subordinated debt | | L + 8.00% | | 8.47% | | 05/2020 | | $ | 77,301 |
| | $ | 77,301 |
| | 8.8 |
| % | $ | 77,301 |
|
| | | | | | | | | | | | | | | | |
| Total controlled affiliate company debt investments | | | | | | $ | 77,301 |
| | $ | 77,301 |
| | 8.8 |
| % | $ | 77,301 |
|
| | | | | | | | | | | | | | | | |
Equity Investments(10) | | | | | | | | | | | | | | | |
| Investment Funds and Vehicles | | | | | | | | | | | | | | | |
Senior Loan Fund LLC(7) | LLC interest | | N/A | | N/A | | N/A | | | | $ | 31,339 |
| | 3.1 |
| % | $ | 26,927 |
|
| | | | | | | | | | | | | | | | |
| Total controlled affiliate company equity investments | | | | | | | | $ | 31,339 |
| | 3.1 |
| % | $ | 26,927 |
|
| | | | | | | | | | | | | | | | |
| Total controlled affiliate company investments | | | | | | $ | 77,301 |
| | $ | 108,640 |
| | 11.9 |
| % | $ | 104,228 |
|
| | | | | | | | | | | | | | | | |
| Total investments | | | | | | $ | 1,593,272 |
| | $ | 1,650,173 |
| | 189.0 |
| % | $ | 1,660,612 |
|
| | | | | | | | | | | |
| Cash, Restricted Cash and Cash Equivalents | | | | | | | | | |
| | |
| | |
| | |
|
| Cash and Restricted Cash | | | | | | |
| | $ | 45,259 |
| | 5.1 |
| % | $ | 45,259 |
|
| BlackRock Liquidity Funds T-Fund Institutional Shares (CUSIP 09248U718) | | 0.21% (14) | | | | |
| | 44,281 |
| | 5.0 |
| | 44,281 |
|
| Total Cash, Restricted Cash and Cash Equivalents | | | | | $ | 89,540 |
| | 10.1 |
| % | $ | 89,540 |
|
| | | | | | | | | | | |
| Total Investments and Cash, Restricted Cash and Cash Equivalents | | | | | | | | $ | 1,739,713 |
| | 199.1 |
| % | $ | 1,750,152 |
|
|
| | | | | | | | | | | | | | | | | | | | | | | |
| | Investment | | Spread Above Index(1) | Interest
Rate(2) | | Maturity Date | | Principal ($) / Shares(3) | | Amortized Cost | | Percentage of Net Assets | | Fair Value (16) |
| Healthcare, Education and Childcare - (continued) | | | | | | | | | | | | | | |
| Young Innovations, Inc. | Common stock | | N/A | | N/A | | N/A | | 2 |
| | $ | — |
| | — |
| % | $ | 234 |
|
| | | | | | | | | |
|
| | 12,647 |
| | 1.2 |
| | 11,222 |
|
| Insurance | | | | | | | | | | | | | | | |
| Captive Resources Midco, LLC | LLC units | | N/A | | N/A | | N/A | | 1 |
| | — |
| | 0.1 |
| | 346 |
|
Internet Pipeline, Inc. (11) | Preferred stock | | N/A | | N/A | | N/A | | — |
| | 72 |
| | — |
| | 87 |
|
| Internet Pipeline, Inc. | Common stock | | N/A | | N/A | | N/A | | 44 |
| | 1 |
| | — |
| | 143 |
|
| | | | | | | | | | | | 73 |
| | 0.1 |
| | 576 |
|
| Leisure, Amusement, Motion Pictures, Entertainment | | | | | | | | | | | | | | |
| LMP TR Holdings, LLC | LLC units | | N/A | | N/A | | N/A | | 712 |
| | 712 |
| | — |
| | 509 |
|
| PADI Holdco, Inc. | LLC units | | N/A | | N/A | | N/A | | — |
| | 414 |
| | — |
| | 414 |
|
| Titan Fitness, LLC | LLC units | | N/A | | N/A | | N/A | | 7 |
| | 712 |
| | 0.1 |
| | 826 |
|
| | | | | | | | | | | | 1,838 |
| | 0.1 |
| | 1,749 |
|
| Personal and Non Durable Consumer Products (Mfg. Only) | | | | | | | | | | | | | | |
| Georgica Pine Clothiers, LLC | LLC interest | | N/A | | N/A | | N/A | | 11 |
| | 106 |
| | — |
| | 103 |
|
| Massage Envy, LLC | LLC interest | | N/A | | N/A | | N/A | | 749 |
| | 210 |
| | 0.1 |
| | 866 |
|
| Team Technologies Acquisition Company | Common stock | | N/A | | N/A | | N/A | | — |
| | 114 |
| | — |
| | 297 |
|
| | | | | | | | | | | | 430 |
| | 0.1 |
| | 1,266 |
|
| Personal, Food and Miscellaneous Services | | | | | | | | | | | | | | | |
| Community Veterinary Partners, LLC | Common stock | | N/A | | N/A | | N/A | | 1 |
| | 147 |
| | 0.1 |
| | 153 |
|
| R.G. Barry Corporation | Preferred stock A | | N/A | | N/A | | N/A | | — |
| | 161 |
| | — |
| | 108 |
|
| Southern Veterinary Partners, LLC | LLC units | | N/A | | N/A | | N/A | | — |
| | 38 |
| | — |
| | 37 |
|
| Southern Veterinary Partners, LLC | LLC units | | N/A | | N/A | | N/A | | 40 |
| | 2 |
| | — |
| | 2 |
|
| Vetcor Professional Practices LLC | LLC units | | N/A | | N/A | | N/A | | 766 |
| | 459 |
| | 0.1 |
| | 510 |
|
| Vetcor Professional Practices LLC | LLC units | | N/A | | N/A | | N/A | | 85 |
| | 85 |
| | 0.1 |
| | 1,027 |
|
| Veterinary Specialists of North America, LLC | LLC units | | N/A | | N/A | | N/A | | — |
| | 106 |
| | — |
| | 141 |
|
| Wetzel's Pretzels, LLC | Common stock | | N/A | | N/A | | N/A | | — |
| | 160 |
| | — |
| | 186 |
|
| | | | | | | | | | | | 1,158 |
| | 0.3 |
| | 2,164 |
|
| Printing and Publishing | | | | | | | | | | | | | | | |
| Brandmuscle, Inc. | LLC interest | | N/A | | N/A | | N/A | | — |
| | 240 |
| | — |
| | 236 |
|
| | | | | | | | | | | | | | | | |
| Retail Stores | | | | | | | | | | | | | | | |
| Barcelona Restaurants, LLC | LP interest | | N/A | | N/A | | N/A | | 1,996 |
| | — |
| | 0.7 |
| | 6,945 |
|
| Batteries Plus Holding Corporation | LLC units | | N/A | | N/A | | N/A | | 5 |
| | 529 |
| | 0.1 |
| | 685 |
|
| Cycle Gear, Inc. | LLC interest | | N/A | | N/A | | N/A | | 19 |
| | 248 |
| | 0.1 |
| | 379 |
|
| DTLR, Inc. | LLC interest | | N/A | | N/A | | N/A | | 4 |
| | 411 |
| | 0.1 |
| | 573 |
|
| Elite Sportswear, L.P. | LLC interest | | N/A | | N/A | | N/A | | — |
| | 158 |
| | — |
| | 97 |
|
| Feeders Supply Company, LLC | Preferred stock | | N/A | | N/A | | N/A | | 2 |
| | 192 |
| | — |
| | 219 |
|
| Feeders Supply Company, LLC | Common stock | | N/A | | N/A | | N/A | | — |
| | — |
| | — |
| | 105 |
|
| Marshall Retail Group LLC, The | LLC units | | N/A | | N/A | | N/A | | 15 |
| | 154 |
| | — |
| | 82 |
|
| Paper Source, Inc. | Common stock | | N/A | | N/A | | N/A | | 8 |
| | 1,387 |
| | 0.1 |
| | 911 |
|
Pet Holdings ULC(7)(8) | LP interest | | N/A | | N/A | | N/A | | 455 |
| | 386 |
| | — |
| | 469 |
|
| | | | | | | | | | | | 3,465 |
| | 1.1 |
| | 10,465 |
|
See Notes to Consolidated Financial Statements.
137
Golub Capital BDC, Inc. and Subsidiaries
Consolidated Schedule of Investments - (continued)
September 30, 2017
(In thousands)
|
| | | | | | | | | | | | | | | | | | | | | | | |
| | Investment | | Spread Above Index(1) | Interest
Rate(2) | | Maturity Date | | Principal ($) / Shares(3) | | Amortized Cost | | Percentage of Net Assets | | Fair Value (16) |
| Utilities | | | | | | | | | | | | | | | |
| PowerPlan Holdings, Inc. | Common stock | | N/A | | N/A | | N/A | | — |
| | $ | 260 |
| | — |
| % | $ | 260 |
|
| PowerPlan Holdings, Inc. | Common stock | | N/A | | N/A | | N/A | | 152 |
| | 3 |
| | 0.1 |
| | 268 |
|
| | | | | | | | | | | | 263 |
| | 0.1 |
| | 528 |
|
| | | | | | | | | | | | | | | | |
| Total non-controlled/non-affiliate company equity investments | | | | | | | | $ | 37,619 |
| | 5.4 |
| % | $ | 51,384 |
|
| | | | | | | | | | | | | | | | |
| Total non-controlled/non-affiliate company investments | | | | | | $ | 1,551,043 |
| | $ | 1,568,976 |
| | 165.6 |
| % | $ | 1,586,293 |
|
| | | | | | | | | | | | | | | | |
Non-controlled affiliate company investments(12) | | | | | | | | | | | | | | | |
| Debt investments | | | | | | | | | | | | | | | |
| Mining, Steel, Iron and Non-Precious Metals | | | | | | | | | | | | | | | |
Benetech, Inc.*(7) | One stop | | L + 11.00% | (a) | 10.25% cash/2.00% PIK | | 08/2018 | | $ | 4,438 |
| | $ | 4,435 |
| | 0.4 |
| % | $ | 3,551 |
|
Benetech, Inc.(7) | One stop | | P + 9.75% | (a)(e) | 11.96% cash/2.00% PIK | | 08/2018 | | 371 |
| | 371 |
| | — |
| | 146 |
|
| | | | | | | | | | 4,809 |
| | 4,806 |
| | 0.4 |
| | 3,697 |
|
| | | | | | | | | | | | | | | | |
| Total non-controlled affiliate company debt investments | | | | | | $ | 4,809 |
| | $ | 4,806 |
| | 0.4 |
| % | $ | 3,697 |
|
| | | | | | | | | | | | | | | | |
Equity Investments (9)(10) | | | | | | | | | | | | | | | |
| Mining, Steel, Iron and Non-Precious Metals | | | | | | | | | | | | | | | |
Benetech, Inc.(7) | LLC interest | | N/A | | N/A | | N/A | | — |
| | $ | — |
| | — |
| % | $ | 10 |
|
Benetech, Inc.(7) | LLC interest | | N/A | | N/A | | N/A | | — |
| | — |
| | — |
| | — |
|
| | | | | | | | | | | | — |
| | — |
| | 10 |
|
| | | | | | | | | | | | | | | | |
| Total non-controlled affiliate company equity investments | | | | | | | | $ | — |
| | — |
| % | $ | 10 |
|
| | | | | | | | | | | | | | | | |
| Total non-controlled affiliate company investments | | | | | | $ | 4,809 |
| | $ | 4,806 |
| | 0.4 |
| % | $ | 3,707 |
|
| | | | | | | | | | | | | | | | |
Controlled affiliate company investments(13) | | | | | | | | | | | | |
Equity Investments(9) | | | | | | | | | | | | | | | |
| Investment Funds and Vehicles | | | | | | | | | | | | | | | |
Senior Loan Fund LLC(7)(14) | LLC interest | | N/A | | N/A | | | | — |
| | $ | 97,457 |
| | 9.9 |
| % | $ | 95,015 |
|
| | | | | | | | | | | | | | | | |
| Total controlled affiliate company equity investments | | | | | |
| | $ | 97,457 |
| | 9.9 |
| % | $ | 95,015 |
|
| | | | | | | | | | | | | | | | |
| Total investments | | | | | | $ | 1,555,852 |
| | $ | 1,671,239 |
| | 175.9 |
| % | $ | 1,685,015 |
|
| | | | | | | | | | | |
| Cash, cash equivalents and restricted cash and cash equivalents | | | | | | |
| | |
| | |
| | |
|
| Cash and restricted cash | | | | | | |
| | $ | 48,733 |
| | 5.1 |
| % | $ | 48,733 |
|
| BlackRock Liquidity Funds T-Fund Institutional Shares (CUSIP 09248U718) | | 0.91% (15) | | | | |
| | 13,825 |
| | 1.4 |
| | 13,825 |
|
| Total cash, cash equivalents and restricted cash and cash equivalents | | | | | $ | 62,558 |
| | 6.5 |
| % | $ | 62,558 |
|
| | | | | | | | | | | |
| Total investments and cash, cash equivalents and restricted cash and cash equivalents | | | | | | | $ | 1,733,797 |
| | 182.4 |
| % | $ | 1,747,573 |
|
See Notes to Consolidated Financial Statements.
138
Golub Capital BDC, Inc. and Subsidiaries
Consolidated Schedule of Investments - (continued)
September 30, 2017
(In thousands)
|
| | |
* | | Denotes that all or a portion of the loan secures the notes offered in the 2010 Debt Securitization (as defined in Note 7)6). |
^ | | Denotes that all or a portion of the loan secures the notes offered in the 2014 Debt Securitization (as defined in Note 7)6). |
# | | Denotes that all or a portion of the loan collateralizedcollateralizes the Credit Facility (as defined in Note 7)6). |
| |
(1) | The majority of the investments bear interest at a rate that may be determined by reference to London Interbank Offered Rate ("LIBOR"LIBOR or "L") or Prime ("P") and which reset daily, quarterly or semiannually. For each, the Company has provided the spread over LIBOR or Prime and the weighted average current interest rate in effect at September 30, 2016.2017. Certain investments are subject to a LIBOR or Prime interest rate floor. For fixed rate loans, a spread above a reference rate is not applicable. Listed below are the index rates as of September 29, 2017, which was the last business day of the period on which LIBOR was determined. The actual index rate for each loan listed may not be the applicable index rate outstanding as of September 30, 2017, as the loan may have priced or repriced based on an index rate prior to September 29, 2017. |
(a) Denotes that all or a portion of the loan was indexed to the 30-day LIBOR, which was 1.23% as of September 29, 2017.
(b) Denotes that all or a portion of the loan was indexed to the 60-day LIBOR, which was 1.27% as of September 29, 2017.
(c) Denotes that all or a portion of the loan was indexed to the 90-day LIBOR, which was 1.33% as of September 29, 2017.
(d) Denotes that all or a portion of the loan was indexed to the 180-day LIBOR, which was 1.51% as of September 29, 2017.
(e) Denotes that all or a portion of the loan was indexed to the Prime rate, which was 4.25% as of September 29, 2017.
| |
(2) | For portfolio companies with multiple interest rate contracts, the interest rate shown is a weighted average current interest rate in effect atas of September 30, 2016.2017. |
| |
(3) | The total principal amount is presented for debt investments while the number of shares or units owned is presented for equity investments. |
| |
(4) | The negative fair value is the result of the capitalized discount on the loan or the unfunded commitment being valued below par. The negative amortized cost is the result of the capitalized discount being greater than the principal amount outstanding on the loan. |
| |
(5) | The entire commitment was unfunded atas of September 30, 2016.2017. As such, no interest is being earned on this investment. |
| |
(6) | Loan was on non-accrual status as of September 30, 2016,2017, meaning that the Company has ceased recognizing interest income on the loan. |
| |
(7) | The investment is treated as a non-qualifying asset under Section 55(a) of the 1940 Act. Under the 1940 Act, the Company may not acquire any non-qualifying asset unless, at the time the acquisition is made, qualifying assets represent at least 70% of the Company's total assets. As of September 30, 2016,2017, total non-qualifying assets at fair value represented 7.4%6.7% of the Company's total assets calculated in accordance with the 1940 Act. |
| |
(8) | The headquarters of this portfolio company is located in Canada. |
| |
(9) | The sale of a portion of this loan does not qualify for sale accounting under ASC Topic 860 - Transfers and Servicing, and therefore, the entire one stop loan asset remains in the Consolidated Schedule of Investments. (See Note 7 in the accompanying notes to the consolidated financial statements.)Equity investments are non-income producing securities unless otherwise noted. |
| |
(10) | Non-income producing securities. |
| |
(11)
| Ownership of certain equity investments may occur through a holding company or partnership. |
| |
(11) | The Company holds an equity investment that entitles it to receive preferential dividends |
| |
(12) | As defined in the 1940 Act, the Company is deemed to be an "Affiliated Person""affiliated person" of the company as the Company along with affiliated entities owns five percent or more of the portfolio company's securities. Transactions related to investments in non-controlled affiliates for the year ended September 30, 2017 were as follows: |
|
| | | | | | | | | | | | | | | | | | | | | | | | | | | | | | | | | | | | | | | | |
Portfolio Company | | Fair value as of September 30, 2016 | | Purchases (cost)(f) | | Redemptions (cost) | | Transfer in (out) | | Discount accretion | | Net change in unrealized gain/(loss) | | Fair value as of September 30, 2017 | | Net realized gain/(loss) | | Interest and fee income | | Dividend income |
Benetech, Inc.(g) | | $ | — |
| | $ | 17 |
| | $ | (68 | ) | | $ | 3,738 |
| | $ | 2 |
| | $ | 18 |
| | $ | 3,707 |
| | $ | — |
| | $ | 113 |
| | $ | — |
|
| Competitor Group, Inc. | | 9,618 |
| | 491 |
| | (15,615 | ) | | — |
| | 278 |
| | 5,228 |
| | — |
| | (6,442 | ) | | 1,023 |
| | — |
|
| Total Non-Controlled Affiliates | | $ | 9,618 |
| | $ | 508 |
| | $ | (15,683 | ) | | $ | 3,738 |
| | $ | 280 |
| | $ | 5,246 |
| | $ | 3,707 |
| | $ | (6,442 | ) | | $ | 1,136 |
| | $ | — |
|
See Notes to Consolidated Financial Statements.
104
Golub Capital BDC, Inc. and Subsidiaries
Consolidated Schedule of Investments - (continued)
September 30, 2016
(In thousands)
|
| |
(f) | Purchases at cost includes amounts related to PIK interest capitalized and added to the principal balance of the respective loans. |
(g) | During the three months ended September 30, 2017, the Company's ownership increased to over five percent of the portfolio company's voting securities. |
| |
(13) | As defined in the 1940 Act, the Company is deemed to be both an "Affiliated Person""affiliated person" of and "Control""control" this portfolio company as the Company owns more than 25% of the portfolio company's outstanding voting securities or has the power to exercise control over management or policies of such portfolio company (including through a management agreement). See Note 5Transactions related to investments in the accompanying notes to the consolidated financial statementscontrolled affiliates for transactions during the year ended September 30, 2016 in which2017 were as follows: |
|
| | | | | | | | | | | | | | | | | | | | | | | | | | | | | | | | | | | | | | | | |
Portfolio Company | | Fair value as of September 30, 2016 | | Purchases (cost)(h) | | Redemptions (cost) | | Transfer in (out) | | Discount accretion | | Net change in unrealized gain/(loss) | | Fair value as of September 30, 2017 | | Net realized gain/(loss) | | Interest and fee income | | Dividend income |
Senior Loan Fund LLC(i) | | $ | 104,228 |
| | $ | 96,688 |
| | $ | (107,870 | ) | | $ | — |
| | $ | — |
| | $ | 1,969 |
| | $ | 95,015 |
| | $ | — |
| | $ | 1,639 |
| | $ | 4,929 |
|
| Total Controlled Affiliates | | $ | 104,228 |
| | $ | 96,688 |
| | $ | (107,870 | ) | | $ | — |
| | $ | — |
| | $ | 1,969 |
| | $ | 95,015 |
| | $ | — |
| | $ | 1,639 |
| | $ | 4,929 |
|
See Notes to Consolidated Financial Statements.
139
Golub Capital BDC, Inc. and Subsidiaries
Consolidated Schedule of Investments - (continued)
September 30, 2017
(In thousands)
|
| |
(h) | Purchases at cost includes amounts related to PIK interest capitalized and added to the issuer was both an Affiliated Person and a portfolio company thatprincipal balance of the respective loans. |
(i) | Together with RGA, the Company co-invests through SLF. SLF is deemedcapitalized as transactions are completed and all portfolio and investment decisions in respect to Control.SLF must be approved by the SLF investment committee consisting of two representatives of the Company and RGA (with unanimous approval required from (i) one representative of each of the Company and RGA or (ii) both representatives of each of the Company and RGA). Therefore, although the Company owns more than 25% of the voting securities of SLF, the Company does not believe that it has control over SLF for purposes of the 1940 Act or otherwise. |
| |
(14) | The Company receives quarterly profit distributions from its equity investment in SLF. See Note 4. Investments. |
| |
(14)(15)
| The rate shown is the annualized seven-day yield as of September 30, 2016.2017. |
| |
(16) | The fair value of the investment was valued using significant unobservable inputs. See Note 5. Fair Value Measurements. |
See Notes to Consolidated Financial Statements.
105140
Golub Capital BDC, Inc. and Subsidiaries
Consolidated Schedule of Investments
September 30, 2015
(In thousands)
|
| | | | | | | | | | | | | | | | | | | | | | |
| | Investment Type | | Spread Above Index(1) | | Interest Rate(2) | Maturity Date | | Principal/Par Amount | | Cost | | Percentage of Net Assets | | Fair Value |
| Investments | | | | | | | | | |
| | |
| | |
| | |
|
| United States | | | | | | | | | |
| | |
| | |
| | |
|
| Debt investments | | | | | | | | | |
| | |
| | |
| | |
|
| Aerospace and Defense | | | | | | | | | |
| | |
| | |
| | |
|
| ILC Dover, LP | One stop | | P + 6.00% | | 9.25 | % | 03/2019 | | $ | 781 |
| | $ | 769 |
| | 0.1 | % | | $ | 697 |
|
| ILC Dover, LP*^ | One stop | | L + 7.00% | | 8.00 | % | 03/2020 | | 18,124 |
| | 17,941 |
| | 2.1 |
| | 16,855 |
|
ILC Industries, Inc.(3) | One stop | | L + 6.00% | | N/A | (5) | 07/2020 | | — |
| | (22 | ) | | — |
| | (94 | ) |
| ILC Industries, Inc.*^ | One stop | | L + 6.00% | | 7.00 | % | 07/2020 | | 22,670 |
| | 22,527 |
| | 2.7 |
| | 22,386 |
|
NTS Technical Systems(3) | One stop | | L + 6.00% | | N/A | (5) | 06/2021 | | — |
| | (47 | ) | | — |
| | — |
|
NTS Technical Systems(3) | One stop | | L + 6.00% | | N/A | (5) | 06/2021 | | — |
| | (100 | ) | | — |
| | — |
|
| NTS Technical Systems*^ | One stop | | L + 6.00% | | 7.00 | % | 06/2021 | | 26,441 |
| | 26,001 |
| | 3.3 |
| | 26,441 |
|
| Tresys Technology Holdings, Inc. | One stop | | L + 6.75% | | 8.00 | % | 12/2017 | | 349 |
| | 345 |
| | — |
| | 349 |
|
Tresys Technology Holdings, Inc.(6) | One stop | | L + 6.75% | | 8.00 | % | 12/2017 | | 3,899 |
| | 3,845 |
| | 0.1 |
| | 1,170 |
|
| Whitcraft LLC | One stop | | P + 5.25% | | 8.50 | % | 05/2020 | | 3 |
| | 2 |
| | — |
| | 2 |
|
| Whitcraft LLC^ | One stop | | L + 6.50% | | 7.50 | % | 05/2020 | | 13,640 |
| | 13,513 |
| | 1.7 |
| | 13,505 |
|
| | | | | | | | | | 85,907 |
| | 84,774 |
| | 10.0 |
| | 81,311 |
|
| Automobile | | | | | | | | | |
| | |
| | |
| | |
|
| American Driveline Systems, Inc. | Senior loan | | P + 4.50% | | 7.75 | % | 03/2020 | | 57 |
| | 50 |
| | — |
| | 57 |
|
| American Driveline Systems, Inc.* | Senior loan | | L + 5.50% | | 6.50 | % | 03/2020 | | 1,817 |
| | 1,763 |
| | 0.2 |
| | 1,817 |
|
| CH Hold Corp. (Caliber Collision) | Senior loan | | L + 4.75% | | 5.75 | % | 11/2019 | | 333 |
| | 330 |
| | 0.1 |
| | 333 |
|
| CH Hold Corp. (Caliber Collision) | Senior loan | | L + 4.75% | | 5.75 | % | 11/2019 | | 1,862 |
| | 1,846 |
| | 0.2 |
| | 1,862 |
|
| Dent Wizard International Corporation* | Senior loan | | L + 4.75% | | 5.75 | % | 04/2020 | | 2,585 |
| | 2,572 |
| | 0.3 |
| | 2,566 |
|
| Integrated Supply Network, LLC | Senior loan | | P + 4.00% | | 6.87 | % | 02/2020 | | 347 |
| | 338 |
| | 0.1 |
| | 347 |
|
| Integrated Supply Network, LLC* | Senior loan | | L + 5.25% | | 6.25 | % | 02/2020 | | 5,662 |
| | 5,590 |
| | 0.7 |
| | 5,662 |
|
| K&N Engineering, Inc.^ | Senior loan | | L + 4.25% | | 5.25 | % | 07/2019 | | 136 |
| | 122 |
| | — |
| | 132 |
|
K&N Engineering, Inc.(3) | Senior loan | | L + 4.25% | | N/A | (5) | 07/2019 | | — |
| | (4 | ) | | — |
| | (5 | ) |
| K&N Engineering, Inc.^ | Senior loan | | L + 4.25 | | 5.25 | | 07/2019 | | 2,883 |
| | 2,844 |
| | 0.3 |
| | 2,797 |
|
| | | | | | | | | | 15,682 |
| | 15,451 |
| | 1.9 |
| | 15,568 |
|
| Banking | | | | | | | | | |
| | |
| | |
| | |
|
HedgeServ Holding L.P.(3) | One stop | | L + 6.00% | | N/A | (5) | 02/2019 | | — |
| | (6 | ) | | — |
| | — |
|
| HedgeServ Holding L.P.^ | One stop | | L + 8.00% | | 7.00% cash/2.00% PIK | 02/2019 | | 17,177 |
| | 17,065 |
| | 2.2 |
| | 17,177 |
|
| | | | | | | | | | 17,177 |
| | 17,059 |
| | 2.2 |
| | 17,177 |
|
| Beverage, Food and Tobacco | | | | | | | | | |
| | |
| | |
| | |
|
Abita Brewing Co., L.L.C.(3) | One stop | | L + 5.75% | | N/A | (5) | 04/2021 | | — |
| | (1 | ) | | — |
| | — |
|
| Abita Brewing Co., L.L.C. | One stop | | L + 5.75% | | 6.75 | % | 04/2021 | | 8,074 |
| | 7,924 |
| | 1.0 |
| | 8,074 |
|
| ABP Corporation | Senior loan | | P + 3.50% | | 7.25 | % | 09/2018 | | 167 |
| | 162 |
| | — |
| | 167 |
|
| ABP Corporation* | Senior loan | | L + 4.75% | | 6.00 | % | 09/2018 | | 4,746 |
| | 4,697 |
| | 0.6 |
| | 4,746 |
|
| American Seafoods Group LLC | Senior loan | | L + 5.00% | | 6.00 | % | 08/2021 | | 5,001 |
| | 4,952 |
| | 0.6 |
| | 4,976 |
|
| Atkins Nutritionals, Inc*^ | One stop | | L + 5.00% | | 6.25 | % | 01/2019 | | 17,490 |
| | 17,314 |
| | 2.2 |
| | 17,512 |
|
| Atkins Nutritionals, Inc*^ | One stop | | L + 8.50% | | 9.75 | % | 04/2019 | | 21,636 |
| | 21,396 |
| | 2.7 |
| | 21,733 |
|
C. J. Foods, Inc.(3) | One stop | | L + 5.50% | | N/A | (5) | 05/2019 | | — |
| | (9 | ) | | — |
| | — |
|
C. J. Foods, Inc.(3) | One stop | | L + 5.50% | | N/A | (5) | 05/2019 | | — |
| | (7 | ) | | — |
| | — |
|
| C. J. Foods, Inc. | One stop | | L + 5.50% | | 6.50 | % | 05/2019 | | 3,192 |
| | 3,157 |
| | 0.4 |
| | 3,192 |
|
| Candy Intermediate Holdings, Inc. (Ferrara Candy)^ | Senior loan | | L + 6.25% | | 7.50 | % | 06/2018 | | 4,838 |
| | 4,761 |
| | 0.6 |
| | 4,801 |
|
| Firebirds International, LLC | One stop | | L + 5.75% | | 7.00 | % | 05/2018 | | 304 |
| | 300 |
| | — |
| | 304 |
|
Firebirds International, LLC(3) | One stop | | L + 5.75% | | N/A | (5) | 05/2018 | | — |
| | (3 | ) | | — |
| | — |
|
Firebirds International, LLC(3) | One stop | | L + 5.75% | | N/A | (5) | 05/2018 | | — |
| | (1 | ) | | — |
| | — |
|
| Firebirds International, LLC* | One stop | | L + 5.75% | | 7.00 | % | 05/2018 | | 1,085 |
| | 1,074 |
| | 0.1 |
| | 1,085 |
|
See Notes to Consolidated Financial Statements.
Golub Capital BDC, Inc. and Subsidiaries
Consolidated Schedule of Investments – (continued)
September 30, 2015
(In thousands)
|
| | | | | | | | | | | | | | | | | | | | | | |
| | Investment Type | | Spread Above Index(1) | | Interest Rate(2) | Maturity Date | | Principal/ Par Amount | | Cost | | Percentage of Net Assets | | Fair Value |
| Beverage, Food and Tobacco – (continued) | | | | | | | | | |
| | |
| | |
| | |
|
First Watch Restaurants, Inc.(3) | One stop | | L + 6.00% | | N/A | (5) | 12/2020 | | $ | — |
| | $ | (12 | ) | | — | % | | $ | — |
|
First Watch Restaurants, Inc.(3) | One stop | | L + 6.00% | | N/A | (5) | 12/2020 | | — |
| | (12 | ) | | — |
| | — |
|
First Watch Restaurants, Inc.(3) | One stop | | L + 6.00% | | N/A | (5) | 12/2020 | | — |
| | (10 | ) | | — |
| | — |
|
First Watch Restaurants, Inc.(3) | One stop | | L + 6.00% | | N/A | (5) | 12/2020 | | — |
| | (9 | ) | | — |
| | — |
|
| First Watch Restaurants, Inc.*^ | One stop | | L + 6.00% | | 7.00 | % | 12/2020 | | 25,860 |
| | 25,598 |
| | 3.2 |
| | 25,860 |
|
Hopdoddy Holdings, LLC(3) | One stop | | L + 8.00% | | N/A | (5) | 08/2020 | | — |
| | (3 | ) | | — |
| | (3 | ) |
| Hopdoddy Holdings, LLC | One stop | | L + 8.00% | | N/A | (5) | 08/2020 | | — |
| | — |
| | — |
| | — |
|
| Hopdoddy Holdings, LLC | One stop | | L + 8.00% | | 9.00 | % | 08/2020 | | 666 |
| | 653 |
| | 0.1 |
| | 660 |
|
| IT'SUGAR LLC | Senior loan | | L + 8.50% | | 10.00 | % | 04/2018 | | 7,489 |
| | 7,393 |
| | 0.9 |
| | 7,489 |
|
| IT'SUGAR LLC | Subordinated debt | | N/A | | 5.00 | % | 10/2017 | | 1,707 |
| | 1,707 |
| | 0.2 |
| | 1,715 |
|
| Northern Brewer, LLC | One stop | | P + 7.25% | | 8.50% cash/2.00% PIK | 02/2018 | | 697 |
| | 688 |
| | 0.1 |
| | 558 |
|
| Northern Brewer, LLC | One stop | | P + 7.25% | | 8.50% cash/2.00% PIK | 02/2018 | | 6,394 |
| | 6,305 |
| | 0.6 |
| | 5,116 |
|
| Surfside Coffee Company LLC | One stop | | L + 5.25% | | 6.25 | % | 06/2020 | | 132 |
| | 122 |
| | — |
| | 122 |
|
| Surfside Coffee Company LLC | One stop | | L + 5.25% | | 6.25 | % | 06/2020 | | 10 |
| | 10 |
| | — |
| | 10 |
|
| Surfside Coffee Company LLC^ | One stop | | L + 5.25% | | 6.25 | % | 06/2020 | | 4,515 |
| | 4,472 |
| | 0.6 |
| | 4,470 |
|
| Uinta Brewing Company | One stop | | L + 6.00% | | 7.00 | % | 08/2019 | | 385 |
| | 379 |
| | — |
| | 362 |
|
| Uinta Brewing Company^ | One stop | | L + 6.00% | | 7.00 | % | 08/2019 | | 3,203 |
| | 3,178 |
| | 0.4 |
| | 3,107 |
|
| United Craft Brews LLC | One stop | | L + 6.25% | | 7.25 | % | 03/2020 | | 542 |
| | 527 |
| | 0.1 |
| | 542 |
|
| United Craft Brews LLC | One stop | | L + 6.25% | | 7.25 | % | 03/2020 | | 68 |
| | 53 |
| | — |
| | 68 |
|
| United Craft Brews LLC | One stop | | L + 6.25% | | 7.25 | % | 03/2020 | | 12,158 |
| | 11,916 |
| | 1.5 |
| | 12,158 |
|
| | | | | | | | | | 130,359 |
| | 128,671 |
| | 15.9 |
| | 128,824 |
|
| Broadcasting and Entertainment | | | | | | | | | |
| | |
| | |
| | |
|
| TouchTunes Interactive Networks, Inc.^ | Senior loan | | L + 4.75% | | 5.75 | % | 05/2021 | | 1,492 |
| | 1,485 |
| | 0.2 |
| | 1,496 |
|
| Building and Real Estate | | | | | | | | | |
| | |
| | |
| | |
|
| Accruent, LLC* | One stop | | L + 6.25% | | 7.27 | % | 11/2019 | | 4,721 |
| | 4,682 |
| | 0.6 |
| | 4,721 |
|
Brooks Equipment Company, LLC(3) | One stop | | L + 5.75% | | N/A | (5) | 08/2020 | | — |
| | (16 | ) | | — |
| | — |
|
| Brooks Equipment Company, LLC*^ | One stop | | L + 5.75% | | 6.75 | % | 08/2020 | | 24,967 |
| | 24,661 |
| | 3.1 |
| | 24,967 |
|
ITEL Laboratories, Inc.(3) | Senior loan | | L + 4.75% | | N/A | (5) | 06/2018 | | — |
| | (1 | ) | | — |
| | — |
|
| ITEL Laboratories, Inc.* | Senior loan | | L + 4.75% | | 6.00 | % | 06/2018 | | 697 |
| | 692 |
| | 0.1 |
| | 697 |
|
| | | | | | | | | | 30,385 |
| | 30,018 |
| | 3.8 |
| | 30,385 |
|
| Chemicals, Plastics and Rubber | | | | | | | | | |
| | |
| | |
| | |
|
Flexan, LLC(3) | One stop | | L + 5.25% | | N/A | (5) | 02/2020 | | — |
| | (6 | ) | | — |
| | — |
|
| Flexan, LLC | One stop | | L + 5.25% | | 6.25 | % | 02/2020 | | 6,152 |
| | 6,099 |
| | 0.8 |
| | 6,152 |
|
| Flexan, LLC | One stop | | L + 5.25% | | N/A | (5) | 02/2020 | | — |
| | — |
| | — |
| | — |
|
| | | | | | | | | | 6,152 |
| | 6,093 |
| | 0.8 |
| | 6,152 |
|
| Containers, Packaging and Glass | | | | | | | | | |
| | |
| | |
| | |
|
| Fort Dearborn Company*^ | Senior loan | | L + 4.25% | | 5.25 | % | 10/2017 | | 567 |
| | 565 |
| | 0.1 |
| | 567 |
|
| Fort Dearborn Company*^ | Senior loan | | L + 4.75% | | 5.77 | % | 10/2018 | | 2,612 |
| | 2,599 |
| | 0.3 |
| | 2,612 |
|
| Packaging Coordinators, Inc.*^ | Senior loan | | L + 4.25% | | 5.25 | % | 08/2021 | | 14,850 |
| | 14,724 |
| | 1.8 |
| | 14,786 |
|
| Packaging Coordinators, Inc. | Second lien | | L + 8.00% | | 9.00 | % | 08/2022 | | 10,000 |
| | 9,913 |
| | 1.2 |
| | 9,850 |
|
| | | | | | | | | | 28,029 |
| | 27,801 |
| | 3.4 |
| | 27,815 |
|
| Diversified Conglomerate Manufacturing | | | | | | | | | |
| | |
| | |
| | |
|
| Chase Industries, Inc. | One stop | | L + 5.75% | | 6.83 | % | 09/2020 | | 3,393 |
| | 3,353 |
| | 0.4 |
| | 3,393 |
|
| Chase Industries, Inc. | One stop | | P + 4.50% | | 7.75 | % | 09/2020 | | 234 |
| | 216 |
| | — |
| | 234 |
|
| Chase Industries, Inc.*^ | One stop | | L + 5.75% | | 6.75 | % | 09/2020 | | 20,880 |
| | 20,706 |
| | 2.6 |
| | 20,880 |
|
| Harvey Tool Company, LLC | Senior loan | | L + 5.00% | | N/A | (5) | 03/2019 | | — |
| | — |
| | — |
| | — |
|
See Notes to Consolidated Financial Statements.
Golub Capital BDC, Inc. and Subsidiaries
Consolidated Schedule of Investments – (continued)
September 30, 2015
|
| | | | | | | | | | | | | | | | | | | | | | |
| | Investment Type | | Spread Above Index(1) | | Interest Rate(2) | Maturity Date | | Principal/ Par Amount | | Cost | | Percentage of Net Assets | | Fair Value |
| Diversified Conglomerate Manufacturing – (continued) | | | | | | | | | |
| | |
| | |
| | |
|
| Harvey Tool Company, LLC* | Senior loan | | L + 5.00% | | 6.00 | % | 03/2020 | | $ | 3,131 |
| | $ | 3,100 |
| | 0.4 | % | | $ | 3,100 |
|
ICC-Nexergy, Inc(3) | One stop | | L + 5.50% | | N/A | (5) | 04/2020 | | — |
| | (3 | ) | | — |
| | — |
|
| ICC-Nexergy, Inc^ | One stop | | L + 5.50% | | 6.50 | % | 04/2020 | | 8,590 |
| | 8,535 |
| | 1.1 |
| | 8,590 |
|
Onicon Incorporated(3) | One stop | | L + 6.00% | | N/A | (5) | 04/2020 | | — |
| | (6 | ) | | — |
| | — |
|
| Onicon Incorporated* | One stop | | L + 6.00% | | 7.00 | % | 04/2020 | | 9,286 |
| | 9,212 |
| | 1.2 |
| | 9,286 |
|
Plex Systems, Inc.(3) | One stop | | L + 7.50% | | N/A | (5) | 06/2018 | | — |
| | (26 | ) | | — |
| | — |
|
| Plex Systems, Inc.*^ | One stop | | L + 7.50% | | 8.75 | % | 06/2018 | | 18,797 |
| | 18,431 |
| | 2.3 |
| | 18,797 |
|
| Sunless Merger Sub, Inc. | Senior loan | | P + 4.00% | | 7.25 | % | 07/2016 | | 59 |
| | 58 |
| | — |
| | 32 |
|
| Sunless Merger Sub, Inc.* | Senior loan | | L + 5.25% | | 6.50 | % | 07/2016 | | 1,651 |
| | 1,647 |
| | 0.1 |
| | 1,156 |
|
| | | | | | | | | | 66,021 |
| | 65,223 |
| | 8.1 |
| | 65,468 |
|
| Diversified Conglomerate Service | | | | | | | | | |
| | |
| | |
| | |
|
Accellos, Inc.(3) | One stop | | L + 5.75% | | N/A | (5) | 07/2020 | | — |
| | (17 | ) | | — |
| | — |
|
| Accellos, Inc.*^ | One stop | | L + 5.75% | | 6.75 | % | 07/2020 | | 32,121 |
| | 31,804 |
| | 3.9 |
| | 32,121 |
|
| Actiance, Inc. | One stop | | L + 9.00% | | N/A | (5) | 04/2018 | | — |
| | — |
| | — |
| | — |
|
| Actiance, Inc.*^ | One stop | | L + 9.00% | | 10.00 | % | 04/2018 | | 2,502 |
| | 2,410 |
| | 0.3 |
| | 2,502 |
|
| Aderant North America, Inc.^ | Senior loan | | L + 4.25% | | 5.25 | % | 12/2018 | | 446 |
| | 442 |
| | 0.1 |
| | 446 |
|
Agility Recovery Solutions Inc.(3) | One stop | | L + 6.50% | | N/A | (5) | 03/2020 | | — |
| | (6 | ) | | — |
| | — |
|
| Agility Recovery Solutions Inc.*^ | One stop | | L + 6.50% | | 7.50 | % | 03/2020 | | 10,352 |
| | 10,260 |
| | 1.3 |
| | 10,352 |
|
Bomgar Corporation(3) | One stop | | L + 6.00% | | N/A | (5) | 09/2020 | | — |
| | (20 | ) | | — |
| | (15 | ) |
| Bomgar Corporation* | One stop | | L + 6.00% | | 7.00 | % | 09/2020 | | 29,638 |
| | 29,158 |
| | 3.6 |
| | 29,416 |
|
Daxko, LLC(3) | One stop | | L + 5.00% | | N/A | (5) | 03/2019 | | — |
| | (18 | ) | | — |
| | — |
|
| Daxko, LLC* | One stop | | L + 5.00% | | 6.00 | % | 03/2019 | | 15,528 |
| | 15,327 |
| | 1.9 |
| | 15,528 |
|
| DTI Holdco, Inc. | Senior loan | | L + 5.00% | | 6.00 | % | 08/2020 | | 8,527 |
| | 8,447 |
| | 1.0 |
| | 8,271 |
|
HealthcareSource HR, Inc.(3) | One stop | | L + 6.75% | | N/A | (5) | 05/2020 | | — |
| | (2 | ) | | — |
| | — |
|
| HealthcareSource HR, Inc. | One stop | | L + 6.75% | | 7.75 | % | 05/2020 | | 17,903 |
| | 17,508 |
| | 2.2 |
| | 17,903 |
|
Host Analytics, Inc.(3) | One stop | | N/A | | N/A | (5) | 02/2020 | | — |
| | (6 | ) | | — |
| | — |
|
| Host Analytics, Inc. | One stop | | N/A | | 8.50% cash/2.25% PIK | 02/2020 | | 2,960 |
| | 2,914 |
| | 0.4 |
| | 2,960 |
|
| Integration Appliance, Inc. | One stop | | L + 8.25% | | 9.50 | % | 09/2018 | | 899 |
| | 890 |
| | 0.1 |
| | 899 |
|
| Integration Appliance, Inc.* | One stop | | L + 8.25% | | 9.50 | % | 09/2020 | | 719 |
| | 709 |
| | 0.1 |
| | 719 |
|
| Integration Appliance, Inc. | One stop | | L + 8.25% | | 9.50 | % | 06/2019 | | 7,914 |
| | 7,766 |
| | 1.0 |
| | 7,914 |
|
| Integration Appliance, Inc. | One stop | | L + 8.25% | | 9.50 | % | 09/2018 | | 5,396 |
| | 5,315 |
| | 0.7 |
| | 5,396 |
|
Mediaocean LLC(3) | Senior loan | | L + 4.50% | | N/A | (5) | 08/2020 | | — |
| | (1 | ) | | — |
| | — |
|
| Mediaocean LLC | Senior loan | | L + 4.75% | | 5.75 | % | 08/2022 | | 3,000 |
| | 2,934 |
| | 0.4 |
| | 2,970 |
|
| NetSmart Technologies, Inc. | One stop | | P + 4.25% | | 7.50 | % | 02/2019 | | 340 |
| | 323 |
| | — |
| | 340 |
|
| NetSmart Technologies, Inc.*^ | One stop | | L + 5.25% | | 6.25 | % | 02/2019 | | 14,816 |
| | 14,690 |
| | 1.8 |
| | 14,816 |
|
| PC Helps Support, LLC | Senior loan | | P + 4.25% | | 7.50 | % | 09/2017 | | 66 |
| | 65 |
| | — |
| | 62 |
|
| PC Helps Support, LLC | Senior loan | | L + 5.25% | | 6.51 | % | 09/2017 | | 1,522 |
| | 1,513 |
| | 0.2 |
| | 1,492 |
|
| Saldon Holdings, Inc. | Senior loan | | L + 4.50% | | N/A | (5) | 09/2021 | | — |
| | — |
| | — |
| | — |
|
| Saldon Holdings, Inc. | Senior loan | | L + 4.50% | | 5.50 | % | 09/2021 | | 2,990 |
| | 2,960 |
| | 0.4 |
| | 2,960 |
|
Secure-24, LLC(3) | One stop | | L + 6.00% | | N/A | (5) | 08/2017 | | — |
| | (3 | ) | | — |
| | — |
|
| Secure-24, LLC* | One stop | | L + 6.00% | | 7.25 | % | 08/2017 | | 10,028 |
| | 9,911 |
| | 1.2 |
| | 10,028 |
|
| Secure-24, LLC^ | One stop | | L + 6.00% | | 7.25 | % | 08/2017 | | 1,467 |
| | 1,454 |
| | 0.2 |
| | 1,467 |
|
Severin Acquisition, LLC(3) | Senior loan | | L + 4.50% | | N/A | (5) | 07/2021 | | — |
| | (1 | ) | | — |
| | (1 | ) |
| Severin Acquisition, LLC | Senior loan | | L + 4.50% | | 5.50 | % | 07/2021 | | 4,931 |
| | 4,859 |
| | 0.6 |
| | 4,882 |
|
| Source Medical Solutions, Inc. | Second lien | | L + 8.00% | | 9.00 | % | 03/2018 | | 9,294 |
| | 9,189 |
| | 1.1 |
| | 9,294 |
|
| Steelwedge Software, Inc. | One stop | | L + 10.00% | | N/A | (5) | 09/2020 | | — |
| | — |
| | — |
| | — |
|
| Steelwedge Software, Inc.^ | One stop | | P + 10.75% | | 12.00% cash/2.00% PIK | 09/2020 | | 2,153 |
| | 2,055 |
| | 0.3 |
| | 2,055 |
|
| TA MHI Buyer, Inc. | One stop | | L + 6.50% | | N/A | (5) | 09/2021 | | — |
| | — |
| | — |
| | — |
|
See Notes to Consolidated Financial Statements.
Golub Capital BDC, Inc. and Subsidiaries
Consolidated Schedule of Investments – (continued)
September 30, 2015
(In thousands)
|
| | | | | | | | | | | | | | | | | | | | | | |
| | Investment Type | | Spread Above Index(1) | | Interest Rate(2) | Maturity Date | | Principal/ Par Amount | | Cost | | Percentage of Net Assets | | Fair Value |
| Diversified Conglomerate Service – (continued) | | | | | | | | | |
| | |
| | |
| | |
|
TA MHI Buyer, Inc.^ | One stop | | L + 6.50% | | 7.50 | % | 09/2021 | | $ | 8,294 |
| | $ | 8,222 |
| | 1.0 | % | | $ | 8,222 |
|
Vendavo, Inc.(3) | One stop | | L + 8.50% | | N/A | (5) | 10/2019 | | — |
| | (13 | ) | | — |
| | — |
|
| Vendavo, Inc. | One stop | | L + 8.50% | | 9.50 | % | 10/2019 | | 15,501 |
| | 15,219 |
| | 1.9 |
| | 15,501 |
|
| | | | | | | | | | 209,307 |
| | 206,257 |
| | 25.7 |
| | 208,500 |
|
| Electronics | | | | | | | | | |
| | |
| | |
| | |
|
| Appriss Holdings, Inc. | Senior loan | | L + 4.75% | | 5.07 | % | 11/2020 | | 902 |
| | 865 |
| | 0.1 |
| | 873 |
|
| Appriss Holdings, Inc.* | Senior loan | | L + 4.75% | | 5.75 | % | 11/2020 | | 20,948 |
| | 20,673 |
| | 2.5 |
| | 20,738 |
|
| Compusearch Software Holdings, Inc.^ | Senior loan | | L + 4.50% | | 5.50 | % | 05/2021 | | 1,321 |
| | 1,318 |
| | 0.2 |
| | 1,321 |
|
| ECI Acquisition Holdings, Inc. | One stop | | L + 6.25% | | 7.25 | % | 03/2019 | | 1,410 |
| | 1,349 |
| | 0.2 |
| | 1,410 |
|
ECI Acquisition Holdings, Inc.(3) | One stop | | L + 6.25% | | N/A | (5) | 03/2019 | | — |
| | (13 | ) | | — |
| | — |
|
| ECI Acquisition Holdings, Inc.*^ | One stop | | L + 6.25% | | 7.25 | % | 03/2019 | | 21,779 |
| | 21,495 |
| | 2.7 |
| | 21,779 |
|
Gamma Technologies, LLC(3) | One stop | | L + 5.50% | | N/A | (5) | 06/2021 | | — |
| | (1 | ) | | — |
| | — |
|
| Gamma Technologies, LLC^ | One stop | | L + 5.50% | | 6.50 | % | 06/2021 | | 18,183 |
| | 18,010 |
| | 2.2 |
| | 18,183 |
|
| Park Place Technologies LLC | One stop | | L + 5.50% | | N/A | (5) | 07/2021 | | — |
| | — |
| | — |
| | — |
|
| Park Place Technologies LLC*^ | One stop | | L + 5.50% | | 6.50 | % | 07/2021 | | 4,950 |
| | 4,914 |
| | 0.6 |
| | 4,926 |
|
| Sloan Company, Inc., The | One stop | | L + 6.25% | | 7.25 | % | 04/2020 | | 30 |
| | 30 |
| | — |
| | 29 |
|
| Sloan Company, Inc., The | One stop | | L + 6.25% | | 7.25 | % | 04/2020 | | 7,589 |
| | 7,503 |
| | 0.9 |
| | 7,362 |
|
Sparta Holding Corporation(3) | One stop | | L + 5.50% | | N/A | (5) | 07/2020 | | — |
| | (31 | ) | | — |
| | — |
|
| Sparta Holding Corporation*^ | One stop | | L + 5.50% | | 6.50 | % | 07/2020 | | 23,125 |
| | 22,893 |
| | 2.9 |
| | 23,125 |
|
Syncsort Incorporated(3) | Senior loan | | L + 4.75% | | N/A | (5) | 03/2019 | | — |
| | (3 | ) | | — |
| | — |
|
Syncsort Incorporated(3) | Senior loan | | L + 4.75% | | N/A | (5) | 03/2019 | | — |
| | (1 | ) | | — |
| | — |
|
| Syncsort Incorporated* | Senior loan | | L + 4.75% | | 5.75 | % | 03/2019 | | 1,984 |
| | 1,970 |
| | 0.2 |
| | 1,984 |
|
Systems Maintenance Services Holding,
Inc.^ | Senior loan | | L + 4.00% | | 5.00 | % | 10/2019 | | 2,623 |
| | 2,614 |
| | 0.3 |
| | 2,623 |
|
Taxware, LLC(3) | One stop | | L + 6.50% | | N/A | (5) | 04/2022 | | — |
| | (5 | ) | | — |
| | — |
|
| Taxware, LLC*^ | One stop | | L + 6.50% | | 7.50 | % | 04/2022 | | 19,899 |
| | 19,609 |
| | 2.5 |
| | 19,899 |
|
| Watchfire Enterprises, Inc. | Second lien | | L + 8.00% | | 9.00 | % | 10/2021 | | 9,435 |
| | 9,242 |
| | 1.2 |
| | 9,435 |
|
| | | | | | | | | | 134,178 |
| | 132,431 |
| | 16.5 |
| | 133,687 |
|
| Finance | | | | | | | | | |
| | |
| | |
| | |
|
Ascensus, Inc.(3) | One stop | | L + 4.00% | | N/A | (5) | 11/2018 | | — |
| | (12 | ) | | — |
| | — |
|
| Ascensus, Inc.^ | One stop | | L + 4.00% | | 5.00 | % | 12/2019 | | 3,953 |
| | 3,895 |
| | 0.5 |
| | 3,953 |
|
Ascensus, Inc.*^ | One stop | | L + 8.00% | | 9.00 | % | 12/2020 | | 6,337 |
| | 6,173 |
| | 0.8 |
| | 6,337 |
|
| | | | | | | | | | 10,290 |
| | 10,056 |
| | 1.3 |
| | 10,290 |
|
| Grocery | | | | | | | | | |
| | |
| | |
| | |
|
AG Kings Holdings Inc.(3) | One stop | | L + 5.50% | | N/A | (5) | 04/2020 | | — |
| | (7 | ) | | — |
| | — |
|
| AG Kings Holdings Inc. | One stop | | L + 5.50 | | 6.50 | % | 04/2020 | | 6,183 |
| | 6,127 |
| | 0.8 |
| | 6,183 |
|
MyWebGrocer, Inc.(3) | One stop | | L + 8.75% | | N/A | (5) | 05/2018 | | — |
| | (11 | ) | | — |
| | — |
|
MyWebGrocer, Inc.^ | One stop | | L + 8.75% | | 10.00 | % | 05/2018 | | 14,271 |
| | 14,115 |
| | 1.7 |
| | 14,271 |
|
| | | | | | | | | | 20,454 |
| | 20,224 |
| | 2.5 |
| | 20,454 |
|
| Healthcare, Education and Childcare | | | | | | | | | |
| | |
| | |
| | |
|
| Agilitas USA, Inc.^ | Senior loan | | L + 4.00% | | 5.00 | % | 10/2020 | | 2,125 |
| | 2,107 |
| | 0.3 |
| | 2,125 |
|
| Avalign Technologies, Inc.^ | Senior loan | | L + 4.50% | | 5.50 | % | 07/2021 | | 1,165 |
| | 1,160 |
| | 0.2 |
| | 1,159 |
|
Avatar International, LLC(6) | One stop | | L + 7.89% | | 6.19% cash/2.95% PIK | 09/2016 | | 1,648 |
| | 1,644 |
| | 0.1 |
| | 548 |
|
| Avatar International, LLC | One stop | | L + 7.89% | | 6.19% cash/2.95% PIK | 09/2016 | | 573 |
| | 571 |
| | 0.1 |
| | 573 |
|
Avatar International, LLC(6)* | One stop | | L + 7.89% | | 6.19% cash/2.95% PIK | 09/2016 | | 7,641 |
| | 7,615 |
| | 0.3 |
| | 2,540 |
|
| California Cryobank, LLC^ | One stop | | L + 5.50% | | 6.50 | % | 08/2019 | | 1,550 |
| | 1,538 |
| | 0.2 |
| | 1,550 |
|
See Notes to Consolidated Financial Statements.
Golub Capital BDC, Inc. and Subsidiaries
Consolidated Schedule of Investments – (continued)
September 30, 2015
(In thousands)
|
| | | | | | | | | | | | | | | | | | | | | | |
| | Investment Type | | Spread Above Index(1) | | Interest Rate(2) | Maturity Date | | Principal/ Par Amount | | Cost | | Percentage of Net Assets | | Fair Value |
| Healthcare, Education and Childcare – (continued) | | | | | | | | | |
| | |
| | |
| | |
|
| California Cryobank, LLC | One stop | | L + 5.50% | | 6.50 | % | 08/2019 | | $ | 43 |
| | $ | 42 |
| | — | % | | $ | 43 |
|
| California Cryobank, LLC | One stop | | P + 4.25% | | 7.50 | % | 08/2019 | | 43 |
| | 41 |
| | — |
| | 43 |
|
Certara L.P.(3) | One stop | | L + 6.25% | | N/A | (5) | 12/2018 | | — |
| | (14 | ) | | — |
| | — |
|
| Certara L.P.*^ | One stop | | L + 6.25% | | 7.25 | % | 12/2018 | | 30,848 |
| | 30,555 |
| | 3.8 |
| | 30,848 |
|
| CPI Buyer, LLC (Cole-Parmer)*^ | Senior loan | | L + 4.50% | | 5.50 | % | 08/2021 | | 7,940 |
| | 7,674 |
| | 1.0 |
| | 7,900 |
|
| Curo Health Services LLC | Senior loan | | L + 5.50% | | 6.50 | % | 02/2022 | | 1,990 |
| | 1,972 |
| | 0.3 |
| | 1,997 |
|
DCA Investment Holding, LLC(3) | One stop | | L + 5.25% | | N/A | (5) | 07/2021 | | — |
| | (2 | ) | | — |
| | (1 | ) |
| DCA Investment Holding, LLC* | One stop | | L + 5.25% | | 6.25 | % | 07/2021 | | 14,336 |
| | 13,990 |
| | 1.8 |
| | 14,192 |
|
Deca Dental Management LLC(3) | One stop | | L + 6.25% | | N/A | (5) | 07/2020 | | — |
| | (11 | ) | | — |
| | (8 | ) |
| Deca Dental Management LLC | One stop | | P + 5.25% | | 8.50 | % | 07/2020 | | 20 |
| | 19 |
| | — |
| | 20 |
|
| Deca Dental Management LLC*^ | One stop | | L + 6.25% | | 7.25 | % | 07/2020 | | 4,188 |
| | 4,128 |
| | 0.5 |
| | 4,146 |
|
| Delta Educational Systems* | Senior loan | | P + 4.75% | | 8.00 | % | 12/2016 | | 1,435 |
| | 1,424 |
| | 0.2 |
| | 1,220 |
|
Delta Educational Systems(3) | Senior loan | | L + 6.00% | | N/A | (5) | 12/2016 | | — |
| | — |
| | — |
| | (8 | ) |
Dental Holdings Corporation(3) | One stop | | L + 5.50% | | N/A | (5) | 02/2020 | | — |
| | (16 | ) | | — |
| | — |
|
Dental Holdings Corporation(3) | One stop | | L + 5.50% | | N/A | (5) | 02/2020 | | — |
| | (12 | ) | | — |
| | — |
|
| Dental Holdings Corporation | One stop | | L + 5.50% | | 6.50 | % | 02/2020 | | 6,575 |
| | 6,444 |
| | 0.8 |
| | 6,575 |
|
Encore GC Acquisition, LLC(3) | Senior loan | | L + 4.50% | | N/A | (5) | 01/2020 | | — |
| | (9 | ) | | — |
| | — |
|
| Encore GC Acquisition, LLC* | Senior loan | | L + 4.50% | | 5.50 | % | 01/2020 | | 3,484 |
| | 3,439 |
| | 0.4 |
| | 3,484 |
|
| G & H Wire Company, Inc. | One stop | | L + 5.75% | | 6.75 | % | 12/2017 | | 268 |
| | 263 |
| | — |
| | 268 |
|
| G & H Wire Company, Inc.*^ | One stop | | L + 5.75% | | 6.75 | % | 12/2017 | | 13,291 |
| | 13,197 |
| | 1.6 |
| | 13,291 |
|
| GSDM Holdings Corp. | Senior loan | | L + 4.25% | | 5.25 | % | 06/2019 | | 870 |
| | 867 |
| | 0.1 |
| | 870 |
|
| IntegraMed America, Inc. | One stop | | L + 7.25% | | 8.50 | % | 09/2017 | | 406 |
| | 402 |
| | — |
| | 398 |
|
| IntegraMed America, Inc.*^ | One stop | | L + 7.25% | | 8.50 | % | 09/2017 | | 14,975 |
| | 14,839 |
| | 1.8 |
| | 14,676 |
|
| Joerns Healthcare, LLC* | One stop | | L + 5.00% | | 6.17 | % | 05/2020 | | 3,318 |
| | 3,286 |
| | 0.4 |
| | 3,301 |
|
Katena Holdings, Inc.(3) | One stop | | L + 6.25% | | N/A | (5) | 06/2021 | | — |
| | (8 | ) | | — |
| | — |
|
Katena Holdings, Inc.(3) | One stop | | L + 6.25% | | N/A | (5) | 06/2021 | | — |
| | (1 | ) | | — |
| | — |
|
| Katena Holdings, Inc.^ | One stop | | L + 6.25% | | 7.25 | % | 06/2021 | | 8,142 |
| | 8,064 |
| | 1.0 |
| | 8,142 |
|
| Maverick Healthcare Group, LLC* | Senior loan | | L + 5.50% | | 7.25 | % | 12/2016 | | 1,933 |
| | 1,912 |
| | 0.2 |
| | 1,933 |
|
Pentec Acquisition Sub, Inc.(3) | Senior loan | | L + 5.00% | | N/A | (5) | 05/2017 | | — |
| | (1 | ) | | — |
| | — |
|
| Pentec Acquisition Sub, Inc.* | Senior loan | | L + 5.00% | | 6.25 | % | 05/2018 | | 1,588 |
| | 1,574 |
| | 0.2 |
| | 1,588 |
|
PPT Management, LLC(3) | One stop | | L + 5.00% | | N/A | (5) | 04/2020 | | — |
| | (1 | ) | | — |
| | — |
|
| PPT Management, LLC*^ | One stop | | L + 5.00% | | 6.00 | % | 04/2020 | | 13,158 |
| | 13,037 |
| | 1.6 |
| | 13,158 |
|
| Premise Health Holding Corp. | One stop | | L + 4.50% | | 5.50 | % | 06/2020 | | 394 |
| | 374 |
| | — |
| | 394 |
|
| Premise Health Holding Corp. | One stop | | L + 4.50% | | 5.50 | % | 06/2020 | | 15,000 |
| | 14,896 |
| | 1.9 |
| | 15,000 |
|
| Pyramid Healthcare, Inc. | One stop | | P + 4.50% | | 7.75 | % | 08/2019 | | 313 |
| | 309 |
| | — |
| | 313 |
|
| Pyramid Healthcare, Inc.^ | One stop | | L + 5.75% | | 6.75 | % | 08/2019 | | 8,439 |
| | 8,377 |
| | 1.0 |
| | 8,439 |
|
Radiology Partners, Inc.(3) | One stop | | L + 5.00% | | N/A | (5) | 09/2020 | | — |
| | (38 | ) | | — |
| | — |
|
Radiology Partners, Inc.(3) | One stop | | L + 5.00% | | N/A | (5) | 09/2020 | | — |
| | (6 | ) | | — |
| | — |
|
| Radiology Partners, Inc.*^ | One stop | | L + 5.00% | | 6.00 | % | 09/2020 | | 17,037 |
| | 16,813 |
| | 2.1 |
| | 17,037 |
|
| Reliant Pro ReHab, LLC | Senior loan | | P + 4.00% | | 7.25 | % | 06/2017 | | 424 |
| | 419 |
| | 0.1 |
| | 424 |
|
| Reliant Pro ReHab, LLC* | Senior loan | | L + 5.00% | | 6.00 | % | 06/2017 | | 3,226 |
| | 3,206 |
| | 0.4 |
| | 3,226 |
|
RXH Buyer Corporation(3) | One stop | | L + 5.75% | | N/A | (5) | 09/2021 | | — |
| | (56 | ) | | — |
| | (28 | ) |
RXH Buyer Corporation(3) | One stop | | L + 5.75% | | N/A | (5) | 09/2021 | | — |
| | (4 | ) | | — |
| | (2 | ) |
| RXH Buyer Corporation*^ | One stop | | L + 5.75% | | 6.75 | % | 09/2021 | | 17,612 |
| | 17,264 |
| | 2.2 |
| | 17,435 |
|
Southern Anesthesia and Surgical(3) | One stop | | L + 5.50% | | N/A | (5) | 11/2017 | | — |
| | (27 | ) | | — |
| | — |
|
Southern Anesthesia and Surgical(3) | One stop | | L + 5.50% | | N/A | (5) | 11/2017 | | — |
| | (7 | ) | | — |
| | — |
|
| Southern Anesthesia and Surgical | One stop | | L + 5.50% | | 6.50 | % | 11/2017 | | 5,638 |
| | 5,570 |
| | 0.7 |
| | 5,638 |
|
| Surgical Information Systems, LLC^ | Senior loan | | L + 3.00% | | 4.01 | % | 09/2018 | | 1,934 |
| | 1,930 |
| | 0.2 |
| | 1,934 |
|
| U.S. Anesthesia Partners, Inc. | One stop | | L + 5.00% | | 6.00 | % | 12/2019 | | 5,942 |
| | 5,918 |
| | 0.7 |
| | 5,942 |
|
See Notes to Consolidated Financial Statements.
Golub Capital BDC, Inc. and Subsidiaries
Consolidated Schedule of Investments – (continued)
September 30, 2015
(In thousands)
|
| | | | | | | | | | | | | | | | | | | | | | |
| | Investment Type | | Spread Above Index(1) | | Interest Rate(2) | Maturity Date | | Principal/ Par Amount | | Cost | | Percentage of Net Assets | | Fair Value |
| Healthcare, Education and Childcare – (continued) | | | | | | | | | |
| | |
| | |
| | |
|
| WIL Research Company, Inc.* | Senior loan | | L + 4.50% | | 5.75 | % | 02/2018 | | $ | 756 |
| | $ | 751 |
| | 0.1 | % | | $ | 737 |
|
| Young Innovations, Inc. | Senior loan | | L + 3.25% | | N/A | (5) | 01/2018 | | — |
| | — |
| | — |
| | — |
|
| Young Innovations, Inc.* | Senior loan | | L + 4.25% | | 5.25 | % | 01/2019 | | 1,830 |
| | 1,819 |
| | 0.2 |
| | 1,830 |
|
| | | | | | | | | | 222,098 |
| | 219,237 |
| | 26.5 |
| | 214,890 |
|
| Home and Office Furnishings, Housewares, and Durable Consumer | | | | | | | | | |
| | |
| | |
| | |
|
| 1A Smart Start LLC* | Senior loan | | L + 4.75% | | 5.75 | % | 02/2022 | | 2,132 |
| | 2,111 |
| | 0.3 |
| | 2,127 |
|
| Plano Molding Company, LLC* | One stop | | L + 6.00% | | 7.00 | % | 05/2021 | | 18,115 |
| | 17,946 |
| | 2.2 |
| | 18,115 |
|
| WII Components, Inc. | Senior loan | | L + 4.50% | | N/A | (5) | 07/2018 | | — |
| | — |
| | — |
| | — |
|
| WII Components, Inc.* | Senior loan | | L + 4.25% | | 5.25 | % | 07/2018 | | 1,048 |
| | 1,044 |
| | 0.1 |
| | 1,048 |
|
Zenith Products Corporation(6) | One stop | | P + 1.75% | | 5.00 | % | 09/2013 | | 81 |
| | 48 |
| | — |
| | 41 |
|
Zenith Products Corporation*(6) | One stop | | P + 3.50% | | 6.75 | % | 09/2013 | | 4,376 |
| | 3,926 |
| | 0.3 |
| | 2,188 |
|
| | | | | | | | | | 25,752 |
| | 25,075 |
| | 2.9 |
| | 23,519 |
|
| Insurance | | | | | | | | | |
| | |
| | |
| | |
|
Captive Resources Midco, LLC(3) | One stop | | L + 5.75% | | N/A | (5) | 06/2020 | | — |
| | (22 | ) | | — |
| | (19 | ) |
Captive Resources Midco, LLC(3) | One stop | | L + 5.75% | | N/A | (5) | 06/2020 | | — |
| | (20 | ) | | — |
| | (17 | ) |
| Captive Resources Midco, LLC*^ | One stop | | L + 5.75% | | 6.75 | % | 06/2020 | | 26,845 |
| | 26,525 |
| | 3.3 |
| | 26,575 |
|
Internet Pipeline, Inc.(3) | One stop | | L + 7.25% | | N/A | (5) | 08/2021 | | — |
| | (1 | ) | | — |
| | — |
|
| Internet Pipeline, Inc. | One stop | | L + 7.25% | | 8.25 | % | 08/2022 | | 4,960 |
| | 4,826 |
| | 0.6 |
| | 4,910 |
|
| | | | | | | | | | 31,805 |
| | 31,308 |
| | 3.9 |
| | 31,449 |
|
| Investment Funds and Vehicles | | | | | | | | | |
| | |
| | |
| | |
|
Senior Loan Fund LLC(7)(8) | Subordinated debt | | L + 8.00% | | 8.19 | % | 05/2020 | | 76,563 |
| | 76,563 |
| | 9.5 |
| | 76,563 |
|
| Leisure, Amusement, Motion Pictures and Entertainment | | | | | | | | | |
| | |
| | |
| | |
|
| Competitor Group, Inc. | One stop | | L + 7.75% | | 9.00 | % | 11/2018 | | 884 |
| | 876 |
| | 0.1 |
| | 773 |
|
| Competitor Group, Inc.* | One stop | | L + 9.25% | | 9.00% cash/1.50% PIK | 11/2018 | | 12,331 |
| | 12,221 |
| | 1.4 |
| | 11,098 |
|
Self Esteem Brands, LLC(3) | Senior loan | | L + 4.00% | | N/A | (5) | 02/2020 | | — |
| | (4 | ) | | — |
| | — |
|
| Self Esteem Brands, LLC^ | Senior loan | | L + 4.00% | | 5.00 | % | 02/2020 | | 3,669 |
| | 3,653 |
| | 0.5 |
| | 3,669 |
|
Starplex Operating, L.L.C.(3) | One stop | | L + 7.00% | | N/A | (5) | 12/2017 | | — |
| | (9 | ) | | — |
| | — |
|
| Starplex Operating, L.L.C.*^ | One stop | | L + 7.00% | | 8.00 | % | 12/2017 | | 9,979 |
| | 9,863 |
| | 1.2 |
| | 9,979 |
|
| Teaching Company, The | One stop | | L + 6.25% | | 7.25 | % | 08/2020 | | 30 |
| | 29 |
| | — |
| | 29 |
|
| Teaching Company, The | One stop | | L + 6.25% | | 7.25 | % | 08/2020 | | 19,069 |
| | 18,789 |
| | 2.3 |
| | 18,878 |
|
Titan Fitness, LLC(3) | One stop | | L + 6.50% | | N/A | (5) | 09/2019 | | — |
| | (17 | ) | | — |
| | — |
|
| Titan Fitness, LLC* | One stop | | L + 6.50% | | 7.75 | % | 09/2019 | | 13,326 |
| | 13,120 |
| | 1.6 |
| | 13,326 |
|
Titan Fitness, LLC(3) | One stop | | L + 6.50% | | N/A | (5) | 09/2019 | | — |
| | (17 | ) | | — |
| | — |
|
| | | | | | | | | | 59,288 |
| | 58,504 |
| | 7.1 |
| | 57,752 |
|
| Mining, Steel, Iron and Non-Precious Metals | | | | | | | | | |
| | |
| | |
| | |
|
| Benetech, Inc. | One stop | | P + 7.75% | | 11.00 | % | 10/2017 | | 303 |
| | 297 |
| | — |
| | 303 |
|
| Benetech, Inc.* | One stop | | L + 9.00% | | 10.25 | % | 10/2017 | | 4,696 |
| | 4,671 |
| | 0.6 |
| | 4,696 |
|
| | | | | | | | | | 4,999 |
| | 4,968 |
| | 0.6 |
| | 4,999 |
|
| Oil and Gas | | | | | | | | | |
| | |
| | |
| | |
|
Drilling Info, Inc.(3)(4) | One stop | | L + 5.00% | | N/A | (5) | 06/2018 | | — |
| | (1 | ) | | — |
| | — |
|
Drilling Info, Inc.(4) | One stop | | L + 5.00% | | 6.00 | % | 06/2018 | | 355 |
| | 353 |
| | — |
| | 355 |
|
| Drilling Info, Inc.^ | One stop | | L + 5.00% | | 6.00 | % | 06/2018 | | 901 |
| | 894 |
| | 0.1 |
| | 901 |
|
Drilling Info, Inc.(3)(4) | One stop | | L + 5.00% | | N/A | (5) | 06/2018 | | — |
| | (5 | ) | | — |
| | — |
|
| | | | | | | | | | 1,256 |
| | 1,241 |
| | 0.1 |
| | 1,256 |
|
See Notes to Consolidated Financial Statements.
Golub Capital BDC, Inc. and Subsidiaries
Consolidated Schedule of Investments – (continued)
September 30, 2015
(In thousands)
|
| | | | | | | | | | | | | | | | | | | | | | |
| | Investment Type | | Spread Above Index(1) | | Interest Rate(2) | Maturity Date | | Principal/ Par Amount | | Cost | | Percentage of Net Assets | | Fair Value |
| Personal and Non-Durable Consumer Products | | | | | | | | | |
| | |
| | |
| | |
|
The Hygenic Corporation(3) | Senior loan | | L + 5.00% | | N/A | (5) | 10/2019 | | $ | — |
| | $ | (5 | ) | | — | % | | $ | — |
|
| The Hygenic Corporation* | Senior loan | | L + 5.00% | | 6.00 | % | 10/2020 | | 3,275 |
| | 3,231 |
| | 0.4 |
| | 3,275 |
|
Massage Envy, LLC(3) | One stop | | L + 7.25% | | N/A | (5) | 09/2018 | | — |
| | (9 | ) | | — |
| | — |
|
| Massage Envy, LLC* | One stop | | L + 7.25% | | 8.50 | % | 09/2018 | | 15,570 |
| | 15,375 |
| | 1.9 |
| | 15,570 |
|
Orthotics Holdings, Inc(3)(8) | One stop | | L + 5.00% | | N/A | (5) | 02/2020 | | — |
| | (2 | ) | | — |
| | — |
|
Orthotics Holdings, Inc*(8) | One stop | | L + 5.00% | | 6.00 | % | 02/2020 | | 1,387 |
| | 1,372 |
| | 0.2 |
| | 1,387 |
|
Orthotics Holdings, Inc(3) | One stop | | L + 5.00% | | N/A | (5) | 02/2020 | | — |
| | (15 | ) | | — |
| | — |
|
Orthotics Holdings, Inc(3) | One stop | | L + 5.00% | | N/A | (5) | 02/2020 | | — |
| | (14 | ) | | — |
| | — |
|
| Orthotics Holdings, Inc* | One stop | | L + 5.00% | | 6.00 | % | 02/2020 | | 8,460 |
| | 8,367 |
| | 1.0 |
| | 8,460 |
|
Team Technologies Acquisition
Company(3) | Senior loan | | L + 5.00% | | N/A | (5) | 12/2017 | | — |
| | (2 | ) | | — |
| | — |
|
Team Technologies Acquisition
Company^ | Senior loan | | L + 5.00% | | 6.25 | % | 12/2017 | | 4,782 |
| | 4,754 |
| | 0.6 |
| | 4,782 |
|
| Team Technologies Acquisition Company | Senior loan | | L + 5.50% | | 6.75 | % | 12/2017 | | 881 |
| | 871 |
| | 0.1 |
| | 881 |
|
| | | | | | | | | | 34,355 |
| | 33,923 |
| | 4.2 |
| | 34,355 |
|
| Personal, Food and Miscellaneous Services | | | | | | | | | |
| | |
| | |
| | |
|
| Focus Brands Inc.*^ | Second lien | | L + 9.00% | | 10.25 | % | 08/2018 | | 11,195 |
| | 11,120 |
| | 1.4 |
| | 11,195 |
|
| Ignite Restaurant Group, Inc (Joe's Crab Shack)^ | One stop | | L + 7.00% | | 8.00 | % | 02/2019 | | 6,108 |
| | 6,039 |
| | 0.7 |
| | 6,108 |
|
| PetVet Care Centers LLC | Senior loan | | L + 4.50% | | 5.50 | % | 12/2020 | | 646 |
| | 626 |
| | 0.1 |
| | 646 |
|
PetVet Care Centers LLC(3) | Senior loan | | L + 4.50% | | N/A | (5) | 12/2019 | | — |
| | (11 | ) | | — |
| | — |
|
| PetVet Care Centers LLC^ | Senior loan | | L + 4.50% | | 5.50 | % | 12/2020 | | 5,896 |
| | 5,800 |
| | 0.7 |
| | 5,896 |
|
Vetcor Merger Sub LLC(3) | One stop | | L + 6.00% | | N/A | (5) | 04/2021 | | — |
| | (14 | ) | | — |
| | — |
|
| Vetcor Merger Sub LLC | One stop | | L + 6.00% | | 7.00 | % | 04/2021 | | 8 |
| | 4 |
| | — |
| | 8 |
|
| Vetcor Merger Sub LLC*^ | One stop | | L + 6.00% | | 7.00 | % | 04/2021 | | 25,181 |
| | 24,715 |
| | 3.1 |
| | 25,181 |
|
Veterinary Specialists of North America,
LLC | One stop | | L + 5.00% | | N/A | (5) | 05/2020 | | — |
| | — |
| | — |
| | — |
|
| Veterinary Specialists of North America, LLC* | One stop | | L + 5.00% | | 6.00 | % | 05/2020 | | 587 |
| | 582 |
| | 0.1 |
| | 587 |
|
| | | | | | | | | | 49,621 |
| | 48,861 |
| | 6.1 |
| | 49,621 |
|
| Printing and Publishing | | | | | | | | | |
| | |
| | |
| | |
|
| Market Track, LLC | One stop | | P + 6.00% | | 9.25 | % | 10/2019 | | 369 |
| | 345 |
| | — |
| | 347 |
|
| Market Track, LLC*^ | One stop | | L + 7.00% | | 8.00 | % | 10/2019 | | 28,976 |
| | 28,643 |
| | 3.5 |
| | 28,686 |
|
| Market Track, LLC* | One stop | | L + 7.00% | | 8.00 | % | 10/2019 | | 2,197 |
| | 2,173 |
| | 0.3 |
| | 2,175 |
|
| Market Track, LLC | One stop | | L + 7.00% | | 8.00 | % | 10/2019 | | 1,379 |
| | 1,340 |
| | 0.2 |
| | 1,344 |
|
| | | | | | | | | | 32,921 |
| | 32,501 |
| | 4.0 |
| | 32,552 |
|
| Retail Stores | | | | | | | | | |
| | |
| | |
| | |
|
| Benihana, Inc. | One stop | | P + 4.75% | | 8.00 | % | 07/2018 | | 868 |
| | 823 |
| | 0.1 |
| | 825 |
|
| Benihana, Inc.*^ | One stop | | L + 6.00% | | 7.25 | % | 01/2019 | | 15,436 |
| | 15,124 |
| | 1.9 |
| | 15,127 |
|
| Boot Barn, Inc.*^ | Senior loan | | L + 4.50% | | 5.50 | % | 06/2021 | | 10,775 |
| | 10,621 |
| | 1.3 |
| | 10,775 |
|
| CVS Holdings I, LP | One stop | | L + 6.25% | | 7.25 | % | 08/2021 | | 366 |
| | 329 |
| | — |
| | 347 |
|
CVS Holdings I, LP(3) | One stop | | L + 6.25% | | N/A | (5) | 08/2020 | | — |
| | (4 | ) | | — |
| | (2 | ) |
| CVS Holdings I, LP^ | One stop | | L + 6.25% | | 7.25 | % | 08/2021 | | 20,575 |
| | 20,173 |
| | 2.5 |
| | 20,369 |
|
Cycle Gear, Inc.(3) | One stop | | L + 6.00% | | N/A | (5) | 01/2020 | | — |
| | (15 | ) | | — |
| | — |
|
| Cycle Gear, Inc. | One stop | | L + 6.00% | | 7.00 | % | 01/2020 | | 6,486 |
| | 6,362 |
| | 0.8 |
| | 6,486 |
|
| DTLR, Inc.*^ | One stop | | L + 8.00% | | 11.00 | % | 12/2015 | | 15,026 |
| | 15,017 |
| | 1.8 |
| | 15,026 |
|
Elite Sportswear, L.P.(3) | Senior loan | | L + 5.00% | | N/A | (5) | 03/2020 | | — |
| | (7 | ) | | — |
| | — |
|
| Elite Sportswear, L.P. | Senior loan | | L + 5.00% | | 6.00 | % | 03/2020 | | 2,849 |
| | 2,798 |
| | 0.4 |
| | 2,849 |
|
| Express Oil Change, LLC* | Senior loan | | L + 5.00% | | 6.00 | % | 12/2017 | | 104 |
| | 103 |
| | — |
| | 104 |
|
| Express Oil Change, LLC* | Senior loan | | L + 5.00% | | 6.00 | % | 12/2017 | | 1,371 |
| | 1,366 |
| | 0.2 |
| | 1,371 |
|
See Notes to Consolidated Financial Statements.
Golub Capital BDC, Inc. and Subsidiaries
Consolidated Schedule of Investments – (continued)
September 30, 2015
(In thousands)
|
| | | | | | | | | | | | | | | | | | | | | | |
| | Investment Type | | Spread Above Index(1) | | Interest Rate(2) | Maturity Date | | Principal/ Par Amount | | Cost | | Percentage of Net Assets | | Fair Value |
| Retail Stores – (continued) | | | | | | | | | |
| | |
| | |
| | |
|
Express Oil Change, LLC(3) | Senior loan | | L + 5.00% | | N/A | (5) | 12/2017 | | $ | — |
| | $ | (3 | ) | | — | % | | $ | — |
|
| Express Oil Change, LLC* | Senior loan | | L + 5.00% | | 6.00 | % | 12/2017 | | 3,672 |
| | 3,647 |
| | 0.5 |
| | 3,672 |
|
Floor & Decor Outlets of America,
Inc.*^ | One stop | | L + 6.50% | | 7.75 | % | 05/2019 | | 11,130 |
| | 11,047 |
| | 1.4 |
| | 11,130 |
|
Marshall Retail Group, LLC, The(3) | One stop | | L + 6.00% | | N/A | (5) | 08/2020 | | — |
| | (9 | ) | | — |
| | (27 | ) |
| Marshall Retail Group, LLC, The | One stop | | L + 6.00% | | 7.00 | % | 08/2019 | | 146 |
| | 124 |
| | — |
| | 80 |
|
| Marshall Retail Group, LLC, The^ | One stop | | L + 6.00% | | 7.00 | % | 08/2020 | | 12,331 |
| | 12,205 |
| | 1.5 |
| | 11,960 |
|
| Paper Source, Inc. | One stop | | P + 5.00% | | 7.75 | % | 09/2018 | | 677 |
| | 670 |
| | 0.1 |
| | 677 |
|
| Paper Source, Inc.*^ | One stop | | L + 6.25% | | 7.25 | % | 09/2018 | | 12,888 |
| | 12,810 |
| | 1.6 |
| | 12,888 |
|
RCPSI Corporation(3) | One stop | | L + 5.75% | | N/A | (5) | 04/2020 | | — |
| | (4 | ) | | — |
| | — |
|
| RCPSI Corporation*^ | One stop | | L + 5.75% | | 6.75 | % | 04/2021 | | 22,400 |
| | 21,986 |
| | 2.8 |
| | 22,400 |
|
| Restaurant Holding Company, LLC | Senior loan | | L + 7.75% | | 8.75 | % | 02/2019 | | 4,843 |
| | 4,809 |
| | 0.5 |
| | 4,310 |
|
| Rubio's Restaurants, Inc | Senior loan | | L + 4.75% | | 6.00 | % | 11/2018 | | 3,985 |
| | 3,985 |
| | 0.4 |
| | 3,985 |
|
| Sneaker Villa, Inc.^ | One stop | | L + 8.50% | | 10.00 | % | 12/2017 | | 627 |
| | 620 |
| | 0.1 |
| | 627 |
|
| Sneaker Villa, Inc. | One stop | | L + 8.50% | | 10.00 | % | 12/2017 | | 752 |
| | 740 |
| | 0.1 |
| | 752 |
|
| Sneaker Villa, Inc.^ | One stop | | L + 8.50% | | 10.00 | % | 12/2017 | | 1,206 |
| | 1,195 |
| | 0.1 |
| | 1,206 |
|
| Sneaker Villa, Inc. | One stop | | P + 7.00% | | 10.25 | % | 12/2017 | | 1,253 |
| | 1,240 |
| | 0.2 |
| | 1,253 |
|
| Sneaker Villa, Inc. | One stop | | L + 8.50% | | 10.00 | % | 12/2017 | | 2,506 |
| | 2,489 |
| | 0.3 |
| | 2,506 |
|
| Sneaker Villa, Inc.^ | One stop | | L + 8.50% | | 10.00 | % | 12/2017 | | 4,154 |
| | 4,126 |
| | 0.5 |
| | 4,154 |
|
| Sneaker Villa, Inc. | One stop | | L + 8.50% | | 10.00 | % | 12/2017 | | 4,317 |
| | 4,254 |
| | 0.5 |
| | 4,317 |
|
Specialty Catalog Corp.(3) | One stop | | L + 6.00% | | N/A | (5) | 07/2017 | | — |
| | (3 | ) | | — |
| | — |
|
| Specialty Catalog Corp. | One stop | | L + 6.00% | | 7.50 | % | 07/2017 | | 4,125 |
| | 4,105 |
| | 0.5 |
| | 4,125 |
|
| | | | | | | | | | 164,868 |
| | 162,723 |
| | 20.1 |
| | 163,292 |
|
| Telecommunications | | | | | | | | | |
| | |
| | |
| | |
|
Arise Virtual Solutions, Inc.(3) | One stop | | L + 5.50% | | N/A | (5) | 12/2018 | | — |
| | (1 | ) | | — |
| | (3 | ) |
| Arise Virtual Solutions, Inc.^ | One stop | | L + 5.50% | | 6.75 | % | 12/2018 | | 1,500 |
| | 1,495 |
| | 0.2 |
| | 1,470 |
|
| Hosting.com Inc. | Senior loan | | P + 3.25% | | 6.50 | % | 12/2017 | | 37 |
| | 37 |
| | — |
| | 37 |
|
| Hosting.com Inc.* | Senior loan | | L + 4.50% | | 5.75 | % | 12/2017 | | 790 |
| | 784 |
| | 0.1 |
| | 790 |
|
| | | | | | | | | | 2,327 |
| | 2,315 |
| | 0.3 |
| | 2,294 |
|
| Textile and Leather | | | | | | | | | |
| | |
| | |
| | |
|
| 5.11, Inc.*^ | Senior loan | | L + 5.00% | | 6.00 | % | 02/2020 | | 991 |
| | 987 |
| | 0.1 |
| | 994 |
|
Southern Tide, LLC(3) | One stop | | L + 6.75% | | N/A | (5) | 06/2019 | | — |
| | (7 | ) | | — |
| | — |
|
| Southern Tide, LLC^ | One stop | | L + 6.75% | | 7.75 | % | 06/2019 | | 4,055 |
| | 4,024 |
| | 0.5 |
| | 4,055 |
|
| | | | | | | | | | 5,046 |
| | 5,004 |
| | 0.6 |
| | 5,049 |
|
| Utilities | | | | | | | | | |
| | |
| | |
| | |
|
PowerPlan Consultants, Inc.(3) | Senior loan | | L + 5.25% | | N/A | (5) | 02/2021 | | — |
| | (7 | ) | | — |
| | — |
|
| PowerPlan Consultants, Inc. | Senior loan | | L + 5.25% | | 6.25 | % | 02/2022 | | 4,885 |
| | 4,818 |
| | 0.6 |
| | 4,885 |
|
| | | | | | | | | | 4,885 |
| | 4,811 |
| | 0.6 |
| | 4,885 |
|
| Total debt investments United States | | | | | | | | | $ | 1,471,217 |
| | $ | 1,452,577 |
| | 178.8 | % | | $ | 1,449,603 |
|
| Fair Value as a percentage of Principal Amount | | | | | | | | | |
| | |
| | |
| | 98.5 | % |
See Notes to Consolidated Financial Statements.
Golub Capital BDC, Inc. and Subsidiaries
Consolidated Schedule of Investments – (continued)
September 30, 2015
(In thousands)
|
| | | | | | | | | | | | | | | | | | | | | |
| | Investment Type | | Spread Above Index(1) | | Interest Rate(2) | | Maturity Date | | Shares/ Contracts | | Cost | | Percentage of Net Assets | | Fair Value |
Equity Investments(9)(10) | | | | | | | | | |
| | |
| | |
| | |
|
| Aerospace and Defense | | | | | | | | | |
| | |
| | |
| | |
|
| NTS Technical Systems | Common stock | | N/A | | N/A | | N/A | | 2 |
| | $ | 1,506 |
| | 0.3 | % | | $ | 2,078 |
|
| Tresys Technology Holdings, Inc. | Common stock | | N/A | | N/A | | N/A | | 295 |
| | 295 |
| | — |
| | — |
|
| Whitcraft LLC | Preferred stock B | | N/A | | N/A | | N/A | | 1 |
| | 670 |
| | 0.1 |
| | 821 |
|
| Whitcraft LLC | Warrant | | N/A | | N/A | | N/A | | — |
| | — |
| | — |
| | 160 |
|
| | | | | | | | | | | | 2,471 |
| | 0.4 |
| | 3,059 |
|
| Automobile | | | | | | | | | |
| | |
| | |
| | |
|
| K&N Engineering, Inc. | Preferred stock A | | N/A | | N/A | | N/A | | — |
| | — |
| | — |
| | 6 |
|
| K&N Engineering, Inc. | Preferred stock B | | N/A | | N/A | | N/A | | — |
| | — |
| | — |
| | 6 |
|
| K&N Engineering, Inc. | Common stock | | N/A | | N/A | | N/A | | — |
| | — |
| | — |
| | 47 |
|
| | | | | | | | | | | | — |
| | — |
| | 59 |
|
| Beverage, Food and Tobacco | | | | | | | | | |
| | |
| | |
| | |
|
| Atkins Nutritionals, Inc. | LLC interest | | N/A | | N/A | | N/A | | 57 |
| | 746 |
| | 0.4 |
| | 2,996 |
|
| C. J. Foods, Inc. | Preferred stock | | N/A | | N/A | | N/A | | — |
| | 157 |
| | — |
| | 160 |
|
| First Watch Restaurants, Inc. | Common stock | | N/A | | N/A | | N/A | | 9 |
| | 964 |
| | 0.2 |
| | 1,481 |
|
| Hopdoddy Holdings, LLC | LLC interest | | N/A | | N/A | | N/A | | 27 |
| | 130 |
| | — |
| | 130 |
|
| Julio & Sons Company | LLC interest | | N/A | | N/A | | N/A | | 521 |
| | 521 |
| | 0.1 |
| | 769 |
|
| Northern Brewer, LLC | LLC interest | | N/A | | N/A | | N/A | | 438 |
| | 362 |
| | — |
| | 32 |
|
| Richelieu Foods, Inc. | LP interest | | N/A | | N/A | | N/A | | 220 |
| | 220 |
| | — |
| | 197 |
|
| Tate's Bake Shop, Inc. | LP interest | | N/A | | N/A | | N/A | | — |
| | 462 |
| | 0.1 |
| | 503 |
|
| Uinta Brewing Company | LP interest | | N/A | | N/A | | N/A | | — |
| | 462 |
| | — |
| | 192 |
|
| United Craft Brews LLC | LP interest | | N/A | | N/A | | N/A | | 1 |
| | 657 |
| | 0.1 |
| | 653 |
|
| | | | | | | | | | | | 4,681 |
| | 0.9 |
| | 7,113 |
|
| Buildings and Real Estate | | | | | | | | | |
| | |
| | |
| | |
|
| Brooks Equipment Company, LLC | Common stock | | N/A | | N/A | | N/A | | 10 |
| | 1,021 |
| | 0.1 |
| | 892 |
|
| | | | | | | | | | | | | | | | |
| Chemicals, Plastics and Rubber | | | | | | | | | |
| | |
| | |
| | |
|
| Flexan, LLC | Preferred stock | | N/A | | N/A | | N/A | | — |
| | 73 |
| | — |
| | 75 |
|
| Flexan, LLC | Common stock | | N/A | | N/A | | N/A | | 1 |
| | — |
| | — |
| | 14 |
|
| | | | | | | | | | | | 73 |
| | — |
| | 89 |
|
| Containers, Packaging and Glass | | | | | | | | | |
| | |
| | |
| | |
Packaging Coordinators, Inc.(8) | Common stock | | N/A | | N/A | | N/A | | 25 |
| | 2,065 |
| | 0.3 |
| | 2,533 |
|
| Packaging Coordinators, Inc. | Common stock | | N/A | | N/A | | N/A | | 48 |
| | 1,563 |
| | 0.3 |
| | 2,205 |
|
| | | | | | | | | | | | 3,628 |
| | 0.6 |
| | 4,738 |
|
| Diversified Conglomerate Manufacturing | | | | | | | | | |
| | |
| | |
| | |
|
| Chase Industries, Inc. | LLC units | | N/A | | N/A | | N/A | | 1 |
| | 1,186 |
| | 0.2 |
| | 1,509 |
|
| ICCN Acquisition Corp. | Preferred stock | | N/A | | N/A | | N/A | | — |
| | 370 |
| | — |
| | 360 |
|
| ICCN Acquisition Corp. | Common stock | | N/A | | N/A | | N/A | | — |
| | — |
| | — |
| | — |
|
| Sunless Merger Sub, Inc. | LP interest | | N/A | | N/A | | N/A | | — |
| | 160 |
| | — |
| | — |
|
| | | | | | | | | | | | 1,716 |
| | 0.2 |
| | 1,869 |
|
| Diversified Conglomerate Service | | | | | | | | | |
| | |
| | |
| | |
|
| Actiance, Inc. | Warrant | | N/A | | N/A | | N/A | | 344 |
| | 82 |
| | — |
| | 82 |
|
| Agility Recovery Solutions Inc. | Preferred stock | | N/A | | N/A | | N/A | | 67 |
| | 430 |
| | 0.1 |
| | 447 |
|
| Daxko, LLC | LLC units | | N/A | | N/A | | N/A | | 219 |
| | 219 |
| | — |
| | 343 |
|
| DISA Holdings Acquisition Subsidiary Corp. | Common stock | | N/A | | N/A | | N/A | | — |
| | 154 |
| | — |
| | 72 |
|
| HealthcareSource HR, Inc. | LLC interest | | N/A | | N/A | | N/A | | — |
| | 348 |
| | — |
| | 348 |
|
| Host Analytics, Inc. | Warrant | | N/A | | N/A | | N/A | | 180 |
| | — |
| | — |
| | 98 |
|
| Marathon Data Operating Co., LLC | LLC units | | N/A | | N/A | | N/A | | 1 |
| | 264 |
| | — |
| | — |
|
See Notes to Consolidated Financial Statements.
Golub Capital BDC, Inc. and Subsidiaries
Consolidated Schedule of Investments – (continued)
September 30, 2015
(In thousands)
|
| | | | | | | | | | | | | | | | | | | | | |
| | Investment Type | | Spread Above Index(1) | | Interest Rate(2) | | Maturity Date | | Shares/ Contracts | | Cost | | Percentage of Net Assets | | Fair Value |
| Diversified Conglomerate Service – (continued) | | | | | | | | | |
| | |
| | |
| | |
|
| Marathon Data Operating Co., LLC | LLC units | | N/A | | N/A | | N/A | | 1 |
| | $ | 264 |
| | 0.1 | % | | $ | 604 |
|
| PC Helps Support, LLC | Common stock | | N/A | | N/A | | N/A | | 1 |
| | 7 |
| | — |
| | — |
|
| PC Helps Support, LLC | Preferred stock A | | N/A | | N/A | | N/A | | — |
| | 61 |
| | — |
| | 62 |
|
| Secure-24, LLC | LLC units | | N/A | | N/A | | N/A | | 263 |
| | 263 |
| | 0.1 |
| | 379 |
|
| Steelwedge Software, Inc. | Warrant | | N/A | | N/A | | N/A | | 36,575 |
| | 76 |
| | — |
| | 76 |
|
| TA MHI Buyer, Inc. | Preferred stock | | N/A | | N/A | | N/A | | — |
| | 202 |
| | — |
| | 202 |
|
| Vendavo, Inc. | Preferred stock A | | N/A | | N/A | | N/A | | 827 |
| | 827 |
| | 0.2 |
| | 1,198 |
|
| | | | | | | | | | | | 3,197 |
| | 0.5 |
| | 3,911 |
|
| Electronics | | | | | | | | | |
| | |
| | |
| | |
|
| ECI Acquisition Holdings, Inc. | Common stock | | N/A | | N/A | | N/A | | 9 |
| | 873 |
| | 0.2 |
| | 1,027 |
|
| Gamma Technologies, LLC | LLC units | | N/A | | N/A | | N/A | | 1 |
| | 134 |
| | — |
| | 134 |
|
| SEI, Inc. | LLC units | | N/A | | N/A | | N/A | | 340 |
| | 340 |
| | — |
| | 340 |
|
| Sloan Company, Inc., The | LLC units | | N/A | | N/A | | N/A | | 1 |
| | 14 |
| | — |
| | 14 |
|
| Sloan Company, Inc., The | LLC units | | N/A | | N/A | | N/A | | — |
| | 122 |
| | — |
| | 122 |
|
| Sparta Holding Corporation | Common stock | | N/A | | N/A | | N/A | | 1 |
| | 567 |
| | 0.1 |
| | 629 |
|
| Sparta Holding Corporation | Common stock | | N/A | | N/A | | N/A | | 235 |
| | 6 |
| | — |
| | 208 |
|
| | | | | | | | | | | | 2,056 |
| | 0.3 |
| | 2,474 |
|
| Grocery | | | | | | | | | |
| | |
| | |
| | |
|
| MyWebGrocer, Inc. | LLC units | | N/A | | N/A | | N/A | | 1,418 |
| | 1,446 |
| | 0.2 |
| | 1,389 |
|
| Healthcare, Education and Childcare | | | | | | | | | |
| | |
| | |
| | |
|
Advanced Pain Management Holdings,
Inc. | Common stock | | N/A | | N/A | | N/A | | 67 |
| | 67 |
| | — |
| | — |
|
Advanced Pain Management Holdings,
Inc. | Preferred stock | | N/A | | N/A | | N/A | | 8 |
| | 829 |
| | 0.1 |
| | 871 |
|
Advanced Pain Management Holdings,
Inc. | Preferred stock | | N/A | | N/A | | N/A | | 1 |
| | 64 |
| | — |
| | 194 |
|
| Avatar International, LLC | LP interest | | N/A | | N/A | | N/A | | 1 |
| | 741 |
| | — |
| | — |
|
| California Cryobank, LLC | LLC units | | N/A | | N/A | | N/A | | — |
| | 28 |
| | — |
| | 32 |
|
| California Cryobank, LLC | LLC units | | N/A | | N/A | | N/A | | — |
| | — |
| | — |
| | 5 |
|
| Certara L.P. | LP interest | | N/A | | N/A | | N/A | | — |
| | 635 |
| | 0.1 |
| | 923 |
|
| DCA Investment Holding, LLC | LLC units | | N/A | | N/A | | N/A | | 65 |
| | 6 |
| | — |
| | 6 |
|
| DCA Investment Holding, LLC | LLC units | | N/A | | N/A | | N/A | | 6,386 |
| | 639 |
| | 0.1 |
| | 639 |
|
| Deca Dental Management LLC | LLC units | | N/A | | N/A | | N/A | | 357 |
| | 357 |
| | — |
| | 357 |
|
| Dental Holdings Corporation | LLC units | | N/A | | N/A | | N/A | | 734 |
| | 734 |
| | 0.1 |
| | 736 |
|
| Dialysis Newco, Inc. (DSI Renal) | LLC units | | N/A | | N/A | | N/A | | 871 |
| | — |
| | 0.5 |
| | 3,447 |
|
| Encore GC Acquisition, LLC | LLC units | | N/A | | N/A | | N/A | | 14 |
| | 141 |
| | — |
| | 143 |
|
| Encore GC Acquisition, LLC | LLC units | | N/A | | N/A | | N/A | | 14 |
| | — |
| | — |
| | — |
|
| G & H Wire Company, Inc | LP interest | | N/A | | N/A | | N/A | | — |
| | 102 |
| | — |
| | 122 |
|
| Global Healthcare Exchange, LLC | Common stock | | N/A | | N/A | | N/A | | — |
| | 5 |
| | — |
| | 111 |
|
| Global Healthcare Exchange, LLC | Preferred stock | | N/A | | N/A | | N/A | | — |
| | 481 |
| | 0.1 |
| | 547 |
|
| IntegraMed America, Inc. | Common stock | | N/A | | N/A | | N/A | | 1 |
| | 875 |
| | — |
| | 281 |
|
| Katena Holdings, Inc. | LLC units | | N/A | | N/A | | N/A | | — |
| | 387 |
| | 0.1 |
| | 387 |
|
Northwestern Management Services,
LLC | LLC units | | N/A | | N/A | | N/A | | 3 |
| | 3 |
| | — |
| | 228 |
|
Northwestern Management Services,
LLC | LLC units | | N/A | | N/A | | N/A | | — |
| | 249 |
| | — |
| | 309 |
|
| Pentec Acquisition Sub, Inc. | Preferred stock | | N/A | | N/A | | N/A | | 1 |
| | 116 |
| | |
| | 252 |
|
| Radiology Partners, Inc. | LLC units | | N/A | | N/A | | N/A | | 43 |
| | 85 |
| | — |
| | 82 |
|
| Reliant Pro ReHab, LLC | Preferred stock A | | N/A | | N/A | | N/A | | 2 |
| | 183 |
| | 0.2 |
| | 956 |
|
| RXH Buyer Corporation | LP interest | | N/A | | N/A | | N/A | | 7 |
| | 683 |
| | 0.1 |
| | 683 |
|
See Notes to Consolidated Financial Statements.
Golub Capital BDC, Inc. and Subsidiaries
Consolidated Schedule of Investments – (continued)
September 30, 2015
(In thousands)
|
| | | | | | | | | | | | | | | | | | | | | |
| | Investment Type | | Spread Above Index(1) | | Interest Rate(2) | | Maturity Date | | Shares/ Contracts | | Cost | | Percentage of Net Assets | | Fair Value |
| Healthcare, Education and Childcare – (continued) | | | | | | | | | |
| | |
| | |
| | |
|
| Southern Anesthesia and Surgical | LLC units | | N/A | | N/A | | N/A | | 487 |
| | $ | 487 |
| | 0.1 | % | | $ | 794 |
|
| Spear Education, LLC | LLC units | | N/A | | N/A | | N/A | | 1 |
| | 1 |
| | — |
| | 20 |
|
| Spear Education, LLC | LLC units | | N/A | | N/A | | N/A | | — |
| | 86 |
| | — |
| | 94 |
|
| Surgical Information Systems, LLC | Common stock | | N/A | | N/A | | N/A | | 4 |
| | 414 |
| | 0.1 |
| | 681 |
|
| Young Innovations, Inc. | LLC units | | N/A | | N/A | | N/A | | — |
| | 236 |
| | — |
| | 346 |
|
| | | | | | | | | | | | 8,634 |
| | 1.6 |
| | 13,246 |
|
Home and Office Furnishings,
Housewares, and Durable Consumer | | | | | | | | | |
| | |
| | |
| | |
|
| Top Knobs USA, Inc. | Common stock | | N/A | | N/A | | N/A | | 3 |
| | 27 |
| | — |
| | 231 |
|
| Zenith Products Corporation | Common stock | | N/A | | N/A | | N/A | | 1 |
| | — |
| | — |
| | — |
|
| | | | | | | | | | | | 27 |
| | — |
| | 231 |
|
| Insurance | | | | | | | | | |
| | |
| | |
| | |
|
| Captive Resources Midco, LLC | LLC units | | N/A | | N/A | | N/A | | 1 |
| | — |
| | — |
| | 146 |
|
| Internet Pipeline, Inc. | Common stock | | N/A | | N/A | | N/A | | 43 |
| | 1 |
| | — |
| | 1 |
|
| Internet Pipeline, Inc. | Preferred stock | | N/A | | N/A | | N/A | | — |
| | 98 |
| | — |
| | 98 |
|
| | | | | | | | | | | | 99 |
| | — |
| | 245 |
|
| Investment Funds and Vehicles | | | | | | | | | |
| | |
| | |
| | |
|
Senior Loan Fund LLC(7)(8) | LLC interest | | N/A | | N/A | | N/A | | 23,222 |
| | 23,222 |
| | 2.8 |
| | 22,373 |
|
| Leisure, Amusement, Motion Pictures and Entertainment | | | | | | | | | |
| | |
| | |
| | |
|
| Competitor Group, Inc. | LLC interest | | N/A | | N/A | | N/A | | 1 |
| | 714 |
| | — |
| | 22 |
|
| LMP TR Holdings, LLC | LLC units | | N/A | | N/A | | N/A | | 712 |
| | 712 |
| | — |
| | 22 |
|
| Starplex Operating, L.L.C. | Common stock | | N/A | | N/A | | N/A | | 1 |
| | 183 |
| | 0.1 |
| | 409 |
|
| Titan Fitness, LLC | LLC units | | N/A | | N/A | | N/A | | 6 |
| | 583 |
| | 0.1 |
| | 827 |
|
| | | | | | | | | | | | 2,192 |
| | 0.2 |
| | 1,280 |
|
| Personal and Non-Durable Consumer Products | | | | | | | | | |
| | |
| | |
| | |
|
| C.B. Fleet Company, Incorporated | LLC units | | N/A | | N/A | | N/A | | 2 |
| | 174 |
| | — |
| | 268 |
|
| The Hygenic Corporation | LP interest | | N/A | | N/A | | N/A | | 1 |
| | 61 |
| | — |
| | 87 |
|
| Massage Envy, LLC | LLC interest | | N/A | | N/A | | N/A | | 749 |
| | 749 |
| | 0.2 |
| | 1,058 |
|
| Team Technologies Acquisition Company | Common stock | | N/A | | N/A | | N/A | | — |
| | 114 |
| | — |
| | 351 |
|
| | | | | | | | | | | | 1,098 |
| | 0.2 |
| | 1,764 |
|
| Personal, Food and Miscellaneous Services | | | | | | | | | |
| | |
| | |
| | |
|
| R.G. Barry Corporation | Preferred stock | | N/A | | N/A | | N/A | | — |
| | 161 |
| | — |
| | 157 |
|
| Vetcor Professional Practices LLC | LLC units | | N/A | | N/A | | N/A | | 85 |
| | 85 |
| | — |
| | 85 |
|
| Vetcor Professional Practices LLC | LLC units | | N/A | | N/A | | N/A | | 766 |
| | 766 |
| | 0.1 |
| | 766 |
|
| | | | | | | | | | | | 1,012 |
| | 0.1 |
| | 1,008 |
|
| Printing and Publishing | | | | | | | | | |
| | |
| | |
| | |
|
| Market Track, LLC | Preferred stock | | N/A | | N/A | | N/A | | — |
| | 145 |
| | — |
| | 195 |
|
| Market Track, LLC | Common stock | | N/A | | N/A | | N/A | | 1 |
| | 145 |
| | — |
| | 272 |
|
| | | | | | | | | | | | 290 |
| | — |
| | 467 |
|
| Retail Stores | | | | | | | | | |
| | |
| | |
| | |
|
Barcelona Restaurants, LLC(8)(11) | LP interest | | N/A | | N/A | | N/A | | 1,996 |
| | 1,996 |
| | 0.7 |
| | 5,523 |
|
| Benihana, Inc. | LLC units | | N/A | | N/A | | N/A | | 43 |
| | 699 |
| | 0.1 |
| | 595 |
|
| Cycle Gear, Inc. | LLC units | | N/A | | N/A | | N/A | | 15 |
| | 150 |
| | — |
| | 153 |
|
| DentMall MSO, LLC | LLC units | | N/A | | N/A | | N/A | | 2 |
| | — |
| | — |
| | — |
|
See Notes to Consolidated Financial Statements.
Golub Capital BDC, Inc. and Subsidiaries
Consolidated Schedule of Investments – (continued)
September 30, 2015
(In thousands)
|
| | | | | | | | | | | | | | | | | | | | | |
| | Investment Type | | Spread Above Index(1) | | Interest Rate(2) | | Maturity Date | | Shares/ Contracts | | Cost | | Percentage of Net Assets | | Fair Value |
| Retail Stores – (continued) | | | | | | | | | |
| | |
| | |
| | |
|
| DentMall MSO, LLC | LLC units | | N/A | | N/A | | N/A | | 2 |
| | $ | 97 |
| | — | % | | $ | 106 |
|
| Elite Sportswear, L.P. | LLC interest | | N/A | | N/A | | N/A | | — |
| | 73 |
| | — |
| | 71 |
|
| Express Oil Change, LLC | LLC interest | | N/A | | N/A | | N/A | | 81 |
| | 81 |
| | — |
| | 153 |
|
| Marshall Retail Group LLC, The | LLC units | | N/A | | N/A | | N/A | | 15 |
| | 154 |
| | — |
| | 59 |
|
| Paper Source, Inc. | Common stock | | N/A | | N/A | | N/A | | 8 |
| | 1,387 |
| | 0.2 |
| | 1,455 |
|
| RCP PetPeople LP | LP interest | | N/A | | N/A | | N/A | | 889 |
| | 889 |
| | 0.2 |
| | 1,331 |
|
| RCPSI Corporation | LLC interest | | N/A | | N/A | | N/A | | 455 |
| | 455 |
| | 0.1 |
| | 455 |
|
| Rubio's Restaurants, Inc. | Preferred stock A | | N/A | | N/A | | N/A | | 2 |
| | 945 |
| | 0.3 |
| | 2,711 |
|
| Sneaker Villa, Inc. | LLC interest | | N/A | | N/A | | N/A | | 4 |
| | 411 |
| | 0.1 |
| | 583 |
|
| SSH Corporation | Common stock | | N/A | | N/A | | N/A | | — |
| | 40 |
| | — |
| | 146 |
|
| | | | | | | | | | | | 7,377 |
| | 1.7 |
| | 13,341 |
|
| Textiles and Leather | | | | | | | | | |
| | |
| | |
| | |
|
| Southern Tide, LLC | LLC interest | | N/A | | N/A | | N/A | | 2 |
| | 191 |
| | — |
| | 222 |
|
| Utilities | | | | | | | | | |
| | |
| | |
| | |
|
| PowerPlan Holdings, Inc. | Common stock | | N/A | | N/A | | N/A | | — |
| | 303 |
| | — |
| | 319 |
|
| PowerPlan Holdings, Inc. | Common stock | | N/A | | N/A | | N/A | | 151 |
| | 3 |
| | — |
| | 92 |
|
| | | | | | | | | | | | 306 |
| | — |
| | 411 |
|
| Total equity investments United States | | | | | | | | | | | $ | 64,737 |
| | 9.8 | % | | $ | 80,181 |
|
| Total United States | | | | | | | | | | | $ | 1,517,314 |
| | 188.6 | % | | $ | 1,529,784 |
|
| Total Investments | | | | | | | | | | | $ | 1,517,314 |
| | 188.6 | % | | $ | 1,529,784 |
|
| | | | | | | | | | | | | | | | |
| Cash, Restricted Cash and Cash Equivalents | | | | | | | | | |
| | |
| | |
| | |
|
| Cash and Restricted Cash | | | | | | | | | |
| | $ | 20,137 |
| | 2.5 | % | | $ | 20,137 |
|
| BlackRock Liquidity Funds T-Fund Institutional Shares (CUSIP 09248U718) | | | | | |
| | 13,367 |
| | 1.6 |
| | 13,367 |
|
| BNY Mellon US Dollar Liquidity Fund Institutional Shares (CUSIP G1206E235) | | |
| | 18,430 |
| | 2.3 |
| | 18,430 |
|
| US Bank Money Market Account (CUSIP 9AMMF05B2) | | | | | | | | 45,550 |
| | 5.6 |
| | 45,550 |
|
| Total Cash, Restricted Cash and Cash Equivalents | | | | | | | | $ | 97,484 |
| | 12.0 | % | | $ | 97,484 |
|
| Total Investments and Cash, Restricted Cash and Cash Equivalents | | | | | | | | $ | 1,614,798 |
| | 200.6 | % | | $ | 1,627,268 |
|
|
| | |
* | | Denotes that all or a portion of the loan secures the notes offered in the 2010 Debt Securitization (as defined in Note 7). |
^ | | Denotes that all or a portion of the loan secures the notes offered in the 2014 Debt Securitization (as defined in Note 7). |
| |
(1)
| The majority of the investments bear interest at a rate that may be determined by reference to LIBOR or Prime and which reset daily, quarterly or semiannually. For each, the Company has provided the spread over LIBOR or Prime and the weighted average current interest rate in effect at September 30, 2015. Certain investments are subject to a LIBOR or Prime interest rate floor. For fixed rate loans, a spread above a reference rate is not applicable. |
| |
(2)
| For portfolio companies with multiple interest rate contracts, the interest rate shown is a weighted average current interest rate in effect at September 30, 2015. |
| |
(3)
| The negative fair value is the result of the capitalized discount on the loan or the unfunded commitment being valued below par. The negative cost is the result of the capitalized discount being greater than the principal amount outstanding on the loan. |
| |
(4)
| The sale of a portion of this loan does not qualify for sale accounting under ASC Topic 860 — Transfers and Servicing, and therefore, the entire one stop loan asset remains in the Consolidated Schedule of Investments. (See Note 7 in the accompanying notes to the consolidated financial statements.) |
| |
(5)
| The entire commitment was unfunded at September 30, 2015. As such, no interest is being earned on this investment. |
See Notes to Consolidated Financial Statements.
Golub Capital BDC, Inc. and Subsidiaries
Consolidated Schedule of Investments – (continued)
September 30, 2015
(In thousands)
| |
(6)
| Loan was on non-accrual status as of September 30, 2015, meaning that the Company has ceased recognizing interest income on the loan. |
| |
(7)
| As defined in the Investment Company Act of 1940, as amended (the “1940 Act”), the Company is deemed to be both an “Affiliated Person” of and “Control” this portfolio company as the Company owns more than 25% of the portfolio company's outstanding voting securities or has the power to exercise control over management or policies of such portfolio company (including through a management agreement). See Note 5 in the accompanying notes to the consolidated financial statements for transactions during the year ended September 30, 2015 in which the issuer was both an Affiliated Person and a portfolio company that the Company is deemed to Control. |
| |
(8)
| The investment is treated as a non-qualifying asset under Section 55(a) of the 1940 Act. Under the 1940 Act, the Company may not acquire any non-qualifying asset unless, at the time the acquisition is made, qualifying assets represent at least 70% of the Company's total assets. |
| |
(9)
| Non-income producing securities. |
| |
(10)
| Ownership of certain equity investments may occur through a holding company or partnership. |
| |
(11)
| As defined in the 1940 Act, the Company is deemed to be an “Affiliated Person” of the portfolio company as the Company along with affiliated entities owns five percent or more of the portfolio company's voting securities. See Note 5 in the accompanying notes to the financial statements for transactions during the year ended September 30, 2015 in which the issuer was an Affiliated Person (but not a portfolio company that the Company is deemed to control). |
See Notes to Consolidated Financial Statements.
Golub Capital BDC, Inc. and Subsidiaries
Notes to Consolidated Financial Statements
(In thousands, except shares and per share data)
Note 1. Organization
Golub Capital BDC, Inc. (“GBDC” and, collectively with its subsidiaries, the “Company”) is an externally managed, closed-end, non-diversified management investment company. GBDC has elected to be regulated as a business development company (“BDC”) under the Investment Company Act of 1940, as amended (the “1940 Act”). In addition, for U.S. federal income tax purposes, GBDC has elected to be treated as a regulated investment company (“RIC”) under Subchapter M of the Internal Revenue Code of 1986, as amended (the “Code”).
The Company’s investment strategy is to invest primarily in senior secured and one stop (a loan that combines characteristics of traditional first lien senior secured loans and second lien or subordinated loans and that are often referred to by other middle-market lenders as unitranche loans) and other senior secured loans of U.S. middle-market companies. The Company may also selectively invest in second lien and subordinated (a loan that ranks senior only to a borrower’s equity securities and ranks junior to all of such borrower’s other indebtedness in priority of payment) loans of, and warrants and minority equity securities in, U.S. middle-market companies. The Company has entered into an investment advisory agreement (the “Investment Advisory Agreement”) with GC Advisors LLC (the “Investment Adviser”), under which the Investment Adviser manages the day-to-day operations of, and provides investment advisory services to, the Company. Under an administration agreement (the “Administration Agreement”) the Company is provided with certain services by an administrator (the “Administrator”), which is currently Golub Capital LLC.
Note 2. Significant Accounting Policies and Recent Accounting Updates
Basis of presentation: The Company is an investment company as defined in the accounting and reporting guidance under Accounting Standards Codification (“ASC”) Topic 946 — Financial Services — Investment Companies (“ASC Topic 946”).
The accompanying consolidated financial statements of the Company and related financial information have been prepared in accordance with generally accepted accounting principles in the United States of America (“GAAP”) for financial information and pursuant to the requirements for reporting on Form 10-K and ArticlesArticle 6 or 10 of Regulation S-X. In the opinion of management, the consolidated financial statements reflect all adjustments and reclassifications consisting solely of normal accruals that are necessary for the fair presentation of financial results as of and for the periods presented. All intercompany balances and transactions have been eliminated. Certain prior period amounts have been reclassified to conform to the current period presentation.
Fair value of financial instruments: The Company applies fair value to all of its financial instruments in accordance with ASC Topic 820 — Fair Value Measurement (“ASC Topic 820”). ASC Topic 820 defines fair value, establishes a framework used to measure fair value and requires disclosures for fair value measurements. In accordance with ASC Topic 820, the Company has categorized its financial instruments carried at fair value, based on the priority of the valuation technique, into a three-level fair value hierarchy. Fair value is a market-based measure considered from the perspective of the market participant who holds the financial instrument rather than an entity-specific measure. Therefore, when market assumptions are not readily available, the Company’s own assumptions are set to reflect those that management believes market participants would use in pricing the financial instrument at the measurement date.
The availability of observable inputs can vary depending on the financial instrument and is affected by a wide variety of factors, including, for example, the type of product, whether the product is new, whether the product is traded on an active exchange or in the secondary market and the current market conditions. To the extent that the valuation is based on models or inputs that are less observable or unobservable in the market, the determination of fair value requires more judgment. Accordingly, the degree of judgment exercised by the Company in determining fair value is greatest for financial instruments classified as Level 3.
Golub Capital BDC, Inc. and Subsidiaries
Notes to Consolidated Financial Statements
(In thousands, except shares and per share data)
Any changes to the valuation methodology are reviewed by management and the Company’s board of directors (the “Board”) to confirm that the changes are appropriate. As markets change, new products develop and the pricing for products becomes more or less transparent, the Company will continue to refine its valuation methodologies. See further description of fair value methodology in Note 6.5.
Use of estimates: The preparation of the consolidated financial statements in conformity with GAAP requires management to make estimates and assumptions that affect the reported amounts of assets and liabilities and disclosure of
Golub Capital BDC, Inc. and Subsidiaries
Notes to Consolidated Financial Statements
(In thousands, except shares and per share data)
Note 2. Significant Accounting Policies and Recent Accounting Updates - (continued)
contingent assets and liabilities at the date of the consolidated financial statements and the reported amounts of revenues and expenses during the reporting period. Actual results could differ from those estimates.
Consolidation: As provided under Regulation S-X and ASC Topic 946, the Company will generally not consolidate its investment in a company other than an investment company subsidiary or a controlled operating company whose business consists of providing services to the Company. Accordingly, the Company consolidated the results of the Company’s wholly-owned subsidiaries Golub Capital BDC 2010-1 Holdings LLC (“Holdings”), Golub Capital BDC 2010-1 LLC (“2010 Issuer”), Golub Capital BDC CLO 2014 LLC (“2014 Issuer”), Golub Capital BDC Funding LLC (“Funding”), Golub Capital BDC Holdings, LLC (“BDC Holdings”), GC SBIC IV, L.P. (“SBIC IV”), GC SBIC V, L.P. (“SBIC V”) and Golub Capital BDC Revolver Funding, LLCGC SBIC VI, L.P. (“Revolver Funding”SBIC VI”) in its consolidated financial statements.. The Company does not consolidate its non-controlling interest in Senior Loan Fund LLC (“SLF”).SLF. See further description of the Company’s investment in SLF in Note 4.
Assets related to transactions that do not meet ASC Topic 860 - Transfers and Servicing (“ASC Topic 860”) requirements for accounting sale treatment are reflected in the Company’s consolidated statementsConsolidated Statements of financial conditionFinancial Condition as investments. Those assets are owned by special purpose entities, including 2010 Issuer, 2014 Issuer Funding and Revolver Funding that are consolidated in the Company’s consolidated financial statements. The creditors of the special purpose entities have received security interests in such assets and such assets are not intended to be available to the creditors of GBDC (or any affiliate of GBDC).
Cash and cash equivalents: Cash and cash equivalents are highly liquid investments with an original maturity of three months or less at the date of acquisition. The Company deposits its cash in financial institutions and, at times, such balances may be in excess of the Federal Deposit Insurance Corporation insurance limits.
Restricted cash and cash equivalents: Restricted cash and cash equivalents include amounts that are collected and are held by trustees who have been appointed as custodians of the assets securing certain of the Company’s financing transactions. Restricted cash isand cash equivalents are held by the trustees for payment of interest expense and principal on the outstanding borrowings or reinvestment into new assets. In addition, restricted cash and cash equivalents include amounts held within the Company’s small business investment company (“SBIC”) subsidiaries. The amounts held within the SBICs are generally restricted to the originations of new loans fromby the SBICs and the payment of U.S. Small Business Administration (“SBA”) debentures and related interest expense.
Foreign currency translation: The Company’s books and records are maintained in U.S. dollars. Any foreign currency amounts are translated into U.S. dollars on the following basis:
| |
| (1) | cash and cash equivalents, fair value of investments, interest receivable, and other assets—at the spot exchange rate on the last business day of the period; and |
| |
| (2) | purchases and sales of investments, income and expenses—at the exchange rates prevailing on the respective dates of such transactions. |
Although net assets and fair values are presented based on the applicable foreign exchange rates described above, the Company does not isolate that portion of the results of operations resulting from changes in foreign exchange rates on investments from the fluctuations arising from changes in fair values of investments held. Such fluctuations are included with the net realized and unrealized gain or loss from investments. Fluctuations arising from the translation of assets other than investments are included with the net change in unrealized gains (losses) on foreign currency translation on the Consolidated Statements of Operations.
Golub Capital BDC, Inc. and Subsidiaries
Notes to Consolidated Financial Statements
(In thousands, except shares and per share data)
Foreign security and currency transactions may involve certain considerations and risks not typically associated with investing in U.S. companies. These risks include, but are not limited to, currency fluctuations and revaluations and future adverse political, social and economic developments, which could cause investments in foreign markets to be less liquid and prices more volatile than those of comparable U.S. companies or U.S. government securities.
Revenue recognition:
Investments and related investment income: Interest income is accrued based upon the outstanding principal amount and contractual interest terms of debt investments.
Loan origination fees, original issue discount and market discount or premium are capitalized, and the Company accretes or amortizes such amounts over the life of the loan as interest income. For the years ended September 30, 2016, 20152018, 2017 and 2014,2016, interest income included $8,662, $9,002$9,660, $9,498 and $9,158,$8,662, respectively, of accretion of discounts. For the years ended September 30, 2016, 20152018, 2017 and 2014,2016, the Company received loan origination fees of $8,327, $8,593 and $11,686, $12,922 and $10,699, respectively.
For investments with contractual payment-in-kind (“PIK”)PIK interest, which represents contractual interest accrued and added to the principal balance that generally becomes due at maturity, the Company will not accrue PIK interest if the portfolio company valuation indicates that the PIK interest is not collectible. For the years ended September 30, 2016, 20152018, 2017 and 2014,2016, the Company recorded PIK income of $1,171, $1,260$941, $2,401 and $1,813,$1,171, respectively, and received PIK payments in cash of $2, $481 and $9, $465 and $2,373, respectively.
In addition, the Company may generate revenue in the form of amendment, structuring or due diligence fees, fees for providing managerial assistance, consulting fees and prepayment premiums on loans. The Company records these fees as fee income when received.earned. All other income is recorded into income when earned. For the years ended September 30, 2016, 20152018, 2017 and 2014,2016, fee income included $2,082, $1,441 and $1,066, $2,035 and $3,137respectively, of prepayment premiums, respectively.which fees are non-recurring.
For the years ended September 30, 2016, 20152018, 2017 and 2014,2016, the Company received interest and fee income in cash, which excludes capitalized loan origination fees, in the amounts of $113,172, $108,677$132,456, $120,429 and $96,612,$113,172, respectively.
Golub Capital BDC, Inc. and Subsidiaries
Notes to Consolidated Financial Statements
(In thousands, except shares and per share data)
Note 2. Significant Accounting Policies and Recent Accounting Updates - (continued)
Dividend income on preferred equity securities is recorded as dividend income on an accrual basis to the extent that such amounts are payable by the portfolio company and are expected to be collected. Dividend income on common equity securities is recorded on the record date for private portfolio companies or on the ex-dividend date for publicly traded portfolio companies. Each distribution received from limited liability company (“LLC”) and limited partnership (“LP”) investments is evaluated to determine if the distribution should be recorded as dividend income or a return of capital. Generally, the Company will not record distributions from equity investments in LLCs and LPs as dividend income unless there are sufficient accumulated tax-basis earnings and profits in the LLC or LP prior to the distribution. Distributions that are classified as a return of capital are recorded as a reduction in the cost basis of the investment.
For the years ended September 30, 2018, 2017 and 2016, 2015 and 2014,excluding the Company's investment in LLC equity interests in SLF, the Company recorded dividend income of $4,638, $1,562$624, $629 and $1,766,$539, respectively, and return of capital distributions of $5,196, $128$373, $999 and $4,973,$2,492, respectively. For the years ended September 30, 2018, 2017 and 2016, the Company recorded dividend income of $8,099, $4,929 and $4,099, respectively, and return of capital distributions of $34,213, $25,112 and $2,704, respectively, from the Company's investment in LLC equity interests in SLF.
Investment transactions are accounted for on a trade-date basis. Realized gains or losses on investments are measured by the difference between the net proceeds from the disposition and the amortized cost basis of investment, without regard to unrealized gains or losses previously recognized. The Company reports current period changes in fair value of investments that are measured at fair value as a component of the net change in unrealized
Golub Capital BDC, Inc. and Subsidiaries
Notes to Consolidated Financial Statements
(In thousands, except shares and per share data)
appreciation (depreciation) on investments and foreign currency translation in the consolidated statementsConsolidated Statements of operations.Operations.
Non-accrual loans: A loan may be left on accrual status during the period the Company is pursuing repayment of the loan. Management reviews all loans that become 90 days or more past due on principal and interest, or when there is reasonable doubt that principal or interest will be collected, for possible placement on non-accrual status. When a loan is placed on non-accrual status, unpaid interest credited to income is reversed. Additionally, any original issue discount and market discount are no longer accreted to interest income as of the date the loan is placed on non-accrual status. Interest payments received on non-accrual loans may be recognized as income or applied to principal depending upon management’s judgment. Non-accrual loans are restored to accrual status when past due principal and interest is paid and, in management’s judgment, payments are likely to remain current. The total fair value of non-accrual loans was $1,326$5,625 and $6,487$2,955 as of September 30, 20162018 and 2015,2017, respectively.
Partial loan sales: The Company follows the guidance in ASC Topic 860 when accounting for loan participations and other partial loan sales. Such guidance requires a participation or other partial loan sale to meet the definition of a “participating interest”, as defined in the guidance, in order for sale treatment to be allowed. Participations or other partial loan sales which do not meet the definition of a participating interest remain on the Company’s consolidated statementsConsolidated Statements of financial conditionFinancial Condition and the proceeds are recorded as a secured borrowing until the definition is met. Secured borrowings are carried at fair value to correspond with the related investments, which are carried at fair value. See Note 76 for additional information.
Income taxes: The Company has elected to be treated as a RIC under Subchapter M of the Code and operates in a manner so as to qualify for the tax treatment applicable to RICs. In order to qualify and be subject to tax as a RIC, among other things, the Company is required to meet certain source of income and asset diversification requirements and timely distribute dividends for U.S. federal income tax purposes to its stockholders of an amount generally at least equal to 90% of investment company taxable income, as defined by the Code and determined without regard to any deduction for dividends paid, for each tax year. The Company has made, and intends to continue to make, the requisite distributions to its stockholders, which will generally relieve the Company from U.S. federal income taxes with respect to all income distributed to its stockholders.
Depending on the level of taxable income earned in a tax year, the Company may choose to retain taxable income in excess of current year dividend distributions and would distribute such taxable income in the next tax year. The Company may then be required to payincur a 4% excise tax on such income..income. To the extent that the Company determines that itsit's estimated current year annual taxable income, determined on a calendar year basis, could exceed estimated current calendar year dividend distributions, the Company accrues excise tax, if any, on estimated excess taxable income as taxable income is earned. For the year ended September 30, 2016, $333 was recorded for U.S. federal excise tax. For each of the years ended September 30, 20152018, 2017 and 2014, no amount2016, $0, $17 and $333, respectively, was recordedincurred for U.S. federal excise tax.
Golub Capital BDC, Inc. and Subsidiaries
Notes to Consolidated Financial Statements
(In thousands, except shares and per share data)
Note 2. Significant Accounting Policies and Recent Accounting Updates - (continued)
The Company accounts for income taxes in conformity with ASC Topic 740 — Income Taxes (“ASC Topic 740”). ASC Topic 740 provides guidelines for how uncertain tax positions should be recognized, measured, presented and disclosed in financial statements. ASC Topic 740 requires the evaluation of tax positions taken in the course of preparing the Company’s tax returns to determine whether the tax positions are “more-likely-than-not” to be sustained by the applicable tax authority. Tax benefits of positions not deemed to meet the more-likely-than-not threshold would be recorded as a tax expense or tax benefit in the current year. It is the Company’s policy to recognize accrued interest and penalties related to uncertain tax benefits in income tax expense. There were no material unrecognized tax benefits or unrecognized tax liabilities related to uncertain income tax positions through September 30, 2016.2018. The 2013Company's tax returns for the 2015 through 20152017 tax years remain subject to examination by U.S. federal and most state tax authorities.
Dividends and distributions: Dividends and distributions to common stockholders are recorded on the ex-dividend date. The amount to be paid out as a dividend or distribution is determined by the Board each quarter and is
Golub Capital BDC, Inc. and Subsidiaries
Notes to Consolidated Financial Statements
(In thousands, except shares and per share data)
generally based upon the earnings estimated by management. Net realized capital gains, if any, are distributed at least annually, although the Company may decide to retain such capital gains for investment.
The Company has adopted a dividend reinvestment plan (“DRIP”) that provides for reinvestment of any distributions the Company declares in cash on behalf of its stockholders, unless a stockholder elects to receive cash. As a result, if the Board authorizes and the Company declares a cash distribution, then stockholders who participate in the DRIP will have their cash distribution reinvested in additional shares of the Company’s common stock, rather than receiving the cash distribution. The Company may use newly issued shares under the guidelines of the DRIP (if the Company’s shares are trading at a premium to net asset value), or the Company may purchase shares in the open market in connection with the obligations under the plan. In particular, if the Company’s shares are trading at a significant discount to net asset value (“NAV”) and the Company is otherwise permitted under applicable law to purchase such shares, the Company intends to purchase shares in the open market in connection with any obligations under the DRIP.
In the event the market price per share of the Company’s common stock on the date of a distribution exceeds the most recently computed NAV per share of the common stock, the Company will issue shares of common stock to participants in the DRIP at the greater of the most recently computed NAV per share of common stock or 95% of the current market price per share of common stock (or such lesser discount to the current market price per share that still exceeds the most recently computed NAV per share of common stock).
Share repurchase plan: The Company has a share repurchase program (the “Program”) which allows the Company to repurchase up to $50,000$75,000 of the Company’s outstanding common stock on the open market at prices below the Company’s NAV as reported in its most recently published consolidated financial statements. The Board most recently reapproved the Program in August 20162018 and the Program may be implemented at the discretion of management. The shares may be purchased from time to time at prevailing market prices, through open market transactions, including block transactions. The Company did not make any repurchases of its common stock during the years ended September 30, 20162018, 2017 and 2015.2016.
Deferred debt issuance costs: Deferred debt issuance costs represent fees and other direct incremental costs incurred in connection with the Company’s borrowings. As of September 30, 20162018 and 2015,2017, the Company had deferred debt issuance costs of $5,627$2,934 and $7,624$4,273, respectively. These amounts are amortized and included in interest expense in the consolidated statementsConsolidated Statements of operationsOperations over the estimated average life of the borrowings. Amortization expense for the years ended September 30, 2018, 2017 and 2016 2015was $3,315, $3,289 and 2014 was $4,184, $4,506 and $3,030, respectively.
Deferred offering costs: Deferred offering costs consist of fees paid in relation to legal, accounting, regulatory and printing work completed in preparation of equity offerings. Deferred offering costs are charged against the proceeds from equity offerings when received. As ofFor the year ended September 30, 20162018, there were no new equity offerings and 2015,as such, there was no change in deferred offering costs, which are included in other assets on the consolidated statementsConsolidated Statements of financial condition, were $145 and $174, respectively.Financial Condition.
Accounting for derivative instruments: The Company does not utilize hedge accounting and marks its derivatives, if any, to market through a net change in unrealized appreciation (depreciation) on derivative instruments in the consolidated statementsConsolidated Statements of operations.Operations.
Golub Capital BDC, Inc. and Subsidiaries
Notes to Consolidated Financial Statements
(In thousands, except shares and per share data)
Note 2. Significant Accounting Policies and Recent Accounting Updates - (continued)
Recent accounting pronouncements: In April 2015,November 2016, the Financial Accounting Standards Board (“FASB”("FASB") issued Accounting Standards Update (“ASU”("ASU") 2015-03,2016-18, Interest - ImputationStatement of Interest (Subtopic 835-30)Cash Flows (Topic 230): SimplifyingRestricted Cash Restricted Cash, a consensus of the Presentation of Debt Issuance CostsFASB Emerging Issues Task Force, which requires that debt issuance costs related to a recognized debt liability be presentedstatement of cash flows explain the change during the period in the balance sheettotal of cash, cash equivalents, and amounts generally described as a direct deduction from the carrying amount of that debt liability, consistent with debt discounts.restricted cash or restricted cash equivalents. This guidance is effective for annual reporting periods, and the interim periods within those periods, beginning after December 15, 2015 and early adoption is permitted.2017. The Company has elected to adoptadopted the ASU, which did not have a material impact on the Company’s consolidated financial statements other than corresponding reductions to total assets and total liabilities on the consolidated statements of financial condition.statements. Prior to adoption, the Company recorded deferred debt issuance costs
Golub Capital BDC, Inc. and Subsidiaries
Notes to Consolidated Financial Statements
(In thousands, except shares and per share data)
presented the change in restricted cash and cash equivalents separately as deferred financing costs as an asset on the consolidated statements of financial condition.a cash flow from investing activity. Upon adoption, the Company reclassified these costsincluded the restricted cash and cash equivalents in each of the balances of the cash, cash equivalents and restricted cash and cash equivalents at the beginning of and end of periods and included the change in restricted cash and cash equivalents as unamortized debt issuance costs that reduce debtpart of the net change in cash, cash equivalents and restricted cash and cash equivalents in the liabilitiesConsolidated Statements of Cash Flows and retrospectively restated the year ended September 30, 2016.
In August 2018, the FASB issued ASU 2018-13, Fair Value Measurement (Topic 820): Disclosure Framework - Changes to the Disclosure Requirements for Fair Value Measurement, which modifies disclosure requirements pertaining to fair value measurement of Level 3 securities for public companies. Under the new standard, reporting entities can remove the disclosures no longer required and amend the disclosures immediately with retrospective application. The effective date for the additional disclosures for all public and nonpublic companies is for fiscal years, and interim periods within those years, beginning after December 15, 2019. An entity is permitted to early adopt any removed or modified disclosures immediately and delay adoption of the additional disclosures until their effective date. The Company has elected to early adopt ASU 2018-13 in the current annual period. No significant changes were made to the Company's fair value disclosures in the Notes to the Consolidated Financial Statements in order to comply with ASU 2018-13.
Securities Exchange Commission ("SEC") Disclosure Update and Simplification: In August 2018, the SEC adopted the final rule under SEC Release No. 33-10532, Disclosure Update and Simplification (the "SEC Release"), amending certain disclosure requirements that were redundant, duplicative, overlapping, outdated or superseded. The amendments are intended to facilitate the disclosure of information to investors and simplify compliance. The final rule is effective for all filings on or after November 5, 2018, therefore, the Company adopted the SEC Release in the current annual period. The SEC Release requires presentation changes to the Company's Consolidated Statements of Financial Condition and Consolidated Statements of Changes in Net Assets. Prior to adoption, the Company presented, in accordance with previous SEC rules, distributable earnings on the consolidated statementsConsolidated Statements of financial conditionFinancial Condition, as three components: 1) undistributed net investment income; 2) net unrealized appreciation (depreciation) on investments and secured borrowings; and 3) net realized gain (loss) on investments and presented distributions from distributable earnings on the Consolidated Statements of Changes in Net Assets as two components: 1) distributions from net investment income; and 2) distributions from realized gain. In accordance with the SEC Release, distributable earnings and distributions from distributable earnings are shown in total on the Consolidated Statements of Financial Condition and Consolidated Statements of Changes in Net Assets, respectively. The changes in presentation have been retrospectively reclassifiedapplied to the $7,624Consolidated Statement of deferred debt issuance costs that were previously presented as deferred financing costs as an assetFinancial Condition as of September 30, 2015.2017 and to the Consolidated Statements of Changes in Net Assets for the years ended September 30, 2017 and 2016. The following tables provide reconciliations of retrospective changes applied to prior periods.
Consolidated Statement of Financial Condition - The table below provides a reconciliation for previously disclosed components of distributable earnings on the Consolidated Statement of Financial Condition as of September 30, 2017 to total distributable earnings as of September 30, 2017 as disclosed in the current filing. |
| | | |
| | September 30, 2017 |
| Undistributed net investment income | $ | 1,954 |
|
| Net unrealized appreciation (depreciation) on investments and secured borrowings | 16,444 |
|
| Net realized gain (loss) on investments | 181 |
|
| Distributable earnings | $ | 18,579 |
|
Golub Capital BDC, Inc. and Subsidiaries
Notes to Consolidated Financial Statements
(In thousands, except shares and per share data)
Consolidated Statements of Changes in Net Assets - Below is a reconciliation representing previously disclosed distributions from net investment income and realized gain for the years ended September 30, 2017 and 2016 to distributions from distributable earnings as disclosed in the current filing.
|
| | | | | | | |
| | Years ended September 30, |
| | 2017 | | 2016 |
| Distributions to stockholders: | | | |
| Distributions from net investment income | $ | (85,304 | ) | | $ | (54,461 | ) |
| Distributions from realized gain | (1,139 | ) | | (12,418 | ) |
| Distributions from distributable earnings | $ | (86,443 | ) | | $ | (66,879 | ) |
The following tables provide reconciliations for the years ended September 30, 2017 and 2016 for the components of distributable earnings as previously disclosed to total distributable earnings as disclosed in this filing. As required by ASC 946-205-45-3, the effects of net investment income - after excise tax, net realized gain (loss) on investments and foreign currency translation, and net change in unrealized gain (loss) on investments, secured borrowings, and foreign currency translation on net assets continue to be disclosed by the Company.
|
| | | | | | | | | | | | |
| | Year ended September 30, 2017 |
| | Undistributed Net Investment Income | Net Unrealized Appreciation (Depreciation) on Investments and Secured Borrowings | Net Realized Gain (Loss) on Investments | Distributable Earnings |
| Net investment income - after excise tax | $ | 69,546 |
| $ | — |
| $ | — |
| $ | 69,546 |
|
| Net realized gain (loss) on investments and foreign currency transactions | — |
| — |
| 9,402 |
| 9,402 |
|
| Net change in unrealized gain (loss) on investments, secured borrowings, and foreign currency translation | — |
| 3,340 |
| | 3,340 |
|
| Net increase in net assets from operations | $ | 69,546 |
| $ | 3,340 |
| $ | 9,402 |
| $ | 82,288 |
|
|
| | | | | | | | | | | | |
| | Year ended September 30, 2016 |
| | Undistributed Net Investment Income | Net Unrealized Appreciation (Depreciation) on Investments and Secured Borrowings | Net Realized Gain (Loss) on Investments | Distributable earnings |
| Net investment income - after excise tax | $ | 64,980 |
| $ | — |
| $ | — |
| $ | 64,980 |
|
| Net realized gain (loss) on investments and foreign currency transactions | — |
| — |
| 6,254 |
| 6,254 |
|
| Net change in unrealized gain (loss) on investments, secured borrowings, and foreign currency translation | — |
| (2,030 | ) | | (2,030 | ) |
| Net increase in net assets from operations | $ | 64,980 |
| $ | (2,030 | ) | $ | 6,254 |
| $ | 69,204 |
|
Note 3. Related Party Transactions
Investment Advisory Agreement: Under the Investment Advisory Agreement, the Investment Adviser manages the day-to-day operations of, and provides investment advisory services to, GBDC. The Board most recently reapproved the Investment Advisory Agreement in May 2016.2018. The Investment Adviser is a registered
Golub Capital BDC, Inc. and Subsidiaries
Notes to Consolidated Financial Statements
(In thousands, except shares and per share data)
investment adviser with the Securities and Exchange Commission (the “SEC”).SEC. The Investment Adviser receives fees for providing services, consisting of two components, a base management fee and an Incentive Fee (as defined below).
The base management fee is calculated at an annual rate equal to 1.375% of average adjusted gross assets at the end of the two most recently completed calendar quarters (including assets purchased with borrowed funds and securitization-related assets, leverage, unrealized depreciation or appreciation on derivative instruments and cash collateral on deposit with custodian but adjusted to exclude cash and cash equivalents so that investors do not pay the base management fee on such assets) and is payable quarterly in arrears. Additionally, the Investment Adviser is voluntarily excludingexcludes any assets funded with secured borrowing proceeds from the base management fee.fee calculation. The base management fee is adjusted, based on the actual number of day’sdays elapsed relative to the total number of days in such calendar quarter, for any share issuances or repurchases during such calendar quarter. For purposes of the Investment Advisory Agreement, cash equivalents means U.S. government securities and commercial paper instruments maturing within 270 days of purchase (which is different than the GAAP definition, which defines cash equivalents as U.S. government securities and commercial paper instruments maturing within 90 days of purchase). To the extent that the Investment Adviser or any of its affiliates provides investment advisory, collateral management or other similar services to a subsidiary of the Company, the base management fee will be reduced by an amount equal to the product of (1) the total fees paid to the Investment Adviser by such subsidiary for such services and (2) the percentage of such subsidiary’s total equity, including membership interests and any class of notes not exclusively held by one or more third parties, that is owned, directly or indirectly, by the Company.
The Company has structured the calculation of the Incentive Fee to include a fee limitation such that an Incentive Fee for any quarter can only be paid to the Investment Adviser if, after such payment, the cumulative Incentive Fees paid to the Investment Adviser since April 13, 2010, the effective date of the Company’s election to become a BDC, would be less than or equal to 20.0% of the Company’s Cumulative Pre-Incentive Fee Net Income (as defined below).
The Company accomplishes this limitation by subjecting each quarterly Incentive Fee payable under the Income and Capital Gain Incentive Fee Calculation (as defined below) to a cap (the “Incentive Fee Cap”). The Incentive Fee Cap in any quarter is equal to the difference between (a) 20.0% of Cumulative Pre-Incentive Fee Net Income and (b) cumulative Incentive Fees of any kind paid to the Investment Adviser by GBDC since April 13, 2010. To the extent the Incentive Fee Cap is zero or a negative value in any quarter, no Incentive Fee would be payable in that quarter. If, for any relevant period, the Incentive Fee Cap calculation results in the Company paying less than the amount of the Incentive Fee calculated above, then the difference between the Incentive Fee and the Incentive Fee Cap will not be paid by GBDC and will not be received by the Investment Adviser as an Incentive Fee either at the end of such relevant period or at the end of any future period. “Cumulative Pre-Incentive Fee Net Income” is equal to the sum of (a) Pre-Incentive Fee Net Investment Income (as defined below) for each period since April 13, 2010 and (b) cumulative aggregate realized capital gains, cumulative aggregate realized capital losses, cumulative aggregate unrealized capital depreciation and cumulative aggregate unrealized capital appreciation since April 13, 2010.
“Pre-Incentive Fee Net Investment Income” means interest income, dividend income and any other income (including any other fees such as commitment, origination, structuring, diligence and consulting fees or other fees that the Company receives from portfolio companies but excluding fees for providing managerial assistance) accrued during the calendar quarter, minus operating expenses for the calendar quarter (including the base management fee, taxes, any expenses payable under the Investment Advisory Agreement and the Administration Agreement, any expenses of securitizations and any interest expense and dividends paid on any outstanding preferred stock, but excluding the Incentive Fee). Pre-Incentive Fee Net Investment Income includes, in the case of investments with a deferred interest feature such as market discount, debt instruments with PIK
Golub Capital BDC, Inc. and Subsidiaries
Notes to Consolidated Financial Statements
(In thousands, except shares and per share data)
Note 3. Related Party Transactions - (continued)
interest, preferred stock with PIK dividends and zero coupon securities, accrued income that the Company has not yet received in cash.
Incentive Fees are calculated and payable quarterly in arrears (or, upon termination of the Investment Advisory Agreement, as of the termination date).
Golub Capital BDC, Inc. and Subsidiaries
Notes to Consolidated Financial Statements
(In thousands, except shares and per share data)
The income and capital gains incentive fee calculation (the “Income and Capital Gain Incentive Fee Calculation”) has two parts, the income component (the “Income Incentive Fee”) and the capital gains component (the “Capital Gain Incentive Fee” and, together with the Income Incentive Fee, the “Incentive Fee”). The Income Incentive Fee is calculated quarterly in arrears based on the Company’s Pre-Incentive Fee Net Investment Income for the immediately preceding calendar quarter.
For the years ended September 30, 2016, 2015,2018, 2017 and 2014,2016, the Income Incentive Fee incurred was $11,652, $4,741 and $6,022, $7,489, and $10,032, respectively.
Pre-Incentive Fee Net Investment Income does not include any realized capital gains, realized capital losses or unrealized capital appreciation or depreciation. Because of the structure of the Income Incentive Fee, it is possible that an Incentive Fee may be calculated under this formula with respect to a period in which the Company has incurred a loss. For example, if the Company receives Pre-Incentive Fee Net Investment Income in excess of the hurdle rate (as defined below) for a calendar quarter, the Income Incentive Fee will result in a positive value and an Incentive Fee will be paid even if the Company has incurred a loss in such period due to realized and/or unrealized capital losses unless the payment of such Incentive Fee would cause the Company to pay Incentive Fees on a cumulative basis that exceed the Incentive Fee Cap. Pre-Incentive Fee Net Investment Income, expressed as a rate of return on the value of the Company’s net assets (defined as total assets less indebtedness and before taking into account any Incentive Fees payable during the period) at the end of the immediately preceding calendar quarter, is compared to a fixed “hurdle rate” of 2.0% quarterly. If market interest rates rise, the Company may be able to invest funds in debt instruments that provide for a higher return, which would increase Pre-Incentive Fee Net Investment Income and make it easier for the Investment Adviser to surpass the fixed hurdle rate and receive an Incentive Fee based on such net investment income.
The Company’s Pre-Incentive Fee Net Investment Income used to calculate this part of the Incentive Fee is also included in the amount of its total assets (excluding cash and cash equivalents but including assets purchased with borrowed funds and securitization-related assets, unrealized depreciation or appreciation on derivative instruments and cash collateral on deposit with custodian) used to calculate the 1.375% base management fee annual rate.
The Company calculates the Income Incentive Fee with respect to its Pre-Incentive Fee Net Investment Income quarterly, in arrears, as follows:
Zero in any calendar quarter in which the Pre-Incentive Fee Net Investment Income does not exceed the hurdle rate;
100% of the Company’s Pre-Incentive Fee Net Investment Income with respect to that portion of such Pre-Incentive Fee Net Investment Income, if any, that exceeds the hurdle rate but is less than 2.5% in any calendar quarter. This portion of the Company’s Pre-Incentive Fee Net Investment Income (which exceeds the hurdle rate but is less than 2.5%) is referred to as the “catch-up” provision. The catch-up is meant to provide the Investment Adviser with 20.0% of the Pre-Incentive Fee Net Investment Income as if a hurdle rate did not apply if the Company’s Pre-Incentive Fee Net Investment Income exceeds 2.5% in any calendar quarter; and
20.0% of the amount of the Company’s Pre-Incentive Fee Net Investment Income, if any, that exceeds 2.5% in any calendar quarter.
The Capital Gain Incentive Fee equals (a) 20.0% of the Company’s Capital Gain Incentive Fee Base (as defined below), if any, calculated in arrears as of the end of each calendar year (or upon termination of the Investment Advisory Agreement, as of the termination date), which commenced with the calendar year ending December 31, 2010, less (b) the aggregate amount of any previously paid Capital Gain Incentive Fees. The Company’s “Capital Gain Incentive Fee Base” equals (1) the sum of (i) realized capital gains, if any, on a cumulative positive basis from the date the Company elected to become a BDC through the end of each calendar year, (ii) all realized capital losses on a cumulative basis and (iii) all unrealized capital depreciation on a cumulative basis less (2) all unamortized
Golub Capital BDC, Inc. and Subsidiaries
Notes to Consolidated Financial Statements
(In thousands, except shares and per share data)
deferred financingdebt issuance costs, if and to the extent such costs exceed all unrealized capital appreciation on a cumulative basis.
Golub Capital BDC, Inc. and Subsidiaries
Notes to Consolidated Financial Statements
(In thousands, except shares and per share data)
Note 3. Related Party Transactions - (continued)
The cumulative aggregate realized capital losses are calculated as the sum of the amounts by which (a) the net sales price of each investment in the Company’s portfolio when sold is less than (b) the accreted or amortized cost basis of such investment.
The cumulative aggregate realized capital gains are calculated as the sum of the differences, if positive, between (a) the net sales price of each investment in the Company’s portfolio when sold and (b) the accreted or amortized cost basis of such investment.
The aggregate unrealized capital depreciation is calculated as the sum of the differences, if negative, between (a) the valuation of each investment in the Company’s portfolio as of the applicable Capital Gain Incentive Fee calculation date and (b) the accreted or amortized cost basis of such investment.
The Capital Gain Incentive Fee payable as calculated under the Investment Advisory Agreement (as described above) for each of the years ended September 30, 2016, 2015 and 2014 was $0. However, in
In accordance with GAAP, the Company also is required to include the aggregate unrealized capital appreciation on investments in the calculation and accrue a capital gain incentive fee on a quarterly basis as if such unrealized capital appreciation were realized, even though such unrealized capital appreciation is not permitted to be considered in calculating the fee actually payable under the Investment Advisory Agreement. If the Capital Gain Incentive Fee Base, adjusted as required by GAAP to include unrealized capital appreciation, is positive at the end of a period, then GAAP requires the Company to accrue a capital gain incentive fee equal to 20% of such amount, less the aggregate amount of the actual Capital Gain Incentive Fees paid and capital gain incentive fees accrued under GAAP in all prior periods. If such amount is negative, then there is no accrual for such period. The resulting accrual under GAAP in a given period may result in additional expense if such cumulative amount is greater than in the prior period or a reversal of previously recorded expense if such cumulative amount is less than in the prior period. There can be no assurance that such unrealized capital appreciation will be realized in the future. Since inception through September 30, 2016, the Company has not made any Capital Gain Incentive Fee payments. For the years ended September 30, 2016, 2015,2018, 2017 and 2014,2016, the Company accrued a capital gain incentive fee of $1,458, $2,819 and $1,244, respectively, which accruals are included in incentive fee in the Consolidated Statements of Operations.
As of September 30, 2018 and 2017, included in management and incentive fees payable on the Consolidated Statements of Financial Condition were $7,158 and $6,896, respectively, for cumulative accruals for capital gain incentive fees under GAAP, including the amounts payable pursuant to the Investment Advisory Agreement described below.
As September 30, 2018 and 2017 the Capital Gain Incentive Fee payable as calculated under the Investment Advisory Agreement (as described above) was $2,303 and $388, respectively. Any payment due under the terms of $1,244, $2,737,the Investment Advisory Agreement is calculated in arrears at the end of each calendar year and $96, respectively.the Company paid a $1,196 Capital Gain Incentive Fee calculated in accordance with the Investment Advisory Agreement as of December 31, 2017. The Company did not pay any capital gain incentive fee under the Investment Advisory Agreement for any period ended prior to December 31, 2017.
The sum of the Income Incentive Fee and the Capital Gain Incentive Fee is the “Incentive Fee.”
Administration Agreement: Under the Administration Agreement, the Administrator furnishes the Company with office facilities and equipment, provides the Company with clerical, bookkeeping and record keeping services at such facilities and provides the Company with other administrative services as the Administrator, subject to review by the Board, determines necessary to conduct the Company’s day-to-day operations. GBDCThe Company reimburses the Administrator the allocable portion of overhead and other expenses incurred by it in performing its obligations under the Administration Agreement, including rent, fees and expenses associated with performing compliance functions and GBDC’sthe Company's allocable portion of the cost of its chief financial officer and chief compliance officer and their respective staffs. The Board reviews such expenses to determine that these expenses, including any allocation of expenses among the Company and other entities for which the Administrator provides similar services, are reasonable and comparable to administrative services charged by unaffiliated third party asset
Golub Capital BDC, Inc. and Subsidiaries
Notes to Consolidated Financial Statements
(In thousands, except shares and per share data)
managers. Under the Administration Agreement, the Administrator also provides, on the Company’s behalf, managerial assistance to those portfolio companies to which the Company is required to provide such assistance and will be paid an additional amount based on the cost of the services provided, which amount shall not exceed the amount the Company receives from such portfolio companies.
Included in accounts payable and accrued expenses is $566$616 and $606$620 as of September 30, 20162018 and 2015,2017, respectively, for accrued allocated shared services under the Administration Agreement.
Other related party transactions: The Administrator pays for certain unaffiliated third-party expenses incurred by the Company. Such expenses include postage, printing, office supplies, rating agency fees and professional fees. These expenses are not marked-up and represent the same amount the Company would have paid had the Company paid the expenses directly. These expenses are subsequently reimbursed in cash.
Total expenses reimbursed to the Administrator during the years ended September 30, 2016, 20152018, 2017 and 20142016 were $2,412, $2,255 and $2,438, $960 and $1,388, respectively.
As of September 30, 20162018 and 2015,2017, included in accounts payable and accrued expenses were $582$364 and $554,$799, respectively, for accrued expenses paid on behalf of the Company by the Administrator.
Golub Capital BDC, Inc. and Subsidiaries
Notes to Consolidated Financial Statements
(In thousands, except shares and per share data)
Note 3. Related Party Transactions - (continued)
During the years ended September 30, 2016 and 2015 the Company sold $157,795 and $288,971, respectively, of investments and unfunded commitments to SLF at fair value and recognized $1,124 and $2,083, respectively, of net realized gains. The Company did not sell any investments or unfunded commitments to SLF during the year ended September 30, 2014.
On June 22, 2016, the Company entered into an unsecured revolving credit facility with the Investment Adviser (the "Adviser Revolver"), with a maximum credit limit of $20,000 and expiration date of June 22, 2019. Refer to Note 76 for discussion of the Adviser Revolver.
For
During the years ended September 30, 2018, 2017 and 2016, 2015the Company sold $6,191, $119,982 and 2014,$157,795, respectively, of investments and unfunded commitments to SLF at fair value and recognized $20, $776 and $1,124, respectively, of net realized gains.
During the years ended September 30, 2018, 2017 and 2016, SLF incurred an administrative service fee of $457, $249$404, $477 and $139,$457, respectively, to reimburse the Administrator for expenses pursuant to an administrative and loan services agreement by and between SLF and the Administrator.
Golub Capital BDC, Inc. and Subsidiaries
Notes to Consolidated Financial Statements
(In thousands, except shares and per share data)
Note 4. Investments
Investments as of September 30, 2018 and 2017 consisted of the following:
| | | | As of September 30, 2016 | | As of September 30, 2015 | As of September 30, 2018 | | As of September 30, 2017 |
| | Par | | Amortized Cost | | Fair Value | | Par | | Amortized Cost | | Fair Value | Principal | | Amortized Cost | | Fair Value | | Principal | | Amortized Cost | | Fair Value |
| Senior secured | $ | 164,818 |
| | $ | 162,969 |
| | $ | 162,849 |
| | $ | 199,573 |
| | $ | 197,189 |
| | $ | 197,329 |
| $ | 233,064 |
| | $ | 230,846 |
| | $ | 231,169 |
| | $ | 197,734 |
| | $ | 195,790 |
| | $ | 195,029 |
|
| One stop | 1,321,494 |
| | 1,303,056 |
| | 1,304,467 |
| | 1,153,450 |
| | 1,137,654 |
| | 1,134,222 |
| 1,443,980 |
| | 1,426,640 |
| | 1,430,196 |
| | 1,348,625 |
| | 1,331,008 |
| | 1,334,084 |
|
| Second lien | 27,909 |
| | 27,579 |
| | 27,909 |
| | 39,924 |
| | 39,464 |
| | 39,774 |
| 9,435 |
| | 9,338 |
| | 9,435 |
| | 9,434 |
| | 9,306 |
| | 9,434 |
|
| Subordinated debt | 1,750 |
| | 1,750 |
| | 1,427 |
| | 1,707 |
| | 1,707 |
| | 1,715 |
| 251 |
| | 251 |
| | 251 |
| | 59 |
| | 59 |
| | 59 |
|
Subordinated notes in SLF(1) | 77,301 |
| | 77,301 |
| | 77,301 |
| | 76,563 |
| | 76,563 |
| | 76,563 |
| |
LLC equity interests in SLF(1) | N/A |
| | 31,339 |
| | 26,927 |
| | N/A |
| | 23,222 |
| | 22,373 |
| N/A |
| | 75,407 |
| | 71,084 |
| | N/A |
| | 97,457 |
| | 95,015 |
|
| Equity | N/A |
| | 46,179 |
| | 59,732 |
| | N/A |
| | 41,515 |
| | 57,808 |
| N/A |
| | 38,170 |
| | 40,706 |
| | N/A |
| | 37,619 |
| | 51,394 |
|
| Total | $ | 1,593,272 |
| | $ | 1,650,173 |
| | $ | 1,660,612 |
| | $ | 1,471,217 |
| | $ | 1,517,314 |
| | $ | 1,529,784 |
| $ | 1,686,730 |
| | $ | 1,780,652 |
| | $ | 1,782,841 |
| | $ | 1,555,852 |
| | $ | 1,671,239 |
| | $ | 1,685,015 |
|
| |
(1) | SLF’s proceeds from the subordinated notes and LLC equity interests invested in SLF were utilized by SLF to invest in senior secured loans. |
Golub Capital BDC, Inc. and Subsidiaries
Notes to Consolidated Financial Statements
(In thousands, except shares and per share data)
Note 4. Investments - (continued)
The following tables show the portfolio composition by geographic region at amortized cost and fair value as a percentage of total investments in portfolio companies. The geographic composition is determined by the location of the corporate headquarters of the portfolio company, which may not be indicative of the primary source of the portfolio company’s business.
| | | | As of September 30, 2016 | | As of September 30, 2015 | As of September 30, 2018 | | As of September 30, 2017 |
| Amortized Cost: | |
| | |
| | |
| | |
| |
| | |
| | |
| | |
|
| United States | |
| | |
| | |
| | |
| |
| | |
| | |
| | |
|
| Mid-Atlantic | $ | 411,509 |
| | 24.9 | % | | $ | 400,538 |
| | 26.4 | % | $ | 354,662 |
| | 19.9 | % | | $ | 341,612 |
| | 20.4 | % |
| Midwest | 353,117 |
| | 21.4 |
| | 288,923 |
| | 19.0 |
| 370,239 |
| | 20.8 |
| | 405,901 |
| | 24.3 |
|
| West | 289,208 |
| | 17.5 |
| | 245,455 |
| | 16.2 |
| 306,052 |
| | 17.2 |
| | 266,546 |
| | 16.0 |
|
| Southeast | 364,203 |
| | 22.1 |
| | 376,243 |
| | 24.8 |
| 422,844 |
| | 23.7 |
| | 354,663 |
| | 21.2 |
|
| Southwest | 117,168 |
| | 7.1 |
| | 92,714 |
| | 6.1 |
| 186,468 |
| | 10.5 |
| | 153,520 |
| | 9.2 |
|
| Northeast | 100,056 |
| | 6.1 |
| | 113,441 |
| | 7.5 |
| 125,329 |
| | 7.0 |
| | 134,164 |
| | 8.0 |
|
| Canada | 14,912 |
| | 0.9 |
| | — |
| | — |
| 15,058 |
| | 0.9 |
| | 14,833 |
| | 0.9 |
|
| Total | $ | 1,650,173 |
| | 100.0 | % | | $ | 1,517,314 |
| | 100.0 | % | $ | 1,780,652 |
| | 100.0 | % | | $ | 1,671,239 |
| | 100.0 | % |
| | | | | | | | | | | | | | | |
| Fair Value: | |
| | |
| | |
| | |
| |
| | |
| | |
| | |
|
| United States | |
| | |
| | |
| | |
| |
| | |
| | |
| | |
|
| Mid-Atlantic | $ | 403,536 |
| | 24.3 | % | | $ | 395,779 |
| | 25.9 | % | $ | 347,560 |
| | 19.5 | % | | $ | 339,358 |
| | 20.1 | % |
| Midwest | 357,059 |
| | 21.5 |
| | 292,826 |
| | 19.1 |
| 371,141 |
| | 20.8 |
| | 406,694 |
| | 24.1 |
|
| West | 288,047 |
| | 17.3 |
| | 250,264 |
| | 16.4 |
| 306,074 |
| | 17.2 |
| | 270,185 |
| | 16.0 |
|
| Southeast | 368,450 |
| | 22.2 |
| | 376,653 |
| | 24.6 |
| 428,235 |
| | 24.0 |
| | 356,846 |
| | 21.2 |
|
| Southwest | 119,641 |
| | 7.2 |
| | 95,524 |
| | 6.2 |
| 189,379 |
| | 10.6 |
| | 152,312 |
| | 9.1 |
|
| Northeast | 108,866 |
| | 6.6 |
| | 118,738 |
| | 7.8 |
| 125,051 |
| | 7.0 |
| | 144,468 |
| | 8.6 |
|
| Canada | 15,013 |
| | 0.9 |
| | — |
| | — |
| 15,401 |
| | 0.9 |
| | 15,152 |
| | 0.9 |
|
| Total | $ | 1,660,612 |
| | 100.0 | % | | $ | 1,529,784 |
| | 100.0 | % | $ | 1,782,841 |
| | 100.0 | % | | $ | 1,685,015 |
| | 100.0 | % |
Golub Capital BDC, Inc. and Subsidiaries
Notes to Consolidated Financial Statements
(In thousands, except shares and per share data)
Note 4. Investments - (continued)
The industry compositions of the portfolio at amortized cost and fair value as of September 30, 2018 and 2017 were as follows:
|
| | | | | | | | | | | | | |
| | As of September 30, 2016 | | As of September 30, 2015 | |
| Amortized Cost: | |
| | |
| | |
| | | |
| Aerospace and Defense | $ | 64,220 |
| | 3.9 |
| % | $ | 87,245 |
| | 5.7 | % |
| Automobile | 25,293 |
| | 1.5 |
| | 15,451 |
| | 1.0 | |
| Banking | 17,447 |
| | 1.1 |
| | 17,059 |
| | 1.1 | |
| Beverage, Food and Tobacco | 141,879 |
| | 8.6 |
| | 133,352 |
| | 8.8 | |
| Broadcasting and Entertainment | 1,471 |
| | 0.1 |
| | 1,485 |
| | 0.1 | |
| Buildings and Real Estate | 24,386 |
| | 1.5 |
| | 31,039 |
| | 2.0 | |
| Chemicals, Plastics and Rubber | 73 |
| | 0.0 |
| * | 6,166 |
| | 0.4 | |
| Containers, Packaging and Glass | 3,477 |
| | 0.2 |
| | 31,429 |
| | 2.1 | |
| Diversified Conglomerate Manufacturing | 84,255 |
| | 5.1 |
| | 66,939 |
| | 4.4 | |
| Diversified Conglomerate Service | 270,691 |
| | 16.4 |
| | 209,454 |
| | 13.8 | |
| Ecological | 15,343 |
| | 0.9 |
| | — |
| | — | |
| Electronics | 144,560 |
| | 8.8 |
| | 134,487 |
| | 8.9 | |
| Finance | — |
| | — |
| | 10,056 |
| | 0.7 | |
| Grocery | 17,051 |
| | 1.0 |
| | 21,670 |
| | 1.4 | |
| Healthcare, Education and Childcare | 322,793 |
| | 19.6 |
| | 227,871 |
| | 15.0 | |
| Home and Office Furnishings, Housewares and Durable Consumer | 17,796 |
| | 1.1 |
| | 25,102 |
| | 1.7 | |
| Hotels, Motels, Inns, and Gaming | 804 |
| | 0.0 |
| * | — |
| | — | |
| Insurance | 32,652 |
| | 2.0 |
| | 31,407 |
| | 2.1 | |
| Investment Funds and Vehicles | 108,640 |
| | 6.6 |
| | 99,785 |
| | 6.6 | |
| Leisure, Amusement, Motion Pictures and Entertainment | 56,004 |
| | 3.4 |
| | 60,696 |
| | 4.0 | |
| Mining, Steel, Iron and Non-Precious Metals | 4,562 |
| | 0.3 |
| | 4,968 |
| | 0.3 | |
| Oil and Gas | 2,287 |
| | 0.1 |
| | 1,241 |
| | 0.1 | |
| Personal and Non-Durable Consumer Products | 37,531 |
| | 2.3 |
| | 35,021 |
| | 2.3 | |
| Personal, Food and Miscellaneous Services | 64,790 |
| | 3.9 |
| | 49,873 |
| | 3.3 | |
| Printing and Publishing | 46,049 |
| | 2.8 |
| | 32,791 |
| | 2.2 | |
| Retail Stores | 130,991 |
| | 7.9 |
| | 170,100 |
| | 11.2 | |
| Telecommunications | 2,170 |
| | 0.1 |
| | 2,315 |
| | 0.2 | |
| Textiles and Leather | 2,015 |
| | 0.1 |
| | 5,195 |
| | 0.3 | |
| Utilities | 10,943 |
| | 0.7 |
| | 5,117 |
| | 0.3 | |
| Total | $ | 1,650,173 |
| | 100.0 |
| % | $ | 1,517,314 |
| | 100.0 | % |
*Represents an amount less than 0.1%
|
| | | | | | | | | | | | | |
| | As of September 30, 2018 | | As of September 30, 2017 |
| Amortized Cost: | |
| | |
| | |
| | |
|
| Aerospace and Defense | $ | 51,288 |
| | 2.9 | % | | $ | 59,296 |
| | 3.6 | % |
| Automobile | 18,934 |
| | 1.1 |
| | 16,507 |
| | 1.0 |
|
| Banking | — |
| | — |
| | 17,144 |
| | 1.0 |
|
| Beverage, Food and Tobacco | 99,594 |
| | 5.6 |
| | 105,466 |
| | 6.3 |
|
| Broadcasting and Entertainment | 1,444 |
| | 0.1 |
| | 1,458 |
| | 0.1 |
|
| Buildings and Real Estate | 63,109 |
| | 3.5 |
| | 66,317 |
| | 4.0 |
|
| Chemicals, Plastics and Rubber | 10,277 |
| | 0.6 |
| | 2,407 |
| | 0.1 |
|
| Diversified/Conglomerate Manufacturing | 96,892 |
| | 5.4 |
| | 98,121 |
| | 5.9 |
|
| Diversified/Conglomerate Service | 460,166 |
| | 25.8 |
| | 287,765 |
| | 17.2 |
|
| Ecological | 18,852 |
| | 1.1 |
| | 18,081 |
| | 1.1 |
|
| Electronics | 130,457 |
| | 7.3 |
| | 84,454 |
| | 5.1 |
|
| Grocery | 16,203 |
| | 0.9 |
| | 15,876 |
| | 0.9 |
|
| Healthcare, Education and Childcare | 337,499 |
| | 19.0 |
| | 336,386 |
| | 20.1 |
|
| Home and Office Furnishings, Housewares, and Durable Consumer | 12,861 |
| | 0.7 |
| | 16,906 |
| | 1.0 |
|
| Hotels, Motels, Inns, and Gaming | 15,383 |
| | 0.9 |
| | 9,889 |
| | 0.6 |
|
| Insurance | 45,865 |
| | 2.6 |
| | 34,225 |
| | 2.1 |
|
| Investment Funds and Vehicles | 75,407 |
| | 4.2 |
| | 97,457 |
| | 5.8 |
|
| Leisure, Amusement, Motion Pictures, Entertainment | 80,302 |
| | 4.5 |
| | 76,717 |
| | 4.6 |
|
| Mining, Steel, Iron and Non-Precious Metals | 4,478 |
| | 0.3 |
| | 4,806 |
| | 0.3 |
|
| Oil and Gas | 14,211 |
| | 0.8 |
| | 6,362 |
| | 0.4 |
|
| Personal and Non Durable Consumer Products (Mfg. Only) | 68,129 |
| | 3.8 |
| | 68,871 |
| | 4.1 |
|
| Personal, Food and Miscellaneous Services | 31,526 |
| | 1.8 |
| | 73,718 |
| | 4.4 |
|
| Printing and Publishing | 4,200 |
| | 0.2 |
| | 10,567 |
| | 0.6 |
|
| Retail Stores | 111,550 |
| | 6.3 |
| | 135,892 |
| | 8.1 |
|
| Telecommunications | 6,310 |
| | 0.3 |
| | 8,504 |
| | 0.5 |
|
| Textiles and Leather | 2,196 |
| | 0.1 |
| | 2,209 |
| | 0.1 |
|
| Utilities | 3,519 |
| | 0.2 |
| | 15,838 |
| | 1.0 |
|
| Total | $ | 1,780,652 |
| | 100.0 | % | | $ | 1,671,239 |
| | 100.0 | % |
Golub Capital BDC, Inc. and Subsidiaries
Notes to Consolidated Financial Statements
(In thousands, except shares and per share data)
Note 4. Investments - (continued)
|
| | | | | | | | | | | | | |
| | As of September 30, 2016 | | As of September 30, 2015 | |
| Fair Value: | |
| | |
| | |
| | | |
| Aerospace and Defense | $ | 59,120 |
| | 3.6 |
| % | $ | 84,370 |
| | 5.5 | % |
| Automobile | 25,911 |
| | 1.6 |
| | 15,627 |
| | 1.0 | |
| Banking | 17,529 |
| | 1.1 |
| | 17,177 |
| | 1.1 | |
| Beverage, Food and Tobacco | 145,658 |
| | 8.8 |
| | 135,937 |
| | 8.9 | |
| Broadcasting and Entertainment | 1,483 |
| | 0.1 |
| | 1,496 |
| | 0.1 | |
| Buildings and Real Estate | 24,852 |
| | 1.5 |
| | 31,277 |
| | 2.0 | |
| Chemicals, Plastics and Rubber | 75 |
| | 0.0 |
| * | 6,241 |
| | 0.4 | |
| Containers, Packaging and Glass | 3,489 |
| | 0.2 |
| | 32,553 |
| | 2.1 | |
| Diversified Conglomerate Manufacturing | 84,306 |
| | 5.1 |
| | 67,337 |
| | 4.4 | |
| Diversified Conglomerate Service | 274,198 |
| | 16.5 |
| | 212,411 |
| | 13.9 | |
| Ecological | 15,618 |
| | 0.9 |
| | — |
| | — | |
| Electronics | 146,319 |
| | 8.8 |
| | 136,161 |
| | 8.9 | |
| Finance | — |
| | — |
| | 10,290 |
| | 0.7 | |
| Grocery | 17,862 |
| | 1.1 |
| | 21,843 |
| | 1.4 | |
| Healthcare, Education and Childcare | 327,287 |
| | 19.7 |
| | 228,136 |
| | 14.9 | |
| Home and Office Furnishings, Housewares and Durable Consumer | 16,498 |
| | 1.0 |
| | 23,750 |
| | 1.6 | |
| Hotels, Motels, Inns, and Gaming | 815 |
| | 0.0 |
| * | — |
| | — | |
| Insurance | 33,303 |
| | 2.0 |
| | 31,694 |
| | 2.1 | |
| Investment Funds and Vehicles | 104,228 |
| | 6.3 |
| | 98,936 |
| | 6.5 | |
| Leisure, Amusement, Motion Pictures and Entertainment | 51,397 |
| | 3.1 |
| | 59,032 |
| | 3.9 | |
| Mining, Steel, Iron and Non-Precious Metals | 3,914 |
| | 0.2 |
| | 4,999 |
| | 0.3 | |
| Oil and Gas | 2,305 |
| | 0.1 |
| | 1,256 |
| | 0.1 | |
| Personal and Non-Durable Consumer Products | 37,895 |
| | 2.3 |
| | 36,119 |
| | 2.4 | |
| Personal, Food and Miscellaneous Services | 66,198 |
| | 4.0 |
| | 50,629 |
| | 3.3 | |
| Printing and Publishing | 46,814 |
| | 2.8 |
| | 33,019 |
| | 2.2 | |
| Retail Stores | 137,940 |
| | 8.3 |
| | 176,633 |
| | 11.5 | |
| Telecommunications | 2,111 |
| | 0.1 |
| | 2,294 |
| | 0.1 | |
| Textiles and Leather | 2,061 |
| | 0.1 |
| | 5,271 |
| | 0.3 | |
| Utilities | 11,426 |
| | 0.7 |
| | 5,296 |
| | 0.4 | |
| Total | $ | 1,660,612 |
| | 100.0 |
| % | $ | 1,529,784 |
| | 100.0 | % |
*Represents an amount less than 0.1%
|
| | | | | | | | | | | | | |
| | As of September 30, 2018 | | As of September 30, 2017 |
| Fair Value: | |
| | |
| | |
| | |
|
| Aerospace and Defense | $ | 47,891 |
| | 2.7 | % | | $ | 56,458 |
| | 3.4 | % |
| Automobile | 19,158 |
| | 1.1 |
| | 16,677 |
| | 1.0 |
|
| Banking | — |
| | — |
| | 17,182 |
| | 1.0 |
|
| Beverage, Food and Tobacco | 99,608 |
| | 5.6 |
| | 107,582 |
| | 6.4 |
|
| Broadcasting and Entertainment | 1,447 |
| | 0.1 |
| | 1,469 |
| | 0.1 |
|
| Buildings and Real Estate | 65,255 |
| | 3.7 |
| | 67,376 |
| | 4.0 |
|
| Chemicals, Plastics and Rubber | 10,356 |
| | 0.6 |
| | 2,460 |
| | 0.1 |
|
| Diversified/Conglomerate Manufacturing | 96,663 |
| | 5.4 |
| | 98,664 |
| | 5.9 |
|
| Diversified/Conglomerate Service | 466,037 |
| | 26.1 |
| | 293,632 |
| | 17.4 |
|
| Ecological | 19,148 |
| | 1.1 |
| | 18,536 |
| | 1.1 |
|
| Electronics | 130,472 |
| | 7.3 |
| | 85,381 |
| | 5.1 |
|
| Grocery | 14,629 |
| | 0.8 |
| | 16,603 |
| | 1.0 |
|
| Healthcare, Education and Childcare | 333,736 |
| | 18.7 |
| | 335,880 |
| | 19.9 |
|
| Home and Office Furnishings, Housewares, and Durable Consumer | 12,831 |
| | 0.7 |
| | 14,954 |
| | 0.9 |
|
| Hotels, Motels, Inns, and Gaming | 15,592 |
| | 0.9 |
| | 10,057 |
| | 0.6 |
|
| Insurance | 47,041 |
| | 2.6 |
| | 35,082 |
| | 2.1 |
|
| Investment Funds and Vehicles | 71,084 |
| | 4.0 |
| | 95,015 |
| | 5.6 |
|
| Leisure, Amusement, Motion Pictures, Entertainment | 81,907 |
| | 4.6 |
| | 76,954 |
| | 4.5 |
|
| Mining, Steel, Iron and Non-Precious Metals | 4,496 |
| | 0.3 |
| | 3,707 |
| | 0.2 |
|
| Oil and Gas | 14,340 |
| | 0.8 |
| | 6,351 |
| | 0.4 |
|
| Personal and Non Durable Consumer Products (Mfg. Only) | 69,912 |
| | 3.9 |
| | 70,192 |
| | 4.2 |
|
| Personal, Food and Miscellaneous Services | 32,253 |
| | 1.8 |
| | 72,517 |
| | 4.3 |
|
| Printing and Publishing | 4,167 |
| | 0.2 |
| | 10,805 |
| | 0.6 |
|
| Retail Stores | 112,738 |
| | 6.3 |
| | 144,336 |
| | 8.6 |
|
| Telecommunications | 6,393 |
| | 0.4 |
| | 8,598 |
| | 0.5 |
|
| Textiles and Leather | 2,134 |
| | 0.1 |
| | 2,247 |
| | 0.1 |
|
| Utilities | 3,553 |
| | 0.2 |
| | 16,300 |
| | 1.0 |
|
| Total | $ | 1,782,841 |
| | 100.0 | % | | $ | 1,685,015 |
| | 100.0 | % |
Senior Loan Fund LLC:
The Company co-invests with RGA Reinsurance Company (“RGA”) in senior secured loans through SLF, an unconsolidated Delaware LLC. SLF is capitalized as transactions are completed and all portfolio and investment decisions in respect of SLF must be approved by the SLF investment committee consisting of two representatives of each of the Company and RGA (with unanimous approval required from (i) one representative of each of the Company and RGA or (ii) both representatives of each of the Company and RGA). SLF may cease making new investments upon notification of either member but operations will continue until all investments have been sold or paid-off in the normal course of business. Investments held by SLF are measured by SLF at fair value using the same valuation methodologies as described in Note 6 and the determination5.
As of such fair value is not included in the Board's valuation process.
September 30, 2018, SLF iswas capitalized with subordinated notes andby LLC equity interest subscriptions from its members. On December 14, 2016, the SLF investment committee approved the recapitalization of the commitments of SLF’s members. On December 30, 2016, SLF’s members entered into additional LLC equity interest subscriptions totaling $160,000, SLF issued capital calls totaling $89,930 to the Company and RGA and the subordinated notes previously issued by SLF were redeemed and terminated. As of September 30, 20162018 and 2015,2017, the Company and RGA owned 87.5% and 12.5%, respectively, of both the outstanding subordinated notes and LLC equity interests. interests of SLF. SLF’s profits and losses are allocated to the Company and RGA in accordance with their respective 87.5% and 12.5% ownership interests.Additionally,
SLF has entered into a senior secured revolving credit facility (as amended, the “SLF Credit Facility”) with Wells Fargo Bank, N.A., through its wholly-owned subsidiary Senior Loan Fund II LLC (“SLF II”), which as of September 30, 2016,2018 allowed SLF II to borrow up to $300,000$104,622 at any one time outstanding, subject to leverage and borrowing base restrictions.
Golub Capital BDC, Inc. and Subsidiaries
Notes to Consolidated Financial Statements
(In thousands, except shares and per share data)
Note 4. Investments - (continued)
As of September 30, 20162018 and 2015,2017, SLF had the following commitments from its members:members (in the aggregate):
|
| | | | | | | | | | | | | | | |
| | As of September 30, 2016 | | As of September 30, 2015 |
| | Committed | | Funded(1) | | Committed | | Funded(1) |
Subordinated note commitments (2) | $ | 160,000 |
| | $ | 88,344 |
| | $ | 160,000 |
| | $ | 87,500 |
|
LLC equity commitments (2) | 40,000 |
| | 35,816 |
| | 40,000 |
| | 26,540 |
|
| Total | $ | 200,000 |
| | $ | 124,160 |
| | $ | 200,000 |
| | $ | 114,040 |
|
|
| | | | | | | | | | | | | | | |
| | As of September 30, 2018 | | As of September 30, 2017 |
| | Committed | | Funded(1) | | Committed | | Funded(1) |
| LLC equity commitments | $ | 200,000 |
| | $ | 86,180 |
| | $ | 200,000 |
| | $ | 111,380 |
|
| Total | $ | 200,000 |
| | $ | 86,180 |
| | $ | 200,000 |
| | $ | 111,380 |
|
| |
(1) | Funded subordinated note commitments are presented net of repayments subject to recall and funded LLC equity commitments are presented net of return of capital distributions subject to recall. |
| |
(2)
| Commitments presented are combined for the Company and RGA. |
As of September 30, 20162018 and 2015,2017, SLF had total assets at fair value of $332,786$186,326 and $323,395,$306,235, respectively. As of September 30, 2016,2018, SLF had one portfolio company investment on non-accrual status and the totalwith a fair value of non-accrual loans was $6,686.$3,856. As of September 30, 2015,2017, SLF did not have anyhad one portfolio company investments investmentsinvestment on non-accrual status.status with a fair value of $329. The portfolio companies in SLF are in industries and geographies similar to those in which the Company may invest directly. Additionally, as of September 30, 20162018 and 2015,2017, SLF had commitments to fund various undrawn revolvers and delayed draw investments to its portfolio companies totaling $24,104$5,920 and $30,840,$13,318, respectively.
Below is a summary of SLF’s portfolio, followed by a listing of the individual loansinvestments in SLF’s portfolio as of September 30, 20162018 and 2015:2017:
|
| | | | | | | |
| | As of September 30, |
| | 2016 | | 2015 |
Senior secured loans (1) | $ | 331,473 |
| | $ | 320,583 |
|
Weighted average current interest rate on senior secured loans (2) | 6.0 | % | | 5.8 | % |
| Number of borrowers in SLF | 62 |
| | 62 |
|
Largest portfolio company investments (1) | $ | 13,050 |
| | $ | 12,734 |
|
Total of five largest portfolio company investments (1) | $ | 61,118 |
| | $ | 59,917 |
|
|
| | | | | | | |
| | As of September 30, |
| | 2018 | | 2017 |
Senior secured loans(1) | $ | 183,668 |
| | $ | 301,583 |
|
Weighted average current interest rate on senior secured loans(2) | 7.5 | % | | 6.4 | % |
| Number of borrowers in SLF | 32 |
| | 50 |
|
Largest portfolio company investments(1) | $ | 13,716 |
| | $ | 13,820 |
|
Total of five largest portfolio company investments(1) | $ | 57,330 |
| | $ | 61,187 |
|
| |
(1) | At principal/parprincipal amount. |
| |
(2) | Computed as the (a) annual stated interest rate on accruing senior secured loans divided by (b) total senior secured loans at principal/parprincipal amount. |
Golub Capital BDC, Inc. and Subsidiaries
Notes to Consolidated Financial Statements
(In thousands, except shares and per share data)
Note 4. Investments - (continued)
|
| | | | | | | | | | | | | | | | | | |
| SLF Loan Portfolio as of September 30, 2016 |
| Portfolio Company | | Business Description | | Security Type | | Maturity Date | | Current Interest Rate(1) | | Principal/ Par Amount | | Fair Value(2) |
1A Smart Start LLC(3) | | Home and Office Furnishings, Housewares, and Durable Consumer | | Senior loan | | 02/2022 | | 5.8 |
| % | | $ | 2,116 |
| | $ | 2,111 |
|
| ACTIVE Network, Inc. | | Electronics | | Senior loan | | 11/2020 | | 5.5 |
| | | 1,945 |
| | 1,938 |
|
| Advanced Pain Management Holdings, Inc. | | Healthcare, Education and Childcare | | Senior loan | | 02/2018 | | 6.3 |
| | | 6,805 |
| | 6,601 |
|
| Advanced Pain Management Holdings, Inc. | | Healthcare, Education and Childcare | | Senior loan | | 02/2018 | | 6.3 |
| | | 466 |
| | 452 |
|
Advanced Pain Management Holdings, Inc.(4) | | Healthcare, Education and Childcare | | Senior loan | | 02/2018 | | N/A |
| (5) | | — |
| | (35 | ) |
Aimbridge Hospitality, LLC (3) | | Hotels, Motels, Inns, and Gaming | | Senior loan | | 10/2018 | | 5.8 |
| | | 5,037 |
| | 5,037 |
|
| American Seafoods Group LLC | | Beverage, Food and Tobacco | | Senior loan | | 08/2021 | | 6.0 |
| | | 4,818 |
| | 4,806 |
|
| Argon Medical Devices, Inc. | | Healthcare, Education and Childcare | | Senior loan | | 12/2021 | | 5.8 |
| | | 3,895 |
| | 3,895 |
|
Arise Virtual Solutions, Inc.(3) | | Telecommunications | | Senior loan | | 12/2018 | | 7.8 |
| | | 10,804 |
| | 10,264 |
|
Arise Virtual Solutions, Inc.(3)(4) | | Telecommunications | | Senior loan | | 12/2018 | | N/A |
| (5) | | — |
| | (28 | ) |
Atkins Nutritionals, Inc.(3) | | Beverage, Food and Tobacco | | Senior loan | | 01/2019 | | 6.3 |
| | | 5,664 |
| | 5,664 |
|
| BMC Software, Inc. | | Electronics | | Senior loan | | 09/2020 | | 5.0 |
| | | 1,876 |
| | 1,813 |
|
| Boot Barn, Inc. | | Retail Stores | | Senior loan | | 06/2021 | | 5.5 |
| | | 10,667 |
| | 10,667 |
|
| Brandmuscle, Inc. | | Printing and Publishing | | Senior loan | | 12/2021 | | 5.8 |
| | | 4,948 |
| | 4,938 |
|
| C.B. Fleet Company, Incorporated | | Personal and Non Durable Consumer Products | | Senior loan | | 12/2021 | | 5.8 |
| | | 7,613 |
| | 7,613 |
|
| Checkers Drive-In Restaurants, Inc. | | Beverage, Food and Tobacco | | Senior loan | | 01/2022 | | 6.5 |
| | | 4,460 |
| | 4,427 |
|
| CLP Healthcare Services, Inc. | | Healthcare, Education and Childcare | | Senior loan | | 12/2020 | | 6.3 |
| | | 8,677 |
| | 8,677 |
|
| CLP Healthcare Services, Inc. | | Healthcare, Education and Childcare | | Senior loan | | 12/2020 | | 6.3 |
| | | 4,373 |
| | 4,373 |
|
| Community Veterinary Partners, LLC | | Personal, Food and Miscellaneous Services | | Senior loan | | 10/2021 | | 6.5 |
| | | 2,466 |
| | 2,454 |
|
| Community Veterinary Partners, LLC | | Personal, Food and Miscellaneous Services | | Senior loan | | 10/2021 | | 6.5 |
| | | 1,240 |
| | 1,234 |
|
CPI Buyer, LLC (Cole-Parmer)(3) | | Healthcare, Education and Childcare | | Senior loan | | 08/2021 | | 5.5 |
| | | 5,805 |
| | 5,776 |
|
Curo Health Services LLC(3) | | Healthcare, Education and Childcare | | Senior loan | | 02/2022 | | 6.5 |
| | | 5,910 |
| | 5,928 |
|
DentMall MSO, LLC(6) | | Retail Stores | | Senior loan | | 07/2019 | | 6.0 |
| | | 10,147 |
| | 6,088 |
|
DentMall MSO, LLC(6) | | Retail Stores | | Senior loan | | 07/2019 | | 6.0 |
| | | 1,000 |
| | 598 |
|
| DISA Holdings Acquisition Subsidiary Corp. | | Diversified/Conglomerate Service | | Senior loan | | 12/2020 | | 5.5 |
| | | 4,568 |
| | 4,431 |
|
| DISA Holdings Acquisition Subsidiary Corp. | | Diversified/Conglomerate Service | | Senior loan | | 12/2020 | | 5.5 |
| | | 255 |
| | 224 |
|
| EAG, INC. (Evans Analytical Group) | | Diversified/Conglomerate Service | | Senior loan | | 07/2017 | | 5.0 |
| | | 2,113 |
| | 2,113 |
|
Encore GC Acquisition, LLC(3) | | Healthcare, Education and Childcare | | Senior loan | | 01/2020 | | 6.3 |
| | | 4,773 |
| | 4,773 |
|
Encore GC Acquisition, LLC(3) | | Healthcare, Education and Childcare | | Senior loan | | 01/2020 | | 7.8 |
| | | 164 |
| | 164 |
|
Express Oil Change, LLC(3) | | Retail Stores | | Senior loan | | 12/2017 | | 6.0 |
| | | 4,841 |
| | 4,841 |
|
| Extreme Reach Inc. | | Broadcasting and Entertainment | | Senior loan | | 02/2020 | | 7.3 |
| | | 1,976 |
| | 1,998 |
|
| Federal-Mogul Corporation | | Automobile | | Senior loan | | 04/2021 | | 4.8 |
| | | 3,920 |
| | 3,799 |
|
| Flexan, LLC | | Chemicals, Plastics and Rubber | | Senior loan | | 02/2020 | | 6.3 |
| | | 6,090 |
| | 6,090 |
|
Harvey Tool Company, LLC(3) | | Diversified/Conglomerate Manufacturing | | Senior loan | | 03/2020 | | 6.0 |
| | | 3,108 |
| | 3,108 |
|
| Jensen Hughes, Inc. | | Diversified/Conglomerate Service | | Senior loan | | 12/2021 | | 6.3 |
| | | 2,342 |
| | 2,342 |
|
| Jensen Hughes, Inc. | | Diversified/Conglomerate Service | | Senior loan | | 12/2021 | | 6.0 |
| | | 104 |
| | 104 |
|
| Jensen Hughes, Inc. | | Diversified/Conglomerate Service | | Senior loan | | 12/2021 | | 6.2 |
| | | 65 |
| | 65 |
|
Joerns Healthcare, LLC(3) | | Healthcare, Education and Childcare | | Senior loan | | 05/2020 | | 6.0 |
| | | 9,598 |
| | 9,118 |
|
|
| | | | | | | | | | | | | | | | | |
| SLF Investment Portfolio as of September 30, 2018 |
| Portfolio Company | | Business Description | | Security Type | | Maturity Date | | Current Interest Rate(1) | | Principal ($) / Shares(2) | | Fair Value(3) |
| 1A Smart Start LLC | | Home and Office Furnishings, Housewares, and Durable Consumer | | Senior Loan | | 02/2022 | | 7.0 | % | | $ | 2,073 |
| | $ | 2,084 |
|
1A Smart Start LLC(4) | | Home and Office Furnishings, Housewares, and Durable Consumer | | Senior Loan | | 02/2022 | | 6.7 | | | 922 |
| | 924 |
|
Advanced Pain Management Holdings, Inc.(5) | | Healthcare, Education and Childcare | | Senior Loan | | 11/2018 | | 7.2 | | | 6,561 |
| | 3,609 |
|
Advanced Pain Management Holdings, Inc.(5) | | Healthcare, Education and Childcare | | Senior Loan | | 11/2018 | | 7.2 | | | 449 |
| | 247 |
|
| Boot Barn, Inc. | | Retail Stores | | Senior Loan | | 06/2021 | | 6.9 | | | 9,533 |
| | 9,533 |
|
| Brandmuscle, Inc. | | Printing and Publishing | | Senior Loan | | 12/2021 | | 7.1 | | | 4,678 |
| | 4,674 |
|
Captain D's, LLC(4) | | Personal, Food and Miscellaneous Services | | Senior Loan | | 12/2023 | | 7.9 | | | 13 |
| | 13 |
|
Captain D's, LLC(4) | | Personal, Food and Miscellaneous Services | | Senior Loan | | 12/2023 | | 6.7 | | | 2,499 |
| | 2,499 |
|
| CLP Healthcare Services, Inc. | | Healthcare, Education and Childcare | | Senior Loan | | 12/2020 | | 7.9 | | | 8,502 |
| | 8,332 |
|
| CLP Healthcare Services, Inc. | | Healthcare, Education and Childcare | | Senior Loan | | 12/2020 | | 7.9 | | | 4,284 |
| | 4,198 |
|
| Community Veterinary Partners, LLC | | Personal, Food and Miscellaneous Services | | Senior Loan | | 10/2021 | | 7.9 | | | 2,417 |
| | 2,417 |
|
| Community Veterinary Partners, LLC | | Personal, Food and Miscellaneous Services | | Senior Loan | | 10/2021 | | 7.9 | | | 1,215 |
| | 1,215 |
|
| Community Veterinary Partners, LLC | | Personal, Food and Miscellaneous Services | | Senior Loan | | 10/2021 | | 7.9 | | | 40 |
| | 40 |
|
| Community Veterinary Partners, LLC | | Personal, Food and Miscellaneous Services | | Senior Loan | | 10/2021 | | 7.9 | | | 58 |
| | 58 |
|
DISA Holdings Acquisition Subsidiary Corp.(4) | | Diversified/Conglomerate Service | | Senior Loan | | 06/2022 | | 6.1 | | | 71 |
| | 71 |
|
DISA Holdings Acquisition Subsidiary Corp.(4) | | Diversified/Conglomerate Service | | Senior Loan | | 06/2022 | | 6.1 | | | 4,821 |
| | 4,821 |
|
| Encore GC Acquisition, LLC | | Healthcare, Education and Childcare | | Senior Loan | | 01/2020 | | 7.5 | | | 4,540 |
| | 4,540 |
|
Flexan, LLC(4) | | Chemicals, Plastics and Rubber | | Senior Loan | | 02/2020 | | 9.8 | | | 304 |
| | 304 |
|
| Flexan, LLC | | Chemicals, Plastics and Rubber | | Senior Loan | | 02/2020 | | 8.1 | | | 5,967 |
| | 5,967 |
|
| Flexan, LLC | | Chemicals, Plastics and Rubber | | Senior Loan | | 02/2020 | | 8.1 | | | 1,657 |
| | 1,657 |
|
Gamma Technologies, LLC(4) | | Electronics | | Senior Loan | | 06/2024 | | 7.7 | | | 10,186 |
| | 10,186 |
|
| III US Holdings, LLC | | Diversified/Conglomerate Service | | Senior Loan | | 09/2022 | | 9.0 | | | 4,927 |
| | 4,927 |
|
| Jensen Hughes, Inc. | | Buildings and Real Estate | | Senior Loan | | 03/2024 | | 6.7 | | | 2,293 |
| | 2,293 |
|
| Jensen Hughes, Inc. | | Buildings and Real Estate | | Senior Loan | | 03/2024 | | 6.7 | | | 119 |
| | 119 |
|
| Jensen Hughes, Inc. | | Buildings and Real Estate | | Senior Loan | | 03/2024 | | 6.7 | | | 64 |
| | 64 |
|
Joerns Healthcare, LLC(4) | | Healthcare, Education and Childcare | | Senior Loan | | 05/2020 | | 8.3 | | | 8,745 |
| | 8,133 |
|
| Paradigm DKD Group, LLC | | Buildings and Real Estate | | Senior Loan | | 05/2020 | | 8.5 | | | 702 |
| | 524 |
|
| Paradigm DKD Group, LLC | | Buildings and Real Estate | | Senior Loan | | 05/2020 | | 8.5 | | | 1,957 |
| | 1,369 |
|
Pasternack Enterprises, Inc. and Fairview Microwave, Inc (4) | | Diversified/Conglomerate Manufacturing | | Senior Loan | | 07/2025 | | 6.2 | | | 5,318 |
| | 5,291 |
|
| Payless ShoeSource, Inc. | | Retail Stores | | Senior Loan | | 08/2022 | | 11.3 | | | 762 |
| | 528 |
|
| Polk Acquisition Corp. | | Automobile | | Senior Loan | | 06/2022 | | 7.5 | | | 93 |
| | 93 |
|
| Polk Acquisition Corp. | | Automobile | | Senior Loan | | 06/2022 | | 7.2 | | | 4,513 |
| | 4,513 |
|
| Polk Acquisition Corp. | | Automobile | | Senior Loan | | 06/2022 | | 7.2 | | | 53 |
| | 53 |
|
| Pyramid Healthcare, Inc. | | Healthcare, Education and Childcare | | Senior Loan | | 08/2019 | | 8.8 | | | 411 |
| | 411 |
|
| Pyramid Healthcare, Inc. | | Healthcare, Education and Childcare | | Senior Loan | | 08/2019 | | 8.8 | | | 10,152 |
| | 10,152 |
|
| Pyramid Healthcare, Inc. | | Healthcare, Education and Childcare | | Senior Loan | | 08/2019 | | 8.8 | | | 45 |
| | 45 |
|
| Pyramid Healthcare, Inc. | | Healthcare, Education and Childcare | | Senior Loan | | 08/2019 | | 8.8 | | | 148 |
| | 148 |
|
Golub Capital BDC, Inc. and Subsidiaries
Notes to Consolidated Financial Statements
(In thousands, except shares and per share data)
|
| | | | | | | | | | | | | | | | | | |
| Note 4. Investments - (continued) |
| SLF Loan Portfolio as of September 30, 2016 – (continued) |
| Portfolio Company | | Business Description | | Security Type | | Maturity Date | | Current
Interest
Rate(1) | | Principal/ Par Amount | | Fair Value(2) |
| Julio & Sons Company | | Beverage, Food and Tobacco | | Senior loan | | 12/2018 | | 6.5 |
| % | | $ | 6,834 |
| | $ | 6,834 |
|
| Julio & Sons Company | | Beverage, Food and Tobacco | | Senior loan | | 12/2018 | | 6.5 |
| | | 1,061 |
| | 1,061 |
|
| Julio & Sons Company | | Beverage, Food and Tobacco | | Senior loan | | 12/2018 | | 6.5 |
| | | 596 |
| | 596 |
|
K&N Engineering, Inc.(3) | | Automobile | | Senior loan | | 07/2019 | | 6.8 |
| | | 3,781 |
| | 3,781 |
|
K&N Engineering, Inc.(3) | | Automobile | | Senior loan | | 07/2019 | | 5.3 |
| | | 179 |
| | 179 |
|
| Loar Group Inc. | | Aerospace and Defense | | Senior loan | | 01/2022 | | 5.8 |
| | | 2,233 |
| | 2,233 |
|
Mediaocean LLC(3) | | Diversified/Conglomerate Service | | Senior loan | | 08/2022 | | 5.8 |
| | | 3,137 |
| | 3,137 |
|
Northwestern Management Services, LLC(3) | | Healthcare, Education and Childcare | | Senior loan | | 10/2019 | | 6.5 |
| | | 4,288 |
| | 4,224 |
|
Northwestern Management Services, LLC(3) | | Healthcare, Education and Childcare | | Senior loan | | 10/2019 | | 6.5 |
| | | 470 |
| | 463 |
|
Northwestern Management Services, LLC(3) | | Healthcare, Education and Childcare | | Senior loan | | 10/2019 | | 7.5 |
| | | 1 |
| | 1 |
|
| Paradigm DKD Group, LLC | | Buildings and Real Estate | | Senior loan | | 11/2018 | | 6.5 |
| | | 1,998 |
| | 1,958 |
|
| Paradigm DKD Group, LLC | | Buildings and Real Estate | | Senior loan | | 11/2018 | | 6.7 |
| | | 180 |
| | 166 |
|
Pasternack Enterprises, Inc. and Fairview Microwave, Inc(3) | | Diversified/Conglomerate Manufacturing | | Senior loan | | 05/2022 | | 6.0 |
| | | 1,640 |
| | 1,623 |
|
| Payless ShoeSource, Inc. | | Retail Stores | | Senior loan | | 03/2021 | | 5.0 |
| | | 1,955 |
| | 1,163 |
|
| Pentec Acquisition Sub, Inc. | | Healthcare, Education and Childcare | | Senior loan | | 05/2018 | | 6.3 |
| | | 1,419 |
| | 1,419 |
|
PetVet Care Centers LLC(3) | | Personal, Food and Miscellaneous Services | | Senior loan | | 12/2020 | | 5.8 |
| | | 5,895 |
| | 5,895 |
|
PetVet Care Centers LLC(3) | | Personal, Food and Miscellaneous Services | | Senior loan | | 12/2020 | | 5.8 |
| | | 1,219 |
| | 1,219 |
|
PowerPlan Holdings, Inc.(3) | | Utilities | | Senior loan | | 02/2022 | | 5.8 |
| | | 11,994 |
| | 11,994 |
|
| PPT Management, LLC | | Healthcare, Education and Childcare | | Senior loan | | 04/2020 | | 6.0 |
| | | 13,026 |
| | 13,026 |
|
| PPT Management, LLC | | Healthcare, Education and Childcare | | Senior loan | | 04/2020 | | 6.0 |
| | | 10 |
| | 10 |
|
Premise Health Holding Corp.(3) | | Healthcare, Education and Childcare | | Senior loan | | 06/2020 | | 5.5 |
| | | 11,891 |
| | 11,891 |
|
Pyramid Healthcare, Inc.(3) | | Healthcare, Education and Childcare | | Senior loan | | 08/2019 | | 6.8 |
| | | 8,354 |
| | 8,354 |
|
| Pyramid Healthcare, Inc. | | Healthcare, Education and Childcare | | Senior loan | | 08/2019 | | 7.8 |
| | | 373 |
| | 373 |
|
| R.G. Barry Corporation | | Personal, Food and Miscellaneous Services | | Senior loan | | 09/2019 | | 6.0 |
| | | 5,880 |
| | 5,821 |
|
Radiology Partners, Inc.(3) | | Healthcare, Education and Childcare | | Senior loan | | 09/2020 | | 6.5 |
| | | 7,072 |
| | 7,001 |
|
Radiology Partners, Inc.(3) | | Healthcare, Education and Childcare | | Senior loan | | 09/2020 | | 6.5 |
| | | 801 |
| | 792 |
|
Radiology Partners, Inc.(3) | | Healthcare, Education and Childcare | | Senior loan | | 09/2020 | | 6.5 |
| | | 510 |
| | 505 |
|
Radiology Partners, Inc.(3)(4) | | Healthcare, Education and Childcare | | Senior loan | | 09/2020 | | N/A |
| (5) | | — |
| | (6 | ) |
Radiology Partners, Inc.(3)(4) | | Healthcare, Education and Childcare | | Senior loan | | 09/2020 | | N/A |
| (5) | | — |
| | (3 | ) |
Reliant Pro ReHab, LLC(3) | | Healthcare, Education and Childcare | | Senior loan | | 12/2017 | | 6.0 |
| | | 3,337 |
| | 3,337 |
|
RSC Acquisition, Inc.(3) | | Insurance | | Senior loan | | 11/2022 | | 6.3 |
| | | 3,732 |
| | 3,732 |
|
RSC Acquisition, Inc.(3) | | Insurance | | Senior loan | | 11/2022 | | 6.3 |
| | | 172 |
| | 172 |
|
| RSC Acquisition, Inc. | | Insurance | | Senior loan | | 11/2020 | | 6.8 |
| | | 33 |
| | 33 |
|
Rubio's Restaurants, Inc.(3) | | Beverage, Food and Tobacco | | Senior loan | | 11/2018 | | 6.0 |
| | | 5,044 |
| | 5,044 |
|
| Rug Doctor LLC | | Personal and Non Durable Consumer Products | | Senior loan | | 06/2018 | | 6.3 |
| | | 7,780 |
| | 7,780 |
|
| Saldon Holdings, Inc. | | Diversified/Conglomerate Service | | Senior loan | | 09/2021 | | 5.5 |
| | | 2,718 |
| | 2,718 |
|
| Sarnova HC, LLC | | Healthcare, Education and Childcare | | Senior loan | | 01/2022 | | 5.8 |
| | | 3,722 |
| | 3,722 |
|
| SEI, Inc. | | Electronics | | Senior loan | | 07/2021 | | 5.8 |
| | | 8,711 |
| | 8,711 |
|
Self Esteem Brands, LLC(3) | | Leisure, Amusement, Motion Pictures, Entertainment | | Senior loan | | 02/2020 | | 5.0 |
| | | 6,342 |
| | 6,342 |
|
Severin Acquisition, LLC(3) | | Diversified/Conglomerate Service | | Senior loan | | 07/2021 | | 5.9 |
| | | 4,882 |
| | 4,858 |
|
|
| | | | | | | | | | | | | | | | | |
| SLF Investment Portfolio as of September 30, 2018 - (continued) |
| Portfolio Company | | Business Description | | Security Type | | Maturity Date | | Current Interest Rate(1) | | Principal ($) /
Shares(2) | | Fair Value(3) |
RSC Acquisition, Inc.(4) | | Insurance | | Senior Loan | | 11/2021 | | 6.8 | % | | $ | 17 |
| | $ | 17 |
|
RSC Acquisition, Inc.(4) | | Insurance | | Senior Loan | | 11/2022 | | 6.7 | | | 3,824 |
| | 3,815 |
|
Rubio's Restaurants, Inc.(4) | | Beverage, Food and Tobacco | | Senior Loan | | 10/2019 | | 7.6 | | | 4,941 |
| | 4,941 |
|
| Rug Doctor LLC | | Personal and Non Durable Consumer Products (Mfg. Only) | | Senior Loan | | 04/2019 | | 7.6 | | | 991 |
| | 991 |
|
| Rug Doctor LLC | | Personal and Non Durable Consumer Products (Mfg. Only) | | Senior Loan | | 04/2019 | | 7.6 | | | 5,061 |
| | 5,061 |
|
| Sage Dental Management, LLC | | Healthcare, Education and Childcare | | Senior Loan | | 12/2020 | | 8.4 | | | 70 |
| | 64 |
|
| Sage Dental Management, LLC | | Healthcare, Education and Childcare | | Senior Loan | | 12/2020 | | 8.4 | | | 4,345 |
| | 3,997 |
|
| Sage Dental Management, LLC | | Healthcare, Education and Childcare | | Senior Loan | | 12/2020 | | 8.4 | | | 45 |
| | 42 |
|
| Sage Dental Management, LLC | | Healthcare, Education and Childcare | | Senior Loan | | 12/2020 | | 8.4 | | | 64 |
| | 59 |
|
Saldon Holdings, Inc. (4) | | Diversified/Conglomerate Service | | Senior Loan | | 09/2022 | | 6.4 | | | 2,354 |
| | 2,342 |
|
SEI, Inc.(4) | | Electronics | | Senior Loan | | 07/2023 | | 7.5 | | | 13,716 |
| | 13,716 |
|
Self Esteem Brands, LLC(4) | | Leisure, Amusement, Motion Pictures, Entertainment | | Senior Loan | | 02/2020 | | 7.0 | | | 10,142 |
| | 10,142 |
|
| Teasdale Quality Foods, Inc. | | Grocery | | Senior Loan | | 10/2020 | | 6.9 | | | 4,507 |
| | 4,416 |
|
| Teasdale Quality Foods, Inc. | | Grocery | | Senior Loan | | 10/2020 | | 6.9 | | | 486 |
| | 476 |
|
| Teasdale Quality Foods, Inc. | | Grocery | | Senior Loan | | 10/2020 | | 7.1 | | | 650 |
| | 637 |
|
| Teasdale Quality Foods, Inc. | | Grocery | | Senior Loan | | 10/2020 | | 7.1 | | | 239 |
| | 235 |
|
| Teasdale Quality Foods, Inc. | | Grocery | | Senior Loan | | 10/2020 | | 6.9 | | | 3,532 |
| | 3,460 |
|
| Upstream Intermediate, LLC | | Healthcare, Education and Childcare | | Senior Loan | | 01/2024 | | 6.6 | | | 2,830 |
| | 2,830 |
|
| W3 Co. | | Oil and Gas | | Senior Loan | | 03/2022 | | 8.2 | | | 1,253 |
| | 1,251 |
|
WHCG Management, LLC(4) | | Healthcare, Education and Childcare | | Senior Loan | | 03/2023 | | 7.4 | | | 7,900 |
| | 7,900 |
|
WIRB-Copernicus Group, Inc.(4) | | Healthcare, Education and Childcare | | Senior Loan | | 08/2022 | | 6.5 | | | 5,609 |
| | 5,609 |
|
| Total senior loan investments | | | | | | | | | | | $ | 183,668 |
| | $ | 178,053 |
|
| | | | | | | | | | | | | | |
Payless ShoeSource, Inc. (6)(7) | | Retail Stores | | LLC interest | | N/A | | N/A | | | 35 |
| | $ | 54 |
|
W3 Co. (6)(7) | | Oil and Gas | | LLC units | | N/A | | N/A | | | 3 |
| | 1,073 |
|
| Total equity investments | | | | | | | | | | | | | $ | 1,127 |
|
| | | | | | | | | | | | | | |
| Total investments | | | | | | | | | | | $ | 183,668 |
| | $ | 179,180 |
|
Golub Capital BDC, Inc. and Subsidiaries
Notes to Consolidated Financial Statements
(In thousands, except shares and per share data)
|
| | | | | | | | | | | | | | | | | | |
| Note 4. Investments - (continued) |
| SLF Loan Portfolio as of September 30, 2016 – (continued) |
| Portfolio Company | | Business Description | | Security Type | | Maturity Date | | Current Interest Rate(1) | | Principal/ Par Amount | | Fair Value(2) |
| Smashburger Finance LLC | | Beverage, Food and Tobacco | | Senior loan | | 05/2018 | | 6.8 |
| % | | $ | 951 |
| | $ | 932 |
|
| Smashburger Finance LLC | | Beverage, Food and Tobacco | | Senior loan | | 05/2018 | | 6.8 |
| | | 75 |
| | 74 |
|
| Smashburger Finance LLC | | Beverage, Food and Tobacco | | Senior loan | | 05/2018 | | 6.8 |
| | | 75 |
| | 73 |
|
| Smashburger Finance LLC | | Beverage, Food and Tobacco | | Senior loan | | 05/2018 | | 6.8 |
| | | 75 |
| | 73 |
|
| Smashburger Finance LLC | | Beverage, Food and Tobacco | | Senior loan | | 05/2018 | | 6.8 |
| | | 75 |
| | 73 |
|
Smashburger Finance LLC(4) | | Beverage, Food and Tobacco | | Senior loan | | 05/2018 | | N/A |
| (5) | | — |
| | (2 | ) |
Systems Maintenance Services Holding, Inc.(3) | | Electronics | | Senior loan | | 10/2019 | | 5.0 |
| | | 2,396 |
| | 2,396 |
|
Tate's Bake Shop, Inc.(3) | | Beverage, Food and Tobacco | | Senior loan | | 08/2019 | | 6.0 |
| | | 2,955 |
| | 2,955 |
|
| Teasdale Quality Foods, Inc. | | Grocery | | Senior loan | | 10/2020 | | 5.3 |
| | | 4,582 |
| | 4,566 |
|
Transaction Data Systems, Inc.(3) | | Diversified/Conglomerate Service | | Senior loan | | 06/2021 | | 6.3 |
| | | 5,260 |
| | 5,260 |
|
| Transaction Data Systems, Inc. | | Diversified/Conglomerate Service | | Senior loan | | 06/2020 | | 5.5 |
| | | 9 |
| | 8 |
|
| W3 Co. | | Oil and Gas | | Senior loan | | 03/2020 | | 5.8 |
| | | 2,924 |
| | 2,295 |
|
| Worldwide Express Operations, LLC | | Cargo Transport | | Senior loan | | 07/2019 | | 6.0 |
| | | 4,869 |
| | 4,869 |
|
| Worldwide Express Operations, LLC | | Cargo Transport | | Senior loan | | 07/2019 | | 6.0 |
| | | 100 |
| | 100 |
|
Young Innovations, Inc.(3) | | Healthcare, Education and Childcare | | Senior loan | | 01/2019 | | 5.3 |
| | | 3,804 |
| | 3,818 |
|
Young Innovations, Inc.(3) | | Healthcare, Education and Childcare | | Senior loan | | 01/2018 | | 6.8 |
| | | 122 |
| | 118 |
|
| Zest Holdings, LLC | | Healthcare, Education and Childcare | | Senior loan | | 08/2020 | | 5.8 |
| | | 5,282 |
| | 5,282 |
|
| | | | | | | | | | | | $ | 331,473 |
| | $ | 323,510 |
|
| |
(1) | Represents the weighted average annual current interest rate as of September 30, 2016. All interest rates are payable in cash.2018. |
| |
(2) | The total principal amount is presented for debt investments while the number of shares or units owned is presented for equity investments. |
| |
(3) | Represents the fair value in accordance with ASC Topic 820. The determination of such fair value is not included in the Board's valuation process described elsewhere herein. |
| |
(3)(4)
| The Company also holds a portion of the first lien senior secured loan in this portfolio company. |
| |
(4)
| The negative fair value is the result of the unfunded commitment being valued below par. |
| |
(5) | The entire commitmentLoan was unfunded aton non-accrual status as of September 30, 2016.2018. As such, no interest is being earned on this investment. |
| |
(6) | Loan was on non-accrual statusEquity investment received as a result of September 30, 2016, meaning that SLF has ceased recognizing interest income on the loan.portfolio company's debt restructuring. |
Golub Capital BDC, Inc. and Subsidiaries
Notes to Consolidated Financial Statements
(In thousands, except shares and per share data)
Note 4. Investments – (continued)
|
| | | | | | | | | | | | | | | | | | |
| SLF Loan Portfolio as of September 30, 2015 |
| Portfolio Company | | Business Description | | Security Type | | Maturity Date | | Current Interest Rate(1) | | Principal/ Par Amount | | Fair Value(2) |
| 1011778 B.C. ULC (New Red Finance/Burger King) | | Beverage, Food and Tobacco | | Senior loan | | 12/2021 | | 3.8 |
| % | | $ | 2,271 |
| | $ | 2,264 |
|
5.11, Inc.(3) | | Textiles and Leather | | Senior loan | | 02/2020 | | 6.0 |
| | | 3,162 |
| | 3,172 |
|
| Acosta, Inc. | | Diversified/Conglomerate Service | | Senior loan | | 09/2021 | | 4.3 |
| | | 2,978 |
| | 2,938 |
|
| ACTIVE Network, Inc. | | Electronics | | Senior loan | | 11/2020 | | 5.5 |
| | | 1,965 |
| | 1,951 |
|
| Aderant North America, Inc. | | Diversified/Conglomerate Service | | Senior loan | | 12/2018 | | 5.3 |
| | | 4,195 |
| | 4,195 |
|
| Advanced Pain Management Holdings, Inc. | | Healthcare, Education and Childcare | | Senior loan | | 02/2018 | | 6.3 |
| | | 6,946 |
| | 6,807 |
|
| Advanced Pain Management Holdings, Inc. | | Healthcare, Education and Childcare | | Senior loan | | 02/2018 | | 6.3 |
| | | 475 |
| | 460 |
|
Advanced Pain Management Holdings, Inc.(4) | | Healthcare, Education and Childcare | | Senior loan | | 02/2018 | | N/A |
| (5) | | — |
| | (23 | ) |
| Affordable Care Inc. | | Personal, Food and Miscellaneous
Services | | Senior loan | | 12/2018 | | 5.5 |
| | | 3,976 |
| | 3,976 |
|
| Aimbridge Hospitality, LLC | | Hotels, Motels, Inns, and Gaming | | Senior loan | | 10/2018 | | 5.8 |
| | | 5,204 |
| | 5,204 |
|
| ARG IH Corporation | | Beverage, Food and Tobacco | | Senior loan | | 11/2020 | | 4.8 |
| | | 4,370 |
| | 4,385 |
|
Arise Virtual Solutions, Inc.(3)(4) | | Telecommunications | | Senior loan | | 12/2018 | | N/A |
| (5) | | — |
| | (23 | ) |
Arise Virtual Solutions, Inc.(3) | | Telecommunications | | Senior loan | | 12/2018 | | 6.8 |
| | | 11,729 |
| | 11,494 |
|
Atkins Nutritionals, Inc(3) | | Beverage, Food and Tobacco | | Senior loan | | 01/2019 | | 6.3 |
| | | 5,872 |
| | 5,879 |
|
| Atrium Innovations | | Personal and Non Durable Consumer
Products | | Senior loan | | 02/2021 | | 4.3 |
| | | 3,520 |
| | 3,336 |
|
| BJ’s Wholesale Club, Inc. | | Retail Stores | | Senior loan | | 09/2019 | | 4.5 |
| | | 2,957 |
| | 2,934 |
|
| BMC Software, Inc. | | Electronics | | Senior loan | | 09/2020 | | 5.0 |
| | | 1,895 |
| | 1,729 |
|
| Brickman Group Ltd. LLC | | Farming and Agriculture | | Senior loan | | 12/2020 | | 4.0 |
| | | 1,980 |
| | 1,954 |
|
| C.B. Fleet Company, Incorporated | | Personal and Non Durable Consumer
Products | | Senior loan | | 10/2020 | | 5.4 |
| | | 5,630 |
| | 5,630 |
|
| C.B. Fleet Company, Incorporated | | Personal and Non Durable Consumer
Products | | Senior loan | | 10/2020 | | 5.4 |
| | | 696 |
| | 696 |
|
| CLP Healthcare Services, Inc. | | Healthcare, Education and Childcare | | Senior loan | | 12/2020 | | 5.8 |
| | | 4,417 |
| | 4,401 |
|
| Connect Merger Sub, Inc. | | Telecommunications | | Senior loan | | 04/2020 | | 4.8 |
| | | 3,935 |
| | 3,820 |
|
CPI Buyer, LLC (Cole-Parmer)(3) | | Healthcare, Education and Childcare | | Senior loan | | 08/2021 | | 5.5 |
| | | 5,955 |
| | 5,925 |
|
Curo Health Services LLC(3) | | Healthcare, Education and Childcare | | Senior loan | | 02/2022 | | 6.5 |
| | | 5,970 |
| | 5,990 |
|
| DentMall MSO, LLC | | Retail Stores | | Senior loan | | 07/2019 | | 6.0 |
| | | 10,251 |
| | 10,046 |
|
| DentMall MSO, LLC | | Retail Stores | | Senior loan | | 07/2019 | | 6.0 |
| | | 1,000 |
| | 946 |
|
| Dialysis Newco, Inc. | | Healthcare, Education and Childcare | | Senior loan | | 04/2021 | | 4.5 |
| | | 2,469 |
| | 2,470 |
|
| DISA Holdings Acquisition Subsidiary Corp. | | Diversified/Conglomerate Service | | Senior loan | | 12/2020 | | 5.5 |
| | | 4,614 |
| | 4,384 |
|
| DISA Holdings Acquisition Subsidiary Corp. | | Diversified/Conglomerate Service | | Senior loan | | 12/2020 | | 6.8 |
| | | 96 |
| | 43 |
|
EAG, INC. (Evans Analytical
Group) | | Diversified/Conglomerate Service | | Senior loan | | 07/2017 | | 5.0 |
| | | 2,245 |
| | 2,245 |
|
| Extreme Reach Inc. | | Broadcasting and Entertainment | | Senior loan | | 01/2020 | | 6.8 |
| | | 5,612 |
| | 5,591 |
|
| Federal-Mogul Corporation | | Automobile | | Senior loan | | 04/2021 | | 4.8 |
| | | 3,960 |
| | 3,769 |
|
GSDM Holdings Corp.(3) | | Healthcare, Education and Childcare | | Senior loan | | 06/2019 | | 5.3 |
| | | 1,782 |
| | 1,782 |
|
Hygenic Corporation, The(3) | | Personal and Non Durable Consumer
Products | | Senior loan | | 10/2020 | | 6.0 |
| | | 4,515 |
| | 4,515 |
|
Integrated Supply Network, LLC(3) | | Automobile | | Senior loan | | 02/2020 | | 6.3 |
| | | 12,000 |
| | 12,000 |
|
Integrated Supply Network, LLC(3) | | Automobile | | Senior loan | | 02/2020 | | 6.9 |
| | | 734 |
| | 734 |
|
| Joerns Healthcare, LLC | | Healthcare, Education and Childcare | | Senior loan | | 05/2020 | | 6.2 |
| | | 9,696 |
| | 9,647 |
|
| Julio & Sons Company | | Beverage, Food and Tobacco | | Senior loan | | 09/2017 | | 6.5 |
| | | 6,906 |
| | 6,906 |
|
| Julio & Sons Company | | Beverage, Food and Tobacco | | Senior loan | | 09/2017 | | 6.5 |
| | | 254 |
| | 254 |
|
|
| | | | | | | | | | | | | | | | | | |
| SLF Investment Portfolio as of September 30, 2017 |
| Portfolio Company | | Business Description | | Security Type | | Maturity Date | | Current Interest Rate(1) | | Principal ($) / Shares (2) | | Fair Value(3) |
| 1A Smart Start LLC | | Home and Office Furnishings, Housewares, and Durable Consumer | | Senior loan | | 02/2022 | | 6.1 |
| % | | $ | 2,094 |
| | $ | 2,105 |
|
| 1A Smart Start LLC | | Home and Office Furnishings, Housewares, and Durable Consumer | | Senior loan | | 02/2022 | | 5.8 |
| | | 928 |
| | 928 |
|
| Advanced Pain Management Holdings, Inc. | | Healthcare, Education and Childcare | | Senior loan | | 02/2018 | | 6.3 |
| | | 6,805 |
| | 5,784 |
|
| Advanced Pain Management Holdings, Inc. | | Healthcare, Education and Childcare | | Senior loan | | 02/2018 | | 6.3 |
| | | 466 |
| | 396 |
|
| Argon Medical Devices, Inc. | | Healthcare, Education and Childcare | | Senior loan | | 12/2021 | | 6.0 |
| | | 3,184 |
| | 3,184 |
|
Arise Virtual Solutions, Inc. (4) | | Telecommunications | | Senior loan | | 12/2018 | | 7.3 |
| | | 9,856 |
| | 9,856 |
|
| Boot Barn, Inc. | | Retail Stores | | Senior loan | | 06/2021 | | 5.8 |
| | | 10,073 |
| | 10,073 |
|
| Brandmuscle, Inc. | | Printing and Publishing | | Senior loan | | 12/2021 | | 6.1 |
| | | 4,851 |
| | 4,845 |
|
| CLP Healthcare Services, Inc. | | Healthcare, Education and Childcare | | Senior loan | | 12/2020 | | 6.6 |
| | | 8,590 |
| | 8,418 |
|
| CLP Healthcare Services, Inc. | | Healthcare, Education and Childcare | | Senior loan | | 12/2020 | | 6.6 |
| | | 4,328 |
| | 4,242 |
|
| Community Veterinary Partners, LLC | | Personal, Food and Miscellaneous Services | | Senior loan | | 10/2021 | | 6.8 |
| | | 2,442 |
| | 2,442 |
|
| Community Veterinary Partners, LLC | | Personal, Food and Miscellaneous Services | | Senior loan | | 10/2021 | | 6.8 |
| | | 1,227 |
| | 1,227 |
|
| Community Veterinary Partners, LLC | | Personal, Food and Miscellaneous Services | | Senior loan | | 10/2021 | | 6.8 |
| | | 59 |
| | 59 |
|
| Community Veterinary Partners, LLC | | Personal, Food and Miscellaneous Services | | Senior loan | | 10/2021 | | 6.8 |
| | | 41 |
| | 41 |
|
Curo Health Services LLC (4) | | Healthcare, Education and Childcare | | Senior loan | | 02/2022 | | 5.3 |
| | | 5,850 |
| | 5,867 |
|
| DISA Holdings Acquisition Subsidiary Corp. | | Diversified/Conglomerate Service | | Senior loan | | 12/2020 | | 5.5 |
| | | 4,401 |
| | 4,401 |
|
| DISA Holdings Acquisition Subsidiary Corp. | | Diversified/Conglomerate Service | | Senior loan | | 12/2020 | | 5.6 |
| | | 428 |
| | 428 |
|
| EAG, INC. | | Diversified/Conglomerate Service | | Senior loan | | 07/2018 | | 5.5 |
| | | 1,964 |
| | 1,964 |
|
| Encore GC Acquisition, LLC | | Healthcare, Education and Childcare | | Senior loan | | 01/2020 | | 6.8 |
| | | 4,725 |
| | 4,725 |
|
| Flexan, LLC | | Chemicals, Plastics and Rubber | | Senior loan | | 02/2020 | | 7.1 |
| | | 6,029 |
| | 6,029 |
|
| Flexan, LLC | | Chemicals, Plastics and Rubber | | Senior loan | | 02/2020 | | 7.1 |
| | | 1,686 |
| | 1,686 |
|
Flexan, LLC (4) | | Chemicals, Plastics and Rubber | | Senior loan | | 02/2020 | | 8.8 |
| | | 47 |
| | 47 |
|
Gamma Technologies, LLC (4) | | Electronics | | Senior loan | | 06/2021 | | 6.0 |
| | | 10,264 |
| | 10,264 |
|
| Harvey Tool Company, LLC | | Diversified/Conglomerate Manufacturing | | Senior loan | | 03/2020 | | 6.1 |
| | | 3,064 |
| | 3,064 |
|
| III US Holdings, LLC | | Diversified/Conglomerate Service | | Senior loan | | 09/2022 | | 7.9 |
| | | 5,044 |
| | 5,044 |
|
| Jensen Hughes, Inc. | | Buildings and Real Estate | | Senior loan | | 12/2021 | | 6.3 |
| | | 2,293 |
| | 2,293 |
|
| Jensen Hughes, Inc. | | Buildings and Real Estate | | Senior loan | | 12/2021 | | 6.4 |
| | | 102 |
| | 102 |
|
| Jensen Hughes, Inc. | | Buildings and Real Estate | | Senior loan | | 12/2021 | | 6.4 |
| | | 64 |
| | 64 |
|
Joerns Healthcare, LLC (4) | | Healthcare, Education and Childcare | | Senior loan | | 05/2020 | | 7.8 |
| | | 8,745 |
| | 8,202 |
|
| Julio & Sons Company | | Beverage, Food and Tobacco | | Senior loan | | 12/2018 | | 6.7 |
| | | 6,762 |
| | 6,762 |
|
| Julio & Sons Company | | Beverage, Food and Tobacco | | Senior loan | | 12/2018 | | 6.7 |
| | | 2,226 |
| | 2,226 |
|
| Julio & Sons Company | | Beverage, Food and Tobacco | | Senior loan | | 12/2018 | | 6.7 |
| | | 822 |
| | 822 |
|
| Loar Group Inc. | | Aerospace and Defense | | Senior loan | | 01/2022 | | 6.0 |
| | | 2,164 |
| | 2,164 |
|
| Loar Group Inc. | | Aerospace and Defense | | Senior loan | | 01/2022 | | 6.0 |
| | | 1,492 |
| | 1,492 |
|
| Paradigm DKD Group, LLC | | Buildings and Real Estate | | Senior loan | | 11/2018 | | 6.2 |
| | | 1,977 |
| | 1,977 |
|
| Paradigm DKD Group, LLC | | Buildings and Real Estate | | Senior loan | | 11/2018 | | 6.2 |
| | | 596 |
| | 596 |
|
Park Place Technologies LLC (4) | | Electronics | | Senior loan | | 06/2022 | | 6.3 |
| | | 5,341 |
| | 5,287 |
|
| Pasternack Enterprises, Inc. and Fairview Microwave, Inc. | | Diversified/Conglomerate Manufacturing | | Senior loan | | 05/2022 | | 6.2 |
| | | 5,372 |
| | 5,372 |
|
| Payless ShoeSource, Inc. | | Retail Stores | | Senior loan | | 08/2022 | | 10.3 |
| | | 768 |
| | 757 |
|
| Polk Acquisition Corp. | | Automobile | | Senior loan | | 06/2022 | | 6.2 |
| | | 4,560 |
| | 4,469 |
|
Golub Capital BDC, Inc. and Subsidiaries
Notes to Consolidated Financial Statements
(In thousands, except shares and per share data)
|
| | | | | | | | | | | | | | | | | | |
| Note 4. Investments - (continued) |
| SLF Loan Portfolio as of September 30, 2015 – (continued) |
| Portfolio Company | | Business Description | | Security Type | | Maturity
Date | | Current
Interest
Rate(1) | | Principal/
Par
Amount | | Fair
Value(2) |
K&N Engineering, Inc.(3) | | Automobile | | Senior loan | | 07/2019 | | 5.3 |
| % | | $ | 3,865 |
| | $ | 3,749 |
|
K&N Engineering, Inc.(3) | | Automobile | | Senior loan | | 07/2019 | | 5.3 |
| | | 183 |
| | 177 |
|
K&N Engineering, Inc.(3)(4) | | Automobile | | Senior loan | | 07/2019 | | N/A |
| (5) | | — |
| | (6 | ) |
| Mister Car Wash Holdings, Inc. | | Automobile | | Senior loan | | 08/2021 | | 5.0 |
| | | 2,970 |
| | 2,971 |
|
National Veterinary Associates,
Inc. | | Personal, Food and Miscellaneous
Services | | Senior loan | | 08/2021 | | 4.8 |
| | | 990 |
| | 991 |
|
Netsmart Technologies, Inc.(3) | | Diversified/Conglomerate Service | | Senior loan | | 02/2019 | | 6.3 |
| | | 10,448 |
| | 10,448 |
|
Netsmart Technologies, Inc.(3) | | Diversified/Conglomerate Service | | Senior loan | | 02/2019 | | 7.5 |
| | | 231 |
| | 231 |
|
| Northwestern Management Services, LLC | | Healthcare, Education and Childcare | | Senior loan | | 10/2017 | | 6.3 |
| | | 3,912 |
| | 3,912 |
|
| Northwestern Management Services, LLC | | Healthcare, Education and Childcare | | Senior loan | | 10/2017 | | 7.0 |
| | | 147 |
| | 147 |
|
| Northwestern Management Services, LLC | | Healthcare, Education and Childcare | | Senior loan | | 10/2017 | | 6.3 |
| | | 47 |
| | 47 |
|
| Octane Fitness, LLC | | Leisure, Amusement, Motion Pictures,
Entertainment | | Senior loan | | 10/2018 | | 6.5 |
| | | 7,718 |
| | 7,718 |
|
| Paradigm DKD Group, LLC | | Buildings and Real Estate | | Senior loan | | 11/2018 | | 6.8 |
| | | 2,037 |
| | 2,037 |
|
| Paradigm DKD Group, LLC | | Buildings and Real Estate | | Senior loan | | 11/2018 | | 6.9 |
| | | 292 |
| | 292 |
|
| Pasternack Enterprises, Inc. | | Diversified/Conglomerate Manufacturing | | Senior loan | | 12/2017 | | 6.3 |
| | | 1,044 |
| | 1,044 |
|
| Payless ShoeSource, Inc. | | Retail Stores | | Senior loan | | 03/2021 | | 5.0 |
| | | 1,975 |
| | 1,580 |
|
PetVet Care Centers LLC(3) | | Personal, Food and Miscellaneous
Services | | Senior loan | | 12/2020 | | 5.5 |
| | | 5,955 |
| | 5,955 |
|
PetVet Care Centers LLC(3) | | Personal, Food and Miscellaneous
Services | | Senior loan | | 12/2020 | | 5.5 |
| | | 646 |
| | 646 |
|
PowerPlan Holdings, Inc.(3) | | Utilities | | Senior loan | | 02/2022 | | 6.3 |
| | | 12,000 |
| | 12,000 |
|
Premise Health Holding Corp.(3) | | Healthcare, Education and Childcare | | Senior loan | | 06/2020 | | 5.5 |
| | | 11,921 |
| | 11,921 |
|
Premise Health Holding Corp.(3) | | Healthcare, Education and Childcare | | Senior loan | | 06/2020 | | 5.5 |
| | | 283 |
| | 283 |
|
| R.G. Barry Corporation | | Personal, Food and Miscellaneous
Services | | Senior loan | | 09/2019 | | 6.0 |
| | | 6,272 |
| | 6,209 |
|
Reliant Pro ReHab, LLC(3) | | Healthcare, Education and Childcare | | Senior loan | | 06/2017 | | 6.0 |
| | | 4,225 |
| | 4,225 |
|
| Renaissance Pharma (U.S.) Holdings Inc. | | Healthcare, Education and Childcare | | Senior loan | | 05/2018 | | 5.0 |
| | | 3,758 |
| | 3,758 |
|
| Renaissance Pharma (U.S.) Holdings Inc. | | Healthcare, Education and Childcare | | Senior loan | | 05/2018 | | 6.3 |
| | | 71 |
| | 71 |
|
Rubio’s Restaurants, Inc(3) | | Retail Stores | | Senior loan | | 11/2018 | | 6.0 |
| | | 5,095 |
| | 5,095 |
|
Rug Doctor LLC(3) | | Personal and Non Durable Consumer
Products | | Senior loan | | 12/2016 | | 6.3 |
| | | 9,769 |
| | 9,769 |
|
Scientific Games International,
Inc. | | Hotels, Motels, Inns, and Gaming | | Senior loan | | 10/2020 | | 6.0 |
| | | 3,935 |
| | 3,891 |
|
| SEI, Inc. | | Electronics | | Senior loan | | 07/2021 | | 5.8 |
| | | 8,799 |
| | 8,711 |
|
Self Esteem Brands, LLC(3) | | Leisure, Amusement, Motion Pictures,
Entertainment | | Senior loan | | 02/2020 | | 5.0 |
| | | 7,930 |
| | 7,930 |
|
| Smashburger Finance LLC | | Beverage, Food and Tobacco | | Senior loan | | 05/2018 | | 6.3 |
| | | 960 |
| | 960 |
|
| Smashburger Finance LLC | | Beverage, Food and Tobacco | | Senior loan | | 05/2018 | | 6.3 |
| | | 75 |
| | 75 |
|
| Smashburger Finance LLC | | Beverage, Food and Tobacco | | Senior loan | | 05/2018 | | 6.3 |
| | | 75 |
| | 75 |
|
| Spear Education, LLC | | Healthcare, Education and Childcare | | Senior loan | | 08/2019 | | 6.0 |
| | | 5,960 |
| | 5,960 |
|
| Spear Education, LLC | | Healthcare, Education and Childcare | | Senior loan | | 08/2019 | | 6.0 |
| | | 500 |
| | 500 |
|
Syncsort Incorporated(3) | | Electronics | | Senior loan | | 03/2019 | | 5.8 |
| | | 8,860 |
| | 8,860 |
|
Systems Maintenance Services Holding, Inc.(3) | | Electronics | | Senior loan | | 10/2019 | | 5.0 |
| | | 2,415 |
| | 2,415 |
|
| Take 5 Oil Change, L.L.C. | | Automobile | | Senior loan | | 07/2018 | | 6.3 |
| | | 6,647 |
| | 6,647 |
|
| Take 5 Oil Change, L.L.C. | | Automobile | | Senior loan | | 07/2018 | | 6.3 |
| | | 187 |
| | 187 |
|
| Tate’s Bake Shop, Inc. | | Beverage, Food and Tobacco | | Senior loan | | 08/2019 | | 5.8 |
| | | 2,978 |
| | 2,978 |
|
| Teasdale Quality Foods, Inc. | | Grocery | | Senior loan | | 10/2020 | | 5.3 |
| | | 4,651 |
| | 4,651 |
|
|
| | | | | | | | | | | | | | | | | | |
| SLF Investment Portfolio as of September 30, 2017 - (continued) |
| Portfolio Company | | Business Description | | Security Type | | Maturity Date | | Current Interest Rate(1) | | Principal ($) / Shares (2) | | Fair Value(3) |
| Polk Acquisition Corp. | | Automobile | | Senior loan | | 06/2022 | | 6.7 |
| % | | $ | 83 |
| | $ | 81 |
|
| Polk Acquisition Corp. | | Automobile | | Senior loan | | 06/2022 | | 6.2 |
| | | 53 |
| | 52 |
|
PowerPlan Holdings, Inc. (4) | | Utilities | | Senior loan | | 02/2022 | | 6.5 |
| | | 11,365 |
| | 11,365 |
|
Premise Health Holding Corp. (4) | | Healthcare, Education and Childcare | | Senior loan | | 06/2020 | | 5.8 |
| | | 11,772 |
| | 11,772 |
|
| Pyramid Healthcare, Inc. | | Healthcare, Education and Childcare | | Senior loan | | 08/2019 | | 7.7 |
| | | 9,738 |
| | 9,738 |
|
| Pyramid Healthcare, Inc. | | Healthcare, Education and Childcare | | Senior loan | | 08/2019 | | 7.9 |
| | | 597 |
| | 597 |
|
| R.G. Barry Corporation | | Personal, Food and Miscellaneous Services | | Senior loan | | 09/2019 | | 6.2 |
| | | 5,217 |
| | 5,217 |
|
Radiology Partners, Inc. (4) | | Healthcare, Education and Childcare | | Senior loan | | 09/2020 | | 7.1 |
| | | 7,793 |
| | 7,793 |
|
Radiology Partners, Inc. (4) | | Healthcare, Education and Childcare | | Senior loan | | 09/2020 | | 7.1 |
| | | 595 |
| | 595 |
|
Radiology Partners, Inc. (4) | | Healthcare, Education and Childcare | | Senior loan | | 09/2020 | | 7.1 |
| | | 505 |
| | 505 |
|
Reliant Pro ReHab, LLC (4) | | Healthcare, Education and Childcare | | Senior loan | | 12/2017 | | 6.3 |
| | | 3,240 |
| | 3,240 |
|
RSC Acquisition, Inc. (4) | | Insurance | | Senior loan | | 11/2022 | | 6.6 |
| | | 3,864 |
| | 3,864 |
|
| RSC Acquisition, Inc. | | Insurance | | Senior loan | | 11/2020 | | 6.1 |
| | | 15 |
| | 15 |
|
Rubio's Restaurants, Inc. (4) | | Beverage, Food and Tobacco | | Senior loan | | 11/2018 | | 6.1 |
| | | 4,992 |
| | 4,992 |
|
| Rug Doctor LLC | | Personal and Non Durable Consumer Products (Mfg. Only) | | Senior loan | | 06/2018 | | 6.6 |
| | | 5,792 |
| | 5,792 |
|
| Sage Dental Management, LLC | | Healthcare, Education and Childcare | | Senior loan | | 10/2019 | | 7.0 |
| | | 4,782 |
| | 4,686 |
|
| Sage Dental Management, LLC | | Healthcare, Education and Childcare | | Senior loan | | 10/2019 | | 7.8 |
| | | 70 |
| | 69 |
|
| Sage Dental Management, LLC | | Healthcare, Education and Childcare | | Senior loan | | 10/2019 | | 7.0 |
| | | 50 |
| | 49 |
|
| Sage Dental Management, LLC | | Healthcare, Education and Childcare | | Senior loan | | 10/2019 | | 8.8 |
| | | 34 |
| | 33 |
|
Saldon Holdings, Inc. (4) | | Diversified/Conglomerate Service | | Senior loan | | 09/2022 | | 5.8 |
| | | 2,521 |
| | 2,490 |
|
| Sarnova HC, LLC | | Healthcare, Education and Childcare | | Senior loan | | 01/2022 | | 6.0 |
| | | 3,684 |
| | 3,684 |
|
| SEI, Inc. | | Electronics | | Senior loan | | 07/2021 | | 6.0 |
| | | 13,820 |
| | 13,820 |
|
Self Esteem Brands, LLC (4) | | Leisure, Amusement, Motion Pictures, Entertainment | | Senior loan | | 02/2020 | | 6.0 |
| | | 11,313 |
| | 11,313 |
|
Severin Acquisition, LLC (4) | | Diversified/Conglomerate Service | | Senior loan | | 07/2021 | | 6.1 |
| | | 4,832 |
| | 4,830 |
|
| Severin Acquisition, LLC | | Diversified/Conglomerate Service | | Senior loan | | 07/2021 | | 6.0 |
| | | 5,290 |
| | 5,265 |
|
| Severin Acquisition, LLC | | Diversified/Conglomerate Service | | Senior loan | | 07/2021 | | 6.2 |
| | | 668 |
| | 670 |
|
Severin Acquisition, LLC (5) | | Diversified/Conglomerate Service | | Senior loan | | 07/2021 | | N/A |
| (6) | | — |
| | (1 | ) |
| Smashburger Finance LLC | | Beverage, Food and Tobacco | | Senior loan | | 05/2018 | | 6.8 |
| | | 867 |
| | 754 |
|
| Smashburger Finance LLC | | Beverage, Food and Tobacco | | Senior loan | | 05/2018 | | 6.8 |
| | | 68 |
| | 60 |
|
| Smashburger Finance LLC | | Beverage, Food and Tobacco | | Senior loan | | 05/2018 | | 6.8 |
| | | 68 |
| | 59 |
|
| Smashburger Finance LLC | | Beverage, Food and Tobacco | | Senior loan | | 05/2018 | | 6.8 |
| | | 68 |
| | 59 |
|
| Smashburger Finance LLC | | Beverage, Food and Tobacco | | Senior loan | | 05/2018 | | 6.8 |
| | | 68 |
| | 59 |
|
Smashburger Finance LLC (5) | | Beverage, Food and Tobacco | | Senior loan | | 05/2018 | | N/A |
| (6) | | — |
| | (15 | ) |
Stomatcare DSO, LLC (7) | | Healthcare, Education and Childcare | | Senior loan | | 05/2022 | | 6.2% PIK | | 625 |
| | 329 |
|
Tate's Bake Shop, Inc. (4) | | Beverage, Food and Tobacco | | Senior loan | | 08/2019 | | 6.3 |
| | | 2,926 |
| | 2,926 |
|
| Teasdale Quality Foods, Inc. | | Grocery | | Senior loan | | 10/2020 | | 5.5 |
| | | 4,553 |
| | 4,553 |
|
| Teasdale Quality Foods, Inc. | | Grocery | | Senior loan | | 10/2020 | | 6.1 |
| | | 3,567 |
| | 3,567 |
|
| Teasdale Quality Foods, Inc. | | Grocery | | Senior loan | | 10/2020 | | 6.1 |
| | | 687 |
| | 687 |
|
| Teasdale Quality Foods, Inc. | | Grocery | | Senior loan | | 10/2020 | | 6.0 |
| | | 514 |
| | 514 |
|
| Teasdale Quality Foods, Inc. | | Grocery | | Senior loan | | 10/2020 | | 6.1 |
| | | 252 |
| | 252 |
|
| Transaction Data Systems, Inc. | | Diversified/Conglomerate Service | | Senior loan | | 06/2021 | | 6.6 |
| | | 7,393 |
| | 7,393 |
|
| Transaction Data Systems, Inc. | | Diversified/Conglomerate Service | | Senior loan | | 06/2020 | | 5.8 |
| | | 22 |
| | 21 |
|
| W3 Co. | | Oil and Gas | | Senior loan | | 03/2022 | | 7.2 |
| | | 1,266 |
| | 1,269 |
|
WHCG Management, LLC (4) | | Healthcare, Education and Childcare | | Senior loan | | 03/2023 | | 6.1 |
| | | 7,980 |
| | 7,980 |
|
Golub Capital BDC, Inc. and Subsidiaries
Notes to Consolidated Financial Statements
(In thousands, except shares and per share data)
|
| | | | | | | | | | | | | | | | | | |
| Note 4. Investments - (continued) |
| SLF Loan Portfolio as of September 30, 2015 – (continued) |
| Portfolio Company | | Business Description | | Security Type | | Maturity
Date | | Current
Interest
Rate(1) | | Principal/
Par
Amount | | Fair
Value(2) |
| Transaction Data Systems, Inc. | | Diversified/Conglomerate Service | | Senior loan | | 06/2021 | | 5.5 |
| % | | $ | 4,545 |
| | $ | 4,545 |
|
| W3 Co. | | Oil and Gas | | Senior loan | | 03/2020 | | 5.8 |
| | | 2,954 |
| | 2,516 |
|
WII Components, Inc.(3) | | Home and Office Furnishings,
Housewares, and Durable Consumer | | Senior loan | | 07/2018 | | 5.3 |
| | | 3,008 |
| | 3,008 |
|
Young Innovations, Inc.(3) | | Healthcare, Education and Childcare | | Senior loan | | 01/2019 | | 5.3 |
| | | 4,018 |
| | 4,018 |
|
| | | | | | | | | | | | $ | 320,583 |
| | $ | 317,623 |
|
|
| | | | | | | | | | | | | | | | | | |
| SLF Investment Portfolio as of September 30, 2017 - (continued) |
| Portfolio Company | | Business Description | | Security Type | | Maturity Date | | Current Interest Rate(1) | | Principal ($) / Shares (2) | | Fair Value(3) |
| WIRB-Copernicus Group, Inc. | | Healthcare, Education and Childcare | | Senior loan | | 08/2022 | | 6.3 |
| | | 5,666 |
| | 5,666 |
|
Young Innovations, Inc. (4) | | Healthcare, Education and Childcare | | Senior loan | | 01/2019 | | 6.3 |
| | | 10,369 |
| | 10,369 |
|
Young Innovations, Inc. (4) | | Healthcare, Education and Childcare | | Senior loan | | 01/2019 | | 6.3 |
| | | 209 |
| | 209 |
|
| Total senior loan investments | | | | | | | | | | | $ | 301,583 |
| | $ | 298,941 |
|
| | | | | | | | | | | | | | |
Payless ShoeSource, Inc. (8)(9) | | Retail Stores | | LLC interest | | N/A | | N/A |
| | | 35 |
| | $ | 843 |
|
W3 Co. (8)(9) | | Oil and Gas | | LLC units | | N/A | | N/A |
| | | 3 |
| | 1,146 |
|
| Total equity investments | | | | | | | | | | | | | $ | 1,989 |
|
| | | | | | | | | | | | | | |
| Total investments | | | | | | | | | | | $ | 301,583 |
| | $ | 300,930 |
|
| |
(1) | Represents the weighted average annual current interest rate as of September 30, 2015. All interest rates are payable in cash.2017. |
| |
(2) | The total principal amount is presented for debt investments while the number of shares or units owned is presented for equity investments. |
| |
(3) | Represents the fair value in accordance with ASC Topic 820. The determination of such fair value is not included in the Board’sBoard's valuation process described elsewhere herein. |
| |
(3)(4)
| The Company also heldhold a portion of the first lien senior secured loan in this portfolio company as of September 30, 2015.company. |
| |
(4)(5)
| The negative fair value is the result of the unfunded commitment being valued below par. |
| |
(5)(6)
| The entire commitment was unfunded atas of September 30, 2015.2017. As such, no interest is being earned on this investment. |
| |
(7) | Loan was on non-accrual status as of September 30, 2017, meaning that SLF has ceased recognizing interest income on the loan. |
| |
(8) | Equity investment received as a result of the portfolio company's debt restructuring. |
The
As of September 30, 2018, the Company has committed to fund $140,000 of subordinated notes and $35,000$175,000 of LLC equity interest subscriptions to SLF. The amortized cost, net of principal repayments that are subject to recall, and fair value of the subordinated notes held by the Company was $77,301 and $77,301, respectively, as of September 30, 2016, and $76,563 and $76,563, respectively, as of September 30, 2015. As of September 30, 2016, the subordinated notes pay a weighted average interest rate of three-month LIBOR plus 8.0%. For the years ended September 30, 20162018 and 2015, the Company earned interest income on the subordinated notes of $6,9392017, $75,407 and $3,735, respectively.
As of September 30, 2016 and 2015, $31,339 and $23,222,$97,457, respectively, of the Company’s LLC equity interest subscriptions to SLF had been called and contributed, net of return of capital distributions subject to recall. For the years ended September 30, 20162018 and 2015,2017, the Company received $4,099$8,099 and $1,350$4,929, respectively, in dividend income from the SLF LLC equity interests.interest.
The subordinated notes, previously issued by SLF to the Company and RGA were redeemed and terminated on December 30, 2016. For the years ended September 30, 2018 and 2017, the Company earned interest income on the subordinated notes of $0 and $1,639, respectively.
Golub Capital BDC, Inc. and Subsidiaries
Notes to Consolidated Financial Statements
(In thousands, except shares and per share data)
Note 4. Investments – (continued)
See below for certain summarized financial information for SLF as of and for the yearyears ended September 30, 20162018 and 2015.2017:
| | | | As of September 30, | As of | | As of |
| | 2016 | | 2015 | September 30, 2018 | | September 30, 2017 |
| Selected Balance Sheet Information: | |
| | |
| |
| | |
|
| Investments, at fair value | $ | 323,510 |
| | $ | 317,623 |
| $ | 179,180 |
| | $ | 300,930 |
|
Cash and other assets (1) | 7,281 |
| | 5,772 |
| 7,127 |
| | 5,305 |
|
| Receivable from investments sold | 1,995 |
| | — |
| 19 |
| | — |
|
Total assets (1) | $ | 332,786 |
| | $ | 323,395 |
| $ | 186,326 |
| | $ | 306,235 |
|
| Senior credit facility | $ | 214,050 |
| | $ | 212,300 |
| $ | 104,622 |
| | $ | 197,700 |
|
Unamortized debt issuance costs (1) | (949 | ) | | (2,464 | ) | (18 | ) | | (712 | ) |
| Other liabilities | 567 |
| | 489 |
| 484 |
| | 658 |
|
| Total liabilities | 213,668 |
| | 210,325 |
| 105,088 |
| | 197,646 |
|
| Subordinated notes and members’ equity | 119,118 |
| | 113,070 |
| |
| Members’ equity | | 81,238 |
| | 108,589 |
|
Total liabilities and members' equity (1) | $ | 332,786 |
| | $ | 323,395 |
| $ | 186,326 |
| | $ | 306,235 |
|
| |
(1)
| On October 1, 2015, SLF adopted ASU 2015-03 which requires that debt issuance costs related to recognized debt liability to be presented on the balance sheet as a direct deduction from the carrying amount of the debt liability rather than as an asset. Adoption of ASU 2015-03 requires the changes to be applied retrospectively. |
| | | | Years ended September 30, | Years ended September 30, |
| | 2016 | | 2015 | 2018 | | 2017 |
| Selected Statement of Operations Information: | |
| | |
| |
| | |
|
| Interest income | $ | 22,016 |
| | $ | 10,906 |
| $ | 18,285 |
| | $ | 21,455 |
|
| Fee income | 84 |
| | 4 |
| 202 |
| | 5 |
|
| Total investment income | 22,100 |
| | 10,910 |
| 18,487 |
| | 21,460 |
|
| Interest expense | 15,715 |
| | 7,701 |
| |
| Interest and other debt financing expense | | 6,687 |
| | 10,236 |
|
| Administrative service fee | 457 |
| | 249 |
| 404 |
| | 477 |
|
| Other expenses | 151 |
| | 103 |
| 93 |
| | 131 |
|
| Total expenses | 16,323 |
| | 8,053 |
| 7,184 |
| | 10,844 |
|
| Net investment income | 5,777 |
| | 2,857 |
| 11,303 |
| | 10,616 |
|
| Net realized gain (loss) on investments | (479 | ) | | 9 |
| — |
| | (7,379 | ) |
Net change in unrealized appreciation (depreciation) on investments, subordinated notes and secured borrowings | (4,685 | ) | | (2,206 | ) | |
| Net increase (decrease) in net assets | $ | 613 |
| | $ | 660 |
| |
| Net change in unrealized appreciation (depreciation) on investments | | (4,197 | ) | | 4,647 |
|
| Net increase (decrease) in members' equity | | $ | 7,106 |
| | $ | 7,884 |
|
Golub Capital BDC, Inc. and Subsidiaries
Notes to Consolidated Financial Statements
(In thousands, except shares and per share data)
Note 5. Transactions with Affiliated Companies
An affiliated company is generally a portfolio company in which the Company owns 5% or more of its voting securities. A controlled affiliate is generally a portfolio company in which the Company owns more than 25% of the portfolio company’s outstanding voting securities. Transactions related to investments with both controlled and non-controlled affiliates for the years ended September 30, 2016 and 2015 were as follows:
|
| | | | | | | | | | | | | | | | | | | | | | | | | | | | | | | | | | | | | | | | | | | | |
| For the year ended September 30, 2016 |
Portfolio
Company | | Fair value at September 30, 2015 | | Purchases(1)
(cost) | | Redemptions
(cost) | | Sales
(cost) | | Transfer in (out) (cost) | | Discount
accretion | | Net unrealized
gain/(loss) | | Fair value at September 30, 2016 | | Net realized gain/(loss) | | Interest and
fee income | | Dividend
income |
| Controlled Affiliates | | |
| | |
| | |
| | |
| | | | |
| | |
| | |
| | | | |
| | |
|
| Senior Loan Fund LLC* | | $ | 98,936 |
| | $ | 20,440 |
| | $ | (11,586 | ) | | $ | — |
| | $ | — |
| | $ | — |
| | $ | (3,562 | ) | | $ | 104,228 |
| | $ | — |
| | $ | 6,939 |
| | $ | 4,099 |
|
| Non-Controlled Affiliates | | | | | | | | | | | | | | | | |
| | | | |
| | |
|
Barcelona Restaurants, LLC(2) | | 5,523 |
| | — |
| | (1,995 | ) | | — |
| | (4,871 | ) | | — |
| | 1,343 |
| | — |
| | 2,722 |
| | — |
| | — |
|
Competitor Group, Inc.(3) | | — |
| | 289 |
| | — |
| | — |
| | 13,743 |
| | 99 |
| | (4,513 | ) | | 9,618 |
| | — |
| | 660 |
| | — |
|
Total Controlled and
Non-Controlled Affiliates | | $ | 104,459 |
| | $ | 20,729 |
| | $ | (13,581 | ) | | $ | — |
| | $ | 8,872 |
| | $ | 99 |
| | $ | (6,732 | ) | | $ | 113,846 |
| | $ | 2,722 |
| | $ | 7,599 |
| | $ | 4,099 |
|
|
| | |
* | | Together with RGA, the Company co-invests through SLF. SLF is capitalized as transactions are completed and all portfolio and investment decisions in respect to SLF must be approved by the SLF investment committee consisting of two representatives of the Company and RGA (with unanimous approval required from (i) one representative of each of the Company and RGA or (ii) both representatives of each of the Company and RGA). Therefore, although the Company owns more than 25% of the voting securities of SLF, the Company does not believe that it has control over SLF for purposes of the 1940 Act or otherwise. |
(1)
| Purchases at cost includes amounts related to PIK capitalized and added to the principal balance of the respective loans. |
(2)
| During the three months ended December 31, 2015, a portion of the Company's investment was sold diluting the Company's ownership to less than five percent of the portfolio company's voting securities. Effective as of and for periods subsequent to December 31, 2015, the Company no longer classified the portfolio company as a non-controlled affiliate company. |
(3)
| During the three months ended March 31, 2016, the Company's ownership increased to over five percent of the portfolio company's voting securities as a result of a partial debt to equity conversion. |
|
| | | | | | | | | | | | | | | | | | | | | | | | | | | | | | | | | | | | | | | | | | | | |
| For the year ended September 30, 2015 |
Portfolio
Company | | Fair value at September 30, 2014 | | Purchases(1)
(cost) | | Redemptions
(cost) | | Sales
(cost) | | Transfer in (out) (cost) | | Discount
accretion | | Net
unrealized
gain/(loss) | | Fair value at September 30, 2015 | | Net realized gain/(loss) | | Interest and
fee income | | Dividend
income |
| Controlled Affiliates | | |
| | |
| | |
| | |
| | | | |
| | |
| | |
| | | | |
| | |
|
| Senior Loan Fund LLC* | | $ | 34,831 |
| | $ | 64,878 |
| | $ | — |
| | $ | — |
| | $ | — |
| | $ | — |
| | $ | (773 | ) | | $ | 98,936 |
| | $ | — |
| | $ | 3,735 |
| | $ | 1,350 |
|
| Non-Controlled Affiliates | | | | | | | | | | | | | | | | |
| | | | |
| | |
|
| Barcelona Restaurants, LLC | | 3,080 |
| | — |
| | — |
| | — |
| | — |
| | — |
| | 2,443 |
| | 5,523 |
| | — |
| | — |
| | — |
|
Total Controlled and Non-Controlled Affiliates | | $ | 37,911 |
| | $ | 64,878 |
| | $ | — |
| | $ | — |
| | $ | — |
| | $ | — |
| | $ | 1,670 |
| | $ | 104,459 |
| | $ | — |
| | $ | 3,735 |
| | $ | 1,350 |
|
|
| | |
* | | Together with RGA, the Company co-invests through SLF. SLF is capitalized as transactions are completed and all portfolio and investment decisions in respect to SLF must be approved by the SLF investment committee consisting of two representatives of the Company and RGA (with unanimous approval required from (i) one representative of each of the Company and RGA or (ii) both representatives of each of the Company and RGA). Therefore, although the Company owns more than 25% of the voting securities of SLF, the Company does not believe that it has control over SLF for purposes of the 1940 Act or otherwise. |
(1)
| Purchases at cost includes amounts related to PIK capitalized and added to the principal balance of the respective loans. |
Golub Capital BDC, Inc. and Subsidiaries
Notes to Consolidated Financial Statements
(In thousands, except shares and per share data)
Note 6. Fair Value Measurements
The Company follows ASC Topic 820 for measuring fair value. Fair value is the price that would be received in the sale of an asset or paid to transfer a liability in an orderly transaction between market participants at the measurement date. Where available, fair value is based on observable market prices or parameters, or derived from such prices or parameters. Where observable prices or inputs are not available, valuation models are applied. These valuation models involve some level of management estimation and judgment, the degree of which is dependent on the price transparency for the assets or liabilities or market and the assets’ or liabilities’ complexity. The Company’s fair value analysis includes an analysis of the value of any unfunded loan commitments. Assets and liabilities are categorized for disclosure purposes based upon the level of judgment associated with the inputs used to measure their value. The valuation hierarchical levels are based upon the transparency of the inputs to the valuation of the asset or liability as of the measurement date. The three levels are defined as follows:
Level 1: Inputs are unadjusted, quoted prices in active markets for identical assets or liabilities at the measurement date.
Level 2: Inputs include quoted prices for similar assets or liabilities in active markets and inputs that are observable for the assets or liabilities, either directly or indirectly, for substantially the full term of the assets or liabilities.
Level 3:Inputs include significant unobservable inputs for the assets or liabilities and include situations where there is little, if any, market activity for the assets or liabilities. The inputs into the determination of fair value are based upon the best information available and may require significant management judgment or estimation.
In certain cases, the inputs used to measure fair value may fall into different levels of the fair value hierarchy. In such cases, an asset’s or a liability’s categorization within the fair value hierarchy is based on the lowest level of input that is significant to the fair value measurement. The Company’s assessment of the significance of a particular input to the fair value measurement in its entirety requires judgment and considers factors specific to the asset or liability. The Company assesses the levels of assets and liabilities at each measurement date, and transfers between levels are recognized on the actual date of the event or change in circumstances that caused the transfers. There were no transfers among Level 1, 2 and 3 of the fair value hierarchy for assets and liabilities during the years ended September 30, 2016, 20152018, 2017 and 2014.2016. The following section describes the valuation techniques used by the Company to measure different assets and liabilities at fair value and includes the level within the fair value hierarchy in which the assets and liabilities are categorized.
Investments
Level 1 investments are valued using quoted market prices. Level 2 investments are valued using market consensus prices that are corroborated by observable market data and quoted market prices for similar assets and liabilities. Level 3 investments are valued at fair value as determined in good faith by the Board, based on input of management, the audit committee and independent valuation firms that have been engaged at the direction of the Board to assist in the valuation of each portfolio investment without a readily available market quotation at least once during a trailing twelve-month period under a valuation policy and a consistently applied valuation process. This valuation process is conducted at the end of each fiscal quarter, with approximately 25% (based on the number of portfolio companies) of the Company’s valuations of debt and equity investments without readily available market quotations subject to review by an independent valuation firm. All investments as of September 30, 20162018 and 2015,2017, with the exception of money market funds included in cash, and cash equivalents and restricted cash and cash equivalents (Level 1 investments) and investments measured at fair value using the NAV, were valued using Level 3 inputs of the fair value hierarchy.inputs.
When determining fair value of Level 3 debt and equity investments, the Company may take into account the following factors, where relevant: the enterprise value of a portfolio company, the nature and realizable value of any
Golub Capital BDC, Inc. and Subsidiaries
Notes to Consolidated Financial Statements
(In thousands, except shares and per share data)
collateral, the portfolio company’s ability to make payments and its earnings and discounted cash flows, the markets in which the portfolio company does business, comparisons to publicly traded securities, and changes in the interest rate environment and the credit markets generally that may affect the price at which similar investments may be made and other relevant factors. The primary method for determining enterprise value uses a multiple analysis whereby appropriate multiples are applied to the portfolio company’s net income before net interest expense, income tax expense, depreciation and amortization (“EBITDA”). A portfolio company’s EBITDA may include pro forma adjustments for items such as acquisitions, divestitures, or expense reductions. The enterprise value analysis is performed to determine the value of equity investments and to determine if debt investments are credit impaired. If debt investments are credit impaired, the Company will use the enterprise value analysis or a liquidation basis analysis to determine fair value. For debt investments that are not determined to be credit impaired, the Company uses a market interest rate yield analysis to determine fair value.
Golub Capital BDC, Inc. and Subsidiaries
Notes to Consolidated Financial Statements
(In thousands, except shares and per share data)
Note 6. Fair Value Measurements - (continued)
In addition, for certain debt investments, the Company may base its valuation on indicative bid and ask prices provided by an independent third party pricing service. Bid prices reflect the highest price that the Company and others may be willing to pay. Ask prices represent the lowest price that the Company and others may be willing to accept. The Company generally uses the midpoint of the bid/ask range as its best estimate of fair value of such investment.
Due to the inherent uncertainty of determining the fair value of Level 3 investments that do not have a readily available market value, the fair value of the investments may differ significantly from the values that would have been used had a ready market existed for such investments and may differ materially from the values that may ultimately be received or settled. Further, such investments are generally subject to legal and other restrictions or otherwise are less liquid than publicly traded instruments. If the Company were required to liquidate a portfolio investment in a forced or liquidation sale, the Company may realize significantly less than the value at which such investment had previously been recorded.
The Company’s investments are subject to market risk. Market risk is the potential for changes in the value due to market changes. Market risk is directly impacted by the volatility and liquidity in the markets in which the investments are traded.
Secured Borrowings
The Company has elected the fair value option under ASC Topic 825 —- Financial Instruments, relating to accounting for debt obligations at their fair value for its secured borrowings which arose due to partial loan sales which did not meet the criteria for sale treatment under ASC Topic 860. The Company reports changes in the fair value of its secured borrowings as a component of the net change in unrealized (appreciation) depreciation on secured borrowings in the consolidated statementsConsolidated Statements of operations.Operations. The net gain or loss reflects the difference between the fair value and the principal amount due on maturity.
All secured borrowings as
As of September 30, 20162018 and 20152017, there were no secured borrowings outstanding. Previous secured borrowings were valued using Level 3 inputs under the fair value hierarchy, and the Company’s approach to determining fair value of Level 3 secured borrowings is consistent with its approach to determining fair value of the Level 3 investments that are associated with these secured borrowings as previously described.
Golub Capital BDC, Inc. and Subsidiaries
Notes to Consolidated Financial Statements
(In thousands, except shares and per share data)
The following tables present fair value measurements of the Company’s investments and secured borrowings and indicates the fair value hierarchy of the valuation techniques utilized by the Company to determine such fair value as of September 30, 20162018 and 2015:2017:
| | | As of September 30, 2016 | | Fair Value Measurements Using | |
| As of September 30, 2018 | | | Fair Value Measurements Using |
| Description | | Level 1 | | Level 2 | | Level 3 | | Total | | Level 1 | | Level 2 | | Level 3 | | Total |
| Assets: | | |
| | |
| | |
| | |
| |
| Assets, at fair value: | | | |
| | |
| | |
| | |
|
Debt investments(1) | | $ | — |
| | $ | — |
| | $ | 1,573,953 |
| | $ | 1,573,953 |
| | $ | — |
| | $ | — |
| | $ | 1,671,051 |
| | $ | 1,671,051 |
|
Equity investments(1) | | — |
| | — |
| | 59,732 |
| | 59,732 |
| | — |
| | — |
| | 40,706 |
| | 40,706 |
|
Money market funds(1)(2) | | 44,281 |
| | — |
| | — |
| | 44,281 |
| | 10,532 |
| | — |
| | — |
| | 10,532 |
|
Investment measured at NAV(3)(4) | | — |
| | — |
| | — |
| | 26,927 |
| | — |
| | — |
| | — |
| | 71,084 |
|
| Total assets: | | $ | 44,281 |
| | $ | — |
| | $ | 1,633,685 |
| | $ | 1,704,893 |
| |
| Secured borrowings: | | $ | — |
| | $ | — |
| | $ | 475 |
| | $ | 475 |
| |
| Total assets, at fair value: | | | $ | 10,532 |
| | $ | — |
| | $ | 1,711,757 |
| | $ | 1,793,373 |
|
| | | As of September 30, 2015 | | Fair Value Measurements Using | |
| As of September 30, 2017 | | | Fair Value Measurements Using |
| Description | | Level 1 | | Level 2 | | Level 3 | | Total | | Level 1 | | Level 2 | | Level 3 | | Total |
| Assets: | | |
| | |
| | |
| | |
| |
| Assets, at fair value: | | | |
| | |
| | |
| | |
|
Debt investments(1) | | $ | — |
| | $ | — |
| | $ | 1,449,603 |
| | $ | 1,449,603 |
| | $ | — |
| | $ | — |
| | $ | 1,538,606 |
| | $ | 1,538,606 |
|
Equity investments(1) | | — |
| | — |
| | 57,808 |
| | 57,808 |
| | — |
| | — |
| | 51,394 |
| | 51,394 |
|
Money market funds(1)(2) | | 77,346 |
| | — |
| | — |
| | 77,346 |
| | 13,825 |
| | — |
| | — |
| | 13,825 |
|
Investment measured at NAV(3)(4) | | — |
| | — |
| | — |
| | 22,373 |
| | — |
| | — |
| | — |
| | 95,015 |
|
| Total assets: | | $ | 77,346 |
| | $ | — |
| | $ | 1,507,411 |
| | $ | 1,607,130 |
| |
| Secured borrowings: | | $ | — |
| | $ | — |
| | $ | 355 |
| | $ | 355 |
| |
| Total assets, at fair value: | | | $ | 13,825 |
| | $ | — |
| | $ | 1,590,000 |
| | $ | 1,698,840 |
|
Golub Capital BDC, Inc. and Subsidiaries
Notes to Consolidated Financial Statements
(In thousands, except shares and per share data)
Note 6. Fair Value Measurements - (continued)
| |
(1) | Refer to the consolidated schedulesConsolidated Schedules of investmentsInvestments for further details. |
| |
(2) | Included in cash and cash equivalents and restricted cash and cash equivalents on the consolidated statementsConsolidated Statements of financial condition.Financial Condition. |
| |
(3) | Certain investments that are measured at fair value using the NAV have not been categorized in the fair value hierarchy. The fair value amounts presented in this table are intended to permit reconciliation of the fair value hierarchy to the amounts presented in the consolidated statementsConsolidated Statements of financial condition.Financial Condition. |
| |
(4) | Represents the Company's investment in LLC equity interestinterests in SLF. The fair value of this investment has been determined using the NAV of the Company’s ownership interest in members’ capital. |
The net change in unrealized appreciation (depreciation) for the years ended September 30, 2016, 20152018, 2017 and 20142016 reported within the net change in unrealized appreciation (depreciation) on investments in the Company’s consolidated statementsConsolidated Statements of operationOperations attributable to the Company’s Level 3 assets held at the end of each year was $3,600, $4,846 and $2,528, $10,064respectively.
Golub Capital BDC, Inc. and $6,224, respectively.Subsidiaries
Notes to Consolidated Financial Statements
(In thousands, except shares and per share data)
The following table presents the changes in investments and secured borrowings measured at fair value using Level 3 inputs for the years ended September 30, 20162018 and 2015:2017:
|
| | | | | | | | | | | | | | | |
| | Year ended September 30, 2016 |
| | Debt Investments | | Equity Investments | | Total Investments | | Secured Borrowings |
| Fair value, beginning of period | $ | 1,449,603 |
| | $ | 57,808 |
| | $ | 1,507,411 |
| | $ | 355 |
|
Net change in unrealized appreciation (depreciation) on investments | 4,274 |
| | (2,742 | ) | | 1,532 |
| | — |
|
Net change in unrealized appreciation (depreciation) on secured borrowings | — |
| | — |
| | — |
| | — |
|
| Realized gain (loss) on investments | (5,529 | ) | | 11,783 |
| | 6,254 |
| | — |
|
| Proceeds from (funding of) revolving loans, net | 587 |
| | — |
| | 587 |
| | — |
|
| Fundings of investments | 630,523 |
| | 13,420 |
| | 643,943 |
| | 155 |
|
| PIK interest | 1,201 |
| | — |
| | 1,201 |
| | — |
|
Proceeds from principal payments and sales of portfolio investments | (515,368 | ) | | (20,537 | ) | | (535,905 | ) | | — |
|
| Repayments on secured borrowings | — |
| | — |
| | — |
| | (35 | ) |
| Accretion of discounts and amortization of premiums | 8,662 |
| | — |
| | 8,662 |
| | — |
|
| Fair value, end of period | $ | 1,573,953 |
| | $ | 59,732 |
| | $ | 1,633,685 |
| | $ | 475 |
|
|
| | | | | | | | | | | |
| | Year ended September 30, 2018 |
| | Debt Investments | | Equity Investments | | Total Investments |
| Fair value, beginning of period | $ | 1,538,606 |
| | $ | 51,394 |
| | $ | 1,590,000 |
|
| Net change in unrealized appreciation (depreciation) on investments | 1,533 |
| | (11,239 | ) | | (9,706 | ) |
| Realized gain (loss) on investments | (4,516 | ) | | 21,970 |
| | 17,454 |
|
| Funding of (proceeds from) revolving loans, net | (7,235 | ) | | — |
| | (7,235 | ) |
| Fundings of investments | 628,608 |
| | 5,824 |
| | 634,432 |
|
| PIK interest | 1,622 |
| | — |
| | 1,622 |
|
| Proceeds from principal payments and sales of portfolio investments | (497,208 | ) | | (27,243 | ) | | (524,451 | ) |
| Accretion of discounts and amortization of premiums | 9,641 |
| | — |
| | 9,641 |
|
| Fair value, end of period | $ | 1,671,051 |
| | $ | 40,706 |
| | $ | 1,711,757 |
|
|
| | | | | | | | | | | | | | | |
| | Year ended September 30, 2017 |
| | Debt Investments | | Equity Investments | | Total Investments | | Secured Borrowings |
| Fair value, beginning of period | $ | 1,573,953 |
| | $ | 59,732 |
| | $ | 1,633,685 |
| | $ | 475 |
|
| Net change in unrealized appreciation (depreciation) on investments | 1,146 |
| | 222 |
| | 1,368 |
| | — |
|
| Net change in unrealized appreciation (depreciation) on secured borrowings |
|
| | — |
| | — |
| | (3 | ) |
| Realized gain (loss) on investments | (372 | ) | | 9,774 |
| | 9,402 |
| | — |
|
| Funding of (proceeds from) revolving loans, net | 331 |
| | — |
| | 331 |
| | — |
|
| Fundings of investments | 570,950 |
| | 4,677 |
| | 575,627 |
| | — |
|
| PIK interest | 1,839 |
| | — |
| | 1,839 |
| | — |
|
| Proceeds from principal payments and sales of portfolio investments | (540,050 | ) | | (23,011 | ) | | (563,061 | ) | | — |
|
| Non-cash proceeds from subordinated notes in SLF principal payments | (78,689 | ) | | — |
| | (78,689 | ) | | — |
|
| Repayments on secured borrowings | — |
| | — |
| | — |
| | (475 | ) |
| Accretion of discounts and amortization of premiums | 9,498 |
| | — |
| | 9,498 |
| | 3 |
|
| Fair value, end of period | $ | 1,538,606 |
| | $ | 51,394 |
| | $ | 1,590,000 |
| | $ | — |
|
Golub Capital BDC, Inc. and Subsidiaries
Notes to Consolidated Financial Statements
(In thousands, except shares and per share data)
Note 6. Fair Value Measurements - (continued)
|
| | | | | | | | | | | | | | | |
| | Year ended September 30, 2015 |
| | Debt Investments | | Equity Investments | | Total Investments | | Secured Borrowings |
| Fair value, beginning of period | $ | 1,292,851 |
| | $ | 45,519 |
| | $ | 1,338,370 |
| | $ | 389 |
|
Net change in unrealized appreciation (depreciation) on investments | (2,782 | ) | | 5,993 |
| | 3,211 |
| | — |
|
Net change in unrealized appreciation (depreciation) on secured borrowings | — |
| | — |
| | — |
| | (2 | ) |
| Realized gain (loss) on investments | (1,030 | ) | | 10,384 |
| | 9,354 |
| | — |
|
| Proceeds from (funding of) revolving loans, net | 1,365 |
| | — |
| | 1,365 |
| | — |
|
| Fundings of investments | 834,708 |
| | 9,535 |
| | 844,243 |
| | — |
|
| PIK interest | 941 |
| | — |
| | 941 |
| | — |
|
Proceeds from principal payments and sales of portfolio investments | (685,452 | ) | | (13,623 | ) | | (699,075 | ) | | — |
|
| Repayments on secured borrowings | — |
| | — |
| | — |
| | (34 | ) |
| Accretion of discounts and amortization of premiums | 9,002 |
| | — |
| | 9,002 |
| | 2 |
|
| Fair value, end of period | $ | 1,449,603 |
| | $ | 57,808 |
| | $ | 1,507,411 |
| | $ | 355 |
|
Golub Capital BDC, Inc. and Subsidiaries
Notes to Consolidated Financial Statements
(In thousands, except shares and per share data)
Note 6. Fair Value Measurements - (continued)
The following tables present quantitative information about the significant unobservable inputs of the Company’s Level 3 investments and secured borrowings as of September 30, 20162018 and 2015.2017.
|
| | | | | | | | | |
| Quantitative information about Level 3 Fair Value Measurements |
| | Fair value as of September 30, 2016 | | Valuation Techniques | | Unobservable Input | | Range (Weighted Average) |
| Assets: | |
| | | | | | |
Senior secured loans(1)(2) | $ | 148,446 |
| | Market rate approach | | Market interest rate | | 4.0% - 10.0% (6.4%) |
| | |
| | Market comparable companies | | EBITDA multiples | | 6.0x - 17.5x (11.5x) |
| | 14,247 |
| | Market comparable | | Broker/dealer bids or quotes | | N/A |
| Subordinated Notes of SLF | $ | 77,301 |
| | Discounted cash flow analysis | | Discount rate | | 8.2% |
One stop loans(1)(3)(4) | $ | 1,299,650 |
| | Market rate approach | | Market interest rate | | 4.5% - 23.5% (7.9%) |
| | | | Market comparable companies | | EBITDA multiples | | 4.0x - 35.4x (10.6x) |
| | | | | | Revenue multiples | | 2.0x - 7.5x (3.9x) |
| | 3,647 |
| | Market comparable | | Broker/dealer bids or quotes | | N/A |
Subordinated and second lien loans(1) | $ | 29,336 |
| | Market rate approach | | Market interest rate | | 9.0% - 29.5% (11.3%) |
| | |
| | Market comparable companies | | EBITDA multiples | | 6.5x - 20.0x (13.1x) |
Equity securities(5) | $ | 59,732 |
| | Market comparable companies | | EBITDA multiples(6) | | 4.0x - 16.7x (10.9x) |
| | | | | | Revenue multiples(6) | | 2.0x - 5.5x (3.2x) |
| Liabilities: | | | | | | | |
Secured borrowings(7) | $ | 475 |
| | Market rate approach | | Market interest rate | | 7.0% |
| | |
| | Market comparable companies | | EBITDA multiples | | 16.0x |
|
| | | | | | | | | |
| Quantitative information about Level 3 Fair Value Measurements |
| | Fair value as of September 30, 2018 | | Valuation Techniques | | Unobservable Input | | Range (Weighted Average) |
| Assets: | |
| | | | | | |
Senior secured loans(1)(2) | $ | 225,960 |
| | Market rate approach | | Market interest rate | | 4.3% - 9.9% (7.2%) |
| | |
| | Market comparable companies | | EBITDA multiples | | 5.0x - 15.0x (11.1x) |
| | 3,926 |
| | Market comparable | | Broker/dealer bids or quotes | | N/A |
One stop loans(1)(3)(4) | $ | 1,422,601 |
| | Market rate approach | | Market interest rate | | 2.0% - 13.8% (8.8%) |
| | | | Market comparable companies | | EBITDA multiples | | 4.5x - 35.0x (13.6x) |
| | | | | | Revenue multiples | | 1.3x - 10.2x (4.1x) |
| | 3,253 |
| | Market comparable | | Broker/dealer bids or quotes | | N/A |
Subordinated debt and second lien loans(1)(5) | $ | 9,686 |
| | Market rate approach | | Market interest rate | | 8.0% - 19.5% (10.4%) |
| | | | Market comparable companies | | EBITDA multiples | | 10.5x - 11.0x (10.5x) |
| | |
| | | | Revenue multiples | | 5.1 |
Equity(6)(7) | $ | 40,706 |
| | Market comparable companies | | EBITDA multiples | | 4.5x - 28.5x (12.2x) |
| | | | | | Revenue multiples | | 1.3x - 10.2x (4.0x) |
| |
(1) | The fair value of this asset class was determined using the market rate approach as the investments in this asset class were determined not to be credit impaired using the market comparable companies approach. The unobservable inputs for both valuation techniques have been presented, but the fair value as of September 30, 20162018 was determined using the market rate approach. |
| |
(2) | Excludes $156$1,283 of non-accrual loans at fair value, which the Company valued on a liquidation basis.using the market comparable companies approach. |
| |
(3) | Excludes $1,170$4,342 of non-accrual loans at fair value, which the Company valued on a liquidation basis.using the market comparable companies approach. |
| |
(4) | The Company valued $1,171,240$1,253,179 and $128,410$169,422 of one stop loans using EBITDA and revenue multiples, respectively. All one stop loans were also valued using the market rate approach. |
| |
(5) | The Company valued $9,502 and $184 of subordinated debt and second lien loans using EBITDA and revenue multiples, respectively. All subordinated debt and second lien loans were also valued using the market rate approach. |
| |
(6) | Excludes $26,927$71,084 of LLC equity interests in SLF at fair value, which the Company valued using the NAV. |
| |
(6)(7)
| The Company valued $55,897$36,714 and $3,835$3,992 of equity investments using EBITDA and revenue multiples, respectively. |
| |
(7)
| The fair value of the secured borrowings was determined using the market rate approach as the corresponding investments were determined not to be credit impaired using the market comparable companies approach. The unobservable inputs for both valuation techniques have been presented, but the fair value as of September 30, 2016 was determined using the market rate approach. |
Golub Capital BDC, Inc. and Subsidiaries
Notes to Consolidated Financial Statements
(In thousands, except shares and per share data)
Note 6. Fair Value Measurements - (continued)
|
| | | | | | | | | |
| Quantitative information about Level 3 Fair Value Measurements |
| | Fair value as of September 30, 2015 | | Valuation Techniques | | Unobservable Input | | Range (Weighted Average) |
| Assets: | |
| | | | | | |
Senior secured loans(1)(2) | $ | 153,205 |
| | Market rate approach | | Market interest rate | | 4.0% - 25.3% (6.5%) |
| | |
| | Market comparable companies | | EBITDA multiples | | 4.0x - 17.5x (11.7x) |
| Subordinated Notes of SLF | $ | 76,563 |
| | Discounted cash flow analysis | | Discount rate | | 8.2% |
One stop loans(1)(3)(4) | $ | 1,085,189 |
| | Market rate approach | | Market interest rate | | 5.0% - 24.0% (7.8%) |
| | |
| | Market comparable companies | | EBITDA multiples(5) | | 4.5x - 40.0x (10.9x) |
| | | | | | Revenue multiples(5) | | 2.1x - 5.0x (3.6x) |
Subordinated and second lien loans(1)(6) | $ | 20,444 |
| | Market rate approach | | Market interest rate | | 9.0% - 14.6% (9.5%) |
| | |
| | Market comparable companies | | EBITDA multiples | | 7.5x - 16.0x (12.5x) |
Equity securities(7) | $ | 57,808 |
| | Market comparable companies | | EBITDA multiples(8) | | 4.0x – 40.0x (10.9x) |
| | | | | | Revenue multiples(8) | | 2.1x – 5.0x (3.0x) |
| Liabilities: | | | | | | | |
Secured borrowings(9) | $ | 355 |
| | Market rate approach | | Market interest rate | | 6.0% |
| | |
| | Market comparable companies | | EBITDA multiples | | 30.0x |
|
| | | | | | | | | |
| Quantitative information about Level 3 Fair Value Measurements |
| | Fair value as of September 30, 2017 | | Valuation Techniques | | Unobservable Input | | Range (Weighted Average)(7) |
| Assets: | |
| | | | | | |
Senior secured loans(1)(2) | $ | 184,529 |
| | Market rate approach | | Market interest rate | | 5.6% - 12.5% (6.9%) |
| | |
| | Market comparable companies | | EBITDA multiples | | 5.0x - 17.5x (11.6x) |
| | 10,560 |
| | Market comparable | | Broker/dealer bids or quotes | | N/A |
One stop loans(1)(3)(4) | $ | 1,327,788 |
| | Market rate approach | | Market interest rate | | 2.3% - 39.5% (8.1%) |
| | | | Market comparable companies | | EBITDA multiples | | 4.0x - 35.0x (12.5x) |
| | | | | | Revenue multiples | | 2.0x - 7.5x (3.9x) |
| | 3,281 |
| | Market comparable | | Broker/dealer bids or quotes | | N/A |
Subordinated debt and second lien loans(1) | $ | 9,493 |
| | Market rate approach | | Market interest rate | | 9.3% - 19.5% (9.4%) |
| | |
| | Market comparable companies | | EBITDA multiples | | 10.5x - 11.0x (10.5x) |
Equity(5)(6) | $ | 51,394 |
| | Market comparable companies | | EBITDA multiples | | 4.0x - 43.3x (12.5x) |
| | | | | | Revenue multiples | | 2.0x - 5.8x (3.0x) |
| |
(1) | The fair value of this asset class was determined using the market rate approach as the investments in this asset class were determined not to be credit impaired using the market comparable companies approach. The unobservable inputs for both valuation techniques have been presented, but the fair value as of September 30, 20152017 was determined using the market rate approach. |
| |
(2) | Excludes $44,124$(60) of non-accrual loans at fair value, which the Company valued using indicative bid and ask prices provided by an independent third party pricing service.the market comparable companies approach. The negative fair value is a result of the unfunded commitment being valued below par. |
| |
(3) | Excludes $42,546$3,015 of non-accrual loans at fair value, which the Company valued using indicative bid and ask prices provided by an independent third party pricing service.the market comparable companies approach. |
| |
(4) | Excludes $6,487 of non-accrual loans at fair value, which the Company valued on a liquidation basis. |
| |
(5)
| The Company valued $996,998$1,189,176 and $88,191$138,612 of one stop loans using EBITDA and revenue multiples, respectively. All one stop loans were also valued using the market rate approach. |
| |
(6)(5)
| Excludes $21,045 of loans at fair value, which the Company valued using indicative bid and ask prices provided by an independent third party pricing service. |
| |
(7)
| Excludes $22,373$95,015 of LLC equity interests in SLF at fair value, which the Company valued using the NAV. |
| |
(8)(6)
| The Company valued $54,965$47,092 and $2,843$4,302 of equity investments using EBITDA and revenue multiples, respectively. |
| |
(9)(7)
| TheUnobservable inputs were weighted by the relative fair value of the secured borrowings was determined using the market rate approach as the corresponding investments were determined not to be credit impaired using the market comparable companies approach. The unobservable inputs for both valuation techniques have been presented, but the fair value as of September 30, 2015 was determined using the market rate approach.instruments. |
Golub Capital BDC, Inc. and Subsidiaries
Notes to Consolidated Financial Statements
(In thousands, except shares and per share data)
Note 6. Fair Value Measurements - (continued)
The above tables are not intended to be all-inclusive but rather to provide information on significant unobservable inputs and valuation techniques used by the Company.
The significant unobservable inputs used in the fair value measurement of the Company’s debt and equity investments and secured borrowings are EBITDA multiples, revenue multiples and market interest rates. The Company uses EBITDA multiples and, to a lesser extent, revenue multiples on its debt and equity investments and secured borrowings to determine any credit gains or losses. Increases or decreases in either of these inputs in isolation would resulthave resulted in a significantly lower or higher fair value measurement. The Company uses market interest rates for loans to determine if the effective yield on a loan is commensurate with the market yields for that type of loan. If a loan’s effective yield iswas significantly less than the market yield for a similar loan with a similar credit profile, then the resulting fair value of the loan may behave been lower.
Other Financial Assets and Liabilities
ASC Topic 820 requires disclosure of the fair value of financial instruments for which it is practical to estimate such value. As a result, with the exception of the line item titled “debt” which is reported at cost, all assets and liabilities approximate fair value on the consolidated statementsConsolidated Statements of financial conditionFinancial Condition due to their short maturity. Fair value of the Company’s debt is estimated using Level 3 inputs by discounting remaining payments using comparable market rates or market quotes for similar instruments at the measurement date, if available.
Golub Capital BDC, Inc. and Subsidiaries
Notes to Consolidated Financial Statements
(In thousands, except shares and per share data)
The following are the carrying values and fair values of the Company’s debt as of September 30, 20162018 and 2015.2017. Fair value is estimated by discounting remaining payments using applicable market rates or market quotes for similar instruments at the measurement date, if available.
|
| | | | | | | | | | | | | | | |
| | As of September 30, 2016 | | As of September 30, 2015 |
| | Carrying Value | | Fair Value | | Carrying Value | | Fair Value |
| Debt | $ | 864,700 |
| | $ | 873,980 |
| | $ | 813,250 |
| | $ | 815,087 |
|
|
| | | | | | | | | | | | | | | |
| | As of September 30, 2018 | | As of September 30, 2017 |
| | Carrying Value | | Fair Value | | Carrying Value | | Fair Value |
| Debt | $ | 845,683 |
| | $ | 837,578 |
| | $ | 781,100 |
| | $ | 788,762 |
|
Note 7.6. Borrowings
In accordance with the 1940 Act, with certain limited exceptions, the Company is onlycurrently allowed to borrow amounts such that its asset coverage, as defined in the 1940 Act, is at least 200% after such borrowing. The Small Business Credit Availability Act (“SBCAA”), which was signed into law on March 23, 2018, among other things, amended Section 61(a) of the 1940 Act to add a new Section 61(a)(2) that reduces the asset coverage requirement applicable to business development companies from 200% to 150% so long as the business development company meets certain disclosure requirements and obtains certain approvals. The reduced asset coverage requirement would permit a business development company to have a ratio of total consolidated assets to outstanding indebtedness of 2:1 as compared to a maximum of 1:1 under the 200% asset coverage requirement. Effectiveness of the reduced asset coverage requirement to a business development company requires approval by either (1) a “required majority,” as defined in Section 57(o) of the 1940 Act, of such business development company’s board of directors with effectiveness one year after the date of such approval or (2) a majority of votes cast at a special or annual meeting of such business development company’s stockholders at which a quorum is present, which is effective the day after such stockholder approval. As of September 30, 2018, the Company has not obtained either approval and, as a result and subject to the exemptive relief described below, remains subject to the 200% asset coverage requirement under Section 61(a)(1) of the 1940 Act. On September 13, 2011, the Company received exemptive relief from the SEC allowing it to modify the asset coverage requirement to exclude the SBA debentures from thisthe asset coverage calculation. As such, the Company’s ratio of total consolidated assets to outstanding indebtedness may be less than 200%. even if the Company does not receive approval for the modified asset coverage requirement permitted by Section 61(a)(2) of the 1940 Act. This provides the Company with increased investment flexibility but also increases its risks related to leverage. As of September 30, 2016,2018, the Company’s asset coverage for borrowed amounts was 248.8%269.5% (excluding the SBA debentures).
Debt Securitizations:On July 16, 2010, the Company completed a $300,000 term debt securitization, which was subsequently increased to $350,000 (as amended, “2010 Debt Securitization”). Term debt securitizations are also known as collateralized loan obligations ("CLOs") and are a form of secured financing incurred by the Company, which is consolidated by the Company and subject to the Company's overall asset coverage requirements. The notes (“2010 Notes”) offered in the 2010 Debt Securitization were issued by the 2010 Issuer, a subsidiary of Holdings, and the Class A 2010 Notes and Class B 2010 Notes are secured by the assets held by the 2010 Issuer. As of September 30,Holdings. Through October 19, 2016, the 2010 Debt Securitization consisted of $203,000 of Aaa/AAA Class A 2010 Notes that bore interest at a rate of three-month LIBOR plus 1.74%, $12,000 face amount of Class B 2010 Notes that bore interest at a rate of three-month LIBOR plus 2.40% and $135,000 face amount of Subordinated 2010 Notes that do not bear interest. The Class A and Class B 2010 Notes are included in the September 30,On October 20, 2016, and 2015 consolidated statements of financial condition as debt of the Company. As of September 30, 2015 and 2015, the Subordinated 2010 Notes were eliminated in consolidation.
On June 25, 2015, the Company and the 2010 Issuer further amended the 2010 Debt Securitization to, among other things, (a) refinance the issued Class A 2010 Notes by redeeming in full the Class A 2010 Notes and issuing new Class A-Refi 2010 Notes in an aggregate principal amount of $205,000 that bore interest at a rate of three-month LIBOR plus 1.90%, (b) refinance the Class B Notes by redeeming in full the Class B 2010 Notes and issuing new Class B-Refi 2010 Notes in an aggregate principal amount of $10,000 that bore interest at a rate of three-month LIBOR plus 2.40%, and (c) extend the reinvestment period two yearsapplicable to July 20, 2017, (b) make certain modifications for purposes of compliance with the loan securitization exclusion of the Volcker Rule and (c) modify the computation of the weighted average life test which relates to the loans securing the 2010 Notes.
Through July 20, 2017, all principal collections received on the underlying collateral may be used by the 2010 Issuer to purchaseJuly 20, 2018. Following the refinancing, Holdings retained the Class B-Refi 2010 Notes. On July 20, 2018, in connection with a new collateral under the direction of the Investment Adviser in its capacity as collateral manager ofrevolving credit facility, the 2010 Issuer and in accordance withredeemed the Company’s investment strategy, allowingoutstanding 2010 Notes pursuant to the Company to maintainterms of the leverage inindenture governing such 2010 Notes. Following such redemption, the agreements governing the 2010 Debt Securitization. The 2010 Notes are scheduled to mature on July 20, 2023.Securitization were terminated.
Golub Capital BDC, Inc. and Subsidiaries
Notes to Consolidated Financial Statements
(In thousands, except shares and per share data)
Note 7. Borrowings - (continued)The Class A-Refi 2010 Notes are included in the September 30, 2017, Consolidated Statement of Financial Condition as debt of the Company and the Class B-Refi 2010 Notes and Subordinated 2010 Notes were eliminated in consolidation. The Class A-Refi 2010 Notes and Class B-Refi 2010 Notes were secured by the assets held by the 2010 Issuer.
As of September 30, 2016 and 2015,2018, the 2010 Notes were no longer outstanding. As of September 30, 2017, there were 77 and 7881 portfolio companies with a total fair value of $319,288 and $310,622, respectively,$345,750 securing the 2010 Notes. The pool of loans in the 2010 Debt Securitization mustwas required to meet certain requirements, including asset mix and concentration, collateral coverage, term, agency rating, minimum coupon, minimum spread and sector diversity requirements.
The interest charged under the 2010 Debt Securitization iswas based on three-month LIBOR, which as of September 30, 2016 was 0.7%.LIBOR. For the years ended September 30, 2016, 20152018, 2017 and 2014,2016, the components of interest expense, cash paid for interest, average interest rates and average outstanding balances for the 2010 Debt Securitization were as follows:
|
| | | | | | | | | | | |
| | For the years ended September 30, |
| | 2016 | | 2015 | | 2014 |
| Stated interest expense | $ | 5,078 |
| | $ | 4,439 |
| | $ | 4,346 |
|
| Amortization of debt issuance costs | 390 |
| | 931 |
| | 707 |
|
| Total interest and other debt financing expenses | $ | 5,468 |
| | $ | 5,370 |
| | $ | 5,053 |
|
| Cash paid for interest expense | $ | 4,900 |
| | $ | 4,404 |
| | $ | 4,285 |
|
| Average stated interest rate | 2.4 | % | | 2.1 | % | | 2.0 | % |
| Average outstanding balance | $ | 215,000 |
| | $ | 215,000 |
| | $ | 213,356 |
|
As of September 30, 2016, the classes, amounts, ratings and interest rates (expressed as a spread to three-month LIBOR) of the Class A and B 2010 Notes were as follows:
|
| | | | |
| Description | | Class A 2010 Notes | | Class B 2010 Notes |
| Type | | Senior Secured Floating Rate | | Senior Secured Floating Rate |
| Amount Outstanding | | $203,000 | | $12,000 |
| Moody’s Rating | | “Aaa” | | “Aa” |
| S&P Rating | | “AAA” | | “AA” |
| Interest Rate | | LIBOR + 1.74% | | LIBOR + 2.40% |
| Stated Maturity | | July 20, 2023 | | July 20, 2023 |
|
| | | | | | | | | | | |
| | For the years ended September 30, |
| | 2018 | | 2017 | | 2016 |
| Stated interest expense | $ | 6,127 |
| | $ | 6,156 |
| | $ | 5,078 |
|
| Amortization of debt issuance costs | 189 |
| | 256 |
| | 390 |
|
| Total interest and other debt financing expenses | $ | 6,316 |
| | $ | 6,412 |
| | $ | 5,468 |
|
| Cash paid for interest expense | $ | 7,460 |
| | $ | 5,901 |
| | $ | 4,900 |
|
| Average stated interest rate | 3.7 | % | | 3.0 | % | | 2.4 | % |
| Average outstanding balance | $ | 164,000 |
| | $ | 205,520 |
| | $ | 215,000 |
|
On June 5, 2014, the Company completed a $402,569 term debt securitization (“2014 Debt Securitization”). Term debt securitizations are also known as CLOs and are a form of secured financing incurred by the Company, which is consolidated by the Company and subject to the Company’s overall asset coverage requirements. The notes (“2014 Notes”) offered in the 2014 Debt Securitization were issued by the 2014 Issuer and are secured by a diversifeddiversified portfolio of senior secured and second lien loans held by the 2014 Issuer. The 2014 Debt Securitization consistsinitially consisted of $191,000 of Aaa/AAA Class A-1 2014 Notes, $20,000 of Aaa/AAA Class A-2 2014 Notes and $35,000 of Aa2/AA Class B 2014 Notes. In partial consideration for the loans transferred to the 2014 Issuer as part of the 2014 Debt Securitization, the Company received $37,500 of Class C 2014 Notes and $119,069 of LLC equity interests in the 2014 Issuer. The Company retained all of the Class C 2014 Notes and LLC equity interests totaling $37,500 and $119,069, respectively. On March 23, 2018, the Company and the 2014 Issuer amended the 2014 Debt Securitization to, among other things, (a) refinance the issued Class A-1 2014 Notes by redeeming in full the $191.0 million of Class A-1 2014 Notes and issuing new Class A-1-R 2014 Notes in an aggregate principal amount of $147,082 that bear interest at a rate of three-month LIBOR plus 0.95%, which is a decrease from the rate of three-month LIBOR plus 1.75% of the previously outstanding Class A-1 2014 Notes, (b) refinance the Class A-2 2014 Notes by redeeming in full the $20,000 of Class A-2 2014 Notes and issuing new Class A-2-R 2014 Notes in an aggregate principal amount of $15,401 that bear interest at a rate of three-month LIBOR plus 0.95%, which is a decrease from the rate of three-month LIBOR plus 1.95% of the previously outstanding Class A-2 2014 Notes, (c) refinance the Class B 2014 Notes by redeeming in full the $35,000 of Class B 2014 Notes and issuing new Class B-R 2014 Notes in an aggregate principal amount of $35,000 that bear interest at a rate of three-month LIBOR plus 1.40%, which is a decrease from the rate of three-month LIBOR plus 2.50% of the previously outstanding Class B 2014 Notes, (d) refinance the Class C 2014 Notes by redeeming in full the $37,500 of Class C 2014 Notes and issuing new Class C-R 2014 Notes in an aggregate principal amount of $37,500 that bear interest at a rate of three-month LIBOR plus 1.55%, which is a decrease from the rate of three-month LIBOR plus 3.50% of the previously outstanding Class C 2014 Notes. The Class C-R 2014 Notes were retained by the Company, and the Company remains the sole owner of the equity of the 2014 Issuer. The Class A-1-R, Class A-2-R and Class B-R 2014 Notes are included in the September 30, 2018 Consolidated Statement of Financial Condition as debt of the Company and the Class C-R 2014 Notes and LLC equity interests were eliminated in consolidation. The Class A-1, Class A-2 and
Golub Capital BDC, Inc. and Subsidiaries
Notes to Consolidated Financial Statements
(In thousands, except shares and per share data)
Class B 2014 Notes are included in the September 30, 2016 and 2015 consolidated statements2017 Consolidated Statement of financial conditionFinancial Condition as debt of the Company. As of September 30, 2016Company and 2015, the Class C 2014 Notes and LLC equity interests were eliminated in consolidation.
Through April 28, 2018, all principal collections received on the underlying collateral may becould have been used by the 2014 Issuer to purchase new collateral under the direction of the Investment Adviser in its capacity as collateral manager of the 2014 Issuer and in accordance with the Company’s investment strategy, allowing the Company to maintain the initial leverage in the 2014 Debt Securitization. The 2014 Notes are scheduled to mature on April 25, 2026.
As of September 30, 20162018 and 2015,2017, there were 7983 and 7185 portfolio companies with a total fair value of $391,752$346,130 and $382,077,$382,957, respectively, securing the 2014 Notes. The pool of loans in the 2014 Debt Securitization must meet certain requirements, including asset mix and concentration, collateral coverage, term, agency rating, minimum coupon, minimum spread and sector diversity requirements.
Golub Capital BDC, Inc. and Subsidiaries
Notes to Consolidated Financial Statements
(In thousands, except shares and per share data)
Note 7. Borrowings - (continued)
The interest charged under the 2014 Debt Securitization is based on three-month LIBOR. The three-month LIBOR whichin effect as of September 30, 20162018 based on the last interest rate reset was 0.7%2.3%. For the years ended September 30, 2016, 20152018, 2017 and 2014,2016, the components of interest expense, cash paid for interest, annualized average interest rates and average outstanding balances for the 2014 Debt Securitization were as follows:
| | | | For the years ended September 30, | For the years ended September 30, |
| | 2016 | | 2015 | | 2014 | 2018 | | 2017 | | 2016 |
| Stated interest expense | $ | 6,029 |
| | $ | 5,213 |
| | $ | 1,653 |
| $ | 8,063 |
| | $ | 7,311 |
| | $ | 6,029 |
|
| Amortization of debt issuance costs | 641 |
| | 638 |
| | 205 |
| 1,085 |
| | 639 |
| | 641 |
|
| Total interest and other debt financing expenses | $ | 6,670 |
| | $ | 5,851 |
| | $ | 1,858 |
| $ | 9,148 |
| | $ | 7,950 |
| | $ | 6,670 |
|
| Cash paid for interest expense | $ | 5,786 |
| | $ | 5,906 |
| | — |
| $ | 8,289 |
| | $ | 7,032 |
| | $ | 5,786 |
|
| Average stated interest rate | 2.5 | % | | 2.1 | % | | 2.1 | % | 3.4 | % | | 3.0 | % | | 2.5 | % |
| Average outstanding balance | $ | 246,000 |
| | $ | 246,000 |
| | 79,529 |
| $ | 236,961 |
| | $ | 246,000 |
| | $ | 246,000 |
|
The
As of September 30, 2018, the classes, amounts, ratings and interest rates (expressed as a spread to three-month LIBOR) of the Class A-1, A-2A-1-R, A-2-R and BB-R 2014 Notes are as follows:
| | | Description | | Class A-1 2014 Notes | | Class A-2 2014 Notes | | Class B 2014 Notes | | Class A-1-R 2014 Notes | | Class A-2-R 2014 Notes | | Class B-R 2014 Notes |
| Type | | Senior Secured Floating Rate | | Senior Secured Floating Rate | | Senior Secured Floating Rate | | Senior Secured Floating Rate | | Senior Secured Floating Rate | | Senior Secured Floating Rate |
| Amount Outstanding | | $191,000 | | $20,000 | | $35,000 | | $147,082 | | $15,401 | | $35,000 |
| Moody’s Rating | | “Aaa” | | “Aaa” | | “Aa2” | | "Aaa" | | "Aaa" | | "Aa1" |
| S&P Rating | | “AAA” | | “AAA” | | “AA” | | "AAA" | | "AAA" | | "AA+" |
| Interest Rate | | LIBOR + 1.75% | | LIBOR + 1.95% | | LIBOR + 2.50% | | LIBOR + 0.95% | | LIBOR + 0.95% | | LIBOR + 1.40% |
| Stated Maturity | | April 25, 2026 | | April 25, 2026 | | April 25, 2026 | |
The Investment Adviser servesserved as collateral manager to the 2010 Issuer and serves as collateral manager to the 2014 Issuer under separate collateral management agreements and receives a fee for providing these services. The total fees payable by the Company under its Investment Advisory Agreement are reduced by an amount equal to the total aggregate fees that are paid to the Investment Adviser by the 2010 Issuer and the 2014 Issuer for rendering such collateral management services.
As part of each of the 2010 Debt Securitization and the 2014 Debt Securitization, the CompanyGBDC entered into master loan sale agreements under which the CompanyGBDC agreed to directly or indirectly sell or contribute certain senior secured and second lien loans (or participation interests therein) to the 2010 Issuer and the 2014 Issuer, as applicable, and to purchase or otherwise acquire the Subordinated 2010 Notes and the LLC equity interests in the 2014 Issuer, as applicable. The 2010 Notes (other than the 2010 Subordinated Notes) andAs of September 30, 2018, the 2014 Notes arewere the secured obligations of the 20102014 Issuer and 2014 Issuer, respectively, and indenturesthe indenture governing each of the 2010 Notes and the 2014 Notes includeincludes customary covenants and events of default. The pool of loans in the 2010 Debt Securitization
Golub Capital BDC, Inc. and the 2014 Debt Securitization must meet certain requirements, including asset mixSubsidiaries
Notes to Consolidated Financial Statements
(In thousands, except shares and concentration, collateral coverage, term, agency rating, minimum coupon, minimum spread and sector diversity requirements.per share data)
SBA Debentures:Debentures: On August 24, 2010, SBIC IV received approval for a license from the SBA to operate as an SBIC. On December 5, 2012, SBIC V received a license from the SBA to operate as an SBIC. On January 10, 2017, SBIC VI received a license from the SBA to operate as an SBIC. The reinvestment period for SBIC IV expired on September 30, 2018. SBICs are subject to a variety of regulations and oversight by the SBA concerning the size and nature of the companies in which they may invest as well as the structures of those investments.
The licenses allow the SBICs to obtain leverage by issuing SBA-guaranteed debentures, subject to issuance of a capital commitment by the SBA and customary procedures. These debentures are non-recourse to GBDC, have interest payable semiannually and a ten-year maturity. The interest rate is fixed at the time of issuance at a market-driven spread over U.S. Treasury Notes with ten-year maturities.
Under present SBIC regulations, the maximum amount of SBA-guaranteed debentures that may be issued by multiple licensees under common management is $350,000 and the maximum amount that a single SBIC licensee may issue is $150,000.
Golub Capital BDC, Inc. and Subsidiaries
Notes to Consolidated Financial Statements
(In thousands, except shares and per share data)
Note 7. Borrowings - (continued)
On February 11, 2016, the SBA approved SBIC V’s application for an additional $75,000 of debenture commitments bringing SBIC V’s total debenture commitments up to $150,000.$175,000. As of September 30, 2016,2018, SBIC IV, SBIC V and SBIC VVI had $115,000, $150,000 and $127,000$12,500, respectively, of outstanding SBA-guaranteed debentures respectively, that mature between MarchSeptember 2021 and September 2026,March 2028, leaving incremental borrowing capacitydebenture commitments of $23,000$0, $0 and $37,500 for SBIC IV, SBIC V and SBIC VI, respectively, under present SBIC regulations. As of September 30, 2015,2017, SBIC IV, SBIC V and SBIC VVI had $150,000$125,000, $133,000 and $75,000$9,000, respectively, of outstanding SBA-guaranteed debenture commitments that mature between September 2021 and September 2027 leaving incremental debenture commitments of $0, $17,000 and $41,000 for SBIC IV, SBIC V and SBIC VI, respectively, under present SBIC regulations. The original amount committed to SBIC IV by the SBA was $150,000. In March 2018 and September 2017, SBIC IV repaid $10,000 and $25,000, respectively, of the aggregate principal amount of the SBA-guaranteed debentures respectively.outstanding at the time and $10,000 and $25,000, respectively, of debenture commitments were terminated.
The interest rate on $277,000 ofthe outstanding debentures as of September 30, 20162018 is fixed at an average annualized interest rate of 3.5%3.4%. For the years ended September 30, 2016, 20152018, 2017 and 2014,2016, the components of interest expense, cash paid for interest, average interest rates and average outstanding balances for the SBA debentures were as follows:
| | | | For the years ended September 30, | For the years ended September 30, |
| | 2016 | | 2015 | | 2014 | 2018 | | 2017 | | 2016 |
| Stated interest expense | $ | 8,554 |
| | $ | 7,749 |
| | $ | 6,982 |
| $ | 9,239 |
| | $ | 9,782 |
| | $ | 8,554 |
|
| Amortization of debt issuance costs | 1,815 |
| | 1,954 |
| | 1,261 |
| 1,072 |
| | 1,357 |
| | 1,815 |
|
| Total interest and other debt financing expenses | $ | 10,369 |
| | $ | 9,703 |
| | $ | 8,243 |
| $ | 10,311 |
| | $ | 11,139 |
| | $ | 10,369 |
|
| Cash paid for interest expense | $ | 8,475 |
| | $ | 7,722 |
| | $ | 6,772 |
| $ | 9,196 |
| | $ | 9,777 |
| | $ | 8,475 |
|
| Average stated interest rate | 3.6 | % | | 3.6 | % | | 3.5 | % | 3.4 | % | | 3.5 | % | | 3.6 | % |
| Average outstanding balance | $ | 239,432 |
| | $ | 213,516 |
| | $ | 198,905 |
| $ | 273,970 |
| | $ | 282,675 |
| | $ | 239,432 |
|
Revolving Credit Facility:Facilities: On July 21, 2011, Funding entered into a senior secured revolving credit facility (as amended, the “Credit Facility”) with Wells Fargo Securities, LLC,Bank, N.A., as administrative agent and Wells Fargo Bank, N.A., as lender, which as of September 30, 2016,2018, allowed Funding to borrow up to $200,000$170,000 at any one time outstanding, subject to leverage and borrowing base restrictions.
On December 18, 2014,
Through a series of amendments, most recently on September 21, 2018, the Company and Funding amended the Credit Facility to, among other things, allow forextend the additionexpiration of a second lender under the facility.
reinvestment period from September 27, 2018 to September 20, 2019, extend the stated maturity date from September 28, 2022 to September 21, 2023, and permit borrowings in foreign currencies. On July 30, 2015,December 14, 2017, the Company and Funding amended the Credit Facility to, among other things, increasedecrease the size of the Credit Facility from $150,000$225,000 to $200,000, extend$170,000 and decrease the expiration of the reinvestment period to July 29, 2017, during which period Funding, subject to certain conditions, may make borrowings under the facility, and extend the stated maturity date from October 17, 2019 to July 30, 2020.
On March 1, 2016 the Credit Facility was amended to, among other things, make certain amendments to the computation of the borrowing base restrictions in the Credit Facility. The maximum borrowing capacity under the Credit Facility, the expiration of the reinvestment period and the stated maturity date of the Credit Facility did not change in connection with this amendment.
Through the reinvestment period,interest the Credit Facility bears interest atfrom one-month LIBOR plus 2.25% per annum. After the reinvestment period, the rate will reset to one-month LIBOR plus 2.75% per annum for the remaining term of the Credit Facility.2.15%. In addition to the stated interest expenserate on the Credit Facility, the Company is required to pay a non-usage fee at a rate between 0.50% and 2.00%1.75% per annum depending on the size of the unused portion of the Credit Facility.
The Credit Facility is
Golub Capital BDC, Inc. and Subsidiaries
Notes to Consolidated Financial Statements
(In thousands, except shares and per share data)
collateralized by all of the assets held by Funding, and GBDC has pledged its interests in Funding as collateral to Wells Fargo Bank, N.A., as the collateral agent, under an ancillary agreement to secure the obligations of GBDC as the transferor and servicer under the Credit Facility. Both GBDC and Funding have made customary representations and warranties and are required to comply with various covenants, reporting requirements and other customary requirements for similar credit facilities. Borrowing under the Credit Facility is subject to the leverage restrictions200% asset coverage requirements contained in the 1940 Act.
The Company has transferred certain loans and debt securities it has originated or acquired from time to time to Funding through a purchase and sale agreement and may cause Funding to originate or acquire loans in the future, consistent with the Company’s investment objectives.
Golub Capital BDC, Inc. and Subsidiaries
Notes to Consolidated Financial Statements
(In thousands, except shares and per share data)
Note 7. Borrowings - (continued)
As of September 30, 20162018 and 2015,2017, the Company had outstanding debt under the Credit Facility of $126,700$136,000 and $127,250,$63,100, respectively. For the years ended September 30, 20162018 and 2015,2017, the Company had borrowings on the Credit Facility of $379,150$491,500 and $486,950,$530,000, respectively, and repayments on the Credit Facility of $379,700$218,750 and $387,100,$593,600, respectively.
For the years ended September 30, 2016, 20152018, 2017 and 2014,2016, the components of interest expense, cash paid for interest and facility fees, average interest rates and average outstanding balances for the Credit Facility were as follows:
| | | | For the years ended September 30, | For the years ended September 30, |
| | 2016 | | 2015 | | 2014 | 2018 | | 2017 | | 2016 |
| Stated interest expense | $ | 3,403 |
| | $ | 1,934 |
| | $ | 2,335 |
| $ | 4,014 |
| | $ | 4,445 |
| | $ | 3,403 |
|
| Facility fees | 460 |
| | 616 |
| | 644 |
| 566 |
| | 539 |
| | 460 |
|
| Amortization of debt issuance costs | 1,304 |
| | 789 |
| | 816 |
| 668 |
| | 1,037 |
| | 1,304 |
|
| Total interest and other debt financing expenses | $ | 5,167 |
| | $ | 3,339 |
| | $ | 3,795 |
| $ | 5,248 |
| | $ | 6,021 |
| | $ | 5,167 |
|
| Cash paid for interest expense and facility fees | $ | 3,856 |
| | $ | 2,393 |
| | $ | 2,985 |
| $ | 4,450 |
| | $ | 4,952 |
| | $ | 3,856 |
|
| Average stated interest rate | 2.7 | % | | 2.5 | % | | 2.4 | % | 3.9 | % | | 3.2 | % | | 2.7 | % |
| Average outstanding balance | $ | 125,908 |
| | $ | 78,051 |
| | $ | 95,649 |
| $ | 102,985 |
| | $ | 138,786 |
| | $ | 125,908 |
|
On July 20, 2018, the 2010 Issuer entered into a credit facility (the “MS Credit Facility”) with Morgan Stanley Bank, N.A., as lender, Morgan Stanley Senior Secured Funding, Inc., as administrative agent, and U.S. Bank National Association, as collateral agent for the administrative agent and the lenders. As of September 30, 2018, the MS Credit Facility allowed the 2010 Issuer to borrow up to $300,000 at any one time outstanding. The period from the closing date until January 18, 2019 is referred to as the revolving period and during such revolving period, the 2010 Issuer may request drawdowns under the MS Credit Facility. During the period prior to the last day of the revolving period, borrowings under the MS Credit Facility bear interest at a rate equal to the one-month LIBOR plus 1.90%. Commencing on the last day of the revolving period, the interest rate on borrowings under the MS Credit Facility will reset to one-month LIBOR plus 2.15% for the remaining term of the MS Credit Facility. The scheduled maturity date of the MS Credit Facility is March 20, 2019.
The MS Credit Facility is secured by all of the assets held by the 2010 Issuer. Pursuant to a collateral management agreement, the Investment Adviser has agreed to perform certain duties with respect to the purchase and management of the assets securing the MS Credit Facility. The Investment Adviser will not be paid a fee for such services under the collateral management agreement, but will be reimbursed for expenses incurred in the performance of such obligations other than any ordinary overhead expenses, which shall not be reimbursed. The 2010 Issuer made customary representations and warranties and is required to comply with various covenants, reporting requirements and other customary requirements for similar credit facilities. Borrowing under the MS Credit Facility is subject to the leverage restrictions contained in 1940 Act.
Golub Capital BDC, Inc. and Subsidiaries
Notes to Consolidated Financial Statements
(In thousands, except shares and per share data)
As of September 30, 2018, the Company had outstanding debt under the MS Credit Facility of $234,700. For the year ended September 30, 2018, the Company had borrowings on the MS Credit Facility of $248,450 and repayments on the MS Credit Facility of $13,750.
For the years ended September 30, 2018, 2017 and 2016, the components of interest expense, cash paid for interest and facility fees, average interest rates and average outstanding balances for the MS Credit Facility were as follows:
|
| | | | | | | | | | | |
| | For the years ended September 30, |
| | 2018 | | 2017 | | 2016 |
| Stated interest expense | $ | 1,721 |
| | $ | — |
| | $ | — |
|
| Amortization of debt issuance costs | 301 |
| | — |
| | — |
|
| Total interest and other debt financing expenses | $ | 2,022 |
| | $ | — |
| | $ | — |
|
| Cash paid for interest expense and facility fees | $ | — |
| | $ | — |
| | $ | — |
|
| Average stated interest rate | 4.1 | % | | N/A |
| | N/A |
|
| Average outstanding balance | $ | 42,239 |
| | $ | — |
| | $ | — |
|
Revolver:Revolvers: On November 22, 2013, Golub Capital BDC Revolver Funding, LLC ("Revolver Funding") entered into a $15,000 revolving line of credit (as amended, the “Revolver”), which could have been increased up to $30,000, with The PrivateBank and Trust Company (“PrivateBank”).Company. On October 21, 2015, the Company and Revolver Funding terminated the Revolver with Private Bank.Revolver. There were no borrowings outstanding on the Revolver at the time of termination, and Revolver Funding was released of all obligations under the Revolver and all liens on the assets held by Revolver Funding collateralizing the Revolver were released.
The Revolver was collateralized by all of the assets held by Revolver Funding. Both GBDC and Revolver Funding made customary representations and warranties and were required to comply with various covenants, reporting requirements and other customary requirements for similar credit facilities. Borrowing under the Revolver was subject to the leverage restrictions contained in the 1940 Act. In addition, the Company paid a fee of 0.25% per annum on any unused portion of the Revolver.
As of
The revolver was not in existence for the years ended September 30, 20162018 and 2015, the Company had $0 outstanding debt under the Revolver.2017. For the years ended September 30, 2018, 2017 and 2016, and 2015, the Company had borrowings of $0 and repayments of $0 on the Revolver.weighted average outstanding balance was $0. For the yearsyear ended September 30, 2016, 2015 and 2014, the components of interest expense, cash paid for facility fees was $2 and total interest annualized average interest ratesexpense of $36 included $2 of facility fees and average outstanding balances for the Revolver were as follows:
|
| | | | | | | | | | |
| | For the years ended September 30, |
| | 2016 | | 2015 | | 2014 |
| Stated interest expense | $ | — |
| | $ | — |
| | 7 |
|
| Facility fees | 2 |
| | 38 |
| | 32 |
|
| Amortization of debt issuance costs | 34 |
| | 194 |
| | 43 |
|
| Total interest and other debt financing expenses | $ | 36 |
| | $ | 232 |
| | 82 |
|
| Cash paid for interest expense and facility fees | $ | 2 |
| | $ | 38 |
| | 39 |
|
| Average stated interest rate | N/A |
| | N/A |
| | 3.8 | % |
| Average outstanding balance | $ | — |
| | $ | — |
| | 185 |
|
On June 22, 2016, the Company entered into the Adviser Revolver with the Investment Adviser, with a maximum credit limit of $20,000 and an expiration date of June 22, 2019. The Adviser Revolver bears an interest rate equal to the short-term Applicable Federal Rate, (“AFR”), which was 0.6%2.5% as of September 30, 2016.2018. As of September 30, 2016,2018 and 2017, the Company had no outstanding debt under the Adviser Revolver,Revolver. For the years ended September 30, 2018 and 2017, the Company had no borrowings and repayments, did not incur any interest expense and no cash was paid for interest on the Adviser Revolver was not outstanding as of September 30, 2016.Revolver. For the year ended September 30, 2016, the annualized average stated interest rate was 0.7% on average outstanding borrowings of $26, interest expense was an amount less than $1 and cash paid for interest was an amount less than $1. For the year ended
Golub Capital BDC, Inc. and Subsidiaries
Notes to Consolidated Financial Statements
(In thousands, except shares and per share data)
Note 7. Borrowings - (continued)
September 30, 2016, the Company had borrowings on the Adviser Revolver of $9,500 and repayments on the Adviser Revolver of $9,500.
Other Short-Term Borrowings: Borrowings with original maturities of less than one year are classified as short-term. As of September 30, 2018 and 2017, there were no other short-term borrowings outstanding. Past short-term borrowings were the result of an investment sold under a repurchase agreement. Investments sold under repurchase agreements are accounted for as collateralized borrowings as the sale of the investment does not qualify for sale accounting under ASC Topic 860 and remain as an investment on the Consolidated Statements of Financial Condition. The Adviser Revolverinvestment sold under the repurchase agreement was notdenominated in existence forforeign currency and the
Golub Capital BDC, Inc. and Subsidiaries
Notes to Consolidated Financial Statements
(In thousands, except shares and per share data)
Company entered into the repurchase agreement to help mitigate the impact that an adverse change in exchange rates would have on the value of that investment.
During the year ended September 30, 2015.2018, proceeds from other short-term borrowings totaled $9,511 and repayments on other short-term borrowings totaled $9,359, respectively. During the years ended September 30, 2017 and 2016, there were no proceeds from or repayments on other short-term borrowings.
For the years ended September 30, 2018, 2017 and 2016, the effective interest rate on short-term borrowings was 4.8%, 0.0% and 0.0% and interest expense was $129, $0 and $0, respectively.
The average total debt outstanding (including the debt under the 2010 Debt Securitization, the 2014 Debt Securitization, SBA debentures, Credit Facility, MS Credit Facility, Adviser Revolver, and Adviser Revolver)other short-term borrowings) for the years ended September 30, 2018, 2017 and 2016, 2015was $822,823, $872,980 and 2014 was $826,366, $752,567 and $587,624, respectively.
For the years ended 2016, 2015September 30, 2018, 2017 and 2014,2016, the effective average annual interest rate, which includes amortization of debt issuancefinancing costs and non-usage facility fees, on the Company’s total debt outstanding (excluding secured borrowings) was 4.0%, 3.6% and 3.4%, 3.3% and 3.2%, respectively.
A summary of the Company’s maturity requirements for borrowings as of September 30, 20162018 is as follows:
| | | | Payments Due by Period | Payments Due by Period |
| | Total | | Less Than 1 Year | | 1 – 3 Years | | 3 – 5 Years | | More Than 5 Years | Total | | Less Than 1 Year | | 1 – 3 Years | | 3 – 5 Years | | More Than 5 Years |
| 2010 Debt Securitization | $ | 215,000 |
| | $ | — |
| | $ | — |
| | $ | — |
| | $ | 215,000 |
| |
| 2014 Debt Securitization | 246,000 |
| | — |
| | — |
| | — |
| | 246,000 |
| $ | 197,483 |
| | $ | — |
| | $ | — |
| | $ | — |
| | $ | 197,483 |
|
| SBA debentures | 277,000 |
| | — |
| | — |
| | 55,300 |
| | 221,700 |
| 277,500 |
| | — |
| | 35,300 |
| | 102,950 |
| | 139,250 |
|
| Credit Facility | 126,700 |
| | — |
| | — |
| | 126,700 |
| | — |
| 136,000 |
| | — |
| | — |
| | 136,000 |
| | — |
|
| MS Credit Facility | | 234,700 |
| | 234,700 |
| | — |
| | — |
| | — |
|
| Adviser Revolver | — |
| | — |
| | — |
| | — |
| | — |
| — |
| | — |
| | — |
| | — |
| | — |
|
| Total borrowings | $ | 864,700 |
| | $ | — |
| | $ | — |
| | $ | 182,000 |
| | $ | 682,700 |
| |
| Total debt | | $ | 845,683 |
| | $ | 234,700 |
| | $ | 35,300 |
| | $ | 238,950 |
| | $ | 336,733 |
|
Secured Borrowings: Certain partial loan sales do not qualify for sale accounting under ASC Topic 860 because these sales do not meet the definition of a “participating interest”, as defined in the guidance, in order for sale treatment to be allowed. Participations or other partial loan sales which do not meet the definition of a participating interest remain as an investment on the consolidated statementConsolidated Statement of financial conditionFinancial Condition and the portion sold is recorded as a secured borrowing in the liabilities section of the consolidated statementConsolidated Statement of financial condition.Financial Condition. For these partial loan sales, the interest earned on the entire loan balance is recorded within “interest income” and the interest earned by the buyer in the partial loan sale is recorded within “interest and other debt financing expenses” in the consolidated statementConsolidated Statement of operations.Operations.
As of September 30, 20162018 and 2015, the Company recognized2017, there were no secured borrowings at fair value of $475 and $355, respectively, and the fair value of the loans that are associated with these secured borrowings was $2,305 and $1,256, respectively. Theseoutstanding.
Past secured borrowings were the result of the Company’s completion of partial loan sales of one stop loans associated with twoa portfolio companiescompany that did not meet the definition of a “participating interest”.interest.” As a result, sale treatment was not allowed and thesethe partial loan sales were treated as secured borrowings.
During the years ended September 30, 2016, 20152018, 2017 and 2014,2016, there were no partial loan sales totaling $0, $0 and $10,295, respectively, net fundings on revolving and delayed draw secured borrowings totaling $155,totaled $0, $0, and $4,818,$155, respectively, and repayments on secured borrowings totaled $0, $475 and $35 $34respectively.
Golub Capital BDC, Inc. and $23,677, respectively. Subsidiaries
Notes to Consolidated Financial Statements
(In thousands, except shares and per share data)
For the years ended September 30, 2016, 20152018, 2017 and 2014,2016, the effective average interest rate on secured borrowings, which includes amortization of original issuance costs, was 0.0%, 3.4% and 4.2%, 4.5%,respectively, and 8.3%, respectively, interest expense was $14, $13,$0, $9 and $932,$14, respectively and amortization of original issue discount was $0, $2$3 and $264,$0, respectively.
Golub Capital BDC, Inc. and Subsidiaries
Notes to Consolidated Financial Statements
(In thousands, except shares and per share data)
Note 8.7. Federal Income Tax Matters
The Company has elected to be treated and intends to be subject to tax as a RIC under Subchapter M of the Code. As a result, the Company must distribute substantially all of its net taxable income each tax year as dividends to its stockholders. Accordingly, no provision for federal income tax has been made in the financial statements.
Dividends from net investment income and distributions from net realized capital gains are determined in accordance with U.S. federal tax regulations, which may differ from amounts determined in accordance with GAAP and those differences could be material. These book-to-tax differences are either temporary or permanent in nature. Reclassifications due to permanent book-tax differences, including distributions representing a return of capital, have no impact on net assets.
The following differences were reclassified for tax purposes for the years ended September 30, 2016, 20152018, 2017 and 2014:
| | | | Years ended September 30, | Years ended September 30, |
| | 2016 | | 2015 | | 2014 | 2018 | | 2017 | | 2016 |
| Increase/(decrease) in Paid in Capital in Excess of Par | $ | (341 | ) | | $ | (71 | ) | | $ | 876 |
| $ | (5 | ) | | $ | 38 |
| | $ | (341 | ) |
| Increase/(decrease) in Capital Distributions in Excess of and Undistributed Net Investment Income | 4,083 |
| | (242 | ) | | 2,190 |
| 10,325 |
| | (1,120 | ) | | 4,083 |
|
| Increase/(decrease) in Net Realized Gain (Loss) on Investments | (3,742 | ) | | 313 |
| | (3,066 | ) | (10,320 | ) | | 1,082 |
| | (3,742 | ) |
Taxable income generally differs from net increase (decrease) in net assets resulting from operations for financial reporting purposes due to temporary and permanent differences in the recognition of income and expenses and generally excludes unrealized appreciation (depreciation) on investments as investment gains and losses are not included in taxable income until they are realized.
Capital losses in excess of capital gains earned in a tax year may generally be carried forward and used to offset capital gains, subject to certain limitations. Capital losses incurred by the Company in tax years beginning after September 30, 2011 are not subject to expiration and retain their character as either short-term or long-term capital losses. As of September 30, 2016,2018, the Company estimates that it will not have any capital loss carryforwardcarry forward available for use in subsequent tax years.
The following table reconciles net increase in net assets resulting from operations to taxable income for the years ended September 30, 2016, 20152018, 2017 and 2014:2016:
| | | | Years ended September 30, | Years ended September 30, |
| | 2016 | | 2015 | | 2014 | 2018 | | 2017 | | 2016 |
| Net increase in net assets resulting from operations | $ | 69,204 |
| | $ | 70,791 |
| | $ | 65,388 |
| $ | 81,970 |
| | $ | 82,288 |
| | $ | 69,204 |
|
| Net change in unrealized (appreciation) depreciation on investments | 2,030 |
| | (2,438 | ) | | (3,348 | ) | |
| Net change in unrealized (appreciation) depreciation on investments and foreign currency translation | | 11,587 |
| | (3,337 | ) | | 2,030 |
|
| Net change in unrealized (appreciation) depreciation on secured borrowings | — |
| | (2 | ) | | (121 | ) | — |
| | (3 | ) | | — |
|
| Other income not currently taxable | (6,129 | ) | | (1,244 | ) | | (3,517 | ) | (11,004 | ) | | (7,509 | ) | | (6,129 | ) |
| Expenses not currently deductible | 1,665 |
| | — |
| | — |
| 324 |
| | 2,911 |
| | 1,665 |
|
| Other income for tax but not book | 5,774 |
| | 2,797 |
| | 924 |
| 9,730 |
| | 9,346 |
| | 5,774 |
|
| Other deductions/losses for tax not book | (279 | ) | | (873 | ) | | (2 | ) | (2 | ) | | (36 | ) | | (279 | ) |
| Other realized gain/loss differences | 1,275 |
| | 1,994 |
| | 3,650 |
| (6,249 | ) | | (5,575 | ) | | 1,275 |
|
| Capital loss carryforward | — |
| | — |
| | (3,497 | ) | |
| Taxable income before deductions for distributions | $ | 73,540 |
| | $ | 71,025 |
| | $ | 59,477 |
| $ | 86,356 |
| | $ | 78,085 |
| | $ | 73,540 |
|
Golub Capital BDC, Inc. and Subsidiaries
Notes to Consolidated Financial Statements
(In thousands, except shares and per share data)
Note 8. Federal Income Tax Matters - (continued)
The tax character of distributions paid during the years ended September 30, 2016, 20152018, 2017 and 20142016 was as follows:
| | | | Years ended September 30, | Years ended September 30, |
| | 2016 | | 2015 | | 2014 | 2018 | | 2017 | | 2016 |
| Ordinary Income | $ | 54,461 |
| | $ | 58,152 |
| | $ | 57,823 |
| $ | 78,349 |
| | $ | 85,304 |
| | $ | 54,461 |
|
| Long-Term Capital Gains | 12,418 |
| | 4,817 |
| | — |
| 2,959 |
| | 1,139 |
| | 12,418 |
|
| Return of Capital | — |
| | — |
| | — |
| |
The tax basis components of distributable earnings/(accumulated losses) and reconciliation to accumulated earnings/(deficit) on a book basis for the years ended September 30, 2016, 20152018, 2017 and 20142016 were as follows:
| | | | As of September 30, | As of September 30, |
| | 2016 | | 2015 | | 2014 | 2018 | | 2017 | | 2016 |
| Undistributed ordinary income – tax basis | $ | 14,792 |
| | $ | 3,869 |
| | $ | — |
| $ | 1,844 |
| | $ | 4,374 |
| | $ | 14,792 |
|
| Undistributed realized gains – tax basis | 1,993 |
| | 6,182 |
| | 1,654 |
| 10,539 |
| | 2,958 |
| | 1,993 |
|
| Net unrealized appreciation (depreciation) on investments | 10,416 |
| | 13,433 |
| | 11,268 |
| 14,468 |
| | 18,532 |
| | 10,416 |
|
| Other temporary differences | (4,429 | ) | | (3,378 | ) | | (709 | ) | (7,604 | ) | | (7,285 | ) | | (4,429 | ) |
| Total accumulated earnings (deficit) – book basis | $ | 22,772 |
| | $ | 20,106 |
| | $ | 12,213 |
| $ | 19,247 |
| | $ | 18,579 |
| | $ | 22,772 |
|
For the tax year ended September 30, 2016,2018, the Company estimates taxable income in excess of the distributions made from such taxable income during the tax year, and therefore, the Company has elected to carry forward the excess for distribution to stockholders in 2017.2019. The amount carried forward to 20172019 is estimated to be approximately $16,785,$12,383, although this amount will not be finalized until the 20162018 tax returns are filed in 2017.2019.
As of September 30, 2016,2018, the Federal tax cost of investments was $1,652,861$1,771,041 resulting in estimated gross unrealized gains and losses of $39,449$43,796 and $31,698,$31,996, respectively.
The differences between the components of distributable earnings on a tax basis and the amounts reflected in the consolidated statements of changes in net assets are primarily due to temporary book-tax differences that will reverse in a subsequent period.
Note 9.8. Commitments and Contingencies
Commitments:The Company had outstanding commitments to fund investments totaling $81,417$57,650 and $121,545$60,497 under various undrawn revolvers and other credit facilities as of September 30, 20162018 and 2015,2017, respectively. In addition, asAs described in Note 4, the Company had commitments of up to $66,360$99,593 and $75,215$77,543 to SLF as of September 30, 20162018 and 2015,2017, respectively that may be contributed primarily for the purpose of funding new investments approved by the SLF investment committee.
Indemnifications: In the normal course of business, the Company enters into contracts and agreements that contain a variety of representations and warranties that provide general indemnifications. The Company’s maximum exposure under these arrangements is unknown, as these involve future claims that may be made against the Company but that have not occurred. The Company expects the risk of any future obligations under these indemnifications to be remote.
Off-balance sheet risk:Off-balance sheet risk refers to an unrecorded potential liability that may result in a future obligation or loss, even though it does not appear on the consolidated statementsConsolidated Statements of financial condition.Financial Condition. The Company has entered and, in the future, may again enter into derivative instruments that contain elements of off-balance sheet market and credit risk. There were no commitments outstanding for derivative contracts as of September 30, 20162018 and 2015.2017. Derivative instruments can be affected by market conditions, such as interest rate volatility, which could impact the fair value of the derivative instruments. If market conditions move against the Company, it may not achieve the anticipated benefits of the
Golub Capital BDC, Inc. and Subsidiaries
Notes to Consolidated Financial Statements
(In thousands, except shares and per share data)
Note 9. Commitments and Contingencies - (continued)
derivative instruments and may realize a loss. The Company minimizes market risk through monitoring its investments and borrowings.
Golub Capital BDC, Inc. and Subsidiaries
Notes to Consolidated Financial Statements
(In thousands, except shares and per share data)
Concentration of credit and counterparty risk: Credit risk arises primarily from the potential inability of counterparties to perform in accordance with the terms of the contract. The Company has engaged and, in the future, may engage again in derivative transactions with counterparties. In the event that the counterparties do not fulfill their obligations, the Company may be exposed to risk. The risk of default depends on the creditworthiness of the counterparties or issuers of the instruments. The Company’s maximum loss that it could incur related to counterparty risk on its derivative instruments is the value of the collateral for that respective derivative instrument. It is the Company’s policy to review, as necessary, the credit standing of each counterparty.
Legal proceedings: In the normal course of business, the Company may be subject to legal and regulatory proceedings that are generally incidental to its ongoing operations. While there can be no assurance of the ultimate disposition of any such proceedings, the Company does not believe any disposition will have a material adverse effect on the Company’s consolidated financial statements.
Note 10. Financial Highlights
The financial highlights for the Company are as follows:
|
| | | | | | | | | | | | | | | | | | | | |
| | | Years ended September 30, |
Per share data(1): | | 2016 | | 2015 | | 2014 | | 2013 | | 2012 |
| Net asset value at beginning of period | | $ | 15.80 |
| | $ | 15.55 |
| | $ | 15.21 |
| | $ | 14.60 |
| | $ | 14.56 |
|
Net increase in net assets as a result of issuance of shares(2) | | 0.06 |
| | — |
| | — |
| | — |
| | — |
|
| Net increase in net assets as a result of public offering | | 0.05 |
| | 0.09 |
| | 0.18 |
| | 0.57 |
| | 0.04 |
|
| Costs related to public offering | | — |
| | — |
| | — |
| | (0.03 | ) | | (0.03 | ) |
| Dividends and distributions declared: | | | | | | | | | | |
| From net investment income | | (1.04 | ) | | (1.18 | ) | | (1.28 | ) | | (1.15 | ) | | (1.24 | ) |
| From capital gains | | (0.24 | ) | | (0.10 | ) | | — |
| | — |
| | — |
|
| From return of capital | | — |
| | — |
| | — |
| | (0.13 | ) | | (0.04 | ) |
| Net investment income | | 1.25 |
| (3) | 1.20 |
| | 1.26 |
| | 1.29 |
| | 1.15 |
|
| Net realized gain (loss) on investments | | 0.12 |
| | 0.19 |
| | 0.11 |
| | (0.04 | ) | | (0.23 | ) |
| Net realized gain on derivative instruments | | — |
| | — |
| | — |
| | — |
| | 0.09 |
|
| Net change in unrealized appreciation (depreciation) on investments | | (0.04 | ) | | 0.05 |
| | 0.07 |
| | 0.10 |
| | 0.22 |
|
| Net change in unrealized appreciation (depreciation) on derivative instruments | | — |
| | — |
| | — |
| | — |
| | 0.08 |
|
| Net asset value at ending of period | | $ | 15.96 |
|
| $ | 15.80 |
|
| $ | 15.55 |
| | $ | 15.21 |
| | $ | 14.60 |
|
| Per share market value at end of period | | $ | 18.57 |
| | $ | 15.98 |
| | $ | 15.95 |
| | $ | 17.32 |
| | $ | 15.90 |
|
Total return based on market value(4) | | 25.36 | % | | 8.21 | % | | (0.52 | )% | | 16.98 | % | | 15.69 | % |
| Number of common shares outstanding | | 55,059,067 |
| | 51,300,193 |
| | 47,119,498 |
| | 43,282,932 |
| | 25,688,101 |
|
Golub Capital BDC, Inc. and Subsidiaries
Notes to Consolidated Financial Statements
(In thousands, except shares and per share data)
Note 10.9. Financial Highlights – (continued)
The financial highlights for the Company are as follows:
|
| | | | | | | | | | | | | | | | | | | | |
| | | Years ended September 30, |
| Listed below are supplemental data and ratios to the financial highlights: | | 2016 | | 2015 | | 2014 | | 2013 | | 2012 |
| Ratio of expenses (without incentive fees) to average net assets | | 6.70 | % | | 6.59 | % | | 6.16 | % | | 5.73 | % | | 6.63 | % |
Ratio of incentive fees to average net assets(5)(6) | | 0.88 | % | | 1.33 | % | | 1.46 | % | | 1.91 | % | | 1.74 | % |
Ratio of total expense to average net assets(5)(6) | | 7.58 | % | | 7.92 | % | | 7.61 | % | | 7.65 | % | | 8.37 | % |
| Ratio of net investment income to average net assets | | 7.88 | % | | 7.66 | % | | 8.12 | % | | 8.62 | % | | 7.78 | % |
Total return based on average net asset value(7) | | 8.39 | % | | 9.19 | % | | 9.39 | % | | 9.03 | % | | 8.86 | % |
| Net assets at end of period | | $ | 878,825 |
| | $ | 810,870 |
| | $ | 732,739 |
| | $ | 658,236 |
| | $ | 375,129 |
|
| Average debt outstanding | | $ | 826,366 |
| | $ | 752,567 |
| | $ | 587,624 |
| | $ | 378,843 |
| | $ | 306,969 |
|
| Average debt outstanding per share | | $ | 15.01 |
| | $ | 14.67 |
| | $ | 12.47 |
| | $ | 8.75 |
| | $ | 11.95 |
|
Asset coverage ratio(5) | | 248.78 | % | | 237.28 | % | | 249.12 | % | | 373.20 | % | | 263.20 | % |
| Portfolio turnover | | 33.73 | % | | 47.69 | % | | 46.50 | % | | 40.05 | % | | 32.55 | % |
|
| | | | | | | | | | | | | | | | | | | | |
| | | Years ended September 30, |
Per share data:(1) | | 2018 | | 2017 | | 2016 | | 2015 | | 2014 |
| Net asset value at beginning of period | | $ | 16.08 |
| | $ | 15.96 |
| | $ | 15.80 |
| | $ | 15.55 |
| | $ | 15.21 |
|
Net increase in net assets as a result of issuance of shares(2) | | 0.01 |
| | 0.01 |
| | 0.06 |
| | — |
| | — |
|
| Net increase in net assets as a result of public offering | | — |
| | 0.19 |
| | 0.05 |
| | 0.09 |
| | 0.18 |
|
| Distributions declared: | | | | | | | | | | |
| From net investment income | | (1.31 | ) | | (1.51 | ) | | (1.04 | ) | | (1.18 | ) | | (1.28 | ) |
| From capital gains | | (0.05 | ) | | (0.02 | ) | | (0.24 | ) | | (0.10 | ) | | — |
|
| From return of capital | | — |
| | — |
| | — |
| | — |
| | — |
|
Net investment income(3) | | 1.27 |
| | 1.23 |
| | 1.25 |
| | 1.20 |
| | 1.26 |
|
| Net realized gain (loss) on investments and foreign currency transactions | | 0.29 |
| | 0.16 |
| | 0.12 |
| | 0.19 |
| | 0.11 |
|
| Net change in unrealized appreciation (depreciation) on investments and foreign currency translation | | (0.19 | ) | | 0.06 |
| | (0.04 | ) | | 0.05 |
| | 0.07 |
|
| Net asset value at end of period | | $ | 16.10 |
| | $ | 16.08 |
| | $ | 15.96 |
| | $ | 15.80 |
| | $ | 15.55 |
|
| Per share market value at end of period | | $ | 18.75 |
| | $ | 18.82 |
| | $ | 18.57 |
| | $ | 15.98 |
| | $ | 15.95 |
|
Total return based on market value(4) | | 7.65 | % | | 10.23 | % | | 25.36 | % | | 8.21 | % | | (0.52 | )% |
| Number of common shares outstanding | | 60,165,454 |
| | 59,577,293 |
| | 55,059,067 |
| | 51,300,193 |
| | 47,119,498 |
|
|
| | | | | | | | | | | | | | | | | | | | |
| | | Years ended September 30, |
| Listed below are supplemental data and ratios to the financial highlights: | | 2018 | | 2017 | | 2016 | | 2015 | | 2014 |
| Ratio of net investment income to average net assets | | 7.88 | % | | 7.67 | % | | 7.88 | % | | 7.66 | % | | 8.12 | % |
| Ratio of total expenses to average net assets | | 7.89 | % | | 7.52 | % | | 7.58 | % | | 7.92 | % | | 7.61 | % |
| Ratio of incentive fees to average net assets | | 1.36 | % | | 0.83 | % | | 0.88 | % | | 1.33 | % | | 1.46 | % |
| Ratio of expenses (without incentive fees) to average net assets | | 6.53 | % | | 6.69 | % | | 6.70 | % | | 6.59 | % | | 6.16 | % |
Total return based on average net asset value(5) | | 8.50 | % | | 9.08 | % | | 8.39 | % | | 9.19 | % | | 9.39 | % |
| Net assets at end of period | | $ | 968,854 |
| | $ | 957,946 |
| | $ | 878,825 |
| | $ | 810,870 |
| | $ | 732,739 |
|
| Average debt outstanding | | $ | 822,823 |
| | $ | 872,980 |
| | $ | 826,366 |
| | $ | 752,657 |
| | $ | 587,624 |
|
| Average debt outstanding per share | | $ | 13.68 |
| | $ | 14.65 |
| | $ | 15.01 |
| | $ | 14.67 |
| | $ | 12.47 |
|
| Portfolio turnover | | 31.91 | % | | 34.06 | % | | 33.73 | % | | 47.69 | % | | 46.50 | % |
Asset coverage ratio(6) | | 269.51 | % | | 285.23 | % | | 248.78 | % | | 237.28 | % | | 249.12 | % |
Asset coverage ratio per unit(7) | | $ | 2,695 |
| | $ | 2,852 |
| | $ | 2,488 |
| | $ | 2,373 |
| | $ | 2,491 |
|
Average market value per unit:(8) | | | | | | | | | | |
| 2010 Debt Securitization | | N/A |
| | N/A |
| | N/A |
| | N/A |
| | N/A |
|
| 2014 Debt Securitization | | N/A |
| | N/A |
| | N/A |
| | N/A |
| | N/A |
|
| SBA Debentures | | N/A |
| | N/A |
| | N/A |
| | N/A |
| | N/A |
|
| Credit Facility | | N/A |
| | N/A |
| | N/A |
| | N/A |
| | N/A |
|
| MS Credit Facility | | N/A |
| | — |
| | — |
| | — |
| | — |
|
| Revolver | | — |
| | — |
| | N/A |
| | N/A |
| | N/A |
|
| Adviser Revolver | | N/A |
| | N/A |
| | N/A |
| | — |
| | — |
|
| |
(1) | Based on actual number of shares outstanding at the end of the corresponding period or the weighted average shares outstanding for the period, unless otherwise noted, as appropriate. |
Golub Capital BDC, Inc. and Subsidiaries
Notes to Consolidated Financial Statements
(In thousands, except shares and per share data)
| |
(2) | Net increase in net assets as a result of issuance of shares related to shares issued through the DRIP and private placement.DRIP. |
| |
(3) | Net investment income per share for the years ended September 30, 2017 and 2016 ended is shown after a net expense of $17 and $333, respectively, for U.S. federal excise tax. |
| |
(4) | Total return based on market value assumes distributions are reinvested. |
| |
(4)
| Net investment income per share forreinvested in accordance with the year ended September 30, 2016 is shown after a net expense of $333 for U.S. federal excise tax.DRIP. Total return does not include sales load. |
| |
(5) | During the year ended September 30, 2012, the Investment Adviser irrevocably waived $647 of incentive fees attributable to the Company's total return swap that was terminated in 2012. Had the Investment Adviser not waived these fees, the annualized ratio of incentive fees to average net assets and the annualized ratio of total expenses to average net assets would have been 1.92% and 8.55%, respectively, for the year ended September 30, 2012. |
| |
(6)
| During the year ended September 30, 2013, the Investment Adviser irrevocably waived $250 of incentive fees. Had the Investment Adviser not waived these fees, the annualized ratio of incentive fees to average net assets and the annualized ratio of total expenses to average net assets would have been 1.96% and 7.69%, respectively, for the year ended September 30, 2013. |
| |
(7)
| Total return based on average net asset value is calculated as (a) the net increase in net assets resulting from operations divided by (b) the daily average of total net assets. Total return does not include sales load. |
| |
(8)(6)
| In accordance with the 1940 Act, with certain limited exceptions, (including the Company's exemptive relief related to SBA debentures), the Company currently is only allowed to borrow amounts such that its assetsasset coverage, as defined in the 1940 Act, is at least 200% after such borrowing.borrowing (excluding the Company's SBA debentures pursuant to exemptive relief received by the Company from the SEC). |
| |
(7) | Asset coverage ratio per unit is the ratio of the carrying value of our total consolidated assets, less all liabilities and indebtedness not represented by senior securities, to the aggregate amount of senior securities representing indebtedness. Asset coverage ratio per unit is expressed in terms of dollar amounts per $1,000 of indebtedness. These amounts exclude the SBA debentures pursuant to exemptive relief the Company received from the SEC on September 13, 2011. |
| |
(8) | Not applicable because such senior securities are not registered for public trading. |
Golub Capital BDC, Inc. and Subsidiaries
Notes to Consolidated Financial Statements
(In thousands, except shares and per share data)
Note 11.10. Earnings Per Share
The following information sets forth the computation of the net increase in net assets per share resulting from operations for the years ended September 30, 2016, 20152018, 2017 and 2014:2016:
| | | | Years ended September 30, | Years ended September 30, |
| | 2016 | | 2015 | | 2014 | 2018 | | 2017 | | 2016 |
| Earnings available to stockholders | $ | 69,204 |
| | $ | 70,791 |
| | $ | 65,388 |
| $ | 81,970 |
| | $ | 82,288 |
| | $ | 69,204 |
|
| Basic and diluted weighted average shares outstanding | 51,948,378 |
| | 49,017,777 |
| | 45,277,111 |
| 59,803,208 |
| | 56,913,064 |
| | 51,948,378 |
|
| Basic and diluted earnings per share | $ | 1.33 |
| | $ | 1.44 |
| | $ | 1.44 |
| $ | 1.37 |
| | $ | 1.45 |
| | $ | 1.33 |
|
Note 12.11. Common Stock Offerings
The following table summarizes the total shares issued and proceeds received in private placements and public offerings, net of underwriting discounts and offering costs, of the Company’s common stock for the years ended September 30, 2016, 20152018, 2017 and 2014:2016:
|
| | | | | | | | | | | |
| | Years ended September 30, |
| | 2016 | | 2015 | | 2014 |
| Shares issued | 3,320,456 |
| | 4,002,292 |
| | 3,666,855 |
|
| Offering price per share | Various |
| | $ | 17.42 |
| | 18.05 |
|
| Proceeds net of underwriting discounts and offering costs | $ | 58,260 |
| | $ | 67,370 |
| | $ | 64,106 |
|
On March 18, 2014, GBDC, Inc. priced a public offering of 3,500,000 shares of its common stock at a public offering price of $18.05 per share. On April 23, 2014, GBDC sold an additional 166,855 shares of its common stock at a public offering price of $18.05 per share pursuant to the underwriters’ partial exercise of the option to purchase additional shares granted in connection with the public offering in March 2014.
On April 10, 2015, GBDC priced a public offering of 3,500,000 shares of its common stock at a public offering price of $17.42 per share. On May 7, 2015, GBDC sold an additional 502,292 shares of its common stock at a public offering price of $17.42 per share pursuant to the underwriters’ partial exercise of the option to purchase additional shares granted in connection with the public offering in April 2015. |
| | | | | | | | | | | |
| | Years ended September 30, |
| | 2018 | | 2017 | | 2016 |
| Shares issued | — |
| | 3,982,721 |
| | 3,320,456 |
|
| Offering price per share | — |
| | Various |
| | Various |
|
| Proceeds net of underwriting discounts and offering costs | $ | — |
| | $ | 73,614 |
| | $ | 58,260 |
|
On July 18, 2016, GBDC entered into a Securities Purchase Agreement between the Company and a third party institutional investor for the sale of 1,433,486 shares of Company's common stock at a price per share of $17.44 per share.
On August 15, 2016, GBDC priced a public offering of 1,750,000 shares of its common stock at a public offering price of $18.35 per share. On September 19, 2016, GBDC sold an additional 136,970 shares of its common stock at a public offering price of $18.35 per share pursuant to the underwriters’ partial exercise of the option to purchase additional shares granted in connection with the public offering in August 2016.
On March 21, 2017, GBDC priced a public offering of 1,750,000 shares of its common stock at a public offering price of $19.03 per share. On April 6, 2017, GBDC sold an additional 262,500 shares of its common stock at a public offering price of $19.03 per share pursuant to the underwriters’ partial exercise of the option to purchase additional shares granted in connection with the public offering in March 2017. Golub Capital BDC, Inc. and Subsidiaries
Notes to Consolidated Financial Statements
(In thousands, except shares and per share data)
On June 6, 2017, GBDC priced a public offering of 1,750,000 shares of its common stock at a public offering price of $19.30 per share. On July 5, 2017, GBDC sold an additional 220,221 shares of its common stock at a public offering price of $19.30 per share pursuant to the underwriters’ partial exercise of the option to purchase additional shares granted in connection with the public offering in June 2017.
Note 13.12. Dividends and Distributions
The Company’s dividends and distributions are recorded on the ex-dividend date. The following table summarizes the Company’s dividend declarations and distributions during the years ended September 30, 2016, 20152018, 2017 and 2014:2016:
|
| | | | | | | | | | | | | | | | | | | | |
| Date Declared | | Record Date | | Payment Date | | Amount Per Share | | Cash Distribution | | DRIP Shares Issued | | DRIP Shares Value |
| Fiscal Year ended September 30, 2014 | | |
| | |
| | |
| | |
|
| | 11/26/2013 | | 12/17/2013 | | 12/27/2013 | | $ | 0.32 |
| | $ | 13,092 |
| | 42,643 |
| | $ | 758 |
|
| | 02/04/2014 | | 03/17/2014 | | 03/28/2014 | | $ | 0.32 |
| | $ | 13,326 |
| | 32,033 |
| | $ | 539 |
|
| | 05/06/2014 | | 06/16/2014 | | 06/27/2014 | | $ | 0.32 |
| | $ | 14,356 |
| | 40,567 |
| | $ | 692 |
|
| | 08/05/2014 | | 09/16/2014 | | 09/26/2014 | | $ | 0.32 |
| | $ | 14,217 |
| | 54,468 |
| | $ | 843 |
|
| Fiscal Year ended September 30, 2015 | | |
| | |
| | |
| | |
|
| | 11/17/2014 | | 12/18/2014 | | 12/29/2014 | | $ | 0.32 |
| | $ | 14,193 |
| | 52,020 |
| | $ | 885 |
|
| | 02/03/2015 | | 03/20/2015 | | 03/27/2015 | | $ | 0.32 |
| | $ | 14,187 |
| | 53,694 |
| | $ | 908 |
|
| | 05/11/2015 | | 06/18/2015 | | 06/29/2015 | | $ | 0.32 |
| | $ | 15,888 |
| | 31,930 |
| | $ | 505 |
|
| | 08/04/2015 | | 09/07/2015 | | 09/29/2015 | | $ | 0.32 |
| | $ | 15,762 |
| | 40,759 |
| | $ | 641 |
|
| Fiscal Year ended September 30, 2016 | | |
| | |
| | |
| | |
|
| | 11/17/2015 | | 12/11/2015 | | 12/29/2015 | | $ | 0.32 |
| | $ | 15,149 |
| | 79,594 |
| | $ | 1,267 |
|
| | 02/02/2016 | | 03/07/2016 | | 03/30/2016 | | $ | 0.32 |
| | $ | 14,287 |
| | 131,434 |
| | $ | 2,155 |
|
| | 05/03/2016 | | 06/06/2016 | | 06/29/2016 | | $ | 0.32 |
| | $ | 14,558 |
| | 112,104 |
| | $ | 1,926 |
|
| | 08/03/2016 | | 09/05/2016 | | 09/29/2016 | | $ | 0.32 |
| | $ | 15,515 |
| | 115,286 |
| | $ | 2,022 |
|
|
| | | | | | | | | | | | | | | | | | | |
| Date Declared | | Record Date | | Payment Date | | Amount Per Share | | Cash Distribution | | DRIP Shares Issued | | DRIP Shares Value |
| Year ended September 31, 2016 | | | | | | | | | | |
| 11/17/2015 | | 12/11/2015 | | 12/29/2015 | | $ | 0.32 |
| | $ | 15,149 |
| | 79,594 |
| | $ | 1,267 |
|
| 02/02/2016 | | 03/07/2016 | | 03/30/2016 | | $ | 0.32 |
| | $ | 14,287 |
| | 131,434 |
| | $ | 2,155 |
|
| 05/03/2016 | | 06/06/2016 | | 06/29/2016 | | $ | 0.32 |
| | $ | 14,558 |
| | 112,104 |
| | $ | 1,926 |
|
| 08/03/2016 | | 09/05/2016 | | 09/29/2016 | | $ | 0.32 |
| | $ | 15,515 |
| | 115,286 |
| | $ | 2,022 |
|
| Year ended September 30, 2017 | | | | |
| | |
| | |
| | |
|
| 11/14/2016 | | 12/12/2016 | | 12/29/2016 | | $ | 0.57 |
| (1) | $ | 28,239 |
| | 177,970 |
| | $ | 3,145 |
|
| 02/07/2017 | | 03/07/2017 | | 03/30/2017 | | $ | 0.32 |
| | $ | 15,509 |
| | 116,386 |
| | $ | 2,167 |
|
| 05/04/2017 | | 06/06/2017 | | 06/29/2017 | | $ | 0.32 |
| | $ | 16,186 |
| | 119,251 |
| | $ | 2,171 |
|
| 08/02/2017 | | 09/06/2017 | | 09/29/2017 | | $ | 0.32 |
| | $ | 16,847 |
| | 121,898 |
| | $ | 2,179 |
|
| Year ended September 30, 2018 | | | | |
| | |
| | |
| | |
|
| 11/17/2017 | | 12/12/2017 | | 12/28/2017 | | $ | 0.40 |
| (2) | $ | 20,959 |
| | 163,955 |
| | $ | 2,872 |
|
| 02/06/2018 | | 03/08/2018 | | 03/30/2018 | | $ | 0.32 |
| | $ | 16,978 |
| | 126,283 |
| | $ | 2,139 |
|
| 05/04/2018 | | 06/08/2018 | | 06/28/2018 | | $ | 0.32 |
| | $ | 16,754 |
| | 138,993 |
| | $ | 2,404 |
|
| 08/07/2018 | | 09/07/2018 | | 09/28/2018 | | $ | 0.32 |
| | $ | 16,371 |
| | 158,930 |
| | $ | 2,830 |
|
| |
(1) | Includes a special distribution of $0.25 per share. |
| |
(2) | Includes a special distribution of $0.08 per share. |
Note 14.13. Subsequent Events
In preparing these financial statements, the Company has evaluated events and transactions for potential recognition or disclosure through November 28, 2018, the date the financial statements were available to be issued. There are no subsequent events to disclose except for the following:
On November 14, 2016,1, 2018, Golub Capital BDC CLO III LLC (the “2018 Issuer”), an indirect, wholly-owned, consolidated subsidiary of the Company entered into a Purchase Agreement (the “Purchase Agreement”) with Golub Capital BDC CLO III Depositor LLC, as depositor, and Morgan Stanley & Co. LLC, as the initial purchaser (the “Initial Purchaser”), pursuant to which the 2018 Issuer agreed to sell certain notes to be issued pursuant to an indenture (the “2018 Notes”) to the Initial Purchaser as part of a new $602.4 million term debt securitization (the “GBDC 2018 Debt Securitization”). Term debt securitizations are also known as CLOs and are a form of secured financing incurred by the Company, which is consolidated by the Company and subject to its overall asset coverage requirement.
Golub Capital BDC, Inc. and Subsidiaries
Notes to Consolidated Financial Statements
(In thousands, except shares and per share data)
On November 1, 2018, the 2010 Issuer entered into an amendment (the “Credit Facility Amendment”) to the documents governing the MS Credit Facility. The Credit Facility Amendment was effective as of November 1, 2018. The Credit Facility Amendment increased the borrowing capacity under the MS Credit Facility from $300.0 million to $450.0 million. The other material terms of the MS Credit Facility were unchanged.
On November 16, 2018, the Company completed a $602.4 million term debt securitization (the “2018 Debt Securitization”). Term debt securitizations are also known as collateralized loan obligations and are a form of secured financing incurred by the Company, which is consolidated by the Company and subject to its overall asset coverage requirement. The notes offered in the 2018 Debt Securitization (the “2018 Notes”) were issued by Golub Capital BDC CLO III LLC, an indirect, wholly-owned and consolidated subsidiary of the Company (the “2018 Issuer”), and are backed by a diversified portfolio of senior secured and second lien loans. The transaction was executed through a private placement of approximately $327.0 million of AAA/AAA Class A 2018 Notes, which bear interest at the three-month LIBOR plus 1.48%; $61.2 million of AA Class B 2018 Notes, which bear interest at the three-month LIBOR plus 2.10%; $20.0 million of A Class C-1 2018 Notes, which bear interest at the three-month LIBOR plus 2.80%; $38.8 million of A Class C-2 2018 Notes, which bear interest at the three-month LIBOR plus 2.65%; $42.0 million of BBB- Class D 2018 Notes, which bear interest at the three-month LIBOR plus 2.95%; and $113.4 million of Subordinated 2018 Notes which do not bear interest. The Company indirectly retained all of the Class C-2, Class D and Subordinated 2018 Notes. Through January 20, 2023, all principal collections received on the underlying collateral may be used by the 2018 Issuer to purchase new collateral under the direction of GC Advisors, in its capacity as collateral manager of the 2018 Issuer and in accordance with the Company’s investment strategy, allowing the Company to maintain the initial leverage in the 2018 Debt Securitization. The 2018 Notes are scheduled to mature on January 20, 2031.
A portion of the proceeds of the private placement of the 2018 Notes, net of expenses, was used to repay all amounts outstanding under the MS Credit Facility, following which the agreements governing the MS Credit Facility were terminated.
Two loan sale agreements govern the 2018 Debt Securitization. Under the terms of the loan sale agreement entered into upon closing on November 16, 2018 (the “Closing Date”) of the 2018 Debt Securitization (the “Closing Date Loan Sale Agreement”), which provides for the sale of assets on the Closing Date to satisfy risk retention requirements, (1) the Company transferred to GC Advisors a portion of its ownership interest in the portfolio company investments securing the 2018 Debt Securitization for the purchase price and other consideration set forth in the Closing Date Loan Sale Agreement and (2) immediately thereafter, GC Advisors sold to the 2018 Issuer all of its ownership interest in such portfolio loans for the purchase price and other consideration set forth in the Closing Date Loan Sale Agreement. Under the terms of the other loan sale agreement governing the 2018 Debt Securitization (the “Depositor Loan Sale Agreement”), which provides for the sale of assets on the Closing Date as well as future sales from the Company to the 2018 Issuer through Golub Capital BDC CLO III Depositor LLC, a direct, wholly-owned and consolidated subsidiary of the Company (the “CLO Depositor”), (3) the Company sold and/or contributed to the CLO Depositor the remainder of its ownership interest in the portfolio company investments securing the 2018 Debt Securitization and participations for the purchase price and other consideration set forth in the Depositor Loan Sale Agreement and (4) CLO Depositor, in turn, sold to the 2018 Issuer all of its ownership interest in such portfolio loans and participations for the purchase price and other consideration set forth in one of the loan sale agreements. Following these transfers, the 2018 Issuer, and not GC Advisors, CLO Depositor or the Company, held all of the ownership interest in such portfolio company investments and participations. The Company made customary representations, warranties and covenants in these loan sale agreements.
The 2018 Notes are the secured obligations of the 2018 Issuer, and an indenture governing the 2018 Notes includes customary covenants and events of default. The 2018 Notes have not been, and will not be, registered under the Securities Act of 1933, as amended, or any state “blue sky” laws and may not be offered or sold in the United States absent registration with the Securities and Exchange Commission or an applicable exemption from registration.
Golub Capital BDC, Inc. and Subsidiaries
Notes to Consolidated Financial Statements
(In thousands, except shares and per share data)
GC Advisors, will serve as collateral manager to the 2018 Issuer under a collateral management agreement and will receive a fee for providing these services in an amount equal to 0.25% of the principal balance of the portfolio loans held by the 2018 Issuer at the beginning of the collection period relating to each payment date, which is payable in arrears on each payment date. Pursuant to the Investment Advisory Agreement, the total fees paid to GC Advisors for rendering collateral management services, which are less than the management fee payable under the Investment Advisory Agreement, will be offset against such management fee.
Under the 2018 Collateral Management Agreement, the term ‘‘collection period’’ refers to a quarterly period commencing on the third business day prior to the preceding collection period to the and ending on (but excluding) the third business day prior to the payment date. Pursuant to the Investment Advisory Agreement, the total fees paid to GC Advisors for rendering these collateral management services, which are less than the management fee payable under the Investment Advisory Agreement, will be offset against such management fee. In addition, the 2018 Issuer paid Morgan Stanley & Co. LLC structuring and placement fees for its services in connection with the structuring of the 2018 Debt Securitization.
On November 27, 2018, the Board recommended that the Company seek shareholder approval to reduce our asset coverage requirement to 150.0% at our annual meeting of stockholders currently scheduled for February 5, 2019. To the extent stockholder approval is received, we currently intend to target a GAAP debt-to-equity ratio of about 1.0x.
On November 27, 2018, the Company entered into a definitive agreement to merge with Golub Capital Investment Corporation ("GCIC") with the Company as the surviving entity. The Board and the board of directors of GCIC, including all of the respective independent directors, have approved the merger agreement and the transactions contemplated therein. Under the terms of the proposed merger, stockholders of GCIC will receive 0.865 shares of GBDC for each share of GCIC, subject to adjustment only in the event of reclassification, recapitalization, or similar transaction by either company. The combined company will remain externally managed by GC Advisors and all current GBDC officers and directors will remain in their current roles. The combined company will continue to trade under the ticker GBDC on the Nasdaq Global Select Market. Consummation of the proposed merger is subject to GBDC and GCIC stockholder approvals, customary regulatory approvals and other closing conditions. Assuming satisfaction of these conditions, the transaction is expected to close in the first half of 2019.
On November 27, 2018, the Board declared a quarterly distribution of $0.32 per share and a special distribution of $0.25$0.12 per share both of which are payable on December 29, 201628, 2018 to holders of record as of December 12, 2016.2018.
On October 20, 2016, the Company and the 2010 Issuer amended the 2010 Debt Securitization to, among other things, (a) refinance the issued Class A 2010 Notes by redeeming in full the $203,000 of Class A 2010 Notes and issuing new Class A-Refi 2010 Notes in an aggregate principal amount of $205,000 that bear interest at a rate of three-month LIBOR plus 1.90%, (b) refinance the Class B 2010 Notes by redeeming in full the $12,000 of Class B 2010 Notes and issuing new Class B-Refi 2010 Notes in an aggregate principal amount of $10,000 that bear interest at a rate of three-month LIBOR plus 2.40%, and (c) extend the reinvestment period applicable to the 2010 Issuer to July 20, 2018. Following the refinancing, Holdings retained the Class B-Refi 2010 Notes, which will be eliminated from the consolidated statements of financial condition in consolidation.
Golub Capital BDC, Inc. and Subsidiaries
Notes to Consolidated Financial Statements
(In thousands, except shares and per share data)
Note 15.14. Selected Quarterly Financial Data (Unaudited)
| | | | September 30, 2016 | | June 30, 2016 | | March 31, 2016 | | December 31, 2015 | | September 30, 2018 | | June 30, 2018 | | March 31, 2018 | | December 31, 2017 |
| Total investment income | $ | 34,503 |
| | $ | 32,106 |
| | $ | 30,762 |
| | $ | 30,500 |
| | $ | 40,428 |
| | $ | 38,396 |
| | $ | 36,897 |
| | $ | 36,450 |
|
| Net investment income | 17,228 |
| | 15,885 |
| | 16,868 |
| (1) | 14,999 |
| (1) | 20,266 |
| | 18,716 |
| | 18,528 |
| | 18,511 |
|
| Net gain (loss) on investments and secured borrowings | (1,129 | ) | | 2,404 |
| | (2,691 | ) | | 5,640 |
| | |
Net increase (decrease) in net assets resulting from
operations | 16,099 |
| | 18,289 |
| | 14,177 |
| | 20,639 |
| | |
| Net gain (loss) on investments, secured borrowings and foreign currency transactions | | (4,363 | ) | | 3,004 |
| | 4,504 |
| | 2,804 |
|
| Net increase in net assets resulting from operations | | 15,903 |
| | 21,720 |
| | 23,032 |
| | 21,315 |
|
| Earnings per share | 0.30 |
| | 0.35 |
| | 0.28 |
| | 0.40 |
| | 0.26 |
| | 0.36 |
| | 0.39 |
| | 0.36 |
|
| Net asset value per common share at period end | $ | 15.96 |
| | $ | 15.88 |
| | $ | 15.85 |
| | $ | 15.89 |
| | $ | 16.10 |
| | $ | 16.15 |
| | $ | 16.11 |
| | $ | 16.04 |
|
| | | | September 30, 2015 | | June 30, 2015 | | March 31, 2015 | | December 31, 2014 | | September 30, 2017 | | June 30, 2017 | | March 31, 2017 | | December 31, 2016 |
| Total investment income | $ | 33,552 |
| | $ | 30,410 |
| | $ | 28,461 |
| | $ | 27,545 |
| | $ | 34,950 |
| | $ | 35,408 |
| | $ | 33,557 |
| | $ | 33,849 |
|
Net investment income | 15,481 |
| | 15,205 |
| | 13,754 |
| | 14,557 |
| | 18,238 |
| | 17,808 |
| | 16,547 |
| | 16,953 |
|
| Net gain (loss) on investments and secured borrowings | 3,989 |
| | 3,083 |
| | 4,107 |
| | 615 |
| | |
Net increase (decrease) in net assets resulting from operations | 19,470 |
| | 18,288 |
| | 17,861 |
| | 15,172 |
| | |
| Net gain (loss) on investments, secured borrowings and foreign currency transactions | | 4,215 |
| | 2,303 |
| | 4,193 |
| | 2,031 |
|
| Net increase in net assets resulting from operations | | 22,453 |
| | 20,111 |
| | 20,740 |
| | 18,984 |
|
| Earnings per share | 0.38 |
| | 0.36 |
| | 0.38 |
| | 0.32 |
| | 0.38 |
| | 0.35 |
| | 0.38 |
| | 0.34 |
|
| Net asset value per common share at period end | $ | 15.80 |
| | $ | 15.74 |
| | $ | 15.61 |
| | $ | 15.55 |
| | $ | 16.08 |
| | $ | 16.01 |
| | $ | 15.88 |
| | $ | 15.74 |
|
| | | | September 30, 2014 | | June 30, 2014 | | March 31, 2014 | | December 31, 2013 | | September 30, 2016 | | June 30, 2016 | | March 31, 2016 | | December 31, 2015 |
| Total investment income | $ | 30,658 |
| | $ | 28,029 |
| | $ | 25,260 |
| | $ | 25,579 |
| | $ | 34,503 |
| | $ | 32,106 |
| | $ | 30,762 |
| | $ | 30,500 |
|
Net investment income | 14,850 |
| | 15,073 |
| | 13,352 |
| | 13,260 |
| | 17,228 |
| | 15,885 |
| | 16,868 |
| | 14,999 |
|
| Net gain (loss) on investments and secured borrowings | 5,332 |
| | 1,207 |
| | 737 |
| | 1,577 |
| | |
Net increase (decrease) in net assets resulting from
operations | 20,182 |
| | 16,280 |
| | 14,089 |
| | 14,837 |
| | |
| Net gain (loss) on investments, secured borrowings and foreign currency transactions | | (1,129 | ) | | 2,404 |
| | (2,691 | ) | | 5,640 |
|
| Net increase in net assets resulting from operations | | 16,099 |
| | 18,289 |
| | 14,177 |
| | 20,639 |
|
| Earnings per share | 0.43 |
| | 0.35 |
| | 0.32 |
| | 0.34 |
| | 0.30 |
| | 0.35 |
| | 0.28 |
| | 0.40 |
|
| Net asset value per common share at period end | $ | 15.55 |
| | $ | 15.44 |
| | $ | 15.41 |
| | $ | 15.23 |
| | $ | 15.96 |
| | $ | 15.88 |
| | $ | 15.85 |
| | $ | 15.89 |
|
| |
(1) | Net investment income for the three months ended March 31, 2017 and December 31, 2016 is shown after a net expense of $7 and $10, respectively, for U.S. federal excise tax. |
| |
(2) | Net investment income for the three months ended March 31, 2016 and December 31, 2015 is shown after a net expense of $31 and $302, respectively, for U.S. federal excise tax. |
Golub Capital BDC, Inc. and Subsidiaries
Notes to Consolidated Financial Statements
(In thousands, except shares and per share data)
Note 16.15. Summarized Financial Information for SLF (Unaudited)
Provided in the table below is a statementare the Statements of financial conditionFinancial Condition for SLF as of September 30, 20162018 and 2015:2017:
Senior Loan Fund LLC
StatementStatements of Financial Condition
| | | | September 30, 2016 | | September 30, 2015 | September 30, 2018 | | September 30, 2017 |
| Assets | |
| | |
| |
| | |
|
| Investments, at fair value | $ | 323,510 |
| | $ | 317,623 |
| $ | 179,180 |
| | $ | 300,930 |
|
| Cash and cash equivalents | 651 |
| | 1,047 |
| 4,719 |
| | 823 |
|
| Restricted cash and cash equivalents | 6,086 |
| | 3,985 |
| 1,910 |
| | 3,966 |
|
| Interest receivable | 544 |
| | 740 |
| 498 |
| | 516 |
|
| Receivable from investments sold | 1,995 |
| | — |
| |
| Other assets | | 19 |
| | — |
|
Total Assets (1) | $ | 332,786 |
| | $ | 323,395 |
| $ | 186,326 |
| | $ | 306,235 |
|
| Liabilities | |
| | |
| | | |
| Senior credit facility | $ | 214,050 |
| | $ | 212,300 |
| $ | 104,622 |
| | $ | 197,700 |
|
Less unamortized debt issuance costs(1) | 949 |
| | 2,464 |
| 18 |
| | 712 |
|
| Senior credit facility less unamortized debt issuance costs | 213,101 |
| | 209,836 |
| 104,604 |
| | 196,988 |
|
Subordinated notes, at fair value
(proceeds of $88,344 and $87,500, respectively) | 88,344 |
| | 87,500 |
| |
| Interest payable | 384 |
| | 330 |
| 213 |
| | 457 |
|
| Accounts payable and accrued expenses | 183 |
| | 159 |
| 271 |
| | 201 |
|
Total Liabilities (1) | 302,012 |
| | 297,825 |
| |
| Total Liabilities | | 105,088 |
| | 197,646 |
|
| Members' equity | 30,774 |
|
| 25,570 |
| 81,238 |
| | 108,589 |
|
Total Liabilities and Members' equity (1) | $ | 332,786 |
| | $ | 323,395 |
| |
| Total Liabilities and members' equity | | $ | 186,326 |
| | $ | 306,235 |
|
| |
(1)
| On October 1, 2015, SLF adopted ASU 2015-03 which requires that debt issuance costs related to recognized debt liability to be presented on the balance sheet as a direct deduction from the carrying amount of the debt liability rather than as an asset. Adoption of ASU 2015-03 requires the changes to be applied retrospectively. |
158
Golub Capital BDC, Inc. and Subsidiaries
Notes to Consolidated Financial Statements
(In thousands, except shares and per share data)
Note 16.15. Summarized Financial Information for SLF (Unaudited) - (continued)
Provided in the table below is a statementare the Statements of operationsOperations for SLF for the years endingended September 30, 2016, 20152018, 2017 and 2014:
2016:
Senior Loan Fund LLC
StatementStatements of Operations
| | | | Years ended September 30, | Years ended September 30, |
| | 2016 | | 2015 | | 2014 | 2018 | | 2017 | | 2016 |
| Investment income | |
| | |
| | |
| |
| | |
| | |
|
| Interest income | $ | 22,016 |
| | $ | 10,906 |
| | $ | 3,834 |
| $ | 18,285 |
| | $ | 21,455 |
| | $ | 22,016 |
|
| Fee income | 84 |
| | 4 |
| | 4 |
| 202 |
| | 5 |
| | 84 |
|
| Total investment income | 22,100 |
| | 10,910 |
| | 3,838 |
| 18,487 |
| | 21,460 |
| | 22,100 |
|
| Expenses | |
| | |
| | |
| |
| | |
| | |
|
| Interest and other debt financing expenses | 15,715 |
| | 7,701 |
| | 3,207 |
| 6,687 |
| | 10,236 |
| | 15,715 |
|
| Administrative service fee | 457 |
| | 249 |
| | 139 |
| 404 |
| | 477 |
| | 457 |
|
| Professional fees | 150 |
| | 102 |
| | 91 |
| 92 |
| | 128 |
| | 150 |
|
| General and administrative expenses | 1 |
| | 1 |
| | 1 |
| 1 |
| | 3 |
| | 1 |
|
| Total expenses | 16,323 |
| | 8,053 |
| | 3,438 |
| 7,184 |
| | 10,844 |
| | 16,323 |
|
| Net investment income | 5,777 |
|
| 2,857 |
|
| 400 |
| 11,303 |
| | 10,616 |
| | 5,777 |
|
| Net gain (loss) on investments, subordinated notes and secured borrowings | |
| | |
| | |
| |
| Net gain (loss) on investments | | |
| | |
| | |
|
| Net realized gain (loss): | |
| | |
| | |
| |
| | |
| | |
|
| Non-controlled/non-affiliate company investments | (479 | ) | | 9 |
| | — |
| — |
| | (7,379 | ) | | (479 | ) |
| Net realized gain (loss) | (479 | ) |
| 9 |
| | — |
| — |
| | (7,379 | ) | | (479 | ) |
| Net unrealized appreciation (depreciation): | |
| | |
| | |
| |
| | |
| | |
|
| Net change in unrealized appreciation (depreciation) on investments | (4,685 | ) | | (2,217 | ) | | (2 | ) | (4,197 | ) | | 4,647 |
| | (4,685 | ) |
| Net change in unrealized appreciation (depreciation) on subordinated notes | — |
| | — |
| | (85 | ) | |
| Net change in unrealized appreciation (depreciation) on secured borrowings | — |
| | 11 |
| | (11 | ) | |
| Net change in unrealized appreciation (depreciation) | (4,685 | ) | | (2,206 | ) | | (98 | ) | (4,197 | ) | | 4,647 |
| | (4,685 | ) |
| Net gain (loss) on investments, subordinated notes and secured borrowings | (5,164 | ) | | (2,197 | ) | | (98 | ) | |
| Net increase (decrease) in net assets resulting from operations | $ | 613 |
|
| $ | 660 |
|
| $ | 302 |
| |
| Net gain (loss) on investments | | (4,197 | ) | | (2,732 | ) | | (5,164 | ) |
| Net increase (decrease) in members' equity | | $ | 7,106 |
| | $ | 7,884 |
| | $ | 613 |
|
Item 9. Changes in and Disagreements with Accountants on Accounting and Financial Disclosure
None.
Item 9A. Controls and Procedures
(a) Evaluation of Disclosure Controls and Procedures
As of September 30, 20162018 (the end of the period covered by this report), management, with the participation of our chief executive officer and chief financial officer, evaluated the effectiveness of the design and operation of our disclosure controls and procedures (as defined in Rule 13a-15(e) and 15d-15(e) of the Exchange Act). Based on that evaluation, our management, including the chief executive officer and chief financial officer, concluded that, at the end of such period, our disclosure controls and procedures were effective and provided reasonable assurance that information required to be disclosed in our periodic SEC filings is recorded, processed, summarized and reported within the time periods specified in the SEC’s rules and forms, and that such information is accumulated and communicated to our management, including our chief executive officer and chief financial officer, as appropriate, to allow timely decisions regarding required disclosure. Notwithstanding the foregoing, a control system, no matter how well designed and operated, can provide only reasonable, not absolute, assurance that it will detect or uncover failures within the Company to disclose material information otherwise required to be set forth in the Company’s periodic reports.
(b) Management’s Report on Internal Control Over Financial Reporting
Management’s Report on Internal Control Over Financial Reporting and Ernst & Young LLP's Report of Independent Registered Public Accounting Firm are included in “Item 8. Consolidated Financial Statements and Supplementary Data” of this annual report on Form 10-K.
(c) Changes in Internal Controls Over Financial Reporting
Management has not identified any change in our internal control over financial reporting that occurred during the fourth fiscal quarter of 20162018 that has materially affected, or is reasonably likely to materially affect, our internal control over financial reporting.
Item 9B. Other Information
None.
PART III
Item 10. Directors, Executive Officers and Corporate Governance
The information required by Item 10 is hereby incorporated by reference from our definitive Proxy Statement relating to our 20172019 Annual Meeting of Stockholders, to be filed with the SEC within 120 days following the end of our fiscal year.
Item 11. Executive Compensation
The information required by Item 11 is hereby incorporated by reference from our definitive Proxy Statement relating to our 20172019 Annual Meeting of Stockholders, to be filed with the SEC within 120 days following the end of our fiscal year.
Item 12. Security Ownership of Certain Beneficial Owners and Management and Related Stockholder Matters
The information required by Item 12 is hereby incorporated by reference from our definitive Proxy Statement relating to our 20172019 Annual Meeting of Stockholders, to be filed with the SEC within 120 days following the end of our fiscal year.
Item 13. Certain Relationships and Related Transactions, and Director Independence
The information required by Item 13 is hereby incorporated by reference from our definitive Proxy Statement relating to our 20172019 Annual Meeting of Stockholders, to be filed with the SEC within 120 days following the end of our fiscal year.
Item 14. Principal Accountant Fees and Services
The information required by Item 14 is hereby incorporated by reference from our definitive Proxy Statement relating to our 20172019 Annual Meeting of Stockholders, to be filed with the SEC within 120 days following the end of our fiscal year.
PART IV
Item 15. Exhibits and Financial Statement Schedules
The following documents are filed as part of this annual report on Form 10-K: |
| |
| (1) | Financial Statements — Refer to Item 8 starting on page 87 |
| 96 |
| (2) | Financial Statement Schedules — None |
|
| | |
| | Form of Certificate of Incorporation (Incorporated by reference to Exhibit (a)(2) to the Registrant’s Pre-effective Amendment No. 3 to the Registration Statement on Form N-2 (File No. 333-163279), filed on March 24,25, 2010). |
| | Form of Bylaws (Incorporated by reference to Exhibit (b)(2) to the Registrant’s Pre-effective Amendment No. 3 to the Registration Statement on Form N-2 (File No. 333-163279), filed on March 24,25, 2010). |
| | Form of Stock Certificate (Incorporated by reference to Exhibit (d) to the Registrant’s Pre-effective Amendment No. 3 to the Registration Statement on Form N-2 (File No. 333-163279), filed on March 24,25, 2010). |
| | Second Amended and Restated Investment Advisory Agreement, dated August 5, 2014, between Registrant and GC Advisors LLC (Incorporated by reference to Exhibit 10.6 to Registrant’s Quarterly Report on Form 10-Q (File No. 814-00794), filed on August 7, 2014). |
| | Form of Custody Agreement (Incorporated by reference to Exhibit (j) to the Registrant’s Pre-effective Amendment No. 5 to the Registration Statement on Form N-2 (File No. 333-163279), filed on April 12, 2010). |
| | Form of Administration Agreement between Registrant and GC Service Company LLC (Incorporated by reference to Exhibit (k)(2) to the Registrant’s Pre-effective Amendment No. 3 to the Registration Statement on Form N-2 (File No. 333-163279), filed on March 24, 2010). |
| | Form of Trademark License Agreement between the Registrant and Golub Capital LLC (Incorporated by reference to Exhibit (k)(3) to the Registrant’s Pre-effective Amendment No. 3 to the Registration Statement on Form N-2 (File No. 333-163279), filed on March 24, 2010). |
| | Amended and Restated Dividend Reinvestment Plan (Incorporated by reference to Exhibit 10.1 to Registrant’s Current Report on Form 8-K (File No. 814-00794), filed on May 5, 2011). |
| | Purchase Agreement, dated July 16, 2010, by and among the Registrant, Golub Capital BDC 2010-1 Holdings LLC, Golub Capital BDC 2010-1 LLC and Wells Fargo Securities, LLC (Incorporated by reference to Exhibit 10.1 to Registrant’s Report on Form 8-K (File No. 814-00794), filed on July 16, 2010). |
| | Master Loan Sale Agreement, dated July 16, 2010, by and between the Registrant, Golub Capital BDC 2010-1 LLC and Golub Capital BDC 2010-1 Holdings LLC (Incorporated by reference to Exhibit 10.2 to Registrant’s Report on Form 8-K (File No. 814-00794), filed on July 16, 2010). |
| | Indenture, dated July 16, 2010, by and between Golub Capital BDC 2010-1 LLC and U.S. Bank, National Association (Incorporated by reference to Exhibit 10.3 to Registrant’s Current Report on Form 8-K (File No. 814-00794), filed on July 16, 2010). |
| | Collateral Management Agreement, dated July 16, 2010, by and between Golub Capital BDC 2010-1 LLC and GC Advisors LLC (Incorporated by reference to Exhibit 10.4 to Registrant’s Current Report on Form 8-K (File No. 814-00794), filed on July 16, 2010). |
| | Purchase and Sale Agreement, dated July 21, 2011, by and between the Registrant and Golub Capital BDC Funding LLC (Incorporated by reference to Exhibit 10.2 to Registrant’s Current Report on Form 8-K (File No. 814-00794), filed on July 21, 2011). |
|
| | |
| | Supplemental Indenture No. 1, dated as of February 15, 2013, by and between Golub Capital BDC 2010-1 LLC and U.S. Bank National Association, as trustee (Incorporated by reference to Exhibit 10.1 to the Registrant’s Current Report on Form 8-K (File No. 814-00794), filed on February 19, 2013). |
| | Senior Loan Fund LLC Limited Liability Company Agreement dated May 31, 2013, by and between the Registrant and United Insurance Company of America (Incorporated by reference to Exhibit 10.1 to the Registrant’s Current Report on Form 8-K (File No. 814-00794), filed on June 7, 2013). |
| | Purchase Agreement, dated June 5, 2014, by and among the Registrant, Golub Capital BDC CLO 2014 LLC and Wells Fargo Securities, LLC (Incorporated by reference to Exhibit 10.2 to the Registrant’s Current Report on Form 8-K (File No. 814-00794), filed on June 6, 2014). |
| | Loan Sale Agreement, dated June 5, 2014, by and between the Registrant and Golub Capital BDC CLO 2014 LLC (Incorporated by reference to Exhibit 10.3 to the Registrant’s Current Report on Form 8-K (File No. 814-00794), filed on June 6, 2014). |
| | Indenture, dated June 5, 2014, by and between Golub Capital BDC CLO 2014 LLC and Wells Fargo Bank, National Association (Incorporated by reference to Exhibit 10.4 to the Registrant’s Current Report on Form 8-K (File No. 814-00794), filed on June 6, 2014). |
| | Collateral Management Agreement, dated June 5, 2014, by and between Golub Capital BDC CLO 2014 LLC and GC Advisors LLC (Incorporated by reference to Exhibit 10.5 to the Registrant’s Current Report on Form 8-K (File No. 814-00794), filed on June 6, 2014). |
| | First Amendment to Senior Loan Fund LLC Limited Liability Company Agreement, dated July 31, 2014, by and between the Registrant and RGA Insurance Company (Incorporated by reference to Exhibit 10.25 to the Registrant’s Annual Report on Form 10-K (File No. 814-00794), filed on November 18, 2014). |
| | Amendment No. 1 to Credit Agreement, dated as of November 24, 2014, by and among Golub Capital BDC Revolver Funding LLC, as the borrower; Golub Capital BDC, Inc., as servicer; and The PrivateBank and Trust Company as lender and administrative agent (Incorporated by reference to Exhibit 10.1 to the Registrant’s Current Report on Form 8-K (File No. 814-00794), filed on November 26, 2014). |
10.19 | | Amended and Restated Loan and Servicing Agreement, dated as of December 18, 2014, by and among Golub Capital BDC Funding LLC, as the Borrower; Golub Capital BDC, Inc., as Transferor and Servicer; Wells Fargo Securities, LLC, as the Administrative Agent; the lenders from time to time party thereto; the lender agents from time to time party thereto; and Wells Fargo Bank, N.A., as the Collateral Agent, the Account Bank, and the Collateral Custodian (Incorporated by reference to Exhibit 10.1 to the Registrant’s Current Report on Form 8-K (File No. 814-00794), filed on January 2, 2015). |
10.20 | | Supplemental Indenture No. 2, dated as of June 25, 2015, by and between Golub Capital BDC 2010-1 LLC and U.S. Bank National Association, as trustee (Incorporated by reference to Exhibit 10.1 to the Registrant’s Current Report on Form 8-K (File No. 814-00794), filed on June 26, 2015). |
10.21 | | First Amendment to Amended and Restated Loan and Servicing Agreement, dated as of July 30, 2015, by and among Golub Capital BDC Funding LLC, as the borrower; Golub Capital BDC, Inc., as the transferor and servicer; certain institutional lenders identified on the signature pages thereto; Wells Fargo Bank, N.A., as the swingline lender, Wells Fargo Bank, N.A., as the collateral agent, account bank and collateral custodian, and Wells Fargo Securities, LLC, as the administrative agent (Incorporated by reference to Exhibit 10.1 to the Registrant’s Current Report on Form 8-K (file No. 814-00794), filed on August 4, 2015). |
10.22 | | Credit Facility Termination Agreement, dated as of October 21, 2015, by and among Golub Capital BDC Revolver Funding LLC as the borrower, the Registrant, as the servicer, U.S. Bank National Association, as collateral custodian, and The PrivateBank and Trust Company, as the lender and administrative agent. (Incorporated by reference to Exhibit 10.22 to Registrant’s Annual Report on Form 10-5 (File No. 814-00794), filed on November 17, 2015). |
10.23 | | Second Amendment to Amended and Restated Loan and Servicing Agreement, dated as of March 1, 2016, by and among Golub Capital BDC Funding LLC, as the borrower; Golub Capital BDC, Inc., as the transferor and servicer; certain institutional lenders identified on the signature pages thereto; Wells Fargo Bank, N.A., as the swingline lender, Wells Fargo Bank, N.A., as the collateral agent, account bank and collateral custodian, and Wells Fargo Securities, LLC, as the administrative agent. (Incorporated by reference to Exhibit 10.1 to Registrant’s Quarterly Report on Form 10-Q (File No. 814-00794), filed on May 5, 2016). |
10.24 |
| | |
| | Unsecured revolving loan agreement, dated as of June 22, 2016, by Golub Capital BDC, Inc., as the borrower, and GC Advisors LLC, as the lender. (Incorporated by reference to Exhibit 10.1 to Registrant’s Quarterly Report on Form 10-Q (File No. 814-00794), filed on August 3, 2016). |
10.25 | | Supplemental Indenture No. 3, dated as of October 20, 2016, by and between Golub Capital BDC 2010-1 LLC and U.S. Bank National Association, as trustee (Incorporated by reference to Exhibit 10.1 to the Registrant’s Current Report on Form 8-K (File No. 814-00794), filed on October 20, 2016). |
| | Joinder Supplement, dated as of May 2, 2017, by and among Golub Capital BDC Funding LLC, as the borrower; the lender identified therein, and Wells Fargo Securities, LLC, as the administrative agent. (Incorporated by reference to Exhibit 10.1 to Registrant’s Quarterly Report on Form 10-Q (File No. 814-00794), filed on August 7, 2017). |
| | Third Amendment to Amended and Restated Loan and Servicing Agreement, dated as of July 28, 2017, by and among Golub Capital BDC Funding LLC, as the borrower; Golub Capital BDC, Inc., as the transferor and servicer; the institutional lenders identified on the signature pages thereto; Wells Fargo Bank, N.A., as the swingline lender, collateral agent, account bank, collateral custodian, and administrative agent. (Incorporated by reference to Exhibit 10.1 to the Registrant’s Current Report on Form 8-K (File No. 814-00794), filed on July 28, 2017). |
| | Fourth Amendment to Amended and Restated Loan and Servicing Agreement, dated as of September 28, 2017, by and among Golub Capital BDC Funding LLC, as the borrower; Golub Capital BDC, Inc., as the transferor and servicer; the institutional lenders identified on the signature pages thereto; Wells Fargo Bank, N.A., as the swingline lender, collateral agent, account bank, collateral custodian, and administrative agent. (Incorporated by reference to Exhibit 10.1 to the Registrant’s Current Report on Form 8-K (File No. 814-00794), filed on September 28, 2017). |
| | Fifth Amendment to Amended and Restated Loan and Servicing Agreement, dated as of November 22, 2017, by and among Golub Capital BDC Funding LLC, as the borrower; Golub Capital BDC, Inc., as the transferor and servicer; the institutional lenders identified on the signature pages thereto; Wells Fargo Bank, N.A., as the swingline lender, collateral agent, account bank, collateral custodian, and administrative agent (Incorporated by reference to Exhibit 10.1 to the Registrant’s Current Report on Form 8-K (File No. 814-00794), filed on November 24, 2017). |
| | Sixth Amendment to Amended and Restated Loan and Servicing Agreement, dated as of December 14, 2017, by and among Golub Capital BDC Funding LLC, as the borrower; Golub Capital BDC, Inc., as the transferor and servicer; the institutional lenders identified on the signature pages thereto; Wells Fargo Bank, N.A., as the swingline lender, collateral agent, account bank, collateral custodian, and administrative agent (Incorporated by reference to Exhibit 10.1 to the Registrant’s Current Report on Form 8-K (File No. 814-00794), filed on December 18, 2017). |
| | Supplemental Indenture No. 1, dated March 23, 2018, by and between Golub Capital BDC 2014 LLC and Wells Fargo Bank, National Association, as trustee. (Incorporated by reference to Exhibit (k)(28) to the Registrant’s Post-effective Amendment No. 4 to the Registration Statement on Form N-2 (File No. 333-215285), filed on April 27, 2018) |
| | Credit Agreement, dated July 20, 2018, among Golub Capital BDC CLO 2010-1 LLC, as borrower; Morgan Stanley Bank, N.A., as lender; Morgan Stanley Senior Secured Funding, Inc., as administrative agent; and U.S. Bank National Association, as collateral agent for the administrative agent and the lenders. (Incorporated by reference to Exhibit 10.1 to the Registrant’s Current Report on Form 8-K (File No. 814-00794), filed on July 23, 2018). |
| | Security Agreement, dated July 20, 2018, by and among Golub Capital BDC CLO 2010-1 LLC, as the borrower; Morgan Stanley Senior Funding, Inc., as administrative agent; and U.S. Bank National Association, as collateral agent. (Incorporated by reference to Exhibit 10.2 to the Registrant’s Current Report on Form 8-K (File No. 814-00794), filed on July 23, 2018). |
| | Warehouse Collateral Management Agreement, dated July 20, 2018, by and among Golub Capital BDC CLO 2010-1 LLC, as the issuer; Morgan Stanley Senior Secured Funding, Inc., as administrative agent; and GC Advisors LLC, as warehouse collateral manager. (Incorporated by reference to Exhibit 10.3 to the Registrant’s Current Report on Form 8-K (File No. 814-00794), filed on July 23, 2018). |
|
| | |
| | Seventh Amendment to Amended and Restated Loan and Servicing Agreement, dated as of September 21, 2018, by and among Golub Capital BDC Funding LLC, as the borrower; Golub Capital BDC, Inc., as the transferor and servicer; the institutional lenders identified on the signature pages thereto; Wells Fargo Bank, N.A., as the swingline lender, collateral agent, account bank, collateral custodian, and administrative agent (Incorporated by reference to Exhibit 10.1 to the Registrant’s Current Report on Form 8-K (File No. 814-00794), filed on September 26, 2018). |
| | Purchase Agreement, dated as of November 1, 2018, by and among Golub Capital BDC CLO III LLC, Golub Capital BDC CLO III Depositor LLC and Morgan Stanley & Co. LLC. (Incorporated by reference to Exhibit 10.1 to the Registrant’s Current Report on Form 8-K (File No. 814-00794), filed on November 2, 2018). |
| | First Amendment to Credit Agreement, dated as of November 1, 2018, by and among Golub Capital BDC 2010-1 LLC, Morgan Stanley Bank, N.A., Morgan Stanley Senior Funding, Inc., and GC Advisors LLC. (Incorporated by reference to Exhibit 10.2 to the Registrant’s Current Report on Form 8-K (File No. 814-00794), filed on November 2, 2018). |
| | Computation of per share earnings (included in the notes to the audited financial statements included in this report). |
| | Code of Ethics of the Registrant and GC Advisors.* |
| | Code of Ethics of GC Advisors (Incorporated by reference toLLC. (Filed as Exhibit 14.114.2 to the Registrant’sRegistrant's Quarterly Report on Form 10-Q (File No. 814-00794), filed on February 5, 2016). |
14.2 | | Code of Ethics of GC Advisors LLC (Incorporated by reference to Exhibit 14.2 to the Registrant’s Quarterly Report on Form 10-Q on Form 10-Q (File No. 814-00794), filed on February 5, 2016). |
| | List of Subsidiaries.* |
| | Power of attorney (included on the signature page hereto). |
| | Certification of Chief Executive Officer pursuant to Rule 13a-14 of the Securities Exchange Act of 1934, as amended.* |
| | Certification of Chief Financial Officer pursuant to Rule 13a-14 of the Securities Exchange Act of 1934, as amended.* |
| | Certification of Chief Executive Officer pursuant to section 906 of the Sarbanes-Oxley Act of 2002.* |
| | Certification of Chief Financial Officer pursuant to section 906 of the Sarbanes-Oxley Act of 2002.* |
| | Privacy Policy of the Registrant.* |
_________________
* Filed herewith
SIGNATURES
Pursuant to the requirements of Section 13 or 15(d) of the Securities Exchange Act of 1934, the registrant has duly caused this Annual Report on Form 10-K to be signed on its behalf by the undersigned, thereunto duly authorized.
|
| | |
| | | Golub Capital BDC, INC.Inc. |
| | | A Delaware Corporation |
| | | |
Date: November 16, 201628, 2018 | By: | /s/ David B. Golub |
| | | Name: David B. Golub |
| | | Title: Chief Executive Officer |
POWER OF ATTORNEY
KNOW ALL MEN BY THESE PRESENTS, that each person whose signature appears below constitutes and appoints Lawrence E. Golub, David B. Golub and Ross A. Teune as his or her true and lawful attorneys-in-fact, each with full power of substitution, for him or her in any and all capacities, to sign any amendments to this Annual Report on Form 10-K and to file the same, with exhibits thereto and other documents in connection therewith, with the Securities and Exchange Commission, hereby ratifying and confirming all that each of said attorneys-in-fact or their substitute or substitutes may do or cause to be done by virtue hereof.
Pursuant to the requirements of the Securities Exchange Act of 1934, this Annual Report on Form 10-K has been signed below by the following persons on behalf of the registrant and in the capacities and on the dates indicated.
|
| | | | |
| | | | |
| Signature | | Title | | Date |
| /s/ David B. Golub | | Chief Executive Officer and Director | | November 16, 201628, 2018 |
| David B. Golub | | (Principal Executive Officer) | | |
| | | | |
| /s/ Ross A. Teune | | Chief Financial Officer | | November 16, 201628, 2018 |
| Ross A. Teune | | (Principal Accounting and Financial and Accounting Officer) | | |
| | | | |
| /s/ Lawrence E. Golub | | Chairman of the Board of Directors | | November 16, 201628, 2018 |
| Lawrence E. Golub | | | | |
| | | | |
| /s/ John T. Baily | | Director | | November 16, 201628, 2018 |
| John T. Baily | | | | |
| | | | |
| /s/ Kenneth F. Bernstein | | Director | | November 16, 201628, 2018 |
| Kenneth F. Bernstein | | | | |
| | | | |
| /s/ Anita R. Rosenberg | | Director | | November 16, 201628, 2018 |
| Anita R. Rosenberg | | | | |
| | | | |
| /s/ William M. Webster IV | | Director | | November 16, 201628, 2018 |
| William M. Webster IV | | | | |