Washington, D.C. 20549
FORM
10-K/A
Amendment No. 1
| ☒ | |
ANNUAL REPORT PURSUANT TO SECTION 13 or 15(d) OF THE SECURITIES EXCHANGE ACT OF 1934 |
For the fiscal year ended September 29, 2017October 2, 2020
OR
| ☐ | |
TRANSITION REPORT PURSUANT TO SECTION 13 OR 15(d) OF THE SECURITIES EXCHANGE ACT OF 1934 |
For the transition period fromto
Commission File Number:
1-7598
VARIAN MEDICAL SYSTEMS, INC.
(Exact name of Registrant as specified in its charter)
Delaware | 94-2359345 | |
(State or other jurisdiction of incorporation or organization) | (I.R.S. Employer Identification Number) | |
3100 Hansen Way Palo Alto California | 94304-1038 | |
(Address of principal executive offices) | (Zip Code) | |
(650)
493-4000
(Registrant’s telephone number, including area code)
Securities registered pursuant to Section 12(b) of the Act:
Title of each class | Trading Symbol | Name of each exchange on which registered | ||
Common Stock, $1 par value | VAR | New York Stock Exchange |
Securities registered pursuant to Section 12(g) of the Act: None
Indicate by check mark if the Registrant is a well-known seasoned issuer, as defined in Rule 405 of the Securities Act. Yes ý☒ No ¨☐
Indicate by check mark if the Registrant is not required to file reports pursuant to Section 13 or Section 15(d) of the Act. Yes ¨☐ No ý☒
Indicate by check mark whether the Registrant: (1) has filed all reports required to be filed by Section 13 or 15(d) of the Securities Exchange Act of 1934 during the preceding 12 months (or for such shorter period that the registrant was required to file such reports), and (2) has been subject to such filing requirements for the past 90 days. Yes ý☒ No ¨☐
Indicate by check mark whether the Registrant has submitted electronically and posted on its corporate Web site, if any, every Interactive Data File required to be submitted and posted pursuant to Rule 405 of Regulationand post such files). Yes ý☒ No ¨
S-T
during the preceding 12 months (or for such shorter period that the registrant was required to submit Indicate by check mark whether the Registrant is a large accelerated filer, an accelerated filer, a"emerging“emerging growth company"company” in Rule
non-accelerated
filer, smaller reporting company, or an emerging growth company. See the definitions of “large accelerated filer,” “accelerated filer,” “smaller reporting company,” and 12b-2
of the Exchange Act. (Check one):Large accelerated filer | ☒ | Accelerated filer | ☐ | |||||
Non-accelerated filer | ☐ | Smaller reporting company | ☐ | |||||
| Emerging growth company | ☐ | |||||||
If an emerging growth company, indicate by check mark if the registrant has elected not to use the extended transition period for complying with any new or revised financial accounting standards provided pursuant to Section 13(a) of the Exchange Act. ¨☐
Indicate by check mark whether the Registrant has filed a report on and attestation to its management’s assessment of the effectiveness of its internal control over financial reporting under Section 404(b) of the Sarbanes-Oxley Act (15 U.S.C. 7262(b)) by the registered public accounting firm that prepared or issued its audit report.
¨☒
Indicate by check mark whether the Registrant is a shell company (as defined in Rule 12b-2 of the Exchange Act).
Yes As of March 31, 2017,April 3, 2020, the last business day of Registrant’s most recently completed second fiscal quarter, the aggregate market value of shares of Registrant’s common stock held byMarch 31, 2017)April 3, 2020) was $8,340,019,028. Shares of Registrant’s common stock held by the Registrant’s executive officers and directors and by each entity that owned 10% or more of Registrant’s outstanding common stock have been excluded in that such persons may be deemed to be affiliates. This determination of affiliate status is not necessarily a conclusive determination for other purposes.
non-affiliates
of Registrant (based upon the closing sale price of such shares on the New York Stock Exchange on $6,905,810,423. At November 21, 2017,13, 2020, the number of shares of the Registrant’s common stock outstanding was 91,616,924.91,355,469
.
DOCUMENTS INCORPORATED BY REFERENCE
None.
EXPLANATORY NOTE | ||
10-K/A
(this “Amendment”) to file certain This Amendment amends the Company’s Annual Report on Form(“SEC”(the “SEC”) on November 25, 2020 (the “Original Filing”). ForThe Company is filing this purpose, statements concerning: industry or market segment outlook; market acceptanceAmendment to amend Part III of or transitionthe Original Filing to new products or technology such as fixed field intensity-modulated radiation therapy, image-guided radiation therapy, stereotactic radiosurgery, volumetric modulated arc therapy, brachytherapy, software, treatment techniques, proton therapy; growth drivers; future orders, revenues, backlog, earnings or other financial results;include the information required by and any statements usingnot included in Part III of the terms “believe,” “expect,” “anticipate,” “can,” “should,” “would,” “could,” “estimate,” “may,” “intended,” “potential,” and “possible” or similar statements are forward-looking statements that involve risks and uncertainties that could cause our actual results andOriginal Filing because the outcome and timingCompany no longer intends to file its definitive proxy statement within 120 days of certain events to differ materially from those projected or management’s current expectations. By making forward-looking statements, we have not assumed any obligation to, and you should not expect us to, update or revise those statements becausethe end of new information, future events or otherwise.
10-K
for the fiscal year ended October 2, 2020, originally filed with the Securities and Exchange Commission 13a-14(a)
promulgated by the S-K,
paragraphs 3, 4 and 5 of the certifications have been omitted.Except as Varex Imaging Corporation (“Varex”), and isdescribed above, no longer part of continuing operations. See “Distribution” below.other changes have been made to the Original Filing. The operating segments were determined based on how our Chief Executive Officer, who is our Chief Operating Decision Maker (“CODM”), views and evaluates our operations. The CODM allocates resourcesOriginal Filing continues to and evaluates the financial performance of each operating segment primarily based on operating earnings.
2
PART III
Item 10. | Directors, Executive Officers and Corporate Governance |
Executive Officers
The information required by this item with respect to our executive officers is set forth in Part I of the Original Filing.
Directors
Below is information, including biographical information, about our current directors as well as a discussion of the specific experiences, qualifications, attributes and skills considered by our Board of Directors (the "Record Date"“Board”) received 0.4 of a share of Varex common stock for every one sharein concluding that such individuals should serve as directors.
Anat Ashkenazi Age: 48 Director Since: 2018 Independent Occupation: Public Company Executive | Principal occupation, business experience and directorships • Positions at Eli Lilly and Company, a global pharmaceutical company: • Senior Vice President, Controller and Chief Financial Officer, Lilly Research Labs (September 2016—present) • Vice President, Finance and Chief Financial Officer, Lilly Diabetes and Lilly Global Manufacturing and Quality (April 2015—September 2016) • Chief Financial Officer, Lilly Oncology (October 2013—April 2015) • Other Current Public Company Board Memberships: None • Prior Public Company Board Memberships in Past Five Years: None Experience, qualifications, attributes or skills supporting directorship • Over 20 years of in-depth financial management and planning experience including corporate finance and financial services• Extensive experience in the pharmaceutical industry having worked for Eli Lilly and Company across different therapeutic areas and disciplines • Experience in global and regional strategic planning, organizational redesign, and Six Sigma implementation | |
Jeffrey R. Balser Age: 59 Director Since: 2018 Independent Occupation: CEO of an Academic Medical Center | Principal occupation, business experience and directorships • President and Chief Executive Officer of Vanderbilt University Medical Center (May 2016—present) • Dean, Vanderbilt University School of Medicine (October 2008—present) • Vice Chancellor for Health Affairs, Vanderbilt University Medical Center (June 2009—April 2016) • Associate Vice Chancellor for Research, Vanderbilt University Medical Center (January 2004—October 2008) • Other Current Public Company Board Memberships: None • Prior Public Company Board Memberships in Past Five Years: None Experience, qualifications, attributes or skills supporting directorship • In-depth knowledge of the healthcare industry, hospital operations and managed care industry• Experience in management and strategic planning of hospital and physician practice, medical education, clinical and basic research through service as Chief Executive Officer and Dean, and previously as chief research officer, of a leading academic medical institution • Licensed Medical Doctor, Board certified in Anesthesiology and Critical Care Medicine | |
3
Judy Bruner Age: 62 Director Since: 2016 Independent Occupation: Former Public Company Executive | Principal occupation, business experience and directorships • Positions at SanDisk Corporation, a global leader in flash memory storage solutions: • Executive Vice President, Administration and Chief Financial Officer (June 2004—May 2016) • Member of Board of Directors (June 2002—July 2004) • Senior Vice President and Chief Financial Officer, Palm, Inc., a manufacturer of personal digital assistants (September 1999—June 2004) • Vice President, Finance & Corporate Controller, 3Com Corporation, a digital electronics manufacturer (May 1998—September 1999) • Other Current Public Company Board Memberships: Applied Materials, Inc., a provider of engineering solutions; Rapid7, a security data and analytics solutions provider; Seagate Technology PLC, a data storage company • Prior Public Company Board Memberships in Past Five Years: Brocade Communications Systems, Inc., a technology company specializing in data and storage networking products Experience, qualifications, attributes or skills supporting directorship • Over 35 years of financial management experience in the high technology industry • Deep experience with compliance and enterprise risk management • Audit committee chair experience • Significant mergers and acquisitions experience • Membership on boards of other public companies | |
Jean-Luc ButelAge: 64 Director Since: 2017 Independent Occupation: Former Public Company Executive | Principal occupation, business experience and directorships • Positions at Baxter International, a health care company providing a portfolio of renal and hospital products: • President, International (January 2015—June 2015) • Corporate Officer, Operating Committee Member, Corporate Vice President and President, International (February 2012—December 2014) • Positions at Medtronic, Inc., a global leader in medical technology: • Corporate Officer, Executive Committee Member, Executive Vice President; Group President International (January 2011—January 2012) • Corporate Officer, Executive Committee Member, Senior Vice President and President, Medtronic International (May 2008—December 2010) • Corporate Officer, Executive Committee Member, Senior Vice President, Medtronic and President, Medtronic Asia Pacific (August 2003—April 2008) • Other Senior Management Experience: President, Johnson & Johnson Independence Technology; President, Worldwide Consumer Healthcare, Becton Dickinson • Other Current Public Company Board Memberships: Takeda Pharmaceutical Company Limited, a global pharmaceuticals company focused on metabolic disorders, gastroenterology, neurology, inflammation and oncology • Prior Public Company Board Memberships in Past Five Years: Biosensors International Group, Ltd., a medical device company specializing in interventional cardiology procedures and critical care technologies Experience, qualifications, attributes or skills supporting directorship • Extensive experience in sales, operations and general management of healthcare companies through his service as an executive of several large U.S. healthcare companies • Extensive experience leading international business operations of large U.S. healthcare companies, including in Europe, Asia and North and South America | |
4
Regina E. Dugan Age: 57 Director Since: 2013 Independent Occupation: CEO | Principal occupation, business experience and directorships • President and Chief Executive Officer, Wellcome Leap, Inc., a nonprofit focused on accelerating innovations in global human health challenges (March 2020—present) • Vice President of Engineering, Facebook, Inc., leading Building 8, a team charged with developing and delivering next generation consumer hardware to market (May 2016—January 2018) • Vice President of Engineering, Google, Inc., leading the Advanced Technology and Products group, a group charged with breakthrough innovations in mobile computing and accelerating the development of promising technologies to market (February 2014—April 2016) • Senior Vice President, Google owned Motorola Mobility LLC, a mobile technology company Google acquired in May 2012 (March 2012— February 2014) • Director, Defense Advanced Research Projects Agency (DARPA), a breakthrough product development organization of the U.S. Department of Defense (July 2009—March 2012) • Co-Founder, President and Chief Executive Officer, RedXDefense LLC, a security solutions company (2005—July 2009)• Co-Founder, President and Chief Executive Officer, Dugan Ventures, an investment firm (currently anon-voting partner) (2001—July 2009)• Other Current Public Company Board Memberships: Zynga Inc., a social game developer • Prior Public Company Board Memberships in Past Five Years: None Experience, qualifications, attributes or skills supporting directorship • Experience leading DARPA, the principal agency within the U.S. Department of Defense responsible for product development, research, demonstration and fielding of high-risk, high-payoff capabilities • Familiarity with defense, security and commercial industries • Expertise with a wide range of advanced technologies and demonstrated track record in moving to use new technologies, from sensor systems to big data products • Years of experience serving in senior executive positions with responsibilities including fostering innovation and developing strategic business relationships across diverse industries and commercial entities large and small • Experience serving on the board of another public company |
5
R. Andrew Eckert Age: 59 Director Since: 2004 Chairman Since: 2014 Independent Occupation: CEO | Principal occupation, business experience and directorships • Chief Executive Officer, Zelis, Inc., a financial technology company specializing in healthcare claims and payment solutions (August 2020—Present) • Chief Executive Officer, Acelity L.P., Inc., a global advanced wound care company (April 2017—October 2019) • Chief Executive Officer, Valence Health, a healthcare solutions company (August 2015—October 2016) • Chief Executive Officer, TriZetto Corporation, a healthcare IT solutions firm (March 2014—November 2014) • Chief Executive Officer, CRC Health Corporation, a provider of substance abuse treatment and adolescent youth services (January 2011—March 2014) • Managing Director, Symphony Technology Group, a private equity firm (October 2009—January 2011) • President and Chief Executive Officer, Eclipsys Corporation, a former publicly traded healthcare information management software provider (October 2005—May 2009) • Chief Executive Officer, SumTotal Systems, Inc., an enterprise software provider (2004—2005) • Chief Executive Officer, Docent Inc., an enterprise software provider that was acquired by SumTotal Systems (2002—2004) • Chairman and Chief Executive Officer, ADAC Laboratories, a former publicly traded medical imaging company (1997—2001) • Other Current Public Company Board Memberships: Becton, Dickinson and Company, a global medical technology company • Prior Public Company Board Memberships in Past Five Years: None Experience, qualifications, attributes or skills supporting directorship • Extensive experience obtained over 15 years serving as an executive officer of several public companies, including a medical imaging company and healthcare information management company • Deep knowledge of operational, financial, strategic planning, product development and marketing matters • Experience serving on the board of directors of several public companies in the healthcare industry | |
Phillip G. Febbo Age: 54 Director Since: 2019 Independent Occupation: Public Company Executive | Principal occupation, business experience and directorships • Chief Medical Officer, Illumina, Inc. (March 2018—present) • Chief Medical Officer, Genomic Health, Inc. (2013—March 2018) • Professor of Medicine and Urology at the University of California, San Francisco (UCSF) (2010—2013) • Service on the board of directors of the American College of Medical Genetics and Genomics Foundation (2018—2019) • Other Current Public Company Board Memberships: None • Prior Public Company Board Memberships in Past Five Years: None Experience, qualifications, attributes or skills supporting directorship • Broad experience in medical strategy and managing resources strategically on a global scale across areas like product development, evidence generation, product marketing, and sales, gained from service as the Chief Medical Officer of two genomic health companies • Deep knowledge in cancer research, clinical and academic research programs, including through service as the principal investigator of clinical trials funded by National Institute Institutes of Health, Department of Defense, and various industry and non-profit foundation grants• Critical insights in evaluating data of various cancer treatments and leveraging multidisciplinary care to optimize patient outcomes | |
6
David J. Illingworth Age: 67 Director Since: 2011 Independent Occupation: Former Public Company CEO | Principal occupation, business experience and directorships • Smith & Nephew plc, a medical devices company • Chief Executive Officer (July 2007—April 2011) • Chief Operating Officer and Division President (2002—July 2007) • Other Senior Management Experience: President, XL Vision, Inc.; Chairman and Chief Executive Officer, VidaMed, Inc.; President, Nellcor Puritan Bennett LLC; and Managing Director, Asia/Pacific, GE Medical Systems • Other Current Public Company Board Memberships: Domtar, Inc., a manufacturer of fiber-based products • Prior Public Company Board Memberships in Past Five Years: None. Experience, qualifications, attributes or skills supporting directorship • In-depth knowledge of the medical technology industry• Extensive experience in sales, operations and general management in the United States, United Kingdom and Asia through his service as an executive of various medical technology companies • Service on the board of directors and as a member of the audit committee and the environmental, health, safety and sustainability committee, of another public medical device company | |
Michelle M. Le Beau Age: 66 Director Since: 2019 Independent Occupation: Professor and Director of an Academic Cancer Center | Principal occupation, business experience and directorships • Positions at the University of Chicago: • Arthur and Marian Edelstein Professor of Medicine, Section of Hematology/Oncology (1986—present) • Director, University of Chicago Medicine Comprehensive Cancer Center (2004—present) • Board Member of the University of Chicago Medicine Cancer Council (2012—present) • Director, Cancer Cytogenetics Laboratory (1986—present) • Other Current Public Company Board Memberships: None • Prior Public Company Board Memberships in Past Five Years: None Experience, qualifications, attributes or skills supporting directorship • Extensive experience with cancer research, clinical and research program development, and structure and operation of academic cancer centers • Deep knowledge of academic and government cancer research priorities, and opportunities across the cancer research and care continuum • Service on (i) numerous scientific advisory boards for academic cancer centers, including advisory boards and working groups for the National Cancer Institute of the U.S. National Institutes of Health, (ii) the board of directors of professional organizations in oncology and cancer research (e.g. the American Association for Cancer Research and the American Society of Hematology), and (iii) multiple non-profit organizations in cancer research, advocacy, outreach and education (e.g. the American Cancer Society)• Doctoral degree in Genetics, and board-certified in clinical cytogenetics by the American Board of Medical Genetics and Genomics • In-depth knowledge of the biology and development of human cancers | |
7
Dow R. Wilson Age: 62 Director Since: 2012 Occupation: President and CEO of Varian | Principal occupation, business experience and directorships • Positions at the Company: • President and Chief Executive Officer (September 2012—present) • Corporate Executive Vice President and Chief Operating Officer (October 2011—September 2012) • Corporate Executive Vice President and President, Oncology Systems (August 2005—September 2011) • Corporate Vice President and President, Oncology Systems (January 2005—August 2005) • Prior to joining the Company in January 2005, held various senior management positions in and outside of the United States with General Electric Company, a diversified industrial company • Other Current Public Company Board Memberships: Agilent Technologies, a research, development and manufacturing company for life science • Public Company Board Memberships in Past Five Years: Saba Software, an e-learning software provider; Varex Imaging Corporation, a leading independent supplier of medicalX-ray tubes and image processing solutions• U.S. Government Appointments: • Presidential appointment to U.S. President’s Advisory Council on Doing Business in Africa (November 2014—January 2019) • Appointed to U.S. Department of Commerce’s US-Brazil CEO Forum in April 2019• Board member of the US-India Strategic Partnership Forum, anon-profit focused on driving economic growth, job creation, innovation, inclusion, and entrepreneurship in the U.S. and India (2018—present)Experience, qualifications, attributes or skills supporting directorship • Deep knowledge of our business, strategy and technology gained through serving as President of our Oncology Systems business and Chief Operating Officer before becoming our President and Chief Executive Officer • Significant knowledge of domestic and international medical and healthcare industries gained from serving in management positions at General Electric • Critical insight into operational requirements of a company with worldwide reach, knowledge of corporate and business unit strategies, and operational expertise, each gained from executive management experience at two large, global organizations • Experience serving on the board of directors and as lead director of another public company |
Delinquent Section 16(a) Reports
Under U.S. securities laws, directors, certain officers and persons holding more than 10% of our common stock as of the Record Date. Varex is now an independent publicly traded company and is listed on The NASDAQ Global Select Market under the ticker symbol "VREX." Varian continues to trade on the New York Stock Exchange under the ticker symbol "VAR." see Note 2, "Discontinued Operations" of the Notes to the Consolidated Financial Statements.
10b5-1
plan.Code of products in foreign countries are also subject to regulation of matters such as product standards, packaging requirements, labeling requirements, import restrictions, environmental and product recycling requirements, tariff regulations, duties and tax requirements. In some countries, we rely on our foreign distributors and agents to assist us in complying with foreign regulatory requirements.Conduct
1. From our main web page, first click “Investors.”
2. Next click on “Governance.”
3. Finally, click on “Code of Conduct” in the Audit Committee, Compensation and Management Development Committee, Ethics and Compliance Committee, Nominating and Corporate Governance Committee and Executive Committee are also available on the Investors page of our website. Investors and others should note that we announce material financial and operational information to our investors using our investor relations website (http://investors.varian.com/), press releases, SEC filings and public conference calls and webcasts. drop-down navigation bar.
8
Please note that information on, or that can be accessed through, our website is not deemed “filed” with the SEC and is not to be incorporated by reference into any of our filings under the Securities Act of 1933, as amended, (the “Securities Act”), or the Securities Exchange Act of 1934, as amended (the “Exchange Act”).
| High | Low | |||||||
| Fiscal Year 2017 | ||||||||
| First Quarter | $ | 94.48 | $ | 75.94 | ||||
| Second Quarter | $ | 92.57 | $ | 76.29 | ||||
| Third Quarter | $ | 105.30 | $ | 87.49 | ||||
| Fourth Quarter | $ | 107.87 | $ | 95.23 | ||||
| Fiscal Year 2016 | ||||||||
| First Quarter | $ | 72.76 | $ | 65.04 | ||||
| Second Quarter | $ | 72.01 | $ | 64.80 | ||||
| Third Quarter | $ | 76.37 | $ | 68.75 | ||||
| Fourth Quarter | $ | 88.62 | $ | 71.49 | ||||
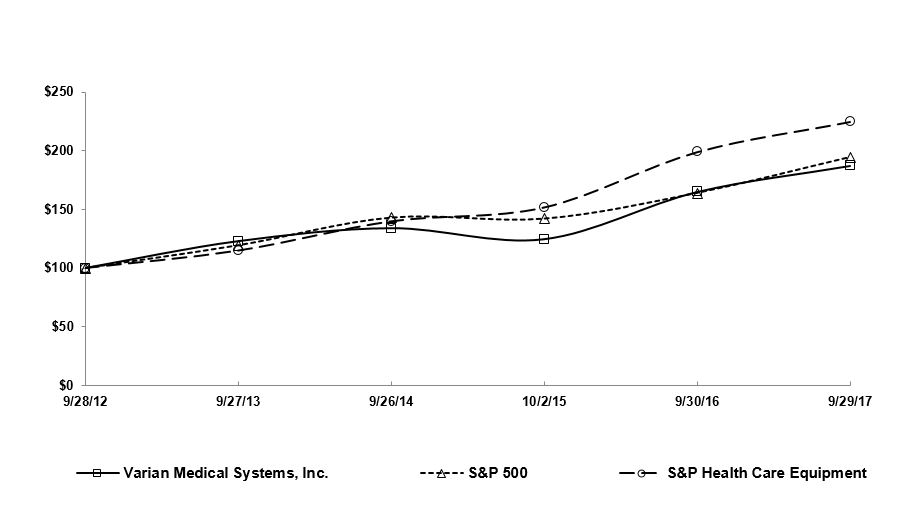
| 9/28/2012 | 9/27/2013 | 9/26/2014 | 10/2/2015 | 9/30/2016 | 9/29/2017 | |||||||
| Varian Medical Systems, Inc. | 100.00 | 122.98 | 134.12 | 124.65 | 165.00 | 187.32 | ||||||
| S&P 500 | 100.00 | 119.34 | 142.89 | 142.02 | 163.93 | 194.44 | ||||||
| S&P Health Care Equipment | 100.00 | 114.92 | 139.91 | 151.75 | 199.02 | 224.92 | ||||||
| Period | Total Number of Shares Purchased | Average Price Paid Per Share | Total Number of Shares Purchased as Part of Publicly Announced Plans or Programs | Maximum Number of Shares that May Yet Be Purchased Under the Plans or Programs (1) | ||||||||
| July 1, 2017 – July 28, 2017 | — | $ | — | — | 5.5 | |||||||
| July 29, 2017 – August 25, 2017 | 0.1 | $ | 97.00 | 0.1 | 5.4 | |||||||
| August 26, 2017 – September 29, 2017 | 0.2 | $ | 105.30 | 0.2 | 5.2 | |||||||
| Total | 0.3 | $ | 101.98 | 0.3 | 5.2 | |||||||
| Summary of Operations: | Fiscal Years (1) | |||||||||||||||||||
| (In millions, except per share amounts) | 2017 | 2016 | 2015 | 2014 | 2013 | |||||||||||||||
| Revenues | $ | 2,668.2 | $ | 2,621.1 | $ | 2,490.7 | $ | 2,392.7 | $ | 2,304.0 | ||||||||||
Earnings from continuing operations before taxes (2) | 344.8 | 440.6 | 401.3 | 374.2 | 417.8 | |||||||||||||||
| Taxes on earnings | 87.7 | 115.3 | 89.9 | 100.2 | 107.1 | |||||||||||||||
| Net earnings from continuing operations | 257.1 | 325.3 | 311.4 | 274.0 | 310.7 | |||||||||||||||
| Net earnings (loss) from discontinued operations | (6.8 | ) | 77.4 | 100.6 | 129.7 | 127.5 | ||||||||||||||
| Net earnings | 250.3 | 402.7 | 412.0 | 403.7 | 438.2 | |||||||||||||||
| Less: Net earnings attributable to noncontrolling interests | 0.7 | 0.4 | 0.5 | — | — | |||||||||||||||
| Net earnings attributable to Varian | $ | 249.6 | $ | 402.3 | $ | 411.5 | $ | 403.7 | $ | 438.2 | ||||||||||
| Net earnings (loss) per share - basic | ||||||||||||||||||||
| Continuing operations | $ | 2.78 | $ | 3.41 | $ | 3.13 | $ | 2.63 | $ | 2.87 | ||||||||||
Discontinued operations | (0.08 | ) | 0.81 | 1.00 | 1.25 | 1.17 | ||||||||||||||
| Net earnings per share - basic | $ | 2.70 | $ | 4.22 | $ | 4.13 | $ | 3.88 | $ | 4.04 | ||||||||||
| Net earnings (loss) per share – diluted | ||||||||||||||||||||
| Continuing operations | $ | 2.75 | $ | 3.39 | $ | 3.10 | $ | 2.60 | $ | 2.82 | ||||||||||
| Discontinued operations | (0.07 | ) | 0.80 | 0.99 | 1.23 | 1.16 | ||||||||||||||
| Net earnings per share - diluted | $ | 2.68 | $ | 4.19 | $ | 4.09 | $ | 3.83 | $ | 3.98 | ||||||||||
| Financial Position at Fiscal Year End: | ||||||||||||||||||||
Working capital (3) | $ | 640.2 | $ | 1,002.0 | $ | 1,016.4 | $ | 1,177.3 | $ | 1,429.5 | ||||||||||
Total assets (3) (4) | 3,179.4 | 3,814.8 | 3,576.9 | 3,336.3 | 3,455.2 | |||||||||||||||
| Short-term borrowings | 350.0 | 329.6 | 108.4 | — | — | |||||||||||||||
Long-term debt (including current maturities) (4) | — | 336.3 | 385.7 | 435.1 | 503.3 | |||||||||||||||
Total equity (3) | $ | 1,499.3 | $ | 1,744.2 | $ | 1,726.3 | $ | 1,616.4 | $ | 1,713.8 | ||||||||||
| Revenues by sales classification | Fiscal Years | ||||||||||||||||
| (Dollars in millions) | 2017 | Percent Change | 2016 | Percent Change | 2015 | ||||||||||||
| Product | $ | 1,555.5 | (2 | )% | $ | 1,583.9 | 6 | % | $ | 1,497.1 | |||||||
| Service | 1,112.7 | 7 | % | 1,037.2 | 4 | % | 993.6 | ||||||||||
| Total Revenues | $ | 2,668.2 | 2 | % | $ | 2,621.1 | 5 | % | $ | 2,490.7 | |||||||
| Product as a percentage of total revenues | 58 | % | 60 | % | 60 | % | |||||||||||
| Service as a percentage of total revenues | 42 | % | 40 | % | 40 | % | |||||||||||
| Revenues by region | Fiscal Years | ||||||||||||||||||||||
| (Dollars in millions) | 2017 | Percent Change | Constant Currency (1) | 2016 | Percent Change | Constant Currency | 2015 | ||||||||||||||||
| Americas | $ | 1,363.8 | 6 | % | 6 | % | $ | 1,285.4 | (3 | )% | (3 | )% | $ | 1,329.4 | |||||||||
| EMEA | 771.6 | (6 | )% | (5 | )% | 824.7 | 13 | % | 18 | % | 730.5 | ||||||||||||
| APAC | 532.8 | 4 | % | 3 | % | 511.0 | 19 | % | 17 | % | 430.8 | ||||||||||||
| Total Revenues | $ | 2,668.2 | 2 | % | 2 | % | $ | 2,621.1 | 5 | % | 7 | % | $ | 2,490.7 | |||||||||
| North America | $ | 1,283.0 | 7 | % | 7 | % | $ | 1,201.2 | (4 | )% | (4 | )% | $ | 1,248.3 | |||||||||
International (2) | 1,385.2 | (2 | )% | (2 | )% | 1,419.9 | 14 | % | 17 | % | 1,242.4 | ||||||||||||
| Total Revenues | $ | 2,668.2 | 2 | % | 2 | % | $ | 2,621.1 | 5 | % | 7 | % | $ | 2,490.7 | |||||||||
| North America as a percentage of total revenues | 48 | % | 47 | % | 51 | % | |||||||||||||||||
| International as a percentage of total revenues | 52 | % | 53 | % | 49 | % | |||||||||||||||||
| Revenues by sales classification | Fiscal Years | ||||||||||||||||||||||
| (Dollars in millions) | 2017 | Percent Change | Constant Currency | 2016 | Percent Change | Constant Currency | 2015 | ||||||||||||||||
| Product | $ | 1,383.0 | (3 | )% | (3 | )% | $ | 1,430.3 | 5 | % | 6 | % | $ | 1,359.2 | |||||||||
| Service | 1,102.7 | 7 | % | 7 | % | 1,027.7 | 4 | % | 5 | % | 987.6 | ||||||||||||
| Total Oncology Systems Revenues | $ | 2,485.7 | 1 | % | 1 | % | $ | 2,458.0 | 5 | % | 6 | % | $ | 2,346.8 | |||||||||
| Product as a percentage of Oncology Systems revenues | 56 | % | 58 | % | 58 | % | |||||||||||||||||
| Service as a percentage of Oncology Systems revenues | 44 | % | 42 | % | 42 | % | |||||||||||||||||
| Oncology Systems revenues as a percentage of total revenues | 93 | % | 94 | % | 94 | % | |||||||||||||||||
| Revenues by region | Fiscal Years | ||||||||||||||||||||||
| (Dollars in millions) | 2017 | Percent Change | Constant Currency | 2016 | Percent Change | Constant Currency | 2015 | ||||||||||||||||
| Americas | $ | 1,276.0 | 4 | % | 4 | % | $ | 1,229.8 | 1 | % | 2 | % | $ | 1,212.1 | |||||||||
| EMEA | 703.5 | (5 | )% | (3 | )% | 739.3 | 5 | % | 9 | % | 703.9 | ||||||||||||
| APAC | 506.2 | 4 | % | 3 | % | 488.9 | 13 | % | 12 | % | 430.8 | ||||||||||||
| Total Oncology System Revenues | $ | 2,485.7 | 1 | % | 1 | % | $ | 2,458.0 | 5 | % | 6 | % | $ | 2,346.8 | |||||||||
| North America | $ | 1,195.2 | 4 | % | 4 | % | $ | 1,145.6 | 1 | % | 1 | % | $ | 1,131.0 | |||||||||
| International | 1,290.5 | (2 | )% | (1 | )% | 1,312.4 | 8 | % | 10 | % | 1,215.8 | ||||||||||||
| Total Oncology System Revenues | $ | 2,485.7 | 1 | % | 1 | % | $ | 2,458.0 | 5 | % | 6 | % | $ | 2,346.8 | |||||||||
| North America as a percentage of total Oncology Systems revenues | 49 | % | 47 | % | 49 | % | |||||||||||||||||
| International as a percentage of total Oncology Systems revenues | 51 | % | 53 | % | 51 | % | |||||||||||||||||
| Revenues by sales classification | Fiscal Years | ||||||||||||||||
| (Dollars in millions) | 2017 | Percent Change | 2016 | Percent Change | 2015 | ||||||||||||
| Product | $ | 172.5 | 13 | % | $ | 153.1 | 11 | % | $ | 137.9 | |||||||
| Service | 10.0 | 4 | % | 9.5 | 70 | % | 5.6 | ||||||||||
| Total VPT revenues | $ | 182.5 | 12 | % | $ | 162.6 | 13 | % | $ | 143.5 | |||||||
| VPT revenues as a percentage of total revenues | 7 | % | 6 | % | 6 | % | |||||||||||
| Fiscal Years | |||||||||||||||||
| Dollars by segment | 2017 | Percent Change | 2016 | Percent Change | 2015 | ||||||||||||
| (Dollars in millions) | |||||||||||||||||
| Oncology Systems | $ | 1,139.6 | 5 | % | $ | 1,087.7 | 9 | % | $ | 998.9 | |||||||
| Varian Particle Therapy | 16.0 | (36 | )% | 25.2 | (24 | )% | 33.2 | ||||||||||
| Gross margin | $ | 1,155.6 | 4 | % | $ | 1,112.9 | 8 | % | $ | 1,032.1 | |||||||
| Percentage by segment | |||||||||||||||||
| Oncology Systems | 45.8 | % | 44.3 | % | 42.6 | % | |||||||||||
| Varian Particle Therapy | 8.8 | % | 15.4 | % | 23.1 | % | |||||||||||
| Total Company | 43.3 | % | 42.5 | % | 41.4 | % | |||||||||||
| Fiscal Years | |||||||||||||||||
| (Dollars in millions) | 2017 | Percent Change | 2016 | Percent Change | 2015 | ||||||||||||
| Research and development | $ | 210.0 | 5 | % | $ | 200.4 | 3 | % | $ | 195.4 | |||||||
| As a percentage of total revenues | 8 | % | 8 | % | 8 | % | |||||||||||
| Fiscal Years | |||||||||||||||||
| (Dollars in millions) | 2017 | Percent Change | 2016 | Percent Change | 2015 | ||||||||||||
| Selling, general and administrative | $ | 552.3 | 16 | % | $ | 475.3 | 8 | % | $ | 441.0 | |||||||
| Impairment charges | $ | 51.4 | n/m | $ | 2.2 | n/m | $ | — | |||||||||
| Selling, general and administrative as a percentage of total revenues | 21 | % | 18 | % | 18 | % | |||||||||||
| Impairment charges as a percentage of total revenues | 2 | % | — | % | — | % | |||||||||||
| Fiscal Years | |||||||||||||||||
| (Dollars in millions) | 2017 | Percent Change | 2016 | Percent Change | 2015 | ||||||||||||
| Interest income, net | $ | 2.9 | (49 | )% | $ | 5.6 | — | % | $ | 5.6 | |||||||
| Fiscal Years | ||||||||||||||
| 2017 | Percent Change | 2016 | Percent Change | 2015 | ||||||||||
| Effective tax rate | 25.4 | % | (0.8 | )% | 26.2 | % | 3.8 | % | 22.4 | % | ||||
| Fiscal Years | |||||||||||
| (in millions) | 2017(1) | 2016 | 2015 | ||||||||
| Revenues | $ | 194.0 | $ | 596.7 | $ | 608.4 | |||||
| Cost of revenues | 117.3 | 348.3 | 357.9 | ||||||||
| Gross margin | 76.7 | 248.4 | 250.5 | ||||||||
Operating expenses (2) | 76.1 | 132.6 | 97.2 | ||||||||
| Operating earnings | 0.6 | 115.8 | 153.3 | ||||||||
| Taxes on earnings | 7.4 | 38.4 | 52.7 | ||||||||
| Net earnings (loss) from discontinued operations | (6.8 | ) | 77.4 | 100.6 | |||||||
| Less: Net earnings from discontinued operations attributable to noncontrolling interests | 0.1 | 0.5 | 0.7 | ||||||||
| Net earnings (loss) from discontinued operations attributable to Varian | $ | (6.9 | ) | $ | 76.9 | $ | 99.9 | ||||
| Fiscal Years | |||||||||||||||||
| 2017 | Percent Change | 2016 | Percent Change | 2015 | |||||||||||||
| Net earnings per diluted share - continuing operations | $ | 2.75 | (19 | )% | $ | 3.39 | 9 | % | $ | 3.10 | |||||||
| Net earnings per diluted share - discontinued operations | (0.07 | ) | (109 | )% | 0.80 | (19 | )% | 0.99 | |||||||||
| Total net earnings per diluted share | $ | 2.68 | (36 | )% | $ | 4.19 | 2 | % | $ | 4.09 | |||||||
| Total Gross Orders (by segment) | Fiscal Years | ||||||||||||||||
| (Dollars in millions) | 2017 | Percent Change | 2016 | Percent Change | 2015 | ||||||||||||
| Oncology Systems | $ | 2,905.8 | 7 | % | $ | 2,724.5 | 1 | % | $ | 2,699.7 | |||||||
| Varian Particle Therapy | 229.2 | 120 | % | 104.3 | (67 | )% | 316.9 | ||||||||||
| Other | — | (100 | )% | 0.4 | 7 | % | 0.3 | ||||||||||
| Total Gross Orders | $ | 3,135.0 | 11 | % | $ | 2,829.2 | (6 | )% | $ | 3,016.9 | |||||||
| Gross Orders by region | Fiscal Years | ||||||||||||||||||||||
| (Dollars in millions) | 2017 | Percent Change | Constant Currency | 2016 | Percent Change | Constant Currency | 2015 | ||||||||||||||||
| Americas | $ | 1,479.0 | 3 | % | 3 | % | $ | 1,438.4 | 4 | % | 4 | % | $ | 1,384.1 | |||||||||
| EMEA | 878.2 | 14 | % | 14 | % | 772.9 | (6 | )% | (4 | )% | 826.0 | ||||||||||||
| APAC | 548.6 | 7 | % | 7 | % | 513.2 | 5 | % | 3 | % | 489.6 | ||||||||||||
| Total Oncology Systems Gross Orders | $ | 2,905.8 | 7 | % | 7 | % | $ | 2,724.5 | 1 | % | 1 | % | $ | 2,699.7 | |||||||||
| North America | $ | 1,386.2 | 6 | % | 5 | % | $ | 1,313.8 | 4 | % | 4 | % | $ | 1,258.2 | |||||||||
| International | 1,519.6 | 8 | % | 8 | % | 1,410.7 | (2 | )% | (1 | )% | 1,441.5 | ||||||||||||
| Total Oncology Systems Gross Orders | $ | 2,905.8 | 7 | % | 7 | % | $ | 2,724.5 | 1 | % | 1 | % | $ | 2,699.7 | |||||||||
| Trailing 12 months ended | |||||||
| September 29, 2017 | June 30, 2017 | March 31, 2017 | December 30, 2016 | ||||
| Americas | 3% | 4% | 5% | 4% | |||
| EMEA | 14% | (3)% | (4)% | (2)% | |||
| APAC | 7% | 13% | 15% | 13% | |||
| North America | 6% | 2% | 5% | 6% | |||
| International | 8% | 5% | 3% | 3% | |||
| Total Oncology Systems Gross Orders | 7% | 3% | 4% | 4% | |||
| September 29, | September 30, | ||||||||||
| (In millions) | 2017 | 2016 | Increase (Decrease) | ||||||||
| Cash and cash equivalents in continuing operations | $ | 716.2 | $ | 811.4 | $ | (95.2 | ) | ||||
| Cash and cash equivalents in discontinued operations | — | 32.1 | (32.1 | ) | |||||||
| Total cash and cash equivalents. | $ | 716.2 | $ | 843.5 | $ | (127.3 | ) | ||||
| Fiscal Years | ||||||||||||
| (In millions) | 2017 | 2016 | 2015 | |||||||||
| Net cash flow provided by (used in): | ||||||||||||
| Operating activities | $ | 399.1 | $ | 356.3 | $ | 469.6 | ||||||
| Investing activities | (130.1 | ) | (109.2 | ) | (210.9 | ) | ||||||
| Financing activities | (392.4 | ) | (245.8 | ) | (276.7 | ) | ||||||
| Effects of exchange rate changes on cash and cash equivalents | (3.9 | ) | (3.3 | ) | 14.2 | |||||||
| Net decrease in cash and cash equivalents | $ | (127.3 | ) | $ | (2.0 | ) | $ | (3.8 | ) | |||
| September 29, 2017 | September 30, 2016 | ||||||||||||
| (In millions, except for percentages) | Amount | Weighted-Average Interest Rate | Amount | Weighted-Average Interest Rate | |||||||||
| 2017 Revolving Credit Facility | $ | 350.0 | 2.36 | % | $ | — | — | % | |||||
| Current portion of 2013 Term Loan Facility | — | — | % | 50.0 | 1.65 | % | |||||||
| 2013 Revolving Credit Facility | — | — | % | 300.0 | 1.91 | % | |||||||
| Sumitomo Credit Facility | — | — | % | 29.6 | 0.53 | % | |||||||
| Debt issuance costs | — | (0.6 | ) | ||||||||||
| Total short-term debt | $ | 350.0 | $ | 379.0 | |||||||||
| 2013 Term Loan Facility | $ | — | — | % | $ | 287.5 | 1.65 | % | |||||
| Debt issuance costs | — | (0.6 | ) | ||||||||||
| Total long-term debt | $ | — | $ | 286.9 | |||||||||
| Fourth Quarter of Fiscal Year 2017 | Fiscal Years | ||||||||||||||
| (In millions except for percentages) | 2017 | 2016 | 2015 | ||||||||||||
| Amount outstanding (at end of period) | $ | 350.0 | $ | 350.0 | $ | 329.6 | $ | 108.4 | |||||||
| Weighted average interest rate (at end of period) | 2.36 | % | 2.36 | % | 1.78 | % | 1.41 | % | |||||||
| Average amount outstanding (during period) | $ | 146.0 | $ | 192.6 | $ | 320.8 | $ | 104.5 | |||||||
| Weighted average interest rate (during period) | 2.30 | % | 1.90 | % | 1.68 | % | 1.48 | % | |||||||
| Maximum month-end amount outstanding during period | $ | 350.0 | $ | 350.0 | $ | 431.6 | $ | 140.0 | |||||||
| Fiscal Years | |||||||||||
| (In millions, except per share amounts) | 2017 | 2016 | 2015 | ||||||||
| Number of shares | 3.3 | 5.7 | 4.8 | ||||||||
| Average repurchase price per share | $ | 90.63 | $ | 81.61 | $ | 87.47 | |||||
| Total cost | $ | 294.5 | $ | 461.3 | $ | 422.0 | |||||
| Payments Due By Period | |||||||||||||||||||
| Fiscal Year | Fiscal Years | Fiscal Years | |||||||||||||||||
| (In millions) | 2018 | 2019-2020 | 2021-2022 | Beyond | Total | ||||||||||||||
Operating leases (1) | $ | 24.9 | $ | 37.3 | $ | 25.6 | $ | 19.1 | $ | 106.9 | |||||||||
Purchase obligations (2) | 31.0 | 39.7 | 3.6 | — | 74.3 | ||||||||||||||
Defined benefit pension plans (3) | 8.7 | — | — | — | 8.7 | ||||||||||||||
Total (4) | $ | 64.6 | $ | 77.0 | $ | 29.2 | $ | 19.1 | $ | 189.9 | |||||||||
| (Dollars in millions) | Notional Value Sold | Notional Value Purchased | Weighted Average Contract Rate (Foreign Currency Units per USD) | ||||||||
| Australian Dollar | $ | 29.1 | $ | — | 1.28 | ||||||
| Brazilian Real | 5.2 | — | 3.18 | ||||||||
| British Pound | 14.8 | 0.1 | 0.75 | ||||||||
| Canadian Dollar | 8.2 | — | 1.25 | ||||||||
| Danish Krone | — | 0.3 | 6.29 | ||||||||
| Euro | 247.2 | 6.1 | 0.85 | ||||||||
| Hungarian Forint | 3.1 | — | 262.83 | ||||||||
| Indian Rupee | 12.7 | — | 65.65 | ||||||||
| Japanese Yen | 47.1 | — | 112.45 | ||||||||
| Polish Zloty | 4.6 | — | 3.65 | ||||||||
| Swedish Krona | 0.6 | — | 8.16 | ||||||||
| Swiss Franc | — | 59.8 | 0.97 | ||||||||
| Thai Baht | 4.8 | — | 33.31 | ||||||||
| Totals | $ | 377.4 | $ | 66.3 | |||||||
| Fiscal Years | ||||||||||||
| (In millions, except per share amounts) | 2017 | 2016 | 2015 | |||||||||
| Revenues: | ||||||||||||
| Product | $ | 1,555.5 | $ | 1,583.9 | $ | 1,497.1 | ||||||
| Service | 1,112.7 | 1,037.2 | 993.6 | |||||||||
| Total revenues | 2,668.2 | 2,621.1 | 2,490.7 | |||||||||
| Cost of revenues: | ||||||||||||
| Product | 1,025.3 | 1,071.3 | 1,035.3 | |||||||||
| Service | 487.3 | 436.9 | 423.3 | |||||||||
| Total cost of revenues | 1,512.6 | 1,508.2 | 1,458.6 | |||||||||
| Gross margin | 1,155.6 | 1,112.9 | 1,032.1 | |||||||||
| Operating expenses: | ||||||||||||
| Research and development | 210.0 | 200.4 | 195.4 | |||||||||
| Selling, general and administrative | 552.3 | 475.3 | 441.0 | |||||||||
| Impairment charges | 51.4 | 2.2 | — | |||||||||
| Total operating expenses | 813.7 | 677.9 | 636.4 | |||||||||
| Operating earnings | 341.9 | 435.0 | 395.7 | |||||||||
| Interest income | 13.6 | 17.2 | 13.5 | |||||||||
| Interest expense | (10.7 | ) | (11.6 | ) | (7.9 | ) | ||||||
| Earnings from continuing operations before taxes | 344.8 | 440.6 | 401.3 | |||||||||
| Taxes on earnings | 87.7 | 115.3 | 89.9 | |||||||||
| Net earnings from continuing operations | 257.1 | 325.3 | 311.4 | |||||||||
| Net earnings (loss) from discontinued operations | (6.8 | ) | 77.4 | 100.6 | ||||||||
| Net earnings | 250.3 | 402.7 | 412.0 | |||||||||
| Less: Net earnings attributable to noncontrolling interests | 0.7 | 0.4 | 0.5 | |||||||||
| Net earnings attributable to Varian | $ | 249.6 | $ | 402.3 | $ | 411.5 | ||||||
| Net earnings (loss) per share - basic | ||||||||||||
| Continuing operations | $ | 2.78 | $ | 3.41 | $ | 3.13 | ||||||
| Discontinued operations | (0.08 | ) | 0.81 | 1.00 | ||||||||
| Net earnings per share - basic | $ | 2.70 | $ | 4.22 | $ | 4.13 | ||||||
| Net earnings (loss) per share - diluted | ||||||||||||
| Continuing operations | $ | 2.75 | $ | 3.39 | $ | 3.10 | ||||||
| Discontinued operations | (0.07 | ) | 0.80 | 0.99 | ||||||||
| Net earnings per share - diluted | $ | 2.68 | $ | 4.19 | $ | 4.09 | ||||||
| Shares used in the calculation of net earnings per share: | ||||||||||||
| Weighted average shares outstanding - basic | 92.5 | 95.4 | 99.7 | |||||||||
| Weighted average shares outstanding - diluted | 93.2 | 96.0 | 100.6 | |||||||||
| Fiscal Years | ||||||||||||
| (In millions) | 2017 | 2016 | 2015 | |||||||||
| Net earnings | $ | 250.3 | $ | 402.7 | $ | 412.0 | ||||||
| Other comprehensive earnings (loss), net of tax: | ||||||||||||
| Defined benefit pension and post-retirement benefit plans: | ||||||||||||
| Net gain (loss) arising during the year, net of tax (expense) benefit of ($2.5), $4.3 and $0.9 | 10.0 | (21.4 | ) | (4.7 | ) | |||||||
| Prior service credit arising during the year, net of tax expense of ($0.7), ($0.2) and $0.0 | 4.3 | 1.1 | — | |||||||||
| Amortization of prior service cost included in net periodic benefit cost, net of tax benefit of $0.2, $0.2 and $0.1 | (0.8 | ) | (0.4 | ) | (0.2 | ) | ||||||
| Amortization, settlement and curtailment of net actuarial loss included in net periodic benefit cost, net of tax expense of ($1.0), ($0.5) and ($0.6) | 5.7 | 3.5 | 2.9 | |||||||||
| 19.2 | (17.2 | ) | (2.0 | ) | ||||||||
| Derivative instruments: | ||||||||||||
| Change in unrealized gain (loss), net of tax (expense) benefit of $0.0, $0.4 and ($0.8) | — | (0.6 | ) | 1.4 | ||||||||
| Reclassification adjustments, net of tax (expense) benefit of $0.0, ($0.4) and $1.4 | — | 0.6 | (2.4 | ) | ||||||||
| — | — | (1.0 | ) | |||||||||
| Available-for-sale securities: | ||||||||||||
| Change in unrealized loss, net of tax benefit of $0.0, $0.1 and $0.1 | — | (0.3 | ) | (0.1 | ) | |||||||
| Reclassification adjustments, net of tax expense of $0.0, ($0.2) and $0.0 | — | 0.4 | — | |||||||||
| — | 0.1 | (0.1 | ) | |||||||||
| Currency translation adjustment | 12.8 | 2.8 | (24.8 | ) | ||||||||
| Other comprehensive earnings (loss) | 32.0 | (14.3 | ) | (27.9 | ) | |||||||
| Comprehensive earnings | 282.3 | 388.4 | 384.1 | |||||||||
| Less: Comprehensive earnings attributable to noncontrolling interests | 0.7 | 0.4 | 0.5 | |||||||||
| Comprehensive earnings attributable to Varian | $ | 281.6 | $ | 388.0 | $ | 383.6 | ||||||
| September 29, | September 30, | ||||||
| (In millions, except par values) | 2017 | 2016 | |||||
| Assets | |||||||
| Current assets: | |||||||
| Cash and cash equivalents | $ | 716.2 | $ | 811.4 | |||
| Short-term investments | — | 95.3 | |||||
| Accounts receivable, net of allowance for doubtful accounts of $45.9 at September 29, 2017 and $24.2 at September 30, 2016 | 823.5 | 769.6 | |||||
| Inventories | 439.7 | 442.4 | |||||
| Prepaid expenses and other current assets | 199.8 | 141.1 | |||||
| Current assets of discontinued operations | 11.1 | 355.6 | |||||
| Total current assets | 2,190.3 | 2,615.4 | |||||
| Property, plant and equipment, net | 255.3 | 258.6 | |||||
| Goodwill | 222.6 | 220.0 | |||||
| Intangible assets | 71.6 | 84.1 | |||||
| Deferred tax assets | 138.8 | 136.8 | |||||
| Other assets | 300.8 | 227.0 | |||||
| Non-current assets of discontinued operations | — | 272.9 | |||||
| Total assets | $ | 3,179.4 | $ | 3,814.8 | |||
| Liabilities, Redeemable Noncontrolling Interests and Equity | |||||||
| Current liabilities: | |||||||
| Accounts payable | $ | 162.3 | $ | 159.2 | |||
| Accrued liabilities | 394.7 | 383.6 | |||||
| Deferred revenues | 640.6 | 608.6 | |||||
| Short-term borrowings | 350.0 | 329.6 | |||||
| Current maturities of long-term debt | — | 49.4 | |||||
| Current liabilities of discontinued operations | 2.5 | 83.0 | |||||
| Total current liabilities | 1,550.1 | 1,613.4 | |||||
| Long-term debt | — | 286.9 | |||||
| Other long-term liabilities | 130.0 | 155.8 | |||||
| Non-current liabilities of discontinued operations | — | 4.2 | |||||
| Total liabilities | 1,680.1 | 2,060.3 | |||||
| Commitments and contingencies (Note 9) | |||||||
| Redeemable noncontrolling interests of discontinued operations | — | 10.3 | |||||
| Equity: | |||||||
| Varian stockholders' equity: | |||||||
| Preferred stock of $1 par value: 1.0 shares authorized; none issued and outstanding | — | — | |||||
| Common stock of $1 par value: 189.0 shares authorized; 91.7 and 93.7 shares issued and outstanding at September 29, 2017 and at September 30, 2016, respectively | 91.7 | 93.7 | |||||
| Capital in excess of par value | 716.1 | 678.6 | |||||
| Retained earnings | 756.0 | 1,069.0 | |||||
| Accumulated other comprehensive loss | (68.8 | ) | (100.8 | ) | |||
| Total Varian stockholders' equity | 1,495.0 | 1,740.5 | |||||
| Noncontrolling interests | 4.3 | 3.7 | |||||
| Total equity | 1,499.3 | 1,744.2 | |||||
| Total liabilities, redeemable noncontrolling interests and equity | $ | 3,179.4 | $ | 3,814.8 | |||
| Fiscal Years | |||||||||||
| (In millions) | 2017 | 2016 | 2015 | ||||||||
| Cash flows from operating activities: | |||||||||||
| Net earnings | $ | 250.3 | $ | 402.7 | $ | 412.0 | |||||
| Adjustments to reconcile net earnings to net cash provided by operating activities: | |||||||||||
| Share-based compensation expense | 41.2 | 48.3 | 46.3 | ||||||||
| Tax benefits from exercises of share-based payment awards | 0.7 | 3.0 | 12.6 | ||||||||
| Excess tax benefits from share-based compensation | (1.0 | ) | (3.9 | ) | (12.6 | ) | |||||
| Depreciation | 58.5 | 64.2 | 60.1 | ||||||||
| Amortization of intangible assets | 18.4 | 15.6 | 8.4 | ||||||||
| Deferred taxes | (14.9 | ) | (23.9 | ) | 5.4 | ||||||
| Provision for doubtful accounts receivable | 43.7 | 3.5 | 1.1 | ||||||||
| Impairment charges | 51.4 | 2.2 | — | ||||||||
| Other, net | 3.0 | 2.1 | 1.4 | ||||||||
| Changes in assets and liabilities, net of effects of acquisitions: | |||||||||||
| Accounts receivable | (52.6 | ) | (168.3 | ) | (79.4 | ) | |||||
| Inventories | (0.1 | ) | (27.7 | ) | (41.6 | ) | |||||
| Prepaid expenses and other assets | (46.7 | ) | 8.0 | (8.2 | ) | ||||||
| Accounts payable | 5.5 | 9.7 | 6.5 | ||||||||
| Accrued liabilities and other long-term liabilities | 11.7 | 61.0 | (14.0 | ) | |||||||
| Deferred revenues | 30.0 | (40.2 | ) | 71.6 | |||||||
| Net cash provided by operating activities | 399.1 | 356.3 | 469.6 | ||||||||
| Cash flows from investing activities: | |||||||||||
| Purchases of property, plant and equipment | (59.1 | ) | (80.4 | ) | (91.4 | ) | |||||
| Issuance of notes receivable | (18.2 | ) | (21.7 | ) | (23.7 | ) | |||||
| Purchase of senior secured debt | (24.5 | ) | — | — | |||||||
| Investment in available-for-sale securities | (13.4 | ) | (3.3 | ) | (1.8 | ) | |||||
| Sale of available-for-sale securities | — | 8.6 | 0.6 | ||||||||
| Sale of notes receivable | — | 8.3 | — | ||||||||
| Investment in privately-held companies | (8.4 | ) | (0.6 | ) | — | ||||||
| Acquisitions, net of cash acquired | (3.0 | ) | (21.1 | ) | (95.3 | ) | |||||
| Net amounts received from (paid to) deferred compensation plan trust account | (4.4 | ) | 0.3 | 1.8 | |||||||
| Other | 0.9 | 0.7 | (1.1 | ) | |||||||
| Net cash used in investing activities | (130.1 | ) | (109.2 | ) | (210.9 | ) | |||||
| Cash flows from financing activities: | |||||||||||
| Repurchases of common stock | (294.5 | ) | (461.3 | ) | (422.0 | ) | |||||
| Proceeds from issuance of common stock to employees | 72.1 | 60.6 | 91.0 | ||||||||
| Excess tax benefits from share-based compensation | 1.0 | 3.9 | 12.6 | ||||||||
| Employees' taxes withheld and paid for restricted stock and restricted stock units | (10.7 | ) | (11.0 | ) | (16.3 | ) | |||||
| Cash received from Varex term facility | 200.0 | — | — | ||||||||
| Cash and cash equivalents contributed to Varex Imaging Corporation | (42.6 | ) | — | — | |||||||
| Borrowings under credit facility agreement | 231.0 | 83.0 | 145.0 | ||||||||
| Repayments under credit facility agreement | (223.5 | ) | (133.0 | ) | (195.0 | ) | |||||
| Net (repayments) borrowings under the credit facility agreements with maturities less than 90 days | (322.0 | ) | 217.1 | 108.6 | |||||||
| Contingent consideration and hold back | (1.4 | ) | (5.6 | ) | (3.4 | ) | |||||
| Other | (1.8 | ) | 0.5 | 2.8 | |||||||
| Net cash used in financing activities | (392.4 | ) | (245.8 | ) | (276.7 | ) | |||||
| Effects of exchange rate changes on cash and cash equivalents | (3.9 | ) | (3.3 | ) | 14.2 | ||||||
| Net decrease in cash and cash equivalents | (127.3 | ) | (2.0 | ) | (3.8 | ) | |||||
Cash and cash equivalents at beginning of period* | 843.5 | 845.5 | 849.3 | ||||||||
Cash and cash equivalents at end of period* | $ | 716.2 | $ | 843.5 | $ | 845.5 | |||||
| Common Stock | |||||||||||||||||||||||||||||||
| (In millions) | Shares | Amount | Capital in Excess of Par Value | Retained Earnings | Accumulated Other Comprehensive Loss | Total Varian Stockholders' Equity | Noncontrolling Interests | Total Equity | |||||||||||||||||||||||
| Balances at September 26, 2014 | 101.0 | $ | 101.0 | $ | 642.8 | $ | 931.2 | $ | (58.6 | ) | $ | 1,616.4 | $ | — | $ | 1,616.4 | |||||||||||||||
| Net earnings | — | — | — | 411.5 | — | 411.5 | 0.5 | 412.0 | |||||||||||||||||||||||
| Other comprehensive loss | — | — | — | — | (27.9 | ) | (27.9 | ) | — | (27.9 | ) | ||||||||||||||||||||
| Issuance of common stock | 2.1 | 2.1 | 88.9 | — | — | 91.0 | — | 91.0 | |||||||||||||||||||||||
| Tax benefits from exercises of share-based payment awards | — | — | 12.6 | — | — | 12.6 | — | 12.6 | |||||||||||||||||||||||
| Shares repurchased for tax withholdings on vesting of restricted stock and restricted stock units | (0.2 | ) | (0.2 | ) | (16.1 | ) | — | — | (16.3 | ) | — | (16.3 | ) | ||||||||||||||||||
| Share-based compensation expense | — | — | 46.3 | — | — | 46.3 | — | 46.3 | |||||||||||||||||||||||
| Repurchases of common stock | (4.8 | ) | (4.8 | ) | (92.3 | ) | (324.9 | ) | — | (422.0 | ) | — | (422.0 | ) | |||||||||||||||||
| Acquisition of MeVis Medical Solutions AG | — | — | — | — | — | — | 10.2 | 10.2 | |||||||||||||||||||||||
| Capital contributions by Noncontrolling interests | — | — | — | — | — | — | 4.0 | 4.0 | |||||||||||||||||||||||
| Balances at October 2, 2015 | 98.1 | 98.1 | 682.2 | 1,017.8 | (86.5 | ) | 1,711.6 | 14.7 | 1,726.3 | ||||||||||||||||||||||
| Net earnings | — | — | — | 402.3 | — | 402.3 | (0.1 | ) | 402.2 | ||||||||||||||||||||||
| Other comprehensive loss | — | — | — | — | (14.3 | ) | (14.3 | ) | — | (14.3 | ) | ||||||||||||||||||||
| Issuance of common stock | 1.4 | 1.4 | 60.5 | — | — | 61.9 | — | 61.9 | |||||||||||||||||||||||
| Tax benefits from exercises of share-based payment awards | — | — | 3.0 | — | — | 3.0 | — | 3.0 | |||||||||||||||||||||||
| Shares repurchased for tax withholdings on vesting of restricted stock and restricted stock units | (0.1 | ) | (0.1 | ) | (10.9 | ) | — | — | (11.0 | ) | — | (11.0 | ) | ||||||||||||||||||
| Share-based compensation expense | — | — | 48.3 | — | — | 48.3 | — | 48.3 | |||||||||||||||||||||||
| Repurchases of common stock | (5.7 | ) | (5.7 | ) | (104.5 | ) | (351.1 | ) | — | (461.3 | ) | — | (461.3 | ) | |||||||||||||||||
| Reclassification of noncontrolling interest in MeVis to redeemable noncontrolling interest | — | — | — | — | — | — | (10.4 | ) | (10.4 | ) | |||||||||||||||||||||
| Other | — | — | — | — | — | — | (0.5 | ) | (0.5 | ) | |||||||||||||||||||||
| Balances at September 30, 2016 | 93.7 | 93.7 | 678.6 | 1,069.0 | (100.8 | ) | 1,740.5 | 3.7 | 1,744.2 | ||||||||||||||||||||||
| Net earnings | — | — | — | 249.6 | — | 249.6 | 0.6 | 250.2 | |||||||||||||||||||||||
| Other comprehensive earnings | — | — | — | — | 32.0 | 32.0 | — | 32.0 | |||||||||||||||||||||||
| Issuance of common stock | 1.4 | 1.4 | 69.3 | — | — | 70.7 | — | 70.7 | |||||||||||||||||||||||
| Tax benefits from exercises of share-based payment awards | — | — | 0.7 | — | — | 0.7 | — | 0.7 | |||||||||||||||||||||||
| Shares repurchased for tax withholdings on vesting of restricted stock and restricted stock units | (0.1 | ) | (0.1 | ) | (10.6 | ) | — | — | (10.7 | ) | — | (10.7 | ) | ||||||||||||||||||
| Share-based compensation expense | — | — | 40.8 | — | — | 40.8 | — | 40.8 | |||||||||||||||||||||||
| Repurchases of common stock | (3.3 | ) | (3.3 | ) | (62.7 | ) | (228.5 | ) | — | (294.5 | ) | — | (294.5 | ) | |||||||||||||||||
| Distribution of Varex | — | — | — | (334.1 | ) | — | (334.1 | ) | — | (334.1 | ) | ||||||||||||||||||||
| Balances at September 29, 2017 | 91.7 | $ | 91.7 | $ | 716.1 | $ | 756.0 | $ | (68.8 | ) | $ | 1,495.0 | $ | 4.3 | $ | 1,499.3 | |||||||||||||||
| Fiscal Years | |||||||||||
| (In millions) | 2017(1) | 2016 | 2015 | ||||||||
| Revenues | $ | 194.0 | $ | 596.7 | $ | 608.4 | |||||
| Cost of revenues | 117.3 | 348.3 | 357.9 | ||||||||
| Gross margin | 76.7 | 248.4 | 250.5 | ||||||||
Operating expenses (2) | 76.1 | 132.6 | 97.2 | ||||||||
| Operating earnings | 0.6 | 115.8 | 153.3 | ||||||||
| Taxes on earnings | 7.4 | 38.4 | 52.7 | ||||||||
| Net earnings (loss) from discontinued operations | (6.8 | ) | 77.4 | 100.6 | |||||||
| Less: Net earnings from discontinued operations attributable to noncontrolling interests | 0.1 | 0.5 | 0.7 | ||||||||
| Net earnings (loss) from discontinued operations attributable to Varian | $ | (6.9 | ) | $ | 76.9 | $ | 99.9 | ||||
| (In millions) | September 29, 2017 | September 30, 2016 | |||||
| Assets: | |||||||
| Cash | $ | — | $ | 32.1 | |||
| Accounts receivable, net | 8.1 | 122.2 | |||||
| Inventories | 2.9 | 197.3 | |||||
| Prepaid expenses and other current assets | 0.1 | 4.0 | |||||
| Current assets of discontinued operations | 11.1 | 355.6 | |||||
| Property, plant and equipment, net | — | 120.6 | |||||
| Goodwill | — | 74.7 | |||||
| Intangible assets | — | 20.6 | |||||
| Deferred tax assets | — | 2.1 | |||||
| Other assets | — | 54.9 | |||||
| Total assets of discontinued operations | $ | 11.1 | $ | 628.5 | |||
| Liabilities: | |||||||
| Accounts payable | $ | 2.0 | $ | 41.9 | |||
| Accrued liabilities | 0.5 | 29.1 | |||||
| Deferred revenues | — | 12.0 | |||||
| Current liabilities of discontinued operations | 2.5 | 83.0 | |||||
| Other long-term liabilities | — | 4.2 | |||||
| Total liabilities of discontinued operations | $ | 2.5 | $ | 87.2 | |||
| Redeemable noncontrolling interests of discontinued operations | $ | — | $ | 10.3 | |||
| Fiscal Years | |||||||||||
| (In millions) | 2017 | 2016 | 2015 | ||||||||
| Operating activities: | |||||||||||
| Share-based compensation expense | $ | 2.0 | $ | 6.1 | $ | 6.4 | |||||
| Depreciation expense | 4.8 | 10.5 | 10.5 | ||||||||
| Amortization expense | 1.8 | 5.5 | 2.7 | ||||||||
| Investing activities: | |||||||||||
| Purchases of property, plant & equipment | (6.4 | ) | (28.9 | ) | (34.3 | ) | |||||
Acquisition of business, net of cash acquired (1) | — | (1.2 | ) | (67.9 | ) | ||||||
| Sale of available-for-sale securities | $ | — | $ | 8.6 | $ | — | |||||
| September 29, 2017 | |||||||||||||||
| (In millions) | Amortized Cost | Gross Unrealized Gains | Gross Unrealized Losses | Fair Value | |||||||||||
| Original CPTC Loans | $ | 47.4 | $ | — | $ | — | $ | 47.4 | |||||||
| DRTC Securities | 8.0 | — | — | 8.0 | |||||||||||
| GPTC securities | 4.4 | — | — | 4.4 | |||||||||||
| Total available-for-sale securities | $ | 59.8 | $ | — | $ | — | $ | 59.8 | |||||||
| September 30, 2016 | |||||||||||||||
| (In millions) | Amortized Cost | Gross Unrealized Gains | Gross Unrealized Losses | Fair Value | |||||||||||
| Original CPTC Loans | $ | 95.3 | $ | — | $ | — | $ | 95.3 | |||||||
| Total available-for-sale securities | $ | 95.3 | $ | — | $ | — | $ | 95.3 | |||||||
| September 29, | September 30, | |||||||
| (In millions) | 2017 | 2016 | ||||||
| Raw materials and parts | $ | 296.5 | $ | 257.9 | ||||
| Work-in-process | 47.7 | 69.6 | ||||||
| Finished goods | 95.5 | 114.9 | ||||||
| Total inventories | $ | 439.7 | $ | 442.4 | ||||
| September 29, | September 30, | |||||||
| (In millions) | 2017 | 2016 | ||||||
| Prepaid income taxes | $ | 69.4 | $ | 41.3 | ||||
RPTC senior secured debt (1) | 25.4 | — | ||||||
| Prepaid compensation | 11.6 | 9.9 | ||||||
| Advance payments to suppliers | 11.1 | 16.9 | ||||||
| Other current receivables | 32.5 | 29.2 | ||||||
| Other prepaid expenses | 49.8 | 43.8 | ||||||
| Total prepaid expenses and other current assets | $ | 199.8 | $ | 141.1 | ||||
| September 29, | September 30, | |||||||
| (In millions) | 2017 | 2016 | ||||||
| Land and land improvements | $ | 44.2 | $ | 44.2 | ||||
| Buildings and leasehold improvements | 220.4 | 211.7 | ||||||
| Machinery and equipment | 375.9 | 358.3 | ||||||
| Construction in progress | 14.6 | 15.9 | ||||||
| 655.1 | 630.1 | |||||||
| Accumulated depreciation and amortization | (399.8 | ) | (371.5 | ) | ||||
| Total property, plant and equipment, net | $ | 255.3 | $ | 258.6 | ||||
| September 29, | September 30, | |||||||
| (In millions) | 2017 | 2016 | ||||||
| Long-term receivables, net | $ | 101.3 | $ | 113.8 | ||||
| Deferred Compensation Plan ("DCP") assets | 72.7 | 61.1 | ||||||
| Long-term available-for-sale securities | 59.8 | — | ||||||
| Investments in privately-held companies | 27.1 | 18.7 | ||||||
| Other | 39.9 | 33.4 | ||||||
| Total other assets | $ | 300.8 | $ | 227.0 | ||||
| September 29, | September 30, | |||||||
| (In millions) | 2017 | 2016 | ||||||
| Accrued compensation and benefits | $ | 109.7 | $ | 105.1 | ||||
| DCP liabilities | 70.7 | 61.5 | ||||||
| Product warranty | 42.9 | 44.2 | ||||||
| Income taxes payable | 38.8 | 54.4 | ||||||
| Other | 132.6 | 118.4 | ||||||
| Total accrued liabilities | $ | 394.7 | $ | 383.6 | ||||
| September 29, | September 30, | |||||||
| (In millions) | 2017 | 2016 | ||||||
| Long-term income taxes payable | $ | 48.6 | $ | 46.2 | ||||
| Deferred income taxes | 19.8 | 24.5 | ||||||
| Other | 61.6 | 85.1 | ||||||
| Total other long-term liabilities | $ | 130.0 | $ | 155.8 | ||||
| Fair Value Measurement Using | ||||||||||||||||
| Type of Instruments | Quoted Prices in Active Markets for Identical Instruments (Level 1) | Significant Other Observable Inputs (Level 2) | Significant Unobservable Inputs (Level 3) | Total Balance | ||||||||||||
| (In millions) | ||||||||||||||||
| Assets at September 29, 2017: | ||||||||||||||||
| Available-for-sale securities: | ||||||||||||||||
| Original CPTC Loans | $ | — | $ | — | $ | 47.4 | $ | 47.4 | ||||||||
| DRTC securities | — | 8.0 | — | 8.0 | ||||||||||||
| GPTC securities | — | 4.4 | — | 4.4 | ||||||||||||
| Total assets measured at fair value | $ | — | $ | 12.4 | $ | 47.4 | $ | 59.8 | ||||||||
| Assets at September 30, 2016: | ||||||||||||||||
| Available-for-sale securities: | ||||||||||||||||
| Original CPTC Loans | $ | — | $ | — | $ | 95.3 | $ | 95.3 | ||||||||
| Total assets measured at fair value | $ | — | $ | — | $ | 95.3 | $ | 95.3 | ||||||||
| Liabilities at September 30, 2016: | ||||||||||||||||
| Contingent consideration | $ | — | $ | — | $ | (1.3 | ) | $ | (1.3 | ) | ||||||
| Total liabilities measured at fair value | $ | — | $ | — | $ | (1.3 | ) | $ | (1.3 | ) | ||||||
| (In millions) | Available-for-sale Securities | Contingent Consideration | ||||||
| Balance at October 2, 2015 | $ | 83.9 | $ | (4.1 | ) | |||
Additions (1) | 11.4 | — | ||||||
Settlements (2) | — | 3.5 | ||||||
| Change in fair value recognized in earnings | — | (0.7 | ) | |||||
| Balance at September 30, 2016 | 95.3 | (1.3 | ) | |||||
Additions (1) | 3.3 | — | ||||||
Settlements (2) | — | 1.6 | ||||||
| Change in fair value recognized in earnings | (51.2 | ) | (0.3 | ) | ||||
| Balance at September 29, 2017 | $ | 47.4 | $ | — | ||||
| September 29, | September 30, | ||||||
| (In millions) | 2017 | 2016 | |||||
| Accounts receivable, gross | $ | 901.2 | $ | 848.4 | |||
| Allowance for doubtful accounts | (63.1 | ) | (24.2 | ) | |||
| Accounts receivable, net | $ | 838.1 | $ | 824.2 | |||
Short-term | $ | 823.5 | $ | 769.6 | |||
Long-term (1) | $ | 14.6 | $ | 54.6 | |||
| Notes receivable | $ | 91.7 | $ | 65.0 | |||
Short-term (2) | $ | 5.0 | $ | 5.8 | |||
Long-term (1) | $ | 86.7 | $ | 59.2 | |||
| (In millions) | Oncology Systems | Varian Particle Therapy | Total | |||||||||
| Balance at October 2, 2015 | $ | 158.8 | $ | 50.0 | $ | 208.8 | ||||||
| Business combinations | 11.4 | — | 11.4 | |||||||||
| Foreign currency translation adjustments | — | (0.2 | ) | (0.2 | ) | |||||||
| Balance at September 30, 2016 | 170.2 | 49.8 | 220.0 | |||||||||
| Foreign currency translation adjustments | — | 2.6 | 2.6 | |||||||||
| Balance at September 29, 2017 | $ | 170.2 | $ | 52.4 | $ | 222.6 | ||||||
| September 29, 2017 | September 30, 2016 | |||||||||||||||||||||||
| (In millions) | Gross Carrying Amount | Accumulated Amortization | Net Carrying Amount | Gross Carrying Amount | Accumulated Amortization | Net Carrying Amount | ||||||||||||||||||
| Technologies and patents | $ | 102.0 | $ | (60.9 | ) | $ | 41.1 | $ | 99.6 | $ | (50.2 | ) | $ | 49.4 | ||||||||||
| Customer contracts and supplier relationship | 33.9 | (14.3 | ) | 19.6 | 32.3 | (10.8 | ) | 21.5 | ||||||||||||||||
| Other | 5.5 | (3.4 | ) | 2.1 | 5.6 | (1.2 | ) | 4.4 | ||||||||||||||||
| Total intangible with finite lives | 141.4 | (78.6 | ) | 62.8 | 137.5 | (62.2 | ) | 75.3 | ||||||||||||||||
| In-process research and development with indefinite lives | 8.8 | — | 8.8 | 8.8 | — | 8.8 | ||||||||||||||||||
| Total intangible assets | $ | 150.2 | $ | (78.6 | ) | $ | 71.6 | $ | 146.3 | $ | (62.2 | ) | $ | 84.1 | ||||||||||
| Fiscal Years | Total | |||
| 2018 | $ | 17.4 | ||
| 2019 | 13.0 | |||
| 2020 | 9.3 | |||
| 2021 | 7.2 | |||
| 2022 | 6.0 | |||
| Thereafter | 9.9 | |||
| Total remaining amortization | $ | 62.8 | ||
| September 29, 2017 | September 30, 2016 | ||||||||||||
| (In millions, except for percentages) | Amount | Weighted-Average Interest Rate | Amount | Weighted-Average Interest Rate | |||||||||
| Short-term debt: | |||||||||||||
| 2017 Revolving Credit Facility | $ | 350.0 | 2.36 | % | $ | — | — | % | |||||
| Current portion of 2013 Term Loan Facility | — | — | % | 50.0 | 1.65 | % | |||||||
| 2013 Revolving Credit Facility | — | — | % | 300.0 | 1.91 | % | |||||||
| Sumitomo Credit Facility | — | — | % | 29.6 | 0.53 | % | |||||||
| Debt issuance costs | — | (0.6 | ) | ||||||||||
| Total short-term debt | $ | 350.0 | $ | 379.0 | |||||||||
| Long-term debt: | |||||||||||||
| 2013 Term Loan Facility | $ | — | — | % | $ | 287.5 | 1.65 | % | |||||
| Debt issuance costs | — | (0.6 | ) | ||||||||||
| Total long-term debt | $ | — | $ | 286.9 | |||||||||
| Gain (Loss) Recognized in Other Comprehensive Income (Effective Portion) | Location of Gain (Loss) Reclassified from Accumulated Other Comprehensive Income into Net Earnings (Effective Portion) | Gain (Loss) Reclassified from Accumulated Other Comprehensive Income into Net Earnings (Effective Portion) | ||||||||||||||||||||||||
| Fiscal Years | Fiscal Years | |||||||||||||||||||||||||
| (In millions) | 2017 | 2016 | 2015 | 2017 | 2016 | 2015 | ||||||||||||||||||||
| Foreign currency forward contracts | $ | — | $ | (1.0 | ) | $ | 2.2 | Revenues | $ | — | $ | (1.0 | ) | $ | 3.8 | |||||||||||
| September 29, 2017 | ||||||||
| (In millions) | Notional Value Sold | Notional Value Purchased | ||||||
| Australian Dollar | $ | 29.1 | $ | — | ||||
| Brazilian Real | 5.2 | — | ||||||
| British Pound | 14.8 | 0.1 | ||||||
| Canadian Dollar | 8.2 | — | ||||||
| Danish Krone | — | 0.3 | ||||||
| Euro | 247.2 | 6.1 | ||||||
| Hungarian Forint | 3.1 | — | ||||||
| Indian Rupee | 12.7 | — | ||||||
| Japanese Yen | 47.1 | — | ||||||
| Polish Zloty | 4.6 | — | ||||||
| Swedish Krona | 0.6 | — | ||||||
| Swiss Franc | — | 59.8 | ||||||
| Thai Baht | 4.8 | — | ||||||
| Totals | $ | 377.4 | $ | 66.3 | ||||
| Location of Gain (Loss) Recognized in Income on Derivative | Amount of Gain (Loss) Recognized in Net Earnings on Derivative | |||||||||||
| Fiscal Years | ||||||||||||
| (In millions) | 2017 | 2016 | 2015 | |||||||||
| Selling, general and administrative expenses | $ | (10.9 | ) | $ | (5.3 | ) | $ | 27.6 | ||||
| Fiscal Years | ||||||||
| (In millions) | 2017 | 2016 | ||||||
| Accrued product warranty, at beginning of period | $ | 48.0 | $ | 39.8 | ||||
| Charged to cost of revenues | 46.9 | 46.4 | ||||||
| Actual product warranty expenditures | (47.7 | ) | (38.2 | ) | ||||
| Accrued product warranty, at end of period | $ | 47.2 | $ | 48.0 | ||||
| (In millions) | Recurring Costs | Non-Recurring Costs | Total Anticipated Future Costs | |||||||||
| Fiscal Years: | ||||||||||||
| 2018 | $ | 0.4 | $ | 0.7 | $ | 1.1 | ||||||
| 2019 | 0.4 | 0.5 | 0.9 | |||||||||
| 2020 | 0.4 | 0.4 | 0.8 | |||||||||
| 2021 | 0.4 | 0.2 | 0.6 | |||||||||
| 2022 | 0.4 | 0.4 | 0.8 | |||||||||
| Thereafter | 1.7 | 0.9 | 2.6 | |||||||||
| Total costs | $ | 3.7 | $ | 3.1 | $ | 6.8 | ||||||
| Less imputed interest | 0.8 | |||||||||||
| Reserve amount | $ | 6.0 | ||||||||||
| (in millions) | September 30, 2016 | Restructuring Charges (Reversals) | Cash Payments | September 29, 2017 | |||||||||||
| 2017 Restructuring Plan | $ | — | $ | 13.2 | $ | (9.3 | ) | $ | 3.9 | ||||||
| 2016 Restructuring Plan and prior plans | 1.6 | (0.6 | ) | (1.0 | ) | — | |||||||||
| $ | 1.6 | $ | 12.6 | $ | (10.3 | ) | $ | 3.9 | |||||||
| (In millions) | September 29, 2017 | September 30, 2016 | |||||
| Change in benefit obligation: | |||||||
| Benefit obligation - beginning of fiscal year | $ | 238.3 | $ | 206.9 | |||
| Service cost | 7.1 | 5.9 | |||||
| Interest cost | 2.4 | 4.0 | |||||
| Plan participants’ contributions | 8.7 | 8.6 | |||||
| Plan amendments | (5.0 | ) | (1.2 | ) | |||
| Plan settlements | (6.9 | ) | (4.0 | ) | |||
| Net transfer in | 0.5 | — | |||||
| Actuarial (gain) loss | (11.3 | ) | 31.6 | ||||
| Foreign currency changes | 1.6 | (8.8 | ) | ||||
| Benefit and expense payments | (4.7 | ) | (4.7 | ) | |||
| Benefit obligation - end of fiscal year | $ | 230.7 | $ | 238.3 | |||
| Change in plan assets: | |||||||
| Plan assets - beginning of fiscal year | $ | 199.3 | $ | 186.9 | |||
| Employer contributions | 8.2 | 8.0 | |||||
| Actual return on plan assets | 8.0 | 12.9 | |||||
| Plan participants’ contributions | 8.7 | 8.6 | |||||
| Plan settlements | (6.9 | ) | (4.0 | ) | |||
| Foreign currency changes | 2.0 | (8.6 | ) | ||||
| Acquisitions / divestitures | 0.5 | — | |||||
| Benefit and expense payments | (4.7 | ) | (4.5 | ) | |||
| Plan assets - end of fiscal year | $ | 215.1 | $ | 199.3 | |||
| Funded status | $ | (15.6 | ) | $ | (39.0 | ) | |
| Amounts recognized within the consolidated balance sheet: | |||||||
| Other assets | $ | 3.6 | $ | — | |||
| Other long-term liabilities | (19.2 | ) | (39.0 | ) | |||
| Net amount recognized | $ | (15.6 | ) | $ | (39.0 | ) | |
| (In millions) | September 29, 2017 | September 30, 2016 | |||||
| Prior service credit | $ | 6.3 | $ | 1.8 | |||
| Net loss | (61.5 | ) | (79.5 | ) | |||
| Accumulated other comprehensive loss | $ | (55.2 | ) | $ | (77.7 | ) | |
| (In millions) | September 29, 2017 | September 30, 2016 | |||||
| Projected benefit obligation | $ | 16.6 | $ | 17.2 | |||
| Accumulated benefit obligation | $ | 15.4 | $ | 16.3 | |||
| Fair value of plan assets | $ | 13.4 | $ | 12.8 | |||
| Fiscal Years | ||||||||||||
| (In millions) | 2017 | 2016 | 2015 | |||||||||
| Net Periodic Benefit Costs: | ||||||||||||
| Service cost | $ | 7.1 | $ | 5.9 | $ | 5.6 | ||||||
| Interest cost | 2.4 | 4.0 | 4.4 | |||||||||
| Loss due to settlement | 1.4 | 1.0 | 1.1 | |||||||||
| Expected return on assets | (7.1 | ) | (6.7 | ) | (7.1 | ) | ||||||
| Amortization of prior service cost | (0.5 | ) | — | 0.1 | ||||||||
| Recognized actuarial loss | 4.3 | 2.9 | 2.4 | |||||||||
| Net periodic benefit cost | 7.6 | 7.1 | 6.5 | |||||||||
| Other Amounts Recognized in Other Comprehensive (Income) Loss: | ||||||||||||
| New prior service credit | (5.0 | ) | (1.2 | ) | (1.1 | ) | ||||||
| Net (gain) loss arising during the year | (12.2 | ) | 25.3 | 6.7 | ||||||||
| Amortization of prior service credit (cost) | 0.5 | — | (0.1 | ) | ||||||||
| Amortization or settlement of net actuarial loss | (5.7 | ) | (3.9 | ) | (3.5 | ) | ||||||
| Total recognized in other comprehensive (income) loss | (22.4 | ) | 20.2 | 2.0 | ||||||||
| Total recognized in net periodic benefit cost and other comprehensive (income) loss | $ | (14.8 | ) | $ | 27.3 | $ | 8.5 | |||||
| (In millions) | Total | |||
| Prior service credit | $ | 0.6 | ||
| Net loss | (2.9 | ) | ||
| Total | $ | (2.3 | ) | |
| Fiscal Years | |||||||||
| Net Periodic Benefit Cost | 2017 | 2016 | 2015 | ||||||
| Discount rate | 1.03 | % | 2.05 | % | 2.59 | % | |||
| Rate of compensation increase | 2.33 | % | 2.42 | % | 2.46 | % | |||
| Expected long-term return on assets | 3.56 | % | 3.57 | % | 3.76 | % | |||
| Benefit Obligation | September 29, 2017 | September 30, 2016 | ||||
| Discount rate | 1.40 | % | 1.03 | % | ||
| Rate of compensation increase | 2.40 | % | 2.33 | % | ||
| (In millions) | Quoted Prices in Active Markets for Identical Assets (Level 1) | Significant Observable Inputs (Level 2) | Significant Unobservable Inputs (Level 3) | Total | ||||||||||||
| As of September 29, 2017: | ||||||||||||||||
| Investment funds: | ||||||||||||||||
| Mutual funds - equities | $ | — | $ | 62.6 | $ | — | $ | 62.6 | ||||||||
| Mutual funds - debt | — | 36.3 | — | 36.3 | ||||||||||||
| Mutual funds - real estate | — | 4.9 | — | 4.9 | ||||||||||||
| Other | — | 3.2 | — | 3.2 | ||||||||||||
| Assets held by insurance company: | ||||||||||||||||
| Insurance contracts | — | 107.6 | — | 107.6 | ||||||||||||
| Cash and cash equivalents | 0.5 | — | — | 0.5 | ||||||||||||
| Total | $ | 0.5 | $ | 214.6 | $ | — | $ | 215.1 | ||||||||
| As of September 30, 2016: | ||||||||||||||||
| Investment funds: | ||||||||||||||||
| Mutual funds - equities | $ | — | $ | 51.7 | $ | — | $ | 51.7 | ||||||||
| Mutual funds - debt | — | 27.1 | — | 27.1 | ||||||||||||
| Mutual funds - real estate | — | 4.6 | — | 4.6 | ||||||||||||
| Other | — | 2.9 | — | 2.9 | ||||||||||||
| Assets held by insurance company: | ||||||||||||||||
| Insurance contracts | — | 112.7 | — | 112.7 | ||||||||||||
| Cash and cash equivalents | 0.3 | — | — | 0.3 | ||||||||||||
| Total | $ | 0.3 | $ | 199.0 | $ | — | $ | 199.3 | ||||||||
| (In millions) | Total | |||
| Fiscal Years: | ||||
| 2018 | $ | 6.6 | ||
| 2019 | 6.9 | |||
| 2020 | 6.2 | |||
| 2021 | 7.6 | |||
| 2022 | 7.9 | |||
| Thereafter | 41.4 | |||
| Total | $ | 76.6 | ||
| Fiscal Years | |||||||||||
| (In millions, except per share amounts) | 2017 | 2016 | 2015 | ||||||||
| Number of shares | 3.3 | 5.7 | 4.8 | ||||||||
| Average repurchase price per share | $ | 90.63 | $ | 81.61 | $ | 87.47 | |||||
| Total cost | $ | 294.5 | $ | 461.3 | $ | 422.0 | |||||
Fiscal Years(1) | |||||||
| (In millions, except per share amounts) | 2016 | 2015 | |||||
| Number of shares | 1.0 | 2.3 | |||||
| Average repurchase price per share | $ | 83.98 | $ | 90.00 | |||
| Total cost | $ | 85.8 | $ | 203.9 | |||
| (In millions) | Net Unrealized Gains (Losses) Defined Benefit Pension and Post-Retirement Benefit Plans | Net Unrealized Gains (Losses) Cash Flow Hedging Instruments | Net Unrealized Gains (Losses) Available-for- Sale Securities | Cumulative Translation Adjustment | Accumulated Other Comprehensive Earnings (Loss) | |||||||||||||||
| Balance at September 26, 2014 | $ | (44.1 | ) | $ | 1.0 | $ | — | $ | (15.5 | ) | $ | (58.6 | ) | |||||||
| Other comprehensive earnings (loss) before reclassifications | (4.5 | ) | 2.2 | (0.2 | ) | (24.8 | ) | (27.3 | ) | |||||||||||
| Amounts reclassified out of other comprehensive loss | 2.1 | (3.8 | ) | — | — | (1.7 | ) | |||||||||||||
| Tax expense | 0.4 | 0.6 | 0.1 | — | 1.1 | |||||||||||||||
| Balance at October 2, 2015 | (46.1 | ) | — | (0.1 | ) | (40.3 | ) | (86.5 | ) | |||||||||||
| Other comprehensive earnings (loss) before reclassifications | (23.4 | ) | (1.0 | ) | (0.4 | ) | 2.8 | (22.0 | ) | |||||||||||
| Amounts reclassified out of other comprehensive loss | 2.4 | 1.0 | 0.6 | — | 4.0 | |||||||||||||||
| Tax benefit (expense) | 3.8 | — | (0.1 | ) | — | 3.7 | ||||||||||||||
| Balance at September 30, 2016 | (63.3 | ) | — | — | (37.5 | ) | (100.8 | ) | ||||||||||||
| Other comprehensive earnings (loss) before reclassifications | 19.8 | — | — | 12.8 | 32.6 | |||||||||||||||
| Amounts reclassified out of other comprehensive loss | 3.4 | — | — | — | 3.4 | |||||||||||||||
| Tax expense | (4.0 | ) | — | — | — | (4.0 | ) | |||||||||||||
| Balance at September 29, 2017 | $ | (44.1 | ) | $ | — | $ | — | $ | (24.7 | ) | $ | (68.8 | ) | |||||||
| Fiscal Years | ||||||||||||||
| Comprehensive Earnings Components | 2017 | 2016 | 2015 | Line Item in Statements of Earnings | ||||||||||
| Unrealized loss on defined benefit pension and post-retirement benefit plans | $ | (3.4 | ) | $ | (2.4 | ) | $ | (2.1 | ) | Cost of revenues & Operating expenses | ||||
| Unrealized gains (losses) on cash flow hedging instruments | — | (1.0 | ) | 3.8 | Revenues | |||||||||
| Unrealized loss on available-for-sale investments | — | (0.6 | ) | — | Operating expenses | |||||||||
| Total amounts reclassified out of other comprehensive loss | $ | (3.4 | ) | $ | (4.0 | ) | $ | 1.7 | ||||||
| Fiscal Years | |||||||||||||||
| 2017 | 2016 | ||||||||||||||
(In millions) | Noncontrolling Interests | Redeemable Noncontrolling Interests | Noncontrolling Interests | Redeemable Noncontrolling Interests | |||||||||||
| Balance at beginning of period | $ | 3.7 | $ | 10.3 | $ | 14.7 | $ | — | |||||||
| Net earnings (loss) attributable to noncontrolling interests | 0.6 | 0.1 | (0.1 | ) | 0.5 | ||||||||||
Reclassification of noncontrolling interests in MeVis to redeemable noncontrolling interests | — | — | (10.4 | ) | 10.4 | ||||||||||
| Transfer of redeemable noncontrolling interests in MeVis to Varex | — | (10.3 | ) | — | — | ||||||||||
| Other | — | (0.1 | ) | (0.5 | ) | (0.6 | ) | ||||||||
| Balance at end of period | $ | 4.3 | $ | — | $ | 3.7 | $ | 10.3 | |||||||
| Employee Stock Option Plans | Employee Stock Purchase Plans | |||||||||||||||||||||||
| Fiscal Years | Fiscal Years | |||||||||||||||||||||||
| 2017 | 2016 | 2015 | 2017 | 2016 | 2015 | |||||||||||||||||||
| Expected term (in years) | 3.99 | 4.13 | 4.15 | 0.50 | 0.50 | 0.50 | ||||||||||||||||||
| Risk-free interest rate | 1.7 | % | 1.1 | % | 1.3 | % | 0.7 | % | 0.3 | % | 0.1 | % | ||||||||||||
| Expected volatility | 21.3 | % | 20.1 | % | 22.1 | % | 20.3 | % | 17.6 | % | 12.7 | % | ||||||||||||
| Expected dividend | — | % | — | % | — | % | — | % | — | % | — | % | ||||||||||||
| Weighted average fair value at grant date | $ | 16.12 | $ | 13.71 | $ | 18.52 | $ | 18.92 | $ | 16.09 | $ | 15.87 | ||||||||||||
| Fiscal Years | ||||||||||||
| (In millions) | 2017 | 2016 | 2015 | |||||||||
| Cost of revenues - Product | $ | 3.0 | $ | 3.3 | $ | 3.5 | ||||||
| Cost of revenues - Service | 4.1 | 4.1 | 4.0 | |||||||||
| Research and development | 5.1 | 5.3 | 5.4 | |||||||||
| Selling, general and administrative | 27.0 | 29.5 | 27.0 | |||||||||
| Total share-based compensation expense | $ | 39.2 | $ | 42.2 | $ | 39.9 | ||||||
| Income tax benefit for share-based compensation | $ | (11.5 | ) | $ | (12.8 | ) | $ | (12.0 | ) | |||
| Fiscal Years | ||||||||||||
| (In millions) | 2017 | 2016 | 2015 | |||||||||
| Stock options | $ | 9.2 | $ | 9.9 | $ | 10.1 | ||||||
Restricted stock units and restricted stock awards (1) | 26.2 | 28.7 | 26.7 | |||||||||
| Employee stock purchase plan | 3.8 | 3.6 | 3.1 | |||||||||
| Total share-based compensation expense | $ | 39.2 | $ | 42.2 | $ | 39.9 | ||||||
| Options Outstanding | |||||||
| (In millions, except per share amounts) | Number of Shares | Weighted Average Exercise Price | |||||
| Balance at September 30, 2016 (1.4 million options exercisable at a weighted average exercise price of $76.31) | 2.6 | $ | 78.25 | ||||
| Granted | 0.6 | 82.29 | |||||
| Adjustment due to Distribution | 0.3 | 70.15 | |||||
| Canceled, expired or forfeited | (0.4 | ) | 70.26 | ||||
| Exercised | (0.8 | ) | 66.80 | ||||
| Balance at September 29, 2017 | 2.3 | $ | 74.08 | ||||
| Options Outstanding | Options Exercisable | |||||||||||||||||||||||||
| Range of Exercise Prices | Number of Shares | Weighted Average Remaining Contractual Term (in years) | Weighted Average Exercise Price | Aggregate Intrinsic Value (1) | Number of Shares | Weighted Average Remaining Contractual Term (in years) | Weighted Average Exercise Price | Aggregate Intrinsic Value (1) | ||||||||||||||||||
| (In millions, except years and per-share amounts) | ||||||||||||||||||||||||||
| $51.23 - $57.27 | 0.1 | 1.2 | $ | 52.91 | $ | 3.7 | 0.1 | 1.2 | $ | 52.91 | $ | 3.7 | ||||||||||||||
| $60.91 - $67.12 | 0.8 | 4.5 | 65.71 | 28.2 | 0.5 | 3.9 | 64.55 | 16.0 | ||||||||||||||||||
| $71.47 - $77.49 | 0.3 | 3.5 | 74.28 | 9.0 | 0.3 | 3.4 | 74.29 | 8.6 | ||||||||||||||||||
| $80.40 - $99.26 | 1.1 | 5.5 | 82.18 | 18.6 | 0.3 | 4.2 | 81.97 | 6.0 | ||||||||||||||||||
| Total | 2.3 | 4.7 | $ | 74.08 | $ | 59.5 | 1.2 | 3.7 | $ | 71.37 | $ | 34.3 | ||||||||||||||
| (In millions, except per share amounts) | Number of Shares | Weighted Average Grant-Date Fair Value | |||||
| Balance at September 30, 2016 | 1.0 | $ | 82.51 | ||||
| Granted | 0.4 | 83.96 | |||||
| Adjustment due to Distribution | 0.1 | 74.18 | |||||
| Vested | (0.4 | ) | 72.77 | ||||
| Canceled or expired | (0.2 | ) | 72.74 | ||||
| Balance at September 29, 2017 | 0.9 | $ | 75.37 | ||||
| Fiscal Years | ||||||||||||
| (In millions, except per share amounts) | 2017 | 2016 | 2015 | |||||||||
| Net earnings from continuing operations | $ | 257.1 | $ | 325.3 | $ | 311.4 | ||||||
| Less: Net earnings (loss) from continuing operations attributable to noncontrolling interests | 0.6 | (0.1 | ) | (0.2 | ) | |||||||
| Net earnings from continuing operations attributable to Varian | 256.5 | 325.4 | 311.6 | |||||||||
| Net earnings (loss) from discontinued operations | (6.8 | ) | 77.4 | 100.6 | ||||||||
| Less: Net earnings from discontinued operations attributable to noncontrolling interests | 0.1 | 0.5 | 0.7 | |||||||||
| Net earnings (loss) from discontinued operations attributable to Varian | $ | (6.9 | ) | $ | 76.9 | $ | 99.9 | |||||
| Net earnings attributable to Varian | $ | 249.6 | $ | 402.3 | $ | 411.5 | ||||||
| Denominator: | ||||||||||||
| Weighted average shares outstanding - basic | 92.5 | 95.4 | 99.7 | |||||||||
| Dilutive effect of potential common shares | 0.7 | 0.6 | 0.9 | |||||||||
| Weighted average shares outstanding - diluted | 93.2 | 96.0 | 100.6 | |||||||||
| Net earnings (loss) per share attributable to Varian - basic | ||||||||||||
| Continuing operations | $ | 2.78 | $ | 3.41 | $ | 3.13 | ||||||
| Discontinued operations | (0.08 | ) | 0.81 | 1.00 | ||||||||
| Net earnings per share - basic | $ | 2.70 | $ | 4.22 | $ | 4.13 | ||||||
| Net earnings (loss) per share attributable to Varian - diluted | ||||||||||||
| Continuing operations | $ | 2.75 | $ | 3.39 | $ | 3.10 | ||||||
| Discontinued operations | (0.07 | ) | 0.80 | 0.99 | ||||||||
| Net earnings per share - diluted | $ | 2.68 | $ | 4.19 | $ | 4.09 | ||||||
| Anti-dilutive employee share-based awards, excluded | 0.2 | 1.6 | 1.0 | |||||||||
| Fiscal Years | ||||||||||||
(In millions) | 2017 | 2016 | 2015 | |||||||||
| Current provision: | ||||||||||||
| Federal | $ | 31.6 | $ | 57.6 | $ | 5.5 | ||||||
| State and local | 4.3 | 7.4 | 4.6 | |||||||||
| Foreign | 68.9 | 74.5 | 73.2 | |||||||||
| Total current | 104.8 | 139.5 | 83.3 | |||||||||
| Deferred provision (benefit): | ||||||||||||
| Federal | (13.3 | ) | (14.9 | ) | 4.4 | |||||||
| State and local | 0.2 | (1.6 | ) | (0.4 | ) | |||||||
| Foreign | (4.0 | ) | (7.7 | ) | 2.6 | |||||||
| Total deferred | (17.1 | ) | (24.2 | ) | 6.6 | |||||||
| Taxes on earnings | $ | 87.7 | $ | 115.3 | $ | 89.9 | ||||||
| Fiscal Years | ||||||||||||
(In millions) | 2017 | 2016 | 2015 | |||||||||
| United States | $ | 93.7 | $ | 83.2 | $ | 82.3 | ||||||
| Foreign | 251.1 | 357.4 | 319.0 | |||||||||
| Total earnings before taxes | $ | 344.8 | $ | 440.6 | $ | 401.3 | ||||||
| Fiscal Years | |||||||||
| 2017 | 2016 | 2015 | |||||||
| Federal statutory income tax rate | 35.0 | % | 35.0 | % | 35.0 | % | |||
| State and local taxes, net of federal tax benefit | 0.9 | % | 0.3 | % | 0.5 | % | |||
| Non-U.S. income taxed at different rates, net | (8.4 | )% | (8.7 | )% | (12.6 | )% | |||
| Other | (2.1 | )% | (0.4 | )% | (0.5 | )% | |||
| Effective tax rate | 25.4 | % | 26.2 | % | 22.4 | % | |||
| September 29, | September 30, | ||||||
| (In millions) | 2017 | 2016 | |||||
| Deferred Tax Assets: | |||||||
| Deferred revenues | $ | 29.6 | $ | 29.5 | |||
| Deferred compensation | 45.0 | 36.5 | |||||
| Product warranty | 9.6 | 9.7 | |||||
| Inventory adjustments | 11.1 | 8.7 | |||||
| Share-based compensation | 17.8 | 22.3 | |||||
| Environmental reserve | 3.9 | 3.6 | |||||
| Accruals and reserves | 20.1 | 13.6 | |||||
| Net operating loss carryforwards | 124.4 | 106.4 | |||||
| Other | 29.7 | 37.1 | |||||
| 291.2 | 267.4 | ||||||
| Valuation allowance | (105.8 | ) | (79.6 | ) | |||
| Total deferred tax assets | 185.4 | 187.8 | |||||
| Deferred Tax Liabilities: | |||||||
| Tax-deductible goodwill | (27.7 | ) | (23.2 | ) | |||
| Property, plant and equipment | (13.6 | ) | (14.4 | ) | |||
| Unremitted earnings of foreign subsidiaries | (16.2 | ) | (20.2 | ) | |||
| Other | (8.9 | ) | (17.7 | ) | |||
| Total deferred tax liabilities | (66.4 | ) | (75.5 | ) | |||
| Net deferred tax assets | $ | 119.0 | $ | 112.3 | |||
| Reported As: | |||||||
| Deferred tax assets | $ | 138.8 | $ | 136.8 | |||
| Deferred tax liabilities (included in other long-term liabilities) | (19.8 | ) | (24.5 | ) | |||
| Net deferred tax assets | $ | 119.0 | $ | 112.3 | |||
| Fiscal Years | ||||||||||||
(In millions) | 2017 | 2016 | 2015 | |||||||||
| Federal income taxes paid, net | $ | 62.0 | $ | 78.3 | $ | 57.1 | ||||||
| State, income taxes paid, net | 5.0 | 5.0 | 7.2 | |||||||||
| Foreign income taxes paid, net | 77.1 | 72.6 | 55.5 | |||||||||
| Total income taxes paid, net | $ | 144.1 | $ | 155.9 | $ | 119.8 | ||||||
| Fiscal Years | ||||||||||||
(In millions) | 2017 | 2016 | 2015 | |||||||||
| Unrecognized tax benefits balance–beginning of fiscal year | $ | 40.7 | $ | 39.5 | $ | 49.6 | ||||||
| Additions based on tax positions related to a prior year | 1.4 | 0.6 | — | |||||||||
| Reductions based on tax positions related to a prior year | (0.3 | ) | (0.8 | ) | (9.9 | ) | ||||||
| Additions based on tax positions related to the current year | 5.8 | 6.6 | 5.7 | |||||||||
| Settlements | — | — | — | |||||||||
| Reductions resulting from the expiration of the applicable statute of limitations | (4.9 | ) | (5.2 | ) | (5.9 | ) | ||||||
| Unrecognized tax benefits balance–end of fiscal year | $ | 42.7 | $ | 40.7 | $ | 39.5 | ||||||
| (In millions) | Purchase Consideration | ||
| Cash paid | $ | 13.0 | |
Net non-cash assets transferred (1) | 21.7 | ||
| Escrow payable | 0.5 | ||
| Total purchase consideration | $ | 35.2 | |
| (In millions) | Fair Value | ||
| Net assumed liabilities | $ | (1.1 | ) |
| Finite-lived intangible assets with a weighted average useful life of 6.2 years | 24.9 | ||
| Goodwill | 11.4 | ||
| Net assets acquired | $ | 35.2 | |
| (In millions) | Fair Value | ||
| Finite-lived intangible assets with a weighted average useful life of 8.3 years | $ | 8.3 | |
| Indefinite-lived intangible assets — IPR&D | 8.8 | ||
| Goodwill | 9.9 | ||
| Net assets acquired | $ | 27.0 | |
| September 29, 2017 | September 30, 2016 | ||||||||||||||
| (In millions) | Balance | Commitment | Balance | Commitment | |||||||||||
| Notes receivable and senior secured debt: | |||||||||||||||
MPTC loans (1) | $ | 60.1 | $ | — | $ | 40.7 | $ | 11.4 | |||||||
NYPC loan (1) | 18.5 | — | 18.5 | — | |||||||||||
RPTC senior secured debt (2) | 25.4 | — | — | — | |||||||||||
CPTC DIP loan (1) | 5.1 | 2.2 | — | — | |||||||||||
PI loan (1) | 3.0 | — | — | — | |||||||||||
| $ | 112.1 | $ | 2.2 | $ | 59.2 | $ | 11.4 | ||||||||
| Available-for-sale securities: | |||||||||||||||
Original CPTC loans (3) | $ | 47.4 | $ | — | $ | 95.3 | $ | 1.1 | |||||||
DRTC securities (1) | 8.0 | — | — | — | |||||||||||
GPTC securities (1) | 4.4 | 11.8 | — | — | |||||||||||
| $ | 59.8 | $ | 11.8 | $ | 95.3 | $ | 1.1 | ||||||||
| Revenues | |||||||||||
| Fiscal Years | |||||||||||
| (In millions) | 2017 | 2016 | 2015 | ||||||||
| Oncology Systems: | |||||||||||
| Product | $ | 1,383.0 | $ | 1,430.3 | $ | 1,359.2 | |||||
| Service | 1,102.7 | 1,027.7 | 987.6 | ||||||||
| Total Oncology Systems | 2,485.7 | 2,458.0 | 2,346.8 | ||||||||
| Varian Particle Therapy: | |||||||||||
| Product | 172.5 | 153.1 | 137.9 | ||||||||
| Service | 10.0 | 9.5 | 5.6 | ||||||||
| Total Varian Particle Therapy | 182.5 | 162.6 | 143.5 | ||||||||
| Total reportable segments | 2,668.2 | 2,620.6 | 2,490.3 | ||||||||
| Other | — | 0.5 | 0.4 | ||||||||
| Total Company | $ | 2,668.2 | $ | 2,621.1 | $ | 2,490.7 | |||||
| Operating Earnings | |||||||||||
| Fiscal Years | |||||||||||
| (In millions) | 2017 | 2016 | 2015 | ||||||||
| Oncology Systems | $ | 520.7 | $ | 518.6 | $ | 447.4 | |||||
| Varian Particle Therapy | (95.7 | ) | (44.6 | ) | (26.5 | ) | |||||
| Total reportable segments | 425.0 | 474.0 | 420.9 | ||||||||
| Other | — | (5.6 | ) | (6.2 | ) | ||||||
| Corporate | (83.1 | ) | (33.4 | ) | (19.0 | ) | |||||
| Total Company | $ | 341.9 | $ | 435.0 | $ | 395.7 | |||||
| Depreciation & Amortization | Total Assets | |||||||||||||||||||||||
| Fiscal Years | Fiscal Years | |||||||||||||||||||||||
| (In millions) | 2017 | 2016 | 2015 | 2017 | 2016 | 2015 | ||||||||||||||||||
| Oncology Systems | $ | 39.4 | $ | 28.5 | $ | 21.8 | $ | 1,452.7 | $ | 1,491.2 | $ | 1,411.3 | ||||||||||||
| Varian Particle Therapy | 6.1 | 6.8 | 4.8 | 354.4 | 367.8 | 294.0 | ||||||||||||||||||
| Total reportable segments | 45.5 | 35.3 | 26.6 | 1,807.1 | 1,859.0 | 1,705.3 | ||||||||||||||||||
| Other | — | 0.2 | 0.2 | — | 2.1 | 2.2 | ||||||||||||||||||
| Corporate | 24.8 | 28.3 | 28.5 | 1,361.2 | 1,325.2 | 1,275.9 | ||||||||||||||||||
| Discontinued operations | 6.6 | 16.0 | 13.2 | 11.1 | 628.5 | 595.3 | ||||||||||||||||||
| Total Company | $ | 76.9 | $ | 79.8 | $ | 68.5 | $ | 3,179.4 | $ | 3,814.8 | $ | 3,578.7 | ||||||||||||
| Fiscal Years | ||||||||||||
| (In millions) | 2017 | 2016 | 2015 | |||||||||
| Oncology Systems | $ | 520.7 | $ | 518.6 | $ | 447.4 | ||||||
| Varian Particle Therapy | (95.7 | ) | (44.6 | ) | (26.5 | ) | ||||||
| Total reportable segments | 425.0 | 474.0 | 420.9 | |||||||||
| Other | — | (5.6 | ) | (6.2 | ) | |||||||
| Corporate | (83.1 | ) | (33.4 | ) | (19.0 | ) | ||||||
| Interest income, net | 2.9 | 5.6 | 5.6 | |||||||||
| Total earnings from continuing operations before taxes | $ | 344.8 | $ | 440.6 | $ | 401.3 | ||||||
Revenues | Property, plant and equipment, net | |||||||||||||||||||||||
| Fiscal Years | Fiscal Years | |||||||||||||||||||||||
| (In millions) | 2017 | 2016 | 2015 | 2017 | 2016 | 2015 | ||||||||||||||||||
| United States | $ | 1,237.0 | $ | 1,161.7 | $ | 1,212.3 | $ | 163.8 | $ | 177.0 | $ | 194.8 | ||||||||||||
| International | 1,431.2 | 1,459.4 | 1,278.4 | 91.5 | 81.6 | 78.3 | ||||||||||||||||||
| Total Company | $ | 2,668.2 | $ | 2,621.1 | $ | 2,490.7 | $ | 255.3 | $ | 258.6 | $ | 273.1 | ||||||||||||
| Fiscal Year 2017 | ||||||||||||||||||||
| (In millions, except per share amounts) | First Quarter (1) | Second Quarter | Third Quarter | Fourth Quarter (2) | Total Year | |||||||||||||||
| Total revenues | $ | 611.8 | $ | 655.0 | $ | 662.4 | $ | 739.0 | $ | 2,668.2 | ||||||||||
| Gross margin | $ | 275.7 | $ | 275.3 | $ | 293.3 | $ | 311.3 | $ | 1,155.6 | ||||||||||
| Net earnings from continuing operations | $ | 14.5 | $ | 69.3 | $ | 90.6 | $ | 82.7 | $ | 257.1 | ||||||||||
| Net earnings (loss) from discontinued operations | $ | 6.5 | $ | (13.3 | ) | $ | — | $ | — | $ | (6.8 | ) | ||||||||
| Net earnings attributable to Varian | $ | 20.4 | $ | 56.1 | $ | 90.4 | $ | 82.7 | $ | 249.6 | ||||||||||
| Net earnings (loss) per share attributable to Varian – basic: | ||||||||||||||||||||
| Continuing operations | $ | 0.15 | $ | 0.75 | $ | 0.99 | $ | 0.90 | $ | 2.78 | ||||||||||
| Discontinued operations | $ | 0.07 | $ | (0.15 | ) | $ | — | $ | — | $ | (0.08 | ) | ||||||||
| Net earnings per share - basic | $ | 0.22 | $ | 0.60 | $ | 0.99 | $ | 0.90 | $ | 2.70 | ||||||||||
| Net earnings (loss) per share attributable to Varian – diluted: | ||||||||||||||||||||
| Continuing operations | $ | 0.15 | $ | 0.74 | $ | 0.98 | $ | 0.89 | $ | 2.75 | ||||||||||
| Discontinued operations | $ | 0.07 | $ | (0.14 | ) | $ | — | $ | — | $ | (0.07 | ) | ||||||||
| Net earnings per share - diluted | $ | 0.22 | $ | 0.60 | $ | 0.98 | $ | 0.89 | $ | 2.68 | ||||||||||
| Fiscal Year 2016 | ||||||||||||||||||||
| (In millions, except per share amounts) | First Quarter | Second Quarter | Third Quarter | Fourth Quarter | Total Year | |||||||||||||||
| Total revenues | $ | 615.8 | $ | 615.2 | $ | 642.9 | $ | 747.2 | $ | 2,621.1 | ||||||||||
| Gross margin | $ | 252.5 | $ | 258.1 | $ | 283.5 | $ | 318.8 | $ | 1,112.9 | ||||||||||
| Net earnings from continuing operations | $ | 71.9 | $ | 77.2 | $ | 81.9 | $ | 94.3 | $ | 325.3 | ||||||||||
| Net earnings from discontinued operations | $ | 17.1 | $ | 19.8 | $ | 17.0 | $ | 23.5 | $ | 77.4 | ||||||||||
| Net earnings attributable to Varian | $ | 89.0 | $ | 97.0 | $ | 98.8 | $ | 117.5 | $ | 402.3 | ||||||||||
| Net earnings per share attributable to Varian – basic: | ||||||||||||||||||||
| Continuing operations | $ | 0.74 | $ | 0.81 | $ | 0.86 | $ | 1.00 | $ | 3.41 | ||||||||||
| Discontinued operations | $ | 0.18 | $ | 0.20 | $ | 0.18 | $ | 0.25 | $ | 0.81 | ||||||||||
| Net earnings per share - basic | $ | 0.92 | $ | 1.01 | $ | 1.04 | $ | 1.25 | $ | 4.22 | ||||||||||
| Net earnings per share attributable to Varian – diluted: | ||||||||||||||||||||
| Continuing operations | $ | 0.74 | $ | 0.80 | $ | 0.86 | $ | 1.00 | $ | 3.39 | ||||||||||
| Discontinued operations | $ | 0.17 | $ | 0.21 | $ | 0.18 | $ | 0.24 | $ | 0.80 | ||||||||||
| Net earnings per share - diluted | $ | 0.91 | $ | 1.01 | $ | 1.04 | $ | 1.24 | $ | 4.19 | ||||||||||
We intend to satisfy the disclosure requirements under Item 5.05(c) of Form
8-K
regarding an amendment to, or waiver from, a provision of the Code of Conduct that applies to our principal executive officer, principal financial officer, principal accounting officer or controller or persons performing similar functions by posting such information on our website, at the address and location specified above.Audit Committee
The Board has established an Audit Committee, which has the composition and responsibilities described below. A copy of the charter for the Audit Committee can be found on the “Governance” link on the Investors page on our website at.
www.varian.com
Chair:
Additional Members:
Functions
The Audit Committee performs the following principal functions:
Oversees our accounting and financial reporting process and audits of financial statements.
Assists the Board in oversight and monitoring of (i) the integrity of our financial statements, (ii) our compliance with legal and regulatory requirements, (iii) the independent registered public accounting firm’s qualifications and independence, (iv) the performance of our internal audit function and of the independent registered public accounting firm, and (v) the principal risk exposures facing the corporation that are related to financial statements, legal, regulatory and other similar matters, as well as the corporation’s related mitigation efforts.
Prepares the Audit Committee Report included in our proxy statement.
Reviews and approves our foreign exchange exposure management policy, including but not limited to entering swaps thereunder and the exemption of swaps from any execution and clearing requirements.
Reviewing cybersecurity risks and incidents and any other risks and incidents relevant to our computerized information system controls and security, and discussing if any such risks and incidents should be disclosed in our periodic filings with the SEC.
Reports to the Board the results of its monitoring and recommendations.
Provides to the Board any additional information and materials as the committee may determine is necessary to make the Board aware of significant financial matters requiring the Board’s attention.
Member Qualifications
Each member of the Audit Committee meets the additional requirements regarding independence for Audit Committee members under the NYSE listing requirements. The Board has determined that Ms. Bruner is an “audit committee financial expert” as defined in Item 407(d)(5) of Regulation
S-K
under the Exchange Act based upon her experience as the Chief Financial Officer of Sandisk Corporation between 2004 and 2016 and as the Chief Financial Officer of Palm, Inc. between 1999 and 2004, and her formal education represented by her MBA from the University of Santa Clara. The Board has also determined that Ms. Ashkenazi is an “audit committee financial expert” based upon her experience as the Chief Financial Officer of Lilly Research Labs from 2016 to the present, as the Chief Financial Officer of Lilly Diabetes and Lilly Global Manufacturing Operations from 2015 to 2016, as the Chief Financial Officer of Lilly Oncology from 2013 to 2015, and her formal education represented by her MBA fromTel-Aviv
University. Additionally, the Board has determined that Mr. Butel, Ms. Dugan and Dr. Febbo are each financially literate.As of February 2021, Ms. Bruner served on the audit committees of the boards of directors of four public companies, including the Audit Committee of our Board. Our Board determined that Ms. Bruner’s simultaneous service on the audit committees of the boards of directors of four public companies would not impair her ability to effectively serve on our Audit Committee.
9
Item 11. | Executive Compensation |
COMPENSATION OF THE NAMED EXECUTIVE OFFICERS AND DIRECTORS
Executive Summary
Business Overview.
Additionally, in August 2020, we announced a combination with a subsidiary of Siemens Healthineers Holding I GmbH (“Siemens Healthineers”), a wholly owned subsidiary of Siemens Healthineers AG, in an
all-cash
transaction valued at $16.4 billion on a fully diluted basis that will deliver immediate value to our stockholders and which we believe will bring us even closer to realizing our transformative vision of a world without fear of cancer. Under the terms of the merger agreement (“Merger Agreement”), which was approved by our stockholders in October 2020, Varian will become a wholly-owned subsidiary of Siemens Healthineers (the “Merger”), and Siemens Healthineers will acquire all outstanding shares of Varian for $177.50 per share in cash (the “Merger Consideration”). The Merger is expected to close in the first half of calendar year 2021, subject to receipt of specified regulatory approvals and other customary closing conditions.Global Radiotherapy Leader | Global Leader in Multi-Disciplinary, Integrated Cancer Care Solutions |

Impact of
COVID-19
Pandemic.COVID-19
pandemic on our fiscal year 2020 operations has varied by region, with mixed impacts based on the geographical spread, stage of containment, and recurrence of the pandemic in each region. Our operations in China were impacted first, beginning early in the second quarter of our fiscal year 2020, followed by other parts of our Asia Pacific geography, with our EMEA and Americas geographies experiencing the initial impacts of the pandemic late in the second quarter of our fiscal year 2020. Prior to the pandemic impact, we were trending toward exceeding our fiscal year 2020 annual financial performance targets with our fiscal year 2020 revenues trending higher than the comparable periods for fiscal year 2019. Beginning in the second quarter of fiscal year 2020 and through the end of fiscal year 2020, the pandemic impacted our operating and financial performance as customer capital constraints, customer site readiness and site access challenges impacted timing of orders and revenues. Despite these unprecedented challenges, our focused execution and an unwavering commitment to employee health and safety allowed us to achieve solid performance for fiscal year 2020 and ensure that our customers continued to have uninterrupted access to Varian’s innovative products and solutions.10
Key Business Highlights.
Priorities | FY20 Results | |
INNOVATE in Radiation Theraphy | • 50%+ share of the global radiation therapy market • 3% year-over-year growth in linear accelerator installed base (an increase of 221 units), bringing the total to 8,717 units • 9% of revenue invested in R&D to drive innovation and extend technology leadership • 510k approval in the US for Ethos and NMPA approval in China for Halcyon 2.0 • 34 Ethos orders and 16 installations across Australia, Denmark, Netherlands, United Kingdom, and the United States • 4 orders for ProBeam proton therapy systems in the United States and Asia | |
LEVERAGE artificial intelligence, machine learning, and cloud solutions | • 4% year-over-year growth in software revenue with 5,660+ unique software installations globally • Built data lake of 117,000+ patient records • 60,000+ patients touched on the Noona ® platform, providing patient-reported outcomes and extending into the life sciences market• FDA 510(k) clearance for Eclipse v16.1 treatment planning software for proton therapy | |
GROW emerging geographies, businesses and technologies | • Received Investigational Device Exemption (IDE) and initiated preparation for the first-ever clinical trial of Flash Therapy • Established direct presence to support customers in Kenya, Turkey, Romania and Bulgaria • Launched and shipped new Cryotouch product for Interventional Oncology | |
IMPROVE operational, financial, and capital efficiency | • $1.6 billion in accessible liquidity • $484 million in cash flow from operations, up 30% year-over-year, including a record $266 million in cash flow from operations in the fourth quarter of FY20, up 126% year-over-year • 58% of FY20 revenues from software and services, up from 53% in FY19 |
Our innovation driven culture combined with the anticipated Siemens Healthineers transaction contributed to the growth of our stock price, which has created meaningful stockholder value. As illustrated in the following graph, an investment of $1 at the end of fiscal year 2015 was worth $2.58 at the end of fiscal year 2020, an increase of 158%.
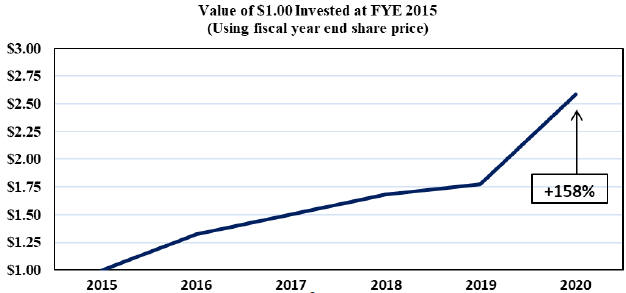
11
Fiscal Year 2020 Executive Compensation Implications of
COVID-19
and Stockholder Feedback.Annual Salary.
The Compensation Committee approved annual salary increases to select executives in December 2019 prior to the onset of the pandemic (as described in more detail below under “Fiscal Year 2020 Compensation Program and Pay Decisions”). No salary increase was approved for Mr. Wilson, along with certain other executives, at that time. Subsequently, as part of the Company’s cost savings efforts in response to the pandemic, Mr. Wilson requested and the Compensation Committee approved a 20 percent reduction in Mr. Wilson’s salary for the second half of the calendar year from July 2020 through December 2020. The Compensation Committee also recommended and the Board approved a 20 percent reduction in cash fees paid to all members of Varian’s Board of Directors for the second half of calendar year 2020.Annual Cash Incentives.
TheCOVID-19
pandemic began to impact our business in our second fiscal quarter, starting in China and then expanding to other geographies as the pandemic spread throughout the fiscal quarter. Prior to the pandemic impact, the Company was tracking to an above target payout for our annual incentive plans including a near-maximum payout for our fiscal year 2020 Management Incentive Plan (MIP) for our executives. In response to the pandemic impact, the Compensation Committee adjusted the financial goals for incentive plan participants below the executive level to (i) appropriately incent participants to make necessary changes to operations in response to the pandemic and achieve the highest possible results for the year as a whole and (ii) ensure the incentives fornon-executives
were commensurate with their significant contributions in navigating the pandemic. However, the Compensation Committee did not adjust the fiscal year 2020 financial goals for the executive annual cash Management Incentive Plan (MIP). Instead, consistent with allowable adjustments adopted by the Compensation Committee at the time the MIP goals were set, the Compensation Committee exercised its ability to consider the impact of unplanned items when determining the final MIP results. In addition to the results achieved against the financial and strategic goals that were established at the beginning of fiscal year 2020, the Compensation Committee considered the impact of the pandemic on our financial results and the actions taken in response to theCOVID-19
pandemic (as measured by a resiliency scorecard), which were intended to support our customers during these challenging times and improve the position of the Company when it emerges from the pandemic environment. Based on these factors, the Committee determined it was appropriate to cap funding at 100% of target for the financial goals portion of MIP for fiscal year 2020, resulting in individual payouts for our named executive officers (“NEOs”) ranging from 102% to 103% of target after consideration of achievements on individual strategic goals. The section below on Annual Cash Incentives provides more details regarding the fiscal year 2020 senior executive annual incentive payout determination process and outcomes.Long Term Incentive Compensation.
In response to stockholder feedback, the Compensation Committee refined the Relative TSR Modifier associated with fiscal year 2020 PSU and PSO awards (granted in November 2019) to eliminate the minimum payout feature for top quartile TSR results. Instead, for fiscal year 2020 awards, PSU and PSO payouts will be reduced by 25 percent if3-year
TSR ranks in the bottom quartile of Business Model peers (below 25th percentile) and increased by 25 percent if3-year
TSR ranks in the top quartile of Business Model peers (above 75th percentile). The Relative TSR Modifier does not apply if Varian’s3-year
TSR ranks between 25th and 75th
percentiles.The information requiredCompensation Committee determined the total target value and mix of equity awards for each NEO’s fiscal year 2020 ongoing equity grants at its regularly scheduled meeting in November 2019, prior to the onset of the
COVID-19
pandemic. In addition, in August 2020, the Compensation Committee approved a new hire grant for Mr. Hutchinson as part of his new hire package and aone-time
retention grant for Mr. Toth as an incentive to remain with the company and in recognition of the criticality of his skills, knowledge and contributions to the long-term success of Varian. These grants were made in the form of RSUs, consistent with the form of award for all other August 2020 grant recipients and with the agreed upon terms with Siemens Healthineers for grants made subsequent to the execution of the Merger Agreement. See section below on Long-Term Incentives for more details.12
Impact of Merger.
Siemens Healthineers will not assume Varian’s outstanding equity awards in connection with the Merger. As a result, in accordance with the terms of our stockholder approved Fifth Amended and Restated 2005 Stock Plan (“2005 Stock Plan”) and the Merger Agreement:For awards granted during or prior to fiscal year 2020, all stock option and other stock-based awards granted under the plan (including those held by this item is incorporated by reference from our definitive proxy statementexecutive officers) that are outstanding immediately prior to the effective time of the Merger will become fully vested and be converted into the right to receive a cash payment equal to the product of (i) the Merger Consideration (less the applicable exercise price for stock options or stock appreciation rights) and (ii) the number of shares subject to the award. For outstanding stock options and stock-based awards that vest in whole or in part based on the achievement of performance goals, the number of options and units that vest will be determined based upon target performance.
For awards granted during fiscal year 2021, grants will be made in the form of RSUs (including to our executive officers) and outstanding RSUs will convert at the effective time of the Merger to the right to a cash award payable based on the original vesting schedule and terms. The cash amount will be equal to the product of the Merger Consideration and the number of shares subject to the award.
In addition, in connection with the Merger, the Compensation Committee approved amended and restated Change in Control Agreements with certain executives, the material terms of which are described in detail below in “Other Elements of Executive Compensation-Change in Control Agreements.”
Continued alignment of pay strategy with Company performance.
90% of our CEO’s total target compensation opportunity was performance-based, with 100% of his long-term incentive (equity) awards subject to performance-based vesting.
79% of our other Named Executive Officers’ total target compensation opportunity was performance-based for our NEOs who served as executive officers for the 2018entire year, with 60% of their regular long-term incentive (equity) awards subject to performance-based vesting. (Excludes a
one-time
retention award granted to Mr. Toth in August 2020.)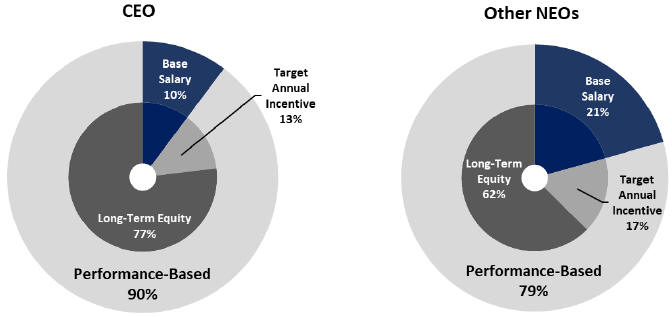
13
Say on Pay Vote History and Stockholder Engagement
Our Board and management are committed to maintaining sound and effective compensation and governance programs, with policies and programs reflecting leading practices and geared to building value for the Company’s stockholders. We have ongoing discussions with our stockholders to understand their perspectives and to communicate on a variety of corporate governance topics, including executive compensation practices. At our 2020 Annual Meeting of Stockholders, 92.4% of votes cast (for and against) were in favor of the advisory vote to approve executive compensation. Since the implementation of thestockholder advisory vote on the compensation of our named executive officers beginning at our 2011 Annual Meeting of stockholders, support from our stockholders for our executive compensation program and practices has averaged 93.6% of votes cast (for and against).
Say-On-Pay
In evaluating and approving our compensation program for fiscal year 2020, the Compensation Committee was mindful of the high level of support our stockholders expressed for the Company’s executive compensation philosophy and practices. The Compensation Committee continued to apply similar principles and philosophy as in the prior fiscal year in determining executive compensation. The Committee and management also considered feedback received by stockholders. Consistent with stockholder feedback, for fiscal year 2020 PSU and PSO awards, we refined the TSR modifier, among other things, to eliminate the provision specifying a minimum payout for top quartile relative TSR results.
Executive Compensation Practices Highlights
A set of practices strengthen the alignment of our compensation program with our stockholders’ interests:
What We Do: | What We DON’T Do: | |
✓ Independent Compensation Committee ✓ Independent compensation advisor ✓ NEOs employed “at will” ✓ Robust CEO & NEO stock ownership guidelines ✓ Clawback policy that applies to our annual cash incentive plan and equity incentive plan ✓ Annual compensation review and risk assessment ✓ Annual stockholder “say on pay” vote ✓ Award 100% of CEO and 60% of other NEO long-term incentive value in performance-vested equity awards ✓ Place caps on maximum payouts from our annual cash incentive plan and our PSU/PSO plans ✓ Require revenue growth to earn a payout for PSU and PSO awards ✓ Solicit detailed feedback regarding our compensation practices from stockholders throughout the year ✓ Annual review of succession plan | ✗ Target pay to any specified percentile of market ✗ NEO employment contracts ✗ Permit directors and executive officers to engage in common stock margining, pledging or hedging ✗ Permit executive officers to sell Company stock without a 10b5-1 trading plan✗ Excessive NEO perquisites ✗ Reprice and repurchase options without stockholder approval ✗ Excessive pension/supplemental NEO retirement plan payouts ✗ Single trigger acceleration of equity vesting or change in control payments ✗ Change in control severance payments without involuntary job loss or substantial diminution of duties | |
14
Philosophy of Our Executive Compensation Program
The Compensation Committee believes that attracting, motivating and retaining a diverse team of high-performing executives with strong thought leadership, industry and subject matter expertise is critical to advancing the interests of stockholders. To promote these objectives, the Compensation Committee is guided by the following principles in developing our executive compensation program and in making pay decisions:
Attraction and Retention of Key Talent.
Performance-Driven Compensation.
Stockholder Alignment
Appropriately Balance Short- and Long-term Performance Orientation.
Total Compensation Context.
The Compensation Committee regularly assesses the program to ensure it is aligned with the Company’s evolving business strategy and is effective in supporting its talent needs.
15
Program Overview
This Compensation Discussion and Analysis focuses on the following executive officers who were our named executive officers, or NEOs, in fiscal year 2020:
Name | Title | |
Dow R. Wilson | Chief Executive Officer | |
Kolleen T. Kennedy | President, Proton Solutions and Chief Growth Officer | |
J. Michael Bruff. | Chief Financial Officer | |
Christopher A. Toth (1) | President and Chief Operating Officer | |
Michael Hutchinson | Senior Vice President, Chief Legal Officer | |
Gary E. Bischoping, Jr. (2) | Former President, Interventional Oncology Solutions and Former Chief Financial Officer |
| (1) | Mr. Toth was promoted from President, Varian Oncology Systems to President and Chief Operating Officer, effective October 5, 2020 with the start of our fiscal year 2021. |
| (2) | Mr. Bischoping resigned in March 2020. |
Each program component and the rationale for it are highlighted below:
Component | Purpose and Role | |
| Base salary | • Provide a market competitive, fixed level of cash compensation to attract and retain talented and skilled executives • Recognize sustained performance, capabilities, job scope, experience, and internal pay equity | |
| Annual cash incentives (Management Incentive Plan, “MIP”) | • Motivate and reward achievement of annual financial results that drive stockholder value • Reward achievement of strategic goals that provide the foundation for future growth and profitability | |
| Performance Share Units (“PSU s | • Reward achievement of 3-year financial goals and TSR relative to peers• Encourage long-term stock price growth and executive retention through 3-year cliff vesting and TSR metric• Align executives’ interests with stockholders’ interests through use of performance-based equity awards | |
| Performance Stock Options (“PSOs”) | • Reward achievement of 3-year financial goals and TSR relative to peers• Encourage long-term stock price growth and executive retention through 3-year cliff vesting, a TSR metric and a seven-year term to exercise the options• Provide leveraged gains aligned with stockholders through use of performance-based awards and a vehicle that ties gains to increases in stock price | |
| Restricted Stock Units (“RSU s | • Encourage stock price growth and executive retention through time-based vesting over three years • Align executives’ interests with stockholders’ interests through use of equity awards | |
16
| Time-Based Stock Options (“Options”) | • Encourage stock price growth and executive retention through time-based vesting over three years and a seven-year period to exercise the options • Provide leveraged gains aligned with stockholders’ interests through use of an award that bases gains on increases in the stock price | |
| Executive benefits and perquisites | • Provide the same health, welfare and 401(k) benefits as other employees • Provide a competitive benefit by allowing executives to defer compensation through a non-qualified deferred compensation plan• Facilitate executive health and focus on our business by providing reimbursement for annual physical exams and financial counseling • Encourage support of the communities in which we operate by matching charitable donations (available to all employees) | |
| Executive change-in-control | • Provide reasonable compensation to executive officers who leave our company under certain circumstances to facilitate their transition to new employment • “Double-trigger” provisions encourage executive retention in the event of a change of control • Require a departing executive officer to sign a separation and release agreement as a condition to receiving post-employment compensation payments or benefits, to mitigate any potential employer liability and avoid future disputes or litigation | |
How We Make Compensation Decisions
Role of the Compensation and Leadership Development Committee.
Risk.
Annual Program Assessment
CEO Compensation and Performance Goals
Compensation of Other Executives
Considerations in Making Compensation Decisions
17
succession plans, compensation previously provided, compensation of other executives of the Company, and competitive compensation levels. Confer with the independent directors of the Board and consider, as appropriate, views expressed by stockholders on executive compensation matters, including results of stockholder advisory votes on executive compensation. |
Peer Groups.
General Advice to the Board
Compensation Consultant
Role of Executive Officers
Role of the Compensation Consultant.
non-employee
director compensation, and the Compensation and Discussion Analysis disclosure contained in our Form10-K/A
filed with the SEC on February 1, 2021.Independence of the Compensation Consultant.
10C-1
of the Exchange Act and applicable listing standards.Considerations in Setting Executive Compensation.
role including the scope and complexity of responsibilities;
experience and capabilities;
contributions or responsibilities beyond the typical scope of the role;
individual performance;
internal comparisons; and
competitive compensation opportunities as reflected in compensation provided by our peers and other competitors for similar executive talent.
Compensation Peer Group and Market Analysis.
18
business strategies. In light of the company’s long-term strategy to transform into a multi-disciplinary integrated cancer care company, we now compete with a broader market for executive talent and have expanded our compensation peer group to include competitors in biotechnology, healthcare technology and pharmaceutical industries including companies who produce alternative healthcare therapies or healthcare-related software. The Committee used the following general criteria to identify potential peers to inform recommendations for fiscal year 2020 compensation:
U.S. publicly traded companies from the Healthcare Equipment, Healthcare Supplies, Healthcare Technology, Life Sciences Tools & Services, and Biotechnology industries
Companies in a relevant range around Varian’s revenues and market-capitalization
Companies with similar business characteristics and comparable talent requirements, such as complex medical or related electronic devices, alternative healthcare therapies or healthcare-related software, significant
non-U.S.
revenues, and employee headcount generally in a reasonable range around Varian’s headcountUsing this selection criteria, the Compensation Committee approved the addition of two companies to the Peer Group for 2020: Teleflex and The Cooper Companies. These new peers are within a relevant range on all key selection metrics and reflect feedback from proxy advisors. Additionally, the increase from 18 to 20 peers was intended to provide increased stability in our competitive benchmarking over the coming years. Accordingly, our Peer Group for fiscal year 2020 compensation decisions was comprised of the following 20 companies that compete in industries that the Compensation Committee believes reflects the competitive market for executive talent with similar skills, experience, capabilities to that required by the Company.
Varian Medical Systems FY 2020 Compensation Peer Group | ||||
Healthcare Equipment | Life Sciences Tools & Services | Healthcare Supplies | ||
| Boston Scientific | Agilent Technologies | Cooper Companies | ||
| Edwards Lifesciences | Bio-Rad Labs | Dentsply Sirona | ||
Hill-Rom Holdings | Bruker Corporation | West Pharmaceutical Services | ||
| Hologic | Mettler-Toledo | |||
| IDEXX Labs | PerkinElmer | Biotechnology | ||
| Intuitive Surgical | Waters Corporation | Alexion Pharmaceuticals | ||
| ResMed | ||||
| Teleflex | Healthcare Technology | |||
| Zimmer Biomet Holdings | Cerner Corporation | |||
At the time of their selection, the 20 companies in the fiscal year 2020 Peer Group generally had annual revenue in their most recent trailing four quarters and market capitalization (as of June 15, 2019) in a relevant range around those of the Company.
Peer Group | ||||||||||||||||
Company Scope | Varian | Low | Median | High | ||||||||||||
Revenue ($M) | $ | 3,031 | $ | 1,745 | $ | 2,910 | $ | 9,937 | ||||||||
Market Capitalization ($M) | $ | 11,903 | $ | 6,972 | $ | 16,461 | $ | 57,325 | ||||||||
The Compensation Committee does not target pay to a specific percentile of market. It reviews executive pay relative to a competitive range of pay for comparable positions in Peer Group companies and, as appropriate, survey data from Peer Group and other similar companies that compete with the Company for executive talent.
19
Fiscal Year 2020 Compensation Program and Pay Decisions
Base Salaries.
COVID-19
pandemic, the Compensation Committee increased the base salaries of (i) Mr. Bruff in recognition of the significant increase in the scope of his role following his promotion to Chief Financial Officer and to be competitive with comparable positions at Peer companies and (ii) Mr. Toth in recognition of the expanded scope of his role for fiscal year 2020 with the addition of Cancer Treatment Services International (“CTSI”), which we acquired in May 2019, and his continued high level of performance and contributions. Base salaries for Mr. Wilson, Ms. Kennedy and Mr. Bischoping remained unchanged from fiscal year 2019.In addition, as part of the Company’s cost savings efforts in response to the pandemic, Mr. Wilson requested and the Compensation Committee approved a 20 percent reduction in Mr. Wilson’s salary for the second half of the calendar year from July 2020 through December 2020. The Compensation Committee also recommended and the Board approved a 20 percent reduction in cash fees paid to all members of Varian’s Board of Directors for the second half of calendar year 2020.
Name | FY2019 Annual Salary (effective December 15, 2018) | FY2020 Annual Salary (effective December 14, 2019) 1 | % Increase | |||
Dow R. Wilson | $1,000,000 | $1,000,000 | 0.0% | |||
Kolleen T. Kennedy | $722,140 | $722,140 | 0.0% | |||
J. Michael Bruff | $341,120 | $550,000 | 61.2% | |||
Christopher A. Toth | $525,000 | $575,000 | 9.5% | |||
Michael D. Hutchinson | — | $535,000 | — | |||
Gary E. Bischoping | $566,500 | $566,500 | 0.0% |
| (1) | Salary increase for Mr. Bruff was effective with his promotion on December 1, 2019, and annual salary for Mr. Hutchinson was effective upon his hire date in June 2020. Annual salary for Mr. Wilson reflects his regular annual rate, prior to the temporary 20% reduction for the second half of calendar year 2020. |
Annual Cash Incentives.
MIP
Payment of any cash annual incentives to our NEOs and other eligible executives is conditioned upon achievement of at least $250 million in annual net income, on a
non-GAAP
basis, calculated using the Company’s currency rates as of September 2019 and subject to applicable adjustments adopted by the Compensation Committee at the time the MIP goals were set.Total awards paid under the caption “CompensationMIP for fiscal year 2020 cannot exceed 8% of fiscal year 2020 EBIT (as defined in the MIP) before incentive compensation. In addition, individual awards payable to each of our NEOs and other eligible executives are capped at the lesser of 200% of target payout or $3,000,000 per individual.
The Compensation Committee retained the discretion to reduce each NEO’s maximum dollar award amount set forth above based on the formula below and such other factors determined by the Committee in its sole discretion. Specifically for the fiscal year 2020 Financial Results component, in addition to considering economic profit results (both
pre-pandemic
and post-pandemic), the Committee also considered the approved funding fornon-MIP
annual incentive plan participants below the executive level, which was based on second half operating earnings results and other resiliency goals related to navigating the pandemic impact, and capped payouts for the Financial Results component at 100% of target.20
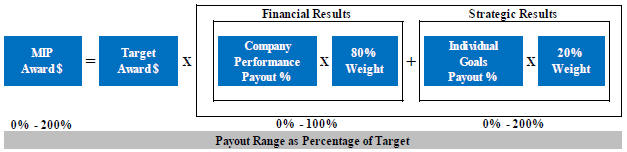
Target Awards
The Compensation Committee sets individual target incentive opportunities for participants in the MIP, expressed as a percentage of each participant’s annual salary rate, using the same criteria as described above for base salary. The target incentive opportunities are reviewed by the Compensation Committee each year. Mr. Bruff’s target incentive percentage was increased from 50% to 75% effective December 2019 in recognition of his promotion to Chief Financial Officer. No other target incentive percentages were increased for fiscal year 2020.
Name | Annual Salary | MIP Target 1 | MIP Maximum 1 | |||||||
% of Salary | Amount | % of Salary | Amount | |||||||
Dow R. Wilson | $1,000,000 | 125% | $1,250,000 | 250% | $2,500,000 | |||||
Kolleen T. Kennedy | $722,140 | 90% | $649,926 | 180% | $1,299,852 | |||||
J. Michael Bruff | $550,000 | 75% | $412,500 | 150% | $825,000 | |||||
Christopher A. Toth | $575,000 | 75% | $431,250 | 150% | $862,500 | |||||
Michael D. Hutchinson | $535,000 | 75% | $401,250 | 150% | $802,500 | |||||
Gary E. Bischoping 2 | $566,500 | 75% | $424,875 | 150% | $849,750 | |||||
| (1) | Amounts reflect annualized targets. Actual MIP payouts are prorated based on new hire, promotion and termination dates during the fiscal year. |
| (2) | Mr. Bischoping was not eligible for a fiscal year 2020 bonus payment as his employment terminated prior to fiscal year end. |
21
Financial Performance
Due to the disruption in the global economy and Varian’s business as a result of the
COVID-19
pandemic and consistent with allowable adjustments adopted by the Compensation Committee at the time the MIP goals were set, the Committee exercised its ability to consider the impact of unplanned items in determining reasonable and appropriate incentive payouts. In fiscal year 2020, 80% of MIP awards were based on a Financial Results component, which the Committee determined in their discretion after reviewing all relevant facts, including in particular:Economic profit results, both
pre-pandemic
and post-pandemic, relative to goals set by the Committee at the beginning of fiscal year 2020Broad-based bonus plan results for participants below the executive level including:
Second half Operating Earnings results relative to the second half forecast
Resilience results relative to existing goals and additional Company goals approved by the Committee after the onset of the
COVID-19
pandemicEconomic Profit Metric.
At the beginning of fiscal year 2020, the Committee again selected an economic profit metric as the fiscal year 2020 financial performance measure. Varian’s economic profit is calculated from the Company’s audited financial results, as illustrated below:Economic Profit Calculation
Adjusted Gross Cash Earnings | - - -Minus- - - | Capital Charge on Gross Operating Assets | ||||||
| + | Operating Earnings | + | Long-term Assets (2) | |||||
| + | Research & Development Expense | + | Other Assets & Liabilities | |||||
| + | Depreciation & Amortization Expense | + | Capitalized R&D | |||||
| + | Impairments Expense & Other Adjustments (1) | + | Unusual & One-Time (3) | |||||
= - | Pre-tax Gross Cash Earnings Taxes (14%) | = x | Gross Operating Assets (GOA) 8% Required Rate of Return | |||||
| = | Gross Cash Earnings (GCE) | = | Capital Charge | |||||
| (1) | Impairments, restructuring, reserves and currency adjustments |
| (2) | Net working capital, gross PP&E, goodwill and intangibles |
| (3) | Unusual and one-time items such as accounting and tax rule changes, legal restructuring and impairments |
GCE includes
add-backs
for R&D expense and depreciation and amortization. GOA includes capitalized R&D, net working capital (such as inventory and accounts receivable), and other gross operating assets (such as property, plant and equipment). Cumulative R&D spending over the prior eight years (approximating our product life cycles) is treated as an asset on which management must earn a return above the cost of capital. Cost of capital is also charged on gross and not depreciated operating assets to avoid an artificial upward drift in economic profit which would occur if these assets were depreciating away.The fiscal year 2020 MIP economic profit payout schedule and results are set out in the following table. The target of $419 million was set at the beginning of the Namedyear based on (a) our fiscal year 2019 economic profit of $453 million, and (b) adjusted down by $34 million for goodwill and intangibles, Proton therapy impairment, foreign currency exchange and the Company sale of its shares in Augmenix, Inc. For fiscal year 2020, the Committee considered both post-pandemic and
pre-pandemic
results. Our fiscal year 2020 economic profit, prior to any adjustment due to the impact of22
the pandemic, was $383 million, which was $37 million above threshold and equated to a calculated payout of 49% of target. Prior to the pandemic, the Company was tracking to an economic profit of $503 million through January 2020, reflecting an economic profit increase of $84 million over the $419 million target and a calculated payout for MIP of 197% of target on a
pre-pandemic
basis.FY 2020 MIP Economic Profit Measure | FY 2020 | FY 2020 | FY 2020 | FY 2020 | FY 2020 | |||||
Minimum | Target | Maximum | Actual | Pre-Pandemic | ||||||
Economic Profit ($M) | $346 | $419 | $506 | $383 | $503 | |||||
Increase in Economic Profit Over FY 2019 Adjusted | ($73) | $0 | $87 | ($36) | $84 | |||||
Percentage of Target Payout | 0% | 100% | 200% | 49% | 197% |
The primary difference between
pre-pandemic
and post-pandemic results was a decrease of GCE driven by a reduction in revenues due to customer capital constraints, customer site access and readiness challenges to complete the installation and acceptance of Varian’s products and solutions. The table below compares the actual fiscal year 2020 results with the estimatedpre-pandemic
economic profit.$Millions | Fiscal Year 2020 | |||||||||||
Actual | Pre-Pandemic Estimate | Difference | ||||||||||
Gross Cash Earnings | 708 | 827 | (119) | |||||||||
Gross Operating Assets (4 quarter average) | 4,058* | 4,054 | 4 | |||||||||
Required Return | 8% | 8% | ||||||||||
Capital Charge | (325) | (324) | (1) | |||||||||
Economic Profit (VVA) | 383 | 503 | (120) | |||||||||
FY 2020 Target | 419 | 419 | ||||||||||
Change in Economic Profit (VVA) | (36) | 84 | ||||||||||
MIP Financial Payout | 49% | 197% | -148% | |||||||||
* Lease accounting charge decreased FY2020 GOA by $4M
Second Half Operating Earnings and other Resiliency Measures.
In addition to the above, the Committee also considered the factors and funding approved for Varian’s annual cash incentive plans for
non-MIP
participants below the executive level. In light of the pandemic impact, the Committee approved funding at 100% of target for thesenon-MIP
participants taking into account (1) the Company missing its original fiscal year 2020 financial target set at the beginning of the fiscal year prior to the onset of the pandemic, balanced by (2) exceeding the Company’s revised second half operating earnings forecast and (3) exceeding resiliency goals tied to supporting customers, employees, stockholders and the overall Company performance during the pandemic as outlined in the following table.23
Category | Criteria | Measures | Key Results | Points | Score (0x to 2x) | |||||
Company performance during pandemic | FY20 company goals | Scorecard results covering 7 categories | Met or exceeded goals | 10 | 12 | |||||
Customers | Customer Satisfaction | Net Promoter Score | NPS improved during pandemic | 5 | 10 | |||||
Innovation to deliver services/ products during pandemic | Innovations in online training, remote support in face of COVID | No missed customer shipment, installation or service event in 2H; vast majority of service and training delivered virtually | ||||||||
Employees | Responsiveness to impact of pandemic on workforce | Employee safety, support, resources, and wellness tracking | Employee engagment increased to world class level; including safety, support & wellbeing | 5 | 10 | |||||
Stockholders | Ensure access to liquidity | Cost savings, net income, working capital | Fiscal year 2020 ending leverage ratio less than 0x with accessible liquidity at >$1.3B | 5 | 10 | |||||
| Effectiveness in striking Siemens Healthineers’ deal & progressing towards closing | Deal price, multiple & stockholder approval | One of largest all cash multiple in medtech industry with >98% stockholder approval + ability to accelerate strategy | ||||||||
Total | 25 | 42 |
Financial Payout Results.
The Committee considered the above factors, including that (i) actual economic profit results prior to any adjustment for the pandemic impact were at 49%, (ii) results were tracking to 197% payout through the early part of the fiscal year prior to the pandemic impact, and (iii) the Company exceeded both its revised second half forecast for operating earnings and the resiliency goals related to supporting its customers, employees and stockholders through the pandemic. Based on an evaluation of the above factors, the Committee determined it was appropriate to cap the payout for the Financial Results portion at target and approved funding at 100% of target for the Financial Results portion of MIP for fiscal year 2020.24
Individual Strategic Goals
Because we believe that achieving key elements of our business strategy is important to driving sustainable growth and value creation, we based the remaining 20% of the fiscal year 2020 MIP target award opportunity on individual, strategic goals. The goals for fiscal year 2020 were tied to our five strategic business priorities plus another two priorities added
mid-year
as a result of theCOVID-19
pandemic and the announced Merger with Siemens Healthineers:Grow our core radiation therapy business
Build software capacity and data capability
Expand to new markets
Delight customers & patients
Inspire people
Manage the
COVID-19
pandemic impact, balancing needs of our customers, employees and stockholdersExecute on the Merger with Siemens Healthineers
The Compensation Committee evaluated Mr. Wilson’s performance and determined the portion of his award that was based on achieving these goals in its sole discretion. The Compensation Committee reviewed their recommendation for Mr. Wilson with the other independent directors. For the other NEOs, Mr. Wilson submitted recommendations with respect to each of the other NEOs, and the final determination of awards was made by the Compensation Committee.
The weighting of each goal category and the Compensation Committee’s score for results are summarized in the following table:
Name | Grow Core RT Business | Build Software Capacity & Data Capability | Expand to New Markets | Delight Customers & Patients | Inspire People | Manage COVID-19 Impact | Execute Merger w/ Siemens Heatlhineers | Total | ||||||||||
Dow R. Wilson | Weight | 20% | 15% | 25% | 40% | 100% | ||||||||||||
| Score | 25% | 15% | 25% | 50% | 115% | |||||||||||||
Kolleen T. Kennedy | Weight | 30% | 50% | 10% | 10% | 100% | ||||||||||||
| Score | 35% | 60% | 10% | 5% | 110% | |||||||||||||
J. Michael Bruff | Weight | 60% | 40% | 100% | ||||||||||||||
| Score | 65% | 45% | 110% | |||||||||||||||
Christopher A. Toth | Weight | 25% | 10% | 35% | 10% | 20% | 100% | |||||||||||
| Score | 30% | 10% | 40% | 10% | 25% | 115% | ||||||||||||
Miachael D. Hutchinson | Weight | 10% | 15% | 40% | 15% | 20% | 100% | |||||||||||
| Score | 10% | 15% | 40% | 15% | 30% | 110% | ||||||||||||
25
Performance against strategic goals for NEOs in each category are summarized below:
Mr. Wilson, Chief Executive OfficersOfficer
Strategic Goal Category | Key Result | |
| Grow Core RT Business | On track for goal of 4.5M patient touches despite pandemic with successful Ethos launch exceeding planned orders/installations and strategic initiatives delivering at or above internal goals. | |
| Expand to New Markets | Integration milestones for CTSI and Interventional Oncology Solutions on track or ahead of schedule with strong retention/attraction of critical talent. | |
| Inspire People | Fostered increase in employee engagement and diversity, inclusion and belonging, achieving engagement scores in line with top tier companies. Built leadership bench strength and executed internal succession plans for several key senior leadership roles in support of our long-term strategy of transforming into a multi-disciplinary integrated cancer care company. | |
| Manage COVID-19 Impact | Successfully balanced interests of customers, employees and stockholders, sustaining high employee engagement and safety, and increasing customer net promoter score in the midst of the pandemic. | |
Execute on Merger with Siemens Healthineers | Signed all-cash deal valued at $16.4 billion and on track for anticipated close and integration planning. |
Ms. Kennedy, President, Proton Solutions and Directors.Chief Growth Officer
Strategic Goal Category | Key Result | |
| Grow Core RT Business | Enabled first human treatment on ProBeam with Flash. | |
| Expand to New Markets | Prepared Cardiac RadioAblation multi-institutional clinical trial plan, and achieved acquisition integration milestones for CTSI, Humediq, Interventional Solutions and Noona. | |
| Delight Customers & Patients | Ensured successful launch of installed base and service management tools to better support our customers. | |
| Inspire People | Expanded relationships and fostered high performing, collaborative executive leadership team. |
Mr. Bruff, Senior Vice President, Chief Financial Officer
Strategic Goal Category | Key Result | |
| Inspire People | Built capability and scalability within Finance and IT functions through shared service migrations, functional reorganizations, launch of new financial planning and treasury management tools, stabilization of human capital management and payroll systems, and enhanced process and internal controls. Improved engagement and barriers to execution scores. | |
| Manage COVID-19 Impact | Exceeded cash flow and liquidity targets, enhanced forecasting accuracy and executed on cost savings measures to ensure continued financial health of the business while navigating the pandemic impact. |
Mr. Toth, President, Oncology Systems
Strategic Goal Category | Key Result | |
| Grow Core RT Business | Exceeded revised profitability and inventory goals with sales and operations and cash flow from operations above forecast. | |
| Build Software & Data Capability | Leveraged cross organization collaboration to expand global reach and accelerate tech enabled services strategies, including key product launch and expansion of CTSI services business. | |
| Expand to New Markets | Achieved acquisition integration milestones for CTSI, with business continuing to outperform. AOI site |
26
| expansion on target providing additional locations of care in India. Established Oncology as a Service (OaaS) program framework. | ||
| Delight Customers & Patients | Increased net promoter scores. Launched Unity 2.0 for field service representatives with user adoption increased from 47% in 2018 to 86% in 2020. B2E score greatly exceeded target. | |
| Inspire People | Built leadership bench strength and enhanced leadership development to prepare leaders to scale with our continued business growth. Increased engagement survey scores related to leadership and diversity, inclusion and belonging. Continued to build external leadership network focused on driving transformational change. |
Mr. Hutchinson, Senior Vice President, Chief Legal Officer
Strategic Goal Category | Key Result | |
| Grow Core RT Business | Established protocols for handling customer inquiries and requests relating to potential solvency impacts from COVID-19. | |
| Expand to New Markets | Filed new patent applications of strategic importance. Developed and enhanced intellectual property strategies for Noona, cryo and migrate-to-cloud COVID-19-related | |
| Inspire People | Updated Company sustainability targets related to energy, greenhouse gases and water. In partnership with human resources, enhanced processes and education related to performance improvement and employee relations. | |
| Manage COVID-19 Impact | Helped establish COVID-19 response initiatives to ensure the health and safety of our employees and the customers they support while ensuring appropriate data privacy. | |
Execute on Merger with Siemens Healthineers | Helped lead process and negotiations of the Merger with Siemens Healthineers, an all-cash deal valued at $16.4 billion and ensure transaction is on track for anticipated close and integration planning. |
Calculation of Fiscal Year 2020 MIP Payouts
The final fiscal year 2020 MIP awards for our NEOs were calculated as indicated in the following table. The Compensation Committee used discretion in determining the Financial payout percentage in light of the pandemic impact (as described above) and in rating performance on individual strategic goals.
Name | MIP Target (1) | Financial | Individual Strategic | Total % Payout | MIP Award | |||||||||||||
Weight | % Payout | Weight | % Payout | |||||||||||||||
Dow R. Wilson | $ | 1,250,000 | 80% | 100% | 20% | 115.0% | 103.0% | $ | 1,287,500 | |||||||||
Kolleen T. Kennedy | $ | 649,926 | 80% | 100% | 20% | 110.0% | 102.0% | $ | 662,925 | |||||||||
J. Michael Bruff | $ | 388,780 | 80% | 100% | 20% | 110.0% | 102.0% | $ | 396,556 | |||||||||
Christopher A. Toth | $ | 431,250 | 80% | 100% | 20% | 115.0% | 103.0% | $ | 444,188 | |||||||||
Michael D. Hutchinson | $ | 134,111 | 80% | 100% | 20% | 110.0% | 102.0% | $ | 136,793 | |||||||||
| (1) | MIP targets are prorated for fiscal year 2020 to reflect December 2019 promotion for Mr. Bruff and June 2020 hire date for Mr. Hutchinson. In addition, Mr. Bischoping was not eligible for a fiscal year 2020 bonus payment as his employment terminated prior to fiscal year end. |
27
Long-term Incentives.
Grant Types and Mix.
Executive | Performance Stock Options (PSOs) | Performance Share Units (PSUs) | Stock Options (SO) | Restricted Stock Units (RSUs) | ||||
CEO | 60% | 40% | ||||||
Other NEOs | 60% | 20% | 20% |
The Compensation Committee determined the total target value of each NEO’s fiscal year 2020 ongoing equity grants prior to the onset of the
COVID-19
pandemic at its regularly scheduled meeting in November 2019. Consistent with its past practice, the Committee granted PSUs and PSOs at that time and later granted stock options and RSUs at the Committee’s regularly scheduled meeting in February 2020, which aligned with the grant timing for similar awards to other employees below senior management.The number of Mr. Wilson’s target PSOs was determined by dividing the intended target PSO grant value by the fair value of a PSO on the grant date, which was equal to (i) the Black-Scholes value per share on the date of grant adjusted by (ii) the grant date fair value of the contingent market condition as determined using Monte Carlo simulation.
The number of target PSUs for each NEO was determined by dividing the intended target PSU grant value by the fair value of a PSU on the grant date, which was equal to (i) the closing stock price on the date of grant adjusted by (ii) the grant date fair value of the contingent market condition as determined using Monte Carlo simulation.
The number of stock options for each NEO (other than Mr. Wilson who was not granted any time-based stock options) was determined by dividing the intended target grant value of the NEO’s stock options by the Black-Scholes value per share on the date of grant.
The number of RSUs for each NEO (other than Mr. Wilson who was not granted any RSUs) was determined by dividing the intended target grant value of the NEO’s RSUs by the closing stock price on the date of grant.
In addition, in August 2020, the Compensation Committee approved a new hire grant for Mr. Hutchinson as part of his new hire package and a
one-time
retention grant for Mr. Toth as an incentive to remain with the Company and in recognition of the criticality of his skills, knowledge and contributions to the long-term success of Varian. These grants were made in the form of RSUs, consistent with the form of award for all other August 2020 grant recipients and with the agreed upon terms with Siemens Healthineers for grants made subsequent to the execution of the Merger Agreement.Name | Performance Options (1) | Performance Share Units | Stock Options | Restricted Stock Units | Target Value of FY 2020 Awards | |||||||||||||||||||||||||||||||||||||||
Target Value | Target PSOs | Maximum PSOs | Target Value | Target PSUs | Maximum PSUs | Grant Value | Stock Options | Grant Value | RSUs | |||||||||||||||||||||||||||||||||||
Dow R. Wilson | $ | 4,500,000 | 130,095 | 260,190 | $ | 3,000,000 | 20,763 | 41,526 | $ | 7,500,000 | ||||||||||||||||||||||||||||||||||
Kolleen T. Kennedy | $ | 1,260,000 | 8,859 | 17,718 | $ | 420,000 | 14,122 | $ | 420,000 | 2,859 | $ | 2,100,000 | ||||||||||||||||||||||||||||||||
J. Michael Bruff | $ | 900,000 | 6,328 | 12,656 | $ | 300,000 | 10,087 | $ | 300,000 | 2,042 | $ | 1,500,000 | ||||||||||||||||||||||||||||||||
Christopher A. Toth (2) | $ | 1,200,000 | 8,437 | 16,874 | $ | 400,000 | 13,450 | $ | 2,400,000 | 14,317 | $ | 4,000,000 | ||||||||||||||||||||||||||||||||
Michael D. Hutchinson | $ | — | — | — | $ | — | — | $ | 1,900,000 | 11,014 | $ | 1,900,000 | ||||||||||||||||||||||||||||||||
Gary E. Bischoping (3) | $ | 930,000 | 6,539 | 13,078 | $ | 310,000 | 10,424 | $ | 310,000 | 2,110 | $ | 1,550,000 | ||||||||||||||||||||||||||||||||
| (1) | The PSOs granted to Mr. Wilson have a seven-year term and an exercise price equal to the Company’s closing stock price on the date of grant. |
| (2) | The RSUs granted to Mr. Toth are comprised of (i) an ongoing grant of 2,723 RSUs with a target value of $400,000 and (ii) a retention grant of 11,594 RSUs with a target value of $2,000,000. |
| (3) | Mr. Bischoping resigned in March 2020, and as a result, he forfeited all his unvested PSUs, RSUs and options. |
28
Fiscal Year 2020 Performance Share Units (PSUs) and Performance Stock Options (PSOs)
If the Merger with Siemens Healthineers is not consummated, the number of shares earned under the fiscal year 2020 PSUs and PSOs will be calculated as set forth below. (See Vesting of PSUs and PSOs below for details if the Merger is consummated.)
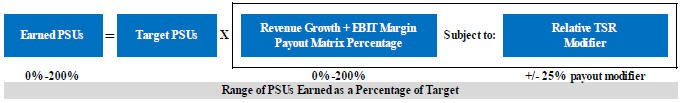
The number of PSUs and PSOs earned will be calculated from the following performance matrix:
3-Year Revenue Compound Annual Growth Rate | ||||||||||||
>0.0% | 3.5% | 7.0% | 10.5% | 14.0% | ||||||||
 | 4.0% | 100% | 133% | 167% | 200% | 200% | ||||||
2.0% | 67% | 100% | 133% | 167% | 200% | |||||||
0.0% | 33% | 67% | 100% | 133% | 167% | |||||||
-2.0% | 0% | 33% | 67% | 100% | 133% | |||||||
-4.0% | 0% | 0% | 33% | 67% | 100% | |||||||
The targets for the payout matrix were established based on the median results of our Business Model Peers, based on modeling over multiple time periods (see Business Model Peer list under the Relative TSR Modifier section below). Consistent with stockholder feedback, beginning with fiscal year 2019 awards and continuing with the fiscal year 2020 awards, we require positive revenue growth in order to receive any payout of PSU and PSO awards. For Revenue CAGR at or below 0% or Change in EBIT as a % of Revenue below
-4%,
PSU/PSO payout is 0%. Payouts for intermediate results are determined by linear interpolation. For the PSU/PSO awards, EBIT is calculated as earnings before reduction for interest and taxes, subject to adjustments adopted by the Compensation Committee at the time the goals were set.Relative TSR Modifier
In response to stockholder feedback, we refined the Relative TSR Modifier for fiscal year 2020 awards to eliminate the minimum payout feature for top quartile TSR results. Instead, for fiscal year 2020 awards, PSU and PSO payouts will be:
Reduced by 25 percent if
3-year
TSR ranks below the 25th
percentile of Business Model peers.Increased by 25 percent if
3-year
TSR ranks above the 75th
percentile of Business Model peers.Unchanged if
3-year
TSR ranks between 25th
and 75th
percentiles of Business Model peers.The Business Model Peers were selected from companies in the healthcare industry based on ten financial and scope metrics, which include size, growth, margins, returns, reinvestment rates, R&D reinvestment rates, reinvestment effectiveness, asset intensity, economic profit volatility, and TSR. The peers selected were similar to Varian on at least five of the ten criteria. The Compensation Committee believes that the 48 companies in the Business Model Peer Group at fiscal
year-end
2020 represent a relevant and sufficiently broad group of companies for the purposes of calibrating the PSU/PSO performance matrix (presented above) and ranking Varian TSR for the Relative TSR Modifier.29
Varian’s Business Model Peers | ||
| Abbott Laboratories | Hologic, Inc. | |
| AbbVie Inc. | IDEXX Laboratories, Inc. | |
| Agilent Technologies, Inc. | Intuitive Surgical, Inc. | |
| Alexion Pharmaceuticals, Inc. | Ion Beam Applications SA | |
| Allscripts Healthcare Solutions, Inc. | IQVIA Holdings Inc. | |
| Amgen Inc. | Johnson & Johnson | |
| athenahealth, Inc.* | Laboratory Corporation of America Holdings | |
| C.R. Bard * | LifePoint Health, Inc.* | |
| Baxter International Inc. | Medtronic plc | |
| Becton, Dickinson and Company | Merck & Co., Inc. | |
| Biogen Inc. | Mettler-Toledo International Inc. | |
Bio-Rad Laboratories, Inc. | Mylan N.V. | |
| Boston Scientific Corporation | Patterson Companies, Inc. | |
| Bristol-Myers Squibb Company | PerkinElmer, Inc. | |
| Bruker Corporation | Pfizer Inc. | |
| Cerner Corporation | QIAGEN N.V. | |
| Danaher Corporation | Quest Diagnostics Incorporated | |
| DaVita Inc. | ResMed Inc. | |
| DENTSPLY SIRONA Inc. | Stryker Corporation | |
| Edwards Lifesciences Corporation | Teleflex Incorporated | |
| Elekta AB (publ) | Tenet Healthcare Corp. | |
| Endo International plc | The Cooper Companies, Inc. | |
| Envision Healthcare Corporation * | Universal Health Services, Inc. | |
| HCA Holdings, Inc. | Waters Corporation | |
| Henry Schein, Inc. | West Pharmaceutical Services, Inc. | |
Hill-Rom Holdings, Inc. | Zoetis Inc. | |
| * | Approved by the Committee but removed after being acquired or taken private during fiscal year 2018 to 2020. |
Vesting of PSUs and PSOs
If the Merger is not consummated, all PSUs and PSOs earned will vest at the end of the three-year performance period provided the recipient is employed by the Company throughout the performance period, except in cases involving retirement, death, disability, a qualified termination that occurs in connection with a change in control, or if the award is not assumed in connection with certain corporate transactions.
If the Merger is consummated, because the awards are not being assumed, each PSO and PSU that is outstanding immediately prior to the effective time of the Merger will become fully vested, based on the target number of PSOs/PSUs, and be converted into the right to receive a cash payment equal to the product of (i) the Merger Consideration (less the applicable exercise price in the case of PSOs) and (ii) the target number of shares subject to the award. See “Potential Payments Upon Termination or Change in Control” for more information.
30
Settlement of PSUs and PSOs Awarded in Fiscal Year 2018
PSUs and PSOs granted in fiscal year 2018 were subject to attainment of revenue growth and EBIT margin goals with potential modification based on relative TSR results as summarized below. The number of shares earned from the fiscal year 2018 PSU and PSO awards was calculated as follows:
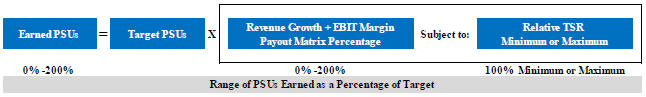
Matrix Results.
3-Year Revenue Compound Annual Growth Rate | ||||||||||||
0.0% | 3.5% | 7.0% | 10.5% | 14.0% | ||||||||
| 4.0% | 100% | 133% | 167% | 200% | 200% | ||||||
2.0% | 67% | 100% | 133% | 167% | 200% | |||||||
0.0% | 33% | 67% | 100% | 133% | 167% | |||||||
-2.0% | 0% | 33% | 67% | 100% | 133% | |||||||
-4.0% | 0% | 0% | 33% | 67% | 100% | |||||||
Relative TSR Modifier
The relative TSR modifier for PSUs and PSOs granted in fiscal year 2018 (the “”) provided for maximums and minimums for the number of PSUs and PSOs earned based on Varian’s
Relative TSR Modifier
3-year
TSR rank relative to its Business Model Peers (see above).A 100% payout maximum when Varian’s
3-year
TSR ranks below 25th
percentileA 100% payout minimum when Varian’s
3-year
TSR ranks above 75th
percentileThe Relative TSR Modifier did not apply if Varian’s
3-year
TSR ranked between 25th
and 75th
percentilesPayout Calculation.
3-year
performance period prior to the onset of theCOVID-19
pandemic. The Company’s fiscal year 2018 to 2020 revenue growth and EBIT margin achievements, inclusive of the pandemic impact, resulted in a payout of 73.8% of target. Varian’s fiscal year 2018 to fiscal year 2020 TSR ranked 73rd
percentile among the Business Model Peers and therefore the TSR Modifier did not apply.The number of fiscal year 2018 PSUs that were earned by each NEO in 2020 are summarized below:
31
Name | Award Type | Matrix Payout % | TSR Modifier | Total Payout % | 2018 Target Shares | 2018 Shares Earned | ||||||
Dow R. Wilson | PSO | 73.8% | - | 73.8% | 215,716 | 159,198 | ||||||
Dow R. Wilson | PSU | 73.8% | - | 73.8% | 25,681 | 18,952 | ||||||
Kolleen T. Kennedy | PSU | 73.8% | - | 73.8% | 11,536 | 8,513 | ||||||
J. Michael Bruff | PSU | - | - | - | - | - | ||||||
Christopher A. Toth | PSU | 73.8% | - | 73.8% | 2,594 | 1,914 | ||||||
Michael D. Hutchinson | PSU | - | - | - | - | - | ||||||
Gary E. Bischoping | PSU | - | - | - | - | - |
Stock Options (SOs)
The stock options granted in fiscal year 2020 have an exercise price equal to the Company’s closing stock price on the date of grant and have a seven-year term. The intended grant value was converted into stock options using the Black Scholes value and assumptions described in footnote 5 of the Summary Compensation Table (refer to “Summary Compensation Table” below).
If the Merger is not consummated, the first 33 1/3% of the stock options will vest 12 months from the grant date, and the remainder vest in equal monthly installments during the following
24-month
period. A recipient must be employed by us throughout each vesting date for vesting to occur on such date, except in cases involving retirement, death, disability, a qualified termination that occurs in connection with a change in control, or if the award is not assumed in connection with certain corporate transactions.If the Merger is consummated, in accordance with the terms of the 2005 Stock Plan and the Merger Agreement, all stock options granted during or prior to fiscal year 2020 that are outstanding immediately prior to the effective time of the Merger will become fully vested and be converted into the right to receive a cash payment equal to the product of (i) the Merger Consideration less the applicable exercise price and (ii) the number of shares subject to the stock option. No stock options are anticipated to be granted in fiscal year 2021. See “Potential Payments Upon Termination or Change in Control” for more information.
Restricted Stock Units (RSUs)
If the Merger is not consummated, RSUs granted in fiscal year 2020 will vest and be settled in equal numbers of shares of our common stock on approximately the first, second and third anniversaries of the date of grant. The intended grant value was converted into RSUs using the Company’s closing stock price on the date of grant. As is the case with stock options, a recipient must be employed by us through each vesting date for vesting to occur on such date, except in cases involving retirement (for grants made prior to August 2020), death, disability, or a qualified termination that occurs in connection with a change in control like the Merger.
If the Merger is consummated, in accordance with the terms of the 2005 Stock Plan and the Merger Agreement, RSUs granted during or prior to fiscal year 2020 that are outstanding immediately prior to the effective time of the Merger will become fully vested and be converted into the right to receive a cash payment equal to the product of the Merger Consideration and the number of shares subject to the RSUs. See “Potential Payments Upon Termination or Change in Control” for more information. RSUs granted during fiscal year 2021 will convert at the effective time of the Merger to the right to a cash award equal to the product of the Merger Consideration and the number of shares subject to the RSUs and payable based on the original vesting schedule and terms.
32
Other Elements of Executive Compensation
Because our philosophy is to emphasize pay for performance, we provide retirement, group benefits and perquisites of relatively minor value to our executives.
401(k) Contributions.
Deferred Compensation Plan
DCP
Group Benefits and Perquisites.
de minimis
Pursuant to our policy, the Company does not provide executives tax
gross-ups
or reimbursements for any taxable income from these benefits and perquisites, except for tax restoration benefits in connection with the relocation of new executives.Change in Control Agreements.
change-in-control
Theagreements are intended to provide an appropriate level of compensation for a specified time interval for executives who would likely be involved in activities regarding a change in control and are personally at risk for job loss in the event of a change in control. Ouragreements are “double-trigger” meaning that to receive benefits under the agreements there must be aevent and the executive must either:
change-in-control
change-in-control
change-in-control
(1) Be terminated by us or the successor company without cause within a specified time interval in connection with a change in control, or
(2) Terminate employment for good reason, as defined in the agreements, within a specified time interval in connection with a change in control.
On August 1, 2020, the Company entered into amended and restatedagreements with each covered executive including our NEOs, other than Mr. Bischoping. The material terms of the restatedagreements are generally similar to those of the prioragreements except that the restated agreements (1) extend the period of severance protection from 18 months following a change in control to 24 months following a change in control; (2) reduce the period of the COBRA benefits continuation of the severance benefits from 24 months following termination to 18 months following termination; (3) revise the definition of good reason; and (4) provide for make-whole payments to indemnify the NEOs for any negative economic impact resulting from the application of the excise tax under Section 4999 of the Internal Revenue Code
change-in-control
change-in-control
change-in-control
33
in connection with the Merger. These revisions resulted from a combination of planned changes identified prior to the Merger discussions as a result of a periodic market review, along with additional refinements in connection with the pending Merger to further ensure management continuity and stability and to ensure that covered executives are incented to make decisions that are in the best interest of the Company and our stockholders, without being unduly distracted by the impact of such a transaction on their personal situation.
In approving the excise tax make-whole payment provision, the Compensation Committee reviewed projections prepared by Company advisors of the expected impact of the excise tax in connection with the Merger, and concluded that the vagaries of the excise tax rules would result in an unintended and inequitably applied personal tax burden that could undermine the intended purpose of the change in control agreements and the change in control provisions of the equity compensation awards. In reaching this determination, the Compensation Committee took into account that the particular terms and timing of the Merger would produce arbitrary results with respect to the imposition of the excise tax. Among other things, the projections indicated that a calendar year 2020 Merger consummation would result in significant excise tax liability for certain covered executives that would fall disproportionately on individuals who were recently hired or promoted. By contrast, a calendar year 2021 consummation would allow opportunities to eliminate the excise tax exposure for the majority of affected executives. As part of its considerations, the Compensation Committee noted that the primary reason for the magnitude of the potential excise tax burden was the vesting of equity awards. These awards have a significant financial value as a result of the substantial price growth achieved for Company stockholders, and the meaningful degree to which such awards are performance-based results in particularly adverse excise tax consequences. The Compensation Committee ultimately determined that it was in the best interests of the Company and would best align stockholder interests and management interests to insulate covered executives from the excise tax, thereby promoting stability and retention and avoiding uncertainty and internal pay inequity.
Because the Merger was not consummated in calendar year 2020, the Company and its executives were in fact able to implement a number of mitigation measures prior to the end of calendar year 2020 that are expected to significantly reduce and, in most cases, eliminate the potential tax reimbursements referenced above in anticipation of the Merger closing in calendar year 2021. It is currently anticipated that the potential tax reimbursements will not exceed $3 million in the aggregate, well below the amounts that might have been necessary upon a calendar year 2020 consummation. Any excise tax reimbursements will solely mitigate the impact of the excise tax; covered executives remain responsible for the underlying income and employment taxes that would have been imposed absent the excise tax. The excise tax reimbursements would apply only to the Merger or to an alternative transaction entered into within 60 days of any termination of the Merger Agreement with Siemens Healthineers. If the Merger does not close, the reimbursement provisions will generally expire 60 days following termination of the Merger Agreement with Siemens Healthineers.
For more information about the agreements as well as a tabular summary of the potential payments that may be made to our NEOs, please refer to “Potential Payments upon Termination or Change in Control.”
34
Executive Compensation Governance Policies
Stock Ownership Guidelines.
Position | Stock Ownership Multiple of Salary | |
CEO | 6x | |
Next four most highly compensated executive officers | 3x | |
Other corporate officers | 2x |
The program counts for purposes of stock ownership: shares owned, unvested restricted stock, RSUs, and earned and vested performance share units. Ownership levels are expected to be achieved within the later of: (i) five years of first becoming an officer, (ii) three years of an amendment increasing ownership levels with respect to any increase, or (iii) three years of the date that the new ownership levels apply to such individual due to a change in position or becoming an NEO.years after an individual becomes subject to the ownership guidelines. As of the date of this Amendment, all the NEOs met the guidelines or were on track to comply in the relevant timeframe.
One-third
of the ownership level is expected to be achieved withintwo-and-one-half
Recoupment (or “Clawback”) Policy.
This recoupment policy is incorporated into the provisions of our MIP and Fifth Amended and Restated 2005 Stock Plan. Under our current stock option agreements, if an employee commences employment with a company that competes with us in any of our businesses, we may, in our sole discretion, terminate the stock option agreement, including the vesting of any options or other grants which remain unvested as of the date the employee commences employment with the competitor.
Prohibition on Hedging and Pledging Company Securities and Insider Trading Policy.
35
Equity Grant Practices.
non-public
information. If extraordinary circumstances arise such that the Compensation Committee determines it is advisable to grant an equity award that will be approved and/or become effective on a date other than the foregoing, the Compensation Committee may consider and approve such alternative date(s), provided that the grant effective date of such award must occur during an open trading window under the Company’s insider trading policies.The exercise price of our stock options is the closing price of our common stock on the NYSE on the date of grant. If the date of grant falls on a day upon which the NYSE is closed, then the exercise price is the closing price of our common stock on the next trading date. Our Fifth Amended and Restated 2005 Omnibus Stock Plan explicitly prohibits the repricing and
cash-out
of underwater stock options without prior stockholder approval.Compensation Risk Management.
As part of this review, Pay Governance reviewed our compensation programs and reported that the programs provide an appropriate pay philosophy, peer group, and benchmarking to support business objectives with meaningful risk mitigation, oversight and discretion by the Compensation Committee. Pay Governance also advised that the Company’s executive compensation programs provide an effective balance in cash and equity mix, short- and long-term performance focus, corporate, business unit and individual performance focus, and financial performance measurement that avoids the taking of short-term risks at the expense of long-term stockholder interests. In addition, total target incentive compensation for all employees is a small percentage of total sales and revenue, and incentive opportunities under these plans are capped. Management also retains discretion to reduce incentive amounts.
The Compensation Committee believes that the following risk oversight and compensation design features described in greater detail above in this CD&A safeguard against excessive risk taking:
Stock ownership requirements
Recoupment policy
Prohibitions on executive officers and other employees subject to the quarterly blackout period engaging in any speculative transactions in Company securities, such as hedging
Prohibitions on executive officers from pledging Company securities in margin accounts or as collateral for a loan
Executive cash incentive payouts and PSU/PSO awards are based on financial performance metrics that drive stockholder value and are capped
PSU/PSO awards are also based on multi-year relative TSR goals
All equity awards have vesting requirements that align employees’ interests with stockholders
36
Tax Deductibility.
Compensation and Leadership Development Committee Report
The Compensation Committee of the Board of the Company has reviewed and discussed with management the “Compensation Discussion and Analysis” section of our Annual Report on Form
10-K.
Based on its review and discussions with management, the Compensation Committee recommended to the Board that the Compensation Discussion and Analysis be included in our Annual Report on Form10-K.
Jean-Luc
Butel (Chair)Anat Ashkenazi
Jeffrey R. Balser
R. Andrew Eckert
Forward-Looking Statements
The Company has disclosed information, which may be considered forward-looking within the meaning of the U.S. federal securities laws. Forward-looking statements may appear throughout the Compensation Discussion and Analysis and this Amendment. Statements concerning the timing of the Company’s acquisition by Siemens Healthineers, the anticipated impact of the acquisition on our business and compensation arrangements with our NEOs and directors, and any statements using the terms “will,” “believe,” “expect,” “should,” or similar statements are forward-looking statements that involve risks and uncertainties that could cause the Company’s actual results to differ materially from those anticipated. Such risks and uncertainties include the future impact of the
COVID-19
pandemic on our business, including but not limited to, the impact on our workforce, operations, supply chain, demand for our products and services, and our financial results and condition; our ability to successfully manage the challenges associated with theCOVID-19
pandemic; our ability to achieve expected synergies from acquisitions; risks associated with integrating recent acquisitions; global economic conditions and changes to trends for cancer treatment regionally; currency exchange rates and tax rates; the impact of the Tax Cuts and Jobs Act; the impact of the Affordable Health Care for America Act (including excise taxes on medical devices) and any further healthcare reforms (including changes to Medicare and Medicaid), and/or changes in third-party reimbursement levels; recent and potential future tariffs, cross-border trade restrictions or a global trade war; demand for and delays in delivery of the company’s products; the company’s ability to develop, commercialize and deploy new products; the company’s ability to meet Food and Drug Administration (FDA) and other regulatory requirements, regulations or procedures; changes in regulatory environments; risks associated with the company providing financing for the construction andstart-up
operations of particle therapy centers, challenges associated with commercializing the company’s Proton Solutions business; challenges to public tender awards and the loss of such awards or other orders; the effect of adverse publicity; the company’s reliance on sole or limited-source suppliers; the company’s ability to maintain or increase margins; the impact of competitive products and pricing; the potential loss of key distributors or key personnel; challenges related to entering into new business lines; the occurrence of any event, change or other circumstances that could give rise to the termination of the Merger Agreement with Siemens Healthineers; the failure to obtain certain required regulatory approvals or the failure to satisfy any of the other closing conditions to the completion of the merger; risks related to disruption of management’s attention from the company’s ongoing business operations due to the merger; the effect of the announcement of the merger on the ability of the company to retain and hire key personnel and maintain relationships with its customers, suppliers, distributors and others with whom it does business, or on its operating results and business generally; the ability to meet expectations regarding the timing and completion of the merger; and the other risks listed from time to time in the company’s filings with the SEC, which by this reference are incorporated herein. For37
additional information concerning factors that could cause actual results and events to differ materially from those projected herein, please refer to our Form
10-K
for the year ended October 2, 2020 and subsequent Forms8-K
and10-Q
filed with the SEC. The company assumes no obligation to update or revise the forward-looking statements in this release because of new information, future events, or otherwise.38
Summary Compensation Table
The following table sets forth, together with certain other information, the compensation granted to or earned by our NEOs during the last three fiscal years in which they were NEOs and the principal position held by each during fiscal year 2020.
Name and Principal Position | Fiscal Year (1) | Salary ($) | Bonus ($) (2) | Stock Awards ($) (3)(4) | Option Awards ($) (4)(5) | Non-Equity Incentive Plan Compensation ($) (6) | Change in Pensions Value and Nonqualified Deferred Compensation Earnings ($) | All Other Compensation ($) (7) | Total ($) | |||||||||||
Dow R. Wilson Chief Executive Officer (8) | | 2020 2019 2018 | | $965,385 $1,000,000 $1,000,000 | — — — | $3,000,046 $2,800,005 $2,800,000 | $4,499,986 $4,200,011 $4,200,000 | $1,287,500 $1,403,500 $2,237,500 | — — — | $50,056 $42,780 $38,939 | $9,802,972 $9,446,296 $10,276,439 | |||||||||
Kolleen T. Kennedy President, Proton Solution and Chief Growth Officer | | 2020 2019 2018 | | $736,027 $721,871 $684,899 | — — — | $1,680,032 $1,679,998 $1,680,000 | $419,847 $419,991 $420,000 | $662,925 $703,740 $1,126,538 | — — — | $23,204 $20,679 $22,530 | $3,522,035 $3,546,279 $3,933,967 | |||||||||
J. Michael Bruff Senior Vice President, Finance and Chief Financial Officer (9) | 2020 | $524,425 | — | $1,200,021 | $299,887 | $396,556 | — | $18,996 | $2,439,885 | |||||||||||
Christopher A. Toth President and Chief Operating Officer (10) | | 2020 2019 | | $575,481 $524,269 | — — | $3,599,996 $1,000,009 | $399,869 $249,989 | $444,188 $430,290 | — — | $22,240 $18,420 | $5,041,773 $2,222,977 | |||||||||
Michael D. Hutchinson Senior Vice President, Chief Legal Officer (11) | 2020 | $185,192 | $75,000 | $1,899,915 | — | $136,793 | — | $280 | $2,297,180 | |||||||||||
Gary E. Bischoping Former Senior Vice President, Finance and Chief Financial Officer (12) | | 2020 2019 2018 | | $250,567 $563,009 $550,000 | — — — | $1,240,022 $1,240,036 $1,240,000 | $309,906 $310,000 $310,000 | — $451,557 $734,250 | — — — | $420 $11,992 $39,626 | $1,800,915 $2,576,594 $2,873,876 | |||||||||
| (1) | Fiscal year 2020 spanned from September 28, 2019 through October 2, 2020, which resulted in 371 days in the fiscal year, instead of the typical 364 days; as such, salaries reported in the table above reflect one additional week of pay compared to a typical year. |
| (2) | Mr. Hutchinson received a signing bonus of $75,000 in connection with joining the Company on June 1, 2020. |
| (3) | This column represents the aggregate grant date fair value of RSU and PSU awards computed in accordance with Accounting Standards Codification 718, “Compensation—Stock Compensation” ASC 718 10-K for the fiscal years ended October 2, 2020, September 27, 2019, and September 28, 2018. |
39
(4) The table below sets forth the grant date fair value of the stock awards and stock option awards made in fiscal year 2020. These amounts reflect our calculation of the value of these awards, and do not necessarily correspond to the actual value that may ultimately be realized by the NEOs. Mr. Bischoping resigned in March 2020, and as a result, he forfeited all his unvested PSUs, RSUs and options.
Name | Value of PSOs at Target ($)* | Value of PSUs at Target ($)* | Value of Stock Options ($) | Value of RSUs ($)** | Total Combined Value of Equity Awards ($) | |||||||||||||||
(Granted 11/22/19) | (Granted 11/21/19) | (Granted 2/13/20) | (Granted 2/13/20) | |||||||||||||||||
Dow R. Wilson | $ | 4,499,986 | $3,000,046 | — | — | $7,500,032 | ||||||||||||||
Kolleen T. Kennedy | — | $1,260,016 | $419,847 | $420,016 | $2,099,879 | |||||||||||||||
J. Michael Bruff | �� | — | $900,031 | $299,887 | $299,990 | $1,499,908 | ||||||||||||||
Christopher A. Toth | — | $1,199,995 | $399,869 | $2,400,001 | $3,999,864 | |||||||||||||||
Michael D. Hutchinson | — | — | — | $1,899,915 | $1,899,915 | |||||||||||||||
Gary E. Bischoping | — | $930,042 | $309,906 | $309,980 | $1,549,928 | |||||||||||||||
| * | Assuming the highest level of performance is achieved under the applicable performance conditions, the maximum possible value of the PSOs and/or PSUs granted to Mr. Wilson, Ms. Kennedy, Mr. Bruff, Mr. Toth and Mr. Bischoping on the grant date is $15,000,064, $2,520,032, $1,800,062, $2,399,990 and $1,860,084, respectively. Mr. Wilson was granted his PSUs on November 22, 2019. |
| ** | Mr. Toth was granted a second RSU award and Mr. Hutchinson was granted a new hire RSU award on August 21, 2020. |
| (5) | This column represents the aggregate grant date fair value of stock option and PSO awards granted to the NEOs computed in accordance with ASC 718. The fair value for stock option awards was determined using the Black-Scholes option-pricing model. The fair value for PSO awards granted in fiscal years 2019 and 2020 was determined using the Black-Scholes option-pricing model and adjusted according to the contingent market condition specified in the terms of those awards. For more information on how the grant date fair value of stock option and PSO awards was determined, please see “Critical Accounting Estimates” in Item 7. Management’s Discussion and Analysis of Financial Condition and Results of Operations and the note on Employee Stock Plans in the Notes to Consolidated Financial Statements in our Annual Report on Form 10-K for the fiscal years ended October 2, 2020, September 27, 2019 and September 28, 2018. |
| (6) | This column represents annual cash incentives earned under the MIP for the applicable fiscal year. Awards for Mr. Bruff and Mr. Hutchinson were pro-rated to reflect time in role in fiscal year 2020. Mr. Bischoping was ineligible for an award payout as his departure date from Varian did not meet the payout requirements. Amounts include the incentive payments deferred under the DCP. Please refer to the Grant of Plan-Based Awards Table below for more information. |
| (7) | Set forth in the table below are the material components of the “All Other Compensation” column for fiscal year 2020. |
Name | Company Contributions to 401(k) (A) | Company Match of Charitable Contributions | Other (B) | |||||||||
Dow R. Wilson | $21,415 | $10,000 | $18,640 | |||||||||
Kolleen T. Kennedy | $19,469 | $2,895 | $840 | |||||||||
J. Michael Bruff | $18,156 | — | $840 | |||||||||
Christopher A. Toth | $17,100 | $4,300 | $840 | |||||||||
Michael D. Hutchinson | — | — | $280 | |||||||||
Gary E. Bischoping | — | — | $420 | |||||||||
| (A) | Amount represents Company matching contributions to the NEO’s contributions to the Company’s 401(k) plan, matched at a level of $1.00 for each dollar contributed, up to 6% of eligible earnings through July 16, 2020 when the match was temporarily suspended for all employees. |
| (B) | For Mr. Wilson, the amount represents reimbursement of financial counseling. For all employees, this also includes company paid Life Insurance for the time they were each actively employed by the Company in fiscal year 2020. |
| (8) | Mr. Wilson requested a temporary 20% salary reduction, from $1,000,000 to $800,000 effective for the second half of calendar year 2020, as part of company cost saving measures in response to the adverse financial impact from the COVID-19 pandemic. |
| (9) | Mr. Bruff was promoted from serving as the Company’s Senior Vice President, Finance and Investor Relations to serve as Senior Vice President, Finance and Chief Financial Officer on December 1, 2019, having thereby succeeded Mr. Bischoping. |
| (10) | Mr. Toth served as the Company’s President, Varian Oncology Systems throughout the entirety of fiscal year 2020 and was promoted to a newly created role as President and Chief Operating Officer on October 5, 2020. |
| (11) | Mr. Hutchinson was hired to serve as the Company’s Senior Vice President, Chief Legal Officer on June 1, 2020. |
| (12) | Mr. Bischoping served as the Company’s Senior Vice President, Finance and Chief Financial Officer through December 1, 2019 when he transitioned roles to serve as the Company’s President, Interventional Oncology Solutions; Mr. Bischoping served in the latter role until his departure from the Company on March 6, 2020. |
40
Grants of Plan-Based Awards for 2020
The following table provides information on plan-based awards made in fiscal year 2020 to each of our NEOs:
Name | Award Type | Grant Date | Estimated Possible Payouts Under Non-Equity IncentivePlan Awards (1) | Estimated Future Payouts Under Equity Incentive Plan Awards (2) | All Other Stock Awards: Number of Shares of Restricted Stock Units (#) (3) | All Other Option Awards: Number of Securities Underlying Options (#) (4) | Exercise or Base Price of Option Awards ($/Sh) | Grant Date Fair Value of Stock and Option Awards (5) | ||||||||||||||||||||||||||||||||||||||||
Threshold ($) | Target ($) | Maximum ($) | Threshold (#) | Target (#) | Maximum (#) | |||||||||||||||||||||||||||||||||||||||||||
Dow R. Wilson | MIP Award | N/A | $0 | $1,250,000 | $2,500,000 | — | — | — | — | — | — | — | ||||||||||||||||||||||||||||||||||||
| PSOs | 11/22/2019 | — | — | — | 0 | 130,095 | 260,190 | — | — | $131.58 | $4,499,986 | |||||||||||||||||||||||||||||||||||||
| PSUs | 11/22/2019 | — | — | — | 0 | 20,763 | 41,526 | — | — | — | $3,000,046 | |||||||||||||||||||||||||||||||||||||
Kolleen T. Kennedy | MIP Award | N/A | $0 | $649,926 | $1,299,852 | — | — | — | — | — | — | — | ||||||||||||||||||||||||||||||||||||
| PSUs | 11/21/2019 | — | — | — | 0 | 8,859 | 17,718 | — | — | — | $1,260,016 | |||||||||||||||||||||||||||||||||||||
| RSUs | 2/13/2020 | — | — | — | — | — | — | 2,859 | — | — | $420,016 | |||||||||||||||||||||||||||||||||||||
| Stock Options | 2/13/2020 | — | — | — | — | — | — | — | 14,122 | $146.91 | $419,847 | |||||||||||||||||||||||||||||||||||||
J. Michael Bruff | MIP Award | N/A | $0 | $388,780 | $777,561 | — | — | — | — | — | — | — | ||||||||||||||||||||||||||||||||||||
| PSUs | 11/21/2019 | — | — | — | 0 | 6,328 | 12,656 | — | — | — | $900,031 | |||||||||||||||||||||||||||||||||||||
| RSUs | 2/13/2020 | — | — | — | — | — | — | 2,042 | — | — | $299,990 | |||||||||||||||||||||||||||||||||||||
| Stock Options | 2/13/2020 | — | — | — | — | — | — | — | 10,087 | $146.91 | $299,887 | |||||||||||||||||||||||||||||||||||||
Christopher A. Toth | MIP Award | N/A | $0 | $431,250 | $862,500 | — | — | — | — | — | — | — | ||||||||||||||||||||||||||||||||||||
| PSUs | 11/21/2019 | — | — | — | 0 | 8,437 | 16,874 | — | — | — | $1,199,995 | |||||||||||||||||||||||||||||||||||||
| RSUs | 2/13/2020 | — | — | — | — | — | — | 2,723 | — | — | $400,036 | |||||||||||||||||||||||||||||||||||||
| RSUs | 8/21/2020 | — | — | — | — | — | — | 11,594 | — | — | $1,999,965 | |||||||||||||||||||||||||||||||||||||
| Stock Options | 2/13/2020 | — | — | — | — | — | — | — | 13,450 | $146.91 | $399,869 | |||||||||||||||||||||||||||||||||||||
Michael D. Hutchinson | MIP Award | N/A | $0 | $134,111 | $268,221 | — | — | — | — | — | — | — | ||||||||||||||||||||||||||||||||||||
| RSUs | 8/21/2020 | — | — | — | — | — | — | 11,014 | — | — | $1,899,915 | |||||||||||||||||||||||||||||||||||||
Gary E. Bischoping (6) | MIP Award | N/A | $0 | $0 | $0 | — | — | — | — | — | — | — | ||||||||||||||||||||||||||||||||||||
| PSUs | 11/21/2019 | — | — | — | 0 | 6,539 | 13,078 | — | — | — | $930,042 | |||||||||||||||||||||||||||||||||||||
| RSUs | 2/13/2020 | — | — | — | — | — | — | 2,110 | — | — | $309,980 | |||||||||||||||||||||||||||||||||||||
| Stock Options | 2/13/2020 | — | — | — | — | — | — | — | 10,424 | $146.91 | $309,906 | |||||||||||||||||||||||||||||||||||||
| (1) | These columns represent the potential awards under our MIP as further discussed in “Compensation Discussion and Analysis—Fiscal Year 2020 Compensation Program and Pay Decisions—Annual Cash Incentives.” For each NEO, the target amount is calculated by multiplying the NEO’s target award percentage by the NEO’s annual base salary, and prorated for eligible service over the fiscal year. The maximum award is 200% of each NEO’s target award. The MIP provided for a threshold amount in fiscal year 2020. The dollar value of the actual cash incentive award earned for fiscal year 2020 for each NEO is set forth in the Summary Compensation Table above. As such, the amounts set forth in these columns do not represent the actual cash incentive earned by any of the NEOs for fiscal year 2020. Mr. Bischoping resigned in March 2020, and as a result, he was not eligible to receive an annual cash incentive under the MIP for fiscal 2020. |
| (2) | Consists of PSO grants to Mr. Wilson and PSU grants to each NEO under the 2005 Stock Plan. The maximum number of PSOs or PSUs that can be earned is 200% of the target PSOs or PSUs based on achievement of 3-year revenue growth and change in EBIT as a percent of revenue goals subject to a relative TSR modifier based on a set of Business Model Peers. The determination of the number of PSUs earned is made at the end of the three-year performance period at which time the earned PSUs vest and are settled. The determination of the number of PSOs earned is made at the end of the three-year performance period at which time the earned PSOs vest and become exercisable. Each NEO must be employed by us throughout the performance period for his or her PSOs or PSUs to vest, except in cases involving retirement, death, disability, a qualified termination that occurs in connection with a change in control, or if the award is not assumed in connection with certain corporate transactions, which include the Merger. See the “Compensation Discussion and Analysis” and “Potential Payments Upon Termination or Change in Control” for more information regarding these awards. |
| (3) | Consists of a single RSU grant to each NEO other than Mr. Wilson and Mr. Toth under the 2005 Stock Plan. Each RSU represents a right to one share of our common stock. For Ms. Kennedy, Mr. Bruff, Mr. Toth, and Mr. Bischoping, the RSUs granted on February 13, 2020 vest and are settled in three equal annual increments on February 15th beginning one year after grant. For Mr. Toth and Mr. Hutchinson, the RSUs granted on August 21, 2020 vest and are settled in three equal annual increments on August 10th beginning one year after grant. For each applicable NEO, the vesting of his or her RSUs is subject to the NEO being employed by us through each vesting date, except in cases involving retirement, death, disability, a qualified termination that occurs in connection with a change in control, or if the award is not assumed in connection with certain corporate transactions, which include the Merger. See the “Compensation Discussion and Analysis” and “Potential Payments Upon Termination or Change in Control” for more information regarding these awards. |
| (4) | Consists of a single stock option grant to each NEO other than Mr. Wilson and Mr. Hutchinson under the 2005 Stock Plan at an exercise price equal to the closing price (fair market value) of the underlying shares on the grant date and expiring seven years from the grant date. One-third of the award vests one year after the grant date and the remainder vests in equal monthly installments |
41
during the following
24-month
period, provided the applicable NEO is employed by us through each vesting date, except in cases involving retirement, death, disability, a qualified termination that occurs in connection with a change in control, or if the award is not assumed in connection with certain corporate transactions, which include the Merger. See the “Compensation Discussion and Analysis” and “Potential Payments Upon Termination or Change in Control” for more information regarding these awards.| (5) | Grant date fair value is computed in accordance with ASC 718. Please see footnotes (3), (4) and (5) to the Summary Compensation Table for more information regarding how the grant date fair value was determined for these awards. |
| (6) | Mr. Bischoping resigned in March 2020, and as a result, he forfeited all his unvested PSUs, RSUs and options. |
42
Outstanding Equity Awards at Fiscal Year End
The following table sets forth the outstanding equity awards of the NEOs as of the end of fiscal year 2020.
Option Awards (1) (2) | Stock Award (2) | |||||||||||||||||||||||||||||||||||||||
Name | Option Grant Date | Number of Securities Underlying Unexercised Options Exercisable (#) | Number of Securities Underlying Unexercised Options Unexercisable (#) | Equity Incentive Plan Awards: Number of Securities Underlying Unexercised Unearned Options (#) | Option Exercise Price ($) | Option Expiration Date | Number of Shares or Units of Stock That Have Not Vested (#) | Market Value of Shares or Units of Stock That Have Not Vested ($) (12) | Equity Incentive Plan Awards: Number of Unearned Shares, Units or Other Rights That Have Not Vested (#) | Equity Incentive Plan Awards: Market or Payout Value of Unearned Shares, Units or Other Rights That Have Not Vested ($) (12) | ||||||||||||||||||||||||||||||
Dow R. Wilson | 02/13/2015 | 111,830 | — | $ | 81.97 | 02/13/2022 | ||||||||||||||||||||||||||||||||||
| 02/10/2017 | 75,015 | — | $ | 80.40 | 02/10/2024 | |||||||||||||||||||||||||||||||||||
| 11/17/2017 | 159,198 | — | $ | 109.03 | 11/17/2024 | |||||||||||||||||||||||||||||||||||
| 11/16/2018 | — | — | 163,361 | $ | 118.76 | 11/16/2025 | ||||||||||||||||||||||||||||||||||
| 11/22/2019 | — | — | 130,095 | $ | 131.58 | 11/22/2026 | ||||||||||||||||||||||||||||||||||
| 23,577 | (9) | $ | 4,053,594 | |||||||||||||||||||||||||||||||||||||
| 20,763 | (11) | $ | 3,569,783 | |||||||||||||||||||||||||||||||||||||
Total | 346,043 | — | 293,456 | — | — | 44,340 | $ | 7,623,376 | ||||||||||||||||||||||||||||||||
Kolleen T. Kennedy | 02/08/2018 | — | 2,716 | $ | 112.82 | 02/08/2025 | ||||||||||||||||||||||||||||||||||
| 02/14/2019 | — | 6,802 | $ | 131.77 | 02/14/2026 | |||||||||||||||||||||||||||||||||||
| 02/13/2020 | — | 14,122 | $ | 146.91 | 02/13/2027 | |||||||||||||||||||||||||||||||||||
| 1,241 | (3) | $ | 213,365 | |||||||||||||||||||||||||||||||||||||
| 2,125 | (4) | $ | 365,351 | |||||||||||||||||||||||||||||||||||||
| 2,859 | (6) | $ | 491,548 | |||||||||||||||||||||||||||||||||||||
| 10,777 | (8) | $ | 1,852,890 | |||||||||||||||||||||||||||||||||||||
| 8,859 | (10) | $ | 1,523,128 | |||||||||||||||||||||||||||||||||||||
Total | — | 23,640 | 6,225 | $ | 1,070,264 | 19,636 | $ | 3,376,017 | ||||||||||||||||||||||||||||||||
J. Michael Bruff | 08/17/2017 | 3,750 | — | $ | 99.26 | 08/17/2024 | ||||||||||||||||||||||||||||||||||
| 02/08/2018 | 819 | 216 | $ | 112.82 | 02/08/2025 | |||||||||||||||||||||||||||||||||||
| 02/14/2019 | 3,016 | 2,700 | $ | 131.77 | 02/14/2026 | |||||||||||||||||||||||||||||||||||
| 08/15/2019 | 3,779 | 6,686 | $ | 107.32 | 08/15/2026 | |||||||||||||||||||||||||||||||||||
| 02/13/2020 | — | 10,087 | $ | 146.91 | 02/13/2027 | |||||||||||||||||||||||||||||||||||
| 197 | (3) | $ | 33,870 | |||||||||||||||||||||||||||||||||||||
| 844 | (4) | $ | 145,109 | |||||||||||||||||||||||||||||||||||||
| 1,553 | (5) | $ | 267,007 | |||||||||||||||||||||||||||||||||||||
| 2,042 | (6) | $ | 351,081 | |||||||||||||||||||||||||||||||||||||
| 1,425 | (8) | $ | 245,000 | |||||||||||||||||||||||||||||||||||||
| 6,328 | (10) | $ | 1,087,973 | |||||||||||||||||||||||||||||||||||||
Total | 11,364 | 19,689 | 4,636 | $ | 797,067 | 7,753 | $ | 1,332,973 | ||||||||||||||||||||||||||||||||
Christopher A. Toth | 02/10/2017 | 4,823 | — | $ | 80.40 | 02/10/2024 | ||||||||||||||||||||||||||||||||||
| 02/08/2018 | 6,961 | 1,833 | $ | 112.82 | 02/08/2025 | |||||||||||||||||||||||||||||||||||
| 02/14/2019 | 4,524 | 4,049 | $ | 131.77 | 02/14/2026 | |||||||||||||||||||||||||||||||||||
| 02/13/2020 | — | 13,450 | $ | 146.91 | 02/13/2027 | |||||||||||||||||||||||||||||||||||
| 837 | (3) | $ | 143,905 | |||||||||||||||||||||||||||||||||||||
| 1,265 | (4) | $ | 217,491 | |||||||||||||||||||||||||||||||||||||
| 2,723 | (6) | $ | 468,165 | |||||||||||||||||||||||||||||||||||||
| 11,594 | (7) | $ | 1,993,356 | |||||||||||||||||||||||||||||||||||||
| 6,415 | (8) | $ | 1,102,931 | |||||||||||||||||||||||||||||||||||||
| 8,437 | (10) | $ | 1,450,573 | |||||||||||||||||||||||||||||||||||||
Total | 16,308 | 19,332 | 16,419 | $ | 2,822,919 | 14,852 | $ | 2,553,504 | ||||||||||||||||||||||||||||||||
Michael D. Hutchinson | — | — | 11,014 | (7) | $ | 1,893,637 | — | — | ||||||||||||||||||||||||||||||||
Total | — | — | 11,014 | $ | 1,893,637 | — | — | |||||||||||||||||||||||||||||||||
Gary E. Bischoping | — | — | — | — | — | — | ||||||||||||||||||||||||||||||||||
Total | — | — | — | — | — | — | ||||||||||||||||||||||||||||||||||
43
| (1) | All options are granted at an exercise price equal to the fair market value (i.e., the closing price) of the underlying shares of our common stock on the date of grant. The following table sets forth the vesting dates for the outstanding unvested option awards: | |||
| Grant Date | Vesting Schedule (based on original option grant) | |||
| 2/13/2015 | 33-1/3% vested on 2/13/2016;pro-rata monthly thereafter until fully vested on 2/13/2018. | |||
| 2/10/2017 | 33-1/3% vested on 2/10/2018;pro-rata monthly thereafter until fully vested on 2/10/2020. | |||
| 8/17/2017 | 33-1/3% vested on 8/17/2018;pro-rata monthly thereafter until fully vested on 8/17/2020. | |||
| 11/17/2017 | The number of shares and the aggregate market value in the table reflect the number of shares earned on 10/2/2020 based on actual performance through the end of a 3-year performance period. | |||
| 2/8/2018 | 33-1/3% vested on 2/8/2019;pro-rata monthly thereafter until fully vested on 2/8/2021. | |||
| 11/16/2018 | 100% vest on 10/1/2021, subject to actual performance. The number of shares and the aggregate market value in the table are based on target performance. The actual number of shares that vest may range from 0% to 200% of target shares based on actual performance at the end of the 3-year performance period. | |||
| 2/14/2019 | 33-1/3% vest on 2/14/2020;pro-rata monthly thereafter until fully vested on 2/14/2022. | |||
| 8/15/2019 | 33-1/3% vest on 8/15/2020;pro-rata monthly thereafter until fully vested on 8/15/2022. | |||
| 2/13/2020 | 33-1/3% vested on 2/13/2021;pro-rata monthly thereafter until fully vested on 2/13/2023. | |||
| 11/22/2019 | 100% vest on 9/30/22, subject to actual performance. The number of shares and the aggregate market value in the table are based on target performance. The actual number of shares that vest may range from 0% to 200% of target shares based on actual performance at the end of the 3-year performance period. | |||
| (2) | Vesting will occur only if the NEO is employed by us throughout each vesting date or in the case of performance awards, the last day of the performance period, except in cases involving retirement, death, disability, a qualified termination that occurs in connection with a change in control, or if the award is not assumed in connection with certain corporate transactions, which include the Merger. In particular, because Mr. Wilson and Ms. Kennedy are eligible for retirement, certain unvested options and unvested stock awards would continue to vest according to the original vesting schedule even if the services of either were terminated for any reason. See “Potential Payments Upon Termination or Change in Control” for more information regarding these awards. | |||
| (3) | Grant Date | Vesting Schedule (based on total number of RSUs originally granted) | ||
| 2/8/2018 | 33 1/3% on 2/15/2019; 33 1/3% on 2/15/2020 and 33 1/3% on 2/15/2021. | |||
| (4) | Grant Date | Vesting Schedule (based on total number of RSUs originally granted) | ||
| 2/14/2019 | 33 1/3% on 2/15/2020; 33 1/3% on 2/15/2021 and 33 1/3% on 2/15/2022. | |||
| (5) | Grant Date | Vesting Schedule (based on total number of RSUs originally granted) | ||
| 8/15/2019 | 33 1/3% on 8/10/2020; 33 1/3% on 8/10/2021 and 33 1/3% on 8/10/2022. | |||
| (6) | Grant Date | Vesting Schedule (based on total number of RSUs originally granted) | ||
| 2/13/2020 | 33 1/3% on 2/15/2021; 33 1/3% on 2/15/2022 and 33 1/3% on 2/15/2023. | |||
| (7) | Grant Date | Vesting Schedule (based on total number of RSUs originally granted) | ||
| 8/21/2020 | 33 1/3% on 8/10/2021; 33 1/3% on 8/10/2022 and 33 1/3% on 8/10/2023. | |||
| (8) | Grant Date | Vesting Schedule (based on total number of PSUs originally granted) | ||
| 11/15/2018 | 100% on the last day of fiscal year 2021, subject to actual performance through the end of fiscal year 2021. The number of shares and aggregate market value in the table are based on target performance. The actual number of shares that vest may range from 0% to 200% of target shares based on actual performance at the end of the 3-year performance period. | |||
44
| (9) | Grant Date | Vesting Schedule (based on total number of PSUs originally granted) | ||
| 11/16/2018 | 100% on the last day of fiscal year 2021, subject to actual performance through the end of fiscal year 2021. The number of shares and aggregate market value in the table are based on target performance. The actual number of shares that vest may range from 0% to 200% of target shares based on actual performance at the end of the 3-year performance period. | |||
| (10) | Grant Date | Vesting Schedule (based on total number of PSUs originally granted) | ||
| 11/21/2019 | 100% on the last day of fiscal year 2022, subject to actual performance through the end of fiscal year 2022. The number of shares and aggregate market value in the table are based on target performance. The actual number of shares that vest may range from 0% to 200% of target shares based on actual performance at the end of the 3-year performance period. | |||
| (11) | Grant Date | Vesting Schedule (based on total number of PSUs originally granted) | ||
| 11/22/2019 | 100% on the last day of fiscal year 2022, subject to actual performance through the end of fiscal year 2022. The number of shares and aggregate market value in the table are based on target performance. The actual number of shares that vest may range from 0% to 200% of target shares based on actual performance at the end of the 3-year performance period. | |||
| (12) | Based on the closing price of our common stock as of October 2, 2020 ($171.93). | |||
45
Option Exercises and Stock Vested
The following table sets forth the number of shares acquired on stock option exercises and vesting of RSUs and PSUs by each of the NEOs during fiscal year 2020. The table also presents the value realized upon such exercises and vesting, as calculated, in the case of stock options, based on the difference between the market price of our common stock at exercise and the option exercise price and, in the case of RSUs and PSUs, based on the closing price per share of our common stock on the NYSE on the vesting date.
Option Awards | Stock Awards (1) | |||||||||||||||
Name | Number of Shares Acquired on Exercise (#) | Value Realized Upon Exercise ($) | Number of Shares Acquired on Vesting (#) | Value Realized on Vesting ($) | ||||||||||||
Dow R. Wilson | 116,723 | $9,870,605 | 41,681 | $5,629,052 | ||||||||||||
Kolleen T. Kennedy | 20,100 | $791,801 | 13,631 | $2,167,052 | ||||||||||||
J. Michael Bruff | — | — | 2,234 | $370,267 | ||||||||||||
Christopher A. Toth | 1,597 | $51,391 | 4,284 | $595,613 | ||||||||||||
Michael D. Hutchinson | — | — | — | — | ||||||||||||
Gary E. Bischoping | 22,441 | $438,413 | �� | 1,700 | $248,030 | |||||||||||
| (1) | These amounts include fiscal year 2018 PSUs, which were earned at the end of fiscal year 2020 at 73.8% of target shares, and RSUs that vested during fiscal year 2020. |
Nonqualified Deferred Compensation
The following table sets forth contributions, earnings and distributions during fiscal year 2020, and account balances as of October 2, 2020 for each of the NEOs, under our nonqualified DCP:
Name | Executive Contributions in Last Fiscal Year (1) | Registrant Contributions in Last Fiscal Year | Aggregate Earnings in Last Fiscal Year (2) | Aggregate Withdrawals/ Distributions | Aggregate Balance at Last Fiscal Year End (3) | |||||||||||||||
Dow R. Wilson | — | — | $23,173 | — | $885,572 | |||||||||||||||
Kolleen T. Kennedy | — | — | $1,042,667 | — | $10,031,416 | |||||||||||||||
J. Michael Bruff | — | — | — | — | — | |||||||||||||||
Christopher A. Toth | — | — | $17,395 | — | $167,991 | |||||||||||||||
Michael D. Hutchinson | — | — | — | — | — | |||||||||||||||
Gary E. Bischoping | — | — | — | — | — | |||||||||||||||
| (1) | There were no executive contributions attributable to fiscal year 2020. |
| (2) | None of the earnings in this column are included in the Summary Compensation Table for fiscal year 2020 because they were not preferential or above market. |
| (3) | Balance at last fiscal year end includes the following amounts reported as compensation to the NEOs in the Summary Compensation Table for fiscal years prior to fiscal year 2020: Mr. Wilson, $705,835 and Ms. Kennedy, $3,241,957 |
Our DCP is an unfunded and unsecured deferred compensation arrangement that is designed to allow directors, executive officers and certain other management and highly compensated employees to forego current compensation and defer a specified percentage of their base salaries (up to 50%), cash incentive payments (up to 100%) and director fees (applicable only to our
non-employee
directors) in a manner similar to the way in which our 401(k) plan operates, but without regard to the maximum deferral limitations imposed on 401(k) plans by the Code. Deferred amounts are our general unsecured obligations and are subject to claims by our creditors. Our general assets or assets in an existing rabbi trust may be used to fund our payment obligations and pay DCP benefits. The Compensation Committee administers the DCP. Further, we may, on a discretionary basis, make46
Company supplemental contributions equal to the product of (a) the excess of the participant’s base annual salary and any applicable incentive payments for the fiscal year over the compensation limit imposed by Section 401(a)(17) of the Code and (b) our matching contribution rate under the 401(k) (6%) (“Company Supplemental Contributions”) and credit additional amounts on behalf of the DCP’s participants (these discretionary contributions, together with the Company Supplemental Contributions, are referred to as “Company Contributions”). We did not make any Company Contributions in fiscal year 2020.
Amounts deferred by a participant and Company Contributions, if any, are credited to a bookkeeping account maintained on behalf of each participant. These bookkeeping accounts are utilized solely as a device for measuring and determining amounts to be paid to a participant, or his or her designated beneficiary, pursuant to the terms of the DCP. Amounts credited to each participant under the DCP are periodically adjusted for earnings and/or losses at a rate that is equal to the various investment funds (also referred to as measurement funds) selected by the Compensation Committee, as elected by the participant. The Compensation Committee may, in its sole discretion, discontinue, substitute or add a measurement fund. Participants may reallocate previously invested money among each of the available measurement funds on a daily basis.
Under the DCP, a participant may make separate distribution elections with respect to each year’s deferrals. These distribution elections include the ability to elect a single
lump-sum
payment or installment payments for up to 15 years for employees who retire from the Company. Deferrals also may be paid out prior to a separation from service in the event of a financial hardship or if the participant makes a “short-term distribution election.” A “short-term distribution election” must be made at the time the participant makes his or her initial deferral elections. Under the DCP, amounts credited as Company Supplemental Contributions are generally paid in the form of a lump sum following a participant’s separation from service (except for those Company Supplemental Contributions made prior to December 31, 2004, which may still be paid in installments upon an employee’s retirement).Non-retirement
separations from service generally will result in payments being made in the form of single lump sums.We may terminate the DCP by action of the Board, in which event benefits will be distributed as soon as the plan and Section 409A of the Code permit.
Potential Payments upon Termination or Change in Control
Change in Control Agreements
As described in the “Compensation Discussion and Analysis” section above, we have entered into change in control agreements with our NEOs, which were recently amended in connection with the Merger. Our change in control agreements are “double-trigger” meaning that to receive benefits under the agreements there must be a change in control event (as defined in each executive’s agreement) and the executive must either be terminated by us or the successor company without cause (as defined in each executive’s agreement) or terminate his or her employment for good reason (as defined in each executive’s agreement). The termination must occur within 60 days prior to or 24 months following the change in control to trigger benefits.
As a condition to receiving such severance benefits, the executive must execute a release of all of his or her rights and claims relating to his or her employment. The agreements also include certain post-termination restrictions, including, among other things, a requirement to continue to comply with the terms of the NEO’s proprietary information and
non-disclosure
agreement, and certainnon-solicitation
provisions.The table below reflects the value of compensation and benefits that would become payable to each of the NEOs under the agreements as of October 2, 2020, if a change in control such as the Merger, had occurred on that date and the NEO experienced a qualifying termination of employment. These amounts are reported based on the NEO’s compensation as of such date and on the Company’s closing stock price of $171.93 on October 2, 2020. These benefits are in addition to the right to exercise then-exercisable stock options, the vested amounts accrued under the DCP as set forth in the “Nonqualified Deferred Compensation” table above which the NEO would retain in the event of any termination, and the benefits available generally to salaried employees, such as distributions under the Company’s broad based 401(k) plan.
The actual amounts that would be paid upon a NEO’s qualifying termination of employment in connection with a change in control can be determined only at the time of any such event. Due to the number of factors that affect the nature and amount of any benefits provided upon such an event, any actual amounts paid or distributed may be higher or lower than reported below. Factors that could affect these amounts include, for example, the timing during the year of any such event, the Company’s stock price and the executive’s current base salary.
47
The benefits payable upon a NEO’s qualifying termination of employment in connection with a change in control as reported in the columns of this table are as follows:
Intrinsic Value of Accelerated Equity Awards (3) | ||||||||||||||||||||||||||||
Name | Cash Severance (1) | Benefits Continuation (2) | Options | Restricted Stock | PSUs & PSOs (4) | Tax Reimbursement (5) | Total | |||||||||||||||||||||
Dow R. Wilson | $ | 7,853,500 | $ | 56,574 | — | — | $ | 26,270,388 | $ | — | $ | 34,180,462 | ||||||||||||||||
Kolleen T. Kennedy | $ | 3,826,168 | $ | 20,454 | $ | 787,002 | $ | 1,070,207 | $ | 3,893,664 | — | $ | 9,597,495 | |||||||||||||||
J. Michael Bruff | $ | 1,925,000 | $ | 56,582 | $ | 805,500 | $ | 796,896 | $ | 1,332,973 | $ | 2,370,664 | $ | 7,287,615 | ||||||||||||||
Christopher A. Toth | $ | 2,081,542 | $ | 56,574 | $ | 607,396 | $ | 2,822,861 | $ | 2,670,352 | $ | 4,382,087 | $ | 12,620,812 | ||||||||||||||
Michael D. Hutchinson | $ | 1,872,500 | $ | 56,574 | — | $ | 1,893,637 | — | $ | 1,922,795 | $ | 5,745,506 | ||||||||||||||||
| (1) | Cash Severance : Cash severance equal to a multiplier times the sum of (i) annual base salary rate, excluding any temporary compensation reductions related toCOVID-19 pandemic, plus (ii) the greater of (a) the most recently established target bonus, (b) the employee’s target bonus as of immediately prior to the change in control or (c) the average annual bonus paid over the prior three fiscal years. The multiplier is 3.0 times for Mr. Wilson, 2.5 times for Ms. Kennedy, and 2.0 times for remaining NEOs. Does not include actual bonus for year of termination, which would be payable in the ordinary course under the MIP as the NEO would have been employed through the end of the performance period, and which bonus amounts are reflected in the Summary Compensation Table above in the“Non-Equity Incentive Plan Compensation” column.” Does not reflect any reduction due to payments exceeding the maximum amount that could be paid without implicating the excise tax under Section 4999 of the Internal Revenue Code by less than 10%, although some such reduction would have applied in Mr. Wilson’s case upon a hypothetical post-change in control severance event on October 2, 2020. |
| (2) | Benefits Continuation : Reflects costs for COBRA benefits continuation premiums for 18 months including medical, dental, and vision insurance. |
| (3) | Based on the closing stock price as of October 2, 2020 ($171.93). Each outstanding equity award that is subject to vesting provisions will vest in full, with PSUs and PSOs vesting at target levels. |
| (4) | All PSUs and PSOs are included at target number of shares, except that with respect to PSUs and PSOs earned in October 2020 for fiscal year 2018-2020 performance, 26.2% of target value is included, representing the excess of the 100% of target shares that would have been due upon a hypothetical post-change in control severance event over the 73.8% of target shares that was actually earned based on performance results. |
| (5) | Tax Reimbursement . Make-whole payments to indemnify the NEOs for any negative economic impact resulting from the application of the excise tax under Section 4999 of the Internal Revenue Code in connection with the Merger. Consistent with SEC guidance, amounts are based on a hypothetical October 2, 2020 Merger consummation date. As discussed more fully in the “Compensation Discussion and Analysis,” the Company has, in cooperation with the affected executives, engaged in mitigation planning that is expected to result in no such make-whole payments being made to any NEO other than Mr. Bruff, assuming the anticipated 2021 Merger consummation. The projected make-whole payment for Mr. Bruff upon a 2021 Merger consummation is expected to be less than $3,000,000. |
48
Outstanding Equity Grants as of October
2, 2020
Under the terms of each NEO’s stock option awards, if the NEO’s employment terminates due to retirement, his or her unvested stock options will continue to vest in accordance with their original vesting schedules; provided however, that the number of shares subject to stock option awards granted within one year of the NEO’s retirement will be adjusted proportionally by the time during such
one-year
period that the NEO remained an employee of the Company (based upon a365-day
year). If the NEO’s service terminates due to death, his or her unvested stock options will fully vest on such termination date. In addition, if the NEO’s service terminates due to disability, his or her unvested stock options will fully vest on such termination date. Stock options may be exercisable for up to three years from the date the NEO’s employment terminates due to retirement or death and one year from the date the NEO’s employment terminates due to disability, unless in each case the stock option term expires earlier.RSU Awards
For awards granted prior to August 2020, under the terms of each NEO’s RSU awards, if the NEO’s service terminates due to retirement one year or more from the grant date, then his or her RSU awards will continue to vest in accordance with their original vesting schedules. If the NEO retires within one year of the grant date of his or her RSU award but after January 1 of the calendar year following the calendar year in which such RSU award was granted, the number of RSUs subject to such award will be adjusted proportionally by the time during such one year period that the NEO remained an employee of the Company (based upon a
365-day
year) and the adjusted RSU award will continue to vest in accordance with its original vesting schedule. If the NEO’s service terminates due to death, his or her RSU awards will fully vest on such termination date. In addition, if the NEO’s service terminates due to disability, then his or her RSU awards will continue to vest in accordance with their original vesting schedules.For awards granted during or after August 2020, under the terms of the RSU award, if the NEO’s service terminates due to retirement, vesting will cease on the termination date. If the NEO’s service terminates due to death or disability, his or her RSU awards will fully vest on such termination date.
PSO Awards
Under the terms of Mr. Wilson’s PSO awards, if Mr. Wilson’s service terminates due to retirement, death or disability, then he will be treated as though he was employed through the applicable performance period; provided however, that if Mr. Wilson retires within one year of his date of grant, the number of shares subject to his award will be adjusted proportionally by the time during such
one-year
period that he remained an employee of the Company (based upon a365-day
year). The actual number of PSOs that are earned in the event of retirement, death or disability will depend on the extent to which the applicable performance goals are achieved. If Mr. Wilson’s service terminates due to disability, he may exercise his vested options within one year from the later of the date that the Compensation Committee certifies whether and to what extent the applicable performance goals are achieved or the date that his service terminates, unless his PSO award expires earlier. If Mr. Wilson’s service terminates due to retirement or death, he or his estate, as applicable, may exercise his vested options within three years from the later of the date that the Compensation Committee certifies whether and to the extent the applicable performance goals are satisfied or the date his service terminates, unless his PSO award expires earlier.PSU Awards
Under the terms of each NEO’s PSU awards, if the NEO’s service terminates due to retirement, death or disability, then the NEO will be treated as though he or she was employed through the applicable performance period; provided however, that in the event of his or her retirement, the target number of PSUs will be adjusted proportionally based on the number of days that the NEO remained an employee during the performance period (based upon a 365 day year). The actual number of PSUs that are earned in such circumstances will depend on the extent to which the applicable performance goals are achieved. In addition, in the event of a change of control where such NEO’s PSU awards are assumed, such awards will fully vest at target, subject to the NEO being employed through the end of the performance period; provided however, that such awards will continue to be subject to the retirement, death and disability vesting provisions described above. Additionally, in the event of a change of control where such NEO’s PSU awards are not assumed, such awards will fully vest at target, without being subject to any employment requirement.
2005 Stock Plan
Under the terms of the 2005 Stock Plan, except as otherwise provided in each NEO’s equity agreements, in the event of certain corporate transactions, which include the Merger, if the transaction does not provide for the assumption, continuation or substitution of stock awards, each NEO’s stock awards will fully vest (based on target number of shares for PSOs or PSUs) and terminate upon the consummation of the transaction, provided that holders of stock options or SARs will be given reasonable advance notice of the impending termination and a reasonable opportunity to exercise their outstanding vested stock options and SARs before the termination of such awards.
49
Other Termination of Employment (Not in Connection with a Change in Control) | ||||||||||||||||||||||||||||||||||||||||||||||||||||||||||||
Retirement | Death | Disability | ||||||||||||||||||||||||||||||||||||||||||||||||||||||||||
Intrinsic Value of Equity Awards (1) | Intrinsic Value of Equity Awards (1) | Intrinsic Value of Equity Awards (1) | ||||||||||||||||||||||||||||||||||||||||||||||||||||||||||
Name | Options (2a) | Restricted Stock/RSUs (2b) | PSUs (2c)(5) | PSOs (2d)(5) | Total | Options (3a) | Restricted Stock/RSUs (3b) | PSUs (3c)(5) | PSOs (3d)(5) | Total | Options (4a) | Restricted Stock/RSUs (4b) | PSUs (4c)(5) | PSOs (4d)(5) | Total | |||||||||||||||||||||||||||||||||||||||||||||
Dow R. Wilson | $ | 0 | $ | 0 | $ | 0 | $ | 0 | $ | 0 | $ | 0 | $ | 0 | $ | 0 | $ | 0 | $ | 0 | $ | 0 | $ | 0 | $ | 0 | $ | 0 | $ | 0 | ||||||||||||||||||||||||||||||
Kolleen T. Kennedy | $ | 658,295 | $ | 578,716 | $ | 0 | $ | 0 | $ | 1,237,011 | $ | 787,044 | $ | 1,070,264 | $ | 0 | $ | 0 | $ | 1,857,308 | $ | 787,044 | $ | 1,070,264 | $ | 0 | $ | 0 | $ | 1,857,308 | ||||||||||||||||||||||||||||||
J. Michael Bruff | $ | 0 | $ | 0 | $ | 0 | $ | 0 | $ | 0 | $ | 805,519 | $ | 797,067 | $ | 0 | $ | 0 | $ | 1,602,586 | $ | 805,519 | $ | 797,067 | $ | 0 | $ | 0 | $ | 1,602,586 | ||||||||||||||||||||||||||||||
Christopher A. Toth | $ | 0 | $ | 0 | $ | 0 | $ | 0 | $ | 0 | $ | 607,475 | $ | 2,822,919 | $ | 0 | $ | 0 | $ | 3,430,394 | $ | 607,475 | $ | 2,822,919 | $ | 0 | $ | 0 | $ | 3,430,394 | ||||||||||||||||||||||||||||||
Michael D. Hutchinson | $ | 0 | $ | 0 | $ | 0 | $ | 0 | $ | 0 | $ | 0 | $ | 1,893,637 | $ | 0 | $ | 0 | $ | 1,893,637 | $ | 0 | $ | 1,893,637 | $ | 0 | $ | 0 | $ | 1,893,637 | ||||||||||||||||||||||||||||||
| (1) | Based on the closing stock price as of October 2, 2020 ($171.93). |
| (2a) | For retirement-eligible NEOs, represents continued vesting of outstanding options granted more than a year prior to October 2, 2020 and prorated acceleration of outstanding options granted less than a year prior to October 2, 2020. |
| (2b) | For retirement-eligible NEOs, represents continued vesting of outstanding RSUs/RSAs granted more than a year prior to October 2, 2020 and after January 1 of the year following the grant year (“Qualifying Retirement”). Excludes value of RSUs granted on February 13, 2020, as the assumed retirement/termination date of October 2, 2020 does not constitute a Qualifying Retirement for that award. |
| (2c) | For NEOs who shall be retirement-eligible on or prior to the last day of the performance period of each outstanding PSU award, the number of shares subject to such PSU award would be adjusted on a prorated basis (based on the actual amount of time employed within each performance period). However, payouts remain subject to actual performance through the end of each award’s applicable performance period, thus awards continue to be subject to risk of forfeiture. $0’s are shown as payouts remain subject to performance post-termination. Assuming target performance is met for all outstanding awards, the intrinsic value of each NEO’s PSU awards would be as follows: |
Wilson: $3,892,323
Kennedy: $1,742,969
Bruff: $0 (Will not be retirement-eligible at the end of applicable outstanding performance period)
Toth: $0 (Will not be retirement-eligible at the end of applicable outstanding performance period)
Hutchinson: $0 (Will not be retirement-eligible at the end of applicable outstanding performance period)
| (2d) | As of October 2, 2020, Mr. Wilson is the only NEO with outstanding PSO awards (granted November 16, 2018 and November 22, 2019). |
2018 PSO Award: payout remains subject to actual performance through the end of the award’s applicable performance period, thus award continues to be subject to risk of forfeiture. $0 is shown as payout remains subject to performance post-termination. Assuming target performance is met for this outstanding award, the intrinsic value of Mr. Wilson’s PSO award would be $8,685,904.
50
2019 PSO Award: because Mr. Wilson is retirement-eligible and his outstanding PSO award was granted less than a year prior to October 2, 2020, service obligations would lapse on a prorated basis (based on actual amount of time employed between the grant date and the assumed retirement/termination date of October 2, 2020). However, payout remains subject to actual performance through the end of the award’s applicable performance period, thus award continues to be subject to risk of forfeiture. $0 is shown as payout remains subject to performance post-termination. Assuming target performance is met for this outstanding award, the intrinsic value of Mr. Wilson’s accelerated PSO award would be $4,530,247.
| (3a) | Represents full acceleration of all outstanding options. |
| (3b) | Represents full acceleration of all outstanding RSUs. |
| (3c) | Service obligations would lapse fully for all outstanding PSUs, but payouts remain subject to actual performance through the end of each award’s applicable performance period, thus awards continue to be subject to risk of forfeiture. |
$0’s are shown as payouts remain subject to performance post-termination. Assuming target performance is met for all outstanding awards, the intrinsic value of each NEO’s accelerated PSU awards would be as follows:
Wilson: $7,623,376
Kennedy: $3,376,017
Bruff: $1,332,973
Toth: $2,553,504
Hutchinson: $0
| (3d) | As of October 2, 2020, Mr. Wilson is the only NEO with outstanding PSO awards (granted November 16, 2018 and November 22, 2019). |
Service obligations would lapse fully for these outstanding awards, but payout remains subject to actual performance through the end of the award’s applicable performance period, thus award continues to be subject to risk of forfeiture.
$0 is shown as payout remains subject to performance post-termination. Assuming target performance is met for these outstanding awards, the intrinsic value of Mr. Wilson’s PSO awards would be $8,685,904 and $5,249,333.
| (4a) | Represents full acceleration of all outstanding options. |
| (4b) | For awards granted prior to August 2020, represents continued vesting of all outstanding RSUs assuming the fiscal year end closing price on each vesting date. For awards granted in August 2020, represents full acceleration of all outstanding RSUs. |
| (4c) | Service obligations would lapse fully for all outstanding PSUs, but payouts remain subject to actual performance through the end of each award’s applicable performance period, thus awards continue to be subject to risk of forfeiture. |
$0’s are shown as payouts remain subject to performance post-termination. Assuming target performance is met for all outstanding awards, the intrinsic value of each NEO’s PSU awards would be as follows:
Wilson: $7,623,376
Kennedy: $3,376,017
Bruff: $1,332,973
Toth: $2,553,504
Hutchinson: $0
51
| (4d) | As of October 2, 2020, Mr. Wilson is the only NEO with outstanding PSO awards (granted November 16, 2018 and November 22, 2019). |
Service obligations would lapse fully for these outstanding awards, but payout remains subject to actual performance through the end of the award’s applicable performance period, thus award continues to be subject to risk of forfeiture.
$0 is shown as payout remains subject to performance post-termination. Assuming target performance is met for these outstanding awards, the intrinsic value of Mr. Wilson’s PSO awards would be $8,685,904 and $5,249,333.
| (5) | Excludes value of PSUs and PSOs earned in October 2020 for fiscal year 2018-2020 performance (earned at 73.8% of target shares). |
Corporate Transaction in which Equity Awards Are Not Assumed, Continued or Substituted (No Termination of Employment) Intrinsic Value of Accelerated Equity Awards(1) | ||||||||||||||||||||
Name | Options | Restricted Stock | PSUs(2) | PSOs | Total(3) | |||||||||||||||
Dow R. Wilson | $ | 0 | $ | 0 | $ | 7,623,376 | $ | 13,935,238 | $ | 21,558,614 | ||||||||||
Kolleen T. Kennedy | $ | 787,044 | $ | 1,070,264 | $ | 3,376,017 | $ | 0 | $ | 5,233,325 | ||||||||||
J. Michael Bruff | $ | 805,519 | $ | 797,067 | $ | 1,332,973 | $ | 0 | $ | 2,935,560 | ||||||||||
Christopher A. Toth | $ | 607,475 | $ | 2,822,919 | $ | 2,553,504 | $ | 0 | $ | 5,983,899 | ||||||||||
Michael D. Hutchinson | $ | 0 | $ | 1,893,637 | $ | 0 | $ | 0 | $ | 1,893,637 | ||||||||||
| (1) | Based on the closing stock price as of October 2, 2020 ($171.93). |
| (2) | Excludes value of PSUs and PSOs earned in October 2020 for fiscal year 2018-2020 performance (earned at 73.8% of target shares). |
| (3) | Represents full acceleration of all outstanding equity awards (with payout for PSUs and PSOs at target performance level) per the Fifth Amended & Restated 2005 Omnibus Stock Plan. |
CEO Pay Ratio
For fiscal year 2020, based on reasonable estimates, the median of the annual total compensation of our employees (other than our CEO) was $66,035 and the annual total compensation of our CEO, as reported in our Summary Compensation Table, was $9,802,972. Based on this information, the ratio of the annual total compensation of our CEO to the median of the annual total compensation of all employees was 148:1. As a result of our acquisition of Cancer Treatment Services International in May 2019, the pay ratio increased from 86:1 in fiscal 2019 due to the addition of approximately 1,800 employees in India, whose compensation is reflective of the lower cost of living in India.
Employees Included.
Selecting Median Employee.
case annualized for regular part-time employees and full-time employees who joined during the fiscal year). No adjustments were made for cost of living or low compensation standards in any countries. Pay for
non-U.S.
employees was converted to U.S. dollars using currency exchange rates as of October 2, 2020. Given the Company had an even number of employees, two median employees were identified; the employee that better represented the median of the total population was selected for the final ratio calculation.Compensation Included.
total compensation, which includes base salary,
non-equity
incentive plan compensation, stock awards, option awards, and all other compensation. Total annual compensation for the median employee for fiscal year 2020 was calculated in the same manner as the CEO’s annual total compensation and52
includes base wages, overtime wages, bonuses, allowances, and company matching contributions to the employee’s retirement plan, resulting in total annual compensation of $66,035.
Compensation of Directors
The compensation of directors is determined by the full Board. Directors who are employees (, Mr. Wilson) receive no compensation for their services as directors. The Compensation Committee periodically initiates a review of the
i.e.
non-employee
director compensation (including cash retainer and meeting fees and equity awards) and recommends changes to the full Board. Changes tonon-employee
director compensation are generally made to ensure that compensation levels are market-competitive and that the compensation structure supports our business objectives, aligns directors’ interests with the interests of stockholders, reflects competitive best practice and iscost-and-tax-effective.
Fiscal 2020 Director Compensation Highlights
An annual cash retainer to all
non-employee
directors.An additional annual cash retainer to the Board Chair, committee chairs and committee members, including an increase to the cash retainers for committee chairs beginning with payments made following the annual meeting in February 2020.
Company matching of director contributions to charities and educational institutions.
An annual restricted stock unit award to all
non-employee
directors, including an increase to the award amount beginning with grants in February 2020.No performance-based equity awards, pension plans or excessive retirement benefits.
Meaningful stock ownership requirements and limit on total director compensation.
The increases to committee chair retainers and annual RSU awards were approved in November 2019 prior to the onset of the
COVID-19
pandemic. Subsequently, as part of the Company’s cost savings measures in response to the pandemic impact, the Board approved a 20 percent reduction in all cash fees paid to members of Varian’s Board of Directors for the second half of calendar year 2020.53
The annualized values for each compensation program component beginning in February 2020 (and prior to reduction due to theexpenses associated with attending Board and committee meetings, and for expenses related to attending continuing directors’ education programs. Our non-employee director compensation program will continue to be in effect through the closing of the Merger.
COVID-19
pandemic impact) are set forth in the following table. Eachnon-employee
director receives an annual retainer as well as committee fees for serving on committees. All directors are also reimbursed forout-of-pocket
Compensation Element | Compensation Amount (prior to reduction in response to pandemic impact) | |
| Annual Cash Board Retainer | • $100,000 | |
| Additional Annual Cash Retainers for Independent Board Chair and Committee Chairs (1) | • $150,000 for Independent Board Chair • $24,000 for Audit Committee Chair • $21,000 for Compensation & Leadership Development Committee Chair • $12,500 for Nominating & Corporate Governance Committee Chair • $12,500 for Ethics & Compliance Committee Chair | |
| Additional Annual Cash Retainer for Non-Chair Committee Members | • $14,000 for Audit Committee Member • $7,500 for Compensation & Leadership Development Committee Member • $5,000 for Nominating & Corporate Governance Committee Member • $5,000 for Ethics & Compliance Committee Member | |
| Annual Equity Award (2) | • $180,000 in RSUs • Grants cliff-vest (100% vest) upon the earlier of one year from the grant date or the next Annual Meeting of Shareholders • Vesting accelerates in the event of termination due to death, disability, retirement, or upon a change in control, such as the Merger | |
| Charitable Giving | • Company matching of director contributions to charities and educational institutions up to a maximum of $10,000 per director per calendar year • Director contributions to Varian’s Political Action Committee were matched by a Company contribution to a charity or educational institution, up to a maximum of $5,000 per director per calendar year |
| (1) | Prior to February 2020, these amounts were $150,000 (unchanged), $20,000, $19,000, $12,000 and $12,000 respectively. |
| (2) | Prior to February 2020, the annual grant date fair value was $165,000. |
As mentioned above, as part of the Company’s cost savings measures in response to the adverse financial impact from the COVID-19 pandemic, the Board approved a 20 percent reduction in cash fees paid to all members of Varian’s Board of Directors for the second half of calendar year 2020.
Non-employee
directors may elect to receive their cash compensation as full-value shares of our common stock, at a value equal to the fair market value on the date that the foregone cash compensation otherwise would have been paid. They may alternatively elect to defer their retainers and/or meeting fees under our DCP, subject to the restrictions of applicable tax law. All earnings on amounts deferred under the DCP are not preferential or above market. Please refer to the discussion in “Nonqualified Deferred Compensation” above for more information.We maintain stock ownership guidelines for our
non-employee
directors. Under these guidelines, eachnon-employee
director is expected to own shares valued at five times the annual cash Board retainer which for this purpose includes shares subject to stock unit awards. Ownership levels are to be achieved within five years from the date upon which an individual becomes anon-employee
Director, within three years of the amendment to the ownership levels described above, or within three years of an amendment tonon-employee
Director compensation that increases the annual retainer fees payable tonon-employee
Directors by 25% or greater, whichever is later. One third of the guideline must be achieved within the first two and a half years after an individual becomes subject to thenon-employee
director compensation program. As of the date of this Amendment, all directors met the guidelines or were within the allowed time frame for meeting the guidelines.54
In addition, we have a stockholder-approved limit on the total value of cash and equity compensation that may be paid or granted to a
non-employee
director during each fiscal year. Currently, the maximum number of shares subject to stock awards granted during a single fiscal year under the 2005 Omnibus Stock Plan or otherwise, if any, taken together with any cash fees paid during such fiscal year for services on the Board of Directors, will not exceed $625,000 in total value for anynon-employee
director serving as the lead director or chair and $525,000 in total value for any othernon-employee
director.The following table sets forth the compensation received by each
non-employee
director during fiscal year 2020:Name | Fees Earned or Paid in Cash (1) | Stock Awards (2)(6) | Option Awards | Non-Equity Incentive Plan Compensation | Change in Pension Value and Nonqualified Deferred Compensation Earnings | All Other Compensation (3) | Total ($) | |||||||||||||||||||||
Anat Ashkenazi | $ | 115,425 | $ | 179,977 | — | — | — | — | $ | 295,402 | ||||||||||||||||||
Jeffrey Balser | $ | 106,875 | $ | 179,977 | — | — | — | — | $ | 286,852 | ||||||||||||||||||
Judy Bruner | $ | 121,550 | $ | 179,977 | — | — | — | $ | 10,000 | $ | 311,527 | |||||||||||||||||
Jean-Luc Butel | $ | 127,750 | $ | 179,977 | — | — | — | — | $ | 307,727 | ||||||||||||||||||
Regina Dugan | $ | 120,050 | $ | 179,977 | — | — | — | — | $ | 300,027 | ||||||||||||||||||
R. Andrew Eckert | $ | 249,375 | $ | 179,977 | — | — | — | — | $ | 429,352 | ||||||||||||||||||
Phillip Febbo (6) | $ | 113,050 | $ | 249,617 | — | — | — | — | $ | 362,667 | ||||||||||||||||||
Timothy E. Guertin (4) | $ | 27,500 | — | — | — | — | — | $ | 27,500 | |||||||||||||||||||
David J. Illingworth | $ | 111,500 | $ | 179,977 | — | — | — | — | $ | 291,477 | ||||||||||||||||||
Michelle Le Beau (5)(6) | $ | 102,000 | $ | 195,844 | — | — | — | $ | 5,000 | $ | 302,844 | |||||||||||||||||
| (1) | This column includes cash compensation paid during fiscal year 2020 (i) under the terms of the director compensation program that was in effect prior to February 2020, (ii) under the terms of the director compensation program that was in effective beginning in February 2020, and (iii) following the temporary 20 percent reduction in cash compensation for payments made during the second half of calendar year 2020 as a result of cost savings measures in response to the COVID-19 pandemic impact. |
| (2) | This column represents the aggregate grant date fair value of RSUs granted in fiscal year 2020, computed in accordance with ASC 718. The fair value is determined using the closing price on the grant date multiplied by the number of shares subject to the award. These amounts reflect our calculation of the value of these awards, and do not necessarily correspond to the actual value that may ultimately be realized by the directors. |
| (3) | Amounts represent charitable contributions made by the Company during the fiscal year on behalf of Ms. Bruner and Ms. Le Beau under our matching gifts program. Contributions span multiple calendar years and therefore may be higher than the applicable calendar year limits outlined above. |
| (4) | Timothy E. Guertin retired from the Board effective February 13, 2020. |
| (5) | Michelle Le Beau was appointed to the Board effective November 27, 2019. |
| (6) | Mr. Febbo and Ms. Le Beau were each granted additional RSUs for their partial year of service prior to the 2020 Annual Meeting. |
55
The following table sets forth the aggregate number of outstanding RSUs and stock options held by each
non-employee
director listed as of the end of fiscal year 2020:Name | RSUs Outstanding | Options Outstanding | ||||||
Anat Ashkenazi | 1,225 | — | ||||||
Jeffrey Balser | 1,225 | — | ||||||
Judy Bruner | 1,225 | — | ||||||
Jean-Luc Butel | 1,225 | — | ||||||
Regina Dugan | 1,225 | — | ||||||
R. Andrew Eckert | 1,225 | — | ||||||
Phillip Febbo | 1,225 | — | ||||||
David J. Illingworth | 1,225 | — | ||||||
Michelle Le Beau | 1,333 | — | ||||||
Compensation Committee Interlocks and Insider Participation
No member of this committee was at any time during fiscal year 2020 or at any other time an officer or employee of the Company, and no member of this committee had any relationship with the Company requiring disclosure under Item 12. 404 of Regulation
S-K.
No executive officer of the Company has served on the board of directors or compensation committee of any other entity that has or has had one or more executive officers who served as a member of the Compensation Committee during fiscal year 2020.56
Item 12. | Security Ownership of Certain Beneficial Owners and Management and Related Stockholder Matters |
Equity Compensation Plan Information
The following table provides information as of September 29, 2017October 2, 2020 with respect to the shares of VMS common stock that may be issued under existing equity compensation plans.
A | B | C | ||||||||||
(In millions, except price per share) | Number of securities to be issued upon exercise of outstanding options, warrants and rights | Weighted average exercise price of outstanding options, warrants and rights (1) | Number of securities remaining available for future issuance under equity compensation plans (excluding securities reflected in column A) | |||||||||
Equity compensation plans approved by security holders | 2.5 | (2) | $ | 110.79 | 11.2 | (3) | ||||||
Total | 2.5 | $ | 110.79 | 11.2 | ||||||||
| A | B | C | ||||||||
| (in millions, except price per share) | Number of securities to be issued upon exercise of outstanding options, warrants and rights | Weighted average exercise price of outstanding options, warrants and rights (1) | Number of securities remaining available for future issuance under equity compensation plans (excluding securities reflected in column A) | |||||||
| Equity compensation plans approved by security holders | 3.2 | (2) | $ | 74.08 | 7.9 | (3) | ||||
| Total | 3.2 | $ | 74.08 | 7.9 | ||||||
| (1) | |
The weighted average exercise price does not take into account the shares issuable upon vesting of outstanding restricted stock units, deferred stock units and performance units, which have no exercise price. |
| (2) | |
Consists of stock options (including performance-based options), restricted stock units, deferred stock units and performance units granted under the |
| (3) | Includes 5.7 million shares available for |
Beneficial Ownership of Certain Stockholders, Directors and Executive Officers.”Officers
This table shows as of January 20, 2021: (1) the beneficial owners of more than five percent of our common stock and the number of shares they beneficially owned based on information provided in their most recent filings with the SEC; and (2) the number of shares each director, each nominee for director and each Named Executive Officer and all directors, nominees for director and executive officers as a group beneficially owned, as reported by each person. Except as otherwise indicated, the address of each person or group is 3100 Hansen Way, Palo Alto, California 94304. Beneficial
57
ownership is determined under the rules of the SEC and generally includes voting or investment power with respect to securities. Except as noted, each person or group has sole voting and investment power over the shares shown in this table. For each individual and group included in the table below, the percentage ownership is calculated by dividing the number of shares beneficially owned by the person or group, which includes the number of shares of common stock that the person or group had the right to acquire on or within 60 days after January 20, 2021, by the sum of the 91,827,391 shares of common stock outstanding on January 20, 2021, plus the number of shares of common stock that the person or group had the right to acquire on or within 60 days after January 20, 2021.
Amount and Nature of Common Stock Beneficially Owned | ||||||||
Number of Shares Beneficially Owned | Percent of Class | |||||||
Stockholders | ||||||||
The Vanguard Group, Inc. (1) | 10,021,104 | 10.91 | % | |||||
100 Vanguard Blvd. | ||||||||
Malvern, PA 19355 | ||||||||
BlackRock, Inc. (2) | 9,929,752 | 10.81 | % | |||||
55 East 52nd Street | ||||||||
New York, NY 10055 | ||||||||
Directors and Named Executive Officers | ||||||||
Anat Ashkenazi (3) | 2,574 | * | ||||||
Jeffrey R. Balser (4) | 2,824 | * | ||||||
Judy Bruner (5) | 6,779 | * | ||||||
Jean-Luc Butel (6) | 4,415 | * | ||||||
Regina E. Dugan (7) | 12,396 | * | ||||||
R. Andrew Eckert (8) | 14,273 | * | ||||||
Phillip G. Febbo (9) | 1,708 | * | ||||||
David J. Illingworth (10) | 15,369 | * | ||||||
Michelle M. Le Beau (11) | 1,333 | * | ||||||
Dow R. Wilson | 104,645 | * | ||||||
J. Michael Bruff (12) | 7,798 | * | ||||||
Kolleen T. Kennedy (13) | 38,704 | * | ||||||
Christopher A. Toth (14) | 16,078 | * | ||||||
Michael Hutchinson | 5,589 | * | ||||||
Gary Bischoping, Jr. (15) | 22,230 | * | ||||||
All directors and executive officers as a group (15 persons) (16) | 246,998 | * | ||||||
| * | The percentage of shares of common stock beneficially owned does not exceed one percent of the shares of common stock outstanding at January 20, 2021. |
| (1) | Based on a Schedule 13G/A filed February 12, 2020, The Vanguard Group, Inc. has sole power to vote 141,096 of these shares, shared power to vote 29,809 of these shares, sole power to dispose of 9,858,132 of these shares and shared power to dispose of 162,972 of these shares. |
| (2) | Based on a Schedule 13G/A filed February 10, 2020, BlackRock, Inc. has sole power to vote 8,803,867 of these shares and sole power to dispose of 9,929,752 of these shares. |
| (3) | Amount shown includes 1,225 restricted stock units that will vest on February 11, 2021. |
| (4) | Amount shown includes 1,225 restricted stock units that will vest on February 11, 2021. |
| (5) | Amount shown includes 1,225 restricted stock units that will vest on February 11, 2021. |
| (6) | Amount shown includes 1,225 restricted stock units that will vest on February 11, 2021. |
| (7) | Amount shown includes 1,225 restricted stock units that will vest on February 11, 2021. |
| (8) | Amount shown includes 1,225 restricted stock units that will vest on February 11, 2021. |
| (9) | Amount shown includes 1,225 restricted stock units that will vest on February 11, 2021. |
| (10) | Amount shown includes 1,225 restricted stock units that will vest on February 11, 2021. |
| (11) | Amount shown includes 1,333 restricted stock units that will vest on February 11, 2021. |
| (12) | Amount shown includes 1,299 restricted stock units that will vest on February 15, 2021. |
| (13) | Amount shown includes 3,256 restricted stock units that will vest on February 15, 2021, and includes 8,330 shares that may be acquired under exercisable stock options. |
| (14) | Amount shown includes 2,376 restricted stock units that will vest on February 15, 2021. |
58
| (15) | Amount shown is based on the Company’s available records as of March 6, 2020. |
| (16) | Amount shown includes 18,513 shares that may be acquired under exercisable stock options, 11,133 shares restricted stock units that will vest on February 11, 2021 and 8,459 restricted stock units that will vest on February 15, 2021, held by all persons who are directors and/or executive officers of the Company as of January 20, 2021. The amount shown (i) excludes the holdings of Mr. Bischoping, who is a former executive officer of the Company, and (ii) includes the holdings of Mr. Kevin O’Reilly, who is a current executive officer of the Company as of October 5, 2020. |
Item 13. Certain Relationships and Related Transactions, and Director Independence
Review, Approval or Ratification of Related Person Transactions
The information requiredNominating and Corporate Governance Committee (the “Nominating Committee”) is responsible for the review, approval or ratification of “related person transactions” between the Company or its subsidiaries and related persons. Under SEC rules, a related person is a director, nominee for director or executive officer since the beginning of the last fiscal year, or a more than five percent stockholder, and their immediate family members. Such transactions may include employment or consulting relationships with a related person or contracts under which we receive goods or services from (or provide goods and services to) a related person or a company for which the related person is an employee or otherwise affiliated. The Board has adopted written policies and procedures that apply to any transaction or series of transactions in which the Company or one of its subsidiaries is a participant and a related person has a direct or indirect material interest. Generally for a transaction to be approved, the Nominating Committee must be informed or have knowledge of (i) the related person’s relationship to the Company and interest in the transaction; (ii) the material facts of the proposed transaction, including a description of the nature and potential aggregate value of the proposed transaction; (iii) the benefits, if any, to the Company of the proposed transaction; (iv) if applicable, the availability of other sources of comparable products or services; and (v) an assessment of whether the proposed transaction or situation is on terms that are comparable to the terms available to an unrelated third party or to employees generally.
The Nominating Committee has, however, determined that a related person does not have a direct or indirect material interest in the following categories of transactions:
any transaction with another company for which a related person’s only relationship is as an employee (other than an executive officer), director, or beneficial owner of less than 10% of that company’s shares, if the amount involved does not exceed the greater of $1 million, or 2% of that company’s total annual revenue, and the related person is not involved in the decision-making process for such transaction;
any charitable contribution, grant or endowment by this itemthe Company to a charitable organization, foundation or university for which a related person’s only relationship is as an employee (other than an executive officer) or a director, if the amount involved does not exceed the lesser of $1 million, or 2% of the charitable organization’s total annual receipts, and the related person is not involved in the decision-making process for such transaction;
compensation to executive officers determined by the Compensation Committee;
compensation to directors determined by the Board; and
transactions in which all security holders receive proportional benefits.
Transactions involving related persons that are not included in one of the above categories are forwarded to our legal department to determine whether the related person could have a direct or indirect material interest in the transaction, and any such transaction is forwarded to the Nominating Committee for review. The Nominating Committee determines whether the related person has a material interest in a transaction and may approve, ratify, terminate or take other action with respect to certainthe transaction in its discretion.
Transactions with Related Persons
There were no related party transactions during fiscal year 2020.
Director Independence
The Board has determined that all of our directors, except Mr. Wilson, are “independent” for purposes of the NYSE listing requirements and under our Corporate Governance Guidelines. Mr. Wilson, our President and Chief Executive Officer, is an employee and therefore not “independent.” The Board considered transactions and relationships, both direct and indirect, between each director (and his or her immediate family) and the Company and its subsidiaries and affirmatively determined that none of Ms. Ashkenazi, Dr. Balser, Ms. Bruner, Mr. Butel, Ms. Dugan, Mr. Eckert, Dr. Febbo, Mr. Illingworth, Mr. Guertin and Dr. Le Beau has any material relationship, either direct or indirect, with us other than as a director and stockholder.
Additionally, in making its determination the Board analyzed the following relationships and related transactionsdetermined that these relationships are not inconsistent with a determination that these directors are “independent” for purposes of the NYSE listing requirements and under our Corporate Governance
59
Guidelines, which can be found through the “Corporate Governance” link on the Investors page on our website at www.varian.com:
Dr. Balser is incorporated by referencethe Chief Executive Officer of Vanderbilt University Medical Center, which is a customer of ours.
Mr. Eckert serves as an outside director of a company from whom we are licensing and with whom we are developing certain technology.
In addition, all members of our definitive proxy statement forkey Board committees, the 2018 Annual Meeting of Stockholders underAudit Committee, the caption “Certain RelationshipsCompensation and Related Transactions.” The information required by this item with respect to directorLeadership Development Committee, the Nominating and committee member independence is incorporated by reference from our definitive proxy statement forCorporate Governance Committee and the 2018 Annual Meeting of Stockholders under the caption “Proposal One—Election of Directors.”Ethics and Compliance Committee, are independent.
Item 14. Principal Accountant Fees and Services
The information requiredfollowing is a summary of the fees billed or to be billed to us by this item is incorporated by reference from our definitive proxy statementPwC for professional services rendered for the 2018 Annual Meetingfiscal years ended October 2, 2020 and September 27, 2019:
Fee Category | Fiscal Year 2020 | Fiscal Year 2019 | ||||||
Audit Fees | $ | 6,843,334 | $ | 5,793,031 | ||||
Audit-Related Fees | $ | 389,500 | $ | 160,460 | ||||
Tax Fees | $ | 711,732 | $ | 1,050,397 | ||||
All Other Fees | $ | 2,700 | $ | 16,880 | ||||
Total Fees | $ | 7,947,266 | $ | 7,020,768 | ||||
Audit Fees
10-Q
Quarterly Reports and services that PwC normally provides in connection with statutory and regulatory filings or engagements, including audit and review services provided in connection with the Company’s acquisitions.Audit-Related Fees
Tax Fees
All Other Fees
Policy on Audit CommitteeFirm.”Firm
Pre-Approval
of Audit and PermissibleNon-Audit
Services of Independent Registered Public Accounting The Audit Committee must
pre-approve
all audit and permissiblenon-audit
Pre-approval
is generally requested annually and anypre-approval
is detailed as to the particular service, which must be classified in one of the four categories of services. The Audit Committee may also, on acase-by-case
pre-approve
particular services that are not contained in the annualpre-approval
request. Additionally, the Chair of the Audit Committee has also been delegated the authority topre-approve
particular services, subject to ratification by the Audit Committee at the next meeting. In connection with thispre-approval
policy, the Audit Committee also considers whether the categories ofpre-approved
services are consistent with the SEC rules on accountant independence.The Audit Committee determined that PwC’s provision of these services and the fees that we paid for these services, are compatible with maintaining the independence of the independent registered public accounting firm. The Audit Committee
pre-approved
all services that PwC provided in fiscal years 2020 and 2019 in accordance with thepre-approval
policy discussed above.60
| (a) | The following documents are filed as part of this report: |
| (1) | Consolidated Financial Statements: |
Consolidated Statements of Earnings
Consolidated Statements of Comprehensive Earnings
Consolidated Balance Sheets
Consolidated Statements of Cash Flows
Consolidated Statements of Equity
Notes to the Consolidated Financial Statements
Report of Independent Registered Public Accounting Firm
| (2) | Consolidated Financial Statement Schedule: |
The following financial statement schedule of the Registrant and its subsidiaries for fiscal years 2017, 20162020, 2019 and 20152018 is filed as a part of this report and should be read in conjunction with the Consolidated Financial Statements of the Registrant and its subsidiaries:
Page | ||||
Schedule | ||||
II | Valuation and Qualifying Accounts | See page 144of the Original Form 10-K |
All other schedules are omitted because of the absence of conditions under which they are required or because the required information is given in the financial statements or the notes thereto.
| (3) | Exhibits: |
The exhibits listed below are filed or incorporated by reference as part of this
Form 10-K.10-K/A.
61
10.4† | |||
10.5† | |||
62
Exhibit Number | Description | |
10.6 | Employee Benefits Allocation Agreement, dated April 2, 1999, by and among Varian Associates, Inc. (which has been renamed Varian Medical Systems, Inc.), Varian, Inc. and Varian Semiconductor Equipment Associates, Inc. (incorporated by reference to Exhibit No. 99.1 to the Registrant’s Form 8-K Current Report filed as of April 19, 1999, File No. 1-7598). | |
10.7 | ||
10.8 | ||
10.9† | ||
10.10† | ||
10.11† | ||
10.12† | ||
10.13† | |||
10.14† | |||
10.15† | |||
10.16† | |||
10.17† | |||
10.18† | |||
10.19† | |||
10.20† | |||
63
Exhibit Number | ||
10.21++ | ||
10.22++ | ||
10.23++ | ||
10.24++ | ||
64
65
Exhibit Number | Description | |
23 | Consent of Independent Registered Public Accounting | |
31.1* | ||
31.2* | ||
32.1 | ||
32.2 | ||
101 | The following financial statements from the Company’s Annual Report on Form 10-K for the year ended October 2, 2020: (i) Consolidated Statements of Earnings, (ii) Consolidated Statements of Comprehensive Earnings, (iii) Consolidated Balance Sheets, (iv) Consolidated Statements of Cash Flows, (v) Consolidated Statements of Equity, and (vi) Notes to the Consolidated Financial Statements, tagged as blocks of text and including detailed tags (incorporated by reference to Exhibit 101 to the Registrant’s Annual Report on Form10-K for the period ended October 2, 2020, filed on November 25, 2020). | |
104 | The cover page from the Company’s Annual Report on Form 10-K for the year ended October 2, 2020, formatted in Inline XBRL and contained in Exhibit 101. | |
| † | Management contract or compensatory arrangement. |
| * | Filed |
| ++ | Confidential treatment has been granted as to certain portions of this exhibit pursuant to Rule 24b-2 of the Securities Exchange Act of 1934, as amended. |
SIGNATURES
Pursuant to the requirements of Section 13 or 15(d) of the Securities Exchange Act of 1934, the registrant has duly caused Amendment No. 1 to this report to be signed on its behalf by the undersigned, thereunto duly authorized.
Dated: February 1, 2021
VARIAN MEDICAL SYSTEMS, INC. | ||
| By: | /s/ J. MICHAEL BRUFF | |
J. Michael Bruff Senior Vice President, Finance and Chief Financial Officer | ||
Fiscal Year | Description | Balance at Beginning of Period | Charged to Bad Debt Expense | Write-offs Adjustments Charged to Allowance | Balance at End of Period | |||||||||||||
| (In millions) | ||||||||||||||||||
| 2017 | Allowance for doubtful accounts receivable | $ | 24.2 | $ | 43.0 | $ | (4.1 | ) | $ | 63.1 | ||||||||
| 2016 | Allowance for doubtful accounts receivable | $ | 21.1 | $ | 3.4 | $ | (0.3 | ) | $ | 24.2 | ||||||||
| 2015 | Allowance for doubtful accounts receivable | $ | 20.2 | $ | 1.1 | $ | (0.2 | ) | $ | 21.1 | ||||||||
67
Fiscal Year | Description | Balance at Beginning of Period | Increases | Deductions | Balance at End of Period | |||||||||||||
| (In millions) | ||||||||||||||||||
| 2017 | Valuation allowance for deferred tax assets | $ | 79.6 | $ | 26.2 | $ | — | $ | 105.8 | |||||||||
| 2016 | Valuation allowance for deferred tax assets | $ | 69.7 | $ | 12.2 | $ | (2.3 | ) | $ | 79.6 | ||||||||
| 2015 | Valuation allowance for deferred tax assets | $ | 67.5 | $ | 4.7 | $ | (2.5 | ) | $ | 69.7 | ||||||||