| Item 1A. | RISK FACTORS |
There are risks, many beyond our control, which could cause our results to differ significantly from management’s expectations. Some of these risk factors are described below. Any factor described in this Report on Form 10-K could, by itself or together with one or more other factors, adversely affect our business, results of operations and/or financial condition. Additional risks and uncertainties not currently known to us or that we currently consider to not be material also may materially and adversely affect us. In assessing these risks, you should also refer to other information disclosed in our SEC filings, including the financial statements and notes thereto.
MARKET AND LIQUIDITY RISKS
Challenging economic conditions or volatility in the financial markets could have a material adverse impact on our business, leading to diminished financial results and position.
Our profitability depends to a large extent on IBERIABANK’s net interest income, which is the difference between income on interest-earning assets, such as loans and investment securities, and expense on interest-bearing liabilities, such as deposits and borrowings. We are unable to predict changes in market interest rates, which are affected by many factors beyond our control, including inflation, recession, unemployment, money supply, competition for loans and deposits, domestic and international events and changes in the United States and other financial markets.
Although the general economic environment has shown improvement since the end of the economic recession in June 2009, there can be no assurance that improvement will continue. Economic growth has been slow and uneven, and continuing concerns over the federal deficit and government spending have contributed to uncertain conditions for the economy. However, theThe change in domestic government administration in early 2017 hasmay have had and may continue to have positive ramifications toward mitigating adverse impacts on the business, including, but not limited to: higher levels of interest rates in 2017 which could continue to rise in the future, potential for greater loan fee revenues from commercial/business capital investment, reduction in corporate tax rate levels by the tax reform legislation enacted in December 2017, and relaxation of certain financial regulatory reform measures.
However, the outcome of the pending U.S. election, a return of recessionary conditions, including declines in real estate values and sales volumes, an increase in unemployment, and/or negative developments in the domestic and international credit markets may significantly affect economic conditions in the market areas in which we do business, the value of our loans and investments, supply of and demand for deposits, and our ongoing operations, costs and profitability.
In addition, geopolitical matters, including international political unrest, foreign trade disputes, and slow growth in the global economy, as well as acts of terrorism, war and other violence could result in further disruptions in the financial markets. These negative events could have a material adverse effect on our results of operations and financial condition, including our liquidity position, and may affect our ability to access capital.
The geographic concentration of our markets makes our business highly susceptible to local economic conditions. Adverse economic factors affecting particular geographies or industries, especially the southeastern United States, could have a negative effect on our customers and their ability to make payments to us.
Unlike larger organizations that are more geographically diversified, our offices are primarily concentrated in selected markets in the southeastern United States. As a result of this geographic concentration, our financial results depend largely upon economic conditions in these market areas.
A downturn in segments of the commercial and residential real estate industries in our markets due to adverse economic factors affecting particular industries could have an adverse effect on our customers. Deterioration in economic conditions in the markets we serve could result in one or more of the following:
an increase in loan delinquencies;
an increase in the allowance for credit losses;
an increase in problem assets and foreclosures;
a decrease in the demand for our products and services;
a decrease in the value of collateral for loans, especially real estate, in turn reducing customers’ borrowing power, the value of assets associated with problem loans and collateral coverage; and/or
| • | a decrease in supply of customer deposits, which could impact our liquidity. |
The Government’s responses to economic conditions may adversely affect our financial performance.
The Federal Open Market Committee (“FOMC”)FOMC of the Federal Reserve Board (“FRB”),FRB, in an attempt to stimulate the overall economy, has, among other things, kept interest rates low through its targeted federal funds rate. In December 2016,While the FOMC votedcontinues to raiseobserve sustained economic activity, strong labor market conditions, and stable inflation, it has signaled a pause in its recent efforts to increase the target federal funds rate for only the second time since 2006. The FOMC voted to raise the target federal funds rate againand made three recent cuts of 25 basis points each in March, June, and December of 2017. The FOMC has now raised rates by one and one-quarter percentage points since the financial crisis in 2008, a sign of its increased confidence in the health of the economy. In addition to increasing the target federal funds rate, the FRB also began to remove accommodation in 2017 by reducing the amount of debt held on its balance sheet. The FRB is expected to continue to wind-down its asset purchase program in 2018. The FOMC expects that economic conditions will continue to evolve in a manner that will warrant additional gradual increases2019. Decreases in the federal funds rate could cause overall interest rates to fall, which may negatively impact financial performance from greater borrower refinancing incentives. Increases in 2018 and over the next several years. As the FOMC increases the federal funds rate and unwindsthe unwinding of its balance sheet it is possible thatcould cause overall interest rates couldto rise, which may negatively impact the U.S. real estate markets and potentially affect deposit growth and pricing. In addition, deflationary pressures, while possibly lowering our operating costs, could have a significant negative effect on our borrowers, especially our business borrowers, and the values of collateral securing loans, which could negatively affect our financial performance.
Changes in interest rates and other factors beyond our control may adversely affect our earnings and financial condition, and we may incur losses if we are unable to successfully manage interest rate risk.
Our net interest income may be reduced if more interest-earning assets than interest-bearing liabilities reprice or mature during a period when interest rates are declining, or more interest-bearing liabilities than interest-earning assets reprice or mature during a period when interest rates are rising.
Changes in the difference between short- and long-term interest rates may also harm our business. For example, short-term deposits may be used to fund longer-term loans. When differences between short-term and long-term interest rates shrink or disappear, as is possible when the FOMC is tightening monetary policy by raising the target fed funds rate, the spread between rates paid on deposits and received on loans could narrow significantly, thereby decreasing our net interest income.
If market interest rates rise rapidly, interest rate adjustment caps may limit increases in interest rates on adjustable rate loans, thereby reducing our net interest income. Similarly, interest rate adjustment floors may limit the upside benefit to increases in interest rates. In the event that market interest rates fall rapidly, loan and bond prepayments may occur as borrowers refinance and pay off debt prior to stated maturity. As a result, yields on earning assets could decline, thereby reducing net interest income. If an unprecedented negative rate environment were to occur, our operations and margin would be adversely impacted and could result in increased credit losses.
We attempt to manage our risk from changes in market interest rates by adjusting the rates, maturity, repricing characteristics, and balances of the different types of interest-earning assets and interest-bearing liabilities. Interest rate risk management techniques are not exact. We employ the use of models and modeling techniques to quantify the levels of risks to net interest income, which inherently involve the use of assumptions, judgments, and estimates. While we strive to ensure the accuracy of our modeled interest rate risk profile, there are inherent limitations and imprecisions in this determination and actual results may differ. As of December 31, 2017,2019, a 100 basis point instantaneous and parallel upward shift in interest rates was estimated to increase net interest income over 12 months by approximately 3.0%1.9%. Similarly, a 100 basis point decrease in interest rates was expected to decrease net interest income by 7.7%5.7% over the same period.
At December 31, 2017,2019, approximately 41%38% of our total loan portfolio had fixed interest rates. Eliminating fixed rate loans that mature within a one-year time frame decreases this percentage to approximately 29% at December 31, 2017. About 96% of the investment portfolio had fixed interest rates as of December 31, 2017.2019. Approximately 70%90% of our time deposit base and 87%49% of our Federal Home Loan Bank ("FHLB") borrowings will mature and/or re-price within 12 months.
Uncertainty about the future of LIBOR may adversely affect our business.
In 2017, the Chief Executive of the United Kingdom Financial Conduct Authority, which regulates the London InterBank Offered Rate (LIBOR), announced that it intends to halt persuading or compelling banks to submit rates for the calculation of LIBOR after 2021. As a result, LIBOR, as currently operated, may not continue after 2021. It is impossible to predict whether and to what extent banks will continue to provide LIBOR submissions to the administrator of LIBOR or whether any additional reforms to LIBOR may be enacted in the United Kingdom or elsewhere. At this time, little consensus exists as to what rate or rates may become accepted alternatives to LIBOR. One leading alternative rate, the Secured Overnight Financing Rate (SOFR) published by the Federal Reserve Bank of New York, is not directly comparable to LIBOR and cannot easily or simply be substituted for it in outstanding instruments. Key differences between the two are: SOFR is based on secured lending, while LIBOR is not; and SOFR is limited to overnight lending, while LIBOR encompasses several short-term maturity periods. It is impossible to predict the effect of any alternatives on the value of LIBOR-based securities and variable rate loans. Our primary exposures to LIBOR are in variable-rate loans and in hedging transactions. The lack of a leading alternative to LIBOR means that LIBOR continues to be used in many new instruments. In addition, it is not known how a transition away from LIBOR, or to a new version of LIBOR, will impact our ability to use hedge accounting after 2021.
Certain instruments issued by us, including our outstanding Series B, Series C and Series D preferred stock, have floating rate terms based on LIBOR.
As mentioned above, it is not known whether LIBOR will continue after 2021 in a legally workable form. There is a risk that an adverse outcome of the LIBOR transition after 2021 could increase our interest, dividend, and other costs relative to our outstanding Series B, Series C and Series D preferred stock. We may not be able to refinance those instruments on terms that reduce those costs to the level we would have expected if LIBOR were to continue indefinitely, unchanged. Additionally, a transition from LIBOR could adversely impact or change our hedge accounting practices.
If we or our subsidiaries were unable to borrow funds through access to capital markets, we may not be able to meet the cash flow requirements of our depositors and borrowers, or the operating cash needs to fund corporate expansion and other corporate activities.
Liquidity is the ability to meet cash flow needs on a timely basis at a reasonable cost. IBERIABANK’s liquidity is used primarily to fund loans and to repay deposit liabilities as they become due or are demanded by customers. Liquidity policies and limits are established by our Board of Directors. Management and the Investment Committee regularly monitor the overall liquidity position of IBERIABANK and the Company to ensure that various alternative strategies exist to cover unanticipated events that could affect liquidity. Management and the Investment Committee also establish policies and monitor
guidelines to diversify IBERIABANK’s funding sources to avoid concentrations in any one market source. Funding sources include federal funds purchased, securities sold under repurchase agreements, customer deposits, and short- and long-term debt. IBERIABANK is also a member of the FHLB System, which provides funding through advances to members that are collateralized with mortgage-related assets.
We maintain a portfolio of securities that can be used as a secondary source of liquidity. There are other sources of liquidity available to us should they be needed. These sources include sales or securitizations of loans, our ability to acquire additional national market, non-core or brokered deposits, additional collateralized borrowings such as the FRB discount window, the issuance and sale of debt securities, and the issuance and sale of preferred or common securities in public or private offerings. Amounts available under our existing credit facilities as of December 31, 20172019 consist of $6.4$8.4 billion in FHLB availability. The Company also had various funding arrangements with the Federal discount window and commercial banks providing up to $290.6$332.6 million in the form of federal funds and other lines of credit.
If we were unable to access any of these funding sources when needed, we might be unable to meet customers’ needs, which could adversely impact our financial condition, results of operations, cash flows, and level of regulatory-qualifying capital.
Additionally, the Company is often the recipient of dividends from its subsidiaries, including IBERIABANK, and may rely on these dividends as a source of cash flow. The amount of future dividends from IBERIABANK is dependent upon its performance and could be impacted by future unanticipated economic conditions and regulatory limitations. Such events could impact the Company’s ability to declare future dividends and ultimately its solvency if other sources of cash flows were not available.
Deposit run-off or a change in deposit mix could increase our funding costs.
A major portion of our net income comes from our interest rate spread, which is the difference between the interest rates we pay on amounts used to fund assets and the interest rates and fees we receive on our interest-earning assets. We rely on deposits as a stable, low-cost source of funding for our interest-earning assets. We must compete with other banks and financial institutions for deposits. If our competitors raise rates on their deposits, we may face deposit attrition or experience higher funding costs by increasing our deposit rates in order to maintain our customer deposit base. Higher funding costs would increase interest expense, thereby reducing our net interest margin, net interest income, and net income. As of December 31, 2017,2019, approximately 29%25% of our deposits were non-interest-bearing.
Market perceptions of our credit risk could impair our liquidity, cash flows, financial condition and operating results.
Our liquidity and borrowing costs are largely impacted by our credit risk. Market perception given the lack of a public credit rating, could have an adverse effect on our ability to access capital markets or borrow funds and increase the costs of capital and borrowings. In addition, deterioration in our credit risk, whether actual or perceived, could trigger unfavorable contractual obligations, resulting in the requirement to post additional collateral or realize credit-related contingent features.
CREDIT RISKS
Our business is highly susceptible to credit risk.
As a lender, we are exposed to the risk that our customers will be unable to repay their loans according to their terms and that the collateral securing the payment of their loans (if any) may not be sufficient to satisfy our customers’ loan obligations in the event of default. Credit losses could have a material adverse effect on our operating results.
As of December 31, 2017,2019, our total loan portfolio was approximately $20.1$24.0 billion, or 72%76% of total assets. At that date, the major components of our loan portfolio comprised 70%69% commercial loans (of which 64% is61% was commercial real estate and 36% is39% was commercial and industrial), 15%20% mortgage loans (primarily residential 1-4 family mortgage loans), and 15%11% consumer and other loans (primarily home equity). Our credit risk with respect to our consumer installment and commercial loan portfolios relates principally to the general creditworthiness of individuals and businesses within our local market areas. Our credit risk with respect to our residential and commercial real estate mortgage and construction loan portfolios relates principally to the general creditworthiness of individuals and businesses, the value of real estate as collateral, and guarantors serving as security for the repayment of the loans.
Our loan portfolio has been and will continue to be affected by real estate markets. Real estate industry pricing dynamics in the geographical markets we operate can vary from year to year, and with respect to construction, can vary between project funding and project completion. Asset values to which we underwrite loans can fluctuate from year to year and impact collateral values and the ability of our borrowers to repay their loans. An additional risk in connection with loans secured by commercial real estate is the effect of unknown or unexpected environmental contamination, which could make the real estate effectively unmarketable or otherwise significantly reduce its value as security, or could expose us to remediation liabilities as the lender. We make credit and reserve decisions based on the current conditions of borrowers or projects combined with our expectations for the future. If a deterioration in economic conditions or prices beyond our expectations were to occur in any of the market areas we serve, we could experience higher charge-offs and delinquencies above amounts provided for in the allowance for credit losses. As such, our earnings could be adversely affected through higher than anticipated provisions for loancredit losses.
We frequently participate in group lending transactions, such as participations or syndications, which include shared national credits. These transactions often have a lead bank that is responsible for servicing the overall credit facility. In that capacity, the lead bank is responsible for the ongoing monitoring of the borrower's financial performance, covenant compliance and collateral verification, among other duties. In transactions where IBERIABANK serves as the lead, we are obligated to properly manage certain credits on behalf of other banks. In other group lending transactions, we must rely on another bank serving in the lead capacity to execute the respective duties and communicate relevant information on the borrower's status. In those instances where we are not the lead bank, we may not receive information that impacts our risk rating process in a timely manner, and/or have limited ability to influence situations that require resolution of a problem asset, which could result in unforeseen credit losses. In addition, shared national credits are a specific focus of regulatory examinations that can result in directed downgrades, including placement of a credit on non-accrual status, reversal of interest previously recorded as income and/or charge-offs.
Our allowance for credit losses may not be sufficient to cover actual credit losses, which could adversely affect our earnings. Events unforeseen by us could result in higher loan losses impacting our results of operations.
We maintain an allowance for credit losses (“allowance”) in an attempt to cover losses inherent in our loan portfolio (funded and unfunded). Additional loanLoan losses will likely occur in the future and may occur at a rate greater than we have experienced to date based on unanticipated adverse changes and/or new facts and circumstances which are currently not available to management as of the respective reporting period. Increases in the allowance will result in decreases in our earnings.
The determination of the allowance which represents management’s estimate of probable losses inherent in our credit portfolio, involves a high degree of judgment and complexity, and is subject to scrutiny by bank regulators. If our assumptions and judgments require modifications (e.g., creditworthiness), our current allowance may not be sufficient and adjustments may be necessary to allow for different economic conditions or adverse developments in our loan portfolio, which may have a significant impact on our financial statements. Further, changes in market factors, such as interest rates or commodity prices, could lead to increases in the allowance. While management monitors these market dynamics carefully, adverse changes to these factors could be unforeseen by management and would result in higher levels of allowance and credit losses. For example, unanticipated adjustments to management’s current expectations could have an adverse impact to the allowance as the borrower’s ability to repay within the terms of the contractual agreement may be reduced due to a lack of sufficient free cash flows, estimated collateral values may decline given the lack of market demand for collateralized assets, and the Company’s ability to monetize guarantor support may be impaired as guarantor net worth may diminish.
Commercial and commercial real estate loans generally are viewed as having more risk of default than residential real estate loans or other loans or investments. These types of loans are also typically larger than residential real estate loans and other consumer loans. Because the loan portfolio contains a significant number of commercial and commercial real estate loans with relatively large balances, the deterioration of a material amount of these loans may cause a significant increase in non-performing assets, TDRs and/or past due loans. An increase in non-performing assets, TDRs, and/or past due loans could result in a loss of earnings, an increase in the provision for credit losses, or an increase in loan charge-offs, which would have an adverse impact on our results of operations and financial condition. Our emphasis on loan growth and on increasing our portfolio of multi-family, commercial business and commercial real estate loans, as well as any future credit deterioration, could also require us to increase our allowance further in the future.
The adoption of the new accounting standard for credit losses may result in increases to the Company's allowance for credit losses and increased volatility in net income and capital.
In June 2016, the FASB issued Accounting Standards Update 2016-13, Financial Instruments - Credit Losses (ASC 326). This accounting standard replaces the current incurred loss accounting model with a current expected credit loss approach (CECL) for financial instruments measured at amortized cost and other commitments to extend credit. The amendments made by ASC 326 require entities to consider all available relevant information when estimating current expected credit losses, including details about past events, current conditions, and reasonable and supportable forecasts. The resulting allowance for credit losses is to reflect the portion of the amortized cost basis that the entity does not expect to collect. The amendments also eliminate the current accounting model for purchased credit impaired loans and debt securities. While the CECL model does not apply to available-for-sale debt securities, ASC 326 does require entities to record an allowance when recognizing credit losses for available-for-sale securities, rather than reduce the amortized cost of the securities by direct write-offs.
The Company adopted ASC 326 as of January 1, 2020. The adoption of ASC 326 will result in a higher allowance for credit losses due to the requirement to estimate lifetime expected credit losses and the remaining length of time to maturity for longer duration loans as well as higher reserves on certain acquired loans which had low reserve levels under the previous accounting guidance. While ASC 326 increased the ACL, it did not change the overall credit risk in the Company’s loan and lease portfolios or the ultimate losses therein. The Company will record a one-time adjustment to its allowance in the first quarter of 2020 equal to the difference between its allowance under the incurred loss methodology and under the CECL methodology. The transition adjustment to increase the ACL is expected to result in a decrease to the opening shareholders' equity balance, net of income taxes, of between $59.5 million and $69.7 million as of January 1, 2020. ASC 326 is likely to result in increased volatility in the Company’s net income and capital levels between reporting periods due to changes in the reasonable and supportable forecast of future economic conditions on a quarterly basis. See Note 2, Recent Accounting Pronouncements, to the Consolidated Financial Statements for further discussion of ASC 326 and the transition adjustment recorded as of January 1, 2020.
We earn a significant portion of our non-interest revenue through sales of residential mortgages in the secondary market. We are exposed to counterparty credit, market, repurchase and other risks associated with these activities.
The Company is exposed to counterparty credit risk in the normal course of mortgage banking activities as well as market risk when engaging in these activities that is greatly impacted by the amount of liquidity in the secondary markets and changes in interest rates. We attempt to hedge our market risk based on modeling assumptions. The performance of these hedges could result in a deviation from our expectation and our operating results could be materially adversely impacted. Additionally, the Company retains repurchase risk associated with sales of these loans that is related to the Company’s residential mortgage loan underwriting and closing practices. Increases in claims under these repurchase or make-whole demands, which typically arise when a borrower defaults, could have a material impact on our ability to continue participating in these types of activities as well as a material impact on our financial condition, results of operations, and cash flows.
Declines in the value of certain investment securities could require write-downs, which would reduce our earnings.
Our securities portfolio includes securities that are subject to declines in value due to negative perceptions about the health of the financial sector in general, and the lack of liquidity for securities that are real estate related.related as well as credit-related concerns about the issuer. A prolonged decline in the value of these or other securities could result in an other-than-temporary impairment write-down, which would reduce our earnings. In the case of issuer default, a permanent impairment could be required that would reduce our earnings.
REGULATORY/COMPLIANCE RISK
Changes in government regulations and legislation could limit our future performance and growth.
The banking industry is heavily regulated. We are subject to examination, supervision and comprehensive regulation by various federal and state agencies. OurThe cost of compliance is costlysignificant and restricts certain of our activities. Banking regulations are primarily intended to protect the federal deposit insurance fund, depositors, customers and the banking system as a whole, not shareholders. The burdens imposed by federal and state regulations put banks at a competitive disadvantage compared to less regulated competitors, such as finance companies, mortgage banking companies and leasing companies. Changes in the laws, regulations and regulatory practices affecting the banking industry may increase our costs of doing business or otherwise adversely affect us and create competitive advantages for others.
Future changes to the laws and regulations applicable to the financial industry, if enacted or adopted, may impact our profitability or financial condition, require more oversight or change certain of our business practices, and expose us to additional costs, including increased compliance costs. Political volatility within the federal government, both in the legislative and in the executive branch, creates significant potential for major and abrupt shifts in federal policy regarding bank regulation, taxes, and the economy, any of which could have significant impacts on our business and financial performance. We cannot predict whether any such legislative or regulatory changes, including those that could benefit our business and results of operations, will be enacted or adopted or, if they are, whether they will have a material effect on us.
We have become subject to more stringent regulatory capital requirements, which may limit our operations and potential growth or adversely affect our ability to pay dividends or to repurchase shares.
The Company and IBERIABANK are subject to the comprehensive, consolidated supervision and regulation of the FRB and the OFI, including risk-based and leverage capital requirements. We must maintain certain risk-based and leverage capital ratios as required by our banking regulators, which can change depending on general economic conditions and the Company’s particular condition, risk profile, growth plans, and regulatory capital adequacy guidelines. If at any time we fail to meet minimum established capital guidelines and/or other regulatory requirements, our financial condition would be materially and adversely affected.
In 2013,addition, the U.S. banking regulatory agencies adopted a final rule to implement the revised capital adequacy standards of the Basel Committee, or “Basel III”, and to address relevant provisions of the Dodd-Frank Act. We became subjectapplicable to the new rule on January 1, 2015,Company and certain provisions ofIBERIABANK under the new rule are being phased in from that date through January 1, 2019. The revised capital adequacy rules implement numerous requirements whichBASEL III Capital Rules require us and IBERIABANK to satisfy more stringent capital and liquidity standards than in the past.
We are required to act as a source of financial and managerial strength for our bank in times of stress.
Under federal law, we are required to act as a source of financial and managerial strength to our bank, and to commit resources to support our bank if necessary. We may be required to commit additional resources to our bank at times when we may not be in a financial position to provide such resources or when it may not be in our, or our shareholders' or our creditors’ best interests to do so. Providing such support is more likely during times of financial stress for us and our bank, which may make any capital we are required to raise to provide such support more expensive than it might otherwise be. In addition, any capital loans we make to our bank are subordinate in right of payment to depositors and to certain other indebtedness of our bank. In the event of our bankruptcy, any commitment by us to a federal banking regulator to maintain the capital of our bank will be assumed by the bankruptcy trustee and entitled to priority of payment.
Non-compliance with the USA PATRIOT Act, the Bank Secrecy Act or other laws and regulations could result in fines or sanctions against us.
The Bank Secrecy Act, as amended by the USA PATRIOT Act of 2001, requires financial institutions to design and implement programs to prevent financial institutions from being used for money laundering and terrorist activities. If such activities are detected, financial institutions are obligated to file suspicious activity reports with the U.S. Treasury Department's Office of Financial Crimes Enforcement Network. These rules require financial institutions to establish procedures for identifying and verifying the identity of customers seeking to open new financial accounts. Failure to comply with these regulations could result in fines or sanctions, including restrictions on conducting acquisitions or establishing new branches. While we have developed policies and procedures designed to assist in compliance with these laws and regulations, these policies and procedures may not be effective in preventing violations of these laws and regulations. Failure to maintain and implement adequate programs to combat money laundering and terrorist financing could also have serious reputational consequences for us, which could have a material adverse effect on our business, financial condition or results of operations.
Our use of third party vendors and our other ongoing third party business relationships are subject to increasing regulatory requirements and attention.
We regularly use third party vendors as part of our business. We also have substantial ongoing business relationships with other third parties. These types of third party relationships are subject to increasingly demanding regulatory requirements and attention by our federal bank regulators. Regulation requires us to perform due diligence and ongoing monitoring and control over our third party vendors and other ongoing third party business relationships. In certain cases we may be required to renegotiate our agreements with these vendors to meet these requirements, which could increase our costs. We expect that our regulators will hold us responsible for deficiencies in our oversight and control of our third party relationships and in the performance of the parties with which we have these relationships. As a result, if our regulators conclude that we have not exercised adequate oversight and control over our third party vendors or other ongoing third party business relationships or that such third parties have not performed appropriately, we could be subject to enforcement actions, including civil money penalties or other administrative or judicial penalties or fines as well as requirements for customer remediation, any of which could have a material adverse effect on our business, financial condition or results of operations.
Possible future increases in FDIC deposit insurance premiums would adversely affect our earnings.
We are generally unable tocannot control the amount of premiums thatassessments we arewill be required to pay for FDIC insurance. In 2011,If there are financial institution failures in the future, we may be required to pay higher FDIC assessments than we currently do, or the FDIC increased the Deposit Insurance Fund’s target reserve ratio to 2.0% of insured deposits, andmay charge additional increasesspecial assessments or require future prepayments. Increases in our assessment rate may also be required in the future to achieve this targeted ratio. In addition, ifmaintain the number of bank failuresFDIC’s designated reserve ratio at the required level. These potential increases in the future, the FDICdeposit assessments or special assessments may set higher deposit insurance premiums or impose special assessments. Any future increases in FDIC deposit insurance premiums may materially adversely affect our business, financial condition or results of operations. See the Non-interest Expense section of MD&A in this Form 10-K.
We may be adversely affected by recent changes in U.S. tax laws.
We are subject to federal and applicable state tax regulations. Such tax regulations are often complex and require interpretation and changes in these regulations could negatively impact our results of operations. In the normal course of business, we are routinely subject to examinations and challenges from federal and applicable state tax authorities regarding the amount of taxes due in connection with investments we have made and the business in which we have engaged. Recently, federal and state taxing authorities have become increasingly aggressive in challenging tax positions taken by financial institutions. These tax positions may relate to tax compliance, sales and use, franchise, gross receipts, payroll, property and income tax issues, including tax base, apportionment and tax credit planning. The enactment of the Tax Cuts and Jobs Act (the “TCJA”) on December 22, 2017challenges made significant changesby tax authorities may result in adjustments to the Internal Revenue Code, manytiming or amount of whichtaxable income or deductions or the allocation of income among tax jurisdictions. If any such challenges are highly complexmade and may require interpretations and implementing regulations. Asare not resolved in our favor, they could have a result of the TCJA’s reduction of the corporate income tax rate from 35% to 21%, we were required to write down our deferred tax assets and to record a provisional one-time charge in income tax expense in the quarter ended December 31, 2017 of approximately $51 million, which amount is subject to refinement in future periods as further information becomes available. See “Management’s Discussion and Analysis of Financial Condition and Results of Operations – Income Taxes” in Exhibit 13 to this Form 10-K. Furthermore, we may incur additional meaningful expenses (including professional fees) as the TCJA is implemented, and the expected impact of certain aspects of the statute remains unclear and subject to change.
Our reported financial results depend on our management’s selection of accounting methods and certain assumptions and estimates, and there may be changes in accounting policies or accounting standards that could adversely affect our financial condition and results of operations.
Our accounting policies and assumptions are fundamental to our reported financial condition and results of operations. Our management must exercise judgment in selecting and applying many of these accounting policies and methods so they comply with generally accepted accounting principles and reflect management’s judgment of the most appropriate manner to report our financial condition and results. Our management must also exercise judgment in selecting assumptions and estimates inherent in deriving certain financial statement line items. In some cases, management must select the accounting policy, method, assumption and/or estimate to apply from two or more alternatives, any of which may be reasonable under the circumstances, yet may result in our reporting materially different results than would have been reported under another acceptable alternative.
From time to time, the Financial Accounting Standards Board (“FASB”)FASB and the SEC change the financial accounting and reporting standards that govern the form and content of our external financial statements. Recently, the FASB has finalized new accounting standard updates related to the calculation of the allowance for credit losses and accounting for leases, amongst other ancillary finalized updates. A discussion of the recent significant accounting standard updates which have been issued are included in Note 2 to the Consolidated Financial Statements incorporated herein by reference.Statements. Accounting standard updates have the potential to alter previously issued or future financial statements depending on their deviation from current standards or industry practices and the implementation method prescribed by the FASB. In addition, accounting standard setters and those who interpret the accounting standards (such as the FASB, SEC, banking regulators and our independent registered auditors) may change or even reverse their previous interpretations or positions on how standards should be applied. Changes in financial accounting and reporting standards and changes in current interpretations may be beyond our control, can be hard to predict and could materially impact our financial condition and results of operations.
We are exposed to intangible asset risk, which could negatively impact our financial results.
In accordance with U.S. GAAP, we record assets acquired and liabilities assumed at their fair value, and, as such, business acquisitions typically result in recording goodwill. We perform a goodwill evaluation at least annually to test for goodwill impairment. As part of its testing, the Company first assesses qualitative factors to determine whether it is more likely than not that the fair value of a reporting unit is less than its carrying amount. If the Company determines the fair value of a reporting unit is less than its carrying amount using these qualitative factors or as part of the annual quantitative evaluation, the Company compares the fair value ofwill recognize a goodwill with its carrying amount, and then measures impairment loss for the amount by comparing the implied fair value of goodwill withwhich the carrying amount of the reporting unit exceeds the reporting unit’s fair value, limited to the total amount of goodwill allocated to that goodwill.reporting unit. Adverse conditions in our business climate, including a significant decline in future operating cash flows, a significant change in our stock price or market capitalization, or a deviation from our expected growth rate and performance may significantly affect the fair value of our goodwill and may trigger impairment losses, which could be material to our operating results and financial condition.
We completed such an evaluation for the Company during the fourth quarter of 20172019 and concluded that an impairment charge was not necessary for the year ended December 31, 2017.2019. We cannot provide assurance, however, that we will not be required to take an impairment charge in the future. Any impairment charge would have an adverse effect on our shareholders’ equity and financial results and could cause a decline in our stock price.
The required accounting treatment of troubled loans we acquired through acquisitions could result in higher net interest margins and interest income in current periods and lower net interest margins and interest income in future periods.
Under GAAP, we are required to record troubled loans acquired through acquisitions at fair value, which may underestimate or overestimate the actual performance of such loans. If these loans outperform our original fair value estimates,
the difference between our original estimate and the actual performance of the loan (the “discount”) is accreted into net interest income. Thus, our net interest margins may initially appear higher. Conversely, if these loans under-perform our original fair value estimates, our net interest margins would be lower than initially estimated. We expect the yields on our loans to decline as our acquired loan portfolio pays down or matures, and we expect downward pressure on our interest income to the extent that the runoff on our acquired loan portfolio is not replaced with comparable high-yielding loans. This could result in higher net interest margins and interest income in current periods and lower net interest rate margins and interest income in future periods.
OPERATIONAL RISKS
A failure in or an attack on our operational systems or infrastructure, or those of third parties, could impair our liquidity, disrupt our business, result in the unauthorized disclosure of confidential information, damage our reputation and cause financial losses.
Our business is dependent on our ability to process and monitor, on a daily basis, a large number of transactions, many of which are highly complex, across numerous and diverse markets. These transactions, as well as the information technology services we provide to clients, often must adhere to client-specific guidelines, as well as legal and regulatory standards. Due to the breadth of our client base and our geographical reach, developing and maintaining our operational systems and infrastructure is challenging, particularly as a result of rapidly evolving legal and regulatory requirements, technological shifts, integration of new platforms and third party relationships. Our financial, accounting, data processing or other operating systems and facilities, or those of our third party vendors, may fail to operate properly or become disabled as a result of events that are wholly or partially beyond our control, such as a spike in transaction volume, cyber attack or other unforeseen catastrophic events, which may adversely affect our ability to process transactions or services.
In addition, our operations rely on the secure processing, storage and transmission of confidential and other information on our computer systems and networks, as well as those of our third party vendors. Although we take protective measures to maintain the confidentiality, integrity and availability of our information and our clients’ information across all geographic and product lines, and endeavor to modify these protective measures as circumstances warrant, the nature of these threats continues to evolve. As a result, our computer systems, software and networks may be vulnerable to unauthorized access, loss or destruction of data (including confidential client information), account takeovers, unavailability of service, computer viruses or other malicious code, cyber attacks and other events that could have an adverse security impact. Despite the defensive measures we take to manage our internal technological and operational infrastructure, these threats may originate externally from third parties such as foreign governments, organized crime and other hackers, and outsource or infrastructure-support providers and application developers, or may originate internally from within our organization. Given the increasingly high volume of our transactions, certain errors may be repeated or compounded before they can be discovered and rectified.
We also face the risk of operational disruption, failure, termination or capacity constraints of any of the third parties that facilitate our business activities, including exchanges, clearing agents, clearing houses or other financial intermediaries. Such parties could also be the source of an attack on, or breach of, our operational systems, data or infrastructure. In addition, as interconnectivity with our clients grows, we increasingly face the risk of operational failure with respect to our clients’ systems.
If one or more of these cyber incidents occurs, it could potentially jeopardize the confidential, proprietary and other information processed and stored in, and transmitted through, our computer systems and networks, or otherwise cause interruptions or malfunctions in our, as well as our clients’ or other third parties’ operations, which could result in damage to our reputation, substantial costs, regulatory penalties and/or client dissatisfaction or loss. Potential costs of a cyber attack may include, but would not be limited to, remediation costs, increased protection costs, lost revenue from the unauthorized use of proprietary information or the loss of current and/or future customers, and litigation.
We maintain an insurance policy which we believe provides sufficient coverage at a manageable expense for an institution of our size and scope with similar technological systems. However, no assurance can be given that this policy would be sufficient to cover all potential financial losses, damages, penalties, including lost revenues, should we experience any one or more of our or a third party’s systems failing or experiencing attack.
The loss of certain key personnel could negatively affect our operations.
Although we have employed a significant number of additional executive officers and other key personnel, our success continues to depend in large part on the retention of a limited number of key executive management, lending and other personnel. We could undergo a difficult transition period if we were to lose the services of any of these individuals. Our success
also depends on the experience of our banking facilities’ managers and lending officers and on their relationships with the customers and communities they serve. The loss of these key persons could negatively impact the affected banking operations. The unexpected loss of key senior managers, or the inability to recruit and retain qualified personnel in the future, could have an adverse effect on our business, financial condition, or operating results.
Catastrophic events could negatively affect our local economies or disrupt our operations, which would have an adverse effect on our business or results of operations.
The occurrence of catastrophic events, including weather events and other natural disasters such as hurricanes, tropical storms, tornadoes, floods and fires, or other disasters, such as pandemics, crime, terrorism andor other acts of violence, could adversely affect our consolidated financial condition or results of operations. Such events can disrupt our operations, cause damage to our properties and negatively affect the local economies in which we operate. We cannot predict whether or to what extent damage that may be caused by these catastrophes will affect our operations or the economies in our market areas, but such events could result in a decline in loan originations, a decline in the value or destruction of properties securing our loans and an increase in payment delinquencies, foreclosures and loan losses.
We may be subject to increased litigation which could result in legal liability and damage to our reputation.
The Company and IBERIABANK have been named from time to time as defendants in class actions and other litigation relating to our businesses and activities. Litigation may include claims for substantial compensatory or punitive damages or claims for indeterminate amounts of damages. We and our subsidiaries are also involved from time to time in other reviews, investigations and proceedings (both formal and informal) by governmental and self-regulatory agencies regarding our business. These matters also could result in adverse judgments, settlements, fines, penalties, injunctions or other relief.
In addition, in recent years, a number of judicial decisions have upheld the right of borrowers to sue lending institutions on the basis of various evolving legal theories, collectively termed “lender liability.” Generally, lender liability is founded on the premise that a lender has either violated a duty, whether implied or contractual, of good faith and fair dealing owed to the borrower or has assumed a degree of control over the borrower resulting in the creation of a fiduciary duty owed to the borrower or its other creditors or shareholders.
Substantial legal liability or significant regulatory action against us, including our subsidiaries, could materially adversely affect our business, financial condition or results of operations, or cause significant harm to our reputation.
STRATEGIC/REPUTATIONAL RISKS
The success of our financial institution acquisitions will depend on a number of uncertain factors.
The success of our financial institution acquisitions depends on a number of factors, including, without limitation:
Our ability to integrate the businesses acquired into IBERIABANK’s current operations, including the conversion of customer loan and deposit data from the acquired banks’ data processing systems to our data processing systems;
Our ability to limit the outflow of deposits held by our new customers in the acquired businesses and to successfully retain and manage interest-earning assets (i.e., loans) acquired;
Our ability to attract new deposits and to generate new interest-earning assets in the geographic areas previously served by the acquired businesses;
Our ability to effectively compete in new markets in which we did not previously have a presence;
Our success in deploying the cash acquired in these transactions into assets bearing sufficiently high yields without incurring unacceptable risk;
Our ability to control the incremental non-interest expense from the acquired businesses in a manner that enables us to maintain a favorable overall efficiency ratio;
Our ability to retain and attract the appropriate personnel to staff and maintain the acquired businesses; and
Our ability to earn acceptable levels of interest and non-interest income, including fee income, from the acquired businesses.
In any acquisition involving a financial institution, particularly one involving the transfer of a large number ofbranches and/or customers, there may be business and service changes and disruptions, including delays or errors in the data conversion process, that result in the loss of customers or cause customers to close their accounts and move their business to competing financial institutions. Integration of such acquired businesses is an operation of substantial size and expense, and may be impacted by general market and economic conditions or government actions affecting the financial services industry. Integration efforts also are likely to divert our management’s attention and resources. No assurance can be given that we will be able to integrate these acquired businesses successfully. The integration process could also result in the loss of key employees, the disruption of ongoing business, or inconsistencies in standards, controls, procedures and policies that adversely affect our ability to maintain relationships with clients, customers, depositors and employees or to achieve the anticipated benefits of bank acquisitions. Further, we may encounter unexpected difficulties or costs during the integration that could adversely affect our earnings and financial condition, perhaps materially. Additionally, no assurance can be given that the operation of acquired businesses will not adversely affect our existing profitability, that we will be able to achieve results in the future similar to those achieved by our existing banking business, that we will be able to compete effectively in the market areas currently served by the acquired businesses, or that we will be able to manage any growth resulting from financial institution acquisitions effectively.
Our ability to grow acquired businesses following these transactions depends in part on our ability to retain certain key personnel we expect to hire and/or retain in connection with these transactions. We believe that the ties these employees have in the local banking markets previously served by their acquired businesses are vital to our ability to maintain our relationships with existing customers and to generate new business in these markets. Our failure to hire or retain these employees could adversely affect the success of these transactions and our future growth.
Our ability to achieve and maintain expense reduction and earnings enhancement initiatives may be adversely affected by external factors not within our control.
We continuously assess opportunities for expense reduction and revenue enhancement to improve annual returns. While many of the elements necessary to achieve certain initiatives are within our control, others such as interest rates and prevailing economic conditions, which influence expenses and revenues, depend on external factors not within our control, and there can be no assurance that external factors will not materially adversely affect our ability to fully implement and accomplish past and future initiatives.
We face substantial competition and are subject to certain regulatory constraints not applicable to some of our competitors, whichmay decrease our growth or profits.
We face substantial competition for deposits, and for credit, title and trust relationships, and other financial services and products in the communities we serve. Competing providers include other banks, thrifts and trust companies, insurance companies, mortgage banking operations, credit unions, finance companies, title companies, money market funds and other financial and nonfinancial companies which may offer products functionally equivalent to those offered by us. Competing providers may have greater financial resources than we do and offer services within and outside the market areas we serve. In addition to this challenge of attracting and retaining customers for traditional banking services, our competitors include securities dealers, brokers, mortgage bankers, investment advisors and finance and insurance companies who seek to offer one-stop financial services to their customers that may include services that financial institutions have not been able or allowed to offer to their customers in the past. The increasingly competitive environment is primarily a result of changes in regulation, changes in technology and product delivery systems and the accelerating pace of consolidation among financial service providers. If we are unable to adjust both to increased competition for traditional banking services and changing customer needs and preferences, our financial performance could be adversely affected.
Some of our competitors, including credit unions, are not subject to certain regulatory constraints, such as the Community Reinvestment Act, which, among other things, requires us to implement procedures to make and monitor loans throughout the communities we serve. Credit unions also have federal tax exemptions that may allow them to offer lower rates on loans and higher rates on deposits than taxpaying financial institutions such as commercial banks. In addition, non-depository institution competitors are generally not subject to the extensive regulation applicable to institutions, like IBERIABANK, that offer federally insured deposits. Other institutions may have other competitive advantages in particular markets or may be willing to accept lower profit margins on certain products. These differences in resources, regulation, competitive advantages, and business strategy may decrease our net interest margin, may increase our operating costs, and may make it harder for us to compete profitably.
Our success depends on our ability to respond to the threats and opportunities of fintech innovation.
Fintech developments, such as bitcoin, have the potential to disrupt the financial industry and change the way banks do business. Investment in new technology to stay competitive would result in significant costs and increased risks of cyber security attacks. Our success depends on our ability to adapt to the pace of the rapidly changing technological environment, which is crucial to retention and acquisition of customers.
We experience increasing competition from nonbank companies, including technology companies, both inside and outside of our market area. Many technology companies have focused on the financial sector and now offer a broad variety of software and payment products primarily over the Internet, with a focus on mobile device delivery. These companies generally are not subject to regulatory burdens comparable to those applicable to banks and may accordingly offer products and services at more favorable rates and with greater convenience to the customer. This competition by technology companies could cause regulated depository institutions such as the Bank to lose fee income as well as customer deposits and related income.
On July 31, 2018, the Office of the Comptroller of the Currency announced that it would begin accepting applications for a special purpose national bank charter from nondepository “fintech” companies engaged in core banking activities, such as paying checks or lending money. Ongoing legal challenges by state banking regulators, however, have delayed the use of the special purpose fintech charter, and the U.S. District Court for the Southern District of New York has ruled in a recent decision that the Office of the Comptroller of the Currency does not have the authority to grant a bank charter to a nonbank entity that is not eligible for federal deposit insurance. While the future of the federal special purpose bank charter is in doubt, it would, if widely implemented, allow fintech companies to operate nationwide under a single set of national standards, without needing to seek state-by-state licenses or joining with brick-and-mortar banks, and would therefore allow fintech companies to more easily compete with us for financial products and services in the communities we serve.
Reputational risk and social factors may impact our results.
Our ability to originate and maintain accounts is highly dependent upon consumer and other external perceptions of our business practices and/or our financial health. Adverse perceptions regarding our business practices and/or our financial health could damage our reputation in both the customer and funding markets, leading to difficulties in generating and maintaining accounts as well as in financing them. Adverse developments with respect to the consumer or other external perceptions regarding the practices of our competitors, or our industry as a whole, may also adversely impact our reputation. In addition, adverse reputational impacts on third parties with whom we have important relationships may also adversely impact our reputation. Adverse impacts to our reputation, or the reputation of our industry, may lead to greater regulatory and/or legislative scrutiny and litigation risk. We carefully monitor internal and external developments for areas of potential reputational risk and have established governance structures to assist in evaluating such risks in our business practices and decisions.
RISKS ABOUT OUR SECURITIES
We are a holding company and depend on our subsidiaries for dividends, distributions and other payments.
There can be no assurance of whether or when we may pay dividends in the future. Cash available to pay dividends to our shareholders is derived primarily, if not entirely, from dividends paid to us from our subsidiaries. Cash available to pay dividends to our shareholders is derived primarily, if not entirely, from dividends paid to us from our subsidiary bank, IBERIABANK. The ability of our subsidiary bank to pay dividends to us as well as our ability to pay dividends to our shareholders is limited by regulatory and legal restrictions and the need to maintain sufficient consolidated capital. In addition, if we fail to satisfy the minimum capital conservation buffer requirement, we will be subject to certain limitations, which include restrictions on capital distributions. We may also decide to limit the payment of dividends even when we have the legal ability to pay them in order to retain earnings for use in our business. Further, any lenders making loans to us may impose financial covenants that may be more restrictive than regulatory requirements with respect to the payment of dividends.
We are prohibited from paying dividends on our common stock if the required payments on our subordinated debentures have not been made. Additionally, dividends on our common stock could be adversely impacted if dividend payments on our preferred stock have not been made.
Although we have paid cash dividends on shares of our common stock in the past, we may not pay cash dividends on shares of our common stock in the future.
Holders of shares of our common stock are only entitled to receive such dividends as our board of directors may declare out of funds legally available for such purpose. We have a history of paying dividends to our shareholders. However, future cash dividends will depend upon our results of operations, financial condition, cash requirements, the need to maintain adequate capital levels, the need to comply with safe and sound banking practices as well as meet regulatory expectations, and other factors, including the ability of our subsidiaries to make distributions to us, which ability may be restricted by statutory, contractual or other constraints. There can be no assurance that we will continue to pay dividends even if the necessary financial conditions are met and if sufficient cash is available for distribution. See Note 13 and Note 15 to the consolidated financial statementsConsolidated Financial Statements for further discussion on factorsfactors impacting or restricting our ability to pay dividendsdividends.
Our common stock and our preferred stock are subordinate to our existing and future indebtedness.
Shares of our common stock and our Series B, Series C, and Series CD preferred stock are equity interests and do not constitute indebtedness of the Company. This means that shares of the common stock and depositary shares, which represent fractional interests in shares of Series B, Series C, and Series CD preferred stock, rank junior to all our existing and future indebtedness and our other non-equity claims with respect to assets available to satisfy claims against us, including claims in the event of our liquidation. We are prohibited from paying dividends on any of our capital stock if the required payments on our subordinated debentures have not been made.
Our common stock is subordinate to our existing and future preferred stock.
The Company has outstanding Series B, Series C and Series CD preferred stock that is senior to the common stock and could adversely affect the ability of the Company to declare or pay dividends or distributions of common stock. Under the terms of the Series B, Series C and Series CD preferred stock, the Company is prohibited from paying dividends on its common stock unless all full dividends for the latest dividend period on all outstanding shares of Series B, Series C and Series CD preferred stock have been declared and paid in full or declared and a sum sufficient for the payment of those dividends has been set aside. Furthermore, if the Company experiences a material deterioration in its financial condition, liquidity, capital, results of operations or risk profile, the Company’s regulators may not permit it to make future payments on its Series B, Series C and Series CD preferred stock, thereby preventing the payment of dividends on the common stock.
We may issue debt and/or equity securities, or securities convertible into equity securities, any of which may be senior to our existing preferred and common stock as to distributions and in liquidation, and such an issuance could negatively affect the value of our common and preferred stock.
In the future, we may attempt to increase our capital resources by entering into debt or debt-like financing that is unsecured or secured by all or up to all of our assets, or by issuing additional debt or equity securities, which could include issuances of secured or unsecured commercial paper, medium-term notes, senior notes, subordinated notes, preferred stock, or securities convertible into or exchangeable for equity securities. In the event of our liquidation, our lenders and holders of our debt and
preferred securities would receive a distribution of our available assets before distributions to the holders of our common stock. Subject to certain conditions, holders of future potential issuances of another class of preferred stock may be entitled to preferences over the Series B, Series C and Series CD preferred stock. Because our decision to incur debt and issue securities in our future offerings will depend on market conditions and other factors beyond our control, we cannot predict or estimate the amount, timing or nature of our future offerings and debt financings. Further, market conditions could require us to accept less favorable terms for the issuance of our securities in the future.
The trading history of our common stock is characterized by modest trading volume.
Our common stock trades on the NASDAQ Global Select Market. During 2017,2019, the average daily trading volume of our common stock was approximately 445,000346,000 shares. The average daily trading volume of our depositary shares, which represent fractional shares of our Series B preferred stock, was approximately 5,500 shares. In addition,4,000 shares; the average daily trading volume of our depositary shares, which represent fractional shares of our Series C preferred stock, hadwas approximately 7,000 shares; and the average daily trading volume of our depositary shares, which represent fractional shares of our Series D preferred stock, was approximately 3,30030,000 shares.
We cannot predict the extent to which investor interest in us will lead to a more active trading market in our securities or how much more liquid these markets might become. A public trading market having the desired characteristics of depth, liquidity and orderliness depends upon the presence in the marketplace of willing buyers and sellers of our securities at any given time, which presence is dependent upon the individual decisions of investors, over which we have no control.
The market price of our securities can be volatile.
The market prices of our common and preferred stock may be highly volatile and subject to wide fluctuations in response to many factors, including, but not limited to, the factors discussed in other risk factors and the following:
actual or unanticipated fluctuations in our operating results;
changes in interest rates;
changes in the legal or regulatory environment in which we operate;
press releases, announcements or publicity relating to us or our competitors or relating to trends in our industry;
changes in expectations as to our future financial performance, including financial estimates or recommendations by securities analysts and investors;
future sales of our securities;
changes in economic conditions in our marketplace, general conditions in the U.S. economy, financial markets or the banking industry; and
other developments affecting our competitors or us.
These factors may adversely affect the trading prices of our securities, regardless of our actual operating performance, and could prevent our shareholders from selling their securities at or above the public offering price. In addition, the stock markets, from time to time, experience extreme price and volume fluctuations that may be unrelated or disproportionate to the operating performance of companies. These broad fluctuations may adversely affect the market prices of our securities, regardless of our trading performance.
In the past, shareholders have brought securities class action litigation against a company following periods of volatility in the market price of its securities. We may be the target of similar litigation in the future, which could result in substantial costs and divert management’s attention and resources.
MERGER-RELATED RISKS
Because the market price of First Horizon common stock may fluctuate, holders of IBKC common stock cannot be certain of the market value of the merger consideration they will receive.
In the merger, each share of IBKC common stock issued and outstanding immediately prior to the effective time (other than certain shares held by First Horizon or IBKC) will be converted into 4.584 shares of First Horizon common stock. This exchange ratio is fixed and will not be adjusted for changes in the market price of either First Horizon common stock or IBKC common stock. Changes in the price of First Horizon common stock between now and the time of the merger will affect the value that holders of IBKC common stock will receive in the merger. Neither First Horizon nor IBKC is permitted to terminate the merger agreement as a result of any increase or decrease in the market price of First Horizon common stock or IBKC common stock.
Stock price changes may result from a variety of factors, including general market and economic conditions, changes in IBKC’s and First Horizon’s businesses, operations and prospects and regulatory considerations, many of which factors are beyond IBKC’s control. Therefore, at the time of the IBKC special meeting, holders of IBKC common stock will not know the market value of the consideration that IBKC shareholders will receive at the effective time. You should obtain current market quotations for shares of IBKC common stock.
The market price of First Horizon common stock after the merger may be affected by factors different from those affecting the shares of IBKC common stock or First Horizon common stock currently.
In the merger, holders of IBKC common stock will become holders of First Horizon common stock. First Horizon’s business differs from that of IBKC. Accordingly, the results of operations of the combined company and the market price of First Horizon common stock after the completion of the merger may be affected by factors different from those currently affecting the independent results of operations of each of First Horizon and IBKC.
Combining First Horizon and IBKC may be more difficult, costly or time consuming than expected and IBKC may fail to realize the anticipated benefits of the merger.
Thesuccess of the merger will depend, in part, on the ability to realize the anticipated cost savings from combining the businesses of First Horizon and IBKC. To realize the anticipated benefits and cost savings from the merger, First Horizon and IBKC must integrate and combine their businesses in a manner that permits those cost savings to be realized, without adversely affecting current revenues and future growth. If First Horizon and IBKC are not able to successfully achieve these objectives, the anticipated benefits of the merger may not be realized fully or at all or may take longer to realize than expected. In addition, the actual cost savings of the merger could be less than anticipated, and integration may result in additional and unforeseen expenses.
An inability to realize the full extent of the anticipated benefits of the merger and the other transactions contemplated by the merger agreement, as well as any delays encountered in the integration process, could have an adverse effect upon the revenues, levels of expenses and operating results of the combined company, which may adversely affect the value of the common stock of the combined company after the completion of the merger.
First Horizon and IBKC have operated and, until the completion of the merger, must continue to operate, independently. It is possible that the integration process could result in the loss of key associates, the disruption of each company’s ongoing businesses or inconsistencies in standards, controls, procedures and policies that adversely affect the companies’ ability to maintain relationships with clients, customers, depositors and associates or to achieve the anticipated benefits and cost savings of the merger. Integration efforts between the two companies may also divert management attention and resources. These integration matters could have an adverse effect on IBKC during this transition period and for an undetermined period after completion of the merger on the combined company.
Furthermore, the board of directors and executive leadership of the combined company will consist of former directors and executive officers from each of First Horizon and IBKC. Combining the boards of directors and management teams of each company into a single board and a single management team could require the reconciliation of differing priorities and philosophies.
The combined company may be unable to retain First Horizon and/or IBKC personnel successfully after the merger is completed.
The success of the merger will depend in part on the combined company’s ability to retain the talents and dedication of key associates currently employed by IBKC. It is possible that these associates may decide not to remain with IBKC while the merger is pending or with the combined company after the merger is consummated. If IBKC is unable to retain key associates, including management, who are critical to the successful integration and future operations of the company, IBKC could face disruptions in its operations, loss of existing customers, loss of key information, expertise or know-how and unanticipated additional recruitment costs. In addition, if key associates terminate their employment, the combined company’s business activities may be adversely affected and management’s attention may be diverted from successfully integrating First Horizon and IBKC to hiring suitable replacements, all of which may cause the combined company’s business to suffer. In addition, IBKC may not be able to locate or retain suitable replacements for any key associates who leave.
Regulatory approvals may not be received, may take longer than expected or may impose conditions that are not presently anticipated or that could have an adverse effect on the combined company following the merger.
Before the merger may be completed, various approvals, consents and non-objections must be obtained from the Federal Reserve Board and various other bank regulatory, antitrust, insurance and other authorities in the United States. In determining whether to grant these approvals, such regulatory authorities consider a variety of factors, including the regulatory standing of each party. These approvals could be delayed or not obtained at all, including due to: an adverse development in either party’s regulatory standing or in any other factors considered by regulators when granting such approvals; governmental, political or community group inquiries, investigations or opposition; or changes in legislation or the political environment generally. The Federal Reserve Board has stated that if material weaknesses are identified by examiners before a banking organization applies to engage in expansionary activity, the Federal Reserve Board will expect the banking organization to resolve all such weaknesses before applying for such expansionary activity. The Federal Reserve Board has also stated that if issues arise during the processing of an application for expansionary activity, it will expect the applicant banking organization to withdraw its application pending resolution of any supervisory concerns.
The approvals that are granted may impose terms and conditions, limitations, obligations or costs, or place restrictions on the conduct of the combined company’s business or require changes to the terms of the transactions contemplated by the merger agreement. There can be no assurance that regulators will not impose any such conditions, limitations, obligations or restrictions and that such conditions, limitations, obligations or restrictions will not have the effect of delaying the completion of any of the transactions contemplated by the merger agreement, imposing additional material costs on or materially limiting the revenues of the combined company following the merger or otherwise reduce the anticipated benefits of the merger if the merger were consummated successfully within the expected timeframe. In addition, there can be no assurance that any such conditions, terms, obligations or restrictions will not result in the delay or abandonment of the merger. Additionally, the completion of the merger is conditioned on the absence of certain orders, injunctions or decrees by any court or regulatory agency of competent jurisdiction that would prohibit or make illegal the completion of any of the transactions contemplated by the merger agreement.
In addition, despite the parties’ commitments to use their reasonable best efforts to comply with conditions imposed by regulators, under the terms of the merger agreement, neither IBKC will be required, and neither party will be permitted without the prior written consent of the other party, to take actions or agree to conditions that would reasonably be expected to have a material adverse effect on the combined company and its subsidiaries, taken as a whole, after giving effect to the merger.
Holders of IBKC common stock should be aware that some of IBKC’s directors and executive officers may have interests in the merger and have arrangements that are different from, or in addition to, those of holders of IBKC common stock. These interests and arrangements may create potential conflicts of interest. The IBKC board of directors was aware of these respective interests and considered these interests, among other matters, when making its decision to approve the merger agreement, and in recommending that holders of common stock vote to approve the merger agreement.
The merger agreement may be terminated in accordance with its terms, and the merger may not be completed.
The merger agreement is subject to a number of conditions which must be fulfilled in order to complete the merger. Those conditions include: (i) the approval of the First Horizon merger proposal and the First Horizon charter amendment proposal by the requisite vote of the First Horizon shareholders; (ii) the approval of the IBKC merger proposal by the requisite vote of the IBKC shareholders; (iii) authorization for listing on the NYSE of the shares of First Horizon common stock and rollover First Horizon preferred stock (or depositary shares in respect thereof) to be issued in the merger; (iv) the receipt of all required regulatory approvals which are necessary to close the merger and the bank merger and the expiration of all statutory waiting periods without the imposition of any materially burdensome regulatory condition; (v) the effectiveness of the registration statement on Form S-4 and the absence of a stop order or proceeding initiated or threatened by the SEC for that purpose; (vi) the absence of any order, injunction, decree or other legal restraint preventing the completion of the merger or any of the other transactions contemplated by the merger agreement or making the completion of the merger illegal; (vii) subject to certain exceptions, the accuracy of the representations and warranties of each party, generally subject to a material adverse effect qualification; (viii) the prior performance in all material respects by each party of the obligations required to be performed by it at or prior to the closing date; and (ix) receipt by each party of an opinion from its counsel to the effect that the merger will qualify as a reorganization within the meaning of Section 368(a) of the Code.
These conditions to the closing may not be fulfilled in a timely manner or at all, and, accordingly, the merger may not be completed. In addition, the parties can mutually decide to terminate the merger agreement at any time, before or after shareholder approval, or First Horizon or IBKC may elect to terminate the merger agreement in certain other circumstances.
Failure to complete the merger could negatively impact IBKC.
If the merger agreement is not completed for any reason, including as a result of First Horizon shareholders failing to approve either the First Horizon merger proposal or IBKC shareholders failing to approve the IBKC merger proposal, there may be various adverse consequences and IBKC may experience negative reactions from the financial markets and from its customers and associates. For example, IBKC’s business may have been impacted adversely by the failure to pursue other beneficial opportunities due to the focus of management on the merger, without realizing any of the anticipated benefits of completing the merger. Additionally, if the merger agreement is terminated, the market price of IBKC common stock could decline to the extent that current market prices reflect a market assumption that the merger will be beneficial and will be completed. IBKC also could be subject to litigation related to any failure to complete the merger or to proceedings commenced against IBKC to perform its obligations under the merger agreement. If the merger agreement is terminated under certain circumstances, IBKC may be required to pay a termination fee of $156 million to First Horizon.
Additionally, IBKC has incurred and will incur substantial expenses in connection with the negotiation and completion of the transactions contemplated by the merger agreement, as well as the costs and expenses of preparing, filing, printing and mailing a joint proxy statement/prospectus, and all filing and other fees paid in connection with the merger. If the merger is not completed, IBKC would have to pay these expenses without realizing the expected benefits of the merger.
IBKC will be subject to business uncertainties and contractual restrictions while the merger is pending.
Uncertainty about the effect of the merger on associates and customers may have an adverse effect on IBKC. These uncertainties may impair IBKC’s ability to attract, retain and motivate key personnel until the merger is completed, and could cause customers and others that deal with IBKC to seek to change existing business relationships with IBKC. In addition, subject to certain exceptions, IBKC has agreed to operate its business in the ordinary course prior to the closing, and IBKC is restricted from making certain acquisitions and taking other specified actions without the consent of First Horizon until the merger is completed. These restrictions may prevent IBKC from pursuing attractive business opportunities that may arise prior to the completion of the merger.
The merger agreement contains provisions that could discourage a potential competing acquirer that might be willing to pay more to acquire or merge with IBKC.
The merger agreement contains provisions that restrict IBKC’s ability to, among other things, initiate, solicit, knowingly encourage or knowingly facilitate, inquiries or proposals with respect to, or, subject to certain exceptions generally related to the exercise of fiduciary duties by its board of directors, engage in any negotiations concerning, or provide any confidential or nonpublic information or data relating to, any alternative acquisition proposals. These provisions, which include a $156 million termination fee payable under certain circumstances, might discourage a potential competing acquirer that might have an interest in acquiring all or a significant part of IBKC from considering or proposing that acquisition even if, in the case of a potential acquisition of IBKC, it were prepared to pay consideration with a higher per share price to IBKC shareholders than what is contemplated in the merger, or might result in a potential competing acquirer proposing to pay a lower per share price to acquire IBKC than it might otherwise have proposed to pay.
The shares of First Horizon common stock to be received by holders of IBKC common stock as a result of the merger will have different rights from the shares of IBKC common stock.
In the merger, holders of IBKC common stock will become holders of First Horizon common stock and their rights as shareholders will be governed by Tennessee law and the governing documents of the combined company. The rights associated with First Horizon common stock are different from the rights associated with IBKC common stock.
IBKC will incur transaction and integration costs in connection with the merger.
IBKC has incurred and expects to incur significant, non-recurring costs in connection with negotiating the merger agreement and closing the merger. In addition, the combined company will incur integration costs following the completion of the merger as First Horizon and IBKC integrate their businesses, including facilities and systems consolidation costs and employment-related costs. There can be no assurances that the expected benefits and efficiencies related to the integration of the businesses will be realized to offset these transaction and integration costs over time. IBKC may also incur additional costs to maintain associate morale and to retain key associates. IBKC will also incur significant legal, financial advisory, accounting, banking and consulting fees, fees relating to regulatory filings and notices, SEC filing fees, printing and mailing fees and other costs associated with the merger. Some of these costs are payable regardless of whether the merger is completed.
In connection with the merger, First Horizon will assume IBKC’s outstanding debt obligations and preferred stock, and the combined company’s level of indebtedness following the completion of the merger could adversely affect the combined company’s ability to raise additional capital and to meet its obligations under its existing indebtedness.
In connection with the merger, First Horizon will assume IBKC’s outstanding indebtedness and IBKC’s obligations related to its outstanding preferred stock. First Horizon’s existing debt, together with any future incurrence of additional indebtedness, and the assumption of IBKC’s outstanding preferred stock, could have important consequences for the combined company’s creditors and the combined company’s shareholders. For example, it could:
limit the combined company’s ability to obtain additional financing for working capital, capital expenditures, debt service requirements, acquisitions and general corporate or other purposes;
restrict the combined company from making strategic acquisitions or cause the combined company to make non-strategic divestitures;
restrict the combined company from paying dividends to its shareholders;
increase the combined company’s vulnerability to general economic and industry conditions; and
require a substantial portion of cash flow from operations to be dedicated to the payment of principal and interest on the combined company’s indebtedness and dividends on the preferred stock, thereby reducing the combined company’s ability to use cash flows to fund its operations, capital expenditures and future business opportunities.
Following completion of the merger, holders of First Horizon common stock will be subject to the prior dividend and liquidation rights of the holders of the First Horizon preferred stock and the rollover First Horizon preferred stock that First Horizon will issue upon completion of the merger. Holders of shares of IBKC preferred stock, which will be converted into rollover First Horizon preferred stock, as well as holders of shares of First Horizon preferred stock and any shares of preferred stock that First Horizon may issue in the future, would receive, upon the combined company’s voluntary or involuntary liquidation, dissolution or winding up, before any payment is made to holders of First Horizon common stock, their liquidation preferences as well as any accrued and unpaid distributions. These payments would reduce the remaining amount of the combined company’s assets, if any, available for distribution to holders of its common stock.
General market conditions and unpredictable factors, including conditions and factors different from those affecting IBKC preferred stock and IBKC depositary shares currently, could adversely affect market prices for rollover First Horizon preferred stock and rollover First Horizon depositary shares once the rollover First Horizon preferred stock is issued
There can be no assurance about the market prices for the rollover First Horizon preferred stock that will be issued upon completion of the merger or the rollover First Horizon depositary shares. Several factors, many of which are beyond the control of First Horizon, could influence the market prices of the rollover First Horizon preferred stock and the rollover First Horizon depositary shares, including:
whether the combined company declares or fails to declare dividends on the rollover First Horizon preferred stock from time to time;
real or anticipated changes in the credit ratings assigned to the rollover First Horizon preferred stock and the rollover First Horizon depositary shares or other First Horizon securities;
the combined company’s creditworthiness;
interest rates;
developments in the securities, credit and housing markets, and developments with respect to financial institutions generally;
the market for similar securities; and
economic, corporate, securities market, geopolitical, regulatory or judicial events that affect the combined company, the banking industry or the financial markets generally.
Shares of rollover First Horizon preferred stock will be equity interests and will not constitute indebtedness. As such, rollover First Horizon preferred stock and rollover First Horizon depositary shares will rank junior to all indebtedness of, and other non-equity claims on, the combined company with respect to assets available to satisfy claims. The market prices for the rollover First Horizon preferred stock and rollover First Horizon depositary shares following the merger may be affected by factors different from those currently affecting the IBKC preferred stock and IBKC depositary shares.
Holders of IBKC common stock will have a reduced ownership and voting interest in the combined company after the merger and will exercise less influence over management.
Holders of IBKC common stock currently have the right to vote in the election of the board of directors and on other matters affecting IBKC. When the merger is completed, each IBKC shareholder will become a shareholder of First Horizon, and each holder of First Horizon common stock and each holder of IBKC common stock will become a holder of common stock of the combined company, with a percentage ownership of the combined company that is smaller than the shareholder’s percentage ownership of either First Horizon or IBKC individually, as applicable, prior to the consummation of the merger. Based on the number of shares of First Horizon and IBKC common stock outstanding as of December 31, 2019, and based on the number of shares of First Horizon common stock expected to be issued in the merger, the former holders of IBKC common stock, as a group, are estimated to own approximately forty-four percent (44%) of the outstanding shares of the combined company immediately after the merger and current holders of First Horizon common stock as a group are estimated to own approximately fifty-six percent (56%) of the outstanding shares of the combined company immediately after the merger. Because of this, holders of IBKC common stock may have less influence on the management and policies of the combined company than they now have on the management and policies of IBKC.
Holders of IBKC common stock will not have dissenters’ rights or appraisal rights in the merger.
Appraisal rights (also known as dissenters’ rights) are statutory rights that, if applicable under law, enable shareholders to dissent from an extraordinary transaction, such as a merger, and to demand that the corporation pay the fair value for their shares as determined by a court in a judicial proceeding instead of receiving the consideration offered to shareholders in connection with the extraordinary transaction.
Under Part 13 of the LBCA, the holders of IBKC common stock will not be entitled to appraisal rights in connection with the merger if, on the record date for the IBKC special meeting, IBKC’s shares are traded in an organized market that has at least two thousand (2,000) shareholders and a market value of at least $20 million. IBKC common stock is currently listed on the NASDAQ, a national securities exchange, and is expected to continue to be so listed on the record date for the IBKC special meeting. Accordingly, the holders of IBKC common stock are not entitled to any appraisal rights in connection with the merger.
Holders of record of IBKC preferred stock are entitled to exercise appraisal rights in connection with the merger, provided the proper procedures of Part 13 of the LBCA are followed. DTC, as nominee for the depository, is the holder of record of the shares of IBKC preferred stock as of the date of this Report.
The IBKC depositary shares are not a class or series of shares issued by IBKC and thus appraisal rights under Part 13 of the LBCA do not independently apply to the depositary shares. Accordingly, to exercise or to direct the depository to exercise appraisal rights with respect to the IBKC preferred stock, holders of depositary shares will be required to follow the procedures provided by the depository with respect thereto and in accordance with requirements of Louisiana law.
Shareholder litigation could prevent or delay the completion of the merger or otherwise negatively impact the business and operations of IBKC.
Shareholders of IBKC may file lawsuits against IBKC and/or the directors and officers of IBKC in connection with the merger. One of the conditions to the closing is that no order, injunction or decree issued by any court or governmental entity of competent jurisdiction or other legal restraint preventing the consummation of the merger or any of the other transactions contemplated by the merger agreement be in effect. If any plaintiff were successful in obtaining an injunction prohibiting IBKC defendants from completing the merger pursuant to the merger agreement, then such injunction may delay or prevent the effectiveness of the merger and could result in significant costs to IBKC, including any cost associated with the indemnification of directors and officers of each company. If a lawsuit is filed, IBKC may incur costs in connection with the defense or settlement of any shareholder lawsuits filed in connection with the merger. Such litigation could have an adverse effect on the financial condition and results of operations of IBKC and could prevent or delay the completion of the merger.
| Item 1B. | UNRESOLVED STAFF COMMENTS |
None.
| Item 2. |
As of December 31, 2017,2019, we operated 335321 combined offices,locations, including 228191 bank branch offices and onethree loan production officeoffices in Louisiana, Arkansas, Tennessee, Alabama, Texas, Florida, Georgia, and South Carolina, 24North Carolina, Mississippi, Missouri, and New York, 28 title insurance offices in Arkansas, Tennessee, and Louisiana, and mortgage representatives in 6884 locations in 10 states, thirteen12 states. The Company also has 14 wealth management locations in fourfive states and one IBERIA Capital Partners, L.L.C.LLC office in Louisiana. Office locations are either owned or leased. For offices in premises leased by us or our subsidiaries, rent expense totaled $19.1$27.3 million in 2017.2019. During 2017,2019, we and our subsidiaries received $2.4$2.3 million in rental income for space leased to others. At December 31, 2017,2019, there were no significant encumbrances on the offices, equipment and other operational facilities owned by us and our subsidiaries.
Additional information on our premises and leasing activity is provided in Note 87 and Note 10 to the Consolidated Financial Statements incorporated herein by reference to Exhibit 13 of this Form 10-K.Statements.
| Item 3. |
The nature of the business of IBKC’sthe Company’s banking and other subsidiaries ordinarily results in a certain amount of claims, litigation, investigations and legal and administrative cases and proceedings, all of which are considered incidental to the normal conduct of business. Some of these claims are against entities or assets of which IBKCthe Company is a successor or acquired in business acquisitions. IBKCThe Company believes it has meritorious defenses to the claims asserted against it in its currently outstanding legal proceedings and, with respect to such legal proceedings, intends to continue to defend itself vigorously, litigating or settling cases according to management’s judgment as to what is in the best interest of IBKCthe Company and its shareholders.
| Item 4. |
Not applicable.
SUPPLEMENTAL PART I INFORMATION
Information About Our Executive Officers
The following table sets forth the name of each current executive officer and the principal position he or she holds.
| Name | Age | Position | ||
| Daryl G. Byrd | 65 | President and Chief Executive Officer | ||
| Michael J. Brown | 56 | Vice Chairman and Chief Operating Officer | ||
| Jefferson G. Parker | 67 | Vice Chairman and Director of Capital Markets, Energy Lending, and Investor Relations | ||
| Fernando Perez-Hickman | 52 | Vice Chairman and Director of Corporate Strategy | ||
| Anthony J. Restel | 50 | Vice Chairman and Chief Financial Officer | ||
| Terry L. Akins | 56 | Senior Executive Vice President and Chief Risk Officer | ||
| Elizabeth A. Ardoin | 50 | Senior Executive Vice President and Director of Communications, Corporate Real Estate, and Human Resources | ||
| J. Randolph Bryan | 51 | Executive Vice President, Director of Business Transformation | ||
| Robert M. Kottler | 61 | Executive Vice President and Director of Retail, Small Business, and Mortgage | ||
| M. Scott Price | 42 | Executive Vice President, Corporate Controller, and Chief Accounting Officer | ||
| Monica R. Sylvain | 51 | Executive Vice President and Chief Diversity Officer | ||
| Robert B. Worley, Jr. | 59 | Executive Vice President, General Counsel, and Corporate Secretary | ||
| Nicolas Young | 43 | Executive Vice President and Chief Credit Officer | ||
DARYL G. BYRD has served as President since 1999 and as Chief Executive Officer since 2000. He also serves as President and Chief Executive Officer of IBERIABANK.
MICHAEL J. BROWN joined the Company in 2001 and serves as Vice Chairman and Chief Operating Officer. Mr. Brown is responsible for management of all of the Company’s banking markets, treasury management, and wealth management.
JEFFERSON G. PARKER serves as Vice Chairman and Director of Capital Markets, Energy Lending, and Investor Relations and has been employed with the Company since 2009. Mr. Parker served on the IBERIABANK Corporation Board of Directors from 2001-2009, and resigned from the Board of Directors upon his employment with the Company.
FERNANDO PEREZ-HICKMAN joined the Company in August 2017 as Vice Chairman and Director of Corporate Strategy, after serving as Chairman of Sabadell United Bank until it was acquired by IBERIABANK. Mr. Perez-Hickman oversees the Company’s M&A and Corporate Strategy initiatives as well as the Retail and Mortgage businesses.
ANTHONY J. RESTEL serves as Vice Chairman and Chief Financial Officer and has been with the Company since 2005. Mr. Restel was hired as Vice President and Treasurer in 2001 and previously served as Chief Credit Officer of the bank subsidiary.
TERRY L. AKINS has served as Senior Executive Vice President and Chief Risk Officer since June 2017. Joining the Company in 2002, Ms. Akins previously served as Executive Vice President responsible for commercial and private banking segment resources for the markets.
ELIZABETH A. ARDOIN joined the Company in 2002 and currently serves as Senior Executive Vice President and Director of Communications, responsible for Marketing, Public Relations, Human Resources, and Corporate Real Estate as well as serves as Chief of Staff to the CEO.
J. RANDOLPH BRYAN joined the Company in 2012 and currently serves as Director of Business Transformation. Throughout his financial career, Mr. Bryan has held positions as Chief Operations Officer, Chief Risk Officer, and was instrumental in the development of risk management programs, information-based strategy programs, and disaster-related business recovery programs.
ROBERT M. KOTTLER has served as Executive Vice President and Director of Retail and Small Business since 2011. Mr. Kottler is responsible for the Retail Segment, including retail operations, credit cards, sales, and small business. He also serves as Director of Mortgage.
M. SCOTT PRICE has served as Executive Vice President, Chief Accounting Officer, and Corporate Controller since 2012. From 2004 to 2012, Mr. Price served in various accounting roles at Regions Financial Corporation.
MONICA R. SYLVAIN joined the Company in March 2018 as Executive Vice President and Chief Diversity Officer. Prior to joining the Company, Dr. Sylvain (Ph.D. Analytical Chemistry) founded and led Posse New Orleans, a regional site of The Posse Foundation - one of the nation’s premier college success, leadership cultivation, and workforce diversification organizations, which was founded in 1989.
ROBERT B. WORLEY, JR. has served as Executive Vice President, General Counsel, and Secretary since joining the Company in 2011.
NICOLAS YOUNG joined the Company in August 2017 as Deputy Chief Credit Officer, and has served as Chief Credit Officer since February 2018. Before joining IBERIABANK, Mr. Young was the Chief Credit Officer for Banco Sabadell Group in the Americas and Global Corporate Banking.
PART II.
Item 5. MARKET FOR THE REGISTRANT'S COMMON EQUITY, RELATED STOCKHOLDER MATTERS AND ISSUER PURCHASES OF EQUITY SECURITIES
Stock Information
| MARKET PRICE | DIVIDENDS DECLARED | ||||||||||||||
| 2019 | HIGH | LOW | CLOSING | ||||||||||||
| First Quarter | $ | 78.96 | $ | 65.97 | $ | 71.71 | $ | 0.43 | |||||||
| Second Quarter | $ | 81.71 | $ | 71.50 | $ | 75.85 | $ | 0.43 | |||||||
| Third Quarter | $ | 78.57 | $ | 67.01 | $ | 75.54 | $ | 0.45 | |||||||
| Fourth Quarter | $ | 78.20 | $ | 71.21 | $ | 74.83 | $ | 0.45 | |||||||
| MARKET PRICE | DIVIDENDS DECLARED | ||||||||||||||
| 2018 | HIGH | LOW | CLOSING | ||||||||||||
| First Quarter | $ | 87.55 | $ | 76.23 | $ | 78.00 | $ | 0.38 | |||||||
| Second Quarter | $ | 84.00 | $ | 70.40 | $ | 75.80 | $ | 0.38 | |||||||
| Third Quarter | $ | 87.50 | $ | 75.20 | $ | 81.35 | $ | 0.39 | |||||||
| Fourth Quarter | $ | 83.80 | $ | 60.82 | $ | 64.28 | $ | 0.41 | |||||||
At January 31, 2020, IBERIABANK Corporation had approximately 2,686 common shareholders of record. This total does not reflect shares held in nominee or "street name" accounts through various firms. These tables are a summary of regular quarterly cash dividends and market prices for the Company's common stock in the last two years. These market prices do not reflect retail markups, markdowns, or commissions.
IBERIABANK Corporation’s common stock trades on the NASDAQ Global Select Market under the symbol “IBKC.” The Company's Series B Preferred Stock, Series C Preferred Stock, and Series D Preferred Stock trade on the NASDAQ Global Select Market under the symbols "IBKCP", "IBKCO" and "IBKCN", respectively.
Stock Performance Graph
The following graph and table, which were prepared by SNL Financial LCS&P Global Intelligence (“SNL”S&P”), compares the cumulative total return on our Common Stock over a measurement period beginning December 31, 20122014 with (i) the cumulative total return on the stocks included in the National Association of Securities Dealers, Inc. Automated Quotation (“NASDAQ”) Composite Index and (ii) the cumulative total return on the stocks included in the SNLS&P > $10 Billion Bank Index. All of these cumulative returns are computed assuming the quarterly reinvestment of dividends paid during the applicable period.

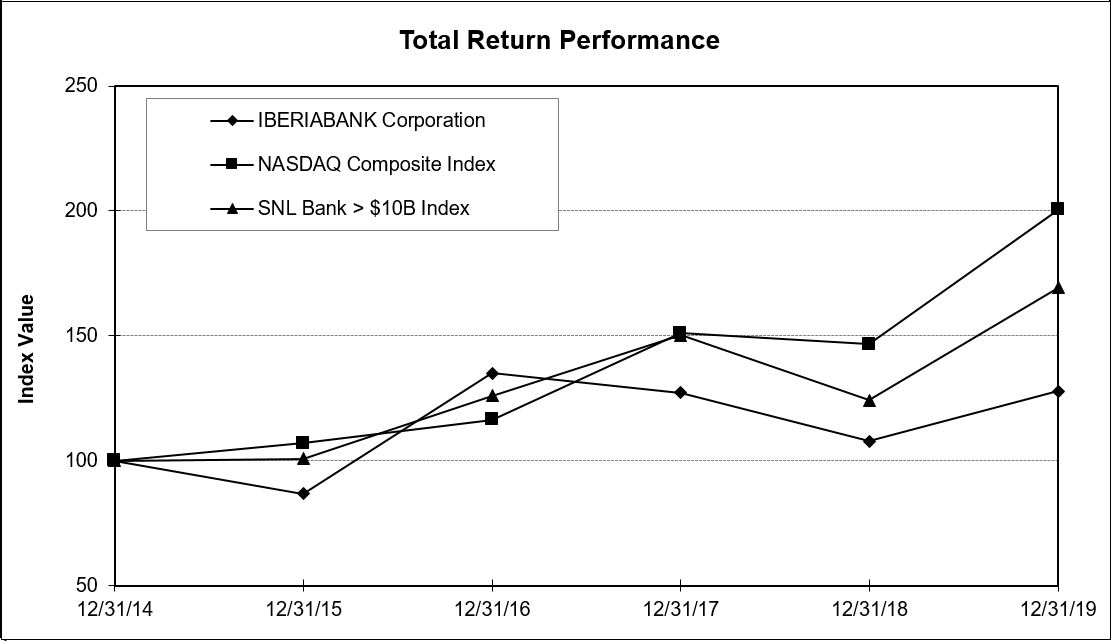
| Period Ending | Period Ending | |||||||||||||||||||||||||||||||||
| Index | 12/31/12 | 12/31/13 | 12/31/14 | 12/31/15 | 12/31/16 | 12/31/17 | 12/31/14 | 12/31/15 | 12/31/16 | 12/31/17 | 12/31/18 | 12/31/19 | ||||||||||||||||||||||
| IBERIABANK Corporation | 100.00 | 131.19 | 138.14 | 119.94 | 186.50 | 174.96 | 100.00 | 86.83 | 135.02 | 127.26 | 107.78 | 127.71 | ||||||||||||||||||||||
| NASDAQ Composite | 100.00 | 140.12 | 160.78 | 171.97 | 187.22 | 242.71 | ||||||||||||||||||||||||||||
| SNL Bank > $10B | 100.00 | 136.47 | 153.43 | 154.70 | 193.26 | 230.59 | ||||||||||||||||||||||||||||
| NASDAQ Composite Index | 100.00 | 106.96 | 116.45 | 150.96 | 146.67 | 200.49 | ||||||||||||||||||||||||||||
| S&P Bank > $10B Index | 100.00 | 100.83 | 125.96 | 150.29 | 124.18 | 169.22 | ||||||||||||||||||||||||||||
The stock performance graph assumes $100.00 was invested December 31, 2012.2014. The stock price performance included in this graph is not necessarily indicative of future stock price performance.
Additional information required herein is incorporated by reference toset forth in “Management’s Discussion and Analysis of Financial Condition and Results of Operations” and “Corporate Information Data”which is included in Exhibit 13 hereto.Item 7 of this Form 10-K.
Share Repurchases
On July 17, 2019, the Board of Directors authorizes aauthorized the repurchase program. The approved shareof up to 1,600,000 shares of the Company's common stock. This repurchase program does not obligateauthorization equated to approximately 3% of total common shares outstanding. At December 31, 2019, the Company tohad approximately 1,165,000 remaining shares that may be repurchased under the current Board-approved plan. During the fourth quarter of 2019, the Company did not repurchase any dollar amount or number of shares, and the program may be extended, modified, suspended, or discontinued at any time. Stock repurchases generally are affected through
Restrictions on Dividends and Repurchase of Stock
Holders of the Company’sCompany's common stock are only entitled to receive dividends if, as and when the Board of Directors may declare a dividend out of funds legally available for such payments. Furthermore, holders
IBERIABANK Corporation understands the importance of returning capital to shareholders. Management will continue to execute the capital planning process, including evaluation of the amount of the common stock dividend, with the Board of Directors and in conjunction with the regulators, subject to the Company's results of operations. Also, IBERIABANK Corporation is a bank holding company, and its ability to declare and pay dividends is dependent on certain federal regulatory considerations, including the guidelines of the Federal Reserve regarding capital adequacy and dividends.
Holders of the common stock are subject to priority dividend rights of any holders of preferred stock then outstanding. At December 31, 2017, thereThere were 13,75023,750 shares of preferred stock outstanding.
outstanding at December 31, 2019. In addition, the terms of the Company’s outstanding junior subordinated debt securities prohibit it from declaring or paying any dividends or distributions on outstanding capital stock, or purchasing, acquiring, or making a liquidation payment on such stock, if the Company has elected to defer interest payments on such debt.
For additional information, see Note 15 to the Consolidated Financial Statements which is incorporated by reference to Exhibit 13 of this Form 10-K.
| Item 6. |
The information required by Item 6 is set forth in Table 3 “Selected Consolidated Financial and Other Data” of "Management's Discussion and Analysis of Financial Condition and Results of Operations", which is included in Item 7 of this Form 10-K.
| Item 7. | MANAGEMENT'S DISCUSSION AND ANALYSIS OF FINANCIAL CONDITION AND RESULTS OF OPERATIONS |
INTRODUCTION
IBERIABANK Corporation is a financial holding company based in Lafayette, Louisiana. Through its subsidiaries, the Company provides a full range of commercial and consumer banking services, including private banking, small business, wealth and trust management, retail brokerage, mortgage, commercial leasing and equipment financing, and title insurance services through locations in Louisiana, Arkansas, Tennessee, Alabama, Texas, Florida, Georgia, South Carolina, North Carolina, Mississippi, Missouri, and New York.
This following discussion and analysis is intended to assist readers in understanding the consolidated financial condition and results of operations of the Company. It should be read in conjunction with the Consolidated Financial Statements and accompanying Notes to the Consolidated Financial Statements in Part II, Item 8 of this Form 10-K, as well as with the other information contained in this report.
EXECUTIVE OVERVIEW
2019 Financial Performance Summary
Highlights of the Company's financial performance for 2019 are discussed below compared to the results for 2018. Refer to the subsequent sections of MD&A for further detail.
Net income available to common shareholders for the year ended December 31, 2019 was $371.6 million, or $6.92 diluted EPS, compared to $361.2 million, or $6.46 diluted EPS, in 2018. Non-GAAP core EPS, which excludes merger-related costs and other items, was $7.01 in 2019 compared to $6.69 in 2018. Refer to Table 29 - Non-GAAP Measures included in this MD&A for further information on non-GAAP items.
Net interest income was $989.6 million for 2019, a $23.6 million, or 2%, decrease compared to 2018. Net interest margin on a tax-equivalent basis decreased 30 basis points to 3.45% from 3.75%, primarily from higher funding costs and lower loan yields in 2019.
The provision for credit losses was $41.7 million for 2019, compared to $40.4 million for 2018. While the Company experienced loan growth of 7% during 2019, the provision was reflective of an overall improvement in asset quality when compared to 2018.
Non-interest income for 2019 increased $81.8 million, or 54%, to $234.4 million, primarily from lower losses recognized on sales of available-for-sale securities and increases in mortgage and customer swap commission income when comparing the periods.
Non-interest expense decreased $40.1 million, or 6%, to $682.8 million for 2019, largely due to branch closure and merger-related expenses incurred during 2018.
Income tax expense increased $83.2 million to $115.4 million in 2019 compared to $32.3 million in 2018. Income tax expense was favorably impacted by $5.2 million and $58.6 million in non-core income tax expense adjustments during 2019 and 2018, respectively. Excluding non-core income tax benefits, income tax expense increased $29.8 million primarily as a result of higher income before income taxes.
Total assets at December 31, 2019 were $31.7 billion, an increase of $880.4 million from December 31, 2018, primarily driven by organic loan growth partially offset by a decrease in investment securities.
Total loans and leases increased $1.5 billion, or 7%, in 2019 to $24.0 billion, driven by strong growth in the Energy and Corporate Asset Finance Groups, as well as the Birmingham, Atlanta, and Dallas markets. Loan growth was diversified across the Company's footprint, as seven additional markets had loan growth of over $50.0 million in 2019.
Asset quality and credit metrics remained strong and continued to improve. Non-performing loans and leases to total loans and leases decreased to 0.59% at December 31, 2019, from 0.62% at December 31, 2018. Classified assets to total assets were 0.84% at the end of 2019 compared to 0.98% one year ago.
Total deposits increased $1.5 billion, or 6%, in 2019, driven by growth in several markets, most notably Miami-Dade, North, West and Central Florida, Southwest Louisiana, Atlanta, and Acadiana, which all had deposit growth over $150.0 million.
TABLE 1—KEY RATIOS
| Years Ended December 31, | |||||||||||
| 2019 | 2018 | 2017 | |||||||||
| Earnings Per Common Share | $ | 6.92 | $ | 6.46 | $ | 2.59 | |||||
| Core Earnings Per Common Share (Non-GAAP) | $ | 7.01 | $ | 6.69 | $ | 4.47 | |||||
| Return on Average Assets | 1.22 | % | 1.25 | % | 0.58 | % | |||||
| Core Return on Average Assets (Non-GAAP) | 1.24 | % | 1.30 | % | 0.98 | % | |||||
| Return on Average Common Equity | 9.22 | % | 9.63 | % | 3.95 | % | |||||
| Core Return on Average Common Equity (Non-GAAP) | 9.33 | % | 9.97 | % | 6.82 | % | |||||
| Efficiency Ratio | 55.8 | % | 62.0 | % | 65.9 | % | |||||
| Core Efficiency Ratio (Non-GAAP) | 55.0 | % | 55.9 | % | 59.6 | % | |||||
| Net Interest Margin (TE) | 3.45 | % | 3.75 | % | 3.64 | % | |||||
SIGNIFICANT TRANSACTIONS AND EVENTS
Pending Merger
On November 4, 2019, the Company announced it had entered the merger agreement to combine with First Horizon in an all-stock merger of equals. Under the terms of the merger agreement, the Company's shareholders will receive 4.584 shares of First Horizon common stock for each share of IBERIABANK Corporation common stock. The combined company will operate under the "First Horizon" name and will be headquartered in Memphis, Tennessee. Once the transaction is completed, the combined company will be one of the largest financial services companies headquartered in the South and one of the top 25 banks in the U.S. in deposits. The merger is expected to position the combined company to capitalize on market opportunities and increase its client base through greater scale, strategic investments in advanced technologies and expanded product offerings. The merger is expected to close in the second quarter of 2020, subject to satisfaction of customary closing conditions, including receipt of regulatory approvals and approval by the shareholders of each company. For more information on the proposed merger with First Horizon, see Part I, Item 1, "Business" to the Consolidated Financial Statements in this Form 10-K.
Acquisition Activity
On March 23, 2018, the Company acquired Gibraltar for total consideration of $214.7 million. Gibraltar operated eight offices, seven of which are located in the Florida metropolitan statistical areas of Miami, Key West, and Naples and one in New York City. The Company incurred merger-related expenses of $30.3 million during 2018 related to the acquisition of Gibraltar.
On July 31, 2017, the Company acquired Sabadell United for total consideration of $1.0 billion. The acquisition expanded the Company's presence in Southeast Florida adding twenty-five offices serving the Miami metropolitan area and three offices in Naples, Sarasota and Tampa. The Company incurred merger-related expenses of $0.9 and $41.0 million during 2018 and 2017, respectively, related to the acquisition of Sabadell United.
The following table is a summary of the Company's acquisition activity during the years indicated:
TABLE 2—SUMMARY OF ACQUISITION ACTIVITY FROM 2015 TO 2019
| (in millions) | Acquisition Date | Total Tangible Assets Acquired | Total Loans and Loans Held for Sale Acquired | Total Deposits Acquired | Goodwill | Other Intangible Assets | |||||||||||||||
Acquisition | |||||||||||||||||||||
| Florida Bank Group, Inc. | 2015 | 535.9 | 307.5 | 392.2 | 17.4 | 4.5 | |||||||||||||||
| Old Florida Bancshares, Inc. | 2015 | 1,540.0 | 1,068.9 | 1,389.8 | 100.8 | 6.8 | |||||||||||||||
| Georgia Commerce Bancshares, Inc. | 2015 | 1,022.3 | 793.4 | 908.0 | 86.7 | 6.7 | |||||||||||||||
| Sabadell United Bank, N.A. | 2017 | 5,451.0 | 4,030.8 | 4,382.8 | 441.0 | 66.6 | |||||||||||||||
| SolomonParks Title & Escrow, LLC | 2018 | — | — | — | 3.4 | 0.2 | |||||||||||||||
| Gibraltar Private Bank & Trust Co. | 2018 | 1,608.7 | 1,447.5 | 1,064.8 | 64.3 | 18.5 | |||||||||||||||
| Total Acquisitions, 2015-2019 | $ | 10,157.9 | $ | 7,648.1 | $ | 8,137.6 | $ | 713.6 | $ | 103.3 | |||||||||||
Capital Transactions
On July 12, 2019, the Company completed its then current share repurchase program, which commenced in November 2018. On July 17, 2019, the Board of Directors authorized a new repurchase plan of up to 1,600,000 shares of the Company's common stock. This repurchase authorization equated to approximately 3% of total common shares outstanding at the time of announcement. During 2019, the Company repurchased 2,700,000 common shares at a weighted average price of $75.83 per common share, of which 2,265,000 were repurchased under the completed plan and 435,000 under the current plan. At December 31, 2019, the Company had approximately 1,165,000 remaining shares that may be repurchased under the current plan. No further common stock repurchases are expected due to the pending merger with First Horizon.
On April 4, 2019, the Company issued and sold an aggregate of 4,000,000 depositary shares, each representing a 1/400th ownership interest in a share of the Company's 6.100% Fixed-to-Floating Non-Cumulative Perpetual Preferred Stock, Series D, par value $1.00 per share, with a liquidation preference of $10,000 per share (equivalent to $25 per depositary share), which represents $100.0 million in aggregate liquidation preference. See Note 15 in the Consolidated Financial Statements of this Form 10-K for further information.
Adoption of New Accounting Standard
As of January 1, 2020, the Company adopted ASU No. 2016-13, Financial Instruments - Credit Losses (ASC 326): Measurement of Credit Losses on Financial Instruments. ASC 326 replaces the incurred loss model for determining the allowance for credit losses with a current expected credit loss model for financial assets carried at amortized cost, such as loans, loan commitments, and held-to-maturity securities. ASC 326 requires recognition of lifetime expected credit losses that consider all available relevant information including details of past events, current conditions and reasonable and supportable forecasts of future economic conditions. The adoption of ASC 326 will result in a higher allowance for credit losses due to the requirement to estimate lifetime expected credit losses and the remaining length of time to maturity for longer duration loans as well as higher reserves on certain acquired loans which had low reserve levels under the previous accounting guidance. While ASC 326 increased the ACL, it did not change the overall credit risk in the Company’s loan and lease portfolios or the ultimate losses therein. The transition adjustment to increase the ACL is expected to result in an ACL to loans ratio between 0.98% and 1.04% and a decrease to the opening shareholders’ equity balance, net of income taxes, of between $59.5 million and $69.7 million as of January 1, 2020. See Note 2, Recent Accounting Pronouncements, to the Consolidated Financial Statements for further discussion of ASC 326 and the related transition adjustment recorded as of January 1, 2020. ASC 326 will result in increased volatility in the Company’s net income and capital levels between reporting periods due to changes in the reasonable and supportable forecast of future economic conditions on a quarterly basis.
FINANCIAL OVERVIEW
Selected consolidated financial and other data for the past five years is shown in the following tables.
TABLE 3—SELECTED CONSOLIDATED FINANCIAL AND OTHER DATA(1)
| Years Ended December 31, | 2019 vs. 2018 | ||||||||||||||||||||||||
| (in thousands, except per share data) | 2019 | 2018 | 2017 | 2016 | 2015 | $ Change | % Change | ||||||||||||||||||
| Income Statement Data | |||||||||||||||||||||||||
| Interest and dividend income | $ | 1,310,008 | $ | 1,221,629 | $ | 913,783 | $ | 716,939 | $ | 646,858 | 88,379 | 7 | |||||||||||||
| Interest expense | 320,362 | 208,381 | 104,937 | 67,701 | 59,100 | 111,981 | 54 | ||||||||||||||||||
| Net interest income | 989,646 | 1,013,248 | 808,846 | 649,238 | 587,758 | (23,602 | ) | (2 | ) | ||||||||||||||||
| Provision for credit losses | 41,657 | 40,385 | 51,708 | 41,521 | 33,252 | 1,272 | 3 | ||||||||||||||||||
| Net interest income after provision for credit losses | 947,989 | 972,863 | 757,138 | 607,717 | 554,506 | (24,874 | ) | (3 | ) | ||||||||||||||||
| Non-interest income | 234,360 | 152,562 | 202,147 | 227,717 | 220,393 | 81,798 | 54 | ||||||||||||||||||
| Non-interest expense | 682,756 | 722,898 | 666,406 | 563,464 | 567,961 | (40,142 | ) | (6 | ) | ||||||||||||||||
| Income before income tax expense | 499,593 | 402,527 | 292,879 | 271,970 | 206,938 | 97,066 | 24 | ||||||||||||||||||
| Income tax expense | 115,438 | 32,278 | 150,466 | 85,193 | 64,094 | 83,160 | 258 | ||||||||||||||||||
| Net income | 384,155 | 370,249 | 142,413 | 186,777 | 142,844 | 13,906 | 4 | ||||||||||||||||||
| Less: Preferred stock dividends | 12,602 | 9,095 | 9,095 | 7,977 | — | 3,507 | 39 | ||||||||||||||||||
| Net Income Available to Common Shareholders | $ | 371,553 | $ | 361,154 | $ | 133,318 | $ | 178,800 | $ | 142,844 | 10,399 | 3 | |||||||||||||
| Earnings per common share – basic | $ | 6.97 | $ | 6.50 | $ | 2.61 | $ | 4.32 | $ | 3.69 | 0.47 | 7 | |||||||||||||
| Earnings per common share – diluted | 6.92 | 6.46 | 2.59 | 4.30 | 3.68 | 0.46 | 7 | ||||||||||||||||||
| Cash dividends declared per common share | 1.76 | 1.56 | 1.46 | 1.40 | 1.36 | 0.20 | 13 | ||||||||||||||||||
| (in thousands, except per share data) | As of December 31, | 2019 vs. 2018 | |||||||||||||||||||||||
| 2019 | 2018 | 2017 | 2016 | 2015 | $ Change | % Change | |||||||||||||||||||
| Balance Sheet Data | |||||||||||||||||||||||||
| Total assets | $ | 31,713,450 | $ | 30,833,015 | $ | 27,904,129 | $ | 21,659,190 | $ | 19,504,068 | 880,435 | 3 | |||||||||||||
| Cash and cash equivalents | 894,723 | 690,453 | 625,724 | 1,362,126 | 510,267 | 204,270 | 30 | ||||||||||||||||||
| Investment securities | 4,116,321 | 4,991,025 | 4,817,380 | 3,535,313 | 2,899,214 | (874,704 | ) | (18 | ) | ||||||||||||||||
| Loans and leases, net of unearned income | 24,021,499 | 22,519,815 | 20,078,181 | 15,064,971 | 14,327,428 | 1,501,684 | 7 | ||||||||||||||||||
| Goodwill and other intangible assets, net | 1,312,701 | 1,324,269 | 1,277,464 | 759,823 | 765,655 | (11,568 | ) | (1 | ) | ||||||||||||||||
| Deposits | 25,219,349 | 23,763,431 | 21,466,717 | 17,408,283 | 16,178,748 | 1,455,918 | 6 | ||||||||||||||||||
| Borrowings | 1,547,895 | 2,649,033 | 2,487,132 | 1,138,089 | 667,064 | (1,101,138 | ) | (42 | ) | ||||||||||||||||
| Shareholders’ equity | 4,336,734 | 4,056,277 | 3,696,791 | 2,939,694 | 2,498,835 | 280,457 | 7 | ||||||||||||||||||
| Book value per common share | 78.37 | 71.61 | 66.17 | 62.68 | 58.87 | 6.76 | 9 | ||||||||||||||||||
Tangible book value per common share (Non-GAAP) (3) | 53.63 | 47.61 | 42.56 | 45.80 | 40.35 | 6.02 | 13 | ||||||||||||||||||
| As of and For the Years Ended December 31, | ||||||||||||||
| 2019 | 2018 | 2017 | 2016 | 2015 | ||||||||||
Key Ratios (2) | ||||||||||||||
| Return on average assets | 1.22 | % | 1.25 | % | 0.58 | % | 0.92 | % | 0.78 | % | ||||
| Return on average common equity | 9.22 | 9.63 | 3.95 | 7.08 | 6.41 | |||||||||
Return on average tangible common equity (Non-GAAP) (3) | 14.18 | 15.48 | 5.85 | 10.44 | 9.65 | |||||||||
| Equity to assets at end of period | 13.67 | 13.16 | 13.25 | 13.57 | 12.81 | |||||||||
| Earning assets to interest-bearing liabilities at end of period | 142.16 | 142.24 | 144.20 | 146.60 | 142.28 | |||||||||
Interest rate spread (4) | 2.99 | 3.40 | 3.42 | 3.40 | 3.45 | |||||||||
Net interest margin (TE) (4) (5) | 3.45 | 3.75 | 3.64 | 3.56 | 3.58 | |||||||||
| Non-interest expense to average assets | 2.18 | 2.44 | 2.72 | 2.77 | 3.09 | |||||||||
Efficiency ratio (6) | 55.78 | 62.01 | 65.92 | 64.25 | 70.57 | |||||||||
Tangible efficiency ratio (TE) (Non-GAAP) (3) (5) (6) | 53.95 | 59.77 | 63.85 | 62.43 | 68.39 | |||||||||
| Common stock dividend payout ratio | 25.11 | 24.18 | 57.47 | 32.94 | 38.46 | |||||||||
| Asset Quality Data | ||||||||||||||
Non-performing assets to total assets at end of period (7) | 0.54 | % | 0.55 | % | 0.64 | % | 1.16 | % | 0.47 | % | ||||
Allowance for credit losses to non-performing loans and leases at end of period (7) | 114.82 | 111.55 | 101.19 | 67.84 | 266.35 | |||||||||
| Allowance for credit losses to total loans and leases at end of period | 0.68 | 0.69 | 0.77 | 1.04 | 1.06 | |||||||||
| Consolidated Capital Ratios | ||||||||||||||
| Tier 1 leverage ratio | 9.90 | % | 9.63 | % | 9.35 | % | 10.86 | % | 9.52 | % | ||||
| Common Equity Tier 1 (CET1) ratio | 10.52 | 10.72 | 10.57 | 11.84 | 10.10 | |||||||||
| Tier 1 risk-based capital ratio | 11.38 | 11.25 | 11.16 | 12.59 | 10.73 | |||||||||
| Total risk-based capital ratio | 12.43 | 12.33 | 12.37 | 14.13 | 12.17 | |||||||||
(1) | 2018 data is impacted by the Company's acquisition of Gibraltar on March 23, 2018 and SolomonParks on January 12, 2018. 2017 data is impacted by the Company's acquisition of Sabadell United on July 31, 2017. 2015 data is impacted by the Company’s acquisitions of Florida Bank Group on February 28, 2015, Old Florida on March 31, 2015, and Georgia Commerce on May 31, 2015. |
(2) | With the exception of end-of-period ratios, all ratios are based on average daily balances during the respective periods. |
(3) | Tangible calculations eliminate the effect of goodwill and acquisition-related intangible assets and the corresponding amortization expense on a tax-effected basis where applicable. |
(4) | Interest rate spread represents the difference between the weighted average yield on earning assets and the weighted average cost of interest-bearing liabilities. Net interest margin represents net interest income as a percentage of average earning assets. |
(5) | Fully taxable equivalent ("TE") calculations include the tax benefit associated with related income sources that are tax-exempt using a rate of 21% for 2019 and 2018 and a rate of 35% for 2017, 2016, and 2015, which approximates the federal statutory tax rate. |
(6) | The efficiency ratio represents non-interest expense as a percentage of total revenues. Total revenues are the sum of net interest income and non-interest income. |
(7) | Non-performing loans consist of non-accruing loans and loans 90 days or more past due. Non-performing assets consist of non-performing loans and other real estate owned, including repossessed assets. |
APPLICATION OF CRITICAL ACCOUNTING POLICIES AND ESTIMATES
In preparing the consolidated financial statements and accompanying notes, management is required to apply significant judgment to various accounting, reporting, and disclosure matters. The accounting principles and methods used by the Company conform to GAAP and general banking accounting practices. The estimates and assumptions most significant to the Company are summarized in the following discussion and are further analyzed in the Notes to the Consolidated Financial Statements.
Allowance for Credit Losses
The allowance for credit losses has two components, the allowance for loan and lease losses (contra asset) and the reserve for unfunded commitments (liability). Further, the allowance for loan and lease losses consists of (i) probable incurred credit losses for legacy and acquired non-impaired loans and (ii) expected losses on acquired impaired loans.
Allowances for Legacy and Acquired Non-Impaired Loans
The legacy and acquired non-impaired ACL, which represent management’s estimate of probable losses inherent in the Company’s legacy and acquired non-impaired loan portfolios, involve a high degree of judgment and complexity. The Company’s policy is to establish reserves through provisions for credit losses in the consolidated statements of comprehensive income for estimated losses on delinquent and other problem loans, as well as loans which have not yet explicitly exhibited factors indicating credit weakness, when it is determined that losses have been incurred on such loans. Management’s determination of the appropriateness of the legacy and acquired non-impaired ACL is based on various factors requiring judgments and estimates, including management’s evaluation of the credit quality of the portfolio (determined through the assignment of risk ratings, assessments of past due status, and scores from credit agencies), historical loss experience, current economic conditions, the volume and type of lending conducted by the Company, composition of the portfolio, the amount of the Company’s classified assets, seasoning of the loan portfolio, value of collateral, the ability to monetize guarantor support and other relevant factors. Estimates in which management exercises significant judgment are the assessments of risk ratings, collateral values, projected principal and interest cash flows, guarantor support on the Company’s commercial loan portfolio, and the application of qualitative adjustments to the quantitative measurements across all portfolios. Other changes in estimates included in the estimation of the ACL may also have a significant impact on the consolidated financial statements. For further discussion of the ACL, see Note 1, Summary of Significant Accounting Policies, and Note 5, Allowance for Credit Losses and Credit Quality, to the Consolidated Financial Statements.
Allowance for Acquired Impaired Loans
Over the life of the acquired impaired loans, the Company continues to estimate the amount and timing of cash flows expected to be collected on either individual loans or on pools of loans sharing common risk characteristics. These expected cash flow estimates are updated for new information on a quarterly basis. Once cash flow estimates are updated, the Company evaluates whether the present value of these cash flows, as determined using effective interest rates, have changed. If the expected cash flows have decreased, the Company recognizes a provision for credit losses in its consolidated statement of comprehensive income. If the cash flows expected to be collected have increased, the Company adjusts the amount of accretable yield recognized on a prospective basis over the respective loan’s or pool’s remaining life.
Valuation of Goodwill, Intangible Assets and Other Purchase Accounting Adjustments
As previously mentioned, the Company accounts for acquisitions using the acquisition method of accounting. Under this method, the Company records the assets acquired, including identified intangible assets, and liabilities assumed, at their respective fair values, which in many instances involves estimates based on third party valuations, such as appraisals, or internal valuations based on discounted cash flow analyses or other valuation techniques. The determination of the useful lives as well as the appropriate amortization method of intangible assets is subjective. Any excess of consideration paid in the acquisition over the fair value of the identifiable net assets acquired is recorded as goodwill.
As discussed in Note 1, Summary of Significant Accounting Policies, to the Consolidated Financial Statements, goodwill is not amortized, but is assessed for potential impairment at the reporting unit level on an annual basis, as of October 1st, or whenever events or changes in circumstances indicate that it is more likely than not the fair value of a reporting unit is less than its respective carrying amount. As part of its testing, the Company may elect to first assess qualitative factors to determine whether it is more likely than not that the fair value of a reporting unit is less than its carrying amount. If the results of the qualitative assessment indicate that more likely than not a reporting unit’s fair value is less than its carrying amount, the Company determines the fair value of the respective reporting unit (through the application of various quantitative valuation methodologies) relative to its carrying amount (i.e., Step 1). The Company may also elect to bypass the qualitative assessment and begin with Step 1. If the results of Step 1 indicate that the fair value of the reporting unit is below its carrying amount (including goodwill), the Company will recognize a goodwill impairment loss for the excess of the reporting unit’s carrying amount over its fair value, limited to the total amount of goodwill allocated to that reporting unit.
As a result of the annual goodwill evaluation, the Company concluded goodwill was not impaired as of October 1, 2019. Further, management evaluated events or changes in circumstances between October 1, 2019 and December 31, 2019 and concluded that the fair value of any reporting unit had not been reduced below its carrying value. Based on the testing performed in 2019 and 2018, management concluded that for the IBERIABANK, Mortgage, and LTC reporting units, goodwill was not impaired at any time during those periods.
Goodwill impairment evaluations require management to utilize significant judgments and assumptions including, but not limited to, the general economic environment and banking industry, reporting unit future performance (i.e., forecasts), events or circumstances affecting a respective reporting unit (e.g., interest rate environment), and changes in the Company stock price, amongst other relevant factors. Management’s judgments and assumptions are based on the best information available at the time. Results could vary in subsequent reporting periods if conditions differ substantially from the assumptions utilized in completing the evaluations.
For additional information on goodwill and intangible assets, see Note 1, Summary of Significant Accounting Policies, and Note 8, Goodwill and Other Acquired Intangible Assets, to the Consolidated Financial Statements.
Income Taxes
In the ordinary course of business, the Company conducts transactions in various taxing jurisdictions (federal, state, and local) that are subject to complex income tax laws and regulations, which may differ by jurisdiction. The Company is often required to exercise significant judgment regarding the interpretation of these tax laws and regulations, in which the Company’s anticipated and actual liability could vary significantly based upon the taxing authority’s interpretation. Adjustments to current, accrued, or deferred taxes may occur due to modifications in tax rates, newly enacted laws, resolution of items with taxing authorities, alterations to interpretative statutory, judicial, and regulatory guidance that affect the Company’s tax positions, methods or elections changes, or other facts and circumstances.
RESULTS OF OPERATIONS
The Company reported net income available to common shareholders of $371.6 million, $361.2 million, and $133.3 million for the years ended December 31, 2019, 2018, and 2017, respectively. EPS on a diluted basis was $6.92 for 2019, $6.46 for 2018, and $2.59 for 2017.
The following discussion provides additional information on the Company’s operating results for the years ended December 31, 2019, 2018, and 2017, segregated by major income statement captions.
Net Interest Income/Net Interest margin
Net interest income is the difference between interest realized on earning assets and interest paid on interest-bearing liabilities and is also the largest driver of earnings. As such, it is subject to constant scrutiny by management. The rate of return and relative risk associated with earning assets are weighed to determine the appropriateness and mix of earning assets. Additionally, the need for lower cost funding sources is weighed against relationships with clients and future growth opportunities.
The following table sets forth information regarding (i) the total dollar amount of interest income from earning assets and the resultant average yields; (ii) the total dollar amount of interest expense on interest-bearing liabilities and the resultant average rates; (iii) net interest income; (iv) net interest spread; and (v) net interest margin. Net interest spread is the difference between the yields earned on average earning assets and the rates paid on average interest-bearing liabilities. Net interest margin on a tax-equivalent basis is net interest income (TE) as a percentage of average earning assets.
Information is based on average daily balances during the indicated periods. Investment security market value adjustments and trade-date accounting adjustments are not considered to be earning assets and, as such, the net effect of these adjustments is included in non-earning assets.
TABLE 4—AVERAGE BALANCES, NET INTEREST INCOME AND YIELDS / RATES
| 2019 | 2018 | 2017 | ||||||||||||||||||||||||||||||
| (dollars in thousands) | Average Balance | Interest Income/Expense(2) | Yield/ Rate (TE)(3) | Average Balance | Interest Income/Expense(2) | Yield/ Rate (TE)(3) | Average Balance | Interest Income/ Expense(2) | Yield/ Rate (TE)(3) | |||||||||||||||||||||||
| Earning Assets: | ||||||||||||||||||||||||||||||||
Loans and leases(1): | ||||||||||||||||||||||||||||||||
| Commercial loans and leases | $ | 15,908,368 | $ | 800,440 | 5.05 | % | $ | 14,633,814 | $ | 731,385 | 5.02 | % | $ | 12,252,823 | $ | 556,883 | 4.59 | % | ||||||||||||||
| Residential mortgage loans | 4,541,780 | 199,035 | 4.38 | % | 3,946,390 | 183,690 | 4.65 | % | 2,032,710 | 90,845 | 4.47 | % | ||||||||||||||||||||
| Consumer and other loans | 2,822,479 | 161,444 | 5.72 | % | 3,061,891 | 171,587 | 5.60 | % | 2,884,239 | 155,219 | 5.38 | % | ||||||||||||||||||||
| Total loans and leases | 23,272,627 | 1,160,919 | 5.00 | % | 21,642,095 | 1,086,662 | 5.04 | % | 17,169,772 | 802,947 | 4.71 | % | ||||||||||||||||||||
| Mortgage loans held for sale | 176,647 | 6,710 | 3.80 | % | 83,087 | 3,748 | 4.51 | % | 144,658 | 4,679 | 3.23 | % | ||||||||||||||||||||
Investment securities(4) | 4,652,096 | 125,786 | 2.75 | % | 4,900,457 | 117,771 | 2.46 | % | 4,347,581 | 96,194 | 2.31 | % | ||||||||||||||||||||
| Other earning assets | 712,006 | 16,593 | 2.33 | % | 573,949 | 13,448 | 2.34 | % | 820,678 | 9,963 | 1.23 | % | ||||||||||||||||||||
| Total earning assets | 28,813,376 | 1,310,008 | 4.57 | % | 27,199,588 | 1,221,629 | 4.51 | % | 22,482,689 | 913,783 | 4.11 | % | ||||||||||||||||||||
| Allowance for loan and lease losses | (145,679 | ) | (141,880 | ) | (144,426 | ) | ||||||||||||||||||||||||||
| Non-earning assets | 2,710,171 | 2,520,318 | 2,142,393 | |||||||||||||||||||||||||||||
| Total assets | $ | 31,377,868 | $ | 29,578,026 | $ | 24,480,656 | ||||||||||||||||||||||||||
| Interest-bearing liabilities: | ||||||||||||||||||||||||||||||||
| Deposits: | ||||||||||||||||||||||||||||||||
| Interest-bearing demand deposits | $ | 4,481,504 | $ | 44,415 | 0.99 | % | $ | 4,341,041 | $ | 33,962 | 0.78 | % | $ | 3,390,268 | $ | 16,385 | 0.48 | % | ||||||||||||||
| Savings and money market accounts | 9,251,689 | 126,988 | 1.37 | % | 9,056,182 | 82,151 | 0.91 | % | 7,912,990 | 42,353 | 0.54 | % | ||||||||||||||||||||
| Time deposits | 4,260,104 | 95,824 | 2.25 | % | 2,920,817 | 44,839 | 1.54 | % | 2,228,029 | 21,095 | 0.95 | % | ||||||||||||||||||||
Total interest-bearing deposits(5) | 17,993,297 | 267,227 | 1.49 | % | 16,318,040 | 160,952 | 0.99 | % | 13,531,287 | 79,833 | 0.59 | % | ||||||||||||||||||||
| Short-term borrowings | 814,653 | 15,739 | 1.93 | % | 1,052,088 | 14,682 | 1.40 | % | 905,755 | 7,557 | 0.83 | % | ||||||||||||||||||||
| Long-term debt | 1,418,431 | 37,396 | 2.64 | % | 1,392,148 | 32,747 | 2.35 | % | 854,425 | 17,547 | 2.05 | % | ||||||||||||||||||||
| Total interest-bearing liabilities | 20,226,381 | 320,362 | 1.58 | % | 18,762,276 | 208,381 | 1.11 | % | 15,291,467 | 104,937 | 0.69 | % | ||||||||||||||||||||
| Non-interest-bearing deposits | 6,410,693 | 6,602,434 | 5,440,477 | |||||||||||||||||||||||||||||
| Non-interest-bearing liabilities | 507,213 | 330,588 | 240,362 | |||||||||||||||||||||||||||||
| Total liabilities | 27,144,287 | 25,695,298 | 20,972,306 | |||||||||||||||||||||||||||||
| Total shareholders’ equity | 4,233,581 | 3,882,728 | 3,508,350 | |||||||||||||||||||||||||||||
| Total liabilities and shareholders’ equity | $ | 31,377,868 | $ | 29,578,026 | $ | 24,480,656 | ||||||||||||||||||||||||||
| Net earning assets | $ | 8,586,995 | $ | 8,437,312 | $ | 7,191,222 | ||||||||||||||||||||||||||
| Net interest income/ Net interest spread | $ | 989,646 | 2.99 | % | $ | 1,013,248 | 3.40 | % | $ | 808,846 | 3.42 | % | ||||||||||||||||||||
Net interest income (TE) / Net interest margin (TE) (3) | $ | 995,021 | 3.45 | % | $ | 1,019,008 | 3.75 | % | $ | 819,154 | 3.64 | % | ||||||||||||||||||||
(1) | Includes non-accrual loans for all periods presented. Interest income excludes approximately $7.8 million, $9.3 million, and $9.5 million, in interest income that would have been recorded in 2019, 2018, and 2017, respectively, if non-accrual loans (excluding acquired impaired loans) had been current in accordance with their contractual terms. |
(2) | Interest income includes loan fees of $3.5 million, $3.5 million, and $3.0 million for the years ended December 31, 2019, 2018, and 2017, respectively. |
(3) | Taxable equivalent yields are calculated using the statutory federal tax rate of 21% for 2019 and 2018 and 35% for 2017. |
(4) | Balances exclude unrealized gain or loss on securities available for sale and the impact of trade date accounting. |
(5) | Total deposit costs for the years ended December 31, 2019, 2018, and 2017 were 1.10%, 0.70%, and 0.42%, respectively. |
2019 vs. 2018
Net interest income decreased $23.6 million, or 2%, to $989.6 million in 2019 compared to $1.0 billion in 2018. Tax-equivalent net interest margin decreased 30 basis points to 3.45% from 3.75% when comparing the periods.
Interest income increased $88.4 million in 2019, primarily as a result of average loan growth of $1.6 billion, or 8%, during the year. In addition, the yield on average earning assets rose 6 basis points. The increase in yield was primarily attributable to a 29 basis point increase in the average yield on investment securities as a result of a portfolio restructuring at the end of 2018. The yield on average loans decreased 4 basis points in 2019 to 5.00%, as loan interest income in 2018 was favorably impacted by higher recovery income from acquired loans when compared to 2019.
Interest expense increased $112.0 million in 2019 primarily from a 50 basis point increase in the average rate paid on interest-bearing deposits. In addition, the average balance of interest-bearing deposits increased $1.7 billion, or 10%, when comparing the periods. Total deposit costs increased 40 basis points to 1.10% in 2019 compared to 0.70% in 2018. Deposit costs were driven upward by the repricing of deposits, higher cost brokered deposit issuances, and higher rates paid on promotional deposit offerings as a result of market competition. Interest expense on borrowings increased $5.7 million in 2019 primarily from a 44 basis point increase in the average rate paid.
Earning assets yields and funding costs were impacted by four FOMC target federal funds rate increases of 25 basis points each in 2018 and by three decreases of 25 basis points each in 2019.
2018 vs. 2017
In 2018, net interest income increased $204.4 million, or 25%, to $1.0 billion compared to $808.8 million in 2017. Tax-equivalent net interest margin increased 11 basis points to 3.75% compared to 3.64% in 2017.
Interest income increased $307.8 million in 2018, driven primarily by a $4.7 billion, or 21%, increase in average earning assets, primarily from acquisitions. In addition, the yield on average earning assets increased 40 basis points in 2018 to 4.51% compared to 4.11% in 2017.
Interest expense increased $103.4 million in 2018 primarily due to a 40 basis point increase in the rate paid on interest-bearing deposits as well as average balance growth of $2.8 billion, primarily due to acquisitions. In addition, interest expense on borrowings increased $22.3 million in 2018. The cost of average interest-bearing liabilities rose 42 basis points from 2017 to 1.11%.
Earning asset yields and funding costs were impacted by five FOMC target federal funds rate increases of 25 basis points each from December 2017 through December 2018.
The following table displays the dollar amount of changes in interest income and interest expense for major components of earning assets and interest-bearing liabilities. The table distinguishes between (i) changes attributable to volume (changes in average volume between periods times the average yield/rate for the two periods), (ii) changes attributable to rate (changes in average rate between periods times the average volume for the two periods), and (iii) total increase (decrease). Changes attributable to both volume and rate are allocated ratably between the volume and rate categories.
TABLE 5—SUMMARY OF CHANGES IN NET INTEREST INCOME
| 2019 Compared to 2018 | 2018 Compared to 2017 | ||||||||||||||||||||||
| Change Attributable To | Change Attributable To | ||||||||||||||||||||||
| (in thousands) | Volume | Rate | Net Increase (Decrease) | Volume | Rate | Net Increase (Decrease) | |||||||||||||||||
| Earning assets: | |||||||||||||||||||||||
| Loans and leases: | |||||||||||||||||||||||
| Commercial loans and leases | $ | 59,822 | $ | 9,233 | $ | 69,055 | $ | 110,526 | $ | 63,976 | $ | 174,502 | |||||||||||
| Residential mortgage loans | 26,544 | (11,199 | ) | 15,345 | 88,925 | 3,920 | 92,845 | ||||||||||||||||
| Consumer and other loans | (13,267 | ) | 3,124 | (10,143 | ) | 10,280 | 6,088 | 16,368 | |||||||||||||||
| Mortgage loans held for sale | 3,636 | (674 | ) | 2,962 | (2,399 | ) | 1,468 | (931 | ) | ||||||||||||||
| Investment securities | (6,120 | ) | 14,135 | 8,015 | 12,844 | 8,733 | 21,577 | ||||||||||||||||
| Other earning assets | 3,145 | — | 3,145 | (3,019 | ) | 6,504 | 3,485 | ||||||||||||||||
| Net change in income on earning assets | 73,760 | 14,619 | 88,379 | 217,157 | 90,689 | 307,846 | |||||||||||||||||
| Interest-bearing liabilities: | |||||||||||||||||||||||
| Deposits: | |||||||||||||||||||||||
| Interest-bearing demand deposits | 1,130 | 9,323 | 10,453 | 5,482 | 12,095 | 17,577 | |||||||||||||||||
| Savings and money market accounts | 2,699 | 42,138 | 44,837 | 7,540 | 32,258 | 39,798 | |||||||||||||||||
| Time deposits | 25,308 | 25,677 | 50,985 | 7,919 | 15,825 | 23,744 | |||||||||||||||||
| Borrowings | (1,163 | ) | 6,869 | 5,706 | 14,152 | 8,173 | 22,325 | ||||||||||||||||
| Net change in expense on interest-bearing liabilities | 27,974 | 84,007 | 111,981 | 35,093 | 68,351 | 103,444 | |||||||||||||||||
| Change in net interest spread | $ | 45,786 | $ | (69,388 | ) | $ | (23,602 | ) | $ | 182,064 | $ | 22,338 | $ | 204,402 | |||||||||
Provision for Credit Losses
The provision for credit losses represents the expense necessary to maintain the ACL at a level that in management's judgment is appropriate to absorb probable losses inherent in the portfolio at the balance sheet date. The provision for credit losses was $41.7 million for 2019, compared to $40.4 million for 2018 and $51.7 million for 2017. While the Company experienced loan growth of 7% in 2019, the increase to the provision was limited due to an overall improvement in asset quality, as both non-performing loans and classified loans as a percentage of total loans declined when compared to 2018. In addition, net charge-offs were 0.13% of average loans in 2019 compared to 0.15% in 2018. The provision for credit losses decreased in 2018 compared to 2017 primarily as a result of an improvement in asset quality. The Company's provision in 2018 was also impacted by asset resolutions and cash flow events on acquired loans that reduced the required allowance for that portfolio. For additional information about general asset quality trends, see the Asset Quality section of this MD&A.
Non-interest Income
Non-interest income for the year ended December 31, 2019 was $234.4 million compared to $152.6 million for 2018 and $202.1 million for 2017. Non-interest income as a percentage of total gross revenue (defined as total interest and non-interest income) was 15% in 2019, 11% in 2018, and 18% in 2017.
The following table illustrates the primary components of non-interest income.
TABLE 6—NON-INTEREST INCOME
| 2019 vs. 2018 | 2018 vs. 2017 | ||||||||||||||||||||||
| (in thousands) | 2019 | 2018 | 2017 | $ Change | % Change | $ Change | % Change | ||||||||||||||||
| Mortgage income | $ | 63,030 | $ | 46,424 | $ | 63,570 | 16,606 | 36 | (17,146 | ) | (27 | ) | |||||||||||
| Service charges on deposit accounts | 51,836 | 52,803 | 47,678 | (967 | ) | (2 | ) | 5,125 | 11 | ||||||||||||||
| Title revenue | 25,928 | 24,149 | 21,972 | 1,779 | 7 | 2,177 | 10 | ||||||||||||||||
| Commission income | 16,937 | 8,869 | 6,020 | 8,068 | 91 | 2,849 | 47 | ||||||||||||||||
| Broker commissions | 8,280 | 9,195 | 9,161 | (915 | ) | (10 | ) | 34 | — | ||||||||||||||
| ATM/debit card fee income | 11,871 | 10,295 | 10,199 | 1,576 | 15 | 96 | 1 | ||||||||||||||||
| Credit card and merchant-related income | 13,260 | 12,540 | 10,904 | 720 | 6 | 1,636 | 15 | ||||||||||||||||
| Trust department income | 17,058 | 15,981 | 9,705 | 1,077 | 7 | 6,276 | 65 | ||||||||||||||||
| Income from bank owned life insurance | 7,194 | 6,310 | 5,082 | 884 | 14 | 1,228 | 24 | ||||||||||||||||
| Securities losses, net | (979 | ) | (49,900 | ) | (148 | ) | 48,921 | 98 | (49,752 | ) | NM | ||||||||||||
| Other non-interest income | 19,945 | 15,896 | 18,004 | 4,049 | 25 | (2,108 | ) | (12 | ) | ||||||||||||||
| Total non-interest income | $ | 234,360 | $ | 152,562 | $ | 202,147 | 81,798 | 54 | (49,585 | ) | (25 | ) | |||||||||||
NM- not meaningful
2019 vs. 2018
Non-interest income increased $81.8 million to $234.4 million in 2019 primarily due to $49.9 million in losses on sales of available-for-sale securities in 2018 as a result of restructuring the Company's investment securities portfolio. At the end of 2018, the Company sold $1.0 billion of its securities at a loss and subsequently purchased an additional $1.2 billion in higher yielding securities.
In addition, mortgage income increased $16.6 million and commission income increased $8.1 million. Mortgage income was favorably impacted by a $370.8 million increase in sales volume as well as an increase in the fair value of mortgage derivatives. The increase in commission income was primarily due to a higher volume of customer swap activity.
Non-interest income in 2019 was also favorably impacted by $3.2 million in gains on the sale of non-mortgage loans as well as increases in title revenue, ATM/debit card fee income, and trust department income.
2018 vs. 2017
Non-interest income decreased $49.6 million in 2018 when compared to 2017 primarily due to the previously mentioned losses from the restructuring of the securities portfolio. Non-interest income in 2018 was also impacted by a $17.1 million decrease in mortgage income, which was primarily the result of lower mortgage loan originations and sales from reduced activity driven by a higher interest rate environment.
The decreases in 2018 when compared to 2017 were partially offset by increases in trust department income, service charges on deposit accounts, and title revenue, which were primarily driven by the Sabadell and Gibraltar acquisitions.
Non-interest Expense
For 2019, non-interest expense was $682.8 million, a decrease of $40.1 million, or 6%, when compared to 2018, primarily from lower branch closure and merger-related expenses in 2019. The Company’s efficiency ratio improved to 55.8% in 2019 compared to 62.0% in 2018.
The following table illustrates the primary components of non-interest expense.
TABLE 7—NON-INTEREST EXPENSE
| 2019 vs. 2018 | 2018 vs. 2017 | ||||||||||||||||||||||
| (in thousands) | 2019 | 2018 | 2017 | $ Change | % Change | $ Change | % Change | ||||||||||||||||
| Salaries and employee benefits | $ | 411,869 | $ | 414,741 | $ | 379,527 | (2,872 | ) | (1 | ) | 35,214 | 9 | |||||||||||
| Net occupancy and equipment | 79,773 | 77,246 | 70,663 | 2,527 | 3 | 6,583 | 9 | ||||||||||||||||
| Communication and delivery | 14,578 | 15,951 | 14,252 | (1,373 | ) | (9 | ) | 1,699 | 12 | ||||||||||||||
| Marketing and business development | 14,161 | 18,371 | 13,999 | (4,210 | ) | (23 | ) | 4,372 | 31 | ||||||||||||||
| Computer services expense | 38,108 | 39,680 | 36,790 | (1,572 | ) | (4 | ) | 2,890 | 8 | ||||||||||||||
| Professional services | 33,284 | 28,698 | 48,545 | 4,586 | 16 | (19,847 | ) | (41 | ) | ||||||||||||||
| Credit and other loan-related expense | 14,448 | 19,088 | 18,411 | (4,640 | ) | (24 | ) | 677 | 4 | ||||||||||||||
| Insurance | 17,365 | 25,274 | 21,815 | (7,909 | ) | (31 | ) | 3,459 | 16 | ||||||||||||||
| Travel and entertainment | 10,432 | 10,035 | 11,287 | 397 | 4 | (1,252 | ) | (11 | ) | ||||||||||||||
| Amortization of acquisition intangibles | 18,464 | 21,678 | 12,590 | (3,214 | ) | (15 | ) | 9,088 | 72 | ||||||||||||||
| Impairment of long-lived assets and other losses | 925 | 27,780 | 12,246 | (26,855 | ) | (97 | ) | 15,534 | 127 | ||||||||||||||
| Other non-interest expense | 29,349 | 24,356 | 26,281 | 4,993 | 21 | (1,925 | ) | (7 | ) | ||||||||||||||
| Total non-interest expense | $ | 682,756 | $ | 722,898 | $ | 666,406 | (40,142 | ) | (6 | ) | 56,492 | 8 | |||||||||||
2019 vs. 2018
The $40.1 million decrease in non-interest expense in 2019 was primarily driven by a $34.6 million decrease in merger-related and other non-core expense, including branch closure and consolidation expense. Excluding these items, core non-interest expense decreased $5.5 million, or 1%, in 2019 compared to 2018.
Impairment of long-lived assets and other losses decreased $26.9 million, primarily due to branch consolidations and closures in 2018. Insurance expense decreased $7.9 million, primarily from lower deposit insurance expense, the result of the elimination of the FDIC large bank surcharge as well as a lower assessment rate in 2019. Credit and other loan-related expense decreased $4.6 million, primarily attributable to an overall improvement in asset quality.
Salaries and employee benefits expense decreased $2.9 million in 2019 primarily as a result of a $9.3 million decline in severance, retention, and other merger-related expense partially offset by a $5.6 million increase in expense from share-based compensation and other incentives. This increase was primarily attributable to an increase in stock price, current year grants, and the vesting of grants tied to financial performance.
The $4.6 million increase in professional services expense was primarily attributable to higher merger-related expenses in 2019. Other non-interest expense included a $3.0 million increase in net costs of OREO in 2019, primarily from higher gains on the sale of properties in 2018.
2018 vs. 2017
The $56.5 million increase in non-interest expense in 2018 was primarily the result of a $35.2 million increase in salaries and employee benefits from the acquisition of Sabadell United in late 2017 and Gibraltar in early 2018. Merit raises, off-cycle pay increases, higher severance and retention expense, higher incentive expense, and restricted stock grants also contributed to the increase in salaries and employee benefits expense when comparing the periods.
Impairment of long-lived assets and other losses increased $15.5 million in 2018, primarily due to branch consolidations and closures. Amortization of acquisition intangibles and net occupancy and equipment expenses also increased in 2018 due to acquisition activity.
The $19.8 million decrease in professional services in 2018 was driven by lower merger-related legal and professional expense as a result of the Sabadell United acquisition in 2017 and litigation settlement expense pertaining to the HUD legal matter in 2017, partially offset by an increase in tax-related consulting expense during 2018.
Income Taxes
For the years ended December 31, 2019, 2018, and 2017, income tax expense was $115.4 million, $32.3 million, and $150.5 million, respectively, which resulted in an effective income tax rate of 23.1% in 2019, 8.0% in 2018, and 51.4% in 2017. Income tax expense in 2018 and 2017 was impacted by the passage of the Tax Act at the end of 2017. Excluding adjustments related to the Tax Act, the effective tax rate would have been 22.6% in 2018 and 34.0% in 2017.
The Company's effective tax rate is impacted by state income taxes (net of federal income tax benefit), tax-exempt income, non-deductible expenses, and the recognition of tax credits. The effective tax rate may vary significantly due to fluctuations in the amount and source of pretax income, changes in amounts of non-deductible expenses, and timing of the recognition of tax credits.
2019 vs. 2018
Income tax expense in 2019 was impacted by a $5.2 million non-core, permanent net tax benefit recorded as a result of deductions claimed on the Company's 2018 income tax returns. Excluding this non-core benefit, income tax expense would have been $120.6 million, which would have resulted in a 24.1% effective tax rate. Excluding net non-core income tax benefits, income tax expense would have increased $29.8 million, or 33% in 2019. This increase was driven primarily by a 24% increase in income before income taxes, as well as a higher level of non-deductible merger-related expenses.
2018 vs. 2017
Income tax expense in 2018 was impacted by $58.7 million in non-core income tax expense adjustments, which included a $65.3 million permanent net tax benefit as a result of deductions claimed on the Company's 2017 income tax returns, partially offset by the repricing of its current and deferred income tax position as a result of the Tax Act. In addition, $6.6 million in income tax expense was recorded from the finalization of accounting for the Sabadell United acquisition and its net impact on the remeasurement of deferred tax assets as a result of the Tax Act. In 2017, income tax expense was affected by $51.0 million in income tax expense related to the estimated net impact from the remeasurement of deferred tax assets and liabilities at the new federal rate of 21%. Excluding non-core adjustments, core income tax expense decreased $9.8 million in 2018 from the reduction in the federal income tax rate.
The Company's federal tax returns for the years 2014 to 2017 are currently under audit by the Internal Revenue Service.
FINANCIAL CONDITION
EARNING ASSETS
Earning assets consist of loans and leases, investment securities, other equity securities, interest-bearing deposits in other banks, mortgage loans held for sale and other interest-earning assets. The following provides a detailed discussion of the major categories of earning assets.
Loans and Leases
The Company had total loans and leases of $24.0 billion at December 31, 2019, an increase of $1.5 billion, or 7%, from December 31, 2018. The increase was a result of legacy loan growth of $2.7 billion, or 16%, partially offset by pay-downs and pay-offs on loans, primarily from prior period acquisitions.
The Company believes its loan portfolio is diversified by product and geography throughout its footprint. Loan growth in 2019 was strongest in the the Energy Group (primarily reserve-based and midstream lending), Corporate Asset Finance Group (equipment financing and leasing business), and the Birmingham, Atlanta, and Dallas markets. Loans in the Energy Group increased $329.3 million, or 36% since December 31, 2018. The Corporate Asset Finance division grew loans and leases by $267.0 million, or 53%, in 2019. The Birmingham market grew loans $262.9 million, or 28%, the Atlanta market $159.8 million, or 12%, and the Dallas market $138.6 million, or 20%. The Company’s loan to deposit ratio at December 31, 2019 and 2018 was 95.3% and 94.8%, respectively. The percentage of fixed-rate loans to total loans decreased from 39% at the end of 2018 to 38% at the end of 2019.
Loans and leases outstanding at December 31, 2019 and 2018 by portfolio segment and class are presented in the following table.
TABLE 8—LOANS AND LEASES BY PORTFOLIO SEGMENT AND CLASS
| 2019 | 2018 | $ Change | % Change | ||||||||||||||||
| (in thousands) | Balance | Mix | Balance | Mix | |||||||||||||||
| Commercial loans and leases: | |||||||||||||||||||
| Real estate - construction | $ | 1,321,663 | 6 | % | $ | 1,196,366 | 5 | % | 125,297 | 10 | |||||||||
| Real estate - owner-occupied | 2,475,326 | 10 | 2,395,822 | 11 | 79,504 | 3 | |||||||||||||
Real estate - non-owner occupied | 6,267,106 | 26 | 5,796,117 | 26 | 470,989 | 8 | |||||||||||||
Commercial and industrial (1) | 6,547,538 | 27 | 5,737,017 | 25 | 810,521 | 14 | |||||||||||||
| Total commercial loans and leases | 16,611,633 | 69 | 15,125,322 | 67 | 1,486,311 | 10 | |||||||||||||
| Residential mortgage loans | 4,739,075 | 20 | 4,359,156 | 19 | 379,919 | 9 | |||||||||||||
| Consumer and other loans: | |||||||||||||||||||
| Home Equity | 1,987,336 | 8 | 2,304,694 | 10 | (317,358 | ) | (14 | ) | |||||||||||
| Other | 683,455 | 3 | 730,643 | 4 | (47,188 | ) | (6 | ) | |||||||||||
| Total consumer and other loans | 2,670,791 | 11 | 3,035,337 | 14 | (364,546 | ) | (12 | ) | |||||||||||
| Total loans and leases | $ | 24,021,499 | 100 | % | $ | 22,519,815 | 100 | % | 1,501,684 | 7 | |||||||||
(1) | Includes equipment financing leases |
Loan Portfolio Components
The table below sets forth the composition of the loan portfolio at December 31, followed by a discussion of activity by portfolio segment.
TABLE 9— COMPOSITION OF LOAN PORTFOLIO
| 2019 | 2018 | 2017 | 2016 | 2015 | ||||||||||||||||||||||||||||||
| (in thousands) | Balance | Mix | Balance | Mix | Balance | Mix | Balance | Mix | Balance | Mix | ||||||||||||||||||||||||
| Commercial loans and leases: | ||||||||||||||||||||||||||||||||||
| Commercial real estate | $ | 10,064,095 | 42 | % | $ | 9,388,305 | 42 | % | $ | 8,938,230 | 44 | % | $ | 6,846,549 | 45 | % | $ | 6,125,927 | 43 | % | ||||||||||||||
| Commercial and industrial | 6,547,538 | 27 | 5,737,017 | 25 | 5,135,067 | 26 | 4,060,032 | 28 | 4,072,928 | 29 | ||||||||||||||||||||||||
| Total commercial loans and leases | 16,611,633 | 69 | 15,125,322 | 67 | 14,073,297 | 70 | 10,906,581 | 73 | 10,198,855 | 72 | ||||||||||||||||||||||||
| Residential mortgage loans | 4,739,075 | 20 | 4,359,156 | 19 | 3,056,352 | 15 | 1,267,400 | 8 | 1,195,319 | 8 | ||||||||||||||||||||||||
| Consumer and other loans: | ||||||||||||||||||||||||||||||||||
| Home equity | 1,987,336 | 8 | 2,304,694 | 10 | 2,292,275 | 12 | 2,155,926 | 14 | 2,066,167 | 14 | ||||||||||||||||||||||||
| Other | 683,455 | 3 | 730,643 | 4 | 656,257 | 3 | 735,064 | 5 | 867,087 | 6 | ||||||||||||||||||||||||
| Total consumer and other loans | 2,670,791 | 11 | 3,035,337 | 14 | 2,948,532 | 15 | 2,890,990 | 19 | 2,933,254 | 20 | ||||||||||||||||||||||||
| Total loans and leases | $ | 24,021,499 | 100 | % | $ | 22,519,815 | 100 | % | $ | 20,078,181 | 100 | % | $ | 15,064,971 | 100 | % | $ | 14,327,428 | 100 | % | ||||||||||||||
Commercial Loans
Total commercial loans and leases increased $1.5 billion, or 10%, to $16.6 billion at December 31, 2019. Commercial loans and leases increased to 69% of the total loan portfolio at December 31, 2019 compared to 67% at December 31, 2018. Unfunded commitments on commercial loans and leases including approved loan commitments not yet funded were $6.5 billion at December 31, 2019, an increase of $489.9 million, or 8% when compared to the end of the prior year.
Commercial real estate loans include loans to commercial customers for medium-term financing of land and buildings or for land development or construction of a building. These loans are repaid from revenues through operations of the businesses, rents of properties, sales of properties and refinances. The Company’s underwriting standards generally provide for loan terms of three to seven years, with amortization schedules of generally no more than twenty-five years. Low loan-to-value ratios are generally maintained and usually limited to no more than 80% at the time of origination. The commercial real estate portfolio is comprised of approximately 13% construction loans, 25% owner-occupied loans, and 62% non-owner-occupied loans as of December 31, 2019, consistent with the portfolio mix at December 31, 2018. Commercial real estate loans increased $675.8 million, or 7%, during 2019, from loan growth across multiple markets, primarily in the Atlanta, South Florida, Dallas, Naples, and New Orleans markets.
Commercial and industrial loans and leases represent loans to commercial customers to finance general working capital needs, equipment purchases and leases and other projects where repayment is derived from cash flows resulting from business operations. The Company originates C&I loans on a secured and, to a lesser extent, unsecured basis. C&I loans may be term loans or revolving lines of credit. Term loans are generally structured with terms of no more than three to seven years, with amortization schedules of generally no more than fifteen years. C&I term loans are generally secured by equipment, machinery or other corporate assets. Revolving lines of credit are generally structured as advances upon perfected security interests in accounts receivable and inventory and generally have annual maturities.
As of December 31, 2019, commercial and industrial loans and leases totaled $6.5 billion, an $810.5 million, or 14% increase from December 31, 2018, primarily driven by growth in the Company's Energy and Corporate Asset Finance Groups. Commercial and industrial loans and leases comprised 27% of the total portfolio at December 31, 2019 and 25% at December 31, 2018.
The following table details the Company’s commercial loans and leases by state.
TABLE 10—COMMERCIAL LOANS AND LEASES BY STATE OF ORIGINATION
| (in thousands) | 2019 | 2018 | $ Change | % Change | |||||||||
| Louisiana | $ | 3,586,091 | $ | 3,521,596 | 64,495 | 2 | |||||||
| Florida | 4,802,565 | 4,756,957 | 45,608 | 1 | |||||||||
| Alabama | 1,568,307 | 1,289,146 | 279,161 | 22 | |||||||||
Texas (1) | 2,780,641 | 2,310,642 | 469,999 | 20 | |||||||||
| Georgia | 1,188,253 | 1,078,983 | 109,270 | 10 | |||||||||
| Arkansas | 766,781 | 711,484 | 55,297 | 8 | |||||||||
| Tennessee | 504,235 | 584,119 | (79,884 | ) | (14 | ) | |||||||
| New York | 110,503 | 44,026 | 66,477 | 151 | |||||||||
| South Carolina and North Carolina | 210,014 | 92,800 | 117,214 | 126 | |||||||||
Other (2) | 1,094,243 | 735,569 | 358,674 | 49 | |||||||||
| Total | $ | 16,611,633 | $ | 15,125,322 | 1,486,311 | 10 | |||||||
(1) Texas loans include $1.2 billion and $911.5 million in Energy Group loans at December 31, 2019 and 2018, respectively.
(2) Other loans include primarily equipment financing and corporate asset financing leases, which the Company does not classify by state.
Residential Mortgage Loans
Residential mortgage loans consist of loans to consumers to finance a primary residence. The residential mortgage loan portfolio is comprised of non-conforming 1-4 family mortgage loans secured by properties located in the Company's market areas. The residential mortgage loan portfolio is originated under terms and documentation that permit their sale in a secondary market. The larger mortgage loans of current and prospective private banking clients are generally retained to enhance relationships, but also tend to be more profitable due to the expected shorter durations and relatively lower servicing costs associated with loans of this size. The Company does not originate or hold negative amortization, option ARM, or other exotic mortgage loans in its portfolio. The Company makes insignificant investments in loans that would be considered sub-prime (e.g., loans with a credit score of less than 620) in order to facilitate compliance with relevant Community Reinvestment Act regulations.
Total residential mortgage loans increased $379.9 million, or 9%, to $4.7 billion at December 31, 2019, primarily the result of growth in the Houston, Atlanta, New Orleans, Central Florida, and Tampa markets.
Consumer and Other Loans
The Company offers consumer loans in order to provide a full range of retail financial services to customers in the communities in which it operates. The Company originates substantially all of its consumer loans in its primary market areas. At December 31, 2019, $2.7 billion, or 11%, of the total loan portfolio was comprised of consumer loans, compared to $3.0 billion, or 14%, at the end of 2018.
The majority of the consumer loan portfolio is comprised of home equity loans, which allow customers to borrow against the equity in their home and are secured by a first or second mortgage on the borrower’s residence. Home equity loans were $2.0billion at December 31, 2019, a decrease of $317.4 million during the year. Unfunded commitments related to home equity loans and lines were $1.0 billion at December 31, 2019, an increase of $8.9 million versus the prior year.
All other consumer loans, which consist of credit card loans, automobile loans and other personal loans, decreased $47.2 million, or 6%, during 2019 to $683.5 million, primarily from decreases in other personal loans and indirect automobile loans, a product that is no longer offered.
Additional information on the Company’s consumer loan portfolio is presented in the following tables. For the purposes of Table 12, unscoreable consumer loans have been included with loans with credit scores below 660. Credit scores reflect the most recent information available as of the dates indicated.
TABLE 11—CONSUMER AND OTHER LOANS BY STATE OF ORIGINATION
| (in thousands) | 2019 | 2018 | $ Change | % Change | |||||||||
| Louisiana | $ | 983,827 | $ | 1,072,628 | (88,801 | ) | (8 | ) | |||||
| Florida | 809,590 | 956,159 | (146,569 | ) | (15 | ) | |||||||
| Alabama | 228,860 | 268,998 | (40,138 | ) | (15 | ) | |||||||
| Texas | 105,674 | 126,562 | (20,888 | ) | (17 | ) | |||||||
| Georgia | 120,677 | 142,067 | (21,390 | ) | (15 | ) | |||||||
| Arkansas | 186,520 | 216,817 | (30,297 | ) | (14 | ) | |||||||
| Tennessee | 61,471 | 78,013 | (16,542 | ) | (21 | ) | |||||||
| New York | 33,643 | 46,146 | (12,503 | ) | (27 | ) | |||||||
| South Carolina and North Carolina | 5,310 | 214 | 5,096 | NM | |||||||||
Other (1) | 135,219 | 127,733 | 7,486 | 6 | |||||||||
| Total consumer and other loans | $ | 2,670,791 | $ | 3,035,337 | (364,546 | ) | (12 | ) | |||||
(1) Other loans include primarily credit card and indirect consumer loans, which the Company does not classify by state.
NM - not meaningful
TABLE 12—CONSUMER AND OTHER LOANS BY CREDIT SCORE
| (in thousands) | 2019 | 2018 | |||||
| Above 720 | $ | 1,544,079 | $ | 1,708,417 | |||
| 660-720 | 526,340 | 666,132 | |||||
| Below 660 | 600,372 | 660,788 | |||||
| Total consumer and other loans | $ | 2,670,791 | $ | 3,035,337 | |||
Loan Maturities
The following table sets forth the scheduled contractual maturities of the Company’s total loan portfolio at December 31, 2019, unadjusted for scheduled principal reductions, prepayments or repricing opportunities. Demand loans, loans having no stated schedule of repayments and no stated maturity, and overdraft loans are reported as due in one year or less. The average life of a loan may be substantially less than the contractual terms because of scheduled amortization and prepayments.
TABLE 13—LOAN MATURITIES BY LOAN TYPE
| (in thousands) | One Year or Less | One Through Five Years | After Five Years | Total | |||||||||||
| Commercial real estate | $ | 1,814,996 | $ | 5,342,469 | $ | 2,906,630 | $ | 10,064,095 | |||||||
| Commercial and industrial | 1,336,769 | 3,786,259 | 1,424,510 | 6,547,538 | |||||||||||
| Residential mortgage | 35,038 | 307,863 | 4,396,174 | 4,739,075 | |||||||||||
| Consumer and other | 392,155 | 416,403 | 1,862,233 | 2,670,791 | |||||||||||
| Total | $ | 3,578,958 | $ | 9,852,994 | $ | 10,589,547 | $ | 24,021,499 | |||||||
Mortgage Loans Held for Sale
The Company sells the majority of conforming mortgage loan originations in the secondary market rather than assume the interest rate risk associated with these longer term assets. Upon the sale, the Company retains servicing on a limited portion of these loans.
Mortgage loans held for sale totaled $213.4 million at December 31, 2019, an increase of $105.6 million, or 98%, from year-end 2018, as originations outpaced sales activity during 2019. In 2019, the Company originated approximately $2.0 billion in mortgage loans, a 34% increase from $1.5 billion in originations in 2018.
Loans held for sale are primarily fixed-rate single-family residential mortgage loans under contracts to be sold in the secondary market. In most cases, loans in this category are sold within thirty days of closing. Buyers generally have recourse to return a purchased loan to the Company under limited circumstances. See Note 1 to the Consolidated Financial Statements for further discussion.
Investment Securities
The investment securities portfolio consists principally of debt securities available for sale. The securities portfolio provides a source of income and liquidity and is an important tool used to balance the interest rate risk of the loan and deposit portfolios. The Company maintains a highly-rated securities portfolio consisting primarily of federal agency CMOs and mortgage-backed securities. The securities portfolio is periodically evaluated in light of established ALM objectives, changing market conditions that could affect the profitability of the portfolio, the regulatory environment, and the level of interest rate risk to which the Company is exposed. These evaluations may result in steps taken to adjust the overall balance sheet positioning.
Investment securities decreased $874.7 million, or 18%, to $4.1 billion at December 31, 2019, compared to $5.0 billion at December 31, 2018. Investment securities were 13% and 16% of total assets at December 31, 2019 and December 31, 2018, respectively. The following table shows the carrying values of securities by category as of December 31 for the years indicated.
TABLE 14—CARRYING VALUE OF SECURITIES
| 2019 | 2018 | 2017 | 2016 | 2015 | ||||||||||||||||||||||||||||||
| (in thousands) | Balance | Mix | Balance | Mix | Balance | Mix | Balance | Mix | Balance | Mix | ||||||||||||||||||||||||
| Securities available for sale: | ||||||||||||||||||||||||||||||||||
| U.S. Government-sponsored enterprise obligations | $ | 40,197 | 1 | % | $ | 998 | — | % | $ | 40,615 | 1 | % | $ | 212,358 | 6 | % | $ | 252,083 | 9 | % | ||||||||||||||
| Obligations of states and political subdivisions | 168,480 | 4 | 178,888 | 4 | 274,204 | 6 | 283,199 | 8 | 187,961 | 7 | ||||||||||||||||||||||||
| Mortgage-backed securities | 3,621,115 | 88 | 4,507,109 | 90 | 4,161,905 | 86 | 2,851,709 | 80 | 2,264,813 | 78 | ||||||||||||||||||||||||
| Other securities | 103,568 | 3 | 96,584 | 2 | 113,338 | 2 | 98,831 | 3 | 95,429 | 3 | ||||||||||||||||||||||||
| 3,933,360 | 96 | 4,783,579 | 96 | 4,590,062 | 95 | 3,446,097 | 97 | 2,800,286 | 97 | |||||||||||||||||||||||||
| Securities held to maturity: | ||||||||||||||||||||||||||||||||||
| Obligations of states and political subdivisions | 166,386 | 4 | 188,684 | 4 | 206,736 | 4 | 64,726 | 2 | 69,979 | 2 | ||||||||||||||||||||||||
| Mortgage-backed securities | 16,575 | — | 18,762 | — | 20,582 | 1 | 24,490 | 1 | 28,949 | 1 | ||||||||||||||||||||||||
| 182,961 | 4 | 207,446 | 4 | 227,318 | 5 | 89,216 | 3 | 98,928 | 3 | |||||||||||||||||||||||||
| $ | 4,116,321 | 100 | % | $ | 4,991,025 | 100 | % | $ | 4,817,380 | 100 | % | $ | 3,535,313 | 100 | % | $ | 2,899,214 | 100 | % | |||||||||||||||
The following table summarizes activity in the Company’s investment securities portfolio during 2019 and 2018. There were no transfers of securities between investment categories during 2019.
TABLE 15—INVESTMENT PORTFOLIO ACTIVITY
| Available for Sale | Held to Maturity | ||||||||||||||
| (in thousands) | 2019 | 2018 | 2019 | 2018 | |||||||||||
| Balance at beginning of period | $ | 4,783,579 | $ | 4,590,062 | $ | 207,446 | $ | 227,318 | |||||||
| Purchases | 210,237 | 1,959,952 | — | — | |||||||||||
| Acquisitions | — | 19,169 | — | — | |||||||||||
| Sales, net of losses | (300,492 | ) | (1,085,382 | ) | 8 | — | |||||||||
| Principal maturities, prepayments and calls, net of gains | (845,726 | ) | (635,183 | ) | (21,727 | ) | (16,841 | ) | |||||||
| Amortization of premiums and accretion of discounts | (24,791 | ) | (26,216 | ) | (2,766 | ) | (3,031 | ) | |||||||
| Market value adjustment | 110,553 | (1,865 | ) | — | — | ||||||||||
Reclassification adjustments(1) | — | (36,958 | ) | — | — | ||||||||||
| Balance at end of period | $ | 3,933,360 | $ | 4,783,579 | $ | 182,961 | $ | 207,446 | |||||||
(1) Adjustments related to the reclassification of certain equity investments in accordance with ASU 2016-01, adopted as of January 1, 2018.
The Company assesses the nature of the unrealized losses in its investment portfolio at least quarterly to determine if there are losses that are deemed other-than-temporary. Based on its analysis, the Company concluded no declines in the estimated fair value of the Company’s investment securities were deemed to be other-than-temporary at December 31, 2019 and 2018. Note 3, Investment Securities, to the Consolidated Financial Statements provides further information on the Company’s investment securities.
ASSET QUALITY
The lending activities of the Company are governed by underwriting policies established by management and approved by the Board Risk Committee of the Board of Directors. Commercial risk personnel, in conjunction with senior lending personnel, underwrite the vast majority of commercial loans. The Company provides centralized underwriting of substantially all residential mortgage, small business and consumer loans. Established loan origination procedures require appropriate documentation, including financial data and credit reports. For loans secured by real property, the Company generally requires property appraisals, title insurance or a title opinion, hazard insurance, and flood insurance, where appropriate.
Loan payment performance is monitored and late charges are generally assessed on past due accounts. Delinquent and problem loans are administered by functional teams of specialized risk officers. Risk ratings on commercial exposures (as described below) are reviewed on an ongoing basis and are adjusted as necessary based on the obligor’s risk profile and debt capacity. The loan review department is responsible for independently assessing and validating risk ratings assigned to commercial exposures through a periodic sampling process.All other loans are also subject to loan reviews through a similar periodic sampling process.
The Company utilizes an asset risk classification system in accordance with guidelines established by the FRB as part of its efforts to monitor commercial asset quality. Loans with a "pass" rating are those the Company believes will be fully repaid in accordance with contractual terms. Commercial loans and leases that are "criticized" are those that have some weakness or potential weakness that indicate an increased probability of future loss. "Criticized" loans are grouped into three categories: "special mention", "substandard", and "doubtful". Special mention loans have potential weaknesses that, if left uncorrected, may result in deterioration of the Company's credit position at some future date. Substandard assets have well-defined weaknesses and are characterized by the distinct possibility that the Company will sustain some loss if the deficiencies are not corrected. Doubtful assets have the same weaknesses as substandard assets with the added characteristics that the probability of loss is high and collection of the full amount is improbable. An asset classified as "loss" is considered not collectible and of such little value that continuance as an asset of the Company is not warranted. The Company exercises judgment in determining the risk classification of its commercial loans. In connection with their examinations of insured institutions, both federal and state examiners also have the authority to identify problem assets and, if appropriate, reclassify them.
Real estate acquired by the Company through foreclosure or by deed-in-lieu of foreclosure is classified as OREO, and is recorded at the lesser of the related loan balance (the pro-rata carrying value for acquired loans) or estimated fair value less costs to sell. Closed bank branches are also classified as OREO and recorded at the lower of cost or market value.
See Note 1, Summary of Significant Accounting Policies, and Note 5, Allowance for Credit Losses and Credit Quality, to the Consolidated Financial Statements for further information.
Non-performing Assets and Troubled Debt Restructurings
The Company defines non-performing assets as non-accrual loans, accruing loans more than 90 days past due, OREO, and foreclosed property. Management continually monitors loans and transfers loans to non-accrual status when warranted.
Under GAAP, certain loan modifications or restructurings are designated as TDRs. In general, the modification or restructuring of a debt constitutes a TDR if the Company, for economic or legal reasons related to the borrower’s financial difficulties, grants a concession to the borrower that the Company would not otherwise consider under current market conditions.
The Company accounts for loans acquired with deteriorated credit quality, as well as all loans acquired with significant discounts that did not exhibit deteriorated credit quality at acquisition, in accordance with ASC Topic 310-30. Collectively, all loans accounted for under ASC 310-30 are referred to as "acquired impaired loans". Application of ASC Topic 310-30 results in significant accounting differences, compared to loans originated or acquired by the Company that are not accounted for under ASC 310-30. See Note 1, Summary of Significant Accounting Policies, to the Consolidated Financial Statements for further details.
Due to the significant difference in accounting for acquired impaired loans, the Company believes inclusion of these loans in certain asset quality ratios that reflect non-performing assets in the numerator or denominator (or both) results in significant distortion to these ratios as the inclusion of these loans could result in a lack of comparability across quarters or years, and could impact comparability with other portfolios that were not impacted by acquired impaired loan accounting. The Company believes that the presentation of certain asset quality measures excluding acquired impaired loans, as indicated below, and related amounts from both the numerator and denominator provides better perspective into underlying trends related to the quality of its loan portfolio. Accordingly, the asset quality measures in the tables below present asset quality information excluding acquired impaired loans, as indicated within each table.
The following table sets forth the composition of the Company’s non-performing assets and TDRs at December 31 for each of the years presented.
TABLE 16—NON-PERFORMING ASSETS AND TROUBLED DEBT RESTRUCTURINGS
| 2019 vs. 2018 | |||||||||||||||||||||||||
| (in thousands) | 2019 | 2018 | 2017 | 2016 | 2015 | $ Change | % Change | ||||||||||||||||||
| Non-accrual loans and leases: | |||||||||||||||||||||||||
| Commercial | $ | 76,287 | $ | 85,112 | $ | 111,726 | $ | 202,481 | $ | 32,097 | (8,825 | ) | (10 | ) | |||||||||||
| Mortgage | 34,833 | 30,396 | 17,387 | 13,733 | 14,783 | 4,437 | 15 | ||||||||||||||||||
| Consumer and other | 27,785 | 21,676 | 16,275 | 12,288 | 9,469 | 6,109 | 28 | ||||||||||||||||||
| Total non-accrual loans and leases | 138,905 | 137,184 | 145,388 | 228,502 | 56,349 | 1,721 | 1 | ||||||||||||||||||
| Accruing loans and leases 90 days or more past due | 3,257 | 2,128 | 6,900 | 1,385 | 915 | 1,129 | 53 | ||||||||||||||||||
Total non-performing loans and leases (1) | 142,162 | 139,312 | 152,288 | 229,887 | 57,264 | 2,850 | 2 | ||||||||||||||||||
OREO and foreclosed property (2) | 27,985 | 30,394 | 26,533 | 21,199 | 34,131 | (2,409 | ) | (8 | ) | ||||||||||||||||
| Total non-performing assets | 170,147 | 169,706 | 178,821 | 251,086 | 91,395 | 441 | — | ||||||||||||||||||
Performing troubled debt restructurings (3) | 67,972 | 80,807 | 81,291 | 104,369 | 38,441 | (12,835 | ) | (16 | ) | ||||||||||||||||
| Total non-performing assets and performing troubled debt restructurings | $ | 238,119 | $ | 250,513 | $ | 260,112 | $ | 355,455 | $ | 129,836 | (12,394 | ) | (5 | ) | |||||||||||
Non-performing loans and leases to total loans and leases (1) | 0.59 | % | 0.62 | % | 0.76 | % | 1.53 | % | 0.40 | % | |||||||||||||||
| Non-performing assets to total assets | 0.54 | % | 0.55 | % | 0.64 | % | 1.16 | % | 0.47 | % | |||||||||||||||
Non-performing assets and performing troubled debt restructurings to total assets (3) | 0.75 | % | 0.81 | % | 0.93 | % | 1.64 | % | 0.67 | % | |||||||||||||||
Allowance for credit losses to non-performing loans and leases (1) | 114.82 | % | 111.55 | % | 101.19 | % | 67.84 | % | 266.35 | % | |||||||||||||||
| Allowance for credit losses to total loans and leases | 0.68 | % | 0.69 | % | 0.77 | % | 1.04 | % | 1.06 | % | |||||||||||||||
(1) | Non-performing loans exclude acquired impaired loans, even if contractually past due or if the Company does not expect to receive payment in full, as the Company is currently accreting interest income over the expected life of the loans. |
(2) | OREO and foreclosed property at December 31, 2018, 2017, 2016, and 2015 include $9.0 million, $4.5 million, $4.8 million, and $8.1 million, respectively, of former bank properties held for development or resale. There were no former bank properties held for development or resale at December 31, 2019. |
(3) | Performing troubled debt restructurings for December 31, 2019, 2018, 2017, 2016 and 2015 exclude $64.9 million, $61.5 million, $68.5 million, $138.9 million, and $23.4 million, respectively, in troubled debt restructurings that meet non-performing asset criteria. |
Total non-performing assets increased slightly to $170.1 million in 2019 compared to $169.7million in 2018 due to an increase in non-performing loans and leases of $2.9 million, offset by a decrease in OREO and foreclosed property of $2.4 million. Mortgage and consumer non-accrual loans increased due to a limited number of loans moving to non-accrual in 2019. The impact of higher mortgage and consumer non-accrual loans was partially offset by a decrease in commercial non-accrual loans related to payments and charge-offs of non-accrual loans during 2019. The decrease in OREO and foreclosed property during 2019 was primarily the result of a $9.0 million decrease in former bank properties from the sale of closed branches during the year.
Potential Problem Loans
At December 31, 2019, the Company had $142.9 million of commercial loans classified as substandard, $15.6 million of commercial loans classified as doubtful, and no commercial loans classified as loss. Accordingly, the aggregate of the Company’s classified commercial loans was 0.50% of total assets and 0.95% of total commercial loans at December 31, 2019. At December 31, 2018, classified commercial loans totaled $182.1 million, or 0.59% of total assets, and 1.20% of total commercial loans.
In addition to the problem loans described above, there were $127.8 million of commercial loans classified as special mention at December 31, 2019, which in management’s opinion were subject to potential future rating downgrades. Special mention loans decreased $29.5 million, or 19%, during 2019 primarily from several customer relationships that were upgraded to Pass. Special mention loans were 0.77% of total commercial loans at the end of 2019 compared to 1.04% at the end of 2018.
Past Due and Non-accrual Loans
Loans are generally considered past due when contractual payments of principal and interest have not been received within 30 days from the contractual due date. At December 31, 2019, total loans past due, including non-accrual loans, were 0.88% of total loans, an increase of 1 basis point from December 31, 2018. Additional information on past due loans at December 31 is presented in the following table.
TABLE 17—PAST DUE AND NON-ACCRUAL LOAN SEGREGATION (1)
| 2019 | 2018 | ||||||||||||||||||
| (in thousands) | Amount | % of Outstanding Balance | Amount | % of Outstanding Balance | $ Change | % Change | |||||||||||||
| Accruing loans and leases: | |||||||||||||||||||
| 30-59 days past due | $ | 44,119 | 0.19 | % | $ | 38,579 | 0.17 | % | 5,540 | 14 | |||||||||
| 60-89 days past due | 24,085 | 0.10 | 18,753 | 0.08 | 5,332 | 28 | |||||||||||||
| 90-119 days past due | 2,217 | 0.01 | 2,128 | 0.01 | 89 | 4 | |||||||||||||
| 120 days past due or more | 1,040 | — | — | — | 1,040 | 100 | |||||||||||||
| 71,461 | 0.30 | 59,460 | 0.26 | 12,001 | 20 | ||||||||||||||
| Non-accrual loans and leases | 138,905 | 0.58 | 137,184 | 0.61 | 1,721 | 1 | |||||||||||||
| Total past due and non-accrual loans and leases | $ | 210,366 | 0.88 | % | $ | 196,644 | 0.87 | % | 13,722 | 7 | |||||||||
(1) | Past due and non-accrual loan amounts exclude acquired impaired loans, even if contractually past due or if the Company does not expect to receive payment in full, as the Company is currently accreting interest income over the expected life of the loans. |
Total past due and non-accrual loans and leases increased $13.7 million to $210.4 million at December 31, 2019. The change was due to both a $12.0 million increase in accruing past due loans and a $1.7 million increase in non-accrual loans. Of the total accruing past due loans, 62% were past due less than 60 days compared to 65% at December 31, 2018, while 95% were past due less than 90 days at December 31, 2019 compared to 96% at December 31, 2018.
Allowance for Credit Losses
The allowance for credit losses represents management’s best estimate of probable credit losses inherent at the balance sheet date. Determination of the allowance for credit losses involves a high degree of complexity and requires significant judgment. Several factors are taken into consideration in the determination of the overall allowance for credit losses. Based on facts and circumstances available, management believes that the allowance for credit losses was appropriate at December 31, 2019 to cover probable losses in the Company’s loan portfolio. The Company will adopt ASC 326 as of January 1, 2020, which changes the way in which the allowance for credit losses is determined and will result in higher allowances for credit losses in future periods. While ASC 326 will increase the allowance for credit losses, it does not change the overall credit risk in the Company's loan and lease portfolios or the ultimate losses therein. See Note 2, Recent Accounting Pronouncements, to the Consolidated Financial Statements for more information.
The following tables set forth the activity in the Company’s allowance for credit losses for the periods presented.
TABLE 18—SUMMARY OF ACTIVITY IN THE ALLOWANCE FOR CREDIT LOSSES
| (in thousands) | 2019 | 2018 | 2017 | 2016 | 2015 | ||||||||||||||
| Allowance for loan and lease losses at beginning of period | $ | 140,571 | $ | 140,891 | $ | 144,719 | $ | 138,378 | $ | 130,131 | |||||||||
| Provision for loan and lease losses | 39,850 | 39,472 | 51,111 | 44,424 | 30,908 | ||||||||||||||
| Transfer of balance to OREO and other | (3,287 | ) | (7,172 | ) | 934 | (2,781 | ) | (10,419 | ) | ||||||||||
| Adjustment attributable to FDIC loss share arrangements | — | — | — | (1,497 | ) | (1,360 | ) | ||||||||||||
| Charge-offs: | |||||||||||||||||||
| Commercial | (24,579 | ) | (31,189 | ) | (47,448 | ) | (25,983 | ) | (4,085 | ) | |||||||||
| Residential mortgage | (309 | ) | (334 | ) | (365 | ) | (313 | ) | (362 | ) | |||||||||
| Consumer and other | (13,482 | ) | (14,024 | ) | (14,653 | ) | (13,543 | ) | (12,854 | ) | |||||||||
| (38,370 | ) | (45,547 | ) | (62,466 | ) | (39,839 | ) | (17,301 | ) | ||||||||||
| Recoveries: | |||||||||||||||||||
| Commercial | 4,567 | 9,005 | 2,286 | 2,643 | 2,325 | ||||||||||||||
| Residential mortgage | 179 | 121 | 437 | 180 | 95 | ||||||||||||||
| Consumer and other | 3,078 | 3,801 | 3,870 | 3,211 | 3,999 | ||||||||||||||
| 7,824 | 12,927 | 6,593 | 6,034 | 6,419 | |||||||||||||||
| Net charge-offs | (30,546 | ) | (32,620 | ) | (55,873 | ) | (33,805 | ) | (10,882 | ) | |||||||||
| Allowance for loan and lease losses at end of period | 146,588 | 140,571 | 140,891 | 144,719 | 138,378 | ||||||||||||||
| Reserve for unfunded lending commitments at beginning of period | 14,830 | 13,208 | 11,241 | 14,145 | 11,801 | ||||||||||||||
| Balance created in acquisition accounting | — | 709 | 1,370 | — | — | ||||||||||||||
| Provision for (reversal of) unfunded lending commitments | 1,807 | 913 | 597 | (2,904 | ) | 2,344 | |||||||||||||
| Reserve for unfunded lending commitments at end of period | 16,637 | 14,830 | 13,208 | 11,241 | 14,145 | ||||||||||||||
| Allowance for credit losses at end of period | $ | 163,225 | $ | 155,401 | $ | 154,099 | $ | 155,960 | $ | 152,523 | |||||||||
Allowance for loan and lease losses to non-performing assets (1) | 86.15 | % | 82.83 | % | 78.79 | % | 57.64 | % | 151.41 | % | |||||||||
| Allowance for loan and lease losses to total loans and leases at end of period | 0.61 | — | 0.70 | 0.96 | 0.97 | ||||||||||||||
| Net charge-offs to average loans and leases | 0.13 | 0.15 | 0.33 | 0.23 | 0.08 | ||||||||||||||
(1) | Non-performing assets include accruing loans 90 days or more past due. For purposes of this table, non-performing assets exclude acquired impaired loans, even if contractually past due or if the Company does not expect to receive payment in full, as the Company is currently accreting interest income over the expected life of the loans. |
TABLE 19—ALLOCATION OF THE ALLOWANCE FOR CREDIT LOSSES
| 2019 | 2018 | 2017 | 2016 | 2015 | |||||||||||||||||||||||||
| Reserve % | % of Loans | Reserve % | % of Loans | Reserve % | % of Loans | Reserve % | % of Loans | Reserve % | % of Loans | ||||||||||||||||||||
| Commercial | 78 | % | 69 | % | 75 | % | 67 | % | 77 | % | 70 | % | 76 | % | 73 | % | 73 | % | 72 | % | |||||||||
| Residential mortgage | 6 | % | 20 | % | 9 | % | 19 | % | 6 | % | 15 | % | 8 | % | 8 | % | 8 | % | 8 | % | |||||||||
| Consumer and other | 16 | % | 11 | % | 16 | % | 14 | % | 17 | % | 15 | % | 16 | % | 19 | % | 19 | % | 20 | % | |||||||||
| Total allowance for credit losses | 100 | % | 100 | % | 100 | % | 100 | % | 100 | % | 100 | % | 100 | % | 100 | % | 100 | % | 100 | % | |||||||||
The allowance for credit losses was $163.2 million at December 31, 2019, $7.8 million higher than at December 31, 2018, and was 0.68% of total loans, compared to 0.69% at December 31, 2018. The decrease in the allowance for credit losses as a percentage of loans and leases was primarily the result of an overall improvement in asset quality. Net charge-offs during 2019 were $30.5 million, or 0.13% of average loans and leases, as compared to net charge-offs of $32.6 million, or 0.15%, for 2018. The decrease in net charge-offs was the result of a $7.2 million decrease in gross charge-offs, offset by a $5.1 million decrease in gross recoveries, primarily from one large commercial recovery of $3.3 million in 2018. The provision for loan and lease losses covered 130% and 121% of net charge-offs in 2019 and 2018, respectively. At December 31, 2019 and 2018, the allowance for loan and lease losses covered 103% and 101% of total non-performing loans and leases, respectively.
Cash and Cash Equivalents
Cash and cash equivalents totaled $894.7 million at December 31, 2019, an increase of $204.3 million, or 30%, from December 31, 2018. Interest-bearing deposits at other institutions increased $208.7 million to $604.9 million at December 31, 2019, while cash and due from banks decreased $4.4 million to $289.8 million at December 31, 2019. Short-term investments held in interest-bearing deposits at other institutions primarily result from excess funds invested overnight in interest-bearing deposit accounts at the FRB and the FHLB of Dallas. These balances fluctuate daily depending on the funding needs of the Company and earn interest at the current FRB and FHLB short-term rates. The Company’s cash activity is further discussed in the Liquidity and Other Off-Balance Sheet Activities section of this MD&A.
Other Assets
The following table details other asset balances as of December 31:
TABLE 20—OTHER ASSETS COMPOSITION
| 2019 vs. 2018 | |||||||||||||||||||||||||
| (in thousands) | 2019 | 2018 | 2017 | 2016 | 2015 | $ Change | % Change | ||||||||||||||||||
| Other Earning Assets | |||||||||||||||||||||||||
| FHLB stock, FRB stock, and other equity securities | $ | 179,082 | $ | 192,436 | $ | 177,370 | $ | 93,718 | $ | 66,008 | (13,354 | ) | (7 | ) | |||||||||||
| FDIC loss share receivable | — | — | 8,622 | — | 39,878 | — | — | ||||||||||||||||||
| Other interest-earning assets | 5,910 | 6,910 | 7,160 | 6,660 | 5,660 | (1,000 | ) | (14 | ) | ||||||||||||||||
| Reverse repurchase agreements | — | — | — | 1,268 | — | — | — | ||||||||||||||||||
| Total other earning assets | 184,992 | 199,346 | 193,152 | 101,646 | 111,546 | (14,354 | ) | (7 | ) | ||||||||||||||||
| Non-Earning Assets | |||||||||||||||||||||||||
| Bank-owned life insurance | 232,898 | 226,219 | 170,570 | 160,875 | 131,575 | 6,679 | 3 | ||||||||||||||||||
| Accrued interest receivable | 80,809 | 84,933 | 75,821 | 52,124 | 47,863 | (4,124 | ) | (5 | ) | ||||||||||||||||
| Other real estate owned | 27,985 | 30,394 | 26,533 | 21,200 | 34,131 | (2,409 | ) | (8 | ) | ||||||||||||||||
| Derivative assets | 104,151 | 27,048 | 31,265 | 38,886 | 30,486 | 77,103 | 285 | ||||||||||||||||||
| Investment in tax credit entities | 128,464 | 147,110 | 112,016 | 76,592 | 141,951 | (18,646 | ) | (13 | ) | ||||||||||||||||
| Other non-earning assets | 245,450 | 324,733 | 170,585 | 166,940 | 152,181 | (79,283 | ) | (24 | ) | ||||||||||||||||
| Total non-earning assets | 819,757 | 840,437 | 586,790 | 516,617 | 538,187 | (20,680 | ) | (2 | ) | ||||||||||||||||
| Total other assets | $ | 1,004,749 | $ | 1,039,783 | $ | 779,942 | $ | 618,263 | $ | 649,733 | (35,034 | ) | (3 | ) | |||||||||||
Derivatives increased $77.1 million as a result of significant activity in the Company's loan level hedging program, primarily from higher levels of commercial loan activity, an active sales process within the markets, and customers taking advantage of historically low fixed rates while short term rates were rising.
FUNDING SOURCES
Deposits, both those obtained from clients in its primary market areas and those acquired, are the Company’s principal source of funds for use in lending and other business purposes. The Company attracts local deposit accounts by offering a wide variety of products, competitive interest rates and convenient branch office locations and service hours, as well as online banking services at www.iberiabank.com and www.virtualbank.com. The Company's continued focus on increasing core deposits has been accomplished through the development of client relationships and, in the past, through acquisitions. Short-term and long-term borrowings are also important funding sources for the Company. Other funding sources include subordinated debt and shareholders’ equity. Refer to the Liquidity and Other Off-Balance Sheet Activities section of this MD&A for further discussion of the Company’s sources and uses of funding. The following discussion highlights the major changes in the mix of deposits and other funding sources during 2019.
Deposits
Total deposits increased $1.5 billion, or 6%, to $25.2 billion at December 31, 2019, primarily driven by organic growth in money market accounts and time deposits. Deposit growth during 2019 was strongest in the Miami-Dade, North, West and Central Florida, Southwest Louisiana, Atlanta, and Acadiana markets.
The Company's deposit balances generally increase at the end of any given year due to real estate tax collections by our municipal customers. These balances typically remain on deposit with the Company 45 to 60 days. Given the short-term nature of these seasonal funds, the deposit balances tied to these seasonal flows are held in liquid investments until they are withdrawn from the Company. The Company currently expects these deposits to decline over the beginning of 2020.
The following table sets forth the composition of the Company’s deposits as of December 31:
TABLE 21—DEPOSIT COMPOSITION BY PRODUCT
| 2019 vs. 2018 | ||||||||||||||||||||||||||||||||||||||||
| (in thousands) | 2019 | 2018 | 2017 | 2016 | 2015 | $ Change | % Change | |||||||||||||||||||||||||||||||||
| Non-interest-bearing deposits | $ | 6,319,806 | 25 | % | $ | 6,542,490 | 28 | % | $ | 6,209,925 | 29 | % | $ | 4,928,878 | 28 | % | $ | 4,352,229 | 27 | % | (222,684 | ) | (3 | ) | ||||||||||||||||
| Interest-bearing demand deposits | 4,821,252 | 19 | 4,514,113 | 19 | 4,348,939 | 20 | 3,314,281 | 19 | 2,974,176 | 19 | 307,139 | 7 | ||||||||||||||||||||||||||||
| Money market accounts | 9,121,283 | 36 | 8,237,291 | 35 | 7,674,291 | 36 | 6,219,532 | 36 | 6,010,882 | 37 | 883,992 | 11 | ||||||||||||||||||||||||||||
| Savings accounts | 683,366 | 3 | 828,914 | 3 | 846,074 | 4 | 814,385 | 5 | 716,838 | 4 | (145,548 | ) | (18 | ) | ||||||||||||||||||||||||||
| Time deposits | 4,273,642 | 17 | 3,640,623 | 15 | 2,387,488 | 11 | 2,131,207 | 12 | 2,124,623 | 13 | 633,019 | 17 | ||||||||||||||||||||||||||||
| Total deposits | $ | 25,219,349 | 100 | % | $ | 23,763,431 | 100 | % | $ | 21,466,717 | 100 | % | $ | 17,408,283 | 100 | % | $ | 16,178,748 | 100 | % | 1,455,918 | 6 | ||||||||||||||||||
The following table details large-denomination time deposits by remaining maturity dates at December 31:
TABLE 22—REMAINING MATURITIES OF TIME DEPOSITS GREATER THAN $100,000
| (in thousands) | 2019 | 2018 | 2017 | 2016 | 2015 | |||||||||||||||||||||||||||||
| 3 months or less | $ | 691,401 | 27 | % | $ | 326,621 | 16 | % | $ | 317,197 | 22 | % | $ | 241,128 | 21 | % | $ | 228,336 | 16 | % | ||||||||||||||
| 3 – 12 months | 1,593,218 | 63 | 1,086,521 | 53 | 753,423 | 51 | 457,796 | 40 | 631,634 | 46 | ||||||||||||||||||||||||
| 12 – 36 months | 242,785 | 9 | 566,736 | 28 | 319,864 | 22 | 339,137 | 30 | 390,820 | 28 | ||||||||||||||||||||||||
| More than 36 months | 14,593 | 1 | 58,730 | 3 | 77,036 | 5 | 97,702 | 9 | 135,950 | 10 | ||||||||||||||||||||||||
| Total time deposits greater than $100,000 | $ | 2,541,997 | 100 | % | $ | 2,038,608 | 100 | % | $ | 1,467,520 | 100 | % | $ | 1,135,763 | 100 | % | $ | 1,386,740 | 100 | % | ||||||||||||||
Short-term Borrowings
The Company may obtain advances from the FHLB of Dallas based upon its ownership of FHLB stock and certain pledges of its real estate loans and investment securities, provided certain standards related to the Company’s creditworthiness have been met. These advances are made pursuant to several credit programs, each of which has its own interest rate and range of maturities. The level of short-term borrowings can fluctuate significantly on a daily basis depending on funding needs and the source of funds chosen to satisfy those needs.
The Company also enters into repurchase agreements to facilitate customer transactions that are accounted for as secured borrowings. These transactions typically involve the receipt of deposits from customers that the Company collateralizes with its investment portfolio. Repurchase agreements had an average rate of 42.6 basis points at December 31, 2019.
Total short-term borrowings decreased $1.3 billion, or 86%, from December 31, 2018, to $204.2 million at December 31, 2019, due to advance repayments on short-term FHLB advances. On a period-end basis, short-term borrowings were 1% of total liabilities and 13% of total borrowings at December 31, 2019, compared to 6% and 56%, respectively, at December 31, 2018.
On an average basis, short-term borrowings decreased $237.4 million, or 23%, from 2018 and were 3% of total liabilities and 36% of total borrowings in 2019, compared to 4% and 43%, respectively, in 2018. For additional information, see Note 12, Short-term Borrowings, in the Notes to the Consolidated Financial Statements.
Long-term Debt
Long-term debt increased $177.5 million, or 15%, to $1.3 billion at December 31, 2019, primarily due to additional long-term FHLB advances made in 2019. On a period-end basis, long-term debt was 5% and 4% of total liabilities at December 31, 2019 and 2018, respectively.
On an average basis, long-term debt increased to $1.4 billion in 2019, $26.3 million, or 2%, higher than 2018, mainly due to higher levels of long-term FHLB advances held by the Company throughout 2019. Average long-term debt was 5% of total liabilities for both 2019 and 2018.
Long-term debt at December 31, 2019 included $1.2 billion in fixed-rate advances from the FHLB of Dallas that cannot be prepaid without incurring substantial penalties. The remaining debt consisted of $120.1 million of the Company’s junior subordinated debt and $35.0 million in notes payable on investments in new market tax credit entities. Interest on the junior subordinated debt is payable quarterly and may be deferred at any time at the election of the Company for up to 20 consecutive quarterly periods. During any deferral period, the Company is subject to certain restrictions, including being prohibited from declaring dividends to its common shareholders. The junior subordinated debt is redeemable by the Company in whole or in part. For additional information, see Note 13, Long-term Debt, in the Notes to the Consolidated Financial Statements.
CAPITAL RESOURCES
Shareholders' equity increased $280.5 million, or 7%, during 2019, primarily from undistributed income to common shareholders of $278.2 million, the issuance of $96.4 million in preferred stock, and an increase in accumulated other comprehensive income of $87.5 million, primarily from unrealized gains on the Company's available-for-sale securities portfolio as a result of lower market interest rates. The increases in equity were partially offset by common stock repurchases totaling $204.7 million. For further information, see Note 15, Shareholders' Equity, Capital Ratios, and Other Regulatory Matters, to the Consolidated Financial Statements.
The Company's dividend to common shareholders was $1.76 per common share in 2019 compared to $1.56 in 2018, a 13% increase. On a year-to-date basis, the dividend payout ratio was 25.1% for the current year, up from 24.2% in 2018.
Regulatory Capital
Banking regulators define minimum capital ratios for bank holding companies and their bank subsidiaries. Based on the capital rules and definitions prescribed by the banking regulators, should any depository institution’s capital ratios decline below predetermined levels, it would become subject to a series of increasingly restrictive regulatory actions. The system categorizes a depository institution’s capital position into one of five categories ranging from well-capitalized to critically under-capitalized. Compliance with bank and bank holding company regulatory capital requirements are monitored by the Company on an ongoing basis.
At December 31, 2019 and 2018, the Company exceeded all required regulatory capital ratios, and the regulatory capital ratios of IBERIABANK were in excess of the levels established for “well-capitalized” institutions, as shown in the following table.
TABLE 23—REGULATORY CAPITAL RATIOS
| Ratio | Entity | 2019 Well- Capitalized Minimums | December 31, 2019 | December 31, 2018 | |||||||
| Actual | Actual | ||||||||||
| Tier 1 Leverage | IBERIABANK Corporation | N/A | 9.90 | % | 9.63 | % | |||||
| IBERIABANK | 5.00 | % | 9.69 | 9.38 | |||||||
| Common Equity Tier 1 (CET1) | IBERIABANK Corporation | N/A | 10.52 | 10.72 | |||||||
| IBERIABANK | 6.50 | % | 11.14 | 10.95 | |||||||
| Tier 1 risk-based capital | IBERIABANK Corporation | N/A | 11.38 | 11.25 | |||||||
| IBERIABANK | 8.00 | % | 11.14 | 10.95 | |||||||
| Total risk-based capital | IBERIABANK Corporation | N/A | 12.43 | 12.33 | |||||||
| IBERIABANK | 10.00 | % | 11.76 | 11.58 | |||||||
Minimum capital ratios are subject to a capital conservation buffer. In order to avoid limitations on distributions, including dividend payments, and certain discretionary bonus payments to executive officers, an institution must hold a capital conservation buffer above its minimum risk-based capital requirements. This capital conservation buffer is calculated as the lowest of the differences between the actual CET1 ratio, Tier 1 Risk-Based Capital Ratio, and Total Risk-Based Capital ratio and the corresponding minimum ratios. At December 31, 2019, the required minimum capital conservation buffer was 2.50%. At December 31, 2019, the capital conservation buffers of the Company and IBERIABANK were 4.43% and 3.76%, respectively.
LIQUIDITY AND OTHER OFF-BALANCE SHEET ACTIVITIES
Liquidity refers to the Company’s ability to generate sufficient cash flows to support its operations and to meet its obligations, including the withdrawal of deposits by customers, commitments to originate loans, and its ability to repay its borrowings and other liabilities. Liquidity risk is the risk to earnings or capital resulting from the Company’s inability to fulfill its obligations as they become due. Liquidity risk also develops from the Company’s failure to timely recognize or address changes in market conditions that affect the ability to liquidate assets in a timely manner or to obtain adequate funding to continue to operate on a profitable basis.
The primary sources of funds for the Company are deposits and borrowings. Other sources of funds include repayments and maturities of loans and investment securities, securities sold under agreements to repurchase, and, to a lesser extent, off-balance sheet borrowing availability. Time deposits scheduled to mature in one year or less at December 31, 2019 totaled $3.8 billion. Based on past experience, management believes that a significant portion of maturing deposits will remain with the Company. Additionally, the majority of the investment securities portfolio is classified as available for sale, which provides the ability to liquidate unencumbered securities as needed. Of the $4.1 billion in the investment securities portfolio, $1.9 billion is unencumbered and $2.2 billion has been pledged to support repurchase transactions, public funds deposits and certain long-term borrowings. Due to the relatively short implied duration of the investment securities portfolio, the Company has historically experienced consistent cash inflows on a regular basis. Securities cash flows are highly dependent on prepayment speeds and could change materially as economic or market conditions change.
Scheduled cash flows from the amortization and maturities of loans and securities are relatively predictable sources of funds. Conversely, deposit flows, prepayments of loans and securities, and draws on customer letters and lines of credit are greatly influenced by general interest rates, economic conditions, competition, and customer demand. The FHLB of Dallas provides an additional source of liquidity to make funds available for general requirements and also to assist with the variability of less predictable funding sources. At December 31, 2019, the Company had $1.2 billion in outstanding FHLB advances, all of which were long-term. Additional FHLB borrowing capacity available at December 31, 2019 amounted to $8.4 billion. At December 31, 2019, the Company also had various funding arrangements with the Federal Reserve discount window and commercial banks providing up to $332.6 million in the form of federal funds and other lines of credit. At December 31, 2019, there were no balances outstanding on these lines and all of the funding was available to the Company.
Liquidity management is both a daily and long-term function of business management. The Company manages its liquidity with the objective of maintaining sufficient funds to respond to the predicted needs of depositors and borrowers and to take advantage of investments in earning assets and other earnings enhancement opportunities. Excess liquidity is generally invested in short-term investments such as overnight deposits. On a longer-term basis, the Company maintains a strategy of investing in various lending and investment security products. The Company uses its sources of funds primarily to fund loan commitments and meet its ongoing commitments associated with its operations. Based on its available cash at December 31, 2019 and current deposit modeling, the Company believes it has adequate liquidity to fund ongoing operations. The Company has adequate availability of funds from deposits, borrowings, repayments and maturities of loans and investment securities to provide the Company additional working capital if needed.
In the normal course of business, the Company is a party to a number of activities that contain credit, market and operational risk that are not reflected in whole or in part in the Company’s consolidated financial statements. Such activities include traditional off-balance sheet credit-related financial instruments. The Company provides customers with off-balance sheet credit support through loan commitments, lines of credit, and standby letters of credit. Many of the commitments are expected to expire unused or be only partially used; therefore, the total amount of commitments does not necessarily represent future cash requirements. Based on its available liquidity and available borrowing capacity, the Company anticipates it will continue to have sufficient funds to meet its current commitments.
At December 31, 2019, the Company’s unfunded loan commitments outstanding totaled $806.2 million. At the same date, unused lines of credit, including credit card lines, amounted to $7.2 billion, as shown in the following table.
TABLE 24—COMMITMENT EXPIRATION PER PERIOD
| (in thousands) | Less than 1 year | 1—3 Years | 3—5 Years | Over 5 Years | Total | ||||||||||||||
| Unused lines of credit: | |||||||||||||||||||
| Real estate - construction | $ | 317,252 | $ | 701,719 | $ | 159,090 | $ | 6,548 | $ | 1,184,609 | |||||||||
| Real estate - owner-occupied | 42,959 | 49,076 | 5,209 | 7,222 | 104,466 | ||||||||||||||
| Real estate - non-owner occupied | 171,127 | 159,035 | 66,039 | 5,291 | 401,492 | ||||||||||||||
| Commercial and industrial | 1,537,966 | 1,278,924 | 679,221 | 54,733 | 3,550,844 | ||||||||||||||
| Mortgage | 71,098 | 37,438 | — | 228 | 108,764 | ||||||||||||||
| Consumer and other | 905,124 | 88,820 | 16,033 | 880,656 | 1,890,633 | ||||||||||||||
| Total unused lines of credit | 3,045,526 | 2,315,012 | 925,592 | 954,678 | 7,240,808 | ||||||||||||||
| Unfunded loan commitments | 806,164 | — | — | — | 806,164 | ||||||||||||||
| Standby letters of credit | 208,509 | 116,317 | 2,500 | 10 | 327,336 | ||||||||||||||
| $ | 4,060,199 | $ | 2,431,329 | $ | 928,092 | $ | 954,688 | $ | 8,374,308 | ||||||||||
The Company has entered into a number of long-term arrangements to support the ongoing activities of the Company. The required payments under such leasing and other debt commitments at December 31, 2019 are shown in the following table.
TABLE 25—CONTRACTUAL OBLIGATIONS AND OTHER DEBT COMMITMENTS
| (in thousands) | 2020 | 2021 | 2022 | 2023 | 2024 | 2025 and After | Total | ||||||||||||||||||||
| Operating leases | $ | 25,928 | $ | 24,083 | $ | 21,663 | $ | 16,916 | $ | 12,598 | $ | 63,912 | $ | 165,100 | |||||||||||||
| Time deposits | 3,844,086 | 308,955 | 86,967 | 17,440 | 15,519 | 675 | 4,273,642 | ||||||||||||||||||||
| Short-term borrowings | 204,208 | — | — | — | — | — | 204,208 | ||||||||||||||||||||
| Long-term debt | 582,371 | 175,255 | 10,564 | 58,597 | 6,242 | 510,658 | 1,343,687 | ||||||||||||||||||||
| $ | 4,656,593 | $ | 508,293 | $ | 119,194 | $ | 92,953 | $ | 34,359 | $ | 575,245 | $ | 5,986,637 | ||||||||||||||
ASSET/LIABILITY MANAGEMENT, MARKET RISK AND COUNTERPARTY CREDIT RISK
The principal objective of the Company’s asset and liability management function is to evaluate the Company's interest rate risk included in certain balance sheet accounts, determine the appropriate level of risk given the Company’s business focus, operating environment, capital and liquidity requirements, and performance objectives, establish prudent asset concentration guidelines and manage the risk consistent with Board-approved guidelines. Through such management, the Company seeks to reduce the vulnerability of its operations to changes in interest rates. The Company’s actions in this regard are taken under the guidance of the Asset and Liability Committee. The Asset and Liability Committee reviews, among other things, the sensitivity of the Company’s assets and liabilities to interest rate changes, local and national market conditions, and interest rates. As a part of this review, the Asset and Liability Committee generally reviews the Company’s liquidity, cash flow needs, composition of investments, deposits, borrowings, and capital position.
The objective of interest rate risk management is to control the effects that interest rate fluctuations have on net interest income and on the net present value of the Company’s earning assets and interest-bearing liabilities. Management and the Board are responsible for managing interest rate risk and employing risk management policies that monitor and limit this exposure. Interest rate risk is measured using net interest income simulation and asset/liability net present value sensitivity analyses. The Company uses financial modeling to measure the impact of changes in interest rates on the net interest margin and to predict market risk. Estimates are based upon numerous assumptions including the nature and timing of interest rate levels including yield curve shape, prepayments on loans and securities, deposit decay rates, pricing decisions on loans and deposits, reinvestment/replacement of asset and liability cash flows, and others. These analyses provide a range of potential impacts on net interest income and portfolio equity caused by interest rate movements.
Included in the modeling are instantaneous parallel rate shift scenarios, which are utilized to establish exposure limits. These scenarios are known as “rate shocks” because all rates are modeled to change instantaneously by the indicated shock amount, rather than a gradual rate shift over a period of time.
The Company’s interest rate risk model indicates that the Company is asset sensitive in terms of interest rate sensitivity. Based on the Company’s interest rate risk model at December 31, 2019, the table below illustrates the impact of an immediate and sustained 100 and 200 basis point increase or decrease in interest rates on net interest income over the next twelve months.
TABLE 26—INTEREST RATE SENSITIVITY
| Shift in Interest Rates (in bps) | % Change in Projected Net Interest Income | |
| +200 | 3.3% | |
| +100 | 1.9% | |
| -100 | (5.7)% | |
| -200 | (11.3)% | |
The influence of using the forward curve as of December 31, 2019 as a basis for projecting the interest rate environment would approximate a 0.3% decrease in net interest income over the next 12 months. The computations of interest rate risk shown above are performed on a static balance sheet and do not necessarily include certain actions that management may undertake to manage this risk in response to unanticipated changes in interest rates and other factors including shifts in deposit behavior.
The short-term interest rate environment is primarily a function of the monetary policy of the FRB. The principal tools of the FRB for implementing monetary policy are open market operations, or the purchases and sales of U.S. Treasury and Federal agency securities, as well as the establishment of a short-term target rate. The FRB’s objective for open market operations has varied over the years, but the focus has gradually shifted toward attaining a specified level of the Federal funds rate to achieve the long-run goals of price stability and sustainable economic growth. The Federal funds rate is the basis for overnight funding and drives the short end of the yield curve. Longer maturities are influenced by the market’s expectations for economic growth and inflation, but can also be influenced by FRB purchases and sales and expectations of monetary policy going forward.
The FOMC of the FRB, in an attempt to stimulate the overall economy, has, among other things, kept interest rates low through its targeted federal funds rate. While the FOMC continues to observe sustained economic activity, strong labor market conditions, and stable inflation, it has signaled a pause in its recent efforts to increase the federal funds rate and made three recent cuts of 25 basis points each in 2019. Decreases in the federal funds rate could cause overall interest rates to fall, which may negatively impact financial performance from greater borrower refinancing incentives. Increases in the federal funds rate and the unwinding of its balance sheet could cause overall interest rates to rise, which may negatively impact the U.S. real estate markets and affect deposit growth and pricing. In addition, deflationary pressures, while possibly lowering our operating costs, could have a significant negative effect on our borrowers, especially our business borrowers, and the values of collateral securing loans, which could negatively affect our financial performance.
The Company’s commercial loan portfolio is also impacted by fluctuations in the level of one-month LIBOR, as a large portion of this portfolio reprices based on this index, and to a lesser extent Prime. Net interest income may be reduced if more interest-earning assets than interest-bearing liabilities reprice or mature during a period when interest rates are declining, or if more interest-bearing liabilities than interest-earning assets reprice or mature during a period when interest rates are rising.
In July 2017, the Financial Conduct Authority (the authority that regulates LIBOR) announced it intends to stop compelling banks to submit rates for the calculation of LIBOR after 2021. The ARRC has proposed that SOFR is the rate that represents best practice as the alternative to LIBOR for use in derivatives and other financial contracts that are currently indexed to LIBOR. ARRC has proposed a paced market transition plan to SOFR from LIBOR and organizations are currently working on industry-wide and company-specific transition plans as it relates to derivatives and cash markets exposed to LIBOR. We are not currently able to predict the impact that the transition from LIBOR will have on the Company though we are monitoring this activity and evaluating related risks. Efforts the Company has initiated include (1) developing an inventory of affected loans, securities and other instruments, (2) evaluating and drafting modifications as needed to address loans outstanding at the time of LIBOR retirement and (3) assessing revisions to product pricing structures based on alternative reference rates.
The table below presents the Company’s anticipated repricing of loans and investment securities over the next four quarters.
TABLE 27—REPRICING OF CERTAIN EARNING ASSETS (1)
| (in thousands) | 1Q 2020 | 2Q 2020 | 3Q 2020 | 4Q 2020 | Total less than one year | ||||||||||||||
| Investment securities | $ | 394,660 | $ | 272,623 | $ | 273,817 | $ | 258,549 | $ | 1,199,649 | |||||||||
| Fixed rate loans | 811,089 | 699,689 | 643,893 | 572,693 | 2,727,364 | ||||||||||||||
| Variable rate loans | 11,453,042 | 490,145 | 357,652 | 321,307 | 12,622,146 | ||||||||||||||
| Total | $ | 12,658,791 | $ | 1,462,457 | $ | 1,275,362 | $ | 1,152,549 | $ | 16,549,159 | |||||||||
(1) Amounts include expected maturities, scheduled paydowns, expected prepayments, and loans subject to caps and floors and exclude the repricing of assets from prior periods, as well as non-accrual loans and market value adjustments.
As part of its asset/liability management strategy, the Company has generally seen greater levels of loan originations with adjustable or variable rates of interest in commercial and consumer loan products, which typically have shorter terms than residential mortgage loans. The majority of fixed-rate, long-term, agency-conforming residential loans are sold in the secondary market to avoid bearing the interest rate risk associated with longer duration assets in the current rate environment. However, the Sabadell and Gibraltar acquisitions brought a considerable amount of jumbo, non-agency-conforming residential mortgage loan exposure onto the balance sheet, both fixed rate and variable rate in nature, which has increased the overall duration of the portfolio. As of December 31, 2019, $14.8 billion, or 62%, of the Company’s total loan portfolio had variable interest rates, of which $2.9 billion, or 20%, had an expected repricing date beyond the next four quarters. The Company had no significant concentration to any single borrower or industry segment at December 31, 2019.
The Company’s strategy with respect to liabilities in recent periods has been to emphasize transaction accounts, particularly non-interest or low interest-bearing transaction accounts, which are significantly less sensitive to changes in interest rates. At December 31, 2019, 83% of the Company’s deposits were in transaction and limited-transaction accounts, compared to 85% at December 31, 2018. Non-interest-bearing transaction accounts were 25% of total deposits at December 31, 2019, compared to 28% of total deposits at December 31, 2018.
The behavior of non-interest-bearing deposits and other types of demand deposits is one of the most important assumptions used in determining the interest rate and liquidity risk positions. A loss of these deposits in the future would reduce the asset sensitivity of the Company’s balance sheet as interest-bearing funds would most likely be increased to offset the loss of this favorable funding source.
The table below presents the Company’s anticipated repricing of liabilities over the next four quarters.
TABLE 28—REPRICING OF LIABILITIES (1)
| (in thousands) | 1Q 2020 | 2Q 2020 | 3Q 2020 | 4Q 2020 | Total less than one year | ||||||||||||||
| Time deposits | $ | 1,383,819 | $ | 1,329,243 | $ | 838,521 | $ | 292,653 | $ | 3,844,236 | |||||||||
| Short-term borrowings | 204,208 | — | — | — | 204,208 | ||||||||||||||
| Long-term debt | 175,792 | 120,454 | 150,395 | 256,771 | 703,412 | ||||||||||||||
| Total | $ | 1,763,819 | $ | 1,449,697 | $ | 988,916 | $ | 549,424 | $ | 4,751,856 | |||||||||
(1) Amounts exclude the repricing of liabilities from prior periods.
As part of an overall interest rate risk management strategy, derivative instruments may also be used as an efficient way to modify the repricing or maturity characteristics of on-balance sheet assets and liabilities. Management may from time to time engage in such derivative instruments to effectively manage interest rate risk. These derivative instruments of the Company would modify net interest sensitivity to levels deemed appropriate.
IMPACT OF INFLATION OR DEFLATION AND CHANGING PRICES
The consolidated financial statements and related financial data presented herein have been prepared in accordance with GAAP, which generally require the measurement of financial position and operating results in terms of historical dollars, without considering changes in relative purchasing power over time due to inflation. Unlike most industrial companies, the majority of the Company’s assets and liabilities are monetary in nature. As a result, interest rates generally have a more significant impact on the Company’s performance than does the effect of inflation. Although fluctuations in interest rates are neither completely predictable nor controllable, the Company regularly monitors its interest rate position and oversees its financial risk management by establishing policies and operating limits. Interest rates do not necessarily move in the same direction or in the same magnitude as the prices of goods and services, since such prices are affected by inflation to a larger extent than interest rates. Although not as critical to the banking industry as to other industries, inflationary factors may have some impact on the Company’s growth, earnings, total assets and capital levels. Management does not expect inflation to be a significant factor in 2020.
Conversely, a period of deflation could affect our business, as well as all financial institutions and other industries. Deflation could lead to lower profits, higher unemployment, lower production and deterioration in overall economic conditions. In addition, deflation could depress economic activity, including loan demand and the ability of borrowers to repay loans, and consequently impair earnings through increasing the value of debt while decreasing the value of collateral for loans.
Management believes the most significant potential impact of deflation on financial results relates to the Company's ability to maintain a sufficient amount of capital to cushion against future losses. However, the Company would employ certain risk management tools to maintain its balance sheet strength in the event a deflationary scenario were to develop.
NON-GAAP MEASURES
This discussion and analysis contains financial information determined by methods other than in accordance with GAAP. The Company’s management uses these non-GAAP financial measures in their analysis of the Company’s performance. Non-GAAP measures include, but are not limited to, descriptions such as core, tangible, and pre-tax pre-provision. These measures typically adjust GAAP performance measures to exclude the effects of the amortization of intangibles and include the tax benefit associated with revenue items that are tax-exempt, as well as adjust income available to common shareholders for certain significant activities or transactions that, in management’s opinion, can distort period-to-period comparisons of the Company’s performance. Transactions that are typically excluded from non-GAAP performance measures include realized and unrealized gains/losses on former bank owned real estate, realized gains/losses on securities, income tax gains/losses, merger-related charges and recoveries, litigation charges and recoveries, and debt repayment penalties. Management believes presentations of these non-GAAP financial measures provide useful supplemental information that is essential to a proper understanding of the operating results of the Company’s core businesses. These non-GAAP disclosures should not be viewed as a substitute for operating results determined in accordance with GAAP, nor are they necessarily comparable to non-GAAP performance measures that may be presented by other companies. Reconciliations of GAAP to non-GAAP disclosures are presented in Table 29. The Company is unable to estimate GAAP EPS guidance without unreasonable efforts due to the nature of one-time or unusual items that cannot be predicted, and therefore has not provided this information under Regulation S-K Item 10(e)(1)(i)(B).
TABLE 29—RECONCILIATIONS OF NON-GAAP FINANCIAL MEASURES
| 2019 | 2018 | 2017 | |||||||||||||||||||||||||||||||||
| (in thousands, except per share amounts) | Pre-tax | After-tax | Per share (2) | Pre-tax | After-tax | Per share (2) | Pre-tax | After-tax | Per share (2) | ||||||||||||||||||||||||||
| Net income | $ | 499,593 | $ | 384,155 | $ | 7.16 | $ | 402,527 | $ | 370,249 | $ | 6.63 | $ | 292,879 | $ | 142,413 | $ | 2.77 | |||||||||||||||||
| Less: Preferred stock dividends | — | 12,602 | 0.24 | — | 9,095 | 0.17 | — | 9,095 | 0.18 | ||||||||||||||||||||||||||
| Income available to common shareholders (GAAP) | $ | 499,593 | $ | 371,553 | $ | 6.92 | $ | 402,527 | $ | 361,154 | $ | 6.46 | $ | 292,879 | $ | 133,318 | $ | 2.59 | |||||||||||||||||
Non-interest income adjustments (1): | |||||||||||||||||||||||||||||||||||
| Loss on sale of investments | 998 | 758 | 0.01 | 49,899 | 37,923 | 0.68 | 148 | 97 | — | ||||||||||||||||||||||||||
| Other non-core non-interest income | — | — | — | 415 | 316 | — | — | — | — | ||||||||||||||||||||||||||
| Total non-interest income adjustments | 998 | 758 | 0.01 | 50,314 | 38,239 | 0.68 | 148 | 97 | — | ||||||||||||||||||||||||||
Non-interest expense adjustments (1): | |||||||||||||||||||||||||||||||||||
| Merger-related expense | 10,977 | 10,567 | 0.20 | 31,295 | 23,919 | 0.44 | 40,971 | 28,566 | 0.55 | ||||||||||||||||||||||||||
| Compensation-related expense | (9 | ) | (7 | ) | — | 4,290 | 3,261 | 0.05 | 3,025 | 1,966 | 0.04 | ||||||||||||||||||||||||
| Impairment of long-lived assets, net of gain/loss on sale | 994 | 755 | 0.01 | 10,837 | 8,236 | 0.15 | 6,961 | 4,525 | 0.09 | ||||||||||||||||||||||||||
| Gain on early termination of loss share agreements | — | — | — | (2,708 | ) | (2,058 | ) | (0.04 | ) | — | — | — | |||||||||||||||||||||||
| Litigation expense | — | — | — | — | — | — | 11,692 | 11,405 | 0.22 | ||||||||||||||||||||||||||
| Other non-core non-interest expense | (3,030 | ) | (2,303 | ) | (0.04 | ) | (133 | ) | (102 | ) | 0.01 | 844 | 603 | 0.01 | |||||||||||||||||||||
| Total non-interest expense adjustments | 8,932 | 9,012 | 0.17 | 43,581 | 33,256 | 0.61 | 63,493 | 47,065 | 0.91 | ||||||||||||||||||||||||||
| Income tax expense (benefit) - impact of the Tax Act | — | — | — | — | (58,745 | ) | (1.06 | ) | — | 51,023 | 0.99 | ||||||||||||||||||||||||
| Income tax expense (benefit) - other | — | (5,209 | ) | (0.09 | ) | — | 173 | — | — | (1,237 | ) | (0.02 | ) | ||||||||||||||||||||||
| Core earnings (Non-GAAP) | 509,523 | 376,114 | 7.01 | 496,422 | 374,077 | 6.69 | 356,520 | 230,266 | 4.47 | ||||||||||||||||||||||||||
Provision for credit losses (1) | 41,657 | 31,659 | 40,385 | 30,692 | 51,708 | 33,610 | |||||||||||||||||||||||||||||
| Pre-provision earnings, as adjusted (Non-GAAP) | $ | 551,180 | $ | 407,773 | $ | 536,807 | $ | 404,769 | $ | 408,228 | $ | 263,876 | |||||||||||||||||||||||
(1) | Excluding preferred stock dividends, merger-related expense, and litigation expense, after-tax amounts are calculated using a tax rate of 24% in 2019 and 2018 and 35% in 2017, which approximates the marginal tax rate. |
(2) | Diluted per share amounts may not appear to foot due to rounding. |
| (in thousands) | 2019 | 2018 | 2017 | ||||||||
| Net interest income (GAAP) | $ | 989,646 | $ | 1,013,248 | $ | 808,846 | |||||
| Taxable equivalent benefit | 5,375 | 5,760 | 10,308 | ||||||||
Net interest income (TE) (Non-GAAP) (1) | $ | 995,021 | $ | 1,019,008 | $ | 819,154 | |||||
Non-interest income (GAAP)(3) | $ | 234,360 | $ | 152,562 | $ | 202,147 | |||||
| Taxable equivalent benefit | 1,913 | 1,677 | 2,736 | ||||||||
Non-interest income (TE) (Non-GAAP) (1)(3) | 236,273 | 154,239 | 204,883 | ||||||||
Taxable equivalent revenues (Non-GAAP) (1)(3) | 1,231,294 | 1,173,247 | 1,024,037 | ||||||||
| Loss on sale of investments and other non-interest income | 998 | 50,314 | 148 | ||||||||
Core taxable equivalent revenues (Non-GAAP) (1)(3) | $ | 1,232,292 | $ | 1,223,561 | $ | 1,024,185 | |||||
Total non-interest expense (GAAP)(3) | $ | 682,756 | $ | 722,898 | $ | 666,406 | |||||
| Less: Intangible amortization expense | 18,464 | 21,678 | 12,590 | ||||||||
Tangible non-interest expense (Non-GAAP) (2)(3) | 664,292 | 701,220 | 653,816 | ||||||||
| Less: Merger-related expense | 10,977 | 31,295 | 40,971 | ||||||||
| Compensation-related expense | (9 | ) | 4,290 | 3,025 | |||||||
| Impairment of long-lived assets, net of loss on sale | 994 | 10,837 | 6,961 | ||||||||
| Gain on early termination of loss share agreements | — | (2,708 | ) | — | |||||||
| Litigation expense | — | — | 11,692 | ||||||||
| Other non-core non-interest expense | (3,030 | ) | (133 | ) | 844 | ||||||
Core tangible non-interest expense (Non-GAAP) (2)(3) | $ | 655,360 | $ | 657,639 | $ | 590,323 | |||||
| Average assets (GAAP) | $ | 31,377,868 | $ | 29,578,026 | $ | 24,480,656 | |||||
| Less: Average intangible assets, net | 1,306,061 | 1,307,156 | 957,209 | ||||||||
Total average tangible assets (Non-GAAP) (2) | $ | 30,071,807 | $ | 28,270,870 | $ | 23,523,447 | |||||
| Total shareholders’ equity (GAAP) | $ | 4,336,734 | $ | 4,056,277 | $ | 3,696,791 | |||||
| Less: Goodwill and other intangibles | 1,297,095 | 1,315,462 | 1,271,807 | ||||||||
| Preferred stock | 228,485 | 132,097 | 132,097 | ||||||||
Tangible common equity (Non-GAAP) (2) | $ | 2,811,154 | $ | 2,608,718 | $ | 2,292,887 | |||||
| Average shareholders’ equity (GAAP) | $ | 4,233,581 | $ | 3,882,728 | $ | 3,508,350 | |||||
| Less: Average preferred equity | 203,943 | 132,097 | 132,097 | ||||||||
| Average common equity | 4,029,638 | 3,750,631 | 3,376,253 | ||||||||
| Less: Average intangible assets, net | 1,306,061 | 1,307,156 | 957,209 | ||||||||
Average tangible common shareholders' equity (Non-GAAP) (2) | $ | 2,723,577 | $ | 2,443,475 | $ | 2,419,044 | |||||
| Return on average assets (GAAP) | 1.22 | % | 1.25 | % | 0.58 | % | |||||
| Effect of non-core revenues and expenses | 0.02 | 0.05 | 0.40 | ||||||||
| Core return on average assets (Non-GAAP) | 1.24 | % | 1.3 | % | 0.98 | % | |||||
| Return on average common equity (GAAP) | 9.22 | % | 9.63 | % | 3.95 | % | |||||
| Effect of non-core revenues and expenses | 0.11 | 0.34 | 2.87 | ||||||||
| Core return on average common equity (Non-GAAP) | 9.33 | % | 9.97 | % | 6.82 | % | |||||
Effect of intangibles (2) | 5.02 | 6.04 | 3.04 | ||||||||
Core return on average tangible common equity (Non-GAAP) (2) | 14.35 | % | 16.01 | % | 9.86 | % | |||||
Efficiency ratio (GAAP)(3) | 55.78 | % | 62.01 | % | 65.92 | % | |||||
Effect of tax benefit related to tax-exempt income(3) | (0.33 | ) | (0.40 | ) | (0.80 | ) | |||||
Efficiency ratio (TE) (Non-GAAP) (1)(3) | 55.45 | % | 61.61 | % | 65.12 | % | |||||
| Effect of amortization of intangibles | (1.50 | ) | (1.84 | ) | (1.27 | ) | |||||
| Effect of non-core items | (0.77 | ) | (6.02 | ) | (6.20 | ) | |||||
Core tangible efficiency ratio (TE) (Non-GAAP) (1)(2)(3) | 53.18 | % | 53.75 | % | 57.64 | % | |||||
| Total assets (GAAP) | $ | 31,713,450 | $ | 30,833,015 | $ | 27,904,129 | |||||
| Less: Goodwill and other intangibles | 1,297,095 | 1,315,462 | 1,271,807 | ||||||||
Tangible assets (Non-GAAP) (2) | $ | 30,416,355 | $ | 29,517,553 | $ | 26,632,322 | |||||
Tangible common equity ratio (Non-GAAP) (2) | 9.24 | % | 8.84 | % | 8.61 | % | |||||
| Cash Yield: | |||||||||||
| Earning assets average balance (GAAP) | $ | 28,813,376 | $ | 27,199,588 | $ | 22,482,689 | |||||
| Add: Adjustments | 117,872 | 144,127 | 160,675 | ||||||||
| Earning assets average balance, as adjusted (Non-GAAP) | $ | 28,931,248 | $ | 27,343,715 | $ | 22,643,364 | |||||
| Net interest income (GAAP) | $ | 989,646 | $ | 1,013,248 | $ | 808,846 | |||||
| Add: Adjustments | (46,892 | ) | (68,755 | ) | (63,866 | ) | |||||
| Net interest income, as adjusted (Non-GAAP) | $ | 942,754 | $ | 944,493 | $ | 744,980 | |||||
| Yield, as reported | 3.45 | % | 3.75 | % | 3.64 | % | |||||
| Add: Adjustments | (0.17 | ) | (0.28 | ) | (0.31 | ) | |||||
| Yield, as adjusted (Non-GAAP) | 3.28 | % | 3.47 | % | 3.33 | % | |||||
(1) Fully taxable-equivalent (TE) calculations include the tax benefit associated with related income sources that are tax-exempt using a rate of 21% for 2019 and 2018 and 35% for 2017.
(2) Tangible calculations eliminate the effect of goodwill and acquisition-related intangibles and the corresponding amortization expense on a tax-effected basis where applicable.
(3) Certain prior period amounts have been reclassified to conform to the net presentation requirements of ASU No. 2014-09, Revenue from Contracts with Customers, which was adopted effective January 1, 2018. The adoption resulted in a reduction of non-interest income and non-interest expense of approximately $8.9 million in 2017, and had no impact on net income.
TABLE 30 – QUARTERLY RESULTS OF OPERATIONS AND SELECTED CASH FLOW DATA (UNAUDITED)
| 2019 | |||||||||||||||
| (in thousands, except per share data) | Fourth Quarter | Third Quarter | Second Quarter | First Quarter | |||||||||||
| Total interest and dividend income | $ | 314,779 | $ | 333,178 | $ | 335,967 | $ | 326,084 | |||||||
| Total interest expense | 80,289 | 83,845 | 80,628 | 75,600 | |||||||||||
| Net interest income | 234,490 | 249,333 | 255,339 | 250,484 | |||||||||||
| Provision for credit losses | 8,153 | 8,986 | 10,755 | 13,763 | |||||||||||
| Net interest income after provision for credit losses | 226,337 | 240,347 | 244,584 | 236,721 | |||||||||||
| Gain (loss) on sale of available-for-sale securities | 8 | 27 | (1,014 | ) | — | ||||||||||
| Other non-interest income | 59,344 | 63,647 | 59,839 | 52,509 | |||||||||||
| Total non-interest expense | 181,723 | 172,662 | 169,618 | 158,753 | |||||||||||
| Income before income taxes | 103,966 | 131,359 | 133,791 | 130,477 | |||||||||||
| Income tax expense | 21,390 | 31,509 | 32,193 | 30,346 | |||||||||||
| Net income | $ | 82,576 | $ | 99,850 | $ | 101,598 | $ | 100,131 | |||||||
| Less: Preferred stock dividends | 4,456 | 3,599 | 949 | 3,598 | |||||||||||
| Net income available to common shareholders | $ | 78,120 | $ | 96,251 | $ | 100,649 | $ | 96,533 | |||||||
| Less: Earnings allocated to unvested restricted stock | 753 | 874 | 999 | 933 | |||||||||||
| Earnings allocated to common shareholders | $ | 77,367 | $ | 95,377 | $ | 99,650 | $ | 95,600 | |||||||
| Earnings per common share - basic | $ | 1.49 | $ | 1.83 | $ | 1.87 | $ | 1.76 | |||||||
| Earnings per common share - diluted | 1.48 | 1.82 | 1.86 | 1.75 | |||||||||||
| Cash dividends declared per common share | 0.45 | 0.45 | 0.43 | 0.43 | |||||||||||
| 2018 | |||||||||||||||
| Fourth Quarter | Third Quarter | Second Quarter | First Quarter | ||||||||||||
| Total interest and dividend income | $ | 330,196 | $ | 317,067 | $ | 303,823 | $ | 270,543 | |||||||
| Total interest expense | 65,175 | 57,842 | 47,710 | 37,654 | |||||||||||
| Net interest income | 265,021 | 259,225 | 256,113 | 232,889 | |||||||||||
| Provision for credit losses | 13,094 | 11,384 | 7,696 | 8,211 | |||||||||||
| Net interest income after provision for credit losses | 251,927 | 247,841 | 248,417 | 224,678 | |||||||||||
| (Loss) gain on sale of available-for-sale securities | (49,844 | ) | — | 3 | (59 | ) | |||||||||
| Other non-interest income | 50,813 | 53,087 | 53,937 | 44,625 | |||||||||||
| Total non-interest expense | 168,989 | 169,062 | 196,776 | 188,071 | |||||||||||
| Income before income taxes | 83,907 | 131,866 | 105,581 | 81,173 | |||||||||||
| Income tax (benefit) expense | (46,132 | ) | 30,401 | 30,457 | 17,552 | ||||||||||
| Net income | $ | 130,039 | $ | 101,465 | $ | 75,124 | $ | 63,621 | |||||||
| Less: Preferred stock dividends | 949 | 3,599 | 949 | 3,598 | |||||||||||
| Net income available to common shareholders | $ | 129,090 | $ | 97,866 | $ | 74,175 | $ | 60,023 | |||||||
| Less: Earnings allocated to unvested restricted stock | 1,214 | 908 | 767 | 639 | |||||||||||
| Earnings allocated to common shareholders | $ | 127,876 | $ | 96,958 | $ | 73,408 | $ | 59,384 | |||||||
| Earnings per common share - basic | $ | 2.33 | $ | 1.74 | $ | 1.31 | $ | 1.11 | |||||||
| Earnings per common share - diluted | 2.32 | 1.73 | 1.30 | 1.10 | |||||||||||
| Cash dividends declared per common share | 0.41 | 0.39 | 0.38 | 0.38 | |||||||||||
| Item 7A. | QUANTITATIVE AND QUALITATIVE DISCLOSURES ABOUT MARKET RISK |
The information required herein is incorporated by reference to “Selected Consolidated Financial and Other Data” in Exhibit 13 hereto.
this Form 10-K.
| Item 8. |
To the Board of Directors of
The management of IBERIABANK Corporation (the “Company”) is responsible for establishing and maintaining effective internal control over financial reporting. The Company’s internal control system was designed to provide reasonable assurance to the Company’s management and Board of Directors regarding the preparation and fair presentation of the Company’s financial statements for external purposes in accordance with U.S. generally accepted accounting principles. Internal control over financial reporting includes self-monitoring mechanisms, and actions are taken to correct deficiencies as they are identified.
All internal control systems, no matter how well designed, have inherent limitations and may not prevent or detect misstatements in the Company’s financial statements, including the possibility of circumvention or overriding of controls. Therefore, even those systems determined to be effective can provide only reasonable assurance with respect to financial statement preparation and presentation. Projections of any evaluation of effectiveness to future periods are subject to the risk that controls may become inadequate because of a change in conditions, or that the degree of compliance with the policies or procedures may deteriorate.
The Company’s management assessed the effectiveness of the Company’s internal control over financial reporting as of December 31, 2017.2019. In making this assessment, it used the criteria set forth by the Committee of Sponsoring Organizations of the Treadway Commission (COSO) in Internal Control—Integrated Framework (2013 Framework). Based on its assessment, management believes that, as of December 31, 2017,2019, the Company’s internal control over financial reporting iswas effective based on those criteria.
The Company’s independent registered public accounting firm has also issued an attestation report, which expresses an unqualified opinion on the effectiveness of ourthe Company’s internal control over financial reporting as of December 31, 20172019.
There was no change in the Company's internal control over financial reporting that occurred during the fourth quarter of 2019 that has materially affected, is likely to materially affect, the Company's internal control over financial reporting.
| /s/ Daryl G. Byrd | /s/ Anthony J. Restel | |
| Daryl G. Byrd | Anthony J. Restel | |
| President and Chief Executive Officer | Vice Chairman and Chief Financial Officer | |
Report of Independent Registered Public Accounting Firm
The Shareholders and the Board of Directors of IBERIABANK Corporation
Opinion on Internal Control over Financial Reporting
We have audited IBERIABANK Corporation and subsidiaries’ internal control over financial reporting as of December 31, 2019, based on criteria established in Internal Control-Integrated Framework issued by the Committee of Sponsoring Organizations of the Treadway Commission (2013 framework) (the COSO criteria). In our opinion, IBERIABANK Corporation and subsidiaries (the Company) maintained, in all material respects, effective internal control over financial reporting as of December 31, 2019, based on the COSO criteria.
We also have audited, in accordance with the standards of the Public Company Accounting Oversight Board (United States) (PCAOB), the consolidated balance sheets of IBERIABANK Corporation and subsidiaries as of December 31, 2019 and 2018, and the related consolidated statements of comprehensive income, shareholders’ equity and cash flows for each of the three years in the period ended December 31, 2019, and the related notes and our report dated March 2, 2020, expressed an unqualified opinion thereon.
Basis for Opinion
The Company’s management is responsible for maintaining effective internal control over financial reporting and for its assessment of the effectiveness of internal control over financial reporting included in the accompanying Management Report on Internal Control Over Financial Reporting. Our responsibility is to express an opinion on the Company’s internal control over financial reporting based on our audit. We are a public accounting firm registered with the PCAOB and are required to be independent with respect to the Company in accordance with the U.S. federal securities laws and the applicable rules and regulations of the Securities and Exchange Commission and the PCAOB.
We conducted our audit in accordance with the standards of the PCAOB. Those standards require that we plan and perform the audit to obtain reasonable assurance about whether effective internal control over financial reporting was maintained in all material respects.
Our audit included obtaining an understanding of internal control over financial reporting, assessing the risk that a material weakness exists, testing and evaluating the design and operating effectiveness of internal control based on the assessed risk, and performing such other procedures as we considered necessary in the circumstances. We believe that our audit provides a reasonable basis for our opinion.
Definition and Limitations of Internal Control Over Financial Reporting
A company’s internal control over financial reporting is a process designed to provide reasonable assurance regarding the reliability of financial reporting and the preparation of financial statements for external purposes in accordance with generally accepted accounting principles. A company’s internal control over financial reporting includes those policies and procedures that (1) pertain to the maintenance of records that, in reasonable detail, accurately and fairly reflect the transactions and dispositions of the assets of the company; (2) provide reasonable assurance that transactions are recorded as necessary to permit preparation of financial statements in accordance with generally accepted accounting principles, and that receipts and expenditures of the company are being made only in accordance with authorizations of management and directors of the company; and (3) provide reasonable assurance regarding prevention or timely detection of unauthorized acquisition, use, or disposition of the company’s assets that could have a material effect on the financial statements.
Because of its inherent limitations, internal control over financial reporting may not prevent or detect misstatements. Also, projections of any evaluation of effectiveness to future periods are subject to the risk that controls may become inadequate because of changes in conditions, or that the degree of compliance with the policies or procedures may deteriorate.
/s/ Ernst & Young LLP
New Orleans, Louisiana
March 2, 2020
Report of Independent Registered Public Accounting Firm
The Shareholders and the Board of Directors of IBERIABANK Corporation
Opinion on the Financial Statements
We have audited the accompanying consolidated balance sheets of IBERIABANK Corporation and subsidiaries (the Company) as of December 31, 2019 and 2018, and the related consolidated statements of comprehensive income, shareholders’ equity and cash flows for each of the three years in the period ended December 31, 2019, and the related notes (collectively referred to as the “consolidated financial statements”). In our opinion, the consolidated financial statements present fairly, in all material respects, the financial position of the Company at December 31, 2019 and 2018, and the results of its operations and its cash flows for each of the three years in the period ended December 31, 2019, in conformity with U.S. generally accepted accounting principles.
We also have audited, in accordance with the standards of the Public Company Accounting Oversight Board (United States) (PCAOB), the Company’s internal control over financial reporting as of December 31, 2019, based on criteria established in Internal Control-Integrated Framework issued by the Committee of Sponsoring Organizations of the Treadway Commission (2013 framework) and our report dated March 2, 2020, expressed an unqualified opinion thereon.
Basis for Opinion
These financial statements are the responsibility of the Company’s management. Our responsibility is to express an opinion on the Company’s financial statements based on our audits. We are a public accounting firm registered with the PCAOB and are required to be independent with respect to the Company in accordance with the U.S. federal securities laws and the applicable rules and regulations of the Securities and Exchange Commission and the PCAOB.
We conducted our audits in accordance with the standards of the PCAOB. Those standards require that we plan and perform the audit to obtain reasonable assurance about whether the financial statements are free of material misstatement, whether due to error or fraud. Our audits included performing procedures to assess the risks of material misstatement of the financial statements, whether due to error or fraud, and performing procedures that respond to those risks. Such procedures included examining, on a test basis, evidence regarding the amounts and disclosures in the financial statements. Our audits also included evaluating the accounting principles used and significant estimates made by management, as well as evaluating the overall presentation of the financial statements. We believe that our audits provide a reasonable basis for our opinion.
Critical Audit Matter
The critical audit matter communicated below is a matter arising from the current period audit of the financial statements that was communicated or required to be communicated to the audit committee and that: (1) relates to accounts or disclosures that are material to the financial statements and (2) involved our especially challenging, subjective or complex judgments. The communication of the critical audit matter does not alter in any way our opinion on the consolidated financial statements, taken as a whole, and we are not, by communicating the critical audit matter below, providing a separate opinion on the critical audit matter or on the account or disclosure to which it relates.
Allowance for loan and lease losses | |
| Description of the matter | The Company’s loans and leases portfolio totaled $24 billion as of December 31, 2019, and the associated allowance for loan and lease losses (ALLL) was $146.6 million. As described in Note 1 to the consolidated financial statements, the ALLL for all non-impaired loans (excluding acquired impaired loans) is calculated based on pools of loans with similar risk characteristics including loan type and risk rating. The pool-level allowance is calculated through the application of probability of default (PD) and loss given default (LGD) factors for each individual loan. The PD and LGD factors are calculated by models that utilize historical default and loss information for similar loans. Qualitative adjustments are incorporated into the pool-level analysis in order to adjust the calculated pool-level allowance to reflect the probable incurred losses estimated at the balance sheet date. Auditing management’s estimate of the ALLL involves a high degree of complexity in testing the models used to calculate the PD and LGD factors utilized in the pool-level allowance calculation. In addition, management’s identification and measurement of the qualitative adjustments used to adjust the calculated pool-level allowance is highly judgmental. |
| How we addressed the matter in our audit | We obtained an understanding, evaluated the design, and tested the operating effectiveness of the Company’s controls that address the risk of material misstatement over the ALLL process. This included testing controls over management’s review and approval of models used to calculate the ALLL, including the completeness and accuracy of data inputs, assumptions, outputs of those models, and the identification and measurement of qualitative adjustments. To test the calculation of the PD and LGD factors, we utilized the assistance of our specialists to test the calculation logic and clerical accuracy of the modeling of the PD and LGD factors, as well as the completeness and accuracy of data from underlying systems and data warehouses that are used in the models. We evaluated management’s identification of historical loss periods used in the models and whether these historic loss periods and the respective loss data were representative of current circumstances and of the recent losses incurred in the portfolios. To test the reasonableness of the qualitative adjustments, we evaluated management’s documentation of the nature of the qualitative adjustments and the underlying rationale for making the adjustments. We obtained and tested support for the amount of the qualitative adjustments. Our procedures also included, among others, evaluating the inputs used by management in determining the qualitative adjustments by obtaining and testing internal and external market data considered by management in determining the qualitative adjustments. In addition, we evaluated the overall ALLL amount, inclusive of the adjustments for qualitative factors, and whether the amount appropriately reflects losses incurred in the loan portfolio as of the consolidated balance sheet date. For example, we independently compared the overall ALLL amount to those established by similar banking institutions with similar loan portfolios. We also reviewed subsequent events and transactions and considered whether they corroborate or contradict the Company’s conclusion. |
/s/ Ernst & Young LLP
We have served as the Company’s auditor since 2007.
New Orleans, Louisiana
March 2, 2020
IBERIABANK CORPORATION AND SUBSIDIARIES
Consolidated Balance Sheets
| December 31, | |||||||
| (in thousands, except share data) | 2019 | 2018 | |||||
| Assets | |||||||
| Cash and due from banks | $ | 289,794 | $ | 294,186 | |||
| Interest-bearing deposits in other banks | 604,929 | 396,267 | |||||
| Total cash and cash equivalents | 894,723 | 690,453 | |||||
| Securities available for sale, at fair value | 3,933,360 | 4,783,579 | |||||
| Securities held to maturity (fair values of $189,899 and $204,277, respectively) | 182,961 | 207,446 | |||||
| Mortgage loans held for sale, at fair value | 213,357 | 107,734 | |||||
| Loans and leases, net of unearned income | 24,021,499 | 22,519,815 | |||||
| Allowance for loan and lease losses | (146,588 | ) | (140,571 | ) | |||
| Loans and leases, net | 23,874,911 | 22,379,244 | |||||
| Premises and equipment, net | 296,688 | 300,507 | |||||
| Goodwill | 1,235,533 | 1,235,533 | |||||
| Other intangible assets | 77,168 | 88,736 | |||||
| Other assets | 1,004,749 | 1,039,783 | |||||
| Total Assets | $ | 31,713,450 | $ | 30,833,015 | |||
| Liabilities | |||||||
| Deposits: | |||||||
| Non-interest-bearing | $ | 6,319,806 | $ | 6,542,490 | |||
| Interest-bearing | 18,899,543 | 17,220,941 | |||||
| Total deposits | 25,219,349 | 23,763,431 | |||||
| Short-term borrowings | 204,208 | 1,482,882 | |||||
| Long-term debt | 1,343,687 | 1,166,151 | |||||
| Other liabilities | 609,472 | 364,274 | |||||
| Total Liabilities | 27,376,716 | 26,776,738 | |||||
| Shareholders’ Equity | |||||||
| Preferred stock, $1 par value - 5,000,000 shares authorized | |||||||
| Non-cumulative perpetual, liquidation preference $10,000 per share; 23,750 and 13,750 shares issued and outstanding, respectively, including related surplus | 228,485 | 132,097 | |||||
| Common stock, $1 par value - 100,000,000 shares authorized; 52,419,519 and 54,796,231 shares issued and outstanding, respectively | 52,420 | 54,796 | |||||
| Additional paid-in capital | 2,688,263 | 2,869,416 | |||||
| Retained earnings | 1,322,805 | 1,042,718 | |||||
| Accumulated other comprehensive income (loss) | 44,761 | (42,750 | ) | ||||
| Total Shareholders’ Equity | 4,336,734 | 4,056,277 | |||||
| Total Liabilities and Shareholders’ Equity | $ | 31,713,450 | $ | 30,833,015 | |||
The accompanying Notes are an integral part of these Consolidated Financial Statements.
IBERIABANK CORPORATION AND SUBSIDIARIES
Consolidated Statements of Comprehensive Income
| Year Ended December 31, | |||||||||||
| (in thousands, except per share data) | 2019 | 2018 | 2017 | ||||||||
| Interest and dividend income | |||||||||||
| Loans and leases, including fees | $ | 1,160,919 | $ | 1,086,662 | $ | 802,947 | |||||
| Mortgage loans held for sale, including fees | 6,710 | 3,748 | 4,679 | ||||||||
| Taxable securities | 117,428 | 107,137 | 87,359 | ||||||||
| Tax-exempt securities | 8,358 | 10,634 | 8,835 | ||||||||
| Other | 16,593 | 13,448 | 9,963 | ||||||||
| Total interest and dividend income | 1,310,008 | 1,221,629 | 913,783 | ||||||||
| Interest expense | |||||||||||
| Deposits | 267,227 | 160,952 | 79,833 | ||||||||
| Short-term borrowings | 15,739 | 14,682 | 7,557 | ||||||||
| Long-term debt | 37,396 | 32,747 | 17,547 | ||||||||
| Total interest expense | 320,362 | 208,381 | 104,937 | ||||||||
| Net interest income | 989,646 | 1,013,248 | 808,846 | ||||||||
| Provision for credit losses | 41,657 | 40,385 | 51,708 | ||||||||
| Net interest income after provision for credit losses | 947,989 | 972,863 | 757,138 | ||||||||
| Non-interest income | |||||||||||
| Mortgage income | 63,030 | 46,424 | 63,570 | ||||||||
| Service charges on deposit accounts | 51,836 | 52,803 | 47,678 | ||||||||
| Title revenue | 25,928 | 24,149 | 21,972 | ||||||||
| Commission income | 16,937 | 8,869 | 6,020 | ||||||||
| Broker commissions | 8,280 | 9,195 | 9,161 | ||||||||
| ATM and debit card fee income | 11,871 | 10,295 | 10,199 | ||||||||
| Credit card and merchant-related income | 13,260 | 12,540 | 10,904 | ||||||||
| Trust department income | 17,058 | 15,981 | 9,705 | ||||||||
| Income from bank owned life insurance | 7,194 | 6,310 | 5,082 | ||||||||
| Loss on sale of available-for-sale securities | (979 | ) | (49,900 | ) | (148 | ) | |||||
| Other non-interest income | 19,945 | 15,896 | 18,004 | ||||||||
| Total non-interest income | 234,360 | 152,562 | 202,147 | ||||||||
| Non-interest expense | |||||||||||
| Salaries and employee benefits | 411,869 | 414,741 | 379,527 | ||||||||
| Net occupancy and equipment | 79,773 | 77,246 | 70,663 | ||||||||
| Communication and delivery | 14,578 | 15,951 | 14,252 | ||||||||
| Marketing and business development | 14,161 | 18,371 | 13,999 | ||||||||
| Computer services expense | 38,108 | 39,680 | 36,790 | ||||||||
| Professional services | 33,284 | 28,698 | 48,545 | ||||||||
| Credit and other loan-related expense | 14,448 | 19,088 | 18,411 | ||||||||
| Insurance | 17,365 | 25,274 | 21,815 | ||||||||
| Travel and entertainment | 10,432 | 10,035 | 11,287 | ||||||||
| Amortization of acquisition intangibles | 18,464 | 21,678 | 12,590 | ||||||||
| Impairment of long-lived assets and other losses | 925 | 27,780 | 12,246 | ||||||||
| Other non-interest expense | 29,349 | 24,356 | 26,281 | ||||||||
| Total non-interest expense | 682,756 | 722,898 | 666,406 | ||||||||
| Income before income tax expense | 499,593 | 402,527 | 292,879 | ||||||||
| Income tax expense | 115,438 | 32,278 | 150,466 | ||||||||
| Net income | 384,155 | 370,249 | 142,413 | ||||||||
| Less: Preferred stock dividends | 12,602 | 9,095 | 9,095 | ||||||||
| Net income available to common shareholders | $ | 371,553 | $ | 361,154 | $ | 133,318 | |||||
| Income available to common shareholders - basic | $ | 371,553 | $ | 361,154 | $ | 133,318 | |||||
| Less: Earnings allocated to unvested restricted stock | 3,559 | 3,583 | 1,210 | ||||||||
| Earnings allocated to common shareholders | $ | 367,994 | $ | 357,571 | $ | 132,108 | |||||
| Earnings per common share - basic | $ | 6.97 | $ | 6.50 | $ | 2.61 | |||||
| Earnings per common share - diluted | 6.92 | 6.46 | 2.59 | ||||||||
| Cash dividends declared per common share | 1.76 | 1.56 | 1.46 | ||||||||
| Comprehensive income | |||||||||||
| Net income | $ | 384,155 | $ | 370,249 | $ | 142,413 | |||||
| Other comprehensive income (loss), net of tax: | |||||||||||
| Unrealized gains (losses) on securities: | |||||||||||
| Unrealized holding gains (losses) arising during the period (net of tax effects of $24,278, $10,870, and $6,244, respectively) | 85,308 | (40,895 | ) | (11,596 | ) | ||||||
| Less: Reclassification adjustment for gains (losses) included in net income (net of tax effects of $230, $10,479, and $52, respectively) | (737 | ) | (39,421 | ) | (96 | ) | |||||
| Unrealized gains (losses) on securities, net of tax | 86,045 | (1,474 | ) | (11,500 | ) | ||||||
| Fair value of derivative instruments designated as cash flow hedges: | |||||||||||
| Change in fair value of derivative instruments designated as cash flow hedges during the period (net of tax effects of $495, $1,174, and $329, respectively) | 1,078 | 4,416 | (611 | ) | |||||||
| Less: Reclassification adjustment for gains (losses) included in net income (net of tax effects of $120, $52, and $210, respectively) | (388 | ) | (196 | ) | (390 | ) | |||||
| Fair value of derivative instruments designated as cash flow hedges, net of tax | 1,466 | 4,612 | (221 | ) | |||||||
| Other comprehensive income (loss), net of tax | 87,511 | 3,138 | (11,721 | ) | |||||||
| Comprehensive income | $ | 471,666 | $ | 373,387 | $ | 130,692 | |||||
The accompanying Notes are an integral part of these Consolidated Financial Statements.
IBERIABANK CORPORATION AND SUBSIDIARIES
Consolidated Statements of Shareholders’ Equity
| Preferred Stock | Common Stock | ||||||||||||||||||||||||||||
| (in thousands, except share and per share data) | Shares | Amount | Shares | Amount | Additional Paid-In Capital | Retained Earnings | Accumulated Other Comprehensive Income (Loss) | Total | |||||||||||||||||||||
| Balance, December 31, 2016 | 13,750 | $ | 132,097 | 44,795,386 | $ | 44,795 | $ | 2,084,446 | $ | 704,391 | $ | (26,035 | ) | $ | 2,939,694 | ||||||||||||||
| Net income | — | — | — | — | — | 142,413 | — | 142,413 | |||||||||||||||||||||
| Other comprehensive income (loss) | — | — | — | — | — | — | (11,721 | ) | (11,721 | ) | |||||||||||||||||||
| Cash dividends declared, $1.46 per share | — | — | — | — | — | (76,615 | ) | — | (76,615 | ) | |||||||||||||||||||
Reclassification of AOCI to RE due to Tax Act (1) | — | — | — | — | — | 8,132 | (8,132 | ) | — | ||||||||||||||||||||
| Preferred stock dividends | — | — | — | — | — | (9,095 | ) | — | (9,095 | ) | |||||||||||||||||||
| Common stock issued under incentive plans, net of shares surrendered in payment | — | — | 366,582 | 367 | (882 | ) | — | — | (515 | ) | |||||||||||||||||||
| Common stock issued | — | — | 6,100,000 | 6,100 | 479,051 | — | — | 485,151 | |||||||||||||||||||||
| Common stock issued for acquisitions | — | — | 2,610,304 | 2,610 | 208,433 | — | — | 211,043 | |||||||||||||||||||||
| Share-based compensation expense | — | — | — | — | 16,436 | — | — | 16,436 | |||||||||||||||||||||
| Balance, December 31, 2017 | 13,750 | $ | 132,097 | 53,872,272 | $ | 53,872 | $ | 2,787,484 | $ | 769,226 | $ | (45,888 | ) | $ | 3,696,791 | ||||||||||||||
Cumulative-effect adjustment due to the adoption of ASU 2016-01 (2) | — | — | — | — | — | (345 | ) | — | (345 | ) | |||||||||||||||||||
| Net income | — | — | — | — | — | 370,249 | — | 370,249 | |||||||||||||||||||||
| Other comprehensive income (loss) | — | — | — | — | — | — | 3,138 | 3,138 | |||||||||||||||||||||
| Cash dividends declared, $1.56 per share | — | — | — | — | — | (87,317 | ) | — | (87,317 | ) | |||||||||||||||||||
| Preferred stock dividends | — | — | — | — | — | (9,095 | ) | — | (9,095 | ) | |||||||||||||||||||
| Common stock issued under incentive plans, net of shares surrendered in payment | — | — | 108,686 | 109 | (3,335 | ) | — | — | (3,226 | ) | |||||||||||||||||||
| Common stock issued for acquisitions | — | — | 2,787,773 | 2,788 | 211,871 | — | — | 214,659 | |||||||||||||||||||||
| Common stock repurchases | — | — | (1,972,500 | ) | (1,973 | ) | (146,882 | ) | — | — | (148,855 | ) | |||||||||||||||||
| Share-based compensation expense | — | — | — | — | 20,278 | — | — | 20,278 | |||||||||||||||||||||
| Balance, December 31, 2018 | 13,750 | $ | 132,097 | 54,796,231 | $ | 54,796 | $ | 2,869,416 | $ | 1,042,718 | $ | (42,750 | ) | $ | 4,056,277 | ||||||||||||||
Cumulative-effect adjustment due to the adoption of ASU 2016-02 (3) | — | — | — | — | — | 1,847 | — | 1,847 | |||||||||||||||||||||
| Net income | — | — | — | — | — | 384,155 | — | 384,155 | |||||||||||||||||||||
| Other comprehensive income (loss) | — | — | — | — | — | — | 87,511 | 87,511 | |||||||||||||||||||||
| Cash dividends declared, $1.76 per share | — | — | — | — | — | (93,313 | ) | — | (93,313 | ) | |||||||||||||||||||
| Preferred stock dividends | — | — | — | — | — | (12,602 | ) | — | (12,602 | ) | |||||||||||||||||||
| Preferred stock issued | 10,000 | 96,388 | — | — | — | — | — | 96,388 | |||||||||||||||||||||
| Common stock issued under incentive plans, net of shares surrendered in payment | — | — | 323,288 | 324 | (3,697 | ) | — | — | (3,373 | ) | |||||||||||||||||||
| Common stock repurchases | — | — | (2,700,000 | ) | (2,700 | ) | (202,040 | ) | — | — | (204,740 | ) | |||||||||||||||||
| Share-based compensation expense | — | — | — | — | 24,584 | — | — | 24,584 | |||||||||||||||||||||
| Balance, December 31, 2019 | 23,750 | $ | 228,485 | 52,419,519 | $ | 52,420 | $ | 2,688,263 | $ | 1,322,805 | $ | 44,761 | $ | 4,336,734 | |||||||||||||||
| (1) One-time reclassification from AOCI to RE for stranded tax effects resulting from the Tax Cuts and Jobs Act (the "Tax Act"), enacted on December 22, 2017. | |||||||||||||||||||||||||||||
| (2) Cumulative-effect adjustment to beginning retained earnings for fair value adjustments related to the reclassification of certain equity investments in accordance with ASU 2016-01, adopted as of January 1, 2018. | |||||||||||||||||||||||||||||
| (3) Cumulative-effect adjustment to beginning retained earnings related to the recognition of pre-existing lease liabilities and previously deferred gains on sale-leaseback transactions in accordance with ASU 2016-02, adopted as of January 1, 2019. | |||||||||||||||||||||||||||||
The accompanying Notes are an integral part of these Consolidated Financial Statements.
IBERIABANK CORPORATION AND SUBSIDIARIES
Consolidated Statements of Cash Flows
| Year Ended December 31, | |||||||||||
| (in thousands) | 2019 | 2018 | 2017 | ||||||||
| Cash Flows from Operating Activities | |||||||||||
| Net income | $ | 384,155 | $ | 370,249 | $ | 142,413 | |||||
| Adjustments to reconcile net income to net cash provided by operating activities: | |||||||||||
| Depreciation, amortization, and accretion, including amortization of purchase accounting adjustments and market value adjustments | 16,360 | (7,534 | ) | (4,113 | ) | ||||||
| Provision for credit losses | 41,657 | 40,385 | 51,708 | ||||||||
| Share-based compensation expense - equity awards | 24,584 | 20,278 | 16,436 | ||||||||
| (Gain) loss on sale of OREO and long-lived assets, net of impairment | (1,740 | ) | 4,429 | 1,581 | |||||||
| Loss on sale of securities available for sale | 979 | 49,900 | 148 | ||||||||
| Gain on early termination of FDIC loss share agreements | — | (2,708 | ) | — | |||||||
| Cash paid for early termination of FDIC loss share agreements | — | (5,637 | ) | — | |||||||
| Deferred income tax expense | 30,703 | 153,518 | 71,257 | ||||||||
| Originations of mortgage loans held for sale | (1,967,532 | ) | (1,469,847 | ) | (1,844,358 | ) | |||||
| Proceeds from sales of mortgage loans held for sale | 1,933,973 | 1,543,724 | 1,922,003 | ||||||||
| Realized and unrealized gain on mortgage loans held for sale, net | (64,825 | ) | (45,338 | ) | (62,438 | ) | |||||
| Other operating activities, net | 180,506 | (204,998 | ) | (30,991 | ) | ||||||
| Net Cash Provided by Operating Activities | 578,820 | 446,421 | 263,646 | ||||||||
| Cash Flows from Investing Activities | |||||||||||
| Proceeds from sales of securities available for sale | 299,513 | 1,035,482 | 682,349 | ||||||||
| Proceeds from maturities, prepayments and calls of securities available for sale | 845,726 | 635,183 | 568,250 | ||||||||
| Purchases of securities available for sale, net of securities available for sale acquired | (210,237 | ) | (1,959,952 | ) | (1,475,008 | ) | |||||
| Proceeds from maturities, prepayments and calls of securities held to maturity | 21,727 | 16,841 | 8,687 | ||||||||
| Purchases of securities held to maturity | — | — | (148,234 | ) | |||||||
| Purchases of equity securities, net of equity securities acquired | (15,154 | ) | (30,904 | ) | (71,684 | ) | |||||
| Proceeds from sales of equity securities | 43,284 | 88,200 | 21,532 | ||||||||
| Increase in loans, net of loans acquired | (1,477,677 | ) | (949,953 | ) | (976,488 | ) | |||||
| Proceeds from sales of premises and equipment | 11,806 | 6,374 | 354 | ||||||||
| Purchases of premises and equipment, net of premises and equipment acquired | (35,000 | ) | (13,730 | ) | (37,763 | ) | |||||
| Proceeds from dispositions of OREO | 13,136 | 15,810 | 25,624 | ||||||||
| Cash paid for additional investment in tax credit entities | (11,414 | ) | (18,818 | ) | (16,401 | ) | |||||
| Cash received (paid) for acquisition of a business, net of cash paid | — | 99,318 | (490,435 | ) | |||||||
| Purchase of bank owned life insurance policies | — | (50,000 | ) | — | |||||||
| Other investing activities, net | 1,000 | 343 | 636 | ||||||||
| Net Cash Used in Investing Activities | (513,290 | ) | (1,125,806 | ) | (1,908,581 | ) | |||||
| Cash Flows from Financing Activities | |||||||||||
| Increase (decrease) in deposits, net of deposits acquired | 1,455,918 | 1,232,603 | (323,257 | ) | |||||||
| Net change in short-term borrowings, net of borrowings acquired | (1,278,674 | ) | 491,585 | (38,377 | ) | ||||||
| Proceeds from long-term debt, net of long-term debt acquired | 500,000 | 937,917 | 964,974 | ||||||||
| Repayments of long-term debt | (321,987 | ) | (1,672,033 | ) | (97,259 | ) | |||||
| Cash dividends paid on common stock | (92,190 | ) | (84,782 | ) | (72,772 | ) | |||||
| Cash dividends paid on preferred stock | (12,602 | ) | (9,095 | ) | (9,095 | ) | |||||
| Net share-based compensation stock transactions | (3,373 | ) | (3,226 | ) | (832 | ) | |||||
| Payments to repurchase common stock | (204,740 | ) | (148,855 | ) | — | ||||||
| Net proceeds from issuance of common stock | — | — | 485,151 | ||||||||
| Net proceeds from issuance of preferred stock | 96,388 | — | — | ||||||||
| Net Cash Provided by Financing Activities | 138,740 | 744,114 | 908,533 | ||||||||
| Net Increase (Decrease) In Cash and Cash Equivalents | 204,270 | 64,729 | (736,402 | ) | |||||||
| Cash and Cash Equivalents at Beginning of Period | 690,453 | 625,724 | 1,362,126 | ||||||||
| Cash and Cash Equivalents at End of Period | $ | 894,723 | $ | 690,453 | $ | 625,724 | |||||
| Supplemental Schedule of Non-cash Activities | |||||||||||
| Acquisition of real estate in settlement of loans | $ | 10,847 | $ | 12,557 | $ | 18,170 | |||||
| Common stock issued in acquisitions | $ | — | $ | 214,659 | $ | 211,043 | |||||
| Supplemental Disclosures | |||||||||||
| Cash paid (received) for: | |||||||||||
| Interest on deposits and borrowings, net of acquired | $ | 319,675 | $ | 198,905 | $ | 102,558 | |||||
| Income taxes, net | $ | (107,401 | ) | $ | 34,313 | $ | 77,034 | ||||
The accompanying Notes are an integral part of these Consolidated Financial Statements.
IBERIABANK CORPORATION AND SUBSIDIARIES
Notes to Consolidated Financial Statements
NOTE 1 - SUMMARY OF SIGNIFICANT ACCOUNTING POLICIES
General
The accompanying consolidated financial statements have been prepared in accordance with GAAP and practices generally accepted in the banking industry. The consolidated financial statements include the accounts of the Company and its subsidiaries. Certain amounts reported in prior periods have been reclassified to conform to the current period presentation. These reclassifications did not have a material effect on previously reported consolidated financial statements.
Proposed Merger with First Horizon National Corporation
On November 4, 2019, the Company announced it had entered into a definitive agreement to merge with First Horizon National Corporation ("First Horizon") in an all-stock merger of equals. Under the terms of the agreement, the Company's shareholders will receive 4.584 shares of First Horizon common stock for each share of IBERIABANK Corporation common stock. The combined holding company and bank will operate under the First Horizon name and will be headquartered in Memphis, Tennessee. The merger is expected to close in the second quarter of 2020, subject to satisfaction of customary closing conditions, including receipt of regulatory approvals and approval by the shareholders of each company.
Principles of Consolidation
All significant intercompany balances and transactions have been eliminated in consolidation. The Company’s consolidated financial statements include all entities in which the Company has a controlling financial interest under either the voting interest or variable interest model. The assessment of whether or not the Company has a controlling interest (i.e., the primary beneficiary) in a variable interest entity (VIE) is performed on an on-going basis. All equity investments in non-consolidated VIEs are included in other assets in the Company’s consolidated balance sheets. The Company’s maximum exposure to loss as a result of its involvement with non-consolidated VIEs was approximately $271.5 million and $230.2 million at December 31, 2019 and 2018, respectively. The Company's maximum exposure to loss was equivalent to the carrying value of its investments and any related outstanding loans to the non-consolidated VIEs.
Investments in entities that are not consolidated are accounted for under either the equity, fair value, or proportional amortization method of accounting. Prior to January 1, 2018, investments in entities that were not consolidated were accounted for under either the equity, cost, or proportional amortization method of accounting. Investments for which the Company has the ability to exercise significant influence over the operating and financing decisions of the entity are accounted for under the equity method. Investments for which the Company does not hold such ability are accounted for at cost less impairment plus or minus changes resulting from observable price changes, which approximates fair value. Prior to January 1, 2018, investments for which the Company did not hold such ability were accounted for under the cost method. Investments in qualified affordable housing projects, which meet certain criteria, are accounted for under the proportional amortization method.
Use of Estimates
The preparation of financial statements in conformity with GAAP requires management to make estimates and assumptions that affect the amounts reported in the consolidated financial statements and accompanying notes. Actual results could differ from those estimates. Material estimates that are susceptible to significant change in the near term are the allowance for credit losses, the valuation of goodwill and other intangible assets, and income taxes.
Concentration of Credit Risks
Most of the Company’s business activity is with customers located in the southeastern United States. The Company’s lending activity is concentrated in its market areas within those states. The Company has emphasized originations of commercial loans and private banking loans, defined as loans to higher net worth clients. Repayments on loans are expected to come from cash flows of the borrower and/or guarantor. Losses on secured loans are limited by the net realizable value of the collateral upon default of the borrowers and guarantor support. The Company believes it does not have any excessive concentrations to any one industry, loan type, or customer.
Business Combinations
Assets and liabilities acquired in business combinations are recorded at their acquisition date fair values. The Company generally records provisional amounts at the time of acquisition based on the information available to the Company. The provisional estimates of fair values may be adjusted for a period of up to one year (“measurement period”) from the date of acquisition if new information is obtained about facts and circumstances that existed as of the acquisition date that, if known, would have affected the measurement of the amounts recognized as of that date. Adjustments recorded during the measurement period are recognized in the current reporting period.
Loans generally represent a significant portion of the assets acquired in the Company’s business acquisitions. If the Company discovers that it has materially underestimated the credit losses expected in the loan portfolio based on information available at the acquisition date within the measurement period, it will reduce or eliminate the gain and/or increase goodwill recorded on the acquisition in the period the adjustment is recorded. If the Company determines that losses arose subsequent to the acquisition date, such losses are reflected as a provision for credit losses.
Cash and Cash Equivalents
For purposes of presentation in the consolidated statements of cash flows, cash and cash equivalents are defined as cash on hand, interest-bearing deposits, and non-interest-bearing demand deposits at other financial institutions with original maturities less than three months. IBERIABANK may be required to maintain average cash balances on hand or with the Federal Reserve Bank to meet regulatory reserve and clearing requirements. At December 31, 2019 and 2018, IBERIABANK had sufficient cash deposited with the Federal Reserve Bank to cover the required reserve balance.
Investment Securities
Management determines the appropriate accounting classification of debt and equity securities at the time of acquisition and re-evaluates such designations at least quarterly. Debt securities that management has the ability and intent to hold to maturity are classified as HTM and carried at cost, adjusted for amortization of premiums and accretion of discounts using methods approximating the interest method. Securities acquired with the intention of recognizing short-term profits or which are actively bought and sold are classified as trading securities and reported at fair value, with unrealized gains and losses recognized in earnings. Securities not classified as HTM or trading are classified as AFS and recorded at fair value, with unrealized gains and losses excluded from earnings and reported in OCI. Prior to January 1, 2018, equity securities with readily determinable fair values were also classified as AFS and recorded at fair value, with unrealized gains and losses excluded from earnings and reported in OCI. Credit-related declines in the fair value of debt securities that are considered OTTI are recorded in earnings. Prior to January 1, 2018, credit-related declines in the fair value of marketable equity securities that were considered OTTI were recorded in earnings.
The Company evaluates its investment securities portfolio on a quarterly basis for indicators of OTTI. Declines in the fair value of individual HTM and AFS securities below their amortized cost basis are reviewed to determine whether the declines are other than temporary. In estimating OTTI losses, management considers 1) the length of time and the extent to which the fair value has been less than the amortized cost basis, 2) the financial condition and near-term prospects of the issuer, 3) its intent to sell and whether it is more likely than not that the Company would be required to sell those securities before the anticipated recovery of the amortized cost basis, and 4) for debt securities, the recovery of contractual principal and interest.
For securities that the Company does not expect to sell, or it is not more likely than not it will be required to sell prior to recovery of its amortized cost basis, the credit component of an OTTI is recognized in earnings and the non-credit component is recognized in OCI. For securities that the Company does expect to sell, or it is more likely than not that it will be required to sell prior to recovery of its amortized cost basis, both the credit and non-credit component of an OTTI are recognized in earnings. Subsequent to recognition of OTTI, an increase in expected cash flows is recognized as a yield adjustment over the remaining expected life of the security based on an evaluation of the nature of the increase.
Other equity securities primarily consist of stock acquired for regulatory purposes, such as Federal Home Loan Bank stock and Federal Reserve Bank stock and are included in other assets.
Gains or losses on securities sold are recorded on the trade date, using the specific identification method.
Loans Held for Sale
Loans which the Company does not have the intent and ability to hold for the foreseeable future or until maturity or payoff are classified as loans held for sale at the time of origination or acquisition. Subsequent to origination or acquisition, if the Company no longer has the intent or ability to hold a loan for the foreseeable future, generally a decision has been made to sell the loan and it is classified within loans held for sale. Unless the fair value option has been elected at origination or acquisition, loans classified as held for sale are carried at the lower of cost or fair value. Amortization/accretion of remaining unamortized net deferred loan fees or costs and discounts or premiums (if applicable) ceases when a loan is classified as held for sale.
Loans held for sale primarily consist of fixed rate single-family residential mortgage loans originated and committed to be sold in the secondary market. Mortgage loans originated and held for sale are recorded at fair value under the fair value option. For mortgage loans for which the Company has elected the fair value option, gains and losses are included in mortgage income. For any other loans held for sale, net unrealized losses, if any, are recognized through a valuation allowance that is recorded as a charge to non-interest income. See Note 19 for further discussion of the determination of fair value for loans held for sale. In most cases, loans in this category are sold within thirty days and are generally sold with the mortgage servicing rights released. Buyers generally have recourse to return a purchased loan or request reimbursement for the loan premium or consideration transferred for servicing rights under limited circumstances. Recourse conditions may include prepayment, payment default, breach of representations or warranties, and documentation deficiencies. During 2019 and 2018, an insignificant number of loans were returned to the Company. At December 31, 2019 and 2018, the recorded repurchase liability associated with transferred loans was not material.
Loans
Legacy (Loans originated or renewed and underwritten by the Company)
The Company originates mortgage, commercial, and consumer loans for customers. Loans that management has the intent and ability to hold for the foreseeable future or until maturity or payoff are reported at the unpaid principal balances, less the ALL, charge-offs, and unamortized net loan origination fees and direct costs, except for loans carried at fair value. Interest income is accrued as earned over the term of the loans based on the principal balance outstanding. Loan origination fees, net of certain direct origination costs, are deferred and recognized as an adjustment of the related loan yield. Accrued interest is reported within other assets in the consolidated balance sheets.
Acquired (Loans acquired through Business Combinations)
Acquired loans are recorded at fair value on the acquisition date. Credit risk assumptions and any resulting credit discounts are included in the determination of fair value. Therefore, an ALL is not recorded at the acquisition date. The determination of fair value includes estimates related to discount rates, expected prepayments, and the amount and timing of undiscounted expected principal, interest, and other cash flows.
All acquired loans are evaluated for impairment at the time of acquisition. At the time of acquisition, acquired loans that reflect credit deterioration since origination to the extent that it is probable that the Company will be unable to collect all contractually required payments are classified as purchased impaired loans (“acquired impaired loans”). All other acquired loans are classified as purchased non-impaired loans (“acquired non-impaired loans”).
At the time of acquisition, acquired impaired loans are accounted for individually or aggregated into loan pools with similar characteristics, which include:
whether the loan is performing according to contractual terms at the time of acquisition,
the loan type based on regulatory reporting guidelines, primarily whether the loan was a mortgage, consumer, or commercial loan,
the nature of the collateral,
the interest rate type, whether fixed or variable rate, and
the loan payment type, primarily whether the loan is amortizing or interest-only.
From these pools, the Company uses certain loan information, including outstanding principal balance, estimated expected losses, weighted average maturity, weighted average term to re-price for a variable rate loan, weighted average margin and weighted average interest rate to estimate the expected cash flows for each loan pool.
For acquired impaired loans, expected cash flows at the acquisition date in excess of the fair value of loans are recorded as interest income over the life of the loans using a level yield method if the timing and amount of future cash flows is reasonably estimable. For acquired non-impaired loans, the difference between the fair value and unpaid principal balance of the loan at acquisition, referred to as a purchase premium or discount, is amortized or accreted to income over the estimated life of the loans as an adjustment to yield.
Subsequent to acquisition, the Company performs cash flow re-estimations at least quarterly for each acquired impaired loan or loan pool. Increases in estimated cash flows above those expected at the time of acquisition are recognized on a prospective basis as interest income over the remaining life of the loan and/or pool. Decreases in expected cash flows subsequent to acquisition generally result in recognition of a provision for credit loss. The measurement of cash flows involves several assumptions and judgments, including prepayments, default rates and loss severity among other factors. All of these factors are inherently subjective and significant changes in the cash flow estimations can result over the life of the loan.
Classification
The Company’s loan portfolio is disaggregated into portfolio segments for purposes of determining the ACL. The Company’s portfolio segments include commercial, residential mortgage, and consumer and other loans. The Company further disaggregates each commercial, residential mortgage, and consumer and other loans portfolio segment into classes for purposes of monitoring and assessing credit quality based on certain risk characteristics. Classes within the commercial loan portfolio segment include commercial real estate-construction, commercial real estate-owner-occupied, commercial real estate-non-owner occupied, and commercial and industrial. Classes within the consumer and other loans portfolio segment include home equity, and other.
Troubled Debt Restructurings
The Company periodically grants concessions to its customers in an attempt to protect as much of its investment as possible and minimize risk of loss. These concessions may include restructuring the terms of a loan to alleviate the burden of the customer’s near-term cash requirements. In order to be classified as a TDR, the Company must conclude that the restructuring constitutes a concession and the customer is experiencing financial difficulties. The Company defines a concession to the customer as a modification of existing terms for economic or legal reasons that it would otherwise not consider. The concession is either granted through an agreement with the customer or is imposed by a court of law. Concessions include modifying original loan terms to reduce or defer cash payments required as part of the loan agreement, including but not limited to:
a reduction of the stated interest rate for the remaining original life of the loan,
an extension of the maturity date or dates at a stated interest rate lower than the current market rate for new loans with similar risk characteristics,
a reduction of the face amount or maturity amount of the loan as stated in the agreement, or
a reduction of accrued interest receivable on the loan.
In its determination of whether the customer is experiencing financial difficulties, the Company considers numerous indicators, including, but not limited to:
whether the customer is currently in default on its existing loan(s), or is in an economic position where it is probable the customer will be in default on its loan(s) in the foreseeable future without a modification,
whether the customer has declared bankruptcy,
whether there is substantial doubt about the customer’s ability to continue as a going concern,
whether, based on its projections of the customer’s current capabilities, the Company believes the customer’s future cash flows will be insufficient to service the loan, including interest, in accordance with the contractual terms of the existing agreement for the foreseeable future, and
whether the customer cannot obtain sufficient funds from other sources at an effective interest rate equal to the current market rate for a similar loan for a non-troubled debtor.
If the Company concludes that both a concession has been granted and the customer is experiencing financial difficulties, the Company identifies the loan as a TDR. All TDRs are considered impaired loans.
Non-accrual and Past Due Loans (Including Loan Charge-offs)
Loans are generally considered past due when contractual payments of principal and interest have not been received within 30 days from the contractual due date. Residential mortgage loans are considered past due when contractual payments have not been received for two consecutive payment dates.
Legacy and acquired non-impaired loans are placed on non-accrual status when any of the following occur: 1) the loan is maintained on a cash basis because of deterioration in the financial condition of the borrower; 2) collection of the full contractual amount of principal and interest is not expected even if the loan is currently paying as agreed; or 3) when principal or interest has been in default for a period of 90 days or more, unless the loan is both well-secured and in the process of collection. Factors considered in determining the collection of the full contractual amount of principal and interest include assessment of the borrower’s cash flow, valuation of underlying collateral, and the ability and willingness of guarantors to provide credit support. Certain commercial loans are also placed on non-accrual status when payment is not past due and full payment of principal and interest is expected, but the Company has doubt about the borrower’s ability to comply with existing repayment terms. Consideration will be given to placing a loan on non-accrual due to the deterioration of the debtor’s repayment ability, the repayment of the loan becoming dependent on the liquidation of collateral, an existing collateral deficiency, the loan being classified as "doubtful" or "loss," the client filing for bankruptcy, and/or foreclosure being initiated. Regarding all classes within the C&I and CRE portfolios, the determination of a borrower’s ability to make the required principal and interest payments is based on an examination of the borrower’s current financial statements, industry, management capabilities, and other qualitative factors.
Acquired impaired loans are placed on non-accrual status when the Company cannot reasonably estimate cash flows on a loan or loan pool. Legacy and acquired non-impaired loans are evaluated for potential charge-off in accordance with the parameters discussed in the following paragraph or when the loan is placed on non-accrual status, whichever is earlier.
Loans within the commercial portfolio (except for acquired impaired loans) are generally evaluated for charge-off at
90 days past due, unless both well-secured and in the process of collection. Closed and open-end residential mortgage and consumer loans (except for acquired impaired loans) are evaluated for charge-off no later than 120 days past due. Any outstanding loan balance in excess of the fair value of the collateral less costs to sell is charged-off no later than 120 days days past due for loans secured by real estate. For non-real estate secured loans, in lieu of charging off the entire loan balance, loans may be written down to the fair value of the collateral less costs to sell if repossession of collateral is assured and in process.
The accrual of interest, as well as the amortization/accretion of any remaining unamortized net deferred fees or costs and discount or premium, is discontinued at the time the loan is placed on non-accrual status. All accrued but uncollected interest for loans that are placed on non-accrual status is reversed through interest income. Cash receipts received on non-accrual loans are generally applied against principal until the loan has been collected in full, after which time any additional cash receipts are recognized as interest income (i.e., cost recovery method). However, interest may be accounted for under the cash-basis method as long as the remaining recorded investment in the loan is deemed fully collectible.
Loans are returned to accrual status when the borrower has demonstrated a capacity to continue payment of the debt (generally a minimum of six months of sustained repayment performance) and collection of contractually required principal and interest associated with the debt is reasonably assured. Additionally, for a non-accrual TDR to be returned to accrual status, a current, well-documented credit analysis is required and the borrower must have complied with all terms of the modification. At such time, the accrual of interest and amortization/accretion of any remaining unamortized net deferred fees or costs and discount or premium shall resume. Any interest income which was applied to the principal balance shall not be reversed and subsequently will be recognized as an adjustment to yield over the remaining life of the loan.
Impaired Loans
Within the commercial portfolio, all loans classified as "substandard", "doubtful" or "loss" with an outstanding commitment balance above a specific threshold are evaluated on a quarterly basis for potential impairment. Generally, residential mortgage and consumer loans within any class are not individually evaluated on a regular basis for impairment. All TDRs, regardless of the outstanding balance amount or portfolio classification, and all acquired impaired loans are considered to be impaired.
A loan is considered impaired when, based on current information and events, it is probable that the Company will be unable to collect the scheduled payments of principal and/or interest in accordance with the contractual terms of the loan agreement. Factors considered by management in determining impairment include payment status, collateral value, and the likelihood of collecting scheduled principal and interest payments when contractually due. Loans that experience insignificant payment delays and payment shortfalls generally are not classified as impaired. Impairment losses are measured on a loan-by-loan basis for commercial and certain residential mortgage or consumer loans, based on either the present value of expected future cash flows discounted at the loan’s effective interest rate, the loan’s observable market price, or the fair value of the collateral if the loan is collateral-dependent. This measurement requires significant judgment and use of estimates, and the actual loss ultimately recognized by the Company may differ significantly from the estimates.
Allowance for Credit Losses
The Company maintains the ACL at a level that management believes appropriate to absorb estimated probable credit losses incurred in the loan portfolios, including unfunded commitments, as of the consolidated balance sheet date. The ACL consists of the allowance for loan losses (contra asset) and the reserve for unfunded commitments (liability). The manner in which the ACL is determined is based on 1) the accounting method applied to the underlying loans and 2) whether the loan is required to be measured for impairment. The Company delineates between loans accounted for under the contractual yield method, legacy and acquired non-impaired loans, and acquired impaired loans. Further, for legacy and acquired non-impaired loans, the Company attributes portions of the ACL to loans and loan commitments that it measures individually, and groups of homogeneous loans and loan commitments that it measures collectively for impairment.
Determination of the appropriate ACL involves a high degree of complexity and requires significant judgment regarding the credit quality of the loan portfolio. Several factors are taken into consideration in the determination of the overall ACL, including a qualitative component. These factors include, but are not limited to, the overall risk profiles of the loan portfolios, net charge-off experience, the extent of impaired loans, the level of non-accrual loans, the level of 90 days past due loans, the value of collateral, the ability to monetize guarantor support, and the overall percentage level of the allowance relative to the loan portfolio, amongst other factors. The Company also considers overall asset quality trends, changes in lending practices and procedures, trends in the nature and volume of the loan portfolio, including the existence and effect of any portfolio concentrations, changes in experience and depth of lending staff, the Company’s legal, regulatory and competitive environment, national and regional economic trends, data availability and applicability that might impact the portfolio or the manner in which it estimates losses, and risk rating accuracy and risk identification.
The allowance for loan losses for all impaired loans (excluding acquired impaired loans) is determined on an individual loan basis, considering the facts and circumstances specific to each borrower. The allowance is based on the difference between the recorded investment in the loan and generally either the estimated net present value of projected cash flows or the estimated value of the collateral associated with a collateral-dependent loan.
The allowance for loan losses for all non-impaired loans (excluding acquired impaired loans) is calculated based on pools of loans with similar characteristics. The pool-level allowance is calculated through the application of probability of default (PD) and loss given default (LGD) factors for each individual loan. PDs and LGDs are determined based on historical default and loss information for similar loans. For purposes of establishing estimated loss percentages for pools of loans that share common risk characteristics, the Company’s loan portfolio is segmented by various loan characteristics including loan type, risk rating for commercial, Vantage or FICO score for residential mortgage and consumer, past due status for residential mortgage and consumer, and call report code. The default and loss information is measured over an appropriate period for each loan pool and adjusted as deemed appropriate. Qualitative adjustments are incorporated into the pool-level analysis to accommodate for the imprecision of certain assumptions and uncertainties inherent in the calculation.
See the "Loans" section of this note for discussion of the determination of the ACL for acquired impaired loans.
Certain inherent, but unconfirmed losses are probable within the loan portfolio. The Company’s current methodology for determining the level of inherent losses is based on historical loss rates, current credit grades, specific allocation, and other qualitative adjustments. In a stable or deteriorating credit environment, heavy reliance on historical loss rates and the credit grade rating process results in model-derived reserves that tend to slightly lag behind portfolio deterioration. Similar lags can occur in an improving credit environment whereby required reserves can lag slightly behind portfolio improvement. Given these and other model limitations, qualitative adjustment factors may be incremental or decremental to the quantitative model results.
The reserve for unfunded commitments is determined using similar methodologies described above for non-impaired loans. The loss factors used in the reserve for unfunded commitments are equivalent to the loss factors used in the allowance for loan losses, while also considering utilization of unused commitments.
Premises and Equipment
Land is carried at cost. Buildings, furniture, fixtures, and equipment are carried at cost, less accumulated depreciation computed on a straight-line basis over the estimated useful lives of 10 to 40 years for buildings and related improvements and generally 3 to 20 years for furniture, fixtures, and equipment. Leasehold improvements are amortized over the lease term, including any renewal periods that are reasonably assured, or the asset’s useful life, whichever is shorter. Premises and equipment are evaluated for impairment whenever events or changes in circumstances indicate that the carrying amount of the asset may not be recoverable.
Goodwill and Other Intangible Assets
Goodwill
Goodwill represents the excess of the consideration paid in a business combination over the fair value of the identifiable net assets acquired. Goodwill is not amortized, but is assessed for potential impairment at a reporting unit level on an annual basis, as of October 1st, or whenever events or changes in circumstances indicate that it is more likely than not the fair value of a reporting unit is less than its respective carrying amount. For the annual October 1, 2019 impairment evaluation, management elected to bypass the qualitative assessment for each respective reporting unit (IBERIABANK, Mortgage, and LTC) and performed Step 1 of the goodwill impairment test. Step 1 of the goodwill impairment test requires the Company to compare the fair value of each reporting unit with its carrying amount, including goodwill. Accordingly, the Company determined the fair value of each reporting unit and compared the fair value to each respective reporting unit’s carrying amount. The Company determined that none of the reporting units’ fair values were below their respective carrying amounts. The Company concluded goodwill was not impaired as of October 1, 2019. Further, no events or changes in circumstances between October 1, 2019 and December 31, 2019 indicated that it was more likely than not the fair value of any reporting unit had been reduced below its carrying value.
Based on the testing performed in 2019 and 2018, management concluded that for the IBERIABANK, Mortgage, and LTC reporting units, goodwill was not impaired at any time during those periods.
Intangible assets subject to amortization
The Company’s acquired intangible assets that are subject to amortization primarily include core deposit intangibles, which are amortized on a straight-line or accelerated basis, and a customer relationship intangible asset, which is amortized on an accelerated basis, over average lives not to exceed 10 years. The Company reviews intangible assets for impairment whenever events or changes in circumstances indicate that their carrying amounts may not be recoverable. Impairment is identified if the sum of the undiscounted estimated future cash flows is less than the carrying value of the asset.Intangible assets are recorded within other intangible assets on the Company’s consolidated balance sheets.
Other Real Estate Owned
Other real estate owned includes all real estate, other than bank premises used in bank operations, owned or controlled by the Company, including real estate acquired in settlement of loans. Properties are initially recognized at the lower of the recorded investment in the loan or its estimated fair value less costs to sell, generally when the Company has received physical possession. The amount by which the recorded investment of the loan exceeds the fair value less costs to sell of the property is charged to the ALL. Subsequent to foreclosure, the assets are carried at the lower of cost or fair value less costs to sell. Former bank properties transferred to OREO are recorded at the lower of cost or market. Subsequent declines in the fair value of other real estate are recorded as adjustments to the carrying amount through a valuation allowance. Revenue and expenses from operations, gain or loss on sale, and changes in the valuation allowance are included in net expenses from foreclosed assets. OREO is recorded within other assets on the Company’s consolidated balance sheets.
Derivative Financial Instruments
The Company enters into various derivative financial instruments to manage interest rate risk, asset sensitivity and other exposures such as liquidity and credit risk, as well as to facilitate customer transactions. The primary types of derivatives utilized by the Company for its risk management strategies include interest rate swap agreements, interest rate collars, interest rate floors, foreign exchange contracts, interest rate lock commitments, forward sales commitments, written and purchased options, and credit derivatives. All derivative instruments are recognized on the consolidated balance sheets as other assets or other liabilities at fair value, regardless of whether a right of offset exists. Changes in the fair value of a derivative instrument are recorded based on whether it has been designated and qualifies as part of a hedging relationship.
Interest rate swap and foreign exchange contracts are entered into by the Company to allow its commercial customers to manage their exposure to market rate fluctuations. To mitigate the Company's exposure to the rate risk associated with customer contracts, offsetting derivative positions are entered into with reputable counterparties. The Company manages its credit risk, or potential risk of default, from the customer contracts through credit limit approval and monitoring procedures. These contracts are not designated for hedge accounting (i.e., treated as economic hedges).
Derivatives Designated in Hedging Relationships
For cash flow hedges, the effective and ineffective portions of the gain or loss related to the derivative instrument is initially reported as a component of OCI and subsequently reclassified into earnings when the forecasted transaction affects earnings or when the hedge is terminated. Prior to January 1, 2018, the ineffective portion of the gain or loss, if any, was reported in earnings immediately in either other income or other expense, respectively. In applying hedge accounting for derivatives, the Company establishes and documents a method for assessing the effectiveness of the hedging derivative and a measurement approach for determining the ineffective aspect of the hedge upon the inception of the hedge. The Company has designated interest rate swaps in a cash flow hedge to convert forecasted variable interest payments to a fixed rate on its junior subordinated debt. The Company has also designated interest rate collars and interest rate floors in a cash flow hedge to reduce the risk of fluctuations in interest rates and thereby reduce the Company’s exposure to variability in cash flows from variable-rate loans. The Company has concluded that the forecasted transactions are probable of occurring.
Derivatives Not Designated in Hedging Relationships
For derivative instruments that are not designated as hedging instruments, changes in the fair value of the derivatives are recognized in earnings immediately.
Common Types of Derivatives
| • | Interest rate swap agreements Interest rate swaps are agreements to exchange interest payments based upon notional amounts. The exchange of payments typically involves paying a fixed rate and receiving a variable rate or vice versa. The Company primarily utilizes these instruments, which the Company designates as cash flow hedges, to manage interest rate risk by converting a portion of its variable-rate loans or debt to a fixed rate. The Company also utilizes these instruments, which are not designated as hedging instruments, to allow its commercial customers to manage their exposure to market rate fluctuations. |
| • | Interest rate collars Interest rate collars are agreements that create a range within which interest rates can fluctuate. The interest rate collar protects against significant decreases in interest rates but limits the benefits when interest rates increase. These instruments are designated as cash flow hedges and are used by the Company to manage interest rate risk by reducing the variability in cash flows that can occur with variable-rate loans. |
| • | Interest rate floors Interest rate floors are agreements that protect against significant decreases in interest rates if interest rates fall below a specified level over an agreed period of time. These instruments are designated as cash flow hedges and are used by the Company to manage interest rate risk by reducing the variability in cash flows that can occur with variable-rate loans. |
| • | Interest rate lock commitments The Company enters into commitments to originate mortgage loans intended for sale whereby the interest rate on the prospective loan is determined prior to funding (“rate lock”). A rate lock is provided to a borrower, subject to conditional performance obligations, for a specified period of time that typically does not exceed 60 days. Rate lock commitments on mortgage loans that are intended to be sold are recognized as derivatives. Accordingly, such commitments are recorded at fair value as derivative assets or liabilities, with changes in fair value recorded in mortgage income on the consolidated statements of comprehensive income. |
| • | Forward sales commitments The Company uses forward sales commitments to protect the value of its rate locks and mortgage loans held for sale from changes in interest rates and pricing between the origination of the rate lock and sale of these loans, as changes in interest rates have the potential to cause a decline in value of rate locks and mortgage loans included in the held for sale portfolio. These commitments are recognized as derivatives and recorded at fair value as derivative assets or liabilities, with changes in fair value recorded in mortgage income on the consolidated statements of comprehensive income. |
| • | Equity-indexed certificates of depositIBERIABANK offers its customers a certificate of deposit that provides the purchaser a guaranteed return of principal at maturity plus a potential return, which allows IBERIABANK to identify a known cost of funds. The rate of return is based on the performance of a group of publicly traded stocks that represent a variety of industry segments. Because it is based on an equity index, the rate of return represents an embedded derivative that is not clearly and closely related to the host instrument and is to be accounted for separately. Accordingly, the certificate of deposit is separated into two components: a zero coupon certificate of deposit (the host instrument) and a written option purchased by the depositor (an embedded derivative). The discount on the zero coupon deposit is amortized over the life of the deposit, and the written option is carried at fair value on the Company’s consolidated balance sheets, with changes in fair value recorded through earnings. IBERIABANK offsets the risks of the written option by purchasing an option with terms that mirror the written option, which is also carried at fair value on the Company’s consolidated balance sheets. |
Recognition of Revenue from Contracts with Customers
Non-interest income from service charges on deposit accounts, broker commissions, ATM/debit card fee income, credit card and merchant-related income (e.g., interchange fees), and transactional income from traditional banking services, including asset management services as well as title revenue, (part of other non-interest income) are the significant sources of revenue from contracts with customers. The Company generally acts in a principal capacity in the performance of these services. The Company’s performance obligations are generally satisfied as the services are rendered and typically do not extend beyond a reporting period. Fees, which are typically billed and collected after services are rendered, are readily determinable and allocated individually to each service. Some contracts contain variable consideration; however, the variable consideration is generally based on the occurrence or nonoccurrence of a contingent event. The Company records any variable consideration when the contingent event occurs and the fee is determinable. In the normal course of business, the Company does not generally grant refunds for services provided. As such, the Company does not establish provisions for estimated returns.
See the "Loans" section of this note for discussion of the recognition of interest income on loans.
Off-Balance Sheet Credit-Related Financial Instruments
In the ordinary course of business, the Company executes various commitments to extend credit, including commitments under commercial construction arrangements, commercial and home equity lines of credit, credit card arrangements, commercial letters of credit, and standby letters of credit. These off-balance sheet financial instruments are generally exercisable at the market rate prevailing at the date the underlying transaction will be completed. Such financial instruments are recorded on the funding date. At December 31, 2019 and 2018, the fair value of guarantees under commercial and standby letters of credit was not material.
Transfers of Financial Assets
Transfers of financial assets, or portions thereof which meet the definition of a participating interest, are accounted for as sales when control over the assets has been surrendered. Control over transferred assets is deemed to be surrendered when 1) the assets have been legally isolated from the Company, 2) the transferee has the right to pledge or exchange the assets with no conditions that constrain the transferee and provide more than a trivial benefit to the Company, and 3) the Company does not maintain effective control over the transferred assets. If the transfer does not satisfy all three criteria, the transaction is recorded as a secured borrowing.
If the transfer is accounted for as a sale, the transferred assets are derecognized from the Company’s balance sheet and a gain or loss on sale is recognized. If the transfer is accounted for as a secured borrowing, the transferred assets remain on the Company’s balance sheet and the proceeds from the transaction are recognized as a liability.
Servicing Rights
The Company recognizes the rights to service mortgage and other loans as separate assets, which are recorded in other assets in the consolidated balance sheets, when purchased or when servicing is contractually separated from the underlying loans by sale with servicing rights retained.
For loan sales with servicing retained, a servicing right, generally an asset, is recorded at fair value at the time of sale for the right to service the loans sold. All servicing rights are identified by class and amortized over the remaining service life of the loan.
Income Taxes
The Company and all subsidiaries file a consolidated Federal income tax return on a calendar year basis. The Company files income tax returns in the U.S. Federal jurisdiction and various state and local jurisdictions through IBERIABANK Corporation (Parent), IBERIABANK, and their respective subsidiaries. In lieu of Louisiana state income tax, IBERIABANK is subject to the Louisiana bank shares tax, portions of which are included in both non-interest expense and income tax expense in the Company’s consolidated statements of comprehensive income. With few exceptions, the Company is no longer subject to U.S. federal, state or local income tax examinations for years before 2014.
Deferred income tax assets and liabilities are determined using the liability or balance sheet method. Under this method, the net deferred tax asset or liability is determined based on the tax effects of the temporary differences between the book and tax bases of the various balance sheet assets and liabilities and gives current recognition to changes in tax rates and laws. The measurement of deferred tax assets is reduced, if necessary, by the amount of any tax benefits that, based on available evidence, are not expected to be realized.
The Company recognizes interest and penalties accrued related to unrecognized tax benefits, if applicable, in non-interest expense.
Investments in qualified affordable housing projects that meet certain criteria are accounted for under the proportional amortization method. Under this method, the expense associated with the investments is recognized in income tax expense rather than non-interest expense. The Company has also elected to utilize the deferral method for investments that generate investment tax credits. Under this approach, the investment tax credits are recognized as a reduction of the related asset rather than income tax expense.
Share-based Compensation Plans
The Company issues stock options, restricted stock awards, restricted share units, and phantom stock awards under various plans to directors, officers, and other key employees. Compensation cost for all awards is recognized on a straight-line basis over the requisite service period, which is generally the vesting period, taking into account retirement eligibility. The majority of the Company's share-based awards qualify for equity accounting and contain service conditions. The fair value of awards is measured at the grant date and not subsequently remeasured. The Company accounts for share-based forfeitures as they occur.
For awards that contain a market condition, the Company includes the market condition in the determination of the grant date fair value of the award. Compensation cost for an award with a market condition is recognized regardless of whether the market condition is satisfied, assuming the requisite service is met. The Company does not include performance conditions in the determination of the grant date fair value of the award. Compensation cost for an award with a performance condition is not recognized if the performance condition is not satisfied. Phantom stock awards are accounted for as liability awards and are remeasured at each reporting period based on their fair value until the date of settlement. Compensation cost for each reporting period until settlement is based on the change (or a portion of the change, depending on the percentage of the requisite service that has been rendered at the reporting date) in the fair value of the phantom stock award for each reporting period.
Compensation expense relating to share-based awards is recognized in net income as part of salaries and employee benefits on the consolidated statements of comprehensive income for employees and professional services for non-employee directors. The exercise price for the options granted by the Company is not less than the fair market value of the underlying stock at the grant date.
Earnings Per Common Share
Basic earnings per share represents income available to common shareholders divided by the weighted average number of common shares outstanding during the period. Diluted earnings per share reflects additional common shares that would have been outstanding if dilutive potential common shares, in the form of stock options or restricted stock units, had been issued, as well as any adjustment to income that would result from the assumed issuance. Participating common shares issued by the Company relate to unvested outstanding restricted stock awards, the earnings allocated to which are used in determining income available to common shareholders under the two-class method. The two-class method allocates earnings for the period between common shareholders and other participating securities holders. The participating awards receiving dividends are allocated the same percentage of income as if they were outstanding shares.
Share Repurchases
The Company classifies repurchased shares as a reduction to issued shares of common stock and adjusts the stated value of common stock and paid-in-capital.
Comprehensive Income
Accounting principles generally require that recognized revenue, expenses, gains, and losses be included in net income. Although certain changes in assets and liabilities, such as unrealized gains and losses on available-for-sale securities and cash flow hedges, are reported as a separate component of the shareholders’ equity section of the consolidated balance sheets, such items along with net income are components of comprehensive income.
Fair Value Measurements
Fair value is the exchange price that would be received for an asset or paid to transfer a liability (exit price) in the principal or most advantageous market for the asset or liability in an orderly transaction between market participants on the measurement date. The Company estimates fair value based on the assumptions market participants would use when selling an asset or transferring a liability and characterizes such measurements within the fair value hierarchy based on the inputs used to develop those assumptions and measure fair value. The hierarchy requires the Company to maximize the use of observable inputs and minimize the use of unobservable inputs. The three levels of inputs used to measure fair value are as follows:
Level 1 - Quoted prices in active markets for identical assets or liabilities.
Level 2 - Observable inputs other than quoted prices included in Level 1, such as quoted prices for similar assets and liabilities in active markets; quoted prices for identical or similar assets and liabilities in markets that are not active; or other inputs that are observable or can be corroborated by observable market data.
Level 3 - Unobservable inputs that are supported by little or no market activity and that are significant to the fair value of the assets or liabilities. This includes certain pricing models, discounted cash flow methodologies, and similar techniques that use significant unobservable inputs.
Following is a description of the valuation methodologies used for financial instruments or other assets measured at fair value, as well as the classification of such instruments within the valuation hierarchy. The descriptions below are exclusive of assets or liabilities acquired in business combinations, as all such instruments are required to initially be measured at fair value.
| • | Cash and cash equivalents The carrying amounts of cash and cash equivalents approximate their fair value and are classified within Level 1 of the fair value hierarchy. |
| • | Investment securities Securities are classified within Level 1 where quoted market prices are available in an active market. If quoted market prices are unavailable, fair value is estimated using quoted prices of securities with similar characteristics and the securities are classified within Level 2 of the fair value hierarchy. |
| • | Mortgage loans held for sale Mortgage loans originated and held for sale are recorded at fair value under the fair value option. When determining the fair value of loans held for sale, the Company obtains quotes or bids on these loans directly from the purchasing financial institutions. Mortgage loans held for sale are classified within Level 2 of the fair value hierarchy. |
| • | Mortgage loans held for investment at fair value option The fair value of mortgage loans held for investment at fair value option is determined by a third party using a discounted cash flow model using various assumptions about future loan performance and market discount rates. Mortgage loans held for investment at fair value option are classified within Level 3 of the fair value hierarchy. |
| • | Loans The fair values of mortgage loans are estimated using an exit price methodology that is based on present values using interest rate that would be charged for a similar loan to a borrower with similar risk, weighted for varying maturity dates and adjusted for a liquidity discount based on the estimated time period to complete a sale transaction with a market participant. |
Other loans and leases are valued based on present values using the interest rate that would be charged for a similar instrument to a borrower with similar risk, applicable to each category of instruments, and adjusted for a liquidity discount based on the estimated time period to complete a sale transaction with a market participant.
Mortgage and other loans and leases are classified within Level 3 of the fair value hierarchy.
| • | Impaired loans Fair value measurements for impaired loans are determined using either a present value of expected future cash flows discounted using the loan’s effective interest rate or the fair value of the collateral, if the loan is collateral-dependent (Level 3 of the fair value hierarchy). Fair value of the collateral is determined by appraisals or independent valuation less costs to sell. Impaired loans for which the fair value of the collateral is higher than the recorded investment in the loan are not adjusted to fair value and therefore not recorded in the Company’s non-recurring fair value measurements section of the Fair Value Measurements note. |
| • | Other real estate owned Fair values of OREO are determined by sales agreement or appraisal and costs to sell are based on estimation per the terms and conditions of the sales agreement or amounts commonly used in real estate transactions. Inputs include appraisal values on the properties or recent sales activity for similar assets in the property’s market. Updated appraisals are obtained on at least an annual basis. OREO measured at fair value is classified within Level 3 of the fair value hierarchy. |
| • | Derivative financial instruments Fair values of interest rate swaps, interest rate locks, interest rate collars, interest rate floors, foreign exchange contracts, forward sales contracts, and written and purchased options are estimated using prices of financial instruments with similar characteristics and thus are classified within Level 2 of the fair value hierarchy. |
| • | Deposits The fair value of non-interest-bearing deposits, interest-bearing demand deposits, money market accounts and savings accounts are the amounts payable on demand at the reporting date. Time deposits are valued using a discounted cash flow model based on the weighted-average rate at December 31, 2019 and 2018 for deposits with similar remaining maturities. The Company evaluated the inputs to the fair value estimate and based on our use of quoted prices for similar liabilities determined that the fair value of deposits should be classified within Level 2 of the fair value hierarchy. |
| • | Short-term borrowings Securities sold under agreements to repurchase, which are classified as secured borrowings, generally mature daily, are reflected at the amount of cash received in connection with the transaction, and are classified within Level 1 of the fair value hierarchy. The carrying amounts of other short-term borrowings maturing within ninety days approximate their fair values and are classified within Level 2 of the fair value hierarchy as similar instruments are traded in active markets. |
| • | Long-term debt The fair values of long-term debt are estimated using discounted cash flow analyses based on the Company’s current incremental borrowing rates for similar types of borrowing arrangements. The fair value of the Company’s long-term debt is classified within Level 3 of the fair value hierarchy. |
NOTE 2 - RECENT ACCOUNTING PRONOUNCEMENTS
Pronouncements adopted during the year ended December 31, 2019:
ASU No. 2016-02, ASU No. 2018-11, ASU No. 2018-20, and ASU 2019-01
In February 2016, the FASB issued ASU No. 2016-02, Leases (ASC 842) which requires lessees to recognize ROU assets and lease liabilities on the balance sheet for most leases, including operating leases. The lessor accounting model was relatively unchanged by this ASU. Additional quantitative and qualitative disclosures are also required. During 2018 and early 2019, the FASB issued ASU No. 2018-11, Targeted Improvements, ASU No. 2018-20, Narrow-Scope Improvements for Lessors, and ASU No. 2019-01, Codification Improvements, which clarified certain implementation issues, provided an additional optional transition method and clarified the disclosure requirements during the period of adopting ASC 842, among others.
The Company adopted ASU No. 2016-02 and the related ASUs discussed above effective January 1, 2019 using the optional transition method. The Company elected the package of practical expedients that does not require the reassessment of whether expired or existing contracts contain leases, the reassessment of the lease classification for any expired or existing leases, or the reassessment of initial direct costs for existing leases. Additionally, the Company did not elect the hindsight practical expedient.
The Company conducted a review of all existing lease contracts and service contracts which might contain embedded leases. Some of the Company’s leases contain variable lease payments, the majority of which depend on an index or rate, such as the Consumer Price Index. At transition, the present value of variable payments was based on the index or rate as of January 1, 2019. To determine the present value of lease payments at transition, the Company applied a portfolio approach utilizing an FHLB Advance rate based on the weighted average remaining term of the Company’s existing leases as of January 1, 2019. As a result of adopting ASC 842, the Company established an ROU asset and a lease liability as of January 1, 2019 of $94.2 million and $118.9 million, respectively. Additionally, as part of the adoption of ASC 842, $24.7 million in pre-existing liabilities were reclassified to the ROU asset on January 1, 2019. This resulted in a gross-up of the balance sheet of $94.2 million as a result of recognizing lease liabilities and corresponding right-of-use assets for operating leases. The adoption of ASC 842 also required the recognition of previously deferred gains on sale-leaseback transactions which resulted in an insignificant increase to retained earnings on January 1, 2019. The related impact on the Company’s regulatory capital ratios was not significant. The Company does not expect material changes to the recognition of lease expense in future periods as a result of the adoption of ASC 842. See Note 10, Leases, for additional disclosures required by ASC 842.
ASU No. 2018-16
In October 2018, the FASB released ASU No. 2018-16, Derivatives and Hedging (ASC 815): Inclusion of the Secured Overnight Financing Rate (SOFR) Overnight Index Swap (OIS)Rate as a Benchmark Interest Rate for Hedge Accounting Purposes, which permits the use of the OIS rate based on SOFR as a U.S. benchmark interest rate for hedge accounting purposes under ASC 815 in addition to the interest rates on direct Treasury obligations of the UST, the LIBOR swap rate, the OIS Rate based on the Fed Funds Effective Rate, and the SIFMA Municipal Swap Rate.
The required effective date of this ASU was dependent upon when an entity adopted the provisions of ASU No. 2017-12. The Company adopted ASU No. 2018-16 effective January 1, 2019 on a prospective basis for qualifying new or redesignated hedging relations as ASU No. 2017-12 had previously been adopted on January 1, 2018. The implementation of this ASU did not have a significant impact on the Company’s consolidated financial statements.
ASU No. 2017-08
In March 2017, the FASB issued ASU No. 2017-08, Receivables-Nonrefundable Fees and Other Costs (ASC 310-20): Premium Amortization on Purchased Callable Debt Securities, which shortens the amortization period for callable debt securities held at a premium to the earliest call date instead of the maturity date. The amendments do not require an accounting change for securities held at a discount, which will continue to be amortized to the maturity date.
The Company adopted ASU No. 2017-08 effective January 1, 2019. The adoption of the ASU did not have a material impact on the Company’s consolidated financial statements.
Pronouncements issued but not yet adopted:
ASU No. 2016-13, ASU No. 2019-04 (portion related to ASC 326), ASU No. 2019-05, and ASU 2019-11
In June 2016, the FASB issued ASU No. 2016-13, Financial Instruments - Credit Losses (ASC 326): Measurement of Credit Losses on Financial Instruments. The guidance, along with subsequent related updates issued during 2019 (ASU Nos. 2019-04, 2019-05 and 2019-11), introduces an impairment model that is based on expected credit losses (ECL), rather than incurred losses, to estimate credit losses on certain types of financial instruments such as loans and held-to-maturity securities, including certain off-balance sheet financial instruments such as loan commitments. The measurement of ECL should consider historical information, current information, and reasonable and supportable forecasts, including estimates of prepayments, over the contractual term. Financial instruments with similar risk characteristics must be grouped together when estimating ECL. ASC 326 also expands credit quality disclosures.
ASC 326 provides for a simplified accounting model for purchased financial assets with a more-than-insignificant amount of credit deterioration since their origination (purchase credit deteriorated). The initial estimate of expected credit losses for purchase credit deteriorated financial assets will be recognized as an ACL with an offset (i.e., increase) to the cost basis of the related financial asset at acquisition.
Additionally, ASC 326 amends the current AFS security impairment model for debt securities. The new model will require an estimate of ECL when the fair value is below the amortized cost of the asset. The credit-related impairment (and subsequent recoveries) are recognized as an allowance on the balance sheet with a corresponding adjustment to the income statement. Non-credit related losses will continue to be recognized through OCI.
The Company will adopt these ASUs as of January 1, 2020 through a modified-retrospective approach. The Company elected to not measure an allowance for credit losses for accrued interest as it reverses uncollectible accrued interest through interest income in a timely manner and to continue to report accrued interest within other assets in the consolidated balance sheets. The Company did not elect the one-time fair value option transition expedient for financial instruments recorded at amortized cost. Additionally, the Company elected to discontinue the use of pools to account for purchase credit deteriorated financial assets.
Prior to adoption, the Company established a cross-function implementation team and engaged third-party consultants who jointly developed multiple current expected credit loss models which segment the Company’s loan and lease portfolio by borrower type (i.e. commercial and consumer) and loan type to estimate lifetime expected credit losses. These current expected credit loss models primarily use a probability-of-default methodology to estimate expected credit losses. Within each model, loans are further segregated based on additional risk characteristics specific to that loan type, such as risk rating, industry sector, company and/or loan size, collateral type, geographic location and FICO score. The Company uses both internal and external historical loss data, as appropriate, and a blend of multiple economic forecasts to estimate expected credit losses over a reasonable and supportable forecast period and then reverts to longer term historical loss experience to arrive at lifetime expected credit losses at implementation.
The transition adjustment as of January 1, 2020 primarily relates to establishing lifetime expected credit losses on its loan portfolio as the impact of the new accounting guidance for held-for-sale and available-for-sale investment securities was immaterial. The transition adjustment is expected to result in an ACL to loans ratio between 0.98% and 1.04%. The increase in the ACL primarily relates to required increases for residential mortgage and home equity loans due to the requirement to estimate lifetime expected credit losses and the remaining length of time to maturity for these loans, as well as an increase in reserves on certain acquired loans which had low reserve levels under the previous accounting guidance. While the Company recognizes the economy is currently vulnerable to major shocks, fiscal policy, other geopolitical events and the outcome of the pending U.S. elections, the transition adjustment reflects the Company’s view of a relatively stable macroeconomic environment over the next eighteen months.
The transition adjustment to increase the ACL is expected to result in a decrease to the opening shareholders’ equity balance, net of income taxes, as of January 1, 2020. While these ASUs increased the ACL, they did not change the overall credit risk in the Company’s loan and lease portfolios or the ultimate losses therein.
ASU No. 2018-13
In August 2018, the FASB released ASU No. 2018-13, Fair Value Measurement (ASC 820): Disclosure Framework - Changes to the Disclosure Requirements for Fair Value Measurement, which eliminates, adds and modifies certain disclosure requirements for fair value measurements. The ASU is effective for fiscal years beginning after December 15, 2019, including interim periods, with early adoption permitted.
The Company will adopt ASU No. 2018-13 as of January 1, 2020. While adoption of this ASU will result in changes to existing disclosures, it did not have an impact on the Company’s financial position or results of operations.
ASU No. 2018-17
In October 2018, the FASB released ASU No. 2018-17, Consolidation (ASC 810): Targeted Improvements to Related Party Guidance for Variable Interest Entities, which improves the consistency of the application of the variable interest entity (VIE) related party guidance for common control arrangements. This ASU requires reporting entities to consider indirect interests held through related parties under common control on a proportional basis rather than as the equivalent of a direct interest in its entirety (as currently required in GAAP) when determining whether a decision-making fee is a variable interest. ASU No. 2018-17 is effective for fiscal years beginning after December 15, 2019, including interim periods within those fiscal years, and early adoption is permitted. The guidance will be applied retrospectively with a cumulative-effect adjustment to retained earnings at the beginning of the earliest period presented.
The Company will adopt ASU No. 2018-17 as of January 1, 2020. The adoption of the ASU did not have a material impact to the Company’s consolidated financial statements. Based on the Company’s invested interests at adoption, no transition adjustment was needed.
ASU No. 2019-04
In April 2019, the FASB released ASU No. 2019-04, Codification Improvements to Financial Instruments-Credit Losses (ASC 326), Derivatives and Hedging (ASC 815), and Financial Instruments (ASC 825). The amendments in the ASU improve the Codification by eliminating inconsistencies and providing clarifications. The amendments related to the credit losses standard are discussed above under ASU 2016-13.
With respect to hedge accounting, the ASU addresses partial-term fair value hedges, fair value hedge basis adjustments, and certain transition requirements, among other things. For recognizing and measuring financial instruments, the ASU addresses the scope of the guidance, the requirement for re-measurement under ASC 820 when using the measurement alternative, certain disclosure requirements and which equity securities have to be re-measured at historical exchange rates.
Since the Company early adopted the guidance in ASU No. 2017-12, Derivatives and Hedging (ASC 815): Targeted Improvements to Accounting for Hedging Activities in 2018, the amended hedge accounting guidance in ASU No. 2019-04 is effective as of the beginning of the first annual reporting period beginning after April 25, 2019 with early adoption permitted on any date after the issuance of this ASU.
The Company will adopt ASU No. 2017-08 as of January 1, 2020. The adoption of the ASU did not have a material impact to the Company’s consolidated financial statements.
ASU No. 2019-12
In December 2019, the FASB released ASU No. 2019-12, Income Taxes (ASC 740): Simplifying the Accounting for Income Taxes, as part of their initiative to reduce complexity in accounting standards. The ASU simplifies the accounting for income taxes by eliminating certain exceptions to the approach for intraperiod tax allocation, the methodology for calculating income taxes in an interim period and the recognition of deferred tax liabilities for outside basis differences. The ASU also simplifies aspects of the accounting for enacted changes in tax laws or rates and clarifies the accounting for transactions that result in a step-up in the tax basis of goodwill.
ASU No. 2019-12 will be effective for fiscal years beginning after December 15, 2020, including interim periods, with early adoption permitted. The transition method for ASU No. 2019-12 varies between the simplification items. The Company is currently evaluating the impact of the ASU on the Company’s consolidated financial statements.
ASU No. 2020-01
In January 2020, the FASB released ASU No. 2020-01, Investments-Equity Securities (ASC 321), Investments-Equity Method and Joint Ventures (ASC 323), and Derivatives and Hedging (ASC 815): Clarifying the Interactions between ASC 321, ASC 323, and ASC 815, a consensus of the FASB’s Emerging Issues Task Force (EITF). The ASU clarifies that a company should consider observable transactions that require a company to either apply or discontinue the equity method of accounting under ASC 323 for the purposes of applying the measurement alternative in accordance with ASC 321 immediately before applying or upon discontinuing the equity method. The ASU also clarifies that, when determining the accounting for certain forward contracts and purchased options, a company should not consider, whether upon settlement or exercise, if the underlying securities would be accounted for under the equity method or fair value option.
ASU No. 2020-01 will be effective for fiscal years beginning after December 15, 2020, including interim periods, with early adoption permitted. The Company is currently evaluating the impact of the ASU on the Company’s consolidated financial statements.
NOTE 3 – INVESTMENT SECURITIES
The amortized cost and estimated fair values of investment securities, with gross unrealized gains and losses, consisted of the following:
| December 31, 2019 | |||||||||||||||
| (in thousands) | Amortized Cost | Gross Unrealized Gains | Gross Unrealized Losses | Estimated Fair Value | |||||||||||
| Securities available for sale: | |||||||||||||||
| U.S. Government-sponsored enterprise obligations | $ | 39,916 | $ | 281 | $ | — | $ | 40,197 | |||||||
| Obligations of state and political subdivisions | 160,873 | 7,607 | — | 168,480 | |||||||||||
| Mortgage-backed securities: | |||||||||||||||
| Residential agency | 2,876,069 | 27,423 | (3,836 | ) | 2,899,656 | ||||||||||
| Commercial agency | 704,661 | 17,202 | (404 | ) | 721,459 | ||||||||||
| Other securities | 101,022 | 2,779 | (233 | ) | 103,568 | ||||||||||
| Total securities available for sale | $ | 3,882,541 | $ | 55,292 | $ | (4,473 | ) | $ | 3,933,360 | ||||||
| Securities held to maturity: | |||||||||||||||
| Obligations of state and political subdivisions | $ | 166,386 | $ | 7,147 | $ | — | $ | 173,533 | |||||||
| Mortgage-backed securities: | |||||||||||||||
| Residential agency | 16,575 | 30 | (239 | ) | 16,366 | ||||||||||
| Total securities held to maturity | $ | 182,961 | $ | 7,177 | $ | (239 | ) | $ | 189,899 | ||||||
| December 31, 2018 | |||||||||||||||
| (in thousands) | Amortized Cost | Gross Unrealized Gains | Gross Unrealized Losses | Estimated Fair Value | |||||||||||
| Securities available for sale: | |||||||||||||||
| U.S. Government-sponsored enterprise obligations | $ | 995 | $ | 3 | $ | — | $ | 998 | |||||||
| Obligations of state and political subdivisions | 177,566 | 2,045 | (723 | ) | 178,888 | ||||||||||
| Mortgage-backed securities: | |||||||||||||||
| Residential agency | 3,837,584 | 8,886 | (57,073 | ) | 3,789,397 | ||||||||||
| Commercial agency | 730,148 | 2,363 | (14,799 | ) | 717,712 | ||||||||||
| Other securities | 97,020 | 351 | (787 | ) | 96,584 | ||||||||||
| Total securities available for sale | $ | 4,843,313 | $ | 13,648 | $ | (73,382 | ) | $ | 4,783,579 | ||||||
| Securities held to maturity: | |||||||||||||||
| Obligations of state and political subdivisions | $ | 188,684 | $ | 309 | $ | (2,497 | ) | $ | 186,496 | ||||||
| Mortgage-backed securities: | |||||||||||||||
| Residential agency | 18,762 | 30 | (1,011 | ) | 17,781 | ||||||||||
| Total securities held to maturity | $ | 207,446 | $ | 339 | $ | (3,508 | ) | $ | 204,277 | ||||||
Securities with carrying values of $2.2 billion and $2.4 billion were pledged to support repurchase transactions, public funds deposits, and certain long-term borrowings at December 31, 2019 and 2018, respectively.
Information pertaining to securities with gross unrealized losses, aggregated by investment category and length of time that individual securities have been in a continuous loss position, was as follows:
| December 31, 2019 | |||||||||||||||||||||||
| Less Than Twelve Months | Twelve Months or More | Total | |||||||||||||||||||||
| (in thousands) | Gross Unrealized Losses | Estimated Fair Value | Gross Unrealized Losses | Estimated Fair Value | Gross Unrealized Losses | Estimated Fair Value | |||||||||||||||||
| Securities available for sale: | |||||||||||||||||||||||
| Obligations of state and political subdivisions | $ | — | $ | 590 | $ | — | $ | — | $ | — | $ | 590 | |||||||||||
| Mortgage-backed securities: | |||||||||||||||||||||||
| Residential agency | (1,893 | ) | 441,332 | (1,943 | ) | 268,383 | (3,836 | ) | 709,715 | ||||||||||||||
| Commercial agency | (252 | ) | 56,728 | (152 | ) | 10,301 | (404 | ) | 67,029 | ||||||||||||||
| Other securities | (133 | ) | 13,241 | (100 | ) | 4,492 | (233 | ) | 17,733 | ||||||||||||||
| Total securities available for sale | $ | (2,278 | ) | $ | 511,891 | $ | (2,195 | ) | $ | 283,176 | $ | (4,473 | ) | $ | 795,067 | ||||||||
| Securities held to maturity: | |||||||||||||||||||||||
| Mortgage-backed securities: | |||||||||||||||||||||||
| Residential agency | $ | (52 | ) | $ | 6,308 | $ | (187 | ) | $ | 9,074 | $ | (239 | ) | $ | 15,382 | ||||||||
| Total securities held to maturity | $ | (52 | ) | $ | 6,308 | $ | (187 | ) | $ | 9,074 | $ | (239 | ) | $ | 15,382 | ||||||||
| December 31, 2018 | |||||||||||||||||||||||
| Less Than Twelve Months | Twelve Months or More | Total | |||||||||||||||||||||
| (in thousands) | Gross Unrealized Losses | Estimated Fair Value | Gross Unrealized Losses | Estimated Fair Value | Gross Unrealized Losses | Estimated Fair Value | |||||||||||||||||
| Securities available for sale: | |||||||||||||||||||||||
| Obligations of state and political subdivisions | $ | (9 | ) | $ | 4,112 | $ | (714 | ) | $ | 30,268 | $ | (723 | ) | $ | 34,380 | ||||||||
| Mortgage-backed securities: | |||||||||||||||||||||||
| Residential agency | (816 | ) | 197,057 | (56,257 | ) | 2,193,862 | (57,073 | ) | 2,390,919 | ||||||||||||||
| Commercial agency | (43 | ) | 18,190 | (14,756 | ) | 483,565 | (14,799 | ) | 501,755 | ||||||||||||||
| Other securities | (94 | ) | 18,025 | (693 | ) | 32,577 | (787 | ) | 50,602 | ||||||||||||||
| Total securities available for sale | $ | (962 | ) | $ | 237,384 | $ | (72,420 | ) | $ | 2,740,272 | $ | (73,382 | ) | $ | 2,977,656 | ||||||||
| Securities held to maturity: | |||||||||||||||||||||||
| Obligations of state and political subdivisions | $ | (3 | ) | $ | 2,059 | $ | (2,494 | ) | $ | 151,699 | $ | (2,497 | ) | $ | 153,758 | ||||||||
| Mortgage-backed securities: | |||||||||||||||||||||||
| Residential agency | — | — | (1,011 | ) | 17,478 | (1,011 | ) | 17,478 | |||||||||||||||
| Total securities held to maturity | $ | (3 | ) | $ | 2,059 | $ | (3,505 | ) | $ | 169,177 | $ | (3,508 | ) | $ | 171,236 | ||||||||
The Company held certain investment securities where amortized cost exceeded fair value, resulting in unrealized loss positions, as shown in the tables above. Management evaluates securities for other-than-temporary impairment on at least a quarterly basis, and more frequently when economic or market concerns warrant such evaluation. Impairment is considered to be other-than-temporary if the Company (1) intends to sell the security, (2) more likely than not will be required to sell the security before recovering its cost, or (3) does not expect to recover the security's entire amortized cost basis. As of December 31, 2019, the Company did not intend to sell any of these securities, did not expect to be required to sell these securities, and expected to recover the entire amortized cost of all these securities. As a result of the Company's analysis, no declines in the estimated fair value of the Company's investment securities were deemed to be other-than-temporary at December 31, 2019 or 2018.
At December 31, 2019, 123 debt securities had unrealized losses of 0.58% of the securities’ amortized cost basis. At December 31, 2018, 488 debt securities had unrealized losses of 2.38% of the securities’ amortized cost basis. The unrealized losses for each of the securities related to market interest rate changes and not credit concerns of the issuers. Additional information on securities that have been in a continuous loss position for over twelve months at December 31 is presented in the following table.
| (in thousands) | 2019 | 2018 | |||||
| Number of securities | |||||||
| Mortgage-backed securities: | |||||||
| Residential agency | 59 | 302 | |||||
| Commercial agency | 6 | 72 | |||||
| Obligations of state and political subdivisions | — | 60 | |||||
| Other securities | 4 | 7 | |||||
| 69 | 441 | ||||||
| Amortized Cost Basis | |||||||
| Mortgage-backed securities: | |||||||
| Residential agency | $ | 279,587 | $ | 2,268,608 | |||
| Commercial agency | 10,453 | 498,321 | |||||
| Obligations of state and political subdivisions | — | 185,175 | |||||
| Other securities | 4,591 | 33,270 | |||||
| $ | 294,631 | $ | 2,985,374 | ||||
| Unrealized Loss | |||||||
| Mortgage-backed securities: | |||||||
| Residential agency | $ | 2,130 | $ | 57,268 | |||
| Commercial agency | 152 | 14,756 | |||||
| Obligations of state and political subdivisions | — | 3,208 | |||||
| Other securities | 100 | 693 | |||||
| $ | 2,382 | $ | 75,925 | ||||
The amortized cost and estimated fair value of investment securities by maturity at December 31, 2019 are presented in the following table. Securities are classified according to their contractual maturities without consideration of principal amortization, potential prepayments or call options. Accordingly, actual maturities may differ from contractual maturities. Weighted average yields are calculated on the basis of the yield to maturity based on the amortized cost of each security.
| Securities Available for Sale | Securities Held to Maturity | ||||||||||||||||||||
| (in thousands) | Weighted Average Yield | Amortized Cost | Estimated Fair Value | Weighted Average Yield | Amortized Cost | Estimated Fair Value | |||||||||||||||
| Within one year or less | 2.61 | % | $ | 40,875 | $ | 41,158 | 3.29 | % | $ | 330 | $ | 331 | |||||||||
| One through five years | 2.52 | 127,588 | 130,809 | 2.60 | 5,350 | 5,380 | |||||||||||||||
| After five through ten years | 2.72 | 706,365 | 725,592 | 2.37 | 42,775 | 44,314 | |||||||||||||||
| Over ten years | 2.45 | 3,007,713 | 3,035,801 | 2.57 | 134,506 | 139,874 | |||||||||||||||
| 2.50 | % | $ | 3,882,541 | $ | 3,933,360 | 2.53 | % | $ | 182,961 | $ | 189,899 | ||||||||||
The following is a summary of realized gains and losses from the sale of securities classified as available for sale. Gains or losses on securities sold are recorded on the trade date, using the specific identification method.
| Years Ended December 31, | |||||||||||
| (in thousands) | 2019 | 2018 | 2017 | ||||||||
| Realized gains | $ | 1,332 | $ | 40 | $ | 1,651 | |||||
| Realized losses | (2,311 | ) | (49,940 | ) | (1,799 | ) | |||||
| $ | (979 | ) | $ | (49,900 | ) | $ | (148 | ) | |||
In addition to the gains above, the Company realized certain gains on calls of securities held to maturity that were not significant to the consolidated financial statements.
Other Equity Securities
The Company accounts for the following securities at cost less impairment plus or minus any observable price changes, which approximates fair value, with the exception of CRA and Community Development Investment Funds, which are recorded at fair value. Other equity securities, which are presented in other assets on the consolidated balance sheets, were as follows:
| (in thousands) | 2019 | 2018 | |||||
| Federal Home Loan Bank stock | $ | 70,386 | $ | 95,213 | |||
| Federal Reserve Bank stock | 85,630 | 85,630 | |||||
| CRA and Community Development Investment Funds | 1,948 | 1,884 | |||||
| Other investments | 21,118 | 9,709 | |||||
| $ | 179,082 | $ | 192,436 | ||||
NOTE 4 – LOANS AND LEASES
Loans and leases by portfolio segment and class consisted of the following at December 31:
| (in thousands) | 2019 | 2018 | ||||||
| Commercial loans and leases: | ||||||||
| Real estate - construction | $ | 1,321,663 | $ | 1,196,366 | ||||
| Real estate - owner-occupied | 2,475,326 | 2,395,822 | ||||||
| Real estate - non-owner-occupied | 6,267,106 | 5,796,117 | ||||||
Commercial and industrial (1) | 6,547,538 | 5,737,017 | ||||||
| Total commercial loans and leases | 16,611,633 | 15,125,322 | ||||||
| Residential mortgage loans | 4,739,075 | 4,359,156 | ||||||
| Consumer and other loans: | ||||||||
| Home equity | 1,987,336 | 2,304,694 | ||||||
| Other | 683,455 | 730,643 | ||||||
| Total consumer and other loans | 2,670,791 | 3,035,337 | ||||||
| Total loans and leases | $ | 24,021,499 | $ | 22,519,815 | ||||
(1) Includes equipment financing leases of $1.0 billion and $431.7 million at December 31, 2019 and 2018, respectively.
Net deferred loan origination fees were $36.8 million and $30.2 million at December 31, 2019 and 2018, respectively. Total net discount on the Company's loans was $89.3 million and $136.8 million at December 31, 2019 and 2018, respectively, of which $56.4 million and $81.6 million was related to non-impaired loans.
In addition to loans issued in the normal course of business, the Company considers overdrafts on customer deposit accounts to be loans and reclassifies these overdrafts as loans in its consolidated balance sheets. At December 31, 2019 and 2018, overdrafts of $7.7 million and $9.2 million, respectively, had been reclassified to loans.
Loans with carrying values of $8.6 billion and $7.6 billion were pledged as collateral for borrowings at December 31, 2019 and 2018, respectively.
Aging Analysis
The following tables provide an analysis of the aging of loans and leases as of December 31, 2019 and 2018. Past due and non-accrual loan amounts exclude acquired impaired loans, even if contractually past due or if the Company does not expect to receive payment in full, as the Company is currently accreting interest income over the expected life of the loans. For additional information on the determination of past due status and the Company's policies for recording payments received, placing loans and leases on non-accrual status, and the resumption of interest accrual on non-accruing loans and leases, See Note 1, Summary of Significant Accounting Policies.
| December 31, 2019 | |||||||||||||||||||||||||||||||
| Accruing | |||||||||||||||||||||||||||||||
| (in thousands) | Current or less than 30 Days Past Due | 30-59 Days | 60-89 Days | > 90 Days | Total Past Due | Non-accrual Loans (1) | Acquired Impaired Loans | Total | |||||||||||||||||||||||
| Real estate - construction | $ | 1,311,458 | $ | 244 | $ | — | $ | — | $ | 244 | $ | 1,394 | $ | 8,567 | $ | 1,321,663 | |||||||||||||||
| Real estate - owner-occupied | 2,384,204 | 15,619 | 1,118 | 1,035 | 17,772 | 17,817 | 55,533 | 2,475,326 | |||||||||||||||||||||||
| Real estate - non-owner-occupied | 6,194,061 | 2,831 | 2,459 | 58 | 5,348 | 15,440 | 52,257 | 6,267,106 | |||||||||||||||||||||||
| Commercial and industrial | 6,474,894 | 6,414 | 1,126 | 887 | 8,427 | 41,636 | 22,581 | 6,547,538 | |||||||||||||||||||||||
| Residential mortgage | 4,608,767 | 2,335 | 16,052 | 1,277 | 19,664 | 34,833 | 75,811 | 4,739,075 | |||||||||||||||||||||||
| Consumer - home equity | 1,899,490 | 12,916 | 2,141 | — | 15,057 | 24,404 | 48,385 | 1,987,336 | |||||||||||||||||||||||
| Consumer - other | 672,931 | 3,760 | 1,189 | — | 4,949 | 3,381 | 2,194 | 683,455 | |||||||||||||||||||||||
| Total loans and leases | $ | 23,545,805 | $ | 44,119 | $ | 24,085 | $ | 3,257 | $ | 71,461 | $ | 138,905 | $ | 265,328 | $ | 24,021,499 | |||||||||||||||
(1) Of the total non-accrual loans at December 31, 2019, $8.7 million were past due 30-59 days, $4.3 million were past due 60-89 days, and $73.2 million were past due more than 90 days.
| December 31, 2018 | |||||||||||||||||||||||||||||||
| Accruing | |||||||||||||||||||||||||||||||
| (in thousands) | Current or less than 30 Days Past Due | 30-59 Days | 60-89 Days | > 90 Days | Total Past Due | Non-accrual Loans (1) | Acquired Impaired Loans | Total | |||||||||||||||||||||||
| Real estate - construction | $ | 1,167,795 | $ | 1,054 | $ | — | $ | — | $ | 1,054 | $ | 1,094 | $ | 26,423 | $ | 1,196,366 | |||||||||||||||
| Real estate - owner-occupied | 2,305,743 | 7,167 | — | — | 7,167 | 10,260 | 72,652 | 2,395,822 | |||||||||||||||||||||||
| Real estate - non-owner-occupied | 5,703,131 | 7,473 | 360 | — | 7,833 | 15,898 | 69,255 | 5,796,117 | |||||||||||||||||||||||
| Commercial and industrial | 5,645,304 | 5,139 | 1,320 | 553 | 7,012 | 57,860 | 26,841 | 5,737,017 | |||||||||||||||||||||||
| Residential mortgage | 4,218,146 | 2,768 | 13,063 | 1,575 | 17,406 | 30,396 | 93,208 | 4,359,156 | |||||||||||||||||||||||
| Consumer - home equity | 2,200,517 | 10,283 | 2,409 | — | 12,692 | 18,830 | 72,655 | 2,304,694 | |||||||||||||||||||||||
| Consumer - other | 719,122 | 4,695 | 1,601 | — | 6,296 | 2,846 | 2,379 | 730,643 | |||||||||||||||||||||||
| Total loans and leases | $ | 21,959,758 | $ | 38,579 | $ | 18,753 | $ | 2,128 | $ | 59,460 | $ | 137,184 | $ | 363,413 | $ | 22,519,815 | |||||||||||||||
(1) Of the total non-accrual loans at December 31, 2018, $7.0 million were past due 30-59 days, $3.7 million were past due 60-89 days, and $66.9 million were past due more than 90 days.
Acquired Loans
The Company acquired certain loans from Sabadell United to customers with addresses outside of the United States. Foreign loans, denominated in U.S. dollars, totaled $182.4 million and $202.6 million at December 31, 2019 and 2018, respectively.
The following is a summary of changes in the accretable difference for all loans accounted for under ASC 310-30 during the years ended December 31:
| (in thousands) | 2019 | 2018 | 2017 | |||||||||
| Balance at beginning of period | $ | 133,342 | $ | 152,623 | $ | 175,054 | ||||||
| Additions | — | 5,574 | 32,937 | |||||||||
| Transfers from non-accretable difference to accretable yield | (2,150 | ) | 3,623 | 4,912 | ||||||||
| Accretion | (36,512 | ) | (47,962 | ) | (56,337 | ) | ||||||
Changes in expected cash flows not affecting non-accretable differences (1) | (4,529 | ) | 19,484 | (3,943 | ) | |||||||
| Balance at end of period | $ | 90,151 | $ | 133,342 | $ | 152,623 | ||||||
(1) | Includes changes in cash flows expected to be collected due to the impact of changes in actual or expected timing of liquidation events, modifications, changes in interest rates and changes in prepayment assumptions. |
Troubled Debt Restructurings
Information about the Company’s TDRs is presented in the following tables. Modifications of loans that are accounted for within a pool under ASC Topic 310-30 are excluded as TDRs. Accordingly, such modifications do not result in the removal of those loans from the pool, even if the modification of those loans would otherwise be considered a TDR. As a result, all such acquired loans that would otherwise meet the criteria for classification as a TDR are excluded from the tables below.
TDRs totaling $57.9 million, $53.2 million, and $70.5 million occurred during the years ended December 31, 2019, 2018, and 2017, respectively, through modification of the original loan terms.
The following table provides information on how the TDRs were modified during the years ended December 31:
| (in thousands) | 2019 | 2018 | 2017 | ||||||||
| Extended maturities | $ | 11,741 | $ | 23,262 | $ | 26,561 | |||||
| Interest rate adjustment | 68 | 99 | 24 | ||||||||
| Maturity and interest rate adjustment | 1,729 | 554 | 4,932 | ||||||||
| Movement to or extension of interest-rate only payments | 1,791 | 881 | 4,161 | ||||||||
| Forbearance | 22,319 | 4,432 | 7,226 | ||||||||
Other concession(s) (1) | 20,226 | 23,943 | 27,555 | ||||||||
| Total | $ | 57,874 | $ | 53,171 | $ | 70,459 | |||||
(1) | Other concessions may include covenant waivers, forgiveness of principal or interest associated with a customer bankruptcy, or a combination of any of the above concessions. |
Of the $57.9 million of TDRs occurring during the year ended December 31, 2019, $25.1 million were on accrual status and $32.8 million were on non-accrual status. Of the $53.2 million of TDRs occurring during the year ended December 31, 2018, $31.5 million were on accrual status and $21.7 million were on non-accrual status. Of the $70.5 million of TDRs occuring during the year ended December 31, 2017, $46.3 million were on accrual status and $24.2 million were on non-accrual status.
The following table presents the end of period balance for loans modified in a TDR during the years ended December 31:
| 2019 | 2018 | 2017 | ||||||||||||||||||||||||||||||
| (In thousands, except number of loans) | Number of Loans | Pre-modification Outstanding Recorded Investment | Post-modification Outstanding Recorded Investment | Number of Loans | Pre-modification Outstanding Recorded Investment | Post-modification Outstanding Recorded Investment | Number of Loans | Pre-modification Outstanding Recorded Investment | Post-modification Outstanding Recorded Investment | |||||||||||||||||||||||
| Commercial real estate - construction | 2 | $ | 6,377 | $ | 9,258 | 3 | $ | 4,819 | $ | 3,830 | 4 | $ | 9,404 | $ | 9,628 | |||||||||||||||||
| Commercial real estate - owner-occupied | 11 | 10,081 | 9,587 | 14 | 4,257 | 3,912 | 11 | 5,779 | 5,706 | |||||||||||||||||||||||
| Commercial real estate - non-owner-occupied | 27 | 9,264 | 8,436 | 20 | 3,719 | 3,428 | 19 | 11,974 | 13,738 | |||||||||||||||||||||||
| Commercial and industrial | 66 | 30,536 | 18,803 | 52 | 39,796 | 30,295 | 57 | 21,651 | 20,883 | |||||||||||||||||||||||
| Residential mortgage | 36 | 2,729 | 2,511 | 19 | 1,706 | 1,529 | 24 | 1,897 | 1,771 | |||||||||||||||||||||||
| Consumer - home equity | 86 | 8,775 | 8,262 | 65 | 10,607 | 8,951 | 123 | 16,346 | 15,862 | |||||||||||||||||||||||
| Consumer - other | 54 | 1,150 | 1,018 | 73 | 1,491 | 1,226 | 121 | 3,182 | 2,871 | |||||||||||||||||||||||
| Total | 282 | $ | 68,912 | $ | 57,875 | 246 | $ | 66,395 | $ | 53,171 | 359 | $ | 70,233 | $ | 70,459 | |||||||||||||||||
Information detailing TDRs that defaulted during the years ended December 31, 2019, 2018, and 2017 and were modified in the previous twelve months (i.e., the twelve months prior to the default) is presented in the following table. The Company has defined a default as any loan with a loan payment that is currently past due greater than 30 days, or was past due greater than 30 days at any point during the previous twelve months, or since the date of modification, whichever is shorter.
| 2019 | 2018 | 2017 | ||||||||||||||||||
| (In thousands, except number of loans) | Number of Loans | Recorded Investment | Number of Loans | Recorded Investment | Number of Loans | Recorded Investment | ||||||||||||||
| Commercial real estate - construction | — | $ | — | — | $ | — | 2 | $ | 3,572 | |||||||||||
| Commercial real estate - owner-occupied | 6 | 4,357 | 2 | 142 | 6 | 4,668 | ||||||||||||||
| Commercial real estate - non-owner-occupied | 9 | 4,215 | 5 | 1,039 | 13 | 8,060 | ||||||||||||||
| Commercial and industrial | 27 | 7,027 | 13 | 3,757 | 32 | 6,550 | ||||||||||||||
| Residential mortgage | 15 | 1,287 | 8 | 773 | 16 | 1,218 | ||||||||||||||
| Consumer - home equity | 28 | 2,178 | 15 | 1,354 | 32 | 3,285 | ||||||||||||||
| Consumer - other | 32 | 545 | 38 | 447 | 62 | 1,381 | ||||||||||||||
| Total | 117 | $ | 19,609 | 81 | $ | 7,512 | 163 | $ | 28,734 | |||||||||||
NOTE 5 – ALLOWANCE FOR CREDIT LOSSES AND CREDIT QUALITY
Allowance for Credit Losses Activity
The following tables present the activity in the allowance for credit losses by loan portfolio type for the years ended December 31, 2019, 2018, and 2017:
| 2019 | |||||||||||||||||||
| (in thousands) | Commercial Real Estate | Commercial and Industrial | Residential Mortgage | Consumer and Other | Total | ||||||||||||||
| Allowance for loan and lease losses at beginning of period | $ | 51,806 | $ | 54,096 | $ | 12,998 | $ | 21,671 | $ | 140,571 | |||||||||
| Provision for loan and lease losses | 9,262 | 19,177 | — | 11,411 | 39,850 | ||||||||||||||
| Transfer of balance to OREO and other | (636 | ) | 235 | (3,221 | ) | 335 | (3,287 | ) | |||||||||||
| Charge-offs | (2,613 | ) | (21,966 | ) | (309 | ) | (13,482 | ) | (38,370 | ) | |||||||||
| Recoveries | 475 | 4,092 | 179 | 3,078 | 7,824 | ||||||||||||||
| Allowance for loan and lease losses at end of period | $ | 58,294 | $ | 55,634 | $ | 9,647 | $ | 23,013 | $ | 146,588 | |||||||||
| Reserve for unfunded commitments at beginning of period | $ | 4,869 | $ | 6,198 | $ | 866 | $ | 2,897 | $ | 14,830 | |||||||||
| Provision for (reversal of) unfunded commitments | 1,115 | 280 | (304 | ) | 716 | 1,807 | |||||||||||||
| Reserve for unfunded commitments at end of period | $ | 5,984 | $ | 6,478 | $ | 562 | $ | 3,613 | $ | 16,637 | |||||||||
| Allowance for credit losses at end of period | $ | 64,278 | $ | 62,112 | $ | 10,209 | $ | 26,626 | $ | 163,225 | |||||||||
| Allowance - individually evaluated for impairment | $ | 5,600 | $ | 11,763 | $ | 285 | $ | 3,249 | $ | 20,897 | |||||||||
| Allowance - collectively evaluated for impairment | 47,308 | 42,346 | 5,400 | 19,417 | 114,471 | ||||||||||||||
| Allowance - acquired with deteriorated credit quality | 5,386 | 1,525 | 3,962 | 347 | 11,220 | ||||||||||||||
| Loans and leases, net of unearned income: | |||||||||||||||||||
| Individually evaluated for impairment | 69,819 | 48,834 | 29,402 | 40,219 | 188,274 | ||||||||||||||
| Collectively evaluated for impairment | 9,877,919 | 6,476,123 | 4,633,862 | 2,579,993 | 23,567,897 | ||||||||||||||
| Acquired with deteriorated credit quality | 116,357 | 22,581 | 75,811 | 50,579 | 265,328 | ||||||||||||||
| Total loans and leases, net of unearned income | $ | 10,064,095 | $ | 6,547,538 | $ | 4,739,075 | $ | 2,670,791 | $ | 24,021,499 | |||||||||
| 2018 | |||||||||||||||||||
| (in thousands) | Commercial Real Estate | Commercial and Industrial | Residential Mortgage | Consumer and Other | Total | ||||||||||||||
| Allowance for loan and lease losses at beginning of period | $ | 54,201 | $ | 53,916 | $ | 9,117 | $ | 23,657 | $ | 140,891 | |||||||||
| Provision for (reversal of) loan and lease losses | (829 | ) | 23,866 | 4,200 | 12,235 | 39,472 | |||||||||||||
| Transfer of balance to OREO and other | (2,256 | ) | (812 | ) | (106 | ) | (3,998 | ) | (7,172 | ) | |||||||||
| Charge-offs | (1,611 | ) | (29,578 | ) | (334 | ) | (14,024 | ) | (45,547 | ) | |||||||||
| Recoveries | 2,301 | 6,704 | 121 | 3,801 | 12,927 | ||||||||||||||
| Allowance for loan and lease losses at end of period | $ | 51,806 | $ | 54,096 | $ | 12,998 | $ | 21,671 | $ | 140,571 | |||||||||
| Reserve for unfunded commitments at beginning of period | $ | 4,531 | $ | 5,309 | $ | 555 | $ | 2,813 | $ | 13,208 | |||||||||
| Balance created in acquisition accounting | 118 | 40 | 551 | — | 709 | ||||||||||||||
| Provision for (reversal of) unfunded commitments | 220 | 849 | (240 | ) | 84 | 913 | |||||||||||||
| Reserve for unfunded commitments at end of period | $ | 4,869 | $ | 6,198 | $ | 866 | $ | 2,897 | $ | 14,830 | |||||||||
| Allowance for credit losses at end of period | $ | 56,675 | $ | 60,294 | $ | 13,864 | $ | 24,568 | $ | 155,401 | |||||||||
| Allowance - individually evaluated for impairment | $ | 636 | $ | 12,646 | $ | 145 | $ | 2,915 | $ | 16,342 | |||||||||
| Allowance - collectively evaluated for impairment | 45,651 | 39,949 | 6,961 | 18,705 | 111,266 | ||||||||||||||
| Allowance - acquired with deteriorated credit quality | 5,519 | 1,501 | 5,892 | 51 | 12,963 | ||||||||||||||
| Loans and leases, net of unearned income: | |||||||||||||||||||
| Individually evaluated for impairment | 53,905 | 71,801 | 6,579 | 37,440 | 169,725 | ||||||||||||||
| Collectively evaluated for impairment | 9,166,070 | 5,638,375 | 4,259,369 | 2,922,863 | 21,986,677 | ||||||||||||||
| Acquired with deteriorated credit quality | 168,330 | 26,841 | 93,208 | 75,034 | 363,413 | ||||||||||||||
| Total loans and leases, net of unearned income | $ | 9,388,305 | $ | 5,737,017 | $ | 4,359,156 | $ | 3,035,337 | $ | 22,519,815 | |||||||||
| 2017 | |||||||||||||||||||
| (in thousands) | Commercial Real Estate | Commercial and Industrial | Residential Mortgage | Consumer and Other | Total | ||||||||||||||
| Allowance for loan and lease losses at beginning of period | $ | 49,231 | $ | 60,939 | $ | 11,249 | $ | 23,300 | $ | 144,719 | |||||||||
| Provision for (reversal of) loan and lease losses | 10,433 | 31,891 | (2,206 | ) | 10,993 | 51,111 | |||||||||||||
| Transfer of balance to OREO and other | 853 | (68 | ) | 2 | 147 | 934 | |||||||||||||
| Charge-offs | (7,433 | ) | (40,015 | ) | (365 | ) | (14,653 | ) | (62,466 | ) | |||||||||
| Recoveries | 1,117 | 1,169 | 437 | 3,870 | 6,593 | ||||||||||||||
| Allowance for loan and lease losses at end of period | $ | 54,201 | $ | 53,916 | $ | 9,117 | $ | 23,657 | $ | 140,891 | |||||||||
| Reserve for unfunded commitments at beginning of period | $ | 3,207 | $ | 4,537 | $ | 657 | $ | 2,840 | $ | 11,241 | |||||||||
| Balance created in acquisition accounting | 253 | 783 | 327 | 7 | 1,370 | ||||||||||||||
| Provision for (reversal of) unfunded commitments | 1,071 | (11 | ) | (429 | ) | (34 | ) | 597 | |||||||||||
| Reserve for unfunded commitments at end of period | $ | 4,531 | $ | 5,309 | $ | 555 | $ | 2,813 | $ | 13,208 | |||||||||
| Allowance for credit losses at end of period | $ | 58,732 | $ | 59,225 | $ | 9,672 | $ | 26,470 | $ | 154,099 | |||||||||
| Allowance - individually evaluated for impairment | $ | 1,588 | $ | 12,736 | $ | 172 | $ | 2,856 | $ | 17,352 | |||||||||
| Allowance - collectively evaluated for impairment | 30,360 | 38,944 | 3,141 | 17,210 | 89,655 | ||||||||||||||
| Allowance - acquired with deteriorated credit quality | 22,253 | 2,236 | 5,804 | 3,591 | 33,884 | ||||||||||||||
| Loans and leases, net of unearned income: | |||||||||||||||||||
| Individually evaluated for impairment | 91,785 | 102,416 | 6,749 | 37,177 | 238,127 | ||||||||||||||
| Collectively evaluated for impairment | 8,616,924 | 5,001,505 | 2,911,222 | 2,828,848 | 19,358,499 | ||||||||||||||
| Acquired with deteriorated credit quality | 229,521 | 31,146 | 138,381 | 82,507 | 481,555 | ||||||||||||||
| Total loans and leases, net of unearned income | $ | 8,938,230 | $ | 5,135,067 | $ | 3,056,352 | $ | 2,948,532 | $ | 20,078,181 | |||||||||
Portfolio Segment Risk Factors
Commercial real estate loans include loans to commercial customers for medium-term financing of land and buildings or for land development or construction of a building. These loans are repaid through revenues from operations of the businesses, rents of properties, sales of properties and refinances. Commercial and industrial loans and leases represent loans to commercial customers to finance general working capital needs, equipment purchases and leases and other projects where repayment is derived from cash flows resulting from business operations. The Company originates commercial and industrial loans on both a secured and, to a lesser extent, unsecured basis.
Residential mortgage loans consist of loans to consumers to finance a primary residence. The vast majority of the residential mortgage loan portfolio is comprised of non-conforming 1-4 family mortgage loans secured by properties located in the Company's market areas and originated under terms and documentation that permit their sale in a secondary market.
Consumer loans are offered by the Company in order to provide a full range of retail financial services to its customers and include home equity, credit card and other direct consumer installment loans. The Company originates substantially all of its consumer loans in its primary market areas. Consumer loans are sensitive to unemployment and other key consumer economic measures.
Credit Quality Indicators
For commercial loans and leases, the Company utilizes regulatory asset risk classification ratings to monitor credit quality. Loans with a "pass" rating are those that the Company believes will be fully repaid in accordance with the contractual loan terms. Commercial loans and leases that are "criticized" are those that have some weakness or potential weakness that indicate an increased probability of future loss. "Criticized" loans are grouped into three categories: "special mention", "substandard", and "doubtful".
Special mention loans have potential weaknesses that, if left uncorrected, may result in deterioration of the Company's credit position at some future date. Substandard commercial loans have well-defined weaknesses and are characterized by the distinct possibility that the Company will sustain some loss if the deficiencies are not corrected. Doubtful commercial loans have the same weaknesses as substandard loans with the added characteristics that the probability of loss is high and collection of the full amount is improbable. Substandard and doubtful loans are collectively referred to as "classified" loans. For residential mortgage loans and consumer loans, the Company primarily uses the loan's payment and delinquency status to monitor credit quality. These credit quality indicators are continually updated and monitored.
The recorded investment in loans and leases by credit quality indicator is presented in the following tables. Asset risk classifications for commercial loans and leases reflect the classification as of December 31, 2019 and 2018. Credit quality information in the tables below includes total loans acquired (including acquired impaired loans) at the net loan balance, after the application of premiums and discounts. Loan premiums and discounts represent the adjustment of acquired loans to fair value at the acquisition date, as adjusted for income accretion and changes in cash flow estimates in subsequent periods.
| December 31, 2019 | December 31, 2018 | ||||||||||||||||||||||||||||||||||||||
| (in thousands) | Pass | Special Mention | Sub- standard | Doubtful | Total | Pass | Special Mention | Sub- standard | Doubtful | Total | |||||||||||||||||||||||||||||
| Commercial real estate - construction | $ | 1,300,953 | $ | 10,801 | $ | 9,909 | $ | — | $ | 1,321,663 | $ | 1,182,554 | $ | 1,062 | $ | 12,740 | $ | 10 | $ | 1,196,366 | |||||||||||||||||||
| Commercial real estate - owner-occupied | 2,412,953 | 19,430 | 40,570 | 2,373 | 2,475,326 | 2,328,999 | 25,526 | 41,297 | — | 2,395,822 | |||||||||||||||||||||||||||||
| Commercial real estate - non-owner-occupied | 6,185,185 | 45,938 | 35,726 | 257 | 6,267,106 | 5,687,963 | 78,009 | 26,512 | 3,633 | 5,796,117 | |||||||||||||||||||||||||||||
| Commercial and industrial | 6,426,235 | 51,605 | 56,691 | 13,007 | 6,547,538 | 5,586,482 | 52,632 | 73,853 | 24,050 | 5,737,017 | |||||||||||||||||||||||||||||
| Total commercial loans and leases | $ | 16,325,326 | $ | 127,774 | $ | 142,896 | $ | 15,637 | $ | 16,611,633 | $ | 14,785,998 | $ | 157,229 | $ | 154,402 | $ | 27,693 | $ | 15,125,322 | |||||||||||||||||||
| December 31, 2019 | December 31, 2018 | ||||||||||||||||||||||
| (in thousands) | Current | 30+ Days Past Due | Total | Current | 30+ Days Past Due | Total | |||||||||||||||||
| Residential mortgage | $ | 4,673,266 | $ | 65,809 | $ | 4,739,075 | $ | 4,290,152 | $ | 69,004 | $ | 4,359,156 | |||||||||||
| Consumer - home equity | 1,942,091 | 45,245 | 1,987,336 | 2,258,659 | 46,035 | 2,304,694 | |||||||||||||||||
| Consumer - other | 675,014 | 8,441 | 683,455 | 721,231 | 9,412 | 730,643 | |||||||||||||||||
| Total | $ | 7,290,371 | $ | 119,495 | $ | 7,409,866 | $ | 7,270,042 | $ | 124,451 | $ | 7,394,493 | |||||||||||
Impaired Loans
Information on impaired loans, which include all TDRs and all other non-accrual loans evaluated or measured individually for impairment for purposes of determining the ALLL, is presented in the following tables as of and for the periods indicated. As of December 31, 2019, 2018, and 2017, the Company was not committed to lend a material amount of additional funds to any customer whose loan was classified as impaired or as a TDR.
| December 31, 2019 | |||||||||||||||||||
| (in thousands) | Unpaid Principal Balance | Recorded Investment | Related Allowance | Average Recorded Investment | Interest Income Recognized | ||||||||||||||
| With no related allowance recorded: | |||||||||||||||||||
| Commercial real estate - construction | $ | 11,150 | $ | 10,141 | $ | — | $ | 7,609 | $ | 336 | |||||||||
| Commercial real estate - owner-occupied | 32,849 | 32,398 | — | 33,378 | 1,439 | ||||||||||||||
| Commercial real estate - non-owner-occupied | 14,340 | 12,903 | — | 13,378 | 364 | ||||||||||||||
| Commercial and industrial | 19,315 | 16,070 | — | 17,485 | 453 | ||||||||||||||
| Residential mortgage | 19,800 | 19,500 | — | 16,403 | 224 | ||||||||||||||
| Consumer - home equity | 4,465 | 4,461 | — | 4,390 | 167 | ||||||||||||||
| With an allowance recorded: | |||||||||||||||||||
| Commercial real estate - construction | 141 | 126 | 2 | 138 | 3 | ||||||||||||||
| Commercial real estate - owner-occupied | 5,074 | 4,795 | 2,591 | 4,927 | 118 | ||||||||||||||
| Commercial real estate - non-owner-occupied | 9,828 | 9,456 | 3,007 | 9,620 | 208 | ||||||||||||||
| Commercial and industrial | 37,509 | 32,764 | 11,763 | 32,807 | 790 | ||||||||||||||
| Residential mortgage | 10,871 | 9,902 | 285 | 10,327 | 355 | ||||||||||||||
| Consumer - home equity | 31,581 | 30,798 | 2,630 | 30,762 | 1,228 | ||||||||||||||
| Consumer - other | 5,262 | 4,960 | 619 | 5,251 | 263 | ||||||||||||||
| Total impaired loans | $ | 202,185 | $ | 188,274 | $ | 20,897 | $ | 186,475 | $ | 5,948 | |||||||||
| Total commercial loans and leases | $ | 130,206 | $ | 118,653 | $ | 17,363 | $ | 119,342 | $ | 3,711 | |||||||||
| Total residential mortgage loans | 30,671 | 29,402 | 285 | 26,730 | 579 | ||||||||||||||
| Total consumer and other loans | 41,308 | 40,219 | 3,249 | 40,403 | 1,658 | ||||||||||||||
| December 31, 2018 | |||||||||||||||||||
| (in thousands) | Unpaid Principal Balance | Recorded Investment | Related Allowance | Average Recorded Investment | Interest Income Recognized | ||||||||||||||
| With no related allowance recorded: | |||||||||||||||||||
| Commercial real estate - construction | $ | 10,261 | $ | 9,262 | $ | — | $ | 9,189 | $ | 496 | |||||||||
| Commercial real estate - owner-occupied | 25,037 | 19,044 | — | 19,559 | 807 | ||||||||||||||
| Commercial real estate - non-owner-occupied | 15,265 | 14,288 | — | 14,873 | 590 | ||||||||||||||
| Commercial and industrial | 55,554 | 43,886 | — | 47,268 | 2,422 | ||||||||||||||
| Residential mortgage | 1,244 | 1,221 | — | 1,261 | 46 | ||||||||||||||
| Consumer - home equity | 4,183 | 4,176 | — | 2,867 | 39 | ||||||||||||||
| With an allowance recorded: | |||||||||||||||||||
| Commercial real estate - construction | 228 | 140 | 11 | 148 | 1 | ||||||||||||||
| Commercial real estate - owner-occupied | 5,032 | 4,773 | 520 | 4,976 | 196 | ||||||||||||||
| Commercial real estate - non-owner-occupied | 6,445 | 6,398 | 105 | 6,229 | 294 | ||||||||||||||
| Commercial and industrial | 46,387 | 27,915 | 12,646 | 40,653 | 795 | ||||||||||||||
| Residential mortgage | 5,870 | 5,358 | 145 | 5,494 | 225 | ||||||||||||||
| Consumer - home equity | 29,284 | 28,818 | 2,427 | 27,911 | 1,202 | ||||||||||||||
| Consumer - other | 4,956 | 4,446 | 488 | 4,822 | 273 | ||||||||||||||
| Total impaired loans | $ | 209,746 | $ | 169,725 | $ | 16,342 | $ | 185,250 | $ | 7,386 | |||||||||
| Total commercial loans and leases | $ | 164,209 | $ | 125,706 | $ | 13,282 | $ | 142,895 | $ | 5,601 | |||||||||
| Total residential mortgage loans | 7,114 | 6,579 | 145 | 6,755 | 271 | ||||||||||||||
| Total consumer and other loans | 38,423 | 37,440 | 2,915 | 35,600 | 1,514 | ||||||||||||||
| December 31, 2017 | |||||||||||||||||||
| (in thousands) | Unpaid Principal Balance | Recorded Investment | Related Allowance | Average Recorded Investment | Interest Income Recognized | ||||||||||||||
| With no related allowance recorded: | |||||||||||||||||||
| Commercial real estate - construction | $ | 13,763 | $ | 13,013 | $ | — | $ | 9,104 | $ | 441 | |||||||||
| Commercial real estate - owner-occupied | 50,867 | 44,482 | — | 53,282 | 1,389 | ||||||||||||||
| Commercial real estate - non-owner-occupied | 15,370 | 14,975 | — | 15,127 | 692 | ||||||||||||||
| Commercial and industrial | 103,013 | 70,254 | — | 92,312 | 2,279 | ||||||||||||||
| Residential mortgage | 2,004 | 2,001 | — | 2,044 | 85 | ||||||||||||||
| Consumer - home equity | 5,906 | 5,634 | — | 5,747 | 231 | ||||||||||||||
| Consumer - other | 75 | 75 | — | 11 | 1 | ||||||||||||||
| With an allowance recorded: | |||||||||||||||||||
| Commercial real estate - construction | 238 | 156 | 19 | 197 | 6 | ||||||||||||||
| Commercial real estate - owner-occupied | 13,314 | 13,287 | 949 | 13,498 | 414 | ||||||||||||||
| Commercial real estate - non-owner-occupied | 6,051 | 5,872 | 620 | 6,196 | 154 | ||||||||||||||
| Commercial and industrial | 35,306 | 32,162 | 12,736 | 42,874 | 1,220 | ||||||||||||||
| Residential mortgage | 5,179 | 4,748 | 172 | 4,861 | 180 | ||||||||||||||
| Consumer - home equity | 27,189 | 26,575 | 2,358 | 23,546 | 1,007 | ||||||||||||||
| Consumer - other | 5,354 | 4,893 | 498 | 4,455 | 269 | ||||||||||||||
| Total | $ | 283,629 | $ | 238,127 | $ | 17,352 | $ | 273,254 | $ | 8,368 | |||||||||
| Total commercial loans and leases | $ | 237,922 | $ | 194,201 | $ | 14,324 | $ | 232,590 | $ | 6,595 | |||||||||
| Total residential mortgage loans | 7,183 | 6,749 | 172 | 6,905 | 265 | ||||||||||||||
| Total consumer and other loans | 38,524 | 37,177 | 2,856 | 33,759 | 1,508 | ||||||||||||||
NOTE 6 –TRANSFERS AND SERVICING OF FINANCIAL ASSETS (INCLUDING MORTGAGE BANKING ACTIVITY)
Commercial Banking Activity
The unpaid principal balances of loans serviced for others were $2.4 billion and $1.6 billion at December 31, 2019 and 2018, respectively. Custodial escrow balances maintained in connection with the foregoing portfolio of loans serviced for others, which are included in demand deposits, were not significant at December 31, 2019 and 2018.
Mortgage Banking Activity
IBERIABANK through one of its reportable segments, Mortgage, originates mortgage loans for sale into the secondary market. The loans originated for sale primarily consist of residential first mortgages that conform to standards established by the GSEs, but can also consist of junior lien loans secured by residential property. These loans are primarily sold to private companies that are unaffiliated with the GSEs on a servicing-released basis. Changes to the carrying amount of mortgage loans held for sale at December 31 are presented in the following table.
| (in thousands) | 2019 | 2018 | 2017 | ||||||||
| Balance at beginning of period | $ | 107,734 | $ | 134,916 | $ | 157,041 | |||||
| Originations and purchases | 1,967,532 | 1,469,847 | 1,844,358 | ||||||||
| Sales, net of gains | (1,869,148 | ) | (1,498,386 | ) | (1,859,565 | ) | |||||
| Mortgage loans transferred from (transferred to) held for investment | 7,239 | 1,058 | (6,918 | ) | |||||||
| Other | — | 299 | — | ||||||||
| Balance at end of period | $ | 213,357 | $ | 107,734 | $ | 134,916 | |||||
The following table details the components of mortgage income for the years ended December 31:
| (in thousands) | 2019 | 2018 | 2017 | ||||||||
| Mortgage loans held for sale and derivatives | $ | 2,752 | $ | 6,490 | $ | (7,047 | ) | ||||
| Derivative settlements, net | (8,481 | ) | (4,039 | ) | 1,229 | ||||||
| Gains on sales | 68,110 | 42,887 | 68,255 | ||||||||
| Servicing and other income, net | 1,392 | 1,339 | 1,133 | ||||||||
| Other losses | (743 | ) | (253 | ) | — | ||||||
| $ | 63,030 | $ | 46,424 | $ | 63,570 | ||||||
Mortgage Servicing Rights
Mortgage servicing rights are recorded at the lower of cost or market value in other intangible assets on the Company's consolidated balance sheets and amortized over the remaining servicing life of the loans, with consideration given to prepayment assumptions. Mortgage servicing rights had the following carrying values as of the periods indicated:
| December 31, 2019 | December 31, 2018 | ||||||||||||||||||||||||||||||
Gross Carrying Amount | Valuation Allowance | Accumulated Amortization | Net Carrying Amount | Gross Carrying Amount | Valuation Allowance | Accumulated Amortization | Net Carrying Amount | ||||||||||||||||||||||||
| (in thousands) | |||||||||||||||||||||||||||||||
| Mortgage servicing rights | $ | 22,476 | $ | (250 | ) | $ | (6,621 | ) | $ | 15,605 | $ | 13,612 | $ | — | $ | (4,806 | ) | $ | 8,806 | ||||||||||||
In addition, there was an insignificant amount of non-mortgage servicing rights related to SBA loans as of December 31, 2019 and 2018.
NOTE 7 – PREMISES AND EQUIPMENT
Premises and equipment consisted of the following at December 31:
| (in thousands) | 2019 | 2018 | |||||
| Land | $ | 80,475 | $ | 81,194 | |||
| Buildings | 255,375 | 241,284 | |||||
| Furniture, fixtures and equipment | 138,353 | 137,469 | |||||
| Total premises and equipment | 474,203 | 459,947 | |||||
| Accumulated depreciation | (177,515 | ) | (159,440 | ) | |||
| Total premises and equipment, net | $ | 296,688 | $ | 300,507 | |||
Depreciation expense was $25.7 million, $22.4 million, and $21.0 million, for the years ended December 31, 2019, 2018, and 2017, respectively.
NOTE 8 – GOODWILL AND OTHER ACQUIRED INTANGIBLE ASSETS
Goodwill
Changes to the carrying amount of goodwill by reporting unit for the years ended December 31, 2019 and 2018 are provided in the following table:
| (in thousands) | IBERIABANK | Mortgage | LTC | Total | |||||||||||
| Balance, December 31, 2017 | $ | 1,160,559 | $ | 23,178 | $ | 5,165 | $ | 1,188,902 | |||||||
| Goodwill acquired and adjustments during the year | 43,251 | — | 3,380 | 46,631 | |||||||||||
| Balance, December 31, 2018 | $ | 1,203,810 | $ | 23,178 | $ | 8,545 | $ | 1,235,533 | |||||||
| Goodwill acquired and adjustments during the year | — | — | — | — | |||||||||||
| Balance, December 31, 2019 | $ | 1,203,810 | $ | 23,178 | $ | 8,545 | $ | 1,235,533 | |||||||
The goodwill acquired and adjustments made during 2018 were the result of the Sabadell United, Gibraltar, and SolomonParks acquisitions. There were no changes to goodwill during 2019.
The Company performed the required annual goodwill impairment test as of October 1, 2019. The Company’s annual impairment test did not indicate impairment in any of the Company’s reporting units as of the testing date. Following the testing date, management evaluated the events and changes in certain circumstances that could indicate that goodwill might be impaired and concluded that a subsequent test was not necessary.
Intangible assets subject to amortization
Definite-lived intangible assets included in other intangible assets on the Company’s consolidated balance sheets had the following carrying values as of December 31:
| 2019 | 2018 | ||||||||||||||||||||||
| (in thousands) | Gross Carrying Amount | Accumulated Amortization | Net Carrying Amount | Gross Carrying Amount | Accumulated Amortization | Net Carrying Amount | |||||||||||||||||
| Core deposit intangible assets | $ | 136,183 | $ | (81,493 | ) | $ | 54,690 | $ | 136,183 | $ | (63,213 | ) | $ | 72,970 | |||||||||
| Customer relationship intangible asset | 1,385 | (1,371 | ) | 14 | 1,385 | (1,323 | ) | 62 | |||||||||||||||
| Non-compete agreement | 206 | (110 | ) | 96 | 206 | (72 | ) | 134 | |||||||||||||||
| Total | $ | 137,774 | $ | (82,974 | ) | $ | 54,800 | $ | 137,774 | $ | (64,608 | ) | $ | 73,166 | |||||||||
The related amortization expense of intangible assets was as follows:
| (in thousands) | Amount | ||
| Aggregate amortization expense for the years ended December 31: | |||
| 2017 | $ | 12,590 | |
| 2018 | 21,678 | ||
| 2019 | 18,464 | ||
| (in thousands) | |||
| Estimated amortization expense for the years ended December 31: | |||
| 2020 | $ | 14,504 | |
| 2021 | 10,211 | ||
| 2022 | 7,715 | ||
| 2023 | 6,396 | ||
| 2024 | 5,333 | ||
| 2025 and thereafter | 10,641 | ||
NOTE 9 –DERIVATIVE INSTRUMENTS AND OTHER HEDGING ACTIVITIES
The Company enters into derivative financial instruments to manage interest rate risk, exposures related to liquidity and credit risk, and to facilitate customer transactions. The primary types of derivatives utilized by the Company for its risk management strategies include interest rate swap agreements, interest rate collars, interest rate floors, foreign exchange contracts, interest rate lock commitments, forward sales commitments, written and purchased options, and credit derivatives. All derivative instruments are recognized on the consolidated balance sheets as other assets or other liabilities at fair value, regardless of whether a right of offset exists.
Cash flow hedge relationships mitigate exposure to the variability of future cash flows or other forecasted transactions. The Company enters into interest rate swap agreements in a cash flow hedge to convert forecasted variable interest payments to a fixed rate on its junior subordinated debt. In addition, the Company has entered into interest rate collars and interest rate floors and designated the instruments as cash flow hedges of the risk of fluctuations in interest rates, thereby reducing the Company's exposure to variability in cash flows from variable-rate loans.
For cash flow hedges, the effective and ineffective portions of the gain or loss related to the derivative instrument is initially reported as a component of other comprehensive income and subsequently reclassified into earnings when the forecasted transaction affects earnings or when the hedge is terminated. In applying hedge accounting for derivatives, the Company establishes and documents a method for assessing the effectiveness of the hedging derivative and a measurement approach for determining the ineffective aspect of the hedge upon the inception of the hedge.
For derivative instruments that are not designated as hedging instruments, changes in the fair value of the derivatives are recognized in earnings immediately.
Information pertaining to outstanding derivative instruments was as follows:
| Derivative Assets - Fair Value | Derivative Liabilities - Fair Value | |||||||||||||||
| (in thousands) | December 31, 2019 | December 31, 2018 | December 31, 2019 | December 31, 2018 | ||||||||||||
| Derivatives designated as hedging instruments: | ||||||||||||||||
| Interest rate contracts | $ | 18,967 | $ | 3,469 | $ | — | $ | — | ||||||||
| Total derivatives designated as hedging instruments | $ | 18,967 | $ | 3,469 | $ | — | $ | — | ||||||||
| Derivatives not designated as hedging instruments: | ||||||||||||||||
| Interest rate contracts: | ||||||||||||||||
| Customer swaps - upstream | $ | 9 | $ | 474 | $ | 5,055 | $ | 191 | ||||||||
| Customer swaps - downstream | 77,934 | 16,946 | 1,680 | 17,812 | ||||||||||||
| Foreign exchange contracts | — | 18 | — | 18 | ||||||||||||
| Forward sales contracts | 420 | 630 | 986 | 750 | ||||||||||||
| Written and purchased options | 6,755 | 5,490 | 3,899 | 3,310 | ||||||||||||
| Other contracts | 66 | 21 | 179 | 43 | ||||||||||||
| Total derivatives not designated as hedging instruments | $ | 85,184 | $ | 23,579 | $ | 11,799 | $ | 22,124 | ||||||||
| Total | $ | 104,151 | $ | 27,048 | $ | 11,799 | $ | 22,124 | ||||||||
| Derivative Assets - Notional Amount | Derivative Liabilities - Notional Amount | ||||||||||||||||||
| (in thousands) | December 31, 2019 | December 31, 2018 | December 31, 2019 | December 31, 2018 | |||||||||||||||
| Derivatives designated as hedging instruments: | |||||||||||||||||||
| Interest rate contracts | $ | 800,000 | $ | 408,500 | $ | 108,500 | $ | — | |||||||||||
| Total derivatives designated as hedging instruments | $ | 800,000 | $ | 408,500 | $ | 108,500 | $ | — | |||||||||||
| Derivatives not designated as hedging instruments: | |||||||||||||||||||
| Interest rate contracts: | |||||||||||||||||||
| Customer swaps - upstream | $ | 430,808 | $ | 919,653 | $ | 2,237,542 | $ | 701,257 | |||||||||||
| Customer swaps - downstream | 2,237,542 | 701,257 | 430,808 | 919,653 | |||||||||||||||
| Foreign exchange contracts | — | 1,202 | — | 1,202 | |||||||||||||||
| Forward sales contracts | 44,011 | 1,140 | 230,998 | 143,179 | |||||||||||||||
| Written and purchased options | 268,590 | 229,333 | 121,981 | 140,645 | |||||||||||||||
| Other contracts | 108,008 | 50,527 | 183,243 | 85,623 | |||||||||||||||
| Total derivatives not designated as hedging instruments | $ | 3,088,959 | $ | 1,903,112 | $ | 3,204,572 | $ | 1,991,559 | |||||||||||
| Total | $ | 3,888,959 | $ | 2,311,612 | $ | 3,313,072 | $ | 1,991,559 | |||||||||||
The Company has entered into risk participation agreements with counterparties to transfer or assume credit exposures related to interest rate derivatives. The notional amounts of risk participation agreements sold were $183.2 million and $85.6 million at December 31, 2019 and 2018, respectively. Assuming all underlying third party customers referenced in the swap contracts defaulted at December 31, 2019 and December 31, 2018, the exposure from these agreements would not be material based on the fair value of the underlying swaps.
The Company is party to collateral agreements with certain derivative counterparties. Such agreements require that the Company maintain collateral based on the fair values of individual derivative transactions. In the event of default by the Company, the counterparty would be entitled to the collateral.
At December 31, 2019 and 2018, the Company was required to post $79.6 million and $35.8 million, respectively, in variation margin payments for its derivative transactions, which is required to be netted against the fair value of the derivatives in other assets or other liabilities on the consolidated balance sheets. The Company does not anticipate additional assets will be required to be posted as collateral, nor does it believe additional assets would be required to settle its derivative instruments immediately if contingent features were triggered at December 31, 2019. The Company’s master netting agreements represent written, legally enforceable bilateral agreements that (1) create a single legal obligation for all individual transactions covered by the master agreement and (2) in the event of default, provide the non-defaulting counterparty the right to accelerate, terminate, and close-out on a net basis all transactions under the agreement and to promptly liquidate or set-off collateral posted by the defaulting counterparty. The Company does not offset fair value amounts recognized for the right to reclaim cash collateral or the obligation to return cash collateral against recognized fair value amounts of derivatives executed with the same counterparty under a master netting agreement.
The following table reconciles the gross amounts presented in the consolidated balance sheets to the net amounts that would result in the event of offset.
| December 31, 2019 | |||||||||||||||
| Gross Amounts Presented in the Balance Sheet | Gross Amounts Not Offset in the Balance Sheet | Net | |||||||||||||
| (in thousands) | Derivatives | Collateral | |||||||||||||
| Derivatives subject to master netting arrangements | |||||||||||||||
| Derivative assets | |||||||||||||||
| Interest rate contracts designated as hedging instruments | $ | 18,967 | $ | — | $ | — | $ | 18,967 | |||||||
| Interest rate contracts not designated as hedging instruments | 77,943 | (5,111 | ) | — | 72,832 | ||||||||||
| Written and purchased options | 3,871 | — | — | 3,871 | |||||||||||
| Total derivative assets subject to master netting arrangements | $ | 100,781 | $ | (5,111 | ) | $ | — | $ | 95,670 | ||||||
| Derivative liabilities | |||||||||||||||
| Interest rate contracts not designated as hedging instruments | $ | 6,735 | $ | (5,111 | ) | $ | — | $ | 1,624 | ||||||
| Written and purchased options | 3,871 | — | — | 3,871 | |||||||||||
| Total derivative liabilities subject to master netting arrangements | $ | 10,606 | $ | (5,111 | ) | $ | — | $ | 5,495 | ||||||
| December 31, 2018 | |||||||||||||||
| Gross Amounts Presented in the Balance Sheet | Gross Amounts Not Offset in the Balance Sheet | Net | |||||||||||||
| (in thousands) | Derivatives | Collateral | |||||||||||||
| Derivatives subject to master netting arrangements | |||||||||||||||
| Derivative assets | |||||||||||||||
| Interest rate contracts designated as hedging instruments | $ | 3,469 | $ | — | $ | — | $ | 3,469 | |||||||
| Interest rate contracts not designated as hedging instruments | 17,420 | (619 | ) | — | 16,801 | ||||||||||
| Written and purchased options | 3,285 | — | — | 3,285 | |||||||||||
| Total derivative assets subject to master netting arrangements | $ | 24,174 | $ | (619 | ) | $ | — | $ | 23,555 | ||||||
| Derivative liabilities | |||||||||||||||
| Interest rate contracts not designated as hedging instruments | $ | 18,003 | $ | (619 | ) | $ | — | $ | 17,384 | ||||||
| Written and purchased options | 3,285 | — | — | 3,285 | |||||||||||
| Total derivative liabilities subject to master netting arrangements | $ | 21,288 | $ | (619 | ) | $ | — | $ | 20,669 | ||||||
During the years ended December 31, 2019 and 2018, the Company did not reclassify into earnings any gain or loss as a result of the discontinuance of cash flow hedges because it was probable the original forecasted transaction would not occur by the end of the originally specified term.
At December 31, 2019, the Company did not expect to reclassify a material amount from accumulated other comprehensive income into interest income over the next twelve months for derivatives that will be settled.
At December 31, 2019, 2018, and 2017, and for the years then ended, information pertaining to the effect of the hedging instruments on the consolidated financial statements was as follows:
| Amount of Gain (Loss) Recognized in OCI, net of taxes | Location of Gain (Loss) Reclassified from AOCI into Income | Amount of Gain (Loss) Reclassified from AOCI into Income, net of taxes | Location of Gain (Loss) Recognized in Income on Derivatives (Amount Excluded from Effectiveness Testing) | Amount of Gain (Loss) Recognized in Income on Derivatives (Amount Excluded from Effectiveness Testing) | ||||||||||||||||||||||||||||||||||||
| Total | Including Component | Excluding Component | Total | Including Component | Excluding Component | Total | Including Component | Excluding Component | ||||||||||||||||||||||||||||||||
| (in thousands) | For the Year Ended December 31, | |||||||||||||||||||||||||||||||||||||||
| Derivatives in Cash Flow Hedging Relationships | 2019 | 2019 | 2019 | |||||||||||||||||||||||||||||||||||||
| Interest rate contracts | $ | 1,078 | $ | 2,340 | $ | (1,262 | ) | Interest expense | $ | (388 | ) | $ | 559 | $ | (947 | ) | Interest expense | $ | — | $ | — | $ | — | |||||||||||||||||
| 2018 | 2018 | 2018 | ||||||||||||||||||||||||||||||||||||||
| Interest rate contracts | $ | 4,416 | $ | 4,835 | $ | (419 | ) | Interest expense | $ | (196 | ) | $ | (150 | ) | $ | (46 | ) | Interest expense | $ | — | $ | — | $ | — | ||||||||||||||||
| Amount of Gain (Loss) Recognized in OCI, net of taxes | Location of Gain (Loss) Reclassified from AOCI into Income | Amount of Gain (Loss) Reclassified from AOCI into Income, net of taxes | Location of Gain (Loss) Recognized in Income on Derivatives (Amount Excluded from Effectiveness Testing) | Amount of Gain (Loss) Recognized in Income on Derivatives (Amount Excluded from Effectiveness Testing) | ||||||||||||
| (in thousands) | For the Year Ended December 31, | |||||||||||||||
| Derivatives in Cash Flow Hedging Relationships | 2017 | 2017 | 2017 | |||||||||||||
| Interest rate contracts | $ | (611 | ) | Interest expense | $ | (390 | ) | Interest expense | $ | — | ||||||
Information pertaining to the effect of derivatives not designated as hedging instruments on the consolidated financial statements as of December 31, was as follows:
| Location of Gain (Loss) Recognized in Income on Derivatives | Amount of Gain (Loss) Recognized in Income on Derivatives | ||||||||||||
| (in thousands) | 2019 | 2018 | 2017 | ||||||||||
Interest rate contracts (1) | Commission income | $ | 15,071 | $ | 6,962 | $ | 4,750 | ||||||
| Foreign exchange contracts | Other income | 15 | 29 | 43 | |||||||||
| Forward sales contracts | Mortgage income | (8,909 | ) | 4,064 | (4,115 | ) | |||||||
| Written and purchased options | Mortgage income | 677 | 180 | (2,028 | ) | ||||||||
| Other contracts | Other income | (91 | ) | (24 | ) | 51 | |||||||
| Total | $ | 6,763 | $ | 11,211 | $ | (1,299 | ) | ||||||
(1) Includes fees associated with customer interest rate contracts
NOTE 10 – LEASES
IBERIABANK as Lessee
The Company leases certain branch and corporate offices, land and ATM facilities through operating leases with terms ranging from less than one year to 44 years. The Company has no financing leases (formerly capital leases). As discussed in Note 2, Recent Accounting Pronouncements, the Company adopted new guidance for leases on January 1, 2019 which requires that leases, whether classified as operating leases or financing leases, to be accounted for as the acquisition of a right-of-use asset (ROU asset) and a related lease liability recorded at the present value of the lease payments less any lease incentives. The ROU asset represents the Company’s right to use an underlying asset for the lease term and is included in other assets on the Company’s consolidated balance sheets. The lease liability represents the Company’s obligation to make lease payments and is included in other liabilities in the Company’s consolidated balance sheets. The cost of the lease is recognized on a straight-line basis over the lease term as lease expense. Prior to January 1, 2019, operating leases were not recorded on the balance sheet. See Note 2, Recent Accounting Pronouncements, for further discussion of the adoption of this new guidance.
Subsequent to the adoption of ASC 842 on January 1, 2019, the Company reviews new lease and service contracts to determine if the contracts contain an embedded lease. Since the Company’s lease agreements do not provide an implicit rate, the Company uses the corresponding FHLB Advance rate based on the lease term at commencement in determining the present value of lease payments. For leases with variable lease payments based on an index or rate, the present value will be determined using the index or rate at the lease commencement date. Changes in variable rent payments due to subsequent changes in the index or rate do not result in a re-measurement of the ROU asset or lease liability, but are recognized as expense in the period in which they occur. Certain of the Company’s leases contain options to either renew, extend or terminate the lease. During 2019, the exercise of existing renewal options became reasonably certain for several of the Company’s leases with current noncancelable terms ending in 2020. These renewal options had varying term lengths ranging from 1 to 5 years, and the payments associated with the renewal options were included in the measurement of the lease liability and ROU asset as of December 31, 2019. The Company also has lease agreements with lease and non-lease components, which are generally accounted for separately. Non-lease components, which primarily consist of common area maintenance, utilities, and janitorial services, are based on the stand-alone price of the services and expensed as incurred.
Operating lease expense for the years ended December 31, 2019, 2018, and 2017 totaled $27.3 million, $22.5 million, and $19.1 million, respectively. During the year ended December 31, 2019, the Company paid $27.7 million for amounts included in the measurement of lease liabilities and $44.2 million to obtain ROU assets.
The following summarizes the ROU asset and lease liabilities as of December 31, 2019:
| (in thousands) | |||
| Right-of-use assets | $ | 119,774 | |
| Lease liabilities | 138,766 | ||
| Weighted average remaining lease term | 10.78 years | ||
| Weighted average discount rate | 3.07 | % | |
Maturities of operating lease liabilities as of December 31, 2019 were as follows:
| (in thousands) | |||
| 2020 | $ | 25,928 | |
| 2021 | 24,083 | ||
| 2022 | 21,663 | ||
| 2023 | 16,916 | ||
| 2024 | 12,598 | ||
| 2025 and thereafter | 63,912 | ||
| Total operating lease payments | $ | 165,100 | |
| Less: Imputed interest | 26,334 | ||
| Total lease liabilities | $ | 138,766 | |
As of December 31, 2019, the Company had not entered into any material leases that had not yet commenced.
Minimum future annual rent commitments under lease agreements as of December 31, 2018 were as follows:
| (in thousands) | |||
| 2019 | $ | 21,750 | |
| 2020 | 19,991 | ||
| 2021 | 16,921 | ||
| 2022 | 14,195 | ||
| 2023 | 9,182 | ||
| 2024 and thereafter | 34,652 | ||
| $ | 116,691 | ||
IBERIABANK as Lessor
As a lessor, the Company engages in the leasing of equipment to commercial customers primarily through direct financing and sales-type leases. Direct financing and sales-type leases are similar to other forms of installment lending in that lessors generally do not retain benefits and risks incidental to ownership of the property subject to leases. Such arrangements are essentially financing transactions that permit lessees to acquire and use property. The new guidance on leases discussed above did not have a significant impact on the lessor model of accounting. As lessor, the sum of all minimum lease payments over the lease term and the estimated residual value, less unearned interest income, is recorded as the net investment in the lease on the commencement date and is included in loans and leases, net of unearned income in the consolidated balance sheet. Interest income is accrued as earned over the term of the lease based on the net investment in leases. Fees incurred to originate the lease are deferred on the commencement date and recognized as an adjustment of the yield on the lease.
The Company’s portfolio of direct financing and sales-type leases contains terms of 2 to 20 years. Some of these leases contain options to extend the leases for up to 12 months and/or to terminate the lease within one year. These direct financing and sales-type leases typically include a payment structure set at lease inception and do not provide any additional services. Expenses associated with the leased equipment, such as maintenance and insurance, are paid by the lessee directly to third parties. The lease agreement typically contains an option for the purchase of the leased property by the lessee at the end of the lease term at either the property’s residual value or a specified price. In all cases, the Company expects to sell or re-lease the equipment at the end of the lease term. Due to the nature and structure of the Company’s direct financing and sales-type leases, there is no selling profit or loss on these transactions.
At a lease’s inception, the Company determines the expected residual value of the leased property at the end of the lease term based on the type of equipment leased, location and usage, as well as the contractual return provisions in the lease agreement. Additionally, the Company utilizes multiple market sources of data to establish equipment values and in many cases engages certified appraisers to provide valuation analyses. In order to manage the risk associated with the residual value of its leased assets, lease agreements typically include various provisions designed to protect the value of the leased property, such as contractual equipment maintenance, use and return provisions, remarketing agreements, and lessee guarantees. In a few cases, the Company also obtains third-party guarantees to further manage residual risk in the portfolio. On an annual basis, leased properties with material residual values are reviewed for impairment.
The components of the Company’s net investment in leases as of December 31, 2019 were as follows:
| (in thousands) | |||
| Lease payment receivable | $ | 388,514 | |
| Unguaranteed residual assets | 39,289 | ||
| Total net investment in leases | $ | 427,803 | |
For the year ended December 31, 2019, interest income for direct financing or sales-type leases totaled $11.8 million. During the year ended December 31, 2019, there was no profit or loss recognized at the commencement date for direct financing or sales-type leases.
Maturities of the Company's lease receivables as of December 31, 2019 were as follows:
| (in thousands) | |||
| 2020 | $ | 87,184 | |
| 2021 | 71,601 | ||
| 2022 | 65,336 | ||
| 2023 | 51,356 | ||
| 2024 | 35,746 | ||
| 2025 and thereafter | 81,581 | ||
| Total future minimum lease payments | $ | 392,804 | |
| Less: Imputed interest | 4,290 | ||
| Lease receivables | $ | 388,514 | |
NOTE 11 – DEPOSITS
Interest-bearing deposits at December 31 are summarized as follows:
| (in thousands) | 2019 | 2018 | |||||
| Interest-bearing demand deposits | $ | 4,821,252 | $ | 4,514,113 | |||
| Money market accounts | 9,121,283 | 8,237,291 | |||||
| Savings accounts | 683,366 | 828,914 | |||||
| Time deposits | 4,273,642 | 3,640,623 | |||||
| Total interest-bearing deposits | $ | 18,899,543 | $ | 17,220,941 | |||
Time deposits that exceed the FDIC insurance limit of $250,000 at December 31, 2019 and 2018 were $1.5 billion and $1.1 billion, respectively.
Scheduled maturities of time deposits as of December 31, 2019 were as follows:
| (in thousands) | |||
| Years ending December 31, | |||
| 2020 | $ | 3,844,086 | |
| 2021 | 308,955 | ||
| 2022 | 86,967 | ||
| 2023 | 17,440 | ||
| 2024 | 15,519 | ||
| 2025 and thereafter | 675 | ||
| $ | 4,273,642 | ||
NOTE 12 – SHORT-TERM BORROWINGS
Short-term borrowings at December 31 are summarized as follows:
| (in thousands) | 2019 | 2018 | 2017 | ||||||||
| Federal Home Loan Bank advances | $ | — | $ | 1,167,000 | $ | 475,000 | |||||
| Securities sold under agreements to repurchase | 204,208 | 315,882 | 516,297 | ||||||||
| $ | 204,208 | $ | 1,482,882 | $ | 991,297 | ||||||
Balances of FHLB advances and securities sold under agreements to repurchase can fluctuate significantly on a day-to-day basis, depending on funding needs and which sources are used to satisfy those needs. All such arrangements are considered typical of the banking and brokerage industries and are accounted for as borrowings.
Securities sold under agreements to repurchase, which are classified as secured borrowings, generally mature daily and are reflected at the amount of cash received in connection with the transaction. The Company may be required to provide additional collateral based on the fair value of the underlying securities.
Additional information on the Company’s short-term borrowings for the years indicated was as follows:
| (in thousands) | 2019 | 2018 | 2017 | ||||||||
| Outstanding at December 31 | $ | 204,208 | $ | 1,482,882 | $ | 991,297 | |||||
| Maximum month-end outstanding balance | 1,354,567 | 1,482,882 | 2,197,105 | ||||||||
| Average daily outstanding balance | 814,653 | 1,052,088 | 905,755 | ||||||||
| Average rate during the year | 1.93 | % | 1.40 | % | 0.83 | % | |||||
| Average rate at year end | 0.47 | % | 2.12 | % | 0.82 | % | |||||
NOTE 13 – LONG-TERM DEBT
Long-term debt at December 31 is summarized as follows:
| (in thousands) | 2019 | 2018 | |||||
| IBERIABANK: | |||||||
| Federal Home Loan Bank advances, 0.98% to 7.04% | $ | 1,188,584 | $ | 986,027 | |||
| Notes payable - Investment fund contribution, 7 to 35 year term, 1.28% to 4.95% fixed, 7 to 35 year term, 1.28% to 6.82% fixed, respectively | 34,993 | 60,014 | |||||
| 1,223,577 | 1,046,041 | ||||||
| IBERIABANK Corporation (junior subordinated debt): | |||||||
Statutory Trust I, 3 month LIBOR (1), plus 3.25%, issued November 2002 | 10,310 | 10,310 | |||||
Statutory Trust II, 3 month LIBOR (1), plus 3.15%, issued June 2003 | 10,310 | 10,310 | |||||
Statutory Trust III, 3 month LIBOR (1), plus 2.00%, issued September 2004 | 10,310 | 10,310 | |||||
Statutory Trust IV, 3 month LIBOR (1), plus 1.60%, issued October 2006 | 15,464 | 15,464 | |||||
American Horizons Statutory Trust I, 3 month LIBOR (1), plus 3.15%, assumed January 2005 | 6,186 | 6,186 | |||||
Statutory Trust V, 3 month LIBOR (1), plus 1.435%, issued June 2007 | 10,310 | 10,310 | |||||
Statutory Trust VI, 3 month LIBOR (1), plus 2.75%, issued November 2007 | 12,372 | 12,372 | |||||
Statutory Trust VII, 3 month LIBOR (1), plus 2.54%, issued November 2007 | 13,403 | 13,403 | |||||
Statutory Trust VIII, 3 month LIBOR (1), plus 3.50%, issued March 2008 | 7,217 | 7,217 | |||||
OMNI Trust I, 3 month LIBOR (1), plus 3.30%, assumed May 2011 | 8,248 | 8,248 | |||||
OMNI Trust II, 3 month LIBOR (1), plus 2.79%, assumed May 2011 | 7,732 | 7,732 | |||||
GA Commerce Trust II, 3 month LIBOR (1), plus 1.64%, assumed May 2015 | 8,248 | 8,248 | |||||
| 120,110 | 120,110 | ||||||
| $ | 1,343,687 | $ | 1,166,151 | ||||
(1) | The interest rate on the Company’s long-term debt indexed to LIBOR is based on the 3-month LIBOR rate. The 3-month LIBOR rate was 1.91% and 2.81% at December 31, 2019 and 2018, respectively. |
Outstanding FHLB advances are a mix of bullet and amortizing structures. Amortizing FHLB advances are amortized over periods ranging from 1.3 to 20.1 years, and have a balloon feature at maturity. Advances are collateralized by a blanket pledge of eligible loans, subject to contractual adjustments which reduce the borrowing base, as well as a secondary pledge of FHLB stock and FHLB demand deposits, the amount of which can exceed the amounts borrowed based on contractually required adjustments. Total additional FHLB advances available for both short-term borrowings and long-term debt at December 31, 2019 were $8.4 billion under the blanket floating lien including $1.3 billion from pledges of investment securities. The weighted average advance rate was 2.34% and 2.15% at December 31, 2019 and 2018, respectively.
Junior subordinated debt consists of a total of $120.1 million in junior subordinated deferrable interest debentures of the Company issued to statutory trusts that were funded by the issuance of floating rate capital securities of the trusts. The terms of the junior subordinated debt are 30 years, and they are callable at par by the Company any time after 5 years. Interest is payable quarterly and may be deferred at any time at the election of the Company for up to 20 consecutive quarterly periods. During a deferral period, the Company is subject to certain restrictions, including being prohibited from declaring and paying dividends to its common shareholders.
Advances and long-term debt at December 31, 2019 have maturities or call dates in future years as follows:
| (in thousands) | |||
| 2020 | $ | 582,371 | |
| 2021 | 175,255 | ||
| 2022 | 10,564 | ||
| 2023 | 58,597 | ||
| 2024 | 6,242 | ||
| 2025 and thereafter | 510,658 | ||
| $ | 1,343,687 | ||
NOTE 14 – INCOME TAXES
The provision for income tax expense consisted of the following for the years ended December 31:
| (in thousands) | 2019 | 2018 | 2017 | ||||||||
| Current expense (benefit) | $ | 114,221 | $ | (115,195 | ) | $ | 84,827 | ||||
| Deferred expense | 30,703 | 153,518 | 71,257 | ||||||||
| Tax credits | (4,363 | ) | (5,179 | ) | (5,618 | ) | |||||
| Items charged to shareholders' equity | (25,123 | ) | (866 | ) | — | ||||||
| $ | 115,438 | $ | 32,278 | $ | 150,466 | ||||||
There was a balance receivable of $4.3 million, $208.0 million, and $4.5 million for federal and state income taxes at December 31, 2019, 2018, and 2017, respectively. The provision for federal income taxes differs from the amount computed by applying the federal income tax statutory rate of 21 percent for the years ended December 31, 2019 and 2018 and 35 percent for the year ended December 31, 2017 on income before income tax expense as indicated in the following analysis for the years ended December 31:
| (in thousands) | 2019 | 2018 | 2017 | ||||||||
| Federal tax based on statutory rate | $ | 104,914 | $ | 84,531 | $ | 102,508 | |||||
| Increase (decrease) resulting from: | |||||||||||
| Effect of tax-exempt income | (6,314 | ) | (5,801 | ) | (9,435 | ) | |||||
| Interest and other nondeductible expenses | 10,429 | 6,464 | 9,605 | ||||||||
| State taxes, net of federal benefit | 18,073 | 12,459 | 6,970 | ||||||||
| Tax credits | (4,363 | ) | (5,179 | ) | (5,618 | ) | |||||
Other (1) | (7,301 | ) | (60,196 | ) | 46,436 | ||||||
| $ | 115,438 | $ | 32,278 | $ | 150,466 | ||||||
| Effective tax rate | 23.1 | % | 8.0 | % | 51.4 | % | |||||
(1) The composition of other items resulting in a net tax benefit of $7.3 million for the year ended December 31, 2019 included $3.5 million in an unrecognized state tax credit, $2.3 million related to the remeasurement of deferred tax assets as a result of state statutory rate changes and changes to the state nexus, and $0.9 million related to equity based compensation.
The composition of other items resulting in a net tax benefit of $60.2 million for the year ended December 31, 2018 included a $6.6 million expense related to the finalization of accounting for the Sabadell United acquisition and its net impact from the remeasurement of deferred tax assets as a result of the passage of the Tax Act. In connection with filing its 2017 income tax returns, the Company recorded a non-core, permanent net income tax benefit of $65.3 million as a result of deductions associated with unrealized losses on securities and loans and depreciation on real and personal property.
The composition of other items resulting in a net tax expense of $46.4 million for the year ended December 31, 2017 included $51.0 million related to the estimated net impact from the remeasurement of deferred tax assets and liabilities as a result of the passage of the Tax Act in December 2017. This was partially offset by $3.0 million related to equity based compensation, $1.0 million resulting from the reversal of a prior year deferred tax asset impairment, and a $600 thousand benefit due to a deferred REIT distribution.
Significant components of deferred tax assets and liabilities at December 31 were as follows:
| (in thousands) | 2019 | 2018 | |||||
| Deferred tax assets: | |||||||
| NOL and credit carryforward | $ | 18,061 | $ | 42,837 | |||
| Allowance for credit losses | 38,384 | 38,571 | |||||
| Deferred compensation | 6,807 | 5,482 | |||||
| Basis difference in acquired assets and liabilities | 8,967 | 9,228 | |||||
| OREO | 1,234 | 32 | |||||
| Other | 46,259 | 19,395 | |||||
| Gross deferred tax assets | 119,712 | 115,545 | |||||
| Deferred tax liabilities: | |||||||
| Unrealized gains on loans and securities | (64,535 | ) | (98,807 | ) | |||
| Premises and equipment | (7,941 | ) | (10,626 | ) | |||
| Acquisition intangibles | (11,789 | ) | (9,757 | ) | |||
| Deferred loan costs | (6,834 | ) | (5,814 | ) | |||
| Basis difference in acquired assets and liabilities | (12,488 | ) | (17,628 | ) | |||
| Lease receivable | (79,795 | ) | (37,844 | ) | |||
| Other | (38,449 | ) | (6,485 | ) | |||
| Gross deferred tax liabilities | (221,831 | ) | (186,961 | ) | |||
| Net deferred tax liabilities | $ | (102,119 | ) | $ | (71,416 | ) | |
At December 31, 2019, the Company had cumulative federal net operating loss carryforwards of $35.7 million. These net operating loss carryforwards arising from acquisitions during 2015 expire over a 20-year period and will be utilized subject to annual Internal Revenue Code Section 382 limitations. No benefit was recognized at acquisition for net operating losses that will expire unused due to the IRS limitations.
At December 31, 2019, the Company had state net operating loss carryforwards of $169.5 million, resulting in a net state deferred tax asset of $7.7 million. These state carryforwards, if not utilized, will gradually expire through 2039.
The Company does not believe it has any unrecognized tax benefits included in its consolidated financial statements. The Company has not had any settlements in the current period with taxing authorities, nor has it recognized tax benefits as a result of a lapse of the applicable statute of limitations.
During the years ended December 31, 2019, 2018 and 2017, an immaterial amount of interest and penalty expense associated with state filings was recorded.
The Company files federal income tax returns, as well as returns in various state jurisdictions. The Company is subject to income tax examination by the IRS for the tax years 2014 and forward and is currently under examination by the IRS for the years 2014 to 2017.
NOTE 15 – SHAREHOLDERS' EQUITY, CAPITAL RATIOS AND OTHER REGULATORY MATTERS
Preferred Stock
On April 4, 2019, the Company issued and sold an aggregate of 4,000,000 depositary shares, each representing a 1/400th ownership interest in a share of the Company’s 6.100% Fixed-to-Floating Non-Cumulative Perpetual Preferred Stock, Series D, par value $1.00 per share, (“Series D Preferred Stock”), with a liquidation preference of $10,000 per share of Series D Preferred Stock (equivalent to $25 per depositary share), which represents $100.0 million in aggregate liquidation preference.
The following table presents a summary of the Company's non-cumulative perpetual preferred stock at December 31:
| 2019 | 2018 | |||||||||||||||||
| Issuance Date | Earliest Redemption Date | Annual Dividend Rate | Liquidation Amount | Carrying Amount | Carrying Amount | |||||||||||||
| (in thousands) | ||||||||||||||||||
| Series B Preferred Stock | 8/5/2015 | 8/1/2025 | 6.625 | % | $ | 80,000 | $ | 76,812 | $ | 76,812 | ||||||||
| Series C Preferred Stock | 5/9/2016 | 5/1/2026 | 6.600 | % | 57,500 | 55,285 | 55,285 | |||||||||||
| Series D Preferred Stock | 4/4/2019 | 5/1/2024 | 6.100 | % | 100,000 | 96,388 | — | |||||||||||
| $ | 237,500 | $ | 228,485 | $ | 132,097 | |||||||||||||
Dividends will accrue and be payable on the Series B Preferred Stock, if declared by the Company's Board of Directors, and will be paid semi-annually, in arrears, at an annual rate equal to 6.625% for each period from the issuance date up to and including August 1, 2025 and will be paid quarterly, in arrears, at an annual rate equal to three-month LIBOR plus 4.262% for each period after August 1, 2025. The Company may redeem the Series B Preferred Stock at its option, subject to regulatory approval, as described in the Company’s Registration Statement on Form 8-A, filed with the Securities and Exchange Commission on August 5, 2015.
Dividends will accrue and be payable on the Series C Preferred Stock, if declared by the Company's Board of Directors, and will be paid quarterly, in arrears, at an annual rate equal to (i) 6.600% for each period from the issuance date to May 1, 2026 and (ii) three-month LIBOR plus 4.920% for each period on or after May 1, 2026. The Company may redeem the Series C Preferred Stock at its option, subject to regulatory approval, as described in the Company’s Registration Statement on Form 8-A, filed with the Securities and Exchange Commission on May 9, 2016.
Dividends will accrue and be payable on the Series D Preferred Stock, if declared by the Company's Board of Directors, and (i) will be paid semi-annually, in arrears, at an annual rate equal to 6.100% for each period from the issuance date to May 1, 2024 and (ii) will be paid quarterly at an annual rate equal to three-month LIBOR plus 3.859% for each period on or after August 1, 2024. The Company may redeem the Series D Preferred Stock at its option, subject to regulatory approval, as described in the Company’s Registration Statement on Form 8-A, filed with the Securities and Exchange Commission on April 4, 2019.
Common Stock
In 2018, the Company's Board of Directors authorized the repurchase of up to 2,765,000 shares of IBERIABANK Corporation's outstanding common stock. The remaining shares available under this plan were repurchased during 2019. During 2019, the Company announced a new Board-approved share repurchase program for up to 1,600,000 shares, or approximately 3% of total common shares outstanding at the time of the announcement.
During 2019, the Company repurchased 2,700,000 common shares for approximately $204.7 million at a weighted average price of $75.83 per common share. During 2018, the Company repurchased 1,972,500 common shares for approximately $148.9 million, at a weighted average price of $75.46 per common share. The Company did not repurchase any common shares during 2017.
At December 31, 2019, there were approximately 1,165,000 remaining shares that may be repurchased under the current Board-approved plan. No further common stock repurchases are expected due to the pending merger with First Horizon.
Regulatory Capital
The Company and its subsidiary bank, IBERIABANK, are subject to various regulatory capital requirements administered by federal and state banking agencies. Failure to meet minimum capital requirements can initiate certain mandatory and possibly additional discretionary actions by regulators that, if undertaken, could have a direct material effect on the Company’s consolidated financial statements. Under capital adequacy regulations and the regulatory framework for prompt corrective action, specific capital guidelines that involve quantitative measures of assets, liabilities and certain off-balance sheet items as calculated under regulatory accounting practices must be met. The capital amounts and classification are also subject to qualitative judgments by the regulators about capital components, asset risk weightings and other factors.
Management believes that, as of December 31, 2019, the Company and IBERIABANK met all capital adequacy requirements to which they were subject. As of December 31, 2019, the most recent notification from the FRB categorized IBERIABANK as well-capitalized under the regulatory framework for prompt corrective action (the prompt corrective action requirements are not applicable to the Company). To be categorized as well-capitalized, an institution must maintain minimum Total Risk-Based, Tier 1 Risk-Based, Common Equity Tier 1, and Tier 1 Leverage ratios as set forth in the following table. There are no conditions or events since the notification that management believes have changed that categorization.
The Company’s and IBERIABANK’s actual capital amounts and ratios as of December 31 are presented in the following table.
| (in thousands) | 2019 | ||||||||||||||||||
| Minimum | Well-Capitalized | Actual | |||||||||||||||||
| Amount | Ratio | Amount | Ratio | Amount | Ratio | ||||||||||||||
| Tier 1 Leverage | |||||||||||||||||||
| Consolidated | $ | 1,220,289 | 4.00 | % | N/A | N/A | $ | 3,021,004 | 9.90 | % | |||||||||
| IBERIABANK | 1,217,638 | 4.00 | $ | 1,522,048 | 5.00 | 2,949,533 | 9.69 | ||||||||||||
| Common Equity Tier 1 (CET1) | |||||||||||||||||||
| Consolidated | $ | 1,194,765 | 4.50 | % | N/A | N/A | $ | 2,792,520 | 10.52 | % | |||||||||
| IBERIABANK | 1,191,062 | 4.50 | $ | 1,720,423 | 6.50 | 2,949,533 | 11.14 | ||||||||||||
| Tier 1 Risk-Based Capital | |||||||||||||||||||
| Consolidated | $ | 1,593,020 | 6.00 | % | N/A | N/A | $ | 3,021,004 | 11.38 | % | |||||||||
| IBERIABANK | 1,588,083 | 6.00 | $ | 2,117,444 | 8.00 | 2,949,533 | 11.14 | ||||||||||||
| Total Risk-Based Capital | |||||||||||||||||||
| Consolidated | $ | 2,124,026 | 8.00 | % | N/A | N/A | $ | 3,300,730 | 12.43 | % | |||||||||
| IBERIABANK | 2,117,444 | 8.00 | $ | 2,648,805 | 10.00 | 3,112,758 | 11.76 | ||||||||||||
| 2018 | |||||||||||||||||||
| Minimum | Well-Capitalized | Actual | |||||||||||||||||
| (in thousands) | Amount | Ratio | Amount | Ratio | Amount | Ratio | |||||||||||||
| Tier 1 Leverage | |||||||||||||||||||
| Consolidated | $ | 1,168,343 | 4.00 | % | N/A | N/A | $ | 2,812,863 | 9.63 | % | |||||||||
| IBERIABANK | 1,165,537 | 4.00 | $ | 1,456,921 | 5.00 | 2,733,099 | 9.38 | ||||||||||||
| Common Equity Tier 1 (CET1) | |||||||||||||||||||
| Consolidated | $ | 1,125,405 | 4.50 | % | N/A | N/A | $ | 2,680,766 | 10.72 | % | |||||||||
| IBERIABANK | 1,122,712 | 4.50 | $ | 1,621,695 | 6.50 | 2,733,099 | 10.95 | ||||||||||||
| Tier 1 Risk-Based Capital | |||||||||||||||||||
| Consolidated | $ | 1,500,540 | 6.00 | % | N/A | N/A | $ | 2,812,863 | 11.25 | % | |||||||||
| IBERIABANK | 1,496,949 | 6.00 | $ | 1,995,932 | 8.00 | 2,733,099 | 10.95 | ||||||||||||
| Total Risk-Based Capital | |||||||||||||||||||
| Consolidated | $ | 2,000,720 | 8.00 | % | N/A | N/A | $ | 3,084,764 | 12.33 | % | |||||||||
| IBERIABANK | 1,995,932 | 8.00 | $ | 2,494,915 | 10.00 | 2,888,500 | 11.58 | ||||||||||||
Minimum capital ratios are subject to a capital conservation buffer. In order to avoid limitations on distributions, including dividend payments, and certain discretionary bonus payments to executive officers, an institution must hold a capital conservation buffer above its minimum risk-based capital requirements. This capital conservation buffer is calculated as the lowest of the differences between the actual CET1 ratio, Tier 1 Risk-Based Capital ratio, and Total Risk-Based Capital ratio and the corresponding minimum ratios. At December 31, 2019, the required minimum capital conservation buffer was 2.50%, At December 31, 2019, the capital conservation buffers of the Company and IBERIABANK were 4.43% and 3.76%, respectively.
Restrictions on Dividends, Loans and Advances
IBERIABANK is restricted under applicable laws in the payment of dividends to an amount equal to current year earnings plus undistributed earnings for the immediately preceding year, unless prior permission is received from the Commissioner of Financial Institutions for the State of Louisiana. Dividends payable by IBERIABANK in 2020 without permission are limited to 2020 earnings plus an additional $199.6 million.
Funds available for loans or advances by IBERIABANK to the Parent amounted to $311.3 million. In addition, any dividends that may be paid by IBERIABANK to the Parent would be restricted if IBERIABANK did not comply with the above-described capital conservation buffer requirements and would be prohibited if the effect thereof would cause IBERIABANK’s capital to be reduced below applicable minimum capital requirements.
During any deferral period under the Company’s junior subordinated debt, the Company would be prohibited from declaring and paying dividends to preferred and common shareholders. See Note 13 to the Consolidated Financial Statements for additional information.
In addition, so long as any shares of Series B Preferred Stock, Series C Preferred Stock, or Series D Preferred Stock remain outstanding, the Company is prohibited from paying dividends on common stock if the required payments on the Preferred Stock have not been made.
NOTE 16 – EARNINGS PER SHARE
The computations of basic and diluted earnings per share were as follows:
| For the Years Ended December 31, | |||||||||||
| (in thousands, except per share data) | 2019 | 2018 | 2017 | ||||||||
| Earnings per common share - Basic | |||||||||||
| Net income | $ | 384,155 | $ | 370,249 | $ | 142,413 | |||||
| Preferred stock dividends | (12,602 | ) | (9,095 | ) | (9,095 | ) | |||||
| Dividends and undistributed earnings allocated to unvested restricted shares | (3,559 | ) | (3,583 | ) | (1,210 | ) | |||||
| Earnings allocated to common shareholders - basic | $ | 367,994 | $ | 357,571 | $ | 132,108 | |||||
| Weighted average common shares outstanding | 52,826 | 55,008 | 50,640 | ||||||||
| Earnings per common share - basic | 6.97 | 6.50 | 2.61 | ||||||||
| Earnings per common share - Diluted | |||||||||||
| Earnings allocated to common shareholders - basic | $ | 367,994 | $ | 357,571 | $ | 132,108 | |||||
| Dividends and undistributed earnings allocated to unvested restricted shares | 6 | (49 | ) | (1 | ) | ||||||
| Earnings allocated to common shareholders - diluted | $ | 368,000 | $ | 357,522 | $ | 132,107 | |||||
| Weighted average common shares outstanding | 52,826 | 55,008 | 50,640 | ||||||||
| Dilutive potential common shares | 327 | 352 | 352 | ||||||||
| Weighted average common shares outstanding - diluted | 53,153 | 55,360 | 50,992 | ||||||||
| Earnings per common share - diluted | $ | 6.92 | $ | 6.46 | $ | 2.59 | |||||
For the years ended December 31, 2019, 2018, and 2017, the calculations for basic shares outstanding exclude the weighted average shares owned by the RRP of 512,969, 564,973, and 467,601, respectively.
The effects from the assumed exercises of 152,416, 154,397, and 71,260 stock options were not included in the computation of diluted earnings per share for the years ended December 31, 2019, 2018, and 2017, respectively, because they were antidilutive.
NOTE 17 – SHARE-BASED COMPENSATION AND OTHER EMPLOYEE BENEFIT PLANS
The Company has various types of share-based compensation plans that permit the granting of awards in the form of stock options, restricted stock, restricted share units, and phantom stock. These plans are administered by the Compensation Committee of the Board of Directors, which selects persons eligible to receive awards and determines the terms, conditions and other provisions of the awards. At December 31, 2019, awards of 3,205,153 shares could be made under approved incentive compensation plans. The Company issues shares to fulfill stock option exercises and restricted share units and restricted stock awards vesting from available authorized common shares. At December 31, 2019, the Company believes there were adequate authorized shares to satisfy anticipated stock option exercises and restricted share unit and restricted stock award vesting.
Stock option awards
The Company issues stock options under various plans to directors, officers and other key employees. The option exercise price cannot be less than the fair value of the underlying common stock as of the date of the option grant and the maximum option term cannot exceed ten years.
The following table represents the activity related to stock options during the periods indicated:
| Number of Shares | Weighted Average Exercise Price | Aggregate Intrinsic Value (in thousands) | Weighted Average Remaining Contract Life (in years) | |||||||||
| Outstanding options, December 31, 2016 | 721,538 | $ | 55.38 | |||||||||
| Granted | 80,557 | 84.78 | ||||||||||
| Exercised | (85,221 | ) | 55.45 | $ | 2,098 | |||||||
| Forfeited or expired | (30,508 | ) | 68.46 | |||||||||
| Outstanding options, December 31, 2017 | 686,366 | $ | 58.24 | |||||||||
| Granted | 97,620 | 82.02 | ||||||||||
| Exercised | (42,047 | ) | 53.07 | 1,242 | ||||||||
| Forfeited or expired | (27,519 | ) | 68.30 | |||||||||
| Outstanding options, December 31, 2018 | 714,420 | $ | 61.41 | |||||||||
| Granted | 127,090 | 70.34 | ||||||||||
| Exercised | (122,143 | ) | 54.39 | 2,575 | ||||||||
| Forfeited or expired | (13,570 | ) | 72.52 | |||||||||
| Outstanding options, December 31, 2019 | 705,797 | $ | 64.02 | $ | 8,926 | 5.4 | ||||||
| Exercisable options, December 31, 2017 | 455,010 | $ | 55.77 | |||||||||
| Exercisable options, December 31, 2018 | 501,815 | 56.75 | ||||||||||
| Exercisable options, December 31, 2019 | 463,595 | 59.13 | $ | 7,796 | 3.9 | |||||||
The Company uses the Black-Scholes option pricing model to estimate the fair value of stock option awards. The following weighted-average assumptions were used for option awards issued during the years ended December 31:
| 2019 | 2018 | 2017 | |||||||||
| Expected dividends | 2.3 | % | 1.8 | % | 1.7 | % | |||||
| Expected volatility | 24.5 | % | 24.3 | % | 25.0 | % | |||||
| Risk-free interest rate | 2.5 | % | 2.7 | % | 2.1 | % | |||||
| Expected term (in years) | 5.7 | 5.8 | 5.8 | ||||||||
| Weighted-average grant-date fair value | $ | 14.44 | $ | 18.48 | $ | 18.86 | |||||
The assumptions above are based on multiple factors, including historical stock option exercise patterns and post-vesting employment termination behaviors, expected future exercise patterns and the expected volatility of the Company’s stock price.
The following table represents the compensation expense that is included in non-interest expense and related income tax benefits in the accompanying consolidated statements of comprehensive income related to stock options for the years ended December 31:
| (in thousands) | 2019 | 2018 | 2017 | ||||||||
| Compensation expense related to stock options | $ | 1,408 | $ | 1,280 | $ | 1,470 | |||||
| Income tax benefit related to stock options | 103 | 93 | 124 | ||||||||
At December 31, 2019, there was $2.1 million of unrecognized compensation expense related to stock options that is expected to be recognized over a weighted-average period of 2.6 years.
Restricted stock awards
The Company issues restricted stock under various plans for certain officers and directors. The restricted stock awards may not be sold or otherwise transferred until certain restrictions have lapsed. The holders of the restricted stock receive dividends and have the right to vote the shares. The compensation expense for these awards is determined based on the market price of the Company's common stock at the date of grant applied to the total number of shares granted and is recognized over the vesting period (generally three to five years). As of December 31, 2019 and 2018, unrecognized share-based compensation expense associated with these awards totaled $27.5 million and $27.1 million, respectively. The unrecognized compensation expense related to restricted stock awards at December 31, 2019 is expected to be recognized over a weighted-average period of 1.1 years.
In connection with the merger agreement with First Horizon, the Compensation Committee of the Board of Directors accelerated the vesting of the performance-based restricted stock awards previously awarded as a special acquisition incentive, held by certain executive officers, such that the restricted stock awards became fully vested upon the execution of the merger agreement. The value of these shares at the merger execution date was $7.3 million. In addition, 123,274 restricted stock awards were granted to certain executive officers on November 18, 2019 in connection with the merger agreement. These awards do not have any performance criteria attached to them.
Restricted share units
The Company issues restricted share units to certain of its executive officers. Restricted share units vest after the end of a three year performance period, based on satisfaction of the market and performance conditions set forth in the restricted share unit agreements. Recipients do not possess voting or investment power over the common stock underlying such units until vesting. The grant date fair value of these restricted share units is the same as the value of the corresponding number of shares of common stock, adjusted for assumptions surrounding the market-based conditions contained in the respective agreements. See Note 1, Summary of Significant Accounting Policies, for further discussion of restricted share units with market or performance conditions.
The following table represents the compensation expense that was included in non-interest expense and related income tax benefits in the accompanying consolidated statements of comprehensive income related to restricted stock awards and restricted share units for the years ended December 31:
| (in thousands) | 2019 | 2018 | 2017 | ||||||||
| Compensation expense related to restricted stock awards and restricted share units | $ | 23,176 | $ | 18,998 | $ | 14,966 | |||||
| Income tax benefit related to restricted stock awards and restricted share units | 4,395 | 3,990 | 2,809 | ||||||||
The following table represents unvested restricted stock award and restricted share unit activity for the years ended December 31:
| 2019 | 2018 | 2017 | ||||||
| Number of shares at beginning of period | 700,628 | 738,187 | 543,261 | |||||
| Granted | 344,018 | 231,064 | 421,198 | |||||
| Forfeited | (21,656 | ) | (72,217 | ) | (31,699 | ) | ||
| Vested | (342,077 | ) | (196,406 | ) | (194,573 | ) | ||
| Number of shares at end of period | 680,913 | 700,628 | 738,187 | |||||
The weighted average grant date fair value of restricted stock awards and restricted share units granted was $71.81, $80.98, and $82.49 for the years ended December 31, 2019, 2018, and 2017, respectively. The total fair value of restricted stock awards and restricted share units vested during the years ended December 31, 2019, 2018, and 2017 was $28.5 million, $16.3 million, and $16.4 million, respectively.
Phantom stock awards
The Company issues phantom stock awards to certain key officers and employees. The awards are subject to a vesting period of five years and are paid out in cash upon vesting. The amount paid per vesting period is calculated as the number of vested “share equivalents” multiplied by the closing market price of a share of the Company’s common stock on the vesting date. Share equivalents are calculated on the date of grant as the total award’s dollar value divided by the closing market price of a share of the Company’s common stock on the grant date.
The following table represents compensation expense recorded for phantom stock based on the number of share equivalents vested at December 31 of the years indicated and the current market price of the Company’s stock at that time:
| (in thousands) | 2019 | 2018 | 2017 | ||||||||
| Compensation expense related to phantom stock | $ | 10,160 | $ | 8,141 | $ | 10,756 | |||||
The following table represents phantom stock award activity during the periods indicated:
| (in thousands) | Number of share equivalents (1) | Value of share equivalents (2) | ||||
| Balance, December 31, 2016 | 472,830 | $ | 39,600 | |||
| Granted | 118,408 | 9,177 | ||||
| Forfeited share equivalents | (34,968 | ) | 2,710 | |||
| Vested share equivalents | (162,426 | ) | 13,515 | |||
| Balance, December 31, 2017 | 393,844 | $ | 30,523 | |||
| Granted | 157,044 | 10,095 | ||||
| Forfeited share equivalents | (63,276 | ) | 4,067 | |||
| Vested share equivalents | (134,205 | ) | 11,156 | |||
| Balance, December 31, 2018 | 353,407 | $ | 22,717 | |||
| Granted | 192,524 | 14,407 | ||||
| Forfeited share equivalents | (34,362 | ) | 2,571 | |||
| Vested share equivalents | (112,052 | ) | 34,566 | |||
| Balance, December 31, 2019 | 399,517 | $ | 29,896 | |||
(1) | Number of share equivalents includes all reinvested dividend equivalents for the years indicated. |
(2) | Except for share equivalents at the beginning of each period, which are based on the value at that time, and vested share payments, which are based on the cash paid at the time of vesting, the value of share equivalents is calculated based on the market price of the Company’s stock at the end of the respective periods. The market price of the Company’s stock was $74.83, $64.28 and $77.50 on December 31, 2019, 2018, and 2017, respectively. |
401(k) defined contribution plan
The Company has a 401(k) Profit Sharing Plan covering substantially all of its employees. Annual employer contributions to the Plan are set by the Board of Directors. The Company made contributions of $4.0 million, $3.7 million, and $3.5 million for the years ended December 31, 2019, 2018, and 2017, respectively. The Plan provides, among other things, that participants in the Plan be able to direct the investment of their account balances within the Profit Sharing Plan into alternative investment funds. Participant deferrals under the salary reduction election may be matched by the employer based on a percentage to be determined annually by the employer.
NOTE 18 – COMMITMENTS AND CONTINGENCIES
Off-balance sheet commitments
In the normal course of business, to meet the financing needs of its customers, the Company is a party to credit-related financial instruments, with risk not reflected in the consolidated financial statements. These financial instruments include commitments to extend credit, standby letters of credit, and commercial letters of credit. Such commitments involve, to varying degrees, elements of credit and interest rate risk in excess of the amount recognized in the consolidated balance sheets. The credit policies used for these commitments are consistent with those used for on-balance sheet instruments. The Company’s exposure to credit loss in the event of non-performance by its customers under such commitments or letters of credit represents the contractual amount of the financial instruments as indicated in the table below. At December 31, 2019 and 2018, the fair value of guarantees under commercial and standby letters of credit was $3.3 million and $2.4 million, respectively. This fair value will decrease as the existing commercial and standby letters of credit approach their expiration dates.
At December 31, 2019 and 2018, respectively, the Company had the following financial instruments outstanding and related reserves, whose contract amounts represent credit risk:
| (in thousands) | December 31, 2019 | December 31, 2018 | |||||
| Commitments to extend credit | $ | 806,164 | $ | 642,162 | |||
| Unfunded commitments under lines of credit | 7,240,808 | 6,883,963 | |||||
| Commercial and standby letters of credit | 327,336 | 240,436 | |||||
| Reserve for unfunded lending commitments | 16,637 | 14,830 | |||||
Commitments to extend credit are agreements to lend to a customer as long as there is no violation of any condition established in the contract. Commitments generally have fixed expiration dates or other termination clauses and may require payment of a fee by the borrower. Since many of the commitments are expected to be drawn upon, the total commitment amount generally represents future cash requirements. The Company evaluates each customer’s creditworthiness on a case-by-case basis. The amount of collateral, if any, is based on management’s credit evaluation of the customer.
Unfunded commitments under commercial lines of credit, revolving credit lines, and overdraft protection agreements are commitments for possible future extensions of credit to existing customers. Many of these types of commitments do not contain a specified maturity date and may not be drawn upon to the total extent to which the Company is committed. See Note 5, Allowance for Credit Losses and Credit Quality, for additional information related to the Company’s reserve for unfunded lending commitments.
Commercial and standby letters of credit are conditional commitments issued by the Company to guarantee the performance of a customer to a third party. These guarantees are primarily issued to support public and private borrowing arrangements, including commercial paper issuance, bond financing, and similar transactions. The credit risk involved in issuing letters of credit is essentially the same as that involved in extending loan facilities to customers. When necessary, they are collateralized, generally in the form of marketable securities and cash equivalents.
Legal proceedings
The nature of the business of the Company’s banking and other subsidiaries ordinarily results in a certain amount of claims, litigation, investigations, and legal and administrative cases and proceedings, which are considered incidental to the normal conduct of business. Some of these claims are against entities or assets of which the Company is a successor or acquired in business acquisitions. The Company has asserted defenses to these claims and, with respect to such legal proceedings, intends to continue to defend itself vigorously, litigating or settling cases according to management’s judgment as to what is in the best interest of the Company and its shareholders.
In July of 2016, the Company received a subpoena from the Office of Inspector General of the U.S. Department of Housing and Urban Development (“HUD”) requesting information on certain previously originated loans insured by the Federal Housing Administration ("FHA") as well as other documents regarding the Company's FHA-related policies and practices. After the Company complied with the subpoena, attorneys from the Department of Justice (“DOJ”) informed the Company in late March of 2017 that a civil qui tam suit had been filed against the Company in federal court involving the subject matter of the HUD subpoena. The HUD lawsuit was settled on December 11, 2017 in the amount of $11.7 million. On February 2, 2018, IBERIABANK filed a lawsuit in the United States District Court for the Eastern District of Louisiana (New Orleans) against Illinois Union Insurance Company and Travelers Casualty and Surety Company of America in an effort to recover the $11.7 million it paid to settle the HUD matter. IBERIABANK filed that lawsuit to recover the insurance proceeds to which it claims to be entitled under certain Bankers’ Professional Liability insurance policies issued by defendants Illinois Union and Travelers. More specifically, IBERIABANK alleges that the insurers have failed to honor their obligations under the policies to pay IBERIABANK’s losses in connection with the $11.7 million settlement of disputed allegations relating to IBERIABANK’s professional services in connection with certain mortgage loans insured by the FHA. The judge in the federal lawsuit granted a motion for summary judgment thereby dismissing the case. The Company has appealed that decision to the United States Court of Appeals for the Fifth Circuit. The appeal seeks reversal of the summary judgment such that the case can be remanded to the district court in an effort to recover the $11.7 million.
Four purported holders of IBKC common stock have filed four putative stockholder class action complaints against IBKC and the members of IBKC’s board of directors. The complaints are captioned as follows: Wang v. IBKC, et al., No. 20-0105-LAP (S.D.N.Y filed January 6, 2020); Parshall v. IBKC, et al., No.20-00027-LPS (D. Del. filed January 8, 2020, includes First Horizon as a Defendant); Hertz v. IBKC, et al., No. 20-00267-MKB-LB (E.D.N.Y filed January 16, 2020); and Cooksey v. IBKC, et al., No. 20-00431-FB-RER (E.D.N.Y. filed January 26, 2020).
The complaints assert claims under Section 14(a) of the Exchange Act and Rule 14a-9 thereunder against IBKC and the members of IBKC’s board of directors and under Section 20(a) of the Exchange Act against the members of IBKC’s board of directors for allegedly disseminating a false and misleading registration statement on Form S-4, filed by First Horizon with the SEC on December 31, 2019. Among other remedies, the plaintiffs seeks to enjoin the Merger and any shareholder vote on the Merger and rescind the Merger or recover damages in the event the Merger is completed. The courts have not acted on the complaints, and no relief has been granted in any of the lawsuits as of this time. The defendants believe the claims and allegations are without merit.
The Company assesses its liabilities and contingencies in connection with outstanding legal proceedings utilizing the latest information available. Where it is probable that the Company will incur a loss and the amount of the loss can be reasonably estimated, the Company records a liability in its consolidated financial statements. These legal reserves may be increased or decreased to reflect any relevant developments on a quarterly basis. Where a loss is not probable or the amount of loss is not estimable, the Company does not accrue legal reserves. While the outcome of legal proceedings is inherently uncertain, based on information currently available and available insurance coverage, the Company’s management believes that it has established appropriate legal reserves. Any incremental liabilities arising from pending legal proceedings are not expected to have a material adverse effect on the Company’s consolidated financial statements. However, it is possible that the ultimate resolution of these matters, if unfavorable, may be material to the Company’s consolidated financial statements.
As of the date of this filing, the Company believes the amount of losses associated with legal proceedings that it is reasonably possible to incur above amounts already accrued and reported as of December 31, 2019 is not material.
NOTE 19 – FAIR VALUE MEASUREMENTS
Recurring fair value measurements
The following table presents information about the Company's assets and liabilities that are measured at fair value on a recurring basis as of December 31, 2019 and 2018 and their classification within the fair value hierarchy. See Note 1, Summary of Significant Accounting Policies, for a description of how fair value measurements are determined.
| December 31, 2019 | |||||||||||||||
| (in thousands) | Level 1 | Level 2 | Level 3 | Total | |||||||||||
| Assets | |||||||||||||||
| Securities available for sale | $ | — | $ | 3,933,360 | $ | — | $ | 3,933,360 | |||||||
| Mortgage loans held for sale | — | 213,357 | — | 213,357 | |||||||||||
| Mortgage loans held for investment, at fair value option | — | — | 2,792 | 2,792 | |||||||||||
| Derivative instruments | — | 104,151 | — | 104,151 | |||||||||||
| Total | $ | — | $ | 4,250,868 | $ | 2,792 | $ | 4,253,660 | |||||||
| Liabilities | |||||||||||||||
| Derivative instruments | $ | — | $ | 11,799 | $ | — | $ | 11,799 | |||||||
| Total | $ | — | $ | 11,799 | $ | — | $ | 11,799 | |||||||
| December 31, 2018 | |||||||||||||||
| Level 1 | Level 2 | Level 3 | Total | ||||||||||||
| Assets | |||||||||||||||
| Securities available for sale | $ | — | $ | 4,783,579 | $ | — | $ | 4,783,579 | |||||||
| Mortgage loans held for sale | — | 107,734 | — | 107,734 | |||||||||||
| Mortgage loans held for investment, at fair value option | — | — | 3,143 | 3,143 | |||||||||||
| Derivative instruments | — | 27,048 | — | 27,048 | |||||||||||
| Total | $ | — | $ | 4,918,361 | $ | 3,143 | $ | 4,921,504 | |||||||
| Liabilities | |||||||||||||||
| Derivative instruments | $ | — | $ | 22,124 | $ | — | $ | 22,124 | |||||||
| Total | $ | — | $ | 22,124 | $ | — | $ | 22,124 | |||||||
During 2019 and 2018, there were 0 transfers between the Level 1 and Level 2 fair value categories.
Non-recurring fair value measurements
The Company holds certain assets that are measured at fair value only in certain circumstances, such as impairment. The following table presents information about the Company's assets that are measured at fair value and still held as of December 31, 2019 and 2018 for which a non-recurring fair value adjustment was recorded during the years then ended. See Note 1, Summary of Significant Accounting Policies, for a description of how fair value measurements are determined.
| December 31, 2019 | |||||||||||||||
| (in thousands) | Level 1 | Level 2 | Level 3 | Total | |||||||||||
| Assets | |||||||||||||||
| Impaired loans | $ | — | $ | — | $ | 74,763 | $ | 74,763 | |||||||
| OREO, net | — | — | 4,907 | 4,907 | |||||||||||
| Total | $ | — | $ | — | $ | 79,670 | $ | 79,670 | |||||||
| December 31, 2018 | |||||||||||||||
| Level 1 | Level 2 | Level 3 | Total | ||||||||||||
| Assets | |||||||||||||||
| Impaired loans | $ | — | $ | — | $ | 65,914 | $ | 65,914 | |||||||
| OREO, net | — | — | 6,433 | 6,433 | |||||||||||
| Total | $ | — | $ | — | $ | 72,347 | $ | 72,347 | |||||||
The Company did not record any liabilities at fair value for which measurement of the fair value was made on a non-recurring basis as of December 31, 2019 and 2018.
Fair value option
The Company has elected the fair value option for originated residential mortgage loans held for sale, which allows for a more effective offset of the changes in fair values of the loans and the derivative instruments used to hedge them without the burden of complying with the requirements for hedge accounting. The Company also has a portion of mortgage loans held for investment for which the fair value option was elected upon origination and which continue to be accounted for at fair value at December 31, 2019 and 2018, respectively.
The following table summarizes the difference between the aggregate fair value and the aggregate unpaid principal balance for mortgage loans held for sale and mortgage loans held for investment measured at fair value:
| December 31, 2019 | December 31, 2018 | ||||||||||||||||||||||
| (in thousands) | Aggregate Fair Value | Aggregate Unpaid Principal | Aggregate Fair Value Less Unpaid Principal | Aggregate Fair Value | Aggregate Unpaid Principal | Aggregate Fair Value Less Unpaid Principal | |||||||||||||||||
| Mortgage loans held for sale, at fair value | $ | 213,357 | $ | 207,481 | $ | 5,876 | $ | 107,734 | $ | 104,345 | $ | 3,389 | |||||||||||
| Mortgage loans held for investment, at fair value | 2,792 | 2,922 | (130 | ) | 3,143 | 3,595 | (452 | ) | |||||||||||||||
Interest income on mortgage loans held for sale and mortgage loans held for investment at fair value option is recognized based on contractual rates and is reflected in interest income on loans held for sale in the consolidated statements of comprehensive income. The following table details net gains (losses) resulting from the change in fair value of loans that were recorded in mortgage income in the consolidated statements of comprehensive income for the years ended December 31, 2019, 2018 and 2017. The changes in fair value are mostly offset by economic hedging activities, with an insignificant portion of these changes attributable to changes in instrument-specific credit risk.
| Net Gains (Losses) Resulting From Changes in Fair Value | |||||||||||
| For the Years Ended December 31, | |||||||||||
| (in thousands) | 2019 | 2018 | 2017 | ||||||||
| Fair value option | |||||||||||
| Mortgage loans held for sale, at fair value | $ | 2,486 | $ | (251 | ) | $ | 944 | ||||
| Mortgage loans held for investment, at fair value | 18 | (1,542 | ) | (204 | ) | ||||||
NOTE 20 – FAIR VALUE OF FINANCIAL INSTRUMENTS
The carrying amount and estimated fair values of the Company's financial instruments, as well as the level within the fair value hierarchy, are included in the tables below. See Note 1, Summary of Significant Accounting Policies, for a description of how fair value measurements are determined.
| December 31, 2019 | ||||||||||||||||||||
| (in thousands) | Carrying Amount | Fair Value | Level 1 | Level 2 | Level 3 | |||||||||||||||
| Measurement Category | ||||||||||||||||||||
| Fair Value | ||||||||||||||||||||
| Financial Assets | ||||||||||||||||||||
| Securities available for sale | $ | 3,933,360 | $ | 3,933,360 | $ | — | $ | 3,933,360 | $ | — | ||||||||||
| Mortgage loans held for sale | 213,357 | 213,357 | — | 213,357 | — | |||||||||||||||
| Mortgage loans held for investment, at fair value option | 2,792 | 2,792 | — | — | 2,792 | |||||||||||||||
| Derivative instruments | 104,151 | 104,151 | — | 104,151 | — | |||||||||||||||
| Financial Liabilities | ||||||||||||||||||||
| Derivative instruments | 11,799 | 11,799 | — | 11,799 | — | |||||||||||||||
| Amortized Cost | ||||||||||||||||||||
| Financial Assets | ||||||||||||||||||||
| Cash and cash equivalents | $ | 894,723 | $ | 894,723 | $ | 894,723 | $ | — | $ | — | ||||||||||
| Securities held to maturity | 182,961 | 189,899 | — | 189,899 | — | |||||||||||||||
| Loans and leases, carried at amortized cost, net of unearned income and allowance for loan and lease losses | 23,874,911 | 23,732,650 | — | — | 23,732,650 | |||||||||||||||
| Financial Liabilities | ||||||||||||||||||||
| Deposits | 25,219,349 | 25,229,566 | — | 25,229,566 | — | |||||||||||||||
| Short-term borrowings | 204,208 | 204,208 | 204,208 | — | — | |||||||||||||||
| Long-term debt | 1,343,687 | 1,296,696 | — | — | 1,296,696 | |||||||||||||||
| December 31, 2018 | ||||||||||||||||||||
| (in thousands) | Carrying Amount | Fair Value | Level 1 | Level 2 | Level 3 | |||||||||||||||
| Measurement Category | ||||||||||||||||||||
| Fair Value | ||||||||||||||||||||
| Financial Assets | ||||||||||||||||||||
| Securities available for sale | $ | 4,783,579 | $ | 4,783,579 | $ | — | $ | 4,783,579 | $ | — | ||||||||||
| Mortgage loans held for sale | 107,734 | 107,734 | — | 107,734 | — | |||||||||||||||
| Mortgage loans held for investment, at fair value option | 3,143 | 3,143 | — | — | 3,143 | |||||||||||||||
| Derivative instruments | 27,048 | 27,048 | — | 27,048 | — | |||||||||||||||
| Financial Liabilities | ||||||||||||||||||||
| Derivative instruments | 22,124 | 22,124 | — | 22,124 | — | |||||||||||||||
| Amortized Cost | ||||||||||||||||||||
| Financial Assets | ||||||||||||||||||||
| Cash and cash equivalents | $ | 690,453 | $ | 690,453 | $ | 690,453 | $ | — | $ | — | ||||||||||
| Securities held to maturity | 207,446 | 204,277 | — | 204,277 | — | |||||||||||||||
| Loans and leases, carried at amortized cost, net of unearned income and allowance for loan and lease losses | 22,376,101 | 22,088,236 | — | — | 22,088,236 | |||||||||||||||
| Financial Liabilities | ||||||||||||||||||||
| Deposits | 23,763,431 | 23,752,139 | — | 23,752,139 | — | |||||||||||||||
| Short-term borrowings | 1,482,882 | 1,482,882 | 315,882 | 1,167,000 | — | |||||||||||||||
| Long-term debt | 1,166,151 | 1,154,062 | — | — | 1,154,062 | |||||||||||||||
The fair value estimates presented herein are based upon pertinent information available to management as of December 31, 2019 and 2018. Although management is not aware of any factors that would significantly affect the estimated fair value amounts, such amounts have not been comprehensively revalued for purposes of these financial statements since these dates and, therefore, current estimates of fair value may differ significantly from the amounts presented herein.
NOTE 21 – RELATED PARTY TRANSACTIONS
In the ordinary course of business, the Company may execute transactions with various related parties. Examples of such transactions may include lending or deposit arrangements, transfers of financial assets, services for administrative support, and other miscellaneous items.
The Company has granted loans to executive officers and directors and their affiliates. These loans, including the related principal additions, principal payments, and unfunded commitments are not material to the consolidated financial statements at December 31, 2019 and 2018. There were no outstanding loans to such related parties classified as non-accrual, past due, or troubled debt restructurings at December 31, 2019 and 2018.
Deposits from related parties held by the Company were not material at December 31, 2019 and 2018.
NOTE 22 – BUSINESS SEGMENTS
Each of the Company’s reportable operating segments serves the specific needs of the Company’s customers based on the products and services it offers. The reportable segments are based upon those revenue-producing components for which separate financial information is produced internally and primarily reflect the manner in which resources are allocated and performance is assessed. Further, the reportable operating segments are also determined based on the quantitative thresholds prescribed within ASC Topic 280, Segment Reporting, and consideration of the usefulness of the information to the users of the consolidated financial statements.
The Company reports the results of its operations through 3 reportable segments: IBERIABANK, Mortgage, and LTC. The IBERIABANK segment represents the Company’s commercial and retail banking functions, including its lending, investment, and deposit activities. IBERIABANK also includes the Company’s wealth management, capital markets, and other corporate functions. The Mortgage segment represents the Company’s origination, funding, and subsequent sale of one-to-four family residential mortgage loans. The LTC segment represents the Company’s title insurance and loan closing services.
Certain expenses not directly attributable to a specific reportable segment are allocated to segments based on pre-determined methods that reflect utilization. Also within IBERIABANK are certain reconciling items that translate reportable segment results into consolidated results. The following tables present certain information regarding operations by reportable segment, including a reconciliation of segment results to reported consolidated results for the periods presented. Reconciling items between segment results and reported results include:
Elimination of interest income and interest expense representing interest earned by IBERIABANK on interest-bearing checking accounts held by related companies, as well as the elimination of the related deposit balances at the IBERIABANK segment;
Elimination of investment in subsidiary balances on certain operating segments included in total and average segment assets; and
Elimination of intercompany due to and due from balances on certain operating segments that are included in total and average segment assets.
| Year Ended December 31, 2019 | |||||||||||||||
| (in thousands) | IBERIABANK | Mortgage | LTC | Consolidated | |||||||||||
| Interest and dividend income | $ | 1,301,901 | $ | 8,104 | $ | 3 | $ | 1,310,008 | |||||||
| Interest expense | 320,362 | — | — | 320,362 | |||||||||||
| Net interest income | 981,539 | 8,104 | 3 | 989,646 | |||||||||||
| Provision for (reversal of) credit losses | 41,710 | (53 | ) | — | 41,657 | ||||||||||
| Mortgage income | — | 63,030 | — | 63,030 | |||||||||||
| Title revenue | — | — | 25,928 | 25,928 | |||||||||||
| Other non-interest income (expense) | 145,317 | 104 | (19 | ) | 145,402 | ||||||||||
| Allocated expenses (income) | (14,495 | ) | 10,640 | 3,855 | — | ||||||||||
| Non-interest expense | 611,794 | 51,734 | 19,228 | 682,756 | |||||||||||
| Income before income tax expense | 487,847 | 8,917 | 2,829 | 499,593 | |||||||||||
| Income tax expense | 112,624 | 2,051 | 763 | 115,438 | |||||||||||
| Net income | $ | 375,223 | $ | 6,866 | $ | 2,066 | $ | 384,155 | |||||||
| Total loans, leases, and loans held for sale, net of unearned income | $ | 24,003,854 | $ | 231,002 | $ | — | $ | 24,234,856 | |||||||
| Total assets | 31,413,998 | 271,382 | 28,070 | 31,713,450 | |||||||||||
| Total deposits | 25,200,205 | 19,144 | — | 25,219,349 | |||||||||||
| Average assets | 31,121,870 | 230,241 | 25,757 | 31,377,868 | |||||||||||
| Year Ended December 31, 2018 | |||||||||||||||
| (in thousands) | IBERIABANK | Mortgage | LTC | Consolidated | |||||||||||
| Interest and dividend income | $ | 1,215,668 | $ | 5,958 | $ | 3 | $ | 1,221,629 | |||||||
| Interest expense | 208,381 | — | — | 208,381 | |||||||||||
| Net interest income | 1,007,287 | 5,958 | 3 | 1,013,248 | |||||||||||
| Provision for (reversal of) credit losses | 40,429 | (44 | ) | — | 40,385 | ||||||||||
| Mortgage income | — | 46,424 | — | 46,424 | |||||||||||
| Title revenue | — | — | 24,149 | 24,149 | |||||||||||
| Other non-interest income (expense) | 81,588 | (95 | ) | 496 | 81,989 | ||||||||||
| Allocated expenses (income) | (13,437 | ) | 9,847 | 3,590 | — | ||||||||||
| Non-interest expense | 660,804 | 43,021 | 19,073 | 722,898 | |||||||||||
| Income (loss) before income tax expense | 401,079 | (537 | ) | 1,985 | 402,527 | ||||||||||
| Income tax expense (benefit) | 32,436 | (52 | ) | (106 | ) | 32,278 | |||||||||
| Net income (loss) | $ | 368,643 | $ | (485 | ) | $ | 2,091 | $ | 370,249 | ||||||
| Total loans, leases, and loans held for sale, net of unearned income | $ | 22,493,809 | $ | 133,740 | $ | — | $ | 22,627,549 | |||||||
| Total assets | 30,645,000 | 162,599 | 25,416 | 30,833,015 | |||||||||||
| Total deposits | 23,754,512 | 8,919 | — | 23,763,431 | |||||||||||
| Average assets | 29,400,755 | 153,717 | 23,554 | 29,578,026 | |||||||||||
| Year Ended December 31, 2017 | |||||||||||||||
| (in thousands) | IBERIABANK | Mortgage | LTC | Consolidated | |||||||||||
| Interest and dividend income | $ | 906,521 | $ | 7,260 | $ | 2 | $ | 913,783 | |||||||
| Interest expense | 104,937 | — | — | 104,937 | |||||||||||
| Net interest income | 801,584 | 7,260 | 2 | 808,846 | |||||||||||
| Provision for (reversal of) credit losses | 51,797 | (89 | ) | — | 51,708 | ||||||||||
| Mortgage income | — | 63,570 | — | 63,570 | |||||||||||
| Title revenue | — | — | 21,972 | 21,972 | |||||||||||
| Other non-interest income (expense) | 116,659 | (42 | ) | (12 | ) | 116,605 | |||||||||
| Allocated expenses (income) | (13,293 | ) | 10,041 | 3,252 | — | ||||||||||
| Non-interest expense | 575,865 | 73,587 | 16,954 | 666,406 | |||||||||||
| Income (loss) before income tax expense | 303,874 | (12,751 | ) | 1,756 | 292,879 | ||||||||||
| Income tax expense (benefit) | 156,407 | (5,771 | ) | (170 | ) | 150,466 | |||||||||
| Net income (loss) | $ | 147,467 | $ | (6,980 | ) | $ | 1,926 | $ | 142,413 | ||||||
| Total loans, leases, and loans held for sale, net of unearned income | $ | 20,028,840 | $ | 184,257 | $ | — | $ | 20,213,097 | |||||||
| Total assets | 27,672,906 | 208,710 | 22,513 | 27,904,129 | |||||||||||
| Total deposits | 21,462,776 | 3,941 | — | 21,466,717 | |||||||||||
| Average assets | 24,228,436 | 229,364 | 22,856 | 24,480,656 | |||||||||||
NOTE 23 – CONDENSED PARENT COMPANY ONLY FINANCIAL STATEMENTS
Condensed financial statements of the Parent are shown below. The Parent has no significant operating activities.
Condensed Balance Sheets
| (in thousands) | December 31, | ||||||
| 2019 | 2018 | ||||||
| Assets | |||||||
| Cash in bank | $ | 160,171 | $ | 179,545 | |||
| Investments in subsidiaries | 4,308,843 | 4,008,802 | |||||
| Other assets | 63,205 | 53,832 | |||||
| $ | 4,532,219 | $ | 4,242,179 | ||||
| Liabilities and Shareholders’ Equity | |||||||
| Liabilities | $ | 195,485 | $ | 185,902 | |||
| Shareholders’ equity | 4,336,734 | 4,056,277 | |||||
| $ | 4,532,219 | $ | 4,242,179 | ||||
Condensed Statements of Income
| Year Ended December 31, | |||||||||||
| (in thousands) | 2019 | 2018 | 2017 | ||||||||
| Operating income | |||||||||||
| Reimbursement of management expenses | $ | 85,796 | $ | 83,262 | $ | 76,177 | |||||
| Other income | 190,407 | 245,213 | 146,796 | ||||||||
| Total operating income | 276,203 | 328,475 | 222,973 | ||||||||
| Operating expenses | |||||||||||
| Interest expense | 6,088 | 6,008 | 5,168 | ||||||||
| Salaries and employee benefits expense | 62,938 | 55,436 | 55,013 | ||||||||
| Other expenses | 25,106 | 28,963 | 32,965 | ||||||||
| Total operating expenses | 94,132 | 90,407 | 93,146 | ||||||||
| Income before income tax (benefit) expense and equity in undistributed earnings of subsidiaries | 182,071 | 238,068 | 129,827 | ||||||||
| Income tax (benefit) expense | (600 | ) | 799 | 3,123 | |||||||
| Income before equity in undistributed earnings of subsidiaries | 182,671 | 237,269 | 126,704 | ||||||||
| Equity in undistributed earnings of subsidiaries | 201,484 | 132,980 | 15,709 | ||||||||
| Net income | 384,155 | 370,249 | 142,413 | ||||||||
| Less: Preferred stock dividends | 12,602 | 9,095 | 9,095 | ||||||||
| Net income available to common shareholders | $ | 371,553 | $ | 361,154 | $ | 133,318 | |||||
Condensed Statements of Cash Flows
| (in thousands) | Year Ended December 31, | ||||||||||
| 2019 | 2018 | 2017 | |||||||||
| Cash Flows from Operating Activities | |||||||||||
| Net income | $ | 384,155 | $ | 370,249 | $ | 142,413 | |||||
| Adjustments to reconcile net income to net cash provided by (used in) operating activities: | |||||||||||
| Depreciation and amortization | 309 | 145 | 62 | ||||||||
| Net income of subsidiaries | (391,484 | ) | (377,974 | ) | (160,206 | ) | |||||
| Share-based compensation expense - equity awards | 24,584 | 20,278 | 16,436 | ||||||||
| Other operating activities, net | (9,828 | ) | 491 | (4,256 | ) | ||||||
| Net Cash Provided by (Used in) Operating Activities | 7,736 | 13,189 | (5,551 | ) | |||||||
| Cash Flows from Investing Activities | |||||||||||
| Cash paid in excess of cash received for acquisitions | — | (7 | ) | (809,159 | ) | ||||||
| Purchases of premises and equipment | (292 | ) | (52 | ) | (105 | ) | |||||
| Return of capital from subsidiary | 190,000 | 245,000 | 144,500 | ||||||||
| Other investing activities, net | (301 | ) | (1,500 | ) | — | ||||||
| Net Cash Provided by (Used in) Investing Activities | 189,407 | 243,441 | (664,764 | ) | |||||||
| Cash Flows from Financing Activities | |||||||||||
| Cash dividends paid on common stock | (92,190 | ) | (84,782 | ) | (72,772 | ) | |||||
| Cash dividends paid on preferred stock | (12,602 | ) | (9,095 | ) | (9,095 | ) | |||||
| Net share-based compensation stock transactions | (3,373 | ) | (3,226 | ) | (832 | ) | |||||
| Payments to repurchase common stock | (204,740 | ) | (148,855 | ) | — | ||||||
| Net proceeds from issuance of common stock | — | — | 485,151 | ||||||||
| Net proceeds from issuance of preferred stock | 96,388 | — | — | ||||||||
| Other financing activities, net | — | — | (56 | ) | |||||||
| Net Cash Provided by (Used In) Financing Activities | (216,517 | ) | (245,958 | ) | 402,396 | ||||||
| Net Increase (Decrease) in Cash and Cash Equivalents | (19,374 | ) | 10,672 | (267,919 | ) | ||||||
| Cash and Cash Equivalents at Beginning of Period | 179,545 | 168,873 | 436,792 | ||||||||
| Cash and Cash Equivalents at End of Period | $ | 160,171 | $ | 179,545 | $ | 168,873 | |||||
| Item 9. | CHANGES IN AND DISAGREEMENTS WITH ACCOUNTANTS ON ACCOUNTING AND FINANCIAL DISCLOSURE |
None.
| Item 9A. | CONTROLS AND PROCEDURES |
Evaluation of Disclosure Controls and Procedures
As required by Rule 13a-15 under the Securities Exchange Act of 1934 (the “Exchange Act”), we performed an evaluation of the effectiveness of our disclosure controls and procedures as of December 31, 2019. The evaluation was carried out under the supervision, and with the participation of, the Chief Executive Officer (“CEO”) and Chief Financial Officer (“CFO”). Based on that evaluation, the CEO and CFO have concluded that our disclosure controls and procedures were effective as of the end of the period covered by this Report. Management’s Report on Internal Control over Financial Reporting, and the attestation report of the independent registered public accounting firm, as statedare included in theirItem 8 of this report appearing in Exhibit 13 to this Form 10-K.and are incorporated by reference herein.
| Item 9B. |
None.
PART III.
| Item 10. |
For information regarding executive officers, is contained inrefer to Part I of this Annual Report on Form 10-K. Other information required herein including information on directors, the audit committee, and the audit committee financial expert is incorporated by reference to our definitive proxy statement or in an amendment to this Form 10-K, to be filed no later than 120 days after the Proxy Statement.
end of the fiscal year covered by this Form 10-K.
| Item 11. |
The information required herein is incorporated by reference to our definitive proxy statement or in an amendment to this Form 10-K, to be filed no later than 120 days after the end of the fiscal year covered by this Form 10-K.
| Item 12. | SECURITY OWNERSHIP OF CERTAIN BENEFICIAL OWNERS AND MANAGEMENT AND RELATED STOCKHOLDER MATTERS |
The information required herein is incorporated by reference to our definitive proxy statement or in an amendment to this Form 10-K, to be filed no later than 120 days after the Proxy Statement.
end of the fiscal year covered by this Form 10-K.
| Item |
The information required herein is incorporated by reference to our definitive proxy statement or in an amendment to this Form 10-K, to be filed no later than 120 days after the Proxy Statement.
end of the fiscal year covered by this Form 10-K.
| Item |
The information required herein is incorporated by reference to our definitive proxy statement or in an amendment to this Form 10-K, to be filed no later than 120 days after the Proxy Statement.
end of the fiscal year covered by this Form 10-K.
PART IV.
| Item 15. |
(a) Documents Filed as Part of this Report.
| (1) | The following financial statements are incorporated by reference from Item 8 hereof (see Exhibit No. 13): |
Consolidated Balance Sheets as of December 31, 20172019 and 20162018
Consolidated Statements of Comprehensive Income for the Years Ended December 31, 2017, 2016,2019, 2018, and 20152017
Consolidated Statements of Shareholders’ Equity for the Years Ended December 31, 2017, 2016,2019, 2018, and 20152017
Consolidated Statements of Cash Flows for the Years Ended December 31, 2017, 2016,2019, 2018, and 20152017
Notes to Consolidated Financial Statements
| (2) | All schedules for which provision is made in the applicable accounting regulation of the SEC are omitted because of the absence of conditions under which they are required or because the required information is included in the consolidated financial statements and related notes thereto. |
| (3) | The following exhibits are filed as part of this Form 10-K, and this list includes the Exhibit Index. |
| Exhibit Index | |
| Exhibit No. 2.1 | |
| Exhibit No. 3.1 | |
| Exhibit No. 3.2 | |
| Exhibit No. 4.1 | Stock Certificate – incorporated herein by reference to Registration Statement on Form S-8 (File No. 33-93210), filed on June 7, 1995. |
| Exhibit No. 4.2 | |
| Exhibit | |
| Exhibit No. 4.4 | |
| Exhibit No. 4.5 | |
| Exhibit No. 4.6 | |
| Exhibit No. 4.7 | |
| Exhibit No. 4.8 | |
| Exhibit No. 10.1 | |
| Exhibit No. 10.2 | |
| Exhibit No. 10.3 | |
| Exhibit No. 10.4 | |
| Exhibit No. 10.5 | |
| Exhibit No. 10.6 | |
| Exhibit No. 10.7 | |
| Exhibit No. 10.8 | |
| Exhibit No. 10.9 | |
| Exhibit No. 10.10 | |
| Exhibit No. 10.11 | |
| Exhibit No 10.12 | |
| Exhibit No. 10.13 | |
| Exhibit No. 10.14 | |
| Exhibit No. 10.15 | |
| Exhibit No. 10.16 | |
| Exhibit No. 10.17 | |
| Exhibit No. 10.18 | |
| Exhibit No. 10.19 | |
| Exhibit No. 10.20 | |
| Exhibit No. 10.21 | |
| Exhibit No. 10.22 | |
| Exhibit No. 10.23 | |
| Exhibit No. 10.24 | |
| Exhibit No. 10.25 | |
| Exhibit No. 10.26 | |
| Exhibit No. 10.27 | |
| Exhibit No. 10.28 | |
| Exhibit No. 10.29 | |
| Exhibit No. 10.30 | |
| Exhibit No. 10.31 | |
| Exhibit No. | |
| Exhibit No. | |
| Exhibit No. 10.34 | |
| Exhibit No. 10.35 | |
| Exhibit No. 10.36 | |
| Exhibit No. 21 | |
| Exhibit No. 23.1 | |
| Exhibit No. 31.1 | |
| Exhibit No. 31.2 | |
| Exhibit No. 32.1 | |
| Exhibit No. 32.2 | |
| Exhibit No. 99.1 | |
| Exhibit No. 101.INS | XBRL Instance Document. |
| Exhibit No. 101.SCH | XBRL Taxonomy Extension Schema. |
| Exhibit No. 101.CAL | XBRL Taxonomy Extension Calculation Linkbase. |
| Exhibit No. 101.DEF | XBRL Taxonomy Extension Definition Linkbase. |
| Exhibit No. 101.LAB | XBRL Taxonomy Extension Label Linkbase. |
| Exhibit No. 101.PRE | XBRL Taxonomy Extension Presentation Linkbase. |
| Exhibit No. 104 | Cover Page Interactive Data File (formatted as Inline XBRL and contained in Exhibit 101) |
SIGNATURES
Pursuant to the requirements of Section 13 or 15(d) of the Securities Exchange Act of 1934, the Registrant has duly caused this report to be signed on its behalf by the undersigned, thereunto duly authorized.
| IBERIABANK CORPORATION | ||
| Date: | By: | /s/ Daryl G. Byrd |
| Daryl G. Byrd | ||
| President, Chief Executive Officer and Director | ||
Pursuant to the requirements of the Securities Exchange Act of 1934, this report has been signed below by the following persons on behalf of the Registrant and in the capacities and on the dates indicated.
| Name | Title | Date | ||
| /s/ Daryl G. Byrd | President, Chief Executive Officer and Director | |||
| Daryl G. Byrd | ||||
| /s/ Anthony J. Restel | Vice Chairman and Chief Financial Officer | |||
| Anthony J. Restel | ||||
| /s/ M. Scott Price | Executive Vice President, Corporate Controller and Chief Accounting Officer | |||
| M. Scott Price | ||||
| /s/ Harry V. Barton, Jr. | Director and Audit Committee Chairman | |||
| Harry V. Barton, Jr. | ||||
| /s/ Ernest P. Breaux, Jr. | Director and Chair of Investment Commitment | |||
| Ernest P. Breaux, Jr. | ||||
| /s/ John N. Casbon | Director and Chair of the Board Risk Committee | |||
| John N. Casbon | ||||
| /s/ William H. Fenstermaker | Chairman of the Board | |||
| William H. Fenstermaker | ||||
| /s/ J. Michael Kemp, Sr. | Director | March 2, 2020 | ||
| J. Michael Kemp, Sr. | ||||
| /s/ John E. Koerner, III | Director and Audit Committee Member | |||
| John E. Koerner, III | ||||
| /s/ Rick E. Maples | Director and Audit Committee Member | |||
| Rick E. Maples | ||||
| /s/ E. Stewart Shea, III | Vice Chairman of the Board | |||
| E. Stewart Shea, III | ||||
| /s/ | Director and Audit Committee Member | |||