UNITED STATES
SECURITIES AND EXCHANGE COMMISSION
Washington, D.C. 20549
_________________________________________________________
FORM 10-K
_________________________________________________________ |
| | | | |
| x | ANNUAL REPORT PURSUANT TO SECTION 13 OR 15(d) OF THE SECURITIES EXCHANGE ACT OF 1934 |
For the fiscal year ended December 31, 20172023
OR
| | | | | |
| ☐ | |
¨ | TRANSITION REPORT PURSUANT TO SECTION 13 OR 15(d) OF THE SECURITIES EXCHANGE ACT OF 1934 |
For the transition period from to
Commission File Number 1-8174001-08174
_________________________________________________________ DUCOMMUN INCORPORATED
(Exact name of registrant as specified in its charter)
_________________________________________________________ | | | | | | | | |
| Delaware | | 95-0693330 |
| | |
Delaware | | 95-0693330 |
(State or other jurisdiction of
incorporation or organization)
| | (I.R.S. Employer
Identification No.)
|
| |
200 Sandpointe Avenue, Suite 700, Santa Ana, California | | 92707-5759 |
| (Address of principal executive offices) | | (Zip code) |
Registrant’s telephone number, including area code: (657) 335-3665
Securities registered pursuant to Section 12(b) of the Act:
| | | | | | | | | | | | | | |
| | |
| Title of each class | | Trading Symbol(s) | | Name of each exchange on which registered |
| Common Stock, $.01 par value per share | | DCO | | New York Stock Exchange |
Securities registered pursuant to Section 12(g) of the Act:_________________________________________________________
None
(Title of class)
Indicate by check mark if the registrant is a well-known seasoned issuer, as defined in Rule 405 of the Securities Act. Yes ¨ No x
Indicate by check mark if the registrant is not required to file reports pursuant to Section 13 or Section 15(d) of the Act. Yes ¨ No x
Indicate by check mark whether the registrant (1) has filed all reports required to be filed by Section 13 or 15(d) of the Securities Exchange Act of 1934 during the preceding 12 months (or for such shorter period that the registrant was required to file such reports), and (2) has been subject to such filing requirements for the past 90 days. Yes x No ¨
Indicate by check mark whether the registrant has submitted electronically and posted on its corporate Web site, if any, every Interactive Data File required to be submitted and posted pursuant to Rule 405 of Regulation S-T (§232.405 of this chapter) during the preceding 12 months (or for such shorter period that the registrant was required to submit and post such files). Yes x No ¨
Indicate by check mark if disclosure of delinquent filers pursuant to Item 405 of Regulation S-K (§229.405 of this chapter) is not contained herein, and will not be contained, to the best of registrant’s knowledge, in definitive proxy or information statements incorporated by reference in Part III of this Form 10-K or any amendment to this Form 10-K. ¨
Indicate by check mark whether the registrant is a large accelerated filer, an accelerated filer, a non-accelerated filer, or a smaller reporting company, or an emerging growth company. See the definitions of “large accelerated filer,” “accelerated filer,” “smaller reporting company,” and “emerging growth company” in Rule 12b-2 of the Exchange Act.
| | | | | | | | | | | | | | | | | |
| | | | | |
| Large accelerated filer | | ¨ | Accelerated filer | | x |
| | | |
| Non-accelerated filer | | ¨ | Smaller reporting company | | ¨☐ |
| | | | | |
| | | Emerging growth company | | ¨☐ |
If an emerging growth company, indicate by check mark if the registrant has elected not to use the extended transition period for complying with any new or revised financial accounting standards provided pursuant to Section 13(a) of the Exchange Act. ¨
Indicate by check mark whether the registrant has filed a report on and attestation to its management’s assessment of the effectiveness of its internal control over financial reporting under Section 404(b) of the Sarbanes-Oxley Act (15 U.S.C. 7262(b)) by the registered public accounting firm that prepared or issued its audit report. x
If securities are registered pursuant to Section 12(b) of the Act, indicate by check mark whether the financial statements of the registrant included in the filing reflect the correction of an error to previously issued financial statements. ¨
Indicate by check mark whether any of those error corrections are restatements that required a recovery analysis of incentive-based compensation received by any of the registrant’s executive officers during the relevant recovery period pursuant to §240.10D-1(b). ¨
Indicate by check mark whether the registrant is a shell company (as defined in Rule 12b-2 of the Exchange Act). Yes ¨☐ No x
The aggregate market value of the voting and non-voting common equity held by non-affiliates computed by reference to the price of which the common equity was last sold, or the average bid and asked price of such common equity, as of the last business day of the registrant’s most recently completed second fiscal quarter ended July 1, 20172023 was $357$635 million.
The number of shares of common stock outstanding on February 14, 201815, 2024 was 11,340,653.14,641,154.
DOCUMENTS INCORPORATED BY REFERENCE
The following documents are incorporated by reference:
(a) Proxy Statement for the 20182024 Annual Meeting of Shareholders (the “2018“2024 Proxy Statement”), incorporated partially in Part III hereof.
DUCOMMUN INCORPORATED AND SUBSIDIARIES
| | | | | | | | |
| | |
| | Page |
|
| | |
| | |
| | |
| Item 1. | | |
| | |
| Item 1A. | | |
| | |
| Item 1B. | | |
| | |
Item 2.1C. | | |
| | |
| Item 2. | | |
| | |
| Item 3. | | |
| | |
| Item 4. | | |
|
|
| | |
| Item 5. | | |
| | |
| Item 6. | | |
| | |
| Item 7. | | |
| | |
| Item 7A. | | |
| | |
| Item 8. | | |
| | |
| Item 9. | | |
| | |
| Item 9A. | | |
| | |
| Item 9B. | | |
| | |
| Item 9C. | | |
|
|
| | |
| Item 10. | | |
| | |
| Item 11. | | |
| | |
| Item 12. | | |
| | |
| Item 13. | | |
| | |
| Item 14. | | |
| |
|
| | |
| Item 15. | | |
| | |
| Item 16. | | |
| | |
| | |
FORWARD-LOOKING STATEMENTS AND RISK FACTORS
This Annual Report on Form 10-K (“Form 10-K”) contains forward-looking statements within the meaning of Section 27A of the Securities Act of 1933, Section 21E of the Securities Exchange Act of 1934 and the Private Securities Litigation Reform Act of 1995. Forward-looking statements may be preceded by, followed by or include the words such as “could,” “may,” “believe,” “expect,” “anticipate,” “intend,” “plan,” “estimate”“estimate,” “expect,” “would,” or similar expressions. These statements are based on the beliefs and assumptions of our management.management at the time such statements are made. Generally, forward-looking statements include information concerning our possible or assumed future actions, events or results of operations. Forward-looking statements specifically include, without limitation, the information in this Form 10-K regarding: future sales, earnings, cash flow, revenue recognition, uses of cash and other measures of financial performance, projections or expectations for future operations, including costs to complete contracts, goodwill impairment evaluations, useful life of intangible assets, unrecognized tax benefits and effective tax rate, environmental remediation costs, insurance recoveries, industry trends and expectations, including ramp up times for build rates, our plans with respect to restructuring activities, capital expenditures, completed acquisitions, future acquisitions and dispositions, and expected business opportunities that may be available to us.
Although we believe that the expectations reflected in the forward-looking statements are based on reasonable assumptions, these forward-looking statements are subject to numerous factors, risks and uncertainties that could cause actual outcomes and results to be materially different from those projected. We cannot guarantee future results, performance or achievements. Moreover, neither we nor any other person assumes responsibility for the accuracy and completeness of the forward-looking statements. All written and oral forward-looking statements made in connection with this Form 10-K that are attributable to us or persons acting on our behalf are expressly qualified in their entirety by “Risk Factors” contained within Part I, Item 1A of this Form 10-K and other cautionary statements included herein. We are under no duty to update any of the forward-looking statements after the date of this Form 10-K to conform such statements to actual results or to changes in our expectations.
The information in this Form 10-K is not a complete description of our business. There can be no assurance that other factors will not affect the accuracy of these forward-looking statements or that our actual results will not differ materially from the results anticipated in such forward-looking statements. While it is impossible to identify all such factors, some factors that could cause actual results to differ materially from those estimated by us include, but are not limited to, those factors or conditions described under Risk Factors contained within Part I, Item 1A of this Form 10-K and the following:
•our ability to manage and otherwise comply with our covenants with respect to our outstanding indebtedness;
•our ability to service our indebtedness;
•our acquisitions, business combinations, joint ventures, divestitures, or restructuring activities may entail certain operational and financial risks;
•the cyclicality of our end-use markets and the level of new commercial and military aircraft orders;
•industry and customer concentration;
•production rates for various commercial and military aircraft programs;
•the level of U.S. Government defense spending, including the impact of sequestration;spending;
•compliance with applicable regulatory requirements and changes in regulatory requirements, including regulatory requirements such as the Cybersecurity Maturity Model Certification (“CMMC”), applicable to government contracts and sub-contracts;sub-contracts, and the Securities and Exchange Commission’s (“SEC”) “Cybersecurity Risk Management, Strategy, Governance, and Incident Disclosure” rule;
•further consolidation of customers and suppliers in our markets;
•product performance and delivery;
•start-up costs, manufacturing inefficiencies and possible overruns on contracts;
•increased design, product development, manufacturing, supply chain and other risks and uncertainties associated with our growth strategy to become a Tier Two supplier of higher-level assemblies;
•our ability to manage the risks associated with international operations and sales;
possible goodwill and other asset impairments;
•economic and geopolitical developments and conditions;conditions, including supply chain issues and rising or higher interest rates;
•environmental, social, and governance (“ESG”) developments and their related impact;
•pandemics, such as the COVID-19 pandemic, significantly impacting the global economy and most significantly, the commercial aerospace end-use market;
•disasters, natural or otherwise, damaging or disrupting our operations;
•unfavorable developments in the global credit markets;
•our ability to operate within highly competitive markets;
•technology changes and evolving industry and regulatory standards;
•possible goodwill and other asset impairments;
•the risk of environmental liabilities;
•the risk of cybersecurity attacks, along with a potential significant ransom demand, or our inability to detect such attacks; and
•litigation with respect to us.
We caution the reader that undue reliance should not be placed on any forward-looking statements, which speak only as of the date of this Form 10-K. We do not undertake any duty or responsibility to update any of these forward-looking statements to reflect events or circumstances after the date of this Form 10-K or to reflect actual outcomes.except as required by law.
PART I
ITEM 1. BUSINESS
GENERAL
Ducommun Incorporated (“Ducommun,” “the Company,” “we,” “us” or “our”) is a leading global provider of engineering and manufacturing services for high-performance products and high-cost-of failure applications used primarily in the aerospace and defense (“A&D”), industrial, medical and other industries (collectively, “Industrial”). Ducommun differentiates itself as a full-service solution-based provider, offering a wide range ofinnovative, value-added proprietary products and servicesmanufacturing solutions to our customers in our primary businesses of electronics, structures, and integrated solutions. We operate through two primary business segments: Electronic Systems and Structural Systems. We are the successor to a business that was founded in California in 1849 and reincorporated in Delaware in 1970.
ACQUISITIONS
Acquisitions have been an important element of our growth strategy. We have supplemented our organic growth by identifying, acquiring and integrating acquisition opportunities that result in broader, more sophisticated product and service offerings while diversifying and expanding our customer base and markets.
For example, in September 2017,on April 25, 2023, we acquired all100% of the outstanding equity interests of Lightning Diversion Systems, LLC (the “LDS Acquisition”BLR Aerospace L.L.C. (“BLR”), a worldwide leader in lightning protectionprivately-held leading provider of aerodynamic systems servingthat enhance the aerospaceproductivity, performance, and defense industries for $60.0safety of rotary and fixed-wing aircraft on commercial and military platforms. The initial purchase price was $115.0 million, (netnet of cash acquired), funded by drawing down on our revolving credit facility.acquired. We paid a gross aggregate of $117.0 million in cash upon the closing of the transaction. We utilized the 2022 Revolving Credit Facility (as defined below) to complete the acquisition. The LDS Acquisition is partacquisition of BLR adds to our strategy to enhance revenue growth by focusing on advanced proprietary technology on various aerospacediversify and defense platforms.offer more customized, value-driven engineered products with aftermarket opportunities, and was included in our Structural Systems segment.
PRODUCTS AND SERVICES
Business Segment Information
We operate through two primary strategic businesses, Electronic Systems and Structural Systems, each of which is a reportable segment. The results of operations among our operating segments vary due to differences in competitors, customers, extent of proprietary deliverables and performance. Electronic Systems designs, engineers and manufactures high-reliability electronic and electromechanical products used in worldwide technology-driven markets including A&D and Industrial end-use markets. Electronic Systems’ product offerings primarily range from prototype development to complex assemblies as discussed in more detail below. Structural Systems designs, engineers and manufactures large,various sizes of complex contoured aerostructure components and assemblies and supplies composite and metal bonded structures and assemblies. Structural Systems’ products are primarily used on commercial aircraft, military fixed-wing aircraft and military and commercial rotary-wing aircraft.
Electronic Systems
Electronic Systems has multiple major product offerings in electronics manufacturing for diverse, high-reliability applications: complex cable assemblies and interconnect systems, printed circuit board assemblies, higher-level electronic, electromechanical, and mechanical components and assemblies, and lightning diversion systems. Components, assemblies, and
lightning diversion products are provided principally for domestic and foreign commercial and military fixed-wing aircraft, military and commercial rotary-wing aircraft and space programs. Further, we provide select industrial high-reliability applications for the industrial, automation and medical, and other end-use markets. We build custom, high-performance electronics and electromechanical systems. Our products include sophisticated radar enclosures, aircraft avionics racks and shipboard communications and control enclosures, printed circuit board assemblies, cable assemblies, wire harnesses, and interconnect systems, lightning diversion strips, surge suppressors, conformal shields and other high-level complex assemblies. Electronic Systems utilizes a highly-integrated production process, including manufacturing, engineering, fabrication, machining, assembly, electronic integration, and related processes. Engineering, technical and program management services including design, development, and integration and testing of circuit card assemblies and cable assemblies, are provided to a wide range of customers.
In response to customer needs and utilizing our in-depth engineering expertise, Electronic Systems is also considered a leading supplier of engineered products including, illuminated pushbutton switches and panels for aviation and test systems, microwave and millimeter switches and filters for radio frequency systems and test instrumentation, and motors and resolvers for motion control.
control, and lightning diversion systems.
Electronic Systems also provides engineering expertise for aerospace system design, development, integration, and testing. We leverage the knowledge base, capabilities, talent, and technologies of this focused capability into direct support of our customers.
Structural Systems
Structural Systems has three major product offerings to support a global customer base: commercial aircraft, military fixed-wing aircraft, and military and commercial rotary-wing aircraft. Our applications include structural components, structural assemblies, and bonded (metal and composite) components.components, precision profile extrusions and extruded assemblies, ammunition handling systems, magnetic seals, and aerodynamic systems. In the structural components products, Structural Systems designs,provides design services, engineers, and manufacturesmanufacturing of large complex contoured aluminum, titanium and Inconel® aerostructure components for the aerospace industry. Structural assembly products include winglets, engine components, and fuselage structural panels for aircraft. Metal and composite bonded structures and assemblies products include aircraft wing spoilers, large fuselage skins, rotor blades on rotary-wing aircraft and components, flight control surfaces, engine components, ammunition handling systems, magnetic seals, and engine components.aerodynamic systems. To support these products, Structural Systems maintains advanced machine milling, stretch-forming, hot-forming, metal bonding, composite layup, and chemical milling capabilities and has an extensive engineering capability to support both design services and manufacturing.
AEROSPACE AND DEFENSE END-USE MARKETS OVERVIEW
Our largest end-use markets are the aerospace and defense markets and our revenues from these markets represented 90%94% of our total net revenues in 2017.2023. These markets are serviced by suppliers which are stratified, from the lowesthighest value provided to the highest,lowest, into four tiers: Tier Three, Tier Two, Tier One and original equipment manufacturers (“OEMs”)., Tier One, Tier Two, and Tier Three. The OEMs provide the highest value and are also known as prime contractors (“Primes”). We derive a significant portion of our revenues from subcontracts with OEMs. As the prime contractorPrimes for various programs and platforms, the OEMs sell to their customers, who may include, depending upon the application, the U.S. Federal Government, foreign, state and local governments, global commercial airline carriers, regional jet carriers and various other customers. The OEMs also sell to global leasing companies that lease commercial aircraft. A significant portion of our revenues is earned from subcontracts with the Primes. Tier ThreeOne suppliers principally provide components or detailed parts.manufacture aircraft sections and purchase assemblies. Tier Two suppliers provide more complex, value-added parts and may also assume more design risk, manufacturing risk, supply chain risk and project management risk than Tier Three suppliers. Tier OneThree suppliers manufacture aircraft sections and purchase assemblies.principally provide components or detailed parts. We currently compete primarily with Tier One, Tier Two, and Tier Three suppliers. Our business growth strategy is to differentiate ourselves from competitors by providing more complex assemblies to our customers as a Tier Twohigher value added supplier.
Commercial Aerospace End-Use Market
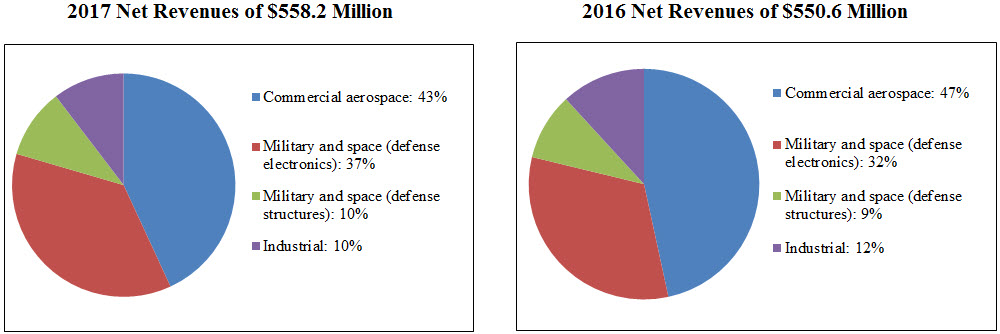
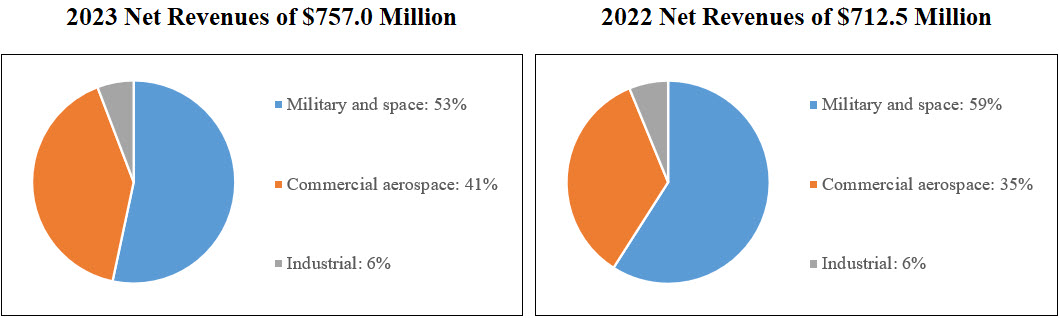
The commercial aerospace end-use market is highly cyclical and is impacted by the level of global air passenger traffic in general, which in turn is influenced by global economic conditions, fleet fuel and maintenance costs, geopolitical developments, pandemics, supply chain issues, and geopolitical developments.inflationary forces. Revenues from the commercial aerospace end-use market represented 43%41% of our total net revenues for 2017.2023.
Global economic growth,The residual effects of the COVID-19 pandemic and the resulting inflation, rising or high interest rates, supply chain issues, geopolitical developments, and other events have contributed and/or continues to contribute to a primary drivergeneral slowdown in the global economy and most significantly, the adverse impact on demand for civil air travel,travel. Further, one of our largest customers, The Boeing Company (“Boeing”), was notified by the Federal Aviation Administration (“FAA”) in early January 2024 it has returnedinitiated an investigation into Boeing’s quality control system. This was followed by the FAA announcing actions to increase its oversight of Boeing as well as not approving production rate increases or additional production lines for the long-term annual average737 MAX until it is
satisfied that Boeing is in 2017 is estimated to grow by more than seven percent, exceeding the long-term trend of approximately five percent.full compliance with required quality control procedures. While growth was strong across all major world regions, there continues to be variation between regionsuncertainty, Boeing is continuing to work with airlines and airline business models. Airlines operatinggovernment officials on delivery timing and expect to deliver most of the aircraft in inventory by the Asia Pacific regionsend of 2024. The combination of these factors has, in turn, created a significant challenge for some of our customers and Europe, as well as low-cost-carriers globally, are currently leading the growth in passenger traffic.
In addition, airlineentire commercial aerospace manufacturing and services sector. Airline financial performance, which also plays a role in the demand for new capacity. Airlines continuecapacity, has been adversely impacted by the COVID-19 pandemic and aforementioned issues. According to focusthe International Air Transport Association (“IATA”), it is estimating industry-wide profits of $23.3 billion for 2023, an increase from its forecast of $4.6 billion a year ago. For 2024, IATA is forecasting $25.7 billion in profits for the industry globally. Thus, the overall outlook continues to stabilize as we face uncertainties in the environment in the near-to medium-term as airlines are facing persistently high and volatile cost of fuel and tight labor conditions. The global economy is expecting an easing of inflation and interest rates, with regional economic and geopolitical difficulties adding uncertainty to the outlook and the financial viability of some airlines and regions.
In The Boeing Company’s (“Boeing”) 2023 Annual Report on increasing revenue through alliances, partnerships, new marketing initiatives,Form 10-K filed with the Securities and effective leveraging of ancillary servicesExchange Commission (the “SEC”), they indicated that in 2023, global air traffic largely recovered to 2019 levels with domestic travel continuing to be the most robust and related revenues. Airlines are also focusing on reducing coststhe single-aisle market following closely. International travel has mostly recovered and renewing fleetsthe wide-body market continues to leverage more efficient airplanes. Net profitsbe paced by the international travel recovery. The transition in 2017 are expectedthe international commercial market from recovery to approximate $35 billion, consistent with 2016.
Further, the availability of internal or external funding impacts commercial aircraft build rates. Failure of ournormal market conditions is progressing slowly as China international travel remains below 2019 levels. Overall, Boeing is experiencing strong demand from its airline customers to obtain financing may result in cancellation or deferral of orders.globally.
The long-term outlook for the industry continues to remainremains positive due to the fundamental drivers of air travel growth:demand: economic growth, and the increasing propensity to travel due to increased trade, globalization, and improved airline services driven by liberalization of air traffic rights between countries. The Boeing Company’s (“Boeing”)Boeing’s commercial market outlook forecast projects a three and a half percent growth rate in the global fleet over a 20 year forecast projections in their 2017 Annual Report on Form 10-K filed with the Securities and Exchange Commission (the “SEC”) projects a long-term average growth rate of almost five percent per year for passenger traffic and more than four percent for cargo traffic. This is basedperiod. Based on long-term global economic growth projections of almost threetwo and six tenths percent average annual gross domestic product (“GDP”) growth, Boeing projects a $6 trillion marketdemand for more than 41,00042,595 new airplanes over the next 20 years. However, the industry remains vulnerable to various developments including fuel price spikes, credit market fluctuations, acts of terrorism, natural disasters, conflicts, epidemics, pandemics, and increased global environmental regulations. We believe we are well positioned given our product capabilities, investment in inventories and contract assets, and our initiatives to increase operating efficiencies to participate in the steadynear term recovery and the long term projected growth rate for commercial air traffic and build rates for large commercial aircraft for the airframe manufacturing industry.
If the recovery is slower than anticipated or any of those various developments occur, it could have a material adverse effect on our results of operations, financial position, and/or cash flows.
Defense End-Use Market
Our defense end-use market includes products used in military and space, including technologies and structures applications. The defense end-use market is highly cyclical and is impacted by the level of government defense spending. Government defense spending is impacted by national defense policies and priorities, political climates, fiscal budgetary constraints, U.S. Federal budget deficits, projected economic growth and the level of global military or security threats, or other conflicts. Revenues from the military and space end-use market in 20172023 represented 47%53% of our total net revenues during 2017.2023.
In November 2017,The U.S. government is currently operating under a continuing resolution (“CR”) to keep the government funded while the Congress passed the National Defense Authorization Act forworks to enact full year fiscal year 20182024 (“FY2018”FY24”), appropriation bills. Under the Fiscal Responsibility Act of 2023, which authorizes a U.S. Department of Defense (“U.S. DoD”) budget topline higher than the administration’s budget request from May. While the appropriations process for FY2018 remains incomplete, both the House and Senate appropriations committees have also produced bills that increase the U.S. DoD budget topline above the administration’s request. On February 9, 2018, Congress passed a fifth Continuing Resolution that maintains current funding levels through March 23, 2018 and includes increases to the Budget Control Act capsimposes limits on discretionary spending for defense and non-defense spendingprograms in exchange for FY2018 and FY2019. However, the Budget Control Act continues to mandate limits on U.S. government discretionary spending and remains in effect. As a result, continued budget uncertainty and the risk of future sequestration cuts will remain unless Congress acts to repeal or suspend this law.
Funding timeliness also remains a risk. If Congress is unable to pass appropriations bills or an omnibus spending bill before the expirationlifting of the current Continuing Resolution, a government shutdown could result which may have impacts abovedebt ceiling in June 2023, if Congress fails to enact all appropriation bills by April 30, 2024, then the budget caps will be reduced and beyond those resulting fromcorresponding automatic reductions to agency budget cuts, sequestration impacts or program-level appropriations. For example, requirements to furlough employees in the U.S. DoD, the Department of Transportation, or other government agencies could result in payment delays, impair our ability to perform work on existing contracts, and/or negatively impact future orders.
In addition, there continues toaccounts will be uncertainty with respect to program-level appropriations for the U.S. DoD and other government agencies, including the National Aeronautics and Space Administration (“NASA”), within the overall budgetary framework described above.enforced through sequestration. Future budget cuts or investment priority changes, including changes associated with the authorizations and appropriations process, could result in reductions, cancellations, and/or delays of existing contracts or programs. Any of these impacts could have a material effect on theour results of our operations, financial position, and/or cash flows. For additional information related to our revenues from customers whose principal sales are to the U.S. Government and our direct sales to the U.S. Government, see “Risk Factors” contained within Part I, Item 1A of this Annual Report on Form 10-K (“Form 10-K”).
INDUSTRIAL END-USE MARKETS OVERVIEW
Our industrial, medical and other (collectively, “Industrial”) end-use markets are diverse and are impacted by the customers’ needs for increasing electronic content and a desire to outsource. Factors expected to impact these markets include capital and industrial goods spending and general economic conditions. Our products are used in heavy industrial manufacturing systems and certain medical applications. Revenues from the Industrial end-use markets were 10%6% of our total net revenues during 2017.2023.
We believe our business in these markets has stabilizedin the long-term, is stable and we are well positioned forin these markets.markets even though the residual effects of the COVID-19 pandemic and the resulting inflation, rising or high interest rates, and supply chain issues has had and will continue to have an impact on our business.
SALES AND MARKETING
Our commercial revenues are substantially dependent on airframe manufacturers’ production rates of new aircraft. Deliveries of new aircraft by airframe manufacturers are dependent on the demand and financial capacity of its customers, primarily airlines and leasing companies, to purchase the aircraft. Thus, revenues from commercial aircraft could be affected as a result of changes in new aircraft orders, or the cancellation or deferral by airlines of purchases of ordered aircraft. Further, our revenues from commercial aircraft programs could be affected by changes in our customers’ inventory levels and changes in our customers’ aircraft production build rates. In recent years,rates as a result of changing demand by their end customer or in order to comply with regulatory requirements. Due to the effects from the lingering COVID-19 pandemic or regulatory compliance requirements, while both major large aircraft manufacturers, Boeing and Airbus SE (“Airbus”), have announced higherimproved build rates, dueit will take longer to increasesreach pre-COVID-19 pandemic levels. While the ramp up in production of existing programs, including more fully-developed models, and bydemand will be slower in the introduction of new platforms.near and medium future, we will continue to identify opportunities to expand our presence and offerings with both major large aircraft manufacturers and their supply chain.
Military components manufactured by us are employed in many of the country’s front-line fighters, bombers, rotary-wing aircraft and support aircraft, as well as land and sea-based applications. Our defense business is diversified among a number of military manufacturers and programs. In the space sector, we are expanding our presence with unmanned aerial vehicles and continue to support various unmanned launch vehicle and satellite programs.
Our sales into the Industrial end-use markets are customer focused in the various markets and driven primarily by their capital spending and manufacturing outsourcing demands.
We continue to broaden and diversify our customer base in the end-use markets we serve by providing innovative product and service solutions throughby drawing on our core competencies, experience and technical expertise. Net revenues related to military and space, (defense technologies and defense structures), commercial aerospace, and Industrial end-use markets in 20172023 and 20162022 were as follows:
Many of our contracts are firm fixed price contracts subject to termination at the convenience of the customer (as well as for default). In the event of termination for convenience, the customer generally is required to pay the costs we have incurred and certain other fees through the date of termination.termination, plus a reasonable profit. Larger, long-term government subcontracts may have provisions for milestone payments, progress payments or cash advances for purchase of inventory.
Our marketing efforts primarily consist of developing strong, long-term relationships with our customers, which provide the basis for future sales. These close relationships allow us to gain a better insight into each customer’s business needs, identify ways to provide greater value to the customer, and allow us to be designeddesignated early in early inthe design process for various products and/or high volume products.
SEASONALITY
The timing of our revenues is governed by the purchasing patterns of our customers, and, as a result, we may not generate revenues equally during the year. However, no material portion of our business is considered to be seasonal.
MAJOR CUSTOMERS
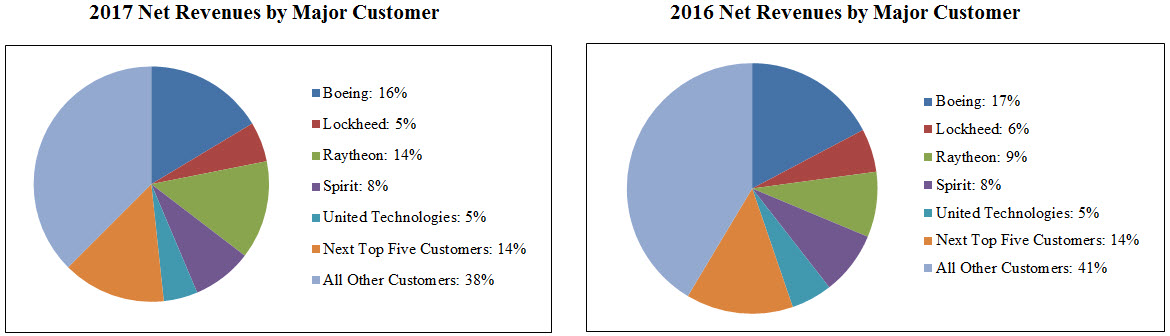
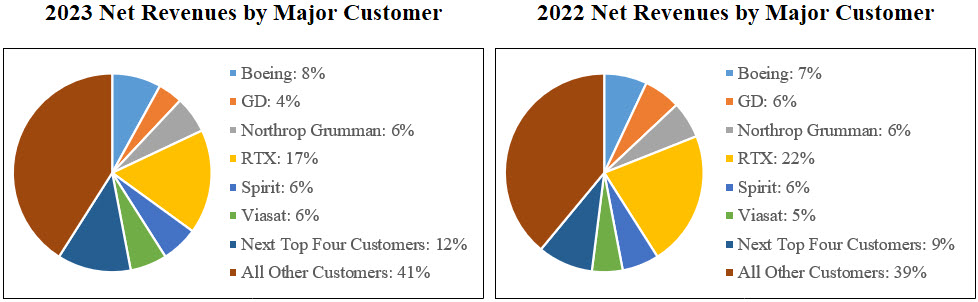
We currently generate the majority of our revenues from the aerospace and defense industries. As a result, we have significant revenues from certain customers. Boeing and RTX Corporation (f/k/a Raytheon CompanyTechnologies Corporation) (“Raytheon”RTX”) were each greater than 10 percentour largest customers, with Boeing generating 8.2% and Lockheed Martin Corporation (“Lockheed Martin”), Spirit AeroSystems Holdings, Inc. (“Spirit”), and United Technologies Corporation (“United Technologies”) each were greater than five percentRTX generating 16.8% of our 20172023 net revenues. Revenues from our top ten
10 customers, including Boeing Raytheon, Lockheed Martin, Spirit, and United Technologies,RTX, were 62%59% of total net revenues during 2017.2023. Net revenues by major customer for 20172023 and 20162022 were as follows:
Net revenues from our customers, except the U.S. Government, are diversified over a number of different military and space, commercial aerospace, industrial, medical and other products. For additional information on revenues from major customers, see Note 1816 to our consolidated financial statements included in Part IV, Item 15(a) of this Form 10-K.
RESEARCH AND DEVELOPMENT
We perform concurrent engineering with our customers and product development activities under our self-funded programs, as well as under contracts with others. Concurrent engineering and product development activities are performed for commercial, military and space applications.
RAW MATERIALS AND COMPONENTS
Raw materials and components used in the manufacturing of our products include aluminum, titanium, steel and carbon fibers, as well as a wide variety of electronic interconnect and circuit card assemblies and components. These raw materials are generally available from a number of suppliers and are generally in adequate supply. However, from time to time, and due to the lingering effects from the COVID-19 pandemic, we have experienced increases in lead times for and limited availability of various items including aluminum, titanium and certain other raw materials and/or components. Moreover, certain components, supplies and raw materials for our operations are purchased from single source suppliers and occasionally, directed by our customers. In such instances, we strive to develop alternative sources and design modifications to minimize the potential for business interruptions.
COMPETITION
The markets we serve are highly competitive, and our products and services are affected by varying degrees of competition. We compete worldwide with domestic and international companies in most markets. These companies may have competitive advantages as a result of greater financial resources, economies of scale and bundled products and services that we do not offer. Additional information related to competition is discussed in Risk Factors contained within Part I, Item 1A of this Form 10-K. Our ability to compete depends principally upon the breadth of our technical capabilities, the quality of our goods and services, competitive pricing, product performance, design and engineering capabilities, new product innovation, the ability to solve specific customer needs, and customer relationships.
PATENTS AND LICENSES
We have several patents, but we do not believe that our operations are dependent upon any single patent or group of patents. In general, we rely on technical superiority, continual product improvement, exclusive product features, superior lead time, on-time delivery performance, quality, and customer relationships to maintain our competitive advantage.
REMAINING PERFORMANCE OBLIGATIONS AND BACKLOG
We define backlogperformance obligations as customer placed purchase orders (“POs”) and long-term agreements (“LTAs”) with firm fixed price and firm delivery dates. The majority of the long-term agreements (“LTAs”) we enter into do not meet the definition of a contract under Accounting Standards Codification 606 (“ASC 606”) and thus, the backlog amount may or may not be greater than the remaining performance obligations amount as defined under ASC 606. Revenue based on remaining performance obligations is subject to delivery delays or program cancellations, which are beyond our control. Remaining performance obligations were $963.5
million at December 31, 2023. We anticipate recognizing an estimated 70% or $674.0 million of our remaining performance obligations during 2024.
We define backlog as potential revenue that is based on customer placed POs and LTAs with firm fixed price and expected delivery dates of 24 months or less. Backlog is subject to delivery delays or program cancellations, which are beyond our control. Backlog is affected by timing differences in the placement of customer orders, and tends to be concentrated in certainseveral programs and customers.to a greater extent, than our net revenues. As a result of these factors, trends in our overall level of backlog may not be indicative of trends in our future net revenues. Backlog was $726.5$993.6 million at December 31, 2017,2023, compared to $641.3$960.8 million at December 31, 2016.2022. The increase in backlog was primarily in the commercial aerospace and military and space end-use markets, partially offset by a decrease in the commercial aerospace end-use markets and the industrial end-use markets. $544.0 million of total backlog is expected to be delivered during 2018.
ENVIRONMENTAL MATTERS
Our business, operations and facilities are subject to numerous stringent federal, state and local environmental laws and regulations issued by government agencies, including the Environmental Protection Agency (“EPA”). Among other matters, these regulatory authorities impose requirements that regulate the emission, discharge, generation, management, transport and disposal of hazardous and non-hazardous materials, pollutants and contaminants. These regulations govern public and private response actions to hazardous or regulated substances that threaten to release,could be or have been released tointo the environment, or endanger human health, and they require us to obtain and maintain licenses and permits in connection with our operations. We may also be required to investigate and remediate the effects of the release or disposal of materials at sites associated with past and present operations. Additionally, this extensive regulatory framework imposes significant compliance burdens and risks on us. For example, California recently passed two wide-reaching bills that will impose significant and mandatory climate-related reporting requirements for large public and private companies doing business in the state. The bills will ultimately require annual disclosure of audited Scope 1, 2, and 3 greenhouse gas (“GHG”) emissions and biennial disclosure related to certain climate risks beginning in January 2026. We anticipate that capital expenditures will continue to be required for the foreseeable future to upgrade and maintain our environmental compliance efforts, however, we currently do not expect such expenditures to be material in 20182024 and the foreseeable future.near term.
Structural Systems has been directed by California environmental agencies to investigate and take corrective action for groundwater contamination at its facilities located in Adelanto (a.k.a., El Mirage) and Monrovia, California. Based on currently available information, we have accrued $1.5 million at December 31, 2023 for our estimated liabilities related to these sites. For further information, see Note 1715 in the accompanying notes to consolidated financial statements included in Part IV, Item 15(a) of this Form 10-K. In addition, see Risk Factors contained within Part I, Item 1A of this Form 10-K for certain risks related to environmental matters.
HUMAN CAPITAL
EMPLOYEESOur employees are critical to our success. We promote a culture of honesty, respect, trust, and teamwork through our Code of Business Conduct. Also, we have been engaged in a number of social matters and issues, both within the Company in our management of human capital, and externally with our community based initiatives.
Employee Safety and Health
The safety of our workforce remains our highest priority as evidenced by our response to the COVID-19 pandemic over the last four years. To this end, we continue to focus on protecting the health and safety of our employees and maintaining a safe work environment, including during the COVID-19 pandemic where we followed the COVID-19 safety guidelines provided by state and local governments and the Centers for Disease Control and Prevention at all of our facilities.
We implemented the use of employee health and safety key performance indicators (“KPIs”) that were regularly communicated to our employees by senior management to improve safety outcomes. In 2023, we continued to invest in infrastructure to improve internal safety protocols related to key processes and refined our health and safety software tools to track and engage our performance centers to further reduce our lost time and total recordable incident rates.
Diversity and Inclusion
Diversity and inclusion has been and will continue to be important to our success. As part of our continuing improvement in this area, we implemented diversity and inclusion initiatives in 2019 to help accelerate the process of developing diverse, and qualified talent and applicant pools. To that end, we are seeing an increase in the number of women and individuals from underrepresented communities being promoted on merit into leadership roles. In 2020, we partnered with the Fund II Foundation to utilize its innovative internX platform to provide access to highly qualified and diverse science, technology, engineering and math (“STEM”) students. We believe that broadening the diversity of our pool of potential qualified applicants at the intern level will support our efforts at a diverse workforce reflective of the population and help us continue to develop a more diverse leadership team as our interns continue in their careers.
Talent Acquisition, Retention, and Development
We attract, develop, and retain employee talent by offering competitive compensation packages and fostering a culture of care about their well-being. In addition, we endeavor to be a proactive corporate citizen by being responsive and supportive of the needs of our employees to attract qualified talent. We strive to provide equal opportunities for qualified members of underrepresented communities and women for advancement within our company and award merit-based scholarships to the children and grandchildren of our employees so that they may develop the skills that will support their entry into the workforce. In addition, in 2018, we implemented an Employee Stock Purchase Plan (“ESPP”) to provide employees the opportunity to share in the ownership of our company and benefit from our performance through the purchase of our company’s stock. The ESPP allows eligible employees to accumulate contributions through after-tax payroll deductions to purchase shares of our Company’s stock at a 15% discount and serves as one of the key retention mechanisms for our human capital.
Workforce Demographics
As of December 31, 2017,2023, we employed 2,600 people,had a highly skilled workforce of 2,265 employees, of which 360368 are subject to collective bargaining agreements expiring in April 2025 and June 20182024. However, the Monrovia, California performance center that employs 97 of our collective bargaining employees that are covered by an agreement expiring in June 2024 will be ceasing production and January 2019. Wethe facility will close by the middle of 2024. See Note 3 to our consolidated financial statements included in Part IV, Item 15(a) of this Form 10-K for further discussion. Historically, we have been successful in negotiating renewals to expiring agreements without material disruption of operating activities, and believe our relations with our employees are good. See Risk Factors contained within Part I, Item 1A of this Form 10-K for additional information regarding certain risks related to our employees.
AVAILABLE INFORMATION
General information about us can be obtained from our website address at www.ducommun.com. Our Annual Reports on Form 10-K, Quarterly Reports on Form 10-Q, Current Reports on Form 8-K, and amendments to those reports, if any, are available free of charge on our website as soon as reasonably practicable after they are filed with or furnished to the SEC. Information included inon our website is not incorporated by reference in this Annual Report on Form 10-K. The SEC also maintains a website at www.sec.gov that contains reports, proxy statements and other information regarding SEC registrants, including our company.
ITEM 1A. RISK FACTORS
Our business, financial condition, results of operations and cash flows may be affected by known and unknown risks, uncertainties and other factors. We have summarized below the significant, known material risks to our business. Additional risk factors not currently known to us or that we currently believe are immaterial may also impair our business, financial condition, results of operations and cash flows. Any of these risks, uncertainties and other factors could cause our future financial results to differ materially from recent financial results or from currently anticipated future financial results. The risk factors below should be considered together with the information included elsewhere in this Annual Report on Form 10-K (“Form 10-K”) as well as other required filings by us towith the SEC.
RISKS RELATED TO OUR CAPITAL STRUCTURE RISKS
Our indebtedness could limit our financing options, adversely affect our financial condition, and prevent us from fulfilling our debt obligations.
In July 2015,2022, we completed thea refinancing of our then existing debt by entering into a new term loan (“2022 Term Loan”) and a new revolving credit facility to replace the existing credit facilities. This credit facility consists of(“2022 Revolving Credit Facility”). The 2022 Term Loan is a $275.0$250.0 million senior secured term loan whichthat matures on June 26, 2020 (“Term Loan”), andin July 2027. The 2022 Revolving Credit Facility is a $200.0 million senior secured revolving credit facility (“that matures in July 2027. The 2022 Term Loan and 2022 Revolving Credit Facility”), which matures on June 26, 2020 (collectively,Facility, collectively are the “Creditnew credit facilities (“2022 Credit Facilities”). The terms of the 2022 Term Loan require us to make installment payments of 0.625% of the initial outstanding principal balance on a quarterly basis during years one and two, 1.250% during years three and four, and 1.875% during year five, on the last business day of each calendar quarter. In addition, the undrawn portion of the commitment of the 2022 Revolving Credit Facility is subject to a commitment fee ranging from 0.175% to 0.275%, based upon the consolidated total net adjusted leverage ratio.
At December 31, 2017,2023, we had a total of $218.1$266.0 million of outstanding long-term debt which was comprised of $160.0 million under the Term Loan and $58.1 million under the Revolving2022 Credit Facility.Facilities. The total long-term debt was primarily the result of our acquisitions, LaBarge Inc. in 2011 and LDSincluding Lightning Diversion Systems, LLC (“LDS”) in September 2017. There are no further required payments under the Credit Facilities until June 2020.2017, Certified Thermoplastics Co., LLC (“CTP”) in April 2018, Nobles Worldwide, Inc. (“Nobles”) in October 2019, and BLR Aerospace, L.L.C. (“BLR”) on April 25, 2023.
Our ability to obtain additional financing or complete a debt refinancing in the future may be limited, as discussed below in this risk factor. Welimited. Should we not have ready access to capital markets, we may have to undertake alternative financing plans, such as selling assets; reducing or delaying scheduled expansions, acquisitions and/or capital investments; or seeking various other forms of capital. Our ability to complete reasonable alternative financing plans may be affected by circumstances and economic events outside of our control. We cannot ensure that we would be able to refinance our debt or enter into alternative financing plans in adequate amounts on commercially reasonable terms, terms acceptable to us or at all, or that such plans guarantee that we would be able to meet our debt obligations.
Our level of debt could:
•limit our ability to obtain additional financing to fund future working capital, capital expenditures, investments or acquisitions or other general corporate requirements;
•require a substantial portion of our cash flows to be dedicated to debt service payments instead of other purposes, thereby reducing the amount of cash flows available for working capital, capital expenditures, investments or acquisitions or other general corporate purposes;
•increase our vulnerability to adverse changes in general economic, industry and competitive conditions;
•place us at a disadvantage compared to other, less leveraged competitors;
•expose us to the risk of increased borrowing costs and higherrising or high interest rates as approximately 40%a portion of our current borrowings under our 2022 Credit Facilities bear interest at variable rates (our interest rate swaps, with an aggregate total notional amount of $150.0 million and seven year tenor, became effective on January 1, 2024), which could further adversely impact our cash flows;
•limit our flexibility to plan for and react to changes in our business and the industry in which we compete;
•restrict us from making strategic acquisitions or causing us to make non-strategic divestitures;acquisitions;
•expose us to risk of unfavorable changes in the global credit markets; and
•make it more difficult for us to satisfy our obligations with respect to the 2022 Credit Facilities and our other debt.
The occurrence of any one of these events could have an adverse effect on our business, financial condition, results of operations and ability to satisfy our obligations in respect of our outstanding debt.
We require a considerable amount of cash to servicerun our indebtedness.business.
Our ability to make payments on our debt in the future and to fund planned capital expenditures and working capital needs, will depend upon our ability to generate significant cash in the future. Our ability to generate cash is subject to economic, financial, competitive, legislative, regulatory and other factors that may be beyond our control.
The terms of the 2022 Term Loan require us to make installment payments of 0.625% of the initial outstanding principal balance on a quarterly basis during years one and two, 1.250% during years three and four, and 1.875% during year five, on the last business day of each calendar quarter. In addition, the undrawn portion of the commitment of the 2022 Revolving Credit Facilities bear interest, at our option, atFacility is subject to a rate equal to either (i) the Eurodollar Rate (defined as a London Interbank Offered Rate [“LIBOR”]) plus an applicable margincommitment fee ranging from 1.50%0.175% to 2.75% per year or (ii) the Base Rate (defined as the highest of [a] Federal Funds Rate plus 0.50%0.275%, [b] Bank of America’s prime rate, and [c] the Eurodollar Rate plus 1.00%) plus an applicable margin ranging from 0.50% to 1.75% per year, in each case based upon the consolidated total net adjusted leverage ratio, typicallyratio.
On April 25, 2023, we acquired 100% of the outstanding equity interests of BLR for an initial purchase price of $115.0 million, net of cash acquired, all payable quarterly. in cash. We paid a gross aggregate of $117.0 million in cash upon the closing of the transaction. We utilized the 2022 Revolving Credit Facility to complete the acquisition. See Note 2 to our consolidated financial statements included in Part IV, Item 15(a) of this Form 10-K for further discussion.
In October 2015,July 2022, as a result of completing a refinancing of our existing debt, we were required to complete an amendment of all the forward interest rate swaps (“Amended Forward Interest Rate Swaps”) we entered into interestin November 2021 that were based on U.S. dollar-one month London Interbank Offered Rate (“LIBOR”) to be based on one month Term Secured Overnight Financing Rate (“SOFR”) as borrowings can only be based on SOFR. The Amended Forward Interest Rate Swaps, with an aggregate total notional amount of $150.0 million and all with a seven year tenor, became effective on January 1, 2024. The weighted average fixed rate cap hedges designated as cash flow hedges, with maturity dates of June 2020 and notional value in aggregate, totaling $135.0 million.the Amended Forward Interest Rate Swaps was 1.7%. At December 31, 2017,2023, the outstanding balance on the 2022 Credit Facilities was $218.1$266.0 million with an average interest rate of 3.73%7.53%. Should interest rates increase significantly, even though $135.0 million of our debt was hedged, our debt service cost on the variable portion of our debt will increase. Any inability to generate sufficient cash flow could have a material adverse effect on our financial condition or results of operations. See Note 1 and Note 9 to our consolidated financial statements included in Part IV, Item 15(a) of this Form 10-K for further discussion.
While we expect to meet all of our financial obligations, we cannot ensure that our business will generate sufficient cash flow from operations in an amount sufficient to enable us to pay our debt or to fund our other liquidity needs.
We require a considerable amount of cash to fund our anticipated voluntary principal prepayments on our Credit Facilities.
Our ability to continue to reduce the debt outstanding under our 2022 Credit Facilities through voluntary principal prepayments will be a contributing factor to our ability to meet the leverage ratio covenant and keepingkeep our interest rate towards the lower end of the interest rate range as defined in the 2022 Credit Facilities. Our ability to make such prepayments will depend upon our ability to generate significant cash in the future. We cannot ensure that our business will generate sufficient cash flow from operations to fund any such prepayments.
The covenants in theour credit agreement to our Credit Facilitiesfacilities impose restrictions that may limit our operating and financial flexibility.
We are required to comply with a leverage covenant as defined in the credit agreement to the2022 Credit Facilities. The leverage covenant is defined as Consolidated Funded Indebtedness less unrestricted cash and cash equivalents in excess of $10.0$5.0 million, divided by consolidated earnings before interest, taxes and depreciation and amortization (“EBITDA”). The leverage covenant decreases over the term of the Credit Facilities, which will require us to lower our outstanding debt or increase our EBITDA in the future. We believe the voluntary prepayments on the Credit Facilities will help reduce our leverage, as defined in the credit agreement. and other adjustments.
At December 31, 2017,2023, we were in compliance with the leverage covenant under the 2022 Credit Facility.Facilities. However, there is no assurance that we will continue to be in compliance with the leverage covenant in future periods.
Our credit agreement to theThe 2022 Credit FacilitiesFacilities’ agreements contains a number of significant restrictions and covenants that limit our ability, among other things, to incur additional indebtedness, to create liens, to make certain payments, to make certain investments, to engage in transactions with affiliates, to sell certain assets or enter into mergers.
These covenants could materially and adversely affect our ability to finance our future operations or capital needs. Furthermore, they may restrict our ability to expand, pursue our business strategies and otherwise conduct our business. Our ability to comply with these covenants may be affected by circumstances and events beyond our control, such as prevailing economic conditions and changes in regulations, and we cannot ensure that we will be able to comply with such covenants. These restrictions also limit our ability to obtain future financings to withstand a future downturn in our business or the economy in general.
A breach of any covenant in credit agreement to the 2022 Credit Facilities wouldcould result in a default under the 2022 Credit Facilities agreement.Facilities. A default, if not waived, could result in acceleration of the debt outstanding under the agreement. A default could permit our lenders to foreclose on any of our assets securing such debt. Even if new financing were available at that time, it may not be on terms or amounts that are acceptable to us or terms as favorable as our current agreements. If our debt is in default for any reason, our business, results of operations and financial condition could be materially and adversely affected.
The typical trading volume of our common stock may affect an investor’s ability to sell significant stock holdings in the future without negatively impacting stock price.
The level of trading activity may vary daily and typically represents only a small percentage of outstanding shares. As a result, a stockholder who sells a significant amount of shares in a short period of time could negatively affect our share price.
Our amount of debt may require us to raise additional capital to fund operations.acquisitions.
We may sell additional shares of common stock or other equity securities to raise capital in the future, which could dilute the value of an investor’s holdings.
BUSINESS AND OPERATIONAL RISKS RELATED TO OUR BUSINESS
Our end-use markets are cyclical.
We sell our products into aerospace, defense, and industrial end-use markets, which are cyclical and have experienced periodic declines. Our sales are, therefore, unpredictable and may tend to fluctuate based on a number of factors, including global economic conditions, U.S. defense budgetary spending, geopolitical developments and conditions, pandemics, supply chain shortages, rising or high interest rates and other developments affecting our end-use markets and the customers served. Consequently, results of operations in any period should not be considered indicative of the operating results that may be experienced in any future period.
We depend upon a selectedselect base of industries and customers, which subjects us to unique risks which may adversely affect us.
We currently generate athe majority of our revenues from customers in the aerospace and defense industry. Our business depends, in part, on the level of new military and commercial aircraft orders. As a result, we have significant sales to certain
customers. Sales to theThe Boeing Company and(“Boeing”), Spirit AeroSystems Holdings, Inc. (“Spirit”), and Viasat, Inc. (“Viasat”) comprise the majoritya significant portion of our commercial aerospace end-use market.market in 2023. A significant portion of our net sales in our military and space end-use markets are made under subcontracts with OEMs,original equipment manufacturers (“OEMs”), under their prime contracts with the U. S. Government. We had significant sales to Lockheed MartinGeneral Dynamics Corporation (“GD”), Northrop Grumman Corporation (“Northrop”), and RTX Corporation (f/k/a Raytheon Company, and United Technologies CorporationCorporation) (“RTX”) in 20172023 in our defense technologies end-use market.
Our customers may experience delays in the launch and certification of new products, labor strikes, diminished liquidity or credit unavailability, weak demand for their products, or other difficulties in their business. In addition, sequestration and a shiftshifts in government spending priorities have caused and may continue to cause additional uncertainty in the placement of orders.
Our sales torevenues from our top ten customers, which represented 62%59% of our total 20172023 net revenues, were diversified over a number of different aerospace and defense and Industrial products. Any significant change in production rates by these customers would have a material effect on our results of operations and cash flows. There is no assurance that our current significant customers will continue to buy products from us at current levels, or that we will retain any or all of our existing customers, or that we will be able to form new relationships with customers upon the loss of one or more of our existing customers. This risk may be further complicated by pricing pressures, intense competition prevalent in our industry and other factors. A significant reduction in sales to any of our major customers, the loss of a major customer, or a default of a major customer on accounts receivable could have a material adverse impact on our financial results.
In addition, weBoeing was one of our largest customers in 2023, and the 737 MAX was one of our highest commercial end use market revenue platforms. While Boeing has received approval from all the major civil aviation regulators around the world for its 737 MAX to return to service, our production rates are still below pre-COVID-19 pandemic levels. Further, as noted earlier, in early January 2024, the FAA initiated an investigation into Boeing’s quality control system. This was followed by the FAA announcing actions to increase its oversight of Boeing as well as not approving production rate increases or additional production lines for the 737 MAX until it is satisfied that Boeing is in full compliance with required quality control procedures. Revenue growth with our other commercial customers, including Airbus SE (“Airbus”), and continued solid demand from defense OEMs (also known as prime contractors) have helped to mitigate a significant portion of this risk for the time being. However, the residual effects of the COVID-19 pandemic along with inflationary forces, supply chain issues, and rising or high interest rates continues to dampen civil air travel demand in various segments and markets, and if traveler demand does not return in the near future, it may make it difficult to continue to offset a significant portion of this risk.
We generally make sales under purchase orders and contracts that are subject to cancellation, modification or rescheduling. Changes in the economic environment and the financial condition of the industries we serve could result in customer cancellation of contractual orders or requests for rescheduling. Some of our contracts have specific provisions relating to schedule and performance, and failure to deliver in accordance with such provisions could result in cancellations, modifications, rescheduling and/or penalties, in some cases at the customers’ convenience and without prior notice. While we have normally recovered our direct and indirect costs plus profit, such cancellations, modifications, or rescheduling that cannot be replaced in a timely fashion, could have a material adverse effect on our financial results.
A significant portion of our business depends upon U.S. Government defense spending.
We derive a significant portion of our business from customers whose principal sales are to the U.S. Government and from direct sales by us to the U.S. Government. Accordingly, the success of our business depends upon government spending
generally or for specific departments or agencies in particular. Such spending, among other factors, is subject to the uncertainties of governmental appropriations and national defense policies and priorities, constraints of the budgetary process, timing and potential changes in these policies and priorities, and the adoption of new laws or regulations or changes to existing laws or regulations.
These and other factors could cause the government and government agencies, or prime contractors that use us as a subcontractor, to reduce their purchases under existing contracts, to exercise their rights to terminate contracts at-willfor convenience or to abstain from exercising options to renew contracts, any of which could have a material adverse effect on our business, financial condition and results of operations.
Further, the levels of U.S. Department of Defense (“U.S. DoD”) spending in future periods are difficult to predict and are impacted by numerous factors such as the political environment, U.S. foreign policy, macroeconomic conditions and the ability of the U.S. Government to enact relevant legislation such as the authorization and appropriations bills. The Budget ControlFor instance, the U.S. government is currently operating under a continuing resolution (“CR”) to keep the government funded while the Congress works to enact full year fiscal year 2024 (“FY24”) appropriation bills. Under the Fiscal Responsibility Act (“2011 Act”) establishedof 2023, which imposes limits on U.S. government discretionary spending includingfor defense and non-defense programs in exchange for the lifting of the debt ceiling in June 2023, if Congress fails to enact all appropriation bills by April 30, 2024, then the budget caps will be reduced and corresponding automatic reductions to agency budget accounts will be enforced through sequestration which could have a reduction
material effect on our results of operations, financial position, and/or cash flows. Further, there continues to be uncertainty with respect to future program-level appropriations for the 2012U.S. DoD and 2021 U.S. Governmentother government agencies for fiscal years.year 2025 and beyond. Accordingly, long-term uncertainty remains with respect to overall levels of defense spending and it is likely that U.S. Government discretionary spending levels will continue to be subject to pressure.
WeExports of certain of our products and our production facility in Guaymas, Mexico are subject to extensive regulationvarious export control regulations and audit byauthorizations, and we may not be successful in obtaining the Defense Contract Audit Agency.
The accuracy and appropriateness of certain costs and expenses used to substantiate our direct and indirect costs for thenecessary U.S. Government contractsapprovals and related export licenses for proposed sales to certain foreign customers.
We must comply with numerous laws and regulations relating to the export of some of our products before we are subjectpermitted to extensive regulationsell or manufacture those products outside the United States. Compliance often entails the submission and audit by the Defense Contract Audit Agency, an armtimely receipt of the U.S. DoD. Such audits and reviews could result in adjustments to our contract costs and profitability. However, we cannot ensure the outcome of any future audits and adjustments may be required to reduce net salesnecessary export approvals, licenses, or profits upon completion and final negotiation of audits. If any audit or review were to uncover inaccurate costs or improper activities, we could be subject to penalties and sanctions, including termination of contracts, forfeiture of profits, suspension of payments, fines and suspension or prohibitionauthorizations from conducting future business with the U.S. Government. Over the last several years, the U.S. export licensing environment for munitions has been adversely affected by a number of factors, including, but not limited to, the changing geopolitical environment and heightened tensions with other countries (which shift and evolve over time). Accordingly, we can give no assurance that we will be successful in obtaining, in a timely manner or at all, the approvals, licenses or authorizations we need to sell or manufacture our products outside the United States, which may result in the cancellation of orders and significant penalties to our customers if we do not make deliveries and fulfill our contractual commitments. Any such outcomesignificant delay in, or impairment of, our ability to sell products outside of the United States could have a material adverse effect on our business, financial results.
We are subject to a numbercondition and results of procurement laws and regulations. Our business and our reputation could be adversely affected if we fail to comply with these laws.
We must comply with and are affected by laws and regulations relating to the award, administration and performance of U.S. Government contracts. Government contract laws and regulations affect how we do business with our customers and impose certain risks and costs on our business. A violation of specific laws and regulations, by us, our employees, others working on our behalf, a supplier or a venture partner, could harm our reputation and result in the imposition of fines and penalties, the termination of our contracts, suspension or debarment from bidding on or being awarded contracts, loss of our ability to export products or services and civil or criminal investigations or proceedings.
In some instances, these laws and regulations impose terms or rights that are different from those typically found in commercial transactions. For example, the U.S. Government may terminate any of our government contracts and subcontracts either at its convenience or for default based on our performance. Upon termination for convenience of a fixed-price type contract, we normally are entitled to receive the purchase price for delivered items, reimbursement for allowable costs for work-in-process and an allowance for profit on the contract or adjustment for loss if completion of performance would have resulted in a loss.operations.
Contracts with some of our customers, including Federal government contracts, contain provisions which give our customers a variety of rights that are unfavorable to us and the OEMs to whom we provide products and services, including the ability to terminate a contract at any time for convenience.
Contracts with some of our customers, including Federal government contracts, contain provisions and are subject to laws and regulations that provide rights and remedies not typically found in commercial contracts. These provisions may allow our customers to:
•terminate existing contracts, in whole or in part, for convenience, as well as for default, or if funds for contract performance for any subsequent year become unavailable;
•terminate existing contracts if we are suspended or debarred from doing business with the federal government or with a governmental agency;
•prohibit future procurement awards with a particular agency as a result of a finding of an organizational conflict of interest based upon prior related work performed for the agency that would give a contractor an unfair advantage over competing contractors; and
•claim rights in products and systems produced by us; and
control or prohibit the export of the products and related services we offer.us.
If the U.S. Government terminates a contract for convenience, the counterparty with whom we have contracted on a subcontract may terminate its contract with us. As a result of any such termination, whether on a direct government contract or subcontract, we may recover only our incurred or committed costs, settlement expenses and profit on work completed prior to the termination. If the U.S. Government terminates a direct contract with us for default, we may not even recover those amounts and instead may be liable for excess costs incurred by the U.S. Government in procuring undelivered items and services from another source.
In addition, the U.S. Government is typically required to open all programs to competitive bidding and, therefore, may not automatically renew any of its prime contracts. If one or more of our customers’ government prime or subcontracts is terminated or canceled, our failure to replace sales generated from such contracts would result in lower sales and could have an adverse effect on our business, results of operations and financial condition.
Further consolidation in the aerospace industry could adversely affect our business and financial results.
The aerospace and defense industry is experiencing significant consolidation, including our customers, competitors and suppliers. Consolidation among our customers may result in delays in the awarding of new contracts and losses of existing business. Consolidation among our competitors may result in larger competitors with greater resources and market share, which could adversely affect our ability to compete successfully. Consolidation among our suppliers may result in fewer sources of supply and increased cost to us.
Our growth strategy includes evaluating selected acquisitions, which entails certain risks to our business and financial performance.
We have historically achieved a portion of our growth through acquisitions and expect to evaluate selected future acquisitions as part of our strategy for growth. Any acquisition of another business entails risks and it is possible that we willmay not realize the expected benefits from an acquisition or that an acquisition willcould adversely affect our existing operations. Acquisitions entail certain risks, including:
•difficulty in integrating the operations and personnel of the acquired company within our existing operations or in maintaining uniform standards;
•loss of key employees or customers of the acquired company;
•the failure to achieve anticipated synergies;
•unrecorded liabilities of acquired companies that we fail to discover during our due diligence investigations or that are not subject to indemnification or reimbursement by the seller; and
•management and other personnel having their time and resources diverted to evaluate, negotiate and integrate acquisitions.
We may not be successful in achieving expected operating efficiencies and sustaining or improving operating expense reductions, and may experience business disruptions associated with restructuring, facilityperformance center consolidations, realignment, cost reduction, and other strategic initiatives.
Over the past year,In recent years, we have implemented a number of restructuring, realignment, and cost reduction initiatives, including facilityperformance center consolidations, organizational realignments, and reductions in our workforce. While we have realized some efficiencies from these actions, we may not realize the benefits of these initiatives to the extent we anticipated. Further, such benefits may be realized later than expected, and the ongoing difficulties in implementing these measures may be greater than anticipated, which could cause us to incur additional costs or result in business disruptions. In addition, if these measures are not successful or sustainable, we may have to undertake additional realignment and cost reduction efforts, which could result in significant additional charges. Moreover, if our restructuring and realignment efforts prove ineffective, our ability to achieve our other strategic and business plan goals may be adversely affected.
We rely on our suppliers to meet the quality and delivery expectations of our customers.
Our ability to deliver our products and services on schedule and to satisfy specific quality levels is dependent upon a variety of factors, including execution of internal performance plans, availability of raw materials, internal and supplier produced parts and structures, conversion of raw materials into parts and assemblies, and performance of suppliers and others.
We rely on numerous third-party suppliers for raw materials and a large proportion of the components used in our production process. Certain of these raw materials and components are available only from single sources or a limited number of suppliers,
or similarly, customers’ specifications may require us to obtain raw materials and/or components from a single source or certain suppliers. Many of our suppliers are small companies with limited financial resources and manufacturing capabilities. We do not currently have the ability to manufacture these components ourselves. These and other factors, including the loss of a critical supplier or raw materials and/or component shortages, could cause disruptions or cost inefficiencies in our operations compared to our competitors that have greater direct purchasing power, which could have a material adverse effect on our financial results.
We use estimates when bidding on fixed-price contracts. Changes in our estimates could adversely affect our financial results.
We enter into contracts providing for a firm, fixed-price for the sale of some of our products regardless of the production costs incurred by us. In many cases, we make multi-year firm, fixed-price commitments to our customers, without assurance that our anticipated production costs will be achieved. Contract bidding and accounting require judgment relative to assessing risks, estimating contract net sales and costs, including estimating cost increases over time and efficiencies to be gained, and making assumptions for supplier sourcing and quality, manufacturing scheduling and technical issues over the life of the contract. Such assumptions can be particularly difficult to estimate for contracts with new customers. Our failure to accurately estimate these costs can result in reduced profits or incurred losses. Due to the significance of the judgments and estimates involved, it is possible that materially different amounts could be obtained if different assumptions were used or if the underlying circumstances were to change. Therefore, any changes in our underlying assumptions, circumstances or estimates could have a material adverse effect on our financial results. For example, in the third quarter of 2015, we recorded a charge in the Structural Systems segment related to a regional jet program for estimated cost overruns of $10.0 million. See “Provision for Estimated Losses on Contracts” in Note 1 to our consolidated financial statements included in Part IV, Item 15(a) of this Form 10-K for further information.impacted.
As we move up the value chain to become a Tier Twomore value added supplier, enhanced design, product development, manufacturing, supply chain project management and other skills will be required.
We may encounter difficulties as we execute our growth strategy to move up the value chain to become a Tier Twomore value added supplier of more complex value-added assemblies. Difficulties we may encounter include, but are not limited to, the need for enhanced and expanded product design skills, enhanced ability to control and influence our suppliers, enhanced quality control systems and infrastructure, enhanced large-scale project management skills, and expanded industry certifications. Assuming incremental project design responsibilities would require us to assume additional risk in developing cost estimates and could expose us to increased risk of losses. There can be no assurance that we will be successful in obtaining the enhanced skills required to be a Tier Two suppliermove up the value chain or that our customers will outsource such functions to us.
Risks associated with operating and conducting our business outside the United States could adversely impact us.
We have a manufacturing facilitiesfacility that we lease in Thailand and Mexico and also derive a portion of our net revenues from direct foreign sales. Further, our customers may derive portions of their revenues from non-U.S. customers. As a result, we are subject to the risks of conducting and operating our business internationally, including:
��political instability;
•economic and geopolitical developments and conditions;
•pandemics and disasters, natural or otherwise;
•compliance with a variety of international laws, as well as U.S. laws affecting the activities of U.S. companies conducting business abroad, including, but not limited to, the Foreign Corrupt Practices Act;
•imposition of taxes, export controls,control approvals or licenses, tariffs, embargoes and other trade restrictions;
•difficulties repatriating funds or restrictions on cash transfers; and
•potential for new tariffs imposed on imports by the new U.S. administration.
While the impact of these factors is difficult to predict, we believe any one or more of these factors could have a material adverse effect on our financial results.
Goodwill and/or other assets could be impaired in the future, which could result in substantial charges.
Goodwill is tested for impairment on an annual basis during our fourth quarter or more frequently if events or circumstances occur which could indicate potential impairment. For example, our annual goodwill impairment testing in the fourth quarter of 2015 indicated the Structural Systems reporting unit’s carrying value exceeded its fair value as a result of the lowered revenues and cash flows outlook in our military and space end-use markets due to the decrease in U.S. government defense spending and
thus, requiring us to perform Step Two of the goodwill impairment test. Based on the Step Two test, we impaired the entire goodwill for the Structural Systems reporting unit of $57.2 million in 2015.
We also test intangible assets with indefinite life periods for potential impairment annually and on an interim basis if there are indicators of potential impairment. For example, in performing our annual impairment test in the fourth quarter of 2015, we concluded the fair value of the indefinite-lived trade name to be zero as a result of divesting businesses in Electronic Systems and our discontinuation of the use of the trade name. Thus, we recorded an impairment of $32.9 million, which was the remaining carrying value of the trade name.
In addition, we evaluate amortizable intangible assets, fixed assets, and production cost of contracts for impairment if there are indicators of a potential impairment.
In assessing the recoverability of goodwill, management is required to make certain critical estimates and assumptions. These estimates and assumptions include projected sales levels, including the addition of new customers, programs or platforms and increased content on existing programs or platforms, improvements in manufacturing efficiency, and reductions in operating costs. Due to many variables inherent in the estimation of a business’s fair value and the relative size of our recorded goodwill, differences in estimates and assumptions may have a material effect on the results of our impairment analysis. If any of these or other estimates and assumptions are not realized in the future, or if market multiples decline, we may be required to record an additional impairment charge for goodwill.
Further, additional impairment charges may be incurred against other intangible assets or long-term assets if asset utilization declines, customer demand declines or other circumstances indicate that the asset carrying value may not be recoverable.
Our production cost of contracts as of December 31, 2017 was $11.2 million or 2% of total assets. Our goodwill and other intangible assets as of December 31, 2017 were $232.1 million, or 41% of total assets. See “Goodwill and Indefinite-Lived Intangible Assets” and “Production Cost of Contracts” in Note 8 of our consolidated financial statements included in Part IV, Item 15(a) of this Form 10-K for further information.
OTHER RISKS
Our operations are subject to numerous extensive, complex, costly and evolving laws, regulations and restrictions, and failure to comply with these laws, regulations and restrictions could subject us to penalties and sanctions that could harm our business.
Prime contracts with various agencies of the U.S. Government, and subcontracts with other prime contractors, are subject to numerous laws and regulations which affect how we do business with our customers and may impose added costs to our business. As a result, our contracts and operations are subject to numerous, extensive, complex, costly and evolving laws, regulations and restrictions, principally by the U.S. Government or their agencies. These laws, regulations and restrictions govern items including, but not limited to, the formation, administration and performance of U.S. Government contracts, disclosure of cost and pricing data, civil penalties for violations or false claims to the U.S. Government for payment, define reimbursable costs, establish ethical standards for the procurement process and control the import and export of defense articles and services.
Noncompliance could expose us to liability for penalties, including termination of our U.S. Government contracts and subcontracts, disqualification from bidding on future U.S. Government contracts and subcontracts, suspension or debarment from U.S. Government contracting and various other fines and penalties. Noncompliance found by any one agency could result in fines, penalties, debarment or suspension from receiving additional contracts with all U.S. Government agencies. Given our dependence on U.S. Government business, suspension or debarment could have a material adverse effect on our financial results.
In addition, the U.S. Government may revise its procurement practices or adopt new contract rules and regulations, at any time, including increased usage of fixed-price contracts and procurement reform. Such changes could impair our ability to obtain new contracts or subcontracts or renew contracts or subcontracts under which we currently perform when those contracts are put up for competitive bidding. Any new contracting methods could be costly or administratively difficult for us to implement and could adversely affect our future net revenues.
In addition, our international operations subject us to numerous U.S. and foreign laws and regulations, including, without limitation, regulations relating to import-export control, technology transfer restrictions, repatriation of earnings, exchange controls, the Foreign Corrupt Practices Act and the anti-boycott provisions of the U.S. Export Administration Act. Changes in regulations or political environments may affect our ability to conduct business in foreign markets including investment, procurement and repatriation of earnings. Failure by us or our sales representatives or consultants to comply with these laws
and regulations could result in certain liabilities and could possibly result in suspension or debarment from government contracts or suspension of our export privileges, which could have a material adverse effect on our financial results.
Customer pricing pressures could reduce the demand and/or price for our products and services.
The markets we serve are highly competitive and price sensitive. We compete worldwide with a number of domestic and international companies that have substantially greater manufacturing, purchasing, marketing and financial resources than we do. Many of our customers have the in-house capability to fulfill their manufacturing requirements. Our larger competitors may be able to compete more effectively for very large-scale contracts than we can by providing different or greater capabilities or benefits such as technical qualifications, past performance on large-scale contracts, geographic presence, price and availability of key professional personnel. If we are unable to successfully compete for new business, our net revenues growth and operating margins may decline.
SeveralSome of our major customers have completed extensive cost containment efforts and we expect continued pricing pressures in 20182024 and beyond. Competitive pricing pressures may have an adverse effect on our financial condition and operating results. Further, there can be no assurance that competition from existing or potential competitors in other segments of our business will not have a material adverse effect on our financial results. If we do not continue to compete effectively and win contracts, our future business, financial condition, results of operations and our ability to meet our financial obligations may be materially compromised.
Our products and processes are subject to risk of obsolescence as a result of changes in technology and evolving industry and regulatory standards.
The future success of our business depends in large part upon our and our customers’ ability to maintain and enhance technological capabilities, develop and market manufacturing services that meet changing customer needs and successfully anticipate or respond to technological advances in manufacturing processes such as the incorporation of artificial intelligence and other disruptive technologies on a cost-effective and timely basis, while meeting evolving industry and regulatory standards. To address these risks, we invest in product design and development, and incur related capital expenditures. There can be no guarantee that our product design and development efforts will be successful, or that funds required to be invested in product design and development or incurred as capital expenditures will not increase materially in the future.
We may not have the ability to renew facilities leases on terms favorable to us and relocation of operations presents risks due to business interruption.
Certain of our manufacturing facilities and offices are leased and have lease terms that expire between 2024 and 2032. The majority of these leases provide renewal options at the fair market rental rate at the time of renewal, which, if renewed, could be significantly higher than our current rental rates. We may be unable to offset these cost increases by charging more for our products and services. Furthermore, continued economic conditions may continue to negatively impact and create greater pressure in the commercial real estate market, causing higher incidences of landlord default and/or lender foreclosure of properties, including properties occupied by us. While we maintain certain non-disturbance rights in most cases, it is not certain that such rights will in all cases be upheld and our continued right of occupancy in such instances could be potentially jeopardized. An occurrence of any of these events could have a material adverse effect on our financial results.
Additionally, if we choose to move any of our operations, those operations may be subject to additional relocation costs and associated risks of business interruption.
LEGAL, REGULATORY, TAX, AND ACCOUNTING RISKS
We are subject to extensive regulation and audit by the Defense Contract Audit Agency.
The accuracy and appropriateness of certain costs and expenses used to substantiate our direct and indirect costs for the U.S. Government contracts are subject to extensive regulation and audit by the Defense Contract Audit Agency, an arm of the U.S. DoD. Such audits and reviews could result in adjustments to our contract costs and profitability. However, we cannot ensure the outcome of any future audits and adjustments may be required to reduce net sales or profits upon completion and final negotiation of audits. If any audit or review were to uncover inaccurate costs or improper activities, we could be subject to penalties and sanctions, including termination of contracts, forfeiture of profits, suspension of payments, fines and suspension or prohibition from conducting future business with the U.S. Government. Any such outcome could have a material adverse effect on our financial results.
We are subject to a number of procurement laws and regulations. Our business and our reputation could be adversely affected if we fail to comply with these laws.
We must comply with and are affected by laws and regulations relating to the award, administration and performance of U.S. Government contracts. Government contract laws and regulations affect how we do business with our customers and impose certain risks and costs on our business. A violation of specific laws and regulations, by us, our employees, or others working on our behalf, such as a supplier or a venture partner, could harm our reputation and result in the imposition of fines and penalties, the termination of our contracts, suspension or debarment from bidding on or being awarded contracts, loss of our ability to export products or services and civil or criminal investigations or proceedings.
In some instances, these laws and regulations impose terms or rights that are different from those typically found in commercial transactions. For example, the U.S. Government may terminate any of our customers’ government contracts and subcontracts either at its convenience or for default based on our performance. Upon termination for convenience of a fixed-price type contract, we normally are entitled to receive the purchase price for delivered items, reimbursement for allowable costs for work-in-process and an allowance for profit on the contract or adjustment for loss if completion of performance would have resulted in a loss.
Our operations are subject to numerous extensive, complex, costly and evolving laws, regulations and restrictions, including cybersecurity requirements, and failure to comply with these laws, regulations and restrictions could subject us to penalties and sanctions that could harm our business.
Prime contracts with our major customers that have contracts with various agencies of the U.S. Government are subject to numerous laws, regulations and certifications, which affect how we do business with our customers and may impose added costs to our business. As a result, our contracts and operations are subject to numerous extensive, complex, costly and evolving laws, regulations and restrictions, principally by the U.S. Government or their agencies. These laws, regulations and restrictions govern items including, but not limited to, the formation, administration and performance of U.S. Government contracts, disclosure of cost and pricing data, civil penalties for violations of false claims to the U.S. Government for payment, defining reimbursable costs, establishing ethical standards for the procurement process, controlling the import and export of defense articles and services, and cybersecurity requirements, such as Cybersecurity Maturity Model Certification (“CMMC”).
Noncompliance could expose us to liability for penalties, including termination of our contracts and subcontracts, disqualification from bidding on future U.S. Government contracts and subcontracts, suspension or debarment from U.S. Government contracting and various other fines and penalties. Noncompliance found by any one agency could result in fines, penalties, debarment or suspension from receiving additional contracts with all U.S. Government agencies. Given our dependence on U.S. Government business, suspension or debarment could have a material adverse effect on our financial results.
In addition, the U.S. Government may revise its procurement practices or adopt new contract rules and regulations at any time, including increased usage of fixed-price contracts, procurement reform, and compliance with cybersecurity requirements. Such changes could impair our ability to obtain new contracts or subcontracts or renew contracts or subcontracts under which we currently perform when those contracts are put up for competitive bidding. Any new contracting methods could be costly or administratively difficult for us to implement and could adversely affect our future net revenues.
In addition, our international operations subject us to numerous U.S. and foreign laws and regulations, including, without limitation, regulations relating to import-export control, technology transfer restrictions, repatriation of earnings, exchange controls, the Foreign Corrupt Practices Act, and the anti-boycott provisions of the U.S. Export Administration Act. Changes in regulations or political environments may affect our ability to conduct business in foreign markets including investment, procurement and repatriation of earnings. Failure by us or our sales representatives or consultants to comply with these laws and regulations could result in certain liabilities and could possibly result in suspension or debarment from government contracts or suspension of our export privileges, which could have a material adverse effect on our financial results.
Environmental liabilities could adversely affect our financial results.
We are subject to various federal, local, and foreign environmental laws and regulations, including those relating to the use, storage, transport, discharge and disposal of hazardous and non-hazardous chemicals and materials used and emissions generated during our manufacturing process. We do not carry insurance for these potential environmental liabilities. Any failure by us to comply with present or future regulations could subject us to future liabilities or the suspension of production, which could have a material adverse effect on our financial results. Moreover, some environmental laws relating to contaminated sites can impose joint and several liability retroactively regardless of fault or the legality of the activities giving rise to the contamination. Compliance with existing or future environmental laws and regulations may require extensive capital expenditures, increase our cost or impact our production capabilities. Even if such expenditures are made, there can be no assurance that we will be able to comply. We have been directed to investigate and take corrective action for groundwater
contamination at certain sites. Oursites and our ultimate liability for such matters will depend upon a number of factors. See Note 1715 to our consolidated financial statements included in Part IV, Item 15(a) of this Form 10-K for further information.
Cyber securityWe may be subject to litigation, other legal proceedings and indemnity claims, and, if any of these are resolved adversely against us in amounts that exceed the limits of our insurance coverage, it could have a material adverse effect on our business, financial condition, and results of operations.
From time to time, we and our subsidiaries are involved in various legal and other proceedings that are incidental to the conduct of our business. Any litigation, other legal proceedings or indemnity claims could result in an unfavorable judgment that may not be reversed upon appeal or in payments of substantial monetary damages or fines that may exceed our insurance coverage limits, or we may decide to settle on similarly unfavorable terms, any of which could adversely affect our business, financial condition, and results of operations. We could also suffer an adverse impact on our reputation and a diversion of management’s attention and resources, which could have a material adverse effect on our business, financial condition, and results of operations. See Note 13and Note 15 to our consolidated financial statements included in Part IV, Item 15(a) of this Form 10-K for further information.
Product liability claims in excess of insurance could adversely affect our financial results and financial condition.
We face potential liability for property damage, personal injury, or death as a result of the failure of products designed or manufactured by us. Although we currently maintain product liability insurance (including aircraft product liability insurance), any material product liability not covered by insurance could have a material adverse effect on our financial condition, results of operations and cash flows.
We use estimates when bidding on fixed-price contracts. Changes in our estimates could adversely affect our financial results.
We enter into contracts providing for a firm, fixed-price for the sale of a majority of our products, regardless of the production costs incurred by us. In many cases, we make multi-year firm, fixed-price commitments to our customers, without assurance that our anticipated production costs will be achieved. Contract bidding and accounting require judgment relative to assessing risks, estimating contract net sales and costs, including estimating cost increases over time and efficiencies to be gained, and making assumptions for supplier sourcing and quality, manufacturing scheduling and technical issues over the life of the contract. Such assumptions can be particularly difficult to estimate for contracts with new customers. Inaccurate estimates of these costs could result in reduced profits or incurred losses. Due to the significance of the judgments and estimates involved, it is possible that materially different amounts could be obtained if different assumptions were used or if the underlying circumstances were to change. Therefore, any changes in our underlying assumptions, circumstances or estimates could have a material adverse effect on our financial results.
Goodwill and/or other assets could be impaired in the future, which could result in substantial charges.
Goodwill is tested for impairment on an annual basis as of the first day of our fourth quarter or more frequently if events or circumstances occur which could indicate potential impairment. In assessing the recoverability of goodwill, management is required to make certain critical estimates and assumptions. These estimates and assumptions include projected sales levels, including the addition of new customers, programs or platforms and increased content on existing programs or platforms, improvements in manufacturing efficiency, and reductions in operating costs. Due to many variables inherent in the estimation of a business’s fair value and the relative size of our recorded goodwill, changes in estimates and assumptions may have a material effect on the results of our impairment analysis. If any of these or other estimates and assumptions are not realized in the future, or if market multiples decline, we may be required to record an impairment charge for goodwill.
We also test intangible assets with indefinite life periods for potential impairment annually and on an interim basis if there are indicators of potential impairment.
In addition, we evaluate amortizable intangible assets, fixed assets, production cost of contracts, and lease right-of-use assets for impairment if there are indicators of a potential impairment.
Further, impairment charges may be incurred against other intangible assets or long-term assets if asset utilization declines, customer demand declines or other circumstances indicate that the asset carrying value may not be recoverable.
Our goodwill and other intangible assets as of December 31, 2023 were $410.9 million, or 37% of total assets. If our goodwill and/or other assets are impaired, it could have an adverse effect on our results of operations and financial condition. See “Goodwill and Other Intangible Assets” in Note 7 of our consolidated financial statements included in Part IV, Item 15(a) of this Form 10-K for further information.
We expect to face increased costs and resources to comply with the new SEC cybersecurity rule.
The SEC recently adopted a rule, “Cybersecurity Risk Management, Strategy, Governance, and Incident Disclosure,” that enhances and standardizes disclosures regarding cybersecurity risk management and governance, as well as material cybersecurity incidents. Under this new rule, public companies are now required to make annual disclosures describing their processes for identifying and managing material cybersecurity risks, management’s role in assessing and managing such risks, and the Board of Directors’ oversight of cybersecurity risks. Companies also must disclose in a Form 8-K, the nature, scope, and timing of any material cybersecurity incidents identified and the material impact or reasonably likely material impact on the company within four business days of determining a cybersecurity incident is material. We expect to face increased costs to comply with this new SEC cybersecurity rule, including increased costs for cybersecurity training, staffing, and management. In addition, the requirement to report cybersecurity incidents within such a short timeframe could mean there may not be sufficient time to halt a breach before having to report it, potentially giving the hackers an advantage.
Unanticipated changes in our tax provision or exposure to additional income tax liabilities could affect our profitability.
Significant judgment is required in determining our provision for income taxes. In the ordinary course of our business, there are transactions and calculations where the ultimate tax determination is uncertain. Furthermore, changes in income tax laws and regulations, or their interpretation, could result in higher or lower income tax rates assessed or changes in the taxability of certain sales or the deductibility of certain expenses, thereby affecting our income tax expense and profitability. In addition, we are regularly under audit by tax authorities. The final determination of tax audits and any related litigation could be materially different from our historical income tax provisions and accruals.
Management has identified a material weakness in our internal control over financial reporting which could, if not remediated, adversely impact the reliability of our financial reports, cause us to submit our financial reports in an untimely fashion, result in material misstatements in our financial statements and cause current and potential stockholders to lose confidence in our financial reporting, which in turn could adversely affect the trading price of our stock.
We have concluded that there is a material weakness in our internal control over financial reporting as we did not design and maintain effective controls over the accuracy of contract terms and the reasonableness of gross margin assumptions used to recognize revenue. Specifically, we did not verify that amendments to purchase orders and gross margin percentage assumptions used in the Company’s revenue recognition analysis were properly reviewed at a sufficient level of precision. The material weakness resulted in immaterial adjustments to net revenues and contract assets as of and for the quarterly and annual periods ending December 31, 2023. Additionally, until remediated, this material weakness could result in future misstatements of net revenues and contract assets that would result in a material misstatement to the annual or interim consolidated financial statements that would not be prevented or detected. Thus, management has determined that our disclosure controls and procedures and internal control over financial reporting were not effective as of December 31, 2023.
Under standards established by the Public Company Accounting Oversight Board (“PCAOB”), a material weakness is a deficiency, or combination of deficiencies, in internal control over financial reporting, such that there is a reasonable possibility that a material misstatement of our annual or interim financial statements will not be prevented or detected and corrected on a timely basis. The existence of this issue could adversely affect us, our reputation or investor perceptions of us. We have and will continue to take additional measures to remediate the underlying causes of the material weakness noted above. As we continue to evaluate and work to remediate the material weakness, we may determine to take additional measures to address the control deficiencies. Also, see Item 9A in Part II of this Form 10-K.
Although we plan to complete this remediation process as quickly as possible, our measures may not prove to be successful in remediating this material weakness. If our remedial measures are insufficient to address the material weakness, or if additional material weaknesses or significant deficiencies in our internal control over financial reporting are discovered or occur in the future, our consolidated financial statements may contain material misstatements and we could be required to restate our financial results. In addition, if we are unable to successfully remediate this material weakness and if we are unable to produce accurate and timely financial statements, our stock price may be adversely affected and we may be unable to maintain compliance with applicable stock exchange listing requirements and debt covenant requirements.
Our ability to accurately report our financial results or prevent fraud may be adversely affected if our internal control over financial reporting is not effective.
The accuracy of our financial reporting is dependent on the effectiveness of our internal controls. We are required to provide a report from management to our shareholders on our internal control over financial reporting that includes an assessment of the effectiveness of these controls. Internal control over financial reporting has inherent limitations, including human error, the possibility that controls could be circumvented or become inadequate as a result of changed conditions, and fraud. Due to these
inherent limitations, internal control over financial reporting might not prevent or detect all misstatements or fraud. If we cannot maintain and execute adequate internal control over financial reporting or implement required new or improved controls that provide reasonable assurance of the reliability of the financial reporting and preparation of our financial statements for external use, our ability to accurately report our financial results or prevent fraud could be adversely affected.
LABOR AND SUPPLY CHAIN RISKS
We are dependent upon our ability to attract and retain key personnel.
Our success depends in part upon our ability to attract and retain key engineering, technical and managerial personnel, at both the executive and performance center level. We face competition for management, engineering and technical personnel from other companies and organizations. The loss of members of our senior management group, or key engineering and technical personnel, could negatively impact our ability to grow and remain competitive in the future and could have a material adverse effect on our financial results.
Labor disruptions by our employees could adversely affect our business.
As of December 31, 2023, we employed 2,265 people. Two of our performance centers are parties to collective bargaining agreements, covering 97 full time hourly employees in one of those performance centers and 271 full time hourly employees in the other performance center, which will expire in June 2024 and April 2025, respectively. However, the Monrovia, California performance center that employs 97 of our collective bargaining employees that are covered by an agreement that expires in June 2024 will be ceasing production and the facility is currently expected to close by the middle of 2024. See Note 3 to our consolidated financial statements included in Part IV, Item 15(a) of this Form 10-K for further information. Although we have not experienced any material labor-related work stoppage and consider our relations with our employees to be good, labor stoppages may occur in the future. If the unionized workers were to engage in a strike or other work stoppage, if we are unable to negotiate acceptable collective bargaining agreements with the unions or if other employees were to become unionized, we could experience a significant disruption of our operations, higher ongoing labor costs and possible loss of customer contracts, which could have an adverse effect on our business and results of operations.
We rely on our suppliers to meet the quality and delivery expectations of our customers.
Our ability to deliver our products and services on schedule and to satisfy specific quality levels is dependent upon a variety of factors, including execution of internal performance plans, availability of raw materials, internal and supplier produced parts and structures, conversion of raw materials into parts and assemblies, and performance of suppliers and others.
We rely on numerous third-party suppliers for raw materials and a large proportion of the components used in our production process. Certain of these raw materials and components are available only from single sources or a limited number of suppliers, or similarly, customers’ specifications may require us to obtain raw materials and/or components from a single source or certain suppliers. Many of our suppliers are small companies with limited financial resources and manufacturing capabilities. We do not currently have the ability to manufacture these components ourselves. These and other factors, including the impact from import tariffs, the loss of a critical supplier or raw materials and/or component shortages, could cause disruptions or cost inefficiencies in our operations. Additionally, our competitors that have greater direct purchasing power, may have product cost advantages which could have a material adverse effect on our financial results.
GENERAL RISKS
Pandemics and other disease outbreaks such as COVID-19 and similar health threats that may arise in the future may have a material adverse effect on our business, results of operations, and financial condition.
While the commercial aerospace industry continues to recover from the effects of the COVID-19 pandemic, new variants of that disease, along with other similar public health threats may have or may continue to have an adverse impact on our employees, operations, businesses of our customers, suppliers and distribution partners, and volatility in the financial markets. Changes in our operations in response to the COVID-19 pandemic and other health threats or employee illnesses resulting from such diseases, has resulted in and may continue to result in inefficiencies or delays, including in sales and product development efforts and our manufacturing and supply chain, and additional costs related to business continuity initiatives, that cannot be fully mitigated through succession planning, employees working remotely, or teleconferencing technologies. The long-term impact to our business remains unknown due to the numerous uncertainties that have risen from such health threats, including the severity of the disease, the duration of the outbreak, the likelihood of resurgences of the outbreak, including the emergence and spread of variants, actions that may be taken by governmental authorities in response to the disease, the timing, distribution, efficacy and public acceptance of vaccines, long-term impact from diseases or vaccines, and related unintended or unanticipated consequences.
Our ability to continue to manufacture products is highly dependent on our ability to maintain the safety and health of our performance center employees. While we continue to follow guidelines and requirements of governmental authorities and taking preventive and protective measures to prioritize the safety and well-being of our employees, these measures are not always successful. Thus far, the ability of our employees to work has not been significantly impacted by individuals contracting or being exposed to COVID-19 or its variants. However, if an outbreak of COVID-19 or other viruses does occur at any of our performance centers, it may disrupt our ability to manufacture products and thus, have a material and adverse impact on our business, financial condition, and results of operations.
Increased scrutiny from investors, lenders, and other market participants regarding our environmental, social, and governance, or sustainability responsibilities could expose us to additional costs and adversely impact our liquidity, results of operations, reputation, employee retention, and stock price.
There is an increasing focus from certain investors, customers, and other key stakeholders concerning corporate responsibility, specifically related to environmental, social, and governance (“ESG”) factors. Some investors may use ESG criteria to guide their investment strategies and, in some cases, may choose not to invest in us if they believe our policies relating to corporate responsibilities are inadequate. Lenders may also use ESG criteria to guide their lending practices and, in some cases, may choose not to lend to us.
The ESG factors by which companies’ corporate responsibility practices are assessed may change. This could result in greater expectations of us and cause us to undertake costly initiatives to satisfy such new criteria. If we are unable to satisfy the new corporate responsibility criteria, investors may view our policies related to corporate responsibility as inadequate. We risk damage to our reputation in the event our corporate responsibility procedures or goals do not meet the standards or goals set by various constituencies. In addition, if our competitors’ corporate responsibility performance is perceived to be greater than ours, potential or current investors may elect to invest in our competitors instead. Further, in the event we communicate certain initiatives or goals related to ESG, we could fail, or be perceived to have failed, in our achievement of such initiatives or goals. If we fail to satisfy the expectations of investors and other key stakeholders, or our initiatives are not executed as planned, our reputation, employee retention, and willingness of our customers and suppliers to do business with us, financial results, and stock price could be materially and adversely affected.
Cybersecurity attacks, internal system or service failures may adversely impact our business and operations.
Any system or service disruptions, including those caused by projects to improve our information technology systems, if not anticipated and appropriately mitigated, could disrupt our business and impair our ability to effectively provide products and related services to our customers and could have a material adverse effect on our business. We could also be subject to systems failures, including network, software or hardware failures, whether caused by us, third-party service providers, intruders or hackers, computer viruses, natural disasters, power shortages or terrorist attacks. Cyber securityCybersecurity threats are evolving and include, but are not limited to, malicious software, unauthorized attempts to gain access to sensitive, confidential or otherwise protected information related to us or our products, our employees, customers or suppliers, or other acts that could lead to disruptions in our business.business, which risk may be heightened by the increased prevalence and use of artificial intelligence. Any such failures could cause loss of data and interruptions or delays in our business, cause us to incur remediation costs, subject us to claims and damage our reputation. In addition, such cybersecurity attacks may result in a significant ransom demand. Further, the failure or disruption of our communications or utilities could cause us to interrupt or suspend our operations or otherwise adversely affect our business. Our property and business interruption insurance may be inadequate to compensate us for all losses that may occur as a result of any system or operational failure or disruption which would adversely affect our business, results of operations and financial condition.
We may not have the ability to renew facilities leases on terms favorable to us and relocation of operations presents risks due to business interruption.
Certain of our manufacturing facilities and offices are leased and have lease terms that expire between 2019 and 2022. The majority of these leases provide renewal options at the fair market rental rate at the time of renewal, which, if renewed, could be significantly higher than our current rental rates. We may be unable to offset these cost increasesadequately protect or enforce our intellectual property rights.
Our intellectual property rights may not be sufficiently broad or otherwise may not provide us a significant competitive advantage, and patents may not be issued for pending or future patent applications owned by charging more for our products and services. Furthermore, continued economic conditions may continueor licensed to us. As patents expire, we could face increased competition, which could negatively impact our operating results. Infringement of our intellectual property and create greater pressureother proprietary rights by a third party, or copying of our technology in countries where we do not hold patents, could result in uncompensated lost market and revenue opportunities. We cannot be certain that the measures we have implemented will prevent our intellectual property from being improperly disclosed, challenged, invalidated, or circumvented, particularly in countries where intellectual property rights are not highly developed or protected. For example, competitors may avoid infringement liability by developing non-infringing competing technologies or by effectively concealing infringement. We may need to spend significant resources monitoring and enforcing our intellectual property rights and we may not be aware of or able to detect or prove infringement by third parties. Our ability to enforce our intellectual property rights is subject to litigation risks, as well as uncertainty as to the protection and enforceability of those rights in some countries. If we seek to enforce our intellectual property rights, we may be subject to claims that those rights are invalid or unenforceable, and
others may seek counterclaims against us, which could have a negative impact on our business. In addition, changes in intellectual property laws or their interpretation may impact our ability to protect and assert our intellectual property rights, increase costs and uncertainties in the commercial real estate market, causing higher incidencesprosecution of landlord default and/patent applications and enforcement or lender foreclosuredefense of properties, including properties occupiedissued patents, and diminish the value of our intellectual property. If we do not protect and enforce our intellectual property rights successfully, or if they are circumvented, invalidated, or rendered obsolete by us. While we maintain certain non-disturbance rights in most cases,the rapid pace of technological change, it is not certain that such rights will in all cases be upheldcould have an adverse impact on our competitive position and our continued right of occupancy in such instances is potentially jeopardized. An occurrence of any of these eventsoperating results.
Assertions by third parties that we violated their intellectual property rights could have a material adverse effect on our business, financial results.condition, and results of operations.
Third parties may claim that we, our customers, licensees, or parties indemnified by us are infringing upon or otherwise violating their intellectual property rights. Such claims may be made by competitors seeking to obtain a competitive advantage or by other parties. Additionally, in recent years, individuals and groups have begun purchasing intellectual property assets for the purpose of making claims of infringement and attempting to extract settlements from companies like ours.
Any claims that we violated a third party’s intellectual property rights can be time consuming and costly to defend and distract management’s attention and resources, even if the claims are without merit. Such claims may also require us to redesign affected products and services, enter into costly settlement or license agreements or pay costly damage awards, or face a temporary or permanent injunction prohibiting us from marketing or providing the affected products and services. Even if we choosehave an agreement to move any ofindemnify us against such costs, the indemnifying party may not have sufficient financial resources or otherwise be unable to uphold its contractual obligations. If we cannot or do not license the infringed technology on favorable terms or cannot or do not substitute similar technology from another source, our operations, those operations will be subject to additional relocation costsrevenue and associated risks of business interruption.
The occurrence of litigation in which weearnings could be named as a defendant is unpredictable.
From time to time, we and our subsidiaries are involved in various legal and other proceedings that are incidental to the conduct of our business. While we believe no current proceedings, if adversely determined, could have a material adverse effect on our financial results, no assurances can be given. Any such claims may divert financial and management resources that would otherwise be used to benefit our operations and could have a material adverse effect on our financial results.
Product liability claims in excess of insurance could adversely affect our financial results and financial condition.
We face potential liability for personal injury or death as a result of the failure of products designed or manufactured by us. Although we currently maintain product liability insurance (including aircraft product liability insurance), any material product liability not covered by insurance could have a material adverse effect on our financial condition, results of operations and cash flows.impacted.
Damage or destruction of our facilities caused by storms, earthquake, fires or other causes could adversely affect our financial results and financial condition.
We have operations located in regions of the U.S. and Mexico that may be exposed to damaging storms, earthquakes, fires and other natural disasters. Although we maintain standard property casualty insurance covering our properties and may be able to recover costs associated with certain natural disasters through insurance, we do not carry any earthquake insurance because of the cost of such insurance. Many of our properties are located in Southern California, an area subject to earthquake activity. Our California facilitiesperformance centers generated $185.3$185.9 million in net revenues during 2017.2023. Even if covered by insurance, any significant damage or destruction of our facilities due to storms, earthquakes, fires or other natural disasters could result in our inability to meet customer delivery schedules and may result in the loss of customers and significant additional costs to us. Thus, any significant damage or destruction of our properties could have a material adverse effect on our business, financial condition or results of operations.
We are dependent upon our ability to attract and retain key personnel.
Our success depends in part upon our ability to attract and retain key engineering, technical and managerial personnel, at both the executive and plant level. We face competition for management, engineering and technical personnel from other companies and organizations. The loss See discussion of members of our senior management group, or key engineering and technical personnel, could negatively impact our ability to grow and remain competitive in the future and could have a material adverse effect on our financial results.
Labor disruptions by our employees could adversely affect our business.
As of December 31, 2017, we employed 2,600 people. Two of our operating facilities are parties to collective bargaining agreements, covering 140 full time hourly employees in one of those facilities and 220 full time hourly employees in the other facility, and will expirefire in June 2018 and January 2019, respectively. Although we have not experienced any material labor-related work stoppage and consider2020 which severely damaged our relations with our employeesGuaymas, Mexico performance center in Note 15 to be good, labor stoppages may occur in the future. If the unionized workers were to engage in a strike or other work stoppage, if we are unable to negotiate acceptable collective bargaining agreements with the unions or if other employees were to become unionized, we could experience a significant disruption of our operations, higher ongoing labor costs and possible loss of customer contracts, which could have an adverse effect on our business and results of operations.
We have identified material weaknesses in the past in our internal controls over financial reporting which could, if not remediated, adversely impact the reliability of our financial reports, cause us to submit our financial reports in an untimely fashion, result in material misstatements in our financial statements and cause current and potential stockholders to lose confidence in our financial reporting, which in turn could adversely affect the trading price of our common stock.
In 2016, we concluded that there was a material weakness in our internal control over financial reporting related to the annual accounting for income taxes. There was an incorrect recording to a deferred tax asset of $1.6 million when this amount should have decreased our income tax benefit for the year and fourth quarter ended December 31, 2015. We assessed the materiality of this error and do not believe it is material to any prior interim or annual periods, however, we determined it was appropriate to revise our consolidated financial statements asincluded in Part IV, Item 15(a) of and for the year and quarter ended December 31, 2015 in this Form 10-K. Therefore, we have revised our December 31, 2015 consolidated balance sheet to increase non-current deferred tax liabilities by $1.6 million and revised our consolidated statement of operations10-K for the year ended December 31, 2015 to increase our net loss by $1.6 million. We have also revised all related footnote disclosures in these consolidated financial statements to correct this error. This error had no effect on net cash provided by operating activities on our consolidated cash flow statement for the year ended December 31, 2015, however, we determined that our internal control over financial reporting relating to the annual accounting for income taxes was not effective as of December 31, 2016. This material weakness was remediated as of December 31, 2107.
Under standards established by the Public Company Accounting Oversight Board (“PCAOB”), a material weakness is a deficiency, or combination of deficiencies, in internal control over financial reporting, such that there is a reasonable possibility that a material misstatement of our annual or interim financial statements will not be prevented or detected and corrected on a timely basis.
When a material weakness occurs, we plan to complete the remediation process as quickly as possible. If our remedial measures are insufficient to address the material weakness, or if additional material weaknesses or significant deficiencies in our internal control over financial reporting are discovered or occur in the future, our consolidated financial statements may contain material misstatements and we could be required to restate our financial results. In addition, if we are unable to successfully remediate a material weakness and if we are unable to produce accurate and timely financial statements, our stock price may be adversely affected and we may be unable to maintain compliance with applicable stock exchange listing requirements and debt covenant requirements.
Unanticipated changes in our tax provision or exposure to additional income tax liabilities could affect our profitability.
Significant judgment is required in determining our provision for income taxes. In the ordinary course of our business, there are transactions and calculations where the ultimate tax determination is uncertain. Furthermore, changes in income tax laws and regulations, or their interpretation, could result in higher or lower income tax rates assessed or changes in the taxability of certain sales or the deductibility of certain expenses, thereby affecting our income tax expense and profitability. We recorded provisional estimates of the impact of the Tax Cuts and Jobs Act (the “2017 Tax Act”) enacted on December 22, 2017 in accordance with SEC Staff Accounting Bulletin No. 118 (“SAB 118”). These estimates are subject to further analysis and review which may result in material adjustments in 2018. In addition, we are regularly under audit by tax authorities. The final determination of tax audits and any related litigation could be materially different from our historical income tax provisions and accruals.information.
ITEM 1B. UNRESOLVED STAFF COMMENTS
None.
ITEM 1C. CYBERSECURITY
We have an enterprise-wide approach to addressing cybersecurity risk, including input and participation from management and support from our Information Technology (“IT”) Steering Committee that is comprised of our Senior Vice President Electronic and Structural Systems, Chief Financial Officer, General Counsel, Chief Human Resources Officer, Vice President Supply Chain Management, and Chief Information Security Officer (Head of IT and Cybersecurity or “CISO”). Our cybersecurity risk management program leverages the National Institute of Standards and Technology (“NIST”) Framework which augmented with Cybersecurity Maturity Model Certification (“CMMC”) components to meet our particular needs. We regularly assess the threat landscape and take a holistic view of the cybersecurity risks, with a layered cybersecurity strategy based on protection, detection, and mitigation. Our IT security team, which is comprised of internal resources, reviews enterprise risk management-level cybersecurity risks at least annually.
Our CISO is responsible for developing, implementing, and maintaining our information security strategy and program, as well as reporting various cybersecurity risk matters to our IT Steering Committee, and the Board’s Innovation Committee. The Innovations Committee is a subset of the full Board of Directors which receive regular updates on our cybersecurity program.
Our CISO has over 17 years of experience leading cybersecurity oversight for several companies and is updated on cyber events related to the monitoring, prevention, detection, mitigation, and remediation efforts from our IT security team. The IT
security team have broad cybersecurity expertise or industry certifications and are knowledgeable in the use of cybersecurity tools and software. In addition, third-party cybersecurity services are used to augment our in-house capabilities, as needed.
We continue to expand investments in IT security, including additional end-user security awareness training, using layered defenses, identifying and protecting critical systems, strengthening monitoring and alerting, and engaging experts as needed. We also use an industry standard risk quantification model to identify, measure, and prioritize cybersecurity risks. This in turn, helps us develop and implement effective security controls and technology defenses. In addition, all employees are required to complete various cybersecurity trainings on a regular basis. Further, we perform periodic simulations and tabletop exercises with the IT security team and will continue to expand its participants as appropriate. Our assessment of risks associated with the use of third party providers on a limited basis is part of our current overall cybersecurity risk management approach. As the threats and attacks are becoming more sophisticated, we will modify and enhance our cybersecurity program as needed.
As a defense contractor, we must also comply with extensive regulations, including requirements imposed by the Defense Federal Acquisition Regulation Supplement (“DFARS”) related to adequately safeguarding controlled unclassified information (“CUI”). The Department of Defense (“DoD”) will require defense contractors to comply with its CMMC program in the future. We are incorporating the requirements of the CMMC program into our overall cybersecurity program and anticipate we will be in position to meet such requirements when it becomes effective.
Cybersecurity threats, including as a result of any previous cybersecurity incidents have not materially affected or are not reasonably likely to materiality affect us, including our business strategy, results of operations or financial condition. See “Cybersecurity attacks, internal system or service failures may adversely impact our business and operations” in Risk Factors included in Part I, Item 1A of this Form 10-K. Such incidents, whether or not successful, could result in our incurring significant costs related to, for example, rebuilding our internal systems, implementing additional threat protection measures, defending against litigation, responding to regulatory inquiries or actions, paying damages, providing customers with incentives to maintain a business relationship with us, or taking other remedial steps with third-parties, as well as incurring significant reputational harm. In addition, these threats are constantly evolving, thereby increasing the difficulty of successfully defending against them or implementing adequate preventive measures. For more information regarding the risks we face from cybersecurity threats, please see Risk Factors included in Part I, Item 1A of this Form 10-K.
ITEM 2. PROPERTIES
We occupy 29Our headquarters are located in Santa Ana, California. As of December 31, 2023, we owned or leased facilities totaling 2.1 million square feet ofand land for corporate functions and manufacturing areaat locations throughout the United States and office space. At December 31, 2017,a manufacturing location outside the United States. We believe our existing facilities which were in excess of 50,000 square feet each were occupied as follows:
|
| | | | | | |
| Location | | Segment | | Square Feet | | Expiration of Lease |
| Carson, California | | Structural Systems | | 299,000 | | Owned |
| Monrovia, California | | Structural Systems | | 274,000 | | Owned |
| Parsons, Kansas | | Structural Systems | | 176,000 | | Owned |
| Coxsackie, New York | | Structural Systems | | 151,000 | | Owned |
| Carson, California | | Electronic Systems | | 117,000 | | 2021 |
| Phoenix, Arizona | | Electronic Systems | | 100,000 | | 2022 |
| Joplin, Missouri | | Electronic Systems | | 92,000 | | Owned |
| Adelanto, California | | Structural Systems | | 88,000 | | Owned |
| Orange, California | | Structural Systems | | 80,000 | | Owned |
| Appleton, Wisconsin | | Electronic Systems | | 77,000 | | Owned |
| Carson, California | | Structural Systems | | 77,000 | | 2019 |
| Huntsville, Arkansas | | Electronic Systems | | 69,000 | | 2020 |
| Berryville, Arkansas | | Electronic Systems | | 65,000 | | Owned |
| Joplin, Missouri | | Electronic Systems | | 55,000 | | 2021 |
| Tulsa, Oklahoma | | Electronic Systems | | 55,000 | | Owned |
| Orange, California | | Structural Systems | | 53,000 | | 2019 |
Management believes these properties are adequate to meet our current requirements, are in good condition and are suitable and adequate for theirour present use.purposes. Each of our reportable segments uses each of these facilities.
ITEM 3. LEGAL PROCEEDINGS
See Note 1715 to our consolidated financial statements included in Part IV, Item 15(a) of this Annual Report on Form 10-K for a description of our legal proceedings.
ITEM 4. MINE SAFETY DISCLOSURES
Not applicable.
PART II
ITEM 5. MARKET FOR THE REGISTRANT’S COMMON EQUITY, RELATED STOCKHOLDER MATTERS AND ISSUER PURCHASES OF EQUITY SECURITIES
Our common stock is listed on the New York Stock Exchange under the symbol DCO. As of December 31, 2017,2023, we had 178134 holders of record of our common stock. We have not paid any dividends since the first quarter of 2011 and we do not expect to pay dividends for the foreseeable future. See “Available Liquidity” in Part II, Item 7, Management’s Discussion and Analysis—Liquidity and Capital Resources—Available Liquidity, of this Annual Report on Form 10-K for further discussion on dividend restrictions under our Credit Facility. The following table sets forth the high and low closing prices per share of our common stock as reported on the New York Stock Exchange for the fiscal periods indicated:
|
| | | | | | | | | | | | | | | | |
| | | Years Ended December 31, |
| | | 2017 | | 2016 |
| | | High | | Low | | High | | Low |
| First Quarter | | $ | 32.18 |
| | $ | 24.35 |
| | $ | 16.98 |
| | $ | 12.89 |
|
| Second Quarter | | $ | 34.46 |
| | $ | 28.12 |
| | $ | 20.69 |
| | $ | 14.32 |
|
| Third Quarter | | $ | 32.55 |
| | $ | 26.24 |
| | $ | 24.41 |
| | $ | 19.02 |
|
| Fourth Quarter | | $ | 35.02 |
| | $ | 25.81 |
| | $ | 29.46 |
| | $ | 18.80 |
|
See “Part III, Item 12. SECURITY OWNERSHIP OF CERTAIN BENEFICIAL OWNERS AND MANAGEMENT AND RELATED STOCKHOLDER MATTERS” for information relating to shares to be issued under equity compensation plans.
Unregistered Sales of Equity Securities
None.
Issuer Purchases of Equity Securities
None.
Performance Graph
The following graph compares the yearly percentage change in our cumulative total shareholder return with the cumulative total return of the Russell 2000 Index and the Spade Index for the periods indicated,median of our 2024 Proxy Statement peers (“Median of Peers”) over a five year period, assuming the reinvestment of any dividends. The graph is not necessarily indicative of future price performance:
ITEM 6. SELECTED FINANCIAL DATA
The following selected consolidated financial data should be read in conjunction with Part II, Item 7 and Part IV, Item 15(a) of this Annual Report on Form 10-K (“Form 10-K”):[Reserved]
|
| | | | | | | | | | | | | | | | | | | | |
| | | (In thousands, except per share amounts) Years Ended December 31, |
| | | 2017(a)(b)(c) | | 2016(d) | | 2015(e)(f) | | 2014 | | 2013(g) |
| Net Revenues | | $ | 558,183 |
| | $ | 550,642 |
| | $ | 666,011 |
| | $ | 742,045 |
| | $ | 736,650 |
|
| Gross Profit as a Percentage of Net Revenues | | 18.4 | % | | 19.3 | % | | 15.1 | % | | 18.9 | % | | 16.9 | % |
| Income (Loss) Before Taxes | | 7,609 |
| | 38,113 |
| | (106,590 | ) | | 26,240 |
| | 9,385 |
|
| Income Tax (Benefit) Expense | | (12,468 | ) | | 12,852 |
| | (31,711 | ) | | 6,373 |
| | (1,993 | ) |
| Net Income (Loss) | | $ | 20,077 |
| | $ | 25,261 |
| | $ | (74,879 | ) | | $ | 19,867 |
| | $ | 11,378 |
|
| Per Common Share | | | | | | | | | | |
| Basic earnings (loss) per share | | $ | 1.78 |
| | $ | 2.27 |
| | $ | (6.78 | ) | | $ | 1.82 |
| | $ | 1.06 |
|
| Diluted earnings (loss) per share | | $ | 1.74 |
| | $ | 2.24 |
| | $ | (6.78 | ) | | $ | 1.79 |
| | $ | 1.05 |
|
| Working Capital | | $ | 140,778 |
| | $ | 139,635 |
| | $ | 179,655 |
| | $ | 217,670 |
| | $ | 225,323 |
|
Total Assets (h) | | $ | 566,753 |
| | $ | 515,429 |
| | $ | 557,081 |
| | $ | 747,599 |
| | $ | 762,645 |
|
Long-Term Debt, Including Current Portion (h) | | $ | 216,055 |
| | $ | 166,899 |
| | $ | 240,687 |
| | $ | 290,052 |
| | $ | 332,702 |
|
| Total Shareholders’ Equity | | $ | 235,583 |
| | $ | 212,103 |
| | $ | 185,734 |
| | $ | 256,570 |
| | $ | 234,271 |
|
| |
(a) | The results for 2017 included LDS’ results of operations since the date of acquisition of September 2017. |
| |
(b) | The results for 2017 included the adoption of the Tax Cuts and Jobs Act and as a result, we recorded a provisional deferred income tax benefit of $13.0 million related to the re-measurement for the year ended December 31, 2017. See Note 16 to our consolidated financial statements included in Part IV, Item 15(a) of this Annual Report on Form 10-K for further information. |
| |
(c) | The results for 2017 included restructuring charges of $8.8 million. See Note 3 to our consolidated financial statements included in Part IV, Item 15(a) of this Annual Report on Form 10-K for further information. |
| |
(d) | The results for 2016 included a gain on divestitures, net in our Electronic Systems operating segment of $17.6 million related to the divestitures of our Pittsburgh and Miltec operations. |
| |
(e) | The results for 2015 included a goodwill impairment charge in our Structural Systems operating segment and an indefinite-lived trade name intangible asset impairment charge in our Electronic Systems operating segment of $57.2 million and $32.9 million, respectively, resulting from our annual impairment testing. |
| |
(f) | The results for 2015 included a loss on extinguishment of debt of $14.7 million related to the retirement of the $200.0 million senior unsecured notes and existing credit facility. |
| |
(g) | The results for 2013 included a $14.1 million in charges related to the Embraer Legacy 450/500 and Boeing 777 wing tip contracts and was comprised of $7.0 million of asset impairment charges for production cost of contracts; $5.2 million of forward loss reserves and $1.9 million of inventory write-offs. |
| |
(h) | Total assets and long-term debt for the years 2014 - 2013 have not been recasted for the impact of the adoption of Accounting Standards Update 2015-03, as amended by Accounting Standards Update 2015-15, which required the reclassification of certain debt issuance costs from an asset to a liability. See Note 1 to our consolidated financial statements included in Part IV, Item 15(a) of this Annual Report on Form 10-K for further information. |
Item 7. MANAGEMENT’S DISCUSSION AND ANALYSIS OF FINANCIAL CONDITION AND RESULTS OF OPERATIONS
Overview
Ducommun Incorporated (“Ducommun,” “the Company,” “we,” “us” or “our”) is a leading global provider of engineering and manufacturing services for high-performance products and high-cost-of failure applications used primarily in the aerospace and defense (“A&D”), industrial, natural resources, medical, and other industries.industries (“Industrial”). We differentiate ourselves as a full-service solution-based provider, offering a wide range of value-added products and services in our primary businesses of electronics, structures and integrated solutions. We operate through two primary business segments: Electronic Systems and Structural Systems, each of which is a reportable segment.
COVID-19 Pandemic Impact on Our Business
The COVID-19 pandemic had a significant impact on our overall business during the prior year ended December 31, 2022. As a result of the COVID-19 pandemic, precautionary measures were instituted by governments and businesses to mitigate its spread, including the imposition of travel restrictions, quarantines, shelter in place directives, and shutting down of non-essential businesses.
The residual effects of the COVID-19 pandemic and the resulting inflation, rising or high interest rates, supply chain issues, geopolitical developments, and other events have contributed and/or continue to contribute to a general slowdown in the global economy and most significantly, the commercial aerospace end-use market. Further, one of our largest customers, The Boeing Company (“Boeing”), was notified by the Federal Aviation Administration (“FAA”) in early January 2024 it has initiated an investigation into Boeing’s quality control system. This was followed by the FAA announcing actions to increase its oversight of Boeing as well as not approving production rate increases or additional production lines for the 737 MAX until it is satisfied that Boeing is in full compliance with required quality control procedures. For 2024, while both major large aircraft manufacturers, Boeing and Airbus SE, have announced either similar or increases in build rates compared to 2023, the ramp up is slower than expected and below pre-pandemic levels. In its 2023 Annual Report on Form 10-K, Boeing indicated that in 2023, global air traffic largely recovered to 2019 levels with domestic travel continuing to be the most robust and international travel has mostly recovered. While the full extent and impact of the COVID-19 pandemic cannot be reasonably estimated with certainty, in the prior year, the COVID-19 pandemic had a significant impact on our business, the businesses of our customers and suppliers, as well as our results of operations and financial condition, and such lingering effects along with compliance with regulatory compliance, could have a material adverse impact on our business, results of operations and financial condition for 2024 and beyond. See Risk Factors included in Part I, Item 1A of this Annual Report on Form 10-K (“Form 10-K”).
Recap offor the year ended December 31, 2017:2023:
•Net revenues of $558.2$757.0 million
•Net income of $20.1$15.9 million, or $1.74$1.14 per diluted share which includes $12.5 million of income tax benefit primarily due to the adoption of the Tax Cuts and Jobs Act
•Adjusted EBITDA of $53.5$101.5 million
Backlog of $726.5 million
Completed the acquisition of Lightning Diversion Systems, LLC
Non-GAAP Financial Measures
Adjusted earnings before interest, taxes, depreciation, and amortization, andstock-based compensation expense, restructuring charges, Guaymas fire related expenses, other fire related expenses, insurance recoveries related to loss on operating assets, insurance recoveries related to business interruption, inventory purchase accounting adjustments, loss on extinguishment of debt, other debt refinancing costs, gain on sale-leaseback, and success bonus related to the completion of sale-leaseback transaction (“Adjusted EBITDA”) was $53.5$101.5 million and $54.8$94.7 million for the years ended December 31, 20172023 and December 31, 2016,2022, respectively.
When viewed with our financial results prepared in accordance with accounting principles generally accepted in the United States of America (“GAAP”) and accompanying reconciliations, we believe Adjusted EBITDA provides additional useful information to clarifythat clarifies and enhanceenhances the understanding of the factors and trends affecting our past performance and future prospects. We define these measures,this measure, explain how they areit is calculated and provide reconciliationsa reconciliation of these measuresthis measure to the most comparable GAAP measure in the table below. Adjusted EBITDA and the related financial ratios, as presented in this Annual Report on Form 10-K, (“Form 10-K”), are supplemental measures of our performance that are not required by, or presented in accordance with, GAAP. They are not a measurement of our financial performance under GAAP and should not be considered as alternatives to net income or any other performance measures derived in accordance with GAAP, or as an alternative to net cash provided by operating activities as measuresa measurement of our liquidity. The presentation of these measures should not be interpreted to mean that our future results will be unaffected by unusual or nonrecurring items.
We use Adjusted EBITDA as a non-GAAP operating performance measuresmeasure internally as a complementary financial measuresmeasure to evaluate the performance and trends of our businesses. We present Adjusted EBITDA and the related financial ratios, as applicable, because we believe that measures such as these provide useful information with respect to our ability to meet our operating commitments.
Adjusted EBITDA has limitations as an analytical tool, and you should not consider it in isolation or as substitutesa substitute for analysis of our results as reported under GAAP. Some of these limitations are:include:
They do•It does not reflect our cash expenditures, future requirements for capital expenditures or contractual commitments;
They do•It does not reflect changes in, or cash requirements for, our working capital needs;
They do•It does not reflect the significant interest expense or the cash requirements necessary to service interest or principal payments on our debt;
•Although depreciation and amortization are non-cash charges, the assets being depreciated and amortized will often have to be replaced in the future, and Adjusted EBITDA does not reflect any cash requirements for such replacements;
They are•It is not adjusted for all non-cash income or expense items that are reflected in our statements of cash flows;
They do•It does not reflect the impact on earnings ofor charges resulting from matters unrelated to our ongoing operations; and
•Other companies in our industry may calculate Adjusted EBITDA differently from us, limiting theirits usefulness as a comparative measures.measure.
BecauseAs a result of these limitations, Adjusted EBITDA and the related financial ratios should not be considered as measures of discretionary cash available to us to invest in the growth of our business or as a measure of cash that will be available to us to meet our obligations. You should compensate for these limitations by relying primarily on our GAAP results and using Adjusted EBITDA only as supplemental information. See our consolidated financial statements contained in this Form 10-K.
However, in spite ofEven with the limitations above, limitations, we believe that Adjusted EBITDA is useful to an investor in evaluating our results of operations because these measures:as this measure:
Are•Is widely used by investors to measure a company’s operating performance without regard to items excluded from the calculation of such terms, which can vary substantially from company to company depending upon accounting methods and book value of assets, capital structure and the method by which assets were acquired, among other factors;
Help•Helps investors to evaluate and compare the results of our operations from period to period by removing the effect of our capital structure from our operating performance; and
Are•Is used by our management team for various other purposes in presentations to our Board of Directors as a basis for strategic planning and forecasting.
The following financial items have been added back to or subtracted from our net income when calculating Adjusted EBITDA:
•Interest expense may be useful to investors for determining current cash flow;
•Income tax expense may be useful to investors because it represents the taxes which may be payable for the period and the change in deferred taxes during the period, and may reduce cash flow available for use in our business;
•Depreciation may be useful to investors because it generally represents the wear and tear on our property and equipment used in our operations;
•Amortization expense may be useful to investors because it represents the estimated attrition of our acquired customer base and the diminishing value of product rights;
•Stock-based compensation expense may be useful to our investors for determining current cash flow;
•Restructuring charges may be useful to our investors in evaluating our core operating performance;
•Guaymas fire related expenses may be useful to our investors in evaluating our core operating performance;
•Other fire related expenses may be useful to our investors in evaluating our core operating performance;
•Insurance recoveries related to loss on operating assets (property and equipment, inventories, and other assets) may be useful to our investors in evaluating our core operating performance;
•Insurance recoveries related to business interruption may be useful to our investors in evaluating our core operating performance;
•Purchase accounting inventory step-ups may be useful to our investors as they do not necessarily reflect the current or on-going cash charges related to our core operating performance;
Net gain on divestitures may be useful to our investors in evaluating our on-going operating performance;
•Loss on extinguishment of debt may be useful to our investors for determining current cash flow;
Asset impairments (including goodwill and intangible assets)•Other debt refinancing costs may be useful to our investors as it generally represents a decline in valueevaluating our core operating performance;
•Gain on sale-leaseback may be useful to our investors in evaluating our assets usedcore operating performance; and
•Success bonus related to completion of sale-leaseback transaction may be useful to our investors in evaluating our operations.
core operating performance.
Reconciliations of net income (loss) to Adjusted EBITDA and the presentation of Adjusted EBITDA as a percentage of net revenues were as follows:
| | | | | | | | | | | | | | | | | | | | |
| | (Dollars in thousands)
Years Ended December 31, |
| | 2023 | | 2022 | | 2021 |
| Net income | | $ | 15,928 | | | $ | 28,789 | | | $ | 135,536 | |
| Interest expense | | 20,773 | | | 11,571 | | | 11,187 | |
| Income tax expense | | 451 | | | 4,533 | | | 34,948 | |
| Depreciation | | 15,473 | | | 14,535 | | | 14,051 | |
| Amortization | | 17,098 | | | 16,886 | | | 14,338 | |
Stock-based compensation expense (1) | | 15,045 | | | 10,744 | | | 11,212 | |
Restructuring charges (2) | | 14,855 | | | 6,686 | | | — | |
| Guaymas fire related expenses | | 3,896 | | | 4,466 | | | 2,486 | |
| Other fire related expenses | | 477 | | | — | | | — | |
| Insurance recoveries related to loss on operating assets | | (5,724) | | | — | | | — | |
| Insurance recoveries related to business interruption | | (2,289) | | | (5,400) | | | — | |
Inventory purchase accounting adjustments (3)(4) | | 5,531 | | | 1,381 | | | 106 | |
| Loss on extinguishment of debt | | — | | | 295 | | | — | |
| Other debt refinancing costs | | — | | | 224 | | | — | |
| Gain on sale-leaseback | | — | | | — | | | (132,522) | |
Success bonus related to completion of sale-leaseback transaction (5) | | — | | | — | | | 1,451 | |
| | | | | | |
| | | | | | |
| | | | | | |
| | | | | | |
| | | | | | |
| Adjusted EBITDA | | $ | 101,514 | | | $ | 94,710 | | | $ | 92,793 | |
| | | | | | |
| % of net revenues | | 13.4 | % | | 13.3 | % | | 14.4 | % |
(1)2023 and 2022 included $2.7 million and $1.2 million, respectively, of stock-based compensation expense for awards with both performance and market conditions that will be settled in cash.
(2)2023 and 2022 included $0.3 million and $0.5 million, respectively, of restructuring charges that were recorded as cost of sales.
(3)2023 included inventory purchase accounting adjustments of inventory that was stepped up as part of our purchase price allocation from our acquisition of BLR Aerospace, LLC (“BLR”) on April 25, 2023 and is a part of our Structural Systems operating segment.
(4)2022 and 2021 included inventory purchase accounting adjustments of inventory that was stepped up as part of our purchase price allocation from our acquisition of Magnetic Seal LLC (f/k/a Magnetic Seal Corporation, “MagSeal”) in December 2021 and is a part of our Structural Systems operating segment.
(5)2021 included $1.3 million of success bonus related to the completion of the sale-leaseback transaction that was recorded as part of cost of sales.
|
| | | | | | | | | | | | |
| | | (In thousands) Years Ended December 31, |
| | | 2017 | | 2016 | | 2015 |
| Net income (loss) | | $ | 20,077 |
| | $ | 25,261 |
| | $ | (74,879 | ) |
| Interest expense | | 8,261 |
| | 8,274 |
| | 18,709 |
|
| Income tax (benefit) expense | | (12,468 | ) | | 12,852 |
| | (31,711 | ) |
| Depreciation | | 13,162 |
| | 13,326 |
| | 15,707 |
|
| Amortization | | 9,683 |
| | 9,534 |
| | 11,139 |
|
| Stock-based compensation expense | | 4,675 |
| | 3,007 |
| | 3,495 |
|
Restructuring charges (1) | | 8,838 |
| | 182 |
| | 2,125 |
|
Inventory purchase accounting adjustments (2) | | 1,235 |
| | — |
| | — |
|
Gain on divestitures, net (3) | | — |
| | (17,604 | ) | | — |
|
| Loss on extinguishment of debt | | — |
| | — |
| | 14,720 |
|
Goodwill impairment (4) | | — |
| | — |
| | 57,243 |
|
Intangible asset impairment (5) | | — |
| | — |
| | 32,937 |
|
| Adjusted EBITDA | | $ | 53,463 |
| | $ | 54,832 |
| | $ | 49,485 |
|
| % of net revenues | | 9.6 | % | | 10.0 | % | | 7.4 | % |
| |
(1) | 2017 included $0.5 million of restructuring charges that were recorded as cost of goods sold. |
| |
(2) | 2017 included inventory purchase accounting adjustments of inventory that was stepped up as part of our purchase price allocation from our acquisition of Lightning Diversion Systems, LLC (“LDS”) in September 2017 and is part of our Electronic Systems operating segment. |
| |
(3) | 2016 included gain on divestitures, net in our Electronic Systems operating segment related to the divestitures of our Pittsburgh and Miltec operations. |
| |
(4) | 2015 included goodwill impairment related to our Structural Systems operating segment. |
| |
(5) | 2015 included intangible asset impairment related to our Electronic Systems operating segment. |
RESULTS OF OPERATIONS
20172023 Compared to 20162022
The following table sets forth net revenues, selected financial data, the effective (benefit) tax rate and diluted earnings per share:
| | | | | (in thousands, except per share data) Years Ended December 31, |
| | | 2017 | | % of Net Revenues | | 2016 | | % of Net Revenues |
| | (Dollars in thousands, except per share data)
Years Ended December 31, | | | | (Dollars in thousands, except per share data)
Years Ended December 31, |
| | 2023 | | | | 2023 | | %
of Net Revenues | | 2022 | | %
of Net Revenues |
| Net Revenues | | $ | 558,183 |
| | 100.0 | % | | $ | 550,642 |
| | 100.0 | % | Net Revenues | | $ | 756,992 | | | 100.0 | | 100.0 | % | | $ | 712,537 | | | 100.0 | | 100.0 | % |
| Cost of Sales | | 455,363 |
| | 81.6 | % | | 444,449 |
| | 80.7 | % | Cost of Sales | | 593,805 | | | 78.4 | | 78.4 | % | | 568,240 | | | 79.7 | | 79.7 | % |
| Gross Profit | | 102,820 |
| | 18.4 | % | | 106,193 |
| | 19.3 | % | Gross Profit | | 163,187 | | | 21.6 | | 21.6 | % | | 144,297 | | | 20.3 | | 20.3 | % |
| Selling, General and Administrative Expenses | | 79,435 |
| | 14.2 | % | | 77,443 |
| | 14.1 | % | Selling, General and Administrative Expenses | | 119,728 | | | 15.8 | | 15.8 | % | | 98,351 | | | 13.8 | | 13.8 | % |
| | Restructuring Charges | |
| | Restructuring Charges | |
| | Restructuring Charges | | 8,360 |
| | 1.5 | % | | 182 |
| | — | % | | 14,542�� | | | 1.9 | | 1.9 | % | | 6,158 | | | 0.9 | | 0.9 | % |
| Operating Income | | 15,025 |
| | 2.7 | % | | 28,568 |
| | 5.2 | % | Operating Income | | 28,917 | | | 3.9 | | 3.9 | % | | 39,788 | | | 5.6 | | 5.6 | % |
| Interest Expense | | (8,261 | ) | | (1.5 | )% | | (8,274 | ) | | (1.5 | )% | Interest Expense | | (20,773) | | | (2.7) | | (2.7) | % | | (11,571) | | | (1.6) | | (1.6) | % |
| Gain on Divestitures, Net | | — |
| | — | % | | 17,604 |
| | 3.2 | % |
| | Loss on Extinguishment of Debt | |
| Loss on Extinguishment of Debt | |
| Loss on Extinguishment of Debt | | | — | | | — | % | | (295) | | | — | % |
| | Other Income, Net | |
| Other Income, Net | |
| Other Income, Net | | 845 |
| | 0.2 | % | | 215 |
| | — | % | | 8,235 | | | 1.1 | | 1.1 | % | | 5,400 | | | 0.8 | | 0.8 | % |
| Income Before Taxes | | 7,609 |
| | 1.4 | % | | 38,113 |
| | 6.9 | % | Income Before Taxes | | 16,379 | | | 2.3 | | 2.3 | % | | 33,322 | | | 4.8 | | 4.8 | % |
| Income Tax (Benefit) Expense | | (12,468 | ) | | nm |
| | 12,852 |
| | nm |
|
| Income Tax Expense | | Income Tax Expense | | 451 | | | nm | | 4,533 | | | nm |
| Net Income | | $ | 20,077 |
| | 3.6 | % | | $ | 25,261 |
| | 4.6 | % | Net Income | | $ | 15,928 | | | 2.1 | | 2.1 | % | | $ | 28,789 | | | 4.0 | | 4.0 | % |
| | | | | | | | | |
| Effective (Benefit) Tax Rate | | (163.8 | )% | | nm |
| | 33.7 | % | | nm |
|
| Effective Tax Rate | |
| Effective Tax Rate | |
| Effective Tax Rate | | | 2.8 | % | | nm | | 13.6 | % | | nm |
| Diluted Earnings Per Share | | $ | 1.74 |
| | nm |
| | $ | 2.24 |
| | nm |
| Diluted Earnings Per Share | | $ | 1.14 | | | nm | | nm | | $ | 2.33 | | | nm | | nm |
nm = not meaningful
Net Revenues by End-Use Market and Operating Segment
Net revenues by end-use market and operating segment during 20172023 and 2016,2022, respectively, were as follows:
| | | | | | | (In thousands) Years Ended December 31, | | % of Net Revenues |
| | | Change | | 2017 | | 2016 | | 2017 | | 2016 |
| | | | (Dollars in thousands)
Years Ended December 31, | | | | | | (Dollars in thousands)
Years Ended December 31, | | % of Net Revenues |
| | Change | | | | Change | | 2023 | | 2022 | | 2023 | | 2022 |
| Consolidated Ducommun | | | | | | | | | | |
| Military and space | | | | | | | | | | |
| Defense electronics | | $ | 25,979 |
| | $ | 203,164 |
| | $ | 177,185 |
| | 36.4 | % | | 32.2 | % |
| Defense structures | | 4,662 |
| | 56,392 |
| | 51,730 |
| | 10.1 | % | | 9.4 | % |
| Military and space | |
| Military and space | | | $ | (16,882) | | | $ | 403,819 | | | $ | 420,701 | | | 53.3 | % | | 59.1 | % |
| Commercial aerospace | | Commercial aerospace | | 61,782 | | | 309,291 | | | 247,509 | | | 40.9 | % | | 34.7 | % |
| Industrial | | Industrial | | (445) | | | 43,882 | | | 44,327 | | | 5.8 | % | | 6.2 | % |
| Total | | Total | | $ | 44,455 | | | $ | 756,992 | | | $ | 712,537 | | | 100.0 | % | | 100.0 | % |
| | Electronic Systems | |
| Electronic Systems | |
| Electronic Systems | |
| Military and space | |
| Military and space | |
| Military and space | | | $ | (20,696) | | | $ | 293,485 | | | $ | 314,181 | | | 68.2 | % | | 71.3 | % |
| Commercial aerospace | | (15,899 | ) | | 240,735 |
| | 256,634 |
| | 43.1 | % | | 46.6 | % | Commercial aerospace | | 10,639 | | | 92,769 | | 92,769 | | | 82,130 | | 82,130 | | | 21.6 | | 21.6 | % | | 18.6 | % |
| Industrial | | (7,201 | ) | | 57,892 |
| | 65,093 |
| | 10.4 | % | | 11.8 | % | Industrial | | (445) | | | 43,882 | | 43,882 | | | 44,327 | | 44,327 | | | 10.2 | | 10.2 | % | | 10.1 | % |
| Total | | $ | 7,541 |
| | $ | 558,183 |
| | $ | 550,642 |
| | 100.0 | % | | 100.0 | % | Total | | $ | (10,502) | | | $ | | $ | 430,136 | | | $ | | $ | 440,638 | | | 100.0 | | 100.0 | % | | 100.0 | % |
| | | | | | | | | | | |
| Structural Systems | | | | | | | | | | |
| Military and space (defense structures) | | $ | 4,662 |
| | $ | 56,392 |
| | $ | 51,730 |
| | 23.4 | % | | 21.0 | % |
| Structural Systems | |
| Structural Systems | |
| Military and space | |
| Military and space | |
| Military and space | | | $ | 3,814 | | | $ | 110,334 | | | $ | 106,520 | | | 33.8 | % | | 39.2 | % |
| Commercial aerospace | | (9,667 | ) | | 185,068 |
| | 194,735 |
| | 76.6 | % | | 79.0 | % | Commercial aerospace | | 51,143 | | | 216,522 | | 216,522 | | | 165,379 | | 165,379 | | | 66.2 | | 66.2 | % | | 60.8 | % |
| Total | | $ | (5,005 | ) | | $ | 241,460 |
| | $ | 246,465 |
| | 100.0 | % | | 100.0 | % | Total | | $ | 54,957 | | | $ | | $ | 326,856 | | | $ | | $ | 271,899 | | | 100.0 | | 100.0 | % | | 100.0 | % |
| | | | | | | | | | | |
| Electronic Systems | | | | | | | | | | |
| Military and space (defense electronics) | | $ | 25,979 |
| | $ | 203,164 |
| | $ | 177,185 |
| | 64.1 | % | | 58.3 | % |
| Commercial aerospace | | (6,232 | ) | | 55,667 |
| | 61,899 |
| | 17.6 | % | | 20.3 | % |
| Industrial | | (7,201 | ) | | 57,892 |
| | 65,093 |
| | 18.3 | % | | 21.4 | % |
| Total | | $ | 12,546 |
| | $ | 316,723 |
| | $ | 304,177 |
| | 100.0 | % | | 100.0 | % |
Net revenues for 20172023 were $558.2$757.0 million compared to $550.6$712.5 million for 2016.2022. The year-over-year increase was primarily due to the following:
•$30.661.8 million higher revenues in our commercial aerospace end-use markets due to higher build rates on large aircraft platforms and other commercial aerospace platforms; partially offset by
•$16.9 million lower revenues in our military and space end-use markets mainly due to increased demand, which favorably impacted our helicopter,lower build rates on various missile platforms and military fixed-wing aircraft platforms, that was partially offset by the divestiturehigher build rates on military rotary-wing aircraft platforms, a portion of our Miltec operations in March 2016; partially offset by
$15.9 million lower revenues in our commercial aerospace end-use markets mainly duewhich was related to the winding down of a regional jet programBLR, and continued softness in demand within the regionalother military and business jet end-use markets; and
$7.2 million lower revenues in our industrial end-use markets.space platforms.
Net Revenues by Major Customers
A significant portion of our net revenues are from our top ten customers as follows:
|
| | | | | | |
| | | Years Ended December 31, |
| | | 2017 | | 2016 |
| Boeing Company | | 16.4 | % | | 17.3 | % |
| Lockheed Martin Corporation | | 5.5 | % | | 5.6 | % |
| Raytheon Company | | 13.5 | % | | 8.4 | % |
| Spirit AeroSystems Holdings, Inc. | | 8.2 | % | | 8.2 | % |
| United Technologies Corporation | | 4.7 | % | | 5.3 | % |
Top ten customers (1) | | 62.5 | % | | 58.6 | % |
| | | | | | | | | | | | | | |
| | Years Ended December 31, |
| | 2023 | | 2022 |
| Boeing Company | | 8.2 | % | | 6.7 | % |
| General Dynamics Corporation | | 3.8 | % | | 5.7 | % |
| | | | |
| Northrop Grumman Corporation | | 5.5 | % | | 5.7 | % |
| RTX Corporation | | 16.8 | % | | 21.6 | % |
| Spirit AeroSystems Holdings, Inc. | | 6.4 | % | | 5.7 | % |
| Viasat, Inc. | | 5.5 | % | | 5.4 | % |
Top ten customers(1) | | 58.7 | % | | 61.4 | % |
(1) Includes The Boeing Company (“Boeing”), Lockheed MartinGeneral Dynamics Corporation (“Lockheed Martin”GD”), Northrop Grumman Corporation (“Northrop”), RTX Corporation (f/k/a Raytheon CompanyTechnologies Corporation) (“Raytheon”RTX”), Spirit AeroSystems Holdings, Inc. (“Spirit”), and United Technologies CorporationViasat, Inc. (“United Technologies”Viasat”).
The revenues from Boeing, Lockheed Martin, Raytheon,GD, Northrop, RTX, Spirit, and United TechnologiesViasat are diversified over a number of commercial, military and space programs and some of which were madegenerated by both operating segments.
Gross Profit
Gross profit consists of net revenues less cost of sales. Cost of sales includes the cost of production of finished products and other expenses related to inventory management, manufacturing quality, and order fulfillment. Gross profit margin decreasedincreased to 18.4%21.6% in 20172023 compared to 19.3%20.3% in 20162022 primarily due to favorable manufacturing volume, partially offset by unfavorable product mix partially offset byand higher volume.other manufacturing costs.
Selling, General and Administrative (“SG&A”) Expenses
SG&A expenses increased $2.0$21.4 million in 20172023 compared to 20162022 primarily due to BLR SG&A expenses of $10.7 million which did not exist in the prior year period, higher compensation and benefitbenefits costs of $3.1$4.2 million, partially offset byhigher stock-based compensation expense of $3.9 million, and higher professional services fees of $1.6 million, a decrease dueportion of which was related to the divestitures of our Pittsburgh and Miltec operations and closure of certain facilities of $1.3 million.BLR acquisition.
Restructuring Charges
Restructuring charges increased $8.7$8.2 million (of which $0.5 million was included(the portion recorded in cost of sales)sales decreased $0.2 million) in 20172023 compared to 20162022 primarily due to the restructuring plan that was implementedapproved and commenced in 2017April 2022 that is expected to increase operating efficiencies.better position us for stronger performance. See Note 3 to our consolidated financial statements included in Part IV, Item 15(a) of this Annual Report on Form 10-K for further information on restructuring activities.information.
Interest Expense
Interest expense was essentially flatincreased in 20172023 compared to 20162022 primarily due to higher interest rates and a lowerhigher outstanding Term Loandebt balance, a result of voluntary principal prepayments on our credit facilities, offset by higher utilization of the Revolving Credit Facility, includingmainly due to the acquisition of LDS. See BLR on April 25, 2023. See Note 102and Note 9 to our consolidated financial statements included in Part IV, Item 15(a) of this Annual Report on Form 10-K for further information on our long-term debt.information.
Income Tax Expense
We recorded an income tax benefit of $12.5 million (an effective tax benefit rate of 163.8%) in 2017, compared to income tax expense of $12.9$0.5 million (an effective tax rate of 33.7%2.8%) in 2016.2023, compared to $4.5 million (an effective tax rate of 13.6%) in 2022. The decrease in the effective tax rate for 20172023 compared to 20162022 was primarily due to $13.0 million of provisional deferred income tax benefit recorded in connection with the Tax Cuts
and Jobs Act (the “2017 Tax Act”). The reduction in the U.S. corporate tax rate from 35.0% to 21.0% required the federal portion of our deferred tax assets and liabilities at December 31, 2017 to be re-measured at the enacted tax rate expected to apply when the temporary differences are to be realized or settled using 21.0%. In addition, thelower pre-tax income in 2017 was lowerfor 2023 compared to 2016 pre-tax income2022, which caused tax incentives such asthe research and development tax credits and discrete items to have a greaterhigher income tax benefit impact on ourthe effective tax rate. The higher income tax benefit on the effective tax rate was partially offset by higher income tax expense related to non-deductible book compensation expenses.
Our unrecognized tax benefits were $5.3$4.5 million and $3.0$4.9 million in 20172023 and 2016,2022, respectively. We record interest and penalty charge,charges, if any, related to uncertain tax positions as a component of tax expense and unrecognized tax benefits. The amounts accrued for interest and penalty charges as of December 31, 20172023 and 20162022 were not significant. If recognized, $3.4$2.6 million would affect the effective income tax rate. We do not reasonablyAs a result of statute of limitations set to expire in 2024, we expect significant increases or decreases to our unrecognized tax benefits of $0.8 million in the next twelve months.
We file U.S. Federal and state income tax returns. During the fourth quarter of 2017,We are subject to examination by the Internal Revenue Service (“IRS”) completed the audit offor tax years 2013, 2014,after 2019 and 2015. Consequently, Federal incomeby state taxing authorities for tax returnsyears after 2015 are subject to examination. California franchise (income) tax returns after 2012 and other state income tax returns after 2012 are subject to examination.2018. While we are no longer subject to examination prior to those periods, carryforwards generated prior to those periods may still be adjusted upon examination by the IRS or state taxing authority if they either have been or will be used in a subsequent period. We believe we have adequately accrued for tax deficiencies or reductions in tax benefits, if any, that could result from the examination and all open audit years.
The Tax Cuts and Jobs Act of 2017 (“TCJA”), which was signed into U.S. law in December 2017, eliminated the option to immediately deduct research and development expenditures in the year incurred under Section 174 effective January 1, 2022. The amended provision under Section 174 requires us to capitalize and amortize these expenditures over five years (for U.S.-based research). For the year ended December 31, 2023, we recorded an increase to income taxes payable of $9.7 million and a decrease to net deferred tax liabilities of a similar amount. We are monitoring legislation for any further changes to Section 174 and the potential impact to our financial statements in 2024.
In August 2022, the U.S. enacted the Inflation Reduction Act of 2022 (“IRA”) which aims to curb inflation by reducing the deficit, lowering prescription drug prices, and investing in domestic energy production while promoting clean energy. We considered the provisions in the IRA and determined they have no or minimal impact to our overall income taxes.
In August 2022, the U.S. enacted the Creating Helpful Incentives to Produce Semiconductors Act of 2022 (“CHIPS Act”) which provides new funding to boost domestic research and manufacturing of semiconductors in the United States. We considered the provisions in the CHIPS Act and determined they have no or minimal impact to our overall income taxes.
Net Income and Earnings per Diluted Share
Net income and earnings per diluted share for 20172023 were $20.1$15.9 million, or $1.74,$1.14 per diluted share, compared to net income and earnings per diluted share for 2016 were $25.32022 of $28.8 million, or $2.24.$2.33 per diluted share. The decrease in net income in 20172023 compared to 20162022 was primarily due to the following:
Prior year included a pre-tax gain on divestitures, nethigher SG&A expenses of our Pittsburgh and Miltec operations$21.4 million, higher interest expense of $17.6 million;
Higher$9.2 million, higher restructuring charges of $8.7$8.2 million (of which $0.5 million is included(the portion recorded in cost of sales)
Lowersales decreased $0.2 million), partially offset by higher gross profit of $2.9$18.9 million, (which excludes $0.5 million of restructuring charges in cost of sales); and
Higher SG&A expenses of $2.0 million; partially offset by
Lowerlower income tax expense of $25.3$4.1 million, and higher other income, net of $2.8 million.
Business Segment Performance
We report our financial performance based upon the two reportable operating segments: StructuralElectronic Systems and ElectronicStructural Systems. The results of operations differ between our reportable operating segments due to differences in competitors, customers, extent of proprietary deliverables and performance. The following table summarizes our business segment performance for 20172023 and 2016:2022:
| | | | | | | | | | | | | | | | | | | | | | | | | | | | | | | | |
| | % | | (Dollars in thousands)
Years Ended December 31, | | %
of Net Revenues | | %
of Net Revenues |
| | Change | | 2023 | | 2022 | | 2023 | | 2022 |
| Net Revenues | | | | | | | | | | |
| Electronic Systems | | (2.4) | % | | $ | 430,136 | | | $ | 440,638 | | | 56.8 | % | | 61.8 | % |
| Structural Systems | | 20.2 | % | | 326,856 | | | 271,899 | | | 43.2 | % | | 38.2 | % |
| Total Net Revenues | | 6.2 | % | | $ | 756,992 | | | $ | 712,537 | | | 100.0 | % | | 100.0 | % |
| Segment Operating Income | | | | | | | | | | |
| Electronic Systems | | | | $ | 42,086 | | | $ | 49,876 | | | 9.8 | % | | 11.3 | % |
| Structural Systems | | | | 23,460 | | | 17,225 | | | 7.2 | % | | 6.3 | % |
| | | | 65,546 | | | 67,101 | | | | | |
Corporate General and Administrative Expenses (1) | | | | (36,629) | | | (27,313) | | | (4.8) | % | | (3.8) | % |
| Total Operating Income | | | | $ | 28,917 | | | $ | 39,788 | | | 3.8 | % | | 5.6 | % |
| Adjusted EBITDA | | | | | | | | | | |
| Electronic Systems | | | | | | | | | | |
| Operating Income | | | | $ | 42,086 | | | $ | 49,876 | | | | | |
| | | | | | | | | | |
| Other Income | | | | 222 | | | — | | | | | |
| Depreciation and Amortization | | | | 14,276 | | | 13,974 | | | | | |
| Stock-Based Compensation Expense | | | | 462 | | | 186 | | | | | |
| Restructuring Charges | | | | 6,412 | | | 3,786 | | | | | |
| | | | | | | | | | |
| | | | | | | | | | |
| | | | 63,458 | | | 67,822 | | | 14.8 | % | | 15.4 | % |
| Structural Systems | | | | | | | | | | |
| Operating Income | | | | 23,460 | | | 17,225 | | | | | |
| | | | | | | | | | |
| Depreciation and Amortization | | | | 18,060 | | | 17,212 | | | | | |
| Stock-Based Compensation Expense | | | | 387 | | | 163 | | | | | |
| Restructuring Charges | | | | 8,334 | | | 2,900 | | | | | |
| Inventory Purchase Accounting Adjustments | | | | 5,531 | | | 1,381 | | | | | |
| Guaymas Fire Related Expenses | | | | 3,896 | | | 4,466 | | | | | |
| Other Fire Related Expenses | | | | 477 | | | — | | | | | |
| | | | 60,145 | | | 43,347 | | | 18.4 | % | | 15.9 | % |
Corporate General and Administrative Expenses (1) | | | | | | | | | | |
| Operating Loss | | | | (36,629) | | | (27,313) | | | | | |
| | | | | | | | | | |
| | | | | | | | | | |
| Depreciation and Amortization | | | | 235 | | | 235 | | | | | |
| Stock-Based Compensation Expense | | | | 14,196 | | | 10,395 | | | | | |
| Restructuring Charges | | | | 109 | | | — | | | | | |
| Other Debt Refinancing Costs | | | | — | | | 224 | | | | | |
| | | | | | | | | | |
| | | | (22,089) | | | (16,459) | | | | | |
| Adjusted EBITDA | | | | $ | 101,514 | | | $ | 94,710 | | | 13.4 | % | | 13.3 | % |
| | | | | | | | | | |
| | | | | | | | | | |
| | | | | | | | | | |
| | | | | | | | | | |
| | | | | | | | | | |
| Capital Expenditures | | | | | | | | | | |
| Electronic Systems | | | | $ | 6,007 | | | $ | 10,717 | | | | | |
| Structural Systems | | | | 13,127 | | | 8,834 | | | | | |
| Corporate Administration | | | | — | | | — | | | | | |
| Total Capital Expenditures | | | | $ | 19,134 | | | $ | 19,551 | | | | | |
(1)Includes costs not allocated to either the Electronic Systems or Structural Systems operating segments.
|
| | | | | | | | | | | | | | | | | |
| | | % | | (In thousands) Years Ended December 31, | | % of Net Revenues | | % of Net Revenues |
| | | Change | | 2017 | | 2016 | | 2017 | | 2016 |
| Net Revenues | | | | | | | | | | |
| Structural Systems | | (2.0 | )% | | $ | 241,460 |
| | $ | 246,465 |
| | 43.3 | % | | 44.8 | % |
| Electronic Systems | | 4.1 | % | | 316,723 |
| | 304,177 |
| | 56.7 | % | | 55.2 | % |
| Total Net Revenues | | 1.4 | % | | $ | 558,183 |
| | $ | 550,642 |
| | 100.0 | % | | 100.0 | % |
| Segment Operating Income | | | | | | | | | | |
| Structural Systems | | | | $ | 5,477 |
| | $ | 16,497 |
| | 2.3 | % | | 6.7 | % |
| Electronic Systems | | | | 30,940 |
| | 28,983 |
| | 9.8 | % | | 9.5 | % |
| | | | | 36,417 |
| | 45,480 |
| | | | |
Corporate General and Administrative Expenses (1) | | | | (21,392 | ) | | (16,912 | ) | | (3.8 | )% | | (3.1 | )% |
| Total Operating Income | | | | $ | 15,025 |
| | $ | 28,568 |
| | 2.7 | % | | 5.2 | % |
| Adjusted EBITDA | | | | | | | | | | |
| Structural Systems | | | | | | | | | | |
| Operating Income | | | | $ | 5,477 |
| | $ | 16,497 |
| | | | |
| Other Income | | | | 200 |
| | 141 |
| | | | |
| Depreciation and Amortization | | | | 8,860 |
| | 8,688 |
| | | | |
| Restructuring Charges | | | | 5,866 |
| | — |
| | | | |
| | | | | 20,403 |
| | 25,326 |
| | 8.4 | % | | 10.3 | % |
| Electronic Systems | | | | | | | | | | |
| Operating Income | | | | 30,940 |
| | 28,983 |
| | | | |
| Other Income | | | | 645 |
| | — |
| | | | |
| Depreciation and Amortization | | | | 13,888 |
| | 14,087 |
| | | | |
| Restructuring Charges | | | | 1,190 |
| | 182 |
| | | | |
| Inventory purchase accounting adjustments | | | | 1,235 |
| | — |
| | | | |
| | | | | 47,898 |
| | 43,252 |
| | 15.1 | % | | 14.2 | % |
Corporate General and Administrative Expenses (1) | | | | | | | | | | |
| Operating Loss | | | | (21,392 | ) | | (16,912 | ) | | | | |
| Other Income | | | | — |
| | 74 |
| | | | |
| Depreciation and Amortization | | | | 97 |
| | 85 |
| | | | |
| Stock-Based Compensation Expense | | | | 4,675 |
| | 3,007 |
| | | | |
| Restructuring Charges | | | | 1,782 |
| | — |
| | | | |
| | | | | (14,838 | ) | | (13,746 | ) | | | | |
| Adjusted EBITDA | | | | $ | 53,463 |
| | $ | 54,832 |
| | 9.6 | % | | 10.0 | % |
| Capital Expenditures | | | | | | | | | | |
| Structural Systems | | | | $ | 20,679 |
| | $ | 15,661 |
| | | | |
| Electronic Systems | | | | 5,019 |
| | 3,032 |
| | | | |
| Corporate Administration | | | | 775 |
| | — |
| | | | |
| Total Capital Expenditures | | | | $ | 26,473 |
| | $ | 18,693 |
| | | | |
| |
(1) | Includes costs not allocated to either the Structural Systems or Electronic Systems operating segments. |
Electronic Systems’ net revenues in 2023 compared to 2022 decreased $10.5 million primarily due to the following:
•$20.7 million lower revenues in our military and space end-use markets due to lower build rates on military fixed-wing aircraft platforms and various missile platforms, partially offset by higher build rates on other military and space platforms; partially offset by
•$10.6 million higher revenues in our commercial aerospace end-use markets due to higher build rates on other commercial aerospace platforms, partially offset by lower build rates on regional and business aircraft platforms.
Electronic Systems segment operating income in 2023 compared to 2022 decreased $7.8 million primarily due to unfavorable product mix and higher restructuring charges, partially offset by favorable manufacturing volume.
Structural Systems
Structural Systems’ net revenues in 20172023 compared to 2016 decreased $5.02022 increased $55.0 million primarily due to the following:
•$9.751.1 million lowerhigher revenues in commercial aerospace end-use markets mainly due to the wind down of a regional jet program and continued softness in demand within thehigher build rates on large aircraft platforms, other commercial aerospace platforms, regional and business jet end-use markets; partially offset byaircraft platforms, and commercial rotary-wing aircraft platforms; and
•$4.73.8 million higher revenues in military and space end-use markets mainly due to increased demandhigher build rates on military rotary-wing platforms, a portion of which favorably impacted our helicopterwas related to BLR, and other military and space platforms, partially offset by lower build rates on various missile platforms and military fixed-wing aircraft platforms.
The Structural Systems operating income in 20172023 compared to 2016 decreased primarily due to restructuring charges of $5.9 million, the impact of new program development on large airframe platforms, and lower manufacturing volume.
Electronic Systems
Electronic Systems’ net revenues in 2017 compared to 20162022 increased $12.5$6.2 million primarily due to the following:
$25.9 million higher revenues in our militaryfavorable manufacturing volume and space end-use markets mainly due to increased demand, which favorably impacted our missile, fixed-wing, and helicopter platforms; partially offset by
$7.2 million lower revenues in our Industrial end-use markets; and
$6.2 million lower revenues in our commercial aerospace end-use markets mainly due to continued softness in demand in the business jet market.
Electronic Systems segment operating income in 2017 compared to 2016 increased primarily due to higher manufacturing volume,favorable product mix, partially offset by higher restructuring charges, of $1.2 millionhigher inventory purchase accounting adjustments, and unfavorable product mix.other manufacturing costs.
In June 2020, a fire severely damaged our performance center in Guaymas, Mexico, which is part of our Structural Systems segment. We have insurance coverage and up to a capped amount, expect the damaged items will be covered, less our deductible. The full financial impact cannot be estimated at this time as we are currently working with our insurance carriers to determine the cause of the fire. The loss of production from the Guaymas performance center was being absorbed by our other existing performance centers, however, we have reestablished and are in the process of ramping up our manufacturing capabilities in a different leased facility in Guaymas. A neighboring, non-related manufacturing facility, also suffered fire damage during the same time as the fire that severely damaged our Guaymas performance center. The cause of the fire is still undetermined and as such, there is no amount of loss that is probable and reasonably estimable at this time. If we are ultimately deemed to be responsible or partly responsible, it is possible we could incur a loss in excess of our insurance coverage limits, which could be material to our cash flow, liquidity, or financial results. See Note 13 and Note 15 to our consolidated financial statements included in Part IV, Item 15(a) of this Form 10-K for additional information.
On April 29, 2023, a fire damaged a relatively small portion of one of our performance centers in our Structural Systems reporting segment. Our insurance covers damage, up to a capped amount, to the property and equipment at replacement cost, as well as business interruption and recovery related expenses caused by the fire, less our per claim deductible. There was a loss of production in this damaged portion of the performance center for a short period of time but did not result in significant disruption to customer delivery schedules. Production in this damaged portion has since resumed. The insurance claim for damages to our operating assets and business interruption was deemed final and closed by our insurance company during the fourth quarter of 2023 and since the remaining gain contingencies were deemed resolved, the remaining $0.3 million was recognized in the fourth quarter of 2023, for an aggregate total of $0.4 million recorded as other income during 2023. See Note 15 to our consolidated financial statements included in Part IV, Item 15(a) of this Form 10-K for additional information.
Corporate General and Administrative (“CG&A”) Expenses
CG&A expenses in 20172023 compared to 20162022 increased $9.3 million primarily due to higher stock-based compensation expense of $3.9 million, higher compensation and benefitbenefits costs of $3.1$3.4 million, and restructuring chargeshigher professional services fees of $1.8 million.
$1.5 million, mainly due to the BLR acquisition.
Backlog
We define backlog as customer placed purchase orders (“POs”) and long-term agreements (“LTAs”) with firm fixed price and firmexpected delivery dates of 24 months or less. The majority of the LTAs do not meet the definition of a contract under ASC 606 and thus, the backlog amount disclosed below is greater than the remaining performance obligations amount disclosed in Note 1 to our consolidated financial statements included in Part IV, Item 15(a) of this Form 10-K. Backlog is subject to delivery delays andor program cancellations, which are beyond our control. Backlog is affected by timing differences in the placement of customer
orders and tends to be concentrated in several programs to a greater extent than our net sales. Backlog in Industrial end-use markets tends to be of a shorter duration and is generally fulfilled within a 3-month period.revenues. As a result of these factors, trends in our overall level of backlog may not be indicative of trends in our future net sales.revenues.
Backlog was $726.5 million at December 31, 2017, compared to $641.3 million at December 31, 2016, as shown in more detail below. The increase in backlog was primarily in the military and space end-use markets; partially offset by a decrease in the commercial aerospace end-use markets and defense technologiesindustrial end-use markets. $544.0$656.0 million of total backlog is expected to be delivered during 2018.over the next 12 months. The following table summarizes our backlog for 20172023 and 2016:2022:
| | | | | | | | | | | | | | | | | | | | |
| | | | (Dollars in thousands)
December 31, |
| | Change | | 2023 | | 2022 |
| Consolidated Ducommun | | | | | | |
| Military and space | | $ | 69,789 | | | $ | 527,143 | | | $ | 457,354 | |
| Commercial aerospace | | (20,598) | | | 429,494 | | | 450,092 | |
| Industrial | | (16,443) | | | 36,931 | | | 53,374 | |
| Total | | $ | 32,748 | | | $ | 993,568 | | | $ | 960,820 | |
| | | | | | |
| Electronic Systems | | | | | | |
| Military and space | | $ | 36,099 | | | $ | 397,681 | | | $ | 361,582 | |
| Commercial aerospace | | (37,596) | | | 87,994 | | | 125,590 | |
| Industrial | | (16,443) | | | 36,931 | | | 53,374 | |
| Total | | $ | (17,940) | | | $ | 522,606 | | | $ | 540,546 | |
| | | | | | |
| Structural Systems | | | | | | |
| Military and space | | $ | 33,690 | | | $ | 129,462 | | | $ | 95,772 | |
| Commercial aerospace | | 16,998 | | | 341,500 | | | 324,502 | |
| Total | | $ | 50,688 | | | $ | 470,962 | | | $ | 420,274 | |
|
| | | | | | | | | | | | |
| | | | | (In thousands) December 31, |
| | | Change | | 2017 | | 2016 |
| Consolidated Ducommun | | | | | | |
| Military and space | | | | | | |
| Defense electronics | | $ | 18,931 |
| | $ | 216,508 |
| | $ | 197,577 |
|
| Defense structures | | 2,044 |
| | 60,921 |
| | 58,877 |
|
| Commercial aerospace | | 60,313 |
| | 417,981 |
| | 357,668 |
|
| Industrial | | 3,938 |
| | 31,068 |
| | 27,130 |
|
| Total | | $ | 85,226 |
| | $ | 726,478 |
| | $ | 641,252 |
|
| Structural Systems | | | | | | |
| Military and space (defense structures) | | $ | 2,044 |
| | $ | 60,921 |
| | $ | 58,877 |
|
| Commercial aerospace | | 42,068 |
| | 361,586 |
| | 319,518 |
|
| Total | | $ | 44,112 |
| | $ | 422,507 |
| | $ | 378,395 |
|
| Electronic Systems | | | | | | |
| Military and space (defense electronics) | | $ | 18,931 |
| | $ | 216,508 |
| | $ | 197,577 |
|
| Commercial aerospace | | 18,245 |
| | 56,395 |
| | 38,150 |
|
| Industrial | | 3,938 |
| | 31,068 |
| | 27,130 |
|
| Total | | $ | 41,114 |
| | $ | 303,971 |
| | $ | 262,857 |
|
20162022 Compared to 20152021
The following table sets forth net revenues, selected financial data, the effective tax (benefit) rateSee Item 7. Management’s Discussion and diluted earnings (loss) per share:
|
| | | | | | | | | | | | | | |
| | | (in thousands, except per share data) Years Ended December 31, |
| | | 2016 | | % of Net Revenues 2016 | | 2015 | | % of Net Revenues 2015 |
| Net Revenues | | $ | 550,642 |
| | 100.0 | % | | $ | 666,011 |
| | 100.0 | % |
| Cost of Sales | | 444,449 |
| | 80.7 | % | | 565,219 |
| | 84.9 | % |
| Gross Profit | | 106,193 |
| | 19.3 | % | | 100,792 |
| | 15.1 | % |
| Selling, General and Administrative Expenses | | 77,443 |
| | 14.1 | % | | 83,796 |
| | 12.6 | % |
| Goodwill Impairment | | — |
| | — | % | | 57,243 |
| | 8.6 | % |
| Intangible Asset Impairment | | — |
| | — | % | | 32,937 |
| | 4.9 | % |
| Restructuring Charges | | 182 |
| | — | % | | 2,125 |
| | 0.3 | % |
| Operating Income (Loss) | | 28,568 |
| | 5.2 | % | | (75,309 | ) | | (11.3 | )% |
| Interest Expense | | (8,274 | ) | | (1.5 | )% | | (18,709 | ) | | (2.8 | )% |
| Gain on Divestitures, Net | | 17,604 |
| | 3.2 | % | | — |
| | — | % |
| Loss on Extinguishment of Debt | | — |
| | — | % | | (14,720 | ) | | (2.2 | )% |
| Other Income | | 215 |
| | — | % | | 2,148 |
| | 0.3 | % |
| Income (Loss) Before Taxes | | 38,113 |
| | 6.9 | % | | (106,590 | ) | | (16.0 | )% |
| Income Tax Expense (Benefit) | | 12,852 |
| | nm |
| | (31,711 | ) | | nm |
|
| Net Income (Loss) | | $ | 25,261 |
| | 4.6 | % | | $ | (74,879 | ) | | (11.2 | )% |
| | | | | | | | | |
| Effective Tax (Benefit) Rate | | 33.7 | % | | nm |
| | (29.7 | )% | | nm |
|
| Diluted Earnings (Loss) Per Share | | $ | 2.24 |
| | nm |
| | $ | (6.78 | ) | | nm |
|
nm = not meaningful
Net Revenues by End-Use MarketAnalysis of Financial Condition and Operating Segment
Net revenues by end-use market and operating segment during 2016 and 2015, respectively, were as follows:
|
| | | | | | | | | | | | | | | | | | |
| | | | | (In thousands) Years Ended December 31, | | % of Net Revenues |
| | | Change | | 2016 | | 2015 | | 2016 | | 2015 |
| Consolidated Ducommun | | | | | | | | | | |
| Military and space | | | | | | | | | | |
| Defense electronics | | $ | (35,352 | ) | | $ | 177,185 |
| | $ | 212,537 |
| | 32.2 | % | | 31.9 | % |
| Defense structures | | (23,364 | ) | | 51,730 |
| | 75,094 |
| | 9.4 | % | | 11.3 | % |
| Commercial aerospace | | 7,333 |
| | 256,634 |
| | 249,301 |
| | 46.6 | % | | 37.4 | % |
| Industrial | | (63,986 | ) | | 65,093 |
| | 129,079 |
| | 11.8 | % | | 19.4 | % |
| Total | | $ | (115,369 | ) | | $ | 550,642 |
| | $ | 666,011 |
| | 100.0 | % | | 100.0 | % |
| | | | | | | | | | | |
| Structural Systems | | | | | | | | | | |
| Military and space (defense structures) | | $ | (23,364 | ) | | $ | 51,730 |
| | $ | 75,094 |
| | 21.0 | % | | 27.5 | % |
| Commercial aerospace | | (3,490 | ) | | 194,735 |
| | 198,225 |
| | 79.0 | % | | 72.5 | % |
| Total | | $ | (26,854 | ) | | $ | 246,465 |
| | $ | 273,319 |
| | 100.0 | % | | 100.0 | % |
| | | | | | | | | | | |
| Electronic Systems | | | | | | | | | | |
| Military and space (defense electronics) | | $ | (35,352 | ) | | $ | 177,185 |
| | $ | 212,537 |
| | 58.3 | % | | 54.1 | % |
| Commercial aerospace | | 10,823 |
| | 61,899 |
| | 51,076 |
| | 20.3 | % | | 13.0 | % |
| Industrial | | (63,986 | ) | | 65,093 |
| | 129,079 |
| | 21.4 | % | | 32.9 | % |
| Total | | $ | (88,515 | ) | | $ | 304,177 |
| | $ | 392,692 |
| | 100.0 | % | | 100.0 | % |
Net revenues for 2016 were $550.6 million compared to $666.0 million for 2015. The year-over-year decrease was primarily due to the following:
$64.0 million lower revenuesResults of Operations in our industrial end-use markets mainly due to the divestiture of our Pittsburgh operation in January 2016 and closure of our Houston operation in December 2015;
$58.7 million lower revenues in our military and space end-use markets mainly due to the divestiture of our Miltec operations in March 2016, as well as program delays and budget changes, which impacted our fixed-wing and helicopter platforms and pushed out scheduled deliveries of these products to customers; partially offset by
$7.3 million higher revenues in our commercial aerospace end-use markets mainly due to added content with existing customers.
Net Revenues by Major Customers
A significant portion of our net revenues are from our top ten customers as follows:
|
| | | | | | |
| | | Years Ended December 31, |
| | | 2016 | | 2015 |
| Boeing | | 17.3 | % | | 16.0 | % |
| Lockheed Martin | | 5.6 | % | | 1.2 | % |
| Raytheon | | 8.4 | % | | 8.7 | % |
| Spirit | | 8.2 | % | | 7.4 | % |
| United Technologies | | 5.3 | % | | 6.1 | % |
Top ten customers (1) | | 58.6 | % | | 55.7 | % |
(1) Includes Boeing, Raytheon, Spirit, and United Technologies for 2016 and 2015 and Lockheed Martin for 2016.
The revenues from Boeing, Lockheed Martin, Raytheon, Spirit, and United Technologies are diversified over a number of commercial, military and space programs and were made by both operating segments.
Gross Profit
Gross profit consists of net revenues less cost of sales. Cost of sales includes the cost of production of finished products and other expenses related to inventory management, manufacturing quality, and order fulfillment. Gross profit margin increased to 19.3% in 2016 compared to 15.1% in 2015 primarily due to the following:
2015 included a forward loss reserve charge related to a regional jet program of $12.2 million; and
Total material costs as a percentage of revenues decreased 1.8% compared to the prior year as a result of our on-going supply chain initiatives and improved operating performance.
Selling, General and Administrative Expenses
SG&A expenses decreased $6.4 million in 2016 compared to 2015 primarily due to the decrease of $9.4 million related to the divestitures of our Pittsburgh and Miltec operations and closures of facilities.
Interest Expense
Interest expense decreased in 2016 compared to 2015 primarily due to a lower outstanding debt balance as a result of net voluntary principal prepayments on our new credit facilities and a lower average interest rate as a result of completing the refinancing of our debt in July 2015. See Note 10 to our consolidated financial statements included in Part IV, Item 15(a) of this Annual Report on2022 Form 10-K for further information on our long-term debt.
Income Tax Expense (Benefit)
We recorded income tax expense of $12.9 million (an effective tax rate of 33.7%) in 2016, compared to an income tax benefit of $31.7 million (an effective tax benefit rate of 29.7%) in 2015. The increase in the effective tax rate for 2016 compared to 2015 was primarily due to pre-tax income in 2016, which included a gain on divestitures, net of our Pittsburgh and Miltec operations of $17.6 million compared to a pre-tax loss in the prior year. The $17.6 million gain on divestitures, net resulted in an increase in our state tax liability in 2016. The increase was partially offset by the U.S. Federal research and development tax credit that was permanently extended in 2015 and the deduction for Qualified Domestic Production Activities.
Our unrecognized tax benefits were $3.0 million in both 2016 and 2015. We record interest and penalty charge, if any, related to uncertain tax positions as a component of tax expense and unrecognized tax benefits. The amounts accrued for interest and penalty charge as of December 31, 2016 and 2015 were not significant. If recognized, $2.0 million would affect the effective tax rate. We do not reasonably expect significant increases or decreases to our unrecognized tax benefits in the next twelve months.
We file U.S. Federal and state income tax returns. Federal income tax returns after 2012, California franchise (income) tax returns after 2011 and other state income tax returns after 2011 are subject to examination. We are no longer subject to examination prior to those periods, although carryforwards generated prior to those periods may still be adjusted upon examination by the Internal Revenue Service (“IRS”) or state taxing authority if they either have been or will be used in a subsequent period. During 2016, the IRS commenced an audit of our 2014 and 2015 tax years. Although the outcome of tax examinations cannot be predicted with certainty, we believe we have adequately accrued for tax deficiencies or reductions in tax benefits, if any, that could result from the examination and all open audit years.
Net Income (Loss) and Earnings (Loss) per Diluted Share
Net income and income per diluted share for 2016 were $25.3 million, or $2.24 per diluted share, compared to a net loss and loss per share for 2015 were $(74.9) million, or $(6.78). The increase in net income in 2016 compared to 2015 was primarily due to the following:
Prior year included a non-cash pre-tax goodwill impairment charge of $57.2 million;
Prior year included a non-cash pre-tax charge related to the impairment of an indefinite-lived trade name of $32.9 million;
Prior year included a loss on extinguishment of debt of $14.7 million related to completing a new credit facility to replace the existing credit facilities alongfiled with the redemption of the $200.0 million senior unsecured notes;SEC on February 16, 2023.
Prior year included a forward loss reserve charge related to a regional jet program of $12.2 million;
A pre-tax gain on divestitures, net of our Pittsburgh and Miltec operations of $17.6 million;
Lower interest expense of $10.4 million;
Lower SG&A expenses related to the divestitures of our Pittsburgh and Miltec operations and closures of facilities in aggregate totaling $9.4 million; and
Improved operating performance; partially offset by
Higher income tax expense of $44.6 million.
Business Segment Performance
We report our financial performance based upon the two reportable operating segments; Structural Systems and Electronic Systems. The results of operations differ between our reportable operating segments due to differences in competitors, customers, extent of proprietary deliverables and performance. The following table summarizes our business segment performance for 2016 and 2015:
|
| | | | | | | | | | | | | | | | | |
| | | % | | (In thousands) Years Ended December 31, | | % of Net Revenues | | % of Net Revenues |
| | | Change | | 2016 | | 2015 | | 2016 | | 2015 |
| Net Revenues | | | | | | | | | | |
| Structural Systems | | (9.8 | )% | | $ | 246,465 |
| | $ | 273,319 |
| | 44.8 | % | | 41.0 | % |
| Electronic Systems | | (22.5 | )% | | 304,177 |
| | 392,692 |
| | 55.2 | % | | 59.0 | % |
| Total Net Revenues | | (17.3 | )% | | $ | 550,642 |
| | $ | 666,011 |
| | 100.0 | % | | 100.0 | % |
| Segment Operating Income (Loss) | | | | | | | | | | |
| Structural Systems | | | | $ | 16,497 |
| | $ | (53,010 | ) | | 6.7 | % | | (19.4 | )% |
| Electronic Systems | | | | 28,983 |
| | (4,472 | ) | | 9.5 | % | | (1.1 | )% |
| | | | | 45,480 |
| | (57,482 | ) | | | | |
Corporate General and Administrative Expenses (1) | | | | (16,912 | ) | | (17,827 | ) | | (3.1 | )% | | (2.7 | )% |
| Total Operating Income (Loss) | | | | $ | 28,568 |
| | $ | (75,309 | ) | | 5.2 | % | | (11.3 | )% |
| Adjusted EBITDA | | | | | | | | | | |
| Structural Systems | | | | | | | | | | |
Operating Income (Loss) (2)(3) | | | | $ | 16,497 |
| | $ | (53,010 | ) | | | | |
Other Income (4) | | | | 141 |
| | 1,510 |
| | | | |
| Depreciation and Amortization | | | | 8,688 |
| | 9,417 |
| | | | |
| Goodwill Impairment | | | | — |
| | 57,243 |
| | | | |
| Restructuring Charges | | | | — |
| | 1,294 |
| | | | |
| | | | | 25,326 |
| | 16,454 |
| | 10.3 | % | | 6.0 | % |
| Electronic Systems | | | | | | | | | | |
Operating Income (Loss) (3)(5) | | | | 28,983 |
| | (4,472 | ) | | | | |
| Other Income | | | | — |
| | 712 |
| | | | |
| Depreciation and Amortization | | | | 14,087 |
| | 17,267 |
| | | | |
| Intangible Asset Impairment | | | | — |
| | 32,937 |
| | | | |
| Restructuring Charges | | | | 182 |
| | 831 |
| | | | |
| | | | | 43,252 |
| | 47,275 |
| | 14.2 | % | | 12.0 | % |
Corporate General and Administrative Expenses (1) | | | | | | | | | | |
| Operating Loss | | | | (16,912 | ) | | (17,827 | ) | | | | |
| Other Income (Expense) | | | | 74 |
| | (74 | ) | | | | |
| Depreciation and Amortization | | | | 85 |
| | 162 |
| | | | |
| Stock-Based Compensation Expense | | | | 3,007 |
| | 3,495 |
| | | | |
| | | | | (13,746 | ) | | (14,244 | ) | | | | |
| Adjusted EBITDA | | | | $ | 54,832 |
| | $ | 49,485 |
| | 10.0 | % | | 7.4 | % |
| Capital Expenditures | | | | | | | | | | |
| Structural Systems | | | | $ | 15,661 |
| | $ | 11,559 |
| | | | |
| Electronic Systems | | | | 3,032 |
| | 4,419 |
| | | | |
| Corporate Administration | | | | — |
| | 10 |
| | | | |
| Total Capital Expenditures | | | | $ | 18,693 |
| | $ | 15,988 |
| | | | |
| |
(1) | Includes costs not allocated to either the Structural Systems or Electronic Systems operating segments. |
| |
(2) | Goodwill impairment related to Structural Systems operating segment. |
| |
(3) | 2015 includes restructuring charges for severance and benefits and loss on early exit from leases of $0.8 million and $1.3 million recorded in the Electronic Systems and Structural Systems operating segments, respectively. |
| |
(4) | Insurance recoveries related to property and equipment included as other income. |
| |
(5) | Intangible asset impairment related to Electronic Systems operating segment. |
Structural Systems
Structural Systems’ net revenues in 2016 compared to 2015 decreased $26.9 million primarily due to the following:
$23.4 million decrease in military and space revenues mainly due to program delays and budget changes which impacted scheduled deliveries on our fixed-wing and helicopter platforms; and
$3.5 million decrease in commercial aerospace revenues mainly due to the wind down of a regional jet program and continued softness in the commercial helicopter end-use market.
The Structural Systems operating income in 2016 compared to 2015 increased primarily due to higher operating margins in 2016 and the prior year included a $57.2 million non-cash goodwill impairment charge and forward loss reserve charge related to a regional jet program of $12.2 million.
Electronic Systems
Electronic Systems’ net revenues in 2016 decreased primarily due to the following:
$64.0 million decrease in our industrial revenues mainly due to the divestiture of our Pittsburgh operation in January 2016 and closure of our Houston operation in December 2015; and
$35.3 million decrease in our military and space revenue mainly due to the divestiture of our Miltec operation in March 2016 and program delays and budget changes, which impacted scheduled deliveries on our fixed-wing and helicopter platforms; partially offset by
$10.8 million increase in our commercial aerospace revenue mainly due to added content with existing customers.
Electronic Systems segment operating income in 2016 compared to 2015 increased primarily due to the prior year included a $32.9 million non-cash impairment charge of an indefinite-lived trade name intangible asset and higher operating margins in 2016.
Corporate General and Administrative Expenses
CG&A expenses in 2016 compared to 2015 decreased primarily due to lower professional services fees of $1.3 million and lower compensation and benefits of $1.1 million, partially offset by one-time retirement charges of $0.9 million.
LIQUIDITY AND CAPITAL RESOURCES
Available Liquidity
Total debt, the weighted-average interest rate, cash and cash equivalents and available credit facilities were as follows:
| | | | | | | | | | | | | | |
| | (Dollars in millions)
December 31, |
| | 2023 | | 2022 |
| Total debt, including short-term portion | | $ | 266.0 | | | $ | 248.4 | |
| Weighted-average interest rate on debt | | 7.53 | % | | 4.36 | % |
| Term Loans interest rate | | 6.93 | % | | 4.24 | % |
| Cash and cash equivalents | | $ | 42.9 | | | $ | 46.2 | |
| Unused Revolving Credit Facility | | $ | 176.0 | | | $ | 199.8 | |
|
| | | | | | | | |
| | | (In millions) December 31, |
| | | 2017 | | 2016 |
| Total debt, including long-term portion | | $ | 218.1 |
| | $ | 170.0 |
|
| Weighted-average interest rate on debt | | 3.73 | % | | 3.25 | % |
| Term Loan interest rate | | 3.74 | % | | 3.31 | % |
| Cash and cash equivalents | | $ | 2.2 |
| | $ | 7.4 |
|
| Unused Revolving Credit Facility | | $ | 141.6 |
| | $ | 199.0 |
|
OurIn July 2022, we completed a refinancing of all our existing debt by entering into a new term loan (“2022 Term Loan”) and a new revolving credit facility consists of(“2022 Revolving Credit Facility”). The 2022 Term Loan is a $275.0$250.0 million senior secured term loan whichthat matures on June 26, 2020 (“Term Loan”), andJuly 14, 2027. The 2022 Revolving Credit Facility is a $200.0 million senior secured revolving credit facility (“that matures on July 14, 2027. The 2022 Term Loan and 2022 Revolving Credit Facility”), which matures on June 26, 2020 (collectively,Facility, collectively are the “Creditnew credit facilities (“2022 Credit Facilities”). WeIn conjunction with the closing of the 2022 Credit Facilities, we utilized the entire $250.0 million of proceeds from the 2022 Term Loan plus our existing cash on hand to pay off our entire debt balance outstanding of $254.2 million under our prior credit facilities. At the same leverage ratio, the interest rate spread in the 2022 Credit Facilities is lower than the interest rate spread under our prior credit facilities. Interest payments are requiredtypically paid on a monthly or quarterly basis, depending on the interest rate selected, on the last business day each month or quarter. In addition, the 2022 Term Loan requires quarterly amortization payments of 0.625% during year one and year two, 1.250% during year three and year four, and 1.875% during year five of the original outstanding principal balance of the 2022 Term Loan amount, on the last business day each quarter. Further, the undrawn portion of the commitment of the 2022 Revolving Credit Facility is subject to make mandatory prepaymentsa commitment
fee ranging from 0.175% to 0.275%, based upon the Term Loan.consolidated total net adjusted leverage ratio, typically paid on a quarterly basis, on the last business day each quarter. However, the 2022 Revolving Credit Facility does not require any principal installment payments. As of December 31, 2017,2023, we were in compliance with all covenants required under the 2022 Credit Facilities. See Note 109 to
our consolidated financial statements included in Part IV, Item 15(a) of this Annual Report on Form 10-K for further information.
We made the mandatory quarterly amortization payments under our term loans of $6.3 million and $5.1 million during 2023 and 2022, respectively. In addition, we paid down an aggregate total of $30.0 million on the term loans during the first quarter of 2022.
As of December 31, 2023, we had $176.0 million of unused borrowing capacity under the 2022 Revolving Credit Facility, after deducting $0.2 million for standby letters of credit.
In April 2022, management approved and commenced a restructuring plan that will position us for stronger performance. The undrawn portionsrestructuring plan mainly reduces headcount and consolidate facilities. As a result of this restructuring plan, we analyzed the commitmentsneed to write-down inventory and impair long-lived assets, including operating lease right-of-use assets. As of December 31, 2023, we estimate the Credit Facilities are subjectremaining amount of charges related to a commitment fee ranging from 0.175%this initiative to 0.300%, based upon thebe $5.0 million to $7.0 million in total pre-tax restructuring charges through 2023. Of these charges, we estimate $4.5 million to $6.0 million to be cash payments for employee separation and other facility consolidation related expenses, and $0.5 million to $1.0 million to be non-cash charges for impairment of long-lived assets. On an annualized basis, we anticipate these restructuring actions will result in total cost savings of $11.0 million to $13.0 million. See Note 3 to our consolidated total net adjusted leverage ratio. financial statements included in Part IV, Item 15(a) of this Form 10-K for further information.
In July 2017,November 2021, we entered into a technical amendment to the Credit Facilities (“First Amendment”) which provides more flexibility to close certain qualified acquisitions permitted under the Credit Facilities.
In October 2015, we entered intoderivative contracts, U.S. dollar-one month LIBOR forward interest rate cap hedgesswaps designated as cash flow hedges, all with maturityan effective date of January 1, 2024, for an aggregate total notional amount of $150.0 million, weighted average fixed rate of 1.8%, and all terminating on January 1, 2031 (“Forward Interest Rate Swaps”). The Forward Interest Rate Swaps mature on a monthly basis, with fixed amount payer payment dates on the first day of June 2020,each calendar month, commencing on February 1, 2024 through January 1, 2031. See Note 1 and Note 9 to our consolidated financial statements included in aggregate, totaling $135.0 millionPart IV, Item 15(a) of this Form 10-K for further information.
In July 2022, as a result of completing a refinancing of our debt. We paidexisting debt, we were required to complete an amendment of the Forward Interest Rate Swaps (“Amended Forward Interest Rate Swaps”). The Forward Interest Rate Swaps were based on U.S. dollar-one month LIBOR and were amended to be based on one month Term SOFR as borrowings using LIBOR are no longer available under the 2022 Credit Facilities. The Amended Forward Interest Rate Swaps weighted average fixed rate was 1.7% as a totalresult of $1.0 millionthe difference between U.S. dollar-one month LIBOR and one month Term SOFR. See Note 1 and Note 9 to our consolidated financial statements included in connection with entering intoPart IV, Item 15(a) of this Form 10-K for further information.
On April 25, 2023, we completed the interest rate cap hedges.
In September 2017, we acquired all the outstanding interestsacquisition of LDS for aBLR. The initial purchase price of $60.0for BLR was $115.0 million, net of cash acquired, all payable in cash. UponWe paid a gross aggregate of $117.0 million in cash upon the closing of the transaction, we paid $61.4 million in cash by drawing down ontransaction. We utilized the 2022 Revolving Credit Facility. The remaining $0.6 million was paid in October 2017 in cash, also by drawing down onFacility to complete the Revolving Credit Facility.acquisition. See Note 2 to our consolidated financial statements included in Part IV, Item 15(a) of this Annual ReportForm 10-K for further information.
On May 18, 2023, we completed a public offering of our common stock resulting in net proceeds of $85.1 million. The public stock offering net proceeds along with cash on hand were used to pay down $85.2 million on the 2022 Revolving Credit Facility that was drawn on and utilized to complete the acquisition of BLR. See Note 2, Note 9, and Note 10 to our consolidated financial statements included in Part IV, Item 15(a) of this Form 10-K for further information.
We expect to spend a total of $15.0$23.0 million to $17.0$25.0 million for capital expenditures in 20182024, financed by cash generated from operations, which will be lower than 2017, principally to support both growth in existing programs as well as new contract awards at Structuralin Electronic Systems and ElectronicStructural Systems. As part of our strategic plan to become a Tier Two supplier of higher-level assemblies and win new contract awards, additional up-front investment in tooling will be required for newer programs which have higher engineering content and higher levels of complexity in assemblies.
We believe the ongoing aerospace and defense subcontractor consolidation makes acquisitions an increasingly important component of our future growth. We will continue to make prudent acquisitions and capital expenditures for manufacturing equipment and facilities to support long-term contracts for commercial and military aircraft and defense programs.
We continue to depend on operating cash flow and the availability of our 2022 Credit Facilities to provide short-term liquidity. Cash generated from operations and bank borrowing capacity is expected to provide sufficient liquidity to meet our obligations during the next twelve months.months from the date of issuance of these financial statements.
Cash Flow Summary
20172023 Compared to 20162022
Net cash provided by operating activities during 2017 decreased to $35.42023 was $31.1 million, compared to $43.3$32.7 million during 20162022. The lower net cash provided by operating activities during 2023 was primarily due to lower accounts payable mainly due to timing of payments, higher inventories mainly due to longer lead times and to support revenue growth, and lower net income, as a result of restructuring chargespartially offset by lower contract assets and lower gross margin, and lower accounts payable.higher contract liabilities.
Net cash used in investing activities in 2017 of $86.2during 2023 was $133.5 million compared to $19.2 million during 2022. The higher net cash provided by of $34.9 millionused in 2016investing activities during 2023 was primarily due to the payments for the purchaseacquisition of LDS, net of cash acquired of $59.8 million in the current year. In addition, the prior year included proceeds from the divestiture of our Pittsburgh and Miltec operations of $51.9 million. Further, 2017 included higher purchases of property and equipment mainly to support the expansion of our Parsons, Kansas facility.BLR.
Net cash provided by financing activities during 20172023 was $45.5$99.0 million compared to net cash used in of $76.2$43.5 million during 20162022. The higher net cash provided by financing activities during 2023 was primarily due to $85.1 million net proceeds from the issuance of common stock in a public offering and $23.8 million net borrowings fromunder the Revolving Credit Facility that was usedrevolving credit facility for the purchaseacquisition of LDS,BLR, partially offset by repaymentsthe voluntary $30.0 million pay down on term loans in the Credit Facilities.prior year 2022.
20162022 Compared to 20152021
Net cash provided by operating activities during 2016 increased to $43.3 million compared to $23.7 million during 2015 primarily due to higher net income as a resultSee Item 7. Management’s Discussion and Analysis of lower interest expenseFinancial Condition and higher gross margin percentage.
Net cash provided by investing activitiesResults of Operations in 2016 of $34.9 million primarily due to proceeds from the divestiture of the Pittsburgh and Miltec operations, partially offset by capital expenditures, principally to support new contract awards in both Structural Systems and Electronic Systems.
Net cash used in financing activities during 2016 was $76.2 million compared to $50.4 million during 2015 primarily due to net voluntary principal prepayments on our new credit facilities of $75.0 million primarily as a result of the proceeds received from divestiture of the Pittsburgh and Miltec operations during the current-year.
Contractual Obligations
A summary of our contractual obligations at December 31, 2017 was as follows (in thousands):
|
| | | | | | | | | | | | | | | | | | | | |
| | | | | Payments Due by Period |
| | | Total | | Less Than 1 Year | | 1-3 Years | | 3-5 Years | | More Than 5 Years |
| Long-term debt, including current portion | | $ | 218,100 |
| | $ | — |
| | $ | 218,100 |
| | $ | — |
| | $ | — |
|
| Future interest on long-term debt | | 28,483 |
| | 10,266 |
| | 18,217 |
| | — |
| | — |
|
| Operating leases | | 12,360 |
| | 3,586 |
| | 5,347 |
| | 2,874 |
| | 553 |
|
| Pension liability | | 19,387 |
| | 1,739 |
| | 3,574 |
| | 3,806 |
| | 10,268 |
|
Total(1) | | $ | 278,330 |
| | $ | 15,591 |
| | $ | 245,238 |
| | $ | 6,680 |
| | $ | 10,821 |
|
| |
(1) | As of December 31, 2017, we have recorded $5.3 million in long-term liabilities related to uncertain tax positions. We are not able to reasonably estimate the timing of the long-term payments, or the amount by which our liability may increase or decrease over time, therefore, the liability or uncertain tax positions has not been included in the contractual obligations table. |
We have estimated that the fair value of our indemnification obligations as insignificant based upon our history with such obligations and insurance coverage and have included no such obligation in the table above.
Our ultimate liability with respect to groundwater contamination at certain Structural Systems facilities will depend upon a number of factors, including changes in existing laws and regulations, the design and cost of construction, operation and maintenance activities, and the allocation of liability among potentially responsible parties. The above table does not include obligations related to these matters. See Note 17 to our consolidated financial statements included in Part IV, Item 15(a) of this Annual Report on2022 Form 10-K for discussion of our environmental liabilities.filed with the SEC on February 16, 2023.
Off-Balance Sheet Arrangements
Our off-balance sheet arrangements consist of operating and finance leases not recorded as a result of the practical expedients utilized, right of offset of industrial revenue bonds and indemnities.associated failed sales-leasebacks on property and equipment, and indemnities, none of which we believe may have a material current or future effect on our financial condition, liquidity, capital resources, or results of operations.
CRITICAL ACCOUNTING POLICIES AND ESTIMATES
Critical accounting policies and estimates are those accounting policies and estimates that can have a significant impact on the presentation of our financial condition and results of operations and that require the use of subjective estimates based upon past experience and management’s judgment. Because of the uncertainty inherent in such estimates, actual results may differ from these estimates. Below are those policies applied in preparing our financial statements that management believes are the most dependent on the application of estimates and assumptions. See Note 1 to our consolidated financial statements included in Part IV, Item 15(a) of this Annual Report on Form 10-K for additional accounting policies.
Revenue Recognition
Except as described below, we recognize revenue, including revenue fromOur customers typically engage us to manufacture products sold under long-term contracts, when persuasive evidencebased on designs and specifications provided by the end-use customer. This requires the building of an arrangement exists, the price is fixed or determinable, collection is reasonably assuredtooling and delivery ofmanufacturing first article inspection products has occurred or services have been rendered.(prototypes) before volume manufacturing. Contracts with our customers generally include a termination for convenience clause.
We have a significant number of contracts that are started and completed within the same year, as well as contracts derived from long-term agreements and programs that can span several years. We recognize revenue under Accounting Standards Codification 606, “Revenue from Contracts with Customers” (“ASC 606”), which utilizes a five-step model.
The definition of a contract for us is typically defined as a customer purchase order as this is when we achieve an enforceable right to payment. The majority of our contracts are firm fixed-price contracts. The deliverables within a customer purchase order are analyzed to determine the number of performance obligations. At times, in order to achieve economies of scale and based on our customer’s forecasted demand, we may build in advance of receiving a purchase order from our customer. When that occurs, we would not recognize revenue until we have received the customer purchase order.
A performance obligation is a promise in a contract to transfer a distinct good or service to the customer, and is the unit of account under ASC 606. A contract’s transaction price is allocated to each distinct performance obligation and recognized as revenue when, or as, control is transferred and the performance obligation is satisfied. The majority of our contracts have a single performance obligation as the promise to transfer the individual goods or services are highly interrelated or meet the series guidance. For contracts with multiple performance obligations, we allocate the contract transaction price to each performance obligation using our best estimate of the standalone selling price of each distinct good or service in the contract. The primary method used to estimate the standalone selling price is the expected cost plus a margin approach, under which we forecast our expected costs of satisfying a performance obligation and then add an appropriate margin for that distinct good or service.
We manufacture most products to customer specifications and the product cannot be easily modified to satisfy another customer’s order. As such, these products are deemed to have no alternative use once the manufacturing process begins. In the event the customer invokes a termination for convenience clause, we would be entitled to costs incurred to date plus a reasonable profit. Contract costs typically include labor, materials, overhead, and when applicable, subcontractor costs. For most of our products, we are building assets with no alternative use and have enforceable right to payment, and thus, we recognize revenue under the contract method of accounting and record revenues and cost of sales on each contract in accordance with the percentage-of-completion method of accounting, using the units-of-deliveryover time method. Under the units-of-delivery method,
The majority of our performance obligations are satisfied over time as work progresses. Typically, revenue is recognized based upon the number of units delivered duringover time using an input measure (i.e., costs incurred to date relative to total estimated costs at completion, also known as cost-to-cost plus reasonable profit) to determine progress. Our typical revenue contract is a periodfirm fixed price contract, and the cost of raw materials could make up a significant amount of the total costs incurred. As such, we believe using the total costs incurred input method would be the most appropriate method. While the cost of raw materials could make up a significant amount of the total costs incurred, there is a direct relationship between our inputs and the transfer of control of goods or services to the customer.
Contract estimates are recognized based on various assumptions to project the actualoutcome of future events that can span multiple months or years. These assumptions include labor productivity and availability; the complexity of the work to be performed; the cost and availability of materials; and the performance of subcontractors.
As a significant change in one or more of these estimates could affect the progress completed (and related profitability) on our contracts, we review and update our contract-related estimates on a regular basis. We recognize such adjustments under the cumulative catch-up method. Under this method, the impact of the adjustment is recognized in the period the adjustment is identified. Revenue and profit in future periods of contract performance is recognized using the adjusted estimate.
The impact of adjustments in contract estimates on our operating earnings can be reflected in either operating costs allocableand expenses or revenue. See Note 1 to our consolidated financial statements included in Part IV, Item 15(a) of this Form 10-K for the delivered units. Costs allocablenet impact of these adjustments to undelivered units are reportedour consolidated financial statements for 2023 and 2022.
Payments under long-term contracts may be received before or after revenue is recognized. When revenue is recognized before we bill our customer, a contract asset is created for the work performed but not yet billed. Similarly, when we receive payment before we ship our products to our customer and have met the shipping terms, a contract liability is created for the advance or progress payment. When a contract liability and a contract asset exist on the balance sheet as inventory. This method is used in circumstances in whichsame contract, we report it on a company produces units of a basic product under production-type contracts in a continuous or sequential production process to buyers’ specifications. These contracts are primarily fixed-price contracts that vary widely in terms of size, length of performance period, and expected gross profit margins.
Provision for Estimated Losses on Contractsnet basis.
We record provisions for the total anticipated losses on contracts, considering total estimated costs to complete the contract compared to total anticipated revenues, in the period in which such losses are identified. The provisions for estimated losses on contracts require managementus to make certain estimates and assumptions, including those with respect to the future revenue under a contract and the future cost to complete the contract. Management’sOur estimate of the future cost to complete a contract
may include assumptions as to improvementschanges in manufacturing efficiency, and reductions in operating and material costs.costs, and our ability to resolve claims and assertions with our customers. If any of these or other assumptions and estimates do not materialize in the future, we may be required to record additionaladjust the provisions for estimated losses on contracts.
Production Cost The provision for estimated losses on contracts is included as part of Contractscontract liabilities on the consolidated balance sheets.
Production cost of contracts includes non-recurring production costs, such as design and engineering costs, and tooling and other special-purpose machinery necessary to build parts as specified in a contract, and non-recurring production costs such as design and engineering costs.contract. Production costs of contracts are recorded to cost of goods soldsales using the units of delivery method.over time revenue recognition model. We review long-livedthe value of the production cost of contracts on a quarterly basis to ensure when added to the estimated cost to complete, the value is not greater than the estimated realizable value of the related contracts.
Business Combinations
When a business is acquired, we allocate the purchase price by recording the assets within productionacquired and liabilities assumed at their estimated fair values as of the acquisition date, with the excess cost recorded as goodwill. A preliminary fair value is determined once a business is acquired, with the final determination of fair value to be completed no later than one year from the date of acquisition.
To determine the estimated fair value of assets acquired and liabilities assumed requires significant judgment and estimates, including the selection of valuation methodologies, estimates of future revenues, costs and cash flows, discount rates, and selection of contractscomparable companies. We engage the assistance of valuation specialists in concluding on fair value measurements in determining the fair value of assets acquired and liabilities assumed in business combinations.
The fair value of the intangible assets is estimated using several valuation methodologies, including the income based or market based approaches, which represent Level 3 fair value measurements. Inputs to fair value analyses and other aspects of the allocation of the purchase price require judgment. The values for technology and trade name are typically estimated using the relief from royalty methodology, while the value for customer relationships is typically estimated based on a multi-period excess earnings approach. The more significant inputs used in the technology intangible asset valuation included (i) future
revenues, (ii) the technology decay rate, (iii) the royalty rate, and (iv) the discount rate. The more significant inputs used in the customer relationships intangible asset valuation include (i) future revenues, (ii) the projected earnings before interest, taxes, and amortization (“EBITA”) margins, (iii) the customer attrition rates, and (iv) the discount rate. The useful lives are estimated based on the underlying agreements or the future economic benefit expected to be received from the assets.
Acquisition related costs are not included as components of consideration transferred but instead, expensed as incurred and are included in selling, general and administrative expenses in our consolidated statements of income. See Note 2 to our consolidated financial statements included in Part IV, Item 15(a) of this Form 10-K.
Goodwill
Goodwill is evaluated for impairment on an annual basis (which we perform during the fourth quarter) or when events or changes in circumstances indicate that the carrying value of our long-lived assets may not be recoverable. An impairment charge is recognized when the carrying value of an asset exceeds the projected undiscounted future cash flows expected from its use and disposal.
Goodwill and Indefinite-Lived Intangible Asset
Our business acquisitions have resulted in the recognition of goodwill. Goodwill is not amortized but is subject to annual evaluation for impairment (which we perform based on the first day of the fourth fiscal quarter)quarter. If certain factors occur, including significant under performance of our business relative to expected operating results, significant adverse economic and between annual tests, if events indicateindustry trends, significant decline in our market capitalization for an extended period of time relative to net book value, a decision to divest individual businesses within a reporting unit, or a decision to group individual businesses differently, we may be required to perform an interim impairment test prior to the fourth quarter.
For goodwill impairment testing purposes, we have defined our reporting units as Electronic Systems and Structural Systems. We may use either a qualitative or quantitative approach when testing a reporting unit’s goodwill for impairment. The qualitative approach for potential impairment analysis is performed to determine whether it is more likely than not that the fair value of a reporting unit iswas less than its carrying value.
A significant amount of judgment is involved in determining if an indicator of impairment has occurred. Such indicators may include deterioration in general economic conditions, negative developments in equity and credit markets, adverse changes in the markets in which we operate, increases in costs that have a negative effect on earnings and cash flows, or a trend of negative or declining cash flows over multiple periods, among others.
Goodwill is allocated at the reporting unit level, which is defined as an operating segment or one level below an operating segment. We have two internal reporting units: Structural Systems and Electronic Systems. The application of the goodwill impairment test requires significant judgment, including the identification of the reporting units, and the determination of both the carrying value and the fair value of the reporting units. The carrying value of each reporting unit is determined by assigning the assets and liabilities, including existing goodwill, to those reporting units. The determination of the fair value of each reporting unit requires significant judgment, including our estimation of future cash flows, which is dependent upon internal forecasts, estimation of the long-term rate of growth of our businesses, estimation of the useful lives of the assets which will generate the cash flows, determination of our weighted-average cost of capital and other factors. In determining the appropriate discount rate, we considered the weighted-average cost of capital for each reporting unit which, among other factors, considers the cost of common equity capital and the marginal cost of debt of market participants.amount.
The estimates and assumptions used to calculatequantitative approach for potential impairment analysis is performed by comparing the fair value of a reporting unit may change from period to period based upon actual operating results, market conditions and our viewits carrying value, including goodwill. Fair value is estimated by management using a combination of the future trends. The estimatesincome approach (which is based on a discounted cash flow model) and the market approach. Management’s cash flow projections include significant judgments and assumptions, used to determine whether impairment exists and determineincluding the amount and timing of such impairment, ifexpected cash flows, long-term growth rates, and discount rates. The cash flows used in the discounted cash flow model are based on our best estimate of future revenues, gross margins, and adjusted after-tax earnings. If any of these assumptions are subject to a high degree of uncertainty. Theincorrect, it will impact the estimated fair value of a reporting unit would change materially if different assumptions and estimates were used.
We initially perform an assessment of qualitative factors to determine if it is necessary to perform the two-step goodwill impairment test. We test goodwill for impairment using the two-step method if, based on our assessment of the qualitative factors, we determined that it is more likely than not that the fair value of a reporting unit is less than its carrying amount, or if we decide to bypass the qualitative assessment. When performing the two-step impairment test, we use a combination of an income approach, which estimates fair value of the reporting unit based upon future discounted cash flows, and aunit. The market approach which estimates fair value using market multiples for transactionsalso requires management judgment in a set ofselecting comparable companies. Ifcompanies, business acquisitions and the carrying value of the reporting unit exceedstransaction values observed and its fair value, we then perform the second step of the impairment test to measure the amount of the impairment loss, if any. The second step compares the implied fair value of goodwill with the carrying amount of that goodwill. The implied fair value of goodwill is determined in the same manner as the amount of goodwill recognized in a business combination. The implied fair value of the reporting unit’s goodwill is calculated by creating a hypothetical purchase price allocation as if the reporting unit had just been acquired. This balance sheet contains all assets and liabilities recorded at fair value (including any intangible assets that may not have any corresponding carrying value on our balance sheet). The implied value of the reporting unit’s goodwill is calculated by subtracting the fair value of the net assets from the fair value of the reporting unit. If the carrying amount of goodwill exceeds the implied fair value of that goodwill, an impairment loss is recognized in an amount equal to that excess.related control premiums.
We perform our annual evaluation for impairment of goodwill based on the first day ofIn the fourth fiscal quarter each year. Theof 2023, the carrying amount of goodwill at the date of the most recent annual impairment testevaluation for the Electronic Systems internal reporting unitand Structural Systems was $117.4 million. As of the date of our 2017 annual evaluation formillion and $127.2 million, respectively. For both reporting units, we performed a quantitative (step one) goodwill impairment we used a qualitative
assessment noting it was not more likely than not that theanalysis. The fair value of a reporting unit is less than its carrying amount and thus, goodwill was not deemed impaired.
We review our indefinite-lived intangible asset for impairment on an annual basis or when events or changes in circumstances indicate that the carrying value of our intangible asset may not be recoverable. We may first assess qualitative factors to determine whether it is more likely than not that an indefinite-lived intangible asset is impaired as a basis for determining whether it is necessary to perform the quantitative impairment test. Impairment indicators include, but are not limited to, cost factors, financial performance, adverse legal or regulatory developments, industry and market conditions and general economic conditions. If the carrying amount of the indefinite-lived intangible asset exceeds its fair value, we would recognize an impairment loss in the amount of such excess. In performing our annual impairment test in the fourth quarter of 2015, we concluded the fair value of the indefinite-lived trade name to be zero as a result of divesting businesses in Electronic Systems and our discontinuation of the use of the trade name. Thus, we recorded a $32.9 million of trade name impairment to the ElectronicStructural Systems trade namesegments exceeded their respective carrying value to decrease its trade name carrying value to zero as of December 31, 2015. See Note 7 in Part IV, Item 15(a) of this Annual Report on Form 10-K for further information.values and thus, were not deemed impaired.
Other Intangible Assets
We amortize purchasedacquired other intangible assets with finite lives over the estimated economic lives of the assets, ranging from three2 years to eighteen23 years, generally using the straight-line method. The value of other intangibles acquired through business combinations has been estimated using present value techniques which involve estimates of future cash flows. Actual results could vary, potentially resultingWe evaluate other intangible assets for recoverability considering undiscounted cash flows when significant changes in conditions occur, and recognize impairment charges.losses, if any, based upon the estimated fair value of the assets.
Accounting for Stock-Based Compensation
We usemeasure and recognize compensation expense for share-based payment transactions to our employees and non-employees at their estimated fair value. The expense is measured at the grant date, based on the calculated fair value of the share-based award, and is recognized over the requisite service period (generally the vesting period of the equity award). The fair value of stock options is determined using the Black-Scholes-Merton (“Black-Scholes”) valuation model, in determining stock-based compensation expense for our options, net of an estimated forfeiture rate, on a straight-line basis over the requisite service period of the award. The stock options typically vest over four years and the estimated forfeiture rate is based on historical experience. The Black-Scholes valuation modelwhich requires assumptions and judgments using inputs such asregarding stock price volatility, risk-free interest rates, and expected options terms. As a result, ourManagement’s estimates could differ from actual results.
For performance and restricted stock units, we calculate compensation expense, net of an estimated forfeiture rate, on a straight line basis over the requisite service/performance period of the awards, with The fair value beingof unvested stock awards is determined based on the closing price of the underlying common stock price on the date of grant except for market condition awards for which the fair value was based on a Monte Carlo simulation model. The performance stock units vest based on a three-year performance cycle. The restricted stock units vest over various periods of time ranging from one to three years. We estimate the forfeiture rate based on our historical experience.
Inventories
Inventories are stated at the lower of cost or net realizable value with cost being determined using a moving average cost basis for raw materials and actual cost for work-in-process and finished goods, with units being relieved andgoods. The majority of our inventory is charged to cost of sales on a first-in, first-out basis. Market value foras raw materials is based on replacement cost and for other inventory classifications it is based on net realizable value.are placed into production. Inventoried costs include raw materials, outside processing, direct labor and allocated overhead, adjusted for any abnormal amounts of idle facilityperformance center expense, freight, handling costs, and wasted materials (spoilage) incurred. Costs under long-term contracts are accumulated into, and removed from, inventory on the same basis as other contracts. We assess the inventory carrying value and reduce it, if necessary, to its net realizable value based on customer orders on hand, and internal demand forecasts using management’s best estimates given information currently available. We maintain a reserveThe majority of our revenues are recognized over time, however, for potentially excessrevenue contracts where revenue is recognized
using the point in time method, inventory is not reduced until it is shipped or transfer of control to the customer has occurred. Our ending inventory consists of raw materials, work-in-process, and obsolete inventories and inventories that are carried at costs that are higher than their estimated net realizable values.
We net progress payments from customers related to inventory purchases against inventories in the consolidated balance sheets.finished goods.
Income Taxes
The provisionIncome taxes are accounted for income taxes is determined using an estimated annual effective tax rate, which is generally less thanasset and liability approach that requires the U.S. federal statutory rate, primarily as a resultrecognition of research and development (“R&D”) tax credits available in the United States and deductions available in the United States for domestic production activities. Our effective tax rate may be subject to fluctuations during the year as new information is obtained, which may affect the assumptions used to estimate the annual effective tax rate, including factors such as valuation allowances against deferred tax assets the recognition or derecognition of tax benefits related to uncertain tax positions, expected utilization of R&D tax credits and changes in or the interpretation of tax laws in jurisdictions where we conduct business.
liabilities. Deferred tax assets and liabilities are recognized, using enacted tax rates, for the expected future tax consequences of temporary differences between the book and tax bases of recorded assets and liabilities, operating losses, and tax credit carryforwards. Deferred tax assets are evaluated quarterly and are reduced by a valuation allowance if it is more likely than not that some portion or all of the deferred tax assets will not be realized.
Tax positions taken or expected to be taken in a tax return are recognized when it is more-likely-than-not, based on technical merits, to be sustained upon examination by taxing authorities. The amount recognized is measured as the largest amount of benefit that is greater than 50% likely of being realized upon ultimate settlement, including resolution of related appeals and/or litigation process, if any.
On December 22, 2017, the Tax Cuts and Jobs Act (the “2017 Tax Act”) was enacted. The 2017 Tax Act represents major tax reform legislation that, among other provisions, reduces the U.S. corporate tax rate. Certain provisional amounts for the income tax effects of the 2017 Tax Act, including $13.0 million of deferred income tax benefit recorded principally due to the re-measurement of the federal portion of our deferred tax assets and liabilities, are reflected in our financial results in accordance with SEC Staff Accounting Bulletin No. 118 (“SAB 118”), which provides SEC staff guidance regarding the application of Accounting Standards Codification (“ASC”) Topic 740, “Income Taxes,” in the reporting period in which the 2017 Tax Act became law. See Note 16 in Part IV, Item 15(a) of this Annual Report on Form 10-K for further information.
Environmental Liabilities
Environmental liabilities are recorded when environmental assessments and/or remedial efforts are probable and costs can be reasonably estimated. Generally, the timing of these accruals coincides with the completion of a feasibility study or our commitment to a formal plan of action. Further, we review and update our environmental accruals as circumstances change and/or additional information is obtained that reasonably could be expected to have a meaningful effect on the outcome of a matter or the estimated cost thereof.
Recent Accounting Pronouncements
See Note 1 to our consolidated financial statements included in Part IV, Item 15(a) of this Annual Report on Form 10-K for a description of recent accounting pronouncements.
ITEM 7A. QUANTITATIVE AND QUALITATIVE DISCLOSURES ABOUT MARKET RISK
Our main market risk exposure relates to changes in U.S. interest rates on our outstanding long-term debt. At December 31, 2017,2023, we had borrowings of $218.1$266.0 million under our 2022 Credit Facilities whichFacilities.
The 2022 Term Loan bears interest, at our option, at a rate equal to either an alternate base rate or an adjusted LIBOR rate for a one-, two-, three-, or six-month interest period chosen by us,(i) Term Secured Overnight Financing Rate (“Term SOFR”) plus an applicable margin percentage. This LIBORranging from 1.375% to 2.375% per year or (ii) Base Rate (defined as the highest of [a] Federal Funds Rate plus 0.50%, [b] Bank of America’s prime rate, has aand [c] Term SOFR plus 1.00%, and if the Base Rate is less than zero percent, it will be deemed zero percent) plus an applicable margin ranging from 1.50%0.375% to 2.75%. 1.375% per year, in each case based upon the consolidated total net adjusted leverage ratio.
The 2022 Revolving Credit Facility bears interest, at our option, at a rate equal to either (i) Term SOFR plus an applicable margin ranging from 1.375% to 2.375% per year or (ii) Base Rate (defined as the highest of [a] Federal Funds Rate plus 0.50%, [b] Bank of America’s prime rate, and [c] Term SOFR plus 1.00%, and if the Base Rate is less than zero percent, it will be deemed zero percent) plus an applicable margin ranging from 0.375% to 1.375% per year, in each case based upon the consolidated total net adjusted leverage ratio.
A hypothetical 10% increase or decrease in the interest rate would have an immaterial impact on our financial condition and results of operations.
ITEM 8. FINANCIAL STATEMENTS AND SUPPLEMENTARY DATA
The financial statements and supplementary data together with the report thereon of PricewaterhouseCoopers LLP included in Part IV, Item 15(a) 1 and 2 of this Annual Report on Form 10-K and are included herein by reference.
ITEM 9. CHANGES IN AND DISAGREEMENTS WITH ACCOUNTANTS ON ACCOUNTING AND FINANCIAL DISCLOSURE
None.
ITEM 9A. CONTROLS AND PROCEDURES
Disclosure Controls and Procedures
Disclosure controls and procedures (as defined in Rules 13a-15(e) and 15d-15(e) under the Securities Exchange Act of 1934, as amended (“Exchange Act”)) are designed to provide reasonable assurance that information required to be disclosed in reports we file or submit under the Exchange Act is recorded, processed, summarized and reported within the time periods specified in the rules and forms of the SEC and that such information is accumulated and communicated to our management, including the Chief Executive Officer and Chief Financial Officer, as appropriate to allow timely decisions regarding required disclosures.
Under the supervision and with the participation of our management, including the Chief Executive Officer and the Chief Financial Officer, we carried out an evaluation of the effectiveness of the design and operation of our disclosure controls and
procedures as of the end of the period covered by this Annual Report on Form 10-K. Based on this evaluation, the Company’s
Chief Executive Officer and Chief Financial Officer concluded that our disclosure controls and procedures were not effective at the reasonable assurance level as of December 31, 2017.2023, because of a material weakness in internal control over financial reporting as described below.
Management’s Report on Internal Control Over Financial Reporting
Management is responsible for establishing and maintaining adequate internal control over financial reporting as defined in Rules 13a-15(f) and 15d-15(f) under the Exchange Act. The Company’s internal control over financial reporting is a process designed to provide reasonable assurance regarding the reliability of financial reporting and the preparation of financial statements for external purposes in accordance with generally accepted accounting principles (“GAAP”). The Company’s internal control over financial reporting includes those policies and procedures that (i) pertain to the maintenance of records that, in reasonable detail, accurately and fairly reflect the transactions and dispositions of the assets of the Company; (ii) provide reasonable assurance that transactions are recorded as necessary to permit preparation of financial statements in accordance with GAAP, and that receipts and expenditures of the Company are being made only in accordance with authorizations of management and directors of the Company; and (iii) provide reasonable assurance regarding prevention or timely detection of unauthorized acquisition, use or disposition of the Company’s assets that could have a material effect on our financial statements.
Because of its inherent limitations, internal control over financial reporting may not prevent or detect misstatements. Also, projections of any evaluation of effectiveness to future periods are subject to the risk that controls may become inadequate because of changes in conditions, or that the degree of compliance with the policies or procedures may deteriorate.
Management of the Company has assessed the effectiveness of the Company’s internal control over financial reporting as of December 31, 2017.2023. In making this assessment, management used the criteria set forth by the Committee of Sponsoring Organizations of the Treadway Commission (“COSO”) Internal Control-Integrated Framework (2013).Based
A material weakness is a deficiency, or a combination of deficiencies, in internal control over financial reporting, such that there is a reasonable possibility that a material misstatement of the Company’s annual or interim financial statements will not be prevented or detected on a timely basis. In connection with management’s assessment of our assessment and those criteria,internal control over financial reporting, management concluded thathas identified the Company maintained effectivefollowing material weakness in our internal control over financial reporting as of December 31, 2017.2023.
We did not design and maintain effective controls over the accuracy of contract terms and the reasonableness of gross margin assumptions used to recognize revenue. Specifically, we did not verify that amendments to purchase orders and gross margin percentage assumptions used in the Company’s revenue recognition analysis were properly reviewed at a sufficient level of precision.
This material weakness resulted in immaterial adjustments to net revenues and contract assets as of and for the quarterly and annual periods ending December 31, 2023. Additionally, until remediated, this material weakness could result in future misstatements of net revenues and contract assets that would result in a material misstatement to the annual or interim consolidated financial statements that would not be prevented or detected.
As a result of the material weakness, management concluded our internal control over financial reporting was not effective as of December 31, 2023 based on criteria in Internal Control-Integrated Framework (2013) issued by the COSO.
The effectiveness of the Company’s internal control over financial reporting as of December 31, 20172023 has been audited by PricewaterhouseCoopers LLP, an independent registered public accounting firm, as stated in their report, which is included in Item 15 of this Annual Report on Form 10-K.
Management’s Remediation of Prior Year Material WeaknessActivities
We previously identified and disclosed in our 2016 Annual Report on Form 10-K, as well as in our Quarterly Report on Form 10-Q (Form “10-Q”) for each interim period in fiscal 2017, a material weakness in ourare committed to maintaining strong internal control over financial reporting. With regard to internal control over financial reporting regarding the following:
We did not maintain effective controls related to revenue recognition, our Chief Financial Officer is responsible for implementing changes and improvements in internal control over financial reporting and for remediating the quarterlymaterial weakness.
The Company’s management, with oversight from the Company’s Audit Committee, is in the process of developing and annual accounting and disclosures for income taxes. Specifically, we did not maintain effective controls relatedimplementing remediation plans in response to the preparation, analysisidentified material weakness described above. Specifically, the Company is designing and review of the income tax provision and significant income tax balance sheet accounts required to assessimplementing additional control activities over the accuracy of amendments to purchase orders and completenessenhancing the level of precision utilized to review the income tax amounts reported within the consolidated financial statements and disclosures at period end.reasonableness of gross margin percentage assumptions used in our revenue recognition analysis.
During 2017, we successfully completed the testing necessary to conclude that the controls were operating effectively as of December 31, 2017 and have concluded that theThis material weakness relatedwill not be considered remediated until the applicable remedial controls operate for a sufficient period of time and management has concluded, through testing, that these controls are operating effectively. The Company believes the above measures will remediate the control deficiencies it has identified and strengthen its internal control over financial reporting. The Company is committed to the accountingcontinuing to improve its internal control processes and disclosures for income taxes has been remediated.will continue to review, optimize and enhance its financial reporting controls and procedures.
Changes in Internal Control Over Financial Reporting
There were no changes in our internal control over financial reporting (as defined in Rules 13a-15(f) and 15d-15(f) under the Exchange Act) that have materially affected, or are reasonably likely to materially affect, our internal control over financial reporting during the quarter ended December 31, 2017.2023.
ITEM 9B. OTHER INFORMATION
None.
ITEM 9C. DISCLOSURE REGARDING FOREIGN JURISDICTIONS THAT PREVENT INSPECTIONS
Not applicable.
PART III
ITEM 10. DIRECTORS, EXECUTIVE OFFICERS AND CORPORATE GOVERNANCE
Directors of the Registrant
The information under the caption “Election of Directors”“Directors’ Backgrounds and Qualifications” in the 20182024 Proxy Statement is incorporated herein by reference.
On February 1, 2024, we appointed David B. Carter as a Class I Director, effective immediately, to serve for a term expiring at the annual meeting of stockholders in 2025 and until his successor is elected and qualified.
Executive Officers of the Registrant
The information under the caption “Executive Officers of the Registrant”“Named Executive Officers” in the 20182024 Proxy Statement is incorporated herein by reference.
On December 31, 2017, Anthony J. Reardon resigned as an employee of the Company but will continue to serve as a non-employee Chairman of the Board.
Audit Committee and Audit Committee Financial Expert
The information under the caption “Committees of the Board of Directors” relating to the Audit Committee of the Board of Directors in the 20182024 Proxy Statement is incorporated herein by reference.
Compliance with Section 16(a) of the Exchange Act
The information under the caption “Section“Delinquent Section 16(a) Beneficial Ownership Reporting Compliance”Reports” in the 20182024 Proxy Statement is incorporated herein by reference.
Code of Business Conduct and Ethics
The information under the caption “Code of Business Conduct and Ethics” in the 20182024 Proxy Statement is incorporated herein by reference.
Changes toInsider Trading Policies and Procedures to Recommend Nominees
There have been no material changes toThe information under the procedurescaption “Key Governance Documents” in the 2024 Proxy Statement is incorporated herein by which security holders may recommend nominees to the Company’s Board of Directors since the date of the Company’s last proxy statement.reference.
ITEM 11. EXECUTIVE COMPENSATION
The information under the captions “2023 Compensation Discussion and Analysis” and “Compensation of Executive Officers,” “Compensation of Directors,” “Compensation Committee Interlocks and Insider Participation” and “Compensation Committee Report”Directors” in the 20182024 Proxy Statement is incorporated herein by reference.
ITEM 12. SECURITY OWNERSHIP OF CERTAIN BENEFICIAL OWNERS AND MANAGEMENT AND RELATED STOCKHOLDER MATTERS
The information under the caption “Security Ownership of Certain Beneficial Owners and Management” in the 20182024 Proxy Statement is incorporated herein by reference.
Securities Authorized for Issuance under Equity Compensation Plans
The following table provides information about our compensation plans under which equity securities are authorized for issuance:issuance as of December 31, 2023:
| | | | | | | | | | | | | | | | | | | | |
| | Number of Securities
to be Issued Upon
Exercise of
Outstanding
Options,
Warrants and Rights
(a) | | Weighted-Average
Exercise Price of
Outstanding
Options,
Warrants and Rights
(b) | | Number of Securities
Remaining
Available for
Future Issuance
Under Equity
Compensation Plans
(Excluding Securities
Reflected
in Column
(a))(c)(3) |
Equity compensation plans approved by security holders(1) | | 616,152 | | | $ | 38.66 | | | 141,377 | |
Employee stock purchase plan approved by security holders(2) | | — | | | — | | | 497,766 | |
| Equity compensation plans not approved by security holders | | — | | | — | | | — | |
| Total | | 616,152 | | | | | 639,143 | |
(1)Consists of the Amended and Restated 2020 Stock Incentive Plan. The number of securities to be issued consists of 137,150 for stock options, 209,814 for restricted stock units and 269,188 for performance stock units at target. The weighted average exercise price applies only to the stock options.
(2)The 2018 Employee Stock Purchase Plan enables employees to purchase our common stock at a 15% discount to the lower of the market value at the beginning or end of each six month offering period. As such, the number of shares that may be issued during a given six month period and the purchase price of such shares cannot be determined in advance. See Note 11 to our consolidated financial statements included in Part IV, Item 15(a) of this Annual Report on Form 10-K.
(3)Awards are not restricted to any specified form or structure and may include, without limitation, sales or bonuses of stock, restricted stock, stock options, reload stock options, stock purchase warrants, other rights to acquire stock, securities convertible into or redeemable for stock, stock appreciation rights, limited stock appreciation rights, phantom stock, dividend equivalents, performance units or performance shares, and an award may consist of one such security or benefit, or two or more of them in tandem or in alternative.
|
| | | | | | | | | | |
| | | Number of Securities to be Issued Upon Exercise of Outstanding Options, Warrants and Rights (a) | | Weighted-Average Exercise Price of Outstanding Options, Warrants and Rights (b) | | Number of Securities Remaining Available for Future Issuance Under Equity Compensation Plans (Excluding Securities Reflected in Column (a))(c)(2) |
| Equity Compensation Plans | | | | | | |
Approved by security holders (1) | | 713,069 |
| | $ | 23.38 |
| | 77,693 |
|
| Not approved by security holders | | — |
| | — |
| | — |
|
| Total | | 713,069 |
| | | | 77,693 |
|
| |
(1) | The number of securities to be issued consists of 306,225 for stock options, 185,344 for restricted stock units and 221,500 for performance stock units at target. The weighted average exercise price applies only to the stock options. |
| |
(2) | Awards are not restricted to any specified form or structure and may include, without limitation, sales or bonuses of stock, restricted stock, stock options, reload stock options, stock purchase warrants, other rights to acquire stock, securities convertible into or redeemable for stock, stock appreciation rights, limited stock appreciation rights, phantom stock, dividend equivalents, performance units or performance shares, and an award may consist of one such security or benefit, or two or more of them in tandem or in alternative. |
ITEM 13. CERTAIN RELATIONSHIPS AND RELATED TRANSACTIONS, AND DIRECTOR INDEPENDENCE
The information under the caption “Election of Directors”“Certain Relationships and Related Transactions” and “Director Independence” in the 20182024 Proxy Statement is incorporated herein by reference.
ITEM 14. PRINCIPAL ACCOUNTANT FEES AND SERVICES
The information under the caption “Principal Accountant Fees and Services” and “Policy for Pre-Approval of Independent Accountant Services” contained in the 20182024 Proxy Statement is incorporated herein by reference.
PART IV
ITEM 15. EXHIBITS AND FINANCIAL STATEMENT SCHEDULES
| | | | | | | | |
| (a) | 1. Financial Statements | | |
| (a) | 1. Financial Statements
|
| |
| The following consolidated financial statements of Ducommun Incorporated and subsidiaries, are incorporated by reference in Item 8 of this report. |
| | |
| | Page |
| | | Page
| | |
| | |
|
| | |
| | |
|
| | |
| | |
|
| | |
| | |
|
| | |
| | |
|
| | |
| | |
|
| | |
| | |
|
| | |
| | |
|
| | |
| 2. Financial Statement Schedule | |
| | |
| The following schedule for the years ended December 31, 2017, 20162023, 2022, and 20152021 is filed herewith: | |
| | |
| Schedule II - Consolidated Valuation and Qualifying Accounts | |
|
| | |
| All other schedules have been omitted because they are not applicable, not required, or the information has been otherwise supplied in the financial statements or notes thereto. | |
| | |
| 3. Exhibits | |
| |
| See Item 15(b) for a list of exhibits. | — | |
| |
| |
|
| | | | |
| ITEM 16. FORM 10-K SUMMARY | — | |
Report of Independent Registered Public Accounting Firm
To the Board of Directors and Shareholders of Ducommun Incorporated
Opinions on the Financial Statements and Internal Control over Financial Reporting
We have audited the accompanying consolidated balance sheets of Ducommun Incorporated and its subsidiaries (the “Company”) as of December 31, 20172023 and 2016,2022, and the related consolidated statements of operations,income, of comprehensive income, (loss),of changes in shareholders’ equity and of cash flows for each of the three years in the period ended December 31, 2017,2023, including the related notes and financial statement schedule listed in the index appearing under Item 15(a)2(2) (collectively referred to as the “consolidated financial statements”). We also have audited the Company’s internal control over financial reporting as of December 31, 2017,2023, based on criteria established in Internal Control - Integrated Framework(2013)issued by the Committee of Sponsoring Organizations of the Treadway Commission (COSO).
In our opinion, the consolidatedfinancial statements referred to above present fairly, in all material respects, the financial position of the Company as of December 31, 20172023 and 2016,2022, and the results of theirits operations and theirits cash flows for each of the three years in the period ended December 31, 20172023 in conformity with accounting principles generally accepted in the United States of America. Also in our opinion, the Company maintained,did not maintain, in all material respects, effective internal control over financial reporting as of December 31, 2017,2023, based on criteria established in Internal Control - Integrated Framework (2013) issued by the COSO.COSO because a material weakness in internal control over financial reporting existed as of that date as the Company did not design and maintain effective controls over the accuracy of contract terms and the reasonableness of gross margin assumptions used to recognize revenue. Specifically, the Company did not verify that amendments to purchase orders and gross margin percentage assumptions used in the Company’s revenue recognition analysis were properly reviewed at a sufficient level of precision.
A material weakness is a deficiency, or a combination of deficiencies, in internal control over financial reporting, such that there is a reasonable possibility that a material misstatement of the annual or interim financial statements will not be prevented or detected on a timely basis. The material weakness referred to above is described in Management’s Report on Internal Control Over Financial Reporting appearing under Item 9A. We considered this material weakness in determining the nature, timing, and extent of audit tests applied in our audit of the 2023 consolidated financial statements, and our opinion regarding the effectiveness of the Company’s internal control over financial reporting does not affect our opinion on those consolidated financial statements.
Basis for Opinions
The Company’s management is responsible for these consolidated financial statements, for maintaining effective internal control over financial reporting, and for its assessment of the effectiveness of internal control over financial reporting, included in Management’s Report on Internal Control Over Financial Reporting appearing under Item 9A.management’s report referred to above. Our responsibility is to express opinions on the Company’s consolidatedfinancial statements and on the Company’s internal control over financial reporting based on our audits. We are a public accounting firm registered with the Public Company Accounting Oversight Board (United States) (“PCAOB”)(PCAOB) and are required to be independent with respect to the Company in accordance with the U.S. federal securities laws and the applicable rules and regulations of the Securities and Exchange Commission and the PCAOB.
We conducted our audits in accordance with the standards of the PCAOB. Those standards require that we plan and perform the audits to obtain reasonable assurance about whether the consolidatedfinancial statements are free of material misstatement, whether due to error or fraud, and whether effective internal control over financial reporting was maintained in all material respects.
Our audits of the consolidatedfinancial statements included performing procedures to assess the risks of material misstatement of the consolidatedfinancial statements, whether due to error or fraud, and performing procedures that respond to those risks. Such procedures included examining, on a test basis, evidence regarding the amounts and disclosures in the consolidatedfinancial statements. Our audits also included evaluating the accounting principles used and significant estimates made by management, as well as evaluating the overall presentation of the consolidatedfinancial statements. Our audit of internal control over financial reporting included obtaining an understanding of internal control over financial reporting, assessing the risk that a material weakness exists, and testing and evaluating the design and operating effectiveness of internal control based on the assessed risk. Our audits also included performing such other procedures as we considered necessary in the circumstances. We believe that our audits provide a reasonable basis for our opinions.
Definition and Limitations of Internal Control over Financial Reporting
A company’s internal control over financial reporting is a process designed to provide reasonable assurance regarding the reliability of financial reporting and the preparation of financial statements for external purposes in accordance with generally accepted accounting principles. A company’s internal control over financial reporting includes those policies and procedures that (i) pertain to the maintenance of records that, in reasonable detail, accurately and fairly reflect the transactions and dispositions of the assets of the company; (ii) provide reasonable assurance that transactions are recorded as necessary to permit preparation of financial statements in accordance with generally accepted accounting principles, and that receipts and expenditures of the company are being made only in accordance with authorizations of management and directors of the company; and (iii) provide reasonable assurance regarding prevention or timely detection of unauthorized acquisition, use, or disposition of the company’s assets that could have a material effect on the financial statements.
Because of its inherent limitations, internal control over financial reporting may not prevent or detect misstatements. Also, projections of any evaluation of effectiveness to future periods are subject to the risk that controls may become inadequate because of changes in conditions, or that the degree of compliance with the policies or procedures may deteriorate.
Critical Audit Matters
The critical audit matters communicated below are matters arising from the current period audit of the consolidated financial statements that were communicated or required to be communicated to the audit committee and that (i) relate to accounts or disclosures that are material to the consolidated financial statements and (ii) involved our especially challenging, subjective, or complex judgments. The communication of critical audit matters does not alter in any way our opinion on the consolidated financial statements, taken as a whole, and we are not, by communicating the critical audit matters below, providing separate opinions on the critical audit matters or on the accounts or disclosures to which they relate.
Goodwill Impairment Assessment - Structural Systems Reporting Unit
As described in Notes 1 and 7 to the consolidated financial statements, the Company’s consolidated goodwill balance was $244.6 million as of December 31, 2023, and the goodwill associated with the Structural Systems reporting unit was $127.2 million. Goodwill is evaluated for impairment on an annual basis on the first day of the fourth fiscal quarter. If certain factors occur, management may be required to perform an interim impairment test prior to the fourth quarter. The quantitative approach for potential impairment analysis is performed by comparing the fair value of a reporting unit to its carrying value, including goodwill. Fair value is estimated by management using a combination of the income approach (which is based on a discounted cash flow model) and the market approach. Management’s cash flow projections include significant judgments and assumptions, including the amount and timing of expected cash flows, long-term growth rates, and discount rates. The cash flows used in the discounted cash flow model are based on management’s best estimate of future revenues, gross margins, and adjusted after-tax earnings. The market approach also requires management judgment in selecting comparable companies, business acquisitions and the transaction values observed and its related control premiums.
The principal considerations for our determination that performing procedures relating to the goodwill impairment assessment of the Structural Systems reporting unit is a critical audit matter are (i) the significant judgment by management when developing the fair value estimate of the Structural Systems reporting unit based on a discounted cash flow model; (ii) a high degree of auditor judgment, subjectivity, and effort in performing procedures and evaluating management’s significant assumptions related to the estimate of gross margins and the discount rate; and (iii) the audit effort involved the use of professionals with specialized skill and knowledge.
Addressing the matter involved performing procedures and evaluating audit evidence in connection with forming our overall opinion on the consolidated financial statements. These procedures included testing the effectiveness of controls relating to management’s goodwill impairment assessment, including controls over the valuation of the Structural Systems reporting unit. These procedures also included, among others (i) testing management’s process for developing the fair value estimate of the Structural Systems reporting unit based on a discounted cash flow model; (ii) evaluating the appropriateness of the discounted cash flow model used by management; (iii) testing the completeness and accuracy of underlying data used in the discounted cash flow model; and (iv) evaluating the reasonableness of the significant assumptions used by management related to the estimate of gross margins and the discount rate. Evaluating management’s assumption related to the estimate of gross margins involved evaluating whether the assumption used by management was reasonable considering (i) the current and past performance of the Structural Systems reporting unit; (ii) the consistency with external market and industry data; and (iii) whether the assumption was consistent with evidence obtained in other areas of the audit. Professionals with specialized skill and knowledge were used to assist in evaluating (i) the appropriateness of the discounted cash flow model and (ii) the reasonableness of the discount rate assumption.
Acquisition of BLR Aerospace, L.L.C. - Valuation of Certain Technology and Certain Customer Relationships Intangible Assets
As described in Notes 1 and 2 to the consolidated financial statements, the Company completed the acquisition of BLR Aerospace, L.L.C. for $114.4 million, net of cash acquired, on April 25, 2023. The acquisition resulted in $35.6 million of technology and $15.0 million of customer relationships, of which a significant portion relates to certain technology and certain customer relationships, which were determined using valuation techniques consistent with the income approach to measure fair value. Management estimated fair value using the relief from royalty methodology for technology and the multi-period excess earnings approach for customer relationships. Inputs to the income approach models require judgment. The more significant inputs used in the technology intangible asset valuation included (i) future revenues, (ii) the technology decay rate, (iii) the royalty rate, and (iv) the discount rate. The more significant inputs used in the customer relationships intangible asset valuation included (i) future revenues, (ii) the projected earnings before interest, taxes, and amortization (EBITA) margins, (iii) the customer attrition rates, and (iv) the discount rate.
The principal considerations for our determination that performing procedures relating to the valuation of certain technology and certain customer relationships intangible assets acquired in the acquisition of BLR Aerospace, L.L.C. is a critical audit matter are (i) the significant judgment by management when developing the fair value estimate of certain technology and certain customer relationships intangible assets acquired; (ii) a high degree of auditor judgment, subjectivity, and effort in performing procedures and evaluating management’s significant assumptions related to future revenues, the technology decay rate, the royalty rate, and the discount rate for certain technology and future revenues, the projected EBITA margins, the customer attrition rate, and the discount rate for certain customer relationships; and (iii) the audit effort involved the use of professionals with specialized skill and knowledge.
Addressing the matter involved performing procedures and evaluating audit evidence in connection with forming our overall opinion on the consolidated financial statements. These procedures included testing the effectiveness of controls relating to the acquisition accounting, including controls over management’s valuation of certain technology and certain customer relationships intangible assets acquired. These procedures also included, among others (i) reading the purchase agreement; (ii) testing management’s process for developing the fair value estimate of certain technology and certain customer relationships intangible assets acquired; (iii) evaluating the appropriateness of the relief from royalty methodology and the multi-period excess earnings approach used by management; (iv) testing the completeness and accuracy of the underlying data used in the relief from royalty methodology and the multi-period excess earnings approach; and (v) evaluating the reasonableness of the significant assumptions used by management related to future revenues, the technology decay rate, the royalty rate, and the discount rate for certain technology and future revenues, the projected EBITA margins, the customer attrition rate, and the discount rate for certain customer relationships. Evaluating management’s assumptions related to future revenues for certain technology and future revenues and the projected EBITA margins for certain customer relationships involved considering (i) the current and past performance of BLR Aerospace, L.L.C. and (ii) the consistency with external market and industry data. Professionals with specialized skill and knowledge were used to assist in evaluating (i) the appropriateness of the relief from royalty methodology and the multi-period excess earnings approach and (ii) the reasonableness of the technology decay rate, the royalty rate, and the discount rate assumptions for certain technology and the customer attrition rate and the discount rate assumptions for certain customer relationships.
/s/ PricewaterhouseCoopers LLP
Los Angeles,Irvine, California
February 28, 201822, 2024
We have served as the Company’s auditor since 1989.
Ducommun Incorporated and Subsidiaries
Consolidated Balance Sheets
(InDollars in thousands, except share and per share data)
| | | | | December 31, | | | December 31, |
| | | 2017 | | 2016 | | | 2023 | | 2022 |
| Assets | | | | |
| Current Assets | | | | |
| Current Assets | |
| Current Assets | |
| Cash and cash equivalents | | $ | 2,150 |
| | $ | 7,432 |
|
| Accounts receivable (less allowance for doubtful accounts of $868 and $495 at December 31, 2017 and 2016, respectively) | | 74,064 |
| | 76,239 |
|
| Cash and cash equivalents | |
| Cash and cash equivalents | |
| | Accounts receivable (net of allowance for credit losses of $2,006 and $589 at December 31, 2023 and 2022, respectively) | |
| Accounts receivable (net of allowance for credit losses of $2,006 and $589 at December 31, 2023 and 2022, respectively) | |
| Accounts receivable (net of allowance for credit losses of $2,006 and $589 at December 31, 2023 and 2022, respectively) | |
| Contract assets | |
| Inventories | | 122,161 |
| | 119,896 |
|
| Production cost of contracts | | 11,204 |
| | 11,340 |
|
| Other current assets | | 11,435 |
| | 11,034 |
|
| | Total Current Assets | |
| Total Current Assets | |
| Total Current Assets | | 221,014 |
| | 225,941 |
|
| Property and Equipment, Net | | 110,252 |
| | 101,590 |
|
| Operating Lease Right-of-Use Assets | |
| Goodwill | | 117,435 |
| | 82,554 |
|
| Intangibles, Net | | 114,693 |
| | 101,573 |
|
| Non-Current Deferred Income Taxes | | 261 |
| | 286 |
|
| Deferred Income Taxes | |
| Other Assets | | 3,098 |
| | 3,485 |
|
| Total Assets | | $ | 566,753 |
| | $ | 515,429 |
|
| Liabilities and Shareholders’ Equity | | | | |
| Current Liabilities | | | | |
| Current Liabilities | |
| Current Liabilities | |
| Accounts payable | |
| Accounts payable | |
| Accounts payable | |
| Contract liabilities | |
| Accrued and other liabilities | |
| Operating lease liabilities | |
| Current portion of long-term debt | | $ | — |
| | $ | 3 |
|
| Accounts payable | | 51,907 |
| | 57,024 |
|
| Accrued liabilities | | 28,329 |
| | 29,279 |
|
| Total Current Liabilities | | 80,236 |
| | 86,306 |
|
| Long-Term Debt, Less Current Portion | | 216,055 |
| | 166,896 |
|
| Non-Current Deferred Income Taxes | | 15,981 |
| | 31,417 |
|
| Non-Current Operating Lease Liabilities | |
| Deferred Income Taxes | |
| Other Long-Term Liabilities | | 18,898 |
| | 18,707 |
|
| Total Liabilities | | 331,170 |
| | 303,326 |
|
| Commitments and Contingencies (Notes 14, 17) | |
| |
|
| Commitments and Contingencies (Notes 13, 15) | | Commitments and Contingencies (Notes 13, 15) | | |
| Shareholders’ Equity | | | | |
| Common stock - $0.01 par value; 35,000,000 shares authorized; 11,332,841 and 11,193,813 shares issued and outstanding at December 31, 2017 and 2016, respectively | | 113 |
| | 112 |
|
| Common stock - $0.01 par value; 35,000,000 shares authorized; 14,600,766 and 12,106,285 shares issued and outstanding at December 31, 2023 and 2022, respectively | |
| Common stock - $0.01 par value; 35,000,000 shares authorized; 14,600,766 and 12,106,285 shares issued and outstanding at December 31, 2023 and 2022, respectively | |
| Common stock - $0.01 par value; 35,000,000 shares authorized; 14,600,766 and 12,106,285 shares issued and outstanding at December 31, 2023 and 2022, respectively | |
| | Additional paid-in capital | |
| Additional paid-in capital | |
| Additional paid-in capital | | 80,223 |
| | 76,783 |
|
| Retained earnings | | 161,364 |
| | 141,287 |
|
| Accumulated other comprehensive loss | | (6,117 | ) | | (6,079 | ) |
| Accumulated other comprehensive income | |
| Total Shareholders’ Equity | | 235,583 |
| | 212,103 |
|
| Total Liabilities and Shareholders’ Equity | | $ | 566,753 |
| | $ | 515,429 |
|
See accompanying notes to consolidated financial statements.
Ducommun Incorporated and Subsidiaries
Consolidated Statements of OperationsIncome
(InDollars in thousands, except per share amounts)
| | | | | Years Ended December 31, | | | Years Ended December 31, |
| | | 2017 | | 2016 | | 2015 | | | 2023 | | 2022 | | 2021 |
| Net Revenues | | $ | 558,183 |
| | $ | 550,642 |
| | $ | 666,011 |
|
| Cost of Sales | | 455,363 |
| | 444,449 |
| | 565,219 |
|
| Gross Profit | | 102,820 |
| | 106,193 |
| | 100,792 |
|
| Selling, General and Administrative Expenses | | 79,435 |
| | 77,443 |
| | 83,796 |
|
| Goodwill Impairment | | — |
| | — |
| | 57,243 |
|
| Intangible Asset Impairment | | — |
| | — |
| | 32,937 |
|
| | Restructuring Charges | | 8,360 |
| | 182 |
| | 2,125 |
|
| Operating Income (Loss) | | 15,025 |
| | 28,568 |
| | (75,309 | ) |
| | Restructuring Charges | |
| | Restructuring Charges | |
| Operating Income | |
| Interest Expense | | (8,261 | ) | | (8,274 | ) | | (18,709 | ) |
| Gain on Divestitures, Net | | — |
| | 17,604 |
| | — |
|
| | Loss on Extinguishment of Debt | | — |
| | — |
| | (14,720 | ) |
| Loss on Extinguishment of Debt | |
| Loss on Extinguishment of Debt | |
| Gain on Sale-Leaseback | |
| Other Income, Net | | 845 |
| | 215 |
| | 2,148 |
|
| Income (Loss) Before Taxes | | 7,609 |
| | 38,113 |
| | (106,590 | ) |
| Income Tax (Benefit) Expense | | (12,468 | ) | | 12,852 |
| | (31,711 | ) |
| Net Income (Loss) | | $ | 20,077 |
| | $ | 25,261 |
| | $ | (74,879 | ) |
| Earnings (Loss) Per Share | | | | | | |
| Basic earnings (loss) per share | | $ | 1.78 |
| | $ | 2.27 |
| | $ | (6.78 | ) |
| Diluted earnings (loss) per share | | $ | 1.74 |
| | $ | 2.24 |
| | $ | (6.78 | ) |
| Income Before Taxes | |
| Income Tax Expense | |
| Net Income | |
| Earnings Per Share | |
| Basic earnings per share | |
| Basic earnings per share | |
| Basic earnings per share | |
| Diluted earnings per share | |
| Weighted-Average Number of Shares Outstanding | | | | | | |
| Basic | | 11,290 |
| | 11,151 |
| | 11,047 |
|
| Basic | |
| Basic | |
| Diluted | | 11,558 |
| | 11,299 |
| | 11,047 |
|
See accompanying notes to consolidated financial statements.
Ducommun Incorporated and Subsidiaries
Consolidated Statements of Comprehensive Income (Loss)
(InDollars in thousands)
|
| | | | | | | | | | | | |
| | | Years Ended December 31, |
| | | 2017 | | 2016 | | 2015 |
| Net Income (Loss) | | $ | 20,077 |
| | $ | 25,261 |
| | $ | (74,879 | ) |
| Other Comprehensive Income (Loss), Net of Tax: | | | | | | |
| Pension Adjustments: | | | | | | |
| Amortization of actuarial loss included in net income, net of tax benefit of $302, $283, and $330 for 2017, 2016, and 2015, respectively | | 508 |
| | 479 |
| | 557 |
|
| Actuarial (loss) gain arising during the period, net of tax (benefit) expense of $(194), $(413), and $300 for 2017, 2016, and 2015, respectively | | (304 | ) | | (650 | ) | | 491 |
|
| Decrease in net unrealized gains and losses on cash flow hedges, net of tax benefit of $145, $180, and $0 for 2017, 2016, and 2015, respectively | | (242 | ) | | (305 | ) | | — |
|
| Other Comprehensive (Loss) Income, Net of Tax | | (38 | ) | | (476 | ) | | 1,048 |
|
| Comprehensive Income (Loss), Net of Tax | | $ | 20,039 |
| | $ | 24,785 |
| | $ | (73,831 | ) |
| | | | | | | | | | | | | | | | | | | | |
| | Years Ended December 31, |
| | 2023 | | 2022 | | 2021 |
| Net Income | | $ | 15,928 | | | $ | 28,789 | | | $ | 135,536 | |
| Other Comprehensive Income, Net of Tax: | | | | | | |
| Pension Adjustments: | | | | | | |
| Amortization of actuarial losses and prior service costs, net of tax of $53, $143, and $309 for 2023, 2022, and 2021, respectively | | 167 | | | 442 | | | 976 | |
| Actuarial gains (losses) arising during the period, net of tax of $394, $722, and $902 for 2023, 2022, and 2021, respectively | | (1,268) | | | 2,259 | | | 2,859 | |
| Change in net unrealized (losses) gains on cash flow hedges, net of tax of $344, $3,753, and $391 for 2023, 2022, and 2021, respectively | | 1,127 | | | 12,077 | | | (1,268) | |
| Other Comprehensive Income, Net of Tax | | 26 | | | 14,778 | | | 2,567 | |
| Comprehensive Income, Net of Tax | | $ | 15,954 | | | $ | 43,567 | | | $ | 138,103 | |
See accompanying notes to consolidated financial statements.
Ducommun Incorporated and Subsidiaries
Consolidated Statements of Changes in Shareholders’ Equity
(InDollars in thousands, except share data)
|
| | | | | | | | | | | | | | | | | | | | | | | | | | | |
| | | Shares Outstanding | | Common Stock | | Treasury Stock | | Additional Paid-In Capital | | Retained Earnings | | Accumulated Other Comprehensive Loss | | Total Shareholders’ Equity |
| Balance at December 31, 2014 | | 10,952,268 |
| | $ | 110 |
| | $ | — |
| | $ | 72,206 |
| | $ | 190,905 |
| | $ | (6,651 | ) | | $ | 256,570 |
|
| Net loss | | — |
| | — |
| | — |
| | — |
| | (74,879 | ) | | — |
| | (74,879 | ) |
| Other comprehensive income, net of tax | | — |
| | — |
| | — |
| | — |
| | — |
| | 1,048 |
| | 1,048 |
|
| Stock options exercised | | 167,523 |
| | 1 |
| | — |
| | 3,083 |
| | — |
| | — |
| | 3,084 |
|
| Stock repurchased related to the exercise of stock options | | (137,194 | ) | | (1 | ) | | — |
| | (4,209 | ) | | — |
| | — |
| | (4,210 | ) |
| Stock awards vested | | 101,721 |
| | 1 |
| | — |
| | (1 | ) | | — |
| | — |
| | — |
|
| Stock-based compensation | | — |
| | — |
| | — |
| | 3,495 |
| | — |
| | — |
| | 3,495 |
|
| Excess tax benefits from share-based compensation | | — |
| | — |
| | — |
| | 626 |
| | — |
| | — |
| | 626 |
|
| Balance at December 31, 2015 | | 11,084,318 |
| | $ | 111 |
| | $ | — |
| | $ | 75,200 |
| | $ | 116,026 |
| | $ | (5,603 | ) | | $ | 185,734 |
|
| Net income | | — |
| | — |
| | — |
| | — |
| | 25,261 |
| | — |
| | 25,261 |
|
| Other comprehensive loss, net of tax | | — |
| | — |
| | — |
| | — |
| | — |
| | (476 | ) | | (476 | ) |
| Stock options exercised | | 132,325 |
| | 1 |
| | — |
| | 2,121 |
| | — |
| | — |
| | 2,122 |
|
| Stock repurchased related to the exercise of stock options | | (151,916 | ) | | (1 | ) | | — |
| | (3,464 | ) | | — |
| | — |
| | (3,465 | ) |
| Stock awards vested | | 129,086 |
| | 1 |
| | — |
| | (1 | ) | | — |
| | — |
| | — |
|
| Stock-based compensation | | — |
| | — |
| | — |
| | 3,007 |
| | — |
| | — |
| | 3,007 |
|
| Tax shortfall from share-based compensation | | — |
| | — |
| | — |
| | (80 | ) | | — |
| | — |
| | (80 | ) |
| Balance at December 31, 2016 | | 11,193,813 |
| | $ | 112 |
| | $ | — |
| | $ | 76,783 |
| | $ | 141,287 |
| | $ | (6,079 | ) | | $ | 212,103 |
|
| Net income | | — |
| | — |
| | — |
| | — |
| | 20,077 |
| | — |
| | 20,077 |
|
| Other comprehensive loss, net of tax | | — |
| | — |
| | — |
| | — |
| | — |
| | (38 | ) | | (38 | ) |
| Stock options exercised | | 212,775 |
| | 2 |
| | — |
| | 4,334 |
| | — |
| | — |
| | 4,336 |
|
| Stock repurchased related to the exercise of stock options | | (219,164 | ) | | (2 | ) | | — |
| | (6,902 | ) | | — |
| | — |
| | (6,904 | ) |
| Stock awards vested | �� | 145,417 |
| | 1 |
| | — |
| | (1 | ) | | — |
| | — |
| | — |
|
| Stock-based compensation | | — |
| | — |
| | — |
| | 6,009 |
| | — |
| | — |
| | 6,009 |
|
| Balance at December 31, 2017 | | 11,332,841 |
| | $ | 113 |
| | $ | — |
| | $ | 80,223 |
| | $ | 161,364 |
| | $ | (6,117 | ) | | $ | 235,583 |
|
| | | | | | | | | | | | | | | | | | | | | | | | | | | | | | | | | | | | | | | | |
| | Shares
Outstanding | | Common
Stock | | | | Additional
Paid-In
Capital | | Retained
Earnings | | Accumulated
Other
Comprehensive
Income (Loss) | | Total
Shareholders’
Equity |
| Balance at December 31, 2020 | | 11,728,212 | | | $ | 117 | | | | | $ | 97,090 | | | $ | 241,727 | | | $ | (9,600) | | | $ | 329,334 | |
| Net income | | — | | | — | | | | | — | | | 135,536 | | | — | | | 135,536 | |
| Other comprehensive loss, net of tax | | — | | | — | | | | | — | | | — | | | 2,567 | | | 2,567 | |
| Employee stock purchase plan | | 56,524 | | | 1 | | | | | 2,903 | | | — | | | — | | | 2,904 | |
| Stock options exercised | | 48,769 | | | 1 | | | | | 1,732 | | | — | | | — | | | 1,733 | |
| Stock repurchased related to the exercise of stock options and stock awards vested | | (155,653) | | | (2) | | | | | (8,682) | | | — | | | — | | | (8,684) | |
| Stock awards vested | | 247,235 | | | 2 | | | | | (2) | | | — | | | — | | | — | |
| Stock-based compensation | | — | | | — | | | | | 11,212 | | | — | | | — | | | 11,212 | |
| Balance at December 31, 2021 | | 11,925,087 | | | 119 | | | | | 104,253 | | | 377,263 | | | (7,033) | | | 474,602 | |
| Net income | | — | | | — | | | | | — | | | 28,789 | | | — | | | 28,789 | |
| Other comprehensive income, net of tax | | — | | | — | | | | | — | | | — | | | 14,778 | | | 14,778 | |
| Employee stock purchase plan | | 59,693 | | | 1 | | | | | 2,230 | | | — | | | — | | | 2,231 | |
| Stock options exercised | | 109,186 | | | 1 | | | | | 3,474 | | | — | | | — | | | 3,475 | |
| Stock repurchased related to the exercise of stock options and stock awards vested | | (151,213) | | | (2) | | | | | (7,457) | | | — | | | — | | | (7,459) | |
| Stock awards vested | | 163,532 | | | 2 | | | | | (2) | | | — | | | — | | | — | |
| Stock-based compensation | | — | | | — | | | | | 9,544 | | | — | | | — | | | 9,544 | |
| Balance at December 31, 2022 | | 12,106,285 | | | 121 | | | | | 112,042 | | | 406,052 | | | 7,745 | | | 525,960 | |
| Net income | | — | | | — | | | | | — | | | 15,928 | | | — | | | 15,928 | |
| Other comprehensive income, net of tax | | — | | | — | | | | | — | | | — | | | 26 | | | 26 | |
| Issuance of common stock in public offering, net of issuance costs | | 2,300,000 | | | 23 | | | | | 85,084 | | | — | | | — | | | 85,107 | |
| Employee stock purchase plan | | 52,211 | | | 1 | | | | | 2,541 | | | — | | | — | | | 2,542 | |
| Stock options exercised | | 49,450 | | | — | | | | | 1,564 | | | — | | | — | | | 1,564 | |
| Stock repurchased related to the exercise of stock options and stock awards vested | | (138,929) | | | (1) | | | | | (7,380) | | | — | | | — | | | (7,381) | |
| Stock awards vested | | 231,749 | | | 2 | | | | | (2) | | | — | | | — | | | — | |
| Stock-based compensation | | — | | | — | | | | | 12,348 | | | — | | | — | | | 12,348 | |
| Balance at December 31, 2023 | | 14,600,766 | | | $ | 146 | | | | | $ | 206,197 | | | $ | 421,980 | | | $ | 7,771 | | | $ | 636,094 | |
See accompanying notes to consolidated financial statements.
Ducommun Incorporated and Subsidiaries
Consolidated Statements of Cash Flows
(InDollars in thousands)
|
| | | | | | | | | | | | |
| | | Years Ended December 31, |
| | | 2017 | | 2016 | | 2015 |
| Cash Flows from Operating Activities | | | | | | |
| Net Income (Loss) | | $ | 20,077 |
| | $ | 25,261 |
| | $ | (74,879 | ) |
| Adjustments to Reconcile Net Income (Loss) to | | | | | | |
| Net Cash Provided by Operating Activities: | | | | | | |
| Depreciation and amortization | | 22,845 |
| | 22,860 |
| | 26,846 |
|
| Gain on divestitures, net | | — |
| | (17,604 | ) | | — |
|
| Goodwill impairment | | — |
| | — |
| | 57,243 |
|
| Intangible asset impairment | | — |
| | — |
| | 32,937 |
|
| Property and equipment impairment due to restructuring | | 3,607 |
| | — |
| | — |
|
| Stock-based compensation expense | | 4,675 |
| | 3,007 |
| | 3,495 |
|
| Deferred income taxes | | (15,411 | ) | | 3,519 |
| | (29,110 | ) |
| Excess tax benefits from stock-based compensation | | — |
| | (248 | ) | | (626 | ) |
| Provision for doubtful accounts | | 373 |
| | 112 |
| | 132 |
|
| Noncash loss on extinguishment of debt | | — |
| | — |
| | 4,970 |
|
| Other | | (1,182 | ) | | (7,204 | ) | | 5,628 |
|
| Changes in Assets and Liabilities: | | | | | | |
| Accounts receivable | | 2,720 |
| | 3,220 |
| | 4,444 |
|
| Inventories | | (533 | ) | | (5,182 | ) | | 20,985 |
|
| Production cost of contracts | | (267 | ) | | (1,536 | ) | | 330 |
|
| Other assets | | 40 |
| | 2,974 |
| | 5,884 |
|
| Accounts payable | | (4,015 | ) | | 15,055 |
| | (13,978 | ) |
| Accrued and other liabilities | | 2,505 |
| | (966 | ) | | (20,623 | ) |
| Net Cash Provided by Operating Activities | | 35,434 |
| | 43,268 |
| | 23,678 |
|
| Cash Flows from Investing Activities | | | | | | |
| Purchases of property and equipment | | (27,610 | ) | | (17,001 | ) | | (15,891 | ) |
| Proceeds from sale of assets | | 913 |
| | 16 |
| | 904 |
|
| Insurance recoveries related to property and equipment | | 288 |
| | — |
| | 1,510 |
|
| Proceeds from divestitures | | — |
| | 51,893 |
| | — |
|
| Payments for purchase of Lightning Diversion Systems, LLC, net of cash acquired | | (59,798 | ) | | — |
| | — |
|
| Net Cash (Used in) Provided by Investing Activities | | (86,207 | ) | | 34,908 |
| | (13,477 | ) |
| Cash Flows from Financing Activities | | | | | | |
| Borrowings from senior secured revolving credit facility | | 395,900 |
| | 71,800 |
| | 65,000 |
|
| Repayment of senior secured revolving credit facility | | (337,800 | ) | | (71,800 | ) | | (65,000 | ) |
| Borrowings from term loan | | — |
| | — |
| | 275,000 |
|
| Repayments of senior unsecured notes and term loans | | (10,000 | ) | | (75,000 | ) | | (320,000 | ) |
| Repayments of other debt | | (3 | ) | | (23 | ) | | (26 | ) |
| Debt issuance costs | | — |
| | — |
| | (4,848 | ) |
| Excess tax benefits from stock-based compensation | | — |
| | 248 |
| | 626 |
|
| Net cash paid from issuance of common stock under stock plans | | (2,606 | ) | | (1,423 | ) | | (1,126 | ) |
| Net Cash Provided by (Used in) Financing Activities | | 45,491 |
| | (76,198 | ) | | (50,374 | ) |
| Net (Decrease) Increase in Cash and Cash Equivalents | | (5,282 | ) | | 1,978 |
| | (40,173 | ) |
| Cash and Cash Equivalents at Beginning of Year | | 7,432 |
| | 5,454 |
| | 45,627 |
|
| Cash and Cash Equivalents at End of Year | | $ | 2,150 |
| | $ | 7,432 |
| | $ | 5,454 |
|
| | | | | | | | | | | | | | | | | | | | |
| | Years Ended December 31, |
| | 2023 | | 2022 | | 2021 |
| Cash Flows from Operating Activities | | | | | | |
| Net Income | | $ | 15,928 | | | $ | 28,789 | | | $ | 135,536 | |
| Adjustments to Reconcile Net Income to | | | | | | |
| Net Cash Provided by (Used in) Operating Activities: | | | | | | |
| Depreciation and amortization | | 32,571 | | | 31,421 | | | 28,389 | |
| | | | | | |
| | | | | | |
| | | | | | |
| Non-cash operating lease cost | | 8,215 | | | 7,267 | | | 3,349 | |
| Inventory write-down and property and equipment impairment due to restructuring | | 882 | | | 1,610 | | | — | |
| Stock-based compensation expense | | 15,045 | | | 10,744 | | | 11,212 | |
| Deferred income taxes | | (9,832) | | | (9,392) | | | 1,768 | |
| | | | | | |
| Provision for (recovery of) credit losses | | 1,417 | | | (509) | | | (454) | |
| Noncash loss on extinguishment of debt | | — | | | 295 | | | — | |
| Recognition of insurance recoveries | | (3,886) | | | — | | | — | |
| Gain on sale-leaseback | | — | | | — | | | (132,522) | |
| Other | | 411 | | | 1,060 | | | (505) | |
| Changes in Assets and Liabilities: | | | | | | |
| Accounts receivable | | 1,998 | | | (31,188) | | | (11,689) | |
| Contract assets | | 13,604 | | | (14,885) | | | (22,377) | |
| Inventories | | (15,979) | | | (20,841) | | | (17,129) | |
| Production cost of contracts | | (2,825) | | | 8 | | | (2,311) | |
| Other assets | | (4,330) | | | (1,354) | | | (4,902) | |
| Accounts payable | | (18,420) | | | 24,222 | | | 2,793 | |
| Contract liabilities | | 6,424 | | | 4,991 | | | 13,813 | |
| Operating lease liabilities | | (7,618) | | | (6,473) | | | (3,531) | |
| Accrued and other liabilities | | (2,538) | | | 6,915 | | | (2,005) | |
| Net Cash Provided by (Used in) Operating Activities | | 31,067 | | | 32,680 | | | (565) | |
| Cash Flows from Investing Activities | | | | | | |
| Purchases of property and equipment | | (19,522) | | | (19,689) | | | (16,863) | |
| Proceeds from sale-leaseback | | — | | | — | | | 143,100 | |
| Proceeds from sale of assets | | 404 | | | 82 | | | 553 | |
| | | | | | |
| Proceeds from life insurance | | — | | | — | | | 439 | |
| | | | | | |
| Payments for acquisition of BLR Aerospace L.L.C., net of cash acquired | | (114,378) | | | — | | | — | |
| | | | | | |
| | | | | | |
| Post closing cash received from (payments for acquisition of) Magnetic Seal LLC, net of cash acquired | | — | | | 365 | | | (69,479) | |
| | | | | | |
| | | | | | |
| | | | | | |
| | | | | | |
| Net Cash (Used in) Provided by Investing Activities | | (133,496) | | | (19,242) | | | 57,750 | |
| Cash Flows from Financing Activities | | | | | | |
| Borrowings from senior secured revolving credit facility | | 176,500 | | | 4,000 | | | 96,000 | |
| Repayments of senior secured revolving credit facility | | (152,700) | | | (4,000) | | | (121,000) | |
| Borrowings from term loans | | — | | | 250,000 | | | — | |
| Repayments of term loans | | (6,250) | | | (289,274) | | | (7,926) | |
| Repayments of other debt | | (336) | | | (344) | | | (362) | |
| Debt issuance costs | | — | | | (2,511) | | | — | |
| Proceeds from issuance of common stock in public offering, net of issuance costs | | 85,107 | | | — | | | — | |
| Net cash paid upon issuance of common stock under stock plans | | (3,275) | | | (1,379) | | | (4,047) | |
| Net Cash Provided by (Used in) Financing Activities | | 99,046 | | | (43,508) | | | (37,335) | |
| Net (Decrease) Increase in Cash and Cash Equivalents | | (3,383) | | | (30,070) | | | 19,850 | |
| Cash and Cash Equivalents at Beginning of Year | | 46,246 | | | 76,316 | | | 56,466 | |
| Cash and Cash Equivalents at End of Year | | $ | 42,863 | | | $ | 46,246 | | | $ | 76,316 | |
| | | | | | |
| | | | | | |
| | | | | | |
| | | | | | |
| | | | | | |
See accompanying notes to consolidated financial statements.
DUCOMMUN INCORPORATED AND SUBSIDIARIES
NOTES TO CONSOLIDATED FINANCIAL STATEMENTS
Note 1. Summary of Significant Accounting Policies
Description of Business
We are a leading global provider of engineeringinnovative, value-added proprietary products and manufacturing servicessolutions for high-performance products and high-cost-of failure applications used primarily in the aerospace and defense (“A&D”), industrial, medical, and other industries.industries (collectively, “Industrial”). Our subsidiariesoperations are organized into two primary businesses: Electronic Systems segment (“Electronic Systems”) and Structural Systems segment (“Structural Systems”), each of which is a reportable operating segment. Electronic Systems designs, engineers and manufactures high-reliability electronic and electromechanical products used in worldwide technology-driven markets including aerospaceA&D and defense, industrial, medical, and otherIndustrial end-use markets. Electronic Systems’ product offerings primarily range from prototype development to complex assemblies. Structural Systems designs, engineers and manufactures large, complex contoured aerostructure components and assemblies and supplies composite and metal bonded structures and assemblies. Structural Systems’ products are primarily used on commercial aircraft, military fixed-wing aircraft, and military and commercial rotary-wing aircraft. All reportable operating segments follow the same accounting principles.
Basis of Presentation
The consolidated financial statements have been prepared in accordance with accounting principles generally accepted in the United States of America (“GAAP”), and include the accounts of Ducommun Incorporated and its subsidiaries (“Ducommun,” the “Company,” “we,” “us” or “our”), after eliminating intercompany balances and transactions.
In the opinion of management, all adjustments, consisting of recurring accruals, have been made that are necessary to fairly state our consolidated financial position, results of operations, comprehensive income (loss) and cash flows in accordance with accounting principles generally accepted in the United States of America (“GAAP”).
Our fiscal quarters typically end on the Saturday closest to the end of March, June and September for the first three fiscal quarters of each year, and ends on December 31 for our fourth fiscal quarter. As a result of using fiscal quarters for the first three quarters combined with leap years, our first and fourth fiscal quarters can range between 12 1/2 weeks to 13 1/2 weeks while the second and third fiscal quarters remain at a constant 13 weeks per fiscal quarter.
Use of Estimates
Certain amounts and disclosures included in the consolidated financial statements required management to make estimates and judgments that affect the amount of assets, liabilities (including forward loss reserves), revenues and expenses, and related disclosures of contingent assets and liabilities. These estimates are based on historical experience and on various other assumptions that are believed to be reasonable under the circumstances, the results of which form the basis for making judgments about the carrying values of assets and liabilities that are not readily apparent from other sources. Actual results could differ from these estimates.
Reclassifications
Certain prior period amounts have been reclassified to conform to current year’s presentation.
Supplemental Cash Flow Information
|
| | | | | | | | | | | | |
| | | (In thousands) Years Ended December 31, |
| | | 2017 | | 2016 | | 2015 |
| Interest paid | | $ | 7,307 |
| | $ | 6,877 |
| | $ | 26,501 |
|
| Taxes paid | | $ | 3,125 |
| | $ | 9,778 |
| | $ | 1,150 |
|
| Non-cash activities: | | | | | | |
| Purchases of property and equipment not paid | | $ | 2,104 |
| | $ | 3,241 |
| | $ | 1,549 |
|
| | | | | | | | | | | | | | | | | | | | |
| | (Dollars in thousands)
Years Ended December 31, |
| | 2023 | | 2022 | | 2021 |
| Interest paid | | $ | 19,856 | | | $ | 10,983 | | | $ | 10,135 | |
| Taxes paid, net | | $ | 22,950 | | | $ | 3,825 | | | $ | 32,934 | |
| Non-cash activities: | | | | | | |
| Purchases of property and equipment not paid | | $ | 807 | | | $ | 1,195 | | | $ | 1,333 | |
Fair Value
Assets and liabilities that are measured, recorded or disclosed at fair value on a recurring basis are categorized using the fair value hierarchy. The fair value hierarchy has three levels based on the reliability of the inputs used to determine the fair value.
Level 1, the highest level, refers to the values determined based on quoted prices in active markets.markets for identical assets. Level 2 refers to fair values estimated using significant observable inputs. Level 3, the lowest level, includes fair values estimated using significant unobservable inputs.. See Note 4 for further information.inputs.
We have money market funds and they are included as cash and cash equivalents. We also have forward interest rate swap agreements and the fair value of the forward interest rate swap agreements were determined using pricing models that use observable market inputs as of the balance sheet date, a Level 2 measurement.
There were no transfers between Level 1, Level 2, or Level 3 financial instruments in either 2023 or 2022.
Cash and Cash Equivalents
Cash equivalents consist of highly liquid instruments purchased with original maturities of three months or less.Theseless. These assets are valued at cost, which approximates fair value, which we classify as Level 1. See Fair Value above.
Derivative Instruments
We recognize derivative instruments on our consolidated balance sheets at their fair value. On the date that we enter into a derivative contract, we designate the derivative instrument as a fair value hedge, a cash flow hedge, a hedge of a net investment in a foreign operation, or a derivative instrument that will not be accounted for using hedge accounting methods. In November 2021, we entered into forward interest rate swap agreements with an aggregate notional amount of $150.0 million, all with an effective date of January 1, 2024 (“Forward Interest Rate Swaps”) to manage our exposure to interest rate movements on a portion of our debt. As such, at the time we entered into the Forward Interest Rate Swaps, there was a high probability of forecasted interest payments on our debts occurring and the swaps are highly effective in offsetting those interest payments and therefore, we elected to apply cash flow hedge accounting. In July 2022, as a result of refinancing all our existing debt, which allows borrowing based on a Secured Overnight Financing Rate (“SOFR”), we were required to complete an amendment of the Forward Interest Rate Swaps from One Month London Interbank Offered Rate (“LIBOR”) to One Month Term SOFR (“Amended Forward Interest Rate Swaps”), which occurred on the same day. After the transition of the Forward Interest Rate Swaps and debt to SOFR was completed, we determined the hedging relationship was still highly effective as of the amendment date. See Note 9. As of December 31, 2017 and December 31, 2016,2023, all of our derivative instruments were designated as cash flow hedges.
We record changes in the fair value of a derivative instrument that is highly effective and that is designated and qualifies as a cash flow hedge in other comprehensive income (loss), net of tax until our earnings are affected by the variability of cash flows of the underlying hedge. We record any hedge ineffectiveness and amounts excluded from effectiveness testing in current period earnings within interest expense.hedged item. We report changes in the fair values of derivative instruments that are not designated or do not qualify for hedge accounting in current period earnings. We classify cash flows from derivative instruments onin the consolidated statements of cash flows in the same category as the item being hedged or on a basis consistent with the nature of the instrument. Since the Amended Forward Interest Rate Swaps are not effective until January 1, 2024, we only record the changes in fair value of the derivative instruments that were highly effective and that were designated and qualified as cash flow hedges. As such, during the years ended December 31, 2023 and December 31, 2022, we recorded the unrealized gain to other comprehensive income of $1.1 million and $12.1 million, respectively, and the associated change to other current assets, other assets, and deferred income taxes.
When we determine that a derivative instrument is not highly effective as a hedge, we discontinue hedge accounting prospectively. In all situations in which we discontinue hedge accounting and the derivative instrument remains outstanding, we will carry the derivative instrument at its fair value on our consolidated balance sheets and recognize subsequent changes in its fair value in our current period earnings.
Allowance for Doubtful AccountsCredit Losses
We maintain an allowance for doubtful accountscredit losses for estimatedexpected losses from the inability of customers to make required payments. The allowance for doubtful accountscredit losses is evaluated periodically for expected credit losses based on the aging of accounts receivable, the financial condition of customers and their payment history, the aging of accounts receivable, historical write-off experience and other assumptions, such as current assessment of economic conditions.
Inventories
Inventories are stated at the lower of cost or net realizable value with cost being determined using a moving average cost basis for raw materials and actual cost for work-in-process and finished goods, with units being relieved andgoods. The majority of our inventory is charged to cost of sales on a first-in, first-out basis.as raw materials are placed into production. Inventoried costs include raw materials, outside processing, direct labor and allocated overhead, adjusted for any abnormal amounts of idle facilityperformance center expense, freight, handling costs, and wasted materials (spoilage) incurred. Costs under long-term contracts are accumulated into, and removed from, inventory on the same basis as other contracts. We assess the inventory carrying value and reduce it, if necessary, to its net realizable value based on customer orders on hand, and internal demand forecasts using management’s best estimates given information currently available.
We net progress payments from customers related to inventory purchases against inventories in the consolidated balance sheets.
Production Cost The majority of Contracts
Production cost ofour revenues are recognized over time, however, for revenue contracts includes non-recurring production costs, such as design and engineering costs, and tooling and other special-purpose machinery necessary to build parts as specified in a contract. Production costs of contracts are recorded to cost of goods soldwhere revenue is recognized using the unitspoint in time method, inventory is not reduced until it is shipped or transfer of delivery method. We review long-lived assets within production costscontrol to the customer has occurred. Our ending inventory consists of contracts for impairment on an annual basis (which we perform during the fourth quarter) or when events or changes in circumstances indicate that the carrying valueraw materials, work-in-process, and finished goods.
Property and Equipment and Depreciation
Property and equipment, including assets recorded under capitaloperating and finance leases, are recorded at cost. Depreciation and amortization are computed using the straight-line method over the estimated useful lives of the related assets, or the lease term if shorter for leasehold improvements. Repairs and maintenance are charged to expense as incurred. We evaluate long-lived assets for
recoverability considering undiscounted cash flows, when significant changes in conditions occur, and recognize impairment losses if any, based upon the fair value of the assets.
GoodwillBusiness Combinations
When a business is acquired, we allocate the purchase price by recording the assets acquired and Indefinite-Lived Intangible Assetliabilities assumed at their estimated fair values as of the acquisition date, with the excess cost recorded as goodwill. A preliminary fair value is determined once a business is acquired, with the final determination of fair value to be completed no later than one year from the date of acquisition.
To determine the estimated fair value of assets acquired and liabilities assumed requires significant judgment and estimates, including the selection of valuation methodologies, estimates of future revenues, costs and cash flows, discount rates, and selection of comparable companies. We engage the assistance of valuation specialists in concluding on fair value measurements in determining the fair value of assets acquired and liabilities assumed in business combinations.
The fair value of the intangible assets is estimated using several valuation methodologies, including the income based or market based approaches, which represent Level 3 fair value measurements. Inputs to fair value analyses and other aspects of the allocation of the purchase price require judgment. The values for technology and trade name are typically estimated using the relief from royalty methodology, while the value for customer relationships is typically estimated based on a multi-period excess earnings approach. The more significant inputs used in the technology intangible asset valuation included (i) future revenues, (ii) the technology decay rate, (iii) the royalty rate, and (iv) the discount rate. The more significant inputs used in the customer relationships intangible asset valuation include (i) future revenues, (ii) the projected earnings before interest, taxes, and amortization (“EBITA”) margins, (iii) the customer attrition rates, and (iv) the discount rate. The useful lives are estimated based on the underlying agreements or the future economic benefit expected to be received from the assets.
Acquisition related costs are not included as components of consideration transferred but instead, expensed as incurred and are included in selling, general and administrative expenses in our consolidated statements of income. See Note 2.
Goodwill
Goodwill is evaluated for impairment on aan annual basis on the first day of the fourth fiscal quarterquarter. If certain factors occur, including significant under performance of our business relative to expected operating results, significant adverse economic and industry trends, significant decline in our market capitalization for an extended period of time relative to net book value, a decision to divest individual businesses within a reporting unit, or more frequently if events or changes in circumstances indicate that the asseta decision to group individual businesses differently, we may be impaired. Ourrequired to perform an interim impairment evaluation of goodwill consists oftest prior to the fourth quarter.
We may use either a qualitative assessmentor quantitative approach when testing a reporting unit’s goodwill for impairment. The qualitative approach for potential impairment analysis is performed to determine ifwhether it is more likely than not that the fair value of a reporting unit iswas less than its carrying amount.
The quantitative approach for potential impairment analysis is performed by comparing the fair value of a reporting unit to its carrying value, including goodwill. Fair value is estimated by management using a combination of the income approach (which is based on a discounted cash flow model) and the market approach. Management’s cash flow projections include significant judgments and assumptions, including the amount and timing of expected cash flows, long-term growth rates, and discount rates. The cash flows used in the discounted cash flow model are based on our best estimate of future revenues, gross margins, and adjusted after-tax earnings. If our qualitative assessment indicatesany of these assumptions are incorrect, it is more likely than not thatwill impact the estimated fair value of a reporting unit exceedsunit. The market approach also requires management judgment in selecting comparable companies, business acquisitions and the transaction values observed and its carrying value, no further analysis is required and goodwill is not impaired. Otherwise, we will follow a two-step quantitative goodwill impairment test to determine if goodwill is impaired.related control premiums.
In the first step, we determine the fair valuefourth quarter of the reporting unit using expected future discounted cash flows and market valuation approaches considering comparable Company revenue and Earnings Before Interest, Taxes, Depreciation and Amortization (“EBITDA”) multiples. If the carrying value of the reporting unit exceeds its fair value, we then perform the second step of the impairment test to measure the amount of the goodwill impairment loss, if any.
The second step requires fair valuation of all the reporting unit’s assets and liabilities in a manner similar to a purchase price allocation, with any residual fair value being allocated to goodwill. This residual fair value of goodwill is then compared to the carrying value of goodwill to determine impairment. An impairment charge will be recognized equal to the excess of the carrying value of goodwill over the implied fair value of goodwill.
In 2015, as a result of the annual goodwill impairment test, we recorded $57.2 million of goodwill impairment to the Structural Systems operating segment reducing the goodwill carrying value to zero as of December 31, 2015.
We review our indefinite-lived intangible asset for impairment on an annual basis or when events or changes in circumstances indicate that the carrying value of our intangible asset may not be recoverable. We may first assess qualitative factors to determine whether it is more likely than not that an indefinite-lived intangible asset is impaired as a basis for determining whether it is necessary to perform the quantitative impairment test. Impairment indicators include, but are not limited to, cost factors, financial performance, adverse legal or regulatory developments, industry and market conditions and general economic conditions. If2023, the carrying amount of goodwill at the indefinite-lived intangible asset exceeds its fair value, we would recognize an impairment loss indate of the amount of such excess. In performing ourmost recent annual impairment testevaluation for Electronic Systems and Structural Systems was $117.4 million and $127.2 million, respectively.
We acquired 100% of the equity interests of BLR Aerospace, L.L.C. (“BLR”) on April 25, 2023, for an original purchase price of $115.0 million, net of cash acquired. We recorded goodwill of $41.2 million in our Structural Systems segment, which is also our reporting unit. See Note 2.
The last time we performed a step one goodwill impairment analysis for our Electronic Systems reporting unit was 2019 and thus, we elected to perform a step one goodwill impairment analysis as of the first day of the fourth quarter of 2015, we concluded the2023. The fair value of the indefinite-lived trade nameour Electronic Systems segment exceeded its carrying value and thus, was not deemed impaired.
As our commercial aerospace end-use market business continues to be zero asnegatively impacted by a result of divesting businessesgeneral slowdown in Electronic Systems and our discontinuationthe global economy primarily due to the lingering effects of the useCOVID-19 pandemic and the resulting inflation and other events, we performed a step one goodwill impairment test for our Structural Systems reporting unit as of the trade name. Thus, we recorded a $32.9 millionfirst day of trade name impairment to the Electronicfourth quarter of 2023. The fair value of our Structural Systems trade namesegment exceeded its carrying value to decrease its trade name carrying value to zero as of December 31, 2015.and thus, was not deemed impaired.
Other Intangible Assets
We amortize purchasedacquired other intangible assets with finite lives over the estimated economic lives of the assets, ranging from fourteen2 to eighteen23 years, generally using the straight-line method. The value of other intangibles acquired through business combinations has been estimated using present value techniques which involve estimates of future cash flows. We evaluate other intangible assets for recoverability considering undiscounted cash flows when significant changes in conditions occur, and recognize impairment losses, if any, based upon the estimated fair value of the assets.
Accumulated Other Comprehensive LossIncome
Accumulated other comprehensive loss,income, as reflected inon the consolidated balance sheets under the equity section, was composedcomprised of cumulative pension and retirement liability adjustments, net of tax, and change in net unrealized gains and losses on cash flow hedges, net of tax.
Revenue Recognition
Except as described below, we recognize revenue, including revenue fromOur customers typically engage us to manufacture products sold under long-term contracts, when persuasive evidencebased on designs and specifications provided by the end-use customer. This requires the building of an arrangement exists, the price is fixed or determinable, collection is reasonably assuredtooling and delivery ofmanufacturing first article inspection products has occurred or services have been rendered.(prototypes) before volume manufacturing. Contracts with our customers generally include a termination for convenience clause.
We have a significant number of contracts that are started and completed within the same year, as well as contracts derived from long-term agreements and programs that can span several years. We recognize revenue under ASC 606, “Revenue from Contracts with Customers” (“ASC 606”), which utilizes a five-step model.
The definition of a contract for us is typically defined as a customer purchase order as this is when we achieve an enforceable right to payment. The majority of our contracts are firm fixed-price contracts. The deliverables within a customer purchase order are analyzed to determine the number of performance obligations. In addition, at times, in order to achieve economies of scale and based on our customer’s forecasted demand, we may build in advance of receiving a purchase order from our customer. When that occurs, we would not recognize revenue until we have received the customer purchase order.
A performance obligation is a promise in a contract to transfer a distinct good or service to the customer, and is the unit of account under ASC 606. A contract’s transaction price is allocated to each distinct performance obligation and recognized as revenue when, or as, control is transferred and the performance obligation is satisfied. The majority of our contracts have a single performance obligation as the promise to transfer the individual goods or services are highly interrelated or met the series guidance. For contracts with multiple performance obligations, we allocate the contract transaction price to each performance obligation using our best estimate of the standalone selling price of each distinct good or service in the contract. The primary method used to estimate the standalone selling price is the expected cost plus a margin approach, under which we forecast our expected costs of satisfying a performance obligation and then add an appropriate margin for that distinct good or service.
We manufacture most products to customer specifications and the product cannot be easily modified for another customer. As such, these products are deemed to have no alternative use once the manufacturing process begins. In the event the customer invokes a termination for convenience clause, we would be entitled to costs incurred to date plus a reasonable profit. Contract costs typically include labor, materials, overhead, and when applicable, subcontractor costs. For most of our products, we are building assets with no alternative use and have enforceable right to payment, and thus, we recognize revenue under the contract method of accounting and record revenues and cost of sales on each contract in accordance with the percentage-of-completion method of accounting, using the units-of-deliveryover time method. Under the units-of-delivery method,
The majority of our performance obligations are satisfied over time as work progresses. Typically, revenue is recognized based upon the number of units delivered duringover time using an input measure (i.e., costs incurred to date relative to total estimated costs at completion, also known as cost-to-cost plus reasonable profit) to measure progress. Our typical revenue contract is a periodfirm fixed price contract, and the cost of raw materials could make up a significant amount of the total costs incurred. As such, we believe using the total costs incurred input method would be the most appropriate method. While the cost of raw materials could make up a significant amount of the total costs incurred, there is a direct relationship between our inputs and the transfer of control of goods or services to the customer.
Contract estimates are recognized based on various assumptions to project the actualoutcome of future events that can span multiple months or years. These assumptions include labor productivity and availability; the complexity of the work to be performed; the cost and availability of materials; and the performance of subcontractors.
As a significant change in one or more of these estimates could affect the progress completed (and related profitability) on our contracts, we review and update our contract-related estimates on a regular basis. We recognize such adjustments under the
cumulative catch-up method. Under this method, the impact of the adjustment is recognized in the period the adjustment is identified. Revenue and profit in future periods of contract performance is recognized using the adjusted estimate.
The impact of adjustments in contract estimates on our operating earnings can be reflected in either operating costs allocableand expenses or revenue.
Net cumulative catch-up adjustments on profit recorded were not material for both years ended December 31, 2023 and December 31, 2022.
Payments under long-term contracts may be received before or after revenue is recognized. When revenue is recognized before we bill our customer, a contract asset is created for the work performed but not yet billed. Similarly, when we receive payment before we ship our products to our customer and have met the delivered units. Costs allocable to undelivered units are reportedshipping terms, a contract liability is created for the advance or progress payment. When a contract liability and a contract asset exist on the balance sheet as inventory. This method is used in circumstances in whichsame contract, we report it on a company produces units of a basic product under production-type contracts in a continuous or sequential production process to buyers’ specifications. These contracts are primarily fixed-price contracts that vary widely in terms of size, length of performance period, and expected gross profit margins.
Provision for Estimated Losses on Contractsnet basis.
We record provisions for the total anticipated losses on contracts, considering total estimated costs to complete the contract compared to total anticipated revenues, in the period in which such losses are identified. The provisions for estimated losses on contracts require managementus to make certain estimates and assumptions, including those with respect to the future revenue under a contract and the future cost to complete the contract. Management'sOur estimate of the future cost to complete a contract may include assumptions as to improvementschanges in manufacturing efficiency, reductions in operating and material costs, and our ability to resolve claims and assertions with our customers. If any of these or other assumptions and estimates do not materialize in the future, we may be required to record additionaladjust the provisions for estimated losses on contracts.
In 2015, we recorded a charge in Structural Systems related to The provision for estimated cost overruns as a result of a change in the contract requirements for the remaining contractual period for a regional jet program of $10.0 million. This amount was recordedlosses on contracts is included as part of contract liabilities on the consolidated balance sheets. As of December 31, 2023 and 2022, provision for estimated losses on contracts were $5.4 million and $3.9 million, respectively.
Production cost of goods soldcontracts includes non-recurring production costs, such as design and engineering costs, and tooling and other special-purpose machinery necessary to build parts as specified in a contract. Production costs of contracts are typically amortized and recognized as cost of sales under the associated revenue contract using the over time revenue recognition model. We review the value of the production cost of contracts on a quarterly basis to ensure when added to the estimated cost to complete, the value is not greater than the estimated realizable value of the related contracts. As of December 31, 2023 and 2022, production costs of contracts were $7.8 million and $5.7 million, respectively.
Contract Assets and Contract Liabilities
Contract assets consist of our right to payment for work performed but not yet billed. Contract assets are transferred to accounts receivable when we bill our customers. We bill our customers when we ship the products and meet the shipping terms within the revenue contract. Contract liabilities consist of advance or progress payments billed to/or received from our customers prior to the time transfer of control occurs plus the estimated losses on contracts. When a contract liability and a contract asset exist on the same contract, we report it on a net basis.
Contract assets and contract liabilities from revenue contracts with customers are as follows: | | | | | | | | | | | | | | |
| | (Dollars in thousands) |
| | December 31,
2023 | | December 31,
2022 |
| Contract assets | | $ | 177,686 | | | $ | 191,290 | |
| Contract liabilities | | $ | 53,492 | | | $ | 47,068 | |
The decrease in our resultscontract assets as of operationsDecember 31, 2023 compared to December 31, 2022 was primarily due to a net decrease of products in work in process.
The increase in our contract liabilities as of December 31, 2023 compared to December 31, 2022 was primarily due to a net increase of advance or progress payments received from our customers in the current year. We recognized $36.1 million of the contract liabilities as of December 31, 2022 as revenues during the year ended December 31, 2023.
Performance obligations are defined as customer placed purchase orders (“POs”) with firm fixed price and increased accrued liabilitiesfirm delivery dates. Our remaining performance obligations as of December 31, 2023 totaled $963.5 million. We anticipate recognizing an estimated 70% of our remaining performance obligations as revenue during the next 12 months with the remaining performance obligations being recognized in 2025 and beyond.
Revenue by $7.6 million and other long-term liabilitiesCategory
In addition to the revenue categories disclosed above, the following table reflects our revenue disaggregated by $2.4 million.major end-use market: | | | | | | | | | | | | | | | | | | | | | | | | | | | | | | | | |
| | | | (Dollars in thousands)
Years Ended December 31, | | % of Net Revenues |
| | Change | | 2023 | | 2022 | | 2023 | | 2022 |
| Consolidated Ducommun | | | | | | | | | | |
| Military and space | | $ | (16,882) | | | $ | 403,819 | | | $ | 420,701 | | | 53.3 | % | | 59.1 | % |
| Commercial aerospace | | 61,782 | | | 309,291 | | | 247,509 | | | 40.9 | % | | 34.7 | % |
| Industrial | | (445) | | | 43,882 | | | 44,327 | | | 5.8 | % | | 6.2 | % |
| Total | | $ | 44,455 | | | $ | 756,992 | | | $ | 712,537 | | | 100.0 | % | | 100.0 | % |
| | | | | | | | | | |
| Electronic Systems | | | | | | | | | | |
| Military and space | | $ | (20,696) | | | $ | 293,485 | | | $ | 314,181 | | | 68.2 | % | | 71.3 | % |
| Commercial aerospace | | 10,639 | | | 92,769 | | | 82,130 | | | 21.6 | % | | 18.6 | % |
| Industrial | | (445) | | | 43,882 | | | 44,327 | | | 10.2 | % | | 10.1 | % |
| Total | | $ | (10,502) | | | $ | 430,136 | | | $ | 440,638 | | | 100.0 | % | | 100.0 | % |
| | | | | | | | | | |
| Structural Systems | | | | | | | | | | |
| Military and space | | $ | 3,814 | | | $ | 110,334 | | | $ | 106,520 | | | 33.8 | % | | 39.2 | % |
| Commercial aerospace | | 51,143 | | | 216,522 | | | 165,379 | | | 66.2 | % | | 60.8 | % |
| Total | | $ | 54,957 | | | $ | 326,856 | | | $ | 271,899 | | | 100.0 | % | | 100.0 | % |
Income Taxes
The provisionIncome taxes are accounted for income taxes is determined using an estimated annual effective tax rate, which is generally less thanasset and liability approach that requires the U.S. federal statutory rate, primarily as a resultrecognition of research and development (“R&D”) tax credits available in the United States and deductions available in the United States for domestic production activities. Our effective tax rate may be subject to fluctuations during the year as new information is obtained, which may affect the assumptions used to estimate the annual effective tax rate, including factors such as valuation allowances against deferred tax assets the recognition or derecognition of tax benefits related to uncertain tax positions, expected utilization of R&D tax credits and changes in or the interpretation of tax laws in jurisdictions where we conduct business.
liabilities. Deferred tax assets and liabilities are recognized, using enacted tax rates, for the expected future tax consequences of temporary differences between the book and tax bases of recorded assets and liabilities, operating losses, and tax credit carryforwards. Deferred tax assets are evaluated quarterly and are reduced by a valuation allowance if it is more likely than not that some portion or all of the deferred tax assets will not be realized.
Tax positions taken or expected to be taken in a tax return are recognized when it is more-likely-than-not, based on technical merits, to be sustained upon examination by taxing authorities. The amount recognized is measured as the largest amount of benefit that is greater than 50% likely of being realized upon ultimate settlement, including resolution of related appeals and/or litigation process, if any.
On December 22, 2017, the Tax Cuts and Jobs Act (the “2017 Tax Act”) was enacted. The 2017 Tax Act represents major tax reform legislation that, among other provisions, reduces the U.S. corporate tax rate. Certain provisional amounts for the income tax effects of the 2017 Tax Act, including $13.0 million of deferred income tax benefit recorded principally due to the re-measurement of the federal portion of our deferred tax assets and liabilities, are reflected in our financial results in accordance with SEC Staff Accounting Bulletin No. 118 (“SAB 118”), which provides SEC staff guidance regarding the application of Accounting Standards Codification (“ASC”) Topic 740, “Income Taxes,” in the reporting period in which the 2017 Tax Act became law. See Note 16 for further information.
Litigation and Commitments
In the normal course of business, we are defendants in certain litigation, claims and inquiries, including matters relating to environmental laws. In addition, we make various commitments and incur contingent liabilities. Management’s estimates regarding contingent liabilities could differ from actual results.
Environmental Liabilities
Environmental liabilities are recorded when environmental assessments and/or remedial efforts are probable and costs can be reasonably estimated. Generally, the timing of these accruals coincides with the completion of a feasibility study or our commitment to a formal plan of action. Further, we review and update our environmental accruals as circumstances change and/or additional information is obtained that reasonably could be expected to have a meaningful effect on the outcome of a matter or the estimated cost thereof.
Accounting for Stock-Based Compensation
We measure and recognize compensation expense for share-based payment transactions to our employees and non-employees at their estimated fair value. The expense is measured at the grant date, based on the calculated fair value of the share-based award, and is recognized over the requisite service period (generally the vesting period of the equity award). The fair value of stock options areis determined using the Black-Scholes-Merton (“Black-Scholes”) valuation model, which requires assumptions
and judgments regarding stock price volatility, risk-free interest rates, and expected options terms. Management’s estimates
could differ from actual results. The fair value of unvested stock awards is determined based on the closing price of the underlying common stock on the date of grant except for market condition awards for which the fair value was based on a Monte Carlo simulation model.
Government Grant
In November 2021, we were awarded an Aviation Manufacturing Jobs Protection Program grant from the U.S. Department of Transportation of $4.0 million. As part of the award, we had to meet, and did complete, certain requirements over a six month performance period from November 2021 to May 2022. As of December 31, 2022, we have received the entire $4.0 million grant balance, $2.0 million of which was received during 2021. We recorded $2.7 million and $0.3 million as a reduction of cost of sales and selling, general and administrative expenses, respectively, during 2022 and $0.9 million and $0.1 million as a reduction of cost of sales and selling, general and administrative expenses, respectively, during 2021.
Charitable Contributions
We contributed $0.1 million to the Ducommun Foundation during 2023.
Earnings (Loss) Per Share
Basic earnings per share are computed by dividing income available to common shareholders by the weighted-average number of common shares outstanding in each period. Diluted earnings per share areis computed by dividing income available to common shareholders plus income associated with dilutive securities by the weighted-average number of common shares outstanding, plus any potentialpotentially dilutive shares that could be issued if exercised or converted into common stock in each period.
The net earnings (loss)income and weighted-average number of common shares outstanding used to compute earnings (loss) per share were as follows:
| | | | | | | | | | | | | | | | | | | | |
| | (In thousands, except per share data)
Years Ended December 31, |
| | | 2023 | | 2022 | | 2021 |
| Net income | | $ | 15,928 | | | $ | 28,789 | | | $ | 135,536 | |
| Weighted-average number of common shares outstanding | | | | | | |
| Basic weighted-average common shares outstanding | | 13,717 | | | 12,074 | | | 11,879 | |
| Dilutive potential common shares | | 255 | | | 292 | | | 372 | |
| Diluted weighted-average common shares outstanding | | 13,972 | | | 12,366 | | | 12,251 | |
| Earnings per share | | | | | | |
| Basic | | $ | 1.16 | | | $ | 2.38 | | | $ | 11.41 | |
| Diluted | | $ | 1.14 | | | $ | 2.33 | | | $ | 11.06 | |
|
| | | | | | | | | | | | |
| | | (In thousands, except per share data) Years Ended December 31, |
| | | 2017 | | 2016 | | 2015 |
| Net income (loss) | | $ | 20,077 |
| | $ | 25,261 |
| | $ | (74,879 | ) |
| Weighted-average number of common shares outstanding | | | | | | |
| Basic weighted-average common shares outstanding | | 11,290 |
| | 11,151 |
| | 11,047 |
|
| Dilutive potential common shares | | 268 |
| | 148 |
| | — |
|
| Diluted weighted-average common shares outstanding | | 11,558 |
| | 11,299 |
| | 11,047 |
|
| Earnings (loss) per share | | | | | | |
| Basic | | $ | 1.78 |
| | $ | 2.27 |
| | $ | (6.78 | ) |
| Diluted | | $ | 1.74 |
| | $ | 2.24 |
| | $ | (6.78 | ) |
Potentially dilutive stock options and stock unitsawards to purchase common stock, as shown below, were excluded from the computation of diluted earnings per share because their inclusion would have been anti-dilutive. However, these shares may be potentially dilutive common shares in the future.
|
| | | | | | | | | |
| | | (In thousands) Years Ended December 31, |
| | | 2017 | | 2016 | | 2015 |
| Stock options and stock units | | 126 |
| | 553 |
| | 778 |
|
| | | | | | | | | | | | | | | | | | | | |
| | (In thousands)
Years Ended December 31, |
| | | 2023 | | 2022 | | 2021 |
| Stock options and stock units | | 10 | | | 52 | | | 3 | |
Recent Accounting Pronouncements
New Accounting Guidance Adopted in 20172023
In December 2016,July 2023, the FASB issued ASU 2016-19, “Technical Corrections2023-03, “Presentation of Financial Statements (Topic 205), Income Statement - Reporting Comprehensive Income (Topic 220), Distinguishing Liabilities from Equity (Topic 480), Equity (Topic 505), and Improvements” (“2016-19”), which cover a variety of Topics in the Codification. The amendments in ASU 2016-19 represent changes to make corrections or improvements to the Codification that are not expected to have a significant effect on current accounting practice or create a significant administrative cost to most entities. The new guidance was effective for us beginning January 1, 2017. The adoption of this standard did not have a significant impact on our condensed consolidated financial statements.
In March 2016, the FASB issued ASU 2016-09, “CompensationCompensation - Stock Compensation (Topic 718): ImprovementsAmendments to Employee Share-Based Payment Accounting”SEC Paragraphs Pursuant to SEC Staff Accounting Bulletin No. 120, SEC Staff Announcement at the March 24, 2022 EITF Meeting, and Staff Accounting Bulletin Topic 6.B, Accounting Series Release 280 - General Revision of Regulation S-X: Income or Loss Applicable to Common Stock” (“ASU 2016-09”2023-03”), which is intendedamends or supersedes various SEC paragraphs within the Accounting Standards Codification to improveconform to past SEC announcements and guidance issued by the accounting for employee share-based payments. TheSEC. ASU 2023-03 does not provide any new guidance so there was no transition or effective for us beginning January 1, 2017. The adoption of this standarddate. ASU 2023-03 did not have a significant dollarmaterial impact on our condensed consolidated financial statements.
In March 2016, the FASB issued ASU 2016-05, “Derivatives and Hedging (Topic 815): Effect
In July 2015, the FASB issued ASU 2015-11, “Inventory (Topic 330)” (“ASU 2015-11”), which requires inventory within the scope of ASU 2015-11 to be measured at the lower of cost or net realizable value. Subsequent measurement is unchanged for inventory measured using last-in, first-out (“LIFO”) or the retail inventory value. The new guidance was effective for us beginning January 1, 2017. The adoption of this standard did not have a significant impact on our condensed consolidated
financial statements.
Recently Issued Accounting Standards
In August 2017,December 2023, the FASB issued ASU 2017-12, “Derivatives and Hedging2023-09, “Income Taxes (Topic 815)740): Targeted Improvements to Accounting for Hedging”Income Tax Disclosures” (“ASU 2017-12”2023-09”), which intends to improve and simplify accounting rules around hedge accounting. ASU 2017-12 refines and expands hedge accounting for both financial (i.e., interest rate) and commodity risks. In addition, it createsprovide more transparency around how economic results are presented, both on the face of the financial statements and in the footnotes. The new guidance is effective for annual periods beginning after December 15, 2018, including interim periods within those annual periods, which will be our interim period beginning January 1, 2019. Early adoption is permitted, including adoption in any interim period after the issuance of ASU 2017-12. We are evaluating the impact of this standard.
In May 2017, the FASB issued ASU 2017-09, “Compensation - Stock Compensation (Topic 718): Scope of Modification Accounting” (“ASU 2017-09”), which provides clarity on determining which changesabout tax information primarily related to the termsrate reconciliation and conditions of share-based payment awards require an entity to apply modification accounting under Topic 718. The new guidance is effective for annual periods beginning after December 15, 2017, including interim periods within those annual periods, which will be our interim period beginning January 1, 2018. Early adoption is permitted, including adoption in any interim period. The amendments should be applied prospectively to an award modified on or after the adoption date. We are evaluating the impact of this standard.
In March 2017, the FASB issued ASU 2017-07, “Compensation - Retirement Benefits (Topic 715): Improving the Presentation of Net Periodic Pension Cost and Net Periodic Postretirement Benefit Costs” (“ASU 2017-07”), which require an employer to report the service cost component in the same line item or items as other compensation costs arising from services rendered by the pertinent employees during the period. The other components of net benefit cost are required to be presented in the income statement separately from the service cost component and outside a subtotal of income from operations, if one is presented. If a separate line item or items are used to present the other components of net benefit cost, that line item or items must be appropriately described. If a separate line item or items are not used, the line item or items used in the income statement to present the other components of net benefit cost must be disclosed. The amendments also allow only the service cost component to be eligible for capitalization when applicable. The new guidance is effective for annual periods beginning after December 15, 2017, including interim periods within those annual periods, which will be our interim period beginning January 1, 2018. We are evaluating the impact of this standard.
In January 2017, the FASB issued ASU 2017-04, “Intangibles - Goodwill and Other (Topic 350): Simplifying the Test for Goodwill Impairment” (“ASU 2017-04”), which simplifies the subsequent measurement of goodwill, the amendments eliminate Step Two from the goodwill impairment test. The annual, or interim, goodwill impairment test is performed by comparing the fair value of a reporting unit with its carrying amount. An impairment charge should be recognized for the amount by which the carrying amount exceeds the reporting unit’s fair value; however, the loss recognized should not exceed the total amount of goodwill allocated to that reporting unit. In addition, income tax effects from any tax deductible goodwill on the carrying amount of the reporting unit should be considered when measuring the goodwill impairment loss, if applicable. The amendments also eliminate the requirements for any reporting unit with a zero or negative carrying amount to perform a qualitative assessment and, if it fails that qualitative test, to perform Step Two of the goodwill impairment test. An entity still has the option to perform the qualitative assessment for a reporting unit to determine if the quantitative impairment test is necessary. The new guidance is effective for annual or interim goodwill impairment tests in fiscal years beginning after December 15, 2019. Early adoption is permitted for interim or annual goodwill impairment tests performed on testing dates after January 1, 2017. We are evaluating the impact of this standard.
In January 2017, the FASB issued ASU 2017-01, “Business Combinations (Topic 805): Clarifying the Definition of a Business” (“ASU 2017-01”), which clarify the definition of a business with the objective of adding guidance to assist entities with evaluating whether transactions should be accounted for as acquisitions (or disposals) of businesses. The new guidance is effective for annual periods beginning after December 15, 2017, including interim periods within those annual periods, which will be our interim period beginning January 1, 2018. We are evaluating the impact of this standard.
In August 2016, the FASB issued ASU 2016-15, “Statement of Cash Flows (Topic 230): Classification of Certain Cash Receipts and Cash Payments” (“ASU 2016-15”), which addresses the following eight specific cash flow issues: Debt prepayment or debt extinguishment costs; settlement of zero-coupon debt instruments or other debt instruments with coupon interest rates that are insignificant in relation to the effective interest rate of the borrowing; contingent consideration payments made after a business combination; proceeds from the settlement of insurance claims; proceeds from the settlement of corporate-owned life insurance policies (“COLIs”) (including bank-owned life insurance policies [“BOLIs”]); distributions received from equity method investees; beneficial interests in securitization transactions; and separately identifiable cash flows and application of the predominance principle. The new guidance is effective for annual periods beginning after December 15, 2017, including interim periods within those annual periods, which will be our interim period beginning January 1, 2018. We are evaluating the impact of this standard.
In February 2016, the FASB issued ASU 2016-02, “Leases (Topic 842)” (“ASU 2016-02”), which requires lessees to present right-of-use assets and lease liabilities on the balance sheet. Lessees are required to apply a modified retrospective transition approach for leases existing at, or entered into after, the beginning of the earliest comparative period presented in the financial statements.taxes paid. The new guidance is effective for fiscal years beginning after December 15, 2018, including interim periods within those fiscal years,2024, which will be our interimannual period beginning January 1, 2019.2025. Early adoption is permitted. We are evaluating the impact of this standard and currently anticipate it will impact our condensed consolidated financial statements.standard.
In May 2014,November 2023, the FASB issued ASU 2014-09, “Revenue from Contracts with Customers2023-07, “Segment Reporting (Topic 606)”280), Improvements to Reportable Segment Disclosures” (“ASU 2014-09”2023-07”), which outlines a new, single comprehensive model for entities to use in accounting for revenue arising from contracts with customers and supersedes most current revenue recognition guidance, including industry-specific guidance. This new revenue recognition model provides a five-step analysis in determining when and how revenue is recognized. It depicts the transfer of promised goods or services to customers in an amount that reflects the consideration an entity expects to receive in exchange for those goods or services. Companies have the option of applying the provisions of ASU 2014-09 either retrospectively to each prior reporting period presented or retrospectively with the cumulative effect of initially applying this guidance recognized at the date of initial application. Additional guidance was issued subsequently as follows:
December 2016, the FASB issued ASU 2016-20, “Technical Corrections and Improvements to Topic 606, Revenue from Contracts with Customers” (“ASU 2016-20”);
May 2016, the FASB issued ASU 2016-12, “Revenue from Contracts with Customers (Topic 606): Narrow-Scope Improvements and Practical Expedients” (“ASU 2016-12”);
May 2016, the FASB issued ASU 2016-11, “Revenue Recognition (Topic 605) and Derivatives and Hedging (Topic 815): Rescission of SEC Guidance Because of Accounting Standards Updates 2014-09 and 2014-06 Pursuant to Staff Announcements at the March 3, 2016 EITF Meeting” (“ASU 2016-11”);
April 2016, the FASB issued ASU 2016-10, “Revenue from Contracts with Customers (Topic 606): Identifying Performance Obligations and Licensing” (“ASU 2016-10”); and
August 2015, the FASB issued ASU 2015-14, “Revenue From Contracts With Customers (Topic 606)” (“ASU 2015-14”).
All of thisexpand reportable segment disclosure requirements, primarily through enhanced disclosures about significant segment expenses. The new guidance is effective for fiscal years beginning after December 15, 2017, including2023, which is our annual period beginning January 1, 2024, and interim periods within those fiscal years beginning after December 15, 2024, which will be our interim period beginning January 1, 2018.
2025. Early adoption is permitted. We are evaluating the impact of this standard.
In October 2023, the FASB issued ASU 2023-06, “Disclosure Improvements: Codification Amendments in Response to the processSEC’s Disclosure Update and Simplification Initiative” (“ASU 2023-06”), which incorporates updates to the Accounting Standards Codification to align certain SEC disclosure requirements. The amendments impact a variety of completingtopics but are relatively narrow in nature. For entities required to comply with the implementation phaseSEC’s existing disclosure requirements, the effective date for each amendment will be the effective date of the project.removal of the disclosure requirement from SEC Regulation S-X or SEC Regulation S-K, with early adoption prohibited. The amendments should be applied prospectively. We have noted that underare evaluating the impact of this standard.
In December 2022, the FASB issued ASU 2014-09,2022-06, “Reference Rate Reform (Topic 848), Deferral of the percentageSunset Date of completion, unitTopic 848” (“ASU 2022-06”), which defers the sunset date of delivery method of recognizing revenueTopic 848 from December 31, 2022, to December 31, 2024, after which entities will no longer be an acceptable method for us and production costs will generally not be deferred. Instead, revenue will be recognized aspermitted to apply the customer obtains control of the goods and services promisedrelief in the contract (i.e., performance obligations). Given the nature of our products and terms and conditions in the majority of our contracts, our customer obtains control as we perform work under the contract. As such, the majority of our revenues will be recognized sooner as a result of changing to an over time method (i.e., cost-to-cost plus margin) from a point-in-time method, which is our current method for recognizing revenue. This will result in eliminating the majority of our work-in-process and finished goods inventory and a significant increase in unbilled accounts receivables (i.e., contract assets). This change will also impact our information technology systems, systems of internal controls over financial reporting, and certain accounting policies, requiring the usage of more judgment in determining our revenue recognition. We have selected a software solution and are in the process of implementing the software solution to comply with this new accounting standard. The new accounting standard will be adopted using the modified retrospective method, whereby the cumulative effect of applying the new guidance is recognized as an adjustment to certain captions on the balance sheet, including the opening balance of retained earnings in the first quarter of 2018. We have periodically briefed our Audit Committee of the Board of Directors on the progress made towards the adoption of this revenue recognition accounting standard.Topic 848. Since we adopted ASU 2020-04 during 2022, ASU 2022-06 will not have not completed the implementation of the software solution, we currently are unable to determine the exacta material impact toon our consolidated financial statements. However, we expect the impact to be significant on certain captions on our January 1, 2018 opening balance sheet.See Note 9.
Note 2. Business CombinationCombinations
On September 11, 2017,April 25, 2023, we acquired 100.0% of the outstanding equity interests of Lightning Diversion Systems, LLCBLR Aerospace, L.L.C. (“LDS”BLR”), a privately-held worldwide leader in lightning protectionleading provider of aerodynamic systems servingthat enhance the aerospaceproductivity, performance, and defense industries,safety of rotary and fixed-wing aircraft on commercial and military platforms. BLR is located in Huntington Beach, California.Everett, Washington. The acquisition of LDS is part ofBLR adds to our strategy to enhance revenue growth by focusing on advanced proprietary technology on various aerospacediversify and defense platforms.offer more customized, value-driven engineered products with aftermarket opportunities.
The initial purchase price for LDSBLR was $60.0$115.0 million, net of cash acquired, all payable in cash. Uponcash, subject to adjustments for working capital. We paid a gross aggregate of $117.0 million in cash upon the closing of the transaction. Subsequent to the closing of the transaction, we paid $61.4during the third quarter of 2023, the working capital was finalized and the impact was immaterial for a final purchase price of $114.4 million, with the remaining $0.6 million paid in October 2017.net of cash acquired. We allocated the gross purchase price of $62.0
$117.0 million to the assets acquired and liabilities assumed at their estimated fair values. The excess of the purchase price over the aggregate fair values of the net assets was recorded as goodwill.
The following table summarizes the estimated fair value of the assets acquired and liabilities assumed at the date of acquisition (in thousands):
| | | | | | | | |
| | Estimated
Fair Value |
| Cash | | $ | 2,656 | |
| Accounts receivable | | 4,149 | |
| Inventories | | 12,011 | |
| Other current assets | | 891 | |
| Property and equipment | | 2,632 | |
| Operating lease right-of-use assets | | 874 | |
| Intangible assets | | 55,500 | |
| Goodwill | | 41,193 | |
| | |
| Total assets acquired | | 119,906 | |
| Current liabilities | | (2,145) | |
| | |
| Other non-current liabilities | | (727) | |
| Total liabilities assumed | | (2,872) | |
| Total purchase price allocation | | $ | 117,034 | |
|
| | | | |
| | | Estimated Fair Value |
| Cash | | $ | 2,223 |
|
| Accounts receivable | | 918 |
|
| Inventories | | 1,732 |
|
| Other current assets | | 54 |
|
| Property and equipment | | 138 |
|
| Intangible assets | | 22,400 |
|
| Goodwill | | 34,881 |
|
| Total assets acquired | | 62,346 |
|
| Current liabilities | | (325 | ) |
| Total liabilities assumed | | (325 | ) |
| Total purchase price allocation | | $ | 62,021 |
|
| | | | | Useful Life (In years) | | Estimated Fair Value (In thousands) |
| | Useful Life
(In years) | | | | Useful Life
(In years) | | Estimated
Fair Value
(In thousands) |
| Intangible assets: | | | | |
| Technology | |
| Technology | |
| Technology | |
| Customer relationships | | 15 | | $ | 21,100 |
|
| Trade name | | 15 | | 1,300 |
|
| | | $ | 22,400 |
|
| | | | $ | |
The intangible assets acquired of $22.4$55.5 million were determined based on the estimated fair values using valuation techniques consistent with the income approach to measure fair value.value, which represented Level 3 fair value measurements. The useful lives were estimated based on the underlying agreements or the future economic benefit expected to be received from the assets. The fair values offor technology and trade name were assessed using the identifiable intangible assets were estimated using several valuation methodologies, which represented Level 3 fair value measurements. Therelief from royalty methodology, while the value for customer relationships was estimated based on a multi-period excess earnings approach. Inputs to the income approach whilemodels and other aspects of the value forallocation of the trade name was assessed using the relief from royalty methodology. Further, we analyzedpurchase price require judgment. The more significant inputs used in the technology acquiredintangible asset valuation included (i) future revenues, (ii) the technology decay rate (iii) the royalty rate, and concluded no fair value should be assigned to it.(iv) the discount rate. The more significant inputs used in the customer relationships intangible asset valuation included (i) future revenues, (ii) the projected earnings before interest, taxes, and amortization (“EBITA”) margins, (iii) the customer attrition rates, and (iv) the discount rate.
The goodwill of $34.9$41.2 million arising from the acquisition is attributable to the benefits we expect to derive from expected synergies from the transaction, including complementary products that will enhance our overall product portfolio, opportunities within new markets, and an acquired assembled workforce. All the goodwill was assigned to the ElectronicStructural Systems segment. Since the LDSThe BLR acquisition, for tax purposes, wasis deemed an asset acquisition and thus, the goodwill recognized is deductible for income tax purposes.
Acquisition related transaction costs arewere not included as components of consideration transferred but have been expensed as incurred. Total acquisition-related transaction costs incurred by us were $0.3$1.3 million during 20172023 and charged to selling, general and administrative expenses.
LDS’BLR’s results of operations have been included in our consolidated statements of operationsincome since the date of acquisition as part of the ElectronicStructural Systems segment.segment and were less than three percent of total company revenues since the date of acquisition. Pro forma results of operations of the LDSBLR acquisition have not been presented as the effect of the LDSBLR acquisition was not material to our financial results.
Note 3. Restructuring Activities
Summary of 20172022 Restructuring Plan
In November 2017,April 2022, management approved and commenced a restructuring plan that is expectedwill better position us for stronger performance. The restructuring plan mainly reduces headcount and consolidates facilities. As a result of this restructuring plan, we analyzed the need to increasewrite-down inventory and impair long-lived assets, including operating efficiencies. We currentlylease right-of-use assets. During the year ended December 31, 2023, we recorded total charges of $14.9 million. Cumulative through the year ended December 31, 2023, we recorded total charges of $21.5 million. As of December 31, 2023, we estimate the remaining amount of charges related to this initiative will result in $19.0be $5.0 million to $22.0$7.0 million in total pre-tax restructuring charges through 2018, with $8.82024. Of these charges, we estimate $4.5 million recorded during 2017. We are currently evaluating a number of possible scenarios to execute the second phase of the restructuring plan, which will result in additional restructuring charges during 2018. We anticipate the additional charges will include$6.0 million to be cash payments for employee separation and other facility consolidation related expenses, and $0.5 million to $1.0 million to be non-cash charges for asset
impairments, depending on the specific plan we develop. On an annualized basis, beginning in 2019, we estimate these restructuring actions will result in total savingsimpairment of $14.0 million.long-lived assets.
In the ElectronicElectronics Systems segment, we have recorded expensescharges of $1.2$6.1 million, $0.3 million, and $0.1 million during the year ended December 31, 2023, for severance and benefits whichthat were classified as restructuring charges, charges for inventory write down that were classified as cost of sales, and other restructuring, respectively. Cumulative through the year ended December 31, 2023, we recorded total charges for severance and benefits that were classified as restructuring charges, accelerated depreciation of property and equipment that was charged toclassified as restructuring charges.charges, charges for inventory write down that were classified as cost of sales, and other restructuring of $9.6 million, $0.3 million, $0.3 million, and $0.1 million, respectively.
In the Structural Systems segment, we have recorded expenses of $1.7$4.3 million, $1.2 million, zero, and $2.8 million during the year ended December 31, 2023 for severance and benefits which was charged tothat were classified as restructuring charges. In addition, we recorded non-cash expensescharges, accelerated depreciation of $3.6 million for property and equipment impairment whichthat was charged toclassified as restructuring charges. Further, we recorded non-cash expenses of $0.5 millioncharges, charges for inventory write down whichthat was charged toclassified as cost of sales.
In Corporate,sales, and other restructuring charges, respectively. Cumulative through the year ended December 31, 2023, we have recorded expenses of $0.4 milliontotal charges for severance and benefits that were classified as restructuring charges, accelerated depreciation of property and non-cash expensesequipment that was classified as restructuring charges, impairment of $1.4property and equipment that was classified as restructuring charges,
charges for inventory write down that was classified as cost of sales, and other restructuring of $5.8 million, for stock-based compensation awards which were modified, all of which was charged to restructuring charges.
As of December 31, 2017, we have accrued $1.0$1.7 million, $1.3$0.3 million, $0.5 million, and $0.4$2.8 million, for severance and benefits and loss on early exit from lease in the Electronic Systems segment, Structural Systems segment, and Corporate, respectively.
Summary of 2016 Restructuring Plan
In May 2016, management approved and commenced implementation of the closure of one of our Tulsa facilities that was completed in June 2016, and is part of our overall strategy to streamline operations. We have recorded cumulative expenses of $0.2 million for severance and benefits and loss on early exit from a lease, all of which were charged to restructuring charges in 2016. We do not expect to record additional expenses related to this restructuring plan.
As of December 31, 2017, we have accrued less than $0.1 million for loss on early exit from lease in the Electronic Systems segment.
Summary of 2015 Restructuring Plans
In September 2015, management approved and commenced implementation of several restructuring actions, including organizational re-alignment, consolidation and relocation of the New York facilities that was completed in December 2015, closure of the Houston facility that was completed in December 2015, and closure of the St. Louis facility that was completed in April 2016, all of which are part of our overall strategy to streamline operations. We have recorded cumulative expenses of $2.2 million for severance and benefits and loss on early exit from leases, all of which were charged to restructuring charges in 2015. We do not expect to record additional expenses related to these restructuring plans.
As of December 31, 2017, all payments have been made on early exit from lease in the Structural Systems segment.
Our restructuring activities for 2017 and 20162023 were as follows (in thousands):
| | | | | | | | | | | | | | | | | | | | | | | | | | | | | | | | | | | | | | |
| | December 31, 2022 | | 2023 | | December 31, 2023 |
| | Balance | | Charges | | Cash Payments | | Non-Cash Payments | | Change in Estimates | | Balance |
| Severance and benefits | | $ | 2,799 | | | $ | 10,435 | | | $ | (7,845) | | | $ | — | | | $ | — | | | $ | 5,389 | |
| | | | | | | | | | | | |
| Property and equipment accelerated depreciation due to restructuring | | — | | | 1,210 | | | — | | | (1,210) | | | — | | | — | |
| | | | | | | | | | | | |
| Inventory write down | | — | | | 313 | | | — | | | (313) | | | — | | | — | |
| Other | | | | $ | 2,897 | | | $ | (2,897) | | | $ | — | | | | | — | |
| Ending balance | | $ | 2,799 | | | $ | 14,855 | | | $ | (10,742) | | | $ | (1,523) | | | $ | — | | | $ | 5,389 | |
|
| | | | | | | | | | | | | | | | | | | | | | | | |
| | | December 31, 2016 | | 2017 | | December 31, 2017 |
| | | Balance | | Charges | | Cash Payments | | Non-Cash Payments | | Change in Estimates | | Balance |
| Severance and benefits | | $ | — |
| | $ | 3,337 |
| | $ | (678 | ) | | $ | — |
| | $ | — |
| | $ | 2,659 |
|
| Modification of stock-based compensation awards | | — |
| | 1,334 |
| | — |
| | (1,334 | ) | | — |
| | — |
|
| Lease termination | | 654 |
| | 18 |
| | (670 | ) | | — |
| | 64 |
| | 66 |
|
| Property and equipment impairment due to restructuring | | — |
| | 3,607 |
| | — |
| | (3,607 | ) | | — |
| | — |
|
| Inventory write down | | — |
| | 478 |
| | — |
| | (478 | ) | | — |
| | — |
|
| Ending balance | | $ | 654 |
| | $ | 8,774 |
| | $ | (1,348 | ) | | $ | (5,419 | ) | | $ | 64 |
| | $ | 2,725 |
|
Note 4. Fair Value Measurements
Fair value is defined as the price that would be received for an asset or the price that would be paid to transfer a liability (an exit price) in the principal or most advantageous market in an orderly transaction between market participants on the measurement date. The accounting standard provides a framework for measuring fair value using a fair value hierarchy that prioritizes the inputs to valuation techniques used to measure fair value. This hierarchy requires us to maximize the use of observable inputs and minimize the use of unobservable inputs when measuring fair value. Three levels of inputs that may be used to measure fair value are as follows:
Level 1 - Quoted prices (unadjusted) in active markets for identical assets or liabilities;
Level 2 - Observable inputs other than Level 1 prices, such as quoted prices for similar assets or liabilities; quoted prices in markets that are not active; or other inputs that are observable or can be corroborated by observable market data for substantially the full term of the assets or liabilities; and
Level 3 - Unobservable inputs that are supported by little or no market activity and that are significant to the fair value of the assets or liabilities.
Our financial instruments consist primarily of cash and cash equivalents and interest rate cap derivatives designated as cash flow hedging instruments. Assets and liabilities measured at fair value on a recurring basis were as follows (in thousands):
|
| | | | | | | | | | | | | | | | | | | | | | | | | | | | | | | | |
| | | As of December 31, 2017 | | As of December 31, 2016 |
| | | Fair Value Measurements Using | | | | Fair Value Measurements Using | | |
| | | Level 1 | | Level 2 | | Level 3 | | Total Balance | | Level 1 | | Level 2 | | Level 3 | | Total Balance |
| Assets | | | | | | | | | | | | | | | | |
Money market funds(1) | | $ | 26 |
| | $ | — |
| | $ | — |
| | $ | 26 |
| | $ | 3,751 |
| | $ | — |
| | $ | — |
| | $ | 3,751 |
|
Interest rate cap hedges(2) | | — |
| | 165 |
| | — |
| | 165 |
| | — |
| | 553 |
| | — |
| | 553 |
|
| Total Assets | | $ | 26 |
| | $ | 165 |
| | $ | — |
| | $ | 191 |
| | $ | 3,751 |
| | $ | 553 |
| | $ | — |
| | $ | 4,304 |
|
(1) Included as cash and cash equivalents.
(2) Interest rate cap hedge premium included as other current assets and other assets.
The fair value of the interest rate cap hedge agreements is determined using pricing models that use observable market inputs as of the balance sheet date, a Level 2 measurement.
There were no transfers between Level 1, Level 2, or Level 3 financial instruments in either 2017 or 2016.
Note 5. Financial Instruments
Derivative Instruments and Hedging Activities
We periodically enter into cash flow derivative transactions, such as interest rate cap agreements, to hedge exposure to various risks related to interest rates. We assess the effectiveness of the interest rate cap hedges at inception of the hedge. We recognize all derivatives at their fair value. For cash flow designated hedges, the effective portion of the changes in fair value of the derivative contract are recorded in accumulated other comprehensive income (loss), net of taxes, and are recognized in net earnings at the time earnings are affected by the hedged transaction. Adjustments to record changes in fair values of the derivative contracts that are attributable to the ineffective portion of the hedges, if any, are recognized in earnings. We present derivative instruments in our consolidated statements of cash flows’ operating, investing, or financing activities consistent with the cash flows of the hedged item.
Our interest rate cap hedges were designated as cash flow hedges and deemed highly effective at the inception of the hedges. These interest rate cap hedges mature concurrently with the term loan in June 2020. In 2017, the interest rate cap hedges continued to be highly effective and $0.2 million, net of tax, was recognized in other comprehensive income. No amount was recorded in the consolidated statements of operations in 2017. See Note 10.
The recorded fair value of the derivative financial instruments in the consolidated balance sheets were as follows:
|
| | | | | | | | | | | | | | | | |
| | | (In thousands) December 31, 2017 | | (In thousands)
December 31, 2016 |
| | | Other Current Assets | | Other Long Term Assets | | Other Current Assets | | Other Long Term Assets |
| Derivatives Designated as Hedging Instruments | | | | | | | | |
| Cash Flow Hedges: | | | | | | | | |
| Interest rate cap premiums | | $ | — |
| | $ | 165 |
| | $ | — |
| | $ | 553 |
|
| | | | | | | | | |
| Total Derivatives | | $ | — |
| | $ | 165 |
| | $ | — |
| | $ | 553 |
|
Note 6. Inventories
Inventories consisted of the following:
|
| | | | | | | | |
| | | (In thousands) December 31, |
| | | 2017 | | 2016 |
| Raw materials and supplies | | $ | 65,221 |
| | $ | 64,650 |
|
| Work in process | | 62,584 |
| | 56,806 |
|
| Finished goods | | 10,665 |
| | 9,180 |
|
| | | 138,470 |
| | 130,636 |
|
| Less progress payments | | 16,309 |
| | 10,740 |
|
| Total | | $ | 122,161 |
| | $ | 119,896 |
|
We net progress payments from customers related to inventory purchases against inventories on the consolidated balance sheets. | | | | | | | | | | | | | | |
| | (In thousands)
December 31, |
| | 2023 | | 2022 |
| Raw materials and supplies | | $ | 174,624 | | | $ | 143,495 | |
| Work in process | | 22,060 | | | 23,799 | |
| Finished goods | | 2,517 | | | 3,917 | |
| Total | | $ | 199,201 | | | $ | 171,211 | |
Note 7.5. Property and Equipment, Net
Property and equipment, net consisted of the following:
|
| | | | | | | | | | |
| | | (In thousands) December 31, | | Range of Estimated |
| | | 2017 | | 2016 | | Useful Lives |
| Land | | $ | 15,662 |
| | $ | 15,662 |
| | |
| Buildings and improvements | | 57,024 |
| | 49,870 |
| | 5 - 40 Years |
| Machinery and equipment | | 146,175 |
| | 137,555 |
| | 2 - 20 Years |
| Furniture and equipment | | 21,127 |
| | 21,749 |
| | 2 - 10 Years |
| Construction in progress | | 13,480 |
| | 12,238 |
| | |
| | | 253,468 |
| | 237,074 |
| | |
| Less accumulated depreciation | | 143,216 |
| | 135,484 |
| | |
| Total | | $ | 110,252 |
| | $ | 101,590 |
| | |
| | | | | | | | | | | | | | | | | | | | |
| | (In thousands)
December 31, | | Range of
Estimated |
| | 2023 | | 2022 | | Useful Lives |
| Land | | $ | 11,154 | | | $ | 10,494 | | | |
| Buildings and improvements | | 52,130 | | | 51,110 | | | 5 - 40 Years |
| Machinery and equipment | | 189,480 | | | 179,606 | | | 2 - 20 Years |
| Furniture and equipment | | 21,698 | | | 17,977 | | | 2 - 10 Years |
| Construction in progress | | 18,329 | | | 18,545 | | | |
| | 292,791 | | | 277,732 | | | |
| Less accumulated depreciation | | 181,412 | | | 171,507 | | | |
| Total | | $ | 111,379 | | | $ | 106,225 | | | |
Depreciation expense was $13.2$15.5 million, $13.3$14.5 million, and $15.7$14.1 million, for the years ended December 31, 2017, 20162023, 2022 and 2015,2021, respectively.
Note 6. Leases
Sale-Leaseback Transaction
In December 2021, we entered into a sale-leaseback transaction for the building and related land for our Gardena performance center located in Carson, California (“Sale-Leaseback Agreement”). The building and related land was sold for $143.1 million and we had no continuing involvement. The carrying value of the building and related land was $9.4 million and we recognized a gain of $132.5 million. As part of the Sale-Leaseback Agreement, we entered into an initial five year lease for the usage of the
just sold building and related land, with three options to renew in five year increments. The lease was classified as an operating lease and the future minimum base monthly lease payments during the initial five year period in aggregate total $19.6 million.
All Leases
We elected to utilize the following practical expedients that are permitted under ASC 842:
•As an accounting policy election by class of underlying asset, elected not to separate nonlease components from lease components and instead to account for each separate lease component and the nonlease components associated with that lease component as a single lease component; and
•As an accounting policy election not to apply the recognition requirements in ASC 842 to short term leases (a lease at commencement date has a lease term of 12 months or less and does not contain a purchase option that the lessee is reasonably certain to exercise).
We have operating and finance leases for manufacturing facilities, corporate offices, and various equipment. Our leases have remaining lease terms of 1 to 9 years, some of which include options to extend the leases for up to 15 years, and some of which include options to terminate the leases within 1 year.
The components of lease expense consisted of the following: | | | | | | | | | | | | | |
| (In thousands) | | |
| Years Ended | | |
| December 31, 2023 | | December 31, 2022 | | |
| Operating leases expense | $ | 10,855 | | | 10,521 | | | |
| | | | | |
| Finance leases expense: | | | | | |
| Amortization of right-of-use assets | $ | 358 | | | 343 | | | |
| Interest on lease liabilities | 48 | | | 53 | | | |
| Total finance lease expense | $ | 406 | | | $ | 396 | | | |
Short term and variable lease expenses for the year ended December 31, 2023 were not material.
Supplemental cash flow information related to leases was as follows: | | | | | | | | | | | |
| (In thousands) |
| Years Ended |
| December 31, 2023 | | December 31, 2022 |
| Cash paid for amounts included in the measurement of lease liabilities: | | | |
| Operating cash flows from operating leases | $ | 8,853 | | | $ | 7,669 | |
| Operating cash flows from finance leases | $ | 48 | | | $ | 53 | |
| Financing cash flows from finance leases | $ | 340 | | | $ | 346 | |
| | | |
| Right-of-use assets obtained in exchange for lease obligations: | | | |
| Operating leases | $ | 5,348 | | | $ | 8,332 | |
| Finance leases | $ | — | | | $ | 245 | |
The weighted average remaining lease terms were as follows: | | | | | | | | | | | |
| (In years) |
| December 31, 2023 | | December 31, 2022 |
| Operating leases | 4 | | 5 |
| Finance leases | 5 | | 6 |
When a lease is identified, we recognize a right-of-use asset and a corresponding lease liability based on the present value of the lease payments over the lease term discounted using our incremental borrowing rate, unless an implicit rate is readily determinable. As the discount rate in our leases is usually not readily available, we use our own incremental borrowing rate as the discount rate. Our incremental borrowing rate is based on the interest rate on our term loan, which is a secured rate. After
we completed a financing of all our existing debt in July 2022, the interest rate on our term loan was based on Term Secured Overnight Financing Rate (“Term SOFR”) plus an applicable margin. Prior to the refinancing, the interest rate on our term loans were based on London Interbank Offered Rate (“LIBOR”) plus an applicable margin.
The weighted average discount rates were as follows: | | | | | | | | | | | |
| Years Ended |
| December 31, 2023 | | December 31, 2022 |
| Operating leases | 3.0% | | 3.0% |
| Finance leases | 3.7% | | 3.6% |
Maturity of operating and finance lease liabilities are as follows: | | | | | | | | | | | | | | |
| | (In thousands) |
| | Operating Leases | | Finance Leases |
| 2024 | | $ | 8,647 | | | $ | 321 | |
| 2025 | | 8,398 | | | 262 | |
| 2026 | | 8,113 | | | 208 | |
| 2027 | | 2,885 | | | 175 | |
| 2028 | | 2,385 | | | 135 | |
| Thereafter | | 2,505 | | | 176 | |
| Total lease payments | | 32,933 | | | 1,277 | |
| Less imputed interest | | 2,113 | | | 113 | |
| Total | | $ | 30,820 | | | $ | 1,164 | |
Operating lease payments related to options to extend lease terms that are reasonably certain of being exercised are not significant. As of December 31, 2023, there are no legally binding minimum lease payments for leases signed but not yet commenced.
Finance lease payments related to options to extend lease terms that are reasonably certain of being exercised are not significant. As of December 31, 2023, there are no legally binding minimum lease payments for leases signed but not yet commenced.
Note 8.7. Goodwill and Other Intangible Assets
Goodwill
The carrying amounts of goodwill, all in our Electronic Systemsby operating segment, for the years ended December 31, 20172023 and 20162022 were as follows: | | | | | | | | | | | | | | | | | | | | |
| | | (In thousands) |
| | Electronic
Systems | | Structural
Systems | | Consolidated
Ducommun |
| Gross goodwill | | $ | 199,157 | | | $ | 85,972 | | | $ | 285,129 | |
| Accumulated goodwill impairment | | (81,722) | | | — | | | (81,722) | |
| | | | | | |
| Balance at December 31, 2022 | | 117,435 | | | 85,972 | | | 203,407 | |
| | | | | | |
| | | | | | |
| Goodwill from acquisition during period | | — | | | 41,193 | | | 41,193 | |
| Balance at December 31, 2023 | | $ | 117,435 | | | $ | 127,165 | | | $ | 244,600 | |
|
| | | | |
| | | (In thousands) |
| Gross goodwill | | $ | 164,276 |
|
| Accumulated goodwill impairment | | (81,722 | ) |
| Balance at December 31, 2016 | | 82,554 |
|
| Goodwill from acquisition during the period | | 34,881 |
|
| Balance at December 31, 2017 | | $ | 117,435 |
|
Goodwill is evaluated forWe perform our annual goodwill impairment on a annual basis ontest as of the first day of the fourth fiscal quarter or more frequently if events or changesquarter. If certain factors occur, including significant under performance of our business relative to expected operating results, significant adverse economic and industry trends, significant decline in circumstances indicate that the asset may be impaired. Our impairment evaluationour market capitalization for an extended period of goodwill consists oftime relative to net book value, a qualitative assessmentdecision to determine if it is more likely than not that the fair value ofdivest individual businesses within a reporting unit, is less than its carrying amount.or a decision to group individual businesses differently, we may be required to perform an interim impairment test prior to the fourth quarter.
We may use either a qualitative or quantitative approach when testing a reporting unit’s goodwill for impairment. The qualitative evaluation is an assessment of factors, including reporting unit specific operating results as well as industry, market, and economic conditions,approach for potential impairment analysis to determine whether it is more likely than not that the fair value of a reporting unit iswas less than its carrying amount, including goodwill. If our qualitative assessment indicates it is more likely than not that theamount.
estimated fair value of a reporting unit exceeds its carrying value, no furtherThe quantitative approach for potential impairment analysis is required and goodwill is not impaired. Otherwise, we will follow a two-step quantitative goodwill impairment test to determine if goodwill is impaired.
In the fourth quarter of 2017, the carrying amount of goodwill at the date of the most recent annual impairment evaluation was $117.4 million, all of which was in our Electronic Systems operating segment. As of the date of our 2017 annual evaluation for goodwill impairment, we used a qualitative assessment noting it was not more likely than not thatperformed by comparing the fair value of a reporting unit is less thanto its carrying value, including goodwill. Fair value is estimated by management using a combination of the income approach (which is based on a discounted cash flow model) and market approach. Management’s cash flow projections include significant judgments and assumptions, including the amount and thus, goodwill was not deemed impaired. Ourtiming of expected cash flows, long-term growth rates, and discount rates. The cash flows used in the discounted cash flow model are based on our best estimate of future revenues, gross margins, and adjusted after-tax earnings. If any of these assumptions are incorrect, it will impact the estimated fair value of a reporting unit. The market approach also requires management judgment in selecting comparable companies, business acquisitions and the transaction values observed and its related control premiums.
As our most recent step-onestep one goodwill impairment test for our Electronic Systems reporting unit was in 2019, we elected to perform a step one goodwill impairment analysis was inas of the prior yearfirst day of the fourth quarter of 2016 and2023 where the fair value of theour Electronic Systems internal reporting unit exceeded its carrying value. Our commercial aerospace end-use market business continues to be negatively impacted by the lingering effects of the COVID-19 pandemic and the resulting inflation, supply chain and other issues, and therefore, we performed a step one goodwill impairment test for our Structural Systems reporting unit as of the first day of the fourth quarter of 2023, where the fair value at that time by 32% and thus, wasof our Structural Systems reporting unit exceeded its carrying value. Thus, the respective goodwill amounts were not deemed impaired.
In September 2017,On April 25, 2023, we acquired 100.0%completed the acquisition of the outstanding equity interests of LDS for a purchase price of $60.0 million, net of cash acquired. We allocated the gross purchase price of $62.0 million to the assets acquired and liabilities assumed at estimated fair values.BLR. The excess of the purchase price over the aggregate fair values of the net assets was recorded as goodwill. See Note 2.2 for further information.
Other Intangible Assets
Other intangible assets are related to acquisitions, including LDS,BLR, and recorded at fair value at the time of the acquisition. Other intangible assets with finite lives are generally amortized on the straight-line method over periods ranging from fourteen2 to eighteen23 years. Intangible assets are as follows:
|
| | | | | | | | | | | | | | | | | | | | | | | | | |
| | | | (In thousands) |
| | | | December 31, 2017 | | December 31, 2016 |
| | Wtd. Avg Life (Yrs) | | Gross Carrying Amount | | Accumulated Amortization | | Net Carrying Amount | | Gross Carrying Amount | | Accumulated Amortization | | Net Carrying Amount |
| Finite-lived assets | | | | | | | | | | | | | |
| Customer relationships | 17 | | $ | 180,300 |
| | $ | 67,449 |
| | $ | 112,851 |
| | $ | 159,200 |
| | $ | 58,352 |
| | $ | 100,848 |
|
| Trade names | 15 | | 1,300 |
| | 26 |
| | 1,274 |
| | — |
| | — |
| | — |
|
| Contract renewal | 14 | | 1,845 |
| | 1,493 |
| | 352 |
| | 1,845 |
| | 1,362 |
| | 483 |
|
| Technology | 15 | | 400 |
| | 184 |
| | 216 |
| | 400 |
| | 158 |
| | 242 |
|
| Total | | | $ | 183,845 |
| | $ | 69,152 |
| | $ | 114,693 |
| | $ | 161,445 |
| | $ | 59,872 |
| | $ | 101,573 |
|
| | | | | | | | | | | | | | | | | | | | | | | | | | | | | | | | | | | | | | | | | |
| | | (In thousands) |
| | | December 31, 2023 | | December 31, 2022 |
| Wtd. Avg Life (Yrs) | | Gross
Carrying
Amount | | Accumulated
Amortization | | Net
Carrying
Amount | | Gross
Carrying
Amount | | Accumulated
Amortization | | Net
Carrying
Amount |
| Finite-lived assets | | | | | | | | | | | | | |
| Customer relationships | 17 | | $ | 261,300 | | | $ | 142,423 | | | $ | 118,877 | | | $ | 246,300 | | | $ | 127,999 | | | $ | 118,301 | |
| Trade names and trademarks | 16 | | 10,400 | | | 2,258 | | | 8,142 | | | 5,500 | | | 1,670 | | | 3,830 | |
| Contract renewal | 14 | | 1,845 | | | 1,845 | | | — | | | 1,845 | | | 1,845 | | | — | |
| Technology | 23 | | 36,000 | | | 1,376 | | | 34,624 | | | 400 | | | 318 | | | 82 | |
| Backlog | 2 | | 600 | | | 600 | | | — | | | 600 | | | 312 | | | 288 | |
| Total finite-lived assets | | | 310,145 | | | 148,502 | | | 161,643 | | | 254,645 | | | 132,144 | | | 122,501 | |
| | | | | | | | | | | | | |
| Indefinite-lived assets | | | | | | | | | | | | | |
| Trade names and trademarks | | | 4,700 | | | — | | | 4,700 | | | 4,700 | | | — | | | 4,700 | |
| Total | | | $ | 314,845 | | | $ | 148,502 | | | $ | 166,343 | | | $ | 259,345 | | | $ | 132,144 | | | $ | 127,201 | |
The carrying amount of other intangible assets by operating segment as of December 31, 20172023 and 20162022 was as follows:
| | | | | | | | | | | | | | | | | | | | | | | | | | | | | | | | | | | | | | |
| | (In thousands) |
| | December 31, 2023 | | December 31, 2022 |
| | Gross | | Accumulated
Amortization | | Net
Carrying
Value | | Gross | | Accumulated
Amortization | | Net
Carrying
Value |
| Other intangible assets | | | | | | | | | | | | |
| Electronic Systems | | $ | 164,545 | | | $ | 108,766 | | | $ | 55,779 | | | $ | 164,545 | | | $ | 99,479 | | | $ | 65,066 | |
| Structural Systems | | 150,300 | | | 39,736 | | | 110,564 | | | 94,800 | | | 32,665 | | | 62,135 | |
| Total | | $ | 314,845 | | | $ | 148,502 | | | $ | 166,343 | | | $ | 259,345 | | | $ | 132,144 | | | $ | 127,201 | |
|
| | | | | | | | | | | | | | | | | | | | | | | | |
| | | (In thousands) |
| | | December 31, 2017 | | December 31, 2016 |
| | | Gross | | Accumulated Amortization | | Net Carrying Value | | Gross | | Accumulated Amortization | | Net Carrying Value |
| Other intangible assets | | | | | | | | | | | | |
| Structural Systems | | $ | 19,300 |
| | $ | 16,464 |
| | $ | 2,836 |
| | $ | 19,300 |
| | $ | 15,555 |
| | $ | 3,745 |
|
| Electronic Systems | | 164,545 |
| | 52,688 |
| | 111,857 |
| | 142,145 |
| | 44,317 |
| | 97,828 |
|
| Total | | $ | 183,845 |
| | $ | 69,152 |
| | $ | 114,693 |
| | $ | 161,445 |
| | $ | 59,872 |
| | $ | 101,573 |
|
Amortization expense of other intangible assets was $9.3$16.4 million, $9.0$14.6 million and $10.0$13.1 million for the years ended December 31, 2017, 20162023, 2022 and 2015,2021, respectively. Future amortization expense by operating segment is expected to be as follows:
|
| | | | | | | | | | | | |
| | | (In thousands) |
| | | Structural Systems | | Electronic Systems | | Consolidated Ducommun |
| 2018 | | $ | 737 |
| | $ | 9,420 |
| | $ | 10,157 |
|
| 2019 | | 591 |
| | 9,419 |
| | 10,010 |
|
| 2020 | | 490 |
| | 9,348 |
| | 9,838 |
|
| 2021 | | 381 |
| | 9,287 |
| | 9,668 |
|
| 2022 | | 320 |
| | 9,288 |
| | 9,608 |
|
| Thereafter | | 317 |
| | 65,095 |
| | 65,412 |
|
| | | $ | 2,836 |
| | $ | 111,857 |
| | $ | 114,693 |
|
| | | | | | | | | | | | | | | | | | | | |
| | (In thousands) |
| | Electronic
Systems | | Structural
Systems | | Consolidated
Ducommun |
| 2024 | | $ | 9,288 | | | $ | 7,452 | | | $ | 16,740 | |
| 2025 | | 9,288 | | | 7,464 | | | 16,752 | |
| 2026 | | 9,288 | | | 7,440 | | | 16,728 | |
| 2027 | | 9,288 | | | 7,437 | | | 16,725 | |
| 2028 | | 9,288 | | | 6,892 | | | 16,180 | |
| Thereafter | | 9,339 | | | 69,179 | | | 78,518 | |
| | $ | 55,779 | | | $ | 105,864 | | | $ | 161,643 | |
Note 9.8. Accrued and Other Liabilities
The components of accrued and other liabilities consisted of the following:
| | | | | | | | | | | | | | |
| | (In thousands)
December 31, |
| | 2023 | | 2022 |
| Accrued compensation | | $ | 35,574 | | | $ | 28,785 | |
| Accrued income tax and sales tax | | 177 | | | 10,478 | |
| Other | | 6,509 | | | 9,557 | |
| Total | | $ | 42,260 | | | $ | 48,820 | |
|
| | | | | | | | |
| | | (In thousands) December 31, |
| | | 2017 | | 2016 |
| Accrued compensation | | $ | 18,925 |
| | $ | 15,455 |
|
| Accrued income tax and sales tax | | 71 |
| | 332 |
|
| Customer deposits | | 3,970 |
| | 3,204 |
|
| Provision for forward loss reserves | | 1,226 |
| | 4,780 |
|
| Other | | 4,137 |
| | 5,508 |
|
| Total | | $ | 28,329 |
| | $ | 29,279 |
|
Note 10.9. Long-Term Debt
Long-term debt and the current period interest rates were as follows:
| | | | | | | | | | | | | | |
| | (In thousands)
December 31, |
| | 2023 | | 2022 |
| Term loans | | $ | 242,188 | | | $ | 248,438 | |
| Revolving credit facility | | 23,800 | | | — | |
| | | | |
| | | | |
| Total debt | | 265,988 | | | 248,438 | |
| Less current portion | | 7,813 | | | 6,250 | |
| Total long-term debt, less current portion | | 258,175 | | | 242,188 | |
| Less debt issuance costs - term loans | | (1,214) | | | (1,593) | |
| Total long-term debt, net of debt issuance costs - term loans | | $ | 256,961 | | | $ | 240,595 | |
Debt issuance costs - revolving credit facility (1) | | $ | 1,761 | | | $ | 2,265 | |
| | | | |
| Weighted-average interest rate | | 7.53 | % | | 4.36 | % |
|
| | | | | | | | |
| | | (In thousands) December 31, |
| | | 2017 | | 2016 |
| Term loan | | $ | 160,000 |
| | $ | 170,000 |
|
| Revolving credit facility | | 58,100 |
| | — |
|
| Other debt (fixed 5.41%) | | — |
| | 3 |
|
| Total debt | | 218,100 |
| | 170,003 |
|
| Less current portion | | — |
| | 3 |
|
| Total long-term debt | | 218,100 |
| | 170,000 |
|
| Less debt issuance costs | | 2,045 |
| | 3,104 |
|
| Total long-term debt, net of debt issuance costs | | $ | 216,055 |
| | $ | 166,896 |
|
| Weighted-average interest rate | | 3.73 | % | | 3.25 | % |
(1) Included as part of other assets.
Future long-term debt payments at December 31, 20172023 were as follows:
| | | | | |
| (In thousands) |
| 2024 | $ | 7,813 | |
| 2025 | 12,500 | |
| 2026 | 14,063 | |
| 2027 | 231,612 | |
| 2028 | — | |
| Thereafter | — | |
| Total | $ | 265,988 | |
|
| | | |
| | (In thousands) |
| 2018 | $ | — |
|
| 2019 | — |
|
| 2020 | 218,100 |
|
| 2021 | — |
|
| 2022 | — |
|
| Total | $ | 218,100 |
|
OurIn July 2022, we completed a refinancing of all our existing debt by entering into a new term loan (“2022 Term Loan”) and a new revolving credit facility consists of(“2022 Revolving Credit Facility”). The 2022 Term Loan is a $275.0$250.0 million senior secured term loan whichthat matures on June 26, 2020 (“Term Loan”), andJuly 14, 2027. The 2022 Revolving Credit Facility is a $200.0 million senior secured revolving credit facility that matures on July 14, 2027. The 2022 Term Loan and 2022 Revolving Credit Facility, collectively are the new credit facilities (“2022 Credit Facilities”).
The 2022 Term Loan bears interest, at our option, at a rate equal to either (i) Term Secured Overnight Financing Rate (“Term SOFR”) plus an applicable margin ranging from 1.375% to 2.375% per year or (ii) Base Rate (defined as the highest of [a] Federal Funds Rate plus 0.50%, [b] Bank of America’s prime rate, and [c] Term SOFR plus 1.00%, and if the Base Rate is less than zero percent, it will be deemed zero percent) plus an applicable margin ranging from 0.375% to 1.375% per year, in each case based upon the consolidated total net adjusted leverage ratio. Interest payments are typically paid either on a monthly or quarterly basis, depending on the interest rate selected, on the last business day each month or quarter. In addition, the 2022 Term Loan requires quarterly amortization payments of 0.625% during year one and year two, 1.250% during year three and year four, and 1.875% during year five of the original outstanding principal balance of the 2022 Term Loan amount, on the last business day each quarter. The first quarterly amortization payment of $1.6 million was required to be paid and was paid during the fourth quarter of 2022. We made the required quarterly amortization payments totaling $6.3 million and $5.1 million during the years ended December 31, 2023 and 2022, respectively.
The 2022 Revolving Credit Facility bears interest, at our option, at a rate equal to either (i) Term SOFR plus an applicable margin ranging from 1.375% to 2.375% per year or (ii) Base Rate (defined as the highest of [a] Federal Funds Rate plus 0.50%, [b] Bank of America’s prime rate, and [c] Term SOFR plus 1.00%, and if the Base Rate is less than zero percent, it will be deemed zero percent) plus an applicable margin ranging from 0.375% to 1.375% per year, in each case based upon the consolidated total net adjusted leverage ratio. Interest payments are typically paid either on a monthly or a quarterly basis, depending on the interest rate selected, on the last business day each month or quarter. The undrawn portion of the commitment of the 2022 Revolving Credit Facility is subject to a commitment fee ranging from 0.175% to 0.275%, based upon the consolidated total net adjusted leverage ratio, typically paid on a quarterly basis, on the last business day each quarter. However, the 2022 Revolving Credit Facility does not require any principal installment payments.
In conjunction with the closing of the 2022 Credit Facilities, we utilized the entire $250.0 million of proceeds from the 2022 Term Loan plus our existing cash on hand to pay off our entire debt balance outstanding of $254.2 million under prior credit facilities (described below).
In December 2019, we completed the refinancing of a portion of our then existing debt by entering into a new revolving credit facility (“2019 Revolving Credit Facility”), which matures to replace the then existing revolving credit facility that was entered into in November 2018 (“2018 Revolving Credit Facility”) and entered into a new term loan (“2019 Term Loan”). The 2019 Revolving Credit Facility was a $100.0 million senior secured revolving credit facility that would have matured on June 26, 2020December 20, 2024 and replaced the $100.0 million 2018 Revolving Credit Facility that would have matured on November 21, 2023. The 2019 Term Loan was a $140.0 million senior secured term loan that would have matured on December 20, 2024. We also had a then existing $240.0 million senior secured term loan that was entered into in November 2018 that would have matured on November 21, 2025 (“2018 Term Loan”). The original amounts available under the 2019 Revolving Credit Facility, 2019 Term Loan, and 2018 Term Loan (collectively, the “Credit“Existing Credit Facilities”). in aggregate, totaled $480.0 million at that time.
The Credit Facilities bear2019 Term Loan bore interest, at our option, at a rate equal to either (i) the Eurodollar Rate (defined as LIBOR)the London Interbank Offered Rate [“LIBOR”]) plus an applicable margin ranging from 1.50% to 2.75%2.50% per year or (ii) the Base Rate (defined as the highest of [a] Federal Funds Rate plus 0.50%, [b] Bank of America’s prime rate, and [c] the Eurodollar Rate plus 1.00%) plus an applicable margin ranging from 0.50% to 1.75%1.50% per year, in each case based upon the consolidated total net adjusted leverage ratio.ratio, typically payable quarterly. In addition, the 2019 Term Loan required amortization payments of 1.25% of the original outstanding principal balance of the 2019 Term Loan amount on a quarterly basis, on the last day of the calendar quarter. During 2022, we made the required quarterly payments on the 2019 Term Loan before it was refinanced, in aggregate totaling $3.5 million.
The 2019 Revolving Credit Facility bore interest, at our option, at a rate equal to either (i) the Eurodollar Rate (defined as LIBOR) plus an applicable margin ranging from 1.50% to 2.50% per year or (ii) the Base Rate (defined as the highest of [a] Federal Funds Rate plus 0.50%, [b] Bank of America’s prime rate, and [c] the Eurodollar Rate plus 1.00%) plus an applicable margin ranging from 0.50% to 1.50% per year, in each case based upon the consolidated total net adjusted leverage ratio, typically payable quarterly. The undrawn portionsportion of the commitmentscommitment of the 2019 Revolving Credit Facilities areFacility was subject to a commitment fee ranging from 0.175% to 0.300%0.275%, based upon the consolidated total net adjusted leverage ratio. However, the 2019 Revolving Credit Facility did not require any principal installment payments.
The 2018 Term Loan bore interest, at our option, at a rate equal to either (i) the Eurodollar Rate (defined as LIBOR plus an applicable margin ranging from 3.75% to 4.00% per year or (ii) the Base Rate (defined as the highest of [a] Federal Funds Rate
plus 0.50%, [b] Bank of America’s prime rate, and [c] the Eurodollar Rate plus 1.00%) plus an applicable margin ranging from 3.75% to 4.00% per year, in each case based upon the consolidated total net adjusted leverage ratio, typically payable quarterly. In addition, the 2018 Term Loan required amortization payments of 0.25% of the outstanding principal balance of the 2018 Term Loan amount on a quarterly basis.
Further, under the then Existing Credit Facilities, if we areexceeded the annual excess cash flow threshold, we were required to make an annual additional principal payment based on the consolidated adjusted leverage ratio. The annual mandatory prepaymentsexcess cash flow payment was based on (i) 50% of amounts outstanding under the Term Loan. The mandatory prepayments will be made quarterly,excess cash flow amount if the adjusted leverage ratio is greater than 3.25 to 1.0, (ii) 25% of the excess cash flow amount if the adjusted leverage ratio was less than or equal to 5.0% per year3.25 to 1.0 but greater than 2.50 to 1.0, and (iii) zero percent of the original aggregate principalexcess cash flow amount if the consolidated adjusted leverage ratio was less than or equal to 2.50 to 1.0. We did not exceed the annual excess cash flow threshold for 2021 and thus, no annual excess cash flow payment was required to be paid during the first two years and increase to 7.5% per yearquarter of 2022.
In addition, since we were paying down on the term loans during the third year,first quarter of 2022, we were required to pay down on the 2019 Term Loan and increase to 10.0% per year during2018 Term Loan on a pro-rata basis and thus, we paid down $13.0 million and $17.0 million on the fourth year2019 Term Loan and fifth years, with the remaining balance payable on June 26, 2020. The loans under the Revolving Credit Facility are due on June 26, 2020. 2018 Term Loan, respectively, for an aggregate total pay down of $30.0 million.
As of December 31, 2017,2023, we had $176.0 million of unused borrowing capacity under the 2022 Revolving Credit Facility, after deducting $0.2 million for standby letters of credit.
As of December 31, 2023, we were in compliance with all covenants required under the 2022 Credit Facilities.
The 2022 Term Loan was considered a modification of debt for some lenders and an extinguishment of debt for other lenders, and thus, a loss of $0.2 million was recorded related to the extinguishment. In addition, wethe new fees incurred $4.8of $0.8 million were capitalized and will be amortized to interest expense over the life of the 2022 Term Loan. Further, the remaining debt issuance costs related to the Credit Facilities2019 Term Loan and those costs were capitalized and are being2018 Term Loan of $1.0 million as of the modification date will be amortized to interest expense over the five year life of the Credit Facilities.
In September 2017, we acquired LDS for a purchase price of $60.0 million, net of cash acquired, all payable in cash. Upon the closing of the transaction, we paid $61.4 million in cash by drawing down on the Revolving Credit Facility. The remaining $0.6 million was paid in October 2017 in cash, also by drawing down on the Revolving Credit Facility. See Note 2.
In July 2017, we entered into a technical amendment to the Credit Facilities (“First Amendment”) which provided more flexibility to close certain qualified acquisitions permitted under the Credit Facilities.
We made voluntary principal prepayments of $10.0 million under the2022 Term Loan, during 2017.using the effective interest method.
As of December 31, 2017, we had $141.6 million of unused borrowing capacity under theThe 2022 Revolving Credit Facility after deducting $58.1 millionthat replaced the 2019 Revolving Credit Facility was considered a modification of debt except for draw down on the portion related to the creditor that is no longer a part of the 2022 Revolving Credit Facility and $0.3in which case, it was considered an extinguishment of debt. As a result, we expensed the portion of the unamortized debt issuance costs related to the 2019 Revolving Credit Facility that was considered an extinguishment of debt of $0.1 million. In addition, the new fees incurred of $1.7 million for standby lettersas part of credit.the 2022 Revolving Credit Facility were capitalized and will be amortized to interest expense over the life of the 2022 Revolving Credit Facility. Further, the remaining debt issuance costs related to the 2019 Revolving Credit Facility of $0.8 million as of the modification date will also be amortized to interest expense over the life of the 2022 Revolving Credit Facility.
The Existing Notes2022 Credit Facilities were issuedentered into by us (“Parent Company”) and guaranteed by all of our domestic subsidiaries, other than one subsidiarytwo subsidiaries that waswere considered minor (“Subsidiary Guarantors”). The Subsidiary Guarantors jointly and severally guarantee the Existing Notes and2022 Credit Facilities. The Parent Company has no independent assets or operations and therefore, no consolidating financial information for the Parent Company and its subsidiaries areis presented.
In October 2015,December 2021, we entered into a sale-leaseback transaction for the building and related land for our Gardena performance center located in Carson, California, for a sale price of $143.1 million. A portion of the net proceeds were used to pay down on the $65.0 million that was drawn on the 2019 Revolving Credit Facility for the Magnetic Seal LLC acquisition that was completed in December 2021. See Note 6.
On April 25, 2023, we completed the acquisition of BLR. The initial purchase price for BLR was $115.0 million, net of cash acquired, all payable in cash. We paid a gross aggregate of $117.0 million in cash upon the closing of the transaction. We utilized the 2022 Revolving Credit Facility to complete the acquisition. See Note 2.
On May 18, 2023, we completed a public offering of our common stock resulting in net proceeds of $85.1 million. We utilized the net proceeds plus cash on hand to pay down $85.2 million on the 2022 Revolving Credit Facility. See Note 10 for further information.
In November 2021, we entered into derivative contracts, U.S. dollar-one month LIBOR forward interest rate cap hedgesswaps designated as cash flow hedges, all with maturityan effective date of January 1, 2024, for an aggregate total notional amount of $150.0 million, weighted average fixed rate of 1.8%, and all terminating on January 1, 2031 (“Forward Interest Rate Swaps”). The Forward Interest Rate Swaps mature on a monthly basis, with fixed amount payer payment dates on the first day of June 2020,each calendar month, commencing on February 1, 2024 through January 1, 2031. The Forward Interest Rate Swaps were deemed to be highly effective upon entering into the derivative contracts and thus, hedge accounting treatment was utilized. Since the Amended Forward Interest Rate Swaps (as defined below) are not effective until January 1, 2024, we only record the changes in aggregate, totaling $135.0the fair value of the derivative instruments that were highly effective and that were designated and qualified as cash flow hedges. As
such, during the years ended December 31, 2023 and 2022, we recorded the unrealized gain to other comprehensive income of $1.1 million of our debt. We paid a total of $1.0and $12.1 million, in connection withrespectively, and the interest rate cap hedges.associated change to other current assets, other assets, and deferred income taxes. See Note 51 for further information. In addition, the net deferred gains recorded in other comprehensive income that will mature in the next 12 months total $4.3 million.
In December 2017 and 2016, we entered into agreements to purchase $14.2 million and $9.9 million of industrial revenue bonds (“IRBs”) issued by the city of Parsons, Kansas (“Parsons”) and concurrently, sold $14.2 million and $9.9 million of property and equipment (“Property”) to Parsons as well as entered into a lease agreement to lease the Property from Parsons (“Lease”) with lease payments totaling $14.2 million and $9.9 million over the lease term, respectively. The sale of the Property and concurrent lease back of the Property in December 2017 and 2016 did not meet the sale-leaseback accounting requirementsJuly 2022, as a result of completing a refinancing of our continuous involvement withexisting debt, we were required to complete an amendment of the PropertyForward Interest Rate Swaps (“Amended Forward Interest Rate Swaps”). The Forward Interest Rate Swaps were based on U.S. dollar-one month LIBOR and thus,were amended to be based on one month Term SOFR as borrowings using LIBOR are no longer available under the $14.2 million and $9.9 million in cash received from Parsons2022 Credit Facilities. Since this was not recordedan amendment of just the reference rate as a sale butresult of the cessation of LIBOR, utilizing the guidance under ASU 2020-04, we determined the Amended Forward Interest Rate Swaps as of the amendment date to continue to be highly effective. The Amended Forward Interest Rate Swaps weighted average fixed rate was 1.7% as a financing obligation, respectively. Further,result of the Lease included a right of offset so long as we continue to own the IRBsdifference between U.S. dollar-one month LIBOR and thus, the financing obligation of $14.2 million and $9.9 million was offset against the $14.2 million and $9.9 million, respectively, of IRBs assets and are presented net on the consolidated balance sheets with no impact to the consolidated statements of operations or consolidated cash flow statements.one month Term SOFR.
Note 11.10. Shareholders’ Equity
On May 18, 2023, we completed a public offering of 2.3 million shares of our common stock at $40.00 per share, for gross proceeds of $92.0 million. The common stock offering was made under our effective shelf registration statement. We incurred aggregate total out of pocket stock offering related fees of $6.9 million, resulting in net proceeds of $85.1 million. As such, we recorded an increase to common stock at par value of less than $0.1 million with the remaining amount as an increase to additional paid-in capital of $85.1 million. The public stock offering net proceeds along with cash on hand were used to pay down $85.2 million on the 2022 Revolving Credit Facility that was drawn on and utilized to complete the acquisition of BLR. See Note 2 and Note 9 for further information.
We are authorized to issue five million shares of preferred stock. At December 31, 20172023 and 2016,2022, no preferred shares were issued or outstanding.
Note 12.11. Stock-Based Compensation
Stock Incentive Compensation Plans
We currently have two active stock incentive plans: i) the 2007Amended and Restated 2020 Stock Incentive Plan (the “2007“2020 Plan”), as amended effective Marchwhich expires on April 20, 2007,2032, and ii) the 2018 Employee Stock Purchase Plan (“ESPP”). The 2013 Stock Incentive Plan, as Amended (the “2013 Plan”), collectively referred was closed to further issuances of stock awards in May 2020 and any remaining shares available were folded into the 2020 Plan as (the “Stock Incentive Plans”).part of the approval of the 2020 Plan by shareholders at the 2020 Annual Meeting of Shareholders in May 2020. The Stock Incentive Plans2020 Plan permit awards of stock options, restricted stock units, performance stock units and other stock-based awards to our officers, key employees and non-employee directors on terms determined by the Compensation Committee of the Board of Directors (the “Committee”“Compensation Committee”). The aggregate number of shares available for issuance under the 20072020 Plan andis 1,031,162 plus any outstanding awards issued under the 2013 Plan is 1,200,000 and 1,040,000, respectively. Under the 2007 Plan, no more than an aggregate of 400,000 sharesthat are available for issue of stock-based awards other than stock options and stock appreciation rights.subsequently forfeited, terminated, expire or otherwise lapse without being exercised. As of December 31, 2017,2023, shares available for future grant under the 2007 Plan and 20132020 Plan are zero and 77,693, respectively.141,377. Prior to the adoption of the 20072020 Plan, we granted stock-based awards to purchase shares of our common stock to officers, key employees and non-employee directors under certain predecessor plans. No further awards can be granted under the 2007 Plan or these predecessor plans.
Employee Stock Purchase Plan
The ESPP was adopted by the Board of Directors and approved by the shareholders in 2018, including 750,000 shares that can be awarded. The first offering period closed on July 31, 2019. Under the ESPP, our employees who elect to participate have the right to purchase common stock at a 15% discount from the lower of the market value of the common stock at the beginning or the end of each six month offering period and the discount will be treated as compensation to those employees. Employees purchase common stock using payroll deductions, which may not exceed 10% of their eligible compensation and other limitations. The Compensation Committee administers the ESPP. As of December 31, 2023, there are 497,766 shares available for future award grants.
Stock Options
In the years ended December 31, 2017, 2016,2023, 2022, and 2015,2021, we granteddid not grant any stock options to our officers and key employees and non-employee directors of 129,400, 123,500, and 73,000, respectively, with weighted-average grant date fair values of $11.88, $6.53, and $10.63, respectively.employees. Stock options have beenare typically granted with an exercise price equal to the fair market value of our stock on the date of grant and expire not more than seventen years from the date of grant. The stock options typically vest over a period ofthree or four years from the date of grant. The option price and number of shares are subject to adjustment under certain dilutive circumstances. If an employee terminates employment, the non-vested portion of the stock options will not vest and all rights to the non-vested portion will terminate completely.
Stock option activity for the year ended December 31, 20172023 were as follows: | | | | | | | | | | | | | | | | | | | | | | | | | | |
| | | |
| | Number
of Stock Options | | Weighted-
Average
Exercise
Price Per Share | | Weighted-Average Remaining Contractual Life (Years) | | Aggregate Intrinsic Value (in thousands) |
| Outstanding at January 1, 2023 | | 199,276 | | | $ | 36.89 | | | | | |
| Granted | | — | | | $ | — | | | | | |
| Exercised | | (49,450) | | | $ | 31.65 | | | | | |
| Expired | | (12,676) | | | $ | 38.20 | | | | | |
| Forfeited | | — | | | $ | — | | | | | |
| Outstanding at December 31, 2023 | | 137,150 | | | $ | 38.66 | | | 4.9 | | $ | 1,838 | |
| Exercisable at December 31, 2023 | | 137,150 | | | $ | 38.66 | | | 4.9 | | $ | 1,838 | |
|
| | | | | | | | | | | | | |
| | | Number of Stock Options | | Weighted- Average Exercise Price Per Share | | Weighted-Average Remaining Contractual Life (Years) | | Aggregate Intrinsic Value (in thousands) |
| Outstanding at January 1, 2017 | | 439,550 |
| | $ | 20.07 |
| | | | |
| Granted | | 129,400 |
| | $ | 29.19 |
| | | | |
| Exercised | | (212,775 | ) | | $ | 20.38 |
| | | | |
| Expired | | (5,800 | ) | | $ | 21.12 |
| | | | |
| Forfeited | | (44,150 | ) | | $ | 22.19 |
| | | | |
| Outstanding at December 31, 2017 | | 306,225 |
| | $ | 23.38 |
| | 5.2 | | $ | 1,654 |
|
| Exerciseable at December 31, 2017 | | 86,425 |
| | $ | 20.78 |
| | 2.9 | | $ | 663 |
|
Changes in nonvestedAll stock options for the year ended December 31, 2017outstanding as of January 1, 2023 were as follows:
|
| | | | | | | |
| | | Number of Stock Options | | Weighted- Average Grant Date Fair Value |
| Nonvested at January 1, 2017 | | 225,175 |
| | $ | 8.77 |
|
| Granted | | 129,400 |
| | $ | 11.88 |
|
| Vested | | (90,625 | ) | | $ | 8.87 |
|
| Forfeited | | (44,150 | ) | | $ | 7.93 |
|
| Nonvested at December 31, 2017 | | 219,800 |
| | $ | 11.07 |
|
fully vested.
The aggregate intrinsic value of stock options represents the amount by which the market price of our common stock exceeds the exercise price of the stock option. The aggregate intrinsic value of stock options exercised for the years ended December 31, 2017, 20162023, 2022 and 20152021 was $2.5$1.0 million, $1.3$2.0 million, and $2.3$1.0 million, respectively. Cash received from stock options exercised for the years ended December 31, 2017, 20162023, 2022 and 20152021 was $4.3$1.6 million, $2.1$3.5 million, and $3.1$1.7 million, respectively, with related tax benefits of $0.9$0.4 million, $0.5$0.8 million, and $0.9$0.4 million, respectively. The total amount of stock options vested and expected to vest in the future is 306,225137,150 shares with a weighted-average exercise price of $23.38$38.66 and an aggregate intrinsic value of $1.7$1.8 million. There are no unvested stock options as of December 31, 2023. These stock options have a weighted-average remaining contractual term of 5.24.9 years.
The share-based compensation cost expensed for stock options for the years ended December 31, 2017, 2016,2023, 2022, and 20152021 (before tax benefits) was $0.7 million, $0.8zero, $0.3 million, and $1.2 million, respectively, and is included in selling, general and administrative expenses on the consolidated income statements. At December 31, 2017, total2023, there was no remaining unrecognized compensation cost (before tax benefits) related to stock options of $1.5 million is expected to be recognized over a weighted-average period of 3.1 years.options. The total fair value of stock options vested during the years ended December 31, 2017, 2016,2023, 2022, and 20152021 was zero, $0.8 million, $0.9 million, and $1.3$1.7 million, respectively.
We typically apply fair value accounting for stock-based compensation based on the grant date fair value estimated using a Black-Scholes-Merton (“Black-Scholes”) valuation model. The assumptions used to compute the fair value ofThere were no stock option grantsoptions granted under the Stock Incentive Plans2020 Plan for the years ended December 31, 2017, 2016,2023, 2022, and 2015 were as follows:2021. |
| | | | | | | | | |
| | | Years Ended December 31, |
| | | 2017 | | 2016 | | 2015 |
| Risk-free interest rate | | 1.75 | % | | 1.20 | % | | 1.13 | % |
| Expected volatility | | 50.37 | % | | 51.79 | % | | 53.72 | % |
| Expected dividends | | — |
| | — |
| | — |
|
| Expected term (in months) | | 48 |
| | 48 |
| | 47 |
|
We recognize compensation expense, net of an estimated forfeiture rate, on a straight-line basis over the requisite service period of the award. We have one award populationpopulations with an option vesting termterms ofthree and four years. We estimate the forfeiture rate based on our historic experience, attempting to determine any discernible activity patterns. The expected life computation is based on historic exercise patterns and post-vesting termination behavior. The risk-free interest rate for periods within the contractual life of the award is based on the U.S. Treasury yield curve in effect at the time of grant. The expected volatility is derived from historical volatility of our common stock. We suspended payments of dividends after the first quarter of 2011.
Restricted Stock Units
We granted restricted stock units (“RSUs”) to certain officers, key employees and non-employee directors of 135,350, 139,450,110,067, 118,847, and 108,500118,995 RSUs during the years ended December 31, 2017, 2016,2023, 2022, and 2015,2021, respectively, with weighted-average grant date fair values (equal to the fair market value of our stock on the date of grant) of $28.97, $15.97,$51.57, $51.76, and $25.15$55.92 per share, respectively. RSUs represent a right to receive a share of stock at future vesting dates with no cash payment required from the holder. The RSUs typically have a three year vesting term of 33%33.3%, 33%33.3% and 34%33.4% on the first, second and third anniversaries of the date of grant, respectively. If an employee terminates employment, their non-vested portion of the RSUs will not vest and all rights to the non-vested portion will terminate.
Restricted stock unit activity for the year ended December 31, 20172023 was as follows:
|
| | | | | | | |
| | | Number of Restricted Stock Units | | Weighted- Average Grant Date Fair Value |
| Outstanding at January 1, 2017 | | 193,382 |
| | $ | 18.88 |
|
| Granted | | 135,350 |
| | $ | 28.97 |
|
| Vested | | (101,930 | ) | | $ | 19.66 |
|
| Forfeited | | (41,458 | ) | | $ | 21.93 |
|
| Outstanding at December 31, 2017 | | 185,344 |
| | $ | 25.14 |
|
| | | | | | | | | | | | | | |
| | Number of Restricted Stock Units | | Weighted-
Average
Grant
Date Fair Value |
| Outstanding at January 1, 2023 | | 201,795 | | | $ | 47.81 | |
| Granted | | 110,067 | | | $ | 51.57 | |
| Vested | | (76,866) | | | $ | 47.50 | |
| Forfeited | | (25,182) | | | $ | 51.99 | |
| Outstanding at December 31, 2023 | | 209,814 | | | $ | 49.46 | |
The share-based compensation cost expensed for RSUs for the years ended December 31, 2017, 2016,2023, 2022, and 20152021 (before tax benefits) was $2.0$4.5 million, $1.8$3.8 million, and $1.8$4.1 million respectively, and is included in selling, general and administrative expenses on the consolidated income statements. At December 31, 2017,2023, total unrecognized compensation cost (before tax benefits) related to RSUs of $3.0$5.5 million is expected to be recognized over a weighted average period of 2.01.6 years. The total
fair value of RSUs vested for the years ended December 31, 2017, 2016,2023, 2022, and 20152021 was $3.0$3.9 million, $1.3$3.5 million, and $1.8$4.2 million, respectively. The tax benefit realized from vested RSUs for the years ended December 31, 2017, 2016,2023, 2022, and 20152021 was $1.1$0.9 million, $0.7$0.8 million, and $0.7$1 million, respectively.
Performance Stock Units
We granted performance stock awards (“PSUs”) to certain key employees of 126,000, 62,500,160,852, 111,654, and 64,000182,886 PSUs during the years ended December 31, 2017, 2016,2023, 2022, and 2015,2021, respectively, with weighted-average grant date fair values of $26.31, $15.92,$40.51, $48.18, and $25.51$49.76 per share, respectively. PSU awards are subject to the attainment of performance goals established by the Compensation Committee, the periods during which performance is to be measured, and all other limitations and conditions applicable to the awarded shares. Performance goals are based on a pre-established objective formula that specifies the manner of determining the number of performance stock awardsPSUs that will be granted if performance goals are attained. If an employee terminates employment, their non-vested portion of the PSUs will not vest and all rights to the non-vested portion will terminate.
Performance stock activity for the year ended December 31, 20172023 was as follows:
|
| | | | | | | |
| | | Number of Performance Stock Units | | Weighted- Average Grant Date Fair Value |
| Outstanding at January 1, 2017 | | 121,637 |
| | $ | 20.39 |
|
| Granted | | 126,000 |
| | $ | 26.31 |
|
| Adjustment for target performance | | 37,350 |
| | $ | 25.48 |
|
| Vested | | (43,487 | ) | | $ | 24.98 |
|
| Forfeited | | (20,000 | ) | | $ | 22.63 |
|
| Outstanding at December 31, 2017 | | 221,500 |
| | $ | 23.52 |
|
| | | | | | | | | | | | | | |
| | Number of Performance Stock Units | | Weighted-
Average
Grant
Date Fair Value |
| Outstanding at January 1, 2023 | | 301,354 | | | $ | 42.42 | |
| Granted | | 160,852 | | | $ | 40.51 | |
| | | | |
| Vested | | (154,883) | | | $ | 28.96 | |
| Forfeited | | (38,135) | | | $ | 31.19 | |
| Outstanding at December 31, 2023 | | 269,188 | | | $ | 50.52 | |
The share-based compensation cost expensed for PSUs for the years ended December 31, 2017, 2016,2023, 2022, and 20152021 (before tax benefits) was $2.0$6.9 million, $0.4$5.1 million and $0.5$5.9 million, respectively, and is included in selling, general and administrative expenses on the consolidated income statements. At December 31, 2017,2023, total unrecognized compensation cost (before tax benefits) related to PSUs of $2.4$6.0 million is expected to be recognized over a weighted-average period of 1.71.3 years. The total fair value of PSUs vested during the years ended December 31, 2017, 2016,2023, 2022, and 2015,2021, was $1.2$8.5 million, $1.1$4.4 million, and $0.9$9.6 million, respectively. The tax benefit realized from PSUs for the years ended December 31, 2017, 2016,2023, 2022, and 20152021 were $0.5$2.0 million, $0.2$1.1 million, and $0.3$2.3 million, respectively.
Performance-Based With Market Condition Cash Settled Long-Term Incentive Awards
As permitted under the 2020 Plan, performance-based with market condition cash settled long-term incentive awards (“Performance-Based Cash LTIPs”) were granted in 2023 and 2022. Performance-Based Cash LTIPs will be settled in cash and are subject to the attainment of performance goals established by the Compensation Committee (including achievement of relative total shareholder return market condition), the periods during which performance is to be measured, and all other limitations and conditions applicable to the Performance-Based Cash LTIPs’ values. Performance goals are based on a pre-established objective formula that specifies the manner of determining the value of the Performance-Based Cash LTIPs that will be issued if performance goals are attained. If an employee terminates employment, their non-vested portion of the Performance-Based Cash LTIPs will not vest and all rights to the non-vested portion of the Performance-Based Cash LTIPs will terminate. The Compensation Committee administers the Performance-Based Cash LTIPs. The share-based compensation
expense recorded for the Performance-Based Cash LTIPs for the years ended December 31, 2023, 2022, and 2021 (before tax benefits) was $2.7 million, $1.2 million, and zero, respectively.
Note 13.12. Employee Benefit Plans
Supplemental Retirement Plans
We have three unfunded supplemental retirement plans. The first plan was suspended in 1986, but continues to cover certain former executives. The second plan was suspended in 1997, but continues to cover certain current and retired directors. The third plan covers certain current and retired employees and further employee contributions to this plan were suspended on August 5, 2011. The liability for the third plan and interest thereon is included in accrued employee compensation and long-term liabilities and was $0.1 million and $0.7 million, respectively, at December 31, 2017 and $0.6 million and $0.8 million, respectively, at December 31, 2016. The accumulated benefit obligations of the first two plans at December 31, 2017 and December 31, 2016 were $0.6 million and $0.7 million, respectively, and are included in accrued liabilities.
Defined Contribution 401(K)401(k) Plans
We sponsor a 401(k) defined contribution plan for all our employees. The plan allows the employees to make annual voluntary contributions not to exceed the lesser of an amount equal to 25% of their compensation or limits established by the Internal Revenue Code. Under this plan, we generally provide a match equal to 50% of the employee’s contributions up to the first 6% of compensation, except for union employees who are not eligible to receive the match. Our provision for matching and profit sharing contributions for the three years ended December 31, 2017, 2016,2023, 2022, and 20152021 was $2.7$3.1 million, $2.7$2.9 million, and $3.2$2.8 million, respectively.
Other PlansPension Plan and LaBarge Retirement Plan
We have a defined benefit pension plan covering certain hourly employees of a subsidiary (the “Pension Plan”). Pension Plan benefits are generally determined on the basis of the retiree’s age and length of service. Assets of the Pension Plan are
composed primarily of fixed income and equity securities. We also have a retirement plan covering certain current and retired employees (the “LaBarge Retirement Plan”).
The consolidation of one of our performance centers as part of the 2022 Restructuring Plan as discussed in Note 3 resulted in the curtailment of the Pension Plan during the fourth quarter of 2022, but it had an immaterial impact on our consolidated financial statements.
The components of net periodic pension cost for both plansthe Pension Plan and LaBarge Retirement Plan in aggregate are as follows: | | | | | | | | | | | | | | | | | | | | |
| | (In thousands)
Years Ended December 31, |
| | 2023 | | 2022 | | 2021 |
| Service cost | | $ | 406 | | | $ | 625 | | | $ | 676 | |
| Interest cost | | 1,503 | | | 1,089 | | | 1,010 | |
| Expected return on plan assets | | (1,790) | | | (2,081) | | | (1,895) | |
| Amortization of actuarial losses | | 220 | | | 585 | | | 1,285 | |
| Net periodic pension cost | | $ | 339 | | | $ | 218 | | | $ | 1,076 | |
|
| | | | | | | | | | | | |
| | | (In thousands) Years Ended December 31, |
| | | 2017 | | 2016 | | 2015 |
| Service cost | | $ | 531 |
| | $ | 531 |
| | $ | 785 |
|
| Interest cost | | 1,329 |
| | 1,367 |
| | 1,350 |
|
| Expected return on plan assets | | (1,530 | ) | | (1,482 | ) | | (1,495 | ) |
| Amortization of actuarial losses | | 810 |
| | 762 |
| | 887 |
|
| Net periodic pension cost | | $ | 1,140 |
| | $ | 1,178 |
| | $ | 1,527 |
|
The components of the reclassifications of net actuarial losses from accumulated other comprehensive loss to net income for 20172023 were as follows:
|
| | | | |
| | | (In thousands) Year Ended December 31, |
| | | 2017 |
Amortization of actuarial loss - total before tax (1) | | $ | 810 |
|
| Tax benefit | | (302 | ) |
| Net of tax | | $ | 508 |
|
| | | | | | | | |
| | (In thousands)
Year Ended December 31, |
| | 2023 |
Amortization of actuarial loss - total before tax (1) | | The amortization expense is included in the computation$ | 220 | |
| Tax benefit | | (53) | |
Net of periodic pension cost and is a decrease to net income upon reclassification from accumulated other comprehensive loss.tax | | $ | 167 | |
(1)The amortization expense is included in the computation of periodic pension cost and is a decrease to net income upon reclassification from accumulated other comprehensive loss.
The estimated net actuarial loss for both plans that will be amortized from accumulated other comprehensive loss into net periodic cost during 20182024 is $0.7$0.4 million.
The obligations, fair value of plan assets, and funded status of both plans are as follows:
| | | | | | | | | | | | | | |
| | (In thousands)
December 31, |
| | 2023 | | 2022 |
Change in benefit obligation(1) | | | | |
| Beginning benefit obligation (January 1) | | $ | 30,337 | | | $ | 39,805 | |
| Service cost | | 406 | | | 625 | |
| Interest cost | | 1,503 | | | 1,089 | |
| Actuarial gain | | 859 | | | (9,714) | |
| Benefits paid | | (1,555) | | | (1,468) | |
| Ending benefit obligation (December 31) | | $ | 31,550 | | | $ | 30,337 | |
| Change in plan assets | | | | |
| Beginning fair value of plan assets (January 1) | | $ | 29,280 | | | $ | 33,698 | |
| Return on assets | | 987 | | | (4,652) | |
| Employer contribution | | 775 | | | 1,702 | |
| Benefits paid | | (1,555) | | | (1,468) | |
| Ending fair value of plan assets (December 31) | | $ | 29,487 | | | $ | 29,280 | |
| Funded status underfunded | | $ | (2,063) | | | $ | (1,057) | |
| Amounts recognized in the consolidated balance sheet | | | | |
| Non-current assets | | $ | 1,464 | | | $ | 2,498 | |
| Current liabilities | | $ | 428 | | | $ | 416 | |
| Non-current liabilities | | $ | 3,099 | | | $ | 3,139 | |
| Unrecognized loss included in accumulated other comprehensive loss | | | | |
| Beginning unrecognized loss, before tax (January 1) | | $ | 4,011 | | | $ | 7,573 | |
| Amortization | | (216) | | | (582) | |
| Liability gain | | 851 | | | (9,714) | |
| Asset loss (gain) | | 803 | | | 6,734 | |
| Ending unrecognized loss, before tax (December 31) | | 5,449 | | | 4,011 | |
| Tax impact | | (1,296) | | | (970) | |
| Unrecognized loss included in accumulated other comprehensive loss, net of tax | | $ | 4,153 | | | $ | 3,041 | |
| | | | |
| | | | |
|
| | | | | | | | |
| | | (In thousands) December 31, |
| | | 2017 | | 2016 |
Change in benefit obligation(1) | | | | |
| Beginning benefit obligation (January 1) | | $ | 33,154 |
| | $ | 31,510 |
|
| Service cost | | 531 |
| | 531 |
|
| Interest cost | | 1,329 |
| | 1,367 |
|
| Actuarial loss | | 2,449 |
| | 1,132 |
|
| Benefits paid | | (1,461 | ) | | (1,386 | ) |
| Ending benefit obligation (December 31) | | $ | 36,002 |
| | $ | 33,154 |
|
| Change in plan assets | | | | |
| Beginning fair value of plan assets (January 1) | | $ | 22,015 |
| | $ | 19,933 |
|
| Return on assets | | 3,481 |
| | 1,551 |
|
| Employer contribution | | 1,611 |
| | 1,917 |
|
| Benefits paid | | (1,461 | ) | | (1,386 | ) |
| Ending fair value of plan assets (December 31) | | $ | 25,646 |
| | $ | 22,015 |
|
| Funded status (underfunded) | | $ | (10,356 | ) | | $ | (11,139 | ) |
| Amounts recognized in the consolidated balance sheet | | | | |
| Current liabilities | | $ | 560 |
| | $ | 544 |
|
| Non-current liabilities | | $ | 9,796 |
| | $ | 10,595 |
|
| Unrecognized loss included in accumulated other comprehensive loss | | | | |
| Beginning unrecognized loss, before tax (January 1) | | $ | 9,220 |
| | $ | 8,919 |
|
| Amortization | | (810 | ) | | (762 | ) |
| Liability loss | | 2,449 |
| | 1,132 |
|
| Asset gain | | (1,951 | ) | | (69 | ) |
| Ending unrecognized loss, before tax (December 31) | | 8,908 |
| | 9,220 |
|
| Tax impact | | (3,309 | ) | | (3,425 | ) |
| Unrecognized loss included in accumulated other comprehensive loss, net of tax | | $ | 5,599 |
| | $ | 5,795 |
|
| |
(1) | Projected benefit obligation equals the accumulated benefit obligation for the plans. |
On December 31, 2017,2023, our annual measurement date, the accumulated benefit obligation exceeded the fair value of the plans assets by $10.4$2.1 million. Such excess is referred to as an unfunded accumulated benefit obligation. We recorded an unrecognized lossgain (loss) included in accumulated other comprehensive loss, net of tax at December 31, 20172023 and 20162022 of $5.6$4.2 million and $5.8$3.0 million, respectively, which decreasedincreased (decreased) shareholders’ equity. This charge to shareholders’ equity represents a net loss not yet recognized as pension expense. This charge did not affect reported earnings, and would be decreased or be eliminated if either interest rates increase or market performance and plan returns improve which will cause the Pension Plan to return to fully funded status.
Our Pension Plan asset allocations at December 31, 20172023 and 2016,2022, by asset category, were as follows:
| | | | | | | | | | | | | | |
| | December 31, |
| | 2023 | | 2022 |
| Equity securities | | —% | | 61% |
| Cash and equivalents | | 41% | | 4% |
| Debt securities | | 59% | | 35% |
Total(1) | | 100% | | 100% |
|
| | | | | | |
| | | December 31, |
| | | 2017 | | 2016 |
| Equity securities | | 70 | % | | 65 | % |
| Cash and equivalents | | 1 | % | | 2 | % |
| Debt securities | | 29 | % | | 33 | % |
Total(1) | | 100 | % | | 100 | % |
(1)Our overall investment strategy is typically to achieve an asset allocation within the following ranges to achieve an appropriate rate of return relative to risk. | | | | | |
| Cash | 0-10% |
(1) | Our overall investment strategy is to achieve an asset allocation within the following ranges to achieve an appropriate rate of return relative to risk. |
|
| |
Cash | 0-5% |
| Fixed income securities | 15-75% |
| Equities | 30-80% |
The Pension Plan is associated with the union employees at one of the performance centers we expect to cease operations in 2024 as a result of the 2022 Restructure Plan. Therefore, during 2023, we changed the overall investment strategy to achieve an asset allocation that minimized the risk of loss of plan assets as the Pension Plan was fully funded. As of December 31, 2023, the Pension Plan assets consistconsists primarily of listed stocks and bonds and do not include any of the Company’s securities.cash and cash equivalents. The return on assets assumption reflects the average rate of return expected on funds invested or to bethe bonds and cash and cash equivalents invested to provide for the benefits included in the projected benefit obligation. We select the return on asset assumption by considering our current and target asset allocation. We consider information from various external investment managers, forward-looking information regarding expected returns by asset class and our own judgment when determining the expected returns.
| | | | | | | | | | | | | | | | | | | | | | | | | | |
| | (In thousands)
Year Ended December 31, 2023 |
| | Level 1 | | Level 2 | | Level 3 | | Total |
| Cash and cash equivalents | | $ | 12,016 | | | $ | — | | | $ | — | | | $ | 12,016 | |
| Fixed income securities | | 17,471 | | | — | | | — | | | 17,471 | |
| | | | | | | | |
| | | | | | | | |
| Total plan assets at fair value | | $ | 29,487 | | | $ | — | | | $ | — | | | 29,487 | |
| Pooled funds | | | | | | | | — | |
| Total fair value of plan assets | | | | | | | | $ | 29,487 | |
| | | | | | | | | | | | | | | | | | | | | | | | | | |
| | (In thousands)
Year Ended December 31, 2022 |
| | Level 1 | | Level 2 | | Level 3 | | Total |
| Cash and cash equivalents | | $ | 1,078 | | | $ | — | | | $ | — | | | $ | 1,078 | |
| Fixed income securities | | 4,622 | | | — | | | — | | | 4,622 | |
Equities(1) | | 12,591 | | | — | | | — | | | 12,591 | |
| Other investments | | 1,033 | | | — | | | — | | | 1,033 | |
| Total plan assets at fair value | | $ | 19,324 | | | $ | — | | | $ | — | | | 19,324 | |
| Pooled funds | | | | | | | | 9,956 | |
| Total fair value of plan assets | | | | | | | | $ | 29,280 | |
|
| | | | | | | | | | | | | | | | |
| | | (In thousands) Year Ended December 31, 2017 |
| | | Level 1 | | Level 2 | | Level 3 | | Total |
| Cash and cash equivalents | | $ | 135 |
| | $ | — |
| | $ | — |
| | $ | 135 |
|
| Fixed income securities | | 3,494 |
| | — |
| | — |
| | 3,494 |
|
Equities(1) | | 1,625 |
| | — |
| | — |
| | 1,625 |
|
| Other investments | | 910 |
| | — |
| | — |
| | 910 |
|
| Total plan assets at fair value | | $ | 6,164 |
| | $ | — |
| | $ | — |
| | 6,164 |
|
| Pooled funds | | | | | | | | 19,482 |
|
| Total fair value of plan assets | |
|
| |
|
| |
|
| | $ | 25,646 |
|
(1)Represents mutual funds and commingled accounts which invest primarily in equities, but may also hold fixed income securities, cash and other investments. Commingled funds with publicly quoted prices and actively traded are classified as Level 1 investments.
|
| | | | | | | | | | | | | | | | |
| | | (In thousands) Year Ended December 31, 2016 |
| | | Level 1 | | Level 2 | | Level 3 | | Total |
| Cash and cash equivalents | | $ | 366 |
| | $ | — |
| | $ | — |
| | $ | 366 |
|
| Fixed income securities | | 3,468 |
| | — |
| | — |
| | 3,468 |
|
Equities(1) | | 1,611 |
| | — |
| | — |
| | 1,611 |
|
| Other investments | | 760 |
| | — |
| | — |
| | 760 |
|
| Total plan assets at fair value | | $ | 6,205 |
| | $ | — |
| | $ | — |
| | 6,205 |
|
| Pooled funds | | | | | | | | 15,810 |
|
| Total fair value of plan assets | |
|
| |
|
| |
|
| | $ | 22,015 |
|
| |
(1) | Represents mutual funds and commingled accounts which invest primarily in equities, but may also hold fixed income securities, cash and other investments. Commingled funds with publicly quoted prices and actively traded are classified as Level 1 investments. |
Pooled funds are measured using the net asset value (“NAV”) as a practical expedient for fair value as permissible under the accounting standard for fair value measurements and have not been categorized in the fair value hierarchy in accordance with ASU 2015-07, “Fair Value Measurement (Topic 820): Disclosures for Investments in Certain Entities That Calculate Net Asset Value per Share (or Its Equivalent).” Pooled fund NAVs are provided by the trustee and are determined by reference to the fair value of the underlying securities of the trust, less its liabilities, which are valued primarily through the use of directly or indirectly observable inputs. Depending on the pooled fund, underlying securities may include marketable equity securities or fixed income securities.
The assumptions used to determine the benefit obligations and expense for our two plans are presented in the tables below. The expected long-term return on assets, noted below, represents an estimate of long-term returns on investment portfolios consisting of a mixture of fixed income and equity securities.cash and cash equivalents. The estimated cash flows from the plans for all future years are determined based on the plans’ population at the measurement date. We used the expected benefit payouts from the plans for each year into the future and discounted them back to the present using the Wells FargoUSI Consulting Group (“USICG”) yield curve rate for that duration.
The weighted-average assumptions used to determine the net periodic benefit costs under the two plans were as follows:
| | | | | | | | | | | | | | | | | | | | |
| | Years Ended December 31, |
| | 2023 | | 2022 | | 2021 |
| Discount rate used to determine pension expense | | | | | | |
| Pension Plan | | 5.11% | | 2.85% | | 2.50% |
| LaBarge Retirement Plan | | 5.00% | | 2.35% | | 1.85% |
|
| | | | | | | | | |
| | | Years Ended December 31, |
| | | 2017 | | 2016 | | 2015 |
| Discount rate used to determine pension expense | | | | | | |
| Pension Plan | | 4.18 | % | | 4.55 | % | | 4.25 | % |
| LaBarge Retirement Plan | | 3.75 | % | | 4.00 | % | | 3.70 | % |
The weighted-average assumptions used to determine the benefit obligations under the two plans were as follows:
| | | | | December 31, |
| | | 2017 | | 2016 | | 2015 |
| | December 31, | | | | December 31, |
| | 2023 | | | | 2023 | | 2022 | | 2021 |
| Discount rate used to determine value of obligations | | | | | | |
| Pension Plan | |
| Pension Plan | |
| Pension Plan | | 3.64 | % | | 4.18 | % | | 4.55 | % | | 4.91% | | 5.11% | | 2.85% |
| LaBarge Retirement Plan | | 3.40 | % | | 3.75 | % | | 4.00 | % | LaBarge Retirement Plan | | 4.75% | | 5.00% | | 2.35% |
| Long-term rate of return - Pension Plan only | | 7.00 | % | | 7.50 | % | | 7.50 | % | Long-term rate of return - Pension Plan only | | 3.00% | | 6.25% |
The following benefit payments under both plans, which reflect expected future service, as appropriate, are expected to be paid:
|
| | | | | | | | |
| | | (In thousands) |
| | | Pension Plan | | LaBarge Retirement Plan |
| 2018 | | $ | 1,178 |
| | $ | 561 |
|
| 2019 | | 1,212 |
| | 546 |
|
| 2020 | | 1,288 |
| | 528 |
|
| 2021 | | 1,365 |
| | 506 |
|
| 2022 | | 1,453 |
| | 482 |
|
| 2023 - 2027 | | 8,246 |
| | 2,022 |
|
| | | | | | | | | | | | | | |
| | (In thousands) |
| | Pension Plan | | LaBarge
Retirement
Plan |
| 2024 | | $ | 1,495 | | | $ | 428 | |
| 2025 | | $ | 1,622 | | | $ | 404 | |
| 2026 | | $ | 1,738 | | | $ | 381 | |
| 2027 | | $ | 1,834 | | | $ | 361 | |
| 2028 | | $ | 1,875 | | | $ | 341 | |
| 2029 - 2033 | | $ | 9,620 | | | $ | 1,403 | |
Our funding policy is to contribute cash to our plans so that the minimum contribution requirements established by government funding and taxing authorities are met. We expect to make contributions of $0.9$0.4 million to the plans in 2018.2024.
Supplemental Retirement Plans
We have three unfunded supplemental retirement plans. The first plan was suspended in 1986, but continues to cover certain former executives. The second plan was suspended in 1997, but continues to cover certain current and retired directors. The third plan covers certain current and retired employees and further employee contributions to this plan were suspended on August 5, 2011. The liability for the third plan and interest thereon is included in accrued employee compensation and long-term liabilities were both zero at December 31, 2023, and both zero at December 31, 2022. The accumulated benefit obligations of the first two plans at December 31, 2023 and December 31, 2022 were both $0.3 million, and are included in accrued liabilities.
Note 14.13. Indemnifications
We have made guarantees and indemnities under which we may be required to make payments to a guaranteed or indemnified party, in relation to certain transactions, including revenue transactions in the ordinary course of business. In connection with certain facility leases,Additionally, we have indemnified our lessors for certain claims arising from the facility or the lease. We indemnify our directors and officers to the maximum extent permitted under the laws of the State of Delaware.
However, weDelaware and have a directors and officers insurance policy that may reduce our exposure in certain circumstances and may enable us to recover a portion of future amounts that may be payable, if any. Moreover, in connection with certain performance center leases, we have indemnified our lessors for certain claims arising from the performance center or the lease.
The duration of the guarantees and indemnities varies and, in many cases is indefinite but subject to statuteapplicable statutes of limitations. The majority of guarantees and indemnities do not provide any limitations ofon the maximum potential future payments we could be obligated to make. Historically, payments related to these guarantees and indemnities have been immaterial. We estimate the fair value of our indemnification obligations as insignificant based on this history and insurance coverage and have, therefore, not recorded any liability for these guarantees and indemnities in the accompanying consolidated balance sheets.
Note 15. Leases
We lease certain facilities and equipment for periods ranging from one to ten years. The leases generally are renewable and provide for the payment of property taxes, insurance and other costs relative to the property. Rental expense in 2017, 2016, and 2015 was $5.0 million, $4.9 million, and $8.5 million, respectively. Future minimum rental payments under operating leases having initial or remaining non-cancelable terms in excess of one year at December 31, 2017 were as follows:
|
| | | |
| | (In thousands) |
| 2018 | $ | 3,586 |
|
| 2019 | 2,793 |
|
| 2020 | 2,554 |
|
| 2021 | 1,927 |
|
| 2022 | 947 |
|
| Thereafter | 553 |
|
| Total | $ | 12,360 |
|
Note 16.14. Income Taxes
Our pre-tax income attributable to foreign operations was not material. The provision for income tax (benefit) expense consisted of the following:
| | | | | | | | | | | | | | | | | | | | |
| | (In thousands)
Years Ended December 31, |
| | 2023 | | 2022 | | 2021 |
| Current tax expense | | | | | | |
| Federal | | $ | 8,796 | | | $ | 12,474 | | | $ | 31,112 | |
| State | | $ | 1,095 | | | $ | 1,023 | | | $ | 2,829 | |
| Foreign | | 390 | | | 428 | | | 59 | |
| | 10,281 | | | 13,925 | | | 34,000 | |
| Deferred tax (benefit) expense | | | | | | |
| Federal | | (7,857) | | | (8,624) | | | 107 | |
| State | | (1,973) | | | (768) | | | 841 | |
| | (9,830) | | | (9,392) | | | 948 | |
| Income tax expense | | $ | 451 | | | $ | 4,533 | | | $ | 34,948 | |
|
| | | | | | | | | | | | |
| | | (In thousands) Years Ended December 31, |
| | | 2017 | | 2016 | | 2015 |
| Current tax expense (benefit) | | | | | | |
| Federal | | $ | 2,387 |
| | $ | 5,953 |
| | $ | (1,511 | ) |
| State | | 525 |
| | 2,982 |
| | (418 | ) |
| | | 2,912 |
| | 8,935 |
| | (1,929 | ) |
| Deferred tax (benefit) expense | | | | | | |
| Federal | | (15,515 | ) | | 3,876 |
| | (28,011 | ) |
| State | | 135 |
| | 41 |
| | (1,771 | ) |
| | | (15,380 | ) | | 3,917 |
| | (29,782 | ) |
| Income tax (benefit) expense | | $ | (12,468 | ) | | $ | 12,852 |
| | $ | (31,711 | ) |
On December 22, 2017, the President of the United States signed into law the Tax Cuts and Jobs Act (the “2017 Tax Act”) which, among a broad range of tax reform measures, reduced the U.S. corporate tax rate from 35.0% to 21.0% effective January 1, 2018. The reduction in the corporate tax rate required the federal portion of our deferred tax assets and liabilities at December 31, 2017 to be re-measured at the enacted tax rate expected to apply when the temporary differences are to be realized or settled using 21.0%. As a result, we recorded a provisional deferred income tax benefit of $13.0 million related to the re-measurement for the year ended December 31, 2017. SEC Staff Accounting Bulletin No. 118, “Income Tax Accounting Implications of the Tax Cuts and Jobs Act” (“SAB 118”), allows us to record provisional amounts during a measurement period not to extend beyond one year of the enactment date. Since the 2017 Tax Act was passed late in the fourth quarter of 2017, and ongoing guidance and accounting interpretation are expected over the next 12 months, we consider the accounting of the deferred tax re-measurement and other items to be incomplete due to the forthcoming guidance and our ongoing analysis of final year-end data and tax positions. We expect to complete our analysis within the measurement period in accordance with SAB 118.
ASU 2016-09, “Compensation - Stock Compensation (Topic 718): Improvements to Employee Share-Based Payment Accounting” (“ASU 2016-09”), became effective beginning January 1, 2017 and required all the tax effects related to share-based payments be recorded through the income statement. We recognized net income tax benefits from deductions of share-based payments in excess of compensation cost recognized for financial reporting purposes of $0.6$0.2 million, for the year ended December 31, 2017. Prior to January 1, 2017, the current income tax expense (benefit) excluded net (tax shortfalls) excess tax benefits which were previously recorded directly to additional paid-in-capital in the amounts of $(0.1)$0.2 million, and $0.6$0.9 million for the years ended December 31, 20162023, 2022, and 2015,2021, respectively.
Deferred tax (liabilities) assets were comprised of the following:
|
| | | | | | | | |
| | | (In thousands) December 31, |
| | | 2017 | | 2016 |
| Deferred tax assets: | | | | |
| Accrued expenses | | $ | 313 |
| | $ | 760 |
|
| Allowance for doubtful accounts | | 208 |
| | 184 |
|
| Contract overrun reserves | | 294 |
| | 1,776 |
|
| Deferred compensation | | 177 |
| | 507 |
|
| Employment-related accruals | | 2,091 |
| | 2,888 |
|
| Environmental reserves | | 501 |
| | 769 |
|
| Federal tax credit carryforwards | | 5,613 |
| | 4,234 |
|
| Inventory reserves | | 1,315 |
| | 2,313 |
|
| Pension obligation | | 2,398 |
| | 4,002 |
|
| State net operating loss carryforwards | | 86 |
| | 63 |
|
| State tax credit carryforwards | | 9,051 |
| | 6,585 |
|
| Stock-based compensation | | 1,480 |
| | 1,950 |
|
| Workers’ compensation | | 75 |
| | 122 |
|
| Other | | 1,492 |
| | 2,098 |
|
| Total gross deferred tax assets | | 25,094 |
| | 28,251 |
|
| Valuation allowance | | (9,013 | ) | | (6,607 | ) |
| Total gross deferred tax assets, net of valuation allowance | | 16,081 |
| | 21,644 |
|
| Deferred tax liabilities: | | | | |
| Depreciation | | (7,976 | ) | | (13,167 | ) |
| Goodwill | | (2,902 | ) | | (3,909 | ) |
| Intangibles | | (20,611 | ) | | (35,071 | ) |
| Prepaid insurance | | (312 | ) | | (626 | ) |
| Unbilled receivables | | — |
| | (2 | ) |
| Total gross deferred tax liabilities | | (31,801 | ) | | (52,775 | ) |
| Net deferred tax liabilities | | $ | (15,720 | ) | | $ | (31,131 | ) |
| | | | | | | | | | | | | | |
| | (In thousands)
December 31, |
| | 2023 | | 2022 |
| Deferred tax assets: | | | | |
| Accrued expenses | | $ | 889 | | | $ | 627 | |
| Allowance for credit losses | | 501 | | | 152 | |
| Contract overrun reserves | | 1,323 | | | 952 | |
| Deferred compensation | | 526 | | | 234 | |
| Deferred revenue | | — | | | 943 | |
| Employment-related accruals | | 5,022 | | | 3,932 | |
| Environmental reserves | | 501 | | | 501 | |
| Federal tax credit carryforwards | | 133 | | | 133 | |
| Inventory reserves | | 4,628 | | | 3,572 | |
| Operating lease liabilities | | 7,318 | | | 8,672 | |
| Pension obligation | | 553 | | | 28 | |
| Federal and state net operating loss carryforwards | | 2,560 | | | 3,397 | |
| Research expenses | | 21,822 | | | 10,620 | |
| State tax credit carryforwards | | 7,582 | | | 6,974 | |
| Stock-based compensation | | 1,852 | | | 2,420 | |
| | | | |
| Other | | 1,798 | | | 1,525 | |
| Total gross deferred tax assets | | 57,008 | | | 44,682 | |
| Valuation allowance | | (7,464) | | | (7,548) | |
| Total gross deferred tax assets, net of valuation allowance | | 49,544 | | | 37,134 | |
| Deferred tax liabilities: | | | | |
| Deferred revenue | | (2,794) | | | — | |
| Depreciation | | (11,622) | | | (11,286) | |
| Goodwill | | (10,973) | | | (8,630) | |
| Intangibles | | (16,265) | | | (18,310) | |
| Interest rate hedge | | (3,659) | | | (3,359) | |
| Operating lease right-of-use assets | | (7,087) | | | (8,346) | |
| Prepaid insurance | | (770) | | | (609) | |
| | | | |
| Other | | (499) | | | (547) | |
| Total gross deferred tax liabilities | | (53,669) | | | (51,087) | |
| Net deferred tax liabilities | | $ | (4,125) | | | $ | (13,953) | |
We have federal and state tax net operating losses in various states of $1.8$7.6 million and $16.5 million, respectively, as of December 31, 2017.2023. The federal net operating losses acquired from the acquisition of Nobles are subject to an annual limitation under Internal Revenue Code Section 382; however, we expect to fully realize them under ASC Subtopic 740-10 before they begin to expire in 2038. The state net operating loss carryforwards include $1.3$2.5 million that is not expected to be realized under ASC Subtopic 740-10due to various limitations and has been reduced by a valuation allowance. If not realized, the state net operating loss carryforwards, depending on the tax jurisdiction, will begin to expire in 2030.between 2027 and 2038.
We have federal and state tax credit carryforwards of $6.6$0.1 million and $12.8$11.8 million, respectively, as of December 31, 2017.2023. A valuation allowance of $11.3$9.3 million has been provided on state tax credit carryforwards that are not expected to be realized under ASC Subtopic 740-10. If not realized, the federal tax carryforwards will begin to expire in 2032 and state tax credit carryforwards, depending on the tax jurisdiction, will begin to expire between 20182024 and 2037.2038.
We believe it is more likely than not that we will generate sufficient taxable income to realize the benefit of the remaining deferred tax assets.
The principal reasons for the variation between the statutory and effective tax rates were as follows:
|
| | | | | | |
| | | Years Ended December 31, |
| | | 2017 | | 2016 | | 2015 |
| Statutory federal income tax (benefit) rate | | 35.0% | | 35.0% | | (35.0)% |
| State income taxes (net of federal benefit) | | 2.5 | | 5.7 | | (1.2) |
| Qualified domestic production activities | | (2.6) | | (2.0) | | 0.5 |
| Stock-based compensation expense | | (8.2) | | — | | — |
| Research and development tax credits | | (50.6) | | (8.6) | | (2.9) |
| Other tax credits | | (7.5) | | — | | — |
| Goodwill impairment | | — | | — | | 8.1 |
| Changes in valuation allowance | | 10.6 | | 0.9 | | 0.6 |
| Non-deductible book expenses | | 1.1 | | 0.2 | | 0.2 |
| Changes in deferred tax assets | | 15.4 | | 1.5 | | 0.1 |
| Re-measurement of deferred taxes for 2017 Tax Act | | (171.3) | | — | | — |
| Changes in tax reserves | | 11.4 | | — | | 0.1 |
| Other | | 0.4 | | 1.0 | | (0.2) |
| Effective income tax (benefit) rate | | (163.8)% | | 33.7% | | (29.7)% |
The deduction for qualified domestic production activities is treated as a “special deduction” which has no effect on deferred tax assets and liabilities. Instead, the impact of this deduction is reported in our rate reconciliation. No deduction for qualified domestic production has been recognized in 2015 due to a taxable loss. As part of the 2017 Tax Act, the qualified domestic production deduction is repealed for tax years beginning after December 31, 2017.
We recorded a goodwill impairment charge related to the Structural Systems operating segment in 2015. A portion of this goodwill impairment charge was nondeductible for tax purposes and was a permanent impact to our income tax provision of $8.7 million. | | | | | | | | | | | | | | | | | | | | |
| | | Years Ended December 31, |
| | | 2023 | | 2022 | | 2021 |
| Statutory federal income tax rate | | 21.0% | | 21.0% | | 21.0% |
| State income taxes (net of federal benefit) | | 3.2 | | 4.0 | | 3.1 |
| Tax impact of foreign operations | | 2.8 | | 1.0 | | — |
| Foreign derived intangible income deduction | | (3.2) | | (0.9) | | — |
| | | | | | |
| Stock-based compensation expense | | (1.5) | | (0.6) | | (0.5) |
| Research and development tax credits | | (36.3) | | (14.8) | | (3.0) |
| Other tax credits | | (0.3) | | (0.1) | | — |
| | | | | | |
| Changes in valuation allowance | | (0.5) | | (0.5) | | (1.0) |
| Non-deductible book compensation expenses | | 14.8 | | 4.4 | | 0.7 |
| Changes in deferred tax assets | | 0.8 | | (0.2) | | — |
| | | | | | |
| | | | | | |
| Changes in tax reserves | | 1.0 | | — | | 0.2 |
| Other | | 1.0 | | 0.3 | | — |
| Effective income tax rate | | 2.8% | | 13.6% | | 20.5% |
Our total amount of unrecognized tax benefits was $5.3$4.5 million, $3.0$4.9 million, and $3.0$4.4 million at December 31, 2017, 2016,2023, 2022, and 2015,2021, respectively. We record interest and penalty charge,charges, if any, related to uncertain tax positions as a component of tax expense and unrecognized tax benefits. The amounts accrued for interest and penalty charges as of December 31, 2017, 2016,2023, 2022, and 20152021 were not significant. If recognized, $3.4$2.6 million would affect the effective income tax rate. We do not reasonablyAs a result of statute of limitations set to expire in 2024, we expect significant increases or decreases to our unrecognized tax benefits of $0.8 million in the next twelve months.
A reconciliation of the beginning and ending amount of unrecognized tax benefits was as follows:
|
| | | | | | | | | | | | |
| | | (In thousands) Years Ended December 31, |
| | | 2017 | | 2016 | | 2015 |
| Balance at January 1, | | $ | 3,036 |
| | $ | 2,963 |
| | $ | 2,803 |
|
| Additions for tax positions related to the current year | | 422 |
| | 476 |
| | 702 |
|
| Additions for tax positions related to prior years | | 1,953 |
| | 385 |
| | — |
|
| Reductions for tax positions related to prior years | | (99 | ) | | (567 | ) | | (48 | ) |
| Reductions for lapse of statute of limitations | | (41 | ) | | (221 | ) | | (494 | ) |
| Balance at December 31, | | $ | 5,271 |
| | $ | 3,036 |
| | $ | 2,963 |
|
| | | | | | | | | | | | | | | | | | | | |
| | (In thousands)
Years Ended December 31, |
| | 2023 | | 2022 | | 2021 |
| Balance at January 1, | | $ | 4,944 | | | $ | 4,435 | | | $ | 4,069 | |
| Additions for tax positions related to the current year | | 646 | | | 1,177 | | | 562 | |
| Additions for tax positions related to prior years | | 220 | | | 15 | | | 180 | |
| Reductions for tax positions related to prior years | | (600) | | | (13) | | | — | |
| Reductions for lapse of statute of limitations | | (717) | | | (670) | | | (376) | |
| Balance at December 31, | | $ | 4,493 | | | $ | 4,944 | | | $ | 4,435 | |
We file U.S. Federal and state income tax returns. During the fourth quarter of 2017,We are subject to examination by the Internal Revenue Service (“IRS”) completed the audit offor tax years 2013, 2014,after 2019 and 2015. Consequently, Federal incomeby state taxing authorities for tax returnsyears after 2015 are subject to examination. California franchise (income) tax returns after 2012 and other state income tax returns after 2012 are subject to examination.2018. While we are no longer subject to examination prior to those periods, carryforwards generated prior to those periods may still be adjusted upon examination by the IRS or state taxing authorityauthorities if they either have been or will be used in a subsequent period. We believe we have adequately accrued for tax deficiencies or reductions in tax benefits, if any, that could result from the examination and all open audit years.
The Tax Cuts and Jobs Act of 2017 (“TCJA”), which was signed into U.S. law in December 2017, eliminated the option to immediately deduct research and development expenditures in the year incurred under Section 174 effective January 1, 2022. The amended provision under Section 174 requires us to capitalize and amortize these expenditures over five years (for U.S.-based research). For the year ended December 31, 2023, we recorded an increase to income taxes payable of $9.7 million and a decrease to net deferred tax liabilities of a similar amount. We are monitoring legislation for any further changes to Section 174 and the potential impact to our financial statements in 2024.
In August 2022, the U.S. enacted the Inflation Reduction Act of 2022 (“IRA”) which aims to curb inflation by reducing the deficit, lowering prescription drug prices, and investing in domestic energy production while promoting clean energy. We considered the provisions in the IRA and determined they have no or minimal impact to our overall income taxes.
In August 2022, the U.S. enacted the Creating Helpful Incentives to Produce Semiconductors Act of 2022 (“CHIPS Act”) which provides new funding to boost domestic research and manufacturing of semiconductors in the United States. We considered the provisions in the CHIPS Act and determined they have no or minimal impact to our overall income taxes.
Note 17.15. Commitments and Contingencies
In December 2020, a representative action under California’s Private Attorneys General Act was filed against us in the Superior Court for the State of California, County of San Bernardino. We received service of process of this complaint in January 2021. The complaint alleged violations of California’s wage and hour laws relating to our current and former employees and sought attorney’s fees and penalties. We vigorously refuted and defended these claims, and reached a tentative settlement of $0.8 million during the fourth quarter 2021, which was subject to court approval. Thus, we recorded accrued liabilities of $0.8 million as of December 31, 2021. During the second quarter of 2022, additional factual information was identified resulting in an increase in the amount of the tentative settlement to $0.9 million. Therefore, we recorded an additional accrued liabilities of $0.1 million for a total accrued liabilities amount of $0.9 million as of the end of the second quarter of 2022 and remained unchanged as of December 31, 2022 as we were awaiting final court approval of this settlement. Subsequent to final court approval and paying of the $0.9 million on January 17, 2023, during the third quarter of 2023 and upon plaintiff’s motion, the court re-opened the settlement agreement to determine whether the class list captured all affected employees. We are appealing this decision and intend to vigorously contest the court’s decision to reopen the settlement agreement. Any amount of additional liability is still undetermined pending the appeal and as such, there is no amount of loss that is probable and reasonably estimable at this time. Thus, no additional accrual was recorded during the third quarter of 2023 or as of December 31, 2023.
Structural Systems has been directed by California environmental agencies to investigate and take corrective action for groundwater contamination at itsour facilities located in El Mirage and Monrovia, California. Based on currently available information, Ducommun haswe have established an accrual for itsthe estimated liability for such investigation and corrective action of $1.5 million atas of both December 31, 2017,2023 and December 31, 2022, which is reflected in other long-term liabilities on itsour consolidated balance sheet.sheets.
Structural Systems also faces liability as a potentially responsible party for hazardous waste disposed at landfills located in Casmalia and West Covina, California. Structural Systems and other companies and government entities have entered into consent decrees with respect to these landfills with the United States Environmental Protection Agency and/or California environmental agencies under which certain investigation, remediation and maintenance activities are being performed. Based on currently available information, Ducommunwe preliminarily estimatesestimate that the range of itsour future liabilities in connection with the landfill located in West Covina, California is between $0.4 million and $3.1 million. Ducommun hasWe have established an accrual for itsthe estimated liability in connection with the West Covina landfill of $0.4 million atas of both December 31, 2017,2023 and December 31, 2022, which is reflected in other long-term liabilities on itsour consolidated balance sheet. Ducommun’ssheets. Our ultimate liability in connection with these matters will depend upon a number of factors, including changes in existing laws and regulations, the design and cost of construction, operation and maintenance activities, and the allocation of liability among potentially responsible parties.
In June 2020, a fire severely damaged our performance center in Guaymas, Mexico, which is part of our Structural Systems segment. There were no injuries, however, property and equipment, inventories, and tooling in this leased facility were damaged. Our severely damaged Guaymas performance center was comprised of two buildings with an aggregate total of 62,000 square feet. The loss of production from the Guaymas performance center was absorbed by our other existing performance centers, however, we have reestablished and are in the process of ramping up our manufacturing capabilities in a different leased facility with 117,000 square feet in Guaymas. A neighboring, non-related manufacturing facility, also suffered fire damage during the same time as the fire that severely damaged our Guaymas performance center, and on November 8, 2023 the occupant of the neighboring facility filed suit against us in U.S. District Court for the Central District of California seeking unspecified amounts for damages relating to the fire. We intend to defend this matter vigorously and believe we have substantial defenses in relation to these claims. As responsibility for the fire is still undetermined, there is no amount of loss that is probable and reasonably estimable at this time. If we are ultimately deemed to be responsible or party responsible, it is possible we could incur a loss in excess of our insurance coverage limits, which could be material to our cash flow, liquidity, or financial results.
Our insurance covers damage, up to a capped amount, to the facility, equipment, unfinished inventory, and other assets at replacement cost, finished goods inventory at selling price, as well as business interruption, third party property damage, and recovery related expenses caused by the fire, less our per claim deductible. The anticipated insurance recoveries related to losses and incremental costs incurred are recognized when receipt is probable. The anticipated insurance recoveries in excess of net book value of the damaged operating assets and business interruption will not be recorded until all contingencies related to our claim have been resolved. During the year ended December 31, 2020, $0.8 million of revenue and $0.5 million of related cost of sales were reversed for revenue previously recognized using the over time method as the revenue recognition process for these items were deemed to be interrupted as a result of these inventory items being damaged. Also during the year ended December 31, 2020, we wrote off property and equipment and tooling with an aggregate total net book value of $7.1 million and inventory on hand of $3.4 million that were damaged by the fire. The related anticipated insurance recoveries were also presented within the same financial statement line item in the consolidated statements of income resulting in no net impact, with the anticipated insurance recoveries receivable included as part of other current assets on the consolidated balance sheets.
The insurance claim for damages to our operating assets and business interruption was deemed final and closed by our insurance company during the second quarter of 2023. During the years ended December 31, 2023 and December 31, 2022, we received insurance recoveries of $3.8 million and $6.4 million, respectively. The $3.8 million of insurance recoveries received during 2023 was for business interruption and property and equipment damage of $2.1 million and $1.7 million, respectively, and were recognized as other income. The $6.4 million received during 2022 was for business interruption and property and equipment damage of $5.4 million and $1.0 million, respectively, and were recognized as other income. Cumulatively, as of December 31, 2023, we have received insurance recoveries in aggregate total of $23.7 million, with $7.5 million for business interruption and $16.2 million for damages to property and equipment, inventories, and tooling. Further, all insurance recovery amounts received related to this claim have been recognized up to the amount of net book value loss and presented within the same financial statement line item in the condensed consolidated statements of income resulting in no net impact, with the remaining amounts recognized as other income in our condensed consolidated statements of income when the contingencies were deemed resolved.
On April 29, 2023, a fire damaged a relatively small portion of one of our performance centers in our Structural Systems reporting segment. There were no injuries, however, subsequent to the fire, we determined that some property and equipment in this company owned facility were damaged. Our insurance covers damage, up to a capped amount, to the property and equipment at replacement cost, as well as business interruption and recovery related expenses caused by the fire, less our per claim deductible. There was a loss of production in this damaged portion of the performance center for a short period of time but did not result in significant disruption to customer delivery schedules. Production in this damaged portion has since resumed. The anticipated insurance recoveries related to losses and incremental costs incurred are recognized when receipt is probable. The anticipated insurance recoveries in excess of net book value of the damaged operating assets and business interruption are not recorded until all contingencies related to our claim have been resolved. As such, during the second quarter of 2023, we wrote off property and equipment with an aggregate total net book value of $0.2 million. During 2023, we received aggregate total insurance recoveries of $0.6 million (which was net of our deductible of $0.1 million), and thus, such insurance recoveries were also presented within the same financial statement line item in the consolidated statements of income resulting in no net impact. The amount of the insurance recoveries received in excess of the loss on operating assets was deemed a contingent gain and thus $0.1 million was also recognized during the second quarter of 2023. The insurance claim for damages to our operating assets and business interruption was deemed final and closed by our insurance company during the fourth quarter of 2023 and since the remaining gain contingencies were deemed resolved, the remaining $0.3 million was recognized in the fourth quarter of 2023, for an aggregate total of $0.4 million recorded as other income during 2023.
In the normal course of business, Ducommun and its subsidiaries are defendants in certain other litigation, claims and inquiries, including matters relating to environmental laws. In addition, Ducommun makes various commitments and incurs contingent liabilities.liabilities in the ordinary course of business. While it is not feasible to predict the outcome of these matters, Ducommun does not presently expect that any sum it may be required to pay in connection with these matters would have a material adverse effect on its consolidated financial position, results of operations or cash flows.
Note 18.16. Major Customers and Concentrations of Credit Risk
We provide proprietary products and services to the Department of Defense and various United States Government agencies, and most of the aerospace and aircraft manufacturers who receive contracts directly from the U.S. Government as an original equipment manufacturer (“prime manufacturers”Primes”). In addition, we also service technology-driven markets in the industrial, medical and other end-use markets. As a result, we have significant net revenues from certain customers. Accounts receivable were diversified over a number of different commercial, military and space programs and were made by both operating segments. Net revenues from our top ten customers, including The Boeing Company (“Boeing”), Lockheed MartinGeneral Dynamics Corporation (“Lockheed Martin”GD”), Raytheon CompanyNorthrop Grumman Corporation (“Raytheon”Northrop”), RTX Corporation (“RTX”), Spirit AeroSystems Holdings, Inc. (“Spirit”), and United Technologies CorporationViasat, Inc. (“United Technologies”Viasat”), represented the following percentages of total net sales:revenues:
| | | | | | | | | | | | | | | | | | | | |
| | Years Ended December 31, |
| | 2023 | | 2022 | | 2021 |
| Boeing | | 8.2 | % | | 6.7 | % | | 7.8 | % |
| GD | | 3.8 | % | | 5.7 | % | | 3.0 | % |
| | | | | | |
| Northrop | | 5.5 | % | | 5.7 | % | | 7.1 | % |
| RTX | | 16.8 | % | | 21.6 | % | | 24.4 | % |
| Spirit | | 6.4 | % | | 5.7 | % | | 3.8 | % |
| Viasat | | 5.5 | % | | 5.4 | % | | 2.6 | % |
Top ten customers (1) | | 58.7 | % | | 61.4 | % | | 61.1 | % |
|
| | | | | | | | | |
| | | Years Ended December 31, |
| | | 2017 | | 2016 | | 2015 |
| Boeing | | 16.4 | % | | 17.3 | % | | 16.0 | % |
| Lockheed Martin | | 5.5 | % | | 5.6 | % | | 1.2 | % |
| Raytheon | | 13.5 | % | | 8.4 | % | | 8.7 | % |
| Spirit | | 8.2 | % | | 8.2 | % | | 7.4 | % |
| United Technologies | | 4.7 | % | | 5.3 | % | | 6.1 | % |
Top ten customers (1) | | 62.5 | % | | 58.6 | % | | 55.7 | % |
(1) Includes Boeing, Raytheon,GD, Northrop, RTX, Spirit, and United Technologies for 2017, 2016, and 2015 and Lockheed Martin for 2017 and 2016.Viasat.
Boeing, Lockheed Martin, Raytheon,GD, Northrop, RTX, Spirit, and United TechnologiesViasat represented the following percentages of total accounts receivable:
|
| | | | | | |
| | | December 31, |
| | | 2017 | | 2016 |
| Boeing | | 7.8 | % | | 7.8 | % |
| Lockheed Martin | | 5.9 | % | | 2.9 | % |
| Raytheon | | 1.4 | % | | 10.9 | % |
| Spirit | | 13.5 | % | | 9.0 | % |
| United Technologies | | 2.3 | % | | 7.8 | % |
| | | | | | | | | | | | | | |
| | December 31, |
| | | 2023 | | 2022 |
| Boeing | | 7.5 | % | | 3.8 | % |
| GD | | 3.3 | % | | 3.4 | % |
| | | | |
| Northrop | | 2.5 | % | | 13.0 | % |
| RTX | | 16.4 | % | | 16.2 | % |
| Spirit | | 4.2 | % | | 1.0 | % |
| Viasat | | 8.3 | % | | 10.3 | % |
In 2017, 20162023, 2022 and 2015,2021, net revenues from foreign customers based on the location of the customer were $57.2$82.2 million, $56.4$60.7 million and $60.2$43.6 million, respectively. No net revenues from a foreign country were greater than 3.0% of total net revenues in 2017, 2016,2023, 2022, and 2015.2021. We have manufacturing facilities in Mexico and Thailand, and Mexico.however, we ceased manufacturing activities in our Thailand performance center during 2023. Our net revenues, profitability and identifiable long-lived assets attributable to foreign revenues activity were not material compared to our net revenues, profitability and identifiable long-lived assets attributable to our domestic operations during 2017, 2016,2023, 2022, and 2015.2021. We are not subject to any significant foreign currency risks as all our sales are made in United States dollars.
Note 19.17. Business Segment Information
We supply products and services primarily to the aerospace and defense industries. Our subsidiaries are organized into two strategic businesses, StructuralElectronic Systems and ElectronicStructural Systems, each of which is an operating segment as well as a reportable segment.
Financial information by reportable segment was as follows: | | | | | | | | | | | | | | | | | | | | |
| | (In thousands)
Years Ended December 31, |
| | | 2023 | | 2022 | | 2021 |
Net Revenues (1)(2) | | | | | | |
| Electronic Systems | | $ | 430,136 | | | $ | 440,638 | | | $ | 412,648 | |
| Structural Systems | | 326,856 | | | 271,899 | | | 232,765 | |
| Total Net Revenues | | $ | 756,992 | | | $ | 712,537 | | | $ | 645,413 | |
Segment Operating Income (Loss) (1)(2) | | | | | | |
| Electronic Systems | | $ | 42,086 | | | $ | 49,876 | | | $ | 57,629 | |
| Structural Systems | | 23,460 | | | 17,225 | | | 20,234 | |
| | 65,546 | | | 67,101 | | | 77,863 | |
Corporate General and Administrative Expenses (3) | | (36,629) | | | (27,313) | | | (28,982) | |
| Operating Income | | $ | 28,917 | | | $ | 39,788 | | | $ | 48,881 | |
| Depreciation and Amortization Expenses | | | | | | |
| Electronic Systems | | $ | 14,276 | | | $ | 13,974 | | | $ | 13,823 | |
| Structural Systems | | 18,060 | | | 17,212 | | | 14,331 | |
| Corporate Administration | | 235 | | | 235 | | | 235 | |
| Total Depreciation and Amortization Expenses | | $ | 32,571 | | | $ | 31,421 | | | $ | 28,389 | |
| Capital Expenditures | | | | | | |
| Electronic Systems | | $ | 6,007 | | | $ | 10,717 | | | $ | 7,471 | |
| Structural Systems | | 13,127 | | | 8,834 | | | 8,463 | |
| Corporate Administration | | — | | | — | | | — | |
| Total Capital Expenditures | | $ | 19,134 | | | $ | 19,551 | | | $ | 15,934 | |
(1)The results for 2023 include BLR’s results of operations which have been included in our consolidated statements of income since the date of acquisition of April 25, 2023, as part of the Structural Systems segment. See Note 2.
(2)The results for 2021 include MagSeal’s results of operations which have been included in our consolidated statements of income since the date of acquisition in December 2021 as part of the Structural Systems segment.
|
| | | | | | | | | | | | |
| | | (In thousands) Years Ended December 31, |
| | | 2017 | | 2016 | | 2015 |
| Net Revenues | | | | | | |
| Structural Systems | | $ | 241,460 |
| | $ | 246,465 |
| | $ | 273,319 |
|
| Electronic Systems | | 316,723 |
| | 304,177 |
| | 392,692 |
|
| Total Net Revenues | | $ | 558,183 |
| | $ | 550,642 |
| | $ | 666,011 |
|
Segment Operating Income (Loss) (1)(2) | | | | | | |
| Structural Systems | | $ | 5,477 |
| | $ | 16,497 |
| | $ | (53,010 | ) |
| Electronic Systems | | 30,940 |
| | 28,983 |
| | (4,472 | ) |
| | | 36,417 |
| | 45,480 |
| | (57,482 | ) |
Corporate General and Administrative Expenses (1)(2) | | (21,392 | ) | | (16,912 | ) | | (17,827 | ) |
| Operating Income (Loss) | | $ | 15,025 |
| | $ | 28,568 |
| | $ | (75,309 | ) |
| Depreciation and Amortization Expenses | | | | | | |
| Structural Systems | | $ | 8,860 |
| | $ | 8,688 |
| | $ | 9,417 |
|
| Electronic Systems | | 13,888 |
| | 14,087 |
| | 17,267 |
|
| Corporate Administration | | 97 |
| | 85 |
| | 162 |
|
| Total Depreciation and Amortization Expenses | | $ | 22,845 |
| | $ | 22,860 |
| | $ | 26,846 |
|
| Capital Expenditures | | | | | | |
| Structural Systems | | $ | 20,679 |
| | $ | 15,661 |
| | $ | 11,559 |
|
| Electronic Systems | | 5,019 |
| | 3,032 |
| | 4,419 |
|
| Corporate Administration | | 775 |
| | — |
| | 10 |
|
| Total Capital Expenditures | | $ | 26,473 |
| | $ | 18,693 |
| | $ | 15,988 |
|
80
| |
(1) | Includes cost not allocated to either the Structural Systems or Electronic Systems operating segments. |
| |
(2) | The results for 2017 includes LDS’ results of operations which have been included in our consolidated statements of operations since the date of acquisition as part of the Electronic Systems segment. See Note 2. |
(3)Includes costs not allocated to either the Electronic Systems or Structural Systems operating segments.
Segment assets include assets directly identifiable with each segment. Corporate assets include assets not specifically identified with a business segment, including cash. The following table summarizes our segment assets for 20172023 and 2016:2022: | | | | | | | | | | | | | | |
| | (In thousands)
December 31, |
| | | 2023 | | 2022 |
| Total Assets | | | | |
| Electronic Systems | | $ | 505,371 | | | $ | 543,298 | |
Structural Systems (1) | | 552,641 | | | 410,565 | |
Corporate Administration (2) | | 62,907 | | | 67,643 | |
| Total Assets | | $ | 1,120,919 | | | $ | 1,021,506 | |
| Goodwill and Intangibles | | | | |
| Electronic Systems | | $ | 173,214 | | | $ | 182,501 | |
| Structural Systems | | 237,729 | | | 148,107 | |
| Total Goodwill and Intangibles | | $ | 410,943 | | | $ | 330,608 | |
|
| | | | | | | | |
| | | (In thousands) December 31, |
| | | 2017 | | 2016 |
| Total Assets | | | | |
| Structural Systems | | $ | 193,600 |
| | $ | 175,580 |
|
| Electronic Systems | | 362,831 |
| | 325,780 |
|
| Corporate Administration | | 10,322 |
| | 14,069 |
|
| Total Assets | | $ | 566,753 |
| | $ | 515,429 |
|
| Goodwill and Intangibles | | | | |
| Structural Systems | | $ | 2,836 |
| | $ | 3,745 |
|
| Electronic Systems | | 229,292 |
| | 180,382 |
|
| Total Goodwill and Intangibles | | $ | 232,128 |
| | $ | 184,127 |
|
In September 2017,(1)On April 25, 2023, we acquired 100.0% of the outstanding equity interests of LDSBLR for aan original purchase price of $60.0$115.0 million, net of cash acquired. We allocated the final gross purchase price of $62.0$117.0 million to the assets acquired and liabilities assumed at their estimated fair values. The excess of the purchase price over the aggregate fair values of the net assets was recorded as goodwill. See Note 2.
In the first quarter of 2016, we entered into and completed the sale of our Pittsburgh, Pennsylvania and Miltec operations, both of which were part of our Electronic Systems operating segment.
Note 20. Supplemental Quarterly Financial Data (Unaudited)
|
| | | | | | | | | | | | | | | | | | | | | | | | | | | | | | | | |
| | | (In thousands, except per share amounts) |
| | | Three Months Ended 2017 | | Three Months Ended 2016 |
| | | Dec 31 | | Sep 30 | | Jul 1 | | Apr 1 | | Dec 31 | | Oct 1 | | Jul 2 | | Apr 2 |
| Net Revenues | | $ | 142,258 |
| | $ | 138,690 |
| | $ | 140,938 |
| | $ | 136,297 |
| | $ | 142,486 |
| | $ | 132,571 |
| | $ | 133,437 |
| | $ | 142,148 |
|
| Gross Profit | | 25,693 |
| | 26,009 |
| | 26,191 |
| | 24,927 |
| | 27,786 |
| | 25,223 |
| | 26,215 |
| | 26,969 |
|
| (Loss) Income Before Taxes | | (5,057 | ) | | 5,595 |
| | 4,564 |
| | 2,507 |
| | 5,825 |
| | 6,248 |
| | 5,331 |
| | 20,709 |
|
| Income Tax (Benefit) Expense | | (14,541 | ) | | 940 |
| | 741 |
| | 392 |
| | 2,989 |
| | 1,234 |
| | 1,470 |
| | 7,159 |
|
| Net Income | | $ | 9,484 |
| | $ | 4,655 |
| | $ | 3,823 |
| | $ | 2,115 |
| | $ | 2,836 |
| | $ | 5,014 |
| | $ | 3,861 |
| | $ | 13,550 |
|
| Earnings Per Share | | | | | | | | | | | | | | | | |
| Basic earnings per share | | $ | 0.84 |
| | $ | 0.41 |
| | $ | 0.34 |
| | $ | 0.19 |
| | $ | 0.25 |
| | $ | 0.45 |
| | $ | 0.35 |
| | $ | 1.22 |
|
| Diluted earnings per share | | $ | 0.82 |
| | $ | 0.41 |
| | $ | 0.33 |
| | $ | 0.18 |
| | $ | 0.25 |
| | $ | 0.44 |
| | $ | 0.34 |
| | $ | 1.21 |
|
In the fourth quarter of 2017, we adopted the Tax Cuts and Jobs Act and as a result, recorded a provisional deferred income tax benefit of $13.0 million related(2)Includes costs not allocated to the re-measurement for the year ended December 31, 2017. See Note 16. In addition, we commenced a restructuring plan and recorded restructuring charges of $8.8 million (with $0.5 million recorded as costs of sales). See Note 3.
In the third quarter of 2017, we acquired 100.0% of the outstanding equity interests of LDS and LDS’ results of operations have been included in our consolidated statements of operations since the date of acquisition as part ofeither the Electronic Systems segment. See Note 2.
In the first quarter of 2016, we entered into and completed the sale of our Pittsburgh, Pennsylvania and Miltec operations, both of which were part of our Electronicor Structural Systems operating segment. We recorded a preliminary pre-tax gainsegments.
DUCOMMUN INCORPORATED AND SUBSIDIARIES
CONSOLIDATED VALUATION AND QUALIFYING ACCOUNTS
YEARS ENDED DECEMBER 31, 2017, 2016,2023, 2022, AND 20152021
(Dollars in thousands)
SCHEDULE II
| | | | | | | | | | | | | | | | | | | | | | | | | | | | | | | | | | |
| | | | | | | | | | |
| Description | | Balance at
Beginning
of Period | | Charged to
(Reduction of) Costs and
Expenses | | | | Deductions/(Recoveries) | | Other(1) | | Balance at End of Period |
| 2023 | | | | | | | | | | | | |
| Allowance for Credit Losses | | $ | 589 | | | $ | 1,329 | | | | | $ | (88) | | | $ | — | | | $ | 2,006 | |
| Valuation Allowance on Deferred Tax Assets | | $ | 7,548 | | | $ | (84) | | | | | $ | — | | | $ | — | | | $ | 7,464 | |
| 2022 | | | | | | | | | | | | |
| Allowance for Credit Losses | | $ | 1,098 | | | $ | (74) | | | | | $ | 435 | | | $ | — | | | $ | 589 | |
| Valuation Allowance on Deferred Tax Assets | | $ | 7,718 | | | $ | (170) | | | | | $ | — | | | $ | — | | | $ | 7,548 | |
| 2021 | | | | | | | | | | | | |
| Allowance for Credit Losses | | $ | 1,552 | | | $ | 227 | | | | | $ | 681 | | | $ | — | | | $ | 1,098 | |
| Valuation Allowance on Deferred Tax Assets | | $ | 9,330 | | | $ | (1,612) | | | | | $ | — | | | $ | — | | | $ | 7,718 | |
(1) Opening balance of BLR Aerospace L.L.C. acquired on April 25, 2023 was zero.
|
| | | | | | | | | | | | | | | | |
| Description | | Balance at Beginning of Period | | Charged to Costs and Expenses (1) | | Deductions/(Recoveries) | | Balance at End of Period |
| 2017 | | | | | | | | |
| Allowance for Doubtful Accounts | | $ | 495 |
| | $ | 334 |
| | $ | (39 | ) | | $ | 868 |
|
| Valuation Allowance on Deferred Tax Assets | | 6,607 |
| | 2,406 |
| | — |
| | 9,013 |
|
| 2016 | | | | | | | | |
| Allowance for Doubtful Accounts | | $ | 359 |
| | $ | 233 |
| | $ | 97 |
| | $ | 495 |
|
| Valuation Allowance on Deferred Tax Assets | | 7,477 |
| | (870 | ) | | — |
| | 6,607 |
|
| 2015 | | | | | | | | |
Allowance for Doubtful Accounts (1) | | $ | 252 |
| | $ | 235 |
| | $ | 128 |
| | $ | 359 |
|
| Valuation Allowance on Deferred Tax Assets | | 6,882 |
| | 595 |
| | — |
| | 7,477 |
|
| |
(1) | Included amount that was part of assets held for sale. |
EXHIBIT INDEX
Exhibit
No. Description
2.3 Stock Purchase2.2 Agreement and Plan of Merger, dated January 22, 2016, by andas of October 8, 2019, among Ducommun Incorporated, Ducommun LaBarge Technologies, Inc., as Seller, LaBarge Electronics,DLT Acquisition, Inc., Nobles Parent Inc., and Intervala, LLC, as Buyer.the Stockholder Representative. Incorporated by reference to Exhibit 2.1 to Form 8-K dated January 25, 2016.filed on October 9, 2019.2.4 Stock2.3 Equity Purchase Agreement dated February 24, 2016,December 15, 2021, by and between Ducommun LaBarge Technologies, Inc., as Seller,Mag Parent, Inc. and General Atomics, as Buyer.Thomas B. Colby and Lyman J. Colby. Incorporated by reference to Exhibit 2.1 to Form 8-K filed on December 16, 2021.2.4 Securities Purchase Agreement dated February 24, 2016.March 20, 2023, by and between Ducommun LaBarge Technologies, Inc., Ducommun Incorporated, solely for the purposes of Section 7.07, BLR, L.L.C., Crescent Capital Aerospace, L.L.C. and Michael Carpenter. Incorporated by reference to Exhibit 2.1 to Form 8-K filed on March 21, 2023. 3.1 Restated Certificate of Incorporation filed with the Delaware Secretary of State on May 29, 1990. Incorporated by reference to Exhibit 3.1 to Form 10-K for the year ended December 31, 1990.
10.1 Credit Agreement, dated as of June 26, 2015,July 14, 2022, by and among Ducommun Incorporated, certainas Borrower, the subsidiaries of its subsidiaries,the Borrower party thereto as Guarantors, Bank of America, N.A., as administrative agent, swinglineAdministrative Agent, Swingline Lender and an L/C Issuer, and the lender and issuing bank, and other lenders party thereto. Incorporated by reference to Exhibit 10.1 to Form 8-K dated June 26, 2015.filed on July 18, 2022. *10.2 First Amendment2013 Stock Incentive Plan (Amended and Restated May 2, 2018). Incorporated by reference to Credit Agreement, dated asAppendix A of July 14, 2017, among Ducommun Incorporated, certain of its subsidiaries, Bank of America, N.A., as administrative agent, swingline lenderDefinitive Proxy Statement on Schedule 14a, filed on March 23, 2018.
Exhibit
No. Description
| |
*10.14 | Form of Indemnity Agreement entered with all directors and officers of Ducommun. Incorporated by reference to Exhibit 10.8 to Form 10-K for the year ended December 31, 1990. All of the Indemnity Agreements are identical except for the name of the director or officer and the date of the Agreement: |
|
| | | | |
| Director/Officer | | Date of Agreement | |
| Richard A. Baldridge | | March 19, 2013 | |
| Gregory S. Churchill | | March 19, 2013 | |
| Robert C. Ducommun | | December 31, 1985 | |
| Dean M. Flatt | | November 5, 2009 | |
| Douglas L. Groves | | February 12, 2013 | |
| Jay L. Haberland | | February 2, 2009 | |
| Stephen G. Oswald | | January 23, 2017 | |
| Amy M. Paul | | January 23, 2017 | |
| Robert D. Paulson | | March 25, 2003 | |
| Anthony J. Reardon | | January 8, 2008 | |
| Jerry L. Redondo | | October 1, 2015 | |
| Rosalie F. Rogers | | July 24, 2008 | |
| Christopher D. Wampler | | January 1, 2016 | |
Exhibit
No. Description
| | | | | | | | | | | | | | |
| Executive Officer | | | | |
| Person | | Date of Agreement | |
| Laureen S. Gonzalez | | DouglasSeptember 20, 2022 | |
| Suman B. Mookerji | | May 2, 2018 | |
| Jerry L. GrovesRedondo | | January 23, 2017 | |
| Rajiv A. Tata | | Amy M. PaulJanuary 24, 2020 | |
| Christopher D. Wampler | | January 23, 2017 | |
| Anthony J. Reardon | | January 23, 2017 | |
| Jerry L. Redondo | | January 23, 2017 | |
| Rosalie F. Rogers | | January 23, 2017 | |
| Christopher D. Wampler | | January 23, 2017 | |
Exhibit
No. Description
10.27 Form of Indemnity Agreement entered with all directors and officers of Ducommun. Incorporated by reference to Exhibit 10.8 to Form 10-K for the year ended December 31, 1990. All of the Indemnity Agreements are identical except for the name of the director or officer and the date of the Agreement:
| | | | | | | | | | | | | | |
| Director/Officer | | Date of Agreement | |
| Richard A. Baldridge | | March 19, 2013 | |
| David B. Carter | | February 1, 2024 | |
| Shirley G. Drazba | | October 18, 2018 | |
| Robert C. Ducommun | | December 31, 1985 | |
| Dean M. Flatt | | November 5, 2009 | |
| Laureen S. Gonzalez | | September 20, 2022 | |
| Jay L. Haberland | | February 2, 2009 | |
| Sheila G. Kramer | | June 1, 2021 | |
| Suman B. Mookerji | | April 27, 2023 | |
| Stephen G. Oswald | | January 23, 2017 | |
| Jerry L. Redondo | | October 1, 2015 | |
| Samara A. Strycker | | December 30, 2021 | |
| Rajiv A. Tata | | January 24, 2020 | |
| Christopher D. Wampler | | January 1, 2016 | |
| |
101.INS | XBRL Instance Document |
101.INS Inline XBRL Instance Document - the instance document does not appear in the Interactive Data File because its XBRL tags are embedded within the Inline XBRL
101.SCH Inline XBRL Taxonomy Extension Schema
101.CAL Inline XBRL Taxonomy Extension Calculation Linkbase
101.DEF Inline XBRL Taxonomy Extension Definition Linkbase
101.LAB Inline XBRL Taxonomy Extension Label Linkbase
101.PRE Inline XBRL Taxonomy Extension Presentation Linkbase
104 Cover Page Interactive Data File (formatted as Inline XBRL and contained in Exhibit 101)
___________________
* Indicates an executive compensation plan or arrangement.
ITEM 16. FORM 10-K SUMMARY
Not applicable.
SIGNATURES
Pursuant to the requirements of Section 13 or 15(d) of the Securities and Exchange Act of 1934, the registrant has duly caused this report to be signed on its behalf by the undersigned, thereunto duly authorized.
| | | | | | | | | | | |
| | | DUCOMMUN INCORPORATED |
| | | |
| | | DUCOMMUN INCORPORATED |
| | |
Date: February 28, 201822, 2024 | By: | | /s/ Stephen G. Oswald |
| | | | | Stephen G. Oswald |
| | | | | Chairman, President and Chief Executive Officer |
Pursuant to the requirements of the Securities and Exchange Act of 1934, this report has been duly signed below by the following persons on behalf of the registrant and in the capacities indicated on February 28, 2018.22, 2024.
| | | | | | | | | | | |
| Signature | | | Title |
| | | |
Signature | | | Title |
| | | |
| /s/ Stephen G. Oswald | | | Chairman, President and Chief Executive Officer |
| Stephen G. Oswald | | | (Principal Executive Officer) |
| | | |
| | | |
| | | |
| | | |
/s/ Douglas L. GrovesSuman B. Mookerji | | | Senior Vice President, Chief Financial Officer and Treasurer |
Douglas L. GrovesSuman B. Mookerji | | | (Principal Financial Officer) |
| | | |
/s/ Christopher D. Wampler | | | Vice President, Controller and Chief Accounting Officer |
Christopher D. Wampler | | | (Principal Accounting Officer) |
| | | |
/s/ Anthony J. Reardon | | | Chairman of the Board |
Anthony J. Reardon | | | |
| | | |
| /s/ Richard A. Baldridge | | | Director |
| Richard A. Baldridge | | | |
| | | |
| /s/ David B. Carter | | | Director |
| David B. Carter | | | |
| | | |
| /s/ Shirley G. Drazba | | | Director |
/s/ Gregory S. ChurchillShirley G. Drazba | | | | Director
| Gregory S. Churchill | | |
| | | |
| /s/ Robert C. Ducommun | | | Director |
| Robert C. Ducommun | | | |
| | | |
| /s/ Dean M. Flatt | | | Director |
| Dean M. Flatt | | | |
| | | |
| /s/ Jay L. Haberland | | | Director |
| Jay L. Haberland | | | |
| | | |
| /s/ Sheila G. Kramer | | | Director |
| Sheila G. Kramer | | | |
| | | |
| /s/ Samara A. Strycker | | | Director |
/s/ Robert D. PaulsonSamara A. Strycker | | | | Director
| Robert D. Paulson | | |
| | | |
| | | |