Table of Contents

UNITED STATES
SECURITIES AND EXCHANGE COMMISSION
Washington, D.C. 20549

FORM 10‑K
10-K
ýANNUAL REPORT PURSUANT TO SECTION 13 OR 15(d) OF THE SECURITIES EXCHANGE ACT OF 1934
For the fiscal year ended December 31, 2023
OR
For the fiscal year ended December 31, 2017
OR
o
TRANSITION REPORT PURSUANT TO SECTION 13 OR 15(d) OF THE SECURITIES EXCHANGE ACT OF 1934
For the transition period from                          to
Commission File No. 001‑36429

For the transition period from             to       
Commission File No. 001-36429
NewAresPrintLogoRGB_Large.jpg
ARES MANAGEMENT L.P.CORPORATION
(Exact name of registrantRegistrant as specified in its charter)
Delaware80-0962035
Delaware80-0962035
(State or other jurisdiction of

incorporation or organization)
(I.R.S. Employer

Identification No.)
2000 Avenue of the Stars, 12thFloor, Los Angeles, CA 90067
(Address of principal executive offices) (Zip Code)
(310) 201-4100
(Registrant’s telephone number, including area code)Number)

2000 Avenue of the Stars, 12th Floor, Los Angeles, CA 90067
(Address of principal executive office) (Zip Code)
(310) 201-4100
(Registrant’s telephone number, including area code)
N/A
(Former name, former address and former fiscal year, if changed since last report)
Securities registered pursuant to Section 12(b) of the Act:
Title of each classTrading Symbol(s)Name of each exchange on which registered
Common shares representing limited partner interestsClass A common stock, par value $0.01 per shareARESNew York Stock Exchange
Preferred sharesNew York Stock Exchange
Securities registered pursuant to Section 12(g) of the Act: None
Indicate by check mark if the registrant is a well‑knownwell-known seasoned issuer, as defined in Rule 405 of the Securities Act. Yes ýx  No 
 No o
Indicate by check mark if the registrant is not required to file reports pursuant to Section 13 or Section 15(d) of the Act. Yes o¨  No ýx
Indicate by check mark whether the registrant (1) has filed all reports required to be filed by Section 13 or 15(d) of the Securities Exchange Act of 1934 during the preceding 12 months (or for such shorter period that the registrant was required to file such reports), and (2) has been subject to such filing requirements for the past 90 days: Yes ýx  No o¨
Indicate by check mark whether the registrant has submitted electronically and posted on its corporate Web site, if any, every Interactive Data File required to be submitted and posted pursuant to Rule 405 of Regulation S‑T (Section §232.405S-T (§232.405 of this chapter) during the preceding 12 months (or for such shorter period that the registrant was required to submit and post such files). Yes ýx  No o
Indicate by check mark if disclosure of delinquent filers pursuant to Item 405 of Regulation S‑K is not contained herein, and will not be contained, to the best of registrant’s knowledge, in definitive proxy or information statements incorporated by reference in Part III of this Form 10‑K or any amendment to this Form 10‑K. ý¨
Indicate by check mark whether the registrant is a large accelerated filer, an accelerated filer, a non‑acceleratednon-accelerated filer, a smaller reporting company, or an emerging growth company. See the definitions of “large accelerated filer,” “accelerated filer,” “smaller reporting company,company.” and "emerging“emerging growth company"company” in Rule 12b‑212b-2 of the Exchange Act:
Act.
Large Accelerated Filer
Large accelerated filer ýx
Accelerated filer o
Filer
Non‑accelerated filer o
(Do not check if a smaller
reporting company)
Non-Accelerated Filer
Smaller reporting company oReporting Company
Emerging growth company oGrowth Company
If an emerging growth company, indicate by check mark if the registrant has elected not to use the extended transition period for complying with any new or revised financial accounting standards provided pursuant to Section 13(a) of the Exchange Act.o¨
Indicate by check mark whether the registrant has filed a report on and attestation to its management’s assessment of the effectiveness of its internal control over financial reporting under Section 404(b) of the Sarbanes-Oxley Act (15 U.S.C. 7262(b)) by the registered public accounting firm that prepared or issued its audit report. Yes x  No ¨
If securities are registered pursuant to Section 12(b) of the Act, indicate by check mark whether the financial statements of the registrant included in the filing reflect the correction of an error to previously issued financial statements. o
Indicate by check mark whether any of those error corrections are restatements that required a recovery analysis of incentive-based compensation received by any of the registrant’s executive officers during the relevant recovery period pursuant to §240.10D-1(b). o
Indicate by check mark whether the registrant is a shell company (as defined in Rule 12b‑212b-2 of the Exchange Act). Yes o  No ýx
The aggregate market value of the common shares held by non‑affiliatesnon-affiliates of the registrant on June 30, 2017,2023, based on the closing price on that date of $18.00$96.35 on the New York Stock Exchange, was approximately $858,409,578.$16,519,398,894. As of February 15, 2018,20, 2024 there were 82,758,558189,877,592 of the registrant’s shares of Class A common stock outstanding, 3,489,911 of the registrant’s shares representing limited partner interestsof non-voting common stock outstanding, 1,000 shares of the registrant’s Class B common stock outstanding, and 116,232,034 of the registrant’s Class C common stock outstanding.
DOCUMENTS INCORPORATED BY REFERENCE
Part III of this Form 10-K incorporates by reference information from the registrant’s definitive proxy statement related to the 2024 annual meeting of stockholders.

1

Table of Contents
TABLEOFCONTENTS

TABLEOFCONTENTS
Page
Item 6. [Reserved]

2
Forward‑Looking

Table of Contents
Cautionary Note Regarding Forward-Looking Statements
This Annual Report on Form 10‑Kreport contains forward‑lookingforward-looking statements within the meaning of Section 27A of the Securities Act of 1933, as amended (the “Securities Act”), and Section 21E of the Securities Exchange Act of 1934, as amended (the “Exchange Act”), which reflect our current views with respect to, among other things, future events, operations and financial performance. You can identify these forward‑lookingforward-looking statements by the use of forward‑lookingforward-looking words such as “outlook,” “believes,” “expects,” “potential,” “continues,” “may,” “will,” “should,” “seeks,” “approximately,” “predicts,” “intends,” “plans,” “estimates,” “anticipates”“anticipates,” “foresees” or the negative versionversions of those words, other comparable words or other comparable words.statements that do not relate to historical or factual matters. The forward‑lookingforward-looking statements are based on our beliefs, assumptions and expectations of our future performance, taking into account all information currently available to us. Such forward‑lookingforward-looking statements are subject to various risks and uncertainties and assumptions relating to our operations, financial results, financial condition, business prospects, growth strategy and liquidity. Some of these factors are described in this Annual Report on Form 10‑K10-K for the year ended December 31, 2023, under the headings “Management’s“Item 7. Management’s Discussion and Analysis of Financial Condition and Results of Operations” and “Risk“Item 1A. Risk Factors.” These factors should not be construed as exhaustive and should be read in conjunction with the risk factors and other cautionary statements that are included in this Annual Report on Form 10‑Kreport and in our other periodic filings. If one or more of these or other risks or uncertainties materialize, or if our underlying assumptions prove to be incorrect, our actual results may vary materially from those indicated in these forward‑lookingforward-looking statements. New risks and uncertainties arise over time, and it is not possible for us to predict those events or how they may affect us. Therefore, you should not place undue reliance on these forward‑lookingforward-looking statements. Any forward‑lookingforward-looking statement speaks only as of the date on which it is made. We do not undertake any obligation to publicly update or review any forward‑lookingforward-looking statement, whether as a result of new information, future developments or otherwise, except as required by law.
Unless the context suggests otherwise, references in this Annual Report on Form 10‑K to (1) “Ares,” “we,” “us” and “our” refer to our businesses, both before and after the consummation of our reorganization into a holding partnership structure and (2) our “Predecessors” refer to Ares Holdings Inc. (“AHI”) and Ares Investments LLC (“AI”), our accounting predecessors, as well as their wholly owned subsidiaries and managed funds, in each case prior to the Reorganization.
References in this Annual Report on Form 10‑K to “our general partner” refer to Ares Management GP LLC, an entity wholly owned by Ares Partners Holdco LLC, which is in turn owned and controlled by Holdco Members. References in this Annual Report on Form 10‑K10-K to the “Ares Operating Group” refer to collectively, Ares Holdings L.P. (“Ares Holdings”), Ares Offshore Holdings L.P. (“Ares Offshore”) and Ares Investments L.P. (“Ares Investments”). References in this Annual Report on Form 10‑K10-K to an “Ares Operating Group Unit” or an “AOG Unit” referrefers to collectively, a partnership unit in each of the Ares Operating Group entities. Referencesentity.

The use of any defined term in this Annual Report on Form 10-Kreport to (1) “common units”mean more than one entities, persons, securities or “common shares”other items collectively is solely for convenience of reference and “preferred units”in no way implies that such entities, persons, securities or “preferred shares” outstanding priorother items are one indistinguishable group. For example, notwithstanding the use of the defined terms “Ares,” “we” and “our” in this report to March 1, 2018 refer to our common unitsAres Management Corporation and preferred units, respectively, previously outstanding prior to March 1, 2018its subsidiaries, each subsidiary of Ares Management Corporation is a standalone legal entity that is separate and (2) “common unitholders” or “common shareholders”distinct from Ares Management Corporation and “preferred unitholders” or “preferred shareholders” prior to March 1, 2018 refer to our common unitholders and preferred unitholders, respectively, prior to March 1, 2018. Note that the termsany of our common shares and preferred shares, and the associated rights, remain unchanged.its other subsidiaries.

Under generally accepted accounting principles in the United States (“U.S.”) (“GAAP”), we are required to consolidate (a)(i) entities other than limited partnerships and entities similar to limited partnerships in which we hold a majority voting interest or have majority ownership and control over the operational, financial and investing decisions of that entity, including Ares‑affiliatesAres-affiliates and affiliated funds and co‑investment entities,co-investment vehicles, for which we are presumed to have controlling financial interests, and (b)(ii) entities that we concluded are variable interest entities (“VIEs”), including limited partnerships and collateralized loan obligations, for which we are deemed to be the primary beneficiary. When an entity is consolidated, we reflect the assets, liabilities, revenues, expenses and cash flows of the entity in our consolidated financial statements on a gross basis, subject to eliminations from consolidation, including the elimination of the management fees, performancecarried interest, incentive fees and other fees that we earn from the entity. However, the presentation of performance feerelated compensation and other expenses associated with generating such revenues is not affected by the consolidation process. In addition, as a result of the consolidation process, the net income attributable to third‑partythird-party investors in consolidated entities is presented as net income attributable to redeemable interests and non‑controllingnon-controlling interests in Consolidated Funds in ourwithin Consolidated Statements of Operations. We also consolidate joint ventures that we have established with third-party investors for strategic distribution and expansion purposes. The results of these entities are reflected on a gross basis in the consolidated financial statements, subject to eliminations from consolidation, and net income attributable to third-party investors in the consolidated joint ventures is presented within net income attributable to redeemable interest and non-controlling interests in AOG entities.


In this Annual Report on Form 10‑K,10-K, in addition to presenting our results on a consolidated basis in accordance with GAAP, we present revenues, expenses and other results on aa: (i) “segment basis,” which deconsolidates these entitiesthe consolidated funds and removes the proportional results attributable to third-party investors in the consolidated joint ventures, and therefore shows the results of our reportableoperating segments without giving effect to the consolidation of the entitiesthese entities; and (ii) “Unconsolidated Reporting“unconsolidated reporting basis,” which shows the results of our reportableoperating segments on a combined segment basis together with our Operations Management Group. In addition to our threeoperating segments, we have an Operations Management Group (the “OMG”) that. The OMG consists of five independent, shared resource groups to support our reportableoperating segments by providing infrastructure and administrative support in the areas of accounting/finance, operations/operations, information technology, business development/corporatelegal, compliance, human resources, strategy legal/compliance and human resources.relationship management and distribution. The OMG includes Ares Wealth Management Solutions, LLC (“AWMS”) that facilitates the product development, distribution, marketing and client management activities for investment offerings in the
3

Table of Contents
global wealth management channel. Additionally, the OMG provides services to certain of the Company’s managed funds and vehicles, which reimburse the OMG for expenses either equal to the costs of services provided or as a percentage of invested capital. The OMG’s revenues and expenses are not allocated to our three reportableoperating segments but we consider the cost structure of the OMG when evaluating our financial performance. This information constitutes non‑GAAPnon-GAAP financial information within the meaning of Regulation G, as promulgated by the SEC. Our management uses this information to assess the performance of our

reportable operating segments and ourthe OMG, and we believe that this information enhances the ability of shareholders to analyze our performance. For more information, see “Notes to the Consolidated Financial Statements - Note 18.“Note 14. Segment Reporting.Reporting,
Glossary
When used within our consolidated financial statements included in this Annual Report on Form 10‑K,10-K.
4

Table of Contents
Glossary

When used in this report, unless the context otherwise requires:

ARCC Part I Fees”American-style waterfall” generally refers to carried interest that the general partner is entitled to receive after a quarterly performance fee onfund investment is realized and the investors in the fund have received distributions in excess of the capital contributed for that investment income fromand all prior realized investments (including allocable expenses) plus a preferred return;

“Ares”, the “Company”, “AMC”, “we”, “us” and “our” refer to Ares CapitalManagement Corporation (NASDAQ: ARCC)and its subsidiaries;

Ares Operating Group entities” or an "AOG Entity" refers to, collectively, Ares Holdings, L.P. (“ARCC”Ares Holdings”); and any future entity designated by our board of directors in its sole discretion as an Ares Operating Group entity;


“Ares Operating Group Unit” or an “AOG Unit” referrefers to, collectively, a partnership unit in each of the Ares Operating Group entities;entities including Ares Holdings and any future entity designated by our board of directors in its sole discretion as an Ares Operating Group entity;


“assets under management” or “AUM” generally refers to the assets we manage. For our funds other than CLOs, our AUM represents the sum of the net asset value (“NAV”) of such funds, the drawn and undrawn debt (at the fund‑levelfund-level including amounts subject to restrictions) and uncalled committed capital (including commitments to funds that have yet to commence their investment periods). NAV refers to the fair value of the assets of a fund less the fair value of the liabilities of the fund. For our funds that arethe CLOs we manage, our AUM represents subordinated notes (equity) plus all drawnis equal to initial principal of collateral adjusted for paydowns. AUM also includes the proceeds raised in the initial public offerings of special purpose acquisition companies (“SPACs”) sponsored by us, less any redemptions;

“AUM not yet paying fees” (also referred to as “shadow AUM”) refers to AUM that is not currently paying fees and undrawn debt tranches;is eligible to earn management fees upon deployment;


"available capital"capital” (also referred to as “dry powder”) is comprised of uncalled committed capital and undrawn amounts under credit facilities and may include AUM that may be canceled or not otherwise available to invest (also referredinvest;

“catch-up fees” refers to as "dry powder").retroactive management fees that are episodic in nature and are calculated between the fee initiation date and the day prior to the period in which additional capital commitments are received and catch-up fees are measured, representing fees charged to new fund investors in subsequent closings of a fundraising period. Therefore, catch-up fees for each quarter during an annual period may not equal to the catch-up fees calculated for the same annual period;


“CLOs” refers to “our funds” whichthat are structured as collateralized loan obligations;


“Consolidated Funds” refers collectively to certain Ares‑affiliatedAres funds, co‑investment entitiesco-investment vehicles, CLOs and certain CLOsSPACs that are required under GAAP to be consolidated in our consolidated financial statements;


“Co‑Founders” refers to Michael Arougheti, David Kaplan, John Kissick, Antony Ressler and Bennett Rosenthal;

“Credit Facility” refers to the revolving credit facility of the Ares Operating Group;


distributable earnings” or “DE”, a non-GAAP measure, is an operating metric that assesses our performance withouteffective management fee rate” represents the effects of our consolidated funds andannualized fees divided by the average fee paying AUM for the period, excluding the impact of unrealized income and expenses, whichcatch-up fees;

“European-style waterfall” generally fluctuate with fair value changes. Among other things, this metric alsorefers to carried interest that the general partner is usedentitled to assistreceive after the investors in determining amounts potentially available for distribution. However, the declaration, payment, and determinationa fund have received distributions in an amount equal to all prior capital contributions plus a preferred return;

5

Table of the amount of distributions to shareholders, if any, is at the sole discretion of our Board of Directors, which may change our distribution policy at any time. Distributable earnings is calculated as the sum of fee related earnings, realized performance fees, realized performance fee compensation, realized net investment and other income, and is reduced by expenses arising from transaction costs associated with acquisitions, placement fees and underwriting costs, expenses incurred in connection with corporate reorganization and depreciation. Distributable earnings differs from income before taxes computed in accordance with GAAP as it is typically presented before giving effect to unrealized performance fees, unrealized performance fee compensation, unrealized net investment income, amortization of intangibles, and equity compensation expense. DE is presented prior to the effect of income taxes attributable to Ares Holdings, Inc. and to distributions made to our preferred shareholders, unless otherwise noted;Contents

“economic net income” or “ENI”, a non-GAAP measure, is an operating metric used by management to evaluate total operating performance, a decision tool for deployment of resources, and an assessment of the performance of our business segments. ENI differs from net income by excluding (a) income tax expense, (b) operating results of our Consolidated Funds, (c) depreciation and amortization expense, (d) the effects of changes arising from corporate actions, and (e) certain other items that we believe are not indicative of our total operating performance. Changes arising from corporate actions include equity-based compensation expenses, the amortization of intangible assets, transaction costs associated with mergers, acquisitions and capital transactions, placement fees and underwriting costs and expenses incurred in connection with corporate reorganization;

“fee paying AUM” or “FPAUM” refers to the AUM onfrom which we directly earn management fees. Fee paying AUMFPAUM is equal to the sum of all the individual fee bases of our funds that directly contribute to our management fees;fees. For our funds other than CLOs, our FPAUM represents the amount of limited partner capital commitments for certain closed-end funds within the reinvestment period, the amount of limited partner invested capital for the aforementioned closed-end funds beyond the reinvestment period and the portfolio value, gross asset value or NAV. For the CLOs we manage, our FPAUM is equal to the gross amount of aggregate collateral balance, at par, adjusted for defaulted or discounted collateral;


“fee related earnings” or “FRE”, a non-GAAP measure, refers to a component of ENI that is used to assess core operating performance by determining whether recurring revenue, primarily consisting of management fees and fee related performance revenues, is

sufficient to cover operating expenses and to generate profits. FRE differs from income before taxes computed in accordance with GAAP as it adjusts for the items included in the calculation of ENI andFRE excludes net performance fees, performance fee compensation,income, investment income from our Consolidated Fundsfunds and non-consolidated funds andadjusts for certain other items that we believe are not indicative of our core operating performance;performance. Fee related performance revenues, together with fee related performance compensation, is presented within FRE because it represents incentive fees from perpetual capital vehicles that are measured and eligible to be received on a recurring basis and are not dependent on realization events from the underlying investments;


“fee related performance revenues” refers to incentive fees from perpetual capital vehicles that are: (i) measured and eligible to be received on a recurring basis; and (ii) not dependent on realization events from the underlying investments. Certain vehicles are subject to hold back provisions that limit the amounts paid in a particular year. Such hold back amounts may be paid in subsequent years, subject to their extended performance conditions;

“GAAP” refers to accounting principles generally accepted in the United States of America;

“Holdco Members” refers to Messrs.Michael Arougheti, David Kaplan, Antony Ressler, andBennett Rosenthal, and Ryan Berry and R. Kipp deVeer,deVeer;

“Incentive eligible AUM” or “IEAUM” generally refers to the AUM of our funds and Michael McFerran;other entities from which carried interest and incentive fees may be generated, regardless of whether or not they are currently generating carried interest and incentive fees. It generally represents the NAV plus uncalled equity or total assets plus uncalled debt, as applicable, of our funds for which we are entitled to receive carried interest and incentive fees, excluding capital committed by us and our professionals (from which we generally do not earn carried interest and incentive fees), as well as proceeds raised in the initial public offerings of SPACs sponsored by us, less any redemptions. With respect to Ares Capital Corporation (NASDAQ: ARCC) (“ARCC”) and Ares Strategic Income Fund’s (“ASIF”) AUM, only Part II Fees may be generated from IEAUM;


“Incentive generating AUM” or “IGAUM” refers to the AUM of our funds and other entities that are currently generating carried interest and incentive fees on a realized or unrealized basis, performance fee revenue.basis. It generally represents the NAV or total assets of our funds, as applicable, for which we are entitled to receive a performance fee,carried interest and incentive fees, excluding capital committed by us and our professionals (which(from which we generally isdo not subject to a performance fee)earn carried interest and incentive fees). With respect to ARCC and ASIF are only ARCCincluded in IGAUM when Part II Fees can be generated from IGAUM;
are being generated;


“Incentive eligible AUM” or “IEAUM” refers to the AUM of our funds that are eligible to produce performance fee revenue, regardless of whether or not they are currently generating performance fees. It generally represents the NAV plus uncalled equity of our funds for which we are entitled to receive a performance fee, excluding capital committed by us and our professionals (which generally is not subject to a performance fee);

“management fees” refers to fees we earn for advisory services provided to our funds, which are generally based on a defined percentage of fair value of assets, total commitments, invested capital, net asset value, net investment income, total assets fair value of assets, or par value of the investment portfolios managed by us and alsous. Management fees include ARCC Part I Fees, that are classified as management fees as they are predictable and recurring in nature, not subject to contingent repayment and generally cash‑settled each quarter;a quarterly fee based on the net investment income of certain funds;    


“net inflows of capital” refers to net new commitments during the period, including equity and debt commitments and gross inflows into our open-ended managed accounts and sub-advised accounts, as well as new debt and equity offeringsissuances by our publicly tradedpublicly-traded vehicles minus redemptions from our open-ended funds, managed accounts and sub-advised accounts.accounts;


“net performance fees”income” refers to performance feesincome net of performance feerelated compensation which is the portion of the performance fees earned from certain funds that is typically payable to our professionals;

6

Table of Contents

“our funds” refers to the funds, alternative asset companies, trusts, co-investment vehicles and other entities and accounts that are managed or co‑managedco-managed by the Ares Operating Group, and which are structured to pay fees. It also includes funds managed by Ivy Hill Asset Management, L.P., a wholly owned portfolio company of ARCC and a registeredan SEC-registered investment adviser;


permanent capital”Part I Fees” refers to capital of our funds that do not have redemption provisions or a requirement to return capital to investors upon exitingquarterly fee on the investments made with such capital, except as required by applicable law, which funds currently consistnet investment income of ARCC, CION Ares Commercial Real Estate CorporationDiversified Credit Fund (“ACRE”CADC”) and Ares Dynamic Credit Allocation Fund, Inc. (“ARDC”).ASIF. Such funds may be required, or elect,fees are classified as management fees as they are predictable and recurring in nature, not subject to return all orcontingent repayment and generally cash-settled each quarter, unless subject to a portion of capital gains and investment income;payment deferral;


performance fees”Part II Fees” refers to fees from ARCC and ASIF that are paid in arrears as of the end of each calendar year when the respective cumulative aggregate realized capital gains exceed the cumulative aggregate realized capital losses and aggregate unrealized capital depreciation, less the aggregate amount of respective Part II Fees paid in all prior years since inception;

“performance income” refers to income we earn based on the performance of a fund which arethat is generally based on certain specific hurdle rates as defined in the fund’s investment management or partnership agreements and may be either an incentive feefees earned from funds with stated investment periods or carried interest;


performance related earnings”perpetual capital” refers to the AUM of: (i) our publicly-traded vehicles, including ARCC, Ares Commercial Real Estate Corporation (NYSE: ACRE) (“ACRE”) and Ares Dynamic Credit Allocation Fund, Inc. (NYSE: ARDC) (“ARDC”); (ii) our non-traded vehicles, including our non-traded real estate investment trusts (“REITs”), Ares Private Markets Fund (“APMF”), ASIF and CADC; (iii) Aspida Holdings Ltd. (together with its subsidiaries, “Aspida”); and (iv) certain other commingled funds and managed accounts that have an indefinite term, are not in liquidation, and for which there is no immediate requirement to return invested capital to investors upon the realization of investments. Perpetual Capital - Managed Accounts refers to managed accounts for single investors primarily in illiquid strategies that meet the perpetual capital criteria. Perpetual Capital - Private Commingled Funds refers to commingled funds that meet the perpetual capital criteria, not including our publicly-traded vehicles or “PRE”, a non-GAAP measure, is usednon-traded vehicles. Perpetual capital may be withdrawn by investors under certain conditions, including through an election to assessredeem an investor’s fund investment or to terminate the investment management agreement, which in certain cases may be terminated on 30 days’ prior written notice. In addition, the investment management or advisory agreements of certain of our investment performance net of performance fee compensation. PRE differs from income (loss) before taxes computed in accordance with GAAP as it only includes performance fees, performance fee compensationpublicly-traded and total investment and other income that we earn from our Consolidated Funds and non-consolidated funds;non-traded vehicles have one year terms, which are subject to annual renewal by such vehicles;


“realized income” or “RI”, a non-GAAP measure, is an operating metric used by management to evaluate performance of the business based on tangible operating performance and the contribution of each of the business segments to that performance, while removing the fluctuations of unrealized income and expenses,losses, which may or may not be eventually realized at the levels presented and whose realizations depend more on future outcomes than current business operations. RI differs from net income before taxes by excluding (a) income tax expense, (b)excluding: (i) operating results of our Consolidated Funds, (c)Funds; (ii) depreciation and amortization expense, (d)expense; (iii) the effects of changes arising from corporate

actions, (e) actions; and (iv) unrealized gains and losses related to performancecarried interest, incentive fees and investment performanceperformance; and (e)adjusts for certain other items that we believe are not indicative of our tangible operating performance. Changes arising from corporate actions include equity-based compensation expenses, the amortization of intangible assets, transaction costs associated with mergers, acquisitions and capital transactions, placement fees andactivities, underwriting costs and expenses incurred in connection with corporate reorganization;reorganization. Placement fee adjustment represents the net portion of either expense deferral or amortization of upfront fees to placement agents that is presented to match the timing of expense recognition with the period over which management fees are expected to be earned from the associated fund for segment purposes but have been expensed in advance in accordance with GAAP. For periods in which the amortization of upfront fees for segment purposes is higher than the GAAP expense, the placement fee adjustment is presented as a reduction to RI;


“SEC” refers to the Securities and Exchange Commission;


7

Table of Contents
2024 Senior Notes” or the "AFC Notes" refers to senior notes ofissued by a wholly owned subsidiary of Ares Holding;Holdings in October 2014 with a maturity in October 2024;


Term Loans”2028 Senior Notes” refers to term loans ofsenior notes issued by the Company in November 2023 with a maturity in November 2028;

“2030 Senior Notes” refers to senior notes issued by a wholly owned subsidiary of Ares Management LLC (“AM LLC”).Holdings in June 2020 with a maturity in June 2030;


“2051 Subordinated Notes” refers to subordinated notes issued by a wholly owned subsidiary of Ares Holdings in June 2021 with a maturity in June 2051; and

“2052 Senior Notes” refers to senior notes issued by a wholly owned subsidiary of Ares Holdings in January 2022 with a maturity in February 2052.

Many of the terms used in this Annual Report on Form 10‑K,report, including AUM, FPAUM, ENI, FRE PRE,and RI, and DE, may not be comparable to similarly titled measures used by other companies. In addition, our definitions of AUM and FPAUM are not based on any definition of AUM or FPAUM that is set forth in the agreements governing the investment funds that we manage and may differ from definitions of AUM or FPAUM set forth in other agreements to which we are a party.party or definitions used by the SEC or other regulatory bodies. Further, ENI, FRE PRE,and RI and DE are not measures of performance calculated in accordance with GAAP. We use ENI, FRE PRE,and RI and DE as measures of operating performance, not as measures of liquidity. ENI, FRE PRE,and RI and DE should not be considered in isolation or as substitutes for operating income, net income, operating cash flows, or other income or cash flow statement data prepared in accordance with GAAP. The use of ENI, FRE PRE,and RI and DE without consideration of related GAAP measures is not adequate due to the adjustments described above. Our management compensates for these limitations by using ENI, FRE PRE,and RI and DE as supplemental measures to our GAAP results. We present these measures to provide a more complete understanding of our performance as our management measures it.

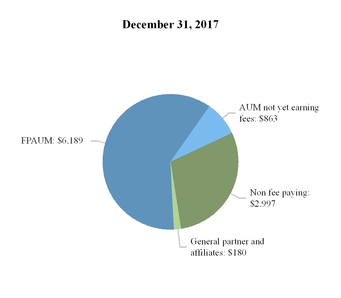
Amounts and percentages throughout this report may reflect rounding adjustments and consequently totals may not appear to sum.

8


Table of Contents
PART I.I

Item 1.  Business
BUSINESS
Overview
Ares is a leading global alternative assetinvestment manager withapproximately $106.4 $418.8 billion of assets under management and over 1,0002,850 employees in over 35 offices in more than 15 offices across the United States, Europe, Asia and Australia. countries. We offer our investors a range of investment strategies and seek to deliver attractive performance to a growingan investor base that includes approximately 785over 2,300 direct institutional relationships and a significant retail investor base across our publicly tradedpublicly-traded funds, sub-advised accounts and sub‑advised funds.non-traded vehicles. Since our inception in 1997, we have adhered to a disciplined investment philosophy that focuses on delivering strong risk‑adjustedrisk-adjusted investment returns through market cycles. Ares believes each of its three distinct but complementary investment groups in Credit, Private Equity, Real Assets and Real EstateSecondaries is a market leader based on assets under management and investment performance. We believe we create value for our stakeholders not only through our investment performance, but also by expanding our product offering, enhancing our distribution channels, increasing our global presence, investing in our non‑investmentnon-investment functions, securing strategic partnerships and completing accretivestrategic acquisitions and portfolio purchases.

Our AUM has grown to $418.8 billion as of December 31, 2023 from $74.0 billion a decade earlier. As shown in the chart below, over the past five and ten10 years, our assets under management have achieved a compound annual growth rate (“CAGR”) of 12%26% and 20%19%, respectively. Our AUM has grown to approximately $106.4 billion as of December 31, 2017, from approximately $18.0 billion a decade earlier.respectively ($ in billions):
CAGR chart v3.jpg

We have an established track record of delivering strong risk‑adjustedrisk-adjusted returns through market cycles. We believe our consistent and strong performance in a broad range of alternative assetsinvestments has been shaped by several distinguishing features of our platform:
Robust Sourcing Model: our investment professionals’ local market presence and ability to effectively cross-source for other investment groups generates a robust pipeline of high-quality investment opportunities across our platform.


Comprehensive Multi‑AssetMulti-Asset Class Expertise and Flexible Capital:  ourOur proficiency at evaluating every level of the capital structure, from senior debt to common equity, across companies, structured assets, powerreal estate projects, and infrastructure and energy assets and real estate projects enables us to effectively assess relative value. This proficiency is complemented by our flexibility in deploying capital in a range of structures and different market environments to maximize risk‑adjustedrisk-adjusted returns.

9

Table of Contents

Differentiated Market Intelligence: ourOur proprietary research on approximately 60 over 55 industries and insights from a broad, global investment portfolio enable us to more effectively diligence and structure our products and investments.


Consistent Investment Approach: weWe believe our rigorous, credit‑orientedcredit-oriented investment approach across each of our investment groups is a key contributor to our strong investment performance and ability to expand our product offering.


Robust Sourcing Model: Our investment professionals’ local market presence and ability to effectively cross-source for other investment groups generates a robust pipeline of high-quality investment opportunities across our platform.

Talented and Committed Professionals: weWe attract, develop and retain highly accomplished investment professionals who not only demonstrate deep and broad investment and non-investment expertise but also have a strong sense of commitment to our firm.


Collaborative Culture: weWe share ideas, relationships and information across our investment groups, which enables us to more effectively source, evaluate and manage investments.
We also leverage the OMG to help drive the efficiencies across the platforms and support our investment process.


Integrated Investment Platform and Process


We operate our increasingly diversified and global firm as an integrated investment platform with a collaborative culture that emphasizes sharing of knowledge and expertise. We believe the exchange of information enhances our ability to analyze investments, deploy capital and improve the performance of our funds and portfolio companies. Through collaboration, we drive value by leveraging our capital markets relationships and access to deal flow. The management of our operating businesses is currently overseen by our Management Committee, which is comprised of our executive officers and other heads of various investment and operating groups, and ultimately by the Holdco Members. The Management Committee meets monthly to discuss asset deployment, strategy and fundraising. Within this framework, weWe have established deep and sophisticated independent research capabilities in approximately 60over 55 industries and insights from active investments in approximately 1,480over 1,800 companies, over 1,400 alternative credit investments, over 505 structuredproperties, over 65 infrastructure assets and over 170 properties. Further,900 limited partnership interests.
Our investment process leverages the power of the Ares platform and an extensive network of professionals across our investment areas to identify and source attractive risk adjusted return opportunities while emphasizing capital preservation. We utilize our collective market and company knowledge, proprietary internal industry and company research, third-party information and financial modeling to drive fundamental credit analysis and investment selection. We are able to invest up and down a company’s capital structure, which we believe helps us capitalize on out-performance opportunities and assess relative value for a particular investment. The investment committees of our investment groups review and evaluate investment opportunities in a framework that includes a qualitative and quantitative assessment of the key risks of each investment. We do not have a centralized investment committee and instead our investment committees are structured with overlapping membership from different investment groups to ensure consistency of approach, shared investment experience and collaboration across our platform. Our extensive network of investment professionals includes local and geographically positionedother individuals based in our markets with the knowledge, experience and relationships that enable them to identify and take advantage of a wide range of investment opportunities. These professionals are supportedIn addition, our investment vehicles have investment policies and procedures that generally contain requirements and limitations, such as concentrations of securities, industries, and geographies in which such investment vehicles will invest, as well as other limitations required by law.

Credit: Our experienced team takes a highly sophisticated operations management team.value-oriented approach which, among other factors, considers industry and market analysis, technical analysis, fundamental credit analysis and in-house research to identify investments that offer attractive value in comparison to the perceived credit risk profile. We believe this broaduse our longstanding relationships, considerable scale, research, industry knowledge, structuring expertise and deep platform andoften our operational infrastructure provide usself-origination capabilities to invest actively across capital structures with a scalable foundationfocus on selecting the best risk-adjusted returns for our investors, while also seeking to expandprovide our product offerings, geographic scopeborrowers a valued capital solution. Each investment decision involves an intensive due diligence process that is generally focused on evaluating the target company and profitability.its current and future prospects, its management team and industry, its ability to withstand adverse conditions and its capital structure, sponsorship and structural protection, among others. Credit now includes the APAC credit platform. In connection with a merger agreement, we rebranded Ares SSG Capital Holdings Limited and its operating subsidiaries (“SSG” and subsequently rebranded as “Ares SSG”) as Ares Asia and the Ares SSG credit business as Asia credit, which was subsequently rebranded as APAC credit. APAC credit makes credit and special situations investments through its local originating presence across Asia-Pacific (“APAC”) on behalf of its institutional client base.

Private Equity: Our private equity professionals have demonstrated the ability to deploy capital across various market environments at attractive rates of return through control and non-control transactions. At the center of our investment process is a systematic approach that emphasizes rigorous due diligence at company and market levels in addition to assessing attractive relative value. We seek to be a private equity partner of choice and believe our partnership
10

Table of Contents
mentality well-positions our investments for long-term success, whereby management teams gain access to our expertise and extensive internal and external networks from diligence to exit. In addition to focusing on generating strong returns for our investors, we are simultaneously focused on driving positive change by helping to promote diversity, inclusivity and social responsibility in the companies in which we invest, which we believe benefits the businesses as a whole in addition to its employees, communities and stakeholders. In addition, we completed the acquisition of the investment management business and related operating entities collectively doing business as Crescent Point Capital on October 2, 2023 (the “Crescent Point Acquisition”), a leading Asia-focused private equity firm. The acquired business is presented within the Private Equity Group as APAC private equity.

Real Assets: With our experienced team, along with our expansive network of relationships, our Real Assets Group manages equity and debt strategies across real estate and infrastructure investments. Across our real estate equity and debt investment strategies, our team differentiates itself through its cycle-tested leadership, demonstrated performance across market cycles, access to real-time property market and corporate trends, and proven ability to create value through a disciplined investment process. Our real estate activities are managed by dedicated equity and debt teams in the U.S. and Europe, along with our vertically-integrated operating platform. These individuals collaborate frequently within and across strategies to enhance sourcing, exchange information to inform underwriting and leverage relationships to drive pricing power. Our real estate equity and debt teams have the flexibility to invest across the risk-return spectrum through core/core-plus, value-add and opportunistic investment strategies.

The infrastructure strategy focuses on debt and equity in essential infrastructure assets and companies with stable cash flow profiles through long-term contracts and high barriers to entry, and may demonstrate a lower correlation to public markets and potential for inflation projection. Across our infrastructure opportunities and debt investment strategies, we have a long-tenured global team utilizing deep local sourcing capabilities and extensive sector experience to originate and manage diverse, high-quality investments in private infrastructure assets across the globe. We have dedicated direct infrastructure opportunities and debt teams that collaborate to share market insights, support underwriting and enhance origination. Our infrastructure opportunities strategy focuses on value-add equity with a flexible mandate in climate infrastructure. Our infrastructure debt strategy targets global assets and businesses with defensive characteristics across the digital, transport, energy and utility sectors. Leveraging the established long-standing relationships, the strategy seeks to generate exclusive deal flow and high-quality investment opportunities.

Secondaries: Our team invests in secondary markets across a range of alternative asset class strategies, including private equity, real estate, infrastructure and credit. Our secondary funds acquire interests across a range of partnership vehicles, including funds, multi-asset portfolios and single asset joint ventures. These strategies involve the acquisition of interests from investors in existing funds as well as recapitalizing and restructuring the funds, including transactions that can address pending fund maturity, strategy change or the need for additional equity capital.

Our other businesses include: (i) Ares Insurance Solutions (“AIS”); and (ii) activities from our company sponsored special purpose vehicles that are formed for the purpose of effecting a merger, share exchange, asset acquisition, share purchase, reorganization or similar business combination.

We also recognize the importance of considering environmental, social and governance (“ESG”) factors in our investment process and have adopted a Responsible Investment Program for the conduct of our business. We work collaboratively with our various underwriting, asset management, legal and compliance teams to appropriately integrate relevant ESG considerations into our investment process.

In addition, as part of our growth strategy, we may from time to time engage in discussions with counterparties with respect to various potential strategic transactions, including investments in, and acquisitions of, other companies or assets. We may incur significant expenses for the evaluation, due diligence investigation and negotiation of potential strategic transactions.

Breadth, Depth and Tenure of our Senior Management

Ares was built upon the fundamental principle that each of our distinct but complementary investment groups benefits from being part of our broader platform. We believe that our strong performance, consistent growth and high talent retention through economic cycles is due largely to the effective application of this principle across our broad organization of over 1,0002,850 employees. The management of our operating businesses is currently overseen by our Executive Management Committee which meets frequently to discuss strategy and operational matters, and includes as representatives our Holdco Members and other senior leadership from our investment groups and business operations team. We do notalso have a centralizedPartners Committee comprised of senior leadership from across the firm that meets periodically to discuss our business, including investment committee and instead our investment committees are structured with overlapping membership from different investment groups to ensure consistency of approach.operating performance, fundraising, market conditions, strategic initiatives and other firm matters. Each of our investment
11

Table of Contents
groups is led by its own deep leadership team of highly accomplished investment professionals, who average approximately 25 years of investment experience in managing, investments in, advising, underwriting and restructuring companies. While primarily focused on managing strategies within their own investment group, these senior professionals are integrated within our platform through economic, cultural and structural measures. Our senior professionals have the opportunity to participate in the incentive programs of multiple investment groups to reward collaboration across our investment activities. This collaboration takes place on a daily basis butand is formally promoted through sophisticated internal systems and widely attended weekly or monthly meetings.
2017
Human Capital

We believe that our people and our culture are the most critical strategic drivers of our success as a firm. Creating a welcoming and inclusive work environment with opportunities for growth and development is essential to attracting and retaining a high-performance team, which in turn is necessary to drive differentiated outcomes. We believe that our unique culture, which centers upon values of collaboration, responsibility, entrepreneurialism, self-awareness and trustworthiness makes Ares a preferred place for top talent at all levels to build a long-term career within the alternative asset management industry. To foster this culture, we invest heavily in our human capital efforts, including:

Talent Management: As of December 31, 2023, we had over 2,850 full-time employees, comprised of approximately 1,000 professionals in our investment groups and over 1,850 operations management professionals, located in over 35 offices in more than 15 countries. We provide a comprehensive set of programs, policies and benefits to enable team members to thrive, grow and contribute to their highest potential.

Governance and Policies: Ares is committed to providing a work environment in which all individuals are treated with respect and dignity. While our culture is the foundation of our work environment, our equal opportunity employment, diversity, anti-harassment and anti-discrimination policies reinforce a professional atmosphere.

Recruiting and Onboarding: We pursue several strategic paths to hire top talent, including campus and lateral recruiting efforts, and focus on diversity. We prioritize making all new team members feel welcome and seek to set them up for success through onboarding training, ongoing touchpoints, and connecting them with our employee resource groups (“ERGs”), which are grassroots, employee-led, executive-sponsored groups and open to all team members.

Internship Training Program: Ares offers a formal internship program for students between their junior and senior years of college with the possibility of conversion to a full-time position in our analyst program upon graduation. Available roles span our investment and operations management teams.

Mentoring, Training and Employee Engagement: We provide formal and informal mentoring, learning and development, and employee engagement opportunities. We host frequent townhall meetings hosted by senior leadership and events to foster belonging. We also conduct anonymous firmwide surveys at least annually to evaluate employee morale, productivity and overall well-being.

Education Sponsorship Program: Employees are encouraged to participate in degree programs, business-related seminars, workshops, ad-hoc academic courses, continued education seminars to maintain job-related licenses and other outside training courses to facilitate professional development, the cost of which is reimbursed to the employee by Ares.

Internal Training and Development Programs: We continue to foster an environment that cultivates company and employee growth through educational programs focused on professional development, mandated training and other learning opportunities that are offered in person or online. Our team is focused on the training and development of our employees and has invested in a learning management system to facilitate this initiative.

Performance Management: We take a continuous feedback approach to performance management, encouraging leaders and team members to participate in goal setting and ongoing feedback discussions throughout the year. Our formal, firm-wide annual review process includes a self-assessment, a 360-degree feedback component, calibration and round table discussions, and year-end evaluations provided by managers to employees. In addition to the annual review, we also conduct mid-year performance reviews that are less formal and serve to evaluate progress against goals and as an opportunity to discuss specific career development objectives that were identified in the annual assessment. Training is provided for each phase of our performance assessment process.

12

Table of Contents
Retention, Rewards and Recognition: We provide competitive compensation and benefits to: (i) attract and retain talent; (ii) align the incentives of our employees with our investors and stakeholders; and (iii) support our employees across many aspects of their lives. We also have programs that seek to recognize significant team member contributions at the firm level.

Environmental, Social and Governance: We believe that ESG is integral to driving long-term success for our business. We pursue a strategy that is designed to address ESG issues most relevant to our business, starting with a corporate sustainability program focused on our corporate operations and then scaling through a responsible investment program that focuses on our investment platform.

In order to continuously improve our ESG integration processes, we have defined three tiers of roles and responsibilities for oversight and implementation: (i) Oversight Responsibility; (ii) Defining Implementation; and (iii) Driving Implementation. The Oversight Responsibility tier is led by our Global Head of ESG and consists of our most-senior managers and decision-making bodies, including our Executive Management Committee and board of directors. Next, our ESG team is responsible for Defining Implementation steps and processes in partnership with ESG champions embedded within each business line to adapt the Ares firm-wide approach to strategy-specific implementation steps. We focus on Driving Implementation through all levels of investment professionals and management to promote the integration and scalability of our approach.

Where appropriate, we aim to engage with industry organizations to help shape emerging areas of ESG practice. For example, Ares is the Chair of the UN Principles for Responsible Investing (“UNPRI”) Private Debt Advisory Committee, which aims to define and promote best practices for ESG integration within the direct lending market. Ares is also a public supporter of the Financial Stability Board Taskforce on Climate-related Financial Disclosures (“TCFD”). We believe the TCFD recommendations provide a useful framework to increase transparency on climate-related risks and opportunities within financial markets. In addition, we engage with the ESG Data Convergence Initiative, Partnership for Carbon Accounting Financials and Initiative Climat International to improve consistency and transparency in our ESG and climate disclosures.

As part of our efforts to manage the risks and opportunities associated with the energy transition, we seek to engage our portfolio companies on greenhouse gas emissions measurement and support them in their emissions reduction strategies. We are committed to measuring and reporting on our greenhouse gas emissions. We aim to minimize our own corporate footprint through initiatives to reduce operational emissions and by addressing residual, harder-to-abate emissions with tools such as renewable energy certificates and the purchase of carbon credits we believe to be high-quality.

Diversity, Equity and Inclusion: We invest heavily in diversity, equity and inclusion (“DEI”) as a strategic pillar that integrates with all talent processes and global business practices. Our human resources function, our global DEI Council and team led by our Chief Diversity, Equity, and Inclusion Officer and business leaders across the Ares platform work in partnership to implement a strategic framework to attract, engage, develop and advance diverse talent within an inclusive and welcoming environment, as well as to support DEI best practices across our investment portfolios and through our broader involvement in our communities.

People and Culture: As part of our ongoing effort to foster an inclusive culture built on apprenticeship, we support the growth and advancement of talent through various mentorship and professional development programs. In line with our continued commitment to seek to provide an environment where all team members experience a genuine sense of belonging, we hold educational trainings and employee engagement events, often in partnership with our eight ERGs that help to drive our DEI strategy and enhance the employee experience for underrepresented groups, allies and diverse talent more broadly. To create more transparency, we also aim to conduct periodic reviews with business leadership to assess our people, progress, metrics and strategies to enable the long-term success of diverse talent at Ares. In addition, as part of our commitment to equitable pay for all employees, we monitor and assess total compensation to help ensure we have alignment with role responsibilities and contributions.

Business Processes and Investment Platform: We seek to embed DEI best practices into our business and investment diligence processes as both a reflection of our values and to drive innovation and returns. We have identified DEI champions within each investment group to develop bespoke strategies focused on representation, DEI governance, equitable access, and employee engagement and equity ownership, which we intend to integrate into our business plans each year. In addition, we are focused on supporting vendor and supplier diversity in our procurement practices. In 2022, we also introduced sustainability-linked pricing to our Credit Facility, tying a portion of our borrowing costs
13

Table of Contents
to certain ESG and DEI-related targets. Due to the achievement of the ESG-related targets in 2023, our base rate and unused commitment fee on our Credit Facility have been reduced from July 2023 through June 2024. We also partner with select Ares private equity portfolio companies to understand the current state of their DEI efforts, as well as to share best practices and establish mutually agreed strategies for driving DEI improvements in parallel with our internal efforts.

Communities: We partner with organizations to foster diversity within our communities and promote corporate citizenship through charity and volunteerism, much of which targets historically underrepresented and economically disadvantaged populations. We also participate in DEI-focused industry groups in an effort to identify and advance best practices more broadly within alternative asset management. In partnership with our ERGs, we donated to various community organizations that support diverse communities.

Health and Wellness: We believe that healthy team members are more productive, and we invest heavily in benefits and initiatives to support our working families. In addition to medical, dental, vision, life insurance, disability insurance and retirement benefits, we provide generous primary and non-primary caregiver leave, domestic partner health and life insurance, adoption and reproductive assistance, family care resources (including back-up care benefits and baby baskets for new parents) and mental health benefits. We also provide employees with access to a medical advisory team and concierge service at no cost to help them navigate complex health situations and concerns. We also host several wellness-related events throughout the year on topics such as nutrition and stress management.

Flexibility: We believe that our culture benefits from people collaborating in-person in our offices, while also recognizing the value of flexibility. We are committed to providing flexibility to our employees, and in 2023, we continued to offer business group flexibility frameworks as well as our summer “Work From Anywhere” program, which allows people to work virtually for up to a maximum of three weeks. We will continue to offer a flexible working structure in 2024, while evaluating the ongoing effectiveness and determining what works best for our organization.

Philanthropy: We strive to be a force for good and to be a leader in our approach to giving and engagement. Our core values are to be collaborative, responsible, entrepreneurial, self-aware and trustworthy. These core values motivate us to seek innovative yet practical solutions to some of society’s most pressing concerns. Empathy and compassion guide our approach to “doing good” such that our charitable efforts aim to help improve people’s quality of life. Philanthropy at Ares includes:

Ares Charitable Foundation (the “Ares Foundation”):A 501(c)(3) qualifying organization sponsored by the firm, the Ares Foundation envisions a world in which people benefit from equitable access to knowledge, resources and opportunities so that they can achieve their full potential. Launched in 2021, the Ares Foundation’s mission is to help accelerate equality of economic opportunity by supporting nonprofit organizations and initiatives that provide career preparation and reskilling, encourage entrepreneurship and deepen individuals’ understanding of personal finance.

We fund and work alongside high-quality nonprofit organizations to devise inspired solutions to critical societal issues. Our employee-directed grants support initiatives that, for example, help low-income women in Singapore transition out of poverty, examine barriers to young people’s workforce entry in the U.K. and catalyze intergenerational entrepreneurship in the U.S. Our signature initiatives seek to address pervasive challenges through large-scale funding commitments that reflect our desire to improve the lives of current and future generations. Our commitments include Climate-Resilient Employees for a Sustainable Tomorrow (“CREST”), a five-year $25.0 million commitment that aims to close the gap between the demand for a skilled workforce for green jobs and the number of people ready for these opportunities in the U.S. and India, and AltFinance, a 10-year $30.0 million commitment to help equip Historically Black College and University students for careers in alternative investment management.

Ares is committed to donating a portion of our annualized carried interest allocations and incentive fees from certain funds to the Ares Foundation, which helps further align the firms’ investment and charitable activities. Moreover, the Ares Foundation benefits from the generosity of Ares employees who are able to donate cash, equity or a portion of the realized proceeds from carried interest in certain funds.

Pathfinder and Other Funds:In addition, Ares has committed to donate a minimum of 10% of the carried interest generated from Ares Pathfinder Fund, L.P. (“Pathfinder I”) and Ares Pathfinder Fund II, L.P. (“Pathfinder II”) and 5% of the incentive fees generated from an open-ended core alternative credit fund to global health and education charities, contributed by the firm and our team members. We believe that Pathfinder I is the first institutional private investment fund to utilize a predefined structure to make a substantial commitment to charitable activities.

14

Table of Contents
Ares in Motion (“AIM”): Our signature platform for employee engagement has empowered our team members to support local communities and nonprofit organizations since 2012. AIM engages employees in grassroots volunteerism, encourages their service with nonprofit boards and other pro bono opportunities, and amplifies their personal donations with charitable matches. Furthermore, employees who volunteer as AIM Champions enjoy opportunities to organize and lead volunteer activities in the U.S., Europe and Asia-Pacific to benefit the communities in which they live and work.

Our annual Summer of Service engages Ares employees around the world in both service-and skills-based “give back” opportunities. In addition, our nonprofit board training and placement program provides a way for team members to make a difference in their communities beyond firm-sponsored volunteer activities. AIM also helps bring our team members into thoughtful dialogue with nonprofit leaders through virtual fireside chat events so that employees can learn more about their organizations, understand the purpose and significance of their work, and glean valuable insights to apply professionally and personally.

Furthermore, we leverage AIM to sponsor and match team members’ support of charitable causes like crisis relief, social justice, mental health and DEI. In addition, we offer matching funds to augment team members’ sponsorship of nonprofits’ mission-driven events. The firm also sponsors these kinds of events through our business lines, and offers opportunities for employees to participate in these funded activities.


15

Table of Contents
2023 Highlights

Fundraising
In 2017,2023, we raised $16.7$74.5 billion in gross new capital commitments for more than 65125 different funds.investment vehicles. Of the $16.7$74.5 billion, $10.7$65.9 billion was raised directly from 146over 625 institutional investors (68(over 325 existing and 78approximately 300 new to Ares) and $6.0$8.6 billion was raised through intermediaries. 
InThe charts below summarize our Credit Group, we raised $14.9 billion of gross capital commitments across a variety of our credit strategies comprised of $4.3 billion in Syndicated Loans, $558.0 million in High Yield, $66.0 million in Credit Opportunities and $284.0 million in Structured Credit. In our Direct Lending strategy, we raised $7.7 billion of gross capital in our U.S.

and E.U. Direct Lending funds and $738.0 million in aggregate new debt commitments for ARCC, our publicly traded business development company, and its affiliated funds and vehicles.
In our Private Equity Group, we raised $55.6 million of gross new capital commitments for an Asian private equity fundby investment group and $300.0 millionstrategy ($ in billions):

Credit: $55.4Private Equity: $1.6
549756003175549756003185
U.S. Direct LendingEuropean Direct LendingAlternative CreditCorporate Private EquityOther
Liquid CreditAPAC CreditOther
Real Assets: $6.9Secondaries: $3.6
549756003196549756003215
U.S. Real Estate EquityInfrastructure OpportunitiesEuropean Real Estate EquityCredit
Secondaries
Real Estate SecondariesInfrastructure Secondaries
Real Estate DebtInfrastructure DebtPrivate Equity SecondariesOther

16

Table of Contents
Other Businesses: $7.0
549756003219
InsuranceSPACs

The chart below summarizes gross new capital commitmentsraised from existing and new direct institutional investors for the year endedDecember 31, 2023:
30533
Existing -
Re-Up
Existing - New ProductNew

In 2023, 88% of our fifth powerfundraising from direct institutional investors was from existing investors that either committed to a new product or re-upped their commitment to a subsequent fund vintage within the same product. We believe the fundraising from existing investors demonstrates our investors’ satisfaction with our performance, disciplined management of their capital and infrastructure fund. diverse product offering.


In our Real Estate Group, we raised $934.2 million
17

Table of gross new capital commitments for our U.S. real estate private equity funds. Additionally, we raised $508.9 million in our real estate debt strategy.Contents

Capital Deployment


WIn 2023, we took advantage ofinvested $68.1 billion across our diverse global platform to invest more than $16.4 billion (excluding permanent capital) globally in 2017 as shown in the following table (dollarscharts ($ in billions):

Credit $53.2Private Equity: $4.3
549756003226549756003230
U.S. Direct LendingAlternative CreditEuropean Direct LendingSpecial OpportunitiesCorporate Private Equity
Liquid CreditAPAC Credit


Real Assets: $7.6

Secondaries: $2.3

549756003241549756003244
U.S. Real Estate EquityEuropean Real Estate EquityInfrastructure DebtPrivate Equity SecondariesReal Estate Secondaries
Infrastructure OpportunitiesReal Estate DebtInfrastructure SecondariesCredit
Secondaries


18

Table of Contents
StrategyInvested Amount
Syndicated Loans$2.9
High Yield Bonds0.4
Credit Opportunities0.3
Structured Credit1.4
U.S. Direct Lending3.8
E.U. Direct Lending3.3
Corporate Private Equity2.5
U.S. Power & Energy Infrastructure0.4
Special Situations0.5
Real Estate Equity & Debt0.9
     Total$16.4
Other Businesses: $0.7

549756003249
Insurance


Of the $16.4$68.1 billion invested, $12.6$42.5 billion was tied to our drawdown funds. OfOur capital deployment in drawdown funds was comprised of the $12.6 billion, $6.8 billion was driven by investmentsfollowing ($ in E.U. and U.S. direct lending, $1.3 billion driven by investment in structured credit, $0.2 billion was driven by investments in various credit strategies, $3.4 billion was driven by investments in corporate private equity, U.S. power and energy infrastructure and special situations, and $0.9 billion was driven by investments in real estate debt and equity strategies.billions):


31281

CreditPrivate EquityReal AssetsSecondaries

19

Table of Contents
Investment Groups


Each of our investment groups employs a disciplined, credit-oriented investment philosophy and is managed by a seasoned leadership team of senior professionals with extensive experience investing in, advising and underwriting assets held by our funds.
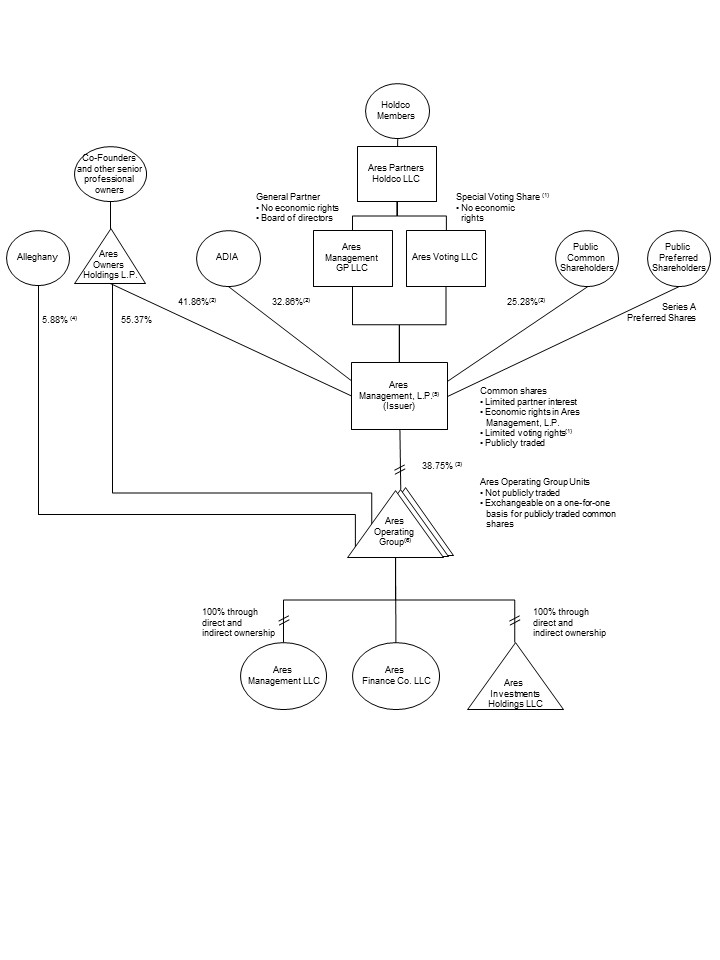
ares org-title.jpg
Investment Groups Chart.jpg


(1)As of December 31, 2023, AUM amounts include vehicles managed by Ivy Hill Asset Management, L.P., a wholly owned portfolio company of ARCC and restructuringan SEC-registered investment adviser (“IHAM”).
(2)$56.9 billion in AUM represents investments by insurance companies powerin various Ares’ funds, SMAs and energy assets, or real estate properties.co-investments versus one discrete insurance platform.


20

Table of Contents
Credit Group


Our Credit Group is a leading managerone of the largest managers of credit strategies across the non-investment grade credit universe, with approximately $71.7$284.8 billion of AUM and approximately 139over 270 funds as of December 31, 2017.2023. The Credit Group provides solutions for fixed income investors seeking to access the syndicated loana wide range of credit assets, including liquid credit, alternative credit and high yield bond markets anddirect lending products. The Credit Group capitalizes on opportunities across traded and non-traded corporate and structured credit. It additionally providesconsumer debt across the U.S. and European markets, providing investors access to directly originated fixed and floating rate credit assets andalong with the ability to capitalize on illiquidity premiums across the credit spectrum. Our U.S. and European direct lending strategies are among the largest in their respective markets.


The Credit Group offers a range ofthe following credit strategies across the liquid and illiquid spectrum, includingspectrum:

Liquid Credit: Our liquid credit investment solutions help traditional fixed income investors access the syndicated loans,loan and high yield bonds, creditbond markets in North America and Europe and capitalize on opportunities structured credit investments and U.S. and European direct lending.

Syndicated Loans:  Ouracross multi-asset credit. The syndicated loans strategy delivers a diversified portfolio of liquid, traded non-investment grade secured loans to corporate issuers. We focusfocuses on evaluating individual credit opportunities related primarily to non‑investmentnon-investment grade senior secured loans and primarily targettargets first lien senior secured debt,loans, with a secondary focus on second lien senior secured loans mezzanine loans,and subordinated and other unsecured loans. The high yield bonds and unsecured loans.

High Yield Bonds: Our high yield bondsbond strategy employs a value-driven philosophy, utilizing fundamental researchseeks to identify non‑investment grade corporate issuers. We primarily seekdeliver a diversified portfolio of liquid, traded non-investment grade corporate bonds. This incorporatesbonds, including secured, unsecured and subordinated debt instrumentsinstruments. Multi-asset credit is a “go anywhere” strategy designed to offer investors a flexible solution to global credit investing by allowing us to tactically allocate between multiple asset classes in various market conditions. As of issuers in both North America and Europe.

Credit Opportunities:  Our credit opportunities strategy has an event‑oriented credit mandate that seeks to generate attractive risk‑adjusted returns across market cycles by capitalizing on market inefficiencies and relative value opportunities in the non‑investment grade corporate credit market. We principally invest or take short positions in U.S. and European debt securities across the capital structure, including opportunisticDecember 31, 2023, our liquid credit special situationsteam managed $47.3 billion of AUM in over 110 funds and structured products. separately managed accounts (“SMAs”).

Alternative Credit:Our “all weather”alternative credit strategy seeks to dynamically manage duration, which is critical to realizing attractive performance during various interest rate environments.

Structured Credit:capitalize on asset-focused investment opportunities that fall outside of traditional, well-defined markets such as corporate debt, real estate and private equity. As of December 31, 2023, our dedicated team of over 65 professionals managed $33.9 billion of AUM in over 25 private funds and SMAs for a global investor base. Our structuredalternative credit strategy invests across theemphasizes downside protection and capital structure of syndicated CLO vehicles and in directly-originated asset-backed investments comprised of diversified portfolios of consumer and commercial assets. We seek to

construct portfolios of asset-backedpreservation through a focus on investments that benefit from having downside protection, less correlation withtend to share the broader credit marketsfollowing key attributes: asset security, covenants, cash flow velocity and diversification.other features designed to capture value and minimize risk to principal. Our investment approach is designed to capture and create value by leveraging our firm’s platform insights to assess risk and relative value.


Direct Lending: Our direct lending strategy is one of the largest self‑originatingself-originating direct lenders to the U.S. and European markets, with approximately $42.4$191.4 billion of assets under management across approximately 65AUM in over 90 funds orand investment vehicles as of December 31, 2017. 2023. We manage various types of direct lending vehicles within our U.S. and European direct lending teams including commingled funds, SMAs for large institutional investors seeking tailored investment solutions and joint venture lending programs. As of December 31, 2023, we managed over 55 SMAs across our direct lending strategy.

Our direct lending strategyteam has a multi‑channelmulti-channel origination strategy designed to address a broad set of investment opportunities in the middle market. We focus on being the lead or sole lender to our portfolio companies which we believe allows us to exert greater influence over deal terms, capital structure, documentation, fees and pricing, while at the same time securing our position as a preferred source of financing for our transaction partners. The groupteam maintains a flexible investment strategy with the capability to invest in revolving credit facilities, first lien senior secured loans (including unitranche loans which are loans that combine senior and subordinated debt, generally in a first lien position), second lien senior secured loans, mezzaninesubordinated debt, preferred equity and non‑controlnon-control equity co-investments in private middle market companies and power generation projects. We manage various types of funds within our U.S. and European direct lending teams that include commingled funds, separately managed accounts for large institutional investors seeking tailored investment solutions and joint venture lending programs.companies.


U.S. Direct Lending: Our leading U.S. team is comprised of approximately 130over 180 investment professionals in seven offices. Our team maintains an active dialogue withthat cover more than 480650 financial sponsors and providesprovide a wide range of financing solutions to middle-marketmiddle market companies that typically range from $10.0$10 million to $150.0over $500 million in earnings before interest, tax, depreciation and amortization (“EBITDA”). As of December 31, 2017,2023, our U.S. direct lending team and its affiliates advised 46managed $123.1 billion of AUM in approximately 55 funds totaling, in aggregate, approximately $30.6 billion in AUM.and investment vehicles. Our U.S. direct lending team manages corporate lending activities primarily through our inaugural vehicle and publicly tradedpublicly-traded business development company (“BDC”), ARCC, our non-traded BDC, ASIF, as well as private commingled funds and separately managed accounts.

SMAs. Primary areas of focus for our U.S. Direct Lendingdirect lending teams include:


Ares Capital Corporation: ARCC is a leading specialty finance company that provides one-stop debtfocused on providing direct loans to and equity financing solutions to U.S.making other investments in private middle market companies in the U.S. ARCC has elected to be regulated as a BDC and power generation projects. Aswas the largest publicly-traded BDC by market capitalization in the U.S. as of December 31, 2017, ARCC was2023.

Ares Strategic Income Fund: ASIF is a closed-end investment company focused primarily on providing direct loans to private middle market companies in the largest business development company by both total assetsU.S., and market capitalization.to a lesser extent, broadly syndicated loans and
21

Table of Contents

other more liquid credit opportunities, including in publicly-traded debt instruments. ASIF has elected to be regulated as a BDC.

Other U.S. funds:Commingled Funds and SMAs:Outside of ARCC, and its controlled affiliates, U.S. direct lending also generates fees from other funds, including the following fund families: Ares Private Credit Solutions, which focus on junior debt investments in upper middle market companies; Ares Senior Direct Lending Fund, which focus on first lien senior secured loans to North American middle market companies; Ares Commercial Finance, which makesfocuses on asset-based and cash flow loans to middle-marketmiddle market and specialty finance companies, Ares Private Credit Solutions, which makes junior debt investments in upper middle-market companies, companies; and separately managed accountsSMAs for large institutional investors. AUM for these other U.S.

European Direct Lending: Our European direct lending team is comprised of over 90 investment professionals with the ability to invest across the capital structure and across several geographies in Europe. The team covers over 395 financial sponsors, offers self-originated, flexible and scaled debt capital to predominantly middle market and large capitalization companies with EBITDA typically ranging from €10 million to over €300 million. As of December 31, 2023, our European direct lending team managed $68.3 billion of AUM in over 35funds, totaled $10.5including commingled funds and SMAs.
APAC Credit: Our APAC credit team manages credit, private equity and special situations investments in the APAC region. Our APAC special situations strategy focuses on primary and secondary special situations, primarily targeting restructuring-related situations, deep value acquisitions and distressed financing. Our APAC private credit strategy targets privately sourced loans in high quality businesses across the region. The team consists of approximately 70 investment professionals. APAC credit benefits from having an on-the-ground presence in offices across the APAC region and a comprehensive range of local market licenses and entities to provide our clients with an extensive regional investment platform. APAC credit primarily employs a direct origination model and aims to provide flexible capital solutions to its investee companies and compelling risk-reward investment opportunities to our investors. As of December 31, 2023, APAC credit had $11.9 billion of AUM in over 15 funds and related co-investment vehicles.


22

The following charts present the Credit Group’s AUM and FPAUM as of December 31, 2017.
E.U. Direct Lending:  Our European team is comprised of approximately 402023 by investment professionals in five offices. Our team covers over 200 financial sponsors and is one of the most significant participants in the European middle-market. We provide a wide range of financing opportunities to middle-market companies that typically range from €10.0 to €100.0 million in EBITDA. As of December 31, 2017, our E.U. direct lending team advised 19 commingled funds and managed accounts, aggregating approximately $11.8 billion in AUM.
The following table presents the Credit Group’s AUM, FPAUM and number of funds as of December 31, 2017 (dollarsstrategy ($ in billions):

 AUM FPAUM 
Number of
Funds
Syndicated Loans$16.5
 $15.3
 35
High Yield Bonds4.7
 4.6
 16
Credit Opportunities3.3
 2.8
 10
Structured Credit4.8
 3.4
 13
U.S. Direct Lending30.6
 16.9
 46
E.U. Direct Lending11.8
 6.4
 19
Credit Group$71.7
 $49.4
 139
AUM: $284.8FPAUM: $176.8

549756003266549756003267


U.S. Direct LendingEuropean Direct LendingLiquid CreditAlternative CreditAPAC CreditOther
Private Equity Group
Our Private Equity Group has achieved compelling investment returns for a loyal and growing group of high profileits limited partners and, as of December 31, 2017 had approximately $24.52023, managed $39.1 billion of AUM. Our Private Equity Group AUM in over 65 funds. The group broadly categorizes its investment activitiesstrategies into three strategies: Corporate Private Equity, U.S. Powercorporate private equity, special opportunities and Energy Infrastructure and Special Situations.APAC private equity. Our private equity professionals have a demonstrated ability to deploy flexible capital across market environments, which allows them to stay both active and disciplined in various market environments.their assessment of the best relative value opportunities. The group’s activities are managed by three dedicated investment teamsgroup manages funds focused primarily on investing in North America, Europe and China.The group manages flagshipAsia-Pacific.

Corporate Private Equity: Our team consists of over 55 investment professionals based primarily in Los Angeles and London. Our private equity funds focused primarilyare leaders in the North American and European middle market, where they focus on growth buyouts, with the ability to flex into distressed investing during periods of market volatility and dislocation. We seek to invest in high-quality middle market companies in the core industries of healthcare, services, industrials and consumer across North America and Europe, where we can utilize the team’s extensive growth-oriented investing experience, dedicated value creation system and ability to a lesser extent, Europe, special situations funds, U.S. power and energy infrastructure funds and related co-investment vehicles and growth funds in China.
Corporate Private Equity:Certain of our senior private equity professionals have been working together since 1990 and raised our first corporate private equity fund in 2003. Our team has grownflex into distressed to approximately 65 investment professionals based in Los Angeles, Chicago, London, Shanghai, Chengdu and Hong Kong. In the U.S. and London, we pursue four principal transactions types: prudently leveraged control buyouts, growth equity, rescue/deleveraging capital and distressed buyouts/discounted debt accumulation.target attractive returns across market environments. This flexible capital approach,differentiated strategy, together with the broad resources of the Ares platform, widens our universe of potential investment opportunities and allows us to remain active in different marketsacross various market environments and to be highly selective in making investments across variousby identifying the most attractive relative value opportunities.

Special Opportunities: Our special opportunities team consists of over 25 investment professionals and employs an “all weather” flexible capital strategy to finance debt and non-control equity solutions in healthy, stressed and distressed middle market environments.
companies undergoing transformational change. Our team partners with companies in North America and Europe to enhance enterprise values, filling the void between for-control private equity and traditional private debt. The strategy seeks to consistently invest in a range of private, special-situation opportunities and flex into distressed public market debt when attractive. We believe the special opportunities team benefits from: (i) advantaged sourcing; (ii) private equity integration, with an ability to leverage the deep industry experience of the corporate private equity professionals; (iii) an extensive network and information edge; and (iv) an experienced team utilizing a consistent and repeatable investment process.


U.S. Power & Energy Infrastructure:Our U.S. powerIn February 2024, we announced that our special opportunities strategy, historically reported as a component of our Private Equity Group, will be integrated into the Credit Group to align management of this strategy and energy infrastructure strategy teamwill form the foundation for a new opportunistic credit strategy. The change will be presented in our results beginning in 2024. Adjusted for this change, as of December 31, 2023, the Credit Group managed $299.4 billion in AUM with approximately 20490 investment professionals targets assetsand the Private Equity Group managed $24.5 billion in AUM with approximately 85 investment professionals, with both groups continuing to manage investments across the U.S. power generation, transmission, Europe and midstreamAsia-Pacific.

23

APAC Private Equity:The APAC private equity strategy was established in connection with the Crescent Point Acquisition, investing in industry leading consumer companies in seven core sectors whichthat we believe benefit disproportionately from higher disposable income levels. The strategy focuses on primarily pursuing structured growth equity investments in control, joint control and minority ownership formats. Our APAC private equity team consists of over 25 investment professionals and focuses on investing in companies that give us exposure to increasing consumer spending and urbanization in our target markets. In times of economic dislocation, we also seek attractive risk-adjusted equity returns with current cash flowto invest opportunistically where the focus is on dislocations and capital appreciation. We believe there are significant investmentcatalysts that lead to high-quality assets becoming available for purchase at deeply discounted prices. While we look for deep value opportunities for us in this sector as the United States replaces its aging infrastructure and builds new assets to meet capacity needs over the coming decades.

Special Situations: Our special situations strategy capitalizes on dislocated assets by flexibly deploying capital across multiple asset classes. We employconsumer-driven companies, our deep credit expertise, proprietary research and robust sourcing model to capitalize on current market trends. This opportunisticvalue approach allows us to invest across a broad spectrum of investments, including public and private, distressed and opportunistic, special situations across a broad range of industries, asset classes and geographies.
often includes asset-oriented opportunities.


The following table presentscharts present the Private Equity Group’s AUM FPAUM and number of fundsFPAUM as of December 31, 2017 (dollars2023 by investment strategy ($ in billions):

 AUM FPAUM 
Number of
Funds
Corporate Private Equity$18.6
 $12.1
 7
U.S. Power & Energy Infrastructure4.4
 4.0
 11
Special Situations1.5
 0.8
 3
Private Equity Group funds$24.5
 $16.9
 21
AUM: $39.1FPAUM: $21.6

549756003274549756003275
Corporate
Private Equity
Special OpportunitiesAPAC Private EquityOther

Real EstateAssets Group


Our Real EstateAssets Group manages comprehensive public and private equity and debt strategies withapproximately $10.2 $65.4 billion of assets under managementAUM in over 65 investment vehicles as of December 31, 2017.2023. With our experienced team, along with our expansive network of relationships, our Real EstateAssets Group capitalizes on opportunities across both real estatein equity and debt investing. investing across real estate and infrastructure investment strategies.

Real Estate: Our real estate equity investments focus on implementing hands‑onhands-on value creation initiatives to mismanaged and capital‑starvedcapital-starved assets, platform-level investments, as well as new development,developments, ultimately selling stabilized assets back into the market. Our real estate debt strategies leverage the Real Estate Group’sutilize diverse sources of capital to directly originate and manage commercial mortgage investmentsloans on properties that range from stabilized to those requiring hands-on value creation. The Real Estate GroupOur real estate platform has achieved significant scale in a short period ofover time through both organic fundraising efforts as well as various acquisitions and successful fundraising efforts.acquisitions. Today, the group provideswe provide investors access to itsour real estate investment capabilities through several vehicles: closed-end U.S. and European real estate privatediversified equity commingled funds, real estatean open-end U.S. industrial-focused equity fund, open-end U.S. and European debt funds, equity and debt separately managed accountsSMAs, our non-traded REITs, Ares Real Estate Income Trust, Inc. (“AREIT”) and a publicly tradedAres Industrial Real Estate Income Trust, Inc. (“AIREIT”), and our publicly-traded commercial mortgage REIT, ACRE. The group’s activities are managed by dedicated equity and debt teams in the U.S. and Europe.

Real Estate Equity: Our real estate equity team, with approximately 50over 220 investment professionals, across six offices, has extensive real estate private equity experience in the United StatesU.S. and Europe. Our team primarily investsacquires standing assets and improves them through renovating, repositioning and retenanting and selectively developing assets in new developments and the

repositioning of assets, with a focus on control or majority‑control investments primarily in the United States and Western Europe.supply-constrained markets. As of December 31, 2017,2023, our real estate equity team advisedmanaged $38.6 billion of AUM in over 40 investment vehicles totaling, in aggregate, approximately $7.3 billion in AUM.
vehicles.Primary areas of focus for our Real Estate Groupreal estate equity teams include:

Real Estate Equity Value‑Add Strategy: Core/Core-Plus: Our U.S. core/core-plus real estate strategy focuses on the acquisition of assets with strong long-term cash flow potential and durable tenancy diversified across end-user industries and
24

Table of Contents
geographies. We deploy capital across all major property types, with a strong focus on industrial and multifamily assets located in top-tier primary and regional distribution markets across the U.S.

Real Estate Value-Add:Our U.S. and European value‑add funds focusvalue-add real estate strategy focuses on undermanaged and under‑fundedunderfunded income-producing assets seekingacross various property sectors in the U.S. and Europe. The strategy seeks to create value and generate stable and growing distributions to investors by buying assetsproperties at attractive valuations, as well as through activeimplementing asset management of income‑producing properties, including multifamily, retail, office, hotelinitiatives to increase income and industrial properties across the United States and Western Europe.
identifying multiple exit strategies upfront.


Real Estate Equity Opportunistic Strategy: Opportunistic:Our U.S. and European opportunistic real estate funds capitalizestrategy capitalizes on increased investor demand for developed and stabilized assets by focusing on manufacturing corethe repositioning of assets, throughcapitalization of distressed and special situations, and development redevelopment and fixing distressed capital structuresof core-quality assets across all major property types, including multifamily, hotel, office, retailas well as select and industrial properties acrossadjacent sectors, throughout the United StatesU.S. and Europe.


Real Estate Debt: Our real estate debt team, of approximately 20with over 35 professionals, primarily focuses on directly originates and invests inoriginating a wide range of self-originated financing opportunities for middle-market ownersin the U.S. and operators of U.S. commercial real estate.Europe. As of December 31, 2017,2023, our real estate debt team advised twomanaged $11.1 billion of AUM globally through open-end funds, SMAs and ACRE. By investing through multiple investment vehicles, totaling, in the aggregate, approximately $2.9 billion in AUM. In addition to managing private funds, our real estate debt team makeshas the ability to provide flexible financing across the capital structure. While our real estate debt strategies focus predominantly on directly originated transactions, we also selectively pursue secondary market acquisitions and syndicated transactions.

Infrastructure: Our long-tenured global infrastructure team utilizes deep local sourcing capabilities and extensive sector experience to seek to originate and manage diverse, high-quality investments through ACRE, primarilyin private infrastructure assets across the globe and, as of December 31, 2023, managed $15.7 billion of AUM in over 15 investment vehicles.

Infrastructure Opportunities: Our infrastructure opportunities team consists of over 30 investment professionals and managed $6.3 billion of AUM in more than ten investment vehicles as of December 31, 2023. We utilize a broad origination strategy, flexible investment approach, and leverage industry relationships and the Ares platform to seek attractive risk-adjusted returns across the climate infrastructure market. We believe our experience as value-add investors, flexible approach, and broad infrastructure experience positions us well to take advantage of the transitioning infrastructure industry.

Infrastructure Debt: Our global infrastructure debt team consists of over 20 investment professionals and sources assets and businesses across regions with defensive characteristics across the digital, transport, energy and utility sectors. As of December 31, 2023, our global infrastructure debt team managed $9.4 billion of AUM in more than five investment vehicles. We employ a direct origination and tailored structuring approach to provide borrowers with flexible financing solutions. We aim to deliver attractive risk adjusted returns focused on directly originating, managingcash yield by targeting infrastructure debt investments with defensive characteristics that have the potential to perform across different market cycles. Our structuring experience helps enhance cash yield and servicingreduce downside risks in a diversified portfoliocore asset class.

25

Table of commercialContents
The following charts present the Real Assets Group’s AUM and FPAUM as of December 31, 2023by investment strategy ($ in billions):
AUM: $65.4FPAUM: $41.3
549756003289549756003290
U.S. Real Estate EquityReal Estate DebtEuropean Real Estate EquityInfrastructure DebtInfrastructure Opportunities
Secondaries Group

Our Secondaries Group invests in secondary markets across a range of alternative asset class strategies, including private equity, real estate, debt-related investments. 
The following table presents the Real Estate Group’sinfrastructure and credit, with $24.7 billion of AUM FPAUM and number ofin over 75 funds as of December 31, 2017 per2023. The team has extensive experience investing across the secondaries market primarily in North America. We have established ourselves among the most active secondary investors engaged in recapitalizing and restructuring existing limited partnership interests in funds with a focus on transactions that can address pending fund maturity, strategy change or the need for additional equity capital.

Private Equity Secondaries: Our private equity secondaries teamhas an established track record of providing customized private equity transaction solutions to institutional limited partners and general partners. As of December 31, 2023, our private equity secondaries team of more than 35 investment professionals managed $13.1 billion of AUM in approximately 35 funds and open-end accounts. Our private equity secondaries team acquires interests across a range of partnership vehicles, including private equity funds, multi-asset portfolios, as well as single asset joint ventures. The private equity secondaries strategy seeks to achieve attractive secondary cash flow and diversification characteristics by investing across the spectrum of private equity secondaries transactions, including through APMF, a closed-end interval fund. We continue to maintain a differentiated investment strategy (dollarsthat utilizes our skills in fundamental manager and portfolio analysis, our quantitative research capabilities and the support and insights from the wider Ares platform with the aim to generate strong risk-adjusted returns.

Real Estate Secondaries: Our real estate secondaries team has a track record of innovation through customized transaction solutions tailored to meet the needs of limited partners and general partners. As of December 31, 2023, our real estate secondaries team of more than 25 investment professionals managed $7.8 billion of AUM in approximately 30 funds and related co-investment vehicles. Our real estate secondaries team acquires interests across a range of partnership vehicles, including private real estate funds, multi-asset portfolios and single property joint ventures. Our team seeks broad diversification by property sector and geography and to drive investment results through underwriting, transaction structuring and portfolio construction.

Infrastructure Secondaries: Our infrastructure secondaries team has a strong track record of providing customized infrastructure transaction solutions tailored to meet the needs of limited partners and general partners. As of December 31, 2023, our infrastructure secondaries team of more than ten investment professionals managed $2.4 billion of AUM in ten funds and related co-investment vehicles. The infrastructure secondaries strategy seeks to accelerate the benefits of traditional infrastructure by providing diversified low risk exposure through preferred structure, traditional limited partnership and general partner led continuation vehicle transactions. Our team focuses on achieving diversification through building a portfolio that provides inflation protection and exposure to uncorrelated assets.

Credit Secondaries: Our credit secondaries strategy seeks to create a highly diversified portfolio of primarily senior secured private credit interests across North America and Europe, acquired directly or indirectly through secondary market
26

Table of Contents
transactions. As of December 31, 2023, our credit secondaries team of ten investment professionals managed $1.4 billion of AUM in four funds and related co-investment vehicles.

The following charts present the Secondaries Group’s AUM and FPAUM as of December 31, 2023by investment strategy ($ in billions):

AUM: $24.7FPAUM: $19.1
549756003328549756003329

Private Equity SecondariesReal Estate SecondariesInfrastructure SecondariesCredit
Secondaries
Other Businesses

Certain operating segments and growth opportunities have not reached the scale and magnitude to be presented individually; therefore, we present the results for these businesses collectively. These strategies seek to expand our reach in new global markets and include AIS and our SPACs.

Ares Insurance Solutions:AIS is Ares’ dedicated, in-house team that provides solutions to insurance clients including asset management, capital solutions and corporate development. AIS strives to provide insurers with attractive risk and capital adjusted return profiles that fit within regulatory, rating agency and other counterparty guidelines. Leveraging approximately 1,000 investment professionals across the firm’s investment groups, AIS creates tailored investment solutions that meet the unique objectives of our insurance clients. AIS is overseen by an experienced management team with direct insurance industry experience in many areas directly applicable to AIS and our insurance company clients. Members of the Ares team have previously held senior positions at leading insurers. AIS acts as the dedicated investment manager, capital solutions and corporate development partner to Aspida Life Insurance Company (“Aspida Life”) and Aspida Life Re Ltd. (“Aspida Re”). Aspida Life and Aspida Re are insurance companies that focus on the U.S. life and annuity insurance and reinsurance markets. AIS manages $12.5 billion of AUM as of December 31, 2023, of which $8.2 billion is sub-advised by Ares vehicles and included within other strategies.

Ares Acquisition Corporation: Ares Acquisition Corporation (formerly NYSE: AAC) (“AAC I”) was a SPAC sponsored by Ares and formed in 2020 for the purpose of effecting a merger, share exchange, asset acquisition, share purchase, reorganization or similar business combination. AAC I did not complete a business combination within the time period required by its amended and restated memorandum and articles of association, and in the fourth quarter of 2023, the remaining outstanding Class A ordinary shares of AAC I were redeemed in full and AAC I ceased all operations other than legal dissolution.

Ares Acquisition Corporation II: Ares Acquisition Corporation II (NYSE: AACT) (“AAC II”) is a SPAC sponsored by Ares and formed in 2021 for the purpose of effecting a merger, share exchange, asset acquisition, share purchase, reorganization or similar business combination. AAC II is seeking to pursue an initial business combination target in any industry or sector in North America, Europe or Asia.


27

Table of Contents
 AUM FPAUM 
Number of
Funds
U.S. Real Estate Equity$4.6
 $3.1
 21
E.U. Real Estate Equity2.7
 2.0
 19
Real Estate Debt2.9
 1.1
 2
Real Estate Group$10.2
 $6.2
 42
The following charts present Other Businesses AUM and FPAUM as of December 31, 2023by investment strategy ($ in billions):

AUM: $4.8FPAUM: $3.6
549756003364549756003365
InsuranceSPACs
Product Offering
To meet investors’ growing demand for alternative asset investments, we manage investments in an increasingly comprehensive range of funds across a spectrum of compelling and complementary strategies. We have demonstrated an ability to consistently generate attractive and differentiated investment returns across these investment strategies and through various market environments. We believe the breadth of our product offering, our expertise in various investment strategies and our proficiency in attracting and satisfying our growing institutional and retail client base has enabled and will continue to enable us to increase our assets under managementAUM across each of our investment groups in a balanced manner. Our fundraising efforts historically have been spread across investment strategies and have not been dependent on the success of any one strategy. We offer the following strategies for our investors:

Target Net Returns at December 2017(1)
Credit
Syndicated Loans(2)Benchmark Outperformance
High Yield Bonds(2)Benchmark Outperformance
Credit Opportunities8 - 12%
Structured Credit5 - 15%
U.S. Direct Lending5 - 15%
E.U. Direct Lending5 - 15%
Private Equity
Corporate Private Equity18 - 22%
U.S. Power & Energy Infrastructure10 - 15%
Special Situations15 - 20%
Real Estate
Real Estate Debt5 - 12%
Real Estate Equity12 - 18%

(1)Target returns are shown for illustrative purposes only after the effect of any management and performance fees. No assurance can be made that targeted returns will be achieved and actual returns may differ materially. An investment in any of the mandates is subject to the execution of definitive subscription and investment documentation for the applicable funds.
(2)Our funds employing syndicated loan and high yield strategies are typically benchmarked against the Credit Suisse Leveraged Loan Index and the ICE BofAML US High Yield Master II Constrained Index, respectively. Certain of our funds are not benchmarked against any particular index due to fund-specific portfolio constraints.

groups.
Investor Base and Fundraising


Our diverse investor base includes direct institutional relationships and a significant number of retail investors. Our high-quality institutional investor base includes largecorporate and public pension funds, insurance companies, sovereign wealth funds, banks, investment managers, endowments and insurance companies, and wefoundations. We have grown the number of these relationships from approximately 200over 900 in 20112018 to approximately 785over2,300 in 2017. 2023.

28

Table of Contents
As of December 31, 2017, approximately 66.9%2023, $328.5 billion, or 78% of our $106.4418.8 billion in of AUM, was attributable to our direct institutional relationships.
As of December 31, 2017,2023, our $106.4 billion oftotal AUM was divided by channel, and further our institutional direct AUM by client type and geographic origin as follows (dollars($ in millions)billions):
557945579555796
  December 31, 2017
AUM by Client Type AUM %
Direct Institutional          
Pension $30,320
 28.5%
Insurance 11,656
 10.9%
Sovereign Wealth Fund 9,732
 9.1%
Bank/Private Bank 8,596
 8.1%
Investment Manager 3,268
 3.1%
Endowment 1,660
 1.6%
Other 5,877
 5.6%
Total Direct Institutional 71,109
 66.9%
Public Entities and Related 22,278
 20.9%
Institutional Intermediaries 13,104
 12.2%
Total $106,491
 100%
Institutional DirectRetailInstitutional IntermediariesPensionInsuranceBankNorth AmericaEuropeAPAC
Sovereign Wealth FundHigh Net Worth and Private BankInvestment ManagerMiddle East & AfricaOther
Other
    

  December 31, 2017
Direct Institutional AUM by Geography AUM %
North America $43,014
 60.5%
Europe 13,219
 18.6%
Asia & Australia 8,975
 12.6%
Middle East 5,510
 7.7%
Other 391
 0.6%
Total $71,109
 100%
AsThe following chart presents the AUM of December 31, 2017, approximately 39% of our investors were committed to more than one fund, and approximately 35% were committed to between two and fiveof our funds an increase from 24% and 22%, respectively, from as of December 31, 2011. 2023 compared to December 31, 2018 ($ in billions):
Investors committed to funds v3.jpg

We believe that the growing numberAUM of multi-fund investors demonstrates our investors’ satisfaction with our performance, our disciplined management of their capital and our diverse product offering. Their loyalty has facilitated the growth of our existing businesses and we believe improves our ability to raise new funds and successor funds in existing strategies in the future.
Institutional investors are demonstrating a growingcontinue to demonstrate interest in separately managed accounts (“SMAs”),SMAs, which include contractual arrangements and single investor vehicles and funds, because these accounts can provide investors with greater levels of transparency, liquidity and control over their investments as compared to more traditional commingled funds. As such, we expect our AUM that is managed through SMAs to continue to grow over time. As of December 31, 2017, approximately $26.52023, $91.1 billion, or 37%28%, of our direct institutional AUM was managed through SMAs compared to $6.4 billion, or 27%, as of December 31, 2011.
SMAs. Our publicly traded entitiesretail vehicles and their affiliates, including ARCC, ACRE, ARDC, ASIF, APMF, CADC, AREIT and ARDC,AIREIT account for approximately 21%$53.8 billion, or 13%, of our AUM. We have over 600945 institutional investors and over 200,000hundreds of thousands of retail investor accounts across our three publicly tradedretail vehicles.
29

Table of Contents
We believe that client relationships are fundamental to our business and that our performance across our investment groups coupled with our focus on client service has resulted in strong relationships with our investors. Our dedicated and extensive in-house business developmentrelationship management team, comprised of approximately 85over 135 professionals located in North America, Europe, AsiaAPAC and Australia,the Middle East, is dedicated to raising capital globally across all of our funds, servicing existing fund investors and tailoring offerings to meet their needs, developing products to complement our existing offerings, and deepening existing relationships to expand them across our platform. We also have strategic initiatives focused on expanding our presence in Latin America and Australia. Our senior Relationship Managementrelationship management team maintains an active and transparent dialogue with an expansive list of investors. This team is supported by Product Managersproduct managers and Investor Relationsinvestor relations professionals with deep experience in each of our three complementary investment groups whothat are dedicated to servicing our existing and prospective investors.
Employees
We believe that one of the strengths and principal reasons for our success is the quality and dedication of our employees. We work to attract, develop and retain highly accomplished professionals across the firm. We believe that we employ individuals with a strong sense of commitmentIn addition to our firm. Asexpansive relationships with institutional investors, we have further diversified our investor base with our retail distribution channel. AWMS, our wholly owned subsidiary, facilitates the product development, distribution, marketing and client management activities for investment offerings in the global wealth management channel with over 125 professionals.

Operations Management Group
The OMG consists of December 31, 2017, we had over 1,000 employees, comprised of approximately 400 professionals inshared resource groups to support our investment groupsoperating segments by providing infrastructure and over 600 operations management professionals, in addition to administrative support located in over 15 officesthe areas of accounting/finance, operations, information technology, legal, compliance, human resources, strategy and relationship management and distribution. Our clients seek to partner with investment management firms that not only have compelling investment track records across four continents.multiple investment products but also possess seasoned infrastructure support functions. As such, significant investments have been made to develop the OMG. The OMG also includes AWMS. We have successfully launched new business lines, integrated acquired businesses into the operations and created scale within the OMG to support a much larger platform in the future.


30

Table of Contents
Organizational StructureOperations Management Group
The simplified diagram below (which omits certain intermediate holding companies) depictsOMG consists of shared resource groups to support our legal organizational structure. Ownership informationoperating segments by providing infrastructure and administrative support in the diagram below is presented asareas of December 31, 2017.accounting/finance, operations, information technology, legal, compliance, human resources, strategy and relationship management and distribution. Our clients seek to partner with investment management firms that not only have compelling investment track records across multiple investment products but also possess seasoned infrastructure support functions. As such, significant investments have been made to develop the OMG. The diagramOMG also depictsincludes AWMS. We have successfully launched new business lines, integrated acquired businesses into the tax classification election for Ares Management, L.P.operations and created scale within the OMG to be treated assupport a corporation for U.S. federal income tax purposes effective March 1, 2018.  All entities are organizedmuch larger platform in the statefuture.


30

Table of Delaware unless otherwise indicated. Ares Management, L.P. is a holding company and, either directly or through direct subsidiaries, is the general partner of each of the Ares Operating Group entities, and operates and controls the business and affairs of the Ares Operating Group. Ares Management, L.P. consolidates the financial results of the Ares Operating Group entities, their consolidated subsidiaries and certain consolidated funds.


(1)Ares Management, L.P. common shareholders have limited voting rights and have no right to remove our general partner or, except in the limited circumstances described below, elect the directors of our general partner. On those few matters that may be submitted for a vote of our common shareholders, Ares Voting LLC, an entity owned and controlled by Ares Partners Holdco LLC, which is in turn owned and controlled by the Holdco members, holds a special voting share that provides it with a number of votes, on any matter that may be submitted for a vote of our common shareholders, that is equal to the aggregate number of vested and unvested Ares Operating Group Units held directly or indirectly by the limited partners of the Ares Operating Group that do not directly hold a special voting share. See “Material Provisions of Ares Management, L.P. Partnership Agreement—Withdrawal or Removal of the General Partner,” “—Meetings; Voting” and “—Election of Directors of General Partner.”
(2)Assuming the full exchange of Ares Operating Group Units for our common shares, Ares Management, L.P. holds 100% of the Ares Operating Group and Ares Owners Holdings L.P., Alleghany, ADIA and the public hold 71.59%, 5.88%, 12.73% and 9.80%, respectively, of Ares Management, L.P.
(3)
Each Ares Operating Group entity has both common units and a series of preferred units with economic terms designed to mirror those of the Series A Preferred shares (“GP Mirror units”) outstanding.
(4)Alleghany is expected to exchange all of its Ares Operating Group Units for our common shares in 2018.
(5)As of December 31, 2017, Ares Management, L.P. was treated as a partnership for U.S. federal income tax purposes. Effective March 1, 2018, Ares Management, L.P. will be treated as a corporation for U.S. federal income tax purposes. Ares Management, L.P.'s legal structure will remain a Delaware limited partnership.
(6)The Ares Operating Group is comprised of Ares Holdings L.P., Ares Offshore Holdings L.P. and Ares Investments L.P.

Holding Company Structure
The Company has elected to be treated as a corporation for U.S. federal income tax purposes (the “Tax Election”) effective March 1, 2018. In connection with the Tax Election, we have amended and restated our partnership agreement to, among other things, reflect our new tax classification and change the name of our common units and preferred units to common shares and preferred shares, respectively. The terms of such common shares and preferred shares, and the associated rights, otherwise remain unchanged. See "Item 1A. Risk Factors – Our common shareholders do not elect our general partner or, except in limited circumstances, vote on our general partner's directors and have limited ability to influence decisions regarding our businesses."
Accordingly, Ares Management, L.P. and any direct subsidiaries of Ares Management, L.P. that are treated as corporations for U.S. federal income tax purposes and that are the holders of Ares Operating Group Units are (and, in the case of Ares Offshore Holdings, Ltd., may be) subject to U.S. federal, state and local income taxes in respect of their interests in the Ares Operating Group entities. Our legal structure will remain a Delaware limited partnership and the distribution provisions under our limited partnership agreement will remain unchanged. The Ares Operating Group entities are treated as partnerships for U.S. federal income tax purposes. An entity that is treated as a partnership for U.S. federal income tax purposes generally incurs no U.S. federal income tax liability at the entity level. Instead, each partner is required to take into account its allocable share of items of income, gain, loss, deduction and credit of the partnership in computing its U.S. federal, state and local income tax liability each taxable year, whether or not cash distributions are made.
Each of the Ares Operating Group entities has an identical number of partnership units outstanding. Ares Management, L.P. holds, directly or through direct subsidiaries, a number of Ares Operating Group Units equal to the number of common shares that Ares Management, L.P. has issued. The Ares Operating Group Units held by Ares Management, L.P. and its subsidiaries are economically identical in all respects to the Ares Operating Group Units that are not held by Ares Management, L.P. and its subsidiaries. Accordingly, Ares Management, L.P. receives the distributive share of income of the Ares Operating Group from its equity interest in the Ares Operating Group.
The Ares Operating Group Units and our common shares held directly or indirectly by our senior professional owners are generally subject to restrictions on transfer and other provisions. See “Item 11. Executive Compensation.”
Certain Corporate Governance Considerations
Voting Rights.  Unlike the holders of common stock in a corporation, our common shareholders have limited voting rights and have no right to remove our general partner or, except in the limited circumstances described below, elect the directors of our general partner. On those few matters that may be submitted for a vote of our common shareholders – certain amendments to our limited partnership agreement, mergers and consolidations and in the limited circumstances described below, election of the directors of our general partner – Ares Voting LLC, an entity wholly owned by Ares Partners Holdco LLC, which is in turn owned and controlled by the Holdco Members, holds a special voting share that provides it with a number of votes, on any matter that may be submitted for a vote of our common shareholders, that is equal to the aggregate number of Ares Operating Group Units held by the limited partners of the Ares Operating Group entities that do not hold a special voting share. We refer to our common shares (other than those held by any person whom our general partner may from time to time, with such person’s consent, designate as a non‑voting common shareholder) and our special voting shares as “voting shares.” Accordingly, on those few matters that may be submitted for a vote of our common shareholders, our public shareholders (other than ADIA) collectively have 9.79% of the voting power of Ares Management, L.P, and the Holdco Members, through Ares Owners Holdings L.P. and the special voting share held by Ares Voting LLC, have approximately 71.59% of the voting power of Ares Management, L.P. Our common shareholders’ voting rights are further restricted by the provision in our partnership agreement stating that any common shares held by a person that beneficially owns 20% or more of any class of our common shares then outstanding (other than our general partner, Ares Owners Holdings L.P., a member of Ares Partners Holdco LLC or their respective affiliates, a direct or subsequently approved transferee of our general partner or its affiliates or a person who acquired such common shares with the prior approval of our general partner) cannot vote on any matter.
Election of Directors. In general, our common shareholders have no right to elect the directors of our general partner. However, when the Holdco Members and other then‑current or former Ares personnel directly or indirectly hold less than 10% of the limited partner voting power, our common shareholders will have the right to vote in the election of the directors of our general partner. This voting power condition will be measured on January 31 of each year, and will be triggered if the total voting power held collectively by (i) holders of the special voting shares in Ares Management, L.P. (including our general partner, members of Ares Partners Holdco LLC and their respective affiliates), (ii) then‑current or former Ares personnel (including indirectly through related entities) and (iii) Ares Owners Holdings L.P. is less than 10% of the voting power of the outstanding voting shares of Ares Management, L.P. For purposes of determining whether the Ares control condition is satisfied, our general partner will treat as

outstanding, and as held by the foregoing persons, all voting shares deliverable to such persons pursuant to equity awards granted to such persons. Unless and until the foregoing voting power condition is satisfied, our general partner’s board of directors will be elected in accordance with its limited liability company agreement, which provides that directors generally may be appointed and removed by the member of our general partner, an entity owned and controlled by the Holdco Members. Unless and until the foregoing voting power condition is satisfied, the board of directors of our general partner has no authority other than that which its member chooses to delegate to it. In the event that the voting power condition is satisfied, the board of directors of our general partner will be responsible for the oversight of our business and operations.
Conflicts of Interest and Duties of Our General Partner.  Although our general partner does not engage in any business activities other than the management and operation of our businesses, conflicts of interest may arise in the future between us or our common shareholders, on the one hand, and our general partner or its affiliates or associates, on the other. The resolutions of these conflicts may not always be in our best interests or that of our common shareholders. In addition, we have fiduciary and contractual obligations to the investors in our funds and we expect to regularly take actions with respect to the purchase or sale of investments in our funds, the structuring of investment transactions for those funds or otherwise that are in the best interests of the investors in those funds but that might at the same time adversely affect our near term results of operations or cash flow.

Our partnership agreement limits the liability of, and reduces or eliminates the duties (including fiduciary duties) owed by, our general partner and its affiliates and associates to us and our common shareholders. Our partnership agreement also restricts the remedies available to common shareholders for actions that might otherwise constitute breaches of our general partner’s or its affiliates’ or associates’ duties (including fiduciary duties). Common shareholders are treated as having consented to the provisions set forth in our partnership agreement, including the provisions regarding conflicts of interest situations that, in the absence of such provisions, might be considered a breach of fiduciary or other duties under applicable state law.
Operations Management Group
The OMG consists of five independent, shared resource groups to support our reportableoperating segments by providing infrastructure and administrative support in the areas of accounting/finance, operations/operations, information technology, business development/corporatelegal, compliance, human resources, strategy legal/compliance and human resources.relationship management and distribution. Our clients seek to partner with investment management firms that not only have compelling investment track records across multiple investment products but also possess seasoned infrastructure support functions. As such, significant investments have been made to develop the OMG. The OMG also includes AWMS. We have successfully launched new business lines, integrated acquired businesses into the operations and created scale within the OMG to support a much larger platform in the future.


30

Table of Contents
Organizational Structure
The simplified diagram below (which omits certain intermediate holding companies) depicts our legal organizational structure. Ownership information in the diagram below is presented as of December 31, 2023. Ares Management Corporation (“AMC”) is a holding company and through subsidiaries is the general partner of the Ares Operating Group entity and operates and controls the business and affairs of the Ares Operating Group. AMC consolidates the financial results of the Ares Operating Group, its consolidated subsidiaries and certain consolidated funds.
Organization structure.jpg
(1)Assuming the full exchange of AOG Units for shares of our Class A common stock, as of December 31, 2023, Ares Owners Holdings L.P. would hold 42.36%, Sumitomo Mitsui Banking Corporation (“SMBC”) would hold 5.48% and the public would hold 52.16% of AMC. Inclusive of Class A common stock held directly by Ares employees and assuming the full exchange of AOG Units for shares of our Class A common stock, Ares employee ownership would represent 45.90% of all outstanding shares.

31

Table of Contents
Holding Company Structure

Our common stockholders are entitled to vote on all matters on which stockholders of a corporation are generally entitled to vote under the Delaware General Corporation Law (the “DGCL”), including the election of our board of directors. Holders of shares of our Class A common stock are entitled to one vote per share of our Class A common stock. On any date on which the Ares Ownership Condition (as defined in the Certificate of Incorporation) is satisfied, holders of shares of our Class B common stock are, in the aggregate, entitled to a number of votes equal to (x) four times the aggregate number of votes attributable to our Class A common stock minus (y) the aggregate number of votes attributable to our Class C common stock. On any date on which the Ares Ownership Condition is not satisfied, holders of shares of our Class B common stock are not entitled to vote on any matter submitted to a vote of our stockholders. The holder of shares of our Class C common stock is generally entitled to a number of votes equal to the number of AOG Units (as defined in the Certificate of Incorporation) held of record by each Ares Operating Group Limited Partner (as defined in the Certificate of Incorporation) other than the Company and its subsidiaries. Ares Management GP LLC is the sole holder of shares of our Class B common stock and Ares Voting LLC is the sole holder of shares of our Class C common stock. Our Class B common stock and our Class C common stock are non-economic and holders thereof shall not be entitled to: (i) dividends from the Company or (ii) receive any assets of the Company in the event of any dissolution, liquidation or winding up of the Company.Ares Management GP LLC and Ares Voting LLC are both wholly owned by Ares Partners Holdco LLC. As a result, the Company is a “controlled company” within the meaning of the corporate governance standards of the New York Stock Exchange (“NYSE”) and qualifies for exceptions from certain corporate governance rules of the NYSE. The Company also has non-voting common stock solely held by SMBC, which has the same economic rights as the Class A common stock.
Accordingly, AMC and any direct subsidiaries of AMC that are treated as corporations for U.S. federal income tax purposes and that are the holders of AOG Units are subject to U.S. federal, state and local income taxes in respect of their interests in the Ares Operating Group. The Ares Operating Group entity is treated as a partnership for U.S. federal income tax purposes. An entity that is treated as a partnership for U.S. federal income tax purposes generally incurs no U.S. federal income tax liability at the entity level. Instead, each partner is required to take into account its allocable share of items of income, gain, loss, deduction and credit of the partnership in computing its U.S. federal, state and local income tax liability each taxable year, whether or not cash distributions are made.
AMC holds through subsidiaries a number of AOG Units equal to the number of shares of Class A common stock that AMC has issued. The AOG Units held by AMC and its subsidiaries are economically identical in all respects to the AOG Units that are not held by AMC and its subsidiaries. Accordingly, AMC receives the distributive share of income of the Ares Operating Group from its equity interest in the Ares Operating Group.

Structure and Operation of our Funds
We conduct the management of our funds and other similar private vehicles primarily through organizing a limited partnership or other limited liability structure in which entities organized by us accept commitments and/or funds for investment from institutional investors and (to a limited extent) high net worth individuals.other investors. Such commitments are generally drawn down from investors on an as needed basis to fund investments over a specified term. Our Credit Group funds also include hedge funds or structured funds in which the investor’s capital is fully funded into the fund upon or soon after the subscription for interests in the fund. The CLOs that we manage are structured investment vehicles that are generally private companies with limited liability.liability companies. Our drawdown funds and hedge funds are generally organized as limited partnerships or limited liability companies. However, there are non‑U.S.non-U.S. funds that are structured as corporate or non‑partnershipnon-partnership entities under applicable law. We also advise a number of investors through SMA relationships structured as contractual arrangements or single investor vehicles. In the case of our SMAs that are not structured as single investor vehicles, the investor, rather than us, generally controls custody of the investments with respect to which we advise. ThreeWe also manage closed-end interval funds (APMF and CADC) that allow for periodic redemptions of the vehicles that we manage are publicly traded corporations. The publicly tradedvarious share classes, four publicly-traded corporations (AAC II, ACRE, ARCC and ARDC), two non-traded REITs (AIREIT and AREIT) and a non-traded BDC (ASIF). ACRE, ARDC and ARCC do not have redemption provisions or a requirement to return capital to investors upon exiting the investments made with such capital, except as required by applicable law (including distribution requirements that must be met to maintain RICregulated investment company (“RIC”) or REIT status). However, ACRE’s charter includes certain limitations relating to the ownership or purported transfer of its common stock in violation of the REIT ownership requirements. In addition, Class A ordinary shares issued by AAC II are redeemable for cash by the public shareholders in the event that AAC II does not complete a business combination or tender offer associated with stockholder approval provisions.

Our funds are generally advised by Ares Management LLC, which is registered under the Investment Advisers Act of 1940, as amended (the "Investment“Investment Advisers Act"Act”) or, a wholly owned subsidiary thereof.thereof or subsidiary controlled by AMC. Responsibility for the day‑to‑dayday-to-day operations of each investment vehicle is typically delegated to the Ares entity serving as investment adviser pursuant to an investment advisory, (or similar)management or similar agreement. Generally, the material terms of our
32

Table of Contents
investment advisory agreements relate to the scope of services to be rendered by the investment adviser to the applicable vehicle, the calculation of management fees to be borne by investors in our investment vehicles and certain rights of termination with respect to our investment advisory agreements. With the exception of certain of the publicly traded corporations,publicly-traded investment vehicles, the investment vehicles themselves do not generally register as investment companies under the Investment Company Act of 1940, as amended (the “Investment Company Act”), in reliance on applicable exemptions thereunder.

The investment management agreements we enter into with clients in connection with contractual SMAs may generally be terminated by such clients with reasonably short prior written notice. Our investment management agreement with ARCC generally must be approved annually by such company’s board of directors (including a majority of such company’s independent directors). In addition to other termination provisions, each investment advisory and management agreement will automatically terminate in the event of its assignment and may be terminated by either party without penalty upon 60 days’ written notice to the other party.
The governing agreements of many of our funds provide that, subject to certain conditions, third‑partythird-party investors in those funds have the right to terminate the investment period or the fund without cause. The governing agreements of some of our funds provide that, subject to certain conditions, third‑partythird-party investors have the right to remove the general partner. In addition, the governing agreements of certain of our funds provide that upon the occurrence of certain events, including in the event that certain “key persons” in our funds do not meet specified time commitments, the investment period will be suspended or the investors have the right to vote to terminate the investment period in accordance with specified procedures. Such events may include certain “key persons” in our funds that engage in bad acts or depart the firm.

Fee Structure
Management Fees
The investment adviser of each of our funds and certain separately managed accounts generally receives an annual management fee based upon a percentage of the fund’s capital commitments, contributed capital, net assets value or invested capital during the investment period and the fund’s invested capital after the investment period, except for the investment advisers to certain of our hedge funds and separately managed accounts receive an annual management fee that is based upon a percentage of invested capital, contributed capital or net asset value throughout the term of the fund or separately managed account. From time to time we also may receive special fees, including commitment, arrangement, underwriting, agency, portfolio management, monitoring and other similar fees, some of which may be accelerated upon a sale of the underlying portfolio investment. In certain circumstances we are contractually required to offset certain amounts of such special fees against future management fees relating to the applicable fund. In addition, we may receive transaction fees from certain affiliated funds for activities related to fund transactions, such as loan originations. These fees are either recognized as other revenue in the period the transaction related services are rendered or amortized over the life of the investment.
The investment adviser of each of our CLOs typically receives annual management fees based upon a percentage of each CLO's total assets, subject to certain performance measures related to the underlying assets the vehicle owns, and additional management fees which are incentive‑based (that is, subject to meeting certain return criteria). We also classify the ARCC Part I Fees as management fees due to their predictability and frequency of payments without risk of contingent repayment. See “Item 7. Management’s Discussion and Analysis of Financial Condition and Results of Operations—Components of Consolidated Results of Operations—Revenues.”
The management fees we receive from our drawdown style funds are typically payable on a quarterly basis over the life of the fund and do not depend on the investment performance of the fund (other than to reflect the disposition or decrease in value of assets where the management fees are based on invested capital). The management fees we receive from our hedge funds have similar characteristics, except that such funds often afford investors increased liquidity through annual, semi‑annual or quarterly withdrawal or redemption rights following the expiration of a specified period of time when capital may not be withdrawn and the amount of management fees to which the investment adviser is entitled with respect thereto will proportionately increase as the net asset value of each investor’s capital account grows and will proportionately decrease as the net asset value of each investor’s capital account decreases. The management fees we receive from our SMAs are generally paid on a periodic basis (typically quarterly, subject to the termination rights described above) and may alternatively be based on invested capital or proportionately increase or decrease based on the net asset value of the separately managed account.
We also receive management fees in accordance with the investment advisory and management agreements we have with the publicly traded vehicles we manage. Base management fees we receive from ARCC are paid quarterly and proportionately increase or decrease based on ARCC’s total assets (other than cash and cash equivalents). ARCC Part I Fees are also generally paid quarterly and proportionately increase or decrease based on ARCC’s net investment income (before ARCC Part I Fees and ARCC Part II Fees (as defined in “Item 7. Management’s Discussion and Analysis of Financial Condition and Results of Operations—Components of Consolidated Results of Operations—Revenues”)), subject to a fixed hurdle rate. Management fees we receive from ARDC are generally paid on a regular basis (typically monthly) and proportionately increase or decrease based on the closed‑end funds’ total assets minus such funds’ liabilities (other than liabilities relating to indebtedness). Management fees we receive from ACRE are generally paid on a quarterly basis and proportionately increase or decrease based on ACRE’s stockholders’ equity (as calculated pursuant to the ACRE management agreement).

Performance Fees
We may also receive performance fees from a majorityOperations” for an overview of our funds, which may be either anfee structure, including management fee, incentive fee or a special allocation of income, which we refer to as aand carried interest in the event that specified investment returns are achieved by the fund. We may, and do in certain cases, award our senior professionals with participation in such performance fees.
Incentive Fees
The general partners or similar entities of certain of our funds receive performance‑based allocation fees ranging from 10% to 20% of the applicable fund’s net capital appreciation per annum, subject to certain net loss carry‑forward provisions (known as a “high‑watermark”). In some cases, the investment adviser of each of our hedge funds and certain SMAs is entitled to an incentive fee generally up to 20% of the applicable fund’s net appreciation per annum, subject to a high‑watermark and in some cases a preferred return. Realized incentive fees are generally higher during the second half of the year due to the nature of certain Credit Group funds that typically realize incentive fees annually. Once realized, the fees earned by our hedge funds generally are not subject to a contingent repayment obligation. Incentive fees are realized at the end of a measurement period, typically quarterly or annually.
Incentive Fees from Publicly TradedVehicles
We also are entitled to receive incentive fees in accordance with the investment advisory and management agreements we have with ARCC and ACRE. We may receive ARCC Part II Fees, which are calculated at the end of each applicable year by subtracting (a) the sum of ARCC’s cumulative aggregate realized capital losses and aggregate unrealized capital depreciation from (b) its cumulative aggregate realized capital gains, in each case calculated from October 8, 2004. Incentive fees we receive from ACRE are based on a percentage of the difference between ACRE’s core earnings (as defined in ACRE’s management agreement) and an amount derived from the weighted average issue price per share of ACRE’s common stock in its public offerings multiplied by the weighted average number of shares of common stock outstanding. We are not entitled to receive incentive fees from ARDC.
Carried Interest
The general partner or an affiliate of certain of our funds may be entitled to receive carried interest from a fund. Carried interest entitles the general partner (or an affiliate) to a special allocation of income and gains from a fund, and is typically structured as a net profits interest in the applicable fund. Carried interest is generally calculated on a “realized gain” basis, and the general partner of a fund is generally entitled to a carried interest between 10% and 20% of the net realized income and gains (generally taking into account unrealized losses) generated by such fund. Net realized income or loss is not netted between or among funds.
For most funds, the carried interest is subject to a preferred return ranging from 5% to 8%, subject in most cases to a catch‑up allocation to the general partner. Generally, if at the termination of a fund (and in some cases at interim points in the life of a fund), the fund has not achieved investment returns that generally exceed the preferred return threshold or the general partner receives net profits over the life of the fund in excess of its allocable share under the applicable partnership agreement, the general partner will be obligated to repay an amount equal to the extent to which performance fees that were previously distributed to it exceeds the amounts to which the general partner is ultimately entitled. These repayment obligations may be related to amounts previously distributed to us and our senior professionals and are generally referred to as contingent repayment obligations.
Although a portion of any distributions by us to our common shareholders may include carried interest received by us, we do not intend to seek fulfillment of any contingent repayment obligation by seeking to have our common shareholders return any portion of such distributions attributable to carried interest associated with any contingent repayment obligation. Contingent repayment obligations operate with respect to a given fund’s own net investment performance only and performance fees of other funds are not netted for determining this contingent obligation. Although a contingent repayment obligation is several to each person who received a distribution, and not a joint obligation, the governing agreements of our funds generally provide that, if a recipient does not fund his or her respective share, we may have to fund such additional amounts beyond the amount of performance fees we retained, although we generally will retain the right to pursue remedies against those performance fee recipients who fail to fund their obligations.
For additional information concerning the contingent repayment obligations we could face, see “Item 1A. Risk Factors—We may need to pay these contingent obligations if and when they are triggered under the governing agreementsarrangements with our investors.”funds.

Capital Invested In and Through Our Funds

To further align our interests with those of investors in our funds, we have invested the firm’s capital and that of our professionals in the funds we sponsor and manage. General partner capital commitments to our funds are determined separately with respect to our funds and, generally, are less than 5% of the total commitments of any particular fund. We determine the general partner capital commitments based on a variety of factors, including regulatory requirements, investor requirements, estimates regarding liquidity over the estimated time period during which commitments will be funded, estimates regarding the amounts of

capital that may be appropriate for other opportunities or other funds we may be in the process of raising or are considering raising, prevailing industry standards with respect to sponsor commitments and our general working capital requirements. We may from time to time offer to our senior professionals a part of the general partner commitments to our funds. Our general partner capital commitments are typically funded with cash and not with carried interest or deferral of management fees. We generally offer a portion of the general partner commitments to our eligible professionals in accordance with the Investment Company Act. Ares employees had capital commitments of $2.4 billion in Ares-managed funds as of December 31, 2023. For more information, see “Item 7. Management’s Discussion and Analysis of Financial Condition and Results of Operations—Liquidity and Capital Resources—Sources and Uses of Liquidity.”

Regulatory and Compliance Matters

Our businesses, as well as the financial services industry, generally are subject to extensive regulation, including periodic examinations, by governmental agencies and self‑regulatoryself-regulatory organizations or exchanges in the U.S. and foreign jurisdictions in which we operate relating to, among other things, antitrust laws, anti‑moneyanti-money laundering laws, anti‑briberyanti-bribery laws relating to foreign officials, tax laws and data privacy laws with respect to client and other information, and some of our funds invest in businesses that operate in highly regulated industries. Each of the regulatory bodies with jurisdiction over us has regulatory powers dealing with many aspects of financial services, including the authority to grant, and in specific circumstances to cancel, permissions to carry on particular activities. Any failure to comply with these rules and regulations could expose us to liability and/or reputational damage. In addition, additionalAdditional legislation, increasing global regulatory oversight of fundraising activities, changes in rules promulgated by self‑regulatoryself-regulatory organizations or exchanges or changes in the laws or rules, or interpretation or enforcement of existing laws and rules, either in the United StatesU.S. or elsewhere, may directly affect our mode of operation and profitability. See “Item 1A. Risk Factors-RisksFactors—Risks Related to Our Businesses-Extensive regulation in the United States affects our activities and creates the potential for significant liabilities and penalties that could adversely affect our businesses and results of operations,” “-Failure to comply with “pay to play” regulations implemented by the SEC, FINRA and certain states, and changes to the “pay to play” regulatory regimes, could adversely affect our businesses,” “-Regulatory changes and other developments in the United States and regulatory compliance failures could adversely affect our reputation, businesses and operations” and “-Regulatory changes in jurisdictions outside the United States could adversely affect our businesses.Regulation.
Rigorous legal and compliance analysis of our businesses and investments is important to our culture. We strive to maintain a culture of compliance through the use of policies and procedures such as oversight compliance, codes of ethics, compliance systems, communication of compliance guidance and employee education and training. All employees must annually certify their understanding of, compliance with and adherence to key global Ares policies, procedures and code of ethics. We havemaintain a compliance group, supervised by our Chief Compliance Officer, that monitorsis responsible for monitoring our compliance with the regulatory and legal requirements to which we are subject and managesmanaging our compliance policies and procedures. Our Chief Compliance Officer, together with our Chief Legal Officer, supervises our compliance group, which is responsible for monitoring all regulatory and compliance matters that affect our activities. Our compliance policies and procedures seek to address a variety of regulatory and compliance risks such as the handling of material non‑publicnon-public information, position reporting, personal securities trading, valuation of investments on a fund‑specificfund-specific basis, document retention, potential conflicts of interest and the allocation of investment opportunities.
33

Table of Contents
Many jurisdictions in which we operate have laws and regulations relating to data privacy, cybersecurity and protection of personal information, including the General Data Protection Regulation (“GDPR”), a European Union (“EU”) regulation designed to protect privacy rights of individuals residing in the European Economic Area (the “EEA”), the GDPR as it forms part of the laws of England and Wales, Scotland and Northern Ireland by virtue of Section 3 of the European Union Withdrawal Act 2018 (as amended) and the Data Protection Act 2018 (collectively, “U.K. GDPR”) with respect to individuals residing in the United StatesKingdom (the “U.K.”), and various state and federal privacy laws applicable to individuals residing in the U.S., including the California Consumer Privacy Act (the “CCPA”), as amended by the California Privacy Rights Act. Other comprehensive privacy laws have been enacted or passed in numerous U.S. states, including Colorado, Connecticut, Delaware, Indiana, Iowa, Montana, New Jersey, Oregon, Tennessee, Texas, Utah and Virginia. Various global privacy laws also apply to our business, including those in Australia, the Cayman Islands, Hong Kong, India, Korea, Japan, Dubai and Singapore. These privacy laws are quickly evolving and may conflict with one another. Any failure to comply with such laws or regulations could result in substantial fines, penalties and/or sanctions, litigation, as well as reputational harm. Moreover, to the extent that these laws and regulations or the enforcement of the same become more stringent, or if new laws or regulations or enacted, our financial performance or plans for growth may be adversely impacted.

U.S.

The SEC oversees the activities of our subsidiaries that are registered investment advisers under the Investment Advisers Act. The Financial Industry Regulatory Authority (“FINRA”) overseesand the SEC oversee the activities of our subsidiarywholly owned subsidiaries, AWMS and Ares Management Capital Markets LLC (formerly known as Ares Investor Services LLC ("AIS"LLC) (“AMCM”), as a registered broker‑dealer. In connection with certain investments made by funds in our Private Equity Group, certain of our subsidiaries and funds are subject to audits by the Defense Security Service to determine whether we are under foreign ownership, control or influence.broker-dealers. In addition, we regularly rely on exemptions from various requirements of the Securities Act, of 1933, as amended (the “Securities Act”),  the Securities Exchange Act, of 1934, as amended (the “Exchange Act”), the Investment Company Act, the Commodity Exchange Act and ERISA.the U.S. Employee Retirement Income Security Act of 1974, as amended (“ERISA”). These exemptions are sometimes highly complex and may in certain circumstances depend on compliance by third parties who we do not control.
Additionally, the SEC and various self-regulatory organizations have in recent years increased their regulatory activities in respect of investment management firms. See “Item 1A. Risk Factors—Risks Related to Regulation—Extensive regulation affects our activities, increases the cost of doing business and creates the potential for significant liabilities and penalties that could adversely affect our businesses and results of operations.” Since September 2019, the SEC has required broker-dealers, or natural persons who are associated persons of broker-dealers, to act in the best interest of a retail customer when making a recommendation of any securities transaction or investment strategy involving securities, without placing the financial or other interest of the broker, dealer or natural person who is an associated person of a broker-dealer making the recommendation ahead of the interest of the retail customer (“Regulation Best Interest”). Regulation Best Interest requires broker-dealers to evaluate available alternatives, including those that may have lower expenses and/or lower investment risk than our investment funds. The term “retail customer” is defined as a natural person who uses such a recommendation primarily for personal, family or household purposes, without reference to investor sophistication or net worth. The “best interest” standard is satisfied through compliance with certain disclosure, duty of care, conflict of interest mitigation and compliance obligations. Under Regulation Best Interest, high cost, high risk and complex products may be subject to greater scrutiny by broker-dealers and their salespersons. The full impact of Regulation Best Interest and state fiduciary standards on broker-dealers cannot be determined at this time. However, it may negatively impact whether broker-dealers and their associated persons are willing to recommend investment products, including our funds, to retail customers, which may adversely impact our ability to distribute our products to certain investors. As such, Regulation Best Interest may reduce the ability of our funds to raise capital, which would adversely affect our business and results of operations. In addition, the U.S. Department of Labor as well as several states have proposed regulations or taken other actions pertaining to conduct standards for investment advisers and broker-dealers that may result in additional regulatory requirements related to our business.

Funds and Portfolio Companies of our Funds

All of our funds are advised by SEC registered investment advisers that are registered with the SEC (or wholly owned subsidiaries thereof). Registered investment advisers are subject to more stringent requirements and regulations under the Investment Advisers Act than unregistered investment advisers. Such requirements relate to, among other things, fiduciary duties to clients, maintaining an effective compliance program, managing conflicts of interest and general anti‑fraudanti-fraud prohibitions. In addition, the SEC requires investment advisers registered or required to register with the SEC under the Investment Advisers Act that advise one or more private funds and have at least $150 million in private fund assets under management to periodically file reports on Form PF. We have filed, and will continue to file, quarterly reports on Form PF.PF, which has resulted in increased administrative costs and a significant amount of attention and time to be spent by our personnel. The SEC adopted changes to Form PF in 2023, which, among other requirements, requires current reporting upon the occurrence of certain fund-level events. In 2024, the SEC and the Commodity Futures Trading Commission (the “CFTC”) adopted joint amendments to Form PF that will require additional basic information about advisers and the private funds they advise, including identifying information, assets under management,
34

Table of Contents
withdrawal and redemption rights, gross asset value and net asset value, inflows and outflows, base currency, borrowings and types of creditors, fair value hierarchy, beneficial ownership and fund performance, as well as additional specific information regarding funds that must report as hedge funds on the form. These amendments will likely increase related administrative costs and burdens.
ARCC is aand ASIF are registered investment companycompanies that hashave each elected to be treated as a business development company under the Investment Company Act. APMF, ARDC and certain other fundsCADC are registered investment companies under the Investment Company Act. Each of the registered investment companies has elected, for U.S. federal tax purposes, to be treated as a regulated investment companyRIC under Subchapter M of the U.S. Internal Revenue Code of 1986, as amended (the “Code”). As such, each registered investment company is requiredTo maintain its RIC status under the Code, a RIC must timely distribute an amount equal to distribute at least 90% of its ordinaryinvestment company taxable income and realized,(as defined by the Code, which generally includes net short‑term capital gains in excess of realized net long‑term capital losses, if any, to its shareholders. In addition, to avoid excise tax, each registered investment

company is required to distribute at least 98% of its income (such income to include both ordinary income and net capital gains), which would take into account short‑term and long‑short term capital gains and losses. Each registered investment company, at each ofgains) to its discretions, may carry forward taxable income in excess of calendar year distributions andstockholders. In addition, a RIC generally will be required to pay an excise tax equal to 4% on this income.certain undistributed taxable income unless it distributes in a timely manner an amount at least equal to the sum of: (i) 98% of its ordinary income recognized during a calendar year; (ii) 98.2% of its capital gain net income, as defined by the Code, recognized during the one-year period ending on October 31 of the calendar year; and (iii) any income recognized, but not distributed, in preceding years. The taxable income on which a RIC pays excise tax is generally distributed to its stockholders in the next tax year. Depending on the level of taxable income earned in a tax year, a RIC may choose to carry forward such taxable income for distribution in the following year, and pay any applicable excise tax. In addition, as a business development company,companies, ARCC and ASIF must not acquire any assets other than “qualifying assets” specified in the Investment Company Act unless, at the time the acquisition is made, at least 70% of ARCC’sARCC and ASIF’s respective total assets are qualifying assets (with certain limited exceptions). Qualifying assets include investments in “eligible portfolio companies.” ARCC and ASIF are also generally prohibited from issuing and selling its common stock at a price below net asset value per share and from incurring indebtedness (including for this purpose, preferred stock), if ARCC and ASIF’s respective asset coverage, as calculated pursuant to the Investment Company Act, equals less than 150% after such incurrence.
ACRE, hasAREIT and AIREIT have each elected and qualified to be taxed as a real estate investment trust, or REIT, under the Code. To maintain its qualification as a REIT, ACREeach must distribute at least 90% of its taxable income to its shareholdersstockholders and meet, on a continuing basis, certain other complex requirements under the Code.
AIS,AWMS and AMCM, our wholly owned subsidiary, issubsidiaries, are registered as a broker‑dealerbroker-dealers with the SEC, maintain licenses in many states, and is a memberare members of FINRA. As a broker‑dealer, thisbroker-dealer, each subsidiary is subject to regulation and oversight by the SEC and state securities regulators. In addition, FINRA a self‑regulatory organization that is subject to oversight by the SEC, promulgates and enforces rules governing the conduct of, and examines the activities of, its member firms. Due to the limited authority granted to each of our subsidiarysubsidiaries in its capacity as a broker‑dealer, it isbroker-dealers, they are not required to comply with certain regulations covering trade practices among broker‑dealersbroker-dealers and the use and safekeeping of customers’ funds and securities. As a registered broker‑dealerbroker-dealers and membermembers of a self‑regulatoryself-regulatory organization, AIS is,AWMS and AMCM are, however, subject to the SEC’s uniform net capital rule. Rule 15c3‑115c3-1 of the Exchange Act, which specifies the minimum level of net capital a broker‑dealerbroker-dealer must maintain and also requires that a significant part of a broker‑dealer’sbroker-dealer’s assets be kept in relatively liquid form.
The SEC See “Item 1A. Risk Factors—Risks Related to Our Businesses—Political and various self‑regulatory organizations haveconditions, including the effects of negative publicity surrounding the financial industry in recent years increased their regulatory activities in respect of investment management firms. In July 2010, the Dodd‑Frank Wall Street Reformgeneral and Consumer Protection Act (the “Dodd‑Frank Act”) was signed into law and has imposed significant regulations on nearly every aspect of the U.S. financial services industry.
In October 2011, the Federal Reserve and other federal regulatory agencies issued a proposed rule implementing a section of the Dodd‑Frank Act that has become known as the “Volcker Rule.” The Volcker Rule generally prohibits insured banks or thrifts, any bank holding company or savings and loan holding company, any non‑U.S. bank with a U.S. branch, agency or commercial lending company and any subsidiaries and affiliates of such entities, regardless of geographic location, from investing in or sponsoring “covered funds,” which include private equity funds or hedge funds. The final Volcker Rule became effective on April 1, 2014, and , except with respect to certain foreign banking entities, the conformance period ended on July 21, 2017. It contains exemptions for certain “permitted activities” that would enable certain institutions subject to the Volcker Rule to continue investing in covered funds under certain conditions.
In 2013, the Office of the Comptroller of the Currency, the Department of the Treasury, the Board of Governors of the Federal Reserve System and the Federal Deposit Insurance Corporation published revised guidance regarding expectations for banks’ leveraged lending activities. This guidance, in addition to the Dodd‑Frank Act risk retention rules approved in October 2014,legislation, could further restrict credit availability, as well as potentially restrict the activities of certain funds who invest in broadly syndicated loans in our Credit Group, which supports many of its portfolio investments from banks’ lending activities.
Pursuant to the Dodd-Frank Act, regulation of the derivatives market is bifurcated between the U.S. Commodities Futures Trading Commission (the “CFTC”) and the SEC. Under the Dodd‑Frank Act, the CFTC has jurisdiction over swaps and the SEC has jurisdiction over security‑based swaps. As part of its Dodd-Frank Act related rule‑making process, the CFTC made changes to its rules with respect to the registration and oversight of commodity pool operators (“CPOs”). Such rules require that an entity that is a CPO must register with the CFTC unless an exemption from registration is available. Previously, the CPO registration rules had applied to the operator of a fund invested in “commodity interests,” meaning that the fund entered into futures or options with respect to commodities. As a result of the CFTC’s revisions to these rules, all swaps (other than security‑based swaps) are now included in the definition of commodity interests. As a result, funds that utilize swaps (whether or not related to a commodity) as part of their business model may fall within the statutory definition of a commodity pool. If a fund qualifies as a commodity pool, then, absent an available exemption, the operator of such a fund is required to register with the CFTC as a CPO. Registration with the CFTC renders such CPO subject to regulation, including with respect to disclosure, reporting, recordkeeping and business conduct.
Certain of our funds may from time to time, directly or indirectly, invest in instruments that meet the definition of a “swap” under the Commodity Exchange Act and the CFTC’s rules promulgated thereunder. As a result, such funds may qualify as commodity pools, and the operators of such funds may need to register as CPOs unless an exemption applies such as the so-called “de minimis” exemption, codified in CFTC rule 4.13(a)(3). If any of our funds cease to qualify for this (or another applicable) exemption, certain Ares entities associated with and/or affiliated with those funds will be required to register with the CFTC as commodity pool operators.

The Dodd‑Frank Act requires the CFTC, the SEC and other regulatory authorities to promulgate certain rules relating to the regulation of the derivatives market. Such rules require or will require the registration of certain market participants, the clearing of certain derivatives contracts through central counterparties, the execution of certain derivatives contracts on electronic platforms, as well as reporting and recordkeeping. The Dodd-Frank Act also provides expanded enforcement authority to the CFTC and SEC. While certain rules have been promulgated and are already in effect, the rulemaking and implementation process is still ongoing. In particular, the CFTC has finalized most of its rules under the Dodd‑Frank Act, and the SEC has proposed a number of rules regarding security‑based swaps but has only finalized some of these rules. We cannot therefore yet predict the ultimate effect of the rules and regulations on our business.
Under CFTC and SEC rules, an entity may be required to register as a major swap participant (“MSP”) or major security-based swap participant (“MSBSP”) if it has substantial swaps or security-based swaps positions or has substantial counterparty exposure from its swaps or security-based swaps positions. If any of our funds were required to register as an MSP or MSBSP, it could make compliance more expensive, affect the manner in which we conduct our businesses and adversely affect our profitability. Additionally, if any of our funds qualify as “special entities” under CFTC rules, it could make it more difficult for them to enter into derivatives transactions or make such transactions more expensive.businesses.”
The CFTC has issued final rules imposing reporting and recordkeeping requirements on swaps market participants. Such rules are currently effective and could significantly increase operating costs. These additional recordkeeping and reporting requirements may require additional compliance resources and may also have a negative effect on market liquidity, which could negatively impact commodity prices and our ability to hedge our price risks.
Pursuant to rules finalized by the CFTC in December 2012 and September 2016, certain classes of interest rate swaps and certain classes of credit default swaps are subject to mandatory clearing, unless an exemption applies. Many of these swaps are also subject to mandatory trading on designated contract markets or swap execution facilities. At this time, the CFTC has not proposed any rules designating other classes of swaps for mandatory clearing, but it may do so in the future. Mandatory clearing and trade execution requirements may change the cost and availability of the swaps that we use, and exposes us to the credit risk of the clearing house through which any cleared swap is cleared. In addition, federal bank regulatory authorities and the CFTC have adopted initial and variation margin requirements for swap dealers, security-based swap dealers, MSPs and MSBSPs (“swap entities”), including permissible forms of margin, custodial arrangements and documentation requirements, for uncleared swaps and security-based swaps. As a result, swap entities will be required to collect margin for transactions and positions in uncleared swaps and security-based swaps by financial end users. The new rules became effective for end users on March 1, 2017. The CFTC’s Division of Swap Dealer and Intermediary Oversight subsequently extended, until September 1, 2017, the time to comply with the variation margin requirements for swaps that are subject to a March 1, 2017 compliance date. The effect of the regulations on us is not fully known at this time. However, these rules may increase the cost of our activity in uncleared swaps and security-based swaps to the extent we are determined to be a financial end user.
 In December 2016, the CFTC reproposed rules that would set federal position limits for certain core physical commodity futures, options and swap contracts (“referenced contracts”), and issued final rules on aggregation among entities under common ownership or control, unless an exemption applies, for position limits on certain futures and options contracts that would apply to the proposed position limits on referenced contracts. It is possible that the CFTC could propose to expand such requirements to other types of contracts in the future. The proposal could affect our ability and the ability for our funds to enter into derivatives transactions if and when the CFTC’s position limits rules become effective.
The CFTC has finalized regulations requiring collateral used to margin cleared swaps to be segregated in a manner different from that applicable to the futures market and has finalized other rules allowing parties to an uncleared swap to require that any collateral posted as initial margin be segregated with a third party custodian. Collateral segregation may impose greater costs on us when entering into swaps.
Finally, the Dodd‑Frank Act gave the CFTC expanded anti‑fraud and anti‑manipulation authority, including authority over disruptive trading practices and insider trading. Several investigations have commenced in the United States related to manipulation of the foreign exchange, LIBOR and indices markets. It is possible that new standards will emerge from these proceedings that could impact the way that we trade.
The Dodd‑Frank Act authorizes federal regulatory agencies to review and, in certain cases, prohibit compensation arrangements at financial institutions that give employees incentives to engage in conduct deemed to encourage inappropriate risk‑taking by covered financial institutions. In 2016, federal bank regulatory authorities and the SEC revised and re-proposed a rule that generally (1) prohibits incentive-based payment arrangements that they determine encourage inappropriate risks by certain financial institutions by providing excessive compensation or that could lead to material financial loss and (2) requires those financial institutions to disclose information concerning incentive-based compensation arrangements to the appropriate federal regulator.

The Dodd‑Frank Act also directs the SEC to adopt a rule that requires public companies to adopt and disclose policies requiring, in the event the company is required to issue an accounting restatement, the contingent repayment obligations of related incentive compensation from current and former executive officers. The SEC has proposed but not yet adopted such rule. To the extent the aforementioned rules are adopted, our ability to recruit and retain investment professionals and senior management executives could be limited.
The Dodd‑Frank Act amends the Exchange Act to compensate and protect whistleblowers who voluntarily provide original information to the SEC and establishes a fund to be used to pay whistleblowers who will be entitled to receive a payment equal to between 10% and 30% of certain monetary sanctions imposed in a successful government action resulting from the information provided by the whistleblower.
Many of these provisions are subject to further rulemaking and to the discretion of regulatory bodies, such as the Council and the Federal Reserve. Many of these provisions are subject to further rulemaking and to the discretion of regulatory bodies, such as the Council and the Federal Reserve. On February 3, 2017, President Trump signed Executive Order 13772 (the “Executive Order”) announcing the new administration’s policy to regulate the U.S. financial system in a manner consistent with certain “Core Principles,” including regulation that is efficient, effective and appropriately tailored. The Executive Order directed the Secretary of the Treasury, in consultation with the heads of the member agencies of the Financial Stability Oversight Council, to report to the President on the extent to which existing laws, regulations and other government policies promote the Core Principles and to identify any laws, regulations or other government policies that inhibit federal regulation of the U.S. financial system.
On June 12, 2017, the U.S. Department of the Treasury (“Treasury”) published the first of several reports in response to the Executive Order on the depository system covering banks and other savings institutions. On October 6, 2017, the Treasury released a second report outlining ways to streamline and reform the U.S. regulatory system for capital markets, followed by a third report, on October 26, 2017, examining the current regulatory framework for the asset management and insurance industries. Subsequent reports are expected to address: retail and institutional investment products and vehicles, as well as non‑bank financial institutions, financial technology and financial innovation.
On June 8, 2017, the U.S. House of Representatives passed the Financial Choice Act, which includes legislation intended to repeal or replace substantial portions of the Dodd‑Frank Act. Among other things, the proposed law would repeal the Volcker Rule limiting certain proprietary investment and trading activities by banks, eliminate the authority of regulators to designate asset managers and other large non‑bank institutions as “systemically important financial institutions” or “SIFIs,” and repeal the Department of Labor (“DOL”) “fiduciary rule” governing standards for dealing with retirement plans until the SEC issues standards for similar dealings by broker‑dealers and limiting the substance of any subsequent DOL rule to the SEC standards. The bill was referred to the Senate, where it is unlikely to pass as proposed. On November 16, 2017, a bipartisan group of U.S. Senators, led by Senate Banking Committee Chairman, introduced the Economic Growth, Regulatory Relief, and Consumer Protection Act (the “Senate Regulatory Relief Bill”). The Senate Regulatory Relief Bill would revise various post-crisis regulatory requirements and provide targeted regulatory relief to certain financial institutions. Among the most significant of its proposed amendments to the Dodd-Frank Act are a substantial increase in the $50 billion asset threshold for automatic regulation of bank holding companies as SIFIs, an exemption from the Volcker Rule for insured depository institutions with less than $10 billion in consolidated assets and lower levels of trading assets and liabilities, as well as amendments to the liquidity leverage ratio and supplementary leverage ratio requirements. On December 5, 2017, the Senate Banking Committee approved the Senate Regulatory Relief Bill. If the legislation is adopted in the Senate, it remains unclear whether and how it would be reconciled with its House-passed counterpart, the Financial Choice Act, which is substantially different in scope and substance, and ultimately approved by both chambers of Congress. The ultimate impact of this order and its implementation on existing and proposed regulations under the Dodd-Frank Act and other rules and regulations applicable to the U.S. financial system are uncertain; however, such impact could be material to our industry, business and operations.
Other Jurisdictions
Certain of our subsidiaries operate outside the United States.U.S. In Luxembourg, Ares Management Luxembourg (“AM Lux”) is subject to authorization and regulation by the Commission de Surveillance du Secteur Financier (“CSSF”). In the United Kingdom,U.K., Ares Management Limited (“AML”) and Ares Management UKU.K. Limited (“AMUKL”) are subject to regulation and authorization by the U.K. Financial Conduct Authority (“FCA”(the “FCA”). Ares European Loan Management LLP (“AELM”), which is not a subsidiary, but in which we are indirectly invested and which procures certain services from Ares Management Limited,AML, is also subject to regulation by the FCA. In some circumstances, Ares Management Limited, Ares Management UK Limited, Ares European Loan Management LLPAML, AMUKL, AELM (the “U.K. Regulated Entities”) and other Ares entities are or may become subject to UKU.K. or EU laws, for instance in relation to marketing our funds to investors in the European Economic Area (“EEA”).EEA.
The UK is scheduled to leaveU.K. exited the EU in March 2019. Some formon January 31, 2020. The withdrawal agreement which provided for a transitional period to allow for the terms of transitional agreement by which UK based financial services firms can continuethe U.K.’s future relationship with the EU to operatebe negotiated, ended on a cross-border basis seems likely. However,December 31, 2020. EEA passporting rights are no longer available to the durationrelevant U.K. entities following the end of the transitional agreementperiod. Various EU laws were “on-shored” into domestic U.K. legislation and certain transitional regimes and deficiency-correction powers exist to ease the transition. The Trade and Cooperation Agreement (the “TCA”) between the U.K. and the end-state relationshipEU formally came into force on May 1, 2021 and since its effectiveness, the TCA has governed certain matters between the UKU.K. and EUthe EU. In addition, the Temporary Marketing Permission Regime (the “TMPR”) allows our alternative investment fund managers (“AIFMs”) to continue to market those funds in the U.K. that were in existence on December 31, 2020, on broadly the same terms as previously applied. Unless extended, the TMPR lasts until December 31, 2025. Any marketing of a new fund coming into
35

Table of Contents
existence after December 31, 2020 must comply with the U.K.’s national private placement regime. Notwithstanding the TCA and the TMPR, there remains unclear. There is a risk that following Brexit the UK may be denied accessconsiderable uncertainty as to the single market. Thisnature of the U.K.’s future relationship with the EU, creating continuing uncertainty as to the full extent to which the businesses of the U.K. Regulated Entities and our businesses generally could be highly disruptiveadversely affected by Brexit. See “Item 1A. Risk Factors—Risks Related to Regulation—The U.K.’s exit from the EU (“Brexit”) could adversely affect our business and may result in us having to increase our presence in other EEA member states which would result in additional costs.

operations.” Despite the U.K.’s departure from the EU, new and existing EU legislation couldis expected to continue to impact our business in the United KingdomU.K. (whether because its effect is preserved in the U.K. as a matter of domestic policy or because compliance with such legislation (whether in whole or part) is a necessary condition for market access into the EEA) and other EEA member states where we have operations. The U.K.’s departure has the potential to change the U.K. legislative and regulatory frameworks within which the U.K. Regulated Entities operate, which could adversely affect our businesses or cause a material increase in our tax liability.
AM Lux operates under the EU legislative frameworks. Notwithstanding the U.K.’s withdrawal from the EU, the U.K. Regulated Entities generally continue to be regulated under these frameworks to the extent they were preserved in U.K. law. In some circumstances other Ares entities are or may become subject to EU laws or the law of EEA member states, including with respect to marketing our funds to investors in the EEA.
AM Lux and AMUKL are both AIFMs. Their operations are primarily governed by Directive 2011/61/EU on Alternative Investment Fund Managers and other associated legislation, rules and guidance (“AIFMD”). The U.K. implemented AIFMD while it was still a member of the EU and similar requirements therefore continue to apply in the U.K. notwithstanding Brexit. The AIFMD imposes significant regulatory requirements on AIFMs established in the EEA. AIFMD regulates fund managers by, amongst other things, prescribing authorization conditions for an AIFM, restricting the activities that can be undertaken by an AIFM and prescribing the organizational requirements, operating conditions, and regulatory standards relating to such things as initial capital, remuneration, conflicts, risk management, leverage, liquidity management, delegation of duties, transparency and reporting requirements.
In the EU (but not the U.K.), AIFMD is expected to be amended in 2024. On November 10, 2023, the European Commission published a near-final amending directive, commonly referred to as “AIFMD II”. Assuming AIFMD II is adopted promptly and published in the Official Journal without delay in 2024, most of the changes will become effective in 2026, subject to the grandfathering period for certain of the loan origination provisions and certain Annex IV disclosure requirements which will become effective a year later. It is not yet clear to what extent (if any) the U.K. will seek to reflect AIFMD II in its domestic rules implementing AIFMD.
AML and AELM are both investment firms within the meaning of Directive 2014/65/EU on Markets in Financial Instruments (“MiFID II”). Notwithstanding Brexit, the U.K.’s rules implementing MiFID II continue to have effect and the accompanying Markets in Financial Instruments Regulation 600/2014/EU (“MiFIR”) has been on-shored into U.K. law in connection with this withdrawal. The operations of AML and AELM are primarily governed by U.K. laws and regulatory rules implementing MiFID II, MiFIR and other associated legislation, rules and guidance. AMUKL is subject to certain provisions of U.K.-retained MiFID II because it has top-up permissions to provide certain U.K.-retained MiFID investment services. AM Lux is subject to certain provisions of EU MiFID II because it has top-up permissions to provide certain MIFID investment services. The main business of AM Lux and the U.K. Regulated Entities is to provide asset management services to clients in Europe.
MiFID II and MiFIR extended the Markets and Financial Instruments Directive (“MiFID”) requirements in a number of areas with more prescriptive and onerous obligations with respect to costs and charges disclosure, product design and governance, the receipt and payment of inducements, the receipt of and payment for investment research, suitability and appropriateness assessments, conflicts of interest, record-keeping, best execution, transaction and trade reporting, remuneration, training and competence and corporate governance. Certain aspects of MIFID II and MiFIR are subject to review and change in both the EU and the U.K.
Effective January 1, 2022, the U.K. introduced a prudential regulatory framework for U.K. investment firms (the “Investment Firm Prudential Regime” or “IFPR”). IFPR applies to AML and AELM as U.K. MiFID investment firms as well as to AMUKL, as a U.K. AIFM with MiFID “top-up” permissions. Under IFPR, among other requirements, AML, AMUKL and AELM are required to maintain more onerous policies regarding remuneration of staff, to set an appropriate ratio between the variable and fixed components of total remuneration and to meet requirements on the structure of variable remuneration. AML and AMUKL are considered to be part of the same “prudential consolidation group”, and many of the requirements of IFPR (including but not limited to capital, liquidity and remuneration) apply at the consolidated group level. Under IFPR, each of AML, AMUKL and AELM have made public disclosures on their websites in relation to their: (i) own funds, own funds requirements and governance structures; (ii) risk management; and (iii) remuneration. The new public disclosure requirements mandate more detail, including quantitative information on remuneration paid to staff, split in between classes of employees, and confirmation of the highest severance payment awarded to an individual material risk taker. The requirements of this
36

Table of Contents
regime may lead to additional operational and compliance complexity in the short to medium term and possibly higher regulatory capital requirements for the affected firms.
The U.K. has introduced an important and substantial regime, the Consumer Duty, designed to improve outcomes for retail investors, aspects of which became effective on July 31, 2023. Although Ares entities do not generally deal with consumers in the ordinary sense, the regime will apply to certain of our funds.
Our operations and our investment activities worldwide are subject to a variety of regulatory regimes that vary by country. These include operating subsidiaries of Ares Management Asia (Holdings) Limited, which are subject to regulation by various regulatory authorities, including the Securities and Futures Commission of Hong Kong and Monetary Authority of Singapore. In addition, as the ultimate parent of the controlling entity of Aspida Re, a Bermuda Class E insurance company, we are considered its “shareholder controller” (as defined in the Bermuda Insurance Act) by the Bermuda Monetary Authority (the “BMA”).

Competition

The investment management industry is intensely competitive, and we expect it to remain so. We compete globally and on a regional, industry and asset basis.
We face competition both in the pursuit of fund investors and investment opportunities. Generally, our competition varies across business lines, geographies and financial markets. We compete for outside investors based on a variety of factors, including investment performance, investor perception of investment managers’ drive, focus and alignment of interest, quality of service provided to and duration of relationship with investors, breadth of our product offering, business reputation and the level of fees and expenses charged for services. We compete for investment opportunities both at our funds and for strategic acquisitions by us based on a variety of factors, including breadth of market coverage and relationships, access to capital, transaction execution skills, the range of products and services offered, innovation and price.
We face competition in our direct lending, trading, acquisitions and other investment activities primarily from traditional asset managers, business development companies, specialized funds, investment managers and other financial institutions, and we expect that competition will continue to increase. Many of these competitors in some of our businesses are substantially larger and have considerably greater financial, technical and marketing resources than are available to us. Many of these competitors have similar investment objectives to us, which may create additional competition for investment opportunities. Some of these competitors may also have a lower cost of capital and access to funding sources that are not available to us, which may create competitive disadvantages for us with respect to investment opportunities. In addition, some of these competitors may have higher risk tolerances, different risk assessments or lower return thresholds, which could allow them to consider a wider variety of investments and to bid more aggressively than us for investments that we want to make. Corporate buyers may be able to achieve synergistic cost savings with regard to an investment that may provide them with a competitive advantage in bidding for an investment. Lastly, institutional and individual investors are allocating increasing amounts of capital to alternative investment strategies. Several large institutional investors have announced a desire to consolidate their investments in a more limited number of managers. We expect that this will cause competition in our industry to intensify and could lead to a reduction in the size and duration of pricing inefficiencies that many of our funds seek to exploit.
Competition is also intense for the attraction and retention of qualified employees. Our ability to continue to compete effectively in our businesses will depend upon our ability to attract new employees and retain and motivate our existing employees.
For additional information concerning the competitive risks that we face, see “Item 1A. Risk Factors—Risks Related to Our Businesses—The investment management business is intensely competitive.”
Available Information
Ares Management Corporation is a Delaware corporation. Our telephone number is (310) 201-4100 and our website address is http://www.aresmgmt.com. Information on our website is not a part of this report and is not incorporated by reference herein. We make available free of charge on our website or provide a link on our website to our Annual Report on Form 10-K, Quarterly Reports on Form 10-Q, Current Reports on Form 8-K, proxy statements and any amendments to those reports filed or furnished pursuant to Section 13(a) or 15(d) of the Exchange Act, as soon as reasonably practicable after those reports are electronically filed with, or furnished to, the SEC. To access these filings, go to the “Investor Resources” section of our website and then click on “SEC Filings.” In addition, these reports and the other documents we file with the SEC are available at a website maintained by the SEC at http://www.sec.gov.
37

Table of Contents
Item 1A. Risk Factors
Risk Factor Summary
Our businesses are subject to a number of inherent risks. We believe that the primary risks affecting our businesses and an investment in shares of our Class A common stock are:
difficult market and political conditions may adversely affect our businesses in many ways, including by reducing the value or hampering the performance of the investments made by our funds or reducing the ability of our funds to raise or deploy capital;
we operate in a complex regulatory and tax environment involving rules and regulations (both domestic and foreign), some of which are outdated relative to today’s global financial activities and some of which are subject to political influence, which could restrict or require us to adjust our operations or the operations of our funds or portfolio companies and subject us to increased compliance costs and administrative burdens, as well as restrictions on our business activities;
inflation has adversely affected and may continue to adversely affect our business, results of operations and financial condition of our funds and their portfolio companies;
if we are unable to raise capital from investors or deploy capital into investments, or if any of our management fees are waived or reduced, or if we fail to realize investments and generate carried interest or incentive fees, our revenues and cash flows would be materially reduced;
we are subject to risks related to our dependence on members of the Executive Management Committee, senior professionals and other key personnel as well as attracting, retaining and developing human capital in a highly competitive talent market;
we may experience reputational harm if we fail to appropriately address conflicts of interest or if we, our employees, our funds or their portfolio companies fail (or are alleged to have failed) to comply with applicable regulations in an increasingly complex political and regulatory environment;
we face intense competition in the investment management business for investment opportunities;
our growth strategy contemplates acquisitions and entering new lines of business and expanding into new investment strategies, geographic markets and businesses, which subject us to numerous risks, expenses and uncertainties, including related to the integration of development opportunities, acquisitions or joint ventures;
we derive a significant portion of our management fees from ARCC;
economic U.S. and foreign sanction laws may prohibit us and our affiliates from transacting with certain countries, individuals and companies;
our international operations subject us to numerous regulatory, operational and reputational risks and expenses;
we are subject to operational risks and risks in using prime brokers, custodians, counterparties, administrators and other agents;
the increasing demands of fund investors, including the potential for fee compression and changes to other terms, could materially adversely affect our future revenues;
we and our third-party service providers may be subject to cybersecurity risks and our business could be adversely affected by changes to data protection laws and regulations;
we may be subject to litigation and reputational risks and related liabilities or risks related to employee misconduct, fraud and other deceptive practices;
increases in interest rates could negatively impact the values of certain assets or investments and the ability of our funds and their portfolio companies to access the debt markets on attractive terms, which could adversely impact investment and realization opportunities;
the use of leverage by us and our funds exposes us to substantial risks, including related to the selection of a replacement for London Interbank Offered Rate (“LIBOR”);
38

Table of Contents
asset valuation methodologies can be highly subjective and the value of assets may not be realized;
our funds may perform poorly due to market conditions, political actions or environments, monetary and fiscal policy or other conditions beyond our control;
third-party investors in our funds may not satisfy their contractual obligation to fund capital calls or may exercise redemption, termination or dissolution rights;
we are subject to risks relating to our contractual rights and obligations under our funds’ governing documents and investment management agreements;
a downturn in the global credit markets could adversely affect our CLO investments;
due to our and our funds’ investments in certain market sectors, such as power, infrastructure and energy, real estate and insurance, we are subject to risks and regulations inherent to those industries;
if we were deemed to be an “investment company” under the Investment Company Act, applicable restrictions could make it impractical for us to continue our businesses as contemplated;
due to the Holdco Members ownership and control of our shares of common stock, holders of our Class A common stock will generally have no influence over matters on which holders of our common stock vote and limited ability to influence decisions regarding our business;
we are subject to risks related to our categorization as a “controlled company” within the meaning of the NYSE listing standards;
potential conflicts of interest may arise among the holders of Class B and Class C common stock and the holders of our Class A common stock;
our holding company structure, Delaware law and contractual restrictions may limit our ability to pay dividends to the holders of our Class A and non-voting common stock;
other anti-takeover provisions in our charter documents could delay or prevent a change in control; and
we are subject to risks related to our tax receivable agreement (the “TRA”).

Risks Related to Our Businesses

Difficult market and political conditions may adversely affect our businesses in many ways, including by reducing the value or hampering the performance of the investments made by our funds or reducing the ability of our funds to raise or deploy capital, each of which could materially reduce our revenue, earnings and cash flow and adversely affect our financial prospects and condition.
Our businesses are materially affected by conditions in the global financial markets and economic and political conditions throughout the world, such as interest rates, the availability and cost of credit, persistent inflation, changes in laws (including laws relating to our taxation, taxation of our investors and the possibility of changes to regulations applicable to alternative asset managers), trade policies, commodity prices, tariffs, currency exchange rates and controls and national and international political circumstances (including wars and other forms of conflict, civil unrest, terrorist acts, and security operations), general economic uncertainty and catastrophic events such as fires, floods, earthquakes, tornadoes, hurricanes, other adverse weather and climate conditions and pandemics. These factors are outside of our control and may affect the level and volatility of securities prices and the liquidity and value of investments, and we may not be able to or may choose not to manage our exposure to these conditions.
Global financial markets have experienced heightened volatility in recent periods, including as a result of economic and political events in or affecting the world’s major economies, such as the conflict between Russia and Ukraine and more recently between Israel and Hamas and the ongoing instability in the Middle East region. Sanctions imposed by the U.S. and other countries in connection with hostilities between Russia and Ukraine and the tensions between China and Taiwan have caused additional financial market volatility and affected the global economy. Concerns over increasing inflation, economic recession, as well as interest rate volatility and fluctuations in oil and gas prices resulting from global production and demand levels,as well as geopolitical tension, have exacerbated market volatility. Market uncertainty and volatility have also been magnified as a result of the upcoming 2024 U.S. presidential and congressional elections and resulting uncertainties regarding actual and potential shifts in U.S. and foreign, trade, economic and other policies.
39

Table of Contents
In addition, numerous structural dynamics and persistent market trends have exacerbated volatility and market uncertainty. Concerns over significant volatility in the commodities markets, sluggish economic expansion in foreign economies, including continued concerns over growth prospects in China and emerging markets, growing debt loads for certain countries, uncertainty about the consequences of the U.S. and other governments withdrawing monetary stimulus measures and speculation about a possible recession all highlight the fact that economic conditions remain unpredictable and volatile. U.S. debt ceiling and budget deficit concerns have increased the possibility of additional credit-rating downgrades and economic slowdowns or a recession in the U.S. In recent periods, geopolitical tensions, including between the U.S. and China, have escalated. Further escalation of such tensions and the related imposition of sanctions or other trade barriers may negatively impact the rate of global growth, particularly in China, where growth has slowed. Moreover, there is a risk of both sector-specific and broad-based volatility, corrections and/or downturns in the commodities, equity and credit markets. Any of the foregoing could have a significant impact on the markets in which we operate and a material adverse impact on our business prospects and financial condition.
A number of factors have had and may continue to have an adverse impact on credit markets in particular. The weakness and the uncertainty regarding the stability of the oil and gas markets resulted in a tightening of credit across multiple sectors. In addition, in an effort to combat inflation the Federal Reserve has increased the federal funds rate in 2023. Although the Federal Reserve left its benchmark rates steady in the fourth quarter of 2023, it has indicated that additional rate increases in the future may be necessary to mitigate inflationary pressures. Changes in and uncertainty surrounding interest rates may have a material effect on our business, particularly with respect to the cost and availability of financing for significant acquisition and disposition transactions. Moreover, while conditions in the U.S. economy have generally improved since the credit crisis, many other economies continue to experience weakness, tighter credit conditions and a decreased availability of foreign capital. Since credit represents a significant portion of our business and ongoing strategy, any of the foregoing could have a material adverse impact on our business prospects and financial condition.
These and other conditions in the global financial markets and the global economy may result in adverse consequences for us and our funds, each of which could adversely affect the business of such funds, restrict such funds’ investment activities, impede such funds’ ability to effectively achieve their investment objectives and result in lower returns than we anticipated at the time certain of our investments were made. More specifically, these economic conditions could adversely affect our operating results by causing:

decreases in the market value of securities, debt instruments or investments held by some of our funds;
illiquidity in the market, which could adversely affect transaction volumes and the pace of realization of our funds’ investments or otherwise restrict the ability of our funds to realize value from their investments, thereby adversely affecting our ability to generate performance or other income;
our assets under management to decrease, thereby lowering a portion of our management fees payable by our funds to the extent they are based on market values; and
increases in costs or reduced availability of financial instruments that finance our funds.
During periods of difficult market conditions or slowdowns (which may be across one or more industries, sectors or geographies), companies in which we and our funds invest may experience decreased revenues, financial losses, credit rating downgrades, difficulty in obtaining access to financing and increased funding costs. During such periods, these companies may also have difficulty in expanding their businesses and operations and be unable to meet their debt service obligations or other expenses as they become due, including expenses payable to us and our funds. Negative financial results in our funds’ portfolio companies may reduce the value of their portfolio companies, the net asset value of our funds and the investment returns for our funds, which could have a material adverse effect on our operating results and cash flow. In addition, such conditions would increase the risk of default with respect to credit-oriented or debt investments. Our funds may be adversely affected by reduced opportunities to exit and realize value from their investments, by lower than expected returns on investments made prior to the deterioration of the credit markets and by our inability to find suitable investments for the funds to effectively deploy capital, which could adversely affect our ability to raise new funds and thus adversely impact our prospects for future growth.
Inflation has adversely affected and may continue to adversely affect our business, results of operations and financial condition of our funds and their portfolio companies.
Certain of our funds and their portfolio companies are in industries that have been impacted by inflation. Although the U.S. inflation rate has decreased in the fourth quarter, it remains well above the historic levels over the past several decades. Such inflationary pressures have increased the costs of labor, energy and raw materials and have adversely affected consumer spending, economic growth and our funds’ portfolio companies’ operations. If such portfolio companies are unable to pass any increases in their costs of operations along to their customers, it could adversely affect their operating results. In addition, any
40

Table of Contents
projected future decreases in the operating results of our funds’ portfolio companies due to inflation could adversely impact the fair value of those investments. Any decreases in the fair value of our fund investments could result in future realized or unrealized losses.

Political and regulatory conditions, including the effects of negative publicity surrounding the financial industry in general and proposed legislation, could adversely affect our businesses.

As a result of market disruptions and highly publicized financial scandals in recent years, regulators and investors have exhibited concerns over the integrity of the U.S. financial markets. The businesses that we operate both in and outside the U.S. will be subject to new or additional regulations. We may be adversely affected as a result of new or revised legislation or regulations imposed by the SEC, the CFTC, FINRA or other U.S. or foreign governmental regulatory authorities or self-regulatory organizations that supervise the financial markets. We may also be adversely affected by changes in the interpretation or enforcement of existing laws and rules by these governmental authorities and self-regulatory organizations.
In recent periods there has been an increasing level of public discourse, debate and media coverage regarding the appropriate extent of regulation and oversight of the financial industry, including investment firms, as well as the tax treatment of certain investments and income generated from such investments. For further discussion regarding legislation affecting the taxation of carried interest, see “—We depend on the members of the Executive Management Committee, senior professionals and other key personnel, and our ability to retain them and attract additional qualified personnel is critical to our success and our growth prospects.” There is ongoing uncertainty regarding prospective changes in law and regulation affecting the U.S. private equity industry, including the possibility of significant revision to the Code and U.S. securities and financial laws, rules and regulations. See “—Risks Related to Taxation—Applicable U.S. and foreign tax law, regulations, or treaties, and changes in such tax laws, regulations or treaties or an adverse interpretation of these items by tax authorities could adversely affect our effective tax rate, tax liability, financial condition and results, ability to raise funds from certain foreign investors, increase our compliance or withholding tax costs and conflict with our contractual obligations” and “—Risks Related to Regulation—Extensive regulation affects our activities, increases the cost of doing business and creates the potential for significant liabilities and penalties that could adversely affect our businesses and results of operations.” The likelihood of occurrence and the effect of any such change is highly uncertain and could have an adverse impact on us, our funds and their portfolio companies.

Changes in relevant tax laws, regulations or treaties or an adverse interpretation of these items by tax authorities may adversely affect our effective tax rate, tax liability and financial condition and results.
Any substantial changes in domestic or international corporate tax policies, regulations or guidance, enforcement activities or legislative initiatives may adversely affect our business, the amount of taxes we are required to pay and our financial condition and results of operations generally. Our effective tax rate and tax liability is based on the application of current income tax laws, regulations and treaties. These laws, regulations and treaties are complex, and the manner in which they apply to us and our funds is sometimes open to interpretation. Significant management judgment is required in determining our provision for income taxes, our deferred tax assets and liabilities and any valuation allowance recorded against our net deferred tax assets. Although management believes its application of current laws, regulations and treaties to be correct and sustainable upon examination by the tax authorities, the tax authorities could challenge our interpretation resulting in additional tax liability or adjustment to our income tax provision that could increase our effective tax rate. For an overview of certain relevant U.S. tax laws and relevant foreign tax laws, see “—Risks Related to Taxation—Applicable U.S. and foreign tax law, regulations, or treaties, and changes in such tax laws, regulations or treaties or an adverse interpretation of these items by tax authorities could adversely affect our effective tax rate, tax liability, financial condition and results, ability to raise funds from certain foreign investors, increase our compliance or withholding tax costs and conflict with our contractual obligations.”
Our business depends in large part on our ability to raise capital from investors. If we were unable to raise such capital, we would be unable to collect management fees or deploy such capital into investments, which would materially reduce our revenues and cash flow and adversely affect our financial condition.
Our ability to raise capital from investors depends on a number of factors, including many that are outside our control. Investors may downsize their investment allocations to alternative asset managers to rebalance a disproportionate weighting of their overall investment portfolio among asset classes. If the value of an investor’s portfolio decreases as a whole, the amount available to allocate to alternative investments could decline. Further, investors often evaluate the amount of distributions they have received from existing funds when considering commitments to new funds. Poor performance of our funds, or regulatory or tax constraints, could also make it more difficult for us to raise new capital. Our investors and potential investors continually assess our funds’ performance independently and relative to market benchmarks and our competitors, which affects our ability to raise capital for existing and future funds. If economic and market conditions deteriorate or continue to be volatile, investors may delay making new commitments to funds and/or we may be unable to raise sufficient amounts of capital to support the
41

Table of Contents
investment activities of future funds. We may not be able to find suitable investments for the funds to effectively deploy capital, which could reduce our revenues and cash flow and adversely affect our financial condition as well as our ability to raise new funds and our prospects for future growth. In addition, certain investors have implemented or may implement restrictions against investing in certain types of asset classes, such as fossil fuels, which would affect our ability to raise new funds focused on those asset classes. If we were unable to successfully raise capital, our revenue and cash flow would be reduced, and our financial condition would be adversely affected. Furthermore, while our senior professionals have committed substantial capital to our funds, commitments from new investors may depend on the commitments made by our senior professionals to new funds and there can be no assurance that there will be further commitments to our funds by these individuals, and any future investments by them in our funds or other alternative investment categories will likely depend on the performance of our funds, the performance of their overall investment portfolios and other investment opportunities available to them.
The financial projections of our portfolio companies could prove inaccurate.
Our funds generally establish the capital structure of portfolio companies on the basis of financial projections prepared by the management of such portfolio companies. These projected operating results will normally be based primarily on judgments of the management of the portfolio companies. In all cases, projections are only estimates of future results that are based upon assumptions made at the time that the projections are developed. General economic conditions, which are not predictable, along with other factors may cause actual performance to fall short of the financial projections that were used to establish a given portfolio company’s capital structure. Because of the leverage that we typically employ in our investments, this could cause a substantial decrease in the value of our equity holdings in the portfolio company. The inaccuracy of financial projections could result in actual performance differing from expectations.
We depend on the members of the Executive Management Committee, senior professionals and other key personnel, and our ability to retain them and attract additional qualified personnel is critical to our success and our growth prospects.
We depend on the diligence, skill, judgment, business contacts and personal reputations of the members of the Executive Management Committee, senior professionals and other key personnel. Our future success will depend upon our ability to retain our senior professionals and other key personnel and our ability to recruit additional qualified personnel. These individuals possess substantial experience and expertise in investing, are responsible for locating and executing our funds’ investments, have significant relationships with the institutions that are the source of many of our funds’ investment opportunities and, in certain cases, have strong relationships with our investors. Therefore, if any of our senior professionals or other key personnel join competitors or form competing companies, it could result in the loss of significant investment opportunities, limit our ability to raise capital from certain existing investors or result in the loss of certain existing investors. There is no guarantee that the non-competition and non-solicitation agreements to which certain of our senior professionals and other key personnel are subject, together with our other arrangements with them, will prevent them from leaving, joining our competitors or otherwise competing with us. Such agreements also expire after a certain period of time, at which point such senior personnel would be free to compete against us and solicit our clients and employees. In addition, there is no assurance that such agreements will be enforceable in all cases, particularly as U.S. states and/or federal agencies enact legislation or adopt rules aimed at effectively prohibiting non-competition agreements. In this respect, in January 2023, the U.S. Federal Trade Commission (“FTC”) published a proposed rule that, if finally issued, would generally prohibit post-employment non-compete clauses (or other clauses with comparable effect) in agreements between employers and their employees. If issued, the proposed rule could adversely affect our ability to recruit and retain our professionals.
The departure or bad acts of any of our senior professionals, or a significant number of our other investment professionals, could have a material adverse effect on our ability to achieve our investment objectives, cause certain of our investors to withdraw capital they invest with us or elect not to commit additional capital to our funds or otherwise have a material adverse effect on our business and our prospects. Turnover and associated costs of rehiring, the loss of human capital through attrition and the reduced ability to attract talent could impair our ability to implement our growth strategy and maintain our standards of excellence. Further the departure of some or all of those individuals could also trigger certain “key person” provisions in the documentation governing certain of our funds, which would permit the investors in those funds to suspend or terminate such funds’ investment periods or, in the case of certain funds, permit investors to withdraw their capital prior to expiration of the applicable lock-up date. We do not carry any “key person” insurance that would provide us with proceeds in the event of the death or disability of any of our senior professionals, and we do not have a policy that prohibits our senior professionals from traveling together. See “—Risks Related to Regulation—Employee misconduct could harm us by impairing our ability to attract and retain investors and subjecting us to significant legal liability, regulatory scrutiny and reputational harm.”
We anticipate that it will be necessary for us to add investment professionals both to grow our businesses and to replace those who depart. Competition for qualified, motivated, and highly-skilled executives, professionals and other key personnel in investment management firms is significant, both in the U.S. and internationally, and we may not succeed in
42

Table of Contents
recruiting additional personnel or we may fail to effectively replace current personnel who depart with qualified or effective successors. We seek to offer our personnel meaningful professional development opportunities and programs such as employee engagement, training and development opportunities and periodic review processes. We also seek to provide our personnel with competitive benefits and compensation packages. However, these efforts may not be sufficient to enable us to attract, retain and motivate qualified individuals to support our business and growth.
The tax treatment of carried interest has continued to be an area of focus for policymakers and government officials, which could result in a further regulatory action by federal or state governments. Congress and the current Presidential administration may consider legislation to further extend the holding period for carried interest to qualify for long-term capital gains treatment, have carried interest taxed as ordinary income rather than as capital gain, impose surcharges on carried interest or increase the capital gains tax rate. Tax authorities and legislators in other jurisdictions in which Ares has investments or employees could clarify, modify or challenge their treatment of carried interest. For example, the U.K. government has suggested, following a report by the Office of Tax Simplification on the U.K. Capital Gains Tax Regime, that it is keeping the regime under review. Such review could result in a change to the taxation of carried interest with respect to our U.K. investment professionals. If any of these potential changes were effectuated, the amount of taxes that our employees and other key personnel would be required to pay could increase materially and could impact our ability to recruit, retain and motivate employees and key personnel in the relevant jurisdictions or could require us in certain circumstances to consider alternative or modified incentive arrangements for such employees or key personnel. Our efforts to retain and attract investment professionals may also result in significant additional expenses, which could adversely affect our profitability or result in an increase in the portion of our carried interest and incentive fees that we grant to our investment professionals. Additionally, we expect expenses related to equity-based compensation to increase in the future as we grant equity-based awards to attract, retain and compensate employees.
Our failure to appropriately address conflicts of interest could damage our reputation and adversely affect our businesses.
As we expand the number and scope of our businesses, we increasingly confront potential conflicts of interest relating to our and our funds’ investment activities. These conflicts are most likely to arise between or among our funds or between one or more funds across our Credit, Private Equity, Real Assets and Secondaries Groups, and other businesses including any SPACs and similar investment vehicles that we sponsor. These conflicts of interest include:
we and certain of our funds may have overlapping investment objectives, including funds that have different fee structures, and potential conflicts may arise with respect to our decisions regarding how to allocate investment opportunities. For example, a decision to receive material non-public information about a company while pursuing an investment opportunity may give rise to a potential conflict of interest if it results in our having to restrict any fund or other part of our business from trading in the securities of such company;
we may allocate an investment opportunity that is appropriate for Ares and/or multiple funds in a manner that excludes one or more funds or results in a disproportionate allocation based on factors or criteria that we determine, such as differences with respect to available capital, the size of a fund, minimum investment amounts and remaining life of a fund, differences in investment objectives or current investment strategies, such as objectives or strategies, differences in risk profile at the time an opportunity becomes available, the potential transaction and other costs of allocating an opportunity among various funds, potential conflicts of interest, including whether multiple funds have an existing investment in the security in question or the issuer of such security, the nature of the security or the transaction including the size of investment opportunity, minimum investment amounts and the source of the opportunity, current and anticipated market and general economic conditions, existing positions in an issuer/security, prior positions in an issuer/security and other considerations deemed relevant to us;
our funds may acquire positions in a single portfolio company, for example, where the fund that made an initial investment no longer has capital available to invest;
our funds may invest in different parts of the capital structure of a company in which one or more of our other funds invests. For example, one or more funds may invest in a controlling or other equity interest issued by a portfolio company in which a different fund holds debt securities. Additionally, in connection with an investment we may create multiple tranches of a capital structure and our funds may be allocated investments in these tranches on terms established by us. The interests of our funds may not always be aligned, which may give rise to actual or potential conflicts of interest, or the appearance of conflicts of interest. Further, a direct conflict of interest could arise between the security holders if such a company were to become distressed or develop insolvency concerns. Actions taken for one or more of our funds may be adverse to us or other of our funds;
our affiliates or portfolio companies may be service providers or counterparties to our funds or portfolio companies and receive fees or other compensation for services that are not shared with our fund investors. In such instances, we
43

Table of Contents
may be incentivized to cause our funds or portfolio companies to purchase such services from our affiliates or portfolio companies rather than an unaffiliated service provider despite the fact that a third-party service provider could potentially provide higher quality services or offer them at a lower cost;
funds in one group could be restricted from selling their positions in such companies for extended periods because investment professionals in another group sit on the boards of such companies or because another part of the firm has received private information;
certain funds in different groups may invest alongside each other in the same security. ARCC, ASIF and other registered closed-end management investment companies managed by us are permitted to co-invest in portfolio companies with each other and with affiliated funds pursuant to an SEC order (the “Co-Investment Exemptive Order”). The different investment objectives or terms of such funds may result in a potential conflict of interest, including in connection with the allocation of investments between the funds made pursuant to the Co-Investment Exemptive Order;
conflicts of interest may exist in the valuation of our investments (which can affect fees and carried interest) and regarding decisions about the allocation of specific investment opportunities among us and our funds and the allocation of fees and costs among us, our funds and their portfolio companies; and
fund investors may perceive conflicts of interest regarding investment decisions for funds in which our investment professionals, who have made and may continue to make significant personal investments, are personally invested.
Though we believe we have appropriate means and oversight to resolve these conflicts, our judgment on any particular allocation could be challenged. While we have developed general guidelines regarding when two or more funds can invest in different parts of the same company’s capital structure and created a process that we employ to handle such conflicts if they arise, our decision to permit the investments to occur in the first instance or our judgment on how to minimize the conflict could be challenged. If we fail to appropriately address any such conflicts, it could negatively impact our reputation and ability to raise additional funds and the willingness of counterparties to do business with us or result in potential litigation or regulatory action against us, which may adversely impact our business.
Conflicts of interest may arise in our allocation of co-investment opportunities.
As a general matter, our allocation of co-investment opportunities is entirely within our discretion and there can be no assurance that co-investments of any particular type or amount will be allocated to any of our funds or investors. There can be no assurance that co-investments will become available and we will take into account a variety of factors and considerations we deem relevant in our sole discretion in allocating co-investment opportunities, including, without limitation, whether a potential co-investor has expressed an interest in evaluating co-investment opportunities, our assessment of a potential co-investor’s ability to invest an amount of capital that fits the needs of the co-investment and its history of participating in Ares co-investments, the potential co-investor’s strategic value to the co-investment, our funds or future funds, the length and nature of our relationship with the potential co-investor, including whether the potential co-investor has demonstrated a long-term and/or continuing commitment to the potential success of Ares or any of its funds, our assessment of a potential co-investor’s ability to commit to a co-investment opportunity within the required timeframe of the particular transaction, the economic and other terms of such co-investment (e.g., whether management fees and/or carried interest would be payable to us and the extent thereof), and such other factors and considerations that we deem relevant in our sole discretion under the circumstances.
Certain funds in different groups may invest alongside each other in the same security. ARCC, ASIF and other registered closed-end management investment companies managed by us are permitted to co-invest in portfolio companies with each other and with affiliated funds pursuant to the Co-Investment Exemptive Order. The different investment objectives or terms of such funds may result in a potential conflict of interest, including in connection with the allocation of investments between the funds made pursuant to the Co-Investment Exemptive Order. In addition, conflicts of interest may exist in the valuation of our investments and regarding decisions about the allocation of specific investment opportunities among us and our funds and the allocation of fees and costs among us, our funds and their portfolio companies. We, from time to time, incur fees, costs, and expenses on behalf of more than one fund. To the extent such fees, costs, and expenses are incurred for the account or benefit of more than one fund, each such fund will typically bear an allocable portion of any such fees, costs, and expenses in proportion to the size of its investment in the activity or entity to which such expense relates (subject to the terms of each fund’s governing documents) or in such other manner as we consider fair and equitable under the circumstances such as the relative fund size or capital available to be invested by such funds. Where a fund’s governing documents do not permit the payment of a particular expense, we will generally pay such fund’s allocable portion of such expense.
Potential conflicts will arise with respect to our decisions regarding how to allocate co-investment opportunities among our funds and investors and the terms of any such co-investments. Our fund documents typically do not mandate specific
44

Table of Contents
allocations with respect to co-investments. The investment advisers of our funds may have an incentive to provide co-investment opportunities to certain investors in lieu of others. Co-investment arrangements may be structured through one or more of our investment vehicles, and in such circumstances, co-investors will generally bear the costs and expenses thereof (which may lead to conflicts of interest regarding the allocation of costs and expenses between such co-investors and investors in our other funds). The terms of any such existing and future co-investment vehicles may differ materially, and in some instances may be more favorable to us, than the terms of certain of our funds or prior co-investment vehicles, and such different terms may create an incentive for us to allocate a greater or lesser percentage of an investment opportunity to such funds or such co-investment vehicles, as the case may be. Such incentives will from time to time give rise to conflicts of interest. There can be no assurance that any conflicts of interest will be resolved in favor of any particular funds or investors (including any applicable co-investors) and such investment fund or investor (or the SEC) may challenge our treatment of such conflict, which could impose costs on our business and expose us to potential liability.
We may also decide to provide a co-investment opportunity to certain investors in lieu of allocating more of that investment to our funds, which may adversely impact our fundraising activity.
The investment management business is intensely competitive.
The investment management business is intensely competitive, with competition based on a variety of factors, including investment performance, business relationships, quality of service provided to investors, investor liquidity and willingness to invest, fund terms (including fees), brand recognition and business reputation. We compete with a number of private equity funds, specialized funds, hedge funds, corporate buyers, traditional asset managers, real estate development companies, commercial banks, investment banks, other investment managers and other financial institutions, as well as domestic and international pension funds and sovereign wealth funds, and we expect that competition will continue to increase.
Numerous factors increase our competitive risks, including, but not limited to:
a number of our competitors in some of our businesses have greater financial, technical, marketing and other resources and more personnel than we do;
some of our funds may not perform as well as competitors’ funds or other available investment products;
several of our competitors have raised significant amounts of capital, and many of them have similar investment objectives to ours, which may create additional competition for investment opportunities;
some of our competitors may have a lower cost of capital and access to funding sources that are not available to us, which may create competitive disadvantages for us with respect to our funds, particularly our funds that directly use leverage or rely on debt financing of their portfolio investments to generate superior investment returns;
some of our competitors may have higher risk tolerances, different risk assessments or lower return thresholds than us, which could allow them to consider a wider variety of investments and to bid more aggressively than us for investments that we want to make;
some of our competitors may be subject to less regulation and, accordingly, may have more flexibility to undertake and execute certain businesses or investments than we do and/or bear less compliance expense than we do;
some of our competitors may not have the same types of conflicts of interest as we do;
some of our competitors may have more flexibility than us in raising certain types of funds under the investment management contracts they have negotiated with their investors;
some of our competitors may have better expertise or be regarded by investors as having better expertise or reputation in a specific asset class or geographic region than we do;
our competitors that are corporate buyers may be able to achieve synergistic cost savings in respect of an investment, which may provide them with a competitive advantage in bidding for an investment;
our competitors have instituted or may institute low cost high speed financial applications and services based on artificial intelligence and new competitors may enter the asset management space using new investment platforms based on artificial intelligence; and
45

Table of Contents
other industry participants may, from time to time, seek to recruit our investment professionals and other employees away from us.
Developments in financial technology, such as a distributed ledger technology (or blockchain), have the potential to disrupt the financial industry and change the way financial institutions, including investment managers, do business, and could exacerbate these competitive pressures.
We may lose investment opportunities in the future if we do not match pricing, structures and terms offered by our competitors. Alternatively, we may experience decreased profitability, rates of return and increased risks of loss if we match pricing, structures and terms offered by our competitors.
In addition, the attractiveness of investments in our funds relative to other investment products could decrease depending on economic conditions. This competitive pressure could adversely affect our ability to make successful investments and limit our ability to raise future funds, either of which would adversely impact our businesses, revenues, results of operations and cash flow.
Lastly, institutional and individual investors are allocating increasing amounts of capital to alternative investment strategies. Several large institutional investors have announced a desire to consolidate their investments in a more limited number of managers. We expect that this will cause competition in our industry to intensify and could lead to a reduction in the size and duration of pricing inefficiencies that many of our funds seek to exploit. Increased competition may adversely impact our ability to deploy capital, which could reduce our revenues and cash flow and adversely affect our financial condition.
Poor performance of our funds would cause a decline in our revenue and results of operations, may obligate us to repay carried interest previously paid to us and could adversely affect our ability to raise capital for future funds.
We derive revenues primarily from:
management fees, which are based generally on the amount of capital committed to or invested by our funds;
carried interest and incentive fees, which are based on the performance of our funds; and
returns on investments of our own capital in the funds and other investment vehicles, including SPACs, that we sponsor and manage.

When any of our funds perform poorly, either by incurring losses or underperforming benchmarks, as compared to our competitors or otherwise, our investment record suffers. As a result, our carried interest and incentive fees may be adversely affected and, all else being equal, the value of our assets under management could decrease, which may, in turn, reduce our management fees. Moreover, we may experience losses on investments of our own capital as a result of poor investment performance. If a fund performs poorly, we will receive little or no carried interest and incentive fees with regard to the fund and little income or possibly losses from our own principal investment in such fund. Furthermore, if, as a result of poor performance or otherwise, a fund does not achieve total investment returns that exceed a specified investment return threshold over the life of the fund or other measurement period, we may be obligated to repay the amount by which carried interest that was previously distributed or paid to us exceeds amounts to which we were entitled. Poor performance of our funds and other vehicles could also make it more difficult for us to raise new capital. Investors in our closed-end funds may decline to invest in future closed-end funds we raise as a result of poor performance. Investors in our open-ended funds may redeem their investment as a result of poor performance. Poor performance of our publicly-traded funds may result in stockholders selling their stock in such vehicles, thereby causing a decline in the stock price and limiting our ability to access capital. For further information on the impact of poor fund performance, see “—We may not be able to maintain our current fee structure as a result of industry pressure from fund investors to reduce fees, which could have an adverse effect on our profit margins and results of operations.”
In addition, if any of our subsidiaries become the sponsor of any SPACs that are unable to successfully complete a business combination within the time limitation provided for such SPAC, we may lose the entirety of our investment. See “—Risks Related to Regulation—Our investments in subsidiaries that have sponsored SPACs and invested in their business combination targets may expose us to increased liabilities, and we may suffer the loss of all or a portion of our investments if the SPAC does not complete a business combination by the applicable deadline or the target is unsuccessful.”
ARCC’s management fee comprises a significant portion of our management fees and a reduction in fees from ARCC could have an adverse effect on our revenues and results of operations.
The management fees we receive from ARCC (including fees attributable to ARCC Part I Fees) comprise a significant percentage of our management fees. The investment advisory and management agreement we have with ARCC categorizes the
46

Table of Contents
fees we receive as: (i) base management fees, which are paid quarterly and generally increase or decrease based on ARCC’s total assets (excluding cash and cash equivalents); (ii) fees based on ARCC’s net investment income (before ARCC Part I Fees and ARCC Part II Fees), which are paid quarterly (“ARCC Part I Fees”); and (iii) fees based on ARCC’s net capital gains, which are paid annually (“ARCC Part II Fees”). We classify the ARCC Part I Fees as management fees because they are predictable and recurring in nature, not subject to contingent repayment and generally cash-settled each quarter. If ARCC’s total assets or its net investment income (before ARCC Part I Fees and ARCC Part II Fees) were to decline significantly for any reason, including, without limitation, due to fair value accounting requirements, the poor performance of its investments or the failure to successfully access or invest capital, the amount of the fees we receive from ARCC, including the base management fee and the ARCC Part I Fees, would also decline significantly, which could have an adverse effect on our revenues and results of operations. In addition, because ARCC Part II Fees are not paid unless ARCC achieves cumulative aggregate realized capital gains (net of cumulative aggregate realized capital losses and aggregate unrealized capital depreciation), ARCC’s Part II Fees payable to us are variable and not predictable. In addition, ARCC Part I Fees and ARCC Part II Fees may be subject to cash payment deferral if certain return hurdles in accordance with the contractual terms are not met, which could have an adverse effect on our cash flows if such deferral is sustained for an extended period. In such cases, the contractual payments to employees as compensation related to such ARCC Part I Fees and ARCC Part II Fees are also deferred, which would limit the associated impact to our liquidity. We may also, from time to time, waive or voluntarily defer any fees payable by ARCC in connection with strategic transactions.
Our investment advisory and management agreement with ARCC renews for successive annual periods subject to the approval of ARCC’s board of directors or by the affirmative vote of the holders of a majority of ARCC’s outstanding voting securities. In addition, as required by the Investment Company Act, both ARCC and its investment adviser have the right to terminate the agreement without penalty upon 60 days’ written notice to the other party. Termination or non-renewal of this agreement would reduce our revenues significantly and could have a material adverse effect on our financial condition.
We may not be able to maintain our current fee structure as a result of industry pressure from fund investors to reduce fees, which could have an adverse effect on our profit margins and results of operations.
We may not be able to maintain our current fee structure as a result of industry pressure from fund investors to reduce fees. Although our investment management fees vary among and within asset classes, historically we have competed primarily on the basis of our performance and not on the level of our investment management fees relative to those of our competitors. In recent years, however, there has been a general trend toward lower fees in the investment management industry. The Institutional Limited Partners Association (“ILPA”) published a set of Private Equity Principles (the “Principles”) which called for enhanced “alignment of interests” between general partners and limited partners through modifications of some of the terms of fund arrangements, including proposed guidelines for fee structures. We promptly provided ILPA with our endorsement of the Principles, representing an indication of our general support for the efforts of ILPA. Although we have no obligation to modify any of our fees with respect to our existing funds, we may experience pressure to do so. More recently, institutional investors have been increasing pressure to reduce management and investment fees charged by external managers, whether through direct reductions, deferrals, rebates or other means. In addition, we may be asked by investors to waive or defer fees for various reasons, including during economic downturns or as a result of poor performance of our funds. We may not be successful in providing investment returns and service that will allow us to maintain our current fee structure. Fee reductions on existing or future new businesses could have an adverse effect on our profit margins and results of operations. For more information about our fees, see “Item 7. Management’s Discussion and Analysis of Financial Condition and Results of Operations.”
In addition, we may not be able to maintain our current fee structure if we fail to grow the assets of our funds. This would limit our ability to earn additional management fees, carried interest and incentive fees, and ultimately affect our operating results. Our fund investors and potential fund investors continually assess our funds’ performance independently and relative to market benchmarks and our competitors, and our ability to raise capital for existing and future funds and avoid excessive redemption levels depends on our funds’ performance. Accordingly, poor fund performance may deter future investment in our funds and thereby decrease the capital invested in our funds and, ultimately, our management fee income. In the face of poor fund performance, investors could demand lower fees or fee concessions for existing or future funds which would likewise decrease our revenue.
A major public health crisis, like the COVID-19 pandemic, could disrupt the U.S. and global economy and industries in which we, our funds and our funds’ portfolio companies operate and negatively impact us, our funds or our funds’ portfolio companies.
A major public health crisis could impact the U.S. and global economy. Disruptions to commercial activity (such as the imposition of quarantines or travel restrictions) or, more generally, a failure to contain or effectively manage a public health crisis, has, and may in the future, adversely impact our and our funds’ business and operations, as well as the business and
47

Table of Contents
operations of our funds’ portfolio companies. For example, such disruptions have adversely affected, and in the future could again, impair our ability to raise funds or deter fund investors from investing in new or successor funds that we are marketing particularly in certain industries in which certain of our funds’ portfolio companies operate, including energy, hospitality, travel, retail and restaurant industries. Additionally, while restrictions have generally been lifted globally, and the World Health Organization has declared the end of the COVID-19 global health emergency, the COVID-19 pandemic contributed, and any future public health crisis could contribute, to adverse impacts on global commercial activity and supply chain operations and significant volatility in the equity and debt markets. Such volatility could increase credit and liquidity risk and hamper our and our funds’ ability to deploy capital, all of which could negatively impact our and our funds’ performance, as well as the business and operations of our funds’ portfolio companies.
Rapid growth of our businesses, particularly outside the U.S., may be difficult to sustain and may place significant demands on our administrative, operational and financial resources.
Our assets under management have grown significantly in the past, and we are pursuing further growth in the near future, both organic and through acquisitions. Our rapid growth has placed, and planned growth, if successful, will continue to place significant demands on our legal, accounting, compliance and operational infrastructure and has increased expenses. The complexity of these demands, and the expense required to address them, is a function not simply of the amount by which our assets under management has grown, but of the growth in the variety and complexity of, as well as the differences in strategy between, our different funds. In addition, we are required to continuously develop our systems and infrastructure in response to the increasing sophistication of the investment management market and legal, accounting, regulatory and tax developments.
Our future growth will depend in part on our ability to maintain an operating platform and management system sufficient to address our growth and will require us to incur significant additional expenses and to commit additional senior management and operational resources. As a result, we face significant challenges in:
maintaining adequate financial, regulatory (legal, tax and compliance) and business controls;
providing current and future investors with accurate and consistent reporting;
implementing new or updated information and financial systems and procedures;
monitoring and enhancing our cybersecurity and data privacy risk management; and
training, managing and appropriately sizing our work force and other components of our businesses on a timely and cost-effective basis.
We may not be able to manage our expanding operations effectively or be able to continue to grow, and any failure to do so could adversely affect our ability to generate revenue and control our expenses.
In addition, pursuing investment opportunities outside the U.S. presents challenges not faced by U.S. investments, such as different legal and tax regimes and currency fluctuations, which require additional resources to address. To accommodate the needs of global investors and strategies we must structure investment products in a manner that addresses tax, regulatory and legislative provisions in different, and sometimes multiple, jurisdictions. These laws may not always be consistent with each other. Further, in conducting business in foreign jurisdictions, we are often faced with the challenge of ensuring that our activities and those of our funds and, in some cases, our funds’ portfolio companies, are consistent with U.S. or other laws with extraterritorial application, such as the USA PATRIOT Act and the U.S. Foreign Corrupt Practices Act (the “FCPA”). Moreover, actively pursuing international investment opportunities may require that we increase the size or number of our international offices. Pursuing foreign fund investors means that we must comply with international laws governing the sale of interests in our funds, different investor reporting, investor “know your customer” requirements and information processes and other requirements, which may impact our ability to service such investors. As a result, we are required to continuously develop our systems and infrastructure, including employing and contracting with foreign businesses and entities, in response to the increasing complexity and sophistication of the investment management market and legal, accounting and regulatory situations. This growth has required, and will continue to require, us to incur significant additional expenses and to commit additional senior management and operational resources. There can be no assurance that we will be able to manage or maintain appropriate oversight over our expanding international operations effectively or that we will be able to continue to grow this part of our businesses, and any failure to do so could adversely affect our ability to generate revenues and control our expenses. See “—Risks Related to Regulation—Regulatory changes in jurisdictions outside the U.S. could adversely affect our businesses.”
We may enter into new lines of business and expand into new investment strategies, geographic markets, strategic partnerships and businesses, each of which may result in additional risks, expenses and uncertainties in our businesses.
48

Table of Contents
We intend, if market conditions warrant, to grow our businesses by increasing assets under management in existing businesses and expanding into new investment strategies, geographic markets, strategic partnerships and businesses. We may pursue growth through acquisitions of other investment management companies, acquisitions of critical business partners, acquisition of companies, or other strategic initiatives (including through our other businesses), which may include entering into new lines of business. In addition, consistent with our past experience, we expect opportunities will arise to acquire other alternative or traditional asset managers.
Attempts to expand our businesses involve a number of special risks, including some or all of the following:
the required investment of capital and other resources;
the diversion of management’s attention from our core businesses;
the assumption of liabilities in any acquired business;
the disruption of our ongoing businesses;
entry into markets or lines of business in which we may have limited or no experience;
increasing demands on our operational and management systems and controls;
our assumption of the imposition on us of known or unknown claims or liabilities in an acquisition, including claims by government agencies or authorities, current or former employees or customers, former stockholders or other third parties;
compliance with or applicability to our business or our funds’ portfolio companies of regulations and laws, including, in particular, local regulations and laws and customs in the numerous jurisdictions in which we operate and the impact that noncompliance or even perceived noncompliance could have on us and our funds’ portfolio companies;
our inability to realize the anticipated operation and financial benefits from an acquisition for a number of reasons, including if we are unable to effectively integrate acquired businesses;
potential increase in investor concentration; and
the broadening of our geographic footprint, increasing the risks associated with conducting operations in certain foreign jurisdictions where we currently have little or no presence.
Entry into certain lines of business may subject us to new laws and regulations with which we are not familiar, or from which we are currently exempt, and may lead to increased litigation and regulatory risk. If a new business does not generate sufficient revenues or if we are unable to efficiently manage our expanded operations, our results of operations will be adversely affected. Our strategic initiatives may include joint ventures and business combinations through subsidiary sponsored SPACs, in which case we will be subject to additional risks and uncertainties in that we may be dependent upon, and subject to liability, losses or reputational damage relating to systems, controls and personnel that are not under our control or disputes with our joint venture partners. Because we have not yet identified these potential new investment strategies, geographic markets or lines of business, we cannot identify all of the specific risks we may face and the potential adverse consequences on us and their investment that may result from any attempted expansion.
If we are unable to consummate or successfully integrate development opportunities, acquisitions or joint ventures, we may not be able to implement our growth strategy successfully.
Our growth strategy is based, in part, on the selective development or acquisition of asset management businesses, advisory businesses or other businesses complementary to our business where we think we can add substantial value or generate substantial returns. The success of this strategy will depend on, among other things, (i) the availability of suitable opportunities, (ii) the level of competition from other companies that may have greater financial resources, (iii) our ability to value potential development or acquisition opportunities accurately and negotiate acceptable terms for those opportunities, (iv) our ability to obtain requisite approvals and licenses from the relevant governmental authorities and to comply with applicable laws and regulations without incurring undue costs and delays, (v) our ability to identify and enter into mutually beneficial relationships with venture partners, and (vi) our ability to properly manage conflicts of interest. In addition, our ability to integrate personnel at acquired businesses into our operations and culture may be impacted by the structure of acquisitions we make, such as contingent consideration and continuing governance rights retained by the sellers.
This strategy also contemplates the use of shares of our publicly-traded Class A common stock as acquisition consideration. Volatility or declines in the trading price of shares of our Class A common stock may make shares of our Class
49

Table of Contents
A common stock less attractive to acquisition targets. Moreover, even if we are able to identify and successfully complete an acquisition, we may encounter unexpected difficulties or incur unexpected costs associated with integrating and overseeing the operations of the new businesses. If we are not successful in implementing our growth strategy, our business, financial results and the market price for shares of our Class A common stock may be adversely affected.
Risks Related to Regulation
Extensive regulation affects our activities, increases the cost of doing business and creates the potential for significant liabilities and penalties that could adversely affect our businesses and results of operations.
Overview of our regulatory environment and exemptions from certain laws.  Our businesses are subject to extensive regulation, including periodic examinations, by governmental agencies and self-regulatory organizations in the jurisdictions in which we operate. The SEC oversees the activities of our subsidiaries that are registered investment advisers under the Investment Advisers Act. FINRA and the SEC oversee the activities of our wholly owned subsidiaries AMCM and AWMS as registered broker-dealers, which also maintain licenses in many states. We are subject to audits by the Defense Security Service to determine whether we are under foreign ownership, control or influence. We are also increasingly subject to various data privacy and protection laws. If we are unable or fail to comply with such laws, we could be subject to fines, penalties, litigation or reputational harm.
Regulators are also increasing scrutiny and considering regulation of the use of artificial intelligence technologies. We cannot predict what, if any, actions may be taken, but such regulation could have a material adverse effect on our business and results of operations.
We regularly rely on exemptions from various requirements of the Securities Act, the Exchange Act, the Investment Company Act, the Commodity Exchange Act and ERISA. These exemptions are sometimes highly complex and may in certain circumstances depend on compliance by third parties who we do not control. If for any reason these exemptions were to be revoked or challenged or otherwise become unavailable to us, such action could increase our cost of doing business or subject us to regulatory action or third-party claims, which could have a material adverse effect on our businesses. For example, the “bad actor” disqualification provisions of Rule 506 of Regulation D under the Securities Act ban an issuer from offering or selling securities pursuant to the safe harbor in Rule 506 if the issuer, or any other “covered person,” is the subject of a criminal, regulatory or court order or other “disqualifying event” under the rule which has not been waived by the SEC. The definition of a “covered person” under the rule includes an issuer’s directors, general partners, managing members and executive officers and promoters and persons compensated for soliciting investors in the offering. Accordingly, our ability to rely on Rule 506 to offer or sell securities would be impaired if we or any “covered person” is the subject of a disqualifying event under the rule and we are unable to obtain a waiver or, in certain circumstances, terminate our involvement with such “covered person”.
SEC enforcement activity has increased under the current Presidential administration. While we have a robust compliance program in place, it is possible this enforcement activity will target practices which we believe are compliant, and which were not targeted by the prior Presidential administration. For example, the Biden administration and the current leadership of the SEC have signaled that they intend to seek to enact changes to numerous areas of law and regulations currently in effect. In particular, the SEC has signaled an increased emphasis on investment adviser and private fund regulation and has enacted rules that will meaningfully affect investment advisers and their management of private funds. These include rules with respect to fund audits, adviser-led secondary transactions, fee and expense allocation and reporting, beneficial ownership reporting under Exchange Act Sections 13(d) and 13(g), reporting on Form PF, borrowings, preferential investment terms, cybersecurity risk management, ESG disclosure, annual compliance reviews and outsourcing by investment advisers. The SEC is expected to propose additional changes in the future. Such current and future rulemaking is expected to materially impact private funds and private fund advisers and their operations, including increasing compliance burdens and regulatory costs, and heightened risk of regulatory enforcement action such as public sanctions, restrictions on activities, fines and reputational damage. For example, significant time and resources are expected to be required to comply with the private fund adviser rules that the SEC adopted on August 23, 2023, including costs related to reporting and disclosures to investors. Further, implementation of the private fund advisor rules may result in us evaluating certain of our fundraising practices, which could adversely impact fundraising. Any of the foregoing could lead to further regulatory uncertainty, particularly regarding those rules that are currently (or in the future may become) subject to legal challenge from private fund industry groups and others, result in changes to our operations and could materially impact our funds and/or their investments and/or the Company, including by causing us to incur additional expenses.
Federal regulation. Under the Dodd-Frank Act, a 10 voting-member Financial Stability Oversight Council (“FSOC”) has the authority to review the activities of certain nonbank financial firms engaged in financial activities and designate them as systemically important financial institutions (“SIFI”), evaluating, among other things, the impact of the distress of the financial firm on the stability of the U.S. economy. Currently, there are no non-bank financial companies with a non-bank SIFI
50

Table of Contents
designation. The FSOC has, however, designated certain non-bank financial companies as SIFIs in the past, and additional non-bank financial companies, which may include large asset management companies such as us, may be designated as SIFIs in the future. In November 2023, FSOC adopted amendments to its guidance regarding procedures for designating non-bank financial companies as SIFIs which eliminated the prior guidance’s prioritization of an “activities-based” approach for identifying, assessing and addressing potential risks to financial stability. Under the previous guidance’s “activities-based” approach, FSOC indicated that it would primarily focus on regulating activities that pose systemic risk rather than focusing on individual firm-specific determinations. The elimination of an “activities-based” approach over designation of an individual firm as a non-bank SIFI may increase the likelihood of FSOC designating one or more firms as a non-bank SIFI. If we were designated as such, it would result in increased regulation of our businesses, including the imposition of capital, leverage, liquidity and risk management standards, credit exposure reporting and concentration limits, enhanced public disclosures, restrictions on acquisitions and annual stress tests by the Federal Reserve. Requirements such as these, which were designed to regulate banking institutions, would likely need to be modified to be applicable to an asset manager, although no proposals have been made indicating how such measures would be adapted for asset managers.                
Pursuant to the Dodd-Frank Act, regulation of the U.S. derivatives market is bifurcated between the CFTC and the SEC. Under the Dodd-Frank Act, the CFTC has jurisdiction over swaps and the SEC has jurisdiction over security-based swaps. Under CFTC rules, all swaps (other than security-based swaps) included in the definition of commodity interests. As a result, funds that utilize swaps (whether or not related to a physical commodity) may fall within the statutory definition of a commodity pool. If a fund qualifies as a commodity pool, then, absent an available exemption, the operator of such fund is required to register with the CFTC as a CPO. Registration with the CFTC renders such CPO subject to regulation, including with respect to disclosure, reporting, recordkeeping and business conduct, which could significantly increase operating costs by requiring additional resources.
Certain classes of interest rate swaps and certain classes of credit default swaps are subject to mandatory clearing, unless an exemption applies. Many of these swaps are also subject to mandatory trading on designated contract markets or swap execution facilities. The CFTC may propose rules designating other classes of swaps for mandatory clearing. Mandatory clearing and trade execution requirements may change the cost and availability of the swaps that we use, and expose our funds to the credit risk of the clearing house through which any cleared swap is cleared. In addition, federal bank regulatory authorities and the CFTC have adopted initial and variation margin requirements for swap dealers, security-based swap dealers and swap entities, including permissible forms of margin, custodial arrangements and documentation requirements for uncleared swaps and security-based swaps. The rules regarding variation margin requirements are now in effect, and as a result some of our funds are required to post collateral to satisfy the variation margin requirements which has made transacting in uncleared swaps more expensive.
Position limits imposed by various regulators, self-regulatory organizations or trading facilities on derivatives may also limit our ability to effect desired trades. Position limits represent the maximum amounts of net long or net short positions that any one person or entity may own or control in a particular financial instrument. The CFTC adopted a final rule that applies specific limits on speculative positions in 25 physical commodity futures contracts, futures and options directly or indirectly linked to such contracts as well as economically equivalent swaps. The final rule had a general compliance date of January 1, 2022 and became effective for economically equivalent swaps on January 1, 2023. The Dodd-Frank Act also authorizes the SEC to establish position limits on security-based swaps, which rules could have a similar impact on our business. The CFTC could propose to expand such requirements to other types of contracts in the future. These rules and any additional proposals could affect our ability and the ability for our funds to enter into derivatives transactions.
The Dodd-Frank Act authorizes federal regulatory agencies to review and, in certain cases, prohibit compensation arrangements at financial institutions that give employees incentives to engage in conduct deemed to encourage inappropriate risk-taking by covered financial institutions. In 2016, federal bank regulatory authorities and the SEC revised and re-proposed a rule that generally: (i) prohibits incentive-based payment arrangements that are determined to encourage inappropriate risks by certain financial institutions by providing excessive compensation or that could lead to material financial loss; and (ii) requires those financial institutions to disclose information concerning incentive-based compensation arrangements to the appropriate federal regulator. For more information on certain incentive compensation paid to our senior executive officers, see “—Risks Related to Shares of Our Common Stock—The market price of shares of our Class A common stock may decline due to the large number of shares of Class A common stock eligible for exchange and future sale.” The Dodd-Frank Act also directs the SEC to adopt a rule that requires public companies to adopt and disclose policies requiring, in the event the company is required to issue an accounting restatement, the contingent repayment obligations of related incentive compensation from current and former executive officers. The SEC has proposed but not yet adopted such rule. To the extent the aforementioned rules are adopted, our ability to recruit and retain investment professionals and senior management executives could be limited.
It is difficult to determine the full extent of the impact on us of new laws, regulations or initiatives that may be proposed or whether any of the proposals will become law. In addition, as a result of proposed legislation, shifting areas of
51

Table of Contents
focus of regulatory enforcement bodies or otherwise, regulatory compliance practices may shift such that formerly accepted industry practices become disfavored or less common. Any changes or other developments in the regulatory framework applicable to our businesses, including the changes described above and changes to formerly accepted industry practices, may impose additional costs on us, require the attention of our senior management or result in limitations on the manner in which we conduct our businesses. Moreover, as calls for additional regulation have increased, there may be a related increase in regulatory investigations of the trading and other investment activities of alternative asset management funds, including our funds. In addition, we may be adversely affected by changes in the interpretation or enforcement of existing laws and rules by these governmental authorities and self-regulatory organizations. Compliance with any new laws or regulations could make compliance more difficult and expensive, affect the manner in which we conduct our businesses and adversely affect our profitability.
State regulation. A number of states and regulatory authorities require investment managers to register as lobbyists. We have registered as such in a number of jurisdictions, including California, Illinois, New York, Pennsylvania, Louisiana, Texas and Kentucky. Other states or municipalities may consider similar legislation or adopt regulations or procedures with similar effect. These registration requirements impose significant compliance obligations on registered lobbyists and their employers, which may include annual registration fees, periodic disclosure reports and internal recordkeeping, and may also prohibit the payment of contingent fees.
Regulatory environment of our funds and portfolio companies of our funds. Each of the regulatory bodies with jurisdiction over us has regulatory powers dealing with many aspects of financial services, including the authority to grant, and in specific circumstances to cancel, permissions to carry on particular activities. A failure to comply with the obligations imposed by the Investment Advisers Act, including recordkeeping, marketing and operating requirements, disclosure obligations and prohibitions on fraudulent activities, could result in investigations, sanctions, restrictions on the activities of us or our personnel and reputational damage. We are involved regularly in trading activities that implicate a broad number of U.S. and foreign securities and tax law regimes, including laws governing trading on inside information, market manipulation and a broad number of technical trading requirements that implicate fundamental market regulation policies. Violation of these laws could result in severe restrictions on our activities and damage to our reputation.
Compliance with existing and new or changing laws and regulations subjects us to significant costs. Moreover, our failure to comply with applicable laws or regulations, including labor and employment laws, could result in fines, censure, suspensions of personnel or other sanctions, including revocation of the registration of our relevant subsidiaries as investment advisers or registered broker-dealers. For example, the SEC requires investment advisers registered or required to register with the SEC under the Investment Advisers Act that advise one or more private funds and have at least $150.0 million in private fund assets under management to periodically file reports on Form PF. We have filed, and will continue to file, quarterly reports on Form PF, which has resulted in increased administrative costs and requires a significant amount of attention and time to be spent by our personnel. The SEC recently adopted changes to Form PF which, among other requirements, require current reporting upon the occurrence of certain fund-level events, which will likely further increase related administrative costs and burdens. Most of the regulations to which our businesses are subject are designed primarily to protect investors in our funds and portfolio companies and to ensure the integrity of the financial markets. They are not designed to protect our stockholders. Even if a sanction is imposed against us, one of our subsidiaries or our personnel by a regulator for a small monetary amount, the costs incurred in responding to such matters could be material, the adverse publicity related to the sanction could harm our reputation, which in turn could have a material adverse effect on our businesses in a number of ways, making it harder for us to raise new funds and discouraging others from doing business with us.
In the past several years, the financial services industry, and private equity and alternative asset managers in particular, has been the subject of heightened scrutiny by regulators around the globe. In particular, the SEC and its staff have focused more narrowly on issues relevant to alternative asset management firms, including by adopting a number of new rules that will likely impose significant changes on investment advisers and their management of private funds and by forming specialized units devoted to examining such firms and, in certain cases, bringing enforcement actions against the firms, their principals and employees. In recent periods there have been a number of enforcement actions within the industry, and it is expected that the SEC will continue to pursue enforcement actions against private fund managers. This increased enforcement activity may cause us to reevaluate certain practices and adjust our compliance control function as necessary and appropriate.
A number of our investing activities, such as our direct lending business, are also subject to regulation by various U.S. and foreign regulators, and may become subject to new laws, regulations or initiatives. It is impossible to determine the full extent of the impact on us of existing regulation or any other new laws, regulations or initiatives that may be proposed or whether any of the proposals will become law. Any changes in the regulatory framework applicable to our businesses, including the changes described above, may impose additional costs on us, require the attention of our senior management or result in limitations on the manner in which we conduct our business. Complying with any new laws or regulations could be more
52

Table of Contents
difficult and expensive, affect the manner in which we conduct our businesses and adversely affect our profitability. As of December 31, 2023, our direct lending AUM represented 46% of our total AUM.
The SEC’s recent lists of examination priorities includes numerous items related to the oversight of asset managers to private funds, such as: (i) conflicts of interest; (ii) calculation and allocation of fees and expenses; (iii) compliance with certain rules under the Investment Advisers Act relating to marketing and custody; and (iv) policies and procedures regarding the use of alternative data. In addition, many firms have received inquiries during examinations or directly from the SEC’s Division of Enforcement regarding private funds, including the acceleration of monitoring fees, the allocation of broken-deal expenses, the disclosure of operating partner or operating executive compensation, outside business activities of firm principals and employees, group purchasing arrangements and general conflicts of interest disclosures. Further, the SEC has recently adopted new rules and amendments to existing rules under the Investment Advisers Act that include: (i) a requirement for detailed quarterly disclosure to private fund investors regarding performance, fees and expenses (including disclosure of the compensation paid to the investment adviser and its affiliates by the private fund) and additional portfolio investment-level disclosure regarding compensation paid to the investment adviser and its affiliates by the portfolio investment; (ii) restrictions on a private fund adviser’s ability to engage in certain activities and practices, such as charging certain fees or expenses, unless the adviser provides certain disclosures to investors, and in some cases, receive investor consent; (iii) limitations on an adviser’s ability to grant certain types of preferential terms regarding redemption or information about portfolio holdings or exposures to only certain private fund investors (e.g., through side letters); (iv) a requirement to provide written notice to investors of preferential terms granted to certain investors in the same private fund; (v) a requirement to obtain an annual audit for each private fund advised by the adviser; (vi) a requirement to obtain a fairness opinion or valuation opinion in connection with an adviser-led secondary transaction; and (vii) a requirement for the adviser to document an annual compliance review in writing.
Further, the SEC has highlighted valuation practices as one of its areas of focus in investment adviser examinations and has instituted enforcement actions against advisers for misleading investors about valuation. If the SEC were to investigate and find errors in our methodologies or procedures, we and/or members of our management could be subject to penalties and fines, which could harm our reputation and our business, financial condition and results of operations could be materially and adversely affected.
Regulations impacting the insurance industry could adversely affect our business and our operations, and our provision of products and services to insurance companies, including through Aspida, subjects us to a variety of risks and uncertainties.
The insurance industry is subject to significant regulatory oversight, both in the U.S. and abroad. Regulatory authorities in many relevant jurisdictions have broad administrative, and in some cases discretionary, authority with respect to insurance companies and/or their investment advisors, which may include, among other things, the investments insurance companies may acquire and hold, marketing practices, affiliate transactions, reserve requirements, capital adequacy including insurance company licensing and examination, agent licensing, establishment of reserve requirements and solvency standards, premium rate regulation, admissibility of assets, policy form approval, unfair trade and claims practices, advertising, maintaining policyholder privacy, payment of dividends and distributions to shareholders, investments, review and/or approval of transactions with affiliates, reinsurance, acquisitions, mergers and other matters. Insurance regulatory authorities regularly review and update these and other requirements. Currently, there are proposals to increase the scope of regulation of insurance holding companies in the U.S., Bermuda and other jurisdictions. Current proposals in Bermuda (intended to become effective by the BMA in March 2024, subject to certain transitional and grandfathering arrangements) relate to changes to the calculation of the technical provisions framework of insurers and insurance groups, amendments to the computation and flexibility of the Bermuda Solvency Capital Requirement, updates to the prudential rules and reporting forms to modify capital requirements and revisions to the fees charged to life insurers regulated by the BMA. Changes in rules and regulations impacting the insurance industry could adversely impact our expansion into the insurance industry, the prospects of our Bermuda insurance company subsidiary Aspida Re and other investments we make in the insurance industry, both in the U.S. and abroad and limit our ability to raise capital for our funds from insurance companies, which could limit our ability to grow.
The U.S. and foreign insurance industries are subject to significant regulation. Regulatory authorities in the U.S. and many relevant jurisdictions have broad regulatory (including through any regulatory support organization), administrative, and in some cases discretionary, authority with respect to insurance companies and/or their investment advisors, which may include, among other things, the investments insurance companies may acquire and hold, marketing practices, affiliate transactions, reserve requirements and capital adequacy. Because these requirements are primarily designed to protect policyholders, regulatory authorities often have wide discretion in applying restrictions and regulations, which may indirectly affect Aspida, Aspida Life, Aspida Re and other parts of our business that operate within or offer products or services to insurance industry.
We may be the target or subject of, or may have indemnification obligations related to, litigation, enforcement investigations or regulatory scrutiny. Regulators and other authorities generally have the power to bring administrative or judicial proceedings against insurance companies, which could result in, among other things, suspension or revocation of
53

Table of Contents
licenses, cease and desist orders, fines, civil penalties, criminal penalties or other disciplinary action. To the extent AIS or another Ares business that offers products to insurance companies, Aspida Life or Aspida Re is directly or indirectly involved in such regulatory actions, our reputation could be harmed, we may become liable for indemnification obligations and we could potentially be subject to enforcement actions, fines and penalties from both U.S. and foreign regulators.
Insurance company investment portfolios are often subject to internal and regulatory requirements governing the categories and ratings of investment products they may acquire and hold. Many of the investment products we develop for, or other assets or investments we include in, insurance company portfolios will be rated and a ratings downgrade or any other negative action by a rating agency with respect to such products, assets or investments could make them less attractive and limit our ability to offer such products to, or invest or deploy capital on behalf of, insurers.
As the ultimate parent of the controlling entity of Aspida Re, a Bermuda Class E insurance company, we are considered its “shareholder controller” (as defined in the Bermuda Insurance Act) by the BMA. Aspida Re is subject to regulation and supervision by the BMA, and compliance with all applicable Bermuda law and Bermuda insurance statutes and regulations, including but not limited to the Bermuda Insurance Act. Under the Bermuda Insurance Act, the BMA maintains supervision over the “controllers” of all registered insurers in Bermuda. For these purposes, a “controller” includes a shareholder controller (as defined in the Bermuda Insurance Act). The Bermuda Insurance Act imposes certain notice requirements upon any person that has become, or as a result of a disposition ceased to be, a shareholder controller, and failure to comply with such requirements is punishable by a fine or imprisonment or both. In addition, the BMA may file a notice of objection to any person or entity who has become a controller of any description where it appears that such person or entity is not, or is no longer, fit and proper to be a controller of the registered insurer, and such person or entity can be subject to fines or imprisonment or both. These laws may discourage potential acquisition proposals for us and could delay, deter or prevent an acquisition of controllers of Bermuda insurers.
Employee misconduct could harm us by impairing our ability to attract and retain investors and subjecting us to significant legal liability, regulatory scrutiny and reputational harm.
Our ability to attract and retain investors and to pursue investment opportunities for our funds depends heavily upon the reputation of our professionals, especially our senior professionals. We are subject to a number of laws, obligations and standards arising from our investment management business and our authority over the assets managed by our investment management business. Further, our employees are subject to various internal policies including a Compliance Manual, a Code of Ethics and our Employee Handbook. The violation of these laws, obligations, standards or policies by any of our employees could adversely affect investors in our funds and us. Our businesses often require that we deal with confidential matters of great significance to companies in which our funds may invest. If our employees or former employees were to use or disclose confidential information improperly, we could suffer serious harm to our reputation, financial position and current and future business relationships. Employee misconduct could also include, among other things, binding us to transactions that exceed authorized limits or present unacceptable risks and other unauthorized activities or concealing unsuccessful investments (which, in either case, may result in unknown and unmanaged risks or losses), concealing or failing to disclose conflicts of interest with our funds or portfolio companies or otherwise charging (or seeking to charge) inappropriate expenses or inappropriate or unlawful behavior or actions directed towards other employees, or misappropriation of confidential or proprietary information relating to us or our funds’ portfolio companies. Such misconduct could subject us to whistleblower claims, regulatory action and monetary or other penalties. Any claims of retaliation against whistleblowers would exacerbate the consequences of any wrongdoing. The growth of our employee base and increasing operational footprint in new jurisdictions as a result of our expanding global presence may heighten the risk of any of the foregoing, particularly in the context of employees who may not have a close familiarity with industries that are regulated in the same way as ours.
It is not always possible to detect or deter employee misconduct, and the extensive precautions we take to detect and prevent this activity may not be effective in all cases. If one or more of our employees or former employees were to engage in misconduct or were to be accused of such misconduct, our businesses and our reputation could be adversely affected and a loss of investor confidence could result, which would adversely impact our ability to raise future funds. Our current and former employees and those of our funds’ portfolio companies may also become subject to allegations of sexual harassment, racial and gender discrimination or other similar misconduct, which, regardless of the ultimate outcome, may result in adverse publicity that could harm our and such portfolio company’s brand and reputation. The pervasiveness of social media, coupled with increased public focus on the externalities of activities unrelated to the business, could further magnify the reputational risks associated with negative publicity.
Changes to the method of determining the LIBOR or the selection of SOFR or SONIA as replacements for LIBOR may affect the value of investments held by us or our funds and could affect our results of operations and financial results.
54

Table of Contents
In July 2017, the FCA, as supervisor of ICE Benchmark Administrator (“IBA”), the administrator of LIBOR, announced that it would phase out LIBOR by the end of 2021 (later extended to the end of June 2023 for USD LIBOR only). IBA ceased publishing GBP, EUR, CHF and JPY LIBOR rates on January 1, 2022 and ceased publishing overnight and 12-month USD LIBOR on June, 30 2023.
In order to avoid disruption for users of LIBOR who were unable to transition to risk-free rates (“RFRs”) prior to relevant deadlines, the FCA required the continued publication of certain LIBOR settings on a changed or “synthetic” methodology (“Synthetic LIBOR”). Synthetic LIBOR settings have been largely transitioned out, and at the date of writing only 3-month GBP Synthetic LIBOR and 1-month, 3-month, and 6-month USD Synthetic LIBOR are being published. Supervised users of all financial contracts other than cleared derivatives are permitted to use these settings in respect of legacy contracts only. The FCA has announced that it intends to compel the publication of these Synthetic LIBOR settings permanently from the following dates: in respect of the GBP Synthetic LIBOR settings, on March 31, 2024, and in respect of the USD Synthetic LIBOR settings, on September 30, 2024.
The nominated replacement for USD LIBOR is the Secured Overnight Financing Rate (“SOFR”) and the nominated replacement for GBP-LIBOR is the Sterling Overnight Interbank Average Rate (“SONIA”). In March 2020, the Federal Reserve began publishing 30-day, 90-day and 180-day tenor SOFR Averages and a SOFR Index and in July 2020, Bloomberg began publishing fall-backs that the International Swaps and Derivatives Association (“ISDA”) implemented in lieu of LIBOR with respect to swaps and derivatives. In July 2021, the CME Group’s forward-looking SOFR term rates were formally recommended by the Alternative Reference Rates Committee.
SOFR and SONIA have a limited history. The future performance of SOFR and SONIA, and SOFR- and SONIA-based reference rates, is uncertain. Future levels of SOFR and SONIA may bear little or no relation to historical levels of SOFR, LIBOR or other rates. SOFR and SONIA are transaction-based rates, and each has been more volatile than other benchmark or market rates during certain periods. Accordingly, use of SOFR or SONIA may result in market inefficiencies. For these reasons, among others, there is no assurance that SOFR or SONIA, or rates derived from SOFR or SONIA, will perform in the same or similar way as USD LIBOR would have performed at any time, and there is no assurance that SOFR- or SONIA-based rates will be a suitable substitute for USD LIBOR.
Regulatory changes in jurisdictions outside the U.S. could adversely affect our businesses.

Certain of our subsidiaries operate outside the U.S. In Luxembourg, AM Lux is subject to regulation by the CSSF. In the U.K., the U.K. Regulated Entities are subject to regulation by the FCA. In some circumstances, the U.K. Regulated Entities and other Ares entities are or become subject to U.K. or EU laws, for instance in relation to marketing our funds to investors in the EEA.
Despite the U.K.’s departure from the EU on January 31, 2020 (see “—The U.K.’s exit from the EU (“Brexit”) could adversely affect our business and our operations” for further detail), new and existing EU legislation is expected to continue to impact our business in the U.K. The following EU measures are of particular relevance to our business.
In March 2013, the predecessor regulator to the FCA published final rules for the FCA’s regulation and supervision of the London Interbank Offered Rate (“LIBOR”). In particular, the FCA’s LIBOR rules include requirements that (1) an independent LIBOR administrator monitor and survey LIBOR submissions to identify breaches of practice standards and/or potentially manipulative behavior, and (2) firms submitting data to LIBOR establish and maintain a clear conflicts of interest policy and appropriate systems and controls. These requirements may cause LIBOR to be more volatile than it has been in the past, which may adversely affect the value of investments made by our funds. On February 3, 2014, ICE Benchmark Administration Limited took responsibility for administering LIBOR, following regulatory authorization by the FCA. LIBOR is expected to be phased out over the coming years. The Bank of England working group has approved Sterling Overnight Interest Average (“SONIA”) as its preferred short-term interest benchmark and will take over its administration from April 2018. The impact this change will have is uncertain.
The EU BenchmarksSecuritisation Regulation (the “Benchmarks“Securitisation Regulation”) entered into force on June 30, 2016. It aims to introduce a common framework and consistent approach to benchmark regulation across the EU by regulating producers, contributors to and users of benchmarks. The Benchmarks Regulation will replace the current UK framework regulating LIBOR and other specified benchmarks, notably the Euro interbank offered rate (“EURIBOR”). The majority of provisions in the Benchmarks Regulation took effect on January 1, 2018. Although there are measures in the Benchmarks Regulation which are designed to prevent certain benchmarks from being undermined by a material reduction of benchmark contributors, it is not yet clear how successful these will be. The Benchmarks Regulation may therefore lead to unpredictable developmentsincludes requirements in relation to LIBORtransparency and certain other benchmarks,risk retention and restricts AIFMs from investing in securitizations which could affectdo not comply with its provisions (“non-compliant securitizations”). The Securitisation Regulation also imposes an obligation on AIFMs to divest any interest in a non-compliant securitization. It is currently unclear if the value of investments made by our funds.
The EU Capital Requirements Directive IV and Capital Requirements Regulation (collectively, “CRD IV”) and the EU Alternative Investment Fund Managers Directive (the “Directive”) restrict the ability of banks andapplies to non-EU marketing one or more alternative investment funds (“AIFs”) managed in the EUEEA under a national private placement regime. This lack of clarity may hamper our ability to invest in securitization vehicles including collateralized loan obligations operated by us unless either the “originator”, “original lender” or “sponsor” (as those terms are definedraise capital for some of our non-EEA funds from investors in the legislation) retains a 5% interestEEA or subject such fund raising to additional risks, including, if application of the Securitisation Regulation to non-EEA AIFMs is confirmed, that their funds that market in the securitization concerned. Where such securitization arrangements are managed by Ares-affiliated undertakings, andEEA could be required to divest of interests in ordernon-compliant securitizations at sub-optimal prices.
Following the U.K.’s exit from the EU, the U.K. intends to makerepeal the securitization attractive to banks and AIFs, this risk retention requirement is held by an appropriately (EU) authorized and regulated entity affiliated with us (i.e., as “sponsor”). The holding of that retention on our affiliate’s balance sheet is likely to increase that entity’s regulatory capital requirement and will accordingly adversely affect return on equity. On December 28, 2017 the textU.K.’s current implementation of the new SecuritizationSecuritisation Regulation wasand has published draft legislation (the “Securitisation Regulations 2023”) as part of a policy statement, identifying several areas for revision in the EU Official Journal.U.K. and divergence from the EU’s Securitisation Regulation. The new regulation will apply from January 1, 2019 to securitization issued after that date. Although risk retention requirements will remain at 5% (of material net economic interest) a mechanism has been introduced whereby this requirement could be modified withoutpolicy statement and the need fordraft Securitisation Regulations 2023 are still under review and the change to be made through the normal EU legislative process. Therefinal rules are also new investor transparency requirements which require additional information to be disclosed to investors. Compliance with these new requirements in the Securitization Regulation may result in us incurring material costs.still unclear.
The EU Regulation on OTCover-the-counter (“OTC”) derivative transactions, central counterparties and trade repositories (commonly known as the(the “European Market Infrastructure Regulation” or “EMIR”) will requirerequires the mandatory clearing of certain over-the-counter (“OTC”)OTC derivatives through central counterparties andcounterparties. This creates additional risk mitigation requirements (including, in particular, margining requirementsrequirements) in respect of certain OTC derivative transactions that are not cleared by a central counterparty.counterparty and imposes reporting and record keeping requirements in respect of most derivative transactions. The implementationrequirements are similar to, but not the same as, those in Title VII of the Dodd-Frank Act. The U.K. has on-shored EMIR, is phased; timing is dependentwith the effect that a similar but not identical set of rules apply in the U.K. (“U.K. EMIR”). Certain cross-border arrangements (e.g., where an Ares European fund
55

Table of Contents
enters into derivatives transactions with a U.K. counterparty, transacts on a U.K. trading venue or clears its derivatives transactions through a U.K. clearing house, and vice versa) may be impacted. Although EMIR and U.K. EMIR are substantively similar, there are some areas of regulatory divergence (including differences in the typeway in which derivatives are reported and a lack of derivativeequivalence declarations between the U.K. and the categorizationEU with respect to trade repositories) and there can be no guarantee that the U.K. will move in lockstep with the future changes proposed by the EU.
The EU regulation on transparency of securities financing transactions (“SFTR”) requires the partiesmandatory reporting of certain securities financing transactions (“SFTs”), disclosure obligations to counterparties regarding the re-use of collateral, and certain transparency and disclosure obligations for managers of UCITS and AIFs in respect of SFTs and total return swaps. The new SFTR validation rules, which were updated in March 2023, are effective as of September 2023. The U.K. has on-shored SFTR, with the effect that a similar but not identical set of rules apply in the U.K. (“U.K. SFTR”). Certain cross-border arrangements (such as those where an Ares European fund enters into SFT with a U.K. counterparty) may be impacted. Although SFTR and U.K. SFTR are substantively similar, there are some areas of regulatory divergence (including with respect to the trade. Implementation deadlines have already been deferred but as they currently stand full implementation is due by July 9, 2019. EMIR has started to impact on Ares-affiliated undertakingsnew validation rules) and as further implementation dates are reachedthere can be no guarantee that the cost of complyingU.K. will move in lockstep with the requirements is likely to increase. In addition, there is an amendment to EMIR currently working its way through EUfuture changes proposed by the legislative process. Among other things the amendment would classify securitization special purpose entities as financial counterparties which may indirectly impact certain aspects of our business.
On December 14, 2015, the European Banking Authority published guidelines which are relevant to, among other things, EU banks' exposures to shadow banking entities. These guidelines became effective on January 1, 2017. The definition of a shadow banking entity is extremely wide and could potentially include a number of different entities, such as investment funds and securitization vehicles. AIFs are excluded from the definition of a shadow banking entity unless they: (1) deploy leverage within the meaning of the Directive on a substantial basis; or (2) are permitted to originate loans or purchase third party lending exposures onto their balance sheet pursuant to the relevant fund rules or constitutional documents. These guidelines may affect our ability to raise capital in certain of our funds from EU banks.
On December 20, 2017, the European Commission published a proposal for a new directive and regulation on prudential requirements for MiFID investment firms, and the proposal will directly apply to our subsidiaries Ares Management Limited and Ares European Loan Management LLP. Its application to Ares Management UK Limited is unclear. Under the proposals most affected firms would see their capital requirements increase significantly, although there would be transitional provisions allowing

firms to increase their capital to the necessary level over three to five years. Firms will also have their liquidity requirements increased and some firms will be subject to additional public reporting requirements and pay regulation. The proposals are likely to increase the cost of us conducting business in the EEA. The legislative package is not expected to come into force until 2020 at the earliest.EU.    
Our U.K., other European and Asian operations and our investment activities worldwide are subject to a variety of regulatory regimes that vary by country. In the EU, examples of further legislation may include proposals for further changes to or reviews of the extent and interpretation of pay regulation, including under the EU Regulation on the prudential requirements of investment firms (Regulation (EU) 2019/2033) and its accompanying Directive (Directive (EU) 2019/2034) or the U.K. version, the Investment Firms Prudential Regime (which may have an impact on the retention and recruitment of key personnel), proposals for enhanced regulation of loan origination (see “—Alternative Investment Fund Managers Directive”), credit servicing (see “—Credit Servicers and Purchasers Directive”) and new reporting requirements in relation to securities financing transactions. In the U.K., additional rule changes have affected the approval of certain Ares professionals in the U.K. to work in the regulated financial services sector. Implementation of these new rules may increase our compliance burden and costs. In addition, we regularly rely on exemptions from various requirements of the regulations of certain foreign countries in conducting our asset management activities.
Each of the regulatory bodies with jurisdiction over us has regulatory powers dealing with many aspects of financial services, including the authority to grant, and in specific circumstances to cancel, permissions to carry on particular activities. We are involved regularly in trading activities that implicate a broad number of foreign (as well as U.S.) securities law regimes, including laws governing trading on inside information and market manipulation and a broad number of technical trading requirements that implicate fundamental market regulation policies. Violation of these laws could result in severe restrictions or prohibitions on our activities and damage to our reputation, which in turn could have a material adverse effect on our businesses in a number of ways, making it harder for us to raise new funds and discouraging others from doing business with us. In addition, increasing global regulatory oversight of fundraising activities, including local registration requirements in various jurisdictions and the addition of new compliance regimes, could make it more difficult for us to raise new funds or could increase the cost of raising such funds.
Alternative Investment Fund Managers Directive (the "Directive")
The Directive was enacted in July 2011 and took effect on July 22, 2013. The Directive    AIFMD applies to (1) Alternative Investment Fund Managers (“AIFMs”)to: (i) AIFMs established in the EEA that manage EEA or non‑EEA AIFs, (2) non‑EEAnon-EEA AIFs; (ii) non-EEA AIFMs that manage EEA AIFsAIFs; and (3) non‑EEA(iii) non-EEA AIFMs that market their AIFs to professional investors within the EEA.
Beginning July 22, 2013, Non-EEA AIFMs do not currently benefit from marketing passport rights and may only market AIFs to investors in some EEA jurisdictions in accordance with national private placement regimes. The U.K. implemented AIFMD while it was still a member of the Directive imposed new operatingEU and “on-shored” it as part of U.K. law, such that similar requirements the categories of AIFMs listed at (1) and (2)continue to apply in the paragraph above. In addition, eachU.K. notwithstanding Brexit.
    On November 10, 2023, the European Commission published a near-final amending directive, commonly referred to as “AIFMD II”. Assuming AIFMD II is adopted promptly and published in the Official Journal without delay, most of the AIFMs identified at (1), (2) and (3)changes will come into effect in 2026, subject to the grandfathering period for certain of the paragraph aboveloan origination provisions and certain Annex IV disclosure requirements which will needcome into effect a year later. It is not yet clear to comply withwhat extent (if any) the Directive’s disclosureU.K. will seek to reflect AIFMD II in its domestic rules implementing AIFMD.
The draft contains a number of amendments to AIFMD, including more onerous delegation requirements which may require a review of AM Lux’s existing arrangements, enhanced substance requirements, additional liquidity management provisions for AIFMs to the extent that they manage open-ended AIFs, and transparencyrevised regulatory reporting and investor disclosures requirements. The draft also proposed significant new requirements when seekingrelating to the activities of funds managed by AM Lux which originate loans including new restrictions on the structure which such funds may take.
56

Table of Contents
AIFMD II may result in new restrictions on the ability of certain of our affiliates other than AM Lux to register funds for marketing to investors in certain EEA states.
AIFMD II imposes a range of requirements on AIFMs which may increase the cost of doing business for AM Lux and Ares’ non-EEA AIFMs (including AMUKL) to the extent they market withinfunds in the EEA and potentially disadvantages our funds as investors in private companies located in EEA member states compared to non-AIF/AIFM competitors that may not be subject to such requirements. It is not yet clear to what extent (if any) the caseU.K. will seek to reflect AIFMD II in its domestic rules implementing AIFMD.
    While there is no current indication that the non-EEA AIFM passport provisions of non‑EEA AIFMs seeking to market under jurisdiction specific private placement regimes, additional jurisdiction specific requirements where these exist (e.g., appointing a depositary).
The full scope of the Directive may also be extended on a jurisdiction-by-jurisdiction basis to non‑EEA AIFMs that wish to market an AIF within the EEA pursuant to a pan‑European marketing passport. In July 2016, the European Securities and Markets Authority (“ESMA”) published advice to EU institutions on extending the passport toAIFMD will become effective or available, certain non-EU jurisdictions. This included positive assessments in respect of extending the passport under the Directive to five non-EEA jurisdictions, which notably did not include the United States or the Cayman Islands. ESMA expressed a qualified assessment in respect of the United States due to concerns about reciprocity of market access. ESMA gave no assessment in respect of the Cayman Islands. The European Commission was expected and arguably required to publish legislation before the end of October 2016 setting a date for the pan-European marketing passport to be made available, at least in respect of the five non-EEA jurisdictions it had assessed positively. In 2017 the European Commission started a review of the application and scope of AIFMD. The European Commission is expected to make a legislative proposal as a result of the review (commonly referred to as "AIFMD II") with any changes to non-EEA jurisdiction passporting rights forming part of the proposal.
Certain of the jurisdiction specific private placement regimes may cease to exist whenin the non-EEA AIFM passport becomes available.case that it does. This development could have a negative impact on our ability to raise capital from EEA investors if, for example, a jurisdiction specific private placement regime ceases to operate and the non-EEA AIFM passport is not made available to United StatesU.S. or U.K. AIFMs.
The operating requirements imposed by the Directive include, among other things, rules relating to the remuneration of certain personnel, minimum regulatory capital requirements, restrictions on the use of leverage, restrictions on early distributions relating to portfolio companies (so called “asset stripping rules”), disclosure and reporting requirements to both investors and home state regulators, the independent valuation of an AIF’s assets and the appointment of an independent depository to hold assets. As a result, the Directive increases the regulatory burden and the cost of doing business for Ares Management UK Limited and, to a more limited extent, non-EEA AIFMs which market to non-EEA AIFs under EEA private placement regimes. This potentially disadvantages our funds as investors in private companies located in EEA member states when compared to non‑AIF/AIFM competitors that may not be subject to the requirements of the Directive, thereby potentially restricting our funds’ ability to invest in such companies. “Levelling-up” of some of these requirements seems likely under AIFMD II.
The Directive could also limit our operating flexibility and our investment opportunities, as well as expose us and/or our funds to conflicting regulatory requirements in the United States (and elsewhere).
Solvency IIAlternative Investment Fund Managers Directive
Directive 2009/138/EC on    AIFMD applies to: (i) AIFMs established in the taking‑upEEA that manage EEA or non-EEA AIFs; (ii) non-EEA AIFMs that manage EEA AIFs; and pursuit(iii) non-EEA AIFMs that market their AIFs to professional investors within the EEA. Non-EEA AIFMs do not currently benefit from marketing passport rights and may only market AIFs to investors in some EEA jurisdictions in accordance with national private placement regimes. The U.K. implemented AIFMD while it was still a member of the businessEU and “on-shored” it as part of InsuranceU.K. law, such that similar requirements continue to apply in the U.K. notwithstanding Brexit.
    On November 10, 2023, the European Commission published a near-final amending directive, commonly referred to as “AIFMD II”. Assuming AIFMD II is adopted promptly and Reinsurance (“Solvency II”) sets out stronger capital adequacypublished in the Official Journal without delay, most of the changes will come into effect in 2026, subject to the grandfathering period for certain of the loan origination provisions and risk managementcertain Annex IV disclosure requirements for European insurers and reinsurers and,which will come into effect a year later. It is not yet clear to what extent (if any) the U.K. will seek to reflect AIFMD II in particular, dictates how much capital such firms must hold against their liabilities and introduces a risk‑based assessment of those liabilities. Solvency II came into force on January 1, 2010 but was only required to be implemented by firms on January 1, 2016. There are alsoits domestic rules implementing AIFMD.
The draft contains a number of transitionalamendments to AIFMD, including more onerous delegation requirements which may require a review of AM Lux’s existing arrangements, enhanced substance requirements, additional liquidity management provisions designedfor AIFMs to avoid market disruption. Solvencythe extent that they manage open-ended AIFs, and revised regulatory reporting and investor disclosures requirements. The draft also proposed significant new requirements relating to the activities of funds managed by AM Lux which originate loans including new restrictions on the structure which such funds may take.
56

Table of Contents
AIFMD II may result in new restrictions on the ability of certain of our affiliates other than AM Lux to register funds for marketing to investors in certain EEA states.
AIFMD II imposes among other things, substantially greater quantitativea range of requirements on AIFMs which may increase the cost of doing business for AM Lux and qualitative capital requirements for insurersAres’ non-EEA AIFMs (including AMUKL) to the extent they market funds in the EEA and reinsurerspotentially disadvantages our funds as well as other supervisory and disclosure requirements. We areinvestors in private companies located in EEA member states compared to non-AIF/AIFM competitors that may not subject to Solvency II; however, many of our European insurer or reinsurer fund investors are subject to this directive, as applied under applicable domestic law. Solvency II may impact insurers’ and reinsurers’ investment decisions and their asset allocations. In addition, insurers and reinsurers will be subject to more onerous data collation and reportingsuch requirements. It is not yet clear to what extent (if any) the U.K. will seek to reflect AIFMD II in its domestic rules implementing AIFMD.

requirements. As a result, Solvency II could have an adverse indirect effect on our businesses by, among other things, restricting    While there is no current indication that the abilitynon-EEA AIFM passport provisions of European insurers and reinsurersAIFMD will become effective or available, certain of the jurisdiction specific private placement regimes may cease to invest in our funds and imposing on us extensive disclosure and reporting obligations for those insurers and reinsurers that do invest in our funds. A number of reviews of and amendments to various aspects and components of Solvency II are expected throughout 2018.
MiFID II
The recast Markets in Financial Instruments Directive and Markets in Financial Instruments Regulation (collectively referred to as MiFID II) came into effect on January 3, 2018. MiFID II amends the existing MiFID regime and, among other requirements, introduces new organizational and operational requirements for investment firmsexist in the EEA.  Compliance with these new rules requires updates to some existing procedures, systems and controls and thecase that it does. This development of new internal systems, which may include substantial automated and electronic systems, and is likely to involve material costs to the business.
European Union Referendum in the United Kingdom
On June 23, 2016, the United Kingdom ("UK") electorate voted in support of the UK leaving the European Union ("EU").  The implications of the UK’s pending withdrawal from the EU are unclear at present because the relationship between the UK and the EU after such withdrawal is unclear.   It is likely that this matter will be negotiated over the next several years.  As a result, our ability to, among other things, (1) market interests in our funds to EU investors; and/or (2) lend to EU borrowers or invest in EU assets may be adversely affected.
Competition
The investment management industry is intensely competitive, and we expect it to remain so. We compete both globally and on a regional, industry and asset basis.
We face competition both in the pursuit of fund investors and investment opportunities. Generally, our competition varies across business lines, geographies and financial markets. We compete for outside investors based on a variety of factors, including investment performance, investor perception of investment managers’ drive, focus and alignment of interest, quality of service provided to and duration of relationship with investors, breath of our product offering, business reputation and the level of fees and expenses charged for services. We compete for investment opportunities based on a variety of factors, including breadth of market coverage and relationships, access to capital, transaction execution skills, the range of products and services offered, innovation and price.
We expect to face competition in our direct lending, trading, acquisitions and other investment activities primarily from business development companies, credit and real estate funds, specialized funds, hedge fund sponsors, financial institutions, private equity funds, corporate buyers and other parties. Many of these competitors in some of our businesses are substantially larger and have considerably greater financial, technical and marketing resources than are available to us. Many of these competitors have similar investment objectives to us, which may create additional competition for investment opportunities. Some of these competitors may also have a lower cost of capital and access to funding sources that are not available to us, which may create competitive disadvantages for us with respect to investment opportunities. In addition, some of these competitors may have higher risk tolerances, different risk assessments or lower return thresholds, which could allow them to consider a wider variety of investments and to bid more aggressively than us for investments that we want to make. Corporate buyers may be able to achieve synergistic cost savings with regard to an investment that may provide them with a competitive advantage in bidding for an investment. Lastly, institutional and individual investors are allocating increasing amounts of capital to alternative investment strategies. Several large institutional investors have announced a desire to consolidate their investments in a more limited number of managers. We expect that this will cause competition in our industry to intensify and could lead to a reduction in the size and duration of pricing inefficiencies that many of our funds seek to exploit.
Competition is also intense for the attraction and retention of qualified employees. Our ability to continue to compete effectively in our businesses will depend upon our ability to attract new employees and retain and motivate our existing employees.
For additional information concerning the competitive risks that we face, see “Item 1A. Risk Factors—Risks Related to Our Businesses—The investment management business is intensely competitive.”


Available Information
Ares Management, L.P. was formed as a Delaware limited partnership on November 15, 2013. Our principal executive offices are located at 2000 Avenue of the Stars, 12th Floor, Los Angeles, California 90067, and our telephone number is (310) 201- 4100.
Our website address is http://www.aresmgmt.com. Information on our website is not a part of this report and is not incorporated by reference herein. We make available free of charge on our website or provide a link on our website to our Annual Report on Form 10‑K, Quarterly Reports on Form 10‑Q and Current Reports on Form 8‑K and any amendments to those reports filed or furnished pursuant to Section 13(a) or 15(d) of the Exchange Act, as soon as reasonably practicable after those reports are electronically filed with, or furnished to, the SEC. To access these filings, go to the “Investor Resources” section of our website and then click on “SEC Filings.” You may also read and copy any document we file with the SEC at the SEC’s public reference room located at 100 F Street, N.E., Washington, DC 20549. Please call the SEC at 1‑800‑SEC‑0330 for further information on the public reference room. In addition, these reports and the other documents we file with the SEC are available at a website maintained by the SEC at http://www.sec.gov.

ITEM 1A.  RISK FACTORS
Summary of Risks
Our businesses are subject to a number of inherent risks. We believe that the primary risks affecting our businesses and an investment in our shares are:
a complex regulatory and tax environment involving rules and regulations (both domestic and foreign), some of which are outdated relative to today’s complex financial activities and some of which are subject to political influence, which could restrict or require us to adjust our operations or the operations of our funds or portfolio companies and subject us to increased compliance costs and administrative burdens, as well as restrictions on our business activities;
poor performance by our funds due to market conditions, political actions or environments, monetary and fiscal policy or other conditions beyond our control;
the reputational harm that we would experience as a result of inappropriately addressing conflicts of interest, poor performance by the investments we manage or the actual or alleged failure by us, our employees, our funds or our portfolio companies to comply with applicable regulations in an increasingly complex political and regulatory environment;
potential variability in our period to period earnings due primarily to mark‑to‑market valuations of our funds’ investments. As a result of this variability, the market price of our common shares may be volatile and subject to fluctuations; the increasing demands of the investing community, including the potential for fee compression and changes to other terms, which could materially adversely affect our revenues; and
an investment in our shares is not an investment in our underlying funds. Moreover, there can be no assurance that projections respecting performance of our underlying funds or unrealized values will be achieved.
Risks Related to Our Businesses
Difficult market and political conditions may adversely affect our businesses in many ways, including by reducing the value or hampering the performance of the investments made by our funds or reducing the ability of our funds to raise or deploy capital, each of which could materially reduce our revenue, net income and cash flow and adversely affect our financial prospects and condition.
Our businesses are materially affected by conditions in the global financial markets and economic and political conditions throughout the world, such as interest rates, the availability and cost of credit, inflation rates, economic uncertainty, changes in laws (including laws relating to our taxation, taxation of our investors and the possibility of changes to regulations applicable to alternative asset managers), trade barriers, commodity prices, currency exchange rates and controls and national and international political circumstances (including wars, terrorist acts and security operations). These factors are outside of our control and may affect the level and volatility of securities prices and the liquidity and value of investments, and we may not be able to or may choose not to manage our exposure to these conditions.
Global financial markets have experienced heightened volatility in recent periods, including as a result of economic and political events in or affecting the world’s major economies. For example, the decision of the People’s Bank of China in January 2016 to reduce the foreign exchange value of the renminbi and subsequent slowdown in China’s industrial sector, the June 2016 referendum in the UK in favor of exiting the EU and subsequent uncertainty regarding the timing and terms of the exit, the 2016 U.S. presidential and congressional election and resulting uncertainty regarding potential shifts in U.S. and foreign, trade, economic and other policies, and, more recently, concerns over increasing interest rates (particularly short-term rates) and uncertainty regarding the short- and long-term effects of tax reform in the United States, have precipitated market volatility. In addition, numerous structural dynamics and persistent market trends have exacerbated volatility generally. Concerns over significant declines in the commodities markets, the implementation by central banks of synchronized global monetary tightening, sluggish economic expansion in non-U.S. economies, including continued concerns over growth prospects in China and emerging markets, growing debt loads for certain countries and uncertainty about the consequences of the U.S. and other governments withdrawing monetary stimulus measures all highlight the fact that economic conditions remain unpredictable and volatile. As a result, although global economies experienced widespread growth in 2017, there is a high risk of significant ongoing volatility. Moreover, there is a risk of both sector-specific and broad based corrections and/or downturns in the equity and credit markets. For example, in February 2018, global equity markets experienced a widespread sell-off, and bonds have also declined in value. Any of the foregoing could

have a significant impact on the markets in which we operate and a material adverse impact on our business prospects and financial condition.
Further, the transition of leadership following the 2016 U.S. presidential and congressional elections, the current U.S. political environment and the resulting uncertainties regarding actual and potential shifts in U.S. foreign, trade, economic and other policies under the new administration have led to further disruption, instability and volatility in the global markets. There can be no assurance these market conditions will not continue or worsen in the future.
A number of factors have had and may continue to have an adverse impact on credit markets in particular. The weakness and the uncertainty regarding the stability of the oil and gas markets resulted in a tightening of credit across multiple sectors. The low price of oil increased default risk among borrowers that have exposure to the energy sector. In addition, following a sustained period of historically low interest rate levels, the Federal Reserve has raised the federal funds rate on multiple occasions since December 2015. Short-term interest rates have risen by 90 to 120 basis points (bps) since the U.S. presidential election in November 2016, with 10 to 20 bps of such amount attributable to increases seen between January 1, 2018 and February 8, 2018. Changes in and uncertainty surrounding interest rates may have a material effect on our business, particularly with respect to the cost and availability of financing for significant acquisition and disposition transactions. Furthermore, some of the provisions under the newly enacted tax law in the United States, Public Law No. 115-97 (the “Tax Cuts and Jobs Act”) could have a negative impact on the cost of financing and dampen the attractiveness of credit. Moreover, while conditions in the U.S. economy have generally improved since the credit crisis, many other economies continue to experience weakness, tighter credit conditions and a decreased availability of foreign capital. Since credit represents a significant portion of our business and ongoing strategy, any of the foregoing could have a material adverse impact on our business prospects and financial condition.
These and other conditions in the global financial markets and the global economy have resulted in, and may continue to result in, adverse consequences for us and many of our funds, each of which could adversely affect the business of such funds, restrict such funds’ investment activities, impede such funds’ ability to effectively achieve their investment objectives and result in lower returns than we anticipated at the time certain of our investments were made. More specifically, these economic conditions could adversely affect our operating results by causing:
decreases in the market value of securities, debt instruments or investments held by some of our funds;
illiquidity in the market, which could adversely affect transaction volumes and the pace of realization of our funds’ investments or otherwise restrict the ability of our funds to realize value from their investments, thereby adversely affecting our ability to generate incentive or other income;
our assets under management to decrease, thereby lowering a portion of our management fees payable by our funds to the extent they are based on market values; and
increases in costs or reduced availability of financial instruments that finance our funds.
During periods of difficult market conditions or slowdowns (which may be across one or more industries, sectors or geographies), companies in which we invest may experience decreased revenues, financial losses, credit rating downgrades, difficulty in obtaining access to financing and increased funding costs. During such periods, these companies may also have difficulty in expanding their businesses and operations and be unable to meet their debt service obligations or other expenses as they become due, including expenses payable to us. Negative financial results in our funds’ portfolio companies may reduce the value of our portfolio companies, the net asset value of our funds and the investment returns for our funds, which could have a material adverse effect on our operating results and cash flow. In addition, such conditions would increase the risk of default with respect to credit-oriented or debt investments. Our funds may be adversely affected by reduced opportunities to exit and realize value from their investments, by lower than expected returns on investments made prior to the deterioration of the credit markets and by our inability to find suitable investments for the funds to effectively deploy capital, which could adversely affect our ability to raise new funds and thus adversely impact our prospects for future growth.
Political and regulatory conditions, including the effects of negative publicity surrounding the financial industry in general and proposed legislation, could adversely affect our businesses or cause a material increase in our tax liability.
As a result of market disruptions and highly publicized financial scandals in recent years, regulators and investors have exhibited concerns over the integrity of the U.S. financial markets, and the businesses in which we operate both in the United States and outside the United States will be subject to new or additional regulations. We may be adversely affected as a result of new or revised legislation or regulations imposed by the SEC, the CFTC or other U.S. governmental regulatory authorities or self-

regulatory organizations that supervise the financial markets. We may also be adversely affected by changes in the interpretation or enforcement of existing laws and rules by these governmental authorities and self-regulatory organizations. See “-Regulatory changes and other developments in the United States and regulatory compliance failures could adversely affect our reputation, businesses and operations.”
Her Majesty’s Treasury (“HM Treasury”), the Organization for Economic Co-operation and Development (the “OECD”) and other government agencies in jurisdictions where we and our affiliates invest or conduct business have maintained a focus on issues related to the taxation of businesses, including multinational entities.
In the United Kingdom, the UK Criminal Finances Act 2017 creates two new separate corporate criminal offences: failure to prevent facilitation of UK tax evasion and failure to prevent facilitation of overseas tax evasion. The scope of the new law and guidance is extremely wide and could have an impact on Ares’ global businesses. Liability can be mitigated where the relevant business has in place reasonable prevention procedures. Separately, the United Kingdom has implemented transparency legislation that will require many large businesses to publish their UK tax strategies on their websites. As part of the publication requirement, organizations must disclose information on tax risk management and governance, tax planning, tax risk appetite and their approach to Her Majesty’s Revenue and Customs. These developments show that the United Kingdom is seeking to bring corporate tax matters further into the public domain. As a result, tax matters may pose an increased reputational risk to our business.
The OECD, which represents a coalition of member countries, has issued guidance through its Base Erosion and Profit Shifting (“BEPS”) project that contemplates changes to long standing international tax norms that determine each country’s jurisdiction to tax cross-border trade and profits. Several of the proposed measures, including measures covering treaty abuse, the deductibility of interest expense, local nexus requirements, transfer pricing and hybrid mismatch arrangements are potentially relevant to some of our structures and could have an adverse tax impact on our funds, investors and/or our portfolio companies. In June 2017, almost 70 countries (excluding the United States) formally signed the Multilateral Convention to Implement Tax Treaty Related Measures to Prevent BEPS (the “Convention”). These changes in law or guidance and additional proposals for reform, if enacted by the United States or by other countries in which we or our affiliates invest or conduct business, could adversely affect our investment returns, including, for example, by eliminating certain tax treaty benefits and increasing our tax compliance costs. Whether these or other proposals will be enacted by the United States or any foreign jurisdiction and in what form is unknown, as are the ultimate consequences of any such proposed legislation. See “-Risks Related to Taxation.”
Newly enacted laws, such as Tax Cuts and Jobs Act, or regulations and future changes in the U.S. taxation of businesses may impact our effective tax rate or may adversely affect our business, financial condition and operating results.
On December 22, 2017, the President signed into law the Tax Cuts and Jobs Act, which significantly changed the Code, including a reduction in the statutory corporate income tax rate to 21%, a new limitation on the deductibility of business interest expense, restrictions on the use of net operating loss carryforwards arising in taxable years beginning after December 31, 2017 and dramatic changes to the taxation of income earned from foreign sources and foreign subsidiaries. The Tax Cuts and Jobs Act also authorizes the Treasury Department to issue regulations with respect to the new provisions. We cannot predict how the changes in the Tax Cuts and Jobs Act, regulations, or other guidance issued under it or conforming or non-conforming state tax rules might affect us or our business. In addition, there can be no assurance that U.S. tax laws, including the corporate income tax rate, would not undergo significant changes in the near future.
Our business depends in large part on our ability to raise capital from investors. If we were unable to raise such capital, we would be unable to collect management fees or deploy such capital into investments, which would materially reduce our revenues and cash flow and adversely affect our financial condition.
Our ability to raise capital fromEEA investors depends on a number of factors, including many that are outside our control. Investors may downsize their investment allocations to alternative asset managers, including private funds and hedge funds, to rebalance a disproportionate weighting of their overall investment portfolio among asset classes. Poor performance of our funds, or regulatory or tax constraints, could also make it more difficultif, for us to raise new capital. Our investors and potential investors continually assess our funds’ performance independently and relative to market benchmarks and our competitors, which affects our ability to raise capital for existing and future funds. If economic and market conditions deteriorate or continue to be so volatile, we may be unable to raise sufficient amounts of capital to support the investment activities of future funds. If we were unable to successfully raise capital, our revenue and cash flow would be reduced, and our financial condition would be adversely affected. Furthermore, while our senior professional owners have committed substantial capital to our funds, commitments from new investors may depend on the commitments made by our senior professional owners to new funds and there can be no assurance that there will be further commitments to our funds, and any future investments by them in our funds or other alternative investment categories will likely depend on the performance of our funds, the performance of their overall investment portfolios and other investment opportunities available to them.

We depend on the Holdco Members, senior professionals and other key personnel, and our ability to retain them and attract additional qualified personnel is critical to our success and our growth prospects.
We depend on the diligence, skill, judgment, business contacts and personal reputations of the Holdco Members, senior professionals and other key personnel. Our future success will depend upon our ability to retain our senior professionals and other key personnel and our ability to recruit additional qualified personnel. These individuals possess substantial experience and expertise in investing, are responsible for locating and executing our funds’ investments, have significant relationships with the institutions that are the source of many of our funds’ investment opportunities and, in certain cases, have strong relationships with our investors. Therefore, if any of our senior professionals or other key personnel join competitors or form competing companies, it could result in the loss of significant investment opportunities, limit our ability to raise capital from certain existing investors or result in the loss of certain existing investors.
The departure or bad acts for any reason of any of our senior professionals, or a significant number of our other investment professionals, could have a material adverse effect on our ability to achieve our investment objectives, cause certain of our investors to withdraw capital they invest with us or elect not to commit additional capital to our funds or otherwise have a material adverse effect on our business and our prospects. The departure of some or all of those individuals could also trigger certain “key person” provisions in the documentation governing certain of our funds, which would permit the investors in those funds to suspend or terminate such funds’ investment periods or, in the case of certain funds, permit investors to withdraw their capital prior to expiration of the applicable lock-up date. We do not carry any “key person” insurance that would provide us with proceeds in the event of the death or disability of any of our senior professionals, and we do not have a policy that prohibits our senior professionals from traveling together. See “-Employee misconduct could harm us by impairing our ability to attract and retain investors and subjecting us to significant legal liability, regulatory scrutiny and reputational harm.”
We anticipate that it will be necessary for us to add investment professionals both to grow our businesses and to replace those who depart. However, the market for qualified investment professionals is extremely competitive, both in the United States and internationally, and we may not succeed in recruiting additional personnel or we may fail to effectively replace current personnel who depart with qualified or effective successors. Our efforts to retain and attract investment professionals may also result in significant additional expenses, which could adversely affect our profitability or result in an increase in the portion of our performance fees that we grant to our investment professionals. In the year ended December 31, 2017, we incurred equity compensation expenses of $69.7 million, and we expect these costs to continue to increase in the future as we increase the use of equity compensation awards to attract, retain and compensate employees.
Our failure to appropriately address conflicts of interest could damage our reputation and adversely affect our businesses.
As we have expanded and as we continue to expand the number and scope of our businesses, we increasingly confront potential conflicts of interest relating to our funds’ investment activities. Certain of our funds may have overlapping investment objectives, including funds that have different fee structures, and potential conflicts may arise with respect to our decisions regarding how to allocate investment opportunities among those funds. For example, a decisionjurisdiction specific private placement regime ceases to receive material non-public information about a company while pursuing an investment opportunity for a particular fund may give rise to a potential conflict of interest when it results in our having to restrict the ability of other funds to trade in the securities of such company. We may also cause different Private Equity Group funds to invest in a single portfolio company, for example where the fund that made an initial investment no longer has capital available to invest. We may also cause different funds that we advise to purchase different classes of securities in the same portfolio company. For example, in the normal course of business our Credit Group funds acquire debt positions in companies in which our Private Equity Group funds own common equity securities. A direct conflict of interest could arise between the debt holders and the equity holders if such a company were to develop insolvency concerns. In addition, funds in one group could be restricted from selling their positions in such companies for extended periods because investment professionals in another group sit on the boards of such companies or because another part of the firm has received private information. Certain funds in different groups may invest alongside each other in the same security. On January 18, 2017, ARCC received an order from the SEC that permits ARCC and other business development companies and registered closed-end management investment companies managed by a subsidiary of us to co-invest in portfolio companies with each other and with affiliated investment funds (the “Co-investment Exemptive Order”). The different investment objectives or terms of such funds may result in a potential conflict of interest, including in connection with the allocation of investments between the funds made pursuant to the Co-investment Exemptive Order. In addition, conflicts of interest may exist in the valuation of our investments and regarding decisions about the allocation of specific investment opportunities among us and our funds and the allocation of fees and costs among us, our funds and their portfolio companies.
Though we believe we have appropriate means and oversight to resolve these conflicts, our judgment on any particular allocation could be challenged. While we have developed general guidelines regarding when two or more funds can invest in different parts of the same company’s capital structure and created a process that we employ to handle such conflicts if they arise,

our decision to permit the investments to occur in the first instance or our judgment on how to minimize the conflict could be challenged. If we fail to appropriately address any such conflicts, it could negatively impact our reputation and ability to raise additional funds and the willingness of counterparties to do business with us or result in potential litigation against us.
The investment management business is intensely competitive.
The investment management business is intensely competitive, with competition based on a variety of factors, including investment performance, business relationships, quality of service provided to investors, investor liquidity and willingness to invest, fund terms (including fees), brand recognition and business reputation. We compete with a number of private equity funds, specialized funds, hedge funds, corporate buyers, traditional asset managers, real estate development companies, commercial banks, investment banks, other investment managers and other financial institutions, as well as sovereign wealth funds.
Numerous factors increase our competitive risks, including, but not limited to:
a number of our competitors in some of our businesses have greater financial, technical, marketing and other resources and more personnel than we do;
some of our funds may not perform as well as competitors’ funds or other available investment products;
several of our competitors have raised significant amounts of capital, and many of them have similar investment objectives to ours, which may create additional competition for investment opportunities;
some of our competitors may have a lower cost of capital and access to funding sources that are not available to us, which may create competitive disadvantages for us with respect to our funds, particularly our funds that directly use leverage or rely on debt financing of their portfolio investments to generate superior investment returns;
some of our competitors may have higher risk tolerances, different risk assessments or lower return thresholds than us, which could allow them to consider a wider variety of investments and to bid more aggressively than us for investments that we want to make;
some of our competitors may be subject to less regulation and, accordingly, may have more flexibility to undertake and execute certain businesses or investments than we do and/or bear less compliance expense than we do;
some of our competitors may not have the same types of conflicts of interest as we do;
some of our competitors may have more flexibility than us in raising certain types of funds under the investment management contracts they have negotiated with their investors;
some of our competitors may have better expertise or be regarded by investors as having better expertise in a specific asset class or geographic region than we do;
our competitors that are corporate buyers may be able to achieve synergistic cost savings in respect of an investment, which may provide them with a competitive advantage in bidding for an investment;
our competitors have instituted or may institute low cost high speed financial applications and services based on artificial intelligence and new competitors may enter the asset management space using new investment platforms based on artificial intelligence; and
other industry participants may, from time to time, seek to recruit our investment professionals and other employees away from us.
Developments in financial technology, such as a distributed ledger technology (or blockchain), have the potential to disrupt the financial industry and change the way financial institutions, including investment managers, do business, and could exacerbate these competitive pressures.
We may lose investment opportunities in the future if we do not match investment valuations, structures and terms offered by our competitors. Alternatively, we may experience decreased profitability, rates of return and increased risks of loss if we match investment valuations, structures and terms offered by our competitors. Moreover, if we are forced to compete with other investment

managers on the basis of price when fundraising, we may not be able to maintain our current fund fee and carried interest terms. We have historically competed primarily on the performance of our funds and not on the level of our fees or carried interest relative to those of our competitors. However, there is a risk that fees and carried interest in the investment management industry will decline, without regard to the historical performance of a manager. Fee or carried interest reductions on existing or future funds, without corresponding decreases in our cost structure, would adversely affect our revenues and profitability.
In addition, the attractiveness of investments in our funds relative to other investment products could decrease depending on economic conditions. This competitive pressure could adversely affect our ability to make successful investments and limit our ability to raise future funds, either of which would adversely impact our businesses, revenues, results of operations and cash flow.
Lastly, institutional and individual investors are allocating increasing amounts of capital to alternative investment strategies. Several large institutional investors have announced a desire to consolidate their investments in a more limited number of managers. We expect that this will cause competition in our industry to intensify and could lead to a reduction in the size and duration of pricing inefficiencies that many of our funds seek to exploit.
Poor performance of our funds would cause a decline in our revenue and results of operations, may obligate us to repay performance fees previously paid to us and could adversely affect our ability to raise capital for future funds.
We derive revenues primarily from:
management fees, which are based generally on the amount of capital committed to or invested by our funds;
performance fees, which are based on the performance of our funds; and
returns on investments of our own capital in the funds we sponsor and manage.
When any of our funds perform poorly, either by incurring losses or underperforming benchmarks, as compared to our competitors or otherwise, our investment record suffers. As a result, our performance fees may be adversely affected and, all else being equal, the value of our assets under management could decrease, which may, in turn, reduce our management fees. Moreover, we may experience losses on investments of our own capital in our funds as a result of poor investment performance. If a fund performs poorly, we will receive little or no performance fees with regard to the fund and little income or possibly losses from our own principal investment in such fund. Furthermore, if, as a result of poor performance or otherwise, a fund does not achieve total investment returns that exceed a specified investment return threshold over the life of the fund or other measurement period, we may be obligated to repay the amount by which performance fees that were previously distributed or paid to us exceeds amounts to which we were entitled. Poor performance of our funds could also make it more difficult for us to raise new capital. Investors in our closed-end funds may decline to invest in future closed-end funds we raise as a result of poor performance. Investors in our open-ended funds may redeem their investment as a result of poor performance. Poor performance of our publicly traded funds may result in stockholders selling their stock, thereby causing a decline in the stock price and limiting our ability to access capital. A failure to grow the assets of such funds will limit our ability to earn additional management fees and performance fees, and will ultimately affect our operating results. Our fund investors and potential fund investors continually assess our funds’ performance independently and relative to market benchmarks and our competitors, and our ability to raise capital for existing and future funds and avoid excessive redemption levels depends on our funds’ performance. Accordingly, poor fund performance may deter future investment in our funds and thereby decrease the capital invested in our funds and, ultimately, our management fee income. Alternatively, in the face of poor fund performance, investors could demand lower fees or fee concessions for existing or future funds which would likewise decrease our revenue.
ARCC’s management fee comprises a significant portion of our management fees and a reduction in fees from ARCC could have an adverse effect on our revenues and results of operations.
The management fees we receive from ARCC (including fees attributable to ARCC Part I Fees) comprise a significant percentage of our management fees. The investment advisory agreement we have with ARCC categorizes the fees we receive as: (a) base management fees, which are paid quarterly and generally increase or decrease based on ARCC’s total assets, (b) fees based on ARCC’s net investment income (before ARCC Part I Fees and ARCC Part II Fees), which are paid quarterly (“ARCC Part I Fees”) and (c) fees based on ARCC’s net capital gains, which are paid annually (“ARCC Part II Fees”). We classify the ARCC Part I Fees as management fees because they are paid quarterly, are predictable and recurring in nature, are not subject to repayment (or contingent repayment obligations) and are generally expected to be cash-settled each quarter. If ARCC’s total assets or its net investment income were to decline significantly for any reason, including, without limitation, due to mark-to-market accounting requirements, the poor performance of its investments or the failure to successfully access or invest capital, the amount

of the fees we receive from ARCC, including the base management fee and the ARCC Part I Fees, would also decline significantly and/or may be subject to deferral, which could have an adverse effect on our revenues and results of operations. In addition, because the ARCC Part II Fees are not paid unless ARCC achieves cumulative realized capital gains (net of realized capital losses and unrealized capital depreciation), ARCC’s Part II Fees payable to us are variable and not predictable. We may also, from time to time, waive or voluntarily defer any fees payable by ARCC in connection with strategic transactions.
Our investment advisory and management agreement with ARCC renews for successive annual periods subject to the approval of ARCC’s board of directors or by the affirmative vote of the holders of a majority of ARCC’s outstanding voting securities. In addition, as required by the Investment Company Act, both ARCC and its investment adviser have the right to terminate the agreement without penalty upon 60 days’ written notice to the other party. Termination or non-renewal of this agreement would reduce our revenues significantly and could have a material adverse effect on our financial condition.
We may not be able to maintain our current fee structure as a result of industry pressure from fund investors to reduce fees, which could have an adverse effect on our profit margins and results of operations.
We may not be able to maintain our current fee structure as a result of industry pressure from fund investors to reduce fees. Although our investment management fees vary among and within asset classes, historically we have competed primarily on the basis of our performance and not on the level of our investment management fees relative to those of our competitors. In recent years, however, there has been a general trend toward lower fees in the investment management industry. In September 2009, the Institutional Limited Partners Association (“ILPA”) published a set of Private Equity Principles (the “Principles”) which were revised in January 2011. The Principles were developed to encourage discussion between limited partners and general partners regarding private equity fund partnership terms. Certain of the Principles call for enhanced “alignment of interests” between general partners and limited partners through modifications of some of the terms of fund arrangements, including proposed guidelines for fees and performance income structures. We promptly provided ILPA with our endorsement of the Principles, representing an indication of our general support for the efforts of ILPA. More recently, institutional investors have been increasing pressure to reduce management and investment fees charged by external managers, whether through direct reductions, deferrals, rebates or other means. In addition, we may be asked by investors to waive or defer fees for various reasons, including during economic downturns or as a result of poor performance of our funds. We may not be successful in providing investment returns and service that will allow us to maintain our current fee structure. Fee reductions on existing or future new businesses could have an adverse effect on our profit margins and results of operations. For more information about our fees see “Item 7. Management’s Discussion and Analysis of Financial Condition and Results of Operations.”
Investors in our funds may be unwilling to commit new capital to our funds because we are a public company, which could have a material adverse effect on our business and financial condition.
Some investors in our funds may have concerns that as a public company our attention is bifurcated between investors in our funds and the public shareholders, resulting in potential conflicts of interest. Some investors in our funds may believe that as a public company we strive for near-term profit instead of superior risk-adjusted returns for investors in our funds over time or grow our assets under management for the purpose of generating additional management fees without regard to whether we believe there are sufficient investment opportunities to effectively deploy the additional capital. There can be no assurance that we will be successful in our efforts to address such concerns or to convince investors in our funds that our status as a public company does not and will not affect our longstanding priorities or the way we conduct our businesses. A decision by a significant number of investors in our funds not to commit additional capital to our funds or to cease doing business with us altogether, or our failure to continue to raise capital, could inhibit our ability to achieve our investment objectives and may have a material adverse effect on our business and financial condition.
Rapid growth of our businesses, particularly outside the United States, may be difficult to sustain and may place significant demands on our administrative, operational and financial resources.
Our assets under management have grown significantly in the past, and we are pursuing further growth in the near future, both organic and through acquisitions. Our rapid growth has placed, and planned growth, if successful, will continue to place, significant demands on our legal, accounting and operational infrastructure, and has increased expenses. The complexity of these demands, and the expense required to address them, is a function not simply of the amount by which our assets under management has grown, but of the growth in the variety and complexity of, as well as the differences in strategy between, our different funds. In addition, we are required to continuously develop our systems and infrastructure in response to the increasing sophistication of the investment management market and legal, accounting, regulatory and tax developments.

Our future growth will depend in part on our ability to maintain an operating platform and management system sufficient to address our growth and will require us to incur significant additional expenses and to commit additional senior management and operational resources. As a result, we face significant challenges:
in maintaining adequate financial, regulatory (legal, tax and compliance) and business controls;
in providing current and future investors with accurate and consistent reporting;
in implementing new or updated information and financial systems and procedures; and
in training, managing and appropriately sizing our work force and other components of our businesses on a timely and cost-effective basis.
We may not be able to manage our expanding operations effectively or be able to continue to grow, and any failure to do so could adversely affect our ability to generate revenue and control our expenses.
In addition, pursuing investment opportunities outside the United States presents challenges not faced by U.S. investments, such as different legal and tax regimes and currency fluctuations, which require additional resources to address. To accommodate the needs of global investors and strategies we must structure investment products in a manner that addresses tax, regulatory and legislative provisions in different, and sometimes multiple, jurisdictions. Further, in conducting business in foreign jurisdictions, we are often faced with the challenge of ensuring that our activities are consistent with U.S. or other laws with extraterritorial application, such as the USA PATRIOT Act and the U.S. Foreign Corrupt Practices Act (the “FCPA”). Moreover, actively pursuing international investment opportunities may require that we increase the size or number of our international offices. Pursuing non-U.S. fund investors means that we must comply with international laws governing the sale of interests in our funds, different investor reporting and information processes and other requirements. As a result, we are required to continuously develop our systems and infrastructure, including employing and contracting with foreign businesses and entities, in response to the increasing complexity and sophistication of the investment management market and legal, accounting and regulatory situations. This growth has required, and will continue to require, us to incur significant additional expenses and to commit additional senior management and operational resources. There can be no assurance that we will be able to manage or maintain appropriate oversight over our expanding international operations effectively or that we will be able to continue to grow this part of our businesses, and any failure to do so could adversely affect our ability to generate revenues and control our expenses.
We may enter into new lines of business and expand into new investment strategies, geographic markets and businesses, each of which may result in additional risks and uncertainties in our businesses.
We intend, if market conditions warrant, growing our businesses by increasing assets under management in existing businesses and expanding into new investment strategies, geographic markets and businesses. Our partnership agreement permits us to enter into new lines of business, make strategic investments or acquisitions and enter into joint ventures. Accordingly, we may pursue growth through acquisitions of other investment management companies, acquisitions of critical business partners or other strategic initiatives, which may include entering into new lines of business. In addition, consistent with our past experience, we expect opportunities will arise to acquire other alternative or traditional asset managers.
Attempts to expand our businesses involve a number of special risks, including some or all of the following:
the required investment of capital and other resources;
the diversion of management’s attention from our core businesses;
the assumption of liabilities in any acquired business;
the disruption of our ongoing businesses;
entry into markets or lines of business in which we may have limited or no experience;
increasing demands on our operational and management systems and controls;
compliance with or applicability to our business or our portfolio companies of regulations and laws, including, in particular, local regulations and laws (for example, consumer protection related laws) and customs in the numerous global jurisdictions in which we operate and the impact that noncompliance or even perceived noncompliance could have on us and our portfolio companies;

potential increase in investor concentration; and
the broadening of our geographic footprint, increasing the risks associated with conducting operations in certain foreign jurisdictions where we currently have no presence.
Entry into certain lines of business may subject us to new laws and regulations with which we are not familiar, or from which we are currently exempt, and may lead to increased litigation and regulatory risk. It could also impact and affect our existing businesses, which might otherwise not be subject to such laws and regulations. If a new business does not generate sufficient revenues or if we are unable to efficiently manage our expanded operations, our results of operations will be adversely affected. Our strategic initiatives may include joint ventures, in which case we will be subject to additional risks and uncertainties in that we may be dependent upon, and subject to liability, losses or reputational damage relating to systems, controls and personnel that are not under our control. Because we have not yet identified these potential new investment strategies, geographic markets or lines of business, we cannot identify all of the specific risks we may face and the potential adverse consequences on us and their investment that may result from any attempted expansion.
If we are unable to consummate or successfully integrate development opportunities, acquisitions or joint ventures, we may not be able to implement our growth strategy successfully.
Our growth strategy is based, in part, on the selective development or acquisition of asset management businesses, advisory businesses or other businesses complementary to our business where we think we can add substantial value or generate substantial returns. The success of this strategy will depend on, among other things: (a) the availability of suitable opportunities, (b) the level of competition from other companies that may have greater financial resources, (c) our ability to value potential development or acquisition opportunities accurately and negotiate acceptable terms for those opportunities, (d) our ability to obtain requisite approvals and licenses from the relevant governmental authorities and to comply with applicable laws and regulations without incurring undue costs and delays, (e) our ability to identify and enter into mutually beneficial relationships with venture partners, (f) our ability to properly manage conflicts of interest and (g) our ability to integrate personnel at acquired businesses into our operations and culture.
This strategy also contemplates the use of our publicly traded common shares as acquisition consideration. Volatility or declines in the trading price of our common shares may make our common shares less attractive to acquisition targets. Moreover, even if we are able to identify and successfully complete an acquisition, we may encounter unexpected difficulties or incur unexpected costs associated with integrating and overseeing the operations of the new businesses. If we are not successful in implementing our growth strategy, our business, financial results and the market price for our common shares may be adversely affected.
Extensive regulation in the United States affects our activities, increases the cost of doing business and creates the potential for significant liabilities and penalties that could adversely affect our businesses and results of operations.
Our businesses are subject to extensive regulation, including periodic examinations, by governmental agencies and self-regulatory organizations in the jurisdictions in which we operate. The SEC oversees the activities of our subsidiaries that are registered investment advisers under the Investment Advisers Act. Since the first quarter of 2014, FINRA as well as the SEC has overseen the activities of our wholly owned subsidiary AIS as a registered broker-dealer. We are subject to audits by the Defense Security Service to determine whether we are under foreign ownership, control or influence. In addition, we regularly rely on exemptions from various requirements of the Securities Act, the Exchange Act, the Investment Company Act, the Commodity Exchange Act and the U.S. Employee Retirement Income Security Act of 1974 (“ERISA”). These exemptions are sometimes highly complex and may in certain circumstances depend on compliance by third parties who we do not control. If for any reason these exemptions were to be revoked or challenged or otherwise become unavailable to us, such action could increase our cost of doing business or subject us to regulatory action or third-party claims, which could have a material adverse effect on our businesses. For example, in 2013 the SEC amended Rule 506 of Regulation D under the Securities Act to impose “bad actor” disqualification provisions that ban an issuer from offering or selling securities pursuant to the safe harbor in Rule 506 if the issuer, or any other “covered person,” is the subject of a criminal, regulatory or court order or other “disqualifying event” under the rule which has not been waived by the SEC. The definition of a “covered person” under the rule includes an issuer’s directors, general partners, managing members and executive officers and promoters and persons compensated for soliciting investors in the offering. Accordingly, our ability to rely on Rule 506 to offer or sell securities would be impaired if we or any “covered person” is the subject of a disqualifying event under the rule and we are unable to obtain a waiver or, in certain circumstances, terminate our involvement with such “covered person”.
The SEC has indicated that investment advisors who receive transaction-based compensation for investment banking or acquisition activities relating to fund portfolio companies may be required to register as broker-dealers. Specifically, the SEC staff

has noted that if a firm receives fees from a fund portfolio company in connection with the acquisition, disposition or recapitalization of such portfolio company, such activities could raise broker-dealer concerns under applicable regulations related to broker dealers. If we receive such transaction fees and the SEC takes the position that such activities render us a “broker” under the applicable rules and regulations of the Exchange Act, we could be subject to additional regulation. If receipt of transaction fees from a portfolio company is determined to require a broker-dealer license, receipt of such transaction fees in the past or in the future during any time when we did not or do not have a broker-dealer license could subject us to liability for fines, penalties, damages, rescission or other equitable remedies.
Since 2010, states and other regulatory authorities have begun to require investment managers to register as lobbyists. We have registered as such in a number of jurisdictions, including California, Illinois, New York, Pennsylvania and Kentucky. Other states or municipalities may consider similar legislation or adopt regulations or procedures with similar effect. These registration requirements impose significant compliance obligations on registered lobbyists and their employers, which may include annual registration fees, periodic disclosure reports and internal recordkeeping, and may also prohibit the payment of contingent fees.
Each of the regulatory bodies with jurisdiction over us has regulatory powers dealing with many aspects of financial services, including the authority to grant, and in specific circumstances to cancel, permissions to carry on particular activities. A failure to comply with the obligations imposed by the Investment Advisers Act, including recordkeeping, advertising and operating requirements, disclosure obligations and prohibitions on fraudulent activities, could result in investigations, sanctions and reputational damage. We are involved regularly in trading activities that implicate a broad number of U.S. and foreign securities and tax law regimes, including laws governing trading on inside information, market manipulation and a broad number of technical trading requirements that implicate fundamental market regulation policies. Violation of these laws could result in severe restrictions on our activities and damage to our reputation.
Compliance with existing and new regulations subjects us to significant costs. Moreover, our failure to comply with applicable laws or regulations, including labor and employment laws, could result in fines, censure, suspensions of personnel or other sanctions, including revocation of the registration of our relevant subsidiaries as investment advisers or registered broker-dealers. The regulations to which our businesses are subject are designed primarily to protect investors in our funds and to ensure the integrity of the financial markets. They are not designed to protect our shareholders. Even if a sanction is imposed against us, one of our subsidiaries or our personnel by a regulator for a small monetary amount, the costs incurred in responding to such matters could be material, the adverse publicity related to the sanction could harm our reputation, which in turn could have a material adverse effect on our businesses in a number of ways, making it harder for us to raise new funds and discouraging others from doing business with us.
In the past several years, the financial services industry, and private equity in particular, has been the subject of heightened scrutiny by regulators around the globe. In particular, the SEC and its staff have focused more narrowly on issues relevant to alternative asset management firms, including by forming specialized units devoted to examining such firms and, in certain cases, bringing enforcement actions against the firms, their principals and employees. In recent periods there have been a number of enforcement actions within the industry, and it is expected that the SEC will continue to pursue enforcement actions against private fund managers. This increased enforcement activity may cause us to reevaluate certain practices and adjust our compliance control function as necessary and appropriate.
While the SEC’s recent list of examination priorities includes such items as cybersecurity compliance and controls and conducting risk-based examinations of never-before-examined investment advisory firms, it is generally expected that the SEC’s oversight of alternative asset managers will continue to focus substantially on concerns related to transparency and investor disclosure practices.  Although the SEC has cited improvements in disclosures and industry practices in this area, it has also indicated that there is room for improvement in particular areas, including fees and expenses (and the allocation of such fees and expenses) and co-investment practices. To this end, many firms have received inquiries during examinations or directly from the SEC’s Division of Enforcement regarding various transparency-related topics, including the acceleration of monitoring fees, the allocation of broken-deal expenses, the disclosure of operating partner or operating executive compensation, outside business activities of firm principals and employees, group purchasing arrangements and general conflicts of interest disclosures. In addition, our Private Equity Group funds have engaged in the past and may engage from time to time advisors who often work with our investment teams during due diligence, provide board-level governance and support and advise portfolio company leadership. Advisors generally are third parties and typically retained by us pursuant to consulting agreements. In some cases, an operating executive may be retained by a portfolio company directly and in such instances the portfolio company may compensate the operating executive directly (meaning that investors in our Private Equity Group funds may indirectly bear the operating executive’s compensation). While we believe we have made appropriate and timely disclosures regarding the engagement and compensation of these advisors, the SEC staff may disagree.

Regulations governing ARCC’s operation as a business development company affect its ability to raise, and the way in which it raises, additional capital.
As a business development company, ARCC operates as a highly regulated business within the provisions of the Investment Company Act. Many of the regulations governing business development companies have not been modernized within recent securities laws amendments and restrict, among other things, leverage incurrence, co-investments and other transactions with other entities within the Ares Operating Group. Certain of our funds may be restricted from engaging in transactions with ARCC and its subsidiaries.
As a business development company registered under the Investment Company Act, ARCC may issue debt securities or preferred stock and borrow money from banks or other financial institutions, which we refer to collectively as “senior securities,” up to the maximum amount permitted by the Investment Company Act. Under the provisions of the Investment Company Act, ARCC is permitted, as a business development company, to incur indebtedness or issue senior securities only in amounts such that its asset coverage, as calculated pursuant to the Investment Company Act, equals at least 200% after each such incurrence or issuance. If the value of its assets declines, it may be unable to satisfy this test. If that happens, it may be required to sell a portion of its investments and, depending on the nature of its leverage, repay a portion of its indebtedness at a time when such sales may be disadvantageous. Business development companies may issue and sell common stock at a price below net asset value per share only in limited circumstances, one of which is during an approximately one-year period after obtaining stockholder approval for such issuance in accordance with the Investment Company Act. ARCC’s stockholders have, in the past, approved such issuances so that during the subsequent 12-month period, ARCC may, in one or more public or private offerings of its common stock, sell or otherwise issue shares of its common stock at a price below the then-current net asset value per share, subject to certain conditions including parameters on the level of permissible dilution, approval of the sale by a majority of its independent directors and a requirement that the sale price be not less than approximately the market price of the shares of its common stock at specified times, less the expenses of the sale. ARCC may ask its stockholders for additional approvals from year to year. There can be no assurance that such approvals will be obtained.
Our publicly traded investment vehicles are subject to regulatory complexities that limit the way in which they do business and may subject them to a higher level of regulatory scrutiny.
Our publicly traded investment vehicles operate under a complex regulatory environment. Such companies require the application of complex tax and securities regulations and may entail a higher level of regulatory scrutiny. In addition, regulations affecting our publicly traded investment vehicles generally affect their ability to take certain actions. For example, certain of our publicly traded vehicles have elected to be treated as a REIT or RIC for U.S. federal income tax purposes. To maintain their status as a RIC or a REIT, such vehicles must meet, among other things, certain source of income, asset diversification and annual distribution requirements. ARCC and our publicly traded closed-end fund are subject to complex rules under the Investment Company Act, including rules that restrict certain of our funds from engaging in transactions with ARCC or the closed-end fund. For example, ARCC is required to generally distribute to its stockholders at least 90% of its investment company taxable income to maintain its RIC status and, subject to certain exceptions, ARCC is generally prohibited from issuing and selling its common stock at a price below net asset value per share and from incurring indebtedness (including for this purpose, preferred stock), if ARCC’s asset coverage, as calculated pursuant to the Investment Company Act, equals less than 200% after such incurrence.
Failure to comply with “pay to play” regulations implemented by the SEC and certain states, and changes to the “pay to play” regulatory regimes, could adversely affect our businesses.
In recent years, the SEC and several states have initiated investigations alleging that certain private equity firms and hedge funds or agents acting on their behalf have paid money to current or former government officials or their associates in exchange for improperly soliciting contracts with state pension funds. In June 2010, the SEC approved Rule 206(4)-5 under the Investment Advisers Act regarding “pay to play” practices by investment advisers involving campaign contributions and other payments to government officials able to exert influence on potential government entity clients. Among other restrictions, the rule prohibits investment advisers from providing advisory services for compensation to a government entity for two years, subject to very limited exceptions, after the investment adviser, its senior executives or its personnel involved in soliciting investments from government entities make contributions to certain candidates and officials in a position to influence the hiring of an investment adviser by such government entity. Advisers are required to implement compliance policies designed, among other matters, to track contributions by certain of the adviser’s employees and engagements of third parties that solicit government entities and to keep certain records to enable the SEC to determine compliance with the rule. In addition, there have been similar rules on a state level regarding “pay to play” practices by investment advisers. FINRA recently adopted its own set of “pay to play” regulations, which went into effect on August 20, 2017, that are similar to the SEC’s regulations.

As we have a significant number of public pension plans that are investors in our funds, these rules could impose significant economic sanctions on our businesses if we or one of the other persons covered by the rules make any such contribution or payment, whether or not material or with an intent to secure an investment from a public pension plan. We may also acquire other investment managers who are not subject to the same restrictions as us, but whose activity, and the activity of their principals, prior to our ownership could affect our fundraising. In addition, such investigations may require the attention of senior management and may result in fines if any of our funds are deemed to have violated any regulations, thereby imposing additional expenses on us. Any failure on our part to comply with these rules could cause us to lose compensation for our advisory services or expose us to significant penalties and reputational damage.
The short-term and long-term impact of the Basel III capital standards is uncertain.
In June 2011, the Basel Committee on Banking Supervision, an international trade body comprised of senior representatives of bank supervisory authorities and central banks from 27 countries, including the United States and the EU, announced the final framework for a comprehensive set of capital and liquidity standards, commonly referred to as “Basel III,” for internationally active banking organizations and certain other types of financial institutions. These new standards, which will be fully phased in by 2019, will require banks to hold more capital, predominantly in the form of common equity, than under the current capital framework. Implementation of Basel III will require implementing regulations and guidelines by member countries. In July 2013, the U.S. federal banking regulators announced the adoption of final regulations to implement Basel III for U.S. banking organizations, subject to various transition periods. The EU implemented Basel III in June 2013. In April 2014, U.S. regulators adopted rules requiring enhanced supplementary leverage ratio standards beginning January 1, 2018, which impose capital requirements more stringent than those of the Basel III standards for the most systematically significant banking organizations in the United States. In January 2016, the Basel Committee published its revised capital requirements for market risk, known as Fundamental Review of the Trading Book (“FRTB”), which are expected to generally result in higher global capital requirements for banks that could, in turn, reduce liquidity and increase financing and hedging costs. The impact of FRTB will not be known until after any resulting rules are finalized by the U.S. federal bank regulatory agencies. Compliance with the Basel III standards, the supplemental regulatory standards adopted by U.S. regulators and FRTB may result in significant costs to banking organizations, which in turn may result in higher borrowing costs for the private sector and reduced access to certain types of credit.
Regulatory changes and other developments in the United States and regulatory compliance failures could adversely affect our reputation, businesses and operations.
In July 2010, the Dodd-Frank Act was signed into law and has imposed significant regulations on nearly every aspect of the U.S. financial services industry. The Dodd-Frank Act established a ten voting-member Financial Stability Oversight Council (the “Council”), an interagency body chaired by the Secretary of the Treasury, to identify and manage systemic risk in the financial system and improve interagency cooperation. Under the Dodd-Frank Act, the Council has the authority to review the activities of certain nonbank financial firms engaged in financial activities that are designated as “systemically important,” meaning, among other things, evaluating the impact of the distress of the financial firm on the stability of the U.S. economy. If we were designated as such, it would result in increased regulation of our businesses, including the imposition of capital, leverage, liquidity and risk management standards, credit exposure reporting and concentration limits, restrictions on acquisitions and annual stress tests by the Federal Reserve.
In October 2011, the Federal Reserve and other federal regulatory agencies issued a proposed rule implementing a section of the Dodd-Frank Act that has become known as the “Volcker Rule.” In December 2013, the Federal Reserve and other federal regulatory agencies adopted a final rule implementing the Volcker Rule. The Volcker Rule generally prohibits insured banks or thrifts, any bank holding company or savings and loan holding company, any non-U.S. bank with a U.S. branch, agency or commercial lending company and any subsidiaries and affiliates of such entities, regardless of geographic location, from investing in or sponsoring “covered funds,” which include private equity funds or hedge funds and certain other proprietary activities. The effects of the Volcker Rule are uncertain but it is in any event likely to curtail various banking activities that in turn could result in uncertainties in the financial markets as well as our business. The final Volcker Rule became effective on April 1, 2014, and, except with respect to certain foreign banking entities, the conformance period ended on July 21, 2017. It contains exemptions for certain “permitted activities” that would enable certain institutions subject to the Volcker Rule to continue investing in covered funds under certain conditions. Although we do not currently anticipate that the Volcker Rule will adversely affect our fundraising to any significant extent, there could be adverse implications on our ability to raise funds from the types of entities mentioned above as a result of this prohibition.
Pursuant to the Dodd-Frank Act, regulation of the U.S. derivatives market is bifurcated between the CFTC and the SEC. Under the Dodd-Frank Act, the CFTC has jurisdiction over swaps and the SEC has jurisdiction over security-based swaps. As part of its Dodd-Frank Act related rule-making process, the CFTC made changes to its rules with respect to the registration and oversight

of CPOs. As a result of the CFTC’s revisions to these rules, all swaps (other than security-based swaps) are now included in the definition of commodity interests. As a result, funds that utilize swaps (whether or not related to a physical commodity) as part of their business model may fall within the statutory definition of a commodity pool. If a fund qualifies as a commodity pool, then, absent an available exemption, the operator of such fund is required to register with the CFTC as a CPO. Registration with the CFTC renders such CPO subject to regulation, including with respect to disclosure, reporting, recordkeeping and business conduct, which could significantly increase operating costs by requiring additional resources.
The Dodd-Frank Act requires the CFTC, the SEC and other regulatory authorities to promulgate certain rules relating to the regulation of the derivatives market. Such rules require or will require the registration of certain market participants, the clearing of certain derivatives contracts through central counterparties, the execution of certain derivatives contracts on electronic platforms, as well as reporting and recordkeeping of derivatives transactions. The Dodd-Frank Act also provides expanded enforcement authority to the CFTC and SEC. While certain rules have been promulgated and are already in effect, the rulemaking and implementation process is still ongoing. In particular, the CFTC has finalized most of its rules under the Dodd-Frank Act, and the SEC has proposed a number of rules regarding security-based swaps but has only finalized some of these rules. We cannot therefore yet predict the ultimate effect of the rules and regulations on our business.
Under CFTC and SEC rules, an entity may be required to register as a MSP or MSBSP if it has substantial swaps or security-based swaps positions or has substantial counterparty exposure from its swaps or security-based swaps positions. If any of our funds were required to register as an MSP or MSBSP, it could make compliance more expensive, affect the manner in which we conduct our businesses and adversely affect our profitability. Additionally, if any of our funds qualify as “special entities” under CFTC rules, it could make it more difficult for them to enter into derivatives transactions or make such transactions more expensive.
Pursuant to rules finalized by the CFTC in December 2012 and September 2016, certain classes of interest rate swaps and certain classes of credit default swaps are subject to mandatory clearing, unless an exemption applies. Many of these swaps are also subject to mandatory trading on designated contract markets or swap execution facilities. At this time, the CFTC has not proposed any rules designating other classes of swaps for mandatory clearing, but it may do so in the future. Mandatory clearing and trade execution requirements may change the cost and availability of the swaps that we use, and exposes our funds to the credit risk of the clearing house through which any cleared swap is cleared. In addition, federal bank regulatory authorities and the CFTC have adopted initial and variation margin requirements for swap dealers, security-based swap dealers and swap entities, including permissible forms of margin, custodial arrangements and documentation requirements for uncleared swaps and security-based swaps. As a result, swap entities will be required to collect margin for transactions and positions in uncleared swaps and security-based swaps by financial end users. The new rules became effective for end users on March 1, 2017. The CFTC’s Division of Swap Dealer and Intermediary Oversight subsequently extended, until September 1, 2017 ,the time to comply with the variation margin requirements for swaps that are subject to a March 1, 2017 compliance date. The effect of the regulations on us is not fully known at this time. However, these rules may increase the cost of our activity in uncleared swaps and security-based swaps if we are determined to be a financial end user.
In December 2016, the CFTC re-proposed rules that would set federal position limits for certain referenced contracts, and issued final rules on aggregation among entities under common ownership or control, for position limits on certain futures and options contracts that would apply to the proposed position limits on referenced contracts. It is possible that the CFTC could propose to expand such requirements to other types of contracts in the future. If any when enacted, the proposal could affect our ability and the ability for our funds to enter into derivatives transactions.
The CFTC has finalized rules requiring collateral used to margin cleared swaps to be segregated in a manner different from that applicable to the futures market and has finalized other rules allowing parties to an uncleared swap to require that any collateral posted as initial margin be segregated with a third party custodian. Collateral segregation may impose greater costs on us when entering into swaps.
In addition, the Dodd-Frank Act gave the CFTC expanded anti-fraud and anti-manipulation authority, including authority over disruptive trading practices and insider trading. Several investigations have commenced in the United States related to manipulation of the foreign exchange, LIBOR and indices markets. It is possible that new standards will emerge from these proceedings that could impact the way that we trade.
The Dodd-Frank Act authorizes federal regulatory agencies to review and, in certain cases, prohibit compensation arrangements at financial institutions that give employees incentives to engage in conduct deemed to encourage inappropriate risk-taking by covered financial institutions. In 2016, federal bank regulatory authorities and the SEC revised and re-proposed a rule that generally (1) prohibits incentive-based payment arrangements that are determined to encourage inappropriate risks by certain financial institutions by providing excessive compensation or that could lead to material financial loss and (2) requires

those financial institutions to disclose information concerning incentive-based compensation arrangements to the appropriate federal regulator. The Dodd-Frank Act also directs the SEC to adopt a rule that requires public companies to adopt and disclose policies requiring, in the event the company is required to issue an accounting restatement, the contingent repayment obligations of related incentive compensation from current and former executive officers. The SEC has proposed but not yet adopted such rule. To the extent the aforementioned rules are adopted, our ability to recruit and retain investment professionals and senior management executives could be limited.
The Dodd-Frank Act amends the Exchange Act to compensate and protect whistleblowers who voluntarily provide original information to the SEC and establishes a fund to be used to pay whistleblowers who will be entitled to receive a payment equal to between 10% and 30% of certain monetary sanctions imposed in a successful government action resulting from the information provided by the whistleblower.
The SEC requires investment advisers registered or required to register with the SEC under the Investment Advisers Act that advise one or more private funds and have at least $150.0 million in private fund assets under management to periodically file reports on Form PF. We have filed, and will continue to file, quarterly reports on Form PF, which has resulted in increased administrative costs and requires a significant amount of attention and time to be spent by our personnel.
Many of these provisions are subject to further rulemaking and to the discretion of regulatory bodies, such as the Council and the Federal Reserve. On February 3, 2017, President Trump signed Executive Order 13772 (the “Executive Order”) announcing the new administration’s policy to regulate the U.S. financial system in a manner consistent with certain “Core Principles,” including regulation that is efficient, effective and appropriately tailored. The Executive Order directed the Secretary of the Treasury, in consultation with the heads of the member agencies of the Financial Stability Oversight Council, to report to the President on the extent to which existing laws, regulations and other government policies promote the Core Principles and to identify any laws, regulations or other government policies that inhibit federal regulation of the U.S. financial system.
On June 12, 2017, the U.S. Department of the Treasury (“Treasury”) published the first of several reports in response to the Executive Order on the depository system covering banks and other savings institutions. On October 6, 2017, the Treasury released a second report outlining ways to streamline and reform the U.S. regulatory system for capital markets, followed by a third report, on October 26, 2017, examining the current regulatory framework for the asset management and insurance industries. Subsequent reports are expected to address: retail and institutional investment products and vehicles, as well as non‑bank financial institutions, financial technology and financial innovation.
We may be impacted indirectly by guidance recently directed to regulated banking institutions with regard to leveraged lending practices. In March 2013, the U.S. federal banking agencies issued updated guidance on credit transactions characterized by a high degree of financial leverage. To the extent that such guidance limits the amount or increases the cost of financing we are able to obtain for our transactions, the returns on our investments may suffer. However, the status of the 2013 leveraged lending guidance remains in doubt following a determination by the Government Accountability Office, on October 19, 2017, that such guidance constituted a “rule” for purposes of the Congressional Review Act of 1996. As a result, the guidance was required to be submitted to Congress for review. It is possible the guidance could be overturned if a joint resolution of disapproval is passed by Congress.
On June 8, 2017, the U.S. House of Representatives passed the Financial Choice Act, which includes legislation intended to repeal or replace substantial portions of the Dodd‑Frank Act. Among other things, the proposed law would repeal the Volcker Rule limiting certain proprietary investment and trading activities by banks, eliminate the authority of regulators to designate asset managers and other large non‑bank institutions as “systemically important financial institutions” or “SIFIs,” and repeal the Department of Labor (“DOL”) “fiduciary rule” governing standards for dealing with retirement plans until the SEC issues standards for similar dealings by broker‑dealers and limiting the substance of any subsequent DOL rule to the SEC standards. The bill was referred to the Senate, where it is unlikely to pass as proposed. On November 16, 2017, a bipartisan group of U.S. Senators, led by Senate Banking Committee Chairman, introduced the Economic Growth, Regulatory Relief, and Consumer Protection Act (the “Senate Regulatory Relief Bill”). The Senate Regulatory Relief Bill would revise various post-crisis regulatory requirements and provide targeted regulatory relief to certain financial institutions. Among the most significant of its proposed amendments to the Dodd-Frank Act are a substantial increase in the $50 billion asset threshold for automatic regulation of bank holding companies as SIFIs, an exemption from the Volcker Rule for insured depository institutions with less than $10 billion in consolidated assets and lower levels of trading assets and liabilities, as well as amendments to the liquidity leverage ratio and supplementary leverage ratio requirements. On December 5, 2017, the Senate Banking Committee approved the Senate Regulatory Relief Bill. If the legislation is adopted in the Senate, it remains unclear whether and how it would be reconciled with its House-passed counterpart, the Financial Choice Act, which is substantially different in scope and substance, and ultimately approved by both chambers of Congress.

On February 9, 2018, the U.S. Court of Appeals for the District of Columbia ruled that the U.S. Risk Retention Rules do not apply to managers of open-market CLOs (i.e., CLOs for which the underlying assets are not transferred by the manager to the CLO issuer via a sale). The SEC, the Board of Governors of the Federal Reserve System and certain other regulatory agencies have 45 days from the date of the decision to petition the U.S. Court of Appeals for an en banc review, during which time the rule will remain effective. If this petitionnon-EEA AIFM passport is not made available to U.S. or if such petition is made but denied, the U.S. Court of Appeals’ ruling will become effective seven days later with retroactive effect on all existing open-market CLOs. We are in the process of reviewing this decision and its ultimate impact on our business.U.K. AIFMs.    
It is difficult to determine the full extent of the impact on us of the Financial Choice Act, the Dodd-Frank Act or any other new laws, regulations or initiatives that may be proposed or whether any of the proposals will become law. In addition, as a result of proposed legislation, shifting areas of focus of regulatory enforcement bodies or otherwise, regulatory compliance practices may shift such that formerly accepted industry practices become disfavored or less common. Any changes or other developments in the regulatory framework applicable to our businesses, including the changes described above and changes to formerly accepted industry practices, may impose additional costs on us, require the attention of our senior management or result in limitations on the manner in which we conduct our businesses. Moreover, as calls for additional regulation have increased, there may be a related increase in regulatory investigations of the trading and other investment activities of alternative asset management funds, including our funds. In addition, we may be adversely affected by changes in the interpretation or enforcement of existing laws and rules by these governmental authorities and self-regulatory organizations. Compliance with any new laws or regulations could make compliance more difficult and expensive, affect the manner in which we conduct our businesses and adversely affect our profitability.
Regulatory changes in jurisdictions outside the United States could adversely affect our businesses.
Certain of our subsidiaries operate outside the United States. In the United Kingdom, Ares Management Limited and Ares Management UK Limited are subject to regulation by the FCA. Ares European Loan Management LLP, which is not a subsidiary, but in which we are indirectly invested and which procures certain services from Ares Management Limited, is also subject to regulation by the FCA. In some circumstances, Ares Management Limited, Ares Management UK Limited, Ares European Loan Management LLP and other Ares entities are or become subject to UK or EU laws, for instance in relation to marketing our funds to investors in the EEA.
The UK is scheduled to leave the EU in March 2019. Some form of transitional agreement by which UK based financial services firms can continue to operate on a cross-border basis seems likely. However, the duration of the transitional agreement and the end-state relationship between the UK and EU remains unclear. There is a risk that following Brexit the UK may be denied access to the single market. This could be highly disruptive to our business and may result in us having to increase our presence in other EEA member states which would result in additional costs.
EU legislation could impact our business in the United Kingdom and other EEA member states where we have operations. The following measures are of particular relevance to our business.
In March 2013, the predecessor regulator to the FCA published the final rules for the FCA’s regulation and supervision of the LIBOR. In particular, the FCA’s LIBOR rules include requirements that (1) an independent LIBOR administrator monitor and survey LIBOR submissions to identify breaches of practice standards and/or potentially manipulative behavior, and (2) firms submitting data to LIBOR establish and maintain a clear conflicts of interest policy and appropriate systems and controls. These requirements may cause LIBOR to be more volatile than it has been in the past, which may adversely affect the value of investments made by our funds. On February 3, 2014, ICE Benchmark Administration Limited took responsibility for administering LIBOR, following regulatory authorization by the FCA. LIBOR is expected to be phased out over the coming years. The Bank of England working group has approved SONIA as its preferred short-term interest benchmark and will take over its administration from April 2018. The impact this change will have is uncertain.
The Benchmarks Regulation entered into force on June 30, 2016. It aims to introduce a common framework and consistent approach to benchmark regulation across the EU by regulating producers, contributors to and users of benchmarks. The Benchmarks Regulation will replace the current UK framework regulating LIBOR and other specified benchmarks, notably the EURIBOR. The majority of provisions in the Benchmarks Regulation took effect on January 1, 2018. Although there are measures in the Benchmarks Regulation which are designed to prevent certain benchmarks from being undermined by a material reduction of benchmark contributors, it is not yet clear how successful these will be. The Benchmarks Regulation may therefore lead to unpredictable developments in relation to LIBOR and certain other benchmarks, which could affect the value of investments made by our funds.

The Directive and CRD IV restrict the ability of banks and alternative investment funds (“AIFs”) managed in the EU to invest in securitization vehicles including collateralized loan obligations operated by us unless either the “originator”, “original lender” or “sponsor” (as those terms are defined in the legislation) retains a 5% interest in the securitization concerned. Where such securitization arrangements are managed by Ares-affiliated undertakings, and in order to make the securitization attractive to banks and AIFs, this risk retention requirement is held by an appropriately (EU) authorized and regulated entity affiliated with us (i.e., as “sponsor”). The holding of that retention on our affiliate’s balance sheet is likely to increase that entity’s regulatory capital requirement and will accordingly adversely affect return on equity. On December 28, 2017 the text of the new Securitization Regulation was published in the EU Official Journal. The new regulation will apply from January 1, 2019 to securitization issued after that date. Although risk retention requirements will remain at 5% (of material net economic interest) a mechanism has been introduced whereby this requirement could be modified without the need for the change to be made through the normal EU legislative process. There are also new investor transparency requirements which require additional information to be disclosed to investors. Compliance with these new requirements in the Securitization Regulation may result in us incurring material costs.
The EU Regulation on OTC derivative transactions, central counterparties and trade repositories (commonly known as EMIR) will require the mandatory clearing of certain OTC derivatives through central counterparties and creates additional margining requirements in respect of OTC derivative transactions that are not cleared by a central counterparty. The implementation of EMIR is phased; timing is dependent on the type of derivative and the categorization of the parties to the trade. Implementation deadlines have already been deferred but as they currently stand full implementation is due by July 9, 2019. EMIR has started to impact on Ares-affiliated undertakings and as further implementation dates are reached the cost of complying with the requirements is likely to increase. In addition, there is an amendment to EMIR currently working its way through EU the legislative process. Among other things, the amendment would classify securitization special purpose entities as financial counterparties which may indirectly impact certain aspects of our business.
On December 14, 2015, the European Banking Authority published guidelines which are relevant to, among other things, EU banks' exposures to shadow banking entities. These guidelines have applied since January 1, 2017. The definition of shadow banking entity is extremely wide and could potentially catch a number of different entities, including investment funds and securitization vehicles. AIFs are excluded from the definition of a shadow banking entity unless they: (1) deploy leverage within the meaning of the Directive on a substantial basis; or (2) are permitted to originate loans or purchase third party lending exposures onto their balance sheet pursuant to the relevant fund rules or constitutional documents. These guidelines may affect our ability to raise capital in certain of our funds from EU banks.
On December 20, 2017, the European Commission published a proposal for a new directive and regulation on prudential requirements for MiFID investment firms, and the proposal will directly apply to Ares Management Limited and Ares European Loan Management LLP. Its application to Ares Management UK Limited is unclear. Under the proposals most affected firms would see their capital requirements increase significantly, although there would be transitional provisions allowing firms to increase their capital to the necessary level over three to five years. Firms will also have their liquidity requirements increased and some firms will be subject to additional public reporting requirements and pay regulation. The proposals are likely to increase the cost of us conducting business in the EEA. The legislative package is not expected to come into force until 2020 at the earliest.
Our UK, other European and Asian operations and our investment activities worldwide are subject to a variety of regulatory regimes that vary by country. In addition, we regularly rely on exemptions from various requirements of the regulations of certain foreign countries in conducting our asset management activities.
Each of the regulatory bodies with jurisdiction over us has regulatory powers dealing with many aspects of financial services, including the authority to grant, and in specific circumstances to cancel, permissions to carry on particular activities. We are involved regularly in trading activities that implicate a broad number of foreign (as well as U.S.) securities law regimes, including laws governing trading on inside information and market manipulation and a broad number of technical trading requirements that implicate fundamental market regulation policies. Violation of these laws could result in severe restrictions or prohibitions on our activities and damage to our reputation, which in turn could have a material adverse effect on our businesses in a number of ways, making it harder for us to raise new funds and discouraging others from doing business with us. In addition, increasing global regulatory oversight of fundraising activities, including local registration requirements in various jurisdictions and the addition of new compliance regimes, could make it more difficult for us to raise new funds or could increase the cost of raising such funds.
Alternative Investment Fund Managers Directive
The Directive was enacted in July 2011 and took effect on July 22, 2013. The Directive    AIFMD applies to (1)to: (i) AIFMs established in the EEA that manage EEA or non-EEA AIFs, (2)AIFs; (ii) non-EEA AIFMs that manage EEA AIFsAIFs; and (3)(iii) non-EEA AIFMs that market their AIFs to professional investors within the EEA.

Each Non-EEA AIFMs do not currently benefit from marketing passport rights and may only market AIFs to investors in some EEA jurisdictions in accordance with national private placement regimes. The U.K. implemented AIFMD while it was still a member of the AIFMs identified in (1), (2)EU and (3)“on-shored” it as part of the paragraph above needU.K. law, such that similar requirements continue to comply with the Directive’s disclosure and transparency requirements when seeking to market within the EEA and,apply in the case of non-EEA AIFMs seeking to market under jurisdiction specific private placement regimes, additional jurisdiction specific requirements where these exist (e.g., appointing a depositary). However, the full scope of the Directive may also be extended on a jurisdiction-by-jurisdiction basis to non-EEA AIFMs that wish to market an AIF within the EEA pursuant to a pan-European marketing passport. In July 2016, the ESMA published advice to EU institutions on extending the passport to certain non-EU jurisdictions. The European Commission was expected and arguably required to publish legislation before the end of October 2016 setting a date for the pan-European marketing passport to be made available, at least in respect of the five non-EEA jurisdictions it had assessed positively. It did not publish this legislation. In 2017U.K. notwithstanding Brexit.
    On November 10, 2023, the European Commission startedpublished a near-final amending directive, commonly referred to as “AIFMD II”. Assuming AIFMD II is adopted promptly and published in the Official Journal without delay, most of the changes will come into effect in 2026, subject to the grandfathering period for certain of the loan origination provisions and certain Annex IV disclosure requirements which will come into effect a year later. It is not yet clear to what extent (if any) the U.K. will seek to reflect AIFMD II in its domestic rules implementing AIFMD.
The draft contains a number of amendments to AIFMD, including more onerous delegation requirements which may require a review of AM Lux’s existing arrangements, enhanced substance requirements, additional liquidity management provisions for AIFMs to the applicationextent that they manage open-ended AIFs, and scoperevised regulatory reporting and investor disclosures requirements. The draft also proposed significant new requirements relating to the activities of AIFMD. The European Commission is expected to make a legislative proposal as a resultfunds managed by AM Lux which originate loans including new restrictions on the structure which such funds may take.
56

Table of the review (commonly referred to as "AIFMD II") with any changes to non-EEA jurisdiction passporting rights forming part of the proposal. Given that the review of the application and scope of AIFMD is still ongoing and the substance of any legislative proposal is uncertain, it remains unclear whether and how any such legislation could affect us or our subsidiaries. Further, compliance with AIFMD or Contents
AIFMD II may result in new restrictions on the ability of certain of our affiliates other than AM Lux to register funds for marketing to investors in certain EEA states.
AIFMD II imposes a range of requirements on AIFMs which may increase the cost of doing business for AM Lux and complexityAres’ non-EEA AIFMs (including AMUKL) to the extent they market funds in the EEA and potentially disadvantages our funds as investors in private companies located in EEA member states compared to non-AIF/AIFM competitors that may not be subject to such requirements. It is not yet clear to what extent (if any) the U.K. will seek to reflect AIFMD II in its domestic rules implementing AIFMD.
    While there is no current indication that the non-EEA AIFM passport provisions of raising capital and consequently may slow the pace of fundraising.
CertainAIFMD will become effective or available, certain of the jurisdiction specific private placement regimes may cease to exist whenin the non-EEA AIFM passport becomes available.case that it does. This development could have a negative impact on our ability to raise capital from EEA investors if, for example, a jurisdiction specific private placement regime ceases to operate and the non-EEA AIFM passport is not made available to United StatesU.S. or U.K. AIFMs.
The operating requirements imposed by the Directive on the categories of AIFMDs listed in (1) and (2) above include, among other things, rules relating to the remuneration of certain personnel, minimum regulatory capital requirements, restrictions on the use of leverage, restrictions on early distributions relating to portfolio companies (so-called “asset stripping rules”), disclosure and reporting requirements to both investors and home state regulators, the independent valuation of an AIF’s assets and the appointment of an independent depository to hold assets. As a result, the Directive increases the regulatory burden and the cost of doing business for Ares Management UK Limited and, to a more limited extent, non-EEA AIFMs which market non-EEA AIFs under EEA private placement regimes. This potentially disadvantages our funds as investors in private companies located in EEA member states when compared to non-AIF/AIFM competitors that may not be subject to the requirements of the Directive, thereby potentially restricting our funds’ ability to invest in such companies. “Levelling-up” of some of these requirements seems likely under AIFMD II.
The Directive could also limit our operating flexibility and our investment opportunities, as well as expose us and/or our funds to conflicting regulatory requirements in the United States and elsewhere.
Solvency II
Solvency II sets out stronger capital adequacyThe European solvency framework and risk management requirements for European insurers and reinsurers and, in particular, dictates how much capital such firms must hold against their liabilities and introduces a risk-based assessment of those liabilities. Solvency II came into force on January 1, 2010 but was only required to be implemented by firms on January 1, 2016. There are also a number of transitional provisions designed to avoid market disruption. Solvency II imposes, among other things, substantially greater quantitative and qualitative capital requirementsprudential regime for insurers and reinsurers, under the Solvency II Directive 2009/138/EC (“Solvency II”) imposes economic risk-based solvency requirements across all EU member states. Solvency II is supplemented by European Commission Delegated Regulation (EU) 2015/35 (the “Delegated Regulation”), other European Commission “delegated acts” and binding technical standards, and guidelines issued by the European Insurance and Occupational Pensions Authority. The Delegated Regulation sets out detailed requirements for individual insurance and reinsurance undertakings, as well as other supervisoryfor groups, based on the overarching provisions of Solvency II, which together make up the core of the single prudential rulebook for insurance and disclosure requirements. reinsurance undertakings in the EU.
We are not subject to Solvency II; however, many of our European insurer or reinsurer fund investors are subject to this directive, as applied under applicable domestic law. Solvency II may impact insurers’ and reinsurers’ investment decisions and their asset allocations. In addition, insurers and reinsurers will beare subject to more onerous data collation and reporting requirements. As a result, there is the potential for Solvency II couldto have an adverse indirect effect on our businesses by, among other things, restricting the ability of European insurers and reinsurers to invest in our funds and imposing on us extensive disclosure and reporting obligations for those insurers and reinsurers that do invest in our funds. A numberOn September 22, 2021, the European Commission published proposed legislation to amend the Solvency II Directive. The European Parliament and the Council of reviews of and amendmentsthe EU are still considering the legislation.
Post Brexit, Solvency II was on-shored in the U.K. In November 2022, His Majesty’s Treasury (“HM Treasury”) issued its response to various aspects and componentsits consultation on a Review of Solvency II, are expected throughout 2018.outlining the areas of reform that would be delivered through changes to the U.K.’s Prudential Regulation Authority’s (“PRA”) rules and legislation. Two consultation papers have since followed, the first published on June 29, 2023 and the second on September 28, 2023. The first consultation paper focused on simplifying the existing framework with the intent of reducing the administrative and reporting requirements (and in turn, costs) for U.K. insurance firms. The second consultation paper included proposals to reform insurers’ matching adjustment mechanism, with the intention of widening the categories of assets which insurers can hold in their portfolios. The intended implementation date for the majority of the changes proposed in the consultation papers is December 31, 2024, with the reforms to the matching adjustment reforms taking effect from June 30, 2024. It is unclear at this stage the extent to which the proposed amendments to Solvency II will have an indirect effect on our businesses.
MiFID II
The recast Markets in Financial Instruments Directive and Markets in Financial Instruments Regulation (collectively referred to as MiFID II) came into effect on January 3, 2018.    Although the U.K. has now withdrawn from the EU, its rules implementing MiFID II amendscontinue to have effect and MiFIR has been on-shored into U.K. law (subject to certain amendments to ensure it operates properly in a U.K.-specific context). MiFID II amended the existing MiFID regime and, among other requirements, introducesintroduced new organizational and operationalconduct of business requirements for investment firms in the EEA. MiFID II requirements apply to AML and AELM as MiFID investment firms. Certain requirements of MiFID II also apply to AIFMs with a MiFID “top-up” permission, such as AMUKL and AM Lux.
Specifically, under    MiFID II extended MiFID requirements in a number of areas such as the receipt and payment of inducements (including investment research), suitability and appropriateness assessments, conflicts of interest, record-keeping, costs and charges disclosures, best execution, product design and governance, and transaction and trade reporting. Under MiFID II, national competent authorities (including the FCA), within EU member states, are also required to establish position limits in relation to the maximum size of positions which a relevant person can hold in certain commodity derivatives. The limits apply to contracts traded on trading venues and their economically equivalent OTC contracts. The position

limits established, as amended from time to time, and our ability to rely on any exemption thereunder may affect the size and types of investments we may make. Failure to comply with MiFID II and
57

Table of Contents
its associated legislative acts could result in sanctions from national regulators, the loss of market access and a number of other adverse consequences which would have a detrimental impact on our business. Certain aspects of MIFID II and MiFIR are subject to review and change in both the EU and the U.K. In August 2022, the EU introduced amendments to MiFID II. The key requirement is that EU MiFID firms, who are providing financial advice and portfolio management, need to carry out a mandatory assessment of the sustainability preferences of their clients. Broadly, sustainability preferences address taxonomy alignment, Sustainable Finance Disclosure Regulation (“SFDR”) sustainable investment alignment and consideration of principal adverse impacts. EU MiFID firms then need to take these into account in the selection process of financial products.
Credit Servicers and Purchasers Directive
In December 2021, a new European Commission directive governing credit servicers, credit purchasers and the recovery of collateral in connection with loans (the “Credit Servicers and Purchasers Directive” or “CSPD”) became effective. The policy aim behind CSPD is the development of a well-functioning secondary market for non-performing loans. Member States were required to adopt and apply measures implementing CSPD by December 30, 2023 and entities carrying on credit servicing activities from December 30, 2023 were required to obtain authorization under the CSPD by June 29, 2024.
The CSPD applies to, among others, “credit servicers” and “credit purchasers” and would impose a number of new requirements relating to licensing, conduct of business and provision of information.
The definition of “credit servicer” in the European Commission proposal is sufficiently broad that it could be construed to include asset managers.
Ares funds which are established in the EU will be in scope of CSPD where they purchase non-performing loans (or purchases loans issued by an EU credit institution that subsequently become non-performing loans) and will be required to appoint a credit servicer for non-performing loans concluded with consumers. Ares funds which are established outside of the EU will be required to designate an EU established representative when purchasing in-scope non-performing loans who will be responsible for compliance with the obligations imposed on the credit purchased under CSPD. The impact of the CSPD, together with other regulatory initiatives in the leveraged and non-performing loans markets, continues to be under review. Such requirements are likely to result in additional compliance and operational costs for Ares managed funds.
Hong Kong Security Law
On June 30, 2020, the National People’s Congress of China passed a national security law (the “National Security Law”), which criminalizes certain offenses including secession, subversion of the Chinese government, terrorism and collusion with foreign entities. The National Security Law also applies to non-permanent residents. Although the extra-territorial reach of the National Security Law remains unclear, the application of the National Security Law to conduct outside Hong Kong by non-permanent residents of Hong Kong could limit the activities of or negatively affect the Company, our funds and/or portfolio companies. The National Security Law has been condemned by the U.S., the U.K. and several EU countries and has created additional tensions between the U.S. and China. Escalation of tensions resulting from the National Security Law, including conflict between China and other countries, protests and other government measures, as well as other economic, social or political unrest in the future, could adversely impact the security and stability of the region and may have a material adverse effect on countries in which the Company, our funds and portfolio companies or any of their respective personnel or assets are located. In addition, any downturn in Hong Kong’s economy could adversely affect the financial performance of the Company and our investments, or could have a significant impact on the industries in which the Company participates, and may adversely affect the operations of the Company, its funds and portfolio companies, including the retention of investment and other key professionals located in Hong Kong.
Regulations governing ARCC’s and ASIF’s operation as business development companies affect their ability to raise, and the way in which they raise, additional capital.
As business development companies, ARCC and ASIF operate as highly regulated businesses within the provisions of the Investment Company Act. Many of the regulations governing business development companies restrict, among other things, leverage incurrence, co-investments and other transactions with other entities within the Ares Operating Group. Certain of our funds may be restricted from engaging in transactions with ARCC or ASIF and their respective subsidiaries. As business development companies registered under the Investment Company Act, ARCC and ASIF may issue debt securities or preferred stock and borrow money from banks or other financial institutions, which we refer to collectively as “senior securities,” up to the maximum amount permitted by the Investment Company Act. Under the provisions of the Investment Company Act, ARCC and ASIF are currently permitted, as business development companies, to incur indebtedness or issue senior securities only in amounts such that their respective asset coverage ratio, as calculated pursuant to the Investment Company Act, equals at least 150% after each such issuance. ARCC and ASIF are also generally prohibited from issuing and selling their respective common
58

Table of Contents
stock at a price below net asset value per share without first obtaining approval from their respective stockholders and independent directors.
Business development companies may issue and sell common stock at a price below net asset value per share only in limited circumstances, one of which is after obtaining stockholder approval for such issuance in accordance with the Investment Company Act. ARCC’s stockholders have, in the past, approved such issuances so that during the subsequent 12-month period, ARCC may, in one or more public or private offerings of its common stock, sell or otherwise issue shares of its common stock at a price below the then-current net asset value per share, subject to certain conditions including parameters on the amount of shares sold, approval of the sale by the directors and a requirement that the sale price be not less than approximately the market price of the shares of its common stock at specified times, less the expenses of the sale. ARCC may ask its stockholders for additional approvals from year to year. There can be no assurance that such approvals will be obtained. The extent to which ARCC is negatively affected by these regulations may affect our overall profitability.
The publicly-traded investment vehicles that we manage are subject to regulatory complexities that limit the way in which they do business and may subject them to a higher level of regulatory scrutiny.
The publicly-traded investment vehicles that we manage operate under a complex regulatory environment. Such companies require the application of complex tax and securities regulations and may entail a higher level of regulatory scrutiny. In addition, regulations affecting our publicly-traded investment vehicles generally affect their ability to take certain actions. Certain of our vehicles have elected to be treated as a RIC or a REIT for U.S. federal income tax purposes. To maintain their status as a RIC or a REIT, such vehicles must meet, among other things, certain source of income, asset diversification and annual distribution requirements. ARCC and ASIF are required to generally distribute to their respective stockholders at least 90% of their respective investment company taxable income to maintain their RIC status. ARCC, ASIF and our publicly-traded closed-end fund are subject to complex rules under the Investment Company Act, including rules that restrict certain of our funds from engaging in transactions with ARCC, ASIF or the closed-end fund. In addition, subject to certain exceptions, ARCC and ASIF are generally prohibited from issuing and selling their common stock at a price below net asset value per share and from incurring indebtedness (including for this purpose, preferred stock), if ARCC’s or ASIF’s respective asset coverage ratio, as calculated pursuant to the Investment Company Act, equals less than 150% after giving effect to such incurrence. The extent to which the publicly-traded investment vehicles that we manage are negatively affected by these regulations may affect our overall profitability.
Failure to comply with “pay to play” regulations implemented by the SEC and certain states, and changes to the “pay to play” regulatory regimes, could adversely affect our businesses.

In recent years, the SEC and several states have initiated investigations alleging that certain private equity firms and hedge funds or agents acting on their behalf have paid money to current or former government officials or their associates in exchange for improperly soliciting contracts with state pension funds. Under SEC rules addressing “pay to play” practices, investment advisers are prohibited from providing advisory services for compensation to a government entity for two years, subject to very limited exceptions, after the investment adviser, its senior executives or its personnel involved in soliciting investments from government entities make contributions to certain candidates and officials in a position to influence the hiring of an investment adviser by such government entity. Advisers are required to implement compliance policies designed, among other matters, to track contributions by certain of the adviser’s employees and engagements of third parties that solicit government entities and to keep certain records to enable the SEC to determine compliance with the rule. In addition, there have been similar rules on a state level regarding “pay to play” practices by investment advisers. FINRA also has its own set of “pay to play” regulations that are similar to the SEC’s regulations.
As we have a significant number of public pension plans that are investors in our funds, these rules could impose significant economic sanctions on our businesses if we or one of the other persons covered by the rules make any such contribution or payment, whether or not material or with an intent to secure an investment from a public pension plan. We may also acquire other investment managers or hire additional personnel who are not subject to the same restrictions as us, but whose activity, and the activity of their principals, prior to our ownership or employment of such person could affect our fundraising. In addition, such investigations may require the attention of senior management and may result in fines if any of our funds are deemed to have violated any regulations, thereby imposing additional expenses on us. Any failure on our part to comply with these rules could cause us to lose compensation for our advisory services or expose us to significant penalties and reputational damage.
Increasing scrutiny from stakeholders and regulators with respect to ESG matters could impact our or our funds’ portfolio companies’ reputation, the cost of our or their operations, or result in investors ceasing to allocate their capital to us, all of which could adversely affect our business and results of operations.

59

Table of Contents
We, our funds and their portfolio companies face increasing public scrutiny related to ESG activities. A variety of organizations measure the performance of companies on ESG topics, and the results of these assessments are widely publicized. Investment in funds that specialize in companies that perform well in such assessments are increasingly popular, and major institutional investors have publicly emphasized the importance of such ESG ratings and measures to their investment decisions. If our ESG ratings or practices do not meet the standards set by such investors or our stockholders, or if we fail, or are perceived to fail, to demonstrate progress toward our ESG goals and initiatives, they may choose not to invest in our funds or exclude our common stock from their investments. Relatedly, we, our funds and their portfolio companies risk damage to our brands and reputations, if we or they do not or are perceived to not act responsibly in a number of areas, such as DEI, human rights, climate change and environmental stewardship, support for local communities, corporate governance and transparency, or consideration of ESG factors in our investment processes. Adverse incidents with respect to ESG activities could impact the value of our brand, the brand of our funds or their portfolio companies, or the cost of our or their operations and relationships with investors, all of which could adversely affect our business and results of operations.
Conversely, anti-ESG sentiment has gained momentum across the U.S., with several states having enacted or proposed “anti-ESG” policies, legislation or issued related legal opinions. For example: (i) boycott bills target financial institutions that “boycott” or “discriminate against” companies in certain industries (e.g., energy and mining) and prohibit state entities from doing business with such institutions and/or investing the state’s assets (including pension plan assets) through such institutions; and (ii) ESG investment prohibitions require that state entities or managers/administrators of state investments make investments based solely on pecuniary factors without consideration of ESG factors. If investors subject to such legislation viewed our funds or ESG practices, including our climate-related goals and commitments, as being in contradiction of such “anti-ESG” policies, legislation or legal opinions, such investors may not invest in our funds, our ability to maintain the size of our funds could be impaired, and it could negatively affect the price of our common stock. Further, asset managers have been subject to recent scrutiny related to ESG-focused industry working groups, initiatives and associations, including organizations advancing action to address climate change or climate-related risk. Such scrutiny could expose us to the risk of antitrust investigations or challenges by federal authorities, result in reputational harm and discourage certain investors from investing in our funds. In addition, some state attorneys general have asserted that the Supreme Court’s decision striking down race-based affirmative action in higher education in June 2023 should be analogized to private employment matters and private contract matters. Several new cases alleging discrimination based on similar arguments have been filed since the decision, with scrutiny of certain corporate DEI practices increasing.
If we do not successfully manage expectations across these varied stakeholder interests, it could erode stakeholder trust, impact our reputation and constrain our investment opportunities. In addition, clients and investors may decide not to commit capital to future fundraises as a result of their assessment of our approach to and consideration of ESG. To the extent our access to capital from clients or investors focused on ESG ratings or matters is impaired, we may not be able to maintain or increase the size of our specialized funds or raise sufficient capital for new specialized funds, which may adversely affect our revenues.
In addition, our ESG initiatives, goals, targets, intentions and expectations are subject to change, and no assurance or guarantee can be given that such goals, targets, intentions or expectations (some of which are aspirational in nature) will be met. Statistics and metrics that we report relating to ESG matters are estimates and may be based on assumptions or developing standards (including our internal standards and policies). There can be no assurance that our ESG policies and procedures, including policies and procedures related to responsible investment or the application of ESG-related criteria or reviews to the investment process, including certain metrics or frameworks, will continue. Such policies and procedures may change, even materially, or may not be applied to certain investments. In addition, the act of selecting and evaluating material ESG factors is subjective by nature, and there is no guarantee that the criteria utilized, or judgement exercised by Ares, will reflect the beliefs or values, internal policies or preferred practices of investors or other managers, or align with market trends. Further, Ares may determine at any point that it is not feasible or practical to implement or complete certain of its ESG initiatives, policies and procedures based on cost, timing or other considerations.
Additionally, certain regulations related to ESG that are applicable to us, our funds and their portfolio companies could adversely affect our business. The European Commission’s “action plan on financing sustainable growth” is designed to, among other things, define and reorient investment toward sustainability. The action plan contemplates: establishing EU labels for green financial products; clarifying asset managers’ and institutional investors’ duties regarding sustainability in their investment decision-making processes; increasing disclosure requirements in the financial services sector around ESG and strengthening the transparency of companies on their ESG policies; and introducing a ‘green supporting factor’ in the EU prudential rules for banks and insurance companies to incorporate climate risks into banks’ and insurance companies’ risk management policies.
As part of these regulations, SFDR introduced mandatory sustainability-related transparency requirements for MiFID investment firms providing portfolio management or investment advisory services, and AIFMs. For Ares, this primarily impacts
60

Table of Contents
our AIFMs by requiring certain firm-level website disclosures regarding how sustainability risks are integrated into our investment process and remuneration practices. Fund-level disclosures are also required in relation to the integration of sustainability risks into investment decisions and potential impacts on fund returns. From January 1, 2022, further disclosures in periodic reports have been required and, since January 1, 2023 certain template pre-contractual and periodic disclosures must be provided in a uniform template.
Further, firms that offer financial products (such as AIFs) that promote environmental or social characteristics, or which have a sustainable investment objective, will also need to comply with additional disclosure and periodic reporting requirements that are broadly designed to prevent firms from “greenwashing” (i.e., the holding out of a product as having green or sustainable characteristics where this is not, in fact, the case). This reporting is mainly focused on the clear and concise articulation of their ESG features and the creation of bespoke key performance indicators to support annual reporting. A significant reorientation in the market following the implementation of these and further measures could be adverse to our funds’ portfolio companies if they are perceived to be less valuable as a consequence of, among other things, their carbon footprint or “greenwashing.” There is also a risk that market expectations in relation to SFDR categorization of financial products could adversely affect our ability to raise capital from EEA investors. In September 2023, the European Commission announced a consultation on refinement versus a wholesale re-write of product categorization criteria under SFDR, but the consultation did not contain much in the way of policy suggestions. Ares cannot guarantee that its current approach will meet future regulatory requirements, reporting frameworks or best practices, increasing the risk of related enforcement. Compliance with new requirements may lead to increased management burdens and costs.
In addition, on June 22, 2020, Regulation (EU) 2020/852 on the establishment of a framework to facilitate sustainable investment was published in the Official Journal of the EU (the “Taxonomy Regulation”). The Taxonomy Regulation sets out a framework for classifying economic activities as “environmentally sustainable” and also introduces certain mandatory disclosure and reporting requirements, which supplement those set out in SFDR. The Taxonomy Regulation took effect in part (for climate change mitigation and adaptation) from January 1, 2022 and in part (for remaining environmental objectives) from January 1, 2023.
Sustainable finance initiatives continue to evolve rapidly so it is not possible at this stage to fully assess how our business will be affected. We are monitoring developments in relation to EU corporate sustainability reporting and proposals for laws requiring due diligence of supply chains. Guidance from EU policymakers and supervisors moves the goalposts frequently, for example a recent consultation paper on the use of ESG-related words in fund names, which, if implemented, may require changes to either the names of certain Ares funds or changes to their portfolio composition. We, our funds and their portfolio companies are subject to the risk that similar measures might be introduced in other jurisdictions in which we or they currently have investments or plan to invest in the future. Additionally, compliance with any new laws or regulations (including recent heightened SEC scrutiny regarding advisor compliance with advisors’ own internal policies) increases our regulatory burden and could make compliance more difficult and expensive, affect the manner in which we, our funds or their portfolio companies conduct our businesses and adversely affect our profitability.
Moreover, on January 5, 2023, the Corporate Sustainability Reporting Directive (“CSRD”) came into effect. Broadly, CSRD amends and strengthens the rules introduced on sustainability reporting for companies, banks and insurance companies under the Non-Financial Reporting Directive (2014/95/EU) (“NFRD”). CSRD requires a much broader range of companies to produce detailed and prescriptive reports on sustainability-related matters within their financial statements – including large EU companies (including EU subsidiaries of non-EU parent companies), EU and non-EU-companies (including small and medium sized enterprises) with listed securities on EU-regulated markets (except micro-undertakings) and non-EU companies with significant turnover and a legal presence on EU markets.
The reporting requirements will be phased in from 2024, with the first reports including audited information on sustainability-related matters being published in 2025 to cover the 2024 financial year. The reporting standards under CSRD within delegated legislation have been adopted by the European Commission and are still due to be published in the Official Journal of the EU. There can be no assurance that adverse developments with respect to such risks will not adversely affect assets held by Ares managed funds that are held in certain countries or the returns from these assets. One or more of our businesses may fall within scope of CSRD and this may lead to increased management burdens and costs.

Finally, starting in 2025 AML and AMUKL will have to disclose certain climate-related financial information in line with the four overarching pillars of the TCFD recommendations (Governance, Strategy, Risk Management, Metrics & Targets) on a mandatory basis under new FCA rules. Collating the relevant data and preparing the relevant report under these new rules could impose additional compliance and administrative burden which could in turn increase costs.

In addition to the above EU regulations, Sustainability Labelling and Disclosure of Sustainability-Related Financial Information Instrument 2023 (“SDR”) introduces sustainability disclosure requirements, investment product labels and an ‘anti-greenwashing’ rule. The anti-greenwashing rule applies to all U.K.-authorized firms in their communications with clients in the
61

Table of Contents
U.K., but the balance of the new regime is directed at U.K. investment funds and U.K. regulated asset managers, that manage or distribute such funds. The FCA has indicated it will consult in early 2024 on alternative approaches to applying the labelling regime to portfolio managers and continues to work with His Majesty’s Treasury to consider its approach in respect of overseas funds. As a result, it is not yet clear to what extent this new legislation will affect Ares. If these rules become applicable to our funds or products, then additional regulatory costs may be incurred and they may also have an impact on our ability to deliver on our fund’s investment strategies and financial returns could be adversely impacted as a result.

In Asia, regulators in Singapore and Hong Kong have introduced requirements for asset managers to integrate climate risk considerations in investment and risk management processes, together with enhanced disclosure and reporting and have also issued enhanced rules for certain ESG funds on general ESG risk management and disclosure. Meanwhile, Australia’s securities regulator issued information on “greenwashing”, and the Australian government is seeking input on the design and implementation of a climate-related financial disclosure regime.

There is also a growing regulatory interest across jurisdictions in improving transparency regarding the definition, measurement and disclosure of ESG factors in order to avoid exceeding position limits,allow investors to validate and better understand sustainability claims. For example, on May 25, 2022, the SEC proposed amendments to rules and reporting forms concerning ESG factors. On August 23, 2023, the SEC adopted its final rule enhancing the regulation of private fund advisers, which includes requirements with respect to the disclosure of certain information to investors that could affect the way certain ESG-related information is shared. In addition, in 2021 the SEC established an enforcement task force to look into ESG practices and disclosures by public companies and investment managers and has started to bring enforcement actions based on ESG disclosures not matching actual investment processes. Growing interest on the part of investors and regulators in ESG factors and increased demand for, and scrutiny of, ESG-related disclosure by asset managers, have also increased the risk that asset managers could be perceived as, or accused of, making inaccurate or misleading statements regarding the ESG-related investment strategies or their and their funds’ ESG efforts or initiatives, or “greenwashing.” Such perception or accusation could damage our reputation, result in litigation or regulatory actions and adversely impact our ability to raise capital.
On March 21, 2022, the SEC issued a proposed rule regarding the enhancement and standardization of mandatory climate-related disclosures for investors. The proposed rule would mandate extensive disclosure of climate-related data, risks, and opportunities, including financial impacts, physical and transition risks, related governance and strategy and greenhouse gas emissions, for certain public companies.Although the ultimate date of effectiveness and the final form and substance of the requirements for the proposed rule are not yet known and the ultimate scope and impact on our business is uncertain, compliance with the proposed rule, if finalized, may result in increased legal, accounting and financial compliance costs, make some activities more difficult, time-consuming and costly, and place strain on our personnel, systems and resources. In October 2023, California enacted legislation that will ultimately require certain companies that do business in California to publicly disclose their Scopes 1, 2, and 3 greenhouse gas emissions, with third party assurance of such data, and issue public reports on their climate-related financial risk and related mitigation measures.
The SEC has also announced that it is possible thatworking on proposals for mandatory disclosure of certain ESG-related matters, including with respect to board diversity and human capital management. At this time, there is uncertainty regarding the scope of such proposals or when they would become effective. Compliance with any new laws or regulations increases our regulatory burden and could make compliance more difficult and expensive, affect the manner in which we or our funds’ portfolio companies conduct our businesses and adversely affect our profitability.

Economic sanction laws in the U.S. and other jurisdictions may prohibit us and our affiliates may need to significantly alterfrom transacting with certain countries, individuals and companies, which could negatively impact our business, processes related to such trading, including by modifying trading strategiesfinancial condition and instructions.operating results.
ComplianceEconomic sanction laws in the U.S. and other jurisdictions may restrict or prohibit us or our affiliates from transacting with these rules requires updates to some existing procedures, systemscertain countries, territories, individuals and controlsentities. In the U.S., the U.S. Department of the Treasury’s Office of Foreign Assets Control (“OFAC”) administers and enforces laws, executive orders and regulations establishing U.S. economic and trade sanctions, which restrict or prohibit, among other things, direct and indirect transactions with, and the developmentprovision of new internal systems,services to, certain foreign countries, territories, individuals and entities. These types of sanctions may significantly restrict or completely prohibit lending activities in certain jurisdictions, and if we were to violate any such laws or regulations, we may face significant legal and monetary penalties, as well as reputational damage. OFAC sanctions programs change frequently, which may include substantial automatedmake it more difficult for us or our affiliates to ensure compliance. Moreover, OFAC enforcement is increasing, which may increase the risk that an issuer or we become subject of such actual or threatened enforcement.
For instance, the Iran Threat Reduction and electronic systems,Syria Human Rights Act of 2012 (the “ITRA”) expanded the scope of U.S. sanctions against Iran. Additionally, Section 219 of the ITRA amended the Exchange Act to require companies subject to SEC reporting obligations under Section 13 of the Exchange Act to disclose in their periodic reports specified dealings or
62

Table of Contents
transactions involving Iran or other individuals and entities targeted by certain OFAC sanctions engaged in by the reporting company or any of its affiliates during the period covered by the relevant periodic report. In some cases, the ITRA requires companies to disclose these types of transactions even if they were permissible under U.S. law. Companies that currently may be or may have been at the time considered our affiliates have from time to time publicly filed and/or provided to us the disclosures reproduced in our Quarterly Reports. We do not independently verify or participate in the preparation of these disclosures. We are required to separately file and have separately filed with the SEC a notice when such activities have been disclosed in this report or in our quarterly reports, and the SEC is likelyrequired to involve material costspost such notice of disclosure on its website and send the report to the business.President and certain U.S. Congressional committees. The President thereafter is required to initiate an investigation and, within 180 days of initiating such an investigation, determine whether sanctions should be imposed. As of December 31, 2023, no sanctions have been imposed on us as a result of our disclosures of these activities. Disclosure of such activity, even if such activity is not subject to sanctions under applicable law, and any sanctions actually imposed on us or our affiliates as a result of these activities, could harm our reputation and have a negative impact on our business, financial condition and results of operations, and any failure to disclose any such activities as required could additionally result in fines or penalties. In addition, any sanctions imposed by the U.S. and other countries in connection with hostilities between Russia and Ukraine and more recently between Israel and Hamas may impact us, our funds and their portfolio companies.
The vote in the UK toU.K.’s exit from the EU (“Brexit”) could adversely affect our business and our operations.
The vote byFollowing the electorate in a referendum in the UK toU.K.’s exit from the EU (referredon January 31, 2020 and a transitional period, EEA “passporting rights” facilitating market access into the EEA by U.K. firms, and into the U.K. by EEA firms, are no longer available. Various EU laws have been “on-shored” into domestic U.K. legislation and certain transitional regimes and deficiency-correction powers exist to ease the transition.
The Trade and Cooperation Agreement (the “TCA”) governs certain matters between the U.K. and the EU. While the TCA includes a commitment by the U.K. and the EU to keep their markets open for persons wishing to provide financial services through a permanent establishment, it does not substantively address future cooperation in the financial services sector or reciprocal market access into the EU by U.K. firms under equivalence arrangements or otherwise.
A similar temporary regime, the TMPR, allows AIFMs to continue to market those funds in the U.K. that were in existence on December 31, 2020, on broadly the same terms as “Brexit”previously applied. Unless extended, the TMPR lasts until December 31, 2025.
While the TCA and the TMPR provide clarity in some areas, there remains considerable uncertainty as to the future position of the U.K. and the arrangements which will apply to its relationships with the EU and other countries. The implications and the operation of the TCA and the TMPR may also be subject to change and/or develop at short notice. AM Lux and its EU branches were established to enable Ares to continue certain regulated activities in the EU post Brexit, such as the management and marketing of funds (including funds managed by affiliates of AM Lux) to European investors. Applicable regulatory requirements may increase effective tax rates within Ares’ structure or on its investments, including by way of higher levels of tax being imposed on AM Lux and EU branches of AM Lux.
Further, the development of the U.K.’s future legislative approach and the extent to which the U.K. diverges from EU legislation remains uncertain. The U.K. introduced the Financial Services and Markets Act 2023 (“FSMA 2023”) could disrupt our businesson June 29, 2023 as a significant piece of legislation that the U.K. government intends to use to bring about changes to the U.K.’s financial services and operations,markets regime. FSMA 2023 contains a number of substantial measures that will overhaul the existing financial services regime, including the liquidityimplementation of the U.K.’s post-Brexit framework through the repeal of retained EU legislation relating to financial services and valuemarkets, as well as the migration of our investments. Since its announcement, Brexitmuch of that law into regulator’s rulebooks. It is likely that, with the exception of regulations which are no longer needed and which can be repealed without replacement, individual pieces of retained EU will only be revoked once the relevant regulator’s final rules has caused significant geo-political uncertainty and market volatility inbeen established. It is expected that the UK and elsewhere. Althoughlegislative reform process will be slow, with the referendum is non-binding, the UK’s leadership has indicatedU.K. Treasury confirming that it expects Brexit to be passed into law and to commence negotiations with the EU to determine the future terms, including with respect to trade, of the UK’s ongoing relationship with the EU. These negotiations are expected toit will take a number of years which could prolongto complete the related uncertainty and volatility, which among other things, could affectprocess of revoking retained EU law. To the pace of capital deployment and investment realizations.
Depending on the outcome of these negotiations, the UK could lose access to the single EU market and to the global trade deals negotiated byextent that U.K. materially diverges from the EU on behalf of its members, which could have a material adverse effect on our operations and the operations of our portfolio companies. For example, a declineregime, compliance with two diverging regulatory regimes in trade could affect the attractiveness of the UK as a global investment center and, as a result, could make doing business in Europe more difficult.
Currently under the EU single market directives, mutual access rights to markets and market infrastructure exist across the EU and U.K. requirements may to continue to increase the mutual recognition of insolvency, bank recoveryoperational burden and resolution regimes applies. In addition, certain regulated entities licensed or authorizedcost to our operations in one EEA jurisdiction may operate on a cross-border basis in other EEA countries in reliance on passporting rights and without the need for a separate license or authorization. There is uncertainty as to whether, following a UK exit from the EU or the EEA (whatever the form thereof), a passporting regime (or similar regime in its effect) will apply (if at all). Depending on the terms of the UK’s exit and the terms of any replacement relationship, it is likely that UK regulated entities may, on the UK’s withdrawal from the EU, lose the right to passport their services to EEA countries, and EEA entities may lose the right to reciprocal passporting into the UK. The movement of capital and the mobility of personnel may also be restricted. Also, UK entities may no longer have access rights to market infrastructure across the EU and the recognition of insolvency, bank recovery and resolution regimes across the EU may no longer be mutual.    these jurisdictions.
These complex issues and other by-products of Brexit such as the tightening of credit in the UK commercial real estate market, may also increase the costs of having operations, conducting business and making investments in the UKU.K. and Europe. As a result, the performance of our funds which are focused on investing in the UKU.K. and to a lesser extent across Europe, such as certain funds in our Credit and Real EstateAssets Groups may be disproportionately affected compared to those funds that invest more broadly across global geographies or are focused on different regions.
The Brexit vote could causeuncertainty surrounding the precise nature of the U.K.’s future legal relationship with the EU may continue to be a source of significant exchange rate fluctuations that result inand/or other adverse effects on international markets. Unhedged currency
63

Table of Contents
fluctuations have the strengthening of the U.S. dollar against foreign currencies in which we conduct business, including the British pound and the Euro. Where un-hedged, the strengthening of the U.S. dollar relativeability to other currencies may, among other things, adversely affect the results of operations of our funds and their underlying business investments, that are denominated in non-U.S. dollar currencies and also adversely affect businesses that rely onas well as the strengthrelative value of foreign currencies against the U.S. dollar, and thereby have a negative impact on our investments in those businesses. Movements in the rate of exchange between the U.S. dollar and non-U.S. dollar currencies affect the management fees earned by funds with fee earning AUM denominated in non-U.S. dollar currencies as well as by funds with fee earning AUM denominated in U.S. dollars that hold investments denominated in non-U.S. dollar currencies. Additionally, movements in exchange rates affect operatingand impact of operational expenses for our foreign offices that are denominated in non-U.S. currencies, cash balances we hold in non-U.S. currencies and investments we hold in non-U.S. currencies.on profitability.
Further, the UK’s determination as to which, if any, EU laws to repeal, retain, replace or replicate upon its exit from the EU could exacerbate the uncertainty and result in divergent national laws and regulations. Changes to the regulatory regimes in the UK or the EU and its member states could materially affect our business prospects and opportunities and increase our costs. In addition, Brexit could potentially disrupt the tax jurisdictions in which we operate and affect the tax benefits or liabilities in these or other jurisdictions in a manner that is adverse to us and/or our funds. Any of the foregoing could materially and adversely affect our business, results of operations and financial condition.


We are subject to risks in using prime brokers, custodians, counterparties, administrators and other agents.
Many of our funds depend on the services of prime brokers, custodians, counterparties, administrators and other agents to carry out certain securities and derivatives transactions. transactions and other administrative services. We are subject to risks of errors and mistakes made by these third parties, which may be attributed to us and subject us or our fund investors to reputational damage, penalties or losses. We may be unsuccessful in seeking reimbursement or indemnification from these third-party service providers.
The terms of the contracts with these contractsthird-party service providers are often customized and complex, and many of these arrangements occur in markets or relate to products that are not subject to regulatory oversight, although the Dodd-Frank Act provides for new regulation of the derivatives market. In particular, some of our funds utilize prime brokerage arrangements with a relatively limited number of counterparties, which has the effect of concentrating the transaction volume (and related counterparty default risk) of these funds with these counterparties.
Our funds are subject to the risk that the counterparty to one or more of these contracts defaults, either voluntarily or involuntarily, on its performance under the contract. Any such default may occur suddenly and without notice to us. Moreover, if a counterparty defaults, we may be unable to take action to cover our exposure, either because we lack contractual recourse or because market conditions make it difficult to take effective action. This inability could occur in times of market stress, which is when defaults are most likely to occur.
In addition, our risk-management models may not accurately anticipate the impact of market stress or counterparty financial condition, and as a result, we may not have taken sufficient action to reduce our risks effectively. Default risk may arise from events or circumstances that are difficult to detect, foresee or evaluate. In addition, concerns about, or a default by, one large participant could lead to significant liquidity problems for other participants, which may in turn expose us to significant losses.
Although we have risk-management models and processes to ensure that we are not exposed to a single counterparty for significant periods of time, given the large number and size of our funds, we often have large positions with a single counterparty. For example, most of our funds have credit lines. If the lender under one or more of those credit lines were to become insolvent, we may have difficulty replacing the credit line and one or more of our funds may face liquidity problems.
In the event of a counterparty default, particularly a default by a major investment bank or a default by a counterparty to a significant number of our contracts, one or more of our funds may have outstanding trades that they cannot settle or are delayed in settling. As a result, these funds could incur material losses and the resulting market impact of a major counterparty default could harm our businesses, results of operation and financial condition.
In the event of the insolvency of a prime broker, custodian, counterparty or any other party that is holding assets of our funds as collateral, our funds might not be able to recover equivalent assets in full as they will rank among the prime broker’s, custodian’s or counterparty’s unsecured creditors in relation to the assets held as collateral. In addition, our funds’ cash held with a prime broker, custodian or counterparty generally will not be segregated from the prime broker’s, custodian’s or counterparty’s own cash, and our funds may therefore rank as unsecured creditors in relation thereto. If our derivatives transactions are cleared through a derivatives clearing organization, the CFTC has issued final rules regulating the segregation and protection of collateral posted by customers of cleared and uncleared swaps. The CFTC is also working to provide new guidance regarding prime broker arrangements and intermediation generally with regard to trading on swap execution facilities.
The counterparty risks that we face have increased in complexity and magnitude as a result of disruption in the financial markets in recent years. For example, the consolidation and elimination of counterparties has increased our concentration of counterparty risk and decreased the universe of potential counterparties, and our funds are generally not restricted from dealing with any particular counterparty or from concentrating any or all of their transactions with one counterparty. In addition, counterparties have generally reacted to recent market volatility by tightening their underwriting standards and increasing their margin requirements for all categories of financing, which has the result of decreasing the overall amount of leverage available and increasing the costs of borrowing.
A portion of our revenue, net incomeearnings and cash flow is variable, which may make it difficult for us to achieve steady earnings growth on a quarterly basis and may cause the price of shares of our Class A common sharesstock to decline.
A portion of our revenue, net incomeearnings and cash flow is variable, primarily due to the fact that the performancecarried interest and incentive fees that we receive from certain of our funds can vary from quarter to quarter and year to year. In addition, the investment returns of most of our funds are volatile. We may also experience fluctuations in our results from quarter to quarter and year to year due to a number of other factors, including changes in the values of our funds’ investments, changes in the amount of distributions, dividends or interest paid in respect of investments, changes in our operating expenses, the degree to
64

Table of Contents
which we encounter competition and general economic and market conditions. Such variability may lead to volatility in the trading price of shares of our Class A common sharesstock and cause our results for a particular period not to be indicative of our performance in a future period. It may be difficult for us to achieve steady growth in net incomeearnings and cash flow on a quarterly basis, which could in turn lead to large adverse movements in the price of shares of our Class A common sharesstock or increased volatility in the price of shares of our Class A common sharesstock generally.

The timing and amount of performancecarried interest and incentive fees generated by our funds is uncertain and contributes to the volatility of our results. It takes a substantial period of time to identify attractive investment opportunities, to raise all the funds needed to makediligence and finance an investment and then to realize the cash value or other proceeds of an investment through a sale, public offering, recapitalization or other exit. Even if an investment proves to be profitable, it may be several years before any profits can be realized in cash or other proceeds. We cannot predict when, or if, any realization of investments will occur. If we were to have a realization event in a particular quarter or year, it may have a significant impact on our results for that particular quarter or year that may not be replicated in subsequent periods. We recognize revenue on investments in our funds based on our allocable share of realized and unrealized gains (or losses) reported by such funds, and a decline in realized or unrealized gains, or an increase in realized or unrealized losses, would adversely affect our revenue, which could increase the volatility of our results.
With respect to our funds that generate carried interest, the timing and receipt of such carried interest varies with the life cycle of our funds. During periods in which a relatively large portion of our assets under management is attributable to funds and investments in their “harvesting” period, our funds would make larger distributions than in the fund-raising or investment periods that precede harvesting. During periods in which a significant portion of our assets under management is attributable to funds that are not in their harvesting periods, we may receive substantially lower carried interest distributions. Moreover in some cases, we receive carried interest payments only upon realization of investments by the relevant fund, which contributes to the volatility of our cash flow and in other funds we are only entitled to carried interest payments after a return of all contributions and a preferred return to investors.
With respect to our funds that pay an incentive fee, the incentive fee is generally paid annually. In many cases, we earn this incentive fee only if the net asset value of a fund has increased or, in the case of certain funds, increased beyond a particular threshold. Some of our funds also have “high water marks”.marks.” If the high water mark for a particular fund is not surpassed, we would not earn an incentive fee with respect to that fund during a particular period even if the fund had positive returns in such period as a result of losses in prior periods. If the fund were to experience losses, we would not be able to earn an incentive fee from such fund until it surpassed the previous high water mark. The incentive fees we earn are, therefore, dependent on the net asset value of our fund investments, which could lead to significant volatility in our results. Finally, the timing and amount of incentive fees generated by our closed-end funds are uncertain and will contribute to the volatility of our net income.earnings. Incentive fees depend on our closed-end funds’ investment performance and opportunities for realizing gains, which may be limited.
Because a portion of our revenue, net incomeearnings and cash flow can be variable from quarter to quarter and year to year, we do not plan to provide any guidance regarding our expected quarterly and annual operating results. The lack of guidance may affect the expectations of public market analysts and could cause increased volatility in the price of our common shares.
Cybersecurity risks and cyber incidents could adversely affect our business by causing a disruption to our operations, a compromise or corruptionshares of our confidential information and/or damage to our business relationships, any of which could negatively impact our business, financial condition and operating results.
There has been an increase in the frequency and sophistication of the cyber and security threats we face, with attacks ranging from thoseClass A common to businesses generally to those that are more advanced and persistent, which may target us because, as an alternative asset management firm, we hold confidential and other price sensitive information about existing and potential investments. As a result, we may face a heightened risk of a security breach or disruption with respect to sensitive information resulting from an attack by computer hackers, foreign governments or cyber terrorists.
The efficient operation of our business is dependent on computer hardware and software systems, as well as data processing systems and the secure processing, storage and transmission of information, which are vulnerable to security breaches and cyber incidents. A cyber incident is considered to be any adverse event that threatens the confidentiality, integrity or availability of our information resources. These incidents may be an intentional attack or an unintentional event and could involve gaining unauthorized access to our information systems for purposes of misappropriating assets, stealing confidential information, corrupting data or causing operational disruption. In addition, we and our employees may be the target of fraudulent emails or other targeted attempts to gain unauthorized access to proprietary or sensitive information. The result of these incidents may include disrupted operations, misstated or unreliable financial data, liability for stolen assets or information, increased cybersecurity protection and insurance costs, litigation and damage to our business relationships, causing our business and results of operations to suffer. As our reliance on technology has increased, so have the risks posed to our information systems, both internal and those provided by third-party service providers. We have implemented processes, procedures and internal controls designed to mitigate cybersecurity risks and cyber intrusions and rely on industry accepted securities measures and technology to securely maintain confidential and proprietary information maintained on our information systems; however, these measures, as well as our increased awareness of the nature and extent of a risk of a cyber-incident, do not guarantee that a cyber-incident will not occur and/or that our financial results, operations or confidential information will not be negatively impacted by such an incident.

These risks are exacerbated by the rapidly increasing volume of highly sensitive data, including our proprietary business information and intellectual property, and personally identifiable information of our employees and our investors, that we collect and store in our data centers and on our networks. The secure processing, maintenance and transmission of this information are critical to our operations. A significant actual or potential theft, loss, corruption, exposure, fraudulent use or misuse of investor, employee or other personally identifiable or proprietary business data, whether by third parties or as a result of employee malfeasance or otherwise, non-compliance with our contractual or other legal obligations regarding such data or intellectual property or a violation of our privacy and security policies with respect to such data could result in significant remediation and other costs, fines, litigation or regulatory actions against us and significant reputational harm.
Our funds’ portfolio companies also rely on similar systems and face similar risks. A disruption or compromise of these systems could have a material adverse effect on the value of these businesses. Our funds may invest in strategic assets having a national or regional profile or in infrastructure assets, the nature of which could expose them to a greater risk of being subject to a terrorist attack or security breach than other assets or businesses.
Cybersecurity has become a priority for regulators in the U.S. and around the world. For example, the SEC has announced that one of the 2018 examination priorities for the Office of Compliance Inspections and Examinations is on cybersecurity procedures and controls. In addition, the new European General Data Protection Regulation (“GDPR”) will come into effect in May 2018. Data protection requirements under the GDPR will be more stringent than those imposed under existing European legislation. Additional restrictions on our ability to use and retain personal data could impede our business while the financial penalties for non-compliance could be up to the higher of 20 million Euros or 4% of group annual turnover.
We expect to be required to devote increasing levels of funding and resources to comply with evolving cybersecurity regulations and to continually monitor and enhance our cybersecurity procedures and controls.
We may be subject to litigation risks and may face liabilities and damage to our professional reputation as a result.
In recent years, the volume of claims and amount of damages claimed in litigation and regulatory proceedings against investment managers have been increasing. We make investment decisions on behalf of investors in our funds that could result in substantial losses. This may subject us to the risk of legal liabilities or actions alleging negligent misconduct, breach of fiduciary duty or breach of contract. Further, we may be subject to third-party litigation arising from allegations that we improperly exercised control or influence over portfolio investments. In addition, we and our affiliates that are the investment managers and general partners of our funds, our funds themselves and those of our employees who are our, our subsidiaries’ or the funds’ officers and directors are each exposed to the risks of litigation specific to the funds’ investment activities and portfolio companies and, in the case where our funds own controlling interests in public companies, to the risk of shareholder litigation by the public companies’ other shareholders. Moreover, we are exposed to risks of litigation or investigation by investors or regulators relating to our having engaged, or our funds having engaged, in transactions that presented conflicts of interest that were not properly addressed.
Legal liability could have a material adverse effect on our businesses, financial condition or results of operations or cause reputational harm to us, which could harm our businesses. We depend to a large extent on our business relationships and our reputation for integrity and high-caliber professional services to attract and retain investors and to pursue investment opportunities for our funds. As a result, allegations of improper conduct by private litigants or regulators, whether the ultimate outcome is favorable or unfavorable to us, as well as negative publicity and press speculation about us, our investment activities or the investment industry in general, whether or not valid, may harm our reputation, which may be damaging to our businesses.
In addition, the laws and regulations governing the limited liability of such issuers and portfolio companies vary from jurisdiction to jurisdiction, and in certain contexts the laws of certain jurisdictions may provide not only for carve-outs from limited liability protection for the issuer or portfolio company that has incurred the liabilities, but also for recourse to assets of other entities under common control with, or that are part of the same economic group as, such issuer. For example, if one of our portfolio companies is subject to bankruptcy or insolvency proceedings in a jurisdiction and is found to have liabilities under the local consumer protection, labor, tax or bankruptcy laws, the laws of that jurisdiction may permit authorities or creditors to file a lien on, or to otherwise have recourse to, assets held by other portfolio companies (including assets held by us) in that jurisdiction. There can be no assurance that we will not be adversely affected as a result of the foregoing risks.
Employee misconduct could harm us by impairing our ability to attract and retain investors and subjecting us to significant legal liability, regulatory scrutiny and reputational harm.
Our ability to attract and retain investors and to pursue investment opportunities for our funds depends heavily upon the reputation of our professionals, especially our senior professionals. We are subject to a number of obligations and standards arising from our investment management business and our authority over the assets managed by our investment management business.

Further, our employees are subject to various internal policies including a Code of Ethics and policies covering information systems, business continuity and information security. The violation of these obligations, standards and policies by any of our employees could adversely affect investors in our funds and us. Our businesses often require that we deal with confidential matters of great significance to companies in which our funds may invest. If our employees or former employees were to use or disclose confidential information improperly, we could suffer serious harm to our reputation, financial position and current and future business relationships. Employee misconduct could also include, among other things, binding us to transactions that exceed authorized limits or present unacceptable risks and other unauthorized activities or concealing unsuccessful investments (which, in either case, may result in unknown and unmanaged risks or losses), or otherwise charging (or seeking to charge) inappropriate expenses.
It is not always possible to detect or deter employee misconduct, and the extensive precautions we take to detect and prevent this activity may not be effective in all cases. If one or more of our employees or former employees were to engage in misconduct or were to be accused of such misconduct, our businesses and our reputation could be adversely affected and a loss of investor confidence could result, which would adversely impact our ability to raise future funds.stock.
Fraud and other deceptive practices or other misconduct at our funds’ portfolio companies, properties or projects could similarly subject us to liability and reputational damage and also harm our businesses.
In recent years, the U.S. Department of Justice and the SEC have devoted greater resources to enforcement of the FCPA. In addition, the United Kingdom significantly expanded the reach of its anti-bribery law with the creation of the U.K., the Bribery Act of 2010 (the “UK“U.K. Bribery Act”). The UK Bribery Act prohibits companies that conduct business in the United KingdomU.K. and their employees and representatives from giving, offering or promising bribes to any person, including non-UKnon-U.K. government officials, as well as requesting, agreeing to receive or accepting bribes from any person. Under the UKU.K. Bribery Act, companies may be held liable for failing to prevent their employees and associated persons from violating the UK Bribery Act. While we have developed and implemented policies and procedures designed to ensure strict compliance by us and our personnel with the FCPA and UKU.K. Bribery Act, such policies and procedures may not be effective in all instances to prevent violations. Any determination that we have violated the FCPA, the UKU.K. Bribery Act or other applicable anti-corruption laws could subject us to, among other things, civil and criminal penalties, material fines, profit disgorgement, injunctions on future conduct, securities litigation and a general loss of investor confidence, any one of which could adversely affect our business prospects, financial position or the market value of shares of our Class A common shares.stock.
In addition, we could be adversely affected as a result of actual or alleged misconduct by personnel of portfolio companies, properties or projects in which our funds invest. For example,invest, if there are failures by personnel at our portfolio companies, properties or projects to comply with anti-bribery, trade sanctions, Federal Energy Regulatory Commission or Environmental Protection Agency regulations or other legal and regulatory requirements that could expose us to litigation or regulatory action and otherwise adversely affect our businesses and reputation. Such misconduct could negatively affect the valuation of a fund’s investments and consequently affect our funds’ performance and negatively impact our businesses. In addition, we may face an increased risk of such misconduct to the extent
65

Table of Contents
our investment in foreign markets, particularly emerging markets, increase. Such markets may not have established laws and regulations that are as stringent as in more developed nations, or existing laws and regulations may not be consistently enforced. Due diligence on investment opportunities in these jurisdictions is frequently more complicated because consistent and uniform commercial practices in such locations may not have developed. Misconduct may be especially difficult to detect in such locations, and compliance with applicable laws may be difficult to maintain and monitor.
Our use of leverage to finance our businesses exposes us to substantial risks.
As of December 31, 2017,2023, we had $210.0$895.0 million ofin borrowings outstanding under our credit facility (the “Credit Facility”), and $406.2 million aggregate principal amount of senior notes and subordinated notes of $1,650.0 million and $450.0 million, respectively, are outstanding. We may choose to finance our businesses operations through further borrowings under the Credit Facility or by issuing additional debt. Our existing and future indebtedness exposes us to the typical risks associated with the use of leverage, including the same risks that are applicable to our funds that use leverage as discussed below under “-Risks“—Risks Related to Our Funds-DependenceFunds—Dependence on significant leverage in investments by our funds subjects us to volatility and contractions in the debt financing markets and could adversely affect our ability to achieve attractive rates of return on those investments.” The occurrence or continuation of any of these events or trends could cause us to suffer a decline in the credit ratings assigned to our debt by rating agencies, which would cause the interest rate applicable to borrowings under the Credit Facility to increase and could result in other material adverse effects on our businesses. We depend on financial institutions extending credit to us on terms that are reasonable to us. There is no guarantee that such institutions will continue to extend credit to us or renew any existing credit agreements we may have with them, or that we will be able to refinance outstanding facilities when they mature. [InIn addition, the incurrence of additional debt in the future could result in potential downgrades of our existing corporate credit ratings, which could limit the availability of future financing and/or increase our cost of borrowing.] Furthermore, ourthe Credit Facility and the indenture governing our senior notes contain certain covenants with which we need to comply. Non-compliance with any of the covenants without cure or waiver would constitute an event of default, and an event of default resulting from a breach of certain covenants could result, at the option of the lenders, in an acceleration of the principal and interest outstanding. In addition, if we incur additional debt, our credit rating could be adversely impacted.
Borrowings under the Credit Facility will mature in February 2022 and theMarch 2027, our tranches of senior notes mature in October 2024.2024, November 2028, June 2030 and February 2052, respectively, and our subordinated notes mature in June 2051. As these borrowings and other indebtedness mature (or are otherwise repaid prior to their scheduled maturities), we may be required to

either refinance them by entering into new facilities or issuing additional debt, which could result in higher borrowing costs, or issuing equity, which would dilute existing shareholders.stockholders. We could also repay these borrowings by using cash on hand, cash provided by our continuing operations or cash from the sale of our assets, which could reduce distributions to holders of our Class A or non-voting common shareholders.stock. We may be unable to enter into new facilities or issue debt or equity in the future on attractive terms, or at all. Borrowings under the Credit Facility are LIBOR-basedSOFR-based obligations. As a result, an increase in short-term interest rates will increase our interest costs if such borrowings have not been hedged into fixed rates.
The risks related to our use of leverage may be exacerbated by our funds’ use of leverage to finance investments. See “-Risks“—Risks Related to Our Funds-DependenceFunds—Dependence on significant leverage in investments by our funds subjects us to volatility and contractions in the debt financing markets and could adversely affect our ability to achieve attractive rates of returnsreturn on those investments.”
We are exposed to risks associated with changes in interest rates.

General interest rate fluctuations may have a substantial negative impact on our investments and investment opportunities and, accordingly, may have a material adverse effect on our investment objective and our net investment income. Because we borrow money and may issue debt securities or preferred stock to make investments, our net investment income is dependent upon the difference between the rate at which we borrow funds or pay interest or dividends on such debt securities or preferred stock and the rate at which we invest these funds. If market rates decrease we may earn less interest income from investments made during such lower rate environment. From time to time, we may also enter into certain hedging transactions to mitigate our exposure to changes in interest rates. In the past, we have entered into certain hedging transactions, such as interest rate swap agreements, to mitigate our exposure to adverse fluctuations in interest rates, and we may do so again in the future. In addition, we may increase our floating rate instruments to position the portfolio for rate increases. On a market value basis, approximately 87% of the debt assets within our Credit Group were floating rate instruments as of December 31, 2023, which we believe helps mitigate volatility associated with changes in interest rates. However, we cannot assure you that such transactions will be successful in mitigating our exposure to interest rate risk. There can be no assurance that a significant change in market interest rates will not have a material adverse effect on our net investment income.

Trading prices tend to fluctuate more for fixed rate securities that have longer maturities. Although we have no policy governing the maturities of our investments, under current market conditions we expect that we will invest in a portfolio of debt generally having maturities of up to 10 years. Trading prices for debt that pays a fixed rate of return tend to fall as interest rates
66

Table of Contents
rise. This means that we are subject to greater risk (other things being equal) than a fund invested solely in shorter-term securities. A decline in the prices of the debt we own could adversely affect the trading price of our common stock. Also, an increase in interest rates available to investors could make an investment in our common stock less attractive if we are not able to increase our dividend rate, which could reduce the value of our common stock.

Operational risks may disrupt our businesses, result in losses or limit our growth.
We face operational risk from errors made in the execution, confirmation or settlement of transactions. We also face operational risk from transactions and key data not being properly recorded, evaluated or accounted for in our funds. In particular, our Credit Group, and to a lesser extent our Private Equity Group, are highly dependent on our ability to process and evaluate, on a daily basis, transactions across markets and geographies in a time-sensitive, efficient and accurate manner. Consequently, we rely heavily on our financial, accounting and other data processing systems. New investment products we may introduce could create a significant risk that our existing systems may not be adequate to identify or control the relevant risks in the investment strategies employed by such new investment products.
In addition, we operate in a business that is highly dependent on information systems and technology. Our information systems and technology may not continue to be able to accommodate our growth, particularly our growth internationally, and the cost of maintaining the information systems technology may increase from its current level. Such a failure to accommodate growth, or an increase in costs related to the information systems technology, could have a material adverse effect on our business and results of operations.
Furthermore, our headquarters and a substantial portion of our personnel are located in Los Angeles. An earthquake or other disaster or a disruption in the infrastructure that supports our businesses, including a disruption involving electronic communications, our internal human resources systems or other services used by us or third parties with whom we conduct business, or directly affecting our headquarters, could have a material adverse effect on our ability to continue to operate our businesses without interruption. Although we have disaster recovery programs in place, these may not be sufficient to mitigate the harm that may result from such a disaster or disruption. In addition, insurance and other safeguards might only partially reimburse us for our losses, if at all.
Finally, weWe also rely on third-party service providers for certain aspects of our businesses, including for certain information systems, technology and administration of our funds and compliance matters. Operational risks could increase as third-party service providers increasingly offer mobile and cloud-based software services rather than software services that can be operated within our own data centers, as certain aspects of the security of such technologies may be complex, unpredictable or beyond our control, and any failure by mobile technology or cloud service providers to adequately safeguard their systems and prevent cyber-attacks could disrupt our operations and result in misappropriation, corruption or loss of confidential, proprietary or personal information. In addition, our counterparties’ information systems, technology or accounts may be the target of cyber-attacks. Any interruption or deterioration in the performance of these third parties or the service providers of our counterparties or failures or vulnerabilities of their respective information systems andor technology could impair the quality of our funds’ operations and could impact our reputation, adversely affect our businesses and limit our ability to grow.
Finally, there has been significant evolution and developments in the use of artificial intelligence technologies, including large language models, such as ChatGPT. We cannot fully determine the impact of such evolving technology to our business at this time.
Our investments in subsidiaries that have sponsored SPACs and invested in their business combination targets may expose us to increased liabilities, and we may suffer the loss of all or a portion of our investments if the SPAC does not complete a business combination by the applicable deadline or the target is unsuccessful.
In February 2021, we invested $23.0 million into a subsidiary that is the sponsor of AAC I, a blank check company. On December 5, 2022, AAC I entered into a business combination agreement among AAC I, X-Energy Reactor Company, LLC (“X-energy”), a Delaware limited liability company and additional parties thereto. On October 31, 2023, AAC I announced that it mutually agreed to terminate its previously announced business combination with X-energy, given challenging market conditions, peer-company trading performance and a balancing of the benefits and drawbacks of becoming a publicly-traded company under current circumstances. Because AAC I did not complete a business combination within the time period required by its amended and restated memorandum and articles of association, AAC I has redeemed all outstanding Class A ordinary shares and ceased all operations other than legal dissolution. In December 2023, we invested $50.0 million into X-energy to support X-energy’s continued growth as a private company. We may lose all or a portion of our investment if X-energy is unsuccessful as a private company.
In April 2023, we invested $14.3 million into a subsidiary that is the sponsor of AAC II, a blank check company. AAC II has until April 25, 2025 to complete a business combination. Prior to a business combination, the sponsor of AAC II (and its
67

Table of Contents
permitted transferees) holds 100% of the Class B ordinary shares outstanding of AAC II. The Class B ordinary shares equal 20% of the outstanding ordinary shares of AAC II. Upon the successful completion of an acquisition the pro forma ownership of the new company will vary depending on the business combination terms. There can be no assurances that this scenario and the resulting ownership will manifest, as changes may be made depending upon business combination terms. There is no assurance that AAC II will be successful in completing a business combination or that any business combination will be successful.
Adverse legal and regulatory developments relating to SPACs and their sponsors could adversely affect our business and reputation and result in significant losses and expenses.
We have sponsored AAC I, AAC II and may in the future continue to sponsor or otherwise utilize SPACs or other blank check companies in connection with the operation of our business. Regulatory and legal scrutiny of SPACs and other blank check companies increased significantly in recent years. For example, in 2021, the SEC’s staff issued statements relating to certain accounting classifications applicable to the financial statements prepared by SPACs, leading to many SPACs, including AAC I, having to restate their financial statements and, in January 2024, the SEC adopted final rules that, among other items, impose additional disclosure requirements in business combination transactions involving SPACs and private operating companies; amend the financial statement requirements applicable to business combination transactions involving such companies; update and expand guidance regarding the general use of projections in SEC filings, including requiring disclosure of all material bases of the projections and all material assumptions underlying the projections; increase the potential liability of certain participants in proposed business combination transactions; and could impact the extent to which SPACs could become subject to regulation under the Investment Company Act. The SEC has also recently brought enforcement actions against a SPAC and its sponsor for misleading claims in advance of a proposed business combination. In addition, litigation challenging completed and pending acquisitions by SPACs has increased, and in such litigation, it is possible that sponsors and/or their director designees may be held liable either for breaches of fiduciary duties owed to the SPAC’s public stockholders or for certain actions or omissions by the SPAC, including the failure by the SPAC to comply with applicable securities laws. Litigation has also arisen asserting that SPACs are violating federal securities laws by operating as unregistered investment companies. Any liabilities arising from these developments could adversely impact our business as well as harm our professional reputation. Moreover, we may lose all or a portion of our investment in any SPAC that we sponsor or become affiliated with if a business combination is not completed as contemplated or if the business combination is unsuccessful, which may also result in significant regulatory scrutiny, litigation costs and other expenses. AAC I did not complete a business combination within the time period required by its amended and restated memorandum and articles of association, and is going through the dissolution and liquidation process.
Risks Related to Our Funds
The historical returns attributable to our funds should not be considered as indicative of the future results of our funds or of our future results or of any returns expected on an investment in shares of our Class A common shares.stock.
The historical performance of our funds is relevant to us primarily insofar as it is indicative of performancecarried interest and incentive fees we have earned in the past and may earn in the future and our reputation and ability to raise new funds and therefore earn management fees on such new funds. The historical and potential returns of the funds we advise are not, however, directly linked to returns on shares of our Class A common shares.stock. Therefore, holders of our Class A common sharesstock should not conclude that positive performance of the funds we advise will necessarily result in positive returns on an investment in shares of our Class A common shares. However, poor performance of the funds we advise would likely cause a decline in our revenues and would therefore likely have a negative effect on our operating results and returns on our common shares.stock. An investment in shares of our sharesClass A common stock is not an investment in any of our funds. Also, there is no assurance that projections in respect of our funds or unrealized valuations will be realized.

Moreover, the historical returns of our funds should not be considered indicative of the future returns of these or from any future funds we may raise, in part because:
market conditions during previous periods may have been significantly more favorable for generating positive performance than the market conditions we may experience in the future;
our funds’ rates of returns, which are calculated on the basis of net asset value of the funds’ investments, reflect unrealized gains, which may never be realized;
our funds’ returns have previously benefited from investment opportunities and general market conditions that may not recur, including the availability of debt capital on attractive terms and the availability of distressed debt opportunities, and we may not be able to achieve the same returns or profitable investment opportunities or deploy capital as quickly;
68

Table of Contents
the historical returns that we present in this Annual Report on Form 10-K derive largely from the performance of our earlier funds, whereas future fund returns will depend increasingly on the performance of our newer funds or funds not yet formed, which may have little or no realized investment track record;
our funds’ historical investments were made over a long period of time and over the course of various market and macroeconomic cycles, and the circumstances under which our current or future funds may make future investments may differ significantly from those conditions prevailing in the past;
the attractive returns of certain of our funds have been driven by the rapid return of invested capital, which has not occurred with respect to all of our funds and we believe is less likely to occur in the future;
in recent years, there has been increased competition for private equity investment opportunities resulting from the increased amount of capital invested in alternative funds and high liquidity in debt markets, and the increased competition for investments may reduce our returns in the future; and
our newly established funds may generate lower returns during the period that they take to deploy their capital.
The future internal rate of return for any current or future fund may vary considerably from the historical internal rate of return generated by any particular fund, or for our funds as a whole. Future returns will also be affected by the risks described elsewhere in this Annual Report on Form 10-K, including risks of the industries and businesses in which a particular fund invests.
Valuation methodologies for certain assets can be subject to significant subjectivity, and the values of assets may never be realized.
Many of the investments inof our funds are illiquid and thus have no readily ascertainable market prices. We value these investments based on our estimate, or an independent third party’s estimate, of their fair value as of the date of determination, which often involves significant subjectivity. There is no single standard for determining fair value in good faith and in many cases fair value is best expressed as a range of fair values from which a single estimate may be derived. We estimate the fair value of our investments based on third-party models, or models developed by us, which include discounted cash flow analyses and other techniques and may be based, at least in part, on independently sourced market parameters. The material estimates and assumptions used in these models include the timing and expected amount of cash flows, the appropriateness of discount rates used, and, in some cases, the ability to execute, the timing of and the estimated proceeds from expected financings, some or all of which factors may be ascribed more or less weight in light of the particular circumstances. The actual results related to any particular investment often vary materially as a result of the inaccuracy of these estimates and assumptions. In addition, because many of the illiquid investments held by our funds are in industries or sectors which are unstable, in distress or undergoing some uncertainty, such investments are subject to rapid changes in value caused by sudden company-specific or industry-wide developments.
We include the fair value of illiquid assets in the calculations of net asset values, returns of our funds and our assets under management. Furthermore, we recognize performancecarried interest and incentive fees from affiliates based in part on these estimated fair values. Because these valuations are inherently uncertain, they may fluctuate greatly from period to period. Also, they may vary greatly from the prices that would be obtained if the assets were to be liquidated on the date of the valuation and often do vary greatly from the prices we eventually realize; as a result, there can be no assurance that such unrealized valuations will be fully or timely realized.

In addition, the values of our investments in publicly tradedpublicly-traded assets are subject to significant volatility, including due to a number of factors beyond our control. These include actual or anticipated fluctuations in the quarterly and annual results of these companies or other companies in their industries, market perceptions concerning the availability of additional securities for sale, general economic, social or political developments, changes in industry conditions or government regulations, changes in management or capital structure and significant acquisitions and dispositions. Because the market prices of these securities can be volatile, the valuations of these assets change from period to period, and the valuation for any particular period may not be realized at the time of disposition. In addition, market values may be based on indicative rather than actual trading prices, and may therefore lack precision. Further, because our funds often hold large positions in their portfolio companies, the disposition of these securities often is delayed for, or takes place over, long periods of time, which can further expose us to volatility risk. Even if we hold a quantity of public securities that may be difficult to sell in a single transaction, we do not discount the market price of the security for purposes of our valuations.
Although we frequently engage independent third parties to perform the foregoing valuations, the valuation process remains inherently subjective for the reasons described above.
69

Table of Contents
If we realize value on an investment that is significantly lower than the value at which it was reflected in a fund’s net asset values, we would suffer losses in the applicable fund. This could in turn lead to a decline in asset management fees and a loss equal to the portion of the performancecarried interest and incentive fees from affiliates reported in prior periods that was not realized upon disposition. These effects could become applicable to a large number of our investments if our estimates and assumptions used in estimating their fair values differ from future valuations due to market developments. See “Item 7. Management’s Discussion and Analysis of Financial Condition and Results of Operations-SegmentOperations—Segment Analysis” for information related to fund activity that is no longer consolidated. If asset values turn out to be materially different than values reflected in fund net asset values, fund investors could lose confidence which could, in turn, result in difficulties in raising additional investments.
The valuation process for the portfolio holdings of our registered funds and business development companies that we manage may create a conflict of interest.
Effective September 2022, Rule 2a-5 under the Investment Company Act establishes requirements for good faith determinations of fair value, and addresses both the board’s and the “valuation designee’s” roles and responsibilities relating to determinations of the fair value of securities without readily available market quotations. Each of the boards of the investment companies registered under the Investment Company Act (collectively, the “registered funds”) and the business development companies that we manage have designated their respective investment advisers to serve as valuation designee. These investment advisers are subsidiaries of the Company.
A substantial majority of our registered funds’ and business development companies’ portfolio holdings are comprised of investments that are not publicly-traded and do not otherwise have readily available market quotations. As a result, as required by the Investment Company Act and pursuant to Rule 2a-5 under the Investment Company Act, each of our registered funds’ and business development companies’ valuation designees will determine the fair value of these securities in good faith. The participation of employees of the Company’s subsidiaries in our business development companies’ valuation processes could result in a conflict of interest since certain of our funds pay base management fees that may fluctuate with changes in value.
Market values of debt instruments and publicly tradedpublicly-traded securities that our funds hold as investments may be volatile.
The market prices of debt instruments and publicly tradedpublicly-traded securities held by some of our funds may be volatile and are likely to fluctuate due to a number of factors beyond our control, including actual or anticipated changes in the profitability of the issuers of such securities, general economic, social or political developments, changes in industry conditions, changes in government regulation, shortfalls in operating results from levels forecast by securities analysts, inflation and rapid fluctuations in inflation rates and the general state of the securities markets as described above under “Risks“—Risks Related to Our Business-DifficultBusinesses—Difficult market and political conditions may adversely affect our businesses in many ways, including by reducing the value or hampering the performance of the investments made by our funds or reducing the ability of our funds to raise or deploy capital, each of which could materially reduce our revenue, net incomeearnings and cash flow and adversely affect our financial prospects and condition,” and other material events, such as significant management changes, financings, re-financings, securities issuances, acquisitions and dispositions. The value of publicly tradedpublicly-traded securities in which our funds invest may be particularly volatile as a result of these factors. In addition, debt instruments that are held by our funds to maturity or for long terms must be “marked-to-market” periodically, and their values are therefore vulnerable to interest rate fluctuations and the changes in the general state of the credit environment, notwithstanding their underlying performance. Changes in the values of these investments may adversely affect our investment performance and our results of operations.
Our funds may be unable to deploy capital at a steady and consistent pace, which could have an adverse effect on our results of operations and future fundraising.
The pace and consistency of our funds’ capital deployment has been, and may in the future continue to be, affected by a range of factors, including market conditions, regulatory developments and increased competition, which are beyond our control. In particular, the private equity and real estate markets have recently experienced a slowdown in deal activity. In addition, the private markets have continued to experience challenges with downward pressure on valuations and muted opportunities for realizations. To the extent these market dynamics continue, it may continue to impact the pace and consistency of our funds’ capital deployment. During the same period, our AUM not yet paying fees may increase due to ongoing fundraising. While this AUM not yet paying fees represents significant future fee-earning potential, our inability to deploy this capital on the timeframe we expect, or at all, and on terms that we believe are attractive, would reduce or delay the management fees, carried interest and incentive fees that we would otherwise expect to earn on this capital. Any such reduction or delay would impair our ability to offset investments in additional resources that we often make to manage new capital, including hiring additional professionals. Moreover, we could be delayed in raising successor funds. The impact of any such reduction or delay would be particularly adverse with respect to funds where management fees are paid on invested capital. Any of the foregoing could have a material adverse effect on our results of operations and growth.
70

Table of Contents
Our funds depend on investment cycles, and any change in such cycles could have an adverse effect on our investment prospects.
Cyclicality is important to our businesses. Weak economic environments have often provided attractive investment opportunities and strong relative investment performance. For example, the relative performance of our high yield bond strategy has typically been strongest in difficult times when default rates are highest, and our distressed debt and control investing funds have historically identified investment opportunities during downturns in the economy when credit is not as readily available. Conversely, we tend to realize value from our investments in times of economic expansion, when opportunities to sell investments may be greater. Thus, we depend on the cyclicality of the market to sustain our businesses and generate attractive risk-adjusted returns over extended periods. Any significant ongoing volatility or prolonged economic expansion or recession could have an adverse impact on certain of our funds and materially affect our ability to deliver attractive investment returns or generate incentive or other income.
Dependence on significant leverage in investments by our funds subjects us to volatility and contractions in the debt financing markets and could adversely affect our ability to achieve attractive rates of return on those investments.
Some of our funds and their investments rely on the use of leverage, and our ability to achieve attractive rates of return on investments will depend on our ability to access sufficient sources of indebtedness at attractive rates. If our funds or the companies in which our funds invest raise capital in the structured credit, leveraged loan, and high yield bond or investment grade bond markets, the results

of their operations may suffer if such markets experience dislocations, contractions or volatility. Any such events could adversely impact the availability of credit to businesses generally and could lead to an overall weakening of the U.S. and global economies.
Recently, the credit markets have experienced heightened volatility. Interest rates have increased, and the Federal Reserve has raised the federal funds rate on multiple occasions since 2015, with ongoing increases expected. Further, many other economies are experiencing weakness, with tighter credit conditions and a decreased availability of foreign capital. These developments have caused borrowing costs to rise and decreased the availability of leverage and the attractiveness of the terms on which we, our funds and our portfolio companies were able to obtain debt financing. Furthermore, some of the provisions under the Tax Cuts and Jobs Act could have a negative impact on the cost of financing and dampen the attractiveness of credit. Significant ongoing volatility or a protracted economic downturn could adversely affect the financial resources of our funds and their investments (in particular those investments that depend on credit from third parties or that otherwise participate in the credit markets) and their ability to make principal and interest payments on outstanding debt, or refinance outstanding debt when due. Moreover, these events could affect the terms of available debt financing with, for example, higher rates, higher equity requirements and/or more restrictive covenants, particularly in the area of acquisition financings for leveraged buyout and real estate assets transactions.
The absence of available sources of sufficient debt financing for extended periods of time or an increase in either the general levels of interest rates or in the risk spread demanded by sources of indebtedness would make it more expensive to finance those investments. Future increases in interest rates could also make it more difficult to locate and consummate investments because other potential buyers, including operating companies acting as strategic buyers, may be able to bid for an asset at a higher price due to a lower overall cost of capital or their ability to benefit from a higher amount of cost savings following the acquisition of the asset. In addition, a portion of the indebtedness used to finance investments often includes high yield debt securities issued in the capital markets. Availability of capital from the high yield debt markets is subject to significant volatility, and there may be times when weour funds are unable to access those markets at attractive rates, or at all, when completing an investment. Certain investments may also be financed through borrowings on fund-level debt facilities, which may or may not be available for a refinancing at the end of their respective terms. Finally, the interest payments on the indebtedness used to finance our funds’ investments are generally deductible expenses for income tax purposes under current law, subject to limitations under applicable tax law and policy. The Tax Cuts and Jobs Act imposes additional limitations on the deductibility of net business interest expenses, and any future change in tax law or policy could reduce the after-tax rates of return on the affected investments, which may have an adverse impact on our businesses and financial results. See “-Our funds make investments in companies that are based outside of the United States, which may expose us to additional risks not typically associated with investing in companies that are based in the United States.”
In the event that our funds are unable to obtain committed debt financing for potential acquisitions or can only obtain debt at an increased interest rate or on unfavorable terms, our funds may have difficulty completing otherwise profitable acquisitions or may generate profits that are lower than would otherwise be the case, either of which could reduce the performance and investment income earned by us. Similarly, our funds’ portfolio companies regularly utilize the corporate debt markets to obtain financing for their operations. If the credit markets continue to render such financing difficult to obtain or more expensive, this may negatively impact the operating performance of those portfolio companies and, therefore, the investment returns of our funds. In addition, if the markets make it difficult or impossible to refinance debt that is maturing in the near term, some of our funds’ portfolio companies may be unable to repay such debt at maturity and may be forced to sell assets, undergo a recapitalization or seek bankruptcy protection. Any of the foregoing circumstances could have a material adverse effect on our financial condition, results of operations and cash flow.
When our funds’ existing portfolio investments reach the point when debt incurred to finance those investments matures in significant amounts and must be either repaid or refinanced, those investments may materially suffer if they have not generated sufficient cash flow to repay maturing debt and there is insufficient capacity and availability in the financing markets to permit them to refinance maturing debt on satisfactory terms, or at all. A persistence of the limited availability of financing for such purposes for an extended period of time when significant amounts of the debt incurred to finance our funds’ existing portfolio investments becomes due could have a material adverse effect on these funds.
Our funds may choose to use leverage as part of their respective investment programs and certain funds, particularly in our Credit Group, regularly borrow a substantial amount of their capital. The use of leverage poses a significant degree of risk and enhances the possibility of a significant loss in the value of the investment portfolio. A fund may borrow money from time to time to purchase or carry securities or may enter into derivative transactions with counterparties that have embedded leverage. The interest expense and other costs incurred in connection with such borrowing may not be recovered by
71

Table of Contents
appreciation in the securities purchased or carried and will be lost, and the timing and magnitude of such losses may be accelerated or exacerbated, in the event of a decline in the market value of such securities. Gains realized with borrowed funds may cause the fund’s net asset value to increase at a faster rate than would be the case without borrowings. However, if investment results fail to cover the cost of borrowings, the fund’s net asset value could also decrease faster than if there had been no borrowings. In addition, as a business development companycompanies registered under the Investment Company Act, ARCC isand ASIF are currently permitted to incur indebtedness or issue senior

securities only in amounts such that its asset coverage ratio equals at least 200%150% after each such issuance or issuance. ARCC’sARCC and ASIF’s ability to pay dividends will be restricted if itstheir respective asset coverage ratio falls below at least 200%150% and any amounts that it usesthey use to service itstheir respective indebtedness are not available for dividends to its common stockholders. An increase in interest rates could also decrease the value of fixed-rate debt investments that our funds make. Any of the foregoing circumstances could have a material adverse effect on our financial condition, results of operations and cash flow.
Some of our funds may invest in companies that are highly leveraged, which may increase the risk of loss associated with those investments.
Some of our funds may invest in companies whose capital structures involve significant leverage. For example, in many non-distressed private equity investments, indebtedness may be as much as 75% or more of a portfolio company’s or real estate asset’s total debt and equity capitalization, including debt that may be incurred in connection with the investment, whether incurred at or above the investment-level entity. In distressed situations, indebtedness may exceed 100% or more of a portfolio company’s capitalization. Investments in highly leveraged entities are inherently more sensitive to declines in revenues, increases in expenses and interest rates and volatile or adverse economic, market and industry developments. Additionally, the debt positions acquired by our funds may be the most junior in what could be a complex capital structure, and thus subject us to the greatest risk of loss.
Investmentsloss in highly leveraged entities are also inherently more sensitive to declines in revenues, increases in expenses and interest rates and volatilethe event of insolvency, liquidation, dissolution, reorganization or adverse economic, market and industry developments.bankruptcy of one of these companies. Furthermore, the incurrence of a significant amount of indebtedness by an entity could, among other things:
subject the entity to a number of restrictive covenants, terms and conditions, any violation of which could be viewed by creditors as an event of default and could materially impact our ability to realize value from the investment;
allow even moderate reductions in operating cash flow to render the entity unable to service its indebtedness, leading to a bankruptcy or other reorganization of the entity and a loss of part or all of our fund’s equity investment in it; and
give rise to an obligation to make mandatory prepayments of debt using excess cash flow, which might limit the entity’s ability to respond to changing industry conditions if additional cash is needed for the response, to make unplanned but necessary capital expenditures or to take advantage of growth opportunities;
limit the entity’s ability to adjust to changing market conditions, thereby placing it at a competitive disadvantage compared to its competitors that have relatively less debt;
limit the entity’s ability to engage in strategic acquisitions that might be necessary to generate attractive returns or further growth; and
limit the entity’s ability to obtain additional financing or increase the cost of obtaining such financing, including for capital expenditures, working capital or other general corporate purposes.
As a result, the risk of loss associated with a leveraged entity is generally greater than for companies with comparatively less debt. For example, a number of investments consummated by private equity sponsors during 2005, 2006 and 2007 that utilized significant amounts of leverage subsequently experienced severe economic stress and, in certain cases, defaulted on their debt obligations due to a decrease in revenues and cash flow precipitated by the subsequent economic downturn during 2008 and 2009. Similarly, the leveraged nature of the investments of our real estate funds increases the risk that a decline in the fair value of the underlying real estate or tangible assets will result in their abandonment or foreclosure. In addition, for taxable years beginning after December 31, 2017, the Tax Cuts and Jobs Act imposes significant limitations on the deductibility of interest expense for U.S. federal income tax purposes, which could adversely affect highly leveraged companies.
Many of our funds invest in assets that are high risk, illiquid or subject to restrictions on transfer and we may fail to realize any profits from these activities ever or for a considerable period of time.time or lose some or all of the capital invested.
Many of our funds invest in securities that are not publicly traded.publicly-traded. In many cases, our funds may be prohibited by contract or by applicable securities laws from selling such securities for a period of time. Our funds generally cannot sell these securities publicly unless either their sale is registered under applicable securities laws or an exemption from such registration is available.available, and then only at such times when we do not possess material nonpublic information. Accordingly, our funds may be forced, under certain conditions, to sell securities at a loss. The ability of many of our funds, particularly our Private Equity Group funds, to dispose of these investments is heavily dependent on the capital markets and in particular the public equity markets. For example, the ability to realize any value from an investment may depend upon the ability of the portfolio company in which such investment is held to complete an initial public offering. Even if the securities are publicly traded,publicly-traded, large holdings of securities

can often be disposed of only over a substantial period of time. Moreover, because the investment strategy of many of our funds, particularly our Private Equity Group funds, often entails our having representation on our funds’ public portfolio company boards, our funds can effectaffect such sales only during limited trading windows, exposing thewindows. Each of these exposes investment returns to risks of downward movement in market prices during the intended disposition period. In addition, our Credit Group funds may hold investments in portfolio companies of such Private Equity Group funds on which we have board representation and be restricted for extended periods of time from selling their investments. As such,a result, we may fail to realize any profits from our investments in the funds that hold these securities for a considerable period of time or at all, and we may lose some or all of the principal amount of our investments. In addition, market conditions can also delay our funds’ ability to exit and realize value from their investments. For example, rising interest rates and challenging credit markets may make it difficult for potential buyers to raise sufficient capital to purchase our funds’ investments. Although the equity markets are not the only means by which we exit investments from our funds, the strength and liquidity of the U.S. and relevant global equity markets generally, and the initial public offering market specifically, affect the valuation of, and our ability to successfully exit, our
72

Table of Contents
equity positions in the portfolio companies of our funds in a timely manner. We may also realize investments through strategic sales. When financing is not available or becomes too costly, it may be more difficult to find a buyer that can successfully raise sufficient capital to purchase our investments. In addition, volatile debt and equity markets may also make the exit of our investments more difficult to execute.
Certain investments may trade on an “over-the-counter” market, which may be any location where the buyer and seller can settle a price. A significant portion of our funds’ investments are not expected to trade in any market. Due to the lack of centralized information and trading, the valuation of such instruments may carry more risk than publicly-traded common stock. Uncertainties in the conditions of the financial market, unreliable reference data, lack of transparency and inconsistency of valuation models and processes may lead to inaccurate asset pricing (or valuation). In addition, other market participants may value a fund’s investments differently than us.
As many of our funds have a finite term, we could also be forced to dispose of investments sooner than otherwise desirable. Accordingly, under certain conditions, our funds may be forced to either sell their investments at lower prices than they had expected to realize or defer sales that they had planned to make, potentially for a considerable period of time. We have made and expect to continue to make significant capital investments in our current and future funds and other strategies. Contributing capital to these funds and new strategies is risky, and we may lose some or all of the principal amount of our investments.
Government policies regarding certain regulations, such as antitrust law, or restrictions on foreign investment in certain of our funds’ portfolio companies or assets can also make it more difficult for us to deploy capital in certain jurisdictions and limit our funds’ exit opportunities.
The U.S. and many non-U.S. jurisdictions have laws designed to protect national security or to restrict foreign direct investment. For example, under the U.S. Foreign Investment Risk Review Modernization Act (“FIRRMA”), the Committee on Foreign Investment in the United States (“CFIUS”) has the authority to review, block or impose conditions on investments by non-U.S. persons in U.S. companies or real assets deemed critical or sensitive to the United States. Many non-U.S. jurisdictions restrict foreign investment in assets important to national security by taking steps including, but not limited to, placing limitations, restrictions or conditions on foreign equity investment, implementing investment screening or approval mechanisms and restricting the employment of foreigners as key personnel. These U.S. and foreign laws could limit our funds’ ability to invest in certain businesses or entities or impose burdensome notification requirements, operational restrictions or delays in pursuing and consummating transactions.
Certain of our investments may be subject to review and approval by CFIUS or any non-U.S. equivalents thereof, which may have outsized impacts on transaction certainty, timing, feasibility and cost, and may prevent us from maintaining or pursuing investment opportunities that we otherwise would have maintained or pursued. CFIUS or any non-U.S. equivalents thereof may seek to impose limitations, conditions or restrictions on or prohibit one or more of our investments, which may adversely affect the ability of our funds to execute on their investment strategy with respect to such transaction as well as limit our flexibility in structuring or financing certain transactions. In addition, CFIUS is actively pursuing transactions that were not notified to it and may ask questions regarding, or impose restrictions, conditions or limitations on, transactions post-closing. Our funds may also invest in companies that are, or may become, subject to CFIUS requirements based on pre-existing foreign ownership and control; in such cases, CFIUS requirements may adversely impact a portfolio company’s ability to obtain or retain business or otherwise make it more difficult for us to realize a profit from an investment.
The foregoing laws could limit our ability to find suitable investments and could also negatively impact our fundraising and syndication activities by causing us to exclude or limit certain investors in our funds or co-investors for our transactions. Moreover, these laws may make it difficult for us to identify suitable buyers for our investments that we want to exit and could constrain the universe of exit opportunities generally. Complying with these laws imposes potentially significant costs and complex additional burdens, and any failure by us or our portfolio companies to comply with them could expose us to significant penalties, sanctions, loss of future investment opportunities, additional regulatory scrutiny and reputational harm. See “—Risks Related to Regulation—Extensive regulation affects our activities, increases the cost of doing business and creates the potential for significant liabilities and penalties that could adversely affect our businesses and results of operations.”
In addition to undertaking active ongoing investigative agendas, the U.S. Department of Justice Antitrust Division and the FTC, the two agencies responsible for enforcing federal antitrust and competition laws, issued new Merger Guidelines in December 2023, designed to invigorate enforcement of the antitrust and competition laws. Antitrust and competition law enforcers and regulators in foreign jurisdictions have been similarly active. These initiatives are expected to increase scrutiny of mergers and acquisitions and to result in the adoption of more stringent guidelines for pre-approval of mergers, and potentially for review of previously consummated transactions as well. As a result, the process of obtaining pre-approval from U.S. antitrust agencies and other non-U.S. antitrust authorities for mergers and acquisitions undertaken by the investment funds we
73

Table of Contents
manage is expected to become more challenging, more time consuming and more expensive. We may even be required to undergo investigations concerning previously closed transactions. If certain proposed acquisitions or dispositions of portfolio companies by our managed investment funds are delayed or rejected by antitrust enforcers, or if previously closed transactions are investigated, it could have an adverse impact on our ability to generate future performance revenues and to fully invest the available capital in our funds, as well as reduce opportunities to exit and realize value from our fund investments.
In August 2023, the President issued an executive order establishing an outbound investment screening regime that is intended to regulate or prohibit certain investments by U.S. persons in advanced technology sectors in China and other jurisdictions that may be designated as a “country of concern.” While the U.S. Department of the Treasury proposed rules in August 2023 contemplating the imposition of notification requirements for, and the potential prohibition of, outbound investment involving semiconductors and microelectronics, quantum information technologies and artificial intelligence by U.S. persons into certain entities with a nexus to China, the exact scope and application of the outbound investment program has yet to be determined. Moreover, there is a high likelihood that the number of targeted sectors will expand over the life of our funds. When restrictions on U.S. outbound investment become effective, these could limit the universe of prospective investments available to us, making it more difficult to deploy capital or identify buyers for investments, and/or adversely affect the governance and operations of our investments and thus our overall performance.
State regulatory agencies may also impose restrictions on private funds’ investments in certain types of assets, which could affect our funds’ ability to find attractive and diversified investments and to complete such investments in a timely manner. For example, more than two dozen U.S. states have enacted or are considering legislation that would prohibit, restrict, or regulate foreign investment in real property in such states. We cannot exclude that some or all of these states may prohibit, restrict or regulate (including requiring disclosure of) our funds’ transactions, including based on the composition of our investor base. Collectively, these laws also elevate the likelihood that we will be required or requested to disclose to U.S. federal and/or state regulators information about us, our funds, our investors, our structure, and our beneficial ownership and control and may impact the ability of non-U.S. limited partners to participate in certain of our investment strategies.
Many of the power, infrastructure and energy companies in which certain of our funds invest are subject to regulation by the Federal Energy Regulatory Commission (“FERC”), which oversees acquisition and disposition of electric generation, transmission and other electric facilities in most of the U.S., along with transmission of electricity in interstate commerce in the U.S., and wholesale purchases and sales of electric energy in interstate commerce in the U.S., among other things. In some U.S. states, public utility commissions can also (or alternatively) regulate investments in, or transfers of, certain electric sector holdings and infrastructure. Under existing regulations, FERC and public utility commissions may, in some circumstances, slow, or impose restrictions on, investments in or transfers of regulated assets. Changes to regulations, or changes to interpretations thereof, by FERC or public utility commissions may similarly make regulated investments, acquisitions or dispositions more challenging or time-consuming, and may subject previously-exempt classes of transactions to new authorization requirements. While our investments are exposed to FERC and public utility commission regulation in a manner that is consistent with other participants in the power, infrastructure and energy sector, such regulations could nonetheless result in delays in making investments, delays in exiting investments or limitations or conditions that may adversely affect the ability of our funds to execute on their investment strategy with respect to such transactions as well as limit our flexibility in structuring or financing certain transactions.

Certain of our funds make preferred and common equity investments that rank junior to preferred equity and debt in a company’s capital structure.
In most cases, the companies in which our investment funds invest have, or are permitted to have, outstanding indebtedness or equity securities that rank senior to our fund’s investment. By their terms, such instruments may provide that their holders are entitled to receive payments of dividends, interest or principal on or before the dates on which payments are to be made in respect of our investment. In addition, in the event of insolvency, liquidation, dissolution, reorganization or bankruptcy of a company in which an investment is made, holders of securities ranking senior to our investment would typically be entitled to receive payment in full before distributions could be made in respect of our investment. After repaying senior security holders, the company may not have any remaining assets to use for repaying amounts owed in respect of our investment. To the extent that any assets remain, holders of claims that rank equally with our investment would be entitled to share on an equal and ratable basis in distributions that are made out of those assets. Moreover, during periods of financial distress or following an insolvency, the ability of our funds to influence a company’s affairs and to take actions to protect their
investments may be substantially less than that of the senior creditors.

Certain of our funds utilize special situation and distressed debt investment strategies that involve significant risks.
74

Table of Contents
Certain of the funds in our Credit and Private Equity Groups invest in obligors and issuers with weak financial conditions, poor operating results, substantial financing needs, negative net worth and/or special competitive problems. These funds also invest in obligors and issuers that are involved in bankruptcy or reorganization proceedings. In such situations, it may be difficult to obtain full information as to the exact financial and operating conditions of these obligors and issuers. Additionally, the fair values of such investments are subject to abrupt and erratic market movements and significant price volatility if they are publicly tradedpublicly-traded securities, and are subject to significant uncertainty in general if they are not publicly tradedpublicly-traded securities. Furthermore, some of our funds’ distressed investments may not be widely traded or may have no recognized market. A fund’s exposure to such investments may be substantial in relation to the market for those investments, and the assets are likely to be illiquid and difficult to sell or transfer. As a result, it may take a number of years for the market value of such investments to ultimately reflect their intrinsic value as perceived by us.
A central feature of our distressed investment strategy is our ability to effectively anticipate the occurrence of certain corporate events, such as debt and/or equity offerings, restructurings, reorganizations, mergers, takeover offers and other transactions, that we believe will improve the condition of the business. Similarly, we perform significant analysis of the company’s capital structure, operations, industry and ability to generate income, as well as market valuation of the company and its debt, and develop a strategy with respect to a particular distressed investment based on such analysis. In furtherance of that strategy our funds seek to identify the best position in the capital structure in which to invest. If the relevant corporate event that we anticipate is delayed, changed or never completed, or if our analysis or investment strategy is inaccurate, the market price and value of the applicable fund’s investment could decline sharply.
In addition, these investments could subject a fund to certain potential additional liabilities that may exceed the value of its original investment. Under certain circumstances, payments or distributions on certain investments may be reclaimed if any such payment or distribution is later determined to have been a fraudulent conveyance, a preferential payment or similar transaction under applicable bankruptcy and insolvency laws. In addition, under certain circumstances, a lender that has inappropriately exercised control of the management and policies of a debtor may have its claims subordinated or disallowed, or may be found liable for damages suffered by parties as a result of such actions. In the case where the investment in securities of troubled companies is made in connection with an attempt to influence a restructuring proposal or plan of reorganization in bankruptcy, our funds may become involved in substantial litigation.
Our funds may be unable to deploy capital at a steady and consistent pace, which could have an adverse effect on our results of operations and future fundraising.
The pace and consistency of our funds’ capital deployment has been, and may in the future continue to be, affected by a range of factors, primarily market conditions and regulatory developments, that are beyond our control. For example, in 2016 our corporate Private Equity Group funds deployed less capital than in prior years as they exercised patience amid elevated purchase price multiples. Similarly, our special situations funds may not deploy as much capital as they target due to changing market conditions and the distressed investment opportunities available. During the same period, our AUM not yet earning fees, which we refer to as our “shadow” AUM, increased due to ongoing fundraising. While this “shadow” AUM represents significant future fee-earning potential, our inability to deploy this capital on the timeframe we expect, or at all, and on terms that we believe are attractive, would reduce or delay the management and performance fees that we would otherwise expect to earn on this capital. Any such reduction or delay would impair our ability to offset investments in additional resources that we often make to manage new capital, including hiring additional professionals. Moreover, we could be delayed in raising successor funds. The impact of any such reduction or delay would be particularly adverse with respect to funds where management fees are paid on invested capital. Any of the foregoing could have a material adverse effect on our results of operations and growth.

Certain of the funds or accounts we advise or manage are subject to the fiduciary responsibility and prohibited transaction provisions of ERISA and Section 4975 of the Code, and our businesses could be adversely affected if certain of our other funds or accounts fail to satisfy an exception under the U.S. Department of Labor’s “plan assets” regulation under ERISA.regulation.
Certain of the funds and accounts we advise or manage are subject to the fiduciary responsibility and prohibited transaction provisions of ERISA and Section 4975 of the Code. For example, we currently manage some of our funds or accounts as “plan assets” under ERISA. With respect to these funds or accounts, this results in the application of the fiduciary responsibility standards of ERISA to investments made by such funds or accounts, including the requirement of investment prudence and diversification, and the possibility that certain transactions that we enter into, or may have entered into, on behalf of these funds or accounts, in the normal course of business, might constitute or result in, or have constituted or resulted in, non-exempt prohibited transactions under Section 406 of ERISA or Section 4975 of the Code. A non-exempt prohibited transaction, in addition to imposing potential liability upon fiduciaries of an ERISA plan, may also result in the imposition of an excise tax under the Code upon a “party in interest” (as defined in ERISA) or “disqualified person” (as defined in the Code) with whom we engaged in the transaction. Some of our other funds or accounts currentlyare intended to qualify as venture“venture capital operating companies (“VCOCs”)companies” or rely on another exception under the “plan assets” regulation under ERISA and therefore are not be subject to the fiduciary requirementsor prohibited transaction provisions of ERISA or Section 4975 of the Code with respect to their assets. However, if these funds or accounts fail to satisfy an exception to holding “plan assets” under relevant regulations by the VCOC requirementsU.S. Department of Labor for any reason, including as a result of an amendment of the relevant regulations by the U.S. Department of Labor, or another exception under the “plan assets” regulation under ERISA, such failure could materially interfere with our activities in relation to these funds or accounts or expose us to risks related to our failure to comply with the applicable requirements.
Contingent liabilities could harm fund performance.
We may cause our funds to acquire an investment that is subject to contingent liabilities. Such contingent liabilities could be unknown to us at the time of acquisition or, if they are known to us, we may not accurately assess or protect against the risks that they present. Acquired contingent liabilities could therefore result in unforeseen losses for our funds. In addition, in connection with the disposition of an investment in a portfolio company, a fund may be required to make representations about the business and financial affairs of such portfolio company typical of those made in connection with the sale of a business. A fund may also be required to indemnify the purchasers of such investment to the extent that any such representations are inaccurate. These arrangements may result in the incurrence of contingent liabilities by a fund, even after the
75

Table of Contents
disposition of an investment. Accordingly, the inaccuracy of representations and warranties made by a fund could harm such fund’s performance.

Our funds may be held liable for the underfunded pension liabilities of their portfolio companies.
Under ERISA, membersA court decision found that, in certain circumstances, an investment fund could be treated as a “trade or business” for purposes of certain “controlled groups” of “tradesdetermining pension liability under ERISA. Therefore, where an investment fund owns 80% or businesses” may be jointly and severally liable for contributions required under any member’s tax-qualified defined benefit pension plan andmore (or possibly, under certain other benefit plans. Similarly, if any member’s tax-qualified defined benefit pension plan were to terminate, underfunding at termination would be the joint and several responsibility of all controlled group members, including members whose employees did not participate in the terminated plan. Similarly, joint and several liability may be imposed for certain pension plan related obligations in connection with the complete or partial withdrawal by an employer from a multiemployer pension plan. Depending on a number of factors, including the level of ownership held by our funds in a particular portfolio company, a fund may be considered to be a membercircumstances, less than 80%) of a portfolio company’s “controlled group” for this purpose, and thus maycompany, such investment fund (and any other 80%-owned portfolio companies of such fund) might be found liable for the underfundedcertain pension liabilities of such portfolio company.
In Sun Capital Partners III L.P. v. New England Teamster and Trucking Industry Pension Fund, the First Circuit Court of Appeal held that a fund was engaged in a “trade or business” with a portfolio company to the extent the portfolio company is unable to satisfy such liabilities. Our funds may, from time to time, invest in a portfolio company that has unfunded pension fund liabilities, including structuring the investment in a manner where a fund may own an 80% or greater interest in such a portfolio company. If a fund (or other 80%-owned portfolio companies of such fund) were deemed to be liable for purposessuch pension liabilities, this could have a material adverse effect on the operations of such fund and the companies in which such fund invests. This discussion is based on current court decisions, statute and regulations regarding control group liability under ERISA, as in effect as of the ERISA rulesdate hereof, which may change in the future as the case law and was thus liable for underfunded pension liabilities. If this decision is applied generally to private equity investing, our funds could be exposed to liability for certain benefit plan contributions, a liability that could be significant if the portfolio company’s pension plan is significantly underfunded.guidance develops.
Our funds’ performance, and our performance, may be adversely affected by the financial performance of our funds’ portfolio companies and the industries in which our funds invest.

Our performance and the performance of our funds are significantly impacted by the value of the companies in which our funds have invested. Our funds invest in companies in many different industries, each of which is subject to volatility based upon economic and market factors. The credit crisis between mid-2007 and the end of 2009 caused significant fluctuations in the value of securities held by our funds and the recent global economic recessiondownturn induced by the COVID-19 pandemic had a significant impact in overall performance activity and the demands for many of the goods and services provided by portfolio companies of the funds we advise. Although we believe the U.S. economy has registered eight consecutive years of growth in real GDP,largely recovered from the economic crisis induced by the COVID-19 pandemic, there remain many obstacles to continued growth in the economy such as global geopolitical events, risks ofpersistent inflation or deflation, rising interest rates and high debt levels, both public and private. These factors and other general economic trends are likely to affect the performance of portfolio companies in many industries and, in particular, industries that anticipated that the GDP in developed economies would quickly return to pre-crisis trend.a range of industries. The performance of our funds, and our performance, may be adversely affected if our fund portfolio companies in these industries experience adverse performance or additional pressure due to downward trends.
The performance of our investments with underlying exposure to the commodities markets is also subject to a high degree of business and market risk, as it is dependent upon prevailing prices of commodities such as oil, natural gas and coal. Prices for oil and natural gas, for example,coal, which are subject to wide fluctuation in response to relatively minor changes in the supply and demand for oil and natural gas, market uncertainty and a variety of additional factors that are beyond our control, such as level of consumer product demand,geopolitical developments like hostilities in the refining capacity of oil purchasers, weather conditions, government regulations, the priceMiddle East region and availability of alternative fuels, political conditions, foreign supply of such commoditiesbetween Russia and overall economic conditions.Ukraine. It is common in making

investments with underlying exposure to the commodities markets to deploy hedging strategies to protect against pricing fluctuations but such strategies may or may not protect our investments. Declining global commodity prices have impacted the value of securities held by our funds. Continued volatility could result in lower returns than we anticipated at the time certain of our investments were made. As of December 31, 2023, 1% of our total AUM was invested in debt and equity investments in the energy sector (of which less than 1% of our total AUM was invested in midstream investments and also includes oil and gas exploration) and less than 1% of our total AUM was invested in renewable energy investments that were challenged from the market disruption and volatility experienced in the recent past.
In respect of real estate, even though the U.S. residential real estate market has recently shown signs of stabilizing from a lengthy and deep downturn, various factors could halt or limit a recovery in the housing market and have an adverse effect on investment performance, including, but not limited to, rising mortgage interest rates, a low level of confidence in the economic recovery or the residential real estate marketmarket.
Our failure to comply with investment guidelines set by our clients and/or investors could result in damage awards against us or a reduction in AUM, either of which would cause our earnings to decline and recent U.S. tax law changesadversely affect our business.
When clients retain us to manage assets on their behalf, they specify certain guidelines regarding investment allocation and strategy that we are required to observe in the management of their portfolios. Similarly, investors in our funds often require certain investment restrictions or limitations be included in their side letters that we are contractually obligated to observe in the management of such investors’ interests in the applicable fund. Similarly, investors in our funds often require certain investment restrictions or limitations be included in their side letters that we are contractually obligated to observe in the management of such investors’ interests in the applicable fund. Our failure to comply with these guidelines, restrictions and other limitations could result in clients terminating their investment management agreement with us or investors seeking to withdraw from our funds. Clients or investors could also sue us for breach of contract and seek to recover damages from us. In addition, such guidelines may restrict our ability to pursue certain investments and strategies on behalf of our clients or limit an investor’s exposure to such investments and strategies that we believe are economically desirable, which limitcould similarly result in losses to a client account or investor capital account or termination or potential withdrawal of the amountaccount or investor and a
76

Table of itemized deductions for mortgage interest as well as stateContents
corresponding reduction in AUM. Even if we comply with all applicable investment guidelines, restrictions and local income tax.limitations, a client or investor may be dissatisfied with its investment performance or our services or fees, and may terminate their customized separate accounts or advisory accounts, seek to withdraw from our funds or be unwilling to commit new capital to our specialized funds, customized separate accounts or advisory accounts. Any of these events could cause our earnings to decline and materially and adversely affect our business, financial condition and results of operations.

Third-party investors in certain of our funds with commitment-based structures may not satisfy their contractual obligation to fund capital calls when requested by us, which could adversely affect a fund’s operations and performance.
Investors in certain of our funds make capital commitments to those funds that we are entitled to call from those investors at any time during prescribed periods. We depend on investors fulfilling and honoring their commitments when we call capital from them for those funds to consummate investments and otherwise pay their obligations when due. Any investor that did not fund a capital call would be subject to several possible penalties, including possibly having a meaningful amount of its existing investment forfeited in that fund. However, the impact of the penalty is directly correlated to the amount of capital previously invested by the investor in the fund and if an investor has invested little or no capital, for instance early in the life of the fund, then the forfeiture penalty may not be as meaningful. Investors may also negotiate for lesser or reduced penalties at the outset of the fund, thereby limiting our ability to enforce the funding of a capital call. Third-party investors in private equity and real estate funds typically use distributions from prior investments to meet future capital calls. In cases where valuations of existing investments fall and the pace of distributions slows, investors may be unable to make new commitments to third-party managed investment funds such as those advised by us.us using distributions they received from prior fund investments. A failure of investors to honor a significant amount of capital calls for any particular fund or funds could have a material adverse effect on the operation and performance of those funds.
Certain of our funds may utilize subscription lines of credit to fund investments prior to the receipt of capital contributions from the fund’s investors. As capital calls made to a fund’s investors are delayed when using a subscription line of credit, the investment period of such investor capital is shortened, which may increase the net internal rate of return of an investment fund. However, since interest expense and other costs of borrowings under subscription lines of credit are an expense of the investment fund, the investment fund’s net multiple of invested capital will be reduced, as will the amount of carried interest generated by the fund. Any material reduction in the amount of carried interest generated by a fund will adversely affect our revenues.
Our funds make investments in companies that are based outside of the United States,U.S., which may expose us to additional risks not typically associated with investing in companies that are based in the United States.U.S.
Some of our funds invest a portion of their assets in the equity, debt, loans or other securities of issuers located outside the United States,U.S., including Europe and Asia,APAC, while certain of our funds invest substantially all of their assets in these types of securities, and we expect that international investments will increase as a proportion of certain of our funds’ portfolios in the future. Investments in non-U.S.foreign securities involve certain factors not typically associated with investing in U.S. securities, including risks relating to:
our funds’ abilities to exchange local currencies for U.S. dollars and other currency exchange matters, including fluctuations in currency exchange rates and costs associated with conversion of investment principal and income from one currency into another;
controls on, and changes in controls on, foreign investment and limitations on repatriation of invested capital;
less developed or less efficient financial markets than exist in the United States,U.S., which may lead to price volatility and relative illiquidity;
the absence of uniform accounting, auditing and financial reporting standards, practices and disclosure requirements and less government supervision and regulation;
changes in laws or clarifications to existing laws (and changes in administrative practices) that could impact our tax treaty positions, which could adversely impact the returns on our investments;
differences in legal and regulatory environments, particularly with respect to bankruptcy and reorganization, labor and employment laws, less developed corporate laws regarding fiduciary duties and the protection of investors and less reliable judicial systems to enforce contracts and applicable law;
political hostility to investments by foreign or private equity investors;
less publicly available information in respect of companies in non-U.S.foreign markets;

77

Table of Contents
reliance on a more limited number of commodity inputs, service providers and/or distribution mechanisms;
higher rates of inflation;
higher transaction costs;
difficulty in enforcing contractual obligations;
fewer investor protections;
limitations on the deductibility of interest and other financing costs and expenses for income tax purposes in certain jurisdictions;
certain economic and political risks, including potential exchange control regulations and restrictions on our non-U.S.foreign investments and repatriation of capital, potential political, economic or social instability, the possibility of nationalization or expropriation or confiscatory taxation and adverse economic and political developments; and
the imposition of non-U.S.foreign taxes or withholding taxes on income and gains recognized with respect to such securities.
While our funds will take these factors into consideration in making investment decisions, including when hedging positions, there can be no assurance that adverse developments with respect to these risks will not adversely affect our funds that invest in securities of non-U.S.foreign issuers. In addition, certain of these funds are managed outside the United States,U.S., which may increase the foregoing risks. The Tax Cuts and Jobs Act imposes a one-time tax on a U.S. shareholder’s pro rata share of net accumulated untaxed earnings and profits of certain foreign subsidiaries (measured as of November 2, 2017 or December 31, 2017, whichever is greater). In addition, the Tax Cuts and Jobs Act also taxes (at reduced rates) U.S. shareholders on their pro rata share of “global intangible low-taxed income” earned in taxable years beginning after December 31, 2017 by certain of their foreign subsidiaries (generally the excess of an implied 10% rate of return on the subsidiaries’ adjusted bases in tangible business assets), regardless of whether the underlying earnings are repatriated.
Many of our funds make investments in companies that we do not control.
Investments by many of our funds will include debt instruments and equity securities of companies that we do not control. Such instruments and securities may be acquired by our funds through trading activities or through purchases of securities from the issuer. In addition, our funds may seek to acquire minority equity interests more frequently and may also dispose of a portion of their majority equity investments in portfolio companies over time in a manner that results in the funds retaining a minority investment. Furthermore, while certain of our funds may make “toe-hold” distressed debt investments in a company with the intention of obtaining control, there is no assurance that a control position may be obtained and such fund may retain a minority investment. Those investments will be subject to the risk that the company in which the investment is made may make business, financial or management decisions with which we do not agree or that the majority stakeholders or the management of the company may take risks or otherwise act in a manner that does not serve our interests. If any of the foregoing were to occur, the values of the investments held by our funds could decrease and our financial condition, results of operations and cash flow could suffer as a result.
Increased regulatory scrutiny and uncertainty with regard to expense allocation may increase risk of harm.
While we historically have and will continue to allocate the expenses of our funds in good faith and in accordance with the terms of the relevant fund agreements and our expense allocation policy in effect from time to time, due to increased regulatory scrutiny of expense allocation policies in the private investment funds realm, there is no guarantee that our policies and practices will not be challenged by our supervising regulatory bodies. If we or our supervising regulators were to determine that we have improperly allocated such expenses, we could be required to refund amounts to the funds and could be subject to regulatory censure, litigation from our fund investors and/or reputational harm, each of which could have a material adverse effect on our financial condition.
We may need to pay "“clawback”“clawback” or “contingent repayment”obligations if and when they are triggered under the governing agreements with our funds.
Generally, if at the termination of a fund (and increasinglyand in certain cases at interim points in the life of a fund),fund, the fund has not achieved investment returns that (in most cases) exceed the preferred return threshold or (in all cases) the general partner receives net profits over the life of the fund in excess of its allocable share under the applicable partnership agreement, we will be obligated to repay an amount equal to the excess of amounts previously distributed to us over the amounts to which we are ultimately entitled. This obligation is known as a “clawback"“clawback” or contingent repayment obligation. Due in part to our investment performance and the fact that our carried interest is generally determined on a liquidation basis, as of December 31, 2017, 2016 and 2015,2023, if the funds were liquidated at their fair values at that date, there would have been no contingent repayment obligation or liability. There can be no assurance that we will not incur a contingent repayment obligation in the future. AtAs of December 31, 2017, 2016 and 2015,2023, had we assumed all existing investments were worthless, the amount of carried interest, net of tax distributions, subject to contingent repayment would

have been approximately $476.1$78.5 million $418.3 million and $322.2 million, respectively, of which approximately $370.0$54.5 million $323.9 million and $247.9 million, respectively, is reimbursable to the Company by certain professionals. In addition, the SEC has recently adopted rules that will require a written notice to private fund investors in order to reduce the amount of any adviser clawback by actual,
78

Table of Contents
potential, or hypothetical taxes within 45 days after the end of any fiscal quarter in which a clawback occurs. See “—Risks Related to Regulation—Extensive regulation affects our activities, increases the cost of doing business and creates the potential for significant liabilities and penalties that could adversely affect our businesses and results of operations.” To the extent that we fail to provide such written notice, we would be limited in our ability to reduce the clawback amount in connection with those taxes, potentially leading to a larger contingent repayment obligation. Although a contingent repayment obligation is several to each person who received a distribution, and not a joint obligation, if a recipient does not fund his or her respective share of a contingent repayment obligation, we may have to fund such additional amounts beyond the amount of carried interest we retained, although we generally will retain the right to pursue remedies against those carried interest recipients who fail to fund their obligations. We may need to use or reserve cash to repay such contingent repayment obligations instead of using the cash for other purposes. See “Item 7. Management’s Discussion and Analysis of Financial Condition and Results of Operations-ContingentOperations—Contractual Obligations, Commitments and Contingencies and Other Arrangements,Note 2 “Summary“Note 2. Summary of Significant Accounting Policies”Policies,” and Note 13 “Commitments“Note 8. Commitments and Contingencies” to thewithin our consolidated financial statements appearing elsewhere in this Annual Report on Form 10-K.
We derive a substantial portion of our revenues from funds managed pursuant to management agreements that may be terminated or fund partnership agreements that permit fund investors to request liquidation of investments in our funds on short notice.
The terms of our funds generally give either the manager of the fund or the fund itself the right to terminate our investment management agreement with the fund. However, insofar as we control the general partners of our funds that are limited partnerships, the risk of termination of investment management agreement for such funds is limited, subject to our fiduciary or contractual duties as general partner. This risk is more significant for certain of our funds that have independent boards of directors.
With respect to our funds that are not exempt from registration under the Investment Company Act, each fund’s investment management agreement must be approved annually by (a)(i) such fund’s board of directors or by the vote of a majority of such fund’s stockholders, and (b)(ii) the majority of the independent members of such fund’s board of directors and, in certain cases, by its stockholders, as required by law. The funds’ investment management agreements can also be terminated by the majority of such fund’s stockholders. Termination of these agreements would reduce the fees we earn from the relevant funds, which could have a material adverse effect on our results of operations. Currently, ARDC, aARCC and ASIF, registered investment company under the Investment Company Act, and ARCC, a registered investment companycompanies that hashave elected to be treated as a business development companycompanies under the Investment Company Act, are subject to these provisions of the Investment Company Act.
Investors in certain of our funds, including our open-ended funds, may redeem their investments in these funds. Third-party investors in many of our funds have the right to remove the general partner of the fund and to terminate the investment period under certain circumstances. In addition, the investment management agreements related to our separately managed accounts may permit the investor to terminate our management of such accounts on short notice. These events would lead to a decrease in our revenues, which could be substantial.
Investors in certain of our funds, including our open-ended funds and non-traded REITs may generally redeem their investments on a periodic basis subject to the expiration of a specified period of time during which capital may not be withdrawn. Such redemptions would result in a reduction of our AUM and decrease in our management fees. The governing agreements of many of our funds provide that, subject to certain conditions, third-party investors in those funds have the right to remove the general partner of the fund or terminate the fund, including in certain cases without cause by a simple majority vote. Any such removal or dissolution could result in a cessation in management fees we would earn from such funds and/or a significant reduction in the expected amounts of performancecarried interest and incentive fees from those funds. Performance feesCarried interest could be significantly reduced as a result of our inability to maximize the value of investments by a fund during the liquidation process or in the event of the triggering of a “contingent repayment"repayment” obligation. Finally, the applicable funds would cease to exist after completion of liquidation and winding-up.
In addition, the governing agreements of many of our funds provide that, subject to certain conditions, third-party investors in those funds have the right to terminate the investment period of the fund, including in certain cases without cause. Such an event could have a significant negative impact on our revenue, net incomeearnings and cash flow of such fund. The governing agreements of our funds may also provide that upon the occurrence of events, including in the event that certain “key persons” in our funds do not meet specified time commitments with regard to managing the fund (including due to death, disability or departure), investors in those funds have the right to vote to suspend or terminate the investment period, including in certain cases by a simple majority vote in accordance with specified procedures. In addition to having a significant negative impact on our revenue, net incomeearnings and cash flow, the occurrence of such an event with respect to any of our funds would likely result in significant reputational damage to us and could negatively impact our future fundraising efforts.
79

Table of Contents
We currently manage a portion of investor assets through separately managed accounts, whereby we earn management fees and performancecarried interest or incentive fees, and we intend to continue to seek additional separately managed account mandates. The investment management agreements we enter into in connection with managing separately managed accounts on behalf of certain clients may in certain cases be terminated by such clients on as little as 30 days’ prior written notice. In addition, the boards of directors of the investment management companies we manage could terminate our advisory engagement of those companies on as little as 30 days’ prior written notice. ARCC’sARCC and ASIF’s respective investment management agreementagreements can be terminated by the majority of itstheir respective stockholders upon 60 days’ prior written notice. InWe serve as the sub-adviser for the existing manager of certain funds. Although in some cases there can be economic payments made by the manager for termination of such sub-advisory contracts, such as in connection with our sub-advisory arrangement of AMP Capital’s Infrastructure Debt platform, in the case of any such terminations, the management fees and performancecarried interest or incentive fees we earn in

connection with managing such account or company would immediately cease, which could result in a significant adverse impact on our revenues.
In addition, if we were to experience a change of control (as defined under the Investment Advisers Act or as otherwise set forth in the partnership agreements of our funds), continuation of the investment management agreements of our funds would be subject to investor consent. There can be no assurance that required consents will be obtained if a change of control occurs. In addition, with respect to our funds that are subject to the Investment Company Act, each fund’s investment management agreement must be approved annually (a)(i) by such fund’s board of directors or by a vote of the majority of such fund’s stockholders, and (b)(ii) by the independent members of such fund’s board of directors and, in certain cases, by its stockholders, as required by law. Termination of these agreements would cause us to lose the management fees and performancecarried interest or incentive fees we earn from such funds, which could have a material adverse effect on our results of operations.
Customized separate account and advisory account fee revenue is not a long-term contracted source of revenue and is subject to intense competition.

Our revenue in any given period is dependent on the number of fee-paying clients and corresponding level of AUM in such period. Our customized separate account and advisory account business operates in a highly competitive environment where typically there are no long-term contracts. While clients of our customized separate account and advisory account businesses may have multi-year contracts, many of these contracts are terminable upon 30 to 90 days’ advance notice to us. We may lose clients as a result of a change in ownership, control or senior management, a client’s decision to transition to in-house asset management rather than partner with a third-party provider such as us, competition from other financial advisors and financial institutions, changes to their investment policies and other causes. Isolated departures have occurred in the past but have not had a material impact on our business. Moreover, a number of our contracts with state government-sponsored clients are secured through such government’s mandated procurement process, and are subject to periodic renewal. If multiple clients were to exercise their termination rights or fail to renew their existing contracts and we were unable to secure new clients or maintain our levels of AUM, our customized separate account and advisory account fees would decline materially. A significant reduction in the number of fee-paying clients and/or AUM levels in any given period could reduce our revenue and materially and adversely affect our business, financial condition and results of operations.
We are vulnerable to an increased number of investors seeking to participate in share redemption programs or tender offers of our non-traded vehicles.

We manage non-traded REITs, BDCs and other non-traded vehicles. Non-traded vehicles often conduct share redemption programs or tender offers to provide liquidity to investors in such vehicles, subject to certain limitations. For example, with respect to our non-traded REITs, the total amount of aggregate redemptions is limited by a certain percentage of each of the non-traded REIT’s NAV for each calendar month and quarter, which percentage is generally based on the excess of share redemptions (capital outflows) over the proceeds from the sale of shares (capital inflows), not including proceeds related to sales of beneficial interests in specific Delaware statutory trusts holding real properties, or the exchange program for the applicable period. While such share redemption programs and tender offers may contain restrictions that limit the amount of shares or other equity, as applicable, that may be redeemed or purchased in particular periods, an increased number of investors requesting redemptions in excess of capital inflows or participating in tender offers of our non-traded vehicles could lead to a decline in the management fees and incentive fees we receive. Economic events affecting the economy or market in general, such as volatility in the financial markets related to changes in markets, inflation, changes in interest rates or global or national events that are beyond our control, could cause investors to request redemption of an increased number of shares pursuant to the share redemption programs of our non-traded vehicles, potentially in excess of established limits. Such prolonged economic disruptions have caused a number of similar vehicles to deny redemption requests or to suspend or partially suspend their share redemption programs and tender offers. Our non-traded vehicles may redeem or purchase fewer shares than investors request due to a lack of readily available funds because of such adverse market conditions beyond our control or the need to maintain liquidity for operations. Certain of our non-traded vehicles may amend or suspend share repurchase programs during periods of
80

Table of Contents
market dislocation where selling assets to fund a repurchase could have a materially negative impact on remaining investors. With respect to our non-traded vehicles, the vast majority of their assets will consist of investments that cannot generally be readily liquidated on short notice without impacting the vehicle’s ability to realize full value upon their disposition. This may further limit the amount of cash available to immediately satisfy redemption requests. Any redemptions or purchases of less than amounts requested could undermine investor confidence in our non-traded vehicles and adversely impact our reputation.

A downturn in the global credit markets could adversely affect our CLO investments.

CLOs are subject to credit, liquidity, interest rate and other risks. From time to time, liquidity in the credit markets is reduced sometimes significantly, resulting in an increase in credit spreads and a decline in ratings, performance and market values for leveraged loans. We have significant exposure to these markets through our investments in our CLO funds. CLOs invest on a leveraged basis in loans or securities that are themselves highly leveraged investments in the underlying collateral, which increases both the opportunity for higher returns as well as the magnitude of losses when compared to unlevered investments. As a result of such funds’ leveraged position, CLOs and their investors are at greater risk of suffering losses. CLOs have failed in the past and may in the future fail one or more of their “overcollateralization” tests. The failure of one or more of these tests will result in reduced cash flows that may have been otherwise available for distribution to us. This could reduce the value of our investment. There can be no assurance that market conditions giving rise to these types of consequences will not once again occur, subsist or become more acute in the future.
Our funds may face risks relating to undiversified investments.
While diversification is generally an objective of our funds, there can be no assurance as to the degree of diversification, if any, that will be achieved in any fund investments. Difficult market conditions or volatility or slowdowns affecting a particular asset class, geographic region, industry or other category of investment could have a significant adverse impact on a fund if its investments are concentrated in that area, which would result in lower investment returns. This lack of diversification may expose a fund to losses disproportionate to market declines in general if there are disproportionately greater adverse price movements in the particular investments. If a fund holds investments concentrated in a particular issuer, security, asset class or geographic region, such fund may be more susceptible than a more widely diversified investment partnership to the negative consequences of a single corporate, economic, political or regulatory event. Accordingly, a lack of diversification on the part of a fund could adversely affect a fund’s performance and, as a result, our financial condition and results of operations.
The performance of our investments may fall short of our expectations and the expectations of the investors in our funds.
Before making investments, we conduct due diligence that we deem reasonable and appropriate based on the facts and circumstances applicable to each investment. When conducting due diligence, we may be required to evaluate important and complex business, financial, tax, accounting, environmental and legal issues. The due diligence investigation that we will carry out with respect to an investment opportunity may not reveal or highlight all relevant facts that may be necessary or helpful in evaluating such investment opportunity.
Once we have made an investment in a portfolio company, our funds generally establish the capital structure on the basis of financial projections prepared by the management of such portfolio company. These projections are only estimates of future results that are based upon assumptions made at the time that the projections are developed. General economic conditions, which are not predictable, along with other factors, may cause actual performance to fall short of the projections.
Additionally, we may cause our funds to acquire an investment that is subject to contingent liabilities. Such contingent liabilities could be unknown to us at the time of acquisition or, if they are known to us, we may not accurately assess or protect against the risks that they present. Acquired contingent liabilities could thus result in unforeseen losses for our funds. In addition, in connection with the disposition of an investment in a portfolio company, a fund may be required to make representations about the business and financial affairs of such portfolio company typical of those made in connection with the sale of a business. A fund may also be required to indemnify the purchasers of such investment if any such representations are inaccurate. These arrangements may result in the incurrence of contingent liabilities by a fund, even after the disposition of an investment. Accordingly, the inaccuracy of representations and warranties made by a fund could harm such fund’s performance.

Our funds may be forced to dispose of investments at a disadvantageous time. Furthermore, we may have to waive management fees for certain of our funds in certain circumstances.
Our funds may make investments that they do not advantageously dispose of prior to the date the applicable fund is dissolved, either by expiration of such fund’s term or otherwise. Although we generally expect that investments will be disposed of prior to dissolution or be suitable for in-kind distribution at dissolution, and the general partners of the funds have only a limited ability to extend the term of the fund with the consent of fund investors or the advisory board of the fund, as applicable, our funds may have to sell, distribute or otherwise dispose of investments at a disadvantageous time as a result of dissolution. This would result in a lower than expected return on the investments and, perhaps, on the fund itself. In addition, our limited partners may require that we waive management fees during periods after the contractual term of a fund, which would reduce the amount of management fees we earn and therefore could negatively impact our revenues and results of operations.
Our real estate funds are subject to the risks inherent in the ownership and operation of real estate and the construction and development of real estate.
Investments in our real estate funds will be subject to the risks inherent in the ownership and operation of real estate and real estate-related businesses and assets. These risks include the following:
those associated with the burdens of ownership of real property;
general and local economic conditions;
changes in supply of and demand for competing properties in an area (as a result, for example, of overbuilding);
fluctuations in the average occupancy and room rates for hotel properties;
the financial resources of tenants;
changes in building, environmental and other laws;
81

Table of Contents
energy and supply shortages;
various uninsured or uninsurable risks;
liability for “slip-and-fall” and other accidents on properties held by our funds;
natural disasters;disasters, extreme weather events and other physical risks related to climate change;
changes in government regulations (such as rent control and tax laws);
changes in real property tax and transfer tax rates;
changes in interest rates;
the reduced availability of mortgage funds which may render the sale or refinancing of properties difficult or impracticable;
negative developments in the economy that depress travel activity;
environmental liabilities;
contingent liabilities on disposition of assets;
unexpected cost overruns in connection with development projects;
terrorist attacks, war and other factors that are beyond our control; and
dependence on local operating partners.
Although real estate values have generally rebounded with the rest of the economy, other than certain high profile assets in the best markets, various factors could halt or limit a recovery in the housing market.
If our real estate funds acquire direct or indirect interests in undeveloped land or underdeveloped real property, which may often be non-income producing, they will be subject to the risks normally associated with such assets and development activities, including risks relating to the availability and timely receipt of zoning and other regulatory or environmental approvals, the cost and timely completion of construction (including risks beyond the control of our fund, such as weather or labor conditions or material shortages) and the availability of both construction and permanent financing on favorable terms. Additionally, our funds’ properties may be managed by a third party, which makes us dependent upon such third parties and subjects us to risks associated with the actions of such third parties. Any of these factors may cause the value of the investments in our real estate funds to decline, which may have a material impact on our results of operations.

Certain of our funds invest in the power, infrastructure and energy sector which is subject to significant market volatility. As such, the performance of investments in the energy sector is subject to a high degree of business and market risk.
The power, infrastructure and energy companies in which certain of our funds invest have been and willmay be negatively impacted by material declines in power and energy related commodity prices and are subject to other risks, including among others, supply and demand risk, operational risk, regulatory risk, depletion risk, reserve risk, reputational risk, severe weather, climate change and catastrophic event risk.risk (including of cyber-attacks). Commodity prices fluctuate for several reasons, including changes in market and economic conditions, the impact of weather on demand, climate initiatives of government entities, levels of domestic production and international production, policies implemented by the Organization of Petroleum Exporting Countries, power and energy conservation, domestic and foreign governmental regulation and taxation and the availability of local, intrastate and interstate transportation systems.
Climate change, climate change-related regulation and other efforts to reduce climate change and address sustainability concerns could adversely affect our business.
Climate change is widely considered to be a significant threat to the global economy. Our business operations, our funds’ portfolio companies, and the companies in which our funds invest may face risks associated with climate change, including “transition risks” such as risks related to the impact of climate-related legislation and regulation (both domestically and internationally), risks related to climate-related business trends (such as the process of transitioning to a lower-carbon economy)and risks stemming from the physical impacts of climate change, such as the increasing frequency or severity of extreme weather events and rising sea levels and temperatures.

Significant chronic or acute physical effects of climate change including extreme weather events such as hurricanes or floods, may have an adverse impact on certain of our funds’ portfolio companies and investments, especially our real asset investments and portfolio companies that rely on physical factories, plants or stores located in the affected areas, or that focus
82

Table of Contents
on tourism or recreational travel. For some of our products and our products’ portfolio companies, physical risks of climate change may also pose systemic risks for their businesses. For example, to the extent weather conditions are affected by climate change, energy use by us, our products or our products’ portfolio companies could increase or decrease depending on the duration and magnitude of any changes. As the effects of climate change increase, we expect the frequency and impact of weather and climate related events and conditions to increase as well. See “—Risks Related to Our Funds—Our real estate funds are subject to the risks inherent in the ownership and operation of real estate and the construction and development of real estate.”

In addition, the current Presidential administration has focused on climate change policies and has re-joined the Paris Agreement, which includes commitments from countries to reduce their greenhouse gas emissions, among other commitments. The Paris Agreement and other regulatory and voluntary initiatives launched by international, federal, state, and regional policymakers and regulatory authorities as well as private actors seeking to reduce greenhouse gas emissions may expose our business operations, portfolio companies, funds and the companies in which they invest to transition risks related to climate change in addition to physical risks, such as: (i) political and policy risks, (including changing regulatory incentives, and legal requirements, including with respect to greenhouse gas emissions, that could result in increased costs or changes in business operations); (ii) regulatory and litigation risks, (including changing legal requirements that could result in increased permitting, tax and compliance costs, enhanced disclosure obligations, changes in business operations, or the discontinuance of certain operations, and litigation seeking monetary or injunctive relief related to impacts related to climate change); (iii) technology and market risks, (including declining market for investments in industries seen as greenhouse gas intensive, like fossil fuels, or less effective than alternatives in reducing greenhouse gas emissions, and increased cost of insurance for assets in high risk sectors); (iv) business trend risks, (including capital expenditures, product or service redesigns, and changes to operations and supply chains to meet changing customer expectations and the increased attention to ESG considerations by our investors, including in connection with their determination of whether to invest in our funds or portfolio companies); and (v) potential harm to our reputation if certain stakeholders, such as our limited partners or shareholders, believe that we are not adequately or appropriately responding to climate change, including through the way in which we operate our business, the composition of our funds’ existing portfolios, the new investments made by our funds, or the decisions we make to continue to conduct or change our activities in response to climate change considerations. See “—Risks Related to Regulation—Increasing scrutiny from stakeholders and regulators with respect to ESG matters could impact our or our funds’ portfolio companies’ reputation, the cost of our or their operations, or result in investors ceasing to allocate their capital to us, all of which could adversely affect our business and results of operations.”

Investments in energy, manufacturing, infrastructure and certain other assets may expose us to increased environmental risks and liabilities that are inherent in the ownership of real assets.
Ownership of real assets in our funds or vehicles may increase our risk of liability under environmental laws that impose, regardless of fault, joint and several liability for the cost of remediating contamination and compensation for damages. In addition, changes in environmental laws or regulations or the environmental condition of an investment may create liabilities that did not exist at the time of acquisition. Even in cases where we are indemnified by a seller against liabilities arising out of violations of environmental laws and regulations, there can be no assurance as to the financial viability of the seller to satisfy such indemnities or our ability to achieve enforcement of such indemnities.
Our investments in infrastructure assets may expose us to increased risks and liabilities.
Investments in infrastructure assets may expose us to increased risks and liabilities that are inherent in the ownership of real assets. For example,
Ownership of infrastructure assets may also present additional risk of liability for personal and property injury or impose significant operating challenges and costs with respect to, for example, compliance with zoning, environmental or other applicable laws.
Infrastructure asset investments may face construction risks including, without limitation: (i) labor disputes, shortages of material and skilled labor, or work stoppages; (ii) slower than projected construction progress and the unavailability or late delivery of necessary equipment; (iii) less than optimal coordination with public utilities in the relocation of their facilities; (iv) adverse weather conditions and unexpected construction conditions; (v) accidents or the breakdown or failure of construction equipment or processes; and (vi) catastrophic events such as explosions, fires, terrorist activities and other similar events. These risks could result in substantial unanticipated delays or expenses (which may exceed expected or forecasted budgets) and, under certain circumstances, could prevent completion of construction activities once undertaken. Certain infrastructure asset investments may remain in construction phases for a prolonged period and, accordingly, may not be cash generative for a prolonged period. Recourse against the contractor may be subject to liability caps or may be subject to default or insolvency on the part of the contractor.
83

Table of Contents
The operation of infrastructure assets is exposed to potential unplanned interruptions caused by significant catastrophic or force majeure events, including cyber-attacks. These risks could, among other effects, adversely impact the cash flows available from investments in infrastructure assets, cause personal injury or loss of life, damage property, or instigate disruptions of service. In addition, the cost of repairing or replacing damaged assets could be considerable. Repeated or prolonged service interruptions may result in permanent loss of customers, litigation, or penalties for regulatory or contractual noncompliance. Force majeure events that are incapable of, or too costly to, cure may also have a permanent adverse effect on an investment.
The management of the business or operations of an infrastructure asset may be contracted to a third-party management company unaffiliated with us. Although it would be possible to replace any such operator, the failure of such an operator to adequately perform its duties or to act in ways that are in our best interest, or the breach by an operator of applicable agreements or laws, rules and regulations, could have an adverse effect on the investment’s financial condition or results of operations. Infrastructure investments may involve the subcontracting of design and construction activities in respect of projects, and as a result our investments are subject to the risks that contractual provisions passing liabilities to a subcontractor could be ineffective, the subcontractor fails to perform services which it has agreed to perform and the subcontractor becomes insolvent.
Infrastructure investments often involve an ongoing commitment to a municipal, state, federal or foreign government or regulatory agencies. The nature of these obligations exposes us to a higher level of regulatory control than typically imposed on other businesses and may require us to rely on complex government licenses, concessions, leases or contracts, which may be difficult to obtain or maintain. Infrastructure investments may require operators to manage such investments and such operators’ failure to comply with laws, including prohibitions against bribing of government officials, may adversely affect the value of such investments and cause us serious reputational and legal harm. Revenues for such investments may rely on contractual agreements for the provision of services with a limited number of counterparties, and are consequently subject to counterparty default risk. The operations and cash flow of infrastructure investments are also more sensitive to inflation and, in certain cases, commodity price risk. Furthermore, services provided by infrastructure investments may be subject to rate regulations by government entities that determine or limit prices that may be charged. Similarly, users of applicable services or government entities in response to such users may react negatively to any adjustments in rates and thus reduce the profitability of such infrastructure investments.
Hedging strategies may adversely affect the returns on our funds’ investments.
When managing our exposure to market risks, we may (on our own behalf or on behalf of our funds) from time to time use forward contracts, options, swaps, caps, collars, floors, foreign currency forward contracts, currency swap agreements, currency option contracts, oramong other strategies. Currency fluctuations in particular can have a substantial effect on our cash flow and financial condition. The success of any hedging or other derivative transactions generally will depend on our ability to correctly predict market or foreign exchange changes, the degree of correlation between price movements of a derivative instrument and the position being hedged, the creditworthiness of the counterparty and other factors. As a result, while we may enter into a transaction to reduce our exposure to market or foreign exchange risks, the transaction may result in poorer overall investment performance than if it had not been executed. Such transactions may also limit the opportunity for gain if the value of a hedged position increases.
While such hedging arrangements may reduce certain risks, such arrangements themselves may entail certain other risks. These arrangements may require the posting of cash collateral at a time when a fund has insufficient cash or illiquid assets such that the posting of the cash is either impossible or requires the sale of assets at prices that do not reflect their underlying value. Moreover, these hedging arrangements may generate significant transaction costs, including potential tax costs, that reduce the returns generated by a fund. Finally,
Our risk management strategies and procedures may leave us exposed to unidentified or unanticipated risks.
Risk management applies to our investment management operations as well as to the CFTC has made several public statementsinvestments we make for our specialized funds and customized separate accounts. We have developed and continue to update strategies and procedures specific to our business for managing risks, which include market risk, liquidity risk, operational risk and reputational risk. Management of these risks can be very complex. These strategies and procedures may fail under some circumstances, particularly if we are confronted with risks that itwe have underestimated or not identified, including those related to difficult market or geopolitical conditions. Given the large number and size of our funds, we often have large positions with a single counterparty. For example, we and most of our funds have credit lines. If the lender under one or more of those credit lines were to freeze the account in response to sanctions or become insolvent, we may soon issuehave difficulty replacing the credit line and the affected fund(s) or we may face liquidity challenges, which may adversely affect our business operations or the fund’s ability to close on an investment. If that counterparty is unable to perform its obligations or performs below our standards, we, our
84

Table of Contents
specialized funds, customized separate accounts and other investments may be adversely affected. In addition, some of our methods for managing the risks related to our clients’ investments are based upon our analysis of historical private markets behavior. Statistical techniques are applied to these observations in order to arrive at quantifications of some of our risk exposures. Historical analysis of private markets returns requires reliance on valuations performed by fund managers, which may not be reliable measures of current valuations. These statistical methods may not accurately quantify our risk exposure if circumstances arise that were not observed in our historical data. In particular, as we introduce new types of investment structures, products or services, our historical data may be incomplete. Failure of our risk management techniques could materially and adversely affect our business, financial condition and results of operations, including our right to receive incentive fees.

Restrictions on our ability to collect and analyze data regarding our clients’ investments could adversely affect our business.

Our database of private markets investments includes funds and direct investments that we monitor and report on for our specialized funds, customized separate accounts and advisory accounts. We rely on our database to provide regular reports to our clients, to research developments and trends in private markets and to support our investment processes. We depend on the continuation of our relationships with the general partners and sponsors of the underlying funds and investments in order to maintain current data on these investments and private markets activity. The termination of such relationships or the imposition of restrictions on our ability to use the data we obtain for our reporting and monitoring services could adversely affect our business, financial condition and results of operations. We are also highly dependent upon the technology platforms within which our data is stored and analyzed, and any disruption in the services provided by such platforms, whether temporary or permanent, could have a proposal for certain foreign exchange productsmaterial adverse effect on our ability to be subjecteffectively continue to mandatory clearing, which could increase the cost of entering into currency hedges.operate our business without interruption.

Risks Related to Our Organization and Structure
If we were deemed to be an “investment company” under the Investment Company Act, applicable restrictions could make it impractical for us to continue our businesses as contemplated and could have a material adverse effect on our businesses.
An entity will generally be deemed to be an “investment company” for purposes of the Investment Company Act if:
it is or holds itself out as being engaged primarily, or proposes to engage primarily, in the business of investing, reinvesting or trading in securities; or
absent an applicable exemption, it owns or proposes to acquire investment securities having a value exceeding 40% of the value of its total assets (exclusive of U.S. government securities and cash items) on an unconsolidated basis.
We believe that we are engaged primarily in the business of providing investment management services and not primarily in the business of investing, reinvesting or trading in securities. We hold ourselves out as an asset management firm and do not propose to engage primarily in the business of investing, reinvesting or trading in securities. Accordingly, we do not believe that we are an “orthodox” investment company as defined in Section 3(a)(1)(A) of the Investment Company Act and described in the first bullet point above. Furthermore, we have no material assets other than interests in certain direct and indirect wholly owned subsidiaries (within the meaning of the Investment Company Act), which in turn have no material assets other than partnership units in the Ares Operating GroupAOG entities. These wholly owned subsidiaries are the general partners of certain of the Ares Operating GroupAOG entities and are vested with all management and control over such Ares Operating GroupAOG entities. We do not believe that the equity interests of Ares Management, L.P.AMC in its wholly owned subsidiaries or the partnership units of these wholly owned subsidiaries in the Ares Operating GroupAOG entities are investment securities. Moreover, because we believe that the capital interests of the general partners of our funds in their respective funds are neither securities nor investment securities, we believe that less than 40% of Ares Management L.P.’sCorporation’s total assets (exclusive of U.S. government securities and cash items) on an unconsolidated basis are composed of assets that could be considered investment securities. Accordingly, we do not believe that Ares Management, L.P.AMC is an inadvertent investment company by virtue of the 40% test in Section 3(a)(1)(C) of the Investment Company Act as described in the second bullet point above.

The Investment Company Act and the rules thereunder contain detailed parameters for the organization and operation of investment companies. Among other things, the Investment Company Act and the rules thereunder limit or prohibit transactions with affiliates, impose limitations on the issuance of debt and equity securities, generally prohibit the issuance of options and impose certain governance requirements. We intend to conduct our operations so that we will not be deemed to be an investment company under the Investment Company Act. If anything were to happen that would cause us to be deemed to be an investment company under the Investment Company Act, requirements imposed by the Investment Company Act, including limitations on capital structure, the ability to transact business with affiliates and the ability to compensate senior employees, could make it impractical for us to continue our businesses as currently conducted, impair the agreements and arrangements
85

Table of Contents
between and among the Ares Operating Group, us, our funds and our senior management, or any combination thereof, and have a material adverse effect on our businesses, financial condition and results of operations. In addition, we may be required to limit the amount of investments that we make as a principal or otherwise conduct our businesses in a manner that does not subject us to the registration and other requirements of the Investment Company Act.
OurDue to the disparity in voting power among the classes of our common shareholders do not electstock, holders of our general partner or, except in limited circumstances,Class A common stock will generally have no influence over matters on which holders of our common stock vote on our general partner’s directors and have limited ability to influence decisions regarding our businesses.business.
Our general partner manages allUnless otherwise provided in our certificate of incorporation and bylaws or required by the DGCL or the rules of the NYSE, holders of our operationscommon stock vote together as a single class on all matters on which stockholders generally are entitled to vote under the DGCL. On any date on which the Ares Ownership Condition is satisfied, the shares of our Class B common stock held by the Class B Stockholder entitles it to a number of votes, in the aggregate, equal to (x) four times the aggregate number of votes attributable to the shares of our Class A common stock minus (y) the aggregate number of votes attributable to the shares of our Class C common stock. On any date on which the Ares Ownership Condition is not satisfied, the shares of our Class B common stock held by the Class B Stockholder will not be entitled to vote on any matter submitted to a vote of our stockholders. Ares Voting LLC, as the initial holder of the shares of our Class C common stock (in such capacity, the “Class C Stockholder”), is generally entitled to a number of votes equal to the number of AOG Units held of record by each limited partner of the AOG entities (other than us and activities. On January 31our subsidiaries). When AOG Units are exchanged for shares of each year, our general partner will determine whetherClass A common stock, the total voting power held collectivelynumber of votes to which the shares of our Class C common stock are entitled shall be reduced by (i)the number of AOG Units so exchanged. However, so long as the Ares Ownership Condition is satisfied, the issuance of shares of our Class A common stock would increase the number of votes to which holders of our Class B common stock are entitled. As a result, so long as the special voting shares inAres Ownership Condition is satisfied, practically all matters submitted to our stockholders will be decided by the vote of the holder of our Class B common stock, Ares Management L.P. (includingGP LLC (in such capacity, the “Class B Stockholder”), and Class C Stockholder. Our certificate of incorporation also provides that the number of authorized shares of our general partner, membersClass A common stock may be increased solely by the holders of Ares Partners Holdco LLC and their respective affiliates), (ii) then-current or former Ares personnel (including indirectly through related entities) and (iii) Ares Owners Holdings L.P. is at least 10%a majority of the voting power of theour outstanding capital stock entitled to vote thereon, voting sharestogether as a single class, and no other vote of Ares Management, L.P. (the “Ares control condition”). For purposes of determining whether the Ares control condition is satisfied, our general partner will treat as outstanding, and as held by the foregoing persons, all voting shares deliverable to such persons pursuant to equity awards granted to such persons. If the Ares control condition is satisfied, the board of directors of our general partner has no authority other than that which its member chooses to delegate to it. If the Ares control condition is not satisfied, the board of directors of our general partner will be responsible for the oversight of our business and operations. See “Item 10. Directors, Executive Officers and Corporate Governance-Limited Powers of Our Board of Directors.”
Unlike the holders of common stock in a corporation, our common shareholders have limited voting rights and have no right to remove our general partnerany class or except in the limited circumstances described below, elect the directorsseries of our general partner. Our common shareholders have no right to elect the directors of our general partner unless the Ares control condition is not satisfied. For so longstock, voting together or separately as the Ares control condition is satisfied, our general partner’s board of directors is elected in accordance with its limited liability company agreement, which provides that directors are appointed and removed by Ares Partners Holdco LLC, the member of our general partner. Ares Partners Holdco LLC is owned by the Holdco Members and managed by a board of managers, which is composed of Messrs. Arougheti, Berry, de Veer, Kaplan, McFerran, Ressler and Rosenthal. Mr. Ressler has veto power over decisions by the board of managers.class, shall be required therefor. As a result, holders of our Class A common shareholdersstock will have very limited or no ability to influence stockholder decisions, including decisions regarding our businesses.business.
The voting rights of holders of our Class A common stock are further restricted by provisions in our certificate of incorporation stating that any of our shares of stock held by a person or group that beneficially owns 20% or more of any class of stock then outstanding (other than the holders of our Class B common stock, Ares Owners Holdings L.P. (“Ares Owners”), any Holdco Member or any of their respective affiliates, or a direct or subsequently approved transferee of the foregoing) cannot be voted on any matter. The Class B Stockholder and Class C Stockholder are both exempt from this limitation.
These limits on the ability of the holders of our Class A common stock to exercise voting rights restrict the ability of the holders of our Class A common stock to influence matters subject to a vote of our stockholders.
The Holdco Members will beare able to determinesignificantly influence the outcome of those few mattersany matter that may be submitted for a vote of holders of our common shareholders.stock.
Ares Voting LLC, an entityThe Class B Stockholder and Class C Stockholder, entities wholly owned by Ares Partners Holdco LLC, which is in turn owned and controlled by the Holdco Members, holds a special voting share that provideshold the shares of our Class B common stock and the shares of our Class C common stock, respectively. On any date on which the Ares Ownership Condition is satisfied, the shares of our Class B common stock held by the Class B Stockholder entitles it withto a number of votes, in the aggregate, equal to (x) four times the aggregate number of votes attributable to the shares of our Class A common stock minus (y) the aggregate number of votes attributable to the shares of our Class C common stock. On any date on which the Ares Ownership Condition is not satisfied, the shares of our Class B common stock held by the Class B Stockholder will not be entitled to vote on any matter that may be submitted forto a vote of our stockholders. The Class C Stockholder, as the holder of our Class C common shareholders (voting together asstock, is entitled to a single class on all such matters), that isnumber of votes equal to the aggregate number of Ares Operating GroupAOG Units held of record by theeach limited partnerspartner of the AOG entities (other than us and our subsidiaries). In addition, Ares Operating Group entities that do not hold a special voting share. ThePartners Holdco Members, throughLLC, in its capacity as general partner of Ares Owners, Holdings L.P. andis entitled to direct the special voting sharevote of all the shares of our Class A common stock held by Ares Voting LLC, hold approximately 71.59% of the voting power of Ares Management, L.P.Owners. Accordingly, the Holdco Members have sufficient voting power to determine the outcome of those few matters that may be submitted for a vote of our common shareholders.stockholders.
OurFurthermore, our certificate of incorporation provides that special meetings of our stockholders may be called at any time only by or at the direction of our board of directors, a record holder of our Class B common shareholders’ voting rights are further restricted by the provision in our partnership agreement that states that any common shares held by a person that beneficially owns 20%stock or stockholders representing 50% or more of anythe voting power of the outstanding stock of the class or classes of stock which are entitled to vote at such meeting. Our Class A common stock and our Class C common stock are considered the same class of common stock for this purpose.
86

Table of Contents
Each year, our board of directors determines whether, as of January 31, the total voting power held by: (i) holders of our Class C common stock; (ii) then-current or former Ares personnel (including indirectly through related entities); and (iii) Ares Owners, without duplication, is at least 10% of the voting power of the shares of our Class A common stock and the shares of our Class C common stock, voting together as a single class (the “Designated Stock”) (the “Ares Ownership Condition”). For purposes of determining whether the Ares Ownership Condition is satisfied, our board of directors will treat as outstanding, and as held by the foregoing persons, all shares of our common shares then outstanding (other than our general partner,stock deliverable to such persons pursuant to equity awards granted to such persons. The Ares Ownership Condition is currently satisfied because Ares Owners Holdings L.P.,owns a membernumber of Ares Partners Holdco LLC or their respective affiliates, a direct or subsequently approved transfereeshares of our general partner or its affiliates or a person who acquiredClass A common stock and AOG Units such commonthat the Class C Stockholder and Ares Owners control over 70% of the voting power of the Designated Stock. In addition, certain Ares personnel (including the Holdco Members) also hold shares with the prior approval of our general partner) cannotClass A common stock and are entitled to shares of our Class A common stock pursuant to equity awards. All such additional shares of our Class A common stock would be voted on any matter. In addition,considered in determining whether the Ares Ownership Condition is satisfied.
If the Ares Ownership Condition is satisfied, our partnership agreement contains provisions limitingcertificate of incorporation provides that our board of directors will be divided into two classes: Class I directors and Class II directors. Mr. Antony P. Ressler, a Holdco Member, is the abilityonly Class I director and will continue to be a Class I director until his ownership of our common shareholders to call meetings or to acquire information about our operations,stock decreases below certain specified thresholds. All other directors are Class II directors. Furthermore, so long as well as other provisions limiting the abilityAres Ownership Condition is satisfied, (x) a quorum for the transaction of business at any meeting of our common shareholders to influence the manner or directionboard of directors and (y) any act of our management. Furthermore,board of directors, requires a majority of the common shareholders are not be entitled to dissenters’ rightsboard of appraisal underdirectors, which majority must include the Class I director. This effectively provides Mr. Ressler a veto right over all actions taken by our partnership agreement or applicable Delaware law in the eventboard of a merger or consolidation, a sale of substantially all of our assets or any other transaction or event.

directors.
As a result of these matters and the provisions referred to under “-Our“—Due to the disparity in voting power among the classes of our common shareholders do not electstock, holders of our general partner or, except in limited circumstances,Class A common stock will generally have no influence over matters on which holders of our common stock vote on our general partner’s directors and have limited ability to influence decisions regarding our businesses,business,holders of our Class A common shareholdersstock may be deprived of an opportunity to receive a premium for their shares of our Class A common sharesstock in the future through a sale of Ares Management, L.P.,AMC, and the trading prices of shares of our Class A common sharesstock may be adversely affected by the absence or reduction of a takeover premium in the trading price.
Potential conflicts of interest may arise among the Class B Stockholder and the Class C Stockholder, on the one hand, and the holders of our general partner, its affiliates or associatesClass A common stock, on the other hand.
The Class B Stockholder and us. Our general partnerthe Class C Stockholder are controlled by the Holdco Members, certain of whom also serve on our board of directors and its affiliates and associates have limited fiduciary duties to us and our preferred and common shareholders, which may permit them to favor their own interests to the detrimentall of us and our preferred and common shareholders.
Conflictswhom serve as executive officers. As a result, conflicts of interest may arise among our general partner or its affiliates or associates,the Class B Stockholder and the Class C Stockholder, and their respective controlling persons, on the one hand, and us orand the holders of our preferred andClass A common shareholders,stock, on the other hand. As a result of these conflicts, our general partner, which is wholly owned by Ares Partners Holdco LLC, which is in turn owned
The Class B Stockholder and controlled bythe Class C Stockholder, and thereby the Holdco Members, may favor its own interestshave the ability to influence our business and affairs through their ownership of the shares of our Class B common stock and the interestsshares of its affiliatesour Class C common stock, respectively, and provisions under our certificate of incorporation requiring the approval of the holders of our Class B common stock for certain corporate actions. Due to the disparity in voting power among the classes of our common stock, the Class B Stockholder and the Class C Stockholder will effectively control the election of directors while the Ares Ownership Condition is satisfied, and holders of our Class A common stock will generally have limited ability to elect directors and no ability to remove any of our directors, with or associates (includingwithout cause.
As such, the Class B Stockholder and Class C Stockholder, and thereby the Holdco Members) over our interests orMembers, have the interestsability to indirectly, and in some cases directly, influence the determination of our preferred and common shareholders. These conflicts include, among others, the following:
our general partner determines the amount and timing of ourthe Ares Operating Group’s investments and dispositions, cash expenditures, including those relating to compensation, indebtedness, issuances of additional partnershippartner interests, tax liabilities and amounts of reserves, each of which can affect the amount of cash that is available for distribution to our common shareholders;holders of AOG Units.
our general partner, in resolvingIn addition, conflicts may arise relating to the selection and structuring of interest, is entitled to take into account only such factors as it determines in its sole discretion to be relevant, reasonableinvestments or appropriate under the circumstances, which may include factors affecting partiestransactions, declaring dividends and other than us and our preferred and common shareholders (including the Holdco Members), which has the effect of limiting its duties (including fiduciary duties) to us and our preferred and common shareholders.distributions. For example, our subsidiaries that serve as the general partnerscertain of our funds have fiduciaryprincipals and contractual obligations to the investors in those funds, as a result of which we expect to regularly take actions in a manner consistent with such duties and obligations but that might adversely affect our results of operations or cash flow;
because our senior professional owners indirectly hold their Ares Operating GroupAOG Units through an entity thatAres Owners, which, unlike us, is not subject to corporate income taxationtaxation. See “—Tax consequences to the direct and indirect holders of AOG Units or to general partners in our funds may give rise to conflicts of interests.”
Certain actions by our board of directors require the approval of the Class B Stockholder, which is controlled by the Holdco Members.
Although the affirmative vote of a majority of our directors (which, so long as the Ares Management, L.P.Ownership Condition is satisfied, must include the Class I director) is required for any action to be taken by our board of directors, certain specified
87

Table of Contents
actions will be subjectalso require the approval of the Class B Stockholder, which is controlled by the Holdco Members. These actions consist of the following:
certain amendments to corporate income taxation, conflicts may arise between our senior professional owners and Ares Management, L.P.certificate of incorporation (including amendments to the definition of “Ares Ownership Condition” therein), or the amendment or repeal, in whole or in part, of certain provisions of our bylaws relating to our board of directors and officers (including the selection, structuringadoption of any provision inconsistent therewith);
the sale or exchange of all or substantially all of our and dispositionour subsidiaries’ assets, taken as a whole, in a single transaction or a series of investmentsrelated transactions; and
the merger, consolidation or other combination of our company with or into any other person.
As a “controlled company,” we qualify for some exemptions from the corporate governance and other matters;requirements of the NYSE.
otherWe are a “controlled company” within the meaning of the corporate governance standards of the NYSE. Under the NYSE rules, a company of which more than as set forth in50% of the fair competition, non-solicitationvoting power for the election of directors is held by an individual, group or another company is a “controlled company” and confidentiality agreements to which the Holdco Members are subject, which may not be enforceable, affiliates of our general partnerelect, and existing and former personnel employed by our general partner are not prohibited from engaging in other businesses or activities, including those that might be in direct competition with us;
our general partner and its affiliates and associates have limited their liability and reduced or eliminated their duties (including fiduciary duties) under our partnership agreement, while also restricting the remedies available to our preferred and common shareholders for actions that, without these limitations, might constitute breaches of duty (including fiduciary duty). In addition, we have agreedelected, and expect to indemnify our general partnercontinue to elect, not to comply with certain corporate governance requirements of the NYSE, including the requirement that the listed company have a nominating and its affiliates and associates (including the Holdco Members) to the fullest extent permitted by law, except with respect to conduct involving bad faith or criminal intent. By purchasing our preferred and common shares,corporate governance committee that is composed entirely of independent directors. Accordingly, holders of our preferredClass A common stock do not have the same protections afforded to stockholders of companies that are subject to all of the corporate governance requirements of the NYSE.
Our certificate of incorporation states that the Class B Stockholder is under no obligation to consider the separate interests of our other stockholders and common shares have agreed and consentedcontains provisions limiting the liability of the Class B Stockholder.
Due to the disparity in the voting power of the classes of our common stock, holders of our Class A common stock will generally have no influence over matters on which holders of our common stock vote. As a result, on any date on which the Ares Ownership Condition is satisfied, nearly all matters submitted to a vote of the holders of our common stock will be determined by the vote of the Class B Stockholder. Although controlling stockholders may owe duties to minority stockholders, our certificate of incorporation contains provisions set forthlimiting the duties owed by the Class B Stockholder and contains provisions allowing the Class B Stockholder to favor its own interests and the interests of its controlling persons over us and the holders of our Class A common stock. Our certificate of incorporation contains provisions stating that the Class B Stockholder is under no obligation to consider the separate interests of our other stockholders (including the tax consequences to such stockholders) in deciding whether or not to cause us to take (or decline to take) any action as well as provisions stating that the Class B Stockholder shall not be liable to our partnership agreement, including the provisions regardingother stockholders for monetary damages or equitable relief for losses sustained, liabilities incurred or benefits not derived by such stockholders in connection with such decisions. See “—Potential conflicts of interest situations that, inmay arise among the absence of such provisions, might constitute a breach of fiduciary or other duties under applicable state law;
our partnership agreement does not restrict our general partner from causing us to pay it or its affiliates for any services rendered, or from entering into additional contractual arrangements with any of these entities on our behalf, so long as

the terms of any such additional contractual arrangements are agreed to by our general partner in good faith as determined under our partnership agreement;
our general partner determines how much we pay for acquisition targetsClass B Stockholder and the structure of such consideration, including whether to incur debt to fundClass C Stockholder, on the transaction, whether to issue shares as considerationone hand, and the number of shares to be issued and the amount and timing of any earn-out payments;
the sole memberholders of our general partner determines whether to allow senior professionals to exchange their shares or waive certain restrictions relating to such shares;
our general partner determines how much debt we incur and that decision may adversely affect our credit ratings;
our general partner determines which costs incurred by it and its affiliates are reimbursable by us;
our general partner controlsClass A common stock, on the enforcement of obligations owed to us by it and its affiliates; and
our general partner decides whether to retain separate counsel, accountants or others to perform services for us.
See “Item 13. Certain Relationships and Related Transactions, and Director Independence.other hand.
Our partnership agreement contains provisions that reduce or eliminate duties (including fiduciary duties) of our general partner and its affiliates and associates and limit remedies available to preferred and common shareholders for actions that might otherwise constitute a breach of duty. It is difficult for a preferred and common shareholder to successfully challenge a resolution of a conflict of interest by our general partner or by its conflicts committee.
Our partnership agreement contains provisions that waive or consent to conduct by our general partner or its affiliates or associates that might otherwise raise issues about compliance with fiduciary duties or applicable law. For example, our partnership agreement provides that when our general partner is acting in its individual capacity, as opposed to in its capacity as our general partner, it or any of its affiliates or associates causing it to do so may act without any duties (including fiduciary duties) or obligations to us or our preferred and common shareholders whatsoever. When our general partner, in its capacity as our general partner, is permitted to or required to make a decision in its “sole discretion” or “discretion” or under a grant of similar authority or latitude or pursuant to any provision not subject to an express standard of “good faith,” then our general partner is entitled to consider only such interests and factors as it desires, including its own interests or the interests of the Holdco Members, and has no duty or obligation (fiduciary or otherwise) to give any consideration to any interest of or factors affecting us or any preferred and common shareholders and is not subject to any different standards imposed by our partnership agreement, or otherwise existing at law, in equity or otherwise. These provisions are expressly permitted by Delaware law. Unless our general partner breaches its obligations pursuant to our partnership agreement, we and our preferred and common shareholders do not have any recourse against our general partner even if our general partner were to act in a manner that was inconsistent with traditional fiduciary duties. Furthermore, even if there has been a breach of our partnership agreement, our partnership agreement provides that our general partner and its members, managers, officers and directorsThe Class B Stockholder will not be liable to us or holders of our preferredClass A common stock for any acts or omissions unless there has been a final and non-appealable judgment determining that the Class B Stockholder acted in bad faith or with criminal intent, and we have also agreed to indemnify other designated persons to a similar extent.
Even if there is deemed to be a breach of the obligations set forth in our certificate of incorporation, our certificate of incorporation provides that the Class B Stockholder will not be liable to us or the holders of our Class A common shareholdersstock for any acts or omissions unless there has been a final and non-appealable judgment entered by a court of competent jurisdiction determining that, in respect of the general partner or its members, managers, officers or directorsmatter in question, the Class B Stockholder acted in bad faith or with criminal intent. These modificationsprovisions are detrimental to the preferred andholders of our Class A common shareholdersstock because they restrict the remedies available to preferred and common shareholdersour stockholders for actions that without those limitations might constitute breaches of duty (including fiduciary duty).the Class B Stockholder.
Whenever a potential conflict of interest exists between us, anyIn addition, we have agreed to indemnify and hold harmless (i) each member of our subsidiariesboard of directors and each of our officers, (ii) each holder of record of our Class B common stock, (iii) Ares Management GP LLC, in its capacity as the former general partner of our company when we were a Delaware limited partnership, and any successor or permitted assign, (iv) any person who is or was a “tax matters partner” (as defined in the Section 6231 of the Code prior to amendment by P.L. 114-74) or “partnership representative” (as defined in Section 6223 of the Code after amendment by P.L. 114-74), member, manager, officer or director of any holder of record of our Class B common stock or Ares Management GP LLC, and (v) any member, manager, officer or director of any holder of record of our Class B common stock or Ares Management GP LLC who is or was serving at the request of any holder of record of our Class B common stock or Ares Management GP LLC as a director, officer, manager, employee, trustee, fiduciary, partner, tax matters partner, partnership representative, member, representative, agent or advisor of another person (collectively, the “Indemnitees”), in each case, to the fullest extent permitted by law, on an after tax
88

Table of Contents
basis from and against any and all losses, claims, damages, liabilities, joint or several, expenses (including legal fees and expenses), judgments, fines, penalties, interests, settlements or other amounts arising from any and all threatened, pending or completed claim, demand, action, suit or proceeding, whether civil, criminal, administrative or investigative, and whether formal or informal, and including appeals, in which any Indemnitee may be involved, or is threatened to be involved, as a party or otherwise, by reason of its status as an Indemnitee, whether arising from acts or omissions to act occurring on, before or after the date of our certificate of incorporation. We have agreed to provide this indemnification unless there has been a final and non-appealable judgment entered by a court of competent jurisdiction determining that, in respect of the matter in question, the Indemnitee acted in bad faith or with criminal intent.
The provision of our certificate of incorporation requiring exclusive venue in the Court of Chancery in the State of Delaware for certain types of lawsuits may have the effect of discouraging lawsuits against us and our directors, officers and stockholders.
Our certificate of incorporation requires, to the fullest extent permitted by law, that any claim, demand, action, suit or proceeding, whether civil, criminal, administrative or investigative, and whether formal or informal, and including appeals, arising out of or relating in any way to our certificate of incorporation or any of our partners and our general partner or its affiliates or associates, our general partnerstock may resolve such conflictonly be brought in the Court of interest in good faith. If our general partner subjectively believes that its resolutionChancery of the conflictState of interest isDelaware or, if such court does not opposed to our best interests, then it will be conclusively deemed that its resolution was madehave subject matter jurisdiction thereof, any other court in good faith and will not be a breachthe State of our partnership agreement or any duty. A preferred or common shareholder seeking to challenge this resolution of the conflict of interest would bear the burden of overcoming such presumption.Delaware with subject matter jurisdiction. This is different from the situation with Delaware corporations, where a conflict resolution by an interested party would be presumed to be unfair and the interested party wouldprovision may have the burdeneffect of demonstrating that the resolution was fair.
Also, if our general partner obtains the approval of its conflicts committee or a majority of the voting shares, the resolution will be conclusively deemed approved bydiscouraging lawsuits against us and our preferreddirectors, officers and common shareholders and not a breach of our partnership agreement (or any agreement referred to therein) or of any duties that our general partner or its affiliates or associates may owe to us or our preferred and common shareholders. This is different from the situation with Delaware corporations, where a conflict resolution by a committee consisting solely of independent directors may, in certain circumstances, merely shift the burden of demonstrating unfairness to the plaintiff. Preferred and common shareholders are treated as having consented to the provisions

set forth in our partnership agreement, including provisions regarding conflicts of interest situations that, in the absence of such provisions, might be considered a breach of fiduciary or other duties under applicable state law. As a result, preferred and common shareholders will, as a practical matter, not be able to successfully challenge an informed decision by the conflicts committee. See “Item 13. Certain Relationships and Related Transactions, and Director Independence.”
The potential requirement to convert our financial statements from being prepared in conformity with accounting principles generally accepted in the United States to International Financial Reporting Standards may strain our resources and increase our annual expenses.
As a public entity, the SEC may require in the future that we report our financial results under International Financial Reporting Standards (“IFRS”) instead of under GAAP. IFRS is a set of accounting principles that has been gaining acceptance on a worldwide basis. These standards are published by the London-based International Accounting Standards Board and are more focused on objectives and principles and less reliant on detailed rules than GAAP. Today, there remain significant and material differences in several key areas between GAAP and IFRS which would affect us. Additionally, GAAP provides specific guidance in classes of accounting transactions for which equivalent guidance in IFRS does not exist. The adoption of IFRS is highly complex and would have an impact on many aspects of us and our operations, including, but not limited to, financial accounting and reporting systems, internal controls, taxes, borrowing covenants and cash management. It is expected that a significant amount of time, internal and external resources and expenses over a multi-year period would be required for this conversion.
The requirements of being a public entity and sustaining growth may strain our resources.
As a public entity, we are subject to the reporting requirements of the Exchange Act and requirements of the Sarbanes-Oxley Act of 2002 (the “Sarbanes-Oxley Act”). These requirements may place a strain on our systems and resources. The Exchange Act requires that we file annual, quarterly and current reports with respect to our business and financial condition. The Sarbanes-Oxley Act requires that we maintain effective disclosure controls and procedures and internal controls over financial reporting, and requires our management and independent auditors to report annually on the effectiveness of our internal control over financial reporting. To maintain and improve the effectiveness of our disclosure controls and procedures, significant resources and management oversight is required. We have implemented procedures and processes to address the standards and requirements applicable to public companies. If we are not able to maintain the necessary procedures and processes, we may be unable to report our financial information on a timely or accurate basis, which could subject us to adverse regulatory consequences, including sanctions by the SEC or violations of applicable NYSE listing rules, and result in a breach of the covenants under the agreements governing any of our financing arrangements. Preparing our consolidated financial statements involves a number of complex manual and automated processes, which are dependent on individual data input or review and require significant management judgment. One or more of these elements may result in errors that may not be detected and could result in a material misstatement of our consolidated financial statements. There could also be a negative reaction in the financial markets due to a loss of investor confidence in us and the reliability of our financial statements. Confidence in the reliability of our financial statements could also suffer if our independent registered public accounting firm were to report a material weakness in our internal controls over financial reporting. This could have a material adverse effect on us and lead to a decline in the price of our common shares.
In addition, sustaining our growth also requires us to commit additional management, operational, and financial resources to identify new professionals to join the firm and to maintain appropriate operational and financial systems to adequately support expansion. These activities may divert management’s attention from other business concerns, which could have a material adverse effect on our businesses, financial condition, results of operations and cash flows.
The control of our general partner may be transferred without common shareholder consent.
Our general partner may transfer all or any part of its general partner interest without the consent of our common shareholders. Furthermore, at any time, the member of our general partner may sell or transfer all or part of its interests in our general partner without the approval of the common shareholders. A new general partner may not be willing or able to form new funds and could form funds that have investment objectives and governing terms that differ materially from those of our current funds. A new owner could also have a different investment philosophy, employ investment professionals who are less experienced, be unsuccessful in identifying investment opportunities or have a track record that is not as successful as our track record. If any of the foregoing were to occur, we could experience difficulty in making new investments, and the value of our existing investments, our businesses, our results of operations and our financial condition could materially suffer.

stockholders.
Our ability to pay distributionsdividends to the holders of our Class A and non-voting common shareholdersstock may be limited by our holding company structure, applicable provisions of Delaware law and contractual restrictions or obligations.
As a holding company, our ability to pay distributionsdividends will be subject to the ability of our subsidiaries to provide cash to us. Ares Management, L.P.AMC has no material assets other than investments in the Ares Operating GroupAOG entities, either directly or through direct or indirect subsidiaries. We have no independent means of generating revenues. Accordingly, we intend to cause the Ares Operating GroupAOG entities to fund any distributionsdividends we may declare on theshares of our Class A and non-voting common shares.stock. If the Ares Operating GroupAOG entities make distributions to fund such distributions,dividends, all holders of Ares Operating GroupAOG Units will be entitled to receive equivalent distributions pro rata based on their partnership interests in the Ares Operating Group.
Because we will be treated as a U.S. corporation for U.S. federal income tax purposes andwe will be subject to entity-level corporate income taxes and may be obligated to make payments under the tax receivable agreement,TRA, the amountsamount of dividends ultimately distributedpaid by us to holders of our Class A and non-voting common shareholdersstock are generally expected to be less, on a per share basis, than the amounts distributed by the Ares Operating Group to the holders of Ares Operating GroupAOG Units (including us) in respect of their or our Ares Operating GroupAOG Units. In addition, each Ares Operating Group entity has issuedFor a seriesfurther discussion of preferred units (“GP Mirror Units”) with economic terms designedrelated tax consequences and risks, see “—Risks Related to generally mirror thoseTaxation—We are a corporation, and applicable taxes will reduce the amount available for dividends to holders of the Seriesour Class A Preferred Shares. The GP Mirror Units pay the same 7.00% rate per annum to us that we pay on our Series A Preferred Shares. Although income allocatedand non-voting common stock in respect of distributions onsuch investments and could adversely affect the GP Mirror Units made to usvalue of our Class A and non-voting common stockholders’ investment.”
Our dividend policy contemplates a steady quarterly dividend for each calendar year that will be subject to tax, cash distributions to holdersbased on fee related earnings after an allocation of Series A Preferred Shares will not be reduced on account of any incomecurrent taxes owed by us.
paid. The declaration, payment and paymentdetermination of the amount of quarterly dividends, if any, future distributions will be at the sole discretion of our general partner, whichboard of directors, and reassessed each year based on the level and growth of our fee related earnings after an allocation of current taxes paid. We may change our distributiondividend policy at any time. There can be no assurance that any distributions,dividends, whether quarterly or otherwise, can or will be paid. Our ability to make cash distributionsdividends to holders of our Class A and non-voting common shareholdersstock depends on a number of factors, including among other things, general economic and business conditions, our strategic plans and prospects, our businesses and investment opportunities, our financial condition and operating results, working capital requirements and other anticipated cash needs, contractual restrictions and obligations, including fulfilling our current and future capital commitments, legal, tax and regulatory restrictions, restrictions and other implications on the payment of distributionsdividends by us to our common shareholdersstockholders or by our subsidiaries to us, payments required to be made pursuant to the tax receivable agreementTRA and such other factors as our general partnerboard of directors may deem relevant.
Under the Delaware Revised Uniform Limited Partnership Act (the “Delaware Limited Partnership Act”),DGCL, we may not make a distributiononly pay dividends to a partner if afterour stockholders out of: (i) our surplus, as defined and computed under the distribution allprovisions of the DGCL or (ii) our liabilities, other than liabilities to partners on account of their partnership interests and liabilitiesnet profits for the fiscal year in which the recourse of creditorsdividend is limited to specific property ofdeclared and/or the partnership, would exceed the fair value of our assets.preceding fiscal year. If we were to makedo not have sufficient surplus or net profits, we will be prohibited by law from paying any such an impermissible distribution, any limited partner who received a distribution and knew at the time of the distribution that the distribution was in violation of the Delaware Limited Partnership Act would be liable to us for the amount of the distribution for three years.dividend. In addition, the terms of the Credit Facility or other financing arrangements may from time to time include covenants or other restrictions that could constrain our ability to make distributions. In addition,dividends. Furthermore, the Ares Operating Group’s cash flow may be insufficient to enable them to make required minimum tax distributions to their members and partners, in which case the Ares Operating Group may have to borrow funds or sell assets, which could have a material adverse effect on our liquidity and financial condition. Our partnership agreementcertificate of incorporation contains provisions authorizing us, subject to the approval of our stockholders, to issue additional partnership interestsclasses or series of stock that have designations, preferences, rights, powers and duties that are different from, and may be senior to, those applicable to shares of our Class A common shares on the terms and conditions determined by our general partner in its sole discretion at any time without common shareholder approval.stock.
89

Table of Contents
Furthermore, by making cash distributionsdividends to our stockholders rather than investing that cash in our businesses, we risk slowing the pace of our growth, or not having a sufficient amount of cash to fund our operations, new investments or unanticipated capital expenditures, should the need arise.
The Class B Stockholder or the Class C Stockholder may transfer their interests in the shares of our Class B common stock or the shares of our Class C common stock, respectively, which could materially alter our operations.
Subject to certain restrictions outlined in our certificate of incorporation, our stock is freely transferable and the Class B Stockholder or the Class C Stockholder may transfer their shares of our Class B common stock and our Class C common stock, respectively, to a third party without the consent of the holders of any other class or series of our stock. Further, the members of the Class B Stockholder or the Class C Stockholder may sell or transfer all or part of their limited liability company interests in the Class B Stockholder or the Class C Stockholder, respectively, at any time without restriction. Any such transfer could constitute or cause a change of control under the Investment Advisers Act, the Credit Facility or other debt instruments and/or governing documents of our funds and other vehicles, which could require consents or waivers or cause defaults under any such documents. In addition, a new holder of shares of our Class B common stock or shares of our Class C common stock, or new controlling members of the Class B Stockholder or Class C Stockholder, may choose to vote for the election of directors to our board of directors who may not be willing or able to cause us to form new funds and could cause us to form funds that have investment objectives and governing terms that differ materially from those of our current funds. A new holder of our Class B common stock or our Class C Common Stock, new controlling members of the Class B Stockholder or Class C Stockholder and/or the directors they each respectively may appoint to our board of directors could also have a different investment philosophy, cause us or our affiliates to employ investment professionals who are less experienced, be unsuccessful in identifying investment opportunities or have a track record that is not as successful as our track record. If any of the foregoing were to occur, we could experience difficulty in making new investments, and the value of our existing investments, our business, our results of operations and our financial condition could materially suffer.
Our certificate of incorporation also provides us with a right to acquire shares of our Class A common stock under specified circumstances, which may adversely affect the price of shares of our Class A common stock.
Our certificate of incorporation provides that, if at any time, either: (i) less than 10% of the total shares of any class of our stock then outstanding (other than our Class B common stock, and our Class C common stock) is held by persons other than a record holder of our Class B common stock, any person who is, was or will be a member of Ares Partners Holdco LLC or their respective affiliates or (ii) we are required to register as an investment company under the Investment Company Act, we may exercise our right to purchase shares of our Class A common stock or assign this right to a record holder of our Class B common stock or any of its affiliates. As a result, a stockholder may have his or her shares of our Class A common stock purchased from him or her at an undesirable time or price.
Other anti-takeover provisions in our charter documents could delay or prevent a change in control.
In addition to the provisions described elsewhere relating to the relative voting power of our classes of common stock, other provisions in our certificate of incorporation and bylaws may discourage, delay or prevent a merger or acquisition that a holder of our Class A common stock may consider favorable by, for example:
permitting our board of directors to issue one or more series of preferred stock;
providing for the loss of voting rights for certain series or classes of our capital stock;
imposing supermajority voting requirements for certain amendments to our certificate of incorporation;
requiring advance notice for stockholder proposals and nominations at annual and special meetings of our stockholders; and
placing limitations on convening stockholder meetings.
These provisions may also discourage acquisition proposals or delay or prevent a change in control.
We will be required to pay the TRA Recipients for most of the benefits relating to our use of tax attributes we receive from prior and future exchanges of Ares Operating GroupAOG Units and related transactions. In certain circumstances, payments to the TRA Recipients may be accelerated and/or could significantly exceed the actual tax benefits we realize.
The holders of Ares Operating GroupAOG Units, subject to any applicable transfer restrictions and other provisions, may, on a quarterly basis, exchange their Ares Operating GroupAOG Units for shares of our Class A common sharesstock on a one-for-one basis or, at our option, for cash. A holder of Ares Operating GroupAOG Units must exchange one AOG Unit in the Ares Operating Group Unit in each of the three Ares Operating Group entitiesentity to effect an exchange for a common share of Ares Management, L.P.
90

Table of Contents
Class A common stock of AMC. These exchanges are expected to result in increases (for U.S. federal income tax purposes) in the tax basis of the tangible and intangible assets of the relevant Ares Operating Group entity. These increases in tax basis generally will increase (for U.S. federal income tax purposes) depreciation and amortization deductions and potentially reduce gain on sales of assets and, therefore, reduce the amount of tax that we would

otherwise be required to pay in the future, although the IRS may challenge all or part of these deductions and tax basis increases, and a court could sustain such a challenge.
We have entered into a tax receivable agreementTRA with certain direct and indirect holders of Ares Operating GroupAOG Units (the “TRA Recipients”) that provides for the payment (“Tax Receivable Payment”) by us to the TRA Recipients of 85% of the amount of cash tax savings, if any, in U.S. federal, state, local and foreign income tax or franchise tax that we actually realize (or are deemed to realize in the case of an early termination payment by us or a change of control, as discussed below) as a result of increases in tax basis and certain other tax benefits related to our entering into the tax receivable agreement,TRA, including tax benefits attributable to payments under the tax receivable agreement. The reduction in the statutory corporate tax rate from 35%TRA. Pursuant to 21% would generally reduce the amount of cash tax savings and thus reduce the amount of the paymentsan amendment to the TRA, Recipients. On the other hand, duedated May 1, 2023, to the extent Ares Owners Holdings L.P. would have been a TRA Recipient of a Tax Election, a greater percentage of our income will be subject to corporate taxation and thus generally increase the amount payableReceivable Payment under the tax receivable agreement.TRA prior to the amendment, Ares Owners Holdings L.P. will no longer be entitled to any Tax Receivable Payment for taxable exchanges on or after May 1, 2023. The payments we may make to the TRA Recipients could be material in amount and we may need to incur debt to finance payments under the tax receivable agreementTRA if our cash resources are insufficient to meet our obligations under the tax receivable agreementTRA as a result of timing discrepancies or otherwise. Assuming thatThe actual increase in tax basis (and our ability to achieve the market valuecorresponding tax benefits), as well as the amount and timing of any payments under the TRA, will vary depending upon a number of factors, including the timing of exchanges, the price of a share of our Class A common share werestock at the time of the exchange, the extent to be equal to $20.00 per common share, which is the closing price per common share as of December 31, 2017, and that LIBOR were to be 2.11% and a federal corporate tax rate of 21%, we estimate that the aggregate amount of these termination payments would be approximately $398 million. The foregoing amount is merely an estimatesuch changes are taxable and the actualamount and timing of our income. In certain circumstances, payments to the TRA Recipients under the TRA could differ materially.
be in excess of our cash tax savings. If the IRS were to challenge a tax basis increase (or the ability to amortize such increase), the TRA Recipients will not reimburse us for any payments previously made to them under the tax receivable agreement. Our ability to achieve benefits from any tax basis increase, and the payments to be made under the tax receivable agreement, will depend upon a number of factors, as discussed above, including the timing and amount of our future income. As a result, in certain circumstances, payments to the TRA Recipients under the tax receivable agreement could be in excess of our cash tax savings.TRA.
In addition, the tax receivable agreementTRA provides that, upon a change of control, or if, at any time, we elect an early termination of the tax receivable agreement,TRA, our obligations under the tax receivables agreementTRA with respect to exchanged or acquired shares of our Class A common stock (whether exchanged or acquired before or after such change of control) would be based on certain assumptions, including that we would have sufficient taxable income to fully utilize the deductions arising from the increased tax deductions and tax basis and other benefits related to entering into the tax receivable agreementTRA and, in the case of an early termination election, that any Ares Operating GroupAOG Units that have not been exchanged are deemed exchanged for the market value of theshares of our Class A common sharesstock at the time of termination. See “Item 13. Certain RelationshipsAssuming that the market value of a share of our Class A common stock were to be equal to $118.92, which is the closing price per share of our Class A common stock as of December 31, 2023, and Related Transactions,that SOFR were to be 5.38% and Director Independence-Tax Receivable Agreement.”a blended federal and state corporate tax rate of 24.0%, we estimate that the aggregate amount of these termination payments would be approximately $1.7 billion on the 117 million AOG Units that have not been exchanged for Class A common stock. The foregoing amount is merely an estimate and the actual payments could differ materially.
Tax consequences to the direct and indirect holders of Ares Operating GroupAOG Units or to general partners in our funds may give rise to conflicts of interests.
As a result of the tax gain inherent in our assets held by the Ares Operating Group, at the time of this report, upon a realization event, certain direct and indirect holders of Ares Operating GroupAOG Units may incur different and potentially significantly greater tax liabilities as a result of the disproportionately greater allocations of items of taxable income and gain to such holders. As these direct and indirect holders will not receive a correspondingcorrespondingly greater distribution of cash proceeds, they may, subject to applicable fiduciary or contractual duties, have different objectives regarding the appropriate pricing, timing and other material terms of any sale, refinancing, or disposition, or whether to sell such assets at all. Decisions made with respect to an acceleration or deferral of income or the sale or disposition of assets with unrealized built-in tax gains may also influence the timing and amount of payments that are received by the TRA Recipients (including, among others, the Holdco Members and other executive officers) under the tax receivable agreement.TRA. In general, we anticipate that earlier disposition of assets with unrealized built-in tax gains following suchan exchange will tend to accelerate such payments and increase the present value of payments under the tax receivable agreement,TRA, and disposition of assets with unrealized built-in tax gains in a tax year before an exchange generally will increase an exchanging holder’s tax liability without giving rise to any rights to any payments under the tax receivable agreement.TRA. Decisions made regarding a change of control also could have a material influence on the timing and amount of payments received by the TRA Recipients pursuant to the tax receivable agreement.TRA.
Moreover, we may receive carried interest or incentive fees from our funds if specified returns are achieved by those funds. In certain circumstances, we may prefer to structure the fees as a special allocation of income, which we refer to as a carried interest, rather than as an incentive fee.
The general partner of our funds may be entitled to receive carried interest from our funds and a significant portion of that carried interest may consist of long-term capital gains. Because Ares Management, L.P. will be taxable asAs a U.S. corporation, for U.S. federal income tax purposes, itwe will not receive preferential treatment for long-term capital gains.gains and we may be limited in deducting capital losses. As a result, the general partners of our funds may
91

Table of Contents
have interests that are not entirely aligned with our stockholders and thus, subject to their fiduciary duties to fund investors, the general partners of our funds may be incentivized to seek investment opportunities with lower pre-tax returns but higher after-tax returns taking into account the preferentialthat maximize favorable tax rates for capital gains, which may be adverse to our interests.

We are a Delaware limited partnership and as a result will qualify for and intend to rely on exceptions from certain corporate governance and other requirements under the rules of the NYSE. Further, there are certain provisions in our partnership agreement regarding exculpation and indemnification of our officers and directors that differ from the Delaware General Corporation Law in a manner that may be less protective of the interests of our shareholders.
We are a Delaware limited partnership and qualify for exceptions from certain corporate governance and other requirements of the rules of the NYSE. Pursuant to these exceptions, limited partnerships may elect not to comply with certain corporate governance requirements of the NYSE, including the requirements that (i) a majority of the board of directors of our general partner consist of independent directors, (ii) we have a nominating/corporate governance committee that is composed entirely of independent directors, (iii) we have a compensation committee that is composed entirely of independent directors and (iv) the compensation committee consider certain independence factors when engaging compensation consultants, legal counsel and other committee advisers. In addition, we are not required to hold annual meetings of our common shareholders. We have availed ourselves of these exceptions. Accordingly, holders of our common shares do not have the same protections afforded to equityholders of entities that are subject to all of the corporate governance requirements of the NYSE.
Our partnership agreement provides thattreatment to the fullest extent permitted by applicable law the directors and officers of our general partner will not be liable to us unless they act in bad faith or with criminal intent. However, under the Delaware General Corporation Law, a director or officer would be liable to us for (i) breach of duty of loyalty to us or our equityholders, (ii) intentional misconduct or knowing violations of the law that are not done in good faith, (iii) improper redemption of shares or declaration of dividend or (iv) a transaction from which the director derived an improper personal benefit. In addition, our partnership agreement provides that we indemnify the directors and officers of our general partner for acts or omissions to the fullest extent provided by law unless they act in bad faith or with criminal intent. However, under the Delaware General Corporation Law, a corporation can only indemnify directors and officers for acts or omissions if the director or officer acted in good faith, in a manner he reasonably believed to be in the best interests of the corporation, and, in criminal action, if the officer or director had no reasonable cause to believe his conduct was unlawful. Accordingly, our partnership agreement is less protective of the interests of our common shareholders, when compared to the Delaware General Corporation Law, insofar as it relates to the exculpation and indemnification of officers and directors.partners.
Risks Related to Shares of Our Preferred and Common SharesStock
The market price and trading volume of shares of our Class A common sharesstock may be volatile, which could result in rapid and substantial losses for holders of our Class A common shareholders.stock.
The market price of shares of our Class A common sharesstock may be highly volatile and could be subject to wide fluctuations. In addition, the trading volume in shares of our Class A common sharesstock may fluctuate and cause significant price variations to occur. If the market price of shares of our Class A common sharesstock declines significantly, holders of our Class A common sharesstock may be unable to resell their shares of our Class A common sharesstock at or above their purchase price, if at all. The market price of shares of our Class A common sharesstock may fluctuate or decline significantly in the future. Some of the factors that could negatively affect the price of shares of our Class A common sharesstock or result in fluctuations in the price or trading volume of shares of our Class A common sharesstock include:
variations in our quarterly operating results or distributions,dividends, which variations we expect will be substantial;
our policy of taking a long-term perspective on making investment, operational and strategic decisions, which is expected to result in significant and unpredictable variations in our quarterly returns;
our creditworthiness, results of operations and financial condition;
the prevailing interest rates or rates of return being paid by other companies similar to us and the market for similar securities;
failure to meet analysts’ earnings estimates;
publication of research reports about us or the investment management industry or the failure of securities analysts to cover shares of our Class A common shares;stock;
additions or departures of our senior professionals and other key management personnel;
adverse market reaction to any indebtedness we may incur or securities we may issue in the future;
changes in market valuations of similar companies;
speculation in the press or investment community;
changes or proposed changes in laws or regulations or differing interpretations thereof affecting our businesses or enforcement of these laws and regulations, or announcements relating to these matters;
a lack of liquidity in the trading of shares of our Class A common shares;stock;

announcements by our competitors of significant contracts, acquisitions, dispositions, strategic partnerships, joint ventures or capital commitments;
adverse publicity about the asset management industry generally or, more specifically, private equity fund practices or individual scandals; and
general market and economic, conditions.financial, geopolitical, regulatory or judicial events or conditions that affect us or the financial markets.
In the past few years, stock markets have experienced extreme price and volume fluctuations. In the past, following periods of volatility in the overall market and the market price of a company’s securities, securities class action litigation has often been instituted against public companies. This type of litigation, if instituted against us, could result in substantial costs and a diversion of our management’s attention and resources.
An investment in our common shares is not an investment in any of our funds, and the assets and revenues of our funds are not directly available to us.
Common shareholders will not directly participate in the performance of our underlying funds, and any benefits from such performance will directly inure to investors in those funds. Our common shares are securities of Ares Management, L.P. only. While our historical consolidated financial information includes financial information, including assets and revenues, of our funds on a consolidated basis, and our future financial information will continue to consolidate certain of these funds, such assets and revenues are available to the fund and not to us except to a limited extent through management fees, performance fees, distributions and other proceeds arising from agreements with funds, as discussed in more detail in this Annual Report on Form 10-K.
The market price of shares of our Class A common sharesstock may decline due to the large number of shares of Class A common sharesstock eligible for exchange and future sale.
The market price of shares of our Class A common sharesstock could decline as a result of sales of a large number of shares of our Class A common sharesstock in the market and non-voting common stock, to the extent that sales happen in the future or the perception that such sales could occur.occur, including pursuant to Rule 10b5-1 trading plans. These sales, or the possibility that these
92

Table of Contents
sales may occur, also might make it more difficult for us to sell shares of our Class A common sharesstock in the future at a time and at a price that we deem appropriate. Subject to the lock-up restrictions described below, weWe may freely issue and sell in the future additional shares of our Class A common shares.stock. In addition, some of our directors and executive officers have entered into, or may enter into, Rule 10b5-1 trading plans pursuant to which they may sell shares of our Class A common stock from time to time in the future.
As of December 31, 2017,2023, our senior professional ownersprofessionals owned, indirectly, an aggregate of 117,576,663 Ares Operating Group117,024,758 AOG Units. We have entered into an exchange agreement with the holders of Ares Operating GroupAOG Units so that such holders subject to any applicable transfer and other restrictions, may, up to four times each year (subject to the terms of the exchange agreement)agreement and any contractual lock-up arrangements), exchange their Ares Operating GroupAOG Units for shares of our Class A common sharesstock on a one-for-one basis, subject to customary conversion rate adjustments for splits, share distributionsstock dividends and reclassifications, or, at our option, for cash. A holder of Ares Operating GroupAOG Units must exchange one AOG Unit in the Ares Operating Group Unit in each of the three Ares Operating Group entitiesentity to effect an exchange for a common share of Ares Management, L.P. TheClass A common shares we issue upon such exchanges would be “restricted securities,” as defined in Rule 144 under the Securities Act, unless we register such issuances.stock of AMC.
Ares Owners Holdings L.P., ADIA and Alleghany (together with ADIA, the “Strategic Investors”) have has the right, under certain circumstances and subject to certain restrictions, to require us to register under the Securities Act shares of Class A common sharesstock delivered in exchange for Ares Operating GroupAOG Units or common shares of Ares Management, L.P.Class A common stock ofAMC otherwise held by them. In addition, we may be required to make available shelf registration statements permitting sales of shares of our Class A common sharesstock into the market from time to time over an extended period. Lastly, Ares Owners Holdings L.P. and the Strategic Investors will have the ability to exercise certain piggyback registration rights in respect of shares of our Class A common sharesstock held by them in connection with registered offerings requested by other registration rights holders or initiated by us. See “Item 13. Certain Relationships and Related Transactions, and Director Independence-Investor Rights Agreement.” See “Item 11. Executive Compensation-Director Compensation-Common Shares and Ares Operating Group Units.” However, transfers may occur notwithstanding such restrictions pursuant to transactions or programs approved by our general partner.
Under our 2014 Equity Incentive Plan,As of December 31, 2023, there arewere options outstanding to purchase 20,495,02579,524 shares of our Class A common sharesstock and 13,751,88817,359,829 restricted sharesunits outstanding to be settled in shares of our Class A common shares,stock, both of which are subject to specified vesting requirements, and were granted to certain of our senior professionals. During the course of 2017, awards representing 1,621,592 common shares were forfeited and became available for issuanceprofessionals under the 20142023 Ares Management Corporation Equity Incentive Plan.Plan (the “Equity Incentive Plan”). As of December 31, 2017, 26,284,165 additional2023, 69,150,100 shares of our Class A common sharesstock were available for awardto be issued under our 2014the Equity Incentive Plan. We have filed twoa registration statements and intend to file more registration statementsstatement on Form S-8 with the SEC covering the shares of our Class A common sharesstock issuable under our 2014the Equity Incentive Plan. Subject to vesting and contractual lock-up arrangements (including through May 1, 2019 for restricted

such shares granted in connection withof our initial public offering.), upon effectiveness of the relevant registration statement on Form S-8, suchClass A common sharesstock are freely tradable. Vesting of those shares of restricted units would dilute the ownership interest of existing stockholders.
In addition, our partnership agreement authorizes us to issue an unlimited number of additional partnership securities and options, rights, warrants and appreciation rights relating to partnership securities for the consideration and on the terms and conditions determined by our general partner in its sole discretion without the approval of any limited partners. In accordance with the Delaware Limited Partnership Act and the provisions of our partnership agreement, we may also issue additional partnership interests that have certain designations, preferences, rights, powers and duties that are different from, and may be senior to, those applicable to our common and Series A Preferred shares. Similarly, the governing agreements of the Ares Operating GroupAOG entities authorize the direct subsidiaries of Ares Management, L.P.AMC which are the general partners of those entities to issue an unlimited number of additional units of the Ares Operating Group entity with such designations, preferences, rights, powers and duties that are different from, and may be senior to, those applicable to the Ares Operating GroupAOG Units, and which may be exchangeable for our common shares.
We cannot assure holdersshares of our Class A common shares that our intended distributions will be paid each quarter or at all.stock.
In conjunction with the Tax Election, we have adopted a distribution policy to provide a steady quarterly distribution for each calendar year that will be based on our after-tax fee related earnings. Starting in the second quarter of 2018, we intend to pay a $0.28 per common share distribution per quarter for the remainder of 2018. Our fixed distribution will be reassessed each year based upon the level and growth of our after-tax fee related earnings. The declaration, payment and determination of the amount of quarterly distributions, if any, will be at the sole discretion of our general partner, which may change our distribution policy at any time. We cannot assure our common shareholders that any distributions, whether quarterly or otherwise, can or will be paid. In making decisions regarding our quarterly distribution, our general partner considers general economic and business conditions, our strategic plans and prospects, our businesses and investment opportunities, our financial condition and operating results, working capital requirements and other anticipated cash needs, contractual restrictions and obligations, legal, tax, regulatory and other restrictions that may have implications on the payment of distributions by us to our common shareholders or by our subsidiaries to us, and such other factors as our general partner may deem relevant.
Distributions on the Series A Preferred Shares are discretionary and non-cumulative.
Distributions on the Series A Preferred Shares are discretionary and non-cumulative. Holders of our Series A Preferred Shares will only receive distributions when, as and if declared by the board of directors of our general partner. Consequently, if the board of directors of our general partner does not authorize and declare a distribution for a distribution period, holders of the Series A Preferred Shares would not be entitled to receive any distribution for such distribution period, and such unpaid distribution will not be payable in such distribution period or in later distribution periods. We will have no obligation to pay distributions for a distribution period if the board of directors of our general partner does not declare such distribution before the scheduled record date for such period, whether or not distributions are declared or paid for any subsequent distribution period with respect to the Series A Preferred Shares or any other preferred shares we may issue. This may result in holders of the Series A Preferred Shares not receiving the full amount of distributions that they expect to receive, or any distributions, and may make it more difficult to resell Series A Preferred Shares or to do so at a price that the holder finds attractive. The board of directors of our general partner may, in its sole discretion, determine to suspend distributions on the Series A Preferred Shares, which may have a material adverse effect on the market price of the Series A Preferred Shares. There can be no assurances that our operations will generate sufficient cash flows to enable us to pay distributions on the Series A Preferred Shares. Our financial and operating performance is subject to prevailing economic and industry conditions and to financial, business and other factors, some of which are beyond our control.
Risks Related to Taxation
Additional proposed changes in the U.S. and foreign taxation of businesses could adversely affect us.
HM Treasury, the OECD and other government agencies in jurisdictions where we and our affiliates invest or conduct business have maintained a focus on issues related to the taxation of businesses, including multinational entities.
In the United Kingdom, the UK Criminal Finances Act 2017 creates two new separate corporate criminal offences: failure to prevent facilitation of UK tax evasion and failure to prevent facilitation of overseas tax evasion. The scope of the new law and guidance is extremely wide and could have an impact on Ares’ global businesses. Liability can be mitigated where the relevant business has in place reasonable prevention procedures. Separately, the United Kingdom has implemented transparency legislation that will require many large businesses to publish their UK tax strategies on their websites. As part of the publication requirement, organizations must disclose information on tax risk management and governance, tax planning, tax risk appetite and their approach

to Her Majesty’s Revenue and Customs. These developments show that the United Kingdom is seeking to bring corporate tax matters further into the public domain. As a result, tax matters may pose an increased reputational risk to our business.
The OECD, which represents a coalition of member countries, has issued guidance through its BEPS project that contemplates changes to longstanding international tax norms that determine each country’s jurisdiction to tax cross-border international trade and profits. In June 2017, almost 70 countries (excluding the United States) formally signed the Convention. These changes in law or guidance and additional proposals for reform, if enacted by the United States or by other countries in which we or our affiliates invest or conduct business, could adversely affect our investment returns, including, for example, by eliminating certain tax treaty benefits and increasing our tax compliance costs. Whether these or other proposals will be enacted by the United States or any foreign jurisdiction and in what form is unknown, as are the ultimate consequences of any such proposed legislation.
We will be treated asare a corporation, for U.S. federal income tax purposes, whichand applicable taxes will reduce the amount available for distributionsdividends to holders of our Class A and non-voting common sharesstock in respect of such investments and could adversely affect the value of our Class A and non-voting common shareholders’stockholders’ investment.
Effective March 1, 2018,Because we have elected to beare taxed as a corporation for U.S. federal income tax purposes. Wepurposes, we could be liable for significantentity-level U.S. federal income taxes and applicable state and local income taxes that would not otherwise be incurred if we were treated as a partnership for U.S. federal income tax purposes, which could reduce the amount of cash available for distributionsdividends to holders of our Class A and non-voting common sharesstock and adversely affect the value of their investment.
In addition, the GP Mirror Units pay the same 7.00% rate per annum to us that we pay on our Series A Preferred Shares. Although income allocated in respect of distributions on the GP Mirror Units made to us is subject to tax, cash distributions to holders of Series A Preferred Shares will not be reduced on account of any income taxes owed by us.
Applicable U.S. and foreign tax law, regulations, or treaties, and changes in such tax laws, regulations or treaties or an adverse interpretation of these items by tax authorities could adversely affect our effective tax rate, tax liability, financial condition and results, ability to raise funds from certain foreign investors.investors, increase our compliance or withholding tax costs and conflict with our contractual obligations.
Overview of certain relevant U.S. tax laws. Tax laws, regulations or treaties newly enacted or enacted in the future may cause us to revalue our net deferred tax assets and have a material change to our effective tax rate and tax liabilities. Moreover, significant management judgment is involved applying tax laws, regulations and treaties to us and our funds such that tax authorities could challenge our interpretation, resulting in additional tax liability or adjustment to our income tax provision that could increase our effective tax rate. For example, on March 11, 2021, the American Rescue Plan Act of 2021 (Pub. L. No. 117-2) (the “ARPA”) was enacted. The ARPA added a new subsection to Section 162(m) of the Code to expand the disallowance for deduction of certain compensation paid by publicly held corporations to cover the next five most highly compensated employees for the taxable year, which expansion will be effective for tax years beginning after December 31, 2026. The expansion of Section 162(m) is expected to generally reduce the amount of tax deductions available to us. In addition, on August 16, 2022, the Inflation Reduction Act (Pub. L. No. 117-169) (the “IRA”) was signed into law. The IRA introduces a 15% minimum tax for corporations whose average annual adjusted financial statement income for any consecutive
93

Table of Contents
three-tax-year period preceding the tax year exceeds $1 billion and a 1% excise tax on the fair market value of stock repurchased by certain corporations after December 31, 2022. We do not currently expect that the IRA will have a material impact on our income tax liability for 2024. The impact on taxable years thereafter will depend on the facts and circumstances of such years.
Under Sections 1471 to 1474 of the Code (such Sections, along with the Treasury Regulations promulgated thereunder, “FATCA”), a broadly defined class of foreign financial institutions are required to comply with a U.S. tax reporting regime or be subject to certain U.S. withholding taxes. The reporting obligations imposed under FATCA require foreign financial institutions to enter into agreements with the IRS to obtain and disclose information about certain account holders and investors to the IRS (or in the case of certain foreign financial institutions that are resident in a jurisdiction that has entered into an intergovernmental agreement (the “IGA”) to implement this legislation, to comply with comparable non-U.S.foreign laws implementing the IGA). Additionally, certain non-U.S.foreign entities that are not foreign financial institutions are required to provide certain certifications or other information regarding their U.S. beneficial ownership or be subject to certain U.S. withholding taxes under FATCA. Failure to comply with these requirements could expose us and/or our investors to a 30% withholding tax on certain U.S. payments, (and beginning in 2019, a 30% withholding tax on gross proceeds from the sale of U.S. stocks and securities), and possibly limit our ability to open bank accounts and secure funding in the global capital markets. There are uncertainties regarding the implementation of FATCA and it is difficult to determine at this time what impact any future administrative guidance may have. The administrative and economic costs of compliance with FATCA may discourage some foreign investors from investing in U.S. funds, which could adversely affect our ability to raise funds from these investors or reduce the demand for shares of our shares.Class A common stock. Moreover, we expect to incur additional expenses related to our compliance with FATCA, which could increase our tax compliance costs generally. OtherAs discussed below, other countries, such as the UKU.K., Luxembourg, and the Cayman Islands, have implemented regimes similar to that of FATCA.FATCA, and a growing number of countries have adopted (or are in process of introducing) similar legislation designed to provide increased transparency about our investors and their tax planning and profile. One or more of these information exchange regimes are likely to apply to our funds, and we may be obligated to collect and share with applicable taxing authorities information concerning investors in our funds (including identifying information and amounts of certain income allocable or distributable to them).
Overview of certain relevant foreign tax laws. HM Treasury, the Organization for Economic Co-operation and Development (the “OECD”) and other government agencies in jurisdictions where we and our affiliates invest or conduct business have maintained a focus on issues related to the taxation of businesses, including multinational entities.
The U.K. has implemented two corporate criminal offenses: failure to prevent facilitation of U.K. tax evasion and failure to prevent facilitation of overseas tax evasion. Liability under these offences can be mitigated where the relevant business has in place reasonable prevention procedures. The scope of these offences is extremely wide and could have an impact on Ares’ global businesses. The U.K. has also implemented transparency legislation that requires many large businesses to publish their U.K. tax strategies and their approach to dealing with the U.K. tax authority on their websites. Our U.K. tax policy statement is published on our website. These developments show that the U.K. is seeking to bring tax matters further into the public domain. As a result, tax matters may pose an increased reputational risk to our business.
The EU, the U.K. and many other countries have implemented the OECD’s Common Reporting Standard for the automatic exchange of financial account information in tax matters (the “CRS”). EU Council Directive 2011/16/EU requires a mandatory automatic exchange of information regime on administrative co-operation in the field of taxation (as amended) (the “Directive on Administrative Co-Operation” or the “DAC”). The DAC, which effectively incorporates (among other items) the CRS into European law, like the CRS, requires governments to obtain detailed account information from financial institutions and exchange that information automatically with other jurisdictions annually. Neither the CRS nor the DAC imposes withholding taxes. EU Council Directive 2018/822 (“DAC 6”) amended the DAC to require ‘intermediaries’ (as defined in DAC 6) and, in some cases, taxpayers to disclose information to tax authorities about cross-border arrangements bearing specific hallmarks involving one or more EU member states. Certain cross-border arrangements are reportable to relevant taxing authorities. Similar reporting rules may apply or be introduced in other jurisdictions which implement the OECD mandatory disclosure rules (“OECD MDR”). With effect from December 31, 2020, the U.K. narrowed the scope of DAC 6 and the corresponding arrangements that need to be reported in the U.K. pursuant to DAC 6 (as implemented under U.K. law by the International Tax Enforcement (Disclosable Arrangements) Regulations 2020 (the “U.K. Regulations”)). The U.K. intends to transition from and replace the U.K. Regulations (as amended) with the OECD MDR during the first half of 2023. The EU has also signed separate automatic exchange of information agreements with certain non-EU countries, under which the EU and the relevant jurisdiction will automatically exchange information on the financial accounts of each other’s residents. Investors in our funds will be required: (i) to consent to the taking of any action in connection with FATCA, the CRS, the DAC (including DAC 6), the OECD MDR and/or any local law relating to, implementing or having similar effect to any of these regimes, including the disclosure of information to tax authorities which may in turn be exchanged between other tax authorities; and (ii) to agree to provide the AIFM and/or the general partner with the information they require to comply with FATCA, the CRS, the DAC (including DAC 6), the OECD MDR and/or any local law relating to, implementing or having similar effect to any of
94

these regimes in any relevant jurisdiction. The breadth of the disclosure requirements under such tax reporting regimes will likely create costs and administrative burdens and penalties and withholding taxes could be imposed for non-compliance.
Pursuant to the OECD’s Base Erosion and Profit Shifting (“BEPS”) Project, many individual jurisdictions have now introduced domestic legislation implementing certain of the BEPS actions. Several of the areas of tax law (including double taxation treaties) on which the BEPS Project focuses are relevant to the ability of our funds to efficiently realize income or capital gains and to efficiently repatriate income and capital gains from the jurisdictions in which they arise to partners and, depending on the extent to and manner in which relevant jurisdictions have implemented (or implement, as the case may be) changes in such areas of tax law (including double taxation treaties), the ability of our funds to do these things may be adversely impacted. Changes in tax laws as a result of the BEPS Project may, for example, result in: (i) the restriction or loss of existing access by partners in our funds or their subsidiaries to tax relief under applicable double taxation treaties or EU directives, such as the EU Interest and Royalties Directive; (ii) restrictions on permitted levels of deductibility of expenses (such as interest) for tax purposes; (iii) rules affecting profit allocation and local nexus requirements, transfer pricing, or the treatment of hybrid entities/investments; or (iv) an increased risk of activity undertaken in a jurisdiction constituting a permanent establishment of our funds and/or any of their subsidiaries.
Many of the jurisdictions in which our funds will make investments have now ratified, accepted and approved the OECD’s draft Multilateral Instrument (“MLI”) which brings into force a number relevant changes to double tax treaties within scope. The MLI is intended to facilitate the speedy introduction by participating states of double tax treaty-related BEPS recommendations. While these changes continue to be introduced, there remains significant uncertainty as to whether and, if so, to what extent our funds or their subsidiaries may benefit from the protections afforded by such treaties and whether our funds may look to their partners in order to derive tax treaty or other benefits. This position is likely to remain uncertain for a number of years.
In May 2017, the Council of the EU formally adopted the Council Directive amending Directive (EU) 2016/1164 as regards hybrid mismatches with third countries (commonly referred to as “ATAD II”), which came into force in member states on January 1, 2020 (subject to relevant derogations) and which contains a set of anti-hybrid rules.
ATAD II was implemented into Luxembourg domestic law by way of a law dated December 20, 2019. ATAD II covers inter alia hybrid mismatches and imported hybrid mismatches resulting from the different characterization of a financial instrument or an entity leading to situations of deduction without inclusion or double deduction. For hybrid mismatches resulting in a situation of deduction without inclusion, the primary rule is that the member state of the payor shall deny such deduction. For hybrid mismatches resulting in a situation of double deduction, a deduction shall only be given to the member state where the payment has its source. However, if, the jurisdiction of the payee does not deny the deduction, the secondary rule would oblige the jurisdiction of the payor to deny the deduction at the level of the payor.
If ATAD II anti-hybrid rules apply, they can act to deny (to a greater or lesser extent) deductibility in Luxembourg corporate entities of interest/expenses. However, these anti-hybrid rules only apply to arrangements: (i) between associated enterprises or (ii) that constitute “structured arrangements.” In the context of hybrid mismatches resulting from the different characterization of a financial instrument, an entity will need to hold a direct or indirect interest of 25% or more of the voting rights, capital interests or rights to share a profit to be considered an associated enterprise. The 25% requirement is replaced by a 50% requirement if the hybrid mismatch results from a different characterization of an entity (i.e., a hybrid entity). With respect to the computation of this 25% or 50% threshold requirement, ATAD II makes reference to the OECD concept of “persons acting together”, as it is specifically mentioned that for purposes of the anti-hybrid rules under ATAD II, “a person who acts together with another person in respect of the voting rights or capital ownership of an entity shall be treated as holding a participation in all of the voting rights or capital ownership of that entity that are held by the other person.” However, the Luxembourg law implementing ATAD II provides that an investor in an investment fund who holds directly or indirectly less than 10% of the interest in the investment fund and who is entitled to receive less than 10% of the fund’s profits is presumed not to act together with the other investors in the same investment fund (since the investors have in principle no effective control over the investments realized by the fund), unless proved otherwise (the de minimis rule). As a consequence of this rebuttable presumption, any investor holding less than 10% in an investment fund should not be regarded as an “associated enterprise” of the fund and of any underlying Luxembourg entities. Any investor holding more than 10% will only be regarded as an “associated enterprise” if it meets the requisite threshold in its own right, or it can be demonstrated that it is acting together with other investors, which would cause it to be deemed to reach the requisite threshold. Our funds have sought their own tax advice in relation to these proposed new rules and their potential impact on future investments.
The impacts of ATAD II on interest and other finance costs in the context of European investments are jurisdiction specific and will be examined on an investment-by-investment basis.
95

Further to the BEPS Project, and in particular BEPS Action 1 (“Addressing the Tax Challenges of the Digital Economy”), the OECD published a Report on May 31, 2019 entitled “Programme of Work to Develop a Consensus Solution to the Tax Challenges Arising from the Digitalisation of the Economy” (as updated on several occasions since and most recently on October 8, 2021 by the “Statement on a Two-Pillar Solution to Address the Tax Challenges Arising from the Digitalisation of the Economy”), which proposes fundamental changes to the international tax system. The proposals (commonly referred to as “BEPS 2.0”) are based on two “pillars”, involving the reallocation of taxing rights (“Amount A of Pillar One”), and a new global minimum corporate tax rate (“Pillar Two”). Under Amount A of Pillar One, multinational enterprises (“MNEs”) with total group revenues exceeding EUR 20 billion (or equivalent) in a given period and pre-tax profitability exceeding 10% calculated using an averaging mechanism will be subject to rules allocating 25% of profits in excess of a 10% profit margin to the jurisdictions within which they carry on business (subject to threshold rules). Certain entities are excluded, including certain investment funds and real estate investment vehicles (as respectively defined) which are the ultimate parent entity of the MNE group (and certain holding vehicles of such entities). There are also specific exclusions for MNEs carrying on specific low-risk activities, including “regulated financial services” (as defined). Pillar Two imposes a minimum effective tax rate of 15% on MNEs that have consolidated revenues of at least EUR 750 million in at least two out of the last four years (i.e., broadly those MNEs which are required to undertake country by country reporting). Pillar Two introduces two related tax measures (the “GloBE Rules”): the income inclusion rule (“IIR”) imposes a top up tax on a parent entity where a constituent member of the MNE group has low taxed income while the undertaxed payment rule (“UTPR”) applies as a backstop if the constituent member’s income is not taxed by an IIR. Specified classes of entities which are typically exempt from tax are outside the scope of the Pillar Two GloBE Rules, including investment funds and real estate investment vehicles (as respectively defined) which are the ultimate parent entity of the MNE group (and certain holding vehicles of such entities). Additionally, and part of Pillar Two but separate from the GloBE Rules, a subject to tax rule (“STTR”) will permit source jurisdictions to impose limited additional taxation on certain cross-border related party payments where the recipient is subject to a nominal corporate income tax rate (subject, in some circumstances, to certain adjustments) below 9%, which will be creditable against the GloBE Rules tax liability. The GloBE Rules must be implemented through domestic legislation, and on December 20, 2021 the OECD released Pillar Two model rules providing a template for this purpose. Many jurisdictions have begun that process, including EU member states pursuant to the EU minimum tax directive and the U.K., with a view to the IIR and the UTPR taking effect for fiscal years beginning on or after December 31, 2023 and December 31, 2024, respectively. Amount A of Pillar One will be implemented through a multilateral convention and the STTR will be implemented, where applicable, either through modifications to bilateral tax treaties or alternatively through a multilateral instrument. The timeline for implementation of both Amount A of Pillar One and the STTR remains uncertain. Subject to the development and implementation of both Amount A of Pillar One and Pillar Two (including the implementation of the EU minimum tax directive by EU member states) and the details of any domestic legislation, double taxation treaty amendments and multilateral agreements which are necessary to implement them, effective tax rates could increase within the fund structure or on its investments, including by way of higher levels of tax being imposed than is currently the case, possible denial of deductions or increased withholding taxes and/or profits being allocated differently and/or penalties could be due. This could adversely affect the returns of investors in our funds. The implementation of BEPS 2.0 in relevant jurisdictions is complex and likely to remain uncertain for a number of years.
On December 22, 2021, the European Commission issued a proposal for a Council Directive laying down rules to prevent the misuse of shell entities for tax purposes within the EU (the “Unshell Proposal”). Whilst the European Commission initially expected the Unshell Proposal to be adopted and published into EU member states’ national laws by June 30, 2023, and to come into effect as of January 1, 2024, the proposal has not yet been adopted and there is considerable uncertainty surrounding the development of the proposal and its implementation. If adopted in its current form, the proposal could result in additional reporting and disclosure obligations for funds and/or their subsidiaries (which may require the sharing with applicable taxing or other governmental authorities of information concerning investors) and/or additional tax being suffered by investors, funds or their subsidiaries.
Effective April 1, 2022, the U.K. implemented a domestic ‘Qualifying Asset Holding Company’ regime, with a view to broadly making the U.K. a more attractive holding company jurisdiction. The extent to which this regime may be applicable or beneficial to and/or utilized by our funds (or their subsidiaries) remains under consideration.

Certain U.S. holders of sharesstockholders are subject to additional tax on net investment income.
U.S. holders of sharesstockholders that are individuals, estates or trusts are subject to a surtax of 3.8% on “net investment income” (or undistributed “net investment income,” in the case of estates and trusts) for each taxable year, with such tax applying to the lesser of such income or the excess of such person’s adjusted gross income (with certain adjustments) over a specified amount. Net investment income includes net incomeearnings from dividends and net gain attributable to the disposition of investment property. It is
96

Table of Contents
anticipated that dividends and net gain attributable to an investment in shares of our sharesClass A common stock will be included in a U.S. holder’s “net investment income” subject to this surtax.
Limitations on the amount of interest expense that we may deduct could materially increase our tax liability and negatively affect an investment in shares of our shares.Class A common stock.
For taxable years beginning after December 31, 2017, ourOur deduction of net business interest expenses for each taxable year is limited generally to 30% of our “adjusted taxable income,” which is an amount that is similar to EBITDAincome” for the relevant taxable years beginning before January 1, 2022, and similar to earnings before interest and taxes (“EBIT”) for taxable years beginning after

January 1, 2022.year. Any excess business interest not allowed as a deduction in a taxable year as a result of the limitation generally will carry forward to the next year.
There is no grandfather provision for outstanding debt prior to the effective date of these rules. Any failure to properly manage or address the foregoing risks may have a material adverse effect on our business, results and financial condition.
General Risk Factors
Cybersecurity failures and data security incidents could adversely affect our business by causing a disruption to our operations, a compromise or corruption of our confidential, personal or other sensitive information and/or damage to our business relationships or reputation, any of which could negatively impact our business, financial condition and operating results.
The efficient operation of our business is dependent on computer hardware and software systems, as well as data processing systems and the secure processing, storage and transmission of information, all of which are potentially vulnerable to security breaches and cyber-attacks or other security breaches, which may include intentional attacks or accidental losses, either of which may result in unauthorized access to, or corruption of, our hardware, software, or data processing systems, or to our confidential, personal, or other sensitive information. In addition, we and our employees may be the target of fraudulent emails or other targeted attempts to gain unauthorized access to confidential, personal, or other sensitive information. The result of any cyber-attack or other security incidents may include disrupted operations, misstated or unreliable financial data, fraudulent transfers or requests for transfers of money, liability for stolen assets or information (including personal information), fines or penalties, investigations, increased cybersecurity protection and insurance costs, litigation, or damage to our business relationships and reputation, in each case, causing our business and results of operations to suffer. The rapid evolution and increasing prevalence of artificial intelligence technologies may also increase our cybersecurity risks.
Although we are not currently aware of any cyber-attacks or other incidents that, individually or in the aggregate, have materially affected, or would reasonably be expected to materially affect, our operations or financial condition, there has been an increase in the frequency and sophistication of the cyber and security threats that we face, with attacks ranging from those common to businesses generally to more advanced and persistent attacks. Cyber-attacks and other security threats could originate from a wide variety of sources, including cyber criminals, nation state hackers, hacktivists and other outside or inside parties. We, or our third-party providers, may face a heightened risk of a security breach or disruption with respect to confidential, personal or other sensitive information resulting from an attack by foreign governments or cyber terrorists. We may be a target for attacks because, as an alternative asset management firm, we hold confidential and other sensitive information, including price information about existing and potential investments. Further, we are dependent on third-party service providers for hosting hardware, software and data processing systems that we do not control. We also rely on third-party service providers for certain aspects of our businesses, including for certain information systems, technology and administration of our funds and compliance matters. While we perform risk assessments on our third-party providers, our reliance on them and their potential reliance on other third-party service providers removes certain cybersecurity functions from outside of our immediate control, and cyber-attacks on our third-party service providers could adversely affect us, our business and our reputation. The costs related to cyber-attacks or other security threats or disruptions may not be fully insured or indemnified by others, including by our third-party service providers.
As our reliance on computer hardware and software systems, data processing systems, and other technology has increased, so have the risks posed to such systems, both those we control and those provided by our third-party service providers. Cyber-attacks may originate from a wide variety of sources, and while we have implemented processes, procedures and internal controls designed to mitigate cybersecurity risks and cyber-attacks, these measures do not guarantee that a cyber-attack will not occur or that our financial results, operations or confidential information, personal or other sensitive information will not be negatively impacted by such an incident, especially because the techniques of threat actors change frequently and are often not recognized until launched. We rely on industry accepted security measures and technology to securely maintain confidential and proprietary information maintained on our information systems, as well as our policies and procedures to protect against the unauthorized or unlawful disclosure of confidential, personal or other sensitive information. Although we take protective measures and endeavors to strengthen our computer systems, software, technology assets and networks to prevent and address potential cyber-attacks, there can be no assurance that any of these measures prove effective. We expect to
97

Table of Contents
be required to devote increasing levels of funding and resources to comply with evolving cybersecurity and privacy laws and regulations and to continually monitor and enhance our cybersecurity procedures and controls.
Cybersecurity risks are exacerbated by the rapidly increasing volume of highly sensitive data, including our proprietary business information and intellectual property, personal information of our employees, our investors and others and other sensitive information that we collect, process and store in our data centers and on our networks or those of our third-party service providers. The secure processing, maintenance and transmission of this information are critical to our operations. A significant actual or potential theft, loss, corruption, exposure, fraudulent use or misuse of investor, employee or other personal information, proprietary business data or other sensitive information, whether by third parties or as a result of employee malfeasance or otherwise, non-compliance with our contractual or other legal obligations regarding such data or intellectual property or a violation of our privacy and security policies with respect to such data could result in significant investigation, remediation and other costs, fines, penalties, litigation or regulatory actions against us and significant reputational harm, any of which could harm our business and results of operations.
Our funds’ portfolio companies also rely on similar systems and face similar risks. A disruption or compromise of these systems could have a material adverse effect on the value of these businesses. Our funds may invest in strategic assets having a national or regional profile or in infrastructure assets, the nature of which could expose them to a greater risk of being subject to a terrorist attack or cyber-attack than other assets or businesses. Such an event may have material adverse consequences on our investment or assets of the same type or may require applicable portfolio companies to increase preventative security measures or expand insurance coverage.
In addition, we operate in businesses that are highly dependent on information systems and technology. The costs related to cyber or other security threats or disruptions may not be fully insured or indemnified by other means. Cybersecurity has become a priority for regulators in the U.S. and around the world. In the latter half of 2021, the SEC brought three charges, sanctioning eight companies, all of which were registered as broker dealers, investment advisory firms or both, for deficient cybersecurity policies and procedures, and settled charges in two separate actions against public companies for deficient disclosure controls and procedures violations related to a cybersecurity vulnerability that exposed sensitive customer information. In 2023, the SEC charged a broker-dealer for allegedly making materially false and misleading statements and omissions regarding its efforts for preventing misuse of sensitive customer information. The SEC has also proposed new rules related to cybersecurity risk management for registered investment advisers, and registered investment companies and business development companies (funds), as well as amendments to certain rules that govern investment adviser and fund disclosures. In July 2023, the SEC also adopted rules requiring public companies to disclose material cybersecurity incidents on Form 8-K and periodic disclosure of a registrant’s cybersecurity risk management, strategy, and governance in annual reports. The rules became effective beginning with annual reports for fiscal years ending on or after December 15, 2023 and beginning with Form 8-Ks on December 18, 2023. With the SEC particularly focused on cybersecurity, we expect increased scrutiny of our policies and systems designed to manage our cybersecurity risks and our related disclosures. We also expect to face increased costs to comply with the new SEC rules, including increased costs for cybersecurity training and management. Many jurisdictions in which we operate have laws and regulations relating to data privacy, cybersecurity and protection of personal information, including, the CCPA, the New York SHIELD Act, the GDPR and the U.K. GDPR. In addition, the SEC has indicated in recent periods that one of its examination priorities for the Office of Compliance Inspections and Examinations is to continue to examine cybersecurity procedures and controls, including testing the implementation of these procedures and controls.
There may be substantial financial penalties or fines for breach of privacy laws (which may include insufficient security for our personal or other sensitive information). For example, the maximum penalty for breach of the GDPR is the greater of 20 million Euros and 4% of group annual worldwide turnover, and fines for each violation of the CCPA are $2,500, or $7,500 per violation for intentional violations. Non-compliance with any applicable privacy or data security laws represents a serious risk to our business. Some jurisdictions have also enacted laws requiring companies to notify individuals of data security breaches involving certain types of personal information. Breaches in security could potentially jeopardize our, our employees’ or our fund investors’ or counterparties’ confidential or other information processed and stored in, or transmitted through, our computer systems and networks (or those of our third-party service providers), or otherwise cause interruptions or malfunctions in our, our employees’, our fund investors’, our counterparties’ or third parties’ operations, which could result in significant losses, increased costs, disruption of our business, liability to our fund investors and other counterparties, fines or penalties, litigation, regulatory intervention or reputational damage, which could also lead to loss of investors or clients.
We may be subject to litigation risks and may face liabilities and damage to our professional reputation.
In recent years, the volume of claims and amount of damages claimed in litigation and regulatory proceedings against investment managers have been increasing. We make investment decisions on behalf of investors in our funds that could result in substantial losses. This may subject us to the risk of legal liabilities or actions alleging misconduct, breach of fiduciary duty or breach of contract. Further, we may be subject to third-party litigation arising from allegations that we improperly exercised
98

Table of Contents
control or influence over portfolio investments. In addition, we and our affiliates that are the investment managers and general partners of our funds, our funds themselves and those of our employees who are our, our subsidiaries’ or the funds’ officers and directors are each exposed to the risks of litigation specific to the funds’ investment activities and portfolio companies and, in the case where our funds own controlling interests in public companies, to the risk of shareholder litigation by the public companies’ other shareholders. Moreover, we are exposed to risks of litigation or investigation by investors or regulators relating to our having engaged, or our funds having engaged, in transactions that presented conflicts of interest that were not properly addressed.
We and our funds and their investment advisers are more generally subject to extensive regulation, which, from time to time, results in requests for information from us or our funds and their investment advisers or regulatory proceedings or investigations against us or our funds and their investment advisers, respectively. We may incur significant costs and expenses in connection with any such information requests, proceedings or investigations. Such investigations have previously and may in the future result in penalties and other sanctions. Regulatory actions and initiatives, including by the SEC, can have an adverse effect on our financial results, including as a result of the imposition of a sanction, a limitation on our or our personnel’s activities, or changing our historic practices. Even if an investigation or proceeding did not result in a sanction, or the sanction imposed against us or our personnel by a regulator were small in monetary amount, the adverse publicity relating to the investigation, proceeding or imposition of these sanctions could harm our reputation.
Legal liability could have a material adverse effect on our businesses, financial condition or results of operations or cause reputational harm to us, which could harm our businesses. We depend, to a large extent, on our business relationships and our reputation for integrity and high-caliber professional service offerings to attract and retain investors and to pursue investment opportunities for our funds. As a result, allegations of improper conduct asserted by private litigants or regulators, regardless of whether the ultimate outcome is favorable or unfavorable to us, as well as negative publicity and press speculation about us, our investment activities or the investment industry in general, whether valid or not, may harm our reputation, which may be damaging to our businesses.
In addition, the laws and regulations governing the limited liability of such issuers and portfolio companies vary from jurisdiction to jurisdiction, and in certain contexts, the laws of certain jurisdictions may provide not only for carve-outs from limited liability protection for the issuer or portfolio company that has incurred the liabilities, but also for recourse to assets of other entities under common control with, or that are part of the same economic group as such issuer.
We may not be able to maintain sufficient insurance to cover us for potential litigation or other risks.
We may not be able to obtain or maintain sufficient insurance on commercially reasonable terms or with adequate coverage levels against potential liabilities we may face in connection with potential claims, which could have a material adverse effect on our business. We may face a risk of loss from a variety of claims, including related to securities, antitrust, contracts, cybersecurity, fraud and various other potential claims, whether or not such claims are valid. Insurance and other safeguards might only partially reimburse us for our losses, if at all, and if a claim is successful and exceeds or is not covered by our insurance policies, we may be required to pay a substantial amount in respect of such claim. Certain losses of a catastrophic nature, such as losses arising as a result of wars, earthquakes, typhoons, terrorist attacks or other similar events, may be uninsurable or may only be insurable at rates that are so high that maintaining coverage would cause an adverse impact on our business, our funds and their portfolio companies. In general, losses related to terrorism are becoming harder and more expensive to insure against. Some insurers are excluding terrorism coverage from their all-risk policies. In some cases, insurers are offering significantly limited coverage against terrorist acts for additional premiums, which can greatly increase the total cost of casualty insurance for a property. As a result, we, our funds and their portfolio companies may not be insured against terrorism or certain other catastrophic losses.
Events which harm our reputation or brand may impact our ability to attract and retain investors and raise new capital.

As fiduciaries and stewards of our client’s capital, we value and depend on the trust they place in us. Reputation is a significant change from prior law,factor that increases our competitive risk. See “—Risks Related to Our Businesses—The investment management business is intensely competitive.” Increased regulatory scrutiny, actions or fines, litigation, employee misconduct, failures or perceived failures to appropriately mitigate and manage ESG incidents, conflicts of interest, data breaches and management of tax disputes, could among other events, harm our reputation and thus our ability to attract and retain investors and raise new capital for our funds, adversely affecting our business. While we have a robust compliance program in place and have successfully instituted a culture of compliance through our policies and procedures aimed to mitigate potential risks and enhanced regulatory action, we may be subject to new and heighted enforcement activity resulting in public sanctions or fines which could increaseadversely impact our tax liability.reputation. See “—Risks Related to Regulation.” Similarly, to the extent we experience material litigation, employee turnover or employee misconduct, our businesses and our reputation could be adversely affected, and a loss of investor confidence could result, which could adversely impact our ability to raise future funds. Our ability to

99

Table of Contents

appropriately mitigate, manage and address conflicts of interests among our stakeholders could also result in increased reputational risk. Further, the impact of events which may harm our reputation and brand are heightened given media and public focus on the externalities of activities unrelated to our business, the pervasiveness of social media and public interest in the financial services and alternative investment management industry generally. The increasing prevalence of artificial intelligence may lead to faster and wider dissemination of any adverse publicity or inaccurate information about us, making effective remediation more difficult and further magnifying the reputational risks associated with negative publicity.


Item 1B.  Unresolved Staff Comments
None.


Item 1C.  Cybersecurity
Assessment, Identification and Management of Material Risks from Cybersecurity

Our cybersecurity strategy prioritizes the detection and analysis of, and response to, known, anticipated or unexpected threats, effective management of security risks and resilience against cyber incidents. Our enterprise-wide cybersecurity program is aligned to the National Institute of Standards and Technology Cybersecurity Framework. Our cybersecurity risk management processes include technical security controls, policy enforcement mechanisms, monitoring systems, tools and related services, which include tools and services from third-party providers, and management oversight to assess, identify and manage risks from cybersecurity threats. We have implemented and continue to implement risk-based controls designed to prevent, detect and respond to information security threats and protect our information, our information systems, and the information of our investors, employees and other third parties who entrust us with their sensitive information.

Our cybersecurity program includes physical, administrative and technical safeguards, and we maintain plans and procedures designed to help us prevent and timely and effectively respond to cybersecurity threats and incidents. Through our cybersecurity risk management process, we seek to monitor cybersecurity vulnerabilities and potential attack vectors, evaluate the potential operational and financial effects of any threat and mitigate such threats. The assessment of cybersecurity risks is integrated into our Enterprise Risk Management program, which is overseen by our Enterprise Risk Committee (the “ERC”), as discussed below. In addition, we periodically engage third-party consultants and engage with key vendors to assist us in assessing, enhancing, implementing, and monitoring our cybersecurity risk management programs and responding to incidents.

Our cybersecurity risk management and awareness programs include periodic identification and testing of vulnerabilities, regular phishing simulations and annual general cybersecurity awareness and data protection training. We also have annual certification requirements for employees with respect to certain policies supporting the cybersecurity program including information security and electronic communications, data protection and privacy. We undertake periodic internal security reviews of our information systems and related controls, including systems affecting personal data and the cybersecurity risks of our critical third-party service providers and other partners. We also complete periodic external reviews of our cybersecurity program and practices, which include assessments of our data protection practices and targeted attack simulations.

In the event of a cybersecurity incident, we have developed an incident response plan that provides guidelines for responding to an incident and facilitates coordination across multiple operational functions.The incident response plan includes notification to the applicable members of cybersecurity leadership, including the Chief Information Security Officer (“CISO”), and, as appropriate, escalation to the full ERC and/or an internal ad-hoc group of senior employees, tasked with helping to manage the cybersecurity incident. Depending on their nature, incidents may also be reported to our audit committee of the board of directors and to our full board of directors, if appropriate.

Material Impact of Cybersecurity Risks

In the last three fiscal years, we have not experienced a material information security breach incident and the expenses we have incurred from information security breach incidents have been immaterial, and we are not aware of any cybersecurity risks that are reasonably likely to materially affect our business. However, future incidents could have a material impact on our business strategy, results of operations, or financial condition. For additional discussion of the risks posed by cybersecurity threats, see “Item 1A. Risk Factors—General Risk Factors—Cybersecurity failures and data security incidents could adversely affect our business by causing a disruption to our operations, a compromise or corruption of our confidential, personal or other sensitive information and/or damage to our business relationships or reputation, any of which could negatively impact our business, financial condition and operating results.”
100

Table of Contents

Oversight of Cybersecurity Risks

Our cybersecurity program is managed by a dedicated internal cybersecurity team, which is responsible for enterprise-wide cybersecurity strategy, policies, standards, engineering, architecture and processes. The team is led by our CISO who has a Master’s degree in Cybersecurity from Brown University and over 25 years of experience advising on, and managing risks from cybersecurity threats as well as developing and implementing cybersecurity policies and procedures. The CISO is also a member of the ERC. The ERC is a cross-functional committee that governs and oversees our Enterprise Risk Program, including cybersecurity. The ERC includes our Chief Executive Officer, Chief Financial Officer, General Counsel, Global Chief Compliance Officer, Chief Information Officer, CISO, and Head of Enterprise Risk, who acts as chairperson of the ERC. The ERC, through regular consultation with the internal cybersecurity team, assesses, discusses, and prioritizes our approach to high-level risks, mitigating controls, and ongoing cybersecurity efforts.

The audit committee has primary responsibility for oversight and review of guidelines and policies with respect to risk assessment and risk management, including cybersecurity. Certain members of the ERC periodically report to our audit committee as well as the full board of directors, as appropriate, on cybersecurity matters, primarily through presentations by the CISO and the Head of Enterprise Risk. Such reporting includes updates on our cybersecurity program, the external threat environment, and our programs to address and mitigate the risks associated with the evolving cybersecurity threat environment. These reports also include updates on our preparedness, prevention, detection, responsiveness, and recovery with respect to cyber incidents.

Item 2.  Properties
Our principal executive offices are located in leased office space at 2000 Avenue of the Stars, 12th Floor, Los Angeles, California. We also lease office space in Culver City, Atlanta, Chicago, Dallas, New York, City, Washington, D.C., St. Louis, Dubai, Frankfurt, London Luxembourg, Paris, Stockholm, Chengdu, Hong Kong, Shanghai, Sydney, Sausalito, Needham, Tarrytown, and Williamsville.other cities around the world. We do not own any real property. We consider these facilities to be suitable and adequate for the management and operation of our businesses.


Item 3. Legal Proceedings
From time to time, we, our executive officers, directors and our funds and their investment advisers, and their respective affiliates and/or any of their respective principals and employees are involved in varioussubject to legal proceedings lawsuitsin the ordinary course of business, including those arising from our management of such funds, and claims incidentalmay, as a result, incur significant costs and expenses in connection with such legal proceedings. Legal proceedings may increase to the conductextent we find it necessary to foreclose or otherwise enforce remedies with respect to loans that are in default, which borrowers may seek to resist by asserting counterclaims and defenses against us. As of December 31, 2023, we were not subject to any material pending legal proceedings.

We and our business, some of which may be material. Our businessesfunds and their investment advisers are also subject to extensive regulation, which, may resultfrom time to time, results in requests for information from us or our funds and their investment advisers or regulatory proceedings or investigations against us.us or our funds and their investment advisers, respectively. We may incur significant costs and expenses in connection with any such information requests, proceedings or investigations.


Item 4.  Mine Safety Disclosures
None.Not applicable.


101

Table of Contents
PART II.

Item 5. Market Forfor Registrant’s Common Equity, Related Stockholder Matters Andand Issuer Purchases Ofof Equity Securities
Market Information
Our Class A common shares representing limited partner interests in Ares Management, L.P. arestock is traded on the NYSE under the symbol “ARES.” Our common shares began trading on the NYSE on May 2, 2014. As a result of changing the name of our common units and preferred units to common shares and preferred shares, respectively, effective March 2, 2018 our common shares and preferred shares will officially trade with such revised names on the NYSE under our existing symbols.
The following table sets forth the high and low intra‑day sales prices per share of our common shares, for the periods indicated, as reported by the NYSE.
 Sales Price
 2017 2016
 High Low High Low
First Quarter$23.25
 $17.15
 $15.50
 $10.76
Second Quarter$19.80
 $17.25
 $15.96
 $12.08
Third Quarter$18.85
 $17.40
 $19.54
 $13.81
Fourth Quarter$20.00
 $18.00
 $19.20
 $14.75

The number of holders of record of our Class A common sharesstock as of February 15, 201820, 2024 was 2. This19, which does not include the number of sharesholdersshareholders that hold shares in “street name” through banks or broker-dealers. Ares Management GP LLC is the sole holder of shares of our Class B common stock and Ares Voting LLC is the sole holder of shares of our Class C common stock.
Stock Performance Graph
The table below presents purchases made byfollowing graph depicts the total return to holders of our Class A common stock from the closing price on December 31, 2018 through December 31, 2023, relative to the performance of the S&P 500 Index and the Dow Jones U.S. Asset Managers Index. The graph assumes $100 invested on December 31, 2018 and dividends received reinvested in the security or on behalfindex.
The performance graph is not intended to be indicative of Ares Management, L.P.future performance. The performance graph shall not be deemed “soliciting material” or any “affiliated purchaser” (as defined in Rule 10b-18(a)(3) underto be “filed” with the SEC for purposes of Section 18 of the Exchange Act) of our common shares during each ofAct, or otherwise subject to the indicated periods. 
PeriodTotal Number of Common Shares Purchased(1)Average Price Paid Per Common SharesTotal Number of Common Shares Purchased as Part of Publicly Announced Plans or ProgramsMaximum Number of Common Shares That May Yet Be Purchased Under the Plan or Program
October 1 to October 31, 2017
$


November 1 to November 30, 2017
$


December 1 to December 31, 2017
$


On March 2, 2017, AREC Holdings Ltd., a wholly owned subsidiary of Abu Dhabi Investment Authority (“ADIA” or “the selling shareholder”) sold 7,500,000 sharesliabilities under that Section, and shall not be deemed to be incorporated by reference into any of the Company’s common shares through a public secondary offering. The Company did not receive anyfilings under the Securities Act or the Exchange Act.
Total Return Performance Table

549755830563
102

Table of the proceeds from the offering. The Company incurred approximately $0.7 millionContents

Issuer Purchases of expenses related to the secondary offering transaction. The fees related to the secondary offering were non-operating expenses and are included in other income, net in the Consolidated Statements of Operations. The selling shareholder paid the underwriting discounts and commissions and/or similar charges incurred for the sale of the common shares.Equity Securities


DistributionNone.
Dividend Policy for Preferred EquityClass A and Non-Voting Common Stock
As of December 31, 2017 and 2016, the Company had 12,400,000 shares of Series A Preferred Equity (the “Preferred Equity”) outstanding. When, as and if
During 2022, we declared by the Company’s board of directors, distributions on the Preferred Equity are paid quarterly at a rate per annum equal to 7.00%. During 2017 and 2016, we paid quarterly distributions of approximately $21.7 million and $12.2 million, respectively, to our preferred equity holders of record, and in February 2018, the board of directors of

our general partner declared quarterly distribution of $5.4 million in respect of the fourthdividend each quarter of 2017 payable on March 31, 2018 $0.61 (totaling $2.44 annually) per share to holders of record of preferred equity at the close of business on March 15, 2018.

Distribution Policy for Common Shares Prior to Effectiveness of Tax Election
During 2016, we paid quarterly distributions of $0.20, $0.28, $0.15Class A common stockholders and $0.20 pernon-voting common share (totaling $0.83 per common share) to record holders of common shares,stockholders, or approximately $67.0$429.1 million. During 2017,2023, we paid quarterly distributions of $0.28, $0.13, $0.31 and $0.41 per common share (totaling $1.13 per common share) to record holders of common shares, or approximately $92.6 million, and in February 2018, the board of directors of our general partner declared an additional distribution of $0.40 per common share, or approximately $33.1 million, inclusive of $0.25 per common share for the fourth of 2017 and $0.15 per common share for the first two months of the firsta dividend each quarter of 2018, payable on February 28, 2018$0.77 (totaling $3.08 annually) per share to Class A and non-voting common shareholders of recordstockholders at the close of business on March 17, 2023, June 16, 2023, September 15, 2023, and December 15, 2023, respectively, or approximately $571.9 million.

In February 26, 2018.

We distributed to our common shareholders on2024, the Company’s board of directors declared a quarterly basis substantially alldividend of Ares Management, L.P.’s$0.93 per share of distributable earnings, netClass A and non-voting common stock with respect to the first quarter of any applicable corporate taxes2024 payable on March 29, 2024 to common stockholders of record at the close of business on March 15, 2024.
Our dividend policy for our Class A and amounts payable under the tax receivable agreement, in excess of amounts determined by our general partner to be necessary or appropriate to provide for the conduct of our businesses, to make appropriate investments in our businesses and our funds, to comply with applicable law, any of our debt instruments and preferred shares or other agreements or to provide for future distributions to ournon-voting common shareholders for any ensuing quarter, subject to a base quarterly distribution target range of 80% to 90% of distributable earnings. See “Item 7. Management’s Discussion and Analysis of Financial Condition and Results of Operations-Segment Analysis-Reconciliation of Certain Non‑GAAP Measures to Consolidated GAAP Financial Measures” for a reconciliation of our distributable earnings to our income before taxes presented in accordance with GAAP.
In most years, the aggregate amounts of distributions to our preferred and common shareholders did not equal our distributable earnings for that year. Our distributable earnings were only a starting point for the determination of the amount to be distributed to our common shareholders because, as noted above, in determining the amount to be distributed, we subtracted from our distributable earnings any amounts determined by our general partner to be necessary or appropriate to provide for the conduct of our businesses, to make appropriate investments in our businesses and our funds, to comply with applicable law, any of our debt instruments or other agreements or to provide for future distributions to our preferred and common shareholders for any ensuing quarter.
Distribution Policy for Common Shares Following Effectiveness of Tax Election
In conjunction with the Tax Election, we have adopted a distribution policy that will reduce volatility of the quarterly distributions and becomestock is more closely aligned with our core management fee business. We intend to provide a steadyfixed quarterly dividend for each calendar year that will be based on our after-taxexpected fee related earnings after an allocation of current taxes paid, with future potential changes based on the level and growth of the metric. Subject to the approval of our after-tax fee related earnings. For March 2018, the first month that we are taxed as a corporation, we declared a distributionboard of $0.0933 per common share, reflecting one-third of a full quarter $0.28 per share distribution. Starting in the second quarter of 2018,directors, we intend to pay a $0.28dividend of $0.93 per share of our Class A and non-voting common share distributionstock per quarter for the remainder of 2018. For distributions made following the effective date of March 1, 2018, investors will now receive income reported on a Form 1099-DIV instead of a Schedule K-1.in 2024.

Our fixed distributiondividend will be reassessed each year based upon the level and growth of our after-tax fee related earnings. earnings after an allocation of current taxes paid. As fee related earnings reflect the core earnings of our business and consistsconsist of management feesfee and fee related performance revenues less compensation and general and administrative expenses, having our recurring distributiondividend based on this amount removes volatility from our distributiondividend and enablesprovides more predictability to investors to receive what we believe ison an attractive after-tax qualifying distribution yield.annual basis
As we have historically distributed to our common shareholders substantially all of our distributable earnings, we have not retained earnings for future growth.
Our new distributiondividend policy reflects our intention to retain net performance fees.income, which excludes our fee related performance revenues. We expect to use such retained earnings for potential share repurchases and to fund future growth with the objective of accelerating our fee related earnings growth per share.share, as well as for potential stock repurchases. However, the declaration, payment and determination of the amount of future distributions,dividends, if any, is at the sole discretion of theour board of directors of our general partner, which may change our distributiondividend policy at any time.
Under the Delaware Limited Partnership Act, Ares Management, L.P. may not make a distribution
The payment of cash dividends is subject to a partner if after the distribution, all of our liabilities, other than liabilities to partners on account of their partnership interests and liabilities for which the recourse of creditors is limited to specific property of the partnership, would exceed the fair value of our assets. If we were to make such an impermissible distribution, any limited partner who received a distribution and knew at the time of the distribution that the distribution was in violation of the Delaware Limited Partnership Act would be liable to us for the amount of

the distribution for three years from the date of such distribution.compliance with DGCL. In addition, under the Credit Facility, certain subsidiaries of the Ares Operating Group are prohibited from making distributionspaying dividends in certain circumstances, including if an Event of Default (as defined in the Credit Facility) has occurred and is continuing.

Because Ares Management, L.P.AMC is a holding company and has no material assets other than its indirect ownership of Ares Operating GroupAOG Units, we fund distributionsdividends by Ares Management, L.P.AMC on theshares of our Class A and non-voting common shares,stock, if any, in three steps:
first, we cause the Ares Operating GroupAOG entities to make distributions to their partners, including Ares Management, L.P.AMC and its direct subsidiaries. If the Ares Operating GroupAOG entities make such distributions, the partners of the Ares Operating GroupAOG entities will be entitled to receive equivalent distributions pro rata based on their partnership units in the Ares Operating Group (except as set forth in the following paragraph);


second, we cause Ares Management, L.P.’sAMC’s direct subsidiaries to distribute to Ares Management, L.P.AMC their share of such distributions, net of any taxes and amounts payable under the tax receivable agreement by such direct subsidiaries; and


third, Ares Management, L.P. distributesAMC pays such distributions to our holders of our Class A and non-voting common equityholders,stock, net of any taxes and amounts payable under the tax receivable agreement, on a pro rata basis.


Because we and our direct subsidiaries that are corporations for U.S. federal income tax purposes may be required to pay corporate income and franchise taxes and make payments under the tax receivable agreement, the dividend amounts ultimately distributedpaid by us to holders of our Class A and non-voting common shareholdersstock are expected to be generally less, on a per share basis, than the amounts distributed by the Ares Operating GroupAOG entities to their respective partners in respect of their Ares Operating GroupAOG Units.

In addition, governing agreements of the Ares Operating GroupAOG entities provide for cash distributions, which we refer to as “tax distributions,” to the partners of such entities if the general partners of the Ares Operating GroupAOG entities determine that the taxable income of the relevant Ares Operating Group entityAOG entities gives rise to taxable income for its partners. Generally, these tax distributions are computed based on our
103

Table of Contents
estimate of the net taxable income of the relevant entity multiplied by an assumed tax rate equal to the highest effective marginal combined U.S. federal, state and local income tax rate prescribed for an individual or corporate resident in Los Angeles, California or New York, New York, whichever is higher (taking into account the non‑deductibilitynon-deductibility of certain expenses and the character of our income). The Ares Operating Group makes tax distributions only if and to the extent distributions from such entities for the relevant year were otherwise insufficient to cover such tax liabilities.
In addition, the cash flow from operations of the Ares Operating Group entities may be insufficient to enable them to make required minimum tax distributions to their partners, in which case the Ares Operating Group may have to borrow funds or sell assets, which could have a material adverse effect on our liquidity and financial condition. Furthermore, by paying cash distributions rather than investing that cash in our businesses, we might risk slowing the pace of our growth, or not having a sufficient amount of cash to fund our operations, new investments or unanticipated capital expenditures, should the need arise.
Although a portion of any distributions by us to our common shareholders may include carried interest received by us, we do not intend to seek fulfillment of any contingent repayment obligation by seeking to have our common shareholders return any portion of such distributions attributable to carried interest associated with any contingent repayment obligation.
We expect any distributions madedividends paid out of current or accumulated earnings and profits to U.S. individuals and certain other qualifying shareholdersholders of our Class A and non-voting common stock to constitute “qualified dividend” income that is generally taxed at a more favorable lower tax rate than the ordinary income tax rate, if the requisite holding periods have been met. If the distributiondividend exceeds current and accumulated earnings and profits, the excess is treated as a nontaxable return of capital, reducing the shareholder’sstockholder’s tax basis in its shares to the extent of such shareholder’s tax basis in such shares. Any remaining excess is treated as capital gain. Because entities treated asU.S. corporations for U.S. federal income tax purposes are taxed on their own taxable income, and because owners of such entities are taxed on any dividends distributedpaid from such entities, there are two levels of potential tax upon income earned by such entities.

Unregistered Sales of Equity Securities and Purchases of Equity Securities
None.


Item 6. Selected Financial Data[Reserved]
The following tables present selected consolidated financial information and other data of the Company and its Predecessor. The Company was formed on November 15, 2013 to serve as a holding partnership for our businesses. See “Item 1. Business—Organizational Structure.”
We derived the following selected consolidated financial data of the Company as of December 31, 2017 and 2016 and for the years ended December 31, 2017, 2016 and 2015 from the audited consolidated financial statements included elsewhere in this Annual Report on Form 10‑K. The selected consolidated financial data of the Company as of and for the year ended 2014 was derived from the audited consolidated financial statements of the Company, which are not included in this Annual Report on Form 10-K. The selected consolidated financial data as of and for the year ended December 31, 2013 was derived from the audited consolidated financial statements of the Predecessor, which are not included in this Annual Report on Form 10-K. The consolidated financial statements were prepared on substantially the same basis as the audited consolidated financial statements and include all adjustments that we consider necessary for a fair presentation of the Predecessor’s consolidated financial position and results of operations. The selected historical financial data is not indicative of the expected future operating results of the Company.
For the period ended December 31, 2013, non-controlling interests in Ares Operating Group entities represent equity interests and net income attributable to various minority non-control oriented strategic investment partners, including the Predecessor’s historical results. The net income attributable to controlling interests in the Predecessor, from January 1, 2014 to April 30, 2014, is presented together with net income attributable to non-controlling interests in Ares Operating Group entities within the Consolidated Statements of Operations.

The entities comprising our Consolidated Funds are not the same entities for all periods presented primarily due to the adoption of new consolidation guidance. Pursuant to revised consolidation guidance that became effective for us on January 1, 2015, we consolidated entities where we hold a controlling financial interest. The consolidation of funds during the periods generally has the effect of grossing up reported assets, liabilities and cash flow, and has no effect on net income attributable to the Company and the Predecessor. See “ItemItem 7. Management’s Discussion and Analysisof Financial Condition and Results of Operations—Consolidation and Deconsolidation of Ares Funds” and “—Critical Accounting Estimates—Principles of Consolidation” and Note 2, “Summary of Significant Accounting Policies,” to our consolidated financial statements appearing elsewhere in this Annual Report on Form 10-K.Operations
The following selected historical consolidated financial data should be read together with “Item 1. Business—Organizational Structure,” “Item 7. Management’s Discussion and Analysis of Financial Condition and Results of Operations”and our historical consolidated financial statements and related notes included elsewhere in this Annual Report on Form 10‑K.

 For the Year Ended December 31,
 2017 2016 2015 2014 2013 
         (Predecessor) 
 (Dollars in thousands)
Statements of operations data                      
Revenues          
Management fees (includes ARCC Part I Fees of $105,467, $121,181, $121,491, $118,537 and $110,511 for the years ended December 31, 2017, 2016, 2015, 2014 and 2013, respectively)$722,419
 $642,068
 $634,399
 $486,477
 $375,572
 
Performance fees636,674
 517,852
 150,615
 91,412
 79,800
 
Administrative, transaction and other fees56,406
 39,285
 29,428
 26,000
 23,283
 
Total revenues1,415,499
 1,199,205
 814,442
 603,889
 478,655
 
Expenses          
Compensation and benefits514,109
 447,725
 414,454
 456,372
 333,902
 
Performance fee compensation479,722
 387,846
 111,683
 170,028
 194,294
 
General, administrative and other expenses196,730
 159,776
 224,798
 166,839
 138,464
 
Transaction support expense275,177


Expenses of Consolidated Funds39,020
 21,073
 18,105
 66,800
 135,237
 
Total expenses1,504,758
 1,016,420
 769,040
 860,039
 801,897
 
Other income (expense)          
Net realized and unrealized gain on investments67,034
 28,251
 17,009
 32,128
 8,922
 
Interest and dividend income12,715
 23,781
 14,045
 7,244
 5,996
 
Interest expense(21,219) (17,981) (18,949) (8,617) (9,475) 
Debt extinguishment expense
 
 (11,641) 
 (1,862) 
Other income (expense), net19,470
 35,650
 21,680
 (2,422) (200) 
Net realized and unrealized gain (loss) on investments of Consolidated Funds100,124
 (2,057) (24,616) 513,270
 479,096
 
Interest and other income of Consolidated Funds187,721
 138,943
 117,373
 937,835
 1,236,037
 
Interest expense of Consolidated Funds(126,727) (91,452) (78,819) (666,373) (534,431) 
Debt extinguishment gain of Consolidated Funds


 11,800
 
Total other income239,118
 115,135
 36,082
 813,065
 1,195,883
 
Income before taxes149,859
 297,920

81,484

556,915

872,641

Income tax expense (benefit)(23,052) 11,019
 19,064
 11,253
 59,263
 
Net income172,911
 286,901

62,420

545,662

813,378

Less: Net income attributable to redeemable interests in Consolidated Funds
 
 
 2,565
 137,924
 
Less: Net income (loss) attributable to non-controlling interests in Consolidated Funds60,818
 3,386
 (5,686) 417,793
 448,847
 
Less: Net income attributable to redeemable interests in Ares Operating Group entities
 456
 338
 731
 2,451
 
Less: Net income attributable to non-controlling interests in Ares Operating Group entities35,915
 171,251
 48,390
 89,585
 224,156
 
Net income attributable to Ares Management, L.P.76,178
 111,808

19,378

34,988


Less: Preferred equity distributions paid21,700
 12,176


Net income attributable to Ares Management, L.P. common unitholders$54,478
 $99,632

$19,378

$34,988

$


 As of December 31,
 2017 2016 2015 2014 2013 
         (Predecessor) 
 (Dollars in thousands)
Statements of financial condition data                   
Cash and cash equivalents$118,929
 $342,861
 $121,483
 $148,858
 $89,802
 
Cash and cash equivalents of Consolidated Funds556,500
 455,280
 159,507
 1,314,397
 1,638,003
 
Investments647,335
 468,471
 468,287
 174,052
 89,438
 
Investments, at fair value, of Consolidated Funds5,582,842
 3,330,203
 2,559,783
 19,123,950
 20,823,338
 
Total assets8,563,522
 5,829,712
 4,321,408
 21,638,992
 23,705,384
 
Debt obligations616,176
 305,784
 389,120
 243,491
 153,119
 
CLO loan obligations of Consolidated Funds4,963,194
 3,031,112
 2,174,352
 12,049,170
 11,774,157
 
Consolidated Funds’ borrowings138,198
 55,070
 11,734
 777,600
 2,070,598
 
Mezzanine debt of Consolidated Funds
 
 
 378,365
 323,164
 
Total liabilities7,103,230
 4,452,450
 3,329,497
 14,879,619
 16,030,319
 
Redeemable interest in Consolidated Funds
 
 
 1,037,450
 1,093,770
 
Redeemable interest in Ares Operating Group entities
 
 23,505
 23,988
 40,751
 
Non‑controlling interest in Consolidated Funds528,488
 338,035
 323,606
 4,950,803
 5,847,135
 
Non‑controlling interest in Ares Operating Group entities358,186
 447,615
 397,883
 463,493
 167,731
 
Total controlling interest in Ares Management, L.P.274,857
 292,851
 246,917
 283,639
 525,678
 
Total equity1,460,292
 1,377,262
 968,406
 5,697,935
 6,540,544
 
Total liabilities, redeemable interest, non‑controlling interests and equity8,563,522
 5,829,712
 4,321,408
 21,638,992
 23,705,384
 

Item 7.  Management’s Discussion And AnalysisOf Financial Condition And Results Of Operations
Ares Management, L.P.AMC is a Delaware limited partnership formed on November 15, 2013.corporation. Unless the context otherwise requires, references to “Ares,” “we,” “us,” “our,” “the Partnership” and “the Company”the “Company” are intended to mean the business and operations of Ares Management, L.P.AMC and its consolidated subsidiaries. The following discussion analyzes the financial condition and results of operations of the Partnership .Company. “Consolidated Funds” refers collectively to certain Ares‑affiliatedAres funds, related co‑ investment entitiesco-investment vehicles, CLOs and certain CLOsSPACs that are required under generally accepted accounting principles in the United States (“GAAP”) to be consolidated inwithin our consolidated financial statements included in this Annual Report on Form 10‑K.10-K. Additional terms used by the Company are defined in the Glossary and throughout the Management'sManagement’s Discussion and Analysis in this Annual Report on Form 10-K.

The following discussion and analysis should be read in conjunction with the audited, consolidated financial statements of Ares Management, L.P.AMC and the related notes included in this Annual Report on Form 10‑K.10-K.
This section of the Annual Report on Form 10-K discusses activity as of and for the years ended December 31, 2023 and 2022. For discussion on activity for the year ended December 31, 2021 and period-over-period analysis on results for the year ended December 31, 2022 to 2021, refer to Part II, “Item 7. Management’s Discussion and Analysis of Financial Condition and Results of Operations” in our Annual Report on Form 10-K for the year ended December 31, 2022.
Amounts and percentages presented throughout our discussion and analysis of financial condition and results of operations may reflect rounded results in thousands (unless otherwise indicated) and consequently, totals may not appear to sum.
Our Business
We are a leading global alternative asset manager that operates through three distinct but complementary investment groups, which are our reportable segments. In 2017, we reclassified certain expenses from OMG to our operating segments. We have presented our reportable segments for the years ended December 31, 2016 and 2015 to conform to the year ended December 31, 2017 presentation.
Our three operating segments are:
Credit Group: Our Credit Group is a leading manager of credit strategies across the non-investment grade credit universe in the U.S. and Europe, with approximately $71.7 billion of assets under management and 139 funds as of December 31, 2017. The Credit Group offers a range of credit strategies across the liquid and illiquid spectrum, including syndicated loans, high yield bonds, credit opportunities, structured credit investments and U.S. and European direct lending. The Credit Group provides solutions for traditional fixed income investors seeking to access the syndicated loans and high yield bond markets and capitalizes on opportunities across traded corporate credit. It additionally provides investors access to directly originated fixed- and floating-rate credit assets and the ability to capitalize on illiquidity premiums across the credit spectrum. The Credit Group’s syndicated loans strategy focuses on liquid, traded non-investment grade secured loans to corporate borrowers. The high yield bond strategy seeks to deliver a diversified portfolio of liquid, traded non-investment grade corporate bonds, including secured, unsecured and subordinated debt instruments. Credit opportunities is a “go anywhere” strategy seeking to capitalize on market inefficiencies and relative value opportunities across the capital structure. The structured credit strategy invests across the capital structures of syndicated collateralized loan obligation vehicles (CLOs) and in directly-originated asset-backed instruments comprised of diversified portfolios of consumer and commercial assets. We are one of the largest self-originating direct lenders to the U.S. and European middle markets, providing one-stop financing solutions for small-to-medium sized companies, which the Company believes are increasingly underserved by traditional lenders. We provide investors access to these capabilities through several vehicles, including commingled funds, separately managed accounts and a publicly traded vehicle. The Credit Group conducts its U.S. corporate lending activities primarily through ARCC, the largest business development company as of December 31, 2017, by both market capitalization and total assets. In addition, illustrative charts may not be presented at scale.

“NM” refers to not meaningful. Period-over-period analysis for current year compared to prior year may be deemed to be not meaningful and are designated as “NM” within the Credit Group manages a commercial finance business that provides asset-baseddiscussion and cash flow loans to smallanalysis of financial condition and middle-market companies, as well as asset-based facilities to specialty finance companies. The Credit Group’s European direct lending platform is one of the most significant participants in the European middle-market, focusing on self-originated investments in illiquid middle-market credits.

Private Equity Group: Our Private Equity Group has approximately $24.5 billion of assets under management as of December 31, 2017, broadly categorizing its investment strategies as corporate private equity, U.S. power and energy infrastructure and special situations. As of December 31, 2017, the group managed five corporate private equity commingled funds focused on North America and Europe and two focused on greater China, five commingled funds and six related co-investment vehicles focused on U.S. power and energy infrastructure and three special situations funds. In its North American and European flexible capital strategy, the Company targets opportunistic majority or shared-control investments in businesses with strong franchises and attractive growth opportunities in North America and Europe. The U.S. power and energy infrastructure strategy targets U.S. energy infrastructure-related assets across the power generation, transmission and midstream sectors, seeking attractive risk-adjusted equity returns with current cash flow and capital

appreciation. The special situations strategy seeks to invest opportunistically across a broad spectrum of distressed or mispriced investments, including corporate debt, rescue capital, private asset-backed investments, post-reorganization securities and non-performing portfolios.

Real Estate Group: Our Real Estate Group manages comprehensive public and private equity and debt strategies, with approximately $10.2 billion of assets under management across 42 funds as of December 31, 2017. Real Estate equity strategies focus on applying hands-on value creation initiatives to mismanaged and capital-starved assets, as well as new development, ultimately selling stabilized assets back into the market. The Real Estate Group manages both a value-add strategy and an opportunistic strategy. The value-add strategy seeks to create value by buying assets at attractive valuations and through active asset management of income-producing properties across the U.S. and Western Europe. The opportunistic strategy focuses on manufacturing core assets through development, redevelopment and fixing distressed capital structures across major property types in the U.S. and Europe. The Company’s debt strategies leverage the Real Estate Group’s diverse sources of capital to directly originate and manage commercial mortgage investments on properties that range from stabilized to requiring hands-on value creation. In addition to managing private debt funds, the Real Estate Group makes debt investments through a publicly traded commercial mortgage REIT, ACRE.
The Operations Management Group (“OMG”) consists of five shared resource groups to support our operating segments by providing infrastructure and administrative support in the areas of accounting/finance, operations/information technology, business development/corporate strategy, legal/compliance and human resources. Additionally, the OMG provides services to certain of our investment companies and partnerships, which reimburse the OMG for expenses equal to the cost of services provided. The OMG’s expenses are not allocated to our three reportable segments but we consider the cost structure of the OMG when evaluating our financial performance.
The focus of our business model is to provide our investment management capabilities through various funds and products that meet the needs of a wide range of institutional and retail investors. Our revenues consist primarily of management fees and performance fees, as well as investment income and administrative expense reimbursements. Management fees are generally based on a defined percentage of average fair value of assets, total commitments, invested capital, net asset value, net investment income or par value of the investment portfolios we manage. Performance fees are based on certain specific hurdle rates as defined in the funds' applicable investment management or partnership agreements and represent either an incentive fee or carried interest. Other income (expense) represents the investment income, realized gains (losses) and unrealized appreciation (depreciation) resulting from the investments of the Company and the Consolidated Funds, as well as interest expense. We provide administrative services to certain of our affiliated funds that are presented within administrative, transaction and other fees for GAAP reporting, but are presented net of respective expenses for segment reporting purposes. We also receive transaction fees from certain affiliated funds for activities related to fund transactions, such as loan originations. In accordance with GAAP, we are required to consolidate those funds in which we hold a significant economic interest and substantive control rights. However, for segment reporting purposes, we present revenues and expenses on a combined segment basis, which shows the results of our reportable segments without giving effect to the consolidation of the funds. Accordingly, our segment revenues consist of management fees, other income, realized and unrealized performance fees, and net investment income. Our segment expenses consist of compensation and benefits, net of administrative fees, general, administrative and other expenses, net of administrative fees, as well as realized and unrealized performance fee compensation.operations.

Trends Affecting Our Business
We believe that our disciplined investment philosophy across our three distinct but complementary investment groups contributes to the stability of our firm’s performance throughout market cycles. Additionally, asFor the year ended December 31, 2023, approximately 72%95% of our assets under management fees were in funds with a contractual life of three years or morederived from perpetual capital vehicles and approximately 42% were in funds with a contractual life of seven years or more as of December 31, 2017,ourlong-dated funds. Our funds have a stable base of committed capital enabling us to invest in assets with a long termlong-term focus over different points in a market cycle and to take advantage of market volatility. However, our results offrom operations, including the fair value of our AUM, are affected by a
104

variety of factors, including conditionsfactors. Conditions in the global financial markets and the economic and political environments may impact our business, particularly in the United States and Western Europe.
December 2017 marked a modestly positive end to the year for credit markets as improving economic conditions, rising corporate earnings, accommodative monetary policy and falling inflation expectations supported investor sentiment. Despite sector specific gains experienced in November, credit spreads generally continued to tighten throughout the fourth quarter of 2017. In response to compressing yields, investors generally sought higher yielding risk assets globally. Similar to 2016, market participants were rewarded for a “risk-on” posture and as a result, the ICE BofAML High Yield Master II Index returned 7.48% for 2017, primarily driven by the CCC portion of the index which returned 10.59% during the year. The leveraged loan market experienced similar return patterns with the Credit Suisse Leveraged Loan Index delivering a 4.25% total return for the full year, led by a 7.45% return for the lower tier segment of the market. Against a backdrop of improving macroeconomic and corporate fundamentals as

well as enthusiasm over tax reform in the U.S., equities (measured by the S&P 500 Index) continued to reach record highs throughoutWestern Europe and Asia.

    The following table presents returns of selected market indices:
Returns (%)
Type of IndexName of IndexRegionYear ended December 31, 2023Year ended December 31, 2022
High yield bondsICE BAML High Yield Master II IndexU.S.13.5(11.2)
High yield bondsICE BAML European Currency High Yield IndexEurope12.2(11.5)
Leveraged loansCredit Suisse Leveraged Loan Index (“CSLLI”)U.S.13.0(1.1)
Leveraged loansCredit Suisse Western European Leveraged Loan IndexEurope12.5(3.3)
EquitiesS&P 500 IndexU.S.26.3(18.1)
EquitiesMSCI All Country World Ex-U.S. IndexNon-U.S.15.6(16.0)
Real estate equitiesFTSE NAREIT All Equity REITs IndexU.S.11.4(24.9)
Real estate equitiesFTSE EPRA/NAREIT Developed Europe IndexEurope17.4(36.5)

During 2023, global markets endured heightened volatility but finished the year positively with improving investor sentiment amid the possibility of monetary easing in 2024. Despite the macroeconomic headwinds and outperformed most asset classes with a year-to-date return of 21.83%.
escalated conflicts in the Middle East and Ukraine, U.S. and European high yield bonds and leveraged loans returned positive performance. The Asian markets experienced mixed performance as the region overall continued to show notable stabilitygrowth primarily driven by resilient demand in Southeast Asia and India. India, in particular, demonstrated healthy economic growth driven by its manufacturing and services sectors. On the other hand, China’s weaker than expected economic recovery led Chinese policymakers to continue taking measures to support economic growth. Overall, reduced lending activity by banks and limited capital accessibility continued to fuel private credit growth.

Global equity markets similarly rallied during the fourth quarter to finish the year on a positive note. While the public markets ended the year positively, the private markets continued to experience challenges with downward pressure on valuations and muted the opportunities for realizations. The private equity markets also experienced a prolonged slowdown in deal activity, and we believe potential liquidity constraints from investors have increased the need for flexible capital solutions. In addition, businesses have struggled to navigate this challenging growth and inflationary environment, which we believe has heightened the need for partnerships with value-add managers. This environment underscores the importance of 2017 as improving growth prospects and increased appetite for riskinvesting in resilient industries with long-term secular tailwinds where we have expertise. Our focus continues to be on investment opportunities in the region seemedhealthcare and services sectors, with limited exposure to energy, and we continue to invest opportunistically in consumer and industrials. Asset selectivity, deliberate portfolio construction, a flexible investment mandate and a differentiated view to drive value creation through earnings growth will be instrumental in delivering attractive returns to investors.

The commercial real estate markets continued to be impacted by the macroeconomic environment throughout 2023. European and U.S. real estate deal activity remained subdued with limited transactional liquidity. Given the higher interest rate environment, property valuations remain soft, with capitalization rate yields widening further over the year. However, we believe certain of these market trends will be offset geopoliticalby continued strong fundamentals, such as occupancy and monetary policy concerns. Asrental rates, in property types that include multifamily and industrial.

The current market environment has had a result, the ICE BofAML European High Yield Index and the Credit Suisse Western European Leveraged Loan Index delivered strong performance for the year-to-date period, returning 6.74% and 5.32% during 2017, respectively. Economic growthmore pronounced negative impact on certain industries, including energy, which is an industry in Europe showed signs of strength as gross domestic product readings consistently beat expectations and the unemployment rate dipped to lows not seen since January 2009.

Notwithstanding the potential opportunities represented by market volatility, future earnings, cash flows and distributions are affected by a range of factors, including realizationswhich few of our funds’funds have made investments. As of December 31, 2023, 1% of our total AUM was invested in debt and equity investments in the energy sector (of which less than 1% of our total AUM was invested in midstream investments and also includes oil and gas exploration) and less than 1% of our total AUM was invested in renewable energy investments.

We believe our portfolios across all strategies are subject to significant fluctuations from period to period.well positioned for a fluctuating interest rate environment. On a market value basis, approximately 85% of our debt assets and 57% of our total assets were floating rate instruments as of December 31, 2023.

In 2018,2023, some of the considerations informingpertaining to our strategic decisions include:included:

Our ability to fundraise and increase AUM and fee paying AUM. During the year ended December 31, 2017,2023, we raised $16.7$74.5 billion both inof gross new capital across our commingled funds, SMAs and separately managed accounts,other vehicles, and continued to expand our investor base, raising capital from over 65125 different fundsinvestment vehicles and approximately 146over 625 institutional investors, including 78
105

approximately 300 direct institutional investors that were new to Ares. Our fundraising efforts helped drive AUM growth of approximately 11.8%19% for 2017.2023. During 2018,2024, we expect that our fundraising will come from a combination of our existing and new strategies primarily in the U.SU.S., Europe and Europe. During the year ended December 31, 2017, we earned approximately 1.1% on our FPAUM, which was consistent with 2016.APAC. As of December 31, 2017, we also had $15.0 billion of2023, AUM not yet earningpaying fees which represents approximately $164.4 million in annual potential management fee revenue. Of the $164.4 million, $126.1 million relates to $11.8includes $62.9 billion of AUM available for future deployment.deployment which could generate approximately $621.6 million in potential incremental annual management fees. Our pipeline of potential fees,future deployment, coupled with our future fundraising opportunities,prospects, gives us the potentialopportunity to increase our management fees in 2018.
2024.

Our ability to attract new capital and investors with our broad multi‑assetmulti-asset class product offering.Our ability to attract new capital and investors in our funds is driven, in part, by the extent to which they continue to see the alternative asset management industry generally, and our investment products specifically, as an attractive vehicle for capital appreciation.appreciation and income generation. We continually seek to create avenues to meet our investors’ evolving needs by offering an expansive range of investment funds, developing new products and creating managed accounts and other investment vehicles tailored to our investors’ goals. We continue to expand our distribution channels, seeking to meetexpanding into the needs of insurance companies,retail channel through our global wealth management offerings, as well as the needs of traditional institutional investors, such as pension funds, sovereign wealth funds, and endowments. If market volatility persists or increases, investors may seek absolute return strategies that seek to mitigate volatility. We offer a variety of investment strategies depending upon investors’ risk tolerance and expected returns.

Our disciplined investment approach and successful deployment of capital.Our ability to maintain and grow our revenue base is dependent upon our ability to successfully deploy the capital that our investors have committed to our investment funds. Greater competition, high valuations, cost of credit and other general market conditions have affected and may continue to affect our ability to identify and execute attractive investments. Under our disciplined investment approach, we deploy capital only when we have sourced a suitable investment opportunity at an attractive price. During the year ended December 31, 2017,2023, we deployed $16.4$68.1 billion of gross capital across our three investment groups compared to approximately $10.2$79.8 billion deployed in 2016.2022. We believe we continue to be well-positioned to invest our assets opportunistically. As of December 31, 2017,2023, we had $25.1$111.4 billion of capital available for investment and we remain well-positionedcompared to invest our assets opportunistically.
$84.6 billion as of December 31, 2022.
Our ability to invest capital and generate returns through market cycles. The strength of our investment performance affects investors’ willingness to commit capital to our funds. The flexibility of the capital we are able to attract is one of the main drivers of the growth of our AUM and the management fees we earn. Current market conditions and a changing regulatory environment have created opportunities for Ares’ businesses, particularly in the Credit Group’s direct lending funds, and in the Private Equity's special situations funds, which utilize flexible investment mandates to manage portfolios through market cycles. As market conditions shift and default risk and interest rate risk come under greater focus, having the ability to move up and down the capital structure enables both our Credit and Private Equity Groups to reduce risk and enhance returns. Similarly, given our broad capabilities in leveraged loans, such flexibility enables our Credit Group to reduce sensitivities to changing interest rates by increasing allocations to floating rate syndicated loans. On a market value basis, more than 75% of the debt assets within our Credit Group are floating rate instruments, which we believe helps mitigate volatility associated with changes in interest rates.

Our ability to continue to achieve stable distributions to investors. Our fee related earnings represented approximately 80% of our distributable earnings for the year ended December 31, 2017. We believe that the high percentage of fee related earnings (versus performance related earnings) in our distributable earnings provides greater stability for our distributions relative to some peers. During 2017, we experienced higher relative distributable earnings compared to 2016 primarily driven by higher realized performance related earnings within the Private Equity Group, mostly as a result of market appreciation in a retail portfolio company following its initial public offering. In addition, we have historically experienced and expect to continue to experience higher realizations within our Credit Group funds during the second half compared to the first half of the year, as certain Credit Group funds, including ARCC, pay incentive fees annually when hurdles are exceeded, which are typically realized during the last six months of the year.
See “Item 1A. Risk Factors” included in this Annual Report on Form 10‑K10-K for a discussion of the risks to which our businesses are subject.subject to.


106

Table of Contents
Managing Business Performance
Operating Metrics
We measure our business performance using certain operating metrics that are common to the alternative asset management industry, which are discussed below.
Assets Under Management
AUM refers to the assets we manage and is viewed as a metric to measure our investment and fundraising performance as it reflects assets generally at fair value plus available uncalled capital.
The Electiontables below present rollforwards of our total AUM by segment ($ in millions):
Credit
Group
Private Equity
Group
Real Assets
Group
Secondaries
Group
Other BusinessesTotal AUM
Balance at 12/31/2022$225,579 $34,749 $66,061 $21,961 $3,647 $351,997 
Acquisitions— 3,697 — — — 3,697 
Net new par/equity commitments40,393 1,621 6,076 3,648 7,008 58,746 
Net new debt commitments14,897 — 726 — — 15,623 
Capital reductions(3,858)(9)(480)— — (4,347)
Distributions(7,185)(2,309)(4,796)(1,116)(423)(15,829)
Redemptions(3,345)— (1,759)(1)(1,046)(6,151)
Net allocations among investment strategies4,258 — — (4,263)— 
Change in fund value14,057 1,356 (415)263 (151)15,110 
Balance at 12/31/2023$284,796 $39,105 $65,413 $24,760 $4,772 $418,846 
Credit
Group
Private Equity
Group
Real Assets
Group
Secondaries
Group
Other BusinessesTotal AUM
Balance at 12/31/2021$201,405 $33,404 $45,919 $22,119 $2,928 $305,775 
Acquisitions— — 8,184 199 — 8,383 
Net new par/equity commitments18,149 2,202 10,638 2,510 4,848 38,347 
Net new debt commitments14,462 — 3,253 — — 17,715 
Capital reductions(1,280)(208)(516)— — (2,004)
Distributions(6,057)(1,333)(3,183)(2,787)(1,788)(15,148)
Redemptions(2,415)— (951)— — (3,366)
Net allocations among investment strategies1,975 — — — (1,975)— 
Change in fund value(660)684 2,717 (80)(366)2,295 
Balance at 12/31/2022$225,579 $34,749 $66,061 $21,961 $3,647 $351,997 
The components of our AUM are presented below ($ in billions):
577578
AUM: $418.8AUM: $352.0
FPAUM
Non-fee paying(1)
AUM not yet paying fees
(1) Includes $15.1 billion and $14.4 billion of AUM of funds from which we indirectly earn management fees as of December 31, 2023 and 2022, respectively and includes $4.3 billion and $3.4 billion of non-fee paying AUM based on our general partner commitment as of December 31, 2023 and 2022, respectively.
107

Table of Contents
Please refer to “— Results of Operations by Segment” for Aresa more detailed presentation of AUM by segment for each of the periods presented.

Fee Paying Assets Under Management L.P.

FPAUM refers to AUM from which we directly earn management fees and is equal to the sum of all the individual fee bases of our funds that directly contribute to our management fees.

The tables below present rollforwards of our total FPAUM by segment ($ in millions):
Credit
Group
Private Equity
Group
Real Assets
Group
Secondaries
Group
Other BusinessesTotal
Balance at 12/31/2022$151,275 $18,447 $41,607 $17,668 $2,064 $231,061 
Acquisitions— 1,692 — — — 1,692 
Commitments8,333 — 3,674 1,645 6,181 19,833 
Deployment/subscriptions/increase in leverage23,701 2,752 2,968 473 150 30,044 
Capital reductions(3,657)— (455)— — (4,112)
Distributions(7,927)(1,232)(3,862)(613)(415)(14,049)
Redemptions(4,474)— (1,775)(1)— (6,250)
Net allocations among investment strategies4,363 — — 30 (4,393)— 
Change in fund value5,176 — (917)(164)317 4,412 
Change in fee basis— (45)98 (329)(274)
Balance at 12/31/2023$176,790 $21,614 $41,338 $19,040 $3,575 $262,357 
Credit
Group
Private Equity
Group
Real Assets
Group
Secondaries
Group
Other BusinessesTotal
Balance at 12/31/2021$122,110 $16,689 $28,615 $18,364 $2,067 $187,845 
Acquisitions— — 4,855 131 — 4,986 
Commitments11,327 — 6,680 2,042 3,607 23,656 
Deployment/subscriptions/increase in leverage32,780 4,489 4,002 560 (38)41,793 
Capital reductions(3,913)— (200)— — (4,113)
Distributions(7,365)(1,902)(2,101)(1,319)(734)(13,421)
Redemptions(2,684)— (965)— — (3,649)
Net allocations among investment strategies1,935 — — — (1,935)— 
Change in fund value(2,071)(4)1,572 772 (665)(396)
Change in fee basis(844)(825)(851)(2,882)(238)(5,640)
Balance at 12/31/2022$151,275 $18,447 $41,607 $17,668 $2,064 $231,061 

The charts below present FPAUM by its fee bases ($ in billions):
13291331
FPAUM: $262.4FPAUM: $231.1
Invested capital/other(1)
Market value(2)
Collateral balances (at par)Capital commitments
(1)Other consists of ACRE’s FPAUM, which is based on ACRE’s stockholders’ equity.
(2)Includes $58.8 billion and $56.0 billion from funds that primarily invest in illiquid strategies as of December 31, 2023 and 2022, respectively. The underlying investments held in these funds are generally subject to less market volatility than investments held in liquid strategies.
108

Table of Contents

Please refer to “— Results of Operations by Segment” for detailed information by segment of the activity affecting total FPAUM for each of the periods presented.

Perpetual Capital Assets Under Management

The chart below presents our perpetual capital AUM by segment and type ($ in billions):
Perpetual Capital v7.jpg

Management Fees By Type

We view the duration of funds we manage as a metric to measure the stability of our future management fees. For both the years ended December 31, 2023 and 2022, 95% of management fees were earned from perpetual capital or long-dated funds. The charts below present the composition of our segment management fees by the initial fund duration:
22792281
Perpetual Capital - Publicly-Traded
Vehicles
Perpetual Capital - Non-Traded
Vehicles
Perpetual Capital - Managed AccountsPerpetual Capital - Private Commingled Vehicles
Long-Dated Funds(1)
Other
(1) Long-dated funds generally have a contractual life of five years or more at inception.
109

Table of Contents
Available Capital and Assets Under Management Not Yet Paying Fees

The charts below present our available capital and AUM not yet paying fees by segment ($ in billions):
AC & AUMNYPF v1.jpg
CreditPrivate EquityReal AssetsSecondariesOther Businesses

As of December 31, 2023, AUM Not Yet Paying Fees includes $62.9 billion of AUM available for future deployment that could generate approximately $621.6 million in potential incremental annual management fees. As of December 31, 2022, AUM Not Yet Paying Fees included $41.8 billion of AUM available for future deployment that could generate approximately $410.9 million in potential incremental annual management fees.

Incentive Eligible Assets Under Management and Incentive Generating Assets Under Management

The charts below present our IEAUM and IGAUM by segment ($ in billions):
IGAUM.jpg
CreditPrivate EquityReal AssetsSecondariesOther Businesses
110

Table of Contents
The charts below present our IGAUM by strategy for funds generating fee related performance revenues and net fee related performance revenues by strategy as of and for the years ended:
FRPR.jpg
U.S. Direct LendingEuropean Direct LendingAlternative CreditPrivate Equity SecondariesU.S. Real Estate EquityReal Estate Debt
(1)Fee related performance revenues by strategy is presented net of the associated fee related performance compensation.

Fund Performance Metrics
Fund performance information for our funds considered to be Taxed“significant funds” is included throughout this discussion with analysis to facilitate an understanding of our results of operations for the periods presented. Our significant funds are commingled funds that either contributed at least 1% of our total management fees or represented at least 1% of the Company’s total FPAUM for the past two consecutive quarters. In addition to management fees, each of our significant funds may generate carried interest or incentive fees upon the achievement of performance hurdles. The fund performance information reflected in this discussion and analysis is not indicative of our overall performance. An investment in Ares is not an investment in any of our funds. Past performance is not indicative of future results. As with any investment, there is always the potential for gains as well as the possibility of losses. There can be no assurance that any of these funds or our other existing and future funds will achieve similar returns.
Fund performance metrics for significant funds may be marked as “NM” as they may not be considered meaningful due to the limited time since the initial investment and/or early stage of capital deployment.

To further facilitate an understanding of the impact a Corporationsignificant fund may have on our results, we present our drawdown funds as either harvesting investments or deploying capital to indicate the fund’s stage in its life cycle. A fund harvesting investments is generally not seeking to deploy capital into new investment opportunities, while a fund deploying capital is generally seeking new investment opportunities.

111

Table of Contents
Components of Consolidated Results of Operations

Revenues

Management Fees. The investment adviser of our funds generally receives an annual management fee based on a percentage of the fund’s capital commitments, contributed capital, net asset value or invested capital during the investment period, which may then change at the end of the investment period. For certain of our SMAs, we receive an annual management fee based on a percentage of invested capital, contributed capital or net asset value throughout the term of the SMA. We also may receive special fees, including agency and arrangement fees. In certain circumstances, we are contractually required to offset certain amounts of such special fees against management fees relating to the applicable fund.

The investment adviser of each of our CLOs typically receives annual management fees based on the gross aggregate collateral balance for CLOs, at par, adjusted for cash and defaulted or discounted collateral. The management fees of CLOs accounted for approximately 2% of our total management fees on a consolidated basis and 4% on an unconsolidated basis for the year ended December 31, 2023.
The management fees we receive from our drawdown style funds are typically payable on a quarterly basis over the life of the fund and do not fluctuate with the changes in investment performance of the fund. The investment management agreements we enter into with clients in connection with contractual SMAs may generally be terminated by such clients with reasonably short prior written notice. Typically, terminations do not require liquidation of the SMAs and such SMAs will continue to exist until the underlying investments are liquidated. The management fees we receive from our SMAs are generally paid on a periodic basis (typically quarterly, subject to the termination rights described above) and are based on either invested capital or on the net asset value of the separately managed account.

We have filed an electionreceive management fees in accordance with the Internal Revenue Service (“IRS”)investment advisory and management agreements of our retail vehicles, including both our publicly-traded and non-traded vehicles, that must be reviewed or approved annually by their independent boards of directors.

Details regarding our management fees from our retail vehicles are presented below:
Annual Fee RateFee Base
ACRE1.50%Stockholders’ equity
AIREIT1.25%NAV
APMF1.40%Total assets (including any assets relating to indebtedness or preferred shares that may be issued) minus liabilities (other than liabilities relating to indebtedness)
ARCC1.50%Total assets (other than cash and cash equivalents)
ARCC Part I Fees20.00%Net investment income (before ARCC Part I Fees and ARCC Part II Fees), subject to a fixed hurdle rate of 1.75% per quarter, or 7.00% per annum. No fees are recognized until ARCC’s net investment income exceeds a 1.75% hurdle rate, with a catch-up provision to ensure that the Company receives 20.00% of the net investment income from the first dollar earned
ARDC1.00%Total assets minus liabilities (other than liabilities relating to indebtedness)
AREIT1.10%NAV
ASIF1.25%NAV
ASIF Part I Fees12.50%Net investment income (before ASIF Part I Fees and ASIF Part II Fees), subject to a fixed hurdle rate of 1.25% per quarter, or 5.00% per annum. No fees are recognized until ASIF’s net investment income exceeds a 1.25% hurdle rate, with a catch-up provision to ensure that the Company receives 12.50% of the net investment income from the first dollar earned
CADC1.25%Total assets minus liabilities (other than liabilities relating to indebtedness)
CADC Part I Fees15.00%Net investment income (before CADC Part I Fees), subject to a fixed hurdle rate of 1.50% per quarter, or 6.00% per annum. No fees are recognized until CADC’s net investment income exceeds the hurdle rate, with a catch-up provision to ensure that the Company receives 15.00% of the net investment income from the first dollar earned

112

Table of Contents
Details regarding our management fees by strategy are presented below:
Fee RateFee Base
Average Remaining Contract Term(1)
Credit Group
Liquid Credit(2)
0.25% - 1.00%Par plus cash or NAV
9.0 years(2)
Alternative Credit0.50% - 1.50%NAV, gross asset value, capital commitments or invested capital4.4 years
U.S. and European Direct Lending(3)
0.75% - 1.50%Invested capital, NAV or total assets (in certain cases, excluding cash and cash equivalents)4.4 years
APAC Credit(4)
1.15% - 2.00%Capital commitments, aggregate cost basis of unrealized portfolio investments or a combination thereof3.7 years
Private Equity Group
Corporate Private Equity(5)
1.50%Capital commitments5.2 years
Special Opportunities(6)
1.50%Invested capital or aggregate cost basis of unrealized portfolio investments7.8 years
APAC Private Equity(7)
1.00% - 2.00%Invested capital, capital commitments or a combination thereof3.9 years
Real Assets Group
Real Estate Equity(8)
0.50% - 1.50%Invested capital, NAV, capital commitments or a combination thereof3.1 years
Real Estate Debt0.50% - 1.00%Invested capital or NAV
N/A(9)
Infrastructure Opportunities(10)
1.00% - 1.50%Capital commitments6.0 years
Infrastructure Debt1.00%Invested capital5.1 years
Secondaries Group
Private Equity, Real Estate, Infrastructure Secondaries and Credit Secondaries(11)
0.50% - 1.25%Capital commitments, invested capital, reported value (largely represents NAV of each fund’s underlying limited partnership interests), called capital plus unfunded commitments or reported value plus unfunded commitments7.2 years
Other Businesses
Ares Insurance Solutions(12)
0.30%Monthly weighted average market value of the assets
N/A(12)
(1)    Represents the average remaining contract term pursuant to the funds’ governing documents within each strategy, excluding perpetual capital vehicles, as of December 31, 2023.
(2)    Liquid credit includes the syndicated loan, high yield bond and multi-asset credit strategies. Fee ranges for syndicated loans generally remain unchanged at the close of the re-investment period. In certain cases, CLOs may be called upon demand by subordinated noteholders prior to the management contract term expiration date. The funds in the high yield bond and multi-asset credit strategies are generally open-ended or managed account structures, which typically do not have investment period termination or management contract expiration dates.
(3)    Following the expiration or termination of the investment period, the fee basis for certain closed-end funds and managed accounts in this strategy generally change either to the aggregate cost or to market value of the portfolio investments.
(4)    Certain funds pay a lower management fee rate on committed capital which increases when such capital is invested. The funds in this strategy are comprised of closed-end funds, with investment period termination or management contract termination dates. The funds also include co-investment accounts with fees ranging from 0.50% to 1.50%, which generally do not include investment period termination or management contract termination dates.
(5)    Fee range represents typical range during the investment period. Management fees for corporate private equity funds generally step down to between 0.75% and 1.25% of the aggregate adjusted cost of unrealized portfolio investments following the earlier to occur of: (i) the expiration or termination of the investment period; and (ii) the activation of a successor fund.
(6)    Fee range represents typical range during the investment period. Management fees for special opportunities funds generally step down to between 1.00% to 1.25% of the invested capital or the aggregate cost basis of unrealized portfolio investments following the expiration or termination of the investment period.
(7)    Fee range represents typical range during the investment period. Management fees for APAC private equity funds generally step down to 2.00% of the aggregate adjusted cost of unrealized portfolio investments following the expiration or termination of the investment period. The funds also include co-investment vehicles with fees rates of 2.00%, which generally do not include investment period termination or management contract termination dates.
(8)    Certain funds pay a lower management fee rate on committed capital which increases when such capital is invested. Following the expiration or termination of the investment period the basis on which management fees are earned for certain closed-end funds, managed accounts and co-investment vehicles in this strategy changes from committed capital to invested capital with no change in the management fee rate. AIREIT and AREIT pay management fees based on NAV plus net capital raised and outstanding from our 1031 exchange programs.
(9)    The funds in this strategy are generally open-ended or managed account structures, which typically do not have investment period termination or management contract expiration dates.
(10)    Fee range represents typical range during the investment period. Certain funds pay a lower management fee rate on committed capital which increases when such capital is invested. The infrastructure opportunities funds generally step down the fee base to the aggregated adjusted cost of unrealized portfolio investments, while retaining the same fee rate, following the expiration or termination of the investment period.
(11)    Funds in each strategy are comprised of closed-end funds with either investment period termination or management contract termination dates and certain open-end accounts that generally do not have termination dates.
(12)    Ares Insurance Solutions earns a tiered management fee that starts at 0.30% and steps down to 0.15% of the monthly weighted average market value. Ares Insurance Solutions generally includes open-ended or managed account structures, which typically do not have investment period termination or management contract expiration dates.

113

Table of Contents
Incentive Fees. The general partners, managers or similar entities of certain of our funds receive performance-based fees. These fees are generally based on the annual investment returns of the applicable fund, subject to certain net loss carry-forward provisions, high-watermarks and/or preferred returns. Such performance-based fees may also be based on a fund’s cumulative net investment returns for the measurement period, in some cases subject to a high-watermark or a preferred return. Incentive fees are realized at the end of a measurement period, typically quarterly or annually. Realized incentive fees are generally higher during the second half of the year due to the nature of certain funds that typically realize incentive fees at the end of the calendar year. Once realized, such incentive fees are not subject to repayment. Cash from the realizations is typically received in the period subsequent to the measurement period. Incentive fees are composed of both fee related performance revenues, which are based on perpetual capital, and those incentive fees earned from funds with stated investment periods:

Details regarding our fee related performance revenues are presented below:
Fee RateFee BaseAnnual Hurdle Rate
Credit Group
Open-ended core alternative credit fund15.0%Incentive eligible fund’s profits6.0%
U.S. and European Direct Lending10.0% - 15.0%Incentive eligible fund’s profits5.0% to 8.0%
Real Assets Group
AIREIT and AREIT12.5%Annual investment returns, subject to certain net loss carry-forward provisions5.0%
ACRE20.0%The difference between ACRE’s core earnings (as defined in ACRE’s management agreement) and its shareholders' return on equity8.0%
Secondaries Group
APMF12.5%Annual investment returns, subject to certain net loss carry-forward provisionsN/A

Details regarding our incentive fees earned from funds with stated investment periods, which are generally based on a fund’s eligible profits, are presented below:
Fee RateAnnual Hurdle Rate
Credit Group
Liquid Credit10.0% - 20.0%3.0% to 12.0%
Alternative Credit12.5% - 20.0%5.0% to 7.0%
U.S. and European Direct Lending(1)
10.0% - 15.0%5.0% to 8.0%
Real Assets Group
Real Estate Equity15.0% - 18.0%6.0% to 8.0%
(1) We may receive Part II Fees, which are not paid unless ARCC and ASIF achieve cumulative aggregate realized capital gains (net of cumulative aggregate realized capital losses and aggregate unrealized capital depreciation). For ARCC and ASIF, incentive fees represent 20.0% and 12.5%, respectively, of the cumulative aggregate realized capital gains (net of cumulative aggregate realized losses and aggregate unrealized capital depreciation) and such fees are presented as incentive fees earned from funds with stated investment periods.

Performance Income.We may receive performance income from our funds that may be either incentive fees earned from funds with stated investment periods as described above, or a special allocation of income, which we refer to as carried interest. Performance income is recognized when specified investment returns are achieved by the fund.
Carried Interest Allocation. Carried interest allocation is recognized based on changes in valuation of our funds’ investments that exceed certain preferred returns as set forth in each respective partnership agreement. Carried interest allocation is based on the amount that would be due to us pursuant to the fund partnership agreement at each period end as if the funds were liquidated at such date. Accordingly, the amount recognized as carried interest allocation reflects our share of the fair value gains and losses of the associated funds’ underlying investments measured at their then-current fair values relative to the fair values as of the end of the prior period. Investment returns of one fund are not offset between or among funds.
Funds generally follow either an American-style waterfall or a European-style waterfall. For American-style waterfalls, the general partner is entitled to receive carried interest after a fund investment is realized if the investors in the fund have received distributions in excess of the capital contributed for such investment and all prior realized investments (plus allocable expenses), as well as the preferred return. For European-style waterfalls, the general partner is entitled to receive carried interest if the investors in the fund have received distributions in an amount equal to all prior capital contributions plus a preferred return.
114

Table of Contents
For most funds, the carried interest is subject to a preferred return ranging from 5.0% to 10.0%, after which there is typically a catch-up allocation to the general partner. Generally, if at the termination of a fund (and in some cases at interim points in the life of a fund), the fund has not achieved investment returns that exceed the preferred return threshold or the general partner receives net profits over the life of the fund in excess of its allocable share under the applicable partnership agreement, the general partner will be obligated to repay an amount equal to the extent the previously distributed carried interest exceeds the amounts to which the general partner is entitled. These repayment obligations may be related to amounts previously distributed to us and our senior professionals and are generally referred to as contingent repayment obligations.
Contingent repayment obligations operate with respect to only a given fund’s net investment performance and carried interest of other funds are not netted for determining this contingent obligation. Although a contingent repayment obligation is several to each person who received a distribution, and not a joint obligation, and our professionals who receive carried interest have guaranteed repayment of such contingent obligation, the governing agreements of our funds generally provide that, if a recipient does not fund his or her respective share, we may have to fund such additional amounts beyond the amount of carried interest we retained, although we generally will retain the right to pursue remedies against those carried interest recipients who fail to fund their obligations.
Certain funds may make distributions to their partners to provide them with cash sufficient to pay applicable federal, state and local tax liabilities attributable to the fund’s income that is allocated to them. These distributions are referred to as tax distributions and are not subject to contingent repayment obligations. Tax distributions from European-style waterfall funds generally precede investors in the fund receiving the preferred return.
Details regarding our carried interest, which is generally based on a fund’s eligible profits, are presented below:
Fee RateAnnual Hurdle Rate
Credit Group
Liquid Credit and Alternative Credit15.0% - 20.0%6.0% to 8.0%
U.S. and European Direct Lending10.0% - 20.0%5.0% to 8.0%
APAC Credit15.0% - 20.0%7.0% to 8.0%
Private Equity Group
Corporate Private Equity, Special Opportunities and APAC Private Equity20.0%8.0%
Real Assets Group
Real Estate10.0% - 20.0%6.0% to 10.0%
Infrastructure15.0% - 20.0%5.0% to 8.0%
Secondaries Group
Private Equity, Real Estate, Infrastructure and Credit Secondaries10.0% - 12.5%8.0%
Other Businesses
Ares Insurance Solutions20.0%8.0%
For detailed discussion of contingencies on carried interest, see “Note 8. Commitments and Contingencies,” within our consolidated financial statements and “Item 1A. Risk Factors—Risks Related to Our Funds—We may need to pay “clawback” or “contingent repayment” obligations if and when they are triggered under the governing agreements with our funds” included in this Annual Report on Form 10-K.
Principal Investment Income (Loss). Principal investment income (loss) consists of interest and dividend income and net realized and unrealized gains (losses) on equity method investments where we serve as general partner. Interest and dividend income are recognized on an accrual basis to the extent that such amounts are expected to be treatedcollected. A realized gain (loss) may be recognized when all or a portion of our investment is returned to us. Unrealized gains (losses) on investments result from appreciation (depreciation) in the fair value of our investments, as well as reversals of previously recorded unrealized appreciation (depreciation) at the time the gain (loss) on an investment becomes realized.

115

Table of Contents
Administrative, Transaction and Other Fees. Details regarding our administrative, transaction and other fees are presented below:
Administrative feesRepresent fees that we earn for providing administrative services to certain funds and may reflect either an expense reimbursements for costs incurred by certain professionals in performing services for a fund or may be based on fixed percentage of a fund’s invested capital
Transaction feesTypically represent fees earned from the arrangement and origination of loans and are generated primarily from funds within our direct lending and infrastructure debt strategies
Other fees:
Property-related fees represent fees earned within funds in our real estate equity strategies and include the following:
Acquisition feesBased on a percentage of a property’s cost at the time of property acquisition
Development feesBased on a percentage of development costs over the development period
Property management feesBased on tenancy of properties over the time associated property management services are provided
Sale and distribution fees represent fees earned through AWMS for the sale and distribution of fund shares in our non-traded vehicles and include the following:
Sales-based feesBased on a percentage of shares sold to retail investors in our non-traded vehicles. Sales-based fees are reported net of amounts re-allowed to participating broker-dealers for their ongoing shareholder services
Asset-based feesBased on the NAV of the applicable asset class. Asset-based fees are reported net of amounts re-allowed to participating broker-dealers for their ongoing shareholder services
Exchange program feesBased on a percentage of the value associated with the properties transacted through our 1031 exchange programs. Exchange program fees are recognized when investors contribute real property through like-kind 1031 exchanges for fund shares and through other private placements and are composed of a program administration fee and a facilitation fee for advisory services and sales-based efforts, respectively
Expenses
Compensation and Benefits. Compensation generally includes salaries, bonuses, health and welfare benefits, payroll related taxes, equity compensation, Part I Fee incentive compensation and fee related performance compensation expenses. Compensation and benefits expenses are typically correlated to the operating performance of our segments, which is used to determine incentive-based compensation for each segment. Incentive-based compensation is accrued over the service period to which it relates. Our discretionary incentive-based compensation generally represents our annual bonus pool, is based on our operating performance and may fluctuate throughout the year until payments are made. The majority of our incentive-based compensation is paid during the fourth quarter. Certain of our senior partners are not paid an annual salary or bonus, instead they only receive distributions based on their ownership interest when declared by our board of directors. We use changes in headcount, which represents the full-time equivalency of active employees during each period, to analyze changes in compensation and benefits. Part I Fee incentive compensation and fee related performance compensation represent approximately 60% of Part I Fees and of fee related performance revenues, respectively, before giving effect to payroll related taxes. Compensation expense also includes employee commissions that are generated in connection with our like-kind 1031 exchange program and other private placement transactions conducted through AWMS. Incremental changes in fair value of certain contingent liabilities established in connection with our various acquisitions are recognized ratably over the service period and are also presented within compensation and benefits.
Equity compensation represents a form of non-cash compensation that we use to align our employees with the long-term interests of our shareholders. Equity-based awards are typically granted in the form of restricted units that generally vest over a service period between three and five years. We issue equity awards with a long-term focus of limiting the average dilutive impact on our Class A common stockholders to no more than 1.5% annually. Because we withhold shares equal to the fair value of our employee tax withholding liabilities and pay the taxes on their behalf in cash, fewer net shares are issued upon vesting. This result has reduced the average annual dilutive impact of these awards to less than 1.0% annually. We expect the expenses recognized in connection with these awards to fluctuate with changes in the price of our Class A common stock.
Performance Related Compensation. Performance related compensation includes compensation directly related to carried interest allocation and incentive fees earned from funds with stated investment periods, generally consisting of percentage interests that we grant to our professionals. Depending on the nature of each fund, the performance related compensation generally represents 60% to 80% of the carried interest allocation and aforementioned incentive fees recognized by us before giving effect to payroll related taxes. We have an obligation to pay our professionals a portion of the carried interest allocation earned from certain funds. The performance related compensation payable is calculated based upon the recognition of carried interest allocation and is not paid to recipients until the carried interest allocation is received. Performance related compensation may include allocations to charitable organizations as part of our philanthropic initiatives.
Although changes in performance related compensation are directly correlated with changes in carried interest allocation and incentive fees reported within our segment results, this correlation does not always exist when our results are reported on a fully consolidated basis in accordance with GAAP. This discrepancy is caused when carried interest allocation
116

Table of Contents
and incentive fees earned from our Consolidated Funds is eliminated upon consolidation and performance related compensation is not.
General, Administrative and Other Expenses. General and administrative expenses include costs primarily related to occupancy, professional services, travel, information services and information technology costs, placement fees, depreciation, amortization of intangibles, supplemental distribution fees and other general operating items. Placement fees are paid to placement agents and include: (i) upfront fees based on commitments to a fund; and (ii) service fees for periodic investor services that are recognized as services are provided. Supplemental distribution fees are paid to brokerage firms, banks or other financial intermediaries for the distribution of shares in our non-traded vehicles and may be calculated on either sales volumes or levels of assets under management.
Expenses of Consolidated Funds. Consolidated Funds’ expenses consist primarily of costs incurred by our Consolidated Funds, including professional services fees, research expenses, trustee fees, travel expenses and other costs associated with organizing and offering these funds.
Other Income (Expense)
Net Realized and Unrealized Gains (Losses) on Investments. A realized gain (loss) may be recognized when all or a portion of our investment is returned to us. Unrealized gains (losses) on investments result from the change in appreciation (depreciation) in the fair value of our investments.
Interest and Dividend Income. Interest and dividend income is primarily generated from investments in CLOs and other strategic investments where we do not serve as general partner. Interest and dividend income are both recognized on an accrual basis to the extent that such amounts are expected to be collected.
Interest Expense. Interest expense includes interest related to our Credit Facility, which has a variable interest rate based upon SOFR plus a credit spread that is adjusted with changes to corporate credit ratings and with the achievement of certain ESG-related targets, and to our senior and subordinated notes, each of which have fixed coupon rates.
Other Income (Expense), Net. Other income (expense), net consists of transaction gains (losses) on the revaluation of assets and liabilities denominated in non-functional currencies and of other non-operating and non-investment related activities, such as bargain purchase gain, changes in fair value of contingent obligations, loss on disposal of assets, among other items.
Net Realized and Unrealized Gains (Losses) on Investments of Consolidated Funds. Realized gains (losses) may arise from dispositions of investments held by our Consolidated Funds. Unrealized gains (losses) are recorded to reflect the change in appreciation (depreciation) of investments held by the Consolidated Funds due to changes in fair value of the investments.
Interest and Other Income of Consolidated Funds. Interest and other incomeof Consolidated Funds primarily includes interest and dividend income generated from the underlying investments of our Consolidated Funds.
Interest Expense of Consolidated Funds. Interest expense primarily consists of interest related to our Consolidated CLOs’ loans payable and, to a lesser extent, revolving credit lines, term loans and notes of other Consolidated Funds. The interest expense of the Consolidated CLOs is solely the responsibility of such CLOs and there is no recourse to us if the CLO is unable to make interest payments.
Income Taxes
AMC is a corporation for U.S. federal income tax purposes (collectively,and is subject to U.S. federal, state and local corporate income taxes at the “Tax Election”), with an effective dateentity level on its share of March 1, 2018 (the “Effective Date”). Although we will be treatednet taxable income. In addition, the AOG entities and certain of AMC’s subsidiaries operate in the U.S. as a corporationpartnerships or disregarded entities for U.S. federal income tax purposes weand as corporate entities in certain foreign jurisdictions. These entities, in some cases, are subject to U.S. state or local income taxes or foreign income taxes. Our effective tax rate is the result of AMC’s net taxable income and the applicable U.S. federal, state and local income taxes as well as, in some cases, foreign income taxes. Net taxable income is based on AMC’s ownership of the AOG entities. As such, our effective tax rate will remainbe directly impacted by changes in AMC’s ownership of the AOG entities and changes to statutory rates in the U.S. and other foreign jurisdictions and, to a limited partnership underlesser extent, income taxes that are recorded for certain affiliated funds and co-investment vehicles that are consolidated in our financial results.
The majority of our Consolidated Funds are not subject to income tax as the funds’ investors are responsible for reporting their share of income or loss. To the extent required by federal, state law. and foreign income tax laws and regulations, certain funds may incur income tax liabilities.

117

Table of Contents
Redeemable and Non-Controlling Interests
Net income (loss) attributable to redeemable and non-controlling interests in Consolidated Funds represents the income (loss) attributable to ownership interests that third parties hold in entities that are consolidated within our consolidated financial statements.
Net income (loss) attributable to redeemable and non-controlling interests in AOG entities represents results attributable to the owners of AOG Units and other ownership interests that are not held by AMC.
In connection with our acquisition of SSG in July 2020, the Tax Election, effective March 1, 2018, we have amended and restated our partnership agreement to, among other things, reflect our new tax classification and change the nameformer owners of our common units and preferred units to common shares and preferred shares, respectively. The terms of such common shares and preferred shares, and the associated rights, otherwise remain unchanged. See “Item 1A. Risk Factors–Our common shareholders do not elect our general partner or, exceptSSG retained a 20% ownership interest in limited circumstances, vote on our general partner’s directors and have limited ability to influence decisions regarding our businesses.”
Asset managers structured as pass-through entities for income tax purposes have historically traded at substantial discounts to asset managers taxed as corporations. Further, we believe that our pass-through tax structure has historically limited our investor universe due to complexities related to this structure. The Tax Election is intended to simplify our tax structure and expand our eligible investor universe and, in turn, enhance our liquidity and trading volume, which may, among other things, provide us with a more liquid and attractive currency for potential strategic transactions to further long term growth. Moreover, we historically have paid corporate level taxes on our fee related earnings, which has averaged over 80% of total fee income since our initial public offering. This, combined with a reduction in the statutory federal corporate tax rate from 35% to 21%, also presented compelling reasons to make the Tax Election in 2018.
Shareholders will receive a final Schedule K-1 reflecting their allocable share of the partnership’s items for the period beginning January 1, 2018 and ending on the day immediately before the Effective Date. On and after the Effective Date, public common shareholders will not have current income tax obligations arising from their investment in Ares Management, L.P. other than on the receipt of distributions treated as dividends for tax purposes, which will be reported on Form 1099-DIV. This change reduces the legal and tax preparation costs associated with Schedule K-1 preparation and simplifies a shareholder’s tax reporting obligations.
We expect that neither Ares Management, L.P. nor its shareholders will recognize a material amount of gain or loss as a result of the Tax Election.
On the Effective Date, the aggregate tax basis of the shares held by a shareholder will equal the aggregate tax basis in such shares immediately before the Effective Date (reduced by the shareholder’s allocable share of our liabilities) and increased by the gain, if any, recognized by such shareholder as a result of the Tax Election. We believe that a shareholder’s holding period in the shares will generally be long-term. There is no assurance, however, that such treatment will be respected by the IRS.
The foregoing discussion is based on our expectation that all the relevant tax requirements for non-recognition treatment will have been met. There is no assurance, however, that such treatment will be respected by the IRS.
The rules governing the U.S. federal income tax treatment of the Tax Election are complex and their application to non-U.S. shareholders, in particular, is unclear. Accordingly, shareholders should consult their tax advisors regarding the tax treatment of the Tax Election in light of their particular situation.
Differences in Taxation of Partnerships and Corporations and Their Owners
An entity treated as a partnership for U.S. federal income tax purposes is not a taxable entity and generally incurs no U.S. federal income tax liability. Instead, each partner is required to take into account its share of items of income, gain, loss and deduction of the partnership in computing its U.S. federal income tax liability, regardless of whether distributions are made to it by the partnership. Distributions by an entity treated as a partnership to a partner are generally not taxable to the partnership or the partner and instead reduce a partner’s adjusted basis in its partnership interest.
An entity treated as a corporation for U.S. federal income tax purposes is a taxable entity and generally pays U.S. federal income tax on its taxable income. The maximum U.S. federal tax rate imposed on the net incomesubsidiary of an AOG entity treated as a corporation was recently changed from 35% to 21% for taxable years beginning after December 31, 2017. Such rate may be further changed in the future. An owner of an entity treated as a corporation generally is not taxed on any income earned by the entity until the entity distributes to it either cash or property. A distribution from an entity treated as a corporation is generally treated as a dividend to the extent it is paid from current or accumulated earnings and profits. We expect any dividends made to individuals and certain other qualifying owners to constitute “qualified dividend” income that is generally taxed at a favorable, lower tax rate than the ordinaryreflected as redeemable interest in AOG entities. Net income tax rate, if the requisite holding periods have been met. If the distribution exceeds current and accumulated

earnings and profits, the excess(loss) attributable to redeemable interest in AOG entities is treated as a nontaxable return of capital, reducing the owner’s tax basis in the stock to the extent of the owner’s tax basis in that stock. Any remaining excess is treated as capital gain. Because entities treated as corporations are taxed on their own taxable income, and because owners of such entities are taxed on any dividends distributed from such entities, there are two levels of potential tax upon income earned by entities treated as corporations.
Following the Effective Date, our shareholders (including holders of Series A Preferred Shares) will be subject to the tax treatment applicable to owners of entities that are treated as corporations described above.
The foregoing description addresses only certain U.S. federal income tax consequences of the Tax Election applicable to shareholders generally. We do not provide tax advice and nothing herein should be considered as such. Each shareholder should consult its tax advisor concerning the particular U.S. federal income, U.S. federal estate or gift, state, local, foreign and other tax consequences of the Tax Election to it.

2017 Tax Cuts and Jobs Act
On December 22, 2017, the Tax Cuts and Jobs Act was enacted into law creating significant and material updates to the Internal Revenue Code. The most significant change is a decrease of the corporate tax rate from 35% to 21%. The reduction in the corporate tax rate is effective for tax years beginning on or after January 1, 2018. We estimated the tax effects of the Tax Cuts and Jobs Act in our fourth quarter tax provision in accordance with our understanding of the changes and guidance available as of the date of this filing. The result was a $0.7 million income tax benefit in the fourth quarter of 2017, the period of enactment of the new tax law. The provisional amount relates to the remeasurement of certain deferred tax assets and liabilitiesallocated based on the new rates at which they are expectedownership percentageattributable to be reversed. Other significant changes are also includedthe redeemable interest. On March 31, 2023, we acquired a portion of the remaining ownership interest in SSG that was retained by the Tax Cutsformer owners of SSG (the “SSG Buyout”), and Jobs Act andwe now own 100% of Ares SSG’s fee-generating business. Following the SSG Buyout, legacy owners of SSG retained an ownership interest in certain non-controlled investments that will continue to be analyzed.reflected as redeemable interests, and the income generated by these investments will continue to be allocated ratably based on ownership.
On December 22, 2017,Net income (loss) attributable to non-controlling interests in AOG entities is generally allocated based on the SEC issued Staff Accounting Bulletin (“SAB”) 118 to address the application of U.S. GAAP in regards to the change in tax law for registrants that do not have allweighted average daily ownership of the necessary information availableother AOG unitholders, except for income (loss) generated from certain joint venture partnerships. Net income (loss) is allocated to analyzeother strategic distribution partners with whom we have established joint ventures based on the respective ownership percentages and calculatebased on the accounting impact for the tax effects of the Tax Cuts and Jobs Act. Under SAB 118, we determined that approximately $0.7 million of deferred tax benefit should be recorded as a result of the remeasurementactivity of certain deferred tax assets and liabilities that are impacted by the reductionmembership interests.
For additional discussion on components of our consolidated results of operations, see “Note 2. Summary of Significant Accounting Policies,” within our consolidated financial statements included in the U.S. federal tax rate at December 31, 2017. Additional work is necessary for a more detailed analysisthis Annual Report on the tax effects of all aspects of the Tax Cuts and Jobs Act. Any subsequent adjustments to these amounts will be recorded to tax expense in the quarter that the required analysis is completed.Form 10-K.
ARCC and American Capital, Ltd. Merger Agreement

On January 3, 2017, ARCC completed its acquisition of American Capital, Ltd. ("ACAS") pursuant to a definitive merger agreement entered into in May 2016 (the "ARCC-ACAS Transaction"). To support the ARCC-ACAS Transaction, we, through our subsidiary Ares Capital Management LLC, which serves as the investment adviser to ARCC, provided $275.2 million of cash consideration to ACAS shareholders upon the closing of the ARCC-ACAS Transaction in accordance with the terms and conditions of the merger agreement. In addition, we agreed to waive up to $10 million per quarter of ARCC's Part I Fees for ten calendar quarters, which began in the second quarter of 2017. We received a favorable private letter ruling from the IRS in the second quarter of 2017 which supports the full deductibility of the $275.2 million support payment in the 2017 tax year.
ConsolidationComponents of Consolidated Results of Operations

Revenues

Management Fees. The investment adviser of our funds generally receives an annual management fee based on a percentage of the fund’s capital commitments, contributed capital, net asset value or invested capital during the investment period, which may then change at the end of the investment period. For certain of our SMAs, we receive an annual management fee based on a percentage of invested capital, contributed capital or net asset value throughout the term of the SMA. We also may receive special fees, including agency and Deconsolidationarrangement fees. In certain circumstances, we are contractually required to offset certain amounts of such special fees against management fees relating to the applicable fund.

The investment adviser of each of our CLOs typically receives annual management fees based on the gross aggregate collateral balance for CLOs, at par, adjusted for cash and defaulted or discounted collateral. The management fees of CLOs accounted for approximately 2% of our total management fees on a consolidated basis and 4% on an unconsolidated basis for the year ended December 31, 2023.
The management fees we receive from our drawdown style funds are typically payable on a quarterly basis over the life of the fund and do not fluctuate with the changes in investment performance of the fund. The investment management agreements we enter into with clients in connection with contractual SMAs may generally be terminated by such clients with reasonably short prior written notice. Typically, terminations do not require liquidation of the SMAs and such SMAs will continue to exist until the underlying investments are liquidated. The management fees we receive from our SMAs are generally paid on a periodic basis (typically quarterly, subject to the termination rights described above) and are based on either invested capital or on the net asset value of the separately managed account.

We receive management fees in accordance with the investment advisory and management agreements of our retail vehicles, including both our publicly-traded and non-traded vehicles, that must be reviewed or approved annually by their independent boards of directors.

Details regarding our management fees from our retail vehicles are presented below:
Annual Fee RateFee Base
ACRE1.50%Stockholders’ equity
AIREIT1.25%NAV
APMF1.40%Total assets (including any assets relating to indebtedness or preferred shares that may be issued) minus liabilities (other than liabilities relating to indebtedness)
ARCC1.50%Total assets (other than cash and cash equivalents)
ARCC Part I Fees20.00%Net investment income (before ARCC Part I Fees and ARCC Part II Fees), subject to a fixed hurdle rate of 1.75% per quarter, or 7.00% per annum. No fees are recognized until ARCC’s net investment income exceeds a 1.75% hurdle rate, with a catch-up provision to ensure that the Company receives 20.00% of the net investment income from the first dollar earned
ARDC1.00%Total assets minus liabilities (other than liabilities relating to indebtedness)
AREIT1.10%NAV
ASIF1.25%NAV
ASIF Part I Fees12.50%Net investment income (before ASIF Part I Fees and ASIF Part II Fees), subject to a fixed hurdle rate of 1.25% per quarter, or 5.00% per annum. No fees are recognized until ASIF’s net investment income exceeds a 1.25% hurdle rate, with a catch-up provision to ensure that the Company receives 12.50% of the net investment income from the first dollar earned
CADC1.25%Total assets minus liabilities (other than liabilities relating to indebtedness)
CADC Part I Fees15.00%Net investment income (before CADC Part I Fees), subject to a fixed hurdle rate of 1.50% per quarter, or 6.00% per annum. No fees are recognized until CADC’s net investment income exceeds the hurdle rate, with a catch-up provision to ensure that the Company receives 15.00% of the net investment income from the first dollar earned

112

Table of Contents
Details regarding our management fees by strategy are presented below:
Fee RateFee Base
Average Remaining Contract Term(1)
Credit Group
Liquid Credit(2)
0.25% - 1.00%Par plus cash or NAV
9.0 years(2)
Alternative Credit0.50% - 1.50%NAV, gross asset value, capital commitments or invested capital4.4 years
U.S. and European Direct Lending(3)
0.75% - 1.50%Invested capital, NAV or total assets (in certain cases, excluding cash and cash equivalents)4.4 years
APAC Credit(4)
1.15% - 2.00%Capital commitments, aggregate cost basis of unrealized portfolio investments or a combination thereof3.7 years
Private Equity Group
Corporate Private Equity(5)
1.50%Capital commitments5.2 years
Special Opportunities(6)
1.50%Invested capital or aggregate cost basis of unrealized portfolio investments7.8 years
APAC Private Equity(7)
1.00% - 2.00%Invested capital, capital commitments or a combination thereof3.9 years
Real Assets Group
Real Estate Equity(8)
0.50% - 1.50%Invested capital, NAV, capital commitments or a combination thereof3.1 years
Real Estate Debt0.50% - 1.00%Invested capital or NAV
N/A(9)
Infrastructure Opportunities(10)
1.00% - 1.50%Capital commitments6.0 years
Infrastructure Debt1.00%Invested capital5.1 years
Secondaries Group
Private Equity, Real Estate, Infrastructure Secondaries and Credit Secondaries(11)
0.50% - 1.25%Capital commitments, invested capital, reported value (largely represents NAV of each fund’s underlying limited partnership interests), called capital plus unfunded commitments or reported value plus unfunded commitments7.2 years
Other Businesses
Ares Insurance Solutions(12)
0.30%Monthly weighted average market value of the assets
N/A(12)
(1)    Represents the average remaining contract term pursuant to the funds’ governing documents within each strategy, excluding perpetual capital vehicles, as of December 31, 2023.
(2)    Liquid credit includes the syndicated loan, high yield bond and multi-asset credit strategies. Fee ranges for syndicated loans generally remain unchanged at the close of the re-investment period. In certain cases, CLOs may be called upon demand by subordinated noteholders prior to the management contract term expiration date. The funds in the high yield bond and multi-asset credit strategies are generally open-ended or managed account structures, which typically do not have investment period termination or management contract expiration dates.
(3)    Following the expiration or termination of the investment period, the fee basis for certain closed-end funds and managed accounts in this strategy generally change either to the aggregate cost or to market value of the portfolio investments.
(4)    Certain funds pay a lower management fee rate on committed capital which increases when such capital is invested. The funds in this strategy are comprised of closed-end funds, with investment period termination or management contract termination dates. The funds also include co-investment accounts with fees ranging from 0.50% to 1.50%, which generally do not include investment period termination or management contract termination dates.
(5)    Fee range represents typical range during the investment period. Management fees for corporate private equity funds generally step down to between 0.75% and 1.25% of the aggregate adjusted cost of unrealized portfolio investments following the earlier to occur of: (i) the expiration or termination of the investment period; and (ii) the activation of a successor fund.
(6)    Fee range represents typical range during the investment period. Management fees for special opportunities funds generally step down to between 1.00% to 1.25% of the invested capital or the aggregate cost basis of unrealized portfolio investments following the expiration or termination of the investment period.
(7)    Fee range represents typical range during the investment period. Management fees for APAC private equity funds generally step down to 2.00% of the aggregate adjusted cost of unrealized portfolio investments following the expiration or termination of the investment period. The funds also include co-investment vehicles with fees rates of 2.00%, which generally do not include investment period termination or management contract termination dates.
(8)    Certain funds pay a lower management fee rate on committed capital which increases when such capital is invested. Following the expiration or termination of the investment period the basis on which management fees are earned for certain closed-end funds, managed accounts and co-investment vehicles in this strategy changes from committed capital to invested capital with no change in the management fee rate. AIREIT and AREIT pay management fees based on NAV plus net capital raised and outstanding from our 1031 exchange programs.
(9)    The funds in this strategy are generally open-ended or managed account structures, which typically do not have investment period termination or management contract expiration dates.
(10)    Fee range represents typical range during the investment period. Certain funds pay a lower management fee rate on committed capital which increases when such capital is invested. The infrastructure opportunities funds generally step down the fee base to the aggregated adjusted cost of unrealized portfolio investments, while retaining the same fee rate, following the expiration or termination of the investment period.
(11)    Funds in each strategy are comprised of closed-end funds with either investment period termination or management contract termination dates and certain open-end accounts that generally do not have termination dates.
(12)    Ares FundsInsurance Solutions earns a tiered management fee that starts at 0.30% and steps down to 0.15% of the monthly weighted average market value. Ares Insurance Solutions generally includes open-ended or managed account structures, which typically do not have investment period termination or management contract expiration dates.
Pursuant
113

Table of Contents
Incentive Fees. The general partners, managers or similar entities of certain of our funds receive performance-based fees. These fees are generally based on the annual investment returns of the applicable fund, subject to GAAP,certain net loss carry-forward provisions, high-watermarks and/or preferred returns. Such performance-based fees may also be based on a fund’s cumulative net investment returns for the measurement period, in some cases subject to a high-watermark or a preferred return. Incentive fees are realized at the end of a measurement period, typically quarterly or annually. Realized incentive fees are generally higher during the second half of the year due to the nature of certain funds that typically realize incentive fees at the end of the calendar year. Once realized, such incentive fees are not subject to repayment. Cash from the realizations is typically received in the period subsequent to the measurement period. Incentive fees are composed of both fee related performance revenues, which are based on perpetual capital, and those incentive fees earned from funds with stated investment periods:

Details regarding our fee related performance revenues are presented below:
Fee RateFee BaseAnnual Hurdle Rate
Credit Group
Open-ended core alternative credit fund15.0%Incentive eligible fund’s profits6.0%
U.S. and European Direct Lending10.0% - 15.0%Incentive eligible fund’s profits5.0% to 8.0%
Real Assets Group
AIREIT and AREIT12.5%Annual investment returns, subject to certain net loss carry-forward provisions5.0%
ACRE20.0%The difference between ACRE’s core earnings (as defined in ACRE’s management agreement) and its shareholders' return on equity8.0%
Secondaries Group
APMF12.5%Annual investment returns, subject to certain net loss carry-forward provisionsN/A

Details regarding our incentive fees earned from funds with stated investment periods, which are generally based on a fund’s eligible profits, are presented below:
Fee RateAnnual Hurdle Rate
Credit Group
Liquid Credit10.0% - 20.0%3.0% to 12.0%
Alternative Credit12.5% - 20.0%5.0% to 7.0%
U.S. and European Direct Lending(1)
10.0% - 15.0%5.0% to 8.0%
Real Assets Group
Real Estate Equity15.0% - 18.0%6.0% to 8.0%
(1) We may receive Part II Fees, which are not paid unless ARCC and ASIF achieve cumulative aggregate realized capital gains (net of cumulative aggregate realized capital losses and aggregate unrealized capital depreciation). For ARCC and ASIF, incentive fees represent 20.0% and 12.5%, respectively, of the cumulative aggregate realized capital gains (net of cumulative aggregate realized losses and aggregate unrealized capital depreciation) and such fees are presented as incentive fees earned from funds with stated investment periods.

Performance Income.We may receive performance income from our funds that may be either incentive fees earned from funds with stated investment periods as described above, or a special allocation of income, which we consolidaterefer to as carried interest. Performance income is recognized when specified investment returns are achieved by the Consolidated fund.
Carried Interest Allocation. Carried interest allocation is recognized based on changes in valuation of our funds’ investments that exceed certain preferred returns as set forth in each respective partnership agreement. Carried interest allocation is based on the amount that would be due to us pursuant to the fund partnership agreement at each period end as if the funds were liquidated at such date. Accordingly, the amount recognized as carried interest allocation reflects our share of the fair value gains and losses of the associated funds’ underlying investments measured at their then-current fair values relative to the fair values as of the end of the prior period. Investment returns of one fund are not offset between or among funds.
Funds intogenerally follow either an American-style waterfall or a European-style waterfall. For American-style waterfalls, the general partner is entitled to receive carried interest after a fund investment is realized if the investors in the fund have received distributions in excess of the capital contributed for such investment and all prior realized investments (plus allocable expenses), as well as the preferred return. For European-style waterfalls, the general partner is entitled to receive carried interest if the investors in the fund have received distributions in an amount equal to all prior capital contributions plus a preferred return.
114

Table of Contents
For most funds, the carried interest is subject to a preferred return ranging from 5.0% to 10.0%, after which there is typically a catch-up allocation to the general partner. Generally, if at the termination of a fund (and in some cases at interim points in the life of a fund), the fund has not achieved investment returns that exceed the preferred return threshold or the general partner receives net profits over the life of the fund in excess of its allocable share under the applicable partnership agreement, the general partner will be obligated to repay an amount equal to the extent the previously distributed carried interest exceeds the amounts to which the general partner is entitled. These repayment obligations may be related to amounts previously distributed to us and our senior professionals and are generally referred to as contingent repayment obligations.
Contingent repayment obligations operate with respect to only a given fund’s net investment performance and carried interest of other funds are not netted for determining this contingent obligation. Although a contingent repayment obligation is several to each person who received a distribution, and not a joint obligation, and our professionals who receive carried interest have guaranteed repayment of such contingent obligation, the governing agreements of our funds generally provide that, if a recipient does not fund his or her respective share, we may have to fund such additional amounts beyond the amount of carried interest we retained, although we generally will retain the right to pursue remedies against those carried interest recipients who fail to fund their obligations.
Certain funds may make distributions to their partners to provide them with cash sufficient to pay applicable federal, state and local tax liabilities attributable to the fund’s income that is allocated to them. These distributions are referred to as tax distributions and are not subject to contingent repayment obligations. Tax distributions from European-style waterfall funds generally precede investors in the fund receiving the preferred return.
Details regarding our carried interest, which is generally based on a fund’s eligible profits, are presented below:
Fee RateAnnual Hurdle Rate
Credit Group
Liquid Credit and Alternative Credit15.0% - 20.0%6.0% to 8.0%
U.S. and European Direct Lending10.0% - 20.0%5.0% to 8.0%
APAC Credit15.0% - 20.0%7.0% to 8.0%
Private Equity Group
Corporate Private Equity, Special Opportunities and APAC Private Equity20.0%8.0%
Real Assets Group
Real Estate10.0% - 20.0%6.0% to 10.0%
Infrastructure15.0% - 20.0%5.0% to 8.0%
Secondaries Group
Private Equity, Real Estate, Infrastructure and Credit Secondaries10.0% - 12.5%8.0%
Other Businesses
Ares Insurance Solutions20.0%8.0%
For detailed discussion of contingencies on carried interest, see “Note 8. Commitments and Contingencies,” within our consolidated financial results as presentedstatements and “Item 1A. Risk Factors—Risks Related to Our Funds—We may need to pay “clawback” or “contingent repayment” obligations if and when they are triggered under the governing agreements with our funds” included in this Annual Report on Form 10‑K. These funds represented approximately 6.4%10-K.
Principal Investment Income (Loss). Principal investment income (loss) consists of our AUM as of December 31, 2017, 3.0% of our management fees and 0.8% of our performance fees for the year ended December 31, 2017. As of December 31, 2017, 2016 and 2015, we consolidated 10, 7 and 5 CLOs, respectively, and 9 private funds. As of December 31, 2017, five of the CLOs were consolidated through risk retention vehicles.
The consolidation of these funds had the impact of increasing interest and otherdividend income of Consolidated Funds, interest expense of Consolidated Funds,and net realized and unrealized gains (losses) on equity method investments where we serve as general partner. Interest and dividend income are recognized on an accrual basis to the extent that such amounts are expected to be collected. A realized gain (loss) may be recognized when all or a portion of our investment is returned to us. Unrealized gains (losses) on investments result from appreciation (depreciation) in the fair value of our investments, as well as reversals of previously recorded unrealized appreciation (depreciation) at the time the gain (loss) on an investment becomes realized.

115

Table of Contents
Administrative, Transaction and Other Fees. Details regarding our administrative, transaction and other fees are presented below:
Administrative feesRepresent fees that we earn for providing administrative services to certain funds and may reflect either an expense reimbursements for costs incurred by certain professionals in performing services for a fund or may be based on fixed percentage of a fund’s invested capital
Transaction feesTypically represent fees earned from the arrangement and origination of loans and are generated primarily from funds within our direct lending and infrastructure debt strategies
Other fees:
Property-related fees represent fees earned within funds in our real estate equity strategies and include the following:
Acquisition feesBased on a percentage of a property’s cost at the time of property acquisition
Development feesBased on a percentage of development costs over the development period
Property management feesBased on tenancy of properties over the time associated property management services are provided
Sale and distribution fees represent fees earned through AWMS for the sale and distribution of fund shares in our non-traded vehicles and include the following:
Sales-based feesBased on a percentage of shares sold to retail investors in our non-traded vehicles. Sales-based fees are reported net of amounts re-allowed to participating broker-dealers for their ongoing shareholder services
Asset-based feesBased on the NAV of the applicable asset class. Asset-based fees are reported net of amounts re-allowed to participating broker-dealers for their ongoing shareholder services
Exchange program feesBased on a percentage of the value associated with the properties transacted through our 1031 exchange programs. Exchange program fees are recognized when investors contribute real property through like-kind 1031 exchanges for fund shares and through other private placements and are composed of a program administration fee and a facilitation fee for advisory services and sales-based efforts, respectively
Expenses
Compensation and Benefits. Compensation generally includes salaries, bonuses, health and welfare benefits, payroll related taxes, equity compensation, Part I Fee incentive compensation and fee related performance compensation expenses. Compensation and benefits expenses are typically correlated to the operating performance of our segments, which is used to determine incentive-based compensation for each segment. Incentive-based compensation is accrued over the service period to which it relates. Our discretionary incentive-based compensation generally represents our annual bonus pool, is based on our operating performance and may fluctuate throughout the year until payments are made. The majority of our incentive-based compensation is paid during the fourth quarter. Certain of our senior partners are not paid an annual salary or bonus, instead they only receive distributions based on their ownership interest when declared by our board of directors. We use changes in headcount, which represents the full-time equivalency of active employees during each period, to analyze changes in compensation and benefits. Part I Fee incentive compensation and fee related performance compensation represent approximately 60% of Part I Fees and of fee related performance revenues, respectively, before giving effect to payroll related taxes. Compensation expense also includes employee commissions that are generated in connection with our like-kind 1031 exchange program and other private placement transactions conducted through AWMS. Incremental changes in fair value of certain contingent liabilities established in connection with our various acquisitions are recognized ratably over the service period and are also presented within compensation and benefits.
Equity compensation represents a form of non-cash compensation that we use to align our employees with the long-term interests of our shareholders. Equity-based awards are typically granted in the form of restricted units that generally vest over a service period between three and five years. We issue equity awards with a long-term focus of limiting the average dilutive impact on our Class A common stockholders to no more than 1.5% annually. Because we withhold shares equal to the fair value of our employee tax withholding liabilities and pay the taxes on their behalf in cash, fewer net shares are issued upon vesting. This result has reduced the average annual dilutive impact of these awards to less than 1.0% annually. We expect the expenses recognized in connection with these awards to fluctuate with changes in the price of our Class A common stock.
Performance Related Compensation. Performance related compensation includes compensation directly related to carried interest allocation and incentive fees earned from funds with stated investment periods, generally consisting of percentage interests that we grant to our professionals. Depending on the nature of each fund, the performance related compensation generally represents 60% to 80% of the carried interest allocation and aforementioned incentive fees recognized by us before giving effect to payroll related taxes. We have an obligation to pay our professionals a portion of the carried interest allocation earned from certain funds. The performance related compensation payable is calculated based upon the recognition of carried interest allocation and is not paid to recipients until the carried interest allocation is received. Performance related compensation may include allocations to charitable organizations as part of our philanthropic initiatives.
Although changes in performance related compensation are directly correlated with changes in carried interest allocation and incentive fees reported within our segment results, this correlation does not always exist when our results are reported on a fully consolidated basis in accordance with GAAP. This discrepancy is caused when carried interest allocation
116

Table of Contents
and incentive fees earned from our Consolidated Funds is eliminated upon consolidation and performance related compensation is not.
General, Administrative and Other Expenses. General and administrative expenses include costs primarily related to occupancy, professional services, travel, information services and information technology costs, placement fees, depreciation, amortization of intangibles, supplemental distribution fees and other general operating items. Placement fees are paid to placement agents and include: (i) upfront fees based on commitments to a fund; and (ii) service fees for periodic investor services that are recognized as services are provided. Supplemental distribution fees are paid to brokerage firms, banks or other financial intermediaries for the distribution of shares in our non-traded vehicles and may be calculated on either sales volumes or levels of assets under management.
Expenses of Consolidated Funds. Consolidated Funds’ expenses consist primarily of costs incurred by our Consolidated Funds, including professional services fees, research expenses, trustee fees, travel expenses and other costs associated with organizing and offering these funds.
Other Income (Expense)
Net Realized and Unrealized Gains (Losses) on Investments. A realized gain (loss) may be recognized when all or a portion of our investment is returned to us. Unrealized gains (losses) on investments result from the change in appreciation (depreciation) in the fair value of our investments.
Interest and Dividend Income. Interest and dividend income is primarily generated from investments in CLOs and other strategic investments where we do not serve as general partner. Interest and dividend income are both recognized on an accrual basis to the extent that such amounts are expected to be collected.
Interest Expense. Interest expense includes interest related to our Credit Facility, which has a variable interest rate based upon SOFR plus a credit spread that is adjusted with changes to corporate credit ratings and with the achievement of certain ESG-related targets, and to our senior and subordinated notes, each of which have fixed coupon rates.
Other Income (Expense), Net. Other income (expense), net consists of transaction gains (losses) on the revaluation of assets and liabilities denominated in non-functional currencies and of other non-operating and non-investment related activities, such as bargain purchase gain, changes in fair value of contingent obligations, loss on disposal of assets, among other items.
Net Realized and Unrealized Gains (Losses) on Investments of Consolidated Funds. Realized gains (losses) may arise from dispositions of investments held by our Consolidated Funds. Unrealized gains (losses) are recorded to reflect the change in appreciation (depreciation) of investments held by the Consolidated Funds due to changes in fair value of the investments.
Interest and Other Income of Consolidated Funds. Interest and other incomeof Consolidated Funds primarily includes interest and dividend income generated from the underlying investments of our Consolidated Funds.
Interest Expense of Consolidated Funds. Interest expense primarily consists of interest related to our Consolidated CLOs’ loans payable and, to a lesser extent, revolving credit lines, term loans and notes of other Consolidated Funds. The interest expense of the Consolidated CLOs is solely the responsibility of such CLOs and there is no recourse to us if the CLO is unable to make interest payments.
Income Taxes
AMC is a corporation for U.S. federal income tax purposes and is subject to U.S. federal, state and local corporate income taxes at the entity level on its share of net taxable income. In addition, the AOG entities and certain of AMC’s subsidiaries operate in the U.S. as partnerships or disregarded entities for U.S. federal income tax purposes and as corporate entities in certain foreign jurisdictions. These entities, in some cases, are subject to U.S. state or local income taxes or foreign income taxes. Our effective tax rate is the result of AMC’s net taxable income and the applicable U.S. federal, state and local income taxes as well as, in some cases, foreign income taxes. Net taxable income is based on AMC’s ownership of the AOG entities. As such, our effective tax rate will be directly impacted by changes in AMC’s ownership of the AOG entities and changes to statutory rates in the U.S. and other foreign jurisdictions and, to a lesser extent, income taxes that are recorded for certain affiliated funds and co-investment vehicles that are consolidated in our financial results.
The majority of our Consolidated Funds are not subject to income tax as the funds’ investors are responsible for reporting their share of income or loss. To the extent required by federal, state and foreign income tax laws and regulations, certain funds may incur income tax liabilities.

117

Table of Contents
Redeemable and Non-Controlling Interests
Net income (loss) attributable to redeemable and non-controlling interests in Consolidated Funds among others, forrepresents the years ended December 31, 2017, 2016income (loss) attributable to ownership interests that third parties hold in entities that are consolidated within our consolidated financial statements.
Net income (loss) attributable to redeemable and 2015. Also, the consolidation of these funds typically has the impact of decreasing management and performance feesnon-controlling interests in AOG entities represents results attributable to the extent such fees were eliminated upon consolidation. owners of AOG Units and other ownership interests that are not held by AMC.
In connection with our acquisition of SSG in July 2020, the former owners of SSG retained a 20% ownership interest in a subsidiary of an AOG entity that is reflected as redeemable interest in AOG entities. Net income (loss) attributable to redeemable interest in AOG entities is allocated based on the ownership percentageattributable to the redeemable interest. On March 31, 2023, we acquired a portion of the remaining ownership interest in SSG that was retained by the former owners of SSG (the “SSG Buyout”), and we now own 100% of Ares SSG’s fee-generating business. Following the SSG Buyout, legacy owners of SSG retained an ownership interest in certain non-controlled investments that will continue to be reflected as redeemable interests, and the income generated by these investments will continue to be allocated ratably based on ownership.
Net income (loss) attributable to non-controlling interests in AOG entities is generally allocated based on the weighted average daily ownership of the other AOG unitholders, except for income (loss) generated from certain joint venture partnerships. Net income (loss) is allocated to other strategic distribution partners with whom we have established joint ventures based on the respective ownership percentages and based on the activity of certain membership interests.
For the actual impact that consolidation hadadditional discussion on components of our consolidated results of operations, see the Consolidating Schedules“Note 2. Summary of Significant Accounting Policies,” within Note 19, “Consolidation”, to our consolidated financial statements included in this Annual Report on Form 10-K.


The assets and liabilities of our Consolidated Funds are held within separate legal entities and, as a result, the liabilities of our Consolidated Funds are non-recourse to us. Generally, the consolidation of our Consolidated Funds has a significant gross-up effect on our assets, liabilities and cash flows but has no net effect on the net income attributable to us. The net economic ownership interests of our Consolidated Funds, to which we have no economic rights, are reflected as non‑controlling interests in the Consolidated Funds in our consolidated financial statements.
We generally deconsolidate funds we advise and CLOs when we are no longer deemed to have a controlling interest in the entity. During the year ended December 31, 2017, there were two Consolidated Funds liquidated or dissolved and no non-VIEs experienced a significant change in ownership or control that resulted in deconsolidation during the period.
The performance of our Consolidated Funds is not necessarily consistent with, or representative of, the combined performance trends of all of our funds.

Managing Business Performance
Non‑GAAP Financial Measures
We use the following non-GAAP measures to assess and track our performance:
Economic Net Income (ENI)
Fee Related Earnings (FRE)
Performance Related Earnings (PRE)
Realized Income (RI)
Distributable Earnings (DE)

These non‑GAAP financial measures supplement and should be considered in addition to and not in lieu of the results of operations, which are discussed further under “—Components of Consolidated Results of Operations” and are prepared in accordance with GAAP. For the specific components and calculations of these non-GAAP measures, as well as a reconciliation of these measures to the most comparable measure in accordance with GAAP, see Note 18, “Segment Reporting,” to our consolidated financial statements included in this Annual Report on Form 10‑K.
Operating Metrics
We monitor certain operating metrics that are common to the alternative asset management industry, which are discussed below.
Assets Under Management
Assets under management refers to the assets we manage. We view AUM as a metric to measure our investment and fundraising performance as it reflects assets generally at fair value plus available uncalled capital. For our funds other than CLOs, our AUM equals the sum of the following:
net asset value (“NAV”) of such funds;
the drawn and undrawn debt (at the fund‑level including amounts subject to restrictions); and
uncalled committed capital (including commitments to funds that have yet to commence their investment periods).
NAV refers to the fair value of all the assets of a fund less the fair value of all liabilities of the fund.
For CLOs, our AUM is equal to subordinated notes (equity) plus all drawn and undrawn debt tranches.
The tables below provide the period-to-period rollforwards of our total AUM by segment for the years ended December 31, 2017, 2016 and 2015 (in millions):
 Credit Group Private Equity Group Real Estate Group Total AUM
Balance at 12/31/2016$60,466
 $25,041
 $9,752
 $95,259
Acquisitions3,605
 
 
 3,605
Net new par/equity commitments8,670
 356
 800
 9,826
Net new debt commitments5,989
 
 509
 6,498
Distributions(10,852) (3,014) (1,599) (15,465)
Change in fund value3,854
 2,147
 767
 6,768
Balance at 12/31/2017$71,732
 $24,530
 $10,229
 $106,491
Average AUM(1)$67,071
 $24,914
 $10,261
 $102,246

 Credit Group Private Equity Group Real Estate Group Total AUM
Balance at 12/31/2015$60,386
 $22,978
 $10,268
 $93,632
Net new par/equity commitments5,453
 2,314
 840
 8,607
Net new debt commitments5,030
 
 225
 5,255
Distributions(11,968) (2,519) (1,813) (16,300)
Change in fund value1,565
 2,268
 232
 4,065
Balance at 12/31/2016$60,466
 $25,041
 $9,752
 $95,259
Average AUM(1)$60,297
 $24,553
 $10,144
 $94,994
 Credit Group Private Equity Group Real Estate Group Total AUM
Balance at 12/31/2014$59,099
 $12,087
 $10,575
 $81,761
Acquisitions
 4,581
 
 4,581
Net new par/equity commitments7,316
 6,700
 1,328
 15,344
Net new debt commitments6,554
 
 105
 6,659
Distributions(11,949) (1,081) (2,072) (15,102)
Change in fund value(634) 691
 332
 389
Balance at 12/31/2015$60,386
 $22,978
 $10,268
 $93,632
Average AUM(1)$60,975
 $17,115
 $10,182
 $88,272
(1) Represents a five-point average of quarter-end balances for each period.
Please refer to “— Results of Operations by Segment” for a more detailed presentation of AUM by segment for each of the periods presented.
The graphs below presents our Incentive Generating AUM and Incentive Eligible AUM by segment as of December 31, 2017, 2016 and 2015 (in millions):

CreditPrivate EquityReal Estate

As of December 31, 2017, 2016 and 2015, our available capital, which we refer to as dry powder, was $25.1 billion, $23.2 billion and $22.4 billion, respectively, primarily attributable to our funds in the Credit Group and the Private Equity Group.
Fee Paying Assets Under Management

The following components generally comprise our FPAUM:
The amount of limited partner capital commitments for certain closed-end funds within the reinvestment period in the Credit Group, funds in the Private Equity Group and certain private funds in the Real Estate Group;
The amount of limited partner invested capital for the aforementioned closed-end funds beyond the reinvestment period as well as the structured assets funds in the Credit Group, certain managed accounts within their reinvestment period, the mezzanine fund in the Credit Group, European commingled funds in the Credit Group and co-invest vehicles in the Real Estate Group;
The gross amount of aggregate collateral balance, for CLOs, at par, adjusted for defaulted or discounted collateral; and
The portfolio value, gross asset value or NAV, adjusted in certain instances for cash or certain accrued expenses, for the remaining funds in the Credit Group, ARCC, certain managed accounts in the Credit Group and certain debt funds in the Real Estate Group.
The tables below provide the period‑to‑period rollforwards of our total FPAUM by segment for the years ended December 31, 2017, 2016 and 2015 (in millions):
 Credit Group Private Equity Group Real Estate Group Total
FPAUM Balance at 12/31/2016$42,709
 $11,314
 $6,540
 $60,563
Acquisitions2,789
 
 
 2,789
Commitments5,060
 7,955
 665
 13,680
Subscriptions/deployment/increase in leverage5,094
 1,122
 582
 6,798
Redemptions/distributions/decrease in leverage(8,733) (1,606) (841) (11,180)
Change in fund value2,322
 (375) 183
 2,130
Change in fee basis209
 (1,552) (940) (2,283)
FPAUM Balance at 12/31/2017$49,450
 $16,858
 $6,189
 $72,497
Average FPAUM(1)$46,598
 $15,886
 $6,547
 $69,031
 Credit Group Private Equity Group Real Estate Group Total
FPAUM Balance at 12/31/2015$39,925
 $12,462
 $6,757
 $59,144
Commitments3,631
 159
 462
 4,252
Subscriptions/deployment/increase in leverage3,712
 93
 630
 4,435
Redemptions/distributions/decrease in leverage(5,815) (665) (1,019) (7,499)
Change in fund value1,316
 (168) (58) 1,090
Change in fee basis(60) (567) (232) (859)
FPAUM Balance at 12/31/2016$42,709
 $11,314
 $6,540
 $60,563
Average FPAUM(1)$40,938
 $11,800
 $6,669
 $59,407
 Credit Group Private Equity Group Real Estate Group Total
FPAUM Balance at 12/31/2014$37,274
 $7,702
 $6,118
 $51,094
Acquisitions
 4,046
 
 4,046
Commitments4,117
 523
 988
 5,628
Subscriptions/deployment/increase in leverage4,139
 691
 803
 5,633
Redemptions/distributions/decrease in leverage(5,242) (414) (797) (6,453)
Change in fund value(57) (31) (68) (156)
Change in fee basis(306) (55) (287) (648)
FPAUM Balance at 12/31/2015$39,925
 $12,462
 $6,757
 $59,144
Average FPAUM(1)$38,328
 $11,155
 $6,208
 $55,691
(1) Represents a five-point average of quarter-end balances for each period.

Please refer to “— Results of Operations by Segment” for detailed information by segment of the activity affecting total FPAUM for each of the periods presented.
The charts below present FPAUM by its fee basis as of December 31, 2017, 2016 and 2015 (in millions):

FPAUM: $72,497FPAUM: $60,563


FPAUM: $59,144


The components of our AUM, including the portion that is FPAUM, are presented below as of December 31, 2017, 2016 and 2015 (in millions):

AUM: $106,491AUM: $95,259


AUM: $93,632


(1) Includes $5.7 billion, $6.4 billion and $9.9 billion of AUM of funds from which we indirectly earn management fees as of December 31, 2017, 2016 and 2015, respectively.

Fund Performance Metrics
Fund performance information for our investment funds that are considered to be “significant funds” is included throughout this discussion with analysis to facilitate an understanding of our results of operations for the periods presented. Our significant funds include those that contributed at least 1% of our total management fees for the year ended December 31, 2017 or comprised at least 1% of the Company’s total FPAUM as of December 31, 2017, and for which we have sole discretion for investment decisions within the fund. In addition to management fees, each of our significant funds may generate performance fees upon the achievement of performance hurdles. The fund performance information reflected in this discussion and analysis is not indicative of our overall performance. An investment in Ares is not an investment in any of our funds. Past performance is not indicative of future results. As with any investment there is always the potential for gains as well as the possibility of losses. There can be no assurance that any of these funds or our other existing and future funds will achieve similar returns.

Components of Consolidated Results of Operations

Revenues

Management Fees.  Management fees are The investment adviser of our funds generally receives an annual management fee based on a defined percentage of average fairthe fund’s capital commitments, contributed capital, net asset value of assets, total commitments,or invested capital NAV,during the investment period, which may then change at the end of the investment period. For certain of our SMAs, we receive an annual management fee based on a percentage of invested capital, contributed capital or net asset value throughout the term of the SMA. We also may receive special fees, including agency and arrangement fees. In certain circumstances, we are contractually required to offset certain amounts of such special fees against management fees relating to the applicable fund.

The investment incomeadviser of each of our CLOs typically receives annual management fees based on the gross aggregate collateral balance for CLOs, at par, adjusted for cash and defaulted or pardiscounted collateral. The management fees of CLOs accounted for approximately 2% of our total management fees on a consolidated basis and 4% on an unconsolidated basis for the year ended December 31, 2023.
The management fees we receive from our drawdown style funds are typically payable on a quarterly basis over the life of the fund and do not fluctuate with the changes in investment performance of the fund. The investment management agreements we enter into with clients in connection with contractual SMAs may generally be terminated by such clients with reasonably short prior written notice. Typically, terminations do not require liquidation of the SMAs and such SMAs will continue to exist until the underlying investments are liquidated. The management fees we receive from our SMAs are generally paid on a periodic basis (typically quarterly, subject to the termination rights described above) and are based on either invested capital or on the net asset value of the investment portfoliosseparately managed by us. The fees are generally based on a quarterly measurement period and amounts can be paid in advance or in arrears depending on each specific fund. Management fees also include ARCC Part I Fees, a quarterly fee on investment income from ARCC, our publicly traded business development company registered under the Investment Company Act, which is managed by our subsidiary. ARCC Part I Fees are equal to 20% of ARCC's net investment income (before ARCC Part I Fees and incentive fees payable based on ARCC’s net capital gains), subject to a fixed “hurdle rate” of 1.75% per quarter, or 7.0% per annum. No fee is earned until ARCC’s net investment income exceeds a 1.75% hurdle rate, with a “catch up” provision such that weaccount.

We receive 20% of ARCC’s net investment income from the first dollar earned. ARCC Part I Fees are classified as management fees as they are predictablein accordance with the investment advisory and are recurring in nature, are not subject to contingent repaymentmanagement agreements of our retail vehicles, including both our publicly-traded and are generally cash-settled each quarter. Management fees are recognized as revenue in the period advisory services are rendered, subject to our assessmentnon-traded vehicles, that must be reviewed or approved annually by their independent boards of collectability. Additional detailsdirectors.

Details regarding our management fees from our retail vehicles are presented below:
Credit Group:
Annual Fee RateFee Base
ACRE1.50%Stockholders’ equity
AIREIT1.25%NAV
APMF1.40%Total assets (including any assets relating to indebtedness or preferred shares that may be issued) minus liabilities (other than liabilities relating to indebtedness)
ARCC1.50%Total assets (other than cash and cash equivalents)
ARCC Part I Fees20.00%Net investment income (before ARCC Part I Fees and ARCC Part II Fees), subject to a fixed hurdle rate of 1.75% per quarter, or 7.00% per annum. No fees are recognized until ARCC’s net investment income exceeds a 1.75% hurdle rate, with a catch-up provision to ensure that the Company receives 20.00% of the net investment income from the first dollar earned
ARDC1.00%Total assets minus liabilities (other than liabilities relating to indebtedness)
AREIT1.10%NAV
ASIF1.25%NAV
ASIF Part I Fees12.50%Net investment income (before ASIF Part I Fees and ASIF Part II Fees), subject to a fixed hurdle rate of 1.25% per quarter, or 5.00% per annum. No fees are recognized until ASIF’s net investment income exceeds a 1.25% hurdle rate, with a catch-up provision to ensure that the Company receives 12.50% of the net investment income from the first dollar earned
CADC1.25%Total assets minus liabilities (other than liabilities relating to indebtedness)
CADC Part I Fees15.00%Net investment income (before CADC Part I Fees), subject to a fixed hurdle rate of 1.50% per quarter, or 6.00% per annum. No fees are recognized until CADC’s net investment income exceeds the hurdle rate, with a catch-up provision to ensure that the Company receives 15.00% of the net investment income from the first dollar earned

Syndicated loans and high yield bonds: Typical
112

Table of Contents
Details regarding our management fees range from 0.35% to 0.65% of par plus cash or NAV. The syndicated loan funds have anby strategy are presented below:
Fee RateFee Base
Average Remaining Contract Term(1)
Credit Group
Liquid Credit(2)
0.25% - 1.00%Par plus cash or NAV
9.0 years(2)
Alternative Credit0.50% - 1.50%NAV, gross asset value, capital commitments or invested capital4.4 years
U.S. and European Direct Lending(3)
0.75% - 1.50%Invested capital, NAV or total assets (in certain cases, excluding cash and cash equivalents)4.4 years
APAC Credit(4)
1.15% - 2.00%Capital commitments, aggregate cost basis of unrealized portfolio investments or a combination thereof3.7 years
Private Equity Group
Corporate Private Equity(5)
1.50%Capital commitments5.2 years
Special Opportunities(6)
1.50%Invested capital or aggregate cost basis of unrealized portfolio investments7.8 years
APAC Private Equity(7)
1.00% - 2.00%Invested capital, capital commitments or a combination thereof3.9 years
Real Assets Group
Real Estate Equity(8)
0.50% - 1.50%Invested capital, NAV, capital commitments or a combination thereof3.1 years
Real Estate Debt0.50% - 1.00%Invested capital or NAV
N/A(9)
Infrastructure Opportunities(10)
1.00% - 1.50%Capital commitments6.0 years
Infrastructure Debt1.00%Invested capital5.1 years
Secondaries Group
Private Equity, Real Estate, Infrastructure Secondaries and Credit Secondaries(11)
0.50% - 1.25%Capital commitments, invested capital, reported value (largely represents NAV of each fund’s underlying limited partnership interests), called capital plus unfunded commitments or reported value plus unfunded commitments7.2 years
Other Businesses
Ares Insurance Solutions(12)
0.30%Monthly weighted average market value of the assets
N/A(12)
(1)    Represents the average managementremaining contract term of 13.1 yearspursuant to the funds’ governing documents within each strategy, excluding perpetual capital vehicles, as of December 31, 20172023.
(2)    Liquid credit includes the syndicated loan, high yield bond and the feemulti-asset credit strategies. Fee ranges for syndicated loans generally remain unchanged at the close of the re-investment period. In certain cases, CLOs may be called upon demand by subordinated noteholders prior to the management contract term expiration date. The funds in the high-yield strategyhigh yield bond and multi-asset credit strategies are generally represent open-ended managed accounts, which typically do not include investment period termination or management contract expiration dates.
Credit opportunities and structured credit: Typical management fees range from 0.45% to 1.50% of NAV, gross asset value, committed capital or invested capital. The funds in the credit opportunities strategy generally include open-ended or managed account structures, which typically do not have investment period termination or management contract expiration dates. The funds in the structured credit strategy include a publicly-traded closed-end fund, which does not include investment period termination or management contract termination dates. The funds in these strategies (excluding ARDC) had an average management contract term of 8.0 years as of December 31, 2017.
U.S and E.U. direct lending: Typical management fees range from 0.50% to 1.50% of invested capital, NAV or total assets.(3)    Following the expiration or termination of the investment period, the fee basis for certain closed-end funds and managed accounts in this strategy generally change either to the aggregate cost or to market value of the portfolio investments. In addition,
(4)    Certain funds pay a lower management fees include the ARCC Part I Fees. Management feesfee rate on the lower end of the typical fee range are generally accompanied by transaction based fees.committed capital which increases when such capital is invested. The funds in this strategy (excluding ARCC) had an averageare comprised of closed-end funds, with investment period termination or management contract term of 8.6 years as of December 31, 2017.
termination dates. The funds also include co-investment accounts with fees ranging from 0.50% to 1.50%, which generally do not include investment period termination or management contract termination dates.
Private Equity Group:
Private Equity funds: Typical management fees(5)    Fee range from 1.50% to 2.00% of total capital commitmentsrepresents typical range during the investment period. The managementManagement fees for corporate private equity funds generally step down to between 0.75% and 1.25% of the aggregate adjusted cost of unrealized portfolio investments following the earlier to occur of: (i) the expiration or termination of the investment period orperiod; and (ii) the launchactivation of a successor fund.
(6)    Fee range represents typical range during the investment period. Management fees for special opportunities funds generally step down to between 1.00% to 1.25% of the invested capital or the aggregate cost basis of unrealized portfolio investments following the expiration or termination of the investment period.
(7)    Fee range represents typical range during the investment period. Management fees for APAC private equity funds generally step down to 2.00% of the aggregate adjusted cost of unrealized portfolio investments following the expiration or termination of the investment period. The powerfunds also include co-investment vehicles with fees rates of 2.00%, which generally do not include investment period termination or management contract termination dates.
(8)    Certain funds pay a lower management fee rate on committed capital which increases when such capital is invested. Following the expiration or termination of the investment period the basis on which management fees are earned for certain closed-end funds, managed accounts and energyco-investment vehicles in this strategy changes from committed capital to invested capital with no change in the management fee rate. AIREIT and AREIT pay management fees based on NAV plus net capital raised and outstanding from our 1031 exchange programs.
(9)    The funds in this strategy are generally open-ended or managed account structures, which typically do not have investment period termination or management contract expiration dates.
(10)    Fee range represents typical range during the investment period. Certain funds pay a lower management fee rate on committed capital which increases when such capital is invested. The infrastructure opportunities funds generally step down the fee base to the aggregated adjusted cost of unrealized portfolio investments, while retaining the same fee rate, following the expiration or termination of the investment period. The funds
(11)    Funds in this strategy had an average management contract term of 11.1 years as of December 31, 2017.
Special situations funds: Typical management fees range from 1.00% to 1.50% of the lesser of the aggregate cost basis of unrealized portfolio investments or committed capital. The funds in thiseach strategy are comprised of closed-end funds with either investment period termination or management contract termination dates. The special situation funds also include manageddates and certain open-end accounts whichthat generally do not includehave termination dates.
(12)    Ares Insurance Solutions earns a tiered management fee that starts at 0.30% and steps down to 0.15% of the monthly weighted average market value. Ares Insurance Solutions generally includes open-ended or managed account structures, which typically do not have investment period termination or management contract terminationexpiration dates. The funds in this strategy had  an average management contract term

113

Table of 8.8 years as of December 31, 2017.Contents
Real Estate Group:
Real EstateIncentive Fees. The general partners, managers or similar entities of certain of our funds: Typical management receive performance-based fees. These fees range from 0.50% to 1.50% of invested capital, stockholders’ equity or total capital commitments. Followingare generally based on the expiration or terminationannual investment returns of the applicable fund, subject to certain net loss carry-forward provisions, high-watermarks and/or preferred returns. Such performance-based fees may also be based on a fund’s cumulative net investment returns for the measurement period, the basis on which

managementin some cases subject to a high-watermark or a preferred return. Incentive fees are earned forrealized at the end of a measurement period, typically quarterly or annually. Realized incentive fees are generally higher during the second half of the year due to the nature of certain closed-end funds managed accounts and co-investment vehicles in this strategy, which paythat typically realize incentive fees based on committed capital, change from committed capital to invested capital with no change inat the management fee rate. The funds in this strategy (excluding ACRE) had an average management contract termend of 11.2 years as of December 31, 2017.
In some instances, we may not record management fees that we have earned when a fund does not have sufficient liquidity to pay management fees or may be restricted by certain covenants from making payment. Managementthe calendar year. Once realized, such incentive fees are not recorded until collectabilitysubject to repayment. Cash from the realizations is assured,typically received in the period subsequent to the measurement period. Incentive fees are composed of both fee related performance revenues, which are based on perpetual capital, and those incentive fees earned from funds with stated investment periods:

Details regarding our fee related performance revenues are presented below:
Fee RateFee BaseAnnual Hurdle Rate
Credit Group
Open-ended core alternative credit fund15.0%Incentive eligible fund’s profits6.0%
U.S. and European Direct Lending10.0% - 15.0%Incentive eligible fund’s profits5.0% to 8.0%
Real Assets Group
AIREIT and AREIT12.5%Annual investment returns, subject to certain net loss carry-forward provisions5.0%
ACRE20.0%The difference between ACRE’s core earnings (as defined in ACRE’s management agreement) and its shareholders' return on equity8.0%
Secondaries Group
APMF12.5%Annual investment returns, subject to certain net loss carry-forward provisionsN/A

Details regarding our incentive fees earned from funds with stated investment periods, which are generally based on a fund’s eligible profits, are presented below:
Fee RateAnnual Hurdle Rate
Credit Group
Liquid Credit10.0% - 20.0%3.0% to 12.0%
Alternative Credit12.5% - 20.0%5.0% to 7.0%
U.S. and European Direct Lending(1)
10.0% - 15.0%5.0% to 8.0%
Real Assets Group
Real Estate Equity15.0% - 18.0%6.0% to 8.0%
(1) We may include meeting certainreceive Part II Fees, which are not paid unless ARCC and ASIF achieve cumulative aggregate realized capital gains (net of cumulative aggregate realized capital losses and aggregate unrealized capital depreciation). For ARCC and ASIF, incentive fees represent 20.0% and 12.5%, respectively, of the cumulative aggregate realized capital gains (net of cumulative aggregate realized losses and aggregate unrealized capital depreciation) and such fees are presented as incentive fees earned from funds with stated investment periods.

Performance Income.We may receive performance conditions. Weincome from our funds that may be either incentive fees earned from funds with stated investment periods as described above, or a special allocation of income, which we refer to these fees as deferred management fees. In future periods,carried interest. Performance income is recognized when specified investment returns are achieved by the fund.
Carried Interest Allocation. Carried interest allocation is recognized based on changes in valuation of our funds’ investments that exceed certain preferred returns as set forth in each respective partnership agreement. Carried interest allocation is based on the amount that would be due to us pursuant to the fund partnership agreement at each period end as if the funds were liquidated at such date. Accordingly, the amount recognized as carried interest allocation reflects our share of the fair value gains and losses of the associated funds’ underlying investments measured at their then-current fair values relative to the fair values as of the end of the prior period. Investment returns of one fund are not offset between or among funds.
Funds generally follow either an American-style waterfall or a European-style waterfall. For American-style waterfalls, the general partner is entitled to receive carried interest after a fund investment is realized if the investors in the fund have received distributions in excess of the capital contributed for such investment and all prior realized investments (plus allocable expenses), as well as the preferred return. For European-style waterfalls, the general partner is entitled to receive carried interest if the investors in the fund have received distributions in an amount equal to all prior capital contributions plus a preferred return.
114

For most funds, the carried interest is subject to a preferred return ranging from 5.0% to 10.0%, after which there is typically a catch-up allocation to the general partner. Generally, if at the termination of a fund (and in some cases at interim points in the life of a fund), the fund has not achieved investment returns that exceed the preferred return threshold or the general partner receives net profits over the life of the fund in excess of its allocable share under the applicable partnership agreement, the general partner will be obligated to repay an amount equal to the extent the previously distributed carried interest exceeds the amounts to which the general partner is entitled. These repayment obligations may be related to amounts previously distributed to us and our senior professionals and are generally referred to as contingent repayment obligations.
Contingent repayment obligations operate with respect to only a given fund’s net investment performance and carried interest of other funds are not netted for determining this contingent obligation. Although a contingent repayment obligation is several to each person who received a distribution, and not a joint obligation, and our professionals who receive carried interest have guaranteed repayment of such contingent obligation, the governing agreements of our funds generally provide that, if a recipient does not fund his or her respective share, we may have to fund such additional amounts beyond the amount of deferred management feescarried interest we retained, although we generally will retain the right to pursue remedies against those carried interest recipients who fail to fund their obligations.
Certain funds may make distributions to their partners to provide them with cash sufficient to pay applicable federal, state and local tax liabilities attributable to the fund’s income that we will record typically increases withis allocated to them. These distributions are referred to as tax distributions and are not subject to contingent repayment obligations. Tax distributions from European-style waterfall funds generally precede investors in the lengthfund receiving the preferred return.
Details regarding our carried interest, which is generally based on a fund’s eligible profits, are presented below:
Fee RateAnnual Hurdle Rate
Credit Group
Liquid Credit and Alternative Credit15.0% - 20.0%6.0% to 8.0%
U.S. and European Direct Lending10.0% - 20.0%5.0% to 8.0%
APAC Credit15.0% - 20.0%7.0% to 8.0%
Private Equity Group
Corporate Private Equity, Special Opportunities and APAC Private Equity20.0%8.0%
Real Assets Group
Real Estate10.0% - 20.0%6.0% to 10.0%
Infrastructure15.0% - 20.0%5.0% to 8.0%
Secondaries Group
Private Equity, Real Estate, Infrastructure and Credit Secondaries10.0% - 12.5%8.0%
Other Businesses
Ares Insurance Solutions20.0%8.0%
For detailed discussion of time the fees were deferred. No material management fees earned were deferred as of December 31, 2017, 2016contingencies on carried interest, see “Note 8. Commitments and 2015.
As of the reporting date, accrued but unpaid management fees, net of management fee reductions and management fee offsets, are included under management fees receivable on the consolidated statements of financial condition. See Note 12, “Related Party Transactions,Contingencies,towithin our consolidated financial statements and “Item 1A. Risk Factors—Risks Related to Our Funds—We may need to pay “clawback” or “contingent repayment” obligations if and when they are triggered under the governing agreements with our funds” included in this Annual Report on Form 10‑K for more information.10-K.
Performance Fees.  Performance fees are based on certain specific hurdle rates as defined in the applicablePrincipal Investment Income (Loss). Principal investment management or partnership agreementsincome (loss) consists of the funds that we manage. Performance fees are recorded on an accrual basis to the extent such amounts are contractually due. The investment returns of most of our funds may be volatile. Performance fees are assessed as a percentage of the investment return of the funds. The performance fee measurement period varies by type of fund and is typically indicative of when realizations are likely to occur. The performance fees from certain Credit Group; credit opportunities funds, structured credit funds and ARCC Part II Fees are measured and realized on an annual basis, typically in the second half of the year. The performance fees from our Credit Group syndicated loans funds, high yield bonds, credit opportunities funds, structured credit funds, managed accounts and Private Equity Group funds are generally measured on an as-if liquidated basis, assuming that the fund was liquidated based on the measurement date net asset value. The performance fees are earned based on cumulative return hurdles and realizations occur as the fund is liquidating. The performance fees for our CLOs are earned based on yearly return hurdles and realizations occur periodically based on the management agreement. For U.S. and E.U. direct lending Credit Group funds, performance fees are measured and distributed on an annual basis. Private Equity Group funds may also distribute performance fees as individual investment realizations occur. For Real Estate Group funds, performance fees are measured at the liquidation of the fund and distributions of performance fees do not occur until all capital is returned to investors. Further, Real Estate Group, Private Equity Group, Credit Group syndicated credit and certain high yield bonds funds may make annual tax distributions based on the tax obligation at year-end and may be greater than the performance fees that were recognized during the year.
Credit Group:
Syndicated loans and high yield bonds: Typical performance fees represent 15% to 20% of each incentive eligible fund’s profits, subject to a preferred return of approximately 12% per annum.
Credit opportunities and structured credit: Typical performance fees represent 10% to 20% of each incentive eligible fund’s profits, subject to a preferred return of approximately 5% to 8% per annum.
U.S. and E.U. direct lending: Typical performance fees represent 10% to 20% of each incentive eligible fund’s profits, or cumulative realized capital gains (net of losses and unrealized capital depreciation), and are subject to a preferred return rate of approximately 5% to 8% per annum.
Private Equity Group:
Private Equity funds: Performance fees represent 20% of each incentive eligible fund’s profits, subject to a preferred return of approximately 8% per annum.
Special situations funds: Performance fees represent 20% of each incentive eligible fund’s profits, subject to a preferred return of approximately 8% per annum.
Real Estate Group:
Real estate funds: Typical performance fees represent 10% to 20% of each incentive eligible fund’s profits, subject to a preferred return of approximately 8% to 10% per annum.

We may be liable to certain funds for previously realized performance fees if the fund’s investment values decline below certain return hurdles, which vary from fund to fund. As of December 31, 2017, 2016 and 2015, if the funds were liquidated at their fair values at that date, there would have been no contingent repayment obligation or liability. When the fair value of a fund’s investment remains constant or falls below certain return hurdles, previously recognized performance fees are reversed. In all cases, each fund is considered separately in evaluating carried interest and potential contingent repayment obligations. For any given period, performance fees could therefore be negative; however, cumulative performance fees can never be negative over the life of a fund. If upon a hypothetical liquidation of a fund’s investments at the then-current fair values previously recognizeddividend income and distributed performance fees would be required to be returned, a liability would be established in our financial statements for the potential contingent repayment obligation that may differ from the amount of revenue that we reverse. At December 31, 2017, 2016 and 2015, if we assumed all existing investments were valued at $0, the total amount of performance fees subject to contingent repayment obligations, net of tax, would have been approximately $476.1 million, $418.3 million and $322.2 million, respectively, of which approximately $370.0 million, $323.9 million and $247.9 million, respectively, would have been reimbursable by professionals who have received such performance fees.
We are entitled to receive incentive fees from certain funds when the return on investment exceeds previous calendar year-end or date of investment high-watermarks. Some of our funds pay annual incentive fees or allocations equal to 10% to 20% of the fund’s profit for the year, subject to a high-watermark. The high-watermark is the highest historical NAV attributable to a fund investor’s account on which incentive fees were paid and represents the measuring floor for all future incentive fees. In these arrangements, incentive fees are recognized when the performance benchmark has been achieved based on the fund’s then-current fair value and are included in performance fees in our consolidated statement of operations. These incentive fees are a component of performance fees in our consolidated financial statements and are treated as accrued until paid.
For any given period, performance fee revenue in our consolidated statement of operations may include reversals of previously recognized performance fees due to a decrease in the value of a particular fund that results in a decrease of cumulative performance fees earned to date. Since many of our fund return hurdles are cumulative, previously recognized fees also may be reversed in a period of appreciation that is lower than the particular fund’s hurdle rate.
Administrative, Transaction and Other Fees. Other fees primarily include revenue from administrative services provided to certain of our affiliated funds that are paid to us, and revenues associated with Real Estate Group activities such as development and construction. In addition, we may receive fees from certain affiliated funds for activities related to fund transactions, such as loan originations. These fees are recognized as revenue in the period the transaction related services are rendered.
Expenses
Compensation and Benefits. Compensation generally includes salaries, bonuses, health and welfare benefits, equity-based compensation, and ARCC Part I Fee incentive compensation expenses. Compensation cost relating to the issuance of restricted units and options is measured at fair value at the grant date, reduced for actual forfeitures, and expensed over the vesting period on a straight-line basis. Phantom equity unit awards are re-measured at the end of each reporting period. Bonuses are accrued for the service period to which they relate. Compensation and benefits expenses are typically correlated to the operating performance of our segments, which is used to determine incentive based compensation for each segment. Our senior partners receive distributions based on their equity interests and are not paid an annual salary or bonus.
Performance Fee Compensation. Performance fee compensation includes compensation directly related to segment performance fees, which generally consists of percentage interests that we grant to our professionals. Depending on the nature of each fund, the performance fee participation is generally structured as a fixed percentage or as an annual award. The liability is calculated based upon the changes to realized and unrealized performance fees but not payable until the performance fees are realized. We have an obligation to pay our professionals a portion of the performance fees earned from certain funds, including performance fees from Consolidated Funds that are eliminated in consolidation.
Although changes in performance fee compensation are directly correlated with changes in performance fees reported within our segment results, this correlation does not always exist when our results are reportedgains (losses) on a fully consolidated basis in accordance with GAAP. This discrepancy is caused by the fact that performance fees earned from our Consolidated Funds are eliminated upon consolidation while performance fee compensation is not eliminated.
General, Administrative and Other Expenses.  General and administrative expenses include costs primarily related to placement fees, professional services, occupancy and equipment expenses, depreciation and amortization expenses, travel and related expenses, communication and information services and otherequity method investments where we serve as general operating items. These expenses are not borne by fund investors.

Expenses of Consolidated Funds.  Consolidated Funds’ expenses consist primarily of costs incurred by our Consolidated Funds, including professional fees, research expenses, trustee fees, travel expenses and other costs associated with administering these funds and with launching new products.
Other Income (Expense)
Interest and Dividend Income.  Interest and dividend incomeconsists of interest income and dividend income primarily generated from investments in products that we manage.partner. Interest and dividend income are recognized on an accrual basis to the extent that such amounts are expected to be collected.
Interest Expense. Interest expense includes interest related to our Credit Facility, which has a variable interest rate based upon a credit spread that is adjusted with changes to corporate credit ratings, to our senior notes, which have a fixed coupon rate, and to our term loans.
Other Income (Expense), Net.  Other income (expense), net consists of transaction gain (loss) and other non-operating and non‑investment related activity, such as loss on disposal of assets and gain (loss) due to the change in fair value of our contingent consideration liabilities.
Net Realized and Unrealized Gain (Loss) on Investments.  Net gain (loss) from investment activities include realized and unrealized gains and losses from our investment portfolio. A realized gain (loss) ismay be recognized when we redeem all or a portion of our investment or when we receive a distribution of capital.is returned to us. Unrealized gains (losses) on investments result from appreciation (depreciation) in the fair value of our investments, as well as reversals of previously recorded unrealized appreciation (depreciation) at the time the gain (loss) on an investment becomes realized.

115

Administrative, Transaction and Other Fees. Details regarding our administrative, transaction and other fees are presented below:
Administrative feesRepresent fees that we earn for providing administrative services to certain funds and may reflect either an expense reimbursements for costs incurred by certain professionals in performing services for a fund or may be based on fixed percentage of a fund’s invested capital
Transaction feesTypically represent fees earned from the arrangement and origination of loans and are generated primarily from funds within our direct lending and infrastructure debt strategies
Other fees:
Property-related fees represent fees earned within funds in our real estate equity strategies and include the following:
Acquisition feesBased on a percentage of a property’s cost at the time of property acquisition
Development feesBased on a percentage of development costs over the development period
Property management feesBased on tenancy of properties over the time associated property management services are provided
Sale and distribution fees represent fees earned through AWMS for the sale and distribution of fund shares in our non-traded vehicles and include the following:
Sales-based feesBased on a percentage of shares sold to retail investors in our non-traded vehicles. Sales-based fees are reported net of amounts re-allowed to participating broker-dealers for their ongoing shareholder services
Asset-based feesBased on the NAV of the applicable asset class. Asset-based fees are reported net of amounts re-allowed to participating broker-dealers for their ongoing shareholder services
Exchange program feesBased on a percentage of the value associated with the properties transacted through our 1031 exchange programs. Exchange program fees are recognized when investors contribute real property through like-kind 1031 exchanges for fund shares and through other private placements and are composed of a program administration fee and a facilitation fee for advisory services and sales-based efforts, respectively
Expenses
Compensation and Benefits. Compensation generally includes salaries, bonuses, health and welfare benefits, payroll related taxes, equity compensation, Part I Fee incentive compensation and fee related performance compensation expenses. Compensation and benefits expenses are typically correlated to the operating performance of our segments, which is used to determine incentive-based compensation for each segment. Incentive-based compensation is accrued over the service period to which it relates. Our discretionary incentive-based compensation generally represents our annual bonus pool, is based on our operating performance and may fluctuate throughout the year until payments are made. The majority of our incentive-based compensation is paid during the fourth quarter. Certain of our senior partners are not paid an annual salary or bonus, instead they only receive distributions based on their ownership interest when declared by our board of directors. We use changes in headcount, which represents the full-time equivalency of active employees during each period, to analyze changes in compensation and benefits. Part I Fee incentive compensation and fee related performance compensation represent approximately 60% of Part I Fees and of fee related performance revenues, respectively, before giving effect to payroll related taxes. Compensation expense also includes employee commissions that are generated in connection with our like-kind 1031 exchange program and other private placement transactions conducted through AWMS. Incremental changes in fair value of certain contingent liabilities established in connection with our various acquisitions are recognized ratably over the service period and are also presented within compensation and benefits.
Equity compensation represents a form of non-cash compensation that we use to align our employees with the long-term interests of our shareholders. Equity-based awards are typically granted in the form of restricted units that generally vest over a service period between three and five years. We issue equity awards with a long-term focus of limiting the average dilutive impact on our Class A common stockholders to no more than 1.5% annually. Because we withhold shares equal to the fair value of our employee tax withholding liabilities and pay the taxes on their behalf in cash, fewer net shares are issued upon vesting. This result has reduced the average annual dilutive impact of these awards to less than 1.0% annually. We expect the expenses recognized in connection with these awards to fluctuate with changes in the price of our Class A common stock.
Performance Related Compensation. Performance related compensation includes compensation directly related to carried interest allocation and incentive fees earned from funds with stated investment periods, generally consisting of percentage interests that we grant to our professionals. Depending on the nature of each fund, the performance related compensation generally represents 60% to 80% of the carried interest allocation and aforementioned incentive fees recognized by us before giving effect to payroll related taxes. We have an obligation to pay our professionals a portion of the carried interest allocation earned from certain funds. The performance related compensation payable is calculated based upon the recognition of carried interest allocation and is not paid to recipients until the carried interest allocation is received. Performance related compensation may include allocations to charitable organizations as part of our philanthropic initiatives.
Although changes in performance related compensation are directly correlated with changes in carried interest allocation and incentive fees reported within our segment results, this correlation does not always exist when our results are reported on a fully consolidated basis in accordance with GAAP. This discrepancy is caused when carried interest allocation
116

and incentive fees earned from our Consolidated Funds is eliminated upon consolidation and performance related compensation is not.
General, Administrative and Other Expenses. General and administrative expenses include costs primarily related to occupancy, professional services, travel, information services and information technology costs, placement fees, depreciation, amortization of intangibles, supplemental distribution fees and other general operating items. Placement fees are paid to placement agents and include: (i) upfront fees based on commitments to a fund; and (ii) service fees for periodic investor services that are recognized as services are provided. Supplemental distribution fees are paid to brokerage firms, banks or other financial intermediaries for the distribution of shares in our non-traded vehicles and may be calculated on either sales volumes or levels of assets under management.
Expenses of Consolidated Funds. Consolidated Funds’ expenses consist primarily of costs incurred by our Consolidated Funds, including professional services fees, research expenses, trustee fees, travel expenses and other costs associated with organizing and offering these funds.
Other Income (Expense)
Net Realized and Unrealized Gains (Losses) on Investments. A realized gain (loss) may be recognized when all or a portion of our investment is returned to us. Unrealized gains (losses) on investments result from the change in appreciation (depreciation) in the fair value of our investments.
Interest and Dividend Income. Interest and dividend income is primarily generated from investments in CLOs and other strategic investments where we do not serve as general partner. Interest and dividend income are both recognized on an accrual basis to the extent that such amounts are expected to be collected.
Interest Expense. Interest expense includes interest related to our Credit Facility, which has a variable interest rate based upon SOFR plus a credit spread that is adjusted with changes to corporate credit ratings and with the achievement of certain ESG-related targets, and to our senior and subordinated notes, each of which have fixed coupon rates.
Other Income (Expense), Net. Other income (expense), net consists of transaction gains (losses) on the revaluation of assets and liabilities denominated in non-functional currencies and of other non-operating and non-investment related activities, such as bargain purchase gain, changes in fair value of contingent obligations, loss on disposal of assets, among other items.
Net Realized and Unrealized Gains (Losses) on Investments of Consolidated Funds. Realized gains (losses) may arise from dispositions of investments held by our Consolidated Funds. Unrealized gains (losses) are recorded to reflect the change in appreciation (depreciation) of investments held by the Consolidated Funds due to changes in fair value of the investments.
Interest and Other Income of Consolidated Funds. Interest and other incomeof Consolidated Funds primarily includes interest and dividend income generated from the underlying investment securities incurred under theinvestments of our Consolidated CLOs' and Consolidated Funds' debt facilities.Funds.
Interest Expense of Consolidated Funds. Interest expense primarily consists of interest related to our Consolidated CLOs’ loans payable and, to a lesser extent, revolving credit lines, term loans and notes of other Consolidated Funds.
Net Realized and Unrealized Gain (Loss) on Investments The interest expense of Consolidated Funds. Net gain (loss) from investment activities of our Consolidated Funds include realized and unrealized gains and losses resulting from their investment portfolios. Realized gains (losses) arise from dispositions of investments held by our Consolidated Funds. Unrealized gains (losses) are recorded to reflect appreciation (depreciation) of investments held by the Consolidated Funds dueCLOs is solely the responsibility of such CLOs and there is no recourse to periodic changes in fair value ofus if the investments, as well as reversals of previously recorded unrealized appreciation (depreciation) of investments upon disposition, when the gain (loss) on an investment becomes realized.CLO is unable to make interest payments.
Income Taxes.  Prior to the effectiveness of the Tax Election,Taxes
AMC is a substantial portion of our earnings flows through to our owners without being subject tocorporation for U.S. federal income tax at the entity level. A portion of our operationspurposes and is conducted through domestic corporations that are subject to corporate level taxesU.S. federal, state and for which we record current and deferredlocal corporate income taxes at the prevailingentity level on its share of net taxable income. In addition, the AOG entities and certain of AMC’s subsidiaries operate in the U.S. as partnerships or disregarded entities for U.S. federal income tax purposes and as corporate entities in certain foreign jurisdictions. These entities, in some cases, are subject to U.S. state or local income taxes or foreign income taxes. Our effective tax rate is the result of AMC’s net taxable income and the applicable U.S. federal, state and local income taxes as well as, in some cases, foreign income taxes. Net taxable income is based on AMC’s ownership of the AOG entities. As such, our effective tax rate will be directly impacted by changes in AMC’s ownership of the AOG entities and changes to statutory rates in the variousU.S. and other foreign jurisdictions and, to a lesser extent, income taxes that are recorded for certain affiliated funds and co-investment vehicles that are consolidated in which these entities operate. our financial results.
The majority of our Consolidated Funds are not subject to income tax as the funds’ investors are responsible for reporting their share of income or loss. To the extent required by federal, state and foreign income tax laws and regulations, certain funds may incur income tax liabilities.
Income taxes are accounted for using the liability method
117

Table of accounting. Under this method, deferred tax assetsContents
Redeemable and liabilities are recognized for the expected future tax consequences of differences between the carrying amounts of assets and liabilities and their respective tax basis, using tax rates in effect for the year in which the differences are expected to reverse. The effect on deferred assets and liabilities of a change in tax rates is recognized in income in the period when the change is enacted. Deferred tax assets are reduced by a valuation allowance when it is more likely than not that some portion or all of the deferred tax assets will not be realized.Non-Controlling Interests
Non-Controlling and Redeemable Interests.Net income (loss) attributable to non-controllingredeemable and redeemablenon-controlling interests in Consolidated Funds represents the income (loss) attributable to ownership interests that third parties hold in entities that are consolidated intowithin our consolidated financial statements.
Net income (loss) attributable to redeemable and non-controlling interests in AOG entities represents results attributable to the owners of AOG Units and other ownership interests that are not held by AMC.
In connection with our acquisition of SSG in July 2020, the former owners of SSG retained a 20% ownership interest in a subsidiary of an AOG entity that is reflected as redeemable interest in AOG entities. Net income (loss) attributable to redeemable interest in AOG entities is allocated based on the ownership percentageattributable to the redeemable interest. On March 31, 2023, we acquired a portion of the remaining ownership interest in SSG that was retained by the former owners of SSG (the “SSG Buyout”), and we now own 100% of Ares SSG’s fee-generating business. Following the SSG Buyout, legacy owners of SSG retained an ownership interest in certain non-controlled investments that will continue to be reflected as redeemable interests, and the income generated by these investments will continue to be allocated ratably based on ownership.
Net income (loss) attributable to non-controlling interests and redeemable interests in Ares Operating GroupAOG entities represents the results attributable to various minority, non-control oriented strategic investment partnersis generally allocated based on the proportionalweighted average daily average ownership of the other AOG unitholders, except for income (loss) generated from certain joint venture partnerships. Net income (loss) is allocated to other strategic distribution partners with whom we have established joint ventures based on the respective ownership percentages and based on the activity of certain membership interests.
For additional discussion on components of our consolidated results of operations, see “Note 2. Summary of Significant Accounting Policies,” within our consolidated financial statements included in this Annual Report on Form 10-K.

Consolidation and Deconsolidation of Ares Operating GroupFunds
Consolidated Funds represented approximately 4% of our AUM as of December 31, 2023, 2% of our management fees and 2% of our carried interest and incentive fees for the year ended December 31, 2023. As of December 31, 2023, we consolidated 28 CLOs, 10 private funds and one SPAC, and as of December 31, 2022, we consolidated 25 CLOs, 10 private funds and one SPAC.
The activity of the Consolidated Funds is reflected within the consolidated financial statement line items indicated by reference thereto. The impact of consolidation also typically will decrease management fees, carried interest allocation and incentive fees reported under GAAP to the extent these amounts are eliminated upon consolidation.
The assets and liabilities of our Consolidated Funds are held within separate legal entities and, as a result, the liabilities of our Consolidated Funds are typically non-recourse to us. Generally, the consolidation of our Consolidated Funds has a significant gross-up effect on our assets, liabilities and cash flows but has no net effect on the net income attributable to us or our stockholders’ equity, except where accounting for a redemption or liquidation preference requires the reallocation of ownership based on specific terms of a profit sharing agreement. The net economic ownership interests of our Consolidated Funds, to which we have no economic rights, are reflected as redeemable and non-controlling interests in the Consolidated Funds within our consolidated financial statements. Redeemable interest in Consolidated Funds represent the shares issued by our SPACs that are redeemable for cash by the public shareholders in the event that the SPAC does not complete a business combination or tender offer associated with shareholder approval provisions.
We generally deconsolidate funds and CLOs when we are no longer deemed to have a controlling interest in the entity. During the year ended December 31, 2023, we deconsolidated one SPAC as a result of liquidation and one private fund as a result of a significant change in ownership. During the year ended December 31, 2022, we did not deconsolidate any entities.

The performance of our Consolidated Funds is not necessarily consistent with, or representative of, the combined performance trends of all of our funds.
For the actual impact that consolidation had on our results and further discussion on consolidation and deconsolidation of funds, see “Note 15. Consolidation” within our consolidated financial statements included herein.
118

Table of Contents
Results of Operations
Consolidated Results of Operations
Although the consolidated results presented below include the results of our operations together with those of the Consolidated Funds and other joint ventures, we separate our analysis of those items primarily impacting the Company from those of the Consolidated Funds.

The following table andpresents our summarized consolidated results of operations ($ in thousands):
Year ended December 31,Favorable (Unfavorable)
20232022$ Change% Change
Total revenues$3,631,884 $3,055,443 $576,441 19%
Total expenses(2,797,858)(2,749,085)(48,773)(2)
Total other income, net499,037 204,448 294,589 144
Less: Income tax expense172,971 71,891 (101,080)(141)
Net income1,160,092 438,915 721,177 164
Less: Net income attributable to non-controlling interests in Consolidated Funds274,296 119,333 154,963 130
Net income attributable to Ares Operating Group entities885,796 319,582 566,214 177
Less: Net income (loss) attributable to redeemable interest in Ares Operating Group entities226 (851)1,077 NM
Less: Net income attributable to non-controlling interests in Ares Operating Group entities411,244 152,892 258,352 169
Net income attributable to Ares Management Corporation Class A and non-voting common stockholders$474,326 $167,541 306,785 183

Year Ended December 31, 2023Compared to Year Ended December 31, 2022
Consolidated Results of Operations of the Company
The following discussion sets forth information regarding our consolidated results of operationsoperations:
Revenues
Year ended December 31,Favorable (Unfavorable)
20232022$ Change% Change
Revenues
Management fees$2,551,150 $2,136,433 $414,717 19%
Carried interest allocation618,579 458,012 160,567 35
Incentive fees276,627 301,187 (24,560)(8)
Principal investment income36,516 12,279 24,237 197
Administrative, transaction and other fees149,012 147,532 1,480 1
Total revenues$3,631,884 $3,055,443 576,441 19
Management Fees. Capital deployment in direct lending funds within the Credit Group led to a rise in FPAUM and additional management fees of $166.1 million for the year ended December 31, 2023 compared to the prior year. Part I Fees contributed $109.6 million to the increase for the year ended December 31, 2023 compared to the prior year. The increase in Part I Fees was primarily due to the increase in pre-incentive fee net investment income generated by ARCC and CADC, driven by an increase in the average size of their portfolios and the impact of rising interest rates, given their primarily floating-rate loan portfolios. Of the total increase in Part I Fees, ASIF contributed $5.1 million as it began generating fees during the third quarter of 2023. Within the Real Assets Group, AIREIT and AREIT contributed additional management fees of $11.4 million for theyear ended December 31, 2023compared to the year ended December 31, 2022 driven by increases in the average capital base of AIREIT and AREIT. Also, management fees from Ares Infrastructure Debt Fund V L.P. (“IDF V”) increased by $9.3 million for theyear ended December 31, 2023 compared to the prior year, primarily driven by deployment of capital. Within the Private Equity Group, the Crescent Point Acquisition contributed $7.4 million to the increase in management fees for the year ended December 31, 2023. For detail regarding the fluctuations of management fees within each of our segments see “—Results of Operations by Segment.”

119

Table of Contents
Carried Interest Allocation. The activity was principally composed of the following ($ in millions):
Year ended December 31, 2023Primary DriversYear ended December 31, 2022Primary Drivers
Credit funds$498.7 
Primarily from six direct lending funds and one alternative credit fund with $28.2 billion of IGAUM generating returns in excess of their hurdle rates. Ares Capital Europe V, L.P. (“ACE V”), Ares Private Credit Solutions II, L.P. (“PCS II”), Ares Sports Media and Entertainment Finance, L.P. and our sixth European direct lending fund generated carried interest allocation of $181.1 million, $37.6 million, $22.0 million and $16.6 million, respectively, driven by net investment income on an increasing invested capital base. Pathfinder I generated carried interest allocation of $66.3 million driven by market appreciation of certain investments and net investment income during the period. Ares Capital Europe IV, L.P. (“ACE IV”) and Ares Private Credit Solutions, L.P. (“PCS I”) generated carried interest allocation of $58.4 million and $45.3 million, respectively, primarily driven by net investment income during the period. Our credit funds have benefited from rising interest rates on predominately floating-rate loans.
$200.0 Primarily from four direct lending funds and one alternative credit fund with $22.4 billion of IGAUM generating returns in excess of their hurdle rates. ACE V generated carried interest allocation of $80.9 million driven by net investment income on an increasing invested capital base. ACE IV, Pathfinder I, Ares Capital Europe III, L.P. (“ACE III”) and PCS I generated carried interest allocation of $60.0 million, $25.7 million, $18.7 million and $6.5 million, respectively, primarily driven by net investment income during the period.
Private equity funds124.6 
Ares Corporate Opportunities Fund VI, L.P. (“ACOF VI”) generated carried interest allocation of $190.0 million, driven by improving operating performance of portfolio companies that primarily operate in the retail and healthcare industries and market appreciation of an investment in a services company. In addition, appreciation of Ares Special Opportunities Fund, L.P. (“ASOF I”) and Ares Special Situations Fund IV, L.P. (“SSF IV”) generated carried interest allocation of $82.7 million and $79.8 million, respectively, predominately driven by market appreciation and improved operating performance of portfolio companies that operate in the services industry. Ares Special Opportunities Fund II, L.P. (“ASOF II”) generated carried interest allocation of $80.9 million, driven by improving operating performance of portfolio companies that operate in the healthcare industry. The appreciation was partially offset by the reversal of unrealized carried interest allocation of $268.1 million from Ares Corporate Opportunities Fund V, L.P. (“ACOF V”), primarily driven by a lower stock price for Savers Value Village, Inc. (“SVV”), and $35.8 million from Ares Corporate Opportunities Fund IV, L.P. (“ACOF IV”), primarily driven by lower operating performance metrics of a portfolio company that operates in the healthcare industry.
187.4 Appreciation across several portfolio company investments, driven by improving operating performance metrics from portfolio companies that primarily operate in industries such as services, technology, retail, healthcare and energy, generated carried interest allocation of $76.9 million from ACOF V, $73.9 million from ACOF VI, $68.5 million from ASOF I and $42.6 million from SSF IV. The appreciation was partially offset by the reversal of unrealized carried interest allocation of $62.4 million and $27.0 million from ACOF IV and Ares Corporate Opportunities Fund III, L.P. (“ACOF III”), respectively, primarily driven by lower stock prices for certain publicly-traded investments.
Real assets funds8.5 IDF V generated carried interest allocation of $37.9 million driven by net investment income during the period. Ares Climate Infrastructure Partners, L.P. (“ACIP I”) generated carried interest allocation of $13.8 million due to market appreciation of certain investments. Appreciation from properties, driven by increasing operating income primarily from industrial and multifamily investments, generated carried interest allocation of $3.1 million from U.S. Real Estate Fund IX, L.P. (“US IX”). The appreciation was partially offset by the reversal of unrealized carried interest allocation of $12.6 million from Ares European Real Estate Fund IV SCSp. (“EF IV”), $5.7 million from Ares Real Estate Opportunity Fund III, L.P. (“AREOF III”), $5.5 million from Ares European Real Estate Fund V SCSp. (“EF V”) and $19.1 million from two European real estate equity funds, primarily driven by lower valuations of certain properties, which were impacted by the market environment.49.6 ACIP I and Ares Energy Investors Fund V, L.P. (“EIF V”) generated carried interest allocation of $38.1 million and $31.8 million, respectively, due to market appreciation of certain investments. Appreciation from properties within real estate equity funds, driven by increasing operating income primarily from industrial and multifamily investments, generated carried interest allocation of $15.0 million from U.S. Real Estate Fund VIII, L.P. (“US VIII”), $7.4 million from US IX and $4.2 million from Ares U.S. Real Estate Fund X, L.P. (“US X”). In addition, realized gains from the sale of properties generated carried interest allocation of $17.3 million from AREOF III. The activity was partially offset by the reversal of unrealized carried interest of $64.4 million from EF V, driven by a lower stock price for one of its publicly-traded investments.
Secondaries funds(13.2)Depreciation across several investments in Landmark Equity Partners XVI, L.P. (“LEP XVI”), led to the reversal of unrealized carried interest of $12.5 million.21.0 Market appreciation of certain investments held in Landmark Real Estate Fund VIII, L.P. (“LREF VIII”) generated carried interest allocation of $32.8 million. The activity was partially offset by the reversal of unrealized carried interest of $18.4 million from LEP XVI, driven primarily by losses from the revaluation of limited partnership interests denominated in foreign currencies.
Carried interest allocation$618.6 $458.0 
120

Table of Contents
Incentive Fees. The activity was principally composed of the following ($ in millions):
Year ended December 31, 2023Primary DriversYear ended December 31, 2022Primary Drivers
Credit funds$248.4 Incentive fees generated from 24 U.S. direct lending funds, ten European direct lending funds and seven alternative credit funds.$101.2 Incentive fees generated from 15 European direct lending funds, 12 U.S. direct lending funds and two alternative credit funds.
Real assets funds15.4 Incentive fees generated from an open-ended industrial real estate fund.199.4 Incentive fees generated from U.S. real estate equity funds, including $140.5 million from AIREIT, $31.6 million from an open-ended industrial real estate fund and $23.7 million from AREIT.
Secondaries funds
12.8 Incentive fees generated from APMF.0.6 Incentive fees generated from a private equity secondaries fund and APMF.
Incentive fees$276.6 $301.2 
Principal Investment Income. The activity for the year ended December 31, 2023 was primarily composed of: (i) appreciation of our investments in certain funds in our European and U.S. direct lending, special opportunities, infrastructure debt and alternative credit strategies; (ii) dividend income from SSF IV and a European real estate fund; (iii) interest income from an open-ended core alternative credit fund; partially offset by (iv) unrealized losses of our investments in certain funds in our corporate private equity and real estate secondaries strategies.
The activity for the year ended December 31, 2022 was primarily composed of appreciation of our investments in certain funds in our infrastructure opportunities strategy, dividend income from various investments in funds within our U.S. direct lending strategy and realized gains from the sale of underlying properties held by funds in our U.S. real estate equity strategy.
Administrative, Transaction and Other Fees. The increase in administrative, transaction and other fees for the year ended December 31, 2023 compared to the prior year was primarily driven by: (i) higher administrative fees of $13.6 million as a result of the deconsolidation of a commercial finance fund during the second quarter of 2023; (ii) an increase of $8.7 million in administrative service fees based on invested capital primarily from certain private funds within our Credit Group, driven by deployment; (iii) higher credit transaction fees of $2.4 million primarily from the infrastructure debt strategy that are generated periodically and relate to the arrangement and origination of loans; partially offset by (iv) lower acquisition and development fees of $11.4 million, resulting from a reduction in property-related activities within certain industrial U.S. real estate equity funds; (v) a decrease of $10.8 million in facilitation fees and program administration fees from reduced sales activity within the 1031 exchange programs associated with our non-traded REITs.
Expenses
Year ended December 31,Favorable (Unfavorable)
20232022$ Change% Change
Expenses
Compensation and benefits$1,486,698 $1,498,590 $11,892 1%
Performance related compensation607,522 518,829 (88,693)(17)
General, administrative and other expenses660,146 695,256 35,110 5
Expenses of Consolidated Funds43,492 36,410 (7,082)(19)
Total expenses$2,797,858 $2,749,085 48,773 2
Compensation and Benefits. The decrease in compensation and benefits was primarily driven by the performance-based, acquisition-related compensation arrangements (“earnouts”) that were established in connection with the acquisition of Black Creek Group’s real estate investment advisory and distribution business (the “Black Creek Acquisition”). The maximum contingent payment associated with the Black Creek Acquisition earnout was achieved and the incremental expense of $218.1 million was recorded during the year ended December 31, 2022. Conversely, the earnout associated with a Landmark private equity secondaries fund was not achieved because revenue targets associated with fundraising did not meet certain thresholds. As a result, the associated compensation expense of $21.0 million was reversed during the year ended December 31, 2022.
Excluding the impact of earnouts as described above, compensation and benefits increased by 14% for the year ended December 31, 2023 compared to the prior year, primarily driven by: (i) an increase in salary expense of $74.4 million, primarily attributable to headcount growth to support the expansion of our business; (ii) higher Part I Fees compensation of $58.3 million; and (iii) higher equity-based compensation expense of $55.6 million as the number of unvested restricted units being amortized
121

Table of Contents
has increased as has the value of these units with our rising stock price. Average headcount increased by 16% to 2,674 professionals for the year-to-date period in 2023 from 2,305 professionals in 2022.

For detail regarding the fluctuations of compensation and benefits within each of our segments see “—Results of Operations by Segment.”
Performance Related Compensation. Changes in performance related compensation are directly associated with the changes in carried interest allocation and incentive fees described above and include associated payroll related taxes as well as carried interest and incentive fees allocated to charitable organizations as part of our philanthropic initiatives.
General, Administrative and Other Expenses. For each year presented, we recognized impairment charges and recorded accelerated amortization expense in connection with acquired intangible assets (as discussed further below). Before giving effect to these costs, general, administrative and other expenses increased by 13% for the year ended December 31, 2023 compared to the prior year. However, due to the recognition of higher impairment charges in the prior year, general, administrative and other expenses over the comparative period has actually decreased by $35.1 million, or 5%, but this trend is not expected to continue.
Travel, marketing and certain fringe benefits collectively increased by $26.8 million for the year ended December 31, 2023 compared to the prior year as we: (i) continued to increase our marketing efforts driven by more investor meetings and events; and (ii) conducted more in-person company meetings and events with a focus on promoting collaboration and integration of acquired businesses. Occupancy costs, information services and information technology costs also increased during the comparative period, to support our growing headcount, the expansion of our business and the build out of our new corporate headquarters. Collectively, these expenses increased by $25.9 million for the year ended December 31, 2023 compared to the prior year. Additionally, professional service fees increased by $9.8 million for the year ended December 31, 2023 compared to 2022 primarily due to the reorganization of our income tax compliance function and to higher consulting fees to support various ongoing initiatives to enhance our operations.
Separately, we expect to incur higher supplemental distribution fees in future periods as we continue to develop our distribution relationships and expand our retail product offerings. These expenses were $20.2 million and increased by $7.3 million for the year ended December 31, 2023 when compared to prior year and will fluctuate with sales volumes and assets under management of our non-traded products.
During the year ended December 31, 2023, we recognized non-cash impairment charges of $78.7 million related to certain intangible assets comprised of: (i) $65.7 million to the fair value of certain client relationships from Landmark in connection with lower expected FPAUM in a private equity secondaries fund from existing investors; (ii) $7.8 million to the carrying value of SSG’s trade name as we rebranded Ares SSG as APAC credit and discontinued the use of the SSG trade name; and (iii) $5.2 million to the fair value of management contracts of certain funds in connection with lower than expected future fee revenue generated from these funds, of which $4.6 million was due to the shortened investment period of an infrastructure debt fund as we directed existing limited partner commitments to other investment vehicles within the strategy. During the year ended December 31, 2022, we recognized non-cash impairment charges of $181.6 million, in connection with intangible assets associated with Landmark’s trade name, management contracts of certain Landmark funds, Black Creek funds and SSG funds and resulted in the amortization expense associated with these intangible assets to decrease in subsequent periods. Excluding the non-cash impairment charges described above, amortization expense decreased by $7.6 million for the year ended December 31, 2023 compared to the prior year, as we no longer recognize amortization expense for the aforementioned intangible assets.
Other Income (Expense)
Year ended December 31,Favorable (Unfavorable)
20232022$ Change% Change
Other income (expense)
Net realized and unrealized gains on investments$77,573 $4,732 $72,841 NM
Interest and dividend income19,276 9,399 9,877 105
Interest expense(106,276)(71,356)(34,920)(49)
Other income, net4,819 13,119 (8,300)(63)
Net realized and unrealized gains on investments of Consolidated Funds262,700 73,386 189,314 258
Interest and other income of Consolidated Funds995,545 586,529 409,016 70
Interest expense of Consolidated Funds(754,600)(411,361)(343,239)(83)
Total other income, net$499,037 $204,448 294,589 144

122

Table of Contents
Net Realized and Unrealized Gains on Investments. The activity for the year ended December 31, 2023 primarily includes a net gain of $70.9 million from our investment in X-energy. AAC I entered into a contract to merge with X-energy that ultimately did not occur as the shareholders of AAC I elected to redeem the investments held in trust in lieu of completing the merger. As the merger was not completed, we directly invested in X-energy. The net gain is primarily a result of the increase in value of various common and preferred equity securities in X-energy. The fair value of these investments are sensitive to changes in underlying assumptions and may demonstrate significant volatility over the short term.

The year ended December 31, 2023 also included: (i) unrealized gains from the appreciation of certain strategic investments in companies that manage portfolios of non-performing loans and real estate owned properties; (ii) unrealized gains and dividend income from our investment in APMF; and partially offset by (iii) unrealized losses from our strategic investment in a U.S. financial technology company.

The activity for the year ended December 31, 2022 reflects unrealized gains from the same strategic investments that manage portfolios of non-performing loans and real estate owned properties and was partially offset by unrealized losses from our investments in the subordinated notes of U.S. CLOs.

Interest Expense. Higher average interest rates driven by rising SOFR rates and a higher average outstanding balance of the Credit Facility contributed to an increase in interest expense for the year ended December 31, 2023 compared to 2022. The issuance of the 2028 Senior Notes in November 2023 also increased interest expense by $4.6 million for the year ended December 31, 2023 compared to the same period in 2022 and will result in interest expense of $8.2 million for the full quarter prospectively.
Other Income, Net. The activity for the years ended December 31, 2017, 20162023 and 2015.2022 primarily included transaction gains (losses) associated with currency fluctuations impacting the revaluation of assets and liabilities denominated in foreign currencies other than an entity’s functional currency. We consolidaterecognized transaction losses for the year ended December 31, 2023 primarily due to the Euro weakening against the British pound for the year-to-date period. Transaction gains for the year ended December 31, 2022 were primarily attributable to the British pound weakening against the Euro.

123

Table of Contents
Income Tax Expense
Year ended December 31,Favorable (Unfavorable)
20232022$ Change% Change
Income before taxes$1,333,063 $510,806 $822,257 161%
Less: Income tax expense172,971 71,891 (101,080)(141)
Net income$1,160,092 $438,915 721,177 164
The increase in income tax expense was attributable to higher pre-tax income allocable to AMC for the year ended December 31, 2023 compared to the prior yearas the income attributed to redeemable and non-controlling interests is generally passed through to partners and not subject to corporate income taxes. The calculation of income taxes is also sensitive to any changes in weighted average daily ownership.
The following table summarizes weighted average daily ownership:
Year ended December 31,
20232022
AMC common stockholders60.83 %59.76 %
Non-controlling AOG unitholders39.17 %40.24 %
The change in ownership was primarily driven by the issuance of Class A common stock in connection with stock option exercises, vesting of restricted stock awards, the completion of the SSG Buyout and the Crescent Point Acquisition. The increase in the weighted average daily ownership for AMC common stockholders was partially offset by the issuance of AOG Units in connection with the settlement of the Black Creek earnout that increased the ownership of AOG Units not held by AMC.
Redeemable and Non-Controlling Interests
Year ended December 31,Favorable (Unfavorable)
20232022$ Change% Change
Net income$1,160,092 $438,915 $721,177 164%
Less: Net income attributable to non-controlling interests in Consolidated Funds274,296 119,333 154,963 130
Net income attributable to Ares Operating Group entities885,796 319,582 566,214 177
Less: Net income (loss) attributable to redeemable interest in Ares Operating Group entities226 (851)1,077 NM
Less: Net income attributable to non-controlling interests in Ares Operating Group entities411,244 152,892 258,352 169
Net income attributable to Ares Management Corporation Class A and non-voting common stockholders$474,326 $167,541 306,785 183

The change in net income attributable to non-controlling interests in AOG entities over the comparative periods was a result of the respective changes in income before taxes and weighted average daily ownership, as presented above.
124

Table of Contents
Consolidated Results of Operations of the Consolidated Funds
The following table presents the results of operations of the Consolidated Funds ($ in thousands):
 Year ended December 31,Favorable (Unfavorable)
20232022$ Change% Change
Expenses of the Consolidated Funds$(43,492)$(36,410)$(7,082)(19)%
Net realized and unrealized gains on investments of Consolidated Funds262,700 73,386 189,314 258
Interest and other income of Consolidated Funds995,545 586,529 409,016 70
Interest expense of Consolidated Funds(754,600)(411,361)(343,239)(83)
Income before taxes460,153 212,144 248,009 117
Less: Income tax expense of Consolidated Funds3,823 331 (3,492)NM
Net income456,330 211,813 244,517 115
Less: Revenues attributable to Ares Management Corporation eliminated upon consolidation188,155 110,809 77,346 70
Other expense, net attributable to Ares Management Corporation eliminated upon consolidation5,688 18,074 12,386 69
General, administrative and other expense attributable to Ares Management Corporation eliminated upon consolidation433 255 (178)(70)
Net income attributable to non-controlling interests in Consolidated Funds$274,296 $119,333 154,963 130

The results of operations of the Consolidated Funds primarily represent activities from certain funds wherethat we are deemed to control. When a fund is consolidated, we reflect the revenues and expenses of the entity on a gross basis, subject to eliminations from consolidation. Substantially all of our results of operations related to the Consolidated Funds are attributable to ownership interests that third parties hold a controlling financial interest.in those funds. The Consolidated Funds are not necessarily the same entitiesfunds in each year presented due to changes in ownership, changes in limited partners'partners’ or investor rights, and the creation andor termination of funds. The consolidation of these funds hadand entities. Accordingly, such amounts may not be comparable for the periods presented, and in any event have no effectmaterial impact on net income attributable to us for the periods presented.
 For the Years Ended December 31, 2017 vs. 2016 2016 vs. 2015
 2017 2016 2015 Favorable (Unfavorable) Favorable (Unfavorable)
     
 $ Change % Change $ Change % Change
Revenues(Dollars in thousands)
Management fees (includes ARCC Part I Fees of $105,467, $121,181, and $121,491 for the years ended December 31, 2017, 2016 and 2015, respectively)$722,419
 $642,068
 $634,399
 $80,351
 13 % $7,669
 1 %
Performance fees636,674
 517,852
 150,615
 118,822
 23 % 367,237
 244 %
Administrative, transaction and other fees56,406
 39,285
 29,428
 17,121
 44 % 9,857
 33 %
Total revenues1,415,499
 1,199,205
 814,442
 216,294
 18 % 384,763
 47 %
Expenses 


Compensation and benefits514,109
 447,725
 414,454
 (66,384) (15)% (33,271) (8)%
Performance fee compensation479,722
 387,846
 111,683
 (91,876) (24)% (276,163) (247)%
General, administrative and other expenses196,730
 159,776
 224,798
 (36,954) (23)% 65,022
 29 %
Transaction support expense275,177
 
 
 (275,177) NM
 
 NM
Expenses of Consolidated Funds39,020
 21,073
 18,105
 (17,947) (85)% (2,968) (16)%
Total expenses1,504,758

1,016,420

769,040
 (488,338) (48)% (247,380) (32)%
Other income (expense) 


Net realized and unrealized gain on investments67,034
 28,251
 17,009
 38,783
 137 % 11,242
 66 %
Interest and dividend income12,715
 23,781
 14,045
 (11,066) (47)% 9,736
 69 %
Interest expense(21,219) (17,981) (18,949) (3,238) (18)% 968
 5 %
Debt extinguishment expense
 
 (11,641) 
 NM
 11,641
 NM
Other income, net19,470
 35,650
 21,680
 (16,180) (45)% 13,970
 64 %
Net realized and unrealized gain (loss) on investments of Consolidated Funds100,124
 (2,057) (24,616) 102,181
 NM
 22,559
 NM
Interest and other income of Consolidated Funds187,721
 138,943
 117,373
 48,778
 35 % 21,570
 18 %
Interest expense of Consolidated Funds(126,727) (91,452) (78,819) (35,275) (39)% (12,633) (16)%
Total other income239,118

115,135

36,082
 123,983
 108 % 79,053
 219 %
Income before taxes149,859

297,920

81,484
 (148,061) (50)% 216,436
 266 %
Income tax expense (benefit)(23,052) 11,019
 19,064
 34,071
 NM
 8,045
 42 %
Net income172,911

286,901

62,420
 (113,990) (40)% 224,481
 NM
Less: Net income (loss) attributable to non-controlling interests in Consolidated Funds60,818
 3,386
 (5,686) 57,432
 NM
 9,072
 NM
Less: Net income attributable to redeemable interests in Ares Operating Group entities
 456
 338
 (456) NM
 118
 35 %
Less: Net income attributable to non-controlling interests in Ares Operating Group entities35,915
 171,251
 48,390
 (135,336) (79)% 122,861
 254 %
Net income attributable to Ares Management, L.P.76,178

111,808

19,378
 (35,630) (32)% 92,430
 NM
Less: Preferred equity distributions paid21,700
 12,176
 
 (9,524) (78)% 12,176
 NM
Net income attributable to Ares Management, L.P. common unitholders$54,478

$99,632

$19,378
 (45,154) (45)% 80,254
 NM
NM - Not Meaningful

The following two sections discuss the year-over-year fluctuations of our consolidated results of operations for 2017 compared to 2016, as well as 2016 compared to 2015. Additional details behind the fluctuations attributable to a particular segment are included in "—Results of Operations by Segment" for each of the segments.
Year Ended December 31, 2017Compared to Year Ended December 31, 2016
Revenues
Management Fees.  Total management fees increased by $80.4 million, or 13%, to $722.4 million, after giving effect to an increase in management fees of $5.0 million that were eliminated upon consolidation, for the year ended December 31, 2017 compared to year ended December 31, 2016. Segment management fees attributable to the Private Equity Group and Credit Group increased by $50.7 million and $36.8 million, respectively, and segment management fees attributable to the Real Estate Group decreased by $2.1 million compared to the year ended December 31, 2016. For more detail regarding the fluctuations of management fees within each of the segments see "—Results of Operations by Segment."
Performance Fees.  Performance fees increased by $118.8 million, or 23%, to $636.7 million, after giving effect to an increase in performance fees of $4.0 million that were eliminated upon consolidation, for the year ended December 31, 2017 compared to year ended December 31, 2016. Segment performance fees attributable to the Real Estate Group, Private Equity Group and Credit Group increased by $61.0 million, $60.2 million and $1.0 million, respectively, compared to the year ended December 31, 2016. For more detail regarding the fluctuations of performance fees within each of the segments see "—Results of Operations by Segment."
Administrative, Transaction and Other Fees.  Administrative, transaction and other fees increased by $17.1 million, or 44%, to $56.4 million for the year ended December 31, 2017 compared to the year ended December 31, 2016. The increase was primarily due to a $9.7 million increase in fees associated with certain funds within the U.S. and E.U. direct lending groups, from which we earned transaction fees of $18.2 million for the year ended December 31, 2017 compared to $8.5 million for the year ended December 31, 2016. We began to recognize transaction-based fees from certain direct lending funds in the fourth quarter of 2016. These fees will change with the level of deployed capital and the number of new funds, however we do not earn this fee from each fund. In addition, administrative fees included $30.7 million of compensation and benefits expense reimbursements for the year ended December 31, 2017, of which $7.7 million related to temporary employees that were assisting with the integration of ACAS into ARCC. Comparatively, administrative fee reimbursements offsetting compensation and benefits was $23.9 million for the year ended December 31, 2016.
Expenses
Compensation and Benefits.  Compensation and benefits expenses increased by $66.4 million, or 15%, to $514.1 million for the year ended December 31, 2017 compared to the year ended December 31, 2016. The increase was due to an increase in headcount, including an additional $16.8 million attributable to employees hired in connection with ARCC's acquisition of ACAS, of which $7.7 million related to temporary employees assisting with the integration. In addition, equity compensation increased $21.6 million due to restricted stock units granted as part of a one-time grant to certain employees in the current year.
Performance Fee Compensation.  Performance fee compensation increased by $91.9 million, or 24%, to $479.7 million for the year ended December 31, 2017 compared to year ended December 31, 2016. The change in performance fee compensation expense directly correlates with the change in our performance fees before giving effect to the performance fees earned from our Consolidated Funds that are eliminated upon consolidation.
General, Administrative and Other Expenses. General, administrative and other expenses increased by $37.0 million, or 23%, to $196.7 million for the year ended December 31, 2017 compared to the year ended December 31, 2016. The increase was attributable to an increase of placement fees of $13.3 million primarily due to the fundraising on two funds within our Credit Group during the current year. We incurred expenses of $4.4 million in connection with the operations of a new joint venture distribution platform. The platform will be used to raise capital for registered investment companies through independent brokerage networks. The first such fund, a direct lending closed end fund, was launched in 2017. Diligence related costs associated with potential acquisitions and capital transactions increased by $4.0 million. Also impacting the year ended December 31, 2017 was a $2.5 million one-time non-income tax expense. The remaining portion of the increase in expense was a result of additional occupancy-related and support costs associated with an increase in headcount. Total headcount increased by 8%, to more than 1,000 employees as of December 31, 2017 compared to total headcount as of December 31, 2016.


Transaction Support Expense. Transaction support expense represents a one-time payment of $275.2 million that we made, through our subsidiary Ares Capital Management LLC, to ACAS shareholders during the first quarter of 2017 upon the closing of ARCC’s acquisition of ACAS. In connection with this acquisition, our AUM increased by $3.6 billion and FPAUM increased by $2.8 billion at closing. No similar expenses were incurred in the year ended December 31, 2016.
Expenses of Consolidated Funds. Expenses of the Consolidated Funds increased by $17.9 million, or 85%, to $39.0 million for the year ended December 31, 2017 compared to the year ended December 31, 2016. The increase was primarily due to increased organizational and offering costs incurred to launch four new funds that we began consolidating in 2017 compared to organizational and offering costs incurred to launch two new funds that we began consolidating in 2016.
Other Income (Expense)
When evaluating the changes in other income (expense), we separately analyze the other income (expense) generated by the Company from the investment returns generated by our Consolidated Funds.
Net Realized and Unrealized Gain on Investments. Net gain on investments of the Company increased by $38.8 million to $67.0 million for the year ended December 31, 2017 compared to $28.3 million for the year ended December 31, 2016. The increase was primarily attributable to ACOF III, which had increases in net returns of $32.2 million for the year ended 2017 due to market appreciation in one of its portfolio companies that completed its initial public offering.
Interest and Dividend Income. Investment and dividend income of the Company decreased by $11.1 million from $23.8 million for the year ended December 31, 2016 to $12.7 million for the year ended December 31, 2017. The decrease was driven by a $14.2 million decrease in interest and dividend income received from our investment in ACOF III for the year ended December 31, 2017 compared to the year ended December 31, 2016. Recapitalization of portfolio companies within ACOF III caused increased disbursements during the year ended December 31, 2016 that did not recur in 2017. The decrease was offset by an increase of $2.1 million of interest income compared to the year ended December 31, 2016 from investments in our syndicated loan strategies, which increased as a result of our compliance with risk retention requirements.
Interest Expense. Interest expense increased by $3.2 million to $21.2 million for the year ended December 31, 2017 compared to $18.0 million for the year ended December 31, 2016. The increase in interest expense was primarily due to CLO term loan balance increasing from $61.1 million as of December 31, 2016 to $160.9 million as of December 31, 2017. CLO term loans entered in 2017 were in connection with risk retention requirements.
Other Income (Expense), Net. Other income of the Company decreased by $16.2 million, or 45%, to $19.5 million for the year ended December 31, 2017 compared to the year ended December 31, 2016. The decrease was primarily due to gains of $16.2 million for the year ended December 31, 2016 compared to losses of  $1.7 million from the revaluation of certain assets and liabilities denominated in foreign currencies. In 2016, the Brexit vote caused exchange rate fluctuations that resulted in the strengthening of the U.S. dollar against foreign currencies in which we conduct business, primarily the British pounds sterling and the Euro. That strengthening of the U.S. dollar against these foreign currencies resulted in gains in 2016. In 2017, a portion of these gains reversed as the British pounds sterling and the Euro strengthened against the U.S. dollar. The impact was partially mitigated by reductions in liabilities denominated in foreign currencies during 2017.
Net Realized and Unrealized Gain (Loss) on Investments of Consolidated Funds. Net gain (loss) on investments of the Consolidated Funds increased $102.2 million from a net investment loss of $2.1 million for the year ended December 31, 2016 to a net investment gain of $100.1 million for the year ended December 31, 2017. The increase was driven by unrealized appreciation on certain investments of $38.5 million in an Asian corporate private equity fund and an increase in net realized and unrealized gains of $47.1 million in an E.U. direct lending fund due to the strengthening Euro for the year ended December 31, 2017 compared to the year ended December 31, 2016. The remaining portion of the increase was primarily attributable to the impact of unrealized gains from investments in funds we began consolidating in 2017.
Interest and Other Income of Consolidated Funds. Interest income and other income of the Consolidated Funds increased by $48.8 million, or 35%, to $187.7 million for the year ended December 31, 2017 compared to the year ended December 31, 2016. The increase was primarily driven by $28.8 million of interest income from funds we began consolidating in 2017 in addition to the impact of a full year of interest income from funds we began consolidating late in 2016. Also contributing to the increase was income from an Asian corporate private equity investment. These increases were offset by a decrease in interest income from the liquidation of a Consolidated Fund during the year ended December 31, 2017.
Interest Expense of Consolidated Funds. Interest expense of the Consolidated Funds increased by $35.3 million, or 39%, to $126.7 million for the year ended December 31, 2017 compared to the year ended December 31, 2016. The increase was driven

by interest expense from new borrowing arrangements for four new funds combined with a full year of interest expense from two new funds that we began consolidating in 2016.
Income Tax Expense (Benefit).  Not all Company and Consolidated Fund entities are subject to taxes. As a result, income taxes may not move in tandem with income before taxes. Specifically, the Company’s investment income and performance fees, prior to the effectiveness of the Tax Election, are generally not subject to income tax.
Income tax benefit was $23.1 million for the year ended December 31, 2017 compared to income tax expense of $11.0 million for the year ended December 31, 2016. The tax benefit for the year ended December 31, 2017 was largely driven by the pre-tax losses recognized by AHI, a U.S. taxable entity, resulting from the $275.2 million transaction support payment made in connection with ARCC's acquisition of ACAS.
Non-Controlling and Redeemable Interests.  Net income attributable to non-controlling and redeemable interests in Ares Operating Group entities represents results attributable to the owners of AOG Units that are not held by Ares Management L.P. and is allocated based on the weighted average daily ownershipCorporation.

125

Table of the AOG unitholders. The former owners of Indicus Advisors, LLP (“Indicus”), a company we acquired in 2011, exercised the put option on their redeemable interest during the third quarter of 2016, at which time the redeemable interest in Ares Operating Group entities ceased to exist.Contents
Net income attributable to non-controlling and redeemable interests in Ares Operating Group entities decreased $135.3 million, from $171.3 million for the year ended December 31, 2016 to $35.9 million for the year ended December 31, 2017. Net income attributable to non-controlling interests decreased by a higher percentage than net income of the Company for the comparative period due to the the tax benefits recognized by AHI being solely attributable to the Company. The weighted average daily ownership for non-controlling and redeemable AOG unitholders was 61.4% for the year ended December 31, 2017 compared to 62.0% for the year ended December 31, 2016.

Year Ended December 31, 2016Compared to Year Ended December 31, 2015
Revenues
Management Fees.  Total management fees increased by $7.7 million, or 1%, to $642.1 million for the year ended December 31, 2016 compared to year ended December 31, 2015. The increase is primarily due to strong deployment of capital and new funds launched within the U.S. and E.U. direct lending strategy during the year ended December 31, 2016. The increase was partially offset by a decline in Private Equity Group management fees, due to an extension of ACOF II's term that included fee waivers beginning in the first quarter of 2016. Management fees from the Real Estate Group remained relatively flat year over year.
Performance Fees.  Performance fees increased by $367.2 million, or 244%, to $517.9 million for the year ended December 31, 2016 compared to year ended December 31, 2015.  The Private Equity Group had an increase in performance fees of $303.7 million compared to the year ended December 31, 2015 due primarily to increases of $203.3 million and $70.4 million in performance fees attributable to Ares Corporate Opportunities Fund IV, L.P. ("ACOF IV") and Ares Corporate Opportunities Fund III (“ACOF III”), respectively, due to stronger performance of the underlying portfolio companies. In addition, the Credit Group and Real Estate Group experienced increases in performance fees of $54.6 million and $8.8 million, respectively, over the prior year.
Administrative, Transaction and Other Fees.  Administrative, transaction and other fees increased by $9.9 million, or 33%, to $39.3 million for the year ended December 31, 2016 compared to the year ended December 31, 2015,  primarily due to an increase in fees associated with certain illiquid credit funds within the Credit Group, from which we earned transaction fees of approximately $8.5 million for the year ended December 31, 2016. Transaction fees based on loan originations were a new source of revenue in 2016 that we expect to continue in future periods.
Expenses
Compensation and Benefits.  Compensation and benefits expenses increased by $33.3 million, or 8%, to $447.7 million for the year ended December 31, 2016 compared to the year ended December 31, 2015. The increase was primarily due to an increase in headcount, which drove increases in incentive based compensation and salary and benefit expenses. The employee headcount of OMG increased as part of an effort to reduce our reliance on professional service providers by internalizing certain corporate support functions.

Performance Fee Compensation.  Performance fee compensation increased by $276.2 million, or 247%, to $387.8 million for the year ended December 31, 2016 compared to year ended December 31, 2015. The change in performance fee compensation expense directly correlates with the change in our performance fees before giving effect to the performance fees earned from our Consolidated Funds that are eliminated upon consolidation.
General, Administrative and Other Expenses. General, administrative and other expenses decreased by $65.0 million, or 29%, to $159.8 million for the year ended December 31, 2016 compared to the year ended December 31, 2015. The decrease was primarily due to $35.9 million of costs incurred in 2015 associated with discontinued merger efforts that did not recur in 2016. Depreciation and amortization expenses also decreased $19.6 million, including a $5.9 million reduction of accelerated amortization, due to certain intangible assets becoming fully amortized in 2015. Additionally, professional fees decreased $5.0 million primarily due to costs associated with the initial adoption of Sarbanes-Oxley in the prior year.
Expenses of Consolidated Funds. Expenses of the Consolidated Funds increased by $3.0 million, or 16%, to $21.1 million for the year ended December 31, 2016 compared to the year ended December 31, 2015. The increase was primarily due to organizational and offering costs incurred to launch new funds in 2016. The increase was partially offset by a reduction in professional fee expenses of the funds in 2016.
Other Income (Expense)
When evaluating the changes in other income (expense), we separately analyze the other income generated by the Company from the investment returns generated by our Consolidated Funds.
Net Realized and Unrealized Gain (Loss) on Investments. Net gain on investments of the Company increased by $11.2 million to $28.3 million for the year ended December 31, 2016 compared to $17.0 million for the year ended December 31, 2015. The increase is primarily attributable to our special situations funds and syndicated loan funds, which had net losses of $16.9 million and $0.5 million, respectively, in 2015 and net gains of $5.7 million and $6.2 million, respectively, in the current year. Partially offsetting these increases, was a $20.0 million realized loss in 2016 related to our minority interest equity method investment in Deimos Management Holdings LLC due to the winding down of its operations.
Interest and Dividend Income. Interest and dividend income of the Company increased by $9.7 million, or 69%, to $23.8 million for the year ended December 31, 2016 compared to the year ended December 31, 2015. The increase was primarily due to a $10.7 million increase in dividends and interest income from our investments in the Private Equity Group funds, including a $10.0 million increase in dividends and interest income from our investment in ACOF III for the year ended December 31, 2016 compared to the prior year period.
Interest Expense. Interest expense of the Company decreased by $1.0 million, or 5%, to $18.0 million for the year ended December 31, 2016 compared to year ended December 31, 2015. The decrease in interest expense was caused by the repayment of notes in connection with terminating a merger agreement in 2015.
Other Income (Expense), Net. Other income of the Company increased by $14.0 million, or 64%, to $35.7 million for the year ended December 31, 2016 compared to the year ended December 31, 2015. The increase was due to $16.2 million of transaction gains from the revaluation of certain assets and liabilities denominated in foreign currencies as a result of the strengthening U.S. dollar for the year ended December 31, 2016 compared to a net transaction loss of $0.3 million for the year ended December 31, 2015. Partially offsetting this increase, was a decrease in the gain recognized as a result of the revaluation of our contingent consideration liability related to the Energy Investors Funds ("EIF") acquisition. Due to lower than expected commitment period management fee revenue, we reduced our contingent consideration liability in each year, resulting in gains of $17.8 million and $21.1 million recognized during the years ended December 31, 2016 and 2015, respectively.
Net Realized and Unrealized Gain (Loss) on Investments of Consolidated Funds. Net loss on investments of the Consolidated Funds decreased $22.6 million from a net investment loss of $24.6 million for the year ended December 31, 2015 to a net investment loss of $2.1 million for the year ended December 31, 2016. The decrease is primarily driven by an increase in valuation of the underlying investments in one of our Credit Group's Consolidated Funds.
Interest and Other Income of Consolidated Funds. Interest income and other income of Consolidated Funds increased by $21.6 million, or 18%, to $138.9 million for the year ended December 31, 2016 compared to the year ended December 31, 2015. The increase is primarily driven by additional dividend income received by certain Consolidated Funds in our Credit Group.

Interest Expense of Consolidated Funds. Interest expense of Consolidated Funds increased by $12.6 million, or 16%, to $91.5 million for the year ended December 31, 2016 compared to the year ended December 31, 2015. The increase was driven by interest expense from the two new funds that we began consolidating in 2016.
Income Tax Expense (Benefit).  Not all Company and Consolidated Fund entities are subject to taxes. As a result, income taxes may not move in tandem with income before taxes. Specifically, the Company’s investment income and performance fees, prior to the effectiveness of the Tax Election, are generally not subject to income tax.
Income tax expense was $11.0 million for the year ended December 31, 2016 compared to $19.1 million for the year ended December 31, 2015. The decrease was primarily attributable to the recognition of a deferred tax benefit resulting from an agreement between Ares Management, L.P. and a subsidiary whereby the subsidiary will remit cash for shares awarded under its Equity Incentive Plan, ultimately providing for a difference between taxable income and GAAP income that was recorded as a reduction to the income tax provision.
Non-Controlling and Redeemable Interests.  Net income attributable to non-controlling and redeemable interests in Ares Operating Group entities represents results attributable to the owners of Ares Operating Group Units ("AOG Units") that are not held by Ares Management, L.P. and is allocated based on the weighted average daily ownership of the AOG unitholders. The former owners of Indicus Advisors, LLP (“Indicus”), a company we acquired in 2011, exercised the put option on their redeemable interest during the third quarter of 2016, at which time the redeemable interest in Ares Operating Group entities ceased to exist.
Net income attributable to non-controlling and redeemable interests in Ares Operating Group entities increased $123.0 million, from $48.4 million for the year ended December 31, 2015 to $171.3 million for the year ended December 31, 2016. The weighted average daily ownership for non-controlling and redeemable AOG unitholders was 62.0% for the year ended December 31, 2016 compared to 62.1% for the year ended December 31, 2015.

Segment Analysis
Under GAAP, we are required to consolidate entities where we have both significant economics and the power to direct the activities of the entity that impact economic performance. For more information regarding consolidation principles, see Note 2, “Summary of Significant Accounting Policies,” to our consolidated financial statements included in this Annual Report on Form 10‑K.
For segment reporting purposes, revenues and expenses are presented on a basis before giving effect to the results of our Consolidated Funds.Funds and the results attributable to non-controlling interests of joint ventures that we consolidate. As a result, segment revenues from management fees, fee related performance feesrevenues, performance income and investment income are greaterdifferent than those presented on a consolidated basis in accordance with GAAP because revenuesGAAP. Revenues recognized from Consolidated Funds are eliminated in consolidation.consolidation and those attributable to the non-controlling interests of joint ventures have been excluded by us. Furthermore, expenses and the effects of other income (expense) are different than related amounts presented on a consolidated basis in accordance with GAAP due to the exclusion of the results of Consolidated Funds.Funds and the non-controlling interests of joint ventures.
Discussed below are our results of operations for each of our three reportable segments. In addition toNon-GAAP Financial Measures
We use the three segments, we separately discuss the OMG. This information is used by our managementfollowing non-GAAP measures to make operating decisions, assess performance and allocate resources.resources:

Fee Related Earnings (“FRE”)
ENIRealized Income (“RI”)
These non-GAAP financial measures supplement and Other Measuresshould be considered in addition to and not in lieu of, the results of operations, which are discussed further under “—Components of Consolidated Results of Operations” and are prepared in accordance with GAAP.We operate through our distinct operating segments. On March 31, 2023, we completed the SSG Buyout. We rebranded Ares SSG as Ares Asia and the Ares SSG credit business, including the Asian special situations, Asian secured lending and APAC direct lending strategies, as APAC credit. APAC credit has been reclassified effective January 1, 2023 and is now presented within the Credit Group. In connection with this reclassification, we will no longer use Strategic Initiatives to describe all other operating segments, instead reporting the collective results as Other. Separately, the Private Equity Group includes APAC private equity following the Crescent Point Acquisition. Historical periods have been modified to conform to the current period presentation.
In February 2024, we announced that our special opportunities strategy, historically reported as a component of our Private Equity Group, will be integrated into the Credit Group to align management of this strategy and will form the foundation for a new opportunistic credit strategy. For segment reporting purposes, the change will require the reclassification of the special opportunities strategy from the Private Equity Group to the Credit Group and will be presented in our results beginning in 2024. Adjusted for this change, as of December 31, 2023, the Credit Group managed $299.4 billion in AUM with approximately 490 investment professionals and the Private Equity Group managed $24.5 billion in AUM with approximately 85 investment professionals, with both groups continuing to manage investments across the U.S., Europe and Asia-Pacific.

The following table sets forth FRE PRE, ENI,and RI by reportable segment and DE by segment basis for the years ended December 31, 2017, 2016 and 2015. FRE, PRE, ENI, RI and DE are non‑GAAP financial measures our management uses when making resource deployment decisions andOMG ($ in assessing performance of our segments. (For definitions of each of these non-GAAP financial measures and how they are being used by management see the Glossary).thousands):
 Year ended December 31,Favorable (Unfavorable)
20232022$ Change% Change
Fee Related Earnings:
Credit Group$1,257,528 $977,892 $279,636 29%
Private Equity Group112,541 84,467 28,074 33
Real Assets Group218,807 271,626 (52,819)(19)
Secondaries Group104,387 110,501 (6,114)(6)
Other8,530 (2,252)10,782 NM
Operations Management Group(538,052)(447,884)(90,168)(20)
Fee Related Earnings$1,163,741 $994,350 169,391 17
Realized Income:
Credit Group$1,368,671 $1,055,634 $313,037 30%
Private Equity Group122,769 107,998 14,771 14
Real Assets Group217,195 322,465 (105,270)(33)
Secondaries Group101,056 109,165 (8,109)(7)
Other(6,703)(14,042)7,339 52
Operations Management Group(537,460)(450,193)(87,267)(19)
Realized Income$1,265,528 $1,131,027 134,501 12

126

 Year Ended December 31, 2017 vs. 2016 2016 vs. 2015
 2017 2016 2015 Favorable (Unfavorable) Favorable (Unfavorable)
   $ Change % Change $ Change % Change
 (Dollars in thousands)
Fee related earnings:                      
Credit Group$276,966
 $243,177
 $228,599
 $33,789
 14 % $14,578
 6 %
Private Equity Group113,863
 73,379
 81,004
 40,484
 55 % (7,625) (9)%
Real Estate Group14,862
 16,157
 10,426
 (1,295) (8)% 5,731
 55 %
Operations Management Group(188,701) (160,363) (143,037) (28,338) (18)% (17,326) (12)%
Fee related earnings$216,990
 $172,350
 $176,992
 44,640
 26 % (4,642) (3)%
Performance related earnings:             
Credit Group$36,618
 $70,691
 $9,688
 (34,073) (48)% 61,003
 NM
Private Equity Group156,796
 113,571
 12,670
 43,225
 38 % 100,901
 NM
Real Estate Group45,475
 19,752
 17,778
 25,723
 130 % 1,974
 11 %
Operations Management Group11,828
 (19,381) (750) 31,209
 161 % (18,631) NM
Performance related earnings$250,717
 $184,633
 $39,386
 66,084
 36 % 145,247
 NM
Economic net income:      


Credit Group$313,584
 $313,868
 $238,287
 (284) < 1 %
 75,581
 32 %
Private Equity Group270,659
 186,950
 93,674
 83,709
 45 % 93,276
 100 %
Real Estate Group60,337
 35,909
 28,204
 24,428
 68 % 7,705
 27 %
Operations Management Group(176,873) (179,744) (143,787) 2,871
 2 % (35,957) (25)%
Economic net income$467,707
 $356,983
 $216,378
 110,724
 31 % 140,605
 65 %
Realized income:             
Credit Group$293,724
 $301,706
 $288,700
 (7,982) (3)% 13,006
 5 %
Private Equity Group192,814
 149,544
 93,668
 43,270
 29 % 55,876
 60 %
Real Estate Group24,527
 26,611
 20,056
 (2,084) (8)% 6,555
 33 %
Operations Management Group(185,625) (177,533) (143,839) (8,092) (5)% (33,694) (23)%
Realized income$325,440
 $300,328
 $258,585
 25,112
 8 % 41,743
 16 %
Distributable earnings:             
Credit Group$268,737
 $294,814
 $279,630
 (26,077) (9)% 15,184
 5 %
Private Equity Group187,733
 144,140
 88,767
 43,593
 30 % 55,373
 62 %
Real Estate Group19,189
 21,594
 14,831
 (2,405) (11)% 6,763
 46 %
Operations Management Group(204,024) (196,242) (152,639) (7,782) (4)% (43,603) (29)%
Distributable earnings$271,635
 $264,306
 $230,589
 7,329
 3 % 33,717
 15 %
NM - Not Meaningful


Reconciliation of Certain Non-GAAP Measures to Consolidated GAAP Financial Measures
Income before provision for income taxes is the GAAP financial measure most comparable to ENI, RI FRE, PRE and DE.FRE. The following table presents the reconciliation of income before taxes as reported inwithin the Condensed Consolidated Statements of Operations to ENI, RI and FRE PREof the reportable segments and DE (in thousands):
 For the Year Ended December 31, 
 2017 2016 2015 
Economic net income      
Income before taxes$149,859
 $297,920
 $81,484
 
Adjustments:      
Amortization of intangibles17,850
 26,638
 46,227
 
Depreciation expense12,631
 8,215
 6,942
 
Equity compensation expenses69,711
 39,065
 32,244
 
Acquisition and merger-related expenses259,899
 (16,902) 34,864
 
Placement fees and underwriting costs19,765
 6,424
 8,825
 
Offering costs688


Other non-cash (income) expense(1,730) (1,728) 110
 
Expense of non-controlling interests in consolidated subsidiaries1,739


(Income) loss before taxes of non-controlling interests in Consolidated Funds, net of eliminations(62,705) (2,649) 5,682
 
Economic net income467,707
 356,983
 216,378
 
Unconsolidated performance fees income - unrealized(325,915) (228,472) (31,647) 
Unconsolidated performance fee compensation - unrealized237,392
 189,582
 46,492
 
Unconsolidated net investment (income) loss - unrealized(53,744) (17,765) 27,362
 
Realized income325,440
 300,328
 258,585
 
Unconsolidated performance fees income - realized(317,787) (292,998) (121,948) 
Unconsolidated performance fee compensation - realized242,330
 198,264
 65,191
 
Unconsolidated net investment (income) loss(32,993) (33,244) (24,836) 
Fee related earnings216,990
 172,350
 176,992
 
Unconsolidated performance fees—realized317,787
 292,998
 121,948
 
Unconsolidated performance fee compensation—realized(242,330) (198,264) (65,191) 
Unconsolidated investment and other income realized, net32,987
 33,244
 24,836
 
Adjustments:      
One-time acquisition costs(4,878) (841) (2,916) 
Dividend equivalent(14,997) (5,323) (3,337) 
Non-cash items576
 870
 (758) 
Income tax expense(4,857) (16,089) (5,208) 
Placement fees and underwriting costs(16,324) (6,424) (8,825) 
Depreciation(12,631) (8,215) (6,952) 
Offering costs(688) 
 
 
Distributable earnings$271,635
 $264,306
 $230,589
 
Performance related earnings      
Economic net income$467,707
 $356,983
 $216,378
 
Less: fee related earnings(216,990) (172,350) (176,992) 
Performance related earnings$250,717
 $184,633
 $39,386


The following table reconciles unconsolidated performance fee income to our consolidated GAAP performance fee income (inthe OMG ($ in thousands):
 For the Year Ended December 31, 
 2017 2016 2015 
Unconsolidated performance fee income - realized$317,787
 $292,998
 $121,948
 
Performance fee income - realized earned from Consolidated Funds(8,089) 
 (1,769) 
Performance fee - realized reclass(1)(2,721) (7,367) (6,472) 
Performance fee income - realized306,977
 285,631
 113,707
 
Unconsolidated performance fee income - unrealized325,915
 228,472
 31,647
 
Performance fee income - unrealized earned from Consolidated Funds2,997
 (1,139) 6,187
 
Performance fee - unrealized reclass(1)785
 4,888
 (926) 
Performance fee income - unrealized329,697
 232,221
 36,908
 
Total GAAP performance fee income$636,674
 $517,852
 $150,615
 
Year ended December 31,
20232022
Income before taxes$1,333,063 $510,806 
Adjustments:
Depreciation and amortization expense233,185 335,083 
Equity compensation expense255,419 198,948 
Acquisition-related compensation expense(1)
7,334 206,252 
Acquisition and merger-related expense12,000 15,197 
Placement fee adjustment(5,819)2,088 
Other expense, net976 1,874 
Income before taxes of non-controlling interests in consolidated subsidiaries(17,249)(357)
Income before taxes of non-controlling interests in Consolidated Funds, net of eliminations(278,119)(119,664)
Total performance income—unrealized(305,370)(106,978)
Total performance related compensation—unrealized206,923 88,502 
Total net investment income—unrealized(176,815)(724)
Realized Income1,265,528 1,131,027 
Total performance income—realized(415,899)(418,021)
Total performance related compensation—realized282,406 274,541 
Total investment loss—realized31,706 6,803 
Fee Related Earnings$1,163,741 $994,350 
(1) Related to performance fees for AREA Sponsor Holdings LLC. ChangesRepresents earnouts in valueconnection with the acquisition of this investmentLandmark Partners, LLC (the “Landmark Acquisition”), the acquisition of AMP Capital’s infrastructure debt platform (“Infrastructure Debt Acquisition”), the Black Creek Acquisition and the Crescent Point Acquisition that are reflectedrecorded as compensation expense and are presented within other (income) expense incompensation and benefits within the Company’s Condensed Consolidated Statements of Operations.


The following table reconciles unconsolidated other incomeFor the specific components and calculations of these non-GAAP measures, as well as additional reconciliations to the most comparable measures in accordance with GAAP, see “Note 14. Segment Reporting” within our consolidated GAAP other income (in thousands):financial statements included in this Annual Report on Form 10-K. Discussed below are our results of operations for our reportable segments and the OMG.
127
 For the Year Ended December 31, 
 2017 2016 2015 
Unconsolidated net investment income$86,737
 $51,009
 $(2,526) 
Net investment income from Consolidated Funds129,223
 42,244
 25,702
 
Performance fee - reclass(1)1,936
 2,479
 7,398
 
Change in value of contingent consideration20,156
 17,675
 21,064
 
Other non-cash expense1,730
 1,728
 (110) 
Merger related expense
 
 (15,446) 
Offering costs(688) 
 
 
Other income of non-controlling interests in consolidated subsidiaries24


Total GAAP other income$239,118
 $115,135
 $36,082


Results of Operations by Segment

Credit Group
The following table sets forth certain statement of operations data and certain other data of our Credit Group segment for the periods presented.
 For the Years Ended December 31, 2017 vs. 2016 2016 vs. 2015
 2017 2016 2015 Favorable (Unfavorable) Favorable (Unfavorable)
       $ Change % Change $ Change % Change
 (Dollars in thousands)
Management fees (includes ARCC Part I Fees of $105,467, $121,181, and $121,491 for the years ended December 31, 2017, 2016 and 2015, respectively)$481,466
 $444,664
 $432,769
 $36,802
 8 % $11,895
 3 %
Other fees20,830
 9,953
 414
 10,877
 109 % 9,539
 NM
Compensation and benefits(192,022) (182,901) (174,262) (9,121) (5)% (8,639) (5)%
General, administrative and other expenses(33,308) (28,539) (30,322) (4,769) (17)% 1,783
 6 %
Fee Related Earnings276,966
 243,177
 228,599
 33,789
 14 % 14,578
 6 %
Performance fees-realized21,087
 51,435
 87,583
 (30,348) (59)% (36,148) (41)%
Performance fees-unrealized54,196
 22,851
 (71,341) 31,345
 137 % 94,192
 NM
Performance fee compensation-realized(9,218) (11,772) (44,110) 2,554
 22 % 32,338
 73 %
Performance fee compensation-unrealized(35,284) (26,109) 36,659
 (9,175) (35)% (62,768) NM
Net performance fees30,781
 36,405
 8,791
 (5,624) (15)% 27,614
 NM
Investment income-realized7,102
 4,928
 13,274
 2,174
 44 % (8,346) (63)%
Investment income (loss)-unrealized5,480
 11,848
 (15,731) (6,368) (54)% 27,579
 NM
Interest and other investment income5,660
 26,119
 10,429
 (20,459) (78)% 15,690
 150 %
Interest expense(12,405) (8,609) (7,075) (3,796) (44)% (1,534) (22)%
Net investment income5,837
 34,286
 897
 (28,449) (83)% 33,389
 NM
Performance related earnings36,618
 70,691
 9,688
 (34,073) (48)% 61,003
 NM
Economic net income$313,584
 $313,868
 $238,287
 (284) < 1%
 75,581
 32 %
Realized income$293,724
 $301,706
 $288,700
 (7,982) (3)% 13,006
 5 %
Distributable earnings$268,737
 $294,814
 $279,630
 (26,077) (9)% 15,184
 5 %
NM - Not meaningful

Accrued performance fees for the Credit Group are comprised of the following:
 As of December 31,
 2017 2016
 (Dollars in thousands)
CLOs$451
 $8,182
CSF28,158
 26,416
ACE II24,090
 16,427
ACE III43,595
 11,541
Other credit funds72,210
 42,386
Total Credit Group$168,504
 $104,952
Net performance fee revenues for the Credit Group are comprised of the following:
 Year Ended December 31, 2017 Year Ended December 31, 2016 Year Ended December 31, 2015
 Realized Unrealized Net Realized Unrealized Net Realized Unrealized Net
 (Dollars in thousands)
CLOs$7,615
 $(7,850) $(235) $31,347
 $(18,379) $12,968
 $16,942
 $(14,413) $2,529
CSF
 1,742
 1,742
 
 16,341
 16,341
 60,000
 (84,265) (24,265)
ARCC


 (417) 
 (417)
ACE II3,201
 6,543
 9,744
 12,124
 (8,110) 4,014
 1,916
 19,659
 21,575
ACE III
 29,557
 29,557
 
 12,035
 12,035


Other credit funds10,271
 24,204
 34,475
 7,964
 20,964
 28,928
 9,142
 7,678
 16,820
Total Credit Group$21,087
 $54,196
 $75,283
 $51,435
 $22,851
 $74,286
 $87,583
 $(71,341) $16,242
The following tables present the components of the change in performance fees - unrealized for the Credit Group:
 Year Ended December 31, 2017 Year Ended December 31, 2016
 Performance Fees - Realized Increases Decreases Performance Fees - Unrealized Performance Fees - Realized Increases Decreases Performance Fees - Unrealized
 (Dollars in thousands)
CLOs$(7,615) $282
 $(517) $(7,850) $(31,347) $13,234
 $(266) $(18,379)
CSF
 1,742
 
 1,742
 
 16,341
 
 16,341
ACE II(3,201) 9,744
 
 6,543
 (12,124) 4,014
 
 (8,110)
ACE III
 29,557
 
 29,557
 
 12,035
 
 12,035
Other credit funds(10,271) 38,236
 (3,761) 24,204
 (7,964) 30,666
 (1,738) 20,964
Total Credit Group$(21,087)
$79,561

$(4,278)
$54,196
 $(51,435)
$76,290

$(2,004)
$22,851
 Year Ended December 31, 2015
 Performance Fees - Realized Increases Decreases Performance Fees - Unrealized
 (Dollars in thousands)
CLOs$(16,942) $4,119
 $(1,590) $(14,413)
CSF(60,000) 
 (24,265) (84,265)
ARCC417
 
 (417) 
ACE II(1,916) 21,575
 
 19,659
Other credit funds(9,142) 18,786
 (1,966) 7,678
Total Credit Group$(87,583) $44,480
 $(28,238) $(71,341)

Credit Group—Year Ended December 31, 20172023Compared to Year Ended December 31, 20162022
Fee Related Earnings:Earnings
Fee related earningsThe following table presents the components of the Credit Group’s FRE ($ in thousands):
 Year ended December 31,Favorable (Unfavorable)
20232022$ Change% Change
Management fees$1,749,796 $1,416,518 $333,278 24%
Fee related performance revenues167,333 71,497 95,836 134
Other fees35,257 31,992 3,265 10
Compensation and benefits(598,125)(462,681)(135,444)(29)
General, administrative and other expenses(96,733)(79,434)(17,299)(22)
Fee Related Earnings$1,257,528 $977,892 279,636 29

Management Fees. The chart below presents Credit Group management fees and effective management fee rates ($ in millions):
Management fees_Credit.jpg

Management fees on existing funds increased $33.8 million, or 14%, to $277.0primarily from deployment of capital with Pathfinder I, an open-ended core alternative credit fund, ACE V, PCS II and Ares Senior Direct Lending Fund II, L.P. (“SDL II”) collectively generating additional management fees of $97.0 million for the year ended December 31, 20172023 compared to the prior year. Management fees from ARCC, excluding Part I Fees described below, increased by $19.3 million for the year ended December 31, 2023 compared to the prior year primarily due to an increase in the average size of ARCC’s portfolio.

Excluding catch-up fees, management fees from Ares SSG Capital Partners VI, L.P. (“SSG Fund VI”) increased by $13.7 million for the year ended December 31, 2023 compared to the year ended December 31, 2016. Fee related earnings were impacted by fluctuations of the following components:
Management Fees. Total2022 primarily due to new capital commitments. The remaining increase in management fees from funds in existence in both periods was primarily driven by deployment of capital in other direct lending funds and SMAs. Management fees from CLOs also increased by $36.8 million, or 8%,for the year
128

ended December 31, 2023 compared to $481.5 millionthe prior year primarily due to the net addition of four CLOs for the year ended December 31, 20172023.

Part I Fees increased for the year ended December 31, 2023 compared to the year ended December 31, 2016. ARCC's acquisition of ACAS in the first quarter of 2017 increased FPAUM by approximately $2.8 billion at the time of acquisition, which drove2022 primarily due to an increase of $34.3 million in management feespre-incentive fee net investment income generated by ARCC and CADC, driven by an increase in 2017. Conversely, ARCCthe average size of their portfolios and by the impact of rising interest rates, given their primarily floating-rate loan portfolios. The increase in Part I Fees decreased $15.7included fees from ASIF of $5.1 million due primarily to the $10 million per quarter ARCC Part I Fee waiver, which became effectivebeginning in the secondthird quarter of 2017 and totaled $30.0 million for 2017. Direct lending funds generated additional management fees of $25.5 million from capital deployment in existing funds during the year ended December 31, 2017, $10.3 million of which was attributable to Ares Capital Europe III, L.P. (“ACE III”). We also earned $16.8 million of management fees from 34 new funds that launched at various points throughout 2017. The aforementioned increases were offset by a decrease of $17.9 million in management fees from 23 funds liquidated during the year ended December 31, 2017.2023.

The increase in effective management fee rate decreased by 0.05% from 1.06% for the year ended December 31, 2016, to 1.01% for the year ended December 31, 2017. ARCC Part I Fees' contribution towards the total effective management fee rate of the Credit Group decreased from 0.29% for the year ended December 31, 2016 to 0.22% for the year ended December 31, 2017. The decrease in effective management fee rate was primarily due to the impact of the ARCC Part I fee waiver, offset partially by new direct lending funds with higher effective fee rates replacing run-off assets with lower fees rates.
Other Fees. Other fees increased by $10.9 million for the year ended December 31, 20172023 compared to the year ended December 31, 2016.2022 was primarily driven by the increase in Part I Fees’ contribution to the effective management fee rate.

Fee Related Performance Revenues. The increase resulted from a full year of transaction fees based on the increased volume and the amount of loans funded from certain U.S. direct lending funds.
Compensation and Benefits.  Compensation and benefits expenses increased by $9.1 million, or 5%, to $192.0 million for the year ended December 31, 20172023 compared to the year ended December 31, 2016. Compensation2022 was primarily attributable to higher returns from certain perpetual capital funds that have benefited from rising interest rates on predominately floating-rate loans. Incentive fees from perpetual capital were mostly generated from 14 U.S. direct lending funds, ten European direct lending funds and benefits expenses increasedone alternative credit fund for the year ended December 31, 2017 primarily due to additional headcount and increase of incentive compensation with segment performance2023 compared to the year ended December 31, 2016. Compensation costs related to employees hired in connection with the ARCC-ACAS Transaction was $6.7 million for the year ended December 31, 2017. This increase in expense was offset by a $9.3 million decrease in ARCC Part I compensation during 2017, due to the decrease in ARCC Part I Fee revenue. Compensation and benefits expenses represented 39.9% of management fees for the year ended December 31, 2017 compared to 41.1% for the year ended December 31, 2016.
General, Administrative and Other Expenses. General, administrative and other expenses increased by $4.8 million, or 17%, to $33.3 million for the year ended December 31, 2017. The increase in the current year was attributable to $4.4 million of costs incurred from operating expenses from a joint venture distribution platform. The platform will be used to raise capital for registered investment companies through independent brokerage networks. The first such fund, a direct lending closed end fund, was launched in 2017.
Performance Related Earnings:
Performance related earnings decreased $34.1 million to $36.6 million for the year ended December 31, 2017 compared to the year ended December 31, 2016. Performance related earnings were impacted by fluctuations of the following components:
Net Performance Fees. Net performance fees include realized and unrealized performance fees, net of realized and unrealized performance fee compensation. The impact of reversals of previously recognized performance fee revenue and the corresponding performance fee compensation expense is reflected as a reduction in unrealized performance fees and unrealized performance fee compensation.  
Net performance fees decreased by $5.6 million to $30.8 million for the year ended December 31, 2017 compared to the year ended December 31, 2016. The decrease in the current year was driven by decreased performance fees primarily from our syndicated loans strategy, which benefited from a broad-based credit market rally in the prior year. These decreases were partially offset by a $23.3 million increase in gross performance fees earned from Ares Capital Europe II, L.P. (“ACE II”) and Ares Capital Europe III, L.P. (“ACE III”) for the December 31, 2017 compared to the year ended December 31, 2016, which generated returns in excess of their hurdle rates on an increased capital base.

Net Investment Income. Net investment income decreased by $28.4 million to $5.8 million for the year ended December 31, 2017 compared to the year ended December 31, 2016. The decrease in the current year was primarily attributable to the revaluation of certain assets and liabilities denominated in foreign currencies, which resulted in losses of $4.5 million for the year ended December 31, 2017 compared to gains of $16.0 million for the year ended December 31, 2016. In 2016, the Brexit vote caused exchange rate fluctuations that resulted in the strengthening of the U.S. dollar against foreign currencies in which we conduct business, primarily the British pounds sterling and the Euro. That strengthening of the U.S. dollar against these foreign currencies resulted in gains in 2016. In 2017, a portion of these gains reversed as the British pounds sterling and the Euro strengthened against the U.S. dollar. The impact was partially mitigated by reductions in liabilities denominated in foreign currencies during 2017. Interest expense also increased $3.8 million for the year ended December 31, 2017 compared to the year ended December 31, 2016 as a result of term loans that were entered into in connection with new CLOs.
Realized Income:
Realized income decreased $8.0 million, or 3%, to $293.7 million for the year ended December 31, 2017 compared to the year ended December 31, 2016. The decrease was primarily driven by lower net realized performance fees and net realized investment income as a result of the wind down of legacy CLOs. These decreases were partially offset by an increase in FRE of $33.8 million for the year ended December 31, 2017 compared to the year ended December 31, 2016.
Economic Net Income:
Economic net income is comprised of fee related earnings and performance related earnings. Economic net income decreased $0.3 million to $313.6 million for the year ended December 31, 2017 compared to the year ended December 31, 2016 as a result of the fluctuations described above.
Distributable Earnings:
DE decreased $26.1 million, or 9%, to $268.7 million for the year ended December 31, 2017 compared to the year ended December 31, 2016. The decrease in DE was due to decreases of $14.0 million in net realized investment and other income and of $27.8 million in net realized performance fees for the year ended December 31, 2017, as described above. Increases in non-core expenses of $18.1 million for the year ended December 31, 2017 compared to the year ended December 31, 2016 also contributed to the decrease of DE. The primary drivers for the increase in non-core expenses were placement fees of $8.5 million related to two new fund launches and to dividend equivalent payments of $8.1 million made on unvested restricted stock. These decreases were partially offset by an increase in FRE of $33.8 million for the year ended December 31, 2017 compared to the year ended December 31, 2016.
Credit Group—Year Ended December 31, 2016Compared to Year Ended December 31, 2015
Fee Related Earnings:
Fee related earnings increased $14.6 million, or 6%, to $243.2 million for the year ended December 31, 2016 compared to the year ended December 31, 2015. Fee related earnings were impacted by fluctuations of the following components:
Management Fees. Total management fees increased by $11.9 million, or 3%, to $444.7 million for the year ended December 31, 2016 compared to the year ended December 31, 2015. The increase in management fees was primarily driven by the launch of 11 funds subsequent to December 31, 2015 that increased fees by $11.9 million.
Management fees of the Credit Group include quarterly fees on the net investment income from ARCC (ARCC Part I Fees). Total ARCC management fees for the years ended December 31, 2016 and 2015 were $258.2 million and $255.8 million, respectively, of which $121.2 million and $121.5 million, respectively, were related to ARCC Part I Fees.
The effective management fee rate decreased by 0.07% from 1.13% for the year ended December 31, 2015, to 1.06% for the year ended December 31, 2016. ARCC Part I Fees contributed 0.29% and 0.32% towards the total effective management fee rate of the Credit Group for the years ended December 31, 2016 and 2015, respectively.
Other Fees. Other fees increased by $9.5 million for the year ended December 31, 2016 compared to the year ended December 31, 2015, resulting from the introduction of a transaction fee earned from a new fund based on underwriting and originating activities.

Compensation and Benefits. Compensation and benefits expenses increased by $8.6 million, or 5%, to $182.9 million for the year ended December 31, 2016 compared to the year ended December 31, 2015. Compensation and benefits expenses increased during the year ended December 31, 2016 primarily due to an increase in headcount, which drove increases in incentive based compensation and salary and benefit expenses. In addition, salary and benefits expenses increased in the current year due to merit based increases. Compensation and benefits expenses represented 41.1% of management fees for the year ended December 31, 2016 compared to 40.3% for the year ended December 31, 2015.
General, Administrative and Other Expenses. General, administrative and other expenses decreased by $1.8 million, or 6%, to $28.5 million for the year ended December 31, 2016, remaining relatively consistent with the year ended December 31, 2015.
Performance Related Earnings:
Performance related earnings increased $61.0 million to $70.7 million for the year ended December 31, 2016 compared to the year ended December 31, 2015. Performance related earnings were impacted by fluctuations of the following components:
Net Performance Fees. Net performance fees include realized and unrealized performance fees, net of realized and unrealized performance fee compensation. The impact of reversals of previously recognized performance fee revenue and the corresponding performance fee compensation expense is reflected as a reduction in unrealized performance fees and unrealized performance fee compensation.  
Net performance fees increased by $27.6 million to $36.4 million for the year ended December 31, 2016 compared to the year ended December 31, 2015. The increase in performance fees for the year ended December 31, 2016 was primarily driven by market appreciation in credit opportunities, U.S.ten European direct lending and syndicated loans strategies as a result of strengthening credit markets. Additionally, net performance fees increased as a result of realizations from several CLOs in excess of unrealized amounts previously recognized during the year ended December 31, 2016 as compared to the year ended December 31, 2015.
Net Investment Income (Loss). Net investment income increased by $33.4 million to $34.3 million for the year ended December 31, 2016 compared to the year ended December 31, 2015. The increase was driven by overall improvements in the credit markets that resulted in unrealized market appreciation of $10.0 million and $4.2 million on investments in our syndicated loan funds andeight U.S. direct lending funds, respectively, offset by unrealized depreciation of $0.8 million on investments in our E.U. direct lending funds for the year ended December 31, 2016. In comparison, our investments2022.

Other Fees. The increase in syndicated loan funds and U.S. direct lending funds experienced unrealized losses of $14.6 million and $0.4 million, respectively,other fees for the year ended December 31, 2015.2023 compared to the year ended December 31, 2022 was primarily driven by higher administrative service fees of $8.1 million mostly earned from certain private funds that pay on invested capital. The increase in other fees is partially offset by a decrease of $5.1 million in transaction fees, primarily from lower loan origination income generated from certain credit funds.

Compensation and Benefits. The increase in compensation and benefits for the year ended December 31, 2023 compared to the year ended December 31, 2022 was primarily driven by: (i) higher fee related performance compensation and Part I Fees compensation of $59.4 million and $58.3 million, respectively, corresponding to the increases in revenues; and (ii) an increase in salary expense of $14.1 million, primarily attributable to headcount growth to support the expansion of our business. Separately, compensation and benefits increased by $4.7 million for the nine months ended December 31, 2023 following the SSG Buyout on March 31, 2023, reflecting the costs associated with the 20% change in ownership that were previously not part of our cost structure.

Average headcount increased by 12% to 566 investment and investment support professionals for the year-to-date period in 2023 from 504 professionals in 2022 as we continued to add professionals primarily to support our growing direct lending and APAC credit platforms.

General, Administrative and Other Expenses. Certain expenses increased during the current period, including: (i) occupancy costs, which support our growing headcount that are based in higher cost locations; (ii) information services such as research and market data; and (iii) information technology costs. These expenses collectively increased by $9.4 million for the year ended December 31, 2023 compared to the prior year. Additionally, $16.0supplemental distribution fees which fluctuate with sales volumes and managed assets of our non-traded products, contributed $5.1 million of transactionthe increase for the year ended December 31, 2023 when compared to prior year. We expect to incur higher supplemental distribution fees in future periods as we continue to develop our distribution relationships and expand our retail product offerings. For the year ended December 31, 2023, travel and marketing expenses have also increased by $4.1 million when compared to the year ended December 31, 2022, as marketing efforts continued to increase driven by more in-person investor meetings and events.


129

Realized Income

The following table presents the components of the Credit Group’s RI ($ in thousands):
Year ended December 31,Favorable (Unfavorable)
20232022$ Change% Change
Fee Related Earnings$1,257,528 $977,892 $279,636 29%
Performance income—realized271,550 156,929 114,621 73
Performance related compensation—realized(175,193)(97,621)(77,572)(79)
Realized net performance income96,357 59,308 37,049 62
Investment income—realized20,111 7,078 13,033 184
Interest and other investment income—realized21,975 27,288 (5,313)(19)
Interest expense(27,300)(15,932)(11,368)(71)
Realized net investment income14,786 18,434 (3,648)(20)
Realized Income$1,368,671 $1,055,634 313,037 30

Realized net performance income for the years ended December 31, 2023 and 2022 included aggregate tax distributions of $54.7 million and $48.1 million, respectively, from ACE IV, ACE V and PCS I, among other European direct lending funds. Realized net performance income for the year ended December 31, 2023 also included incentive fees primarily from ten direct lending funds and six alternative credit funds. Realized net performance income for the year ended December 31, 2022 also included incentive fees primarily from nine direct lending funds and two alternative credit funds.

Realized net investment income for the years ended December 31, 2023 and 2022 was primarily attributable to interest income generated from our CLO investments. In addition, the year ended December 31, 2023 included realized gains from the revaluationsale of certain assets and liabilities denominatedour investment in foreign currencies is included in interest and othera commercial finance fund during the second quarter of 2023.

Realized net investment income for the year ended December 31, 2016 compared2022 was also attributable to: (i) realizations from the settlement of forward contracts entered into to transaction losseshedge our exposure to foreign currency fluctuations, primarily from the Euro; (ii) distributions from a U.S. direct lending fund and a European direct lending fund; and (iii) income recognized in connection with distributions from a commercial finance fund.

Interest expense, which is allocated among our segments based on the cost basis of $0.5 millionbalance sheet investments, increased over the comparative periods primarily due to rising SOFR rates and a higher average outstanding balance of the Credit Facility and to the issuance of the 2028 Senior Notes in November 2023.

130

Credit Group—Performance Income

The following table presents the accrued carried interest, also referred to as accrued performance income, and related performance compensation for the year ended December 31, 2015.Credit Group. Accrued net performance income excludes net performance income that has been realized but not yet received as of the reporting date ($ in thousands):
Realized Income:
As of December 31,
20232022
Accrued Performance IncomeAccrued Performance CompensationAccrued Net Performance IncomeAccrued Performance IncomeAccrued Performance CompensationAccrued Net Performance Income
ACE III$92,546 $57,948 $34,598 $100,774 $60,465 $40,309 
ACE IV149,584 97,123 52,461 168,204 104,286 63,918 
ACE V232,201 146,219 85,982 115,969 69,581 46,388 
PCS I123,979 73,258 50,721 98,143 57,994 40,149 
PCS II38,128 22,573 15,555 — — — 
Pathfinder I155,136 131,866 23,270 88,879 75,547 13,332 
Other credit funds184,783 106,447 78,336 93,640 52,482 41,158 
Total Credit Group$976,357 $635,434 $340,923 $665,609 $420,355 $245,254 
RealizedThe following table presents the change in accrued performance income increased $13.0 million, or 5%, to $301.7 million for the year ended December 31, 2016 compared to the year ended December 31, 2015. The increase was due to increasesCredit Group ($ in thousands):
 As of December 31, 2022Activity during the periodAs of December 31, 2023
Waterfall TypeAccrued Performance IncomeChange in UnrealizedRealizedOther AdjustmentsAccrued Performance Income
Accrued Carried Interest
ACE IIIEuropean$100,774 $(1,931)$(6,237)$(60)$92,546 
ACE IVEuropean168,204 58,421 (77,097)56 149,584 
ACE VEuropean115,969 181,054 (64,079)(743)232,201 
PCS IEuropean98,143 45,308 (19,867)395 123,979 
PCS IIEuropean— 37,621 — 507 38,128 
Pathfinder IEuropean88,879 66,257 — — 155,136 
Other credit fundsEuropean85,463 92,590 (19,078)1,377 160,352 
Other credit fundsAmerican8,177 19,394 (3,083)(57)24,431 
Total accrued carried interest665,609 498,714 (189,441)1,475 976,357 
Other credit fundsIncentive— 82,109 (82,109)— — 
Total Credit Group$665,609 $580,823 $(271,550)$1,475 $976,357 
131

Table of $14.6 million and $2.2 million in FRE and net realized investment and other income, respectively, offset by a decrease in net realized performance fees of $3.8 million.Contents
Economic Net Income:
Economic net income is comprised of fee related earnings and performance related earnings. Economic net income increased $75.6 million, or 32%, to $313.9 million for the year ended December 31, 2016 compared to the year ended December 31, 2015 as a result of the fluctuations described above.
Distributable Earnings:
DE increased $15.2 million, or 5%, to $294.8 million for the year ended December 31, 2016 compared to the year ended December 31, 2015. DE was positively impacted by increases in FRE of $14.6 million and an increase of $2.2 million in net realized investment and other income. The increases were partially offset by a decrease in net realized performance fees of $3.8 million.

Credit Group—Assets Under Management
The tables below provide the period‑to‑periodpresent rollforwards of AUM for the Credit Group for the years ended December 31, 2017, 2016 and 2015 (in($ in millions):
 Syndicated Loans High Yield Credit Opportunities Structured Credit U.S. Direct Lending(1) E.U. Direct Lending Total Credit Group
Balance at 12/31/2016$17,260
 $4,978
 $3,304
 $4,254
 $21,110
 $9,560
 $60,466
Acquisitions


 3,605
 
 3,605
Net new par/ equity commitments731
 558
 (6) 356
 6,167
 864
 8,670
Net new debt commitments3,536


 1,882
 571
 5,989
Distributions(5,426) (1,224) (146) (173) (3,011) (872) (10,852)
Change in fund value429
 318
 181
 354
 887
 1,685
 3,854
Balance at 12/31/2017$16,530
 $4,630
 $3,333
 $4,791
 $30,640
 $11,808
 $71,732
Average AUM(2)$16,861
 $4,685
 $3,343
 $4,482
 $26,957
 $10,743
 $67,071
 Syndicated Loans High Yield Credit Opportunities Structured Credit U.S. Direct Lending(1) E.U. Direct Lending Total Credit Group
Balance at 12/31/2015$17,617
 $3,303
 $3,715
 $3,103
 $23,592
 $9,056
 $60,386
Net new par/ equity commitments624
 1,664
 281
 905
 751
 1,228
 5,453
Net new debt commitments2,287


 2,411
 332
 5,030
Distributions(3,410) (459) (923) (106) (6,269) (801) (11,968)
Change in fund value142
 470
 231
 352
 625
 (255) 1,565
Balance at 12/31/2016$17,260
 $4,978
 $3,304
 $4,254
 $21,110
 $9,560
 $60,466
Average AUM(2)$17,162
 $4,217
 $3,365
 $3,743
 $22,299
 $9,511
 $60,297
 Syndicated Loans High Yield Credit Opportunities Structured Credit U.S. Direct Lending E.U. Direct Lending Total Credit Group
Balance at 12/31/2014$20,175
 $3,076
 $5,479
 $1,719
 $23,115
 $5,535
 $59,099
Net new par/ equity commitments(13) 502
 14
 1,716
 1,537
 3,560
 7,316
Net new debt commitments2,949
 
 302
 
 2,051
 1,252
 6,554
Distributions(4,949) (213) (1,915) (201) (3,654) (1,017) (11,949)
Change in fund value(545) (62) (165) (131) 543
 (274) (634)
Balance at 12/31/2015$17,617
 $3,303
 $3,715
 $3,103
 $23,592
 $9,056
 $60,386
Average AUM(2)$19,605
 $3,281
 $4,533
 $2,804
 $24,179
 $6,573
 $60,975
(1) Distributions of $3.0 billion and $6.3 billion in 2017 and 2016, respectively, includes $1.6 billion and $4.8 billion reduction in leverage, respectively, related to the paydown associated with the Senior Secured Loan Program (the "SSLP").
(2) Represents a five-point average of quarter-end balances for each period.

Credit Group—Fee Paying AUM
The tables below provides the period‑to‑period rollforwards of fee paying AUM for the Credit Group for the years ended December 31, 2017, 2016 and 2015 (in millions):
 Syndicated Loans High Yield Credit Opportunities Structured Credit U.S. Direct Lending E.U. Direct Lending Total Credit Group
FPAUM Balance at 12/31/2016$15,998
 $4,978
 $2,705
 $3,128
 $11,292
 $4,608
 $42,709
Acquisitions


 2,789
 
 2,789
Commitments4,116
 495
 4
 273
 172
 
 5,060
Subscriptions/deployment/increase in leverage
 77
 65
 325
 2,998
 1,629
 5,094
Redemptions/distributions/decrease in leverage(5,240) (1,238) (137) (587) (948) (583) (8,733)
Change in fund value377
 317
 172
 295
 566
 595
 2,322
Change in fee basis


 209
 209
FPAUM Balance at 12/31/2017$15,251
 $4,629
 $2,809
 $3,434
 $16,869
 $6,458
 $49,450
Average FPAUM(1)$15,550
 $4,685
 $2,788
 $3,316
 $14,627
 $5,632
 $46,598

 Syndicated Loans High Yield Credit Opportunities Structured Credit U.S. Direct Lending E.U. Direct Lending Total Credit Group
FPAUM Balance at 12/31/2015$17,180
 $3,303
 $2,606
 $2,558
 $10,187
 $4,091
 $39,925
Commitments1,985
 1,537
 62
 7
 40
 
 3,631
Subscriptions/deployment/increase in leverage24
 127
 366
 379
 1,423
 1,393
 3,712
Redemptions/distributions/decrease in leverage(3,239) (459) (492) (112) (928) (585) (5,815)
Change in fund value48
 470
 223
 296
 570
 (291) 1,316
Change in fee basis
 
 (60) 
 
 
 (60)
FPAUM Balance at 12/31/2016$15,998
 $4,978
 $2,705
 $3,128
 $11,292
 $4,608
 $42,709
Average FPAUM(1)$16,234
 $4,217
 $2,569
 $2,805
 $10,640
 $4,473
 $40,938
 Syndicated Loans High Yield Credit Opportunities Structured Credit U.S. Direct Lending E.U. Direct Lending Total Credit Group
FPAUM Balance at 12/31/2014$16,236
 $3,075
 $3,943
 $1,602
 $9,400
 $3,018
 $37,274
Commitments3,284
 341
 60
 11
 421
 
 4,117
Subscriptions/deployment/increase in leverage122
 97
 164
 1,102
 1,088
 1,566
 4,139
Redemptions/distributions/decrease in leverage(2,252) (213) (882) (218) (1,254) (423) (5,242)
Change in fund value(281) (123) (283) (53) 793
 (110) (57)
Change in fee basis71
 126
 (396) 114
 (261) 40
 (306)
FPAUM Balance at 12/31/2015$17,180
 $3,303
 $2,606
 $2,558
 $10,187
 $4,091
 $39,925
Average FPAUM(1)$16,533
 $3,256
 $3,290
 $2,261
 $9,525
 $3,463
 $38,328
(1) Represents a five-point average of quarter-end balances for each period.


The charts below present FPAUM for the Credit Group by its fee basis as of December 31, 2017, 2016 and 2015 (in millions):
FPAUM: $49,450FPAUM: $42,709


FPAUM: $39,925


Liquid
Credit
Alternative
Credit
U.S. Direct
Lending
European
Direct Lending
APAC
Credit
Other(1)
Total Credit
Group
Balance at 12/31/2022$43,864 $21,363 $98,327 $50,642 $11,383 $ $225,579 
Net new par/equity commitments2,808 8,351 15,960 12,508 387 379 40,393 
Net new debt commitments1,978 400 8,492 3,826 201 — 14,897 
Capital reductions(858)— (1,935)(1,065)— — (3,858)
Distributions(319)(1,484)(2,976)(1,977)(429)— (7,185)
Redemptions(2,069)(984)(290)(2)— — (3,345)
Net allocations among investment strategies(33)4,291 — — 25 (25)4,258 
Change in fund value1,928 1,949 5,495 4,332 353 — 14,057 
Balance at 12/31/2023$47,299 $33,886 $123,073 $68,264 $11,920 $354 $284,796 
Liquid
Credit
Alternative
Credit
U.S. Direct
Lending
European
Direct Lending
APAC
Credit
OtherTotal Credit
Group
Balance at 12/31/2021$40,335 $17,424 $85,849 $49,102 $8,695 $ $201,405 
Net new par/equity commitments3,126 4,628 7,137 1,476 1,782 — 18,149 
Net new debt commitments3,777 — 7,310 1,901 1,474 — 14,462 
Capital reductions(237)(45)(991)(2)(5)— (1,280)
Distributions(117)(1,752)(2,269)(1,182)(737)— (6,057)
Redemptions(1,699)(456)(260)— — — (2,415)
Net allocations among investment strategies(8)1,983 — — — — 1,975 
Change in fund value(1,313)(419)1,551 (653)174 — (660)
Balance at 12/31/2022$43,864 $21,363 $98,327 $50,642 $11,383 $ $225,579 
(1) Activity within Other represents equity commitments to the platform that have not yet been allocated to an investment strategy.
The components of our AUM including the portion that is FPAUM, for the Credit Group are presented below as of December 31, 2017, 2016 and 2015 (in millions)($ in billions):
78447846
AUM: $284.8AUM: $225.6
AUM: $71,732FPAUMAUM: $60,466AUM not yet paying fees
Non-fee paying(1)


AUM: $60,386

(1) Includes $5.7 billion, $6.4$15.1 billion and $9.9$14.4 billion of AUM of funds from which we indirectly earn management fees as of December 31, 2017, 20162023 and 2015,2022, respectively, and includes $1.5 billion and $1.2 billion of non-fee paying AUM based on our general partner commitment as of December 31, 2023 and 2022, respectively.

132


Credit Group—Fee Paying AUM

The tables below present rollforwards of fee paying AUM for the Credit Group ($ in millions):

Liquid
Credit
Alternative
Credit
U.S. Direct
Lending
European
Direct Lending
APAC
Credit
Total Credit
Group
Balance at 12/31/2022$42,191 $15,904 $57,568 $29,561 $6,051 $151,275 
Commitments4,958 65 3,068 — 242 8,333 
Deployment/subscriptions/increase in leverage282 5,463 11,246 5,554 1,156 23,701 
Capital reductions(892)— (2,304)(268)(193)(3,657)
Distributions(335)(1,913)(3,707)(450)(1,522)(7,927)
Redemptions(2,067)(901)(305)(1,201)— (4,474)
Net allocations among investment strategies(33)4,396    4,363 
Change in fund value2,036 204 2,030 1,050 (144)5,176 
Balance at 12/31/2023$46,140 $23,218 $67,596 $34,246 $5,590 $176,790 
Liquid
Credit
Alternative
Credit
U.S. Direct
Lending
European
Direct Lending
APAC
Credit
Total Credit
Group
Balance at 12/31/2021$38,673 $8,742 $46,128 $23,847 $4,720 $122,110 
Commitments6,739 369 2,291 — 1,928 11,327 
Deployment/subscriptions/increase in leverage21 7,128 14,137 9,194 2,300 32,780 
Capital reductions(289)(25)(1,645)(1,563)(391)(3,913)
Distributions(138)(1,442)(3,501)(764)(1,520)(7,365)
Redemptions(1,713)(400)(260)(311)— (2,684)
Net allocations among investment strategies(8)1,943 — — — 1,935 
Change in fund value(1,094)(410)418 (842)(143)(2,071)
Change in fee basis— (1)— — (843)(844)
Balance at 12/31/2022$42,191 $15,904 $57,568 $29,561 $6,051 $151,275 


The charts below present FPAUM for the Credit Group by its fee bases ($ in billions):
82208222
FPAUM: $176.8FPAUM: $151.3
Invested capital
Market value(1)
Collateral balances (at par)Capital commitments
(1)Includes $35.4 billion and $31.1 billion from funds that primarily invest in illiquid strategies as of December 31, 2023 and 2022, respectively. The underlying investments held in these funds are generally subject to less market volatility than investments held in liquid strategies.


133

Credit Group—Fund Performance Metrics as of December 31, 20172023
The Credit Group managed 139 funds as of December 31, 2017.
ARCC contributed approximately 58%37% of the Credit Group’s total management fees for the year ended December 31, 2017.2023. In addition, to ARCC, we have sixeight other significant funds, whichCADC, Ares Senior Direct Lending Fund I, L.P. (“SDL I”), ACE IV, ACE V, PCS II, Pathfinder I, SDL II and an open-ended core alternative credit fund, collectively contributed approximately 9%27% of the Credit Group’s management fees for the year ended December 31, 2017. Our significant funds that are not drawdown funds are ARCC; one sub-advised fund; Ares ELIS XI, Ltd. ("ELIS XI"), a 2013 vintage separately managed account focused on syndicated loans in the United States; and two separately managed accounts over which we exercise sole investment discretion. Our significant drawdown funds are Ares Capital Europe II, L.P. (“ACE II”), a 2013 vintage commingled fund; and ACE III, a 2015 vintage commingled fund, both of which focus on direct lending to European middle market companies. We do not present fund performance metrics for significant funds with less than two years of historical information, except for those significant funds which pay management fees on invested capital, in which case performance is shown at the earlier of (i) the one year anniversary of the fund's first investment and (ii) such time the fund is 50% or more invested.2023.

The following table presents the performance data for our significant funds that are not drawdown funds in the Credit Group thatas of December 31, 2023 ($ in millions):
   Returns(%) 
Year of InceptionAUMYear-To-Date
Since Inception(1)
Primary
Investment Strategy
FundGrossNetGrossNet
ARCC(2)
2004$27,977 N/A12.0 N/A15.7U.S. Direct Lending
CADC(3)
20175,030 N/A13.8 N/A6.4U.S. Direct Lending
(1)Since inception returns are annualized.
(2)Returns are time-weighted rates of return and include the reinvestment of income and other earnings from securities or other investments and reflect the deduction of all trading expenses. Net returns are calculated using the fund’s NAV and assume dividends are reinvested at the closest quarter-end NAV to the relevant quarterly ex-dividend dates. Additional information related to ARCC can be found in its filings with the SEC, which are not drawdown funds:part of this report.
(3)Returns are time-weighted rates of return and include the reinvestment of income and other earnings from securities or other investments and reflect the deduction of all trading expenses. Returns are shown for institutional share class. Shares of other classes may have lower returns due to higher selling commissions and fees. Net returns are calculated using the fund’s NAV and assume distributions are reinvested at the NAV on the date of distribution. Additional information related to CADC can be found in its filings with the SEC, which are not part of this report.


134
   As of December 31, 2017  
     Returns(%)(1)  
 Year of AUM Fourth Quarter Year-To-Date Since Inception(2)  
FundInception (in millions) Gross Net Gross Net Gross Net Investment Strategy
ARCC(3)2004 $14,520
 N/A 3.3 N/A 10.8 N/A 11.8 U.S. Direct Lending
Sub-advised Client A(4)2007 $723
 0.6 0.5 8.1 7.7 8.0 7.6 High Yield
ELIS XI(4)2013 $716
 1.1 1.0 4.9 4.4 3.6 3.1 Syndicated Loans
Separately Managed Account Client A(4)2015 $1,155
 2.4 2.3 11.2 10.7 7.1 6.6 Structured Credit
Separately Managed Account Client B(4)2016 $830
 0.7 0.6 7.0 6.7 6.7 6.3 High Yield

(1)
Returns are time-weighted rates of return and include the reinvestment of income and other earnings from securities or other investments and reflect the deduction of all trading expenses.
(2)
Since inception returns are annualized.
(3)
Net returns are calculated using the fund's NAV and assume dividends are reinvested at the closest quarter-end NAV to the relevant quarterly ex-dividend dates. Additional information related to ARCC can be found in its financial statements filed with the SEC, which are not part of this report.
(4)
Gross returns do not reflect the deduction of management fees or any other expenses. Net returns are calculated by subtracting the applicable management fee from the gross returns on a monthly basis.

The following table presents the performance data of ourthe Credit Group’s significant drawdown funds:funds as of December 31, 2023 ($ in millions):
     As of December 31, 2017 (Dollars in millions)      
 Year of Inception AUM Original Capital Commitments Cumulative Invested Capital Realized Proceeds(1) Unrealized Value(2) Total Value MoIC IRR(%)  
Fund       Gross(3) Net(4) Gross(5) Net(6) Investment Strategy
ACE II(7)2013 $1,509
 $1,216
 $977
 $458
 $796
 $1,254
 1.4x 1.3x 10.2 7.5 E.U. Direct Lending
ACE III(8)2015 $5,184
 $2,822
 $1,951
 $102
 $2,099
 $2,201
 1.2x 1.1x 17.5 13.1 E.U. Direct Lending
Year of InceptionAUMOriginal Capital CommitmentsCapital Invested to Date
Realized Value(1)
Unrealized Value(2)
Total ValueMoICIRR(%)Primary Investment Strategy
Fund
Gross(3)
Net(4)
Gross(5)
Net(6)
Funds Harvesting Investments
SDL I Unlevered2018$4,818 $922 $872 $342 $711 $1,053 1.3x1.2x9.06.9U.S. Direct Lending
SDL I Levered2,045 2,022 915 1,755 2,670 1.4x1.3x15.311.4
ACE IV Unlevered(7)
201810,199 2,851 2,311 746 2,123 2,869 1.3x1.2x8.15.8European Direct Lending
ACE IV Levered(7)
4,819 3,903 1,752 3,502 5,254 1.5x1.3x11.58.2
Funds Deploying Capital
ACE V Unlevered(8)
202017,270 7,026 5,201 555 5,433 5,988 1.2x1.2x11.48.5European Direct Lending
ACE V Levered(8)
6,376 4,723 741 5,093 5,834 1.3x1.2x17.312.5
PCS II20205,524 5,114 3,240 223 3,409 3,632 1.2x1.1x10.17.2U.S. Direct Lending
Pathfinder I20204,286 3,683 2,702 201 3,127 3,328 1.3x1.2x18.112.9Alternative Credit
SDL II Unlevered202115,747 1,989 1,221 129 1,242 1,371 1.2x1.1x12.29.5U.S. Direct Lending
SDL II Levered6,047 3,567 602 3,655 4,257 1.3x1.2x20.215.2
Open-ended core alternative credit fund(9)
20214,674 4,229 3,219 263 3,260 3,523 1.1x1.1x11.98.6Alternative Credit
(1)
Realized proceeds represent the sum of all cash distributions to all partners and if applicable, exclude tax and incentive distributions made to the general partner.
(2)
Unrealized value represents the fund's NAV reduced by the accrued performance fees, if applicable. There can be no assurance that unrealized values will be realized at the valuations indicated.
(3)
The gross multiple of invested capital (“MoIC”) is calculated at the fund-level and is based on the interests of the fee-paying limited partners and if applicable, excludes interests attributable to the non-fee paying limited partners and/or the general partner which does not pay management fees or performance fees. The gross MoIC is before giving effect to management fees, performance fees as applicable and other expenses.
(4)
The net MoIC is calculated at the fund-level and is based on the interests of the fee-paying limited partners and if applicable, excludes those interests attributable to the non-fee paying limited partners and/or the general partner which does not pay management fees or performance fees. The net MoIC is after giving effect to management fees, performance fees as applicable and other expenses.
(5)The gross IRR is an annualized since inception gross internal rate of return of cash flows to and from the fund and the fund’s residual value at the end of the measurement period. Gross IRR reflects returns to the fee-paying limited partners and if applicable, excludes interests attributable to the non-fee paying limited partners and/or the general partner which does not pay management fees or performance fees.

(1)Realized value represents the sum of all cash distributions to all partners and if applicable, exclude tax and incentive distributions made to the general partner.
(2)Unrealized value represents the fund’s NAV reduced by the accrued incentive allocation, if applicable. There can be no assurance that unrealized values will be realized at the valuations indicated.
(3)The gross multiple of invested capital (“MoIC”) is calculated at the fund-level and is based on the interests of the fee-paying limited partners and if applicable, excludes interests attributable to the non-fee paying limited partners and/or the general partner which does not pay management fees or carried interest. The gross MoIC is before giving effect to management fees, carried interest and other expenses, as applicable, but after giving effect to credit facility interest expenses, as applicable. The funds may utilize a credit facility during the investment period and for general cash management purposes. Early in the life of a fund, the gross fund-level MoICs would generally have been lower had such fund called capital from its limited partners instead of utilizing the credit facility.
(4)The net MoIC is calculated at the fund-level and is based on the interests of the fee-paying limited partners and if applicable, excludes those interests attributable to the non-fee paying limited partners and/or the general partner which does not pay management fees or carried interest. The net MoIC is after giving effect to management fees and carried interest, other expenses and credit facility interest expenses, as applicable. The funds may utilize a credit facility during the investment period and for general cash management purposes. Early in the life of a fund, the net fund-level MoICs would generally have been lower had such fund called capital from its limited partners instead of utilizing the credit facility.
(5)The gross IRR is an annualized since inception gross internal rate of return of cash flows to and from the fund and the fund’s residual value at the end of the measurement period. Gross IRR reflects returns to the fee-paying limited partners and, if applicable, excludes interests attributable to the non-fee paying limited partners and/or the general partner which does not pay management fees or carried interest. The cash flow dates used in the gross IRR calculation are based on the actual dates of the cash flows. GrossThe gross IRRs are calculated before giving effect to management fees, performance feescarried interest and other expenses, as applicable, but after giving effect to credit facility interest expenses, as applicable. The funds may utilize a credit facility during the investment period and for general cash management purposes. Gross fund-level IRRs would generally have been lower had such fund called capital from its limited partners instead of utilizing the credit facility.
(6)The net IRR is an annualized since inception net internal rate of return of cash flows to and from the fund and the fund’s residual value at the end of the measurement period. Net IRRs reflect returns to the fee-paying limited partners and, if applicable, exclude interests attributable to the non-fee paying limited partners and/or the general partner which does not pay management fees or carried interest. The cash flow dates used in the net IRR calculations are based on the actual dates of the cash flows. The net IRRs are calculated after giving effect to management fees and carried interest, other expenses.
(6)
The net IRR is an annualized since inception net internal rate of return of cash flows to and from the fund and the fund’s residual value at the end of the measurement period. Net IRRs reflect returns to the fee-paying limited partners and if applicable, exclude interests attributable to the non-fee paying limited partners and/or the general partner who does not pay management fees or performance fees. The cash flow dates used in the net IRR calculations are based on the actual dates of the cash flows. The net IRRs are calculated after giving effect to management fees, performance fees as applicable, and other expenses. The funds may utilize a credit facility during the investment period and for general cash management purposes. Net fund-level IRRs would have been lower had such fund called capital from its limited partners instead of utilizing the credit facility.
(7)
ACE II is made up of two feeder funds, one denominated in U.S. dollars and one denominated in Euros. The gross and net IRR and gross and net MoIC presented in the chart are for the U.S. dollar denominated feeder fund as that is the larger of the two feeders. The gross and net IRR for the Euro denominated feeder fund are 12.5% and 9.4%, respectively. The gross and net MoIC for the Euro denominated feeder fund are 1.5x and 1.3x, respectively. Original capital commitments are converted to U.S. dollars at the prevailing exchange rate at the time of the fund's closing. All other values for ACE II are for the combined fund and are converted to U.S. dollars at the prevailing quarter-end exchange rate. The variance between the gross and net MoICs and the net IRRs for the U.S. dollar denominated and Euro denominated feeder funds is driven by the U.S. GAAP mark-to-market reporting of the foreign currency hedging program in the U.S. dollar denominated feeder fund. The feeder fund will be holding the foreign currency hedges until maturity, and therefore is expected to ultimately recognize a gain while mitigating the currency risk associated with the initial principal investments.
(8)
ACE III is made up of two feeder funds, one denominated in U.S. dollars and one denominated in Euros. The gross and net MoIC presented in the chart are for the Euro denominated feeder fund as that is the larger of the two feeders. The gross and net IRR for the U.S. dollar denominated feeder fund are 17.5% and 12.8%, respectively. The gross and net MoIC for the U.S. dollar denominated feeder fund are 1.2x and 1.1x, respectively. Original capital commitments are converted to U.S. dollars at the prevailing exchange rate at the time of the fund's closing. All other values for ACE III are for the combined fund and are converted to U.S. dollars at the prevailing quarter-end exchange rate.

expenses and credit facility interest expenses, as applicable. The funds may utilize a credit facility during the investment period and for general cash management purposes. Net fund-level IRRs would generally have been lower had such fund called capital from its limited partners instead of utilizing the credit facility.


Private Equity Group
(7)ACE IV is made up of four parallel funds, two denominated in Euros and two denominated in pound sterling: ACE IV (E) Unlevered, ACE IV (G) Unlevered, ACE IV (E) Levered and ACE IV (G) Levered. The followinggross and net IRR and MoIC presented in the table sets forth certain statementare for ACE IV (E) Unlevered and ACE IV (E) Levered. Metrics for ACE IV (E) Levered are inclusive of operations dataa U.S. dollar denominated feeder fund, which has not been presented separately. The gross and certainnet IRR for ACE IV (G) Unlevered are 9.7% and 7.0%, respectively. The gross and net MoIC for ACE IV (G) Unlevered are 1.4x and 1.3x, respectively. The gross and net IRR for ACE IV (G) Levered are 12.8% and 9.1%, respectively. The gross and net MoIC for ACE IV (G) Levered are 1.5x and 1.4x, respectively. Original capital commitments are converted to U.S. dollars at the prevailing exchange rate at the time of the fund’s closing. All other data of our Private Equity Group segmentvalues for ACE IV Unlevered and ACE IV Levered are for the periods presented.combined levered and unlevered parallel funds and are converted to U.S. dollars at the prevailing quarter-end exchange rate.
 For the Years Ended December 31, 2017 vs. 2016 2016 vs. 2015
 2017 2016 2015 Favorable (Unfavorable) Favorable (Unfavorable)
       $ Change % Change $ Change % Change
 (Dollars in thousands)
Management fees$198,498
 $147,790
 $152,104
 $50,708
 34 % $(4,314) (3)%
Other fees1,495
 1,544
 1,406
 (49) (3)% 138
 10 %
Compensation and benefits(68,569) (61,276) (56,859) (7,293) (12)% (4,417) (8)%
General, administrative and other expenses(17,561) (14,679) (15,647) (2,882) (20)% 968
 6 %
Fee Related Earnings113,863
 73,379
 81,004
 40,484
 55 % (7,625) (9)%
Performance fees-realized287,092
 230,162
 24,849
 56,930
 25 % 205,313
 NM
Performance fees-unrealized191,559
 188,287
 87,809
 3,272
 2 % 100,478
 114 %
Performance fee compensation-realized(228,774) (184,072) (19,255) (44,702) (24)% (164,817) NM
Performance fee compensation-unrealized(153,148) (149,956) (74,598) (3,192) (2)% (75,358) (101)%
Net performance fees96,729
 84,421
 18,805
 12,308
 15 % 65,616
 NM
Investment income-realized22,625
 18,773
 6,840
 3,852
 21 % 11,933
 174 %
Investment income (loss)-unrealized38,754
 (613) (13,205) 39,367
 NM
 12,592
 (95)%
Interest and other investment income3,906
 16,579
 6,166
 (12,673) (76)% 10,413
 169 %
Interest expense(5,218) (5,589) (5,936) 371
 7 % 347
 6 %
Net investment income (loss)60,067
 29,150
 (6,135) 30,917
 106 % 35,285
 NM
Performance related earnings156,796
 113,571
 12,670
 43,225
 38 % 100,901
 NM
Economic net income$270,659
 $186,950
 $93,674
 83,709
 45 % 93,276
 100 %
Realized income$192,814
 $149,544
 $93,668
 43,270
 29 % 55,876
 60 %
Distributable earnings$187,733
 $144,140
 $88,767
 43,593
 30 % 55,373
 62 %
NM - Not meaningful

Accrued performance fees(8)ACE V is made up of four parallel funds, two denominated in Euros and two denominated in pound sterling: ACE V (E) Unlevered, ACE V (G) Unlevered, ACE V (E) Levered, and ACE V (G) Levered, and two feeder funds: ACE V (D) Levered and ACE V (Y) Unlevered. ACE V (E) Levered includes the ACE V (D) Levered feeder fund and ACE V (E) Unlevered includes the ACE V (Y) Unlevered feeder fund. The gross and net IRR and gross and net MoIC presented in the table are for ACE V (E) Unlevered and ACE V (E) Levered. Metrics for ACE V (E) Levered exclude the ACE V (D) Levered feeder fund and metrics for ACE V (E) Unlevered exclude the ACE V (Y) Unlevered feeder fund. The gross and net IRR for ACE V (G) Unlevered are 13.3% and 10.0%, respectively. The gross and net MoIC for ACE V (G) Unlevered are 1.2x and 1.2x, respectively. The gross and net IRR for ACE V (G) Levered are 18.1% and 13.2%, respectively. The gross and net MoIC for ACE V (G) Levered are 1.3x and 1.2x, respectively. The gross and net IRR for ACE V (D) Levered are 16.6% and 12.3%, respectively. The gross and net MoIC for ACE V (D) Levered are 1.3x and 1.2x, respectively. The gross and net IRR for ACE V (Y) Unlevered are 11.1% and 8.0%, respectively. The gross and net MoIC for ACE V (Y) Unlevered are 1.2x and 1.1x, respectively. Original capital commitments are converted to U.S. dollars at the prevailing exchange rate at the time of the fund's closing. All other values for ACE V Unlevered and ACE V Levered are for the Private Equity Groupcombined levered and unlevered parallel funds and are comprised ofconverted to U.S. dollars at the following:prevailing quarter-end exchange rate.
 As of December 31,
 2017 2016
 (Dollars in thousands)
ACOF III$570,578
 $342,958
ACOF IV217,354
 234,207
EIF V16,215
 16,510
Other funds11,260
 30,174
Total Private Equity Group$815,407
 $623,849
Net performance fee revenues(9)Performance for the Private Equity Groupopen-ended core alternative credit fund, a perpetual capital vehicle, is presented as a drawdown fund as investor commitments to the fund are compriseddrawn sequentially in order of closing date, typically over a period of approximately 12 to 18 months. The fund is made up of a Class M (“Main Class”) and a Class C (“Constrained Class”). The Main Class includes investors electing to participate in all investments and the following:
 Year Ended December 31, 2017 Year Ended December 31, 2016 Year Ended December 31, 2015
 Realized Unrealized Net Realized Unrealized Net Realized Unrealized Net
 (Dollars in thousands)
ACOF III$58,946
 $227,620
 $286,566
 $161,216
 $4,574
 $165,790
 $4,925
 $90,420
 $95,345
ACOF IV223,479
 (16,852) 206,627
 41,807
 181,571
 223,378
 10,545
 9,512
 20,057
EIF V
 (294) (294) 
 16,510
 16,510


Other funds4,667
 (18,915) (14,248) 27,139
 (14,368) 12,771
 9,379
 (12,123) (2,744)
Total Private Equity Group$287,092

$191,559

$478,651
 $230,162
 $188,287
 $418,449
 $24,849
 $87,809
 $112,658
Constrained Class includes investors electing to be excluded from exposure to liquid investments. The following tables presentgross and net IRR and gross and net MoIC presented in the components of the change in performance fees - unrealizedtable are for the Private Equity Group:Main Class. The gross and net IRRs for the Constrained Class are 10.8% and 7.7%, respectively. The gross and net MoIC for the Constrained Class are 1.2x and 1.1x, respectively.
135
 Year Ended December 31, 2017 Year Ended December 31, 2016
 Performance Fees - Realized Increases Decreases Performance Fees - Unrealized Performance Fees - Realized Increases Decreases Performance Fees - Unrealized
 (Dollars in thousands)
ACOF III$(58,946) $286,566
 $
 $227,620
 $(161,216) $165,790
 $
 $4,574
ACOF IV(223,479) 206,627
 
 (16,852) (41,807) 223,378
 
 181,571
EIF V
 
 (294) (294) 
 16,510
 
 16,510
Other funds(4,667) 1,016
 (15,264) (18,915) (27,139) 15,697
 (2,926) (14,368)
Total Private Equity Group$(287,092) $494,209
 $(15,558) $191,559
 $(230,162) $421,375
 $(2,926) $188,287

 Year Ended December 31, 2015
 Performance Fees - Realized Increases Decreases Performance Fees - Unrealized
 (Dollars in thousands)
ACOF III$(4,925) $95,345
 $
 $90,420
ACOF IV(10,545) 20,057
 
 9,512
Other funds(9,379) 10,260
 (13,004) (12,123)
Total Private Equity Group$(24,849) $125,662
 $(13,004) $87,809


Private Equity Group—Year Ended December 31, 20172023Compared to Year Ended December 31, 20162022
Fee Related Earnings:Earnings
Fee related earningsThe following table presents the components of the Private Equity Group’s FRE ($ in thousands):
Year ended December 31,Favorable (Unfavorable)
20232022$ Change% Change
Management fees$230,251 $199,837 $30,414 15%
Other fees3,076 1,888 1,188 63
Compensation and benefits(85,024)(86,561)1,537 2
General, administrative and other expenses(35,762)(30,697)(5,065)(16)
Fee Related Earnings$112,541 $84,467 28,074 33

Management Fees. The chart below presents Private Equity Group management fees and effective management fee rates ($ in millions):
PE Mgmt Fee chart.jpg
Management fees from ASOF II increased $40.5by $35.3 million or 55%,for the year ended December 31, 2023 compared to $113.9the prior yearprimarily driven by deployment. Management fees also increased by $7.4 million for the year ended December 31, 20172023 due to the Crescent Point Acquisition. The increase in management fees was partially offset by decrease of $5.0 million in fees from ACOF IV for the year ended December 31, 2023 compared to the prior year as the fund stopped paying management fees during the fourth quarter of 2022. Management fees from ASOF I also decreased by $5.6 million for the year ended December 31, 2023 compared to the prior year due to asset realizations that reduced the fee base.
The increase in effective management fee rate for the year ended December 31, 2023 compared to the year ended December 31, 2016. Fee related earnings were impacted2022 was primarily driven by fluctuationsdeployment of capital in ASOF II, which has a higher effective management fee rate than the Private Equity Group’s average effective management fee rate. In addition, certain funds from the Crescent Point Acquisition contributed to the increase in effective management fee rate as those funds have a higher effective management fee rate than the Private Equity Group’s average effective management fee rate.

136

Other Fees. Other fees increasedyear ended December 31, 2023 compared to the prior year primarily due to higher administrative service fees on funds that pay on invested capital, driven by deployment from ASOF II and ACOF VI.

Compensation and Benefits. Although salary and benefits costs have modestly increased during the year ended December 31, 2023 compared to the prior year to reflect merit increases for existing personnel, as well as changes in headcount from the Crescent Point Acquisition, compensation and benefits have decreased over the comparative period, primarily driven by lower incentive-based compensation which is discretionary and may fluctuate each year. In connection to the Crescent Point Acquisition, we recognized $3.1 million of compensation and benefits for the three months ended December 31, 2023 following components:the transaction close date of October 2, 2023.
Management Fees. Total management
Average headcount increased by 6% to 129 investment and investment support professionals for the year-to-date period in 2023 from 122 professionals in 2022, primarily due to the Crescent Point Acquisition.

General, Administrative and Other Expenses. Placement fees increased by $50.7 million, or 34%, to $198.5$2.9 million for the year ended December 31, 20172023 compared to the prior year primarily driven by new capital commitments to ASOF II subsequent to the second quarter of 2022 and through its final close in the fourth quarter of 2022. Additionally, occupancy costs which support our professionals that are based in higher cost locations, increased by $1.4 million for the year ended December 31, 2023 when compared to the year ended December 31, 2016. 2022. Separately, the Crescent Point Acquisition that closed on October 2, 2023, contributed an additional $1.2 million of expenses, primarily consisted of consulting fees and occupancy costs.

Realized Income
The increasefollowing table presents the components of the Private Equity Group’s RI ($ in thousands):
Year ended December 31,Favorable (Unfavorable)
20232022$ Change% Change
Fee Related Earnings$112,541 $84,467 $28,074 33%
Performance income—realized117,899 123,806 (5,907)(5)
Performance related compensation—realized(89,767)(90,300)533 1
Realized net performance income28,132 33,506 (5,374)(16)
Investment income (loss)—realized(1,434)3,432 (4,866)NM
Interest and other investment income—realized4,952 2,546 2,406 95
Interest expense(21,422)(15,953)(5,469)(34)
Realized net investment loss(17,904)(9,975)(7,929)(79)
Realized Income$122,769 $107,998 14,771 14
Realized net performance income for the years ended December 31, 2023 and 2022 was primarily attributable to ACOF V, which began generating fees in March 2017 totaling $90.8 milliontax distributions from ASOF I. Realized net performance income for the year ended December 31, 2017. In addition, Ares Energy Investors Fund V, L.P. ("EIF V") held its final close2023 also included realized gains from the partial sale of ACOF IV’s investment in the second quarter of 2017, generating additional management fees of $8.9 million forAZEK, while the year ended December 31, 2017. Management fees generated by EIF V2022 included realized gains from the partial sale and recapitalization of ACOF IV’s investment in an energy company.
Realized net investment loss for the yearyears ended December 31, 2017 included $5.8 million of one-time catch-up fees. Partially offsetting these increases were management fees generated by Ares Corporate Opportunities Fund IV, L.P. (“ACOF IV”), which decreased by $37.1 million due to a reduced fee rate2023 and change in fee basis in connection with the launch of ACOF V. Additionally, management fees attributable to certain U.S. power and energy infrastructure funds decreased $9.4 million as a result of portfolio realizations, which reduced the fee bases of the funds.
The effective management fee rate decreased from 1.26% for the year ended December 31, 2016 to 1.20% for the year ended December 31, 2017, excluding the effect of one-time catch-up fees. The decreases in the effective management fee rate resulted from the reduced fee rate at ACOF IV and were partially offset by ACOF V management fees.
Compensation and Benefits.  Compensation and benefits expenses increased by $7.3 million, or 12%, to $68.6 million for the year ended December 31, 2017 compared to the year ended December 31, 2016. The increase was primarily due to increases in salary and benefits expenses as a result of additional headcount needed to support ACOF V's capital deployment, as well as merit based increases. Compensation and benefits expenses represented 34.5% of management fees for the year ended December 31, 2017 compared to 41.5% for the year ended December 31, 2016.
General, Administrative and Other Expenses.  General, administrative and other expenses increased by $2.9 million, or 20%, to $17.6 million for the year ended December 31, 2017 compared to the year ended December 31, 2016. The increase in the current year2022 was primarily attributable to an increase in recruiting fees of $1.7 million and other business support costs driven by increased headcount.
Performance Related Earnings:
Performance related earnings increased $43.2 million to $156.8 million for the year ended December 31, 2017 compared to the year ended December 31, 2016. Performance related earnings were impacted by fluctuations of the following components:
Net Performance Fees. Net performance fees include realized and unrealized performance fees, net of realized and unrealized performance fee compensation. The impact of reversals of previously recognized performance fee revenue and the corresponding performance fee compensationinterest expense is reflected as a reduction in unrealized performance fees and unrealized performance fee compensation.
Net performance fees increased by $12.3 million to $96.7 million for the year ended December 31, 2017 compared to $84.4 million for the year ended December 31, 2016. The increase in net performance fees was primarily driven by significant market appreciation in one of ACOF III's retail portfolio companies following its initial public offering.
Net Investment Income (Loss). Netexceeding investment income during these periods. Interest expense, which is allocated among our segments based on the cost basis of balance sheet investments, increased by $30.9 million to $60.1 million forover the year ended December 31, 2017. The increase was primarily attributable to ACOF III, which had an increase of $32.2 million in net realized and unrealized gains for the year ended December 31, 2017comparative periods primarily due to market appreciation in onerising SOFR rates and a higher average outstanding balance of its retail portfolio companies that completed its initial public offering in the current year. 
Realized Income:
Realized income increased $43.3 million, or 29%, to $192.8 million for the year ended December 31, 2017 comparedCredit Facility and to the year ended December 31, 2016, primarily driven by increases in net realized performance fees of $12.2 million and FRE of $40.5 million. The increases were partially offset by a $9.4 million decrease in net realized investment and other income.

Economic Net Income:
Economic net income is comprised of fee related earnings and performance related earnings. Economic net income increased $83.7 million, or 45%, to $270.7 million for the year ended December 31, 2017 compared to the year ended December 31, 2016 as a resultissuance of the fluctuations described above.2028 Senior Notes in November 2023.
Distributable Earnings:
DE increased $43.6 million, or 30%, to $187.7 million for the year ended December 31, 2017 compared to the year ended December 31, 2016. DE was positively impacted by increases in net realized performance fees of $12.2 million and FRE of $40.5 million. The increases were partially offset by a $9.4 million decrease in net realized investment and other income.
Private Equity Group—Year Ended December 31, 2016Compared to Year Ended December 31, 2015
Fee Related Earnings:
Fee related earnings decreased $7.6 million, or 9%, to $73.4 million for the year ended December 31, 2016 compared to the year ended December 31, 2015. Fee related earnings were impacted by fluctuations of the following components:
Management Fees. Total management fees decreased by $4.3 million, or 3%, to $147.8 million for the year ended December 31, 2016 compared to the year ended December 31, 2015. The decrease was primarily attributable to the absence of management fees from Ares Corporate Opportunities Fund II, L.P. (“ACOF II”) in the current year, from which we generated $3.8 million of fees in the year ended December 31, 2015. In connection with an extension of ACOF II’s term for one year, we agreed to waive management fees starting in the first quarter of 2016. The effective management fee rate decreased by 0.01% from 1.27% for the year ended December 31, 2015, to 1.26% for the year ended December 31, 2016.
Compensation and Benefits. Compensation and benefits expenses increased by $4.4 million, or 8%, to $61.3 million for the year ended December 31, 2016 compared to the year ended December 31, 2015. The increase is primarily due to an increase in salary and benefits expenses, which were higher due to merit based increases and an increase in headcount in anticipation of ACOF V capital deployment. Additionally, incentive based compensation increased in the current year. Compensation and benefits expenses represented 41.5% of management fees for the year ended December 31, 2016 compared to 37.4% for the year ended December 31, 2015.
General, Administrative and Other Expenses.  General, administrative and other expenses decreased by $1.0 million, or 6%, to $14.7 million for the year ended December 31, 2016 compared to the year ended December 31, 2015. The decrease was due to the timing of various services delivered over both years. We expect general, administrative and other expenses to increase in 2017 as capital is deployed in ACOF V.
Performance Related Earnings:
Performance related earnings increased $100.9 million to $113.6 million for the year ended December 31, 2016 compared to the year ended December 31, 2015. Performance related earnings were impacted by fluctuations of the following components:
Net Performance Fees. Net performance fees include realized and unrealized performance fees, net of realized and unrealized performance fee compensation. The impact of reversals of previously recognized performance fee revenue and the corresponding performance fee compensation expense is reflected as a reduction in unrealized performance fees and unrealized performance fee compensation.
Net performance fees increased by $65.6 million to $84.4 million for the year ended December 31, 2016 compared to $18.8 million for the year ended December 31, 2015. The increase in net performance fees for the year ended December 31, 2016 was primarily driven by increases in the valuation of certain underlying portfolio companies within certain of our Private Equity Group’s funds.
Net Investment Income (Loss). Net investment income (loss) increased by $35.3 million from a net investment loss of $6.1 million for the year ended December 31, 2015 to net investment income of $29.2 million for the year ended December 31, 2016. Net investment income of $29.2 million for the year ended December 31, 2016 was primarily comprised of $15.6 million and $12.6 million of dividends and net realized gains from sales of ACOF III portfolio companies, respectively. In comparison, there was a $6.1 millionRealized net investment loss for the year ended December 31, 2015, primarily as a result of net2023 also reflects realized and unrealized losses of $17.9 million and $9.8 million on certain investments in the special situations funds and an Asianfrom two corporate

private equity fund, respectively. These losses were offset by unrealized gainsfunds, including the liquidation of $21.2 million on certain investments in North America and Europe driven by unrealized appreciationone of those funds following the fair valuesdisposition of certain underlying investments.
Realized Income:
Realized income increased $55.9 million, or 60%, to $149.5 millionits remaining assets. The activity for the year ended December 31, 2016 compared to the year ended December 31, 2015. The increase2023 was due to increases in net realized performance fees and net realized investment and other income of $40.5 million and $23.0 million, respectively, partially offset by a $7.6 million decreasedividend income from SSF IV and realized gains from the partial sale of ACOF IV’s investment in FRE.AZEK.
Economic Net Income:
137

Economic netPrivate Equity Group—Performance Income
The following table presents the accrued carried interest, also referred to as accrued performance income, is comprised of feeand related earnings and performance related earnings. Economic net income increased $93.3 million, or 100%, to $187.0 millioncompensation for the year ended December 31, 2016 compared toPrivate Equity Group ($ in thousands):
As of December 31,
20232022
Accrued Performance IncomeAccrued Performance CompensationAccrued Net Performance IncomeAccrued Performance IncomeAccrued Performance CompensationAccrued Net Performance Income
ACOF IV$181,317 $145,197 $36,120 $282,624 $226,099 $56,525 
ACOF V474,878 380,807 94,071 742,962 594,369 148,593 
ACOF VI337,142 289,118 48,024 147,185 117,748 29,437 
ASOF I357,016 250,198 106,818 326,471 228,529 97,942 
ASOF II80,926 56,648 24,278 — — — 
Other funds192,167 141,481 50,686 108,997 75,583 33,414 
Total Private Equity Group$1,623,446 $1,263,449 $359,997 $1,608,239 $1,242,328 $365,911 
The following table presents the year ended December 31, 2015 as a result of the fluctuations described above.
Distributable Earnings:
DE increased $55.4 million, or 62%, to $144.1 millionchange in accrued carried interest for the year ended December 31, 2016 compared to the year ended December 31, 2015. DE was positively impacted by increasesPrivate Equity Group ($ in net realized performance fees and net realized investment and other income of $40.5 million and $23.0 million, respectively. The increases were partially offset by a $7.6 million decrease in FRE.thousands):
 As of December 31, 2022Activity during the periodAs of December 31, 2023
Waterfall TypeAccrued Carried InterestChange in UnrealizedRealizedOther AdjustmentsAccrued Carried Interest
ACOF IVAmerican$282,624 $(35,830)$(65,477)$— $181,317 
ACOF VAmerican742,962 (268,084)— — 474,878 
ACOF VIAmerican147,185 189,957 — — 337,142 
ASOF IEuropean326,471 82,728 (52,183)— 357,016 
ASOF IIEuropean— 80,926 — — 80,926 
Other fundsEuropean92,509 82,079 — 8,479 183,067 
Other fundsAmerican16,488 (7,149)(239)— 9,100 
Total Private Equity Group$1,608,239 $124,627 $(117,899)$8,479 $1,623,446 

Private Equity Group—Assets Under Management

The tables below provide the period‑to‑periodpresent rollforwards of AUM for the Private Equity Group ($ in millions):
Corporate Private
Equity
Special
Opportunities
APAC Private Equity
Other(1)
Total Private
Equity Group
Balance at 12/31/2022$20,939 $13,720 $90 $ $34,749 
Acquisitions— — 3,697 — 3,697 
Net new par/equity commitments1,482 — — 139 1,621 
Capital reductions(9)— — — (9)
Distributions(1,794)(499)(16)— (2,309)
Change in fund value380 1,333 (357)— 1,356 
Balance at 12/31/2023$20,998 $14,554 $3,414 $139 $39,105 
Corporate Private
Equity
Special
Opportunities
APAC Private EquityOtherTotal Private
Equity Group
Balance at 12/31/2021$21,502 $11,765 $137 $ $33,404 
Net new par/equity commitments— 2,202 — — 2,202 
Capital reductions(8)(200)— — (208)
Distributions(1,009)(268)(56)— (1,333)
Change in fund value453 221 10 — 684 
Balance at 12/31/2022$20,938 $13,720 $91 $ $34,749 
(1) Activity within Other represents equity commitments to the platform that have not yet been allocated to an investment strategy.

138

The components of our AUM for the years ended December 31, 2017, 2016 and 2015 (in millions)Private Equity Group are presented below ($ in billions):
 Corporate Private Equity Private Equity - EIF Special Situations Total Private Equity Group
Balance at 12/31/2016$18,162
 $5,143
 $1,736
 $25,041
Net new equity commitments56
 300
 
 356
Distributions(2,130) (697) (187) (3,014)
Change in fund value2,469
 (323) 1
 2,147
Balance at 12/31/2017$18,557
 $4,423
 $1,550
 $24,530
Average AUM(3)$18,591
 $4,697
 $1,626
 $24,914
 Corporate Private Equity(1) Private Equity - EIF Special Situations Total Private Equity Group
Balance at 12/31/2015$15,908
 $5,207
 $1,863
 $22,978
Net new equity commitments2,184
 130
 
 2,314
Distributions(1,886) (372) (261) (2,519)
Change in fund value1,956
 178
 134
 2,268
Balance at 12/31/2016$18,162
 $5,143
 $1,736
 $25,041
Average AUM(3)$17,651
 $5,102
 $1,800
 $24,553
 Corporate Private Equity(2) Private Equity - EIF Special Situations Total Private Equity Group
Balance at 12/31/2014$10,135
 $
 $1,952
 $12,087
Acquisitions
 4,581
 
 4,581
Net new equity commitments5,696
 594
 410
 6,700
Distributions(728) (292) (61) (1,081)
Change in fund value805
 324
 (438) 691
Balance at 12/31/2015$15,908
 $5,207
 $1,863
 $22,978
Average AUM(3)$11,366
 $3,717
 $2,032
 $17,115
36533655
AUM: $39.1AUM: $34.7
FPAUM
Non-fee paying(1)
AUM not yet paying fees
(1)Net new equity commitments in 2016 includes $2.1 billion of commitments to ACOF V.
(2)Net new equity commitments in 2015 represents commitments to ACOF V.
(3)Represents a five-point average of quarter-end balances for each period.

(1) Includes $1.7 billion and $1.3 billion of non-fee paying AUM based on our general partner commitment as of December 31, 2023 and 2022, respectively.

Private Equity Group—Fee Paying AUM

The tables below provide the period‑to‑periodpresent rollforwards of fee paying AUM for the Private Equity Group for the years ended December 31, 2017, 2016 and 2015 (in($ in millions):
Corporate Private
Equity
Special
Opportunities
APAC Private EquityTotal Private
Equity Group
Balance at 12/31/2022$11,277 $7,166 $4 $18,447 
Acquisitions— — 1,692 1,692 
Deployment/subscriptions/increase in leverage220 2,518 14 2,752 
Distributions(38)(1,194)— (1,232)
Change in fee basis— — (45)(45)
Balance at 12/31/2023$11,459 $8,490 $1,665 $21,614 
Corporate Private
Equity
Special
Opportunities
APAC Private EquityTotal Private
Equity Group
Balance at 12/31/2021$12,420 $4,216 $53 $16,689 
Deployment/subscriptions/increase in leverage36 4,453 — 4,489 
Distributions(385)(1,503)(14)(1,902)
Change in fund value— — (4)(4)
Change in fee basis(794)— (31)(825)
Balance at 12/31/2022$11,277 $7,166 $4 $18,447 
 Corporate Private Equity Private Equity - EIF Special Situations Total Private Equity Group
FPAUM Balance at 12/31/2016$6,454
 $4,232
 $628
 $11,314
Commitments7,655
 300
 
 7,955
Subscriptions/deployment/increase in leverage478
 230
 414
 1,122
Redemptions/distributions/decrease in leverage(966) (392) (248) (1,606)
Change in fund value4
 (351) (28) (375)
Change in fee basis(1,552) 
 
 (1,552)
FPAUM Balance at 12/31/2017$12,073
 $4,019
 $766
 $16,858
Average FPAUM(1)$11,157
 $4,047
 $682
 $15,886


139
 Corporate Private Equity Private Equity - EIF Special Situations Total Private Equity Group
FPAUM Balance at 12/31/2015$6,957
 $4,454
 $1,051
 $12,462
Commitments29
 130
 
 159
Subscriptions/deployment/increase in leverage52
 45
 (4) 93
Redemptions/distributions/decrease in leverage(288) (46) (331) (665)
Change in fund value
 (80) (88) (168)
Change in fee basis(296) (271) 
 (567)
FPAUM Balance at 12/31/2016$6,454
 $4,232
 $628
 $11,314
Average FPAUM(1)$6,652
 $4,306
 $842
 $11,800

 Corporate Private Equity Private Equity - EIF Special Situations Total Private Equity Group
FPAUM Balance at 12/31/2014$7,172
 $
 $530
 $7,702
Acquisitions
 4,046
 
 4,046
Commitments
 523
 
 523
Subscriptions/deployment/increase in leverage39
 134
 518
 691
Redemptions/distributions/decrease in leverage(149) (247) (18) (414)
Change in fund value
 (2) (29) (31)
Change in fee basis(105) 
 50
 (55)
FPAUM Balance at 12/31/2015$6,957
 $4,454
 $1,051
 $12,462
Average FPAUM(1)$7,031
 $3,265
 $859
 $11,155


The charts below present FPAUM for the Private Equity Group by its fee basis as of December 31, 2017, 2016 and 2015 (in millions)bases ($ in billions):
39563957
FPAUM: $21.6
FPAUM: $16,858$18.5FPAUM: $11,314


Invested capital
FPAUM: $12,462Capital commitments


The components of our AUM, including the portion that is FPAUM, for the Private Equity Group are presented below as of December 31, 2017, 2016 and 2015 (in millions):

AUM: $24,530AUM: $25,041


AUM: $22,978


Private Equity Group—Fund Performance Metrics as of December 31, 20172023
The Private Equity Group managed 21 commingled funds and related co-investment vehicles as of December 31, 2017. Our
Four significant funds, combined forACOF V, ASOF I, ACOF VI and ASOF II, collectively contributed approximately 93%85% of the Private Equity Group’s management fees for the year ended December 31, 2017. Our Corporate2023.

The following table presents the performance data of the Private Equity Group’s significant drawdown funds focusas of December 31, 2023 ($ in millions):
Year of InceptionAUMOriginal Capital CommitmentsCapital Invested to Date
Realized Value(1)
Unrealized Value(2)
Total ValueMoICIRR(%)Primary Investment Strategy
Fund
Gross(3)
Net(4)
Gross(5)
Net(6)
Funds Harvesting Investments
ACOF V2017$8,765 $7,850 $7,611 $3,505 $8,253 $11,758 1.5x1.4x11.68.3Corporate Private Equity
ASOF I20195,559 3,518 5,500 4,462 3,775 8,237 1.8x1.6x26.020.2Special Opportunities
Funds Deploying Capital
ACOF VI20207,419 5,743 5,109 593 6,696 7,289 1.4x1.3x24.217.9Corporate Private Equity
ASOF II20217,580 7,128 5,926 1,371 5,241 6,612 1.2x1.1x14.49.6Special Opportunities
(1)Realized value represents the sum of all cash dividends, interest income, other fees and cash proceeds from realizations of interests in portfolio investments. Realized value excludes any proceeds related to bridge financings.
(2)Unrealized value represents the fair market value of remaining investments. Unrealized value does not take into account any bridge financings. There can be no assurance that unrealized investments will be realized at the valuations indicated.
(3)The gross MoIC is calculated at the fund-level and is based on majority the interests of the fee-paying limited partners and if applicable, excludes interests attributable to the non-fee paying limited partners and/or shared-control investments, principally in under-capitalized companies in North America, Europe and Asia. ACOF III and ACOF IV are in harvest mode, meaning they are generallythe general partner which does not seeking to deploy capital into new investment opportunities, while ACOF V is in deployment mode. Each of our U.S. power and energy infrastructure funds focuses on generating long-term, stable cash-flowing investments in the power generation, transmission and midstream energy sector. USPF III and USPF IV are in harvest mode, while EIF V is in deployment mode. We do not present fund performance metrics for significant funds with less than two years of historical information, except for those significant funds which pay management fees on investedor carried interest. The gross MoIC is before giving effect to management fees, carried interest, as applicable, and other expenses, but after giving effect to credit facility interest expenses, as applicable. The gross MoICs are also calculated before giving effect to any bridge financings. The funds may utilize a credit facility during the investment period and for general cash management purposes. Early in the life of a fund, the gross fund-level MoICs would generally have been lower had such fund called capital in which case performancefrom its limited partners instead of utilizing the credit facility.
(4)The net MoIC is showncalculated at the earlier of (i)fund-level. The net MoIC is based on the one year anniversaryinterests of the fund's firstfee-paying limited partners and if applicable, excludes interests attributable to the non-fee paying limited partners and/or the general partner which does not pay management fees or performance fees. The net MoIC is after giving effect to management fees, carried interest, as applicable, and other expenses. The net MoICs are also calculated before giving effect to any bridge financings. Inclusive of bridge financings, the net MoIC would be 1.3x for ACOF V and 1.2x for ACOF VI. The funds may utilize a credit facility during the investment period and for general cash management purposes. Early in the life of a fund, the net fund-level MoICs would generally have been lower had such fund called capital from its limited partners instead of utilizing the credit facility.
(5)The gross IRR is an annualized since inception gross internal rate of return of cash flows to and from the fund and the fund’s residual value at the end of the measurement period. Gross IRRs reflect returns to the fee-paying limited partners and, if applicable, excludes interests attributable to the non-fee paying limited partners and/or the general partner which does not pay management fees or carried interest. The cash flow dates used in the gross IRR calculation are based on the actual dates of the cash flows. The gross IRRs are calculated before giving effect to management fees, carried interest, as applicable, and other expenses, but after giving effect to credit facility interest expenses, as applicable. The gross IRRs are also calculated before giving effect to any bridge financings. The funds may utilize a credit facility during the investment period and for general cash management purposes. Gross fund-level IRRs would generally have been lower had such fund called capital from its limited partners instead of utilizing the credit facility.
(6)The net IRR is an annualized since inception net internal rate of return of cash flows to and from the fund and the fund’s residual value at the end of the measurement period. Net IRRs reflect returns to the fee-paying limited partners and if applicable, exclude interests attributable to the non-fee paying limited partners and/or the general partner which does not pay management fees or carried interest. The cash flow dates used in the net IRR calculation are based on the actual dates of the cash flows. The net IRRs are calculated after giving effect to management fees, carried interest as applicable, and other expenses and exclude commitments by the general partner and Schedule I investors who do not pay either management fees or carried interest. The funds may utilize a credit facility during the investment period and for general cash management purposes. Net fund-level IRRs would generally have been lower had such fund called capital from its limited partners instead of utilizing the credit facility. The net IRRs are also calculated before giving effect to any bridge financings. Inclusive of bridge financings, the net IRRs would be 8.4% for ACOF V and 16.6% for ACOF VI.

140

Real Assets Group—Year Ended December 31, 2023Compared to Year Ended December 31, 2022
Fee Related Earnings
The following table presents the components of the Real Assets Group’s FRE ($ in thousands):
Year ended December 31,Favorable (Unfavorable)
20232022$ Change% Change
Management fees$389,437 $347,808 $41,629 12%
Fee related performance revenues334 167,693 (167,359)(100)
Other fees29,695 35,879 (6,184)(17)
Compensation and benefits(153,870)(240,015)86,145 36
General, administrative and other expenses(46,789)(39,739)(7,050)(18)
Fee Related Earnings$218,807 $271,626 (52,819)(19)

Management Fees. The chart below presents Real Assets Group management fees and effective management fee rates ($ in millions):
Management fees_RA.jpg

Management fees from IDF V increased by $9.3 million for the year ended December 31, 2023 compared to the prior year primarily driven by deployment of capital. Our second climate infrastructure fund, which launched during the second quarter of 2023, contributed additional management fees of $4.8 million primarily driven by new capital commitments for the year ended December 31, 2023. Management fees from AREIT and AIREIT also collectively increased by $11.4 million for the year ended December 31, 2023 compared to the prior year driven by increases in the average capital base of AREIT and AIREIT. The increase over the comparative period also included $1.5 million from make-whole termination fees, driven by the early termination of the advisory agreements of two U.S. industrial real estate equity funds, which resulted in the acceleration of contractual management fees.

141

Management fees for the year ended December 31, 2023 included: (i) $1.8 million of catch-up fees from our fourth U.S. opportunistic real estate equity fund; and (ii) $0.3 million of catch-up fees from Ares European Real Estate Fund VI, L.P. (“EF VI”). Catch-up fees for the year ended December 31, 2022 included $4.8 million from US X.

Excluding catch-up fees previously discussed, management fees for the year ended December 31, 2023 compared to the prior year increased by: (i) $15.1 million for our fourth U.S. opportunistic real estate equity fund; (ii) $2.9 million for EF VI; and (iii) $3.3 million for US X, which closed in the third quarter of 2022. The increase in management fees for these funds was primarily driven by new capital commitments. Management fees from our most recent real estate equity funds increase once capital is invested and deployment in these funds has also contributed to the increase in fees over the comparative period.

The increase in effective management fee rate for the year ended December 31, 2023 compared to the year ended December 31, 2022 was primarily due to additional capital raised in our non-traded REITs, which have effective management fee rates between 1.10% and 1.25%.
Fee Related Performance Revenues. AREIT and AIREIT generated $164.3 million of incentive fees for the year ended December 31, 2022 but did not meet the performance hurdles to generate incentive fees for the year ended December 31, 2023, resulting in a decrease in fee related performance revenues.
Other Fees. The decrease in other fees for the year ended December 31, 2023 compared to the year ended December 31, 2022 was primarily attributable to a decrease of: (i) $11.4 million in acquisition and development fees resulting from a reduction in property-related activities within certain industrial U.S. real estate equity funds; and (ii) $2.9 million related to program administration fees resulting from the management and creation of our 1031 exchange program that is used by our non-traded REITs. The decrease for the year ended December 31, 2023 compared to the year ended December 31, 2022 was partially offset by higher credit transaction fees of $7.5 million. Credit transaction fees are generated periodically within the infrastructure debt strategy and relate to the arrangement and origination of loans.
Compensation and Benefits. The decrease in compensation and benefits for the year ended December 31, 2023 compared to the year ended December 31, 2022 was primarily driven by lower fee related performance compensation of $103.3 million, corresponding to the decrease in fee related performance revenues. The decrease over the comparative period was partially offset by higher salary expense of $11.5 million, primarily attributable to headcount growth.
Average headcount increased by 13% to 356 investment and investment support professionals for the year-to-date period in 2023 from 314 professionals in 2022.
General, Administrative and Other Expenses. Certain expenses increased during the current period, including: (i) occupancy costs which support our growing headcount that are based in higher cost locations; (ii) information services such timeas research and market data; and (iii) information technology costs. Collectively, these expenses increased by $4.0 million for the year ended December 31, 2023 compared to the prior year.

Additionally, the increase in general, administrative and other expenses was also driven by: (i) travel, marketing and certain fringe benefits, which collectively increased by $3.1 million, as we continued to increase marketing efforts driven by more investor meetings and events and conducted more in-person company meetings and events with a focus on promoting collaboration; and (ii) placement fees, which increased by $1.5 million, primarily attributable to new commitments in IDF V during 2022 and our fourth U.S. opportunistic real estate equity fund in connection with our fundraising efforts.


142

Realized Income

The following table presents the components of the Real Assets Group’s RI ($ in thousands):
Year ended December 31,Favorable (Unfavorable)
20232022$ Change% Change
Fee Related Earnings$218,807 $271,626 $(52,819)(19)%
Performance income—realized20,990 133,130 (112,140)(84)
Performance related compensation—realized(12,768)(83,105)70,337 85
Realized net performance income8,222 50,025 (41,803)(84)
Investment income (loss)—realized(4,498)3,115 (7,613)NM
Interest and other investment income—realized11,055 9,045 2,010 22
Interest expense(16,391)(11,346)(5,045)(44)
Realized net investment income (loss)(9,834)814 (10,648)NM
Realized Income$217,195 $322,465 (105,270)(33)

Realized net performance income for the years ended December 31, 2023 and 2022 included incentive fees generated from an open-ended industrial real estate fund and carried interest received upon realizations from US VIII, driven by multifamily property sales. Realized net performance income for the year ended December 31, 2023 also included carried interest received upon realizations from a U.S. real estate equity fund driven by multifamily property sales, while realized net performance income for the year ended December 31, 2022 included tax distributions from US IX.

Realized net investment loss for the year ended December 31, 2023 was primarily attributable to: (i) interest expense exceeding investment income during the periods; and (ii) realized losses recognized from a real estate debt vehicle, where financing costs are exceeding investment returns due to limited investment opportunities. This activity was partially offset by distributions of investment income from multiple real estate equity and real estate debt vehicles during the period.

Realized net investment income for the year ended December 31, 2022 included dividend income generated from an infrastructure opportunities fund.

Interest expense, which is 50% or more invested.allocated among our segments based on the cost basis of balance sheet investments, increased over the comparative periods primarily due to rising SOFR rates and a higher average outstanding balance of the Credit Facility and to the issuance of the 2028 Senior Notes in November 2023.

Real Assets Group—Performance Income

The following table presents the accrued carried interest, also referred to as accrued performance income, and related performance compensation for the Real Assets Group. Accrued net performance income excludes net performance income that has been realized but not yet received as of the reporting date ($ in thousands):
As of December 31,
20232022
Accrued Performance IncomeAccrued Performance CompensationAccrued Net Performance IncomeAccrued Performance IncomeAccrued Performance CompensationAccrued Net Performance Income
US VIII$32,199 $20,651 $11,548 $36,822 $23,566 $13,256 
US IX89,958 55,774 34,184 86,905 53,881 33,024 
EF IV49,150 29,490 19,660 61,791 37,075 24,716 
IDF V56,065 33,677 22,388 16,848 10,108 6,740 
AREOF III35,715 21,429 14,286 41,463 24,878 16,585 
EIF V93,598 69,969 23,629 94,398 70,562 23,836 
Other real assets funds140,167 92,468 47,699 154,641 97,894 56,747 
Total Real Assets Group$496,852 $323,458 $173,394 $492,868 $317,964 $174,904 


143

The following table presents the change in accrued performance income for the Real Assets Group ($ in thousands):
 As of December 31, 2022Activity during the periodAs of December 31, 2023
Waterfall
Type
Accrued Performance IncomeChange in UnrealizedRealizedOther AdjustmentsAccrued Performance Income
Accrued Carried Interest
US VIIIEuropean$36,822 $(2,162)$(2,461)$— $32,199 
US IXEuropean86,905 3,053 — — 89,958 
EF IVAmerican61,791 (12,641)— — 49,150 
IDF VEuropean16,848 37,875 — 1,342 56,065 
AREOF IIIEuropean41,463 (5,748)— — 35,715 
EIF VEuropean94,398 (800)— — 93,598 
Other real assets fundsEuropean97,934 16,973 (2,462)32 112,477 
Other real assets fundsAmerican56,707 (28,074)(926)(17)27,690 
Total accrued carried interest492,868 8,476 (5,849)1,357 496,852 
Other real assets fundsIncentive— 15,141 (15,141)— — 
Total Real Assets Group$492,868 $23,617 $(20,990)$1,357 $496,852 
Real Assets Group—Assets Under Management

The tables below present rollforwards of AUM for the Real Assets Group ($ in millions):
U.S. Real Estate
Equity
European Real
Estate Equity
Real Estate
Debt
Infrastructure
Opportunities
Infrastructure
Debt
Total Real
Assets Group
Balance at 12/31/2022$31,460 $8,561 $11,161 $5,194 $9,685 $66,061 
Net new par/equity commitments3,116 775 539 1,218 428 6,076 
Net new debt commitments— 326 400 — — 726 
Capital reductions(245)— (235)— — (480)
Distributions(2,813)(264)(259)(322)(1,138)(4,796)
Redemptions(1,207)— (552)— — (1,759)
Change in fund value(1,134)(12)98 158 475 (415)
Balance at 12/31/2023$29,177 $9,386 $11,152 $6,248 $9,450 $65,413 
U.S. Real Estate
Equity
European Real
Estate Equity
Real Estate
Debt
Infrastructure
Opportunities
Infrastructure
Debt
Total Real
Assets Group
Balance at 12/31/2021$24,677 $6,827 $9,659 $4,756 $ $45,919 
Acquisitions— — — — 8,184 8,184 
Net new par/equity commitments5,811 2,038 1,012 431 1,346 10,638 
Net new debt commitments1,305 719 1,229 — — 3,253 
Capital reductions(234)— (282)— — (516)
Distributions(1,539)(538)(196)(514)(396)(3,183)
Redemptions(516)— (435)— — (951)
Change in fund value1,956 (485)174 521 551 2,717 
Balance at 12/31/2022$31,460 $8,561 $11,161 $5,194 $9,685 $66,061 


144

The components of our AUM for the Real Assets Group are presented below ($ in billions):
69166918
AUM: $65.4AUM: $66.1
FPAUM
Non-fee paying(1)
AUM not yet paying fees
(1) Includes $0.6 billion of non-fee paying AUM based on our general partner commitment as of December 31, 2023 and 2022, respectively.

Real Assets Group—Fee Paying AUM

The tables below present rollforwards of fee paying AUM for the Real Assets Group ($ in millions):
U.S. Real Estate
Equity
European Real
Estate Equity
Real Estate
Debt
Infrastructure
Opportunities
Infrastructure
Debt
Total Real
Assets Group
Balance at 12/31/2022$21,788 $5,634 $3,691 $4,524 $5,970 $41,607 
Commitments2,525 26 (5)1,128 — 3,674 
Deployment/subscriptions/increase in leverage199 455 368 350 1,596 2,968 
Capital reductions(245)(99)(111)— — (455)
Distributions(1,125)(7)(264)(854)(1,612)(3,862)
Redemptions(1,207)(3)(565)— — (1,775)
Change in fund value(1,091)85 163 — (74)(917)
Change in fee basis— 98 — — — 98 
Balance at 12/31/2023$20,844 $6,189 $3,277 $5,148 $5,880 $41,338 
U.S. Real Estate
Equity
European Real
Estate Equity
Real Estate
Debt
Infrastructure
Opportunities
Infrastructure
Debt
Total Real
Assets Group
Balance at 12/31/2021$15,687 $4,916 $3,516 $4,496 $ $28,615 
Acquisitions— — — — 4,855 4,855 
Commitments4,947 1,627 106 — — 6,680 
Deployment/subscriptions/increase in leverage871 433 740 363 1,595 4,002 
Capital reductions— (17)(183)— — (200)
Distributions(865)(252)(237)(360)(387)(2,101)
Redemptions(516)— (449)— — (965)
Change in fund value1,696 (254)198 25 (93)1,572 
Change in fee basis(32)(819)— — — (851)
Balance at 12/31/2022$21,788 $5,634 $3,691 $4,524 $5,970 $41,607 

145

The charts below present FPAUM for the Real Assets Group by its fee bases ($ in billions):
71887190
FPAUM: $41.3FPAUM: $41.6
Market value(1)
Invested capital/other(2)
Capital commitments
(1)Amounts represent FPAUM from funds that primarily invest in illiquid strategies. The underlying investments held in these funds are generally subject to less market volatility than investments held in liquid strategies.
(2)Other consists of ACRE’s FPAUM, which is based on ACRE’s stockholders’ equity.

Real Assets Group—Fund Performance Metrics as of December 31, 2023

Five significant funds, AIREIT, AREIT, Ares Infrastructure Debt Fund IV L.P. (“IDF IV”), IDF V and an open-ended industrial real estate fund, collectively contributed approximately 44% of the Real Assets Group’s management fees for the year ended December 31, 2023.

The following table presents the performance data for our significant funds that are not drawdown funds in the Private EquityReal Assets Group as of December 31, 2023 ($ in millions):
   Returns(%) 
Year of InceptionAUMYear-To-Date
Since Inception(1)
Primary
Investment Strategy
FundGrossNetGrossNet
AREIT(2)
2012$5,267 N/A(4.8)N/A6.7 U.S. Real Estate Equity
AIREIT(3)
20177,718 N/A(9.8)N/A9.9 U.S. Real Estate Equity
Open-ended industrial real estate fund(4)
20174,957 (8.1)(7.7)19.9 16.2 U.S. Real Estate Equity
(1)Since inception returns are annualized.
(2)Performance is measured by total return, which includes income and appreciation and reinvestment of all distributions for the respective time period. Returns are shown for institutional share class. Shares of other classes may have lower returns due to higher selling commissions and fees. Actual individual stockholder returns will vary. Net returns are calculated using the fund’s NAV and assume distributions are reinvested at the NAV on the date of distribution. The inception date used in the calculation of the since inception return is the date in which the first shares of common stock were sold after converting to a NAV-based REIT. Additional information related to AREIT can be found in its filings with the SEC, which are drawdown funds:not part of this report.
(3)Performance is measured by total return, which includes income and appreciation and reinvestment of all distributions for the respective time period. Returns are shown for institutional share class. Shares of other classes may have lower returns due to higher selling commissions and fees. Actual individual stockholder returns will vary. Net returns are calculated using the fund’s NAV and assume distributions are reinvested at the NAV on the date of distribution. Additional information related to AIREIT can be found in its filings with the SEC, which are not part of this report.
(4)Returns are time-weighted rates of return and include the reinvestment of income and other earnings from securities or other investments and reflect the deduction of all trading expenses. Gross returns do not reflect the deduction of management fees, incentive fees, as applicable, or other expenses. Net returns are calculated by subtracting the applicable management fees, incentive fees, as applicable and other expenses from the gross returns on a quarterly basis.
146

     As of December 31, 2017 (Dollars in millions)      
 Year of Inception AUM Original Capital Commitments Cumulative Invested Capital Realized Proceeds(1) Unrealized Value(2) Total Value MoIC IRR(%)  
Fund       Gross(3) Net(4) Gross(5) Net(6) Investment Strategy
USPF III2007 $824
 $1,350
 $1,808
 $1,764
 $814
 $2,578
 1.4x 1.4x 7.8 5.1 U.S. Power and Energy Infrastructure
ACOF III2008 $4,548
 $3,510
 $3,867
 $6,181
 $4,220
 $10,401
 2.7x 2.3x 31.3 23.4 Corporate Private Equity
USPF IV2010 $1,827
 $1,688
 $1,846
 $809
 $1,639
 $2,448
 1.3x 1.2x 10.1 6.5 U.S. Power and Energy Infrastructure
ACOF IV2012 $5,479
 $4,700
 $3,836
 $2,492
 $4,313
 $6,805
 1.8x 1.5x 23.6 16.1 Corporate Private Equity
EIF V (7)2015 $882
 $801
 $313
 $77
 $371
 $448
 1.4x 1.6x NA NA U.S. Power and Energy Infrastructure
ACOF V2017 $7,798
 $7,850
 $1,415
 $14
 $1,483
 $1,497
 1.1x 1.0x NA NA Corporate Private Equity
(1)
Realized proceeds represent the sum of all cash dividends, interest income, other fees and cash proceeds from realizations of interests in portfolio investments.
(2)
Unrealized value represents the fair market value of remaining investments. There can be no assurance that unrealized investments will be realized at the valuations indicated.
(3)
The gross MoIC is calculated at the investment-level and is based on the interests of all partners. The gross MoIC is before giving effect to management fees, performance fees as applicable and other expenses.
(4)
The net MoIC for the U.S. power and energy infrastructure funds is calculated at the fund-level. The net MoIC for the corporate private equity funds is calculated at the investment-level. For all funds, the net MoIC is based on the interests of the fee-paying limited partnersand if applicable, excludes those interests attributable to the non-fee paying limited partners and/or the general partner who does not pay management fees or performance fees. The net MoIC is after giving effect to management fees, performance fees as applicable and other expenses.
(5)
The gross IRR is an annualized since inception gross internal rate of return of cash flows to and from investments and the residual value of the investments at the end of the measurement period. Gross IRRs reflect returns to all partners. Cash flows used in the gross IRR calculation are assumed to occur at month-end. The gross IRRs are calculated before giving effect to management fees, performance fees as applicable, and other expenses.
(6)
The net IRR for the U.S. power and energy infrastructure funds is an annualized since inception net internal rate of return of cash flows to and from the fund and the fund’s residual value at the end of the measurement period. The cash flow dates used in the net IRR calculations are based on the actual dates of the cash flows. The net IRR for the corporate private equity funds is an annualized since inception net internal rate of return of cash flows to and from investments and the residual value of the investments at the end of the measurement period. The funds may utilize a credit facility during the investment period and for general cash management purposes. Net fund-level IRRs would have been lower had such fund called capital from its limited partners instead of utilizing the credit facility. Cash flows used in the net IRR calculations are assumed to occur at month end. For all funds, the net IRRs are calculated after giving effect to management fees, performance fees as applicable, and other expenses and exclude commitments by the general partner and Schedule I investors who do not pay either management fees or carried interest. Including the timing on contribution and distributions to and from the corporate private equity funds, net investor IRRs since inception for ACOF III is 22.7% and for ACOF IV is 15.2%.
(7)
The Gross MoIC is lower than the Net MoIC due to the fund's utilization of a credit facility to fund an investment that is currently under construction and not generating cash flow.

Real Estate Group
The following table sets forth certain statement of operations data and certain otherpresents the performance data of ourthe Real Estate Group segmentAssets Group’s significant drawdown funds as of December 31, 2023 ($ in millions):
Year of InceptionAUMOriginal Capital CommitmentsCapital Invested to Date
Realized Value(1)
Unrealized Value(2)
Total ValueMoICIRR(%)Primary Investment Strategy
Fund
Gross(3)
Net(4)
Gross(5)
Net(6)
Fund Harvesting Investments
IDF IV(7)
2018$3,120 $4,012 $4,531 $2,235 $2,875 $5,110 1.2x1.2x6.9 5.3 Infrastructure Debt
Fund Deploying Capital
IDF V(8)
20204,771 4,585 3,152 519 2,945 3,464 1.1x1.1x12.4 9.5 Infrastructure Debt
(1)Realized value includes distributions of operating income, sales and financing proceeds received.
(2)Unrealized value represents the fund's NAV reduced by the accrued incentive allocation, if applicable. There can be no assurance that unrealized values will be realized at the valuations indicated.
(3)The gross MoIC is calculated at the fund-level and is based on the interests of the fee-paying limited partners and if applicable, excludes interests attributable to the non-fee paying limited partners and/or the general partner which does not pay management fees or carried interest. The gross MoIC is before giving effect to management fees, carried interest, as applicable, and other expenses, but after giving effect to credit facility interest expenses, as applicable. The funds may utilize a credit facility during the investment period and for general cash management purposes. Early in the life of a fund, the gross fund-level MoICs would generally have been lower had such fund called capital from its limited partners instead of utilizing the credit facility.
(4)The net MoIC is calculated at the fund-level and is based on the interests of the fee-paying limited partners and, if applicable, excludes interests attributable to the non fee-paying limited partners and/or the general partner which does not pay management fees or carried interest. The net MoIC is after giving effect to management fees, carried interest, as applicable, credit facility interest expense, as applicable, and other expenses. The funds may utilize a credit facility during the investment period and for general cash management purposes. Early in the life of a fund, the net fund-level MoICs would generally have been lower had such fund called capital from its limited partners instead of utilizing the credit facility.
(5)The gross IRR is an annualized since inception gross internal rate of return of cash flows to and from the fund and the fund’s residual value at the end of the measurement period. Gross IRR reflects returns to the fee-paying limited partners and, if applicable, excludes interests attributable to the non-fee paying limited partners and/or the general partner which does not pay management fees or carried interest. The cash flow dates used in the gross IRR calculation are based on the actual dates of the cash flows. The gross IRRs are calculated before giving effect to management fees, carried interest and other expenses, but after giving effect to credit facility interest expenses, as applicable. The funds may utilize a credit facility during the investment period and for general cash management purposes. Gross fund-level IRRs would generally have been lower had such fund called capital from its limited partners instead of utilizing the credit facility.
(6)The net IRR is an annualized since inception net internal rate of return of cash flows to and from the fund and the fund’s residual value at the end of the measurement period. Net IRRs reflect returns to the fee-paying limited partners and, if applicable, exclude interests attributable to the non-fee paying limited partners and/or the general partner which does not pay management fees or carried interest. The cash flow dates used in the net IRR calculations are based on the actual dates of the cash flows. The net IRRs are calculated after giving effect to management fees and carried interest, other expenses and credit facility interest expenses, as applicable. The funds may utilize a credit facility during the investment period and for general cash management purposes. Net fund-level IRRs would generally have been lower had such fund called capital from its limited partners instead of utilizing the credit facility.
(7)IDF IV is made up of U.S. Dollar hedged, U.S. Dollar unhedged, Euro unhedged, Yen hedged parallel funds and a single investor U.S. Dollar parallel fund. The gross and net IRR and MoIC presented in the table are for the periods presented.
 For the Years Ended December 31, 2017 vs. 2016 2016 vs. 2015
 2017 2016 2015 Favorable (Unfavorable) Favorable (Unfavorable)
       $ Change % Change $ Change % Change
 (Dollars in thousands)
Management fees$64,861
 $66,997
 $66,045
 $(2,136) (3)% $952
 1 %
Other fees106
 854
 2,779
 (748) (88)% (1,925) (69)%
Compensation and benefits(39,586) (41,091) (42,632) 1,505
 4 % 1,541
 4 %
General, administrative and other expenses(10,519) (10,603) (15,766) 84
 1 % 5,163
 33 %
Fee Related Earnings14,862
 16,157
 10,426
 (1,295) (8)% 5,731
 55 %
Performance fees-realized9,608
 11,401
 9,516
 (1,793) (16)% 1,885
 20 %
Performance fees-unrealized80,160
 17,334
 15,179
 62,826
 NM
 2,155
 14 %
Performance fee compensation-realized(4,338) (2,420) (1,826) (1,918) (79)% (594) (33)%
Performance fee compensation-unrealized(48,960) (13,517) (8,553) (35,443) (262)% (4,964) (58)%
Net performance fees36,470
 12,798
 14,316
 23,672
 185 % (1,518) (11)%
Investment income-realized5,534
 931
 2,658
 4,603
 NM
 (1,727) (65)%
Investment income-unrealized2,626
 5,418
 1,522
 (2,792) (52)% 3,896
 256 %
Interest and other investment income2,495
 1,661
 259
 834
 50 % 1,402
 NM
Interest expense(1,650) (1,056) (977) (594) (56)% (79) (8)%
Net investment income9,005
 6,954
 3,462
 2,051
 29 % 3,492
 101 %
Performance related earnings45,475
 19,752
 17,778
 25,723
 130 % 1,974
 11 %
Economic net income$60,337
 $35,909
 $28,204
 24,428
 68 % 7,705
 27 %
Realized income$24,527
 $26,611
 $20,056
 (2,084,000) (8)% 6,555,000
 33 %
Distributable earnings$19,189
 $21,594
 $14,831
 (2,405) (11)% 6,763
 46 %
NM - Not Meaningful


Accrued performance feesU.S. Dollar hedged parallel fund. The gross and net IRR for the Real Estate GroupU.S. Dollar unhedged parallel fund are comprised of the following:
 As of December 31,
 2017 2016
 (Dollars in thousands)
US VIII32,940
 12,575
EF IV50,801
 4,052
Other real estate funds37,528
 22,001
Subtotal121,269
 38,628
Other fee generating funds(1)15,362
 16,675
Total Real Estate Group$136,631
 $55,303
(1)Relates to investment income from AREA Sponsor Holdings LLC that is reclassified for segment reporting to align with the character of the underlying income generated.
Net performance fee revenues6.6% and 4.5%, respectively. The gross and net MoIC for the Real Estate GroupU.S. Dollar unhedged parallel fund are comprised of the following:
 Year Ended December 31, 2017 Year Ended December 31, 2016 Year Ended December 31, 2015
 Realized Unrealized Net Realized Unrealized Net Realized Unrealized Net
 (Dollars in thousands)
US VIII
 20,366
 20,366
 
 9,482
 9,482
 
 2,393
 2,393
EF IV
 46,750
 46,750
 
 4,052
 4,052


Other real estate funds6,887
 13,830
 20,717
 4,034
 8,688
 12,722
 3,044
 11,862
 14,906
Subtotal6,887

80,946

87,833
 4,034
 22,222
 26,256
 3,044
 14,255
 17,299
Other fee generating funds(1)2,721
 (786) 1,935
 7,367
 (4,888) 2,479
 6,472
 924
 7,396
Total Real Estate Group$9,608

$80,160

$89,768
 $11,401

$17,334

$28,735

$9,516

$15,179

$24,695

(1)Relates to investment income from AREA Sponsor Holdings LLC that is reclassified for segment reporting to align with the character of the underlying income generated.
1.2x and 1.1x, respectively. The following tables present the components of the change in performance fees - unrealizedgross and net IRR for the Real Estate Group:Euro unhedged parallel fund are 6.4% and 5.1%, respectively. The gross and net MoIC for the Euro unhedged parallel fund are 1.2x and 1.1x, respectively. The gross and net IRR for the Yen hedged parallel fund are 4.6% and 2.8%, respectively. The gross and net MoIC for the Yen hedged parallel fund are 1.1x and 1.1x, respectively. The gross and net IRR for the single investor U.S. Dollar parallel fund are 5.1% and 4.0%, respectively. The gross and net MoIC for the single investor U.S. Dollar parallel fund are 1.1x and 1.1x, respectively. Original capital commitments are converted to U.S. Dollars at the prevailing exchange rate at the time of fund's closing. All other values for IDF IV are for the combined fund and are converted to U.S. Dollars at the prevailing quarter-end exchange rate.
(8)IDF V is made up of U.S. Dollar hedged, Euro unhedged, GBP hedged, Yen hedged and a single investor parallel fund. The gross and net IRR and MoIC presented in the table are for the U.S. Dollar hedged parallel fund. The gross and net IRR for the Euro unhedged parallel fund are 11.5% and 8.6%, respectively. The gross and net MoIC for the Euro unhedged parallel fund are 1.1x and 1.1x, respectively. The gross and net IRR for the GBP hedged parallel fund are 11.9% and 8.8%, respectively. The gross and net MoIC for the GBP hedged parallel fund are 1.1x and 1.1x, respectively. The gross and net IRR for the Yen hedged parallel fund are 9.5% and 6.7%, respectively. The gross and net MoIC for the Yen hedged parallel fund are 1.1x and 1.0x, respectively. The gross and net IRR for the single investor U.S. Dollar parallel fund are 10.0% and 7.7%, respectively. The gross and net MoIC for the single investor U.S. Dollar parallel fund are 1.1x and 1.1x, respectively. Original capital commitments are converted to U.S. Dollars at the prevailing exchange rate at the time of fund's closing. All other values for IDF V are for the combined fund and are converted to U.S. Dollars at the prevailing quarter-end exchange rate.


147
 Year Ended December 31, 2017 Year Ended December 31, 2016
 Performance Fees - Realized Increases Decreases Performance Fees - Unrealized Performance Fees - Realized Increases Decreases Performance Fees - Unrealized
 (Dollars in thousands)
US VIII
 20,366
 
 20,366
 
 9,482
 
 9,482
EF IV
 46,750
 
 46,750
 
 4,052
 
 4,052
Other real estate funds(6,887) 21,441
 (724) 13,830
 (4,034) 13,456
 (734) 8,688
Subtotal(6,887)
88,557

(724)
80,946

(4,034)
26,990

(734)
22,222
Other fee generating funds(1)(2,721) 2,769
 (834) (786) (7,367) 4,093
 (1,614) (4,888)
Total Real Estate Group$(9,608)
$91,326

$(1,558)
$80,160

$(11,401)
$31,083

$(2,348)
$17,334

 Year Ended December 31, 2015
 Performance Fees - Realized Increases Decreases Performance Fees - Unrealized
 (Dollars in thousands)
US VIII
 2,393
 
 2,393
EF IV


Other real estate funds(3,044) 14,906
 
 11,862
Subtotal(3,044) 17,299
 
 14,255
Other fee generating funds(1)(6,472) 7,527
 (131) 924
Total Real Estate Group$(9,516) $24,826
 $(131) $15,179
(1)Relates to investment income from AREA Sponsor Holdings LLC that is reclassified for segment reporting to align with the character of the underlying income generated.

Real EstateSecondaries Group—Year Ended December 31, 20172023 Compared to Year Ended December 31, 20162022

Fee Related Earnings:Earnings
Fee related earnings
The following table presents the components of the Secondaries Group’s FRE ($ in thousands):
Year ended December 31,Favorable (Unfavorable)
20232022$ Change% Change
Management fees$174,942 $176,694 $(1,752)(1)%
Fee related performance revenues12,782 235 12,547 NM
Other fees22 — 22 NM
Compensation and benefits(62,160)(53,743)(8,417)(16)
General, administrative and other expenses(21,199)(12,685)(8,514)(67)
Fee Related Earnings$104,387 $110,501 (6,114)(6)

Management Fees. The chart below presents Secondaries Group management fees and effective management fee rates ($ in millions):
Management fees_Secondaries.jpg

Management fees from Landmark Equity Partners XV, L.P. (“LEP XV”) decreased $1.3 million, or 8%, to $14.9by $8.0 million for the year ended December 31, 20172023 compared to the year ended December 31, 2016. Fee related earnings were impacted by fluctuations2022 primarily due to the change in fee base to reported value, which largely reflects the NAV of the following components:
each fund’s limited partnership interests, from called capital plus unfunded commitments. Management Fees.  Total management fees also decreased by $2.1$3.3 million or 3%,from a real estate secondaries fund and three private equity secondaries funds due to $64.9 milliondistributions that reduced their fee bases.
Management fees for the year ended December 31, 20172023 included: (i) $7.9 million of catch-up fees from Landmark Real Estate Fund IX, L.P. (“LREF IX”). Management fees for the year ended December 31, 2022 included: (i) $9.2 million of catch-up fees from Landmark Equity Partners XVII, L.P. (“LEP XVII”); and (ii) $0.2 million from LREF IX.

148

The decrease in management fees was partially offset by: (i) additional management fees from LREF IX of $7.7 million, generated from new commitments, excluding catch-up fees previously discussed; and (ii) higher management fees from APMF of $4.0 million, as we contractually agreed to a reduced fee rate of 0.25% from inception through March 31, 2023 that subsequently increased to 1.40%.

The increase in effective management fee rate for the year ended December 31, 2023 compared to the year ended December 31, 2016. The decrease2022 was primarily attributabledue to a 2% declinethe higher fee rate for APMF following the expiration of the contractually reduced rate.

Fee Related Performance Revenues. Fee related performance revenues reflects incentive fees recognized from APMF for the years ended December 31, 2023 and 2022.

Compensation and Benefits. The increase in average fee paying AUMcompensation and benefits for the year ended December 31, 20172023 compared to the year ended December 31, 2016. Ares Real Estate Fund VIII ("US VIII") and Ares European Real Estate Fund IV ("EF IV") had decreases in management fees of $1.1 million and $1.3 million, respectively, for the year ended December 31, 2017 compared to the year ended December 31, 2016 due to a change in the fee basis in connection with the launch of a successor fund and the end of the investment period, respectively. The winding down of one of our U.S. Real Estate Equity funds resulted in a reduction in management fees of $2.1 million for the year ended December 31, 2017 compared to the year ended December 31, 2016. Partially offsetting these decreases were $2.4 million of management fees contributed by one of our U.S. Real Estate Equity funds that began generating fees in the year ended December 31, 2017.
The effective management fee rate, excluding the effect of one-time catch-up fees, remained consistent at 0.98% for the years ended December 31, 2017 and 2016.
Compensation and Benefits. Compensation and benefits expenses decreased by $1.5 million, or 4%, to $39.6 million for the year ended December 31, 2017 compared to the year ended December 31, 2016. The decrease was due to a reorganization of the group's management team that occurred in the latter half of 2016. Compensation and benefits expenses represented 61.0% of management fees for the year ended December 31, 2017 compared to 61.3% for the year ended December 31, 2016.
Performance Related Earnings:
Performance related earnings increased by $25.7 million to $45.5 million for the year ended December 31, 2017 compared to the year ended December 31, 2016. Performance related earnings were impacted by fluctuations of the following components:
Net Performance Fees.  Net performance fees include realized and unrealized performance fees, net of realized and unrealized performance fee compensation. The impact of reversals of previously recognized performance fee revenue and the corresponding performance fee compensation expense is reflected as a reduction in unrealized performance fees and performance fee compensation.
Net performance fees increased by $23.7 million to $36.5 million for the year ended December 31, 2017 compared to the year ended December 31, 2016. The increase in net performance fees for the current year periods2022 was primarily driven by favorable real estate market fundamentals in both the U.S. and Europe that have resulted in appreciation across the portfolioby: (i) higher fee related performance compensation of properties in our funds, primarily driven by net performance fees attributable to EF IV and US VIII, which collectively increased $21.4$5.5 million for the year ended December 31, 2017 comparedcorresponding to the year ended December 31, 2016.
Net Investment Income.  Net investment income increased by $2.1 million to $9.0 million for the year ended December 31, 2017 compared to $7.0 million for the year ended December 31, 2016. The increase was driven by our investments in both U.S.fee related performance revenue; and E.U. equity funds, which collectively experienced(ii) an increase in net gainssalary expense of $3.8 million which primarily attributable to headcount growth.

Average headcount increased by 12% to 105 investment and investment support professionals for the year ended December 31, 2017 comparedyear-to-date period in 2023 from 94 professionals in 2022.
General, Administrative and Other Expenses. In an effort to accelerate the year ended December 31, 2016.
Realized Income:
Realized income decreased $2.1 million, growth of APMF’s assets, we have entered into agreements that pay distribution partners a fee based on assets and/or 8%, to $24.5 million for the year ended December 31, 2017 compared to the year ended December 31, 2016. The decrease was due to decreases in FRE of $1.3 million and net realized performance fees ofsales. These agreements increased our expenses by $3.7 million for the year ended December 31, 20172023 when compared to prior year and are expected to fluctuate with sales and the year ended December 31, 2016. These decreases were partially offsetgrowth in assets. Additionally, travel and marketing collectively increased by an increase in net realized investment and other income of $2.9 million for the year ended December 31, 20172023 compared to the prior year ended December 31, 2016.

Economic Net Income:
Economic net income is comprised of fee related earningsdriven by more in-person company meetings and performance related earnings. Economic net incomeevents. Certain other expenses have also increased $24.4 million, or 68%, to $60.3during the current period, primarily from occupancy costs which support our growing headcount that are based in higher cost locations and information technology costs. Collectively, these expenses increased by $1.3 million for the year ended December 31, 20172023 compared to the yearprior year.

Realized Income

The following table presents the components of the Secondaries Group’s RI ($ in thousands):
Year ended December 31,Favorable (Unfavorable)
20232022$ Change% Change
Fee Related Earnings$104,387 $110,501 $(6,114)(6)%
Performance income—realized5,460 4,156 1,304 31
Performance related compensation—realized(4,678)(3,515)(1,163)(33)
Realized net performance income782 641 141 22
Interest and other investment income—realized4,867 3,683 1,184 32
Interest expense(8,980)(5,660)(3,320)(59)
Realized net investment loss(4,113)(1,977)(2,136)(108)
Realized Income$101,056 $109,165 (8,109)(7)

Realized net performance income for the years ended December 31, 2016 as a result of the fluctuations described above.2023 and 2022 was primarily attributable to tax distributions from LREF VIII.
Distributable Earnings:
DE decreased $2.4 million, or 11%, to $19.2 millionRealized investment income for the year ended December 31, 2017 compared to the year ended December 31, 2016. The decrease in DE was due to decreases in FRE of $1.3 million and net realized performance fees of $3.7 million2023 reflects dividend income received from APMF.

Realized investment income for the year ended December 31, 2017 compared to the year ended December 31, 2016. The decrease in DE was partially offset by2022 included dividend income received from LREF VIII and an increase in net realized investment and other income of $2.9 million for the year ended December 31, 2017 compared to the year ended December 31, 2016.infrastructure secondaries fund.
Real Estate Group—Year Ended December 31, 2016Compared to Year Ended December 31, 2015
Fee Related Earnings:
Fee related earnings increased $5.7 million, or 55%, to $16.2 million for the year ended December 31, 2016 compared to the year ended December 31, 2015. Fee related earnings were impacted by fluctuations of the following components:
Management Fees.  Total management fees increased by $1.0 million, or 1%, to $67.0 million for the year ended December 31, 2016 compared to the year ended December 31, 2015. The increaseInterest expense, which is primarily attributable to the launch of Ares European Property Enhancement Program II, L.P. ("EPEP II"), which began generating fees in 2016. The effective management fee rate decreased from 1.02% for the year ended December 31, 2015, to 0.98% for the year ended December 31, 2016. For certain U.S. equity funds, we earn a portion ofallocated among our management feessegments based on the cost basis of balance sheet investments, increased over the unrealized investments and a portion on the unfunded commitments to the funds. The decrease in the management fee rates is a result of additional capital raised for those funds that earn a portion of their fees on unfunded commitments, increasing our fee-earning base, however at a lower rate. We expect management fees and the effective rate to increase as capital is deployed.
Compensation and Benefits.  Compensation and benefits expenses decreased by $1.5 million, or 4%, to $41.1 million for the year ended December 31, 2016 compared to the year ended December 31, 2015. The decrease was primarily a result of a reduction in headcount, including a reorganization of the group's management team. Compensation and benefits expenses represented 61.3% of management fees for the year ended December 31, 2016 compared to 64.5% for the year ended December 31, 2015.
General, Administrative and Other Expenses. General, administrative and other expenses decreased by $5.2 million, or 33%, to $10.6 million for the year ended December 31, 2016 compared to the year ended December 31, 2015. Cost reduction measures resulted in lower travel related expenses, professional services expenses and occupancy expenses compared to the prior year.
Performance Related Earnings:
Performance related earnings increased by $2.0 million to $19.8 million for the year ended December 31, 2016 compared to the year ended December 31, 2015. Performance related earnings were impacted by fluctuations of the following components:
Net Performance Fees. Net performance fees include realized and unrealized performance fees, net of realized and unrealized performance fee compensation. The impact of reversals of previously recognized performance fee revenue and the corresponding performance fee compensation expense is reflected as a reduction in unrealized performance fees and performance fee compensation.
Net performance fees decreased by $1.5 million, or 11%, to $12.8 million for the year ended December 31, 2016 compared to the year ended December 31, 2015. The decrease in net performance fees for the year ended December 31, 2016 was primarily driven by an increase in performance fee compensation expense as a percentage of performance fees. Other incentive fee generating funds, while generating positive returns, experienced diminishing returns in comparison to the prior year. The decrease was offset by funds generating performance fees for the first time, including Ares European Real Estate Fund IV (“EU IV”), which generated $1.6 million net performance fees in 2016.

Net Investment Income (Loss). Net investment income increased by $3.5 million to $7.0 million for the year ended December 31, 2016 compared to $3.5 million for the year ended December 31, 2015. The increase in net investment income wascomparative periods primarily due to increases in valuationsrising SOFR rates and a higher average outstanding balance of the underlying assets. Our investmentsCredit Facility and to the issuance of the 2028 Senior Notes in U.S.November 2023.


149

Secondaries Group—Performance Income

The following table presents the accrued carried interest, also referred to as accrued performance income, and E.U. equity funds experienced unrealized market appreciation of $4.6 million and $1.4 million, respectively,related performance compensation for the year ended December 31, 2016 compared to $1.4 million and $0.1 million, respectively,Secondaries Group. Accrued net performance income excludes net performance income that has been realized but not yet received as of the reporting date ($ in thousands):
As of December 31,
20232022
Accrued Performance IncomeAccrued Performance CompensationAccrued Net Performance IncomeAccrued Performance IncomeAccrued Performance CompensationAccrued Net Performance Income
LEP XVI$128,650 $110,053 $18,597 $141,122 $120,659 $20,463 
LREF VIII97,366 84,256 13,110 109,928 94,538 15,390 
Other secondaries funds57,339 48,897 8,442 58,135 49,726 8,409 
Total Secondaries Group$283,355 $243,206 $40,149 $309,185 $264,923 $44,262 

The following table presents the change in accrued performance income for the year ended December 31, 2015. Of the $4.6 million of unrealized gainsSecondaries Group ($ in our investments in U.S. equity funds for the year ended December 31, 2016, $2.4 million is attributable to our investment in a U.S. real estate fund.thousands):
Realized Income:
 As of December 31, 2022Activity during the periodAs of December 31, 2023
Waterfall TypeAccrued Carried InterestChange in UnrealizedRealizedAccrued Carried Interest
Accrued Carried Interest
LEP XVIEuropean$141,122 $(12,472)$— $128,650 
LREF VIIIEuropean109,928 (8,002)(4,560)97,366 
Other secondaries fundsEuropean58,135 104 (900)57,339 
Total Secondaries Group$309,185 $(20,370)$(5,460)$283,355 
Realized income increased $6.6 million, or 33%, to $26.6 million for the year ended December 31, 2016 compared to the year ended December 31, 2015, primarily due to an increase in FRE of $5.7 million and an increase of $1.3 million in net realized performance fees.
Economic Net Income:
Economic net income is comprised of fee related earnings and performance related earnings. Economic net income increased $7.7 million, or 27%, to $35.9 million for the year ended December 31, 2016 compared to the year ended December 31, 2015 as a result of the fluctuations described above.
Distributable Earnings:
DE increased $6.8 million, or 46%, to $21.6 million for the year ended December 31, 2016 compared to the year ended December 31, 2015. DE was positively impacted by an increase in FRE of $5.7 million and an increase of $1.3 million in net realized performance fees.
Real EstateSecondaries Group—Assets Under Management

The tablestable below providepresents the period‑to‑period rollforwards of AUM for the Real EstateSecondaries Group ($ in millions):
Private Equity
Secondaries
Real Estate
Secondaries
Infrastructure
Secondaries
Credit
Secondaries
Other(1)
Total Secondaries
Group
Balance at 12/31/2022$12,769 $7,552 $1,640 $ $ $21,961 
Net new par/equity commitments567 952 721 1,358 50 3,648 
Distributions(477)(537)(102)— — (1,116)
Redemptions(1)— — — — (1)
Net allocations among investment strategies30 — — 25 (50)
Change in fund value286 (141)121 (3)— 263 
Balance at 12/31/2023$13,174 $7,826 $2,380 $1,380 $ $24,760 
Private Equity
Secondaries
Real Estate
Secondaries
Infrastructure
Secondaries
Credit
Secondaries
OtherTotal Secondaries
Group
Balance at 12/31/2021$13,833 $6,662 $1,624 $ $ $22,119 
Acquisitions199 — — — — 199 
Net new par/equity commitments1,011 1,425 74 — — 2,510 
Distributions(1,632)(932)(223)— — (2,787)
Change in fund value(642)397 165 — — (80)
Balance at 12/31/2022$12,769 $7,552 $1,640 $ $ $21,961 
(1) Activity within Other represents equity commitments to the platform that have not yet been allocated to an investment strategy.

150

The components of our AUM for the years ended December 31, 2017, 2016 and 2015 (in millions)Secondaries Group are presented below ($ in billions):
 Real Estate Equity - U.S. Real Estate Equity - E.U. Real Estate Debt Total Real Estate Group
Balance at 12/31/2016$4,106
 $3,100
 $2,546
 $9,752
Net new equity commitments800
 
 
 800
Net new debt commitments
 
 509
 509
Distributions(659) (801) (139) (1,599)
Change in fund value331
 405
 31
 767
Balance at 12/31/2017$4,578
 $2,704
 $2,947
 $10,229
Average AUM$4,459
 $2,956
 $2,846
 $10,261
 Real Estate Equity - U.S. Real Estate Equity - E.U. Real Estate Debt Total Real Estate Group
Balance at 12/31/2015$4,617
 $3,059
 $2,592
 $10,268
Net new equity commitments355
 470
 15
 840
Net new debt commitments
 
 225
 225
Distributions(1,125) (357) (331) (1,813)
Change in fund value259
 (72) 45
 232
Balance at 12/31/2016$4,106
 $3,100
 $2,546
 $9,752
Average AUM$4,444
 $3,143
 $2,557
 $10,144

 Real Estate Equity - U.S. Real Estate Equity - E.U. Real Estate Debt Total Real Estate Group
Balance at 12/31/2014$4,595
 $2,961
 $3,019
 $10,575
Net new equity commitments732
 755
 (159) 1,328
Net new debt commitments
 
 105
 105
Distributions(1,037) (619) (416) (2,072)
Change in fund value327
 (38) 43
 332
Balance at 12/31/2015$4,617
 $3,059
 $2,592
 $10,268
Average AUM$4,505
 $2,983
 $2,694
 $10,182
4472549755822952
AUM: $24.7AUM: $22.0
FPAUMAUM not yet paying fees
Non-fee paying(1)
(1) Represents a five-point averageIncludes $0.5 billion and $0.3 billion of quarter-end balances for each period.non-fee paying AUM based on our general partner commitment as of December 31, 2023 and 2022, respectively.
Real Estate
SecondariesGroup—Fee Paying AUM

The tablestable below providepresents the period‑to‑period rollforwards of fee paying AUM for the Real EstateSecondaries Group for the years ended December 31, 2017, 2016 and 2015 (in($ in millions):
Private Equity
Secondaries
Real Estate
Secondaries
Infrastructure
Secondaries
Credit SecondariesTotal Secondaries
Group
Balance at 12/31/2022$11,062 $5,313 $1,293 $ $17,668 
Commitments367 772 506 — 1,645 
Deployment/subscriptions/increase in leverage51 317 20 85 473 
Distributions(95)(421)(88)(9)(613)
Redemptions(1)— — — (1)
Net allocations among investment strategies30 — — — 30 
Change in fund value(162)(53)32 19 (164)
Change in fee basis(48)50 — — 
Balance at 12/31/2023$11,204 $5,978 $1,763 $95 $19,040 
Private Equity
Secondaries
Real Estate
Secondaries
Infrastructure
Secondaries
Credit SecondariesTotal Secondaries
Group
Balance at 12/31/2021$11,787 $5,389 $1,188 $ $18,364 
Acquisitions131 — — — 131 
Commitments929 1,039 74 — 2,042 
Deployment/subscriptions/increase in leverage58 473 29 — 560 
Distributions(229)(906)(184)— (1,319)
Change in fund value(130)716 186 — 772 
Change in fee basis(1,484)(1,398)— — (2,882)
Balance at 12/31/2022$11,062 $5,313 $1,293 $ $17,668 
 Real Estate Equity - U.S. Real Estate Equity - E.U. Real Estate Debt Total Real Estate Group
FPAUM Balance at 12/31/2016$2,891
 $2,531
 $1,118
 $6,540
Commitments665
 
 
 665
Subscriptions/deployment/increase in leverage441
 138
 3
 582
Redemptions/distributions/decrease in leverage(510) (236) (95) (841)
Change in fund value
 146
 37
 183
Change in fee basis(425) (515) 
 (940)
FPAUM Balance at 12/31/2017$3,062
 $2,064
 $1,063
 $6,189
Average FPAUM(1)$3,017
 $2,429
 $1,101
 $6,547

151
 Real Estate Equity - U.S. Real Estate Equity - E.U. Real Estate Debt Total Real Estate Group
FPAUM Balance at 12/31/2015$3,205
 $2,554
 $998
 $6,757
Commitments97
 365
 
 462
Subscriptions/deployment/increase in leverage397
 63
 170
 630
Redemptions/distributions/decrease in leverage(842) (87) (90) (1,019)
Change in fund value34
 (132) 40
 (58)
Change in fee basis
 (232) 
 (232)
FPAUM Balance at 12/31/2016$2,891
 $2,531
 $1,118
 $6,540
Average FPAUM(1)$3,011
 $2,581
 $1,077
 $6,669

 Real Estate Equity - U.S. Real Estate Equity - E.U. Real Estate Debt Total Real Estate Group
FPAUM Balance at 12/31/2014$3,028
 $2,697
 $393
 $6,118
Commitments357
 548
 83
 988
Subscriptions/deployment/increase in leverage260
 8
 535
 803
Redemptions/distributions/decrease in leverage(347) (385) (65) (797)
Change in fund value
 (99) 31
 (68)
Change in fee basis(93) (215) 21
 (287)
FPAUM Balance at 12/31/2015$3,205
 $2,554
 $998
 $6,757
Average FPAUM(1)$2,998
 $2,517
 $693
 $6,208

The chartschart below presentpresents FPAUM for the Real EstateSecondaries Group by its fee basis as of December 31, 2017, 2016 and 2015 (in millions)bases ($ in billions):

47484751
FPAUM: $19.1
FPAUM: $6,189FPAUM: $6,540$17.7


Market value(1)
Capital commitmentsInvested capital/other
FPAUM: $6,757

(1)Amounts represent FPAUM from funds that primarily invest in illiquid strategies. The underlying investments held in these funds are generally subject to less market volatility than investments held in liquid strategies.

(1)Market value/other includes ACRE fee paying AUM, which is based on ACRE’s stockholders’ equity.

The components of our AUM, including the portion that is FPAUM, for the Real Estate Group are presented below as of December 31, 2017, 2016 and 2015 (in millions):

AUM: $10,229AUM: $9,752


AUM: $10,268


Real EstateSecondaries Group—Fund Performance Metrics as of December 31, 20172023
The Real Estate Group managed 42 funds as of December 31, 2017. Our two
One significant funds in the Real Estate Group combined forfund LEP XVI contributed approximately 31%26% of the Real EstateSecondaries Group’s management fees for the year ended December 31, 2017: EF IV, a commingled fund focused on real estate assets located in Europe, primarily in the United Kingdom, France and Germany; and EPEP II, a commingled fund focused on Europe. We do not present fund performance metrics for significant funds with less than two years of historical information, except for those significant funds which pay management fees on invested capital, in which case performance is shown at the earlier of (i) the one year anniversary of the fund's first investment and (ii) such time the fund is 50% or more invested.2023.
The following table presents the performance data for ourof the Secondaries Group’s significant drawdown fund as of December 31, 2023 ($ in millions):
Year of InceptionAUMOriginal Capital CommitmentsCapital Invested to Date
Realized Value(1)
Unrealized Value(2)
Total ValueMoICIRR(%)Primary Investment Strategy
Fund
Gross(3)
Net(4)
Gross(5)
Net(6)
Fund Harvesting Investments
LEP XVI(7)
2016$4,769 $4,896 $3,571 $1,990 $2,952 $4,942 1.5x1.4x26.918.1Private Equity Secondaries
For all funds in the Real EstateSecondaries Group, both of whichreturns are drawdown funds:
     As of December 31, 2017 (Dollars in millions)      
 Year of Inception AUM Original Capital Commitments Cumulative Invested Capital Realized Proceeds(1) Unrealized Value(2) Total Value MoIC IRR(%)  
Fund       Gross(3) Net(4) Gross(5) Net(6) Investment Strategy
EF IV (7)2014 $1,022
 $1,302
 $1,057
 $434
 $1,008
 $1,442
 1.4x 1.2x 20.6 12.9 E.U. Real Estate Equity
EPEP II (8)2015 $698
 $747
 $298
 $143
 $226
 $369
 1.2x 1.1x NA NA E.U. Real Estate Equity
(1)
Realized proceeds include distributions of operating income, sales and financing proceeds received.
(2)
Unrealized value represents the fair market value of remaining investments. There can be no assurance that unrealized investments will be realized at the valuations indicated.
(3)
The gross MoIC is calculated at the investment level and is based on the interests of all partners. The gross MoIC for all funds is before giving effect to management fees, performance fees as applicable and other expenses.
(4)
The net MoIC is calculated at the fund-level and is based on the interests of the fee-paying partners and, if applicable, excludes interests attributable to the non fee-paying partners and/or the general partner who does not pay management fees or performance fees or has such fees rebated outside of the fund. The net MoIC is after giving effect to management fees, performance fees as applicable and other expenses.
(5)
The gross IRR is an annualized since inception gross internal rate of return of cash flows to and from investments and the residual value of the investments at the end of the measurement period. Gross IRRs reflect returns to all partners. Cash flows used in the gross IRR calculation are assumed to occur at quarter-end. The gross IRRs are calculated before giving effect to management fees, performance fees as applicable, and other expenses.
(6)
The net IRR is an annualized since inception net internal rate of return of cash flows to and from the fund and the fund’s residual value at the end of the measurement period. Net IRRs reflect returns to the fee-paying partners and, if applicable, excludes interests attributable to the non fee-paying partners and/or the general partner who does not pay management fees or performance fees or has such fees rebated outside of the fund. The cash flow dates used in the net IRR calculation are based on the actual dates of the cash flows. The net IRRs are calculated after giving effect to management fees, performance fees as applicable, and other expenses. The funds may utilize a credit facility during the investment period and for general cash management purposes. Net fund-level IRRs would have been lower had such fund called capital from its limited partners instead of utilizing the credit facility.
(7)
EF IV is made up of two parallel funds, one denominated in U.S. dollars and one denominated in Euros. The gross and net MoIC and gross and net IRRs presented in the chart are for the U.S. dollar denominated parallel fund as that is the larger of the two funds. The gross and net IRRs for the Euro denominated parallel fund are 20.8% and 14.2%, respectively. The gross and net MoIC for the Euro denominated parallel fund are 1.4x and 1.2x, respectively. Original capital commitments are converted to U.S. dollars at the prevailing exchange rate at the time of fund's closing.  All other values for EF IV are for the combined fund and are converted to U.S. dollars at the prevailing quarter-end exchange rate.
(8)
EPEP II is made up of dual currency investors and Euro currency investors. The gross and net MoIC presented in the chart are for dual currency investors as dual currency investors represent the largest group of investors in the fund. Multiples exclude foreign currency gains and losses since dual currency investors fund capital contributions and receive distributions in local deal currency (GBP or EUR) and therefore, do not realize foreign currency gains or losses. The gross and net MoIC for the Euro currency investors, which include foreign currency gains and losses, are 1.2x and 1.1x, respectively. Original capital commitments are converted to U.S. dollars at the prevailing exchange rate at the time of fund's closing. All other values for EPEP II are for the combined fund and are converted to U.S. dollars at the prevailing quarter-end exchange rate.


Operations Management Group
The following table sets forth certain statement of operations data and certain other datacalculated from results of the OMGunderlying portfolio that are generally reported on a segmentthree month lag and may not include the impact of economic and market activities occurring in the current reporting period.

(1)Realized value represents the sum of all cash distributions to all limited partners and if applicable, exclude tax and incentive distributions made to the general partner.
(2)Unrealized value represents the limited partners’ share of fund’s NAV reduced by the accrued incentive allocation, if applicable. There can be no assurance that unrealized values will be realized at the valuations indicated.
(3)The gross MoIC is calculated at the fund-level and is based on the interests of all partners. If applicable, limiting the gross MoIC to exclude interests attributable to the non-fee paying limited partners and/or the general partner who does not pay management fees or carried interest would have no material impact on the result. The gross MoIC is before giving effect to management fees, carried interest, as applicable, and other expenses, but after giving effect to credit facility interest expenses, as applicable. The funds may utilize a short-term credit facility for general cash management purposes, as well as a long-term credit facility as permitted by the respective fund’s governing documentation. The gross fund-level MoIC would have generally been lower had such fund called capital from its partners instead of utilizing the credit facility.
(4)The net MoIC is calculated at the fund-level and is based on the interests of the fee-paying limited partners and if applicable, excludes those interests attributable to the non-fee paying limited partners and/or the general partner which does not pay management fees or carried interest. The net MoIC is after giving effect to management fees and other expenses, carried interest and credit facility interest expense, as applicable. The funds may utilize a short-term credit facility for general cash management purposes, as well as a long-term credit facility as permitted by the respective fund’s governing documentation. The net fund-level MoICs would generally have been lower had such fund called capital from its limited partners instead of utilizing the credit facility.
(5)The gross IRR is an annualized since inception gross internal rate of return of cash flows to and from the fund and the fund’s residual value at the end of the measurement period. Gross IRR reflects returns to all partners. If applicable, limiting the gross IRR to exclude interests attributable to the non-fee paying limited partners and/or the general partner who does not pay management fees or carried interest would have no material impact on the result. The cash flow dates used in the gross IRR calculation are based on the actual dates of the cash flows. The gross IRRs are calculated before giving effect to management fees, carried interest, as applicable, and other expenses, but after giving effect to credit facility interest expenses, as applicable. The funds may utilize a short-term credit facility for general cash management purposes, as well as a long-term credit facility as permitted by the respective fund’s governing documents. The gross fund-level IRR would generally have been lower had such fund called capital from its partners instead of utilizing the credit facility.
(6)The net IRR is an annualized since inception net internal rate of return of cash flows to and from the fund and the fund’s residual value at the end of the measurement period. Net IRRs reflect returns to the fee-paying limited partners and, if applicable, exclude interests attributable to the non-fee paying limited partners and/or the general partner who does not pay management fees or carried interest. The cash flow dates used in the net IRR calculations are based on the actual dates of the cash flows. The net IRRs are calculated after giving effect to management fees and other expenses, carried interest and credit facility interest expenses, as applicable. The funds may utilize a short-term credit facility for general cash management purposes, as well as a long-term credit facility as permitted by the respective fund’s governing documents. Net fund-level IRRs would generally have been lower had such fund called capital from its limited partners instead of utilizing the credit facility.
(7)The results of each fund is presented on a combined basis forwith the periods presented.affiliated parallel funds or accounts, given that the investments are substantially the same.


152
 For the Years Ended December 31, 2017 vs. 2016 2016 vs. 2015
 2017 2016 2015 Favorable (Unfavorable) Favorable (Unfavorable)
       $ Change % Change $ Change % Change
 (Dollars in thousands)
Compensation and benefits$(113,558) $(99,447) $(86,869) $(14,111) (14)% $(12,578) (14)%
General, administrative and other expenses(75,143) (60,916) (56,168) (14,227) (23)% (4,748) (8)%
Fee Related Earnings(188,701) (160,363) (143,037) (28,338) (18)% (17,326) (12)%
Investment income (loss)-realized3,880
 (14,606) (23) 18,486
 NM
 (14,583) NM
Investment income (loss)-unrealized8,627
 (2,197) 52
 10,824
 NM
 (2,249) NM
Interest and other investment income1,267
 149
 379
 1,118
 NM
 (230) (61)%
Interest expense(1,946) (2,727) (1,158) 781
 29 % (1,569) (135)%
Net investment income (loss)11,828
 (19,381) (750) 31,209
 NM
 (18,631) NM
Performance related earnings11,828
 (19,381) (750) 31,209
 NM
 (18,631) NM
Economic net income$(176,873) $(179,744) $(143,787) 2,871
 2 % (35,957) (25)%
Realized income$(185,625) $(177,533) $(143,839) (8,092) (5)% (33,694) (23)%
Distributable earnings$(204,024) $(196,242) $(152,639) (7,782) (4)% (43,603) (29)%

NM - Not Meaningful

Operations Management Group—Year Ended December 31, 20172023Compared to Year Ended December 31, 20162022

Fee Related Earnings:Earnings
Fee related earningsThe following table presents the components of the Operations Management Group’s FRE ($ in thousands):
Year ended December 31,Favorable (Unfavorable)
20232022$ Change% Change
Other fees$23,685 $24,529 $(844)(3)%
Compensation and benefits(361,124)(317,396)(43,728)(14)
General, administrative and other expenses(200,613)(155,017)(45,596)(29)
Fee Related Earnings$(538,052)$(447,884)(90,168)(20)

Other Fees. The decrease in other fees for the year ended December 31, 2023 compared to the year ended December 31, 2022 was primarily driven by lower: (i) facilitation fees from the 1031 exchange programs associated with our non-traded REITs of $7.9 million; and (ii) sales-based, net distribution fees associated with our non-traded REITs of $2.4 million. Conversely, asset-based, net distribution fees associated with our non-traded REITs increased by $5.3 million. The year ended December 31, 2023 also included broker-dealer advisory fees of $2.2 million, which were earned in connection with advisory services provided by AMCM for capital markets transactions executed during the period.
Compensation and Benefits. The increase in compensation and benefits for the year ended December 31, 2023, compared to the year ended December 31, 2022 was primarily driven by: (i) the expansion of our strategy and relationship management teams to support global fundraising; and (ii) the expansion of our business operations teams to support the growth of our business and other strategic initiatives. Average headcount increased by 19% to 1,492 operations management professionals for the year-to-date period in 2023 from 1,252 professionals in 2022.
Separately, compensation and benefits increased by $3.4 million for the nine months ended December 31, 2023 following the SSG Buyout on March 31, 2023, reflecting the costs associated with the 20% change in ownership that were previously not part of our cost structure.
Our engagement of a third party subject matter expert to support the reorganization of our income tax compliance function during the third quarter of 2022 reduced salary expense by $5.9 million for the first two quarters of 2023 with a corresponding increase in general, administrative and other expenses. As this reorganization occurred at the end of the second quarter of 2022, we did not have comparable results for the year ended December 31, 2023.
Employee commissions are earned in connection with the sale and distribution of fund shares in our non-traded, retail channel products and private placements of our exchange programs. Employee commissions have decreased $28.3over the comparative period primarily due to the lower sales volumes from our non-traded REITs and have begun to trend upward with increased sales volumes from ASIF and APMF.
General, Administrative and Other Expenses. Travel and marketing collectively increased by $10.5 million for the year ended December 31, 20172023 compared to the prior year ended December 31, 2016. Fee related earnings were impacted as we continued to increase our marketing efforts driven by fluctuations ofmore investor meetings and events. AWMS has contributed $3.7 million to the following components:increase in travel and marketing over the comparative period. As we build out our retail distribution infrastructure and capabilities through AWMS to support our prospective sales and AUM growth, we expect marketing and distribution expenses, including travel, to increase in future periods.
Compensation and Benefits. Compensation and benefits expensesAdditionally, professional service fees increased by $14.1 million, or 14%, to $113.6$15.9 million for the year ended December 31, 20172023 compared to the prior year ended December 31, 2016, primarily due to additional headcount(i) tax related service fees of $10.5 million from the reorganization of our income tax compliance function during the third quarter of 2022, with a corresponding decrease in compensation and merit based increases. Additional headcount was partially driven by employees hiredbenefits; and (ii) consulting fees to support several information technologyvarious ongoing initiatives andto enhance our operations.
Certain expenses have also increased during the current year to support our growing headcount, the expansion of our business development platform in order to more effectively raise additional investor commitments forand the build out of our plannednew corporate headquarters. Most notably, occupancy costs, information technology and newly launched funds. Employees hired in connection with ARCC's acquisition of ACAS also contributed to the growth in headcount, ACAS-related compensation expense, net of administrative fee reimbursements, for the year ended December 31, 2017 was $3.4 million.
General, Administrative and Other Expenses. General, administrative and other expensesinformation services have collectively increased by $14.2 million, or 23%, to $75.1$9.1 million for the year ended December 31, 2017 compared to the year ended December 31, 2016. The increase in the current year was due to several information technology initiatives to support system implementations, increased occupancy costs from growing headcount and business support costs associated with our expanding business platform during 2017. Also impacting the year ended December 31, 2017 was a $2.5 million one-time non-income tax paid during year ended December 31, 2017.
Performance Related Earnings:
Net Investment Income (Loss). Net investment income increased from a net investment loss of $19.4 million for the year ended December 31, 2016 to net investment income of $11.8 million for the year ended December 31, 2017. In 2016, we realized a $20.0 million loss on our minority interest equity method investment in Deimos Management Holdings LLC due to the winding down of its operations. In addition, our other fund investments in non-core investment strategies experienced an increase in net realized and unrealized gains of $9.8 million for the year ended December 31, 2017 compared to the year ended December 31, 2016.

Realized income:
Realized income decreased by $8.1 million, or 5%, to $185.6 million for the year ended December 31, 2017 compared to the year ended December 31, 2016. The decrease was primarily due to a decrease in FRE of $28.3 million, partially offset by an increase in net realized investment and other income of $20.2 million.
Economic Net Income:
Economic net income is comprised of fee related earnings and performance related earnings. Economic net income increased $2.9 million, or 2%, for the year ended December 31, 2017 compared to the year ended December 31, 2016 as a result of the fluctuations described above.
Distributable Earnings:
DE decreased $7.8 million, or 4%, for the year ended December 31, 2017 compared to the year ended December 31, 2016. DE decreased primarily due to a decrease in FRE of $28.3 million. The decrease was partially offset by an increase in net realized investment and other income of $20.2 million.

Operations Management Group—Year Ended December 31, 2016 Compared to Year Ended December 31, 2015
Fee Related Earnings:
Fee related earnings decreased $17.3 million for the year ended December 31, 2016 compared to the year ended December 31, 2015. Fee related earnings were impacted by fluctuations of the following components:
Compensation and Benefits.  Compensation and benefits expenses increased by $12.6 million, or 14%, to $99.4 million for the year ended December 31, 2016 compared to the year ended December 31, 2015, primarily due to increases in headcount as part of an effort to reduce our reliance on professional service providers by internalizing certain corporate support functions. In addition, incentive-based compensation increased for the year ended December 31, 2016 compared to the year ended December 31, 2015. Administrative fees, which are presented as a reduction to compensation and benefits expense, increased by $2.4 million for the year ended December 31, 2016, partially offsetting the increase in compensation and benefits expenses in the current year period.
General, Administrative and Other Expenses.  General, administrative and other expenses increased by $4.7 million, or 8%, to $60.9 million for  year ended December 31, 2016 compared to the year ended December 31, 2015. In 2016 we realigned certain general, administrative and other expenses with our operating activities, resulting in an increase in occupancy expenses recognized within OMG. Administrative fees, which are also presented as a reduction togeneral, administrative and other expenses, decreased by $1.9 million in for the year ended December 31, 2016, resulting in a net increase in general, administrative and other expenses2023 compared to the prior year. Conversely, professional services expenses decreased due to cost containment initiatives during the current year.year.
Performance Related Earnings:
Performance related earnings decreased $18.6 million for the year ended December 31, 2016 compared to the year ended December 31, 2015. Performance related earnings were impacted by the fluctuation in net investment loss:
153

Realized income:Income
Realized income decreased by $33.7 million, or 23%, to $177.5 million forThe following table presents the year ended December 31, 2016 compared to the year ended December 31, 2015. The decrease was due to a decrease of $17.3 million in FRE and an increase of net realized

investment and other losses of $16.4 million for the year ended December 31, 2016 compared to the year ended December 31, 2015.
Economic Net Income:
Economic net income is comprised of fee related earnings and performance related earnings. Economic net income decreased $35.9 million, or 25%, for the year ended December 31, 2016 compared to the year ended December 31, 2015 as a resultcomponents of the fluctuations described above.OMG’s RI ($ in thousands):
Distributable Earnings:
Year ended December 31,Favorable (Unfavorable)
20232022$ Change% Change
Fee Related Earnings$(538,052)$(447,884)$(90,168)(20)%
Investment loss—realized— (37)37 100
Interest and other investment income (loss)—realized748 (1,588)2,336 NM
Interest expense(156)(684)528 77
Realized net investment income (loss)592 (2,309)2,901 NM
Realized Income$(537,460)$(450,193)(87,267)(19)
DE decreased $43.6 million, or 29%, for the year ended December 31, 2016 compared to the year ended December 31, 2015. DE was negatively impacted by a decrease of $17.3 million in FRE. In addition, net realized investment and other losses increased $16.4 million for the year ended December 31, 2016.

Liquidity and Capital Resources
Management assesses liquidity in terms of our ability to generate cash to fund operating, investing and financing activities. Management believes that the Company is well-positioned and its liquidity will continue to be sufficient for its foreseeable working capital needs, contractual obligations, dividend payments, pending acquisitions and strategic initiatives.

Sources and Uses of Liquidity
Our sources of liquidity are (1)are: (i) cash on hand, (2)hand; (ii) net working capital, (3)capital; (iii) cash from operations, including management fees and fee related performance revenues, which are collected monthly, quarterly or semi‑annually,semi-annually, and net realized performance fees,income, which aremay be unpredictable as to amount and timing, (4)timing; (iv) fund distributions related to our investments that are also unpredictable as to amount and timingtiming; and (5)(v) net borrowing provided byfrom the Credit Facility. As of December 31, 2017,2023, our cash and cash equivalents were $118.9$348.3 million, including investments in money market funds, and we had $210.0have $430.0 million of borrowings outstandingavailable under theour Credit Facility. TheOur ability to draw from the Credit Facility is subject to a leverage covenant.and other covenants. We remain in compliance with all covenants as of December 31, 2023. We believe that these sources of liquidity will be sufficient to fund our working capital requirements and to meet our commitments in the ordinary course of business and under the current market conditions for the foreseeable future. Cash flows from management fees may be impacted by a slowdown or declines in deployment, declines or write downs in valuations, or a slowdown or negatively impacted fundraising. In addition, management fees may be subject to deferral and fee related performance revenues may be subject to hold backs. Declines or delays and transaction activity may impact our fund distributions and net realized performance income which could adversely impact our cash flows and liquidity. Market conditions may make it difficult to extend the maturity or refinance our existing indebtedness or obtain new indebtedness with similar terms.
We expect that our primary liquidity needs will continue to be to (1)to: (i) provide capital to facilitate the growth of our existing investment management businesses, (2)businesses; (ii) fund our investment commitments, (3)commitments; (iii) provide capital to facilitate our expansion into businesses that are complementary to our existing investment management businesses (4)as well as other strategic growth initiatives; (iv) pay operating expenses, including cash compensation to our employeesemployees; (v) fund capital expenditures; (vi) service our debt; (vii) pay income taxes and make payments under the tax receivable agreement (“TRA”), (5) fund capital expenditures, (6) service our debt, (7) pay income taxes and (8); (viii) make distributionsdividend payments to our Class A and non-voting common and preferred shareholdersstockholders in accordance with our distribution policy.

dividend policy; and (ix) pay distributions to AOG unitholders.
In the normal course of business, we have made distributionsexpect to pay dividends to our existing owners, including distributions sourcedClass A and non-voting common stockholders that are aligned with our expected fee related earnings after an allocation of current taxes paid. For the purposes of determining this amount, we allocate the current taxes paid to FRE and to realized incentive and investment income in a manner that may be disproportionate to earnings generated by these metrics, and the actual taxes paid on these metrics should they be considered separately. Additionally, our methodology uses the tax benefits from certain expenses that are not included in these non-GAAP metrics, such as equity-based compensation from the vesting of restricted units and the exercise of stock options and from the amortization of intangible assets, among others. We allocate the taxes by multiplying the statutory tax rate currently in effect by our realized performance and net investment income and performance fees.removing this amount from total current taxes. The remaining current tax paid is the amount that we allocate to FRE. We use this method to allocate the current provision for income taxes to approximate the amount of cash that is available to pay dividends to our stockholders. If cash flowflows from operations were insufficient to fund distributionsdividends over a sustained period of time, we expect that we would suspend or reduce paying such distributions. Unless quarterly distributions have been declareddividends. In addition, there is no assurance that dividends would continue at the current levels or at all.
Our ability to obtain debt financing and paid (or declared and set apart for payment) on the preferred shares, we may not declare or pay or set apart payment for distributions on any common shares during the period. Dividends on the preferred shares are not cumulative and the preferred shares are not convertible into common shares or any other security.
Net realized performance fees also provide a sourcecomplete stock offerings provides us with additional sources of liquidity. Performance fees are realized when a portfolio investment is profitably disposedFor
154

further discussion of the preferred return or hurdle rate. Performance fees are typically realized at the end of each fund’s measurement period when investment performance exceeds a stated benchmark or hurdle rate.
Our gross accrued performance fees by segment as of December 31, 2017 are set forthfinancing transactions occurring in the table below. The company did not record any contingent repayment obligationcurrent period, see “Cash Flows” within this section and “Note 6. Debt” and “Note 13. Equity and Redeemable Interest” within our consolidated financial statements included in this Annual Report on accrued performance fees as of December 31, 2017.Form 10-K.
 As of December 31, 2017
 Accrued Performance Fees Eliminations(1) Consolidated Accrued Performance Fees
Segment(Dollars in thousands)
Credit Group$168,504
 $(5,333) $163,171
Private Equity Group815,407
 

 815,407
Real Estate Group121,269
 
 121,269
Total$1,105,180
 $(5,333) $1,099,847
(1)Amounts represent accrued performance fees earned from Consolidated Funds that are eliminated in consolidation.
Our consolidated financial statements reflect the cash flows of our operating businesses as well as the resultsthose of our Consolidated Funds. The assets of our Consolidated Funds, on a gross basis, are significantly larger than the assets of our operating businesses and therefore have a substantial effect on the amounts reported within our reportedconsolidated statements of cash flows. The primary cash flow activities of our Consolidated Funds include: (1)(i) raising capital from third-party investors, which is reflected as non-controlling interests of our Consolidated Funds when required to be consolidated into our consolidated financial statements, (2)Funds; (ii) financing certain investments by issuing debt, (3)debt; (iii) purchasing and selling investment securities, (4)securities; (iv) generating cash through the realization of certain investments, (5)investments; (v) collecting interest and dividend incomeincome; and (6)(vi) distributing cash to investors. Our Consolidated Funds are treatedgenerally accounted for as investment companies for financial accounting purposes under GAAP; therefore, the character and classification of all Consolidated Fund transactions are presented as cash flows from operations. Liquidity available at our consolidated fundsConsolidated Funds is typically not available for corporate liquidity needs, and debt of the consolidated fundsConsolidated Funds is non–recourse to the companyCompany except to the extent of the Company'sCompany’s investment in the fund.

Cash Flows
The significant captionsfollowing tables summarize our consolidated statements of cash flows by activities attributable to the Company and amounts fromConsolidated Funds. For more details on the activity of the Company and Consolidated Funds, refer to “Note 15. Consolidation” within our consolidated financial statements which include the effects of ourincluded in this Annual Report on Form 10-K.
 Year ended December 31,
20232022
Net cash provided by operating activities$473,107 $632,968 
Net cash used in the Consolidated Funds’ operating activities, net of eliminations(706,368)(1,367,080)
Net cash used in operating activities(233,261)(734,112)
Net cash used in the Company’s investing activities(111,079)(337,379)
Net cash used in the Company’s financing activities(404,761)(238,500)
Net cash provided by the Consolidated Funds’ financing activities, net of eliminations696,887 1,366,563 
Net cash provided by financing activities292,126 1,128,063 
Effect of exchange rate changes10,501 (10,240)
Net change in cash and cash equivalents$(41,713)$46,332 

The Consolidated Funds had no effect on cash flows attributable to the Company for the periods presented and CLOs in accordance with GAAP, are summarizedexcluded from the discussion below. Negative amounts represent a net outflow, or use of cash.The following discussion focuses on cash flow by activities attributable to the Company.
 Year Ended December 31,
 2017 2016 2015
 (Dollars in millions)
Statements of cash flows data              
Net cash used in operating activities$(1,863) $(626) $(528)
Net cash used in investing activities(33) (12) (75)
Net cash provided by financing activities1,655
 881
 582
Effect of foreign exchange rate change17
 (22) (6)
Net change in cash and cash equivalents$(224) $221
 $(27)

Operating Activities
Our
In the table below cash flows from operations have been summarized to present: (i) cash generated from our core operating activities, primarily consisting of profits generated principally from management fees and fee related performance revenues after covering for operating expenses and fee related performance compensation; (ii) net realized performance income; and (iii) net cash flows usedfrom investment related activities including purchases, sales, net realized investment income and interest payments. We generated meaningful cash flow from operations in each period presented.
Year ended December 31,Favorable (Unfavorable)
20232022$ Change% Change
Core operating activities$981,981 $708,039 $273,942 39%
Net realized performance income50,119 161,141 (111,022)(69)
Net cash used in investment related activities(558,993)(236,212)(322,781)137
Net cash provided by operating activities$473,107 $632,968 (159,861)(25)

Cash generated from our core operating activities increased as a result of growing fee revenues and sustained profitability. Net realized performance income represents a source of cash and includes incentive fees that are realized annually at the end of the measurement period, which is typically at the end of the calendar year. Cash from these realizations are generally received in the period subsequent to the measurement period. Our incentive fee realizations were $1.9 billion, $625.7 million and $528.0 million forhigher in the years ended December 31, 2017, 2016 and 2015, respectively. The changesfourth quarter of 2021 compared to the fourth quarter of 2022, which resulted in a decrease in cash payments received over the comparative periods.
155

Net cash used in operating activities for the comparative periods was primarily driven by net investment activity in our Consolidated Funds related to new funds that we began consolidating in 2017 and 2016, respectively. For the years ended December 31, 2017, 2016 and 2015, net purchases from investments by our Consolidated Funds were $1.8 billion, $765.5 million and $593.3 million, respectively. The change for the year ended December 31, 2017 compared to the year ended December 31, 2016 was also attributable to a change in the timing of annual bonus payments to employees for the year ended December 31, 2017. Employee bonuses earned in 2017 were paid in December 2017, while a majority of employee bonuses earned in 2016 were were paid in January 2017, resulting in an $114.3 million increase in net cash used in operating activities for the year ended December 31, 2017 compared2023 primarily represents: (i) purchases associated with funding capital commitments and strategic investments in our investment portfolio; (ii) interest payments on our debt obligations; offset by (iii) distributions received from our capital investments; and (iv) sales of our capital investments to theemployees. Our investment related activities may fluctuate depending on timing of capital investments and distributions of each fund from year ended December 31, 2016.to year. For further discussion of our capital commitments, see “Note 8. Commitments and Contingencies,” within our consolidated financial statements included in this Annual Report on Form 10-K.
Our increasing working capital needs reflectare generally rising to support the growth of our business, while the capital requirements needed to support fund-related activities vary based upon the specific investment activities being conducted during such period. The movements within our Consolidated Funds do not adversely impact our liquidity or earnings trends. We believe that our ability to generate cash from revenues, as well as the capacity under the Credit Facility, provides us with the necessary liquidity to manage short-term fluctuations in working capital and to meet our short-term commitments.
Investing Activities
Our
Year ended December 31,
20232022
Purchase of furniture, equipment and leasehold improvements, net of disposals$(67,183)$(35,796)
Acquisitions, net of cash acquired(43,896)(301,583)
Net cash used in investing activities$(111,079)$(337,379)

Net cash used in the Company’s investing activities generally reflectwas principally composed of cash to purchase furniture, fixtures, equipment and leasehold improvements during both years to support the growth in our staffing levels and to expand our global presence. Net cash used for certain acquisitionsin the Company's investing activities included cash used to complete the Crescent Point Acquisition in the current year and purchasesto complete the Infrastructure Debt Acquisition in the prior year.
Financing Activities
Year ended December 31,
20232022
Net borrowings of Credit Facility$195,000 $285,000 
Proceeds from issuance of senior notes499,010 488,915 
Class A and non-voting common stock dividends(599,934)(447,634)
AOG unitholder distributions(430,732)(388,730)
Stock option exercises85,959 21,205 
Taxes paid related to net share settlement of equity awards(157,007)(201,311)
Other financing activities2,943 4,055 
Net cash used in the Company’s financing activities$(404,761)$(238,500)

As a result of fixed assets. Purchasesgenerating higher fee related earnings, we increased the level of fixed assets were $33.2 million, $11.9 milliondividends paid to a growing shareholder base of Class A and $10.7 millionnon-voting common stockholders and distributions paid to AOG unitholders, resulting in net cash used in the Company’s financing activities for the years ended December 31, 2017, 20162023 and 2015, respectively. The increase in fixed asset purchases in 2017 largely relates to furniture, fixtures, equipment and leasehold improvements related to a new office location in Los Angeles. 2022.

In connection with certain business combinationsthe vesting of restricted units that are granted to our employees under the 2023 Equity Incentive Plan (the “Equity Incentive Plan”) and acquisitions,the predecessor plan, we recordwithhold shares equal to the fair value of management contractsour employees tax withholding liabilities and other finite-lived assetspay the taxes on their behalf in cash and thus net issue fewer shares. The use of cash decreased from the prior year primarily as intangible assets. Duringa result of fewer restricted units that vested in the current year and that a greater number of restricted units vested in the prior year primarily due to certain non-recurring awards that cliff vested in their entirety on the fifth anniversary of their applicable grant dates. This decrease was partially offset by our higher stock price, which resulted in employees recognizing additional compensation. For the years ended December 31, 2015,2023 and 2022, we used $64.4net settled and did not issue 1.7 million of cash, net of cash acquired, to complete the EIF acquisition.
Financing Activities
Net cash flows provided byshares and 2.4 million shares, respectively. The Company’s financing activities was $1.7 billion, $880.8also included cash received from stock options exercises with 5.1 million and $581.51.1 million options exercised for the years ended December 31, 2017, 20162023 and 20152022, respectively. For
Additionally, the year ended December 31, 2017,Company’s financing activities represented a source of cash primarily from net borrowings on debt facilities of the Company and our Consolidated funds. For the year ended December 31, 2016, net cash inflows were primarily due to net proceeds from preferred stock issuances and net borrowings on debt facilities of the Consolidated funds, which were partially offset by net repayments on the Company's debt facilities and a $40 million payment made in connection with our 2011 acquisition of Indicus Advisors, LLP. For the year ended December 31, 2015, net cash inflows were primarily due to net borrowings on debt facilities of the Company and our Consolidated funds.
Net borrowings from our debt obligations were $310.4 million for the year ended December 31, 2017 compared to net repayments on our debt obligations of $84.0 million for the year ended December 31, 2016 and net borrowings of $133.4 million for the year ended December 31, 2015. In the current year, net borrowings under the Credit Facility were used to support earlier payments of annual bonuses and net borrowings from new Term Loans that were issued to support purchases of CLOs that we manage within our risk retention vehicles.

Our Consolidated Funds had net proceeds from debt obligations of $1.5 billion, $905.0 million and $662.9 million for the years ended December 31, 2017, 20162023 and 2015, respectively. The increase in2022 included the net borrowing activity in 2017 for the Consolidated Funds is related to the launch of four new CLOs.
Proceedsproceeds from the issuance of preferred equity offering, net of issuance costs, resulted in a cash inflow of $298.8 million for the year ended December 31, 2016.
Distributions to our AOG unitholders and common shareholders were $261.7 million, $200.7 million and $217.8 million for the years ended December 31, 2017, 2016 and 2015, respectively. The changes in distributions are consistent with the changes in distributable earnings. For our Consolidated Funds, net contributions were $128.3 million, $14.5 million and $2.8 million for the years ended December 31, 2017, 2016 and 2015, respectively. The increase was driven by the funding activities of additional funds consolidated in 2017.
Capital Resources
The following table summarizes the Company's debt obligations (in thousands):
      As of December 31, 2017 As of December 31, 2016
 Debt Origination DateMaturity Original Borrowing Amount Carrying
Value
 Interest Rate Carrying
Value
 Interest Rate
Credit Facility(1)Revolver2/24/2022 N/A
 $210,000
 3.09% $
 %
Senior Notes(2)10/8/201410/8/2024 $250,000
 245,308
 4.21% 244,684
 4.21%
2015 Term Loan(3)9/2/20157/29/2026 $35,205
 35,037
 2.86% 35,063
 2.74%
2016 Term Loan(4)12/21/20161/15/2029 $26,376
 25,948
 3.08% 26,037
 N/A
2017 Term Loan A(4)3/22/20171/22/2028 $17,600
 17,407
 2.90% N/A
 N/A
2017 Term Loan B(4)5/10/201710/15/2029 $35,198
 35,062
 2.90% N/A
 N/A
2017 Term Loan C(4)6/22/20177/30/2029 $17,211
 17,078
 2.88% N/A
 N/A
2017 Term Loan D(4)11/16/201710/15/2030 $30,450
 30,336
 2.77% N/A
 N/A
Total debt obligations     $616,176
  
 $305,784
  
(1)
The AOG entities are borrowers under the Credit Facility, which, as amended in February 2017 and increased in September 2017, provides a $1.065 billion revolving line of credit. It has a variable interest rate based on LIBOR or a base rate plus an applicable margin with an unused commitment fee paid quarterly, which is subject to change with the Company’s underlying credit agency rating. As of December 31, 2017, base rate loans bear interest calculated based on the base rate plus 0.50% and the LIBOR rate loans bear interest calculated based on LIBOR plus 1.50%. The unused commitment fee is 0.20% per annum. There is a base rate and LIBOR floor of zero.
(2)
The Senior Notes were issued in October 2014 by Ares Finance Co. LLC (“AFC”), a subsidiary of the Company, at 98.268% of the face amount with interest paid semi-annually. The Company may redeem the Senior Notes prior to maturity, subject to the terms of the indenture.
(3)
The 2015 Term Loan was entered into in August 2015 by a subsidiary of the Company that acts as a manager to a CLO. The 2015 Term Loan is secured by collateral in the form of CLO senior tranches owned by the Company. To the extent the assets are not sufficient to cover the Term Loan, there is no further recourse to the Company to fund or repay the remaining balance. Interest is paid quarterly, and the Company also pays a fee of 0.025% of a maximum investment amount.
(4)The 2016 and 2017 Term Loans ("Term Loans") were entered into by a subsidiary of the Company that acts as a manager to a CLO. The Term Loans are secured by collateral in the form of CLO senior tranches and subordinated notes owned by the Company. Collateral associated with one of the Term Loans may be used to satisfy outstanding liabilities of another term loan should the collateral fall short. To the extent the assets associated with these Term Loans are not sufficient, there is no further recourse to the Company to fund or repay the remaining balance. Interest is paid quarterly, and the Company also pays a fee of 0.03% of a maximum investment amount.

As of December 31, 2017, we were in compliance with all covenants under the Credit Facility,2028 Senior Notes and Term Loan obligations.
On February 24, 2017, we amended2052 Senior Notes, respectively. A portion of these proceeds was used to repay borrowings under our Credit Facility and to among other things, increasefund strategic growth initiatives in the sizecurrent year and to fund the Infrastructure Debt Acquisition in the prior year.

156


In September 2017, we increased our Credit Facility to $1.065 billion from $1.04 billion. The $25 million increase resulted from the exercise of the facility’s accordion feature and the addition of a new bank to the facility. No other terms of the revolving credit facility were impacted by the increase.

Capital Resources
We intend to use a portion of our available liquidity to makepay cash distributionsdividends to our preferredClass A and non-voting common shareholdersstockholders on a quarterly basis in accordance with our distribution policies.dividend policy. Our ability to make cash distributions to our preferred and common shareholdersdividends is dependent on a myriad of factors, including among others: general economic and business conditions; our strategic plans and prospects; our business and investment opportunities; timing of capital calls by our funds in support of our commitments; our financial condition and operating results; working capital requirements and other anticipated cash needs; contractual restrictions and obligations; legal, tax and regulatory restrictions; restrictions on the payment of distributions by our subsidiaries to us and other relevant factors.
In conjunction with the Tax Election, we have adopted a new distribution policy that will reduce volatility of the quarterly distributions and become more closely aligned with our core management fee business. For further detail on the impact of the Tax Election on our distribution policy, see "Item 5. Market For Registrant’s Common Equity, Related Stockholder Matters And Issuer Purchases Of Equity Securities - Distribution Policy for Common Shares Prior to Effectiveness of Tax Election & Distribution Policy for Common Shares Following Effectiveness of Tax Election."


We are required to maintain minimum net capital balances for regulatory purposes for our United Kingdom subsidiary and for our subsidiary that operates as a broker‑dealer.broker-dealer entities. These net capital requirements are met in part by retaining cash, cash‑cash equivalents and investment securities. Additionally, certain of our subsidiaries operating outside the U.S. are also subject to capital adequacy requirements in each of the applicable jurisdictions. As a result, we may be restricted in our ability to transfer cash between different operating entities and jurisdictions. As of December 31, 2017,2023, we were required to maintain approximately $24.5$64.9 million in liquid net assets within these subsidiaries to meet regulatory net capital and capital adequacy requirements. We remain in compliance with all regulatory requirements.

Holders of AOG Units, subject to the terms of the exchange agreement, may exchange their AOG Units for Ares Management, L.P.shares of our Class A common sharesstock on a one-for-one basis. These exchanges are expected to result in increases in the tax basis of the tangible and intangible assets of Ares Management, L.P.AMC that otherwise would not have been available. These increases in tax basis may increase (for tax purposes) depreciation and amortization for U.S. income tax purposes and thereforethereby reduce the amount of tax that we would otherwise be required to pay in the future. We entered into the TRA withthat provides payment to the TRA recipients that provides for the payment by us to the TRA Recipients of 85% of the amount of actual cash savings, if any, in U.S. federal, state, local and foreign income tax or franchise tax that we actually realize as a result of these increases in tax basis and of certain other tax benefits related to entering into the TRA, including tax benefits attributable to payments under the TRA and interest accrued thereon.thereon (“Tax Benefit Payment”). Effective as of May 1, 2023, pursuant to an amendment to the TRA, to the extent Ares Owners Holdings L.P. would have been a recipient of certain Tax Benefit Payments under the TRA for taxable exchanges on or after May 1, 2023, Ares Owners Holdings L.P. will no longer be entitled to any Tax Benefit Payment for such exchanges. Future payments under the TRA in respect of subsequent exchanges are expected to be substantial. AsThe TRA liability balance was $191.3 million and $118.5 million as of December 31, 2017, there have been2023 and 2022, respectively.
For a limited numberdiscussion of exchangesour debt obligations, including the debt obligations of AOG Units for Ares Management, L.P. common shares.our consolidated funds, see “Note 6. Debt,” within our consolidated financial statements included in this Annual Report on Form 10-K.
Preferred Equity
As of December 31, 2017 and 2016, the Company had 12,400,000 shares of Series A Preferred Shares (the “Preferred Equity”) outstanding. When, as and if declared by the Company’s board of directors, distributions on the Preferred Equity are paid quarterly at a rate per annum equal to 7.00%. The Preferred Equity may be redeemable at our option, in whole or in part, at any time on or after June 30, 2021, at a price of $25.00 per share.
Cash distributions to our common shareholders may be impacted by any corporate tax liability owed by us and Ares Holdings, Inc. (“AHI”), the wholly owned U.S. corporate subsidiary of the Company. In connection with the Preferred Equity issuance, the Ares Operating Group issued mirror preferred units (“GP Mirror Units”) paying the same 7.00% rate per annum to wholly owned subsidiaries of the Company including AHI. Although income allocated in respect of distributions on the GP Mirror Units may be subject to tax, cash distributions to our preferred shareholders will not be reduced on account of any income taxes owed by us. As a result, the amounts ultimately distributed by us to our common shareholders may be reduced by any corporate taxes imposed on us or AHI.
Exercise of Indicus Put Option
Upon acquisition of Indicus in November 2011, certain former owners of Indicus (“Indicus Owners”) were provided a fixed put option on their equity interest in the Company at an aggregate strike price of $40 million to be exercised during 2016 (“Put Option”). In August 2016, the Indicus Owners exercised their Put Option and, in November 2016, we paid these Indicus Owners a total of $40 million to settle the put option in exchange for redemption of their equity interests in the Company. 

Critical Accounting Estimates
We prepare our consolidated financial statements in accordance with GAAP. In applying many of these accounting principles, we need to make assumptions, estimates or judgments that affect the reported amounts of assets, liabilities, revenues and expenses in our consolidated financial statements. We base our estimates and judgments on historical experience and other assumptions that we believe are reasonable under the circumstances. These assumptions, estimates or judgments, however, are both subjective and subject to change, and actual results may differ from our assumptions and estimates. If actual amounts are ultimately different from our estimates, the revisions are included in our results of operations for the period in which the actual amounts become known. We believe the following critical accounting policies could potentially produce materially different results if we were to change the underlying assumptions, estimates or judgments. See “—Components of Consolidated Results of Operations” and Note 2, “Summary“Note 2. Summary of Significant Accounting Policies,” towithin our consolidated financial statements included in this Annual Report on Form 10‑K10-K for a summary of our significant accounting estimates.policies.

Principles of Consolidation

We consolidate entities based on either a variable interest model or voting interest model. As such, for entities that are determined to be variable interest entities (“VIEs”), we consolidate those entities where we have both significant economics and the power to direct the activities of the entity that impact economic performance. For limited partnerships and similar entities evaluated under the voting interest model, we do not consolidate those entities for which we act as the general partner. However, the Company continues to consolidate entities in which it holdspartner unless we hold a majority voting interest.

The consolidation guidance requires qualitative and quantitative analysis to determine whether our involvement, through holding interests directly or indirectly in the entity or contractually through other variable interests (e.g., management fees and performance related fees)income), would give us a controlling financial interest. This analysis requires judgment. These
157

judgments include: (1)(i) determining whether the equity investment at risk is sufficient to permit the entity to finance its activities without additional subordinated financial support, (2)support; (ii) evaluating whether the equity holders, as a group, can make decisions that have a significant effect on the success of the entity, (3)entity; (iii) determining whether two or more parties’ equity interests should be aggregated, (4)aggregated; (iv) determining whether the equity investors have proportionate voting rights to their obligations to absorb losses or rights to receive returns from an entityentity; and (5)(v) evaluating the nature of relationships and activities of the parties involved in determining which party within a related‑partyrelated-party group is most closely associated with a VIE and hence would be deemed the primary beneficiary.

The holderscreditors of the consolidated VIEs’ liabilitiesVIEs do not have recourse to us other than to the assets of the respective consolidated VIEs. The assets and liabilities of the consolidated VIEs are comprised primarily of investments and loans payable, respectively.

Fair Value Measurement

GAAP establishes a hierarchalhierarchical disclosure framework prioritizing the inputs used in measuring financial instruments at fair value into three levels based on their market observability. Market price observability is affected by a number of factors, including the type of instrument and the characteristics specific to the instrument. Financial instruments with readily available quoted prices from an active market or where fair value can be measured based on actively quoted prices generally have a higher degree of market price observability and a lesser degree of judgment inherent in measuring fair value.

Financial assets and liabilities measured and reported at fair value are classified as follows:

Level I—Quoted prices in active markets for identical instruments.

Level II—Quoted prices for similar instruments in active markets; quoted prices for identical or similar instruments in inactive markets; and model‑derivedmodel-derived valuations with directly or indirectly observable significant inputs. Level II inputs include prices in markets with few transactions, non-current prices, prices for which little public information exists or prices that vary substantially over time or among brokered market makers. Other inputs include interest rates,rate, yield curves, volatilities,curve, volatility, prepayment risks,risk, loss severities,severity, credit risksrisk and default rates.
rate.

Level III—IIIValuations that rely on one or more significant unobservable inputs. These inputs reflect the Company’s assessment of the assumptions that market participants would use to value the instrument based on the best information available.

In some instances, an instrument may fall into multiple levels of the fair value hierarchy. In such instances, the instrument’s level within the fair value hierarchy is based on the lowest of the three levels (with Level III being the lowest) that is significant to the fair value measurement. Our assessment of the significance of an input requires judgment and considers factors specific to

the instrument. See Note 6, “Fair“Note 5. Fair Value,” towithin our consolidated financial statements included in this Annual Report on Form 10‑K10-K for a summary of our valuation of investments and other financial instruments by fair value hierarchy levels.
Equity-Based Compensation
We recognize expense related to equity-based compensation in which we receive services from our professionals in exchange for (a) equity instrumentsAcquisitions

Management’s determination of fair value of assets acquired and liabilities assumed at the Company, (b) derivativesacquisition date is based on the Company’s common shares, or (c)best information available in the circumstances and may incorporate management’s own assumptions and involve a significant degree of judgment. We use our best estimates and assumptions to accurately assign fair value to the tangible and identifiable intangible assets acquired and liabilities that are based onassumed at the acquisition date as well as the useful lives of those acquired intangible assets. For business combinations accounted for under the acquisition method, the purchase consideration, including the fair value of certain elements of contingent consideration as of the acquisition date, in excess of the fair value of net assets acquired is recorded as goodwill. Conversely, any excess of the fair value of the Company’s equity instruments. Equity-based compensation expense represents expenses associatednet assets acquired over the purchase consideration is recognized as a bargain purchase gain. Examples of critical estimates in valuing certain of the intangible assets we have acquired include, but are not limited to, future expected cash inflows and outflows, future fundraising assumptions, expected useful lives, discount rates and income tax rates. Our estimates for future cash flows are based on historical data, internal estimates and external sources, and are based on assumptions that are consistent with restricted units, optionsthe plans and phantom units granted underestimates we are using to manage the Ares Management, L.P. 2014 Equity Incentive Plan.
Total compensation expense related to equity-based awards expected to be recognized in all future periods is determinedunderlying assets acquired. We estimate the useful lives of the intangible assets based on the expected period over which we anticipate generating economic benefit from the asset. We base our estimates on assumptions we believe to be reasonable but that are unpredictable and inherently uncertain. Unanticipated events and circumstances may occur that could affect the accuracy or validity of such assumptions, estimates or actual results.

158

Impairment of Intangible Assets

We evaluate intangible assets for impairment annually, or if certain events occur or circumstances change indicating that the carrying amount of the intangible asset may not be recoverable. We evaluate impairment by comparing the estimated undiscounted cash flows attributable to the intangible asset being evaluated with its carrying amount. If an impairment is determined to exist, we accelerate amortization expense so that the carrying amount represents fair value. We estimate fair value of the respective equity-based award on the grant date, and is recognized onusing a straight-line basis over the requisite service period, where applicable. Compensation expense for a liability award is recognized each reporting period until the liability is settled. Thediscounted future cash flow methodology. Inherent in such fair value of liability award is remeasured at the end of each reporting period through settlement.
The Company recognizes forfeitures in the period they occur as a reversal of previously recognized compensation expense. The reduction in compensation expense is determined baseddeterminations are certain judgments and estimates relating to future cash flows, including our strategic plans. We base our estimates on the specific awards forfeited during that period and could impact the expense for that period.
We record deferred tax assets for equity-based compensation transactions that result in deductions on our income tax returns based on the amount of equity-based compensation recognized and the statutory tax rate in the jurisdiction in whichassumptions we will receive a tax deduction.
Restricted Shares
Certain restricted shares are subject to a lock up provision that expires on the fifth anniversary of the IPO. We used Finnerty’s average strike‑price put option model to estimate the discount associated with this lack of marketabilitybelieve to be applied on the closing price of common shares on the grant date, using the following key assumptions:reasonable but that are unpredictable and inherently uncertain. Additionally, future estimates may differ materially from current estimates and assumptions.
Expected volatility factor(1)20% to 28 %
Average length of holding period restriction (in years)2.4 year
Weighted average expected dividend yield5.0%

(1)Expected volatility is based on the Company's guideline companies' expected volatility.
Options
We estimated the fair value of the options as of the grant date using the Black- Scholes option pricing model. Aggregate intrinsic value represents the value of the Company’s closing share price on the last trading day of the period in excess of the weighted-average exercise price multiplied by the number of options exercisable or expected to vest. The Company did not grant new options during the years ended December 31, 2017 and December 31, 2016. The fair value of each option granted during the year ended December 31, 2015 was measured on the date of grant using the Black-Scholes option-pricing model and the following weighted average assumptions:
Risk-free interest rate1.71% to 1.80%
Weighted average expected dividend yield5.00%
Expected volatility factor(1)35.00% to 36.00%
Expected life in years6.66 to 7.49

(1)Expected volatility is based on comparable companies using daily stock prices.
The fair value of an award is affected by the Company’s share price on the date of grant as well as other assumptions including the estimated volatility of the Company’s share price over the term of the awards and the estimated period of time that management expects employees to hold their share options. The estimated period of time that management expects employees to hold their options was estimated as the midpoint between the vesting date and maturity date.

Phantom Shares
Each phantom share represents an unfunded, unsecured right of the holder to receive an amount in cash per phantom share equal to the average closing price of a common share for the 15 trading days immediately prior to, and the 15 trading days immediately following, the vesting dates. The fair value of the awards is remeasured at each reporting period based on the most recent closing price of common shares.
Income Taxes
Prior to the effectiveness of the Tax Election, a substantial portion of our earnings flow through to our owners without being subject to
The Company is taxed as corporation for U.S. federal and state income tax at the entity level. A portion of our operations is conducted through a domestic corporation that is subject to corporate level taxes and for which we record current and deferred income taxes at the prevailing rates in the various jurisdictions in which these entities operate.
purposes. We use the liability method of accounting for deferred income taxes pursuant to GAAP. Under this method, deferred tax assets and liabilities are recognized for the future tax consequences attributable to temporary differences between the carrying value of existing assets and liabilities and their respective tax bases. Deferred tax assets and liabilities are measured using the statutory tax rates expected to be applied in the periods in which those temporary differences are settled. The effect of a change in tax rates on deferred tax assets and liabilities is recognized induring the period ofyear the change.change is enacted. A valuation allowance is recorded on our net deferred tax assets when it is more likely than not that such assets will not be realized.realized or when timing is unknown. When evaluating the realizability of our deferred tax assets, all evidence, both positive and negative, is evaluated. Items considered in this analysis include the ability to carry back losses, the reversal of temporary differences, tax planning strategies and expectations of future earnings.

Under GAAP, the amount of tax benefit to be recognized is the amount of benefit that is “moremore likely than not”not to be sustained upon examination. We analyze our tax filing positions in all of the U.S. federal, state, local and foreign tax jurisdictions where we are required to file income tax returns, as well as for all open tax years in these jurisdictions. If, based on this analysis, we determine that uncertainties in tax positions exist, a liability is established, which is included in accounts payable, accrued expenses and other liabilities in our consolidated financial statements.established. We recognize accrued interest and penalties related to unrecognized tax positions inwithin interest expense and general, administrative and other expenses, respectively, within the provision for income taxes.Consolidated Statements of Operations.

Tax laws are complex and subject to different interpretations by the taxpayer and respective governmental taxing authorities. Significant judgment is required in determining tax expense and in evaluating tax positions, including evaluating uncertainties under GAAP. We review our tax positions quarterly and adjust our tax balances as new legislation is passed or new information becomes available.
See Note 20, “Subsequent Events,” to our consolidated financial statements included in this Annual Report on Form 10‑K for changes made to our tax status in 2018.
Business Combinations
We account for business combinations using the acquisition method of accounting, under which the purchase price of the acquisition is allocated to the fair value of each asset acquired and liability assumed as of the acquisition date. Contingent consideration obligations are recognized as of the acquisition date at fair value based on the probability that contingency will be realized.
Management’s determination of fair value of assets acquired and liabilities assumed at the acquisition date, as well as contingent consideration, are based on the best information available in the circumstances and may incorporate management’s own assumptions and involves a significant degree of judgment. While we use our best estimates and assumptions to accurately value assets acquired and liabilities assumed at the acquisition date as well as contingent consideration, where applicable, estimates are then inherently uncertain and subject to refinement. As a result, during the measurement period, which may be up to one year from the acquisition date, the Company records adjustments to the assets acquired and liabilities assumed with the corresponding offset to goodwill. Upon the conclusion of the measurement period or final determination of the values of assets acquired or liabilities assumed, whichever comes first, any subsequent adjustments are recorded to the consolidated statements of operations.
For a given acquisition, management may identify certain pre-acquisition contingencies as of the acquisition date and may extend the review and evaluation of these pre‑acquisition contingencies throughout the measurement period to obtain sufficient information to assess whether management includes these contingencies as a part of the fair value estimates of assets acquired and liabilities assumed and, if so, to determine their estimated amounts. If management cannot reasonably determine the fair value of a pre- acquisition contingency by the end of the measurement period, which is generally the case given the nature of such matters, the Company will recognize an asset or a liability for such pre-acquisition contingency if: (i) it is probable that an asset

existed or a liability had been incurred at the acquisition date and (ii) the amount of the asset or liability can be reasonably estimated. Subsequent to the measurement period, changes in the estimates of such contingencies will affect earnings and could have a material effect on the consolidated statements of operations and financial position.
Intangible Assets and Goodwill
Our intangible assets generally consist of contractual rights to earn future management fees and incentive fees from investment funds we acquire. Finite-lived intangibles are amortized on a straight-line basis over their estimated useful lives, which range from approximately 1 to 13.5 years and are reviewed for impairment whenever events or changes in circumstances indicate that the carrying amount of the asset may not be recoverable.
Goodwill represents the excess of cost over the identifiable net assets of businesses acquired and is recorded in the functional currency of the acquired entity. Goodwill is tested annually for impairment. If, after assessing qualitative factors, we believe that it is more likely than not that the fair value of the reporting unit is less than its carrying value, we will use a two-step process to evaluate impairment. The first step compares the fair value of the reporting unit with its carrying amount, including goodwill. The second step, used to measure the amount of any potential impairment, compares the implied fair value of the reporting unit with the carrying amount of goodwill.
The assessment requires us to make judgments and involves the use of significant estimates and assumptions. These estimates and assumptions include long-term growth rates and margins used to calculate projected future cash flows, risk-adjusted discount rates based on our weighted average cost of capital and future economic and market conditions. These estimates and assumptions have to be made for each reporting unit evaluated for impairment. Our estimates for market growth, our market share and costs are based on historical data, various internal estimates and certain external sources, and are based on assumptions that are consistent with the plans and estimates we are using to manage the underlying business. If future forecasts are revised, they may indicate or require future impairment charges. We base our fair value estimates on assumptions we believe to be reasonable but that are unpredictable and inherently uncertain. Actual future results may differ from those estimates.
Recent Accounting Pronouncements

Information regarding recent accounting pronouncements and their impact on the Company can be found in Note 2, “Summary“Note 2. Summary of Significant Accounting Policies,” in the “Notes to the Consolidated Financial Statements”within our consolidated financial statements included in this Annual Report on Form 10‑K for a summary10-K.

159

Off‑Balance SheetContractual Obligations, Commitments and Contingencies and Other Arrangements
In the normal course of business, we enter into contractual obligations that may require future cash payments. We may also engage in off‑balanceoff-balance sheet arrangements, including transactions in derivatives, guarantees, capital commitments to funds, indemnifications and potential contingent repayment obligations.

Contractual Obligations, Commitments and Contingencies
The following table sets forth information relating to our contractual obligations and capital commitments of the Company and of the Consolidated Funds as of December 31, 2017:2023 ($ in thousands):
Ares Obligations Less than 1 year 1 - 3 years 4 - 5 years Thereafter Total
 (Dollars in thousands)
Less than 1 yearLess than 1 year1 - 3 years4 - 5 yearsThereafterTotal
The Company:                         The Company:    
Operating lease obligations(1) $26,849
 $48,283
 $37,177
 $51,969
 $164,278
Debt obligations payable(2) 
 
 
 406,176
 406,176
Interest obligations on debt(3) 20,244
 40,488
 36,489
 51,473
 148,694
Credit Facility(4) 
 
 210,000
 
 210,000
Capital commitments(5) 285,695


 285,695
Operating lease obligations(1)
Debt obligations payable(2)
Interest obligations on debt(3)
Other long-term obligations(4)
Capital commitments(5)
Subtotal 332,788
 88,771
 283,666
 509,618
 1,214,843
Consolidated Funds:          Consolidated Funds: 
Debt obligations payable 119,542
 5,714
 
 5,215,824
 5,341,080
Interest obligations on debt(3) 130,969
 260,350
 259,782
 687,693
 1,338,794
Capital commitments of Consolidated Funds(6) 28,021


 28,021
Total $611,320

$354,835

$543,448

$6,413,135

$7,922,738
Interest obligations on debt(3)
Capital commitments of Consolidated Funds(5)
$
(1)The table includes future minimum commitments for our operating leases. Office
(1)The table includes future minimum commitments for our operating leases, including leases that have been executed but have not yet commenced. The majority of our operating lease obligations represents office space is leased under agreements with expirations ranging from month‑to‑month contracts to lease commitments through 2027. Rent expense includes only base contractual rent.
(2)Debt obligations include $245.3 million senior notes and $160.9 million of term loan.
(3)Interest obligations include interest accrued on outstanding indebtedness.
(4)Represent outstanding balance under the Credit Facility
(5)Represent commitments to invest in certain investment products, primarily in funds managed by us. These amounts are generally due on demand and are therefore presented as obligations payable in the less than one year.
(6)Represents commitments by Consolidated Funds to fund certain investments. These amounts are generally due on demand and are therefore presented as obligations payable in the less than one year.
In connection with expirations through June 2036. Rent expense includes only base contractual rent.
(2)Debt obligations include $1,650.0 million of senior notes and $450.0 million of subordinated notes, net of unamortized discount, and outstanding balance under the initial public offering, weCredit Facility as of December 31, 2023.
(3)Interest obligations reflect future interest payments on outstanding debt obligations with stated interest rates for fixed rate debt and at the prevailing rate in effect as of the reporting date for floating rate debt.
(4)Represents payment obligations with respect to long-term service contracts entered into by the Company and future minimum commitments for our finance leases.
(5)Represents commitments to fund certain investments or to support certain strategic investments. These amounts are generally due on demand and are therefore presented as obligations payable in less than one-year.


We entered into a TRA with the TRA Recipients that requires us to pay them 85% of any cash tax savings, if any, realized by Ares Management, L.P.’s and its wholly owned subsidiaries that are taxable as corporations for U.S. federal income tax purposesAMC from any step‑upstep-up in tax basis resulting from an exchange of Ares Operating GroupAOG Units for Ares Management, L.P.shares of our Class A common sharesstock or, at our option, for cash. Because the timing of amounts to be paid under the tax receivable agreementTRA cannot be determined, this contractual commitment has not been presented in the table above. The cash tax savings, if any, achieved may not ensure that we have sufficient cash available to pay this liability, and we may be required to incur additional debt to satisfy this liability.
Indemnifications
Consistent with standard business practices in the normal courseFor further discussion of business, we enter into contracts that contain indemnities for our affiliates, persons acting on our behalf or such affiliatescapital commitments, indemnification arrangements and third parties. The terms of the indemnities vary from contract to contractcontingent obligations, see “Note 8. Commitments and the maximum exposure under these arrangements, if any, cannot be determined and has not been recorded inContingencies,” within our consolidated financial statements. Asstatements included in this Annual Report on Form 10-K.
160

Table of December 31, 2017, we have not had prior claims or losses pursuant to these contracts and expect the risk of loss to be remote.Contents
Capital Commitments
As of December 31, 2017 and December 31, 2016, we had aggregate unfunded commitments of $285.7 million and $535.3 million, respectively, including commitments to both non-consolidated funds and Consolidated Funds. Total unfunded commitments included $16.5 million and $89.2 million in commitments to funds not managed by us as of December 31, 2017 and December 31, 2016, respectively.
ARCC Fee Waiver

In conjunction with the ARCC-ACAS Transaction, we agreed to waive up to $10 million per quarter of ARCC's Part I Fees for ten calendar quarters, which began in the second quarter of 2017. ARCC Part I Fees will only be waived to the extent they are paid. If Part I Fees are less than $10 million in any single quarter, the shortfall will not carryover to the subsequent quarters.

As of December 31, 2017, there are seven remaining quarters as part of the fee waiver agreement, with a maximum of $70 million in potential waivers. ARCC Part I Fees are shown net of the fee waiver.
Contingent Obligations
Generally, if at the termination of a fund (and increasingly at interim points in the life of a fund), the fund has not achieved investment returns that (in most cases) exceed the preferred return threshold or (in all cases) the general partner receives net profits over the life of the fund in excess of its allocable share under the applicable partnership agreement, the Company will be obligated to repay carried interest that was received by the Company in excess of the amounts to which the Company is entitled. This contingent obligation is normally reduced by income taxes paid by the Company related to its carried interest. 
The partnership documents governing our funds generally include a contingent repayment provision that, if triggered, may give rise to a contingent obligation that may require the general partner to return amounts to the fund for distribution to investors. Therefore, performance fees, generally, are subject to reversal in the event that the funds incur future losses. These losses are limited to the extent of the cumulative performance fees recognized in income to date. Due in part to our investment performance and the fact that our performance fees are generally determined on a liquidation basis, as of December 31, 2017 and December 31, 2016, if the funds were liquidated at their fair values, there would have been no contingent repayment obligation or liability. There can be no assurance that we will not incur a contingent repayment obligation in the future. If all of the existing investments were deemed worthless, the amount of cumulative revenues that has been recognized would be reversed. We believe that the possibility of all of the existing investments becoming worthless is remote. At December 31, 2017, 2016 and 2015, had we assumed all existing investments were worthless, the amount of carried interest, net of tax, subject to contingent repayment would have been approximately $476.1 million, $418.3 million and $322.2 million, respectively, of which approximately $370.0 million, $323.9 million and $247.9 million, respectively, would be reimbursable to the Company by certain professionals.
Performance fees are also affected by changes in the fair values of the underlying investments in the funds that we advise. Valuations, on an unrealized basis, can be significantly affected by a variety of external factors including, but not limited to, bond yields and industry trading multiples.
Our senior professionals and other professionals who have received carried interest distributions are responsible for funding their proportionate share of any contingent repayment obligations. However, the governing agreements of certain of our funds provide that if a current or former professional from such funds does not fund his or her respective share, then we may have to fund additional amounts beyond what we received in carried interest, although we will generally retain the right to pursue any remedies that we have under such governing agreements against those carried interest recipients who fail to fund their obligations.
Additionally, at the end of the life of the funds there could be a payment due to a fund by us if we have recognized more performance fees than was ultimately earned. The general partner obligation amount, if any, will depend on final realized values of investments at the end of the life of the fund.

Item 7A.  Quantitative and Qualitative Disclosures About Market Risk
Our primary exposure to market risk is related to our role as general partner or investment adviser to our investment funds and the sensitivity to movements in the fair value of their investments, including the effect on management fees, performancecarried interest, incentive fees and investment income.
Market Risk
The market price of investments may significantly fluctuate during the period of investment. Investments may decline in value due to factors affecting securities markets generally or particular industries represented in the securities markets. The value of an investment may decline due to general market conditions, which are not specifically related to such investment, such as real or perceived adverse economic conditions, changes in the general outlook for corporate earnings, changes in interest or currency rates or adverse investor sentiment generally. TheyIt may also decline due to factors that affect a particular industry or industries, such as labor shortages or increased production costs and competitive conditions within an industry.
Our credit orientation has been a central tenet of our business across our debt and equity investment strategies. Our investment professionals benefit from our independent research and relationship networks in over 50 industries, and insights from our portfolio of active investments. We believe the combination of high-quality proprietary information flow and a consistent, rigorous approach to managing investments across our strategies has been, and we believe will continue to be, a major driver of our strong risk-adjusted returns and the stability and predictability of our income.
Effect on Management Fees
Management fees are generally based on a defined percentage of fair value of assets, totalcapital commitments, invested capital, net asset value,NAV, net investment income, total assets or par value of the investment portfolios we manage. Management fees calculated based on fair value of assets or net investment income are affected by short-term changes in market values.
The overall impact of a short-term change in market value may be mitigated by a number of factors including, but not limited to, fee definitions that are not based on market value including invested capital and committed capital commitments, market value definitions that exclude the impact of realized and/or unrealized gains and losses, market value definitions based on beginning of the period values or a form of average market value including daily, monthly or quarterly averages as well monthly or quarterly payment terms.
For the year ended December 31, 2023, management fees from funds that are impacted by changes in market value and have underlying investments held in liquid strategies were approximately 3%. As such, an incrementala hypothetical 10% changedecrease in fair value of theour managed funds’ investments as of December 31, 2017,2023 would not have a material impact on our management fees.

Effect on PerformanceCarried Interest and Incentive Fees
We earn performancecarried interest and incentive fees from certain of our funds when such funds achieve specified performance criteria. Our performancecarried interest and incentive fees will be impacted by changes in market risk factors. However, several major factors will influence the degree of impact, including, but not limited to, the following :following:
the performance criteria for each individual fund in relation to how that fund’s results of operations are impacted by changes in market risk factors;
whether such performance criteria are annualmeasured annually or over the life of the fund;
to the extent applicable, the previousprior-period performance of each fund in relation to its performance criteria; and
whether each funds’ performance feerelated distributions are subject to contingent repayment.

As a result, the impact of changes in market risk factors on performancecarried interest and incentive fees will vary widely from fund to fund. An overall increase of 10% in the general equity markets would not necessarily drive the same impact on our funds’ ability to generate income or its asset valuations, as manya significant portion of our carried interest and incentive fees are from credit-based investments in our fundsand are illiquid and do not tradegenerally based on any exchange.income. Additionally, as a large percentage of our performance fee income iscarried interest and incentive fees are paid to employees as performance feerelated compensation, the overall net impact to our income would be mitigated by lower compensation payments. We do not have any material derivatives or other instruments that are directly tied to any particular market’s performance. We had $1.1 billion

161


See Note 11, “Commitments“Note 8. Commitments and Contingencies,” towithin our consolidated financial statements included in this Annual Report on Form 10‑K10-K for discussion on amount of performance fees,carried interest, net of tax distributions, subject to contingent repayment if we assumed all existing investments were worthless.

Effect on Investment Income

An investment gain (loss) is realized when we redeem all or a portion of our investment or when we receive cash income, such as dividends or distributions.is returned to us. Unrealized investment gain (loss) results from changes in the fair value of the underlying investment as well as the reversal of unrealized appreciation (depreciation) at the time an investment is realized.
Changes in the fair values of our funds’ investments directly impact unrealized principal investment income. The following table summarizes the incremental impact, including to our Consolidated Funds, of anincome and unrealized gains on investments. A hypothetical incremental 10% changedecrease in the fair value of the funds’our investments by segment as of December 31, 20172023 would result in declines in principal investment income and unrealized gains on our investment income:investments of $124.5 million and $79.1 million, respectively.
 As of December 31, 2017
 10% Increase in Fair Value 10% Decrease in Fair Value
 (Dollars in millions)
Segment         
Credit Group$37
 $(37)
Private Equity Group28
 (28)
Real Estate Group9
 (9)
Total$74
 $(74)

Exchange Rate Risk
OurWe and our funds hold investments that are denominated in non-U.S. dollarforeign currencies that may be affected by movements in the rate of exchange between those currencies and the U.S. dollar and non-U.S. dollar currencies.dollar. Movements in the exchange rate between the U.S. dollar and non-U.S. dollar currencies impact the management fees, carried interest and incentive fees earned by funds with fee paying AUM denominated in non-U.S. dollarforeign currencies as well as by funds with fee paying AUM denominated in U.S. dollars that hold investments denominated in non-U.S. dollarforeign currencies. Additionally, movements in the exchange rate impact operating expenses for our foreignglobal offices that are denominatedtransact in non-U.S.foreign currencies and the revaluation of assets and liabilities denominated in non-functional currencies, including cash balances and investments.
We manage our exposure to exchange rate risks through our regular operating activities, wherein we utilize payments received in non-U.S. dollarforeign currencies to fulfill obligations in non-U.S dollar foreign currencies, and, when appropriate, through the use of derivative financial instruments to hedge the net non-U.S. exposure: inforeign currency exposure in: the funds that we advise; the balance sheet exposure for certain direct investments denominated in non-U.S. dollarforeign currencies; and the cash flow exposure for non-U.S. dollarforeign currencies. A 10% decrease in the rate of exchange of all foreign currencies against the U.S. dollar may have a material impact on transaction gains and losses of the Company.
A portion of our management fees, carried interest, incentive fees and investments are denominated in non-U.S. dollarforeign currencies that may be affected by movements in the rate of exchange between the U.S. dollar and non-U.S. dollar currencies. We estimate that as of December 31, 2017 and 20162023 a hypothetical 10% changedecline in the rate of exchange of all foreign currencies against the U.S. dollar would not result in a material change into management fees, of approximately $6.4 millioncarried interest, incentive fees or investments for the year ended December 31, 2023, and $5.7 million, respectively.
We enter intowould be largely offset by the currency forward contracts and other exchange traded currency options to mitigate the impactconversions of the exchange rate risk on our management fees and investment portfolio due to the fluctuation of exchange of allexpenses denominated in foreign currencies against the U.S. dollar.currencies.

Interest Rate Risk
As of December 31, 2017, we had $210.0 million of borrowings outstanding under the Credit Facility.
Our Credit Facility provides a $1.065$1.325 billion revolving line of credit with the ability to upsize to $1.28$1.65 billion (subject to obtaining commitments for any such additional borrowing capacity) with a maturity date of February 24, 2022. The Credit Facility bears interest at a variable rate based on either LIBOR or a base rate plus an applicable margin with an unused commitment

fee paid quarterly, which is subject to change with our underlying credit agency rating. Currently, base rate loans bear interest calculated based on the base rate plus 0.50% and the LIBOR rate loans bear interest calculated based on LIBOR rate plus 1.50%. Our unused commitment fee is 0.20% per annum.March 31, 2027. As of December 31, 2017,2023, we had $210.0$895.0 million of borrowings outstanding under the Credit Facility. For a further discussion of our Credit Facility, see “Note 6. Debt,” within our consolidated financial statements included in this Annual Report on Form 10-K.

We estimate that in the event of a 100 basis point increase in interest rates, to the extent there is an outstanding revolver balance, we would be subject to the variable rate and would expect our interest expense to increase commensurately.

As credit-oriented investors, we are also subject to interest rate risk through the securities we hold in our Consolidated Funds. A 100 basis point increase in interest rates would be expected to negatively affect the fair value of securities that accrue interest income at fixed rates and therefore negatively impact net change in unrealized appreciationgains on investments of the Company and the Consolidated Funds. The actual impact is dependent on the average duration and amounts of such holdings and the amount of such holdings. Conversely, securities that accrue interest at variable rates would be expected to benefit from a 100 basis points increase in interest rates because these securities would generate higher levels of current income and thereforeincome. This would positively impact interest and dividend income.income but have an offsetting decrease in the fair value of the securities and negatively impact the net change in unrealized gains. In the cases where our funds pay management fees based on NAV, we would expect our segment management fees to experience a change in direction and magnitude corresponding to that experienced by the underlying portfolios.

162

Credit Risk
We are party to agreements providing for various financial services and transactions that contain an element of risk in the event that the counterparties are unable to meet the terms of such agreements. In such agreements, we depend on the respective counterparty to make payment or otherwise perform. We generally endeavor to minimize our risk of exposure by limiting to reputable financial institutions the counterparties with which we enter into financial transactions. In other circumstances, availability of financing from financial institutions may be uncertain due to market events, and we may not be able to access these financing markets.


In the ordinary course of business, we may extend loans to our funds or guarantee credit facilities held by our funds and could be subject to risk of loss or repayment if our funds do not perform.

Certain of our funds’ investments include lower-rated and comparable quality unrated distressed investments and other instruments. These issuers can be more sensitive to adverse market conditions, such as a recession or increasing interest rates, as compared to higher rated issuers. We seek to minimize risk exposure by subjecting each prospective investment to our rigorous, credit-oriented investment approach.

Item 8.  Financial Statements andSupplementary Data
The information required by this item is incorporated by reference to the consolidated financial statements and accompanying notes set forth in the F pagesF-pages of this Annual Report on Form 10-K.
 
Item 9.  Changes In Andin and Disagreements Withwith AccountantsOnon Accounting Andand Financial Disclosure
None.
 

Item 9A.  Controls Andand Procedures

Evaluation of Disclosure Controls and Procedures

We maintain disclosure controls and procedures (as that term is defined in Rules 13a‑15(e)13a-15(e) and 15d‑15(e)15d-15(e) under the Exchange Act) that are designed to ensure that information required to be disclosed in our reports under the Exchange Act is recorded, processed, summarized and reported within the time periods specified in the SEC’s rules and forms, and that such information is accumulated and communicated to our management, including our co-principalprincipal executive officersofficer and principal financial officer, as appropriate, to allow timely decisions regarding required disclosures. Any controls and procedures, no matter how well designed and operated, can provide only reasonable assurance of achieving the desired control objectives. Our management, with the participation of our principal executive officer and principal financial officer, has evaluated the effectiveness of the design and operation of our disclosure controls and procedures as of December 31, 2017.2023. Based upon that evaluation and subject to the foregoing, our principal executive officersofficer and principal financial officer concluded that, as of December 31, 2017,2023, the design and operation of our disclosure controls and procedures were effective to accomplish their objectives at the reasonable assurance level.
Changes in Internal Control over Financial Reporting
There have been no changes in our internal control over financial reporting (as defined in Rule 13a‑15(f)13a-15(f) and 15d‑15(f)15d-15(f) under the Exchange Act) during the quarter ended December 31, 20172023 that have materially affected, or that are reasonably likely to materially affect, our internal control over financial reporting.


Report of Management on Internal Control Over Financial Reporting

Our management is responsible for establishing and maintaining adequate internal control over financial reporting for the Company. Internal control over financial reporting is a process to provide reasonable assurance regarding the reliability of our financial reporting for external purposes in accordance with accounting principles generally accepted in the United States of America. Internal control over financial reporting includes maintaining records that in reasonable detail accurately and fairly reflect our transactions; providing reasonable assurance that transactions are recorded as necessary for preparation of our consolidated financial statements; providing reasonable assurance that receipts and expenditures of company assets are made in accordance with management authorization; and providing reasonable assurance that unauthorized acquisition, use or disposition of company assets that could have a material effect on our consolidated financial statements would be prevented or detected on a timely basis. Because of its inherent limitations, internal control over financial reporting is not intended to provide absolute assurance that a material misstatement of our consolidated financial statements would be prevented or detected.
163

Management conducted an evaluation of the effectiveness of our internal control over financial reporting based on the framework in Internal Control — Integrated Framework (2013) issued by the Committee of Sponsoring Organizations of the Treadway Commission. Based on this evaluation, management concluded that the Company'sCompany’s internal control over financial reporting was effective as of December 31, 2017.2023. The Company'sCompany’s independent registered public accounting firm, Ernst & Young LLP, has issued an audit report on the effectiveness of the Company'sCompany’s internal control over financial reporting. Their report follows.

164

Report ofIndependent Registered Public Accounting Firm
 
To the Stockholders and the Board of Directors and Unitholders of Ares Management L.P.Corporation 
 
Opinion on Internal Control overOver Financial Reporting


We have audited Ares Management L.P.’sCorporation’s internal control over financial reporting as of December 31, 2017,2023, based on criteria established in Internal Control-IntegratedControl—Integrated Framework issued by the Committee of Sponsoring Organizations of the Treadway Commission (2013 framework) (the “COSO criteria”)COSO criteria). In our opinion, Ares Management L.P.Corporation (the “Company”)Company) maintained, in all material respects, effective internal control over financial reporting as of December 31, 2017,2023, based on the COSO criteria.


We also have audited, in accordance with the standards of the Public Company Accounting Oversight Board (United States) (“PCAOB”)(PCAOB), the consolidated statements of financial condition of the Company as of December 31, 20172023 and 2016,2022, the related consolidated statements of operations, comprehensive income, changes in equity and cash flows for each of the three years in the period ended December 31, 2017,2023, and the related notes and our report dated March 1, 2018February 27, 2024 expressed an unqualified opinion thereon.


Basis for Opinion


The Company’s management is responsible for maintaining effective internal control over financial reporting and for its assessment of the effectiveness of internal control over financial reporting included in the accompanying Report of Management on Internal Control Over Financial Reporting. Our responsibility is to express an opinion on the Company’s internal control over financial reporting based on our audit. We are a public accounting firm registered with the PCAOB and are required to be independent with respect to the Company in accordance with the U.S. federal securities laws and the applicable rules and regulations of the Securities and Exchange Commission and the PCAOB.


We conducted our audit in accordance with the standards of the PCAOB. Those standards require that we plan and perform the audit to obtain reasonable assurance about whether effective internal control over financial reporting was maintained in all material respects.


Our audit included obtaining an understanding of internal control over financial reporting, assessing the risk that a material weakness exists, testing and evaluating the design and operating effectiveness of internal control based on the assessed risk, and performing such other procedures as we considered necessary in the circumstances. We believe that our audit provides a reasonable basis for our opinion.


Definition and Limitations of Internal Control Over Financial Reporting


A company’s internal control over financial reporting is a process designed to provide reasonable assurance regarding the reliability of financial reporting and the preparation of financial statements for external purposes in accordance with generally accepted accounting principles. A company’s internal control over financial reporting includes those policies and procedures that (1) pertain to the maintenance of records that, in reasonable detail, accurately and fairly reflect the transactions and dispositions of the assets of the company; (2) provide reasonable assurance that transactions are recorded as necessary to permit preparation of financial statements in accordance with generally accepted accounting principles, and that receipts and expenditures of the company are being made only in accordance with authorizations of management and directors of the company; and (3) provide reasonable assurance regarding prevention or timely detection of unauthorized acquisition, use, or disposition of the company’s assets that could have a material effect on the financial statements.


Because of its inherent limitations, internal control over financial reporting may not prevent or detect misstatements. Also, projections of any evaluation of effectiveness to future periods are subject to the risk that controls may become inadequate because of changes in conditions, or that the degree of compliance with the policies or procedures may deteriorate.


/s/ Ernst & Young LLP
 
Los Angeles, California
March 1, 2018February 27, 2024

165


Item 9B. Other Information
In connection with
Rule 10b5-1 Trading Plans
During the Tax Election, effective March 1, 2018, we amendedthree months ended December 31, 2023, certain executive officers and restated our partnership agreementdirectors of the Company or a vehicle controlled by them (each, a “Plan Participant”) entered into Rule 10b5-1 trading plan (a “Rule 10b5-1 Trading Plan”) to among other things, reflect our new tax classification and changesell shares of the name of ourCompany’s Class A common units and preferred unitsstock, in each case, subject to common shares and preferred shares, respectively. Our legal structure remains a Delaware limited partnership, and the terms of our common shares and preferred shares, and the associated rights, otherwise remain unchanged.any applicable volume limitations.


PART III.
ITEM 10.  DIRECTORS, EXECUTIVE OFFICERSAND CORPORATE GOVERNANCE
The directors and executive officers of our general partner as of the date of this filing are:
table below provides certain information regarding each Plan Participant’s Rule 10b5-1 Trading Plan.
Name and TitlePlan DateMaximum Shares That May Be Sold Under the PlanPlan Expiration Date
Bennett Rosenthal, Director, Co-Founder and Chairman of Private Equity GroupDecember 14, 2023250,000December 1, 2024
NameDavid Kaplan, Director and Co-FounderDecember 14, 2023Age250,000PositionDecember 1, 2024
Michael J Arougheti,45
Director, Co‑Founder,Co-Founder, Chief Executive Officer & President
Ryan BerryDecember 14, 2023999,58538
Partner, Chief Marketing and Strategy Officer
David B. Kaplan50
Director, Co‑Founder & Partner
John H. Kissick76
Director & Co‑FounderFebruary 1, 2025
Antony P. Ressler,57
Executive Chairman & Co‑Founder
Bennett RosenthalCo-FounderDecember 15, 2023542,000,000
Director, Co‑Founder & Partner
R. Kipp deVeer45
Partner, Global Head of Credit Group
Paul G. Joubert70
Director
Michael Lynton58
Director
Dr. Judy D. Olian66
Director
Michael R. McFerran46
Partner, Chief Financial Officer & Chief Operating Officer
Michael D. Weiner65
Executive Vice President, Chief Legal Officer & SecretaryMarch 1, 2025
Biographical Information
A Rule 10b5-1 Trading Plan is a written document that pre-establishes the amounts, prices and dates (or formulas for determining the amounts, prices and dates) of future purchases or sales of the Company’s common stock, including, if applicable, shares issued upon exercise of stock options or vesting of restricted stock units.

Each Plan Participant’s Rule 10b5-1 Trading Plan was adopted during an authorized trading period and when such Plan Participant was not in possession of material non-public information and is intended to satisfy the affirmative defense of Rule 10b5-1(c) under the Exchange Act.

Item 9C. Disclosure Regarding Foreign Jurisdictions that Prevent Inspections

Not applicable.

PART III.

Item 10. Directors, Executive Officers and Corporate Governance

The followinginformation required by this item is a summary of certain biographical information concerning the directors, director nominees and officers ofincorporated by reference to our general partner:
Michael J Arougheti.  Mr. Arougheti is a Co-Founder of Ares and a Director andthe Chief Executive Officer and President of Ares Management GP LLC, Ares general partner. He is a member of the Management Committee. He also serves as Co-Chairman of ARCC and as a director of ACRE. Mr. Arougheti also is a member of the Ares Credit Group’s Direct Lending Investment Committees and the Ares Operations Management Group. Prior to joining Ares in 2004, Mr. Arougheti was employed by Royal Bank of Canada from 2001 to 2004, where he was a Managing Partner of the Principal Finance Group of RBC Capital Partners and a member of the firm's Mezzanine Investment Committee. Mr. Arougheti oversaw an investment team that originated, managed and monitored a diverse portfolio of middle-market leveraged loans, senior and junior subordinated debt, preferred equity and common stock and warrants on behalf of RBC and other third-party institutional investors. Mr. Arougheti joined Royal Bank of Canada in October 2001 from Indosuez Capital, where he was a Principal and an Investment Committee member, responsible for originating, structuring and executing leveraged transactions across a broad range of products and asset classes. Prior to joining Indosuez in 1994, Mr. Arougheti worked at Kidder, Peabody & Co., where he was a member of the firm's Mergers and Acquisitions Group. Mr. Arougheti also serves on the boards of directors of Riverspace Arts, a not-for-profit arts organization and Operation HOPE, a not-for-profit organization focused on expanding economic opportunity in underserved communities through economic education and empowerment. Mr. Arougheti received a B.A. in Ethics, Politics and Economics, cum laude, from Yale University.
Mr. Arougheti’s knowledge of and extensive experience in investment management, leveraged finance and financial services gives the board of directors valuable industry‑specific knowledge and expertise on these and other matters and, in addition to his service as a director of other public companies, position him well to service on the board of directors.
Ryan Berry. Mr. Berry is a Partner and Chief Marketing and Strategy Officer of Ares Management GP LLC, Ares general partner. He also serves on the Board of Ares Partners Holdco LLC, the 7-member governing body which controls the firm. He is also a member of the Management Committee of Ares Management. He is responsibledefinitive Proxy Statement for the ongoing global expansion2024 Annual Meeting of Stockholders to be filed with the firmSecurities and oversees a dedicated teamExchange Commission within 120 days of M&A professionals, as well as the firm’s global marketing function, with relationship managers located in Los Angeles, New York, London, Hong Kong, Dubai and Sydney. Among his initiatives in recent years, Mr. Berry has completed asset manager acquisitions, forged strategic partnerships, expanded the firm’s international presence, enhanced the firm’s distribution channels and assisted with Ares’ IPO in May 2014 and related high grade debt offerings. Mr. Berry joined the firm in 2005 and spent several years working as an investment professional in the Private Equity Group, where he participated in various leveraged buyouts, growth equity and distressed debt transactions. PriorDecember 31, 2023.

Item 11. Executive Compensation
The information required by this item is incorporated by reference to joining Ares, Mr. Berry worked at UBS in Los Angeles as an Investment Banking Analyst. Mr. Berry holds a B.A., with

distinction, from the Ivey Business School at Western University in Business Administration and a B.A. from Huron University College at Western University in Cross Disciplinary Studies.

David B. Kaplan.  Mr. Kaplan is a Co-Founder of Ares and a Director and Partner of Ares Management GP LLC, Ares’ general partner. He is a Partner and Co-Head of the Ares Private Equity Group and a member of the Management Committee. He additionally serves on several of the investment committees for certain funds managed by the Private Equity Group. Mr. Kaplan joined Ares in 2003 from Shelter Capital Partners, LLC, where he was a Senior Principal from June 2000 to April 2003. From 1991 through 2000, Mr. Kaplan was a Senior Partner of, Apollo Management, L.P. and its affiliates, during which time he completed multiple private equity investments from origination through exit. Prior to Apollo Management, L.P., Mr. Kaplan was a member of the Investment Banking Department at Donaldson, Lufkin & Jenrette Securities Corp. Mr. Kaplan currently serves as Chairman of the Boards of Directors of the parent entities of Neiman Marcus Group, Inc. and Smart & Final, Inc. and as a member of the Boards of Directors of 99 Cents Only Stores LLC, ATD Corporation, Guitar Center Holdings, Inc. and the parent entity of Floor and Decor Outlets of America, Inc. Mr. Kaplan’s previous public company Board of Directors experience includes Maidenform Brands, Inc. where he served as the company’s Chairman, GNC Holdings, Inc., Dominick’s Supermarkets, Inc., Stream Global Services, Inc., Orchard Supply Hardware Stores Corporation and Allied Waste Industries Inc. Mr. Kaplan also serves on the Board of Directors of Cedars-Sinai Medical Center, is a Trustee of the Center for Early Education and serves on the President’s Advisory Group of the University of Michigan. Mr. Kaplan graduated with High Distinction, Beta Gamma Sigma, from the University of Michigan, School of Business Administration with a B.B.A. concentrating in Finance.
Mr. Kaplan’s knowledge of and extensive experience with leveraged finance, acquisitions and private equity investments, in addition to his service as a director of other public and private companies, position him well to service on the board of directors.
John H. Kissick.  Mr. Kissick is a Co-Founder of Ares and a Director of Ares Management GP LLC, Ares’ general partner. Until February 13, 2017, Mr. Kissick was a Partner of Ares in the Corporate Strategy and Relationship Management Group and served on Ares’ Management Committee and several investment committees across the firm. Prior to joining Ares in 1997, Mr. Kissick co-founded Apollo Management, L.P. in 1990. Mr. Kissick oversaw and led the capital markets activities of Apollo Management, L.P. from 1990 until 1997, particularly focusing on high yield bonds, leveraged loans, distressed debt and other fixed income assets. Prior to 1990, Mr. Kissick served as a Senior Executive Vice President of Drexel Burnham Lambert Inc., where he began in 1975, eventually heading its Corporate Finance Department. Mr. Kissick also serves on the Board of Directors of City Ventures LLC and on the boards of the Cedars-Sinai Medical Center in Los Angeles, the Stanford University Athletic Department and its Graduate School of Education, and L.A.’s Promise which helps economically disadvantaged children graduate from high school through a variety of mentoring and other programs. Mr. Kissick graduated from Yale University with a B.A. in Economics and with highest honors from the Stanford Business School with a M.B.A. in Finance.
Mr. Kissick’s experience in leadership positions, corporate governance and finance, in addition to his extensive service as a director of other companies, makes him well qualified to serve as a director on the board of directors.
Antony P. Ressler.  Mr. Ressler is a Co-Founder of Ares and the Executive Chairman of Ares Management GP LLC, Ares’ general partner. He serves as Chairman of the Management Committee. Mr. Ressler also serves as a member of the Investment Committees of certain funds managed by the Ares Private Equity Group and certain funds managed by the Ares Real Estate Group. Mr. Ressler has been with Ares Management since its founding in 1997.  Mr. Ressler previously served on the Boards of Directors of Ares Capital Corporation and Air Lease Corporation. Since June 2015, Mr. Ressler has served as the Principal Owner and Chair of the Atlanta Hawks Basketball Club. In the not for profit sector, Mr. Ressler is a member of the Board of Directors of Cedars-Sinai Medical Center, is Co-Chair of the Los Angeles County Museum of Art (LACMA) Board of Trustees and a member of the Board of Trustees of Georgetown University. Mr. Ressler is also one of the founding Board members and Finance Co-Chair of the Painted Turtle Camp, a southern California based organization (affiliated with Paul Newman’s Hole in the Wall Association), which was created to serve children dealing with chronic and life threatening illnesses by creating memorable, old-fashioned camping experiences. Mr. Ressler received his B.S.F.S. from Georgetown University’s School of Foreign Service and received his M.B.A. from Columbia University’s Graduate School of Business.
Mr. Ressler’s intimate knowledge of the business and operations of Ares Management, L.P., his extensive experience in the financial industry and as a partner in investments firms and his service as a director of other public companies provides industry‑specific knowledge and expertise to the board of directors.
Bennett Rosenthal.  Mr. Rosenthal is a Co-Founder of Ares and a Director and Partner of Ares Management GP LLC, Ares’ general partner. He is a Partner and Co-Head of the Ares Private Equity Group and a member of the Management Committee. Mr. Rosenthal additionally serves as the Co-Chairman of the Board of Directors of ARCC. Mr. Rosenthal also is a member of the Investment Committees of certain funds managed by the Ares Private Equity Group. Mr. Rosenthal joined Ares in 1998 from Merrill Lynch & Co. where he served as a Managing Director in the Global Leveraged Finance Group. He currently serves on the

Boards of Directors of City Ventures, LLC and the parent entities of Aspen Dental Management, Inc., CHG Healthcare Holdings L.P., CPG International Inc., Dupage Medical Group, Dawn Holdings, Inc., National Veterinary Associates, Inc., and other private companies. Mr. Rosenthal's previous board of directors experience includes Hanger, Inc., Maidenform Brands, Inc. and Nortek, Inc. Mr. Rosenthal also serves on the Board of Trustees of the Windward School in Los Angeles, and on the Graduate Executive Board of the Wharton School of Business. Mr. Rosenthal graduated summa cum laude with a B.S. in Economics from the University of Pennsylvania's Wharton School of Business where he also received his M.B.A. with distinction.
Mr. Rosenthal’s knowledge of and extensive experience with leveraged finance, acquisitions and direct lending and equity investments, in addition to his service as a director of other public and private companies, position him well to service on the board of directors.
R. Kipp deVeer. Mr. deVeer is a Partner of Ares Management GP LLC, Ares’ general partner, a member of the firm’s Management Committee and the Global Head of the Ares Credit Group. He additionally serves as a Director and Chief Executive Officer of ARCC and is a member of certain Ares Credit Group investment committees. Prior to joining Ares in 2004, Mr. deVeer was a partner at RBC Capital Partners, a division of Royal Bank of Canada, which led the firm's middle market financing and principal investment business. Mr. deVeer joined RBC in October 2001 from Indosuez Capital, where he was Vice President in the Merchant Banking Group. Mr. deVeer has also worked at J.P. Morgan and Co., both in the Special Investment Group of J.P. Morgan Investment Management, Inc. and the Investment Banking Division of J.P. Morgan Securities Inc. Mr. deVeer received a B.A. from Yale University and an M.B.A. from Stanford University's Graduate School of Business.
Paul G. Joubert.  Mr. Joubert is a Director of Ares Management GP LLC, Ares’ general partner. He is the Founding Partner of EdgeAdvisors, a privately held management consulting organization founded in July 2008 and has been a Venture Partner in Converge Venture Partners since March 2014. From 1971 until July 2008, Mr. Joubert held various positions at PricewaterhouseCoopers LLP, or PWC, an international consulting and accounting firm. During his tenure at PWC, Mr. Joubert served as a Partner in the firm’s Assurance practice and led its Technology, InfoCom and Entertainment practiceour definitive Proxy Statement for the Northeast region2024 Annual Meeting of Stockholders to be filed with the United States. Prior to that, he served as Partner‑in‑ChargeSecurities and Exchange Commission within 120 days of PWC’s Northeast Middle Market GroupDecember 31, 2023.

Item 12. Security Ownership of Certain Beneficial Owners and Chief of Staff to the Vice‑Chairman of PWC’s domestic operations. From May 2009 to September 2010, Mr. Joubert served on the Board of Directors of Phaseforward, a publicly traded company that was acquired by Oracle in the fall of 2010. Mr. Joubert also served on the Board of Directors and as the Audit Committee Chairman of Stream Global Services Inc. from July 2008 until March 2014, when it was acquired by Convergys Corporation. He served on the Board of Directors and as the Audit Committee Chairman for ACRE from April 2012 until June 2014. He has also been involved with a number of professional organizations and other institutions, including the Boston Museum of Science, the National Association of Corporate Directors, the Massachusetts Innovation and Technology Exchange, as a director, and the Northeastern University Entrepreneurship Program. Mr. Joubert received a B.A. from Northeastern University.
Mr. Joubert’s long and varied business career and valuable knowledge, insight and experience in financial and accounting matters positions him well for service on the board of directors.
Michael Lynton.  Mr. Lynton is a Director of Ares Management GP LLC, Ares’ general partner. Mr. Lynton currently serves as the Chairman of the Board of Snap Inc. He served as the Chief Executive Officer of Sony Entertainment from April 2012 until February 2017, overseeing Sony’s global entertainment businesses, including Sony Music Entertainment, Sony/ATV Music Publishing and Sony Pictures Entertainment. Lynton also served as Chairman and CEO of Sony Pictures Entertainment since January 2004 and managed the studio’s overall global operations, which include motion picture, television and digital content production and distribution, home entertainment acquisition and distribution, operation of studio facilities, and the development of new entertainment products, services and technologies. Prior to joining Sony Pictures, Lynton worked for Time Warner and served as CEO of AOL Europe, President of AOL International and President of Time Warner International. From 1996 to 2000, Mr. Lynton served as Chairman and CEO of Pearson plc’s Penguin Group. Mr. Lynton joined The Walt Disney Company in 1987 and started Disney Publishing. From 1992 to 1996, he served as President of Disney’s Hollywood Pictures. Mr. Lynton is also a member on the Council on Foreign Relations and the Harvard Board of Overseers and serves on the boards of the Los Angeles County Museum of Art, the USC School of Cinematic Arts and the Rand Corporation. Mr. Lynton holds a B.A. in History and Literature from Harvard College where he also received his M.B.A.
Mr. Lynton’s knowledge and extensive business experience, on a global scale, make him well qualified to serve as a director on the board of directors.
Dr. Judy D. Olian.  Dr. Olian is a Director of Ares Management GP LLC, Ares’ general partner. She is the dean of UCLA Anderson School of Management and the John E. Anderson Chair in Management. Her business expertise centers on aligning organizations’ design with market opportunities, developing strategically coherent human resource systems and incentives, and managing top management teams. She began her appointment in 2006 after serving as dean and professor of management at the

Smeal College of Business Administration at the Pennsylvania State University. Earlier, she served in various faculty and executive roles at the University of Maryland and its Robert H. Smith School of Business. Dr. Olian serves on various advisory boards including Beijing University’s Guanghua School of Business, the U.S. Studies Centre at the University of Sydney, Catalyst, a global think tank for women in business, and Westwood Technology Transfer and is Chairman of the Loeb Awards for Business Journalism. Dr. Olian also serves on the Board of Directors of United Therapeutics Corporation. Dr. Olian received her B.S. in Psychology from the Hebrew University, Jerusalem and her M.S. and Ph.D. in Industrial Relations from the University of Wisconsin, Madison.
Dr. Olian’s knowledge and business expertise in management, in addition to her service on various advisory boards, position her well to service on the board of directors.
Michael R. McFerran.  Mr. McFerran is a Partner, Chief Financial Officer and Chief Operating Officer of Ares Management GP LLC, Ares’ general partner, and a member of the Management Committee of Ares Management. He serves as Vice President of Ares Dynamic Credit Allocation Fund, Inc., a NYSE-listed closed end fund managed by an affiliate of Ares. He additionally serves as a member of the Ares Operations Management Group and the Ares Enterprise Risk Committee. Prior to joining Ares in March 2015, Mr. McFerran was a Managing Director at KKR where he was Chief Financial Officer of KKR’s credit business and Chief Operating Officer and Chief Financial Officer at KKR Financial Holdings LLC. Prior to joining KKR, Mr. McFerran spent the majority of his career at Ernst & Young LLP where he was a senior manager in their financial services industry practice. Mr. McFerran also held Vice President roles at XL Capital Ltd. and American Express. Mr. McFerran holds an M.B.A. from the Haas School of Business at U.C. Berkeley and a B.S. in Business Administration from San Francisco State University.
Michael D. Weiner.  Mr. Weiner is Executive Vice President and Chief Legal Officer of Ares Management GP LLC, Ares' general partner, a Partner and General Counsel in the Ares Legal Group and a member of the firm’s Management Committee. Mr. Weiner has been an officer of Ares Capital Corporation since 2006, including General Counsel from September 2006 to January 2010, and also serves as Vice President of Ares Commercial Real Estate Corporation and Vice President and Assistant Secretary of Ares Dynamic Credit Allocation Fund, Inc., a NYSE-listed, closed end fund managed by an affiliate of Ares Management. He additionally serves as a member of the Ares Operations Management Group and the Ares Enterprise Risk Committee. Mr. Weiner joined Ares in September 2006. Previously, Mr. Weiner served as General Counsel to Apollo Management L.P. and had been an officer of the corporate general partners of Apollo since 1992. Prior to joining Apollo, Mr. Weiner was a partner in the law firm of Morgan, Lewis & Bockius specializing in corporate and alternative financing transactions and securities law, as well as general partnership, corporate and regulatory matters. Mr. Weiner has served on the boards of directors of several public and private corporations. Mr. Weiner also serves on the Board of Governors of Cedars Sinai Medical Center in Los Angeles. Mr. Weiner graduated with a B.S. in Business and Finance from the University of California at Berkeley and a J.D. from the University of Santa Clara.
There are no family relationships among any of the directors or executive officers of our general partner.
Composition of the Board of DirectorsRelated Shareholder Matters
The limited liability company agreement ofinformation required by this item is incorporated by reference to our general partner establishes a board of directors that is responsibledefinitive Proxy Statement for the oversight2024 Annual Meeting of our business and operations. In general, our common shareholders have no right to elect the directors of our general partner. However, when the Holdco Members and other then‑current or former Ares personnel directly or indirectly hold less than 10% of the limited partner voting power, our common shareholders will have the right to vote in the election of the directors of our general partner. This Ares control condition is measured on January 31 of each year, and will be triggered if the total voting power held collectively by (i) holders of the special voting shares in Ares Management, L.P. (including our general partner, members of Ares Partners Holdco LLC and their respective affiliates), (ii) then‑current or former Ares personnel (including indirectly through related entities) and (iii) Ares Owners Holdings L.P. is less than 10% of the voting power of the outstanding voting shares of Ares Management, L.P. For purposes of determining whether the Ares control condition is satisfied, our general partner will treat as outstanding, and as held by the foregoing persons, all voting shares deliverable to such persons pursuant to equity awards granted to such persons. So long as the Ares control condition is satisfied, our general partner’s board of directors is elected in accordance with its limited liability company agreement, which provides that directors generally may be appointed and removed by the sole member of our general partner, an entity owned and controlled by the Holdco Members. In addition, so long as the Ares control condition is satisfied, the sole member of our general partner manages all of our operations and activities, and the board of directors of our general partner has no authority other than that which its member chooses to delegate to it. If the Ares control condition is no longer satisfied, the board of directors of our general partner will be responsible for the oversight of our business and operations.
Management Approach; Limited Partnership Structure

Throughout our history as a privately owned firm, we had a management structure involving strong central management led by our Co‑Founders. Our operating businesses are overseen by our Management Committee, which is comprised of our executive officers and other heads of various investment groups and ultimately by Holdco. Our general partner has determined that maintaining our existing management structure as closely as possible is desirable and intends that these practices will continue. We believe that this management structure has been a significant reason for our growth and performance.
Moreover, as a privately owned firm, we were historically managed with a perspective of achieving successful growth over the long-term. Both in entering and building our various businesses over the years and in determining the types of investmentsStockholders to be made by our funds, our management has consistently sought to focus onfiled with the best way to grow our businessesSecurities and investments over a periodExchange Commission within 120 days of many years and has paid little regard to their short‑term impact on revenue, net income or cash flow.December 31, 2023.
We believe our management approach has been a significant strength and as a public company, we have preserved our management structure with strong central management to maintain our focus on achieving successful growth over the long‑term. This desire to preserve our current management structure is one of the principal reasons why, upon listing our common shares on the NYSE, we decided to organize Ares Management, L.P. as a limited partnership that is managed by our general partner and to avail ourselves of the limited partnership exception from certain of the NYSE’s corporate governance and other rules. This exception eliminates the requirements that we have a majority of independent directors on the board of directors of our general partner and that our general partner have a compensation committee and a nominating and corporate governance committee composed entirely of independent directors. In addition, we are not required to hold annual meetings of our common shareholders.
Limited Powers of Our Board of Directors
As described above, so long as the Ares control condition is satisfied, the member of our general partner, an entity owned and controlled by the Holdco Members, manages all of our operations and activities, and the board of directors of our general partner has no authority other than that which the member of our general partner chooses to delegate to it. The member of our general partner has delegated to the board of directors of our general partner the authority to establish and oversee the audit committee and any other committee that such board deems necessary, advisable or appropriate. The board of directors of our general partner has established an audit committee, a conflicts committee and an equity incentive committee of the board of directors of our general partner. The audit committee performs the functions described below under “—Committees of the Board of Directors—Audit Committee”, the conflicts committee performs the functions described below under “—Committees of the Board of Directors—Conflicts Committee,” and the equity incentive committee performs the functions described below under “—Committees of the Board of Directors—Equity Incentive Committee.” In the event that the Ares control condition is not satisfied, the board of directors of our general partner and any committees thereof will manage all of our operations and activities.
Where action is required or permitted to be taken by the board of directors of our general partner or a committee thereof, a majority of the directors or committee members present at any meeting of the board of directors of our general partner or any committee thereof at which there is a quorum shall be the act of the board or such committee, as the case may be. The board of directors of our general partner or any committee thereof may also act by unanimous written consent.
Committees of the Board of Directors
The board of directors of our general partner has adopted a charter for the audit committee that complies with current federal and NYSE rules relating to corporate governance matters. The board of directors of our general partner has also established a conflicts committee and an equity incentive committee. The member of our general partner has delegated the authority of the board of directors of our general partner the authority to establish other committees from time to time as it deems necessary, advisable or appropriate. 
Audit Committee
The current members of the audit committee of our general partner are Messrs. Joubert and Lynton and Dr. Olian. Mr. Joubert serves as the chairperson of the audit committee. The purpose of the audit committee is to assist the board of directors of our general partner in its oversight of (i) the integrity of our financial statements, (ii) our compliance with legal and regulatory requirements, (iii) the qualifications and independence of our independent registered public accounting firm and (iv) the performance of our internal audit function and our independent registered public accounting firm. In addition, the audit committee may review and approve any related person transactions, as described under “ItemItem 13. Certain Relationships and Related Transactions, and Director Independence—Statement of Policy Regarding Transactions with Related Persons.” Each of the members of the audit committee meets the independence standards and financial literacy requirements for service on an audit committee of a board of directors pursuant to federal securities regulations and NYSE rules relating to corporate governance matters. The board of directors has determined that Mr. Joubert is an audit committee financial expert, as that term is defined in

the federal securities regulations. The audit committee has a charter which is available on our internet website at http://www.ares‑ir.com.
Conflicts CommitteeIndependence
The conflicts committeeinformation required by this item is incorporated by reference to our definitive Proxy Statement for the 2024 Annual Meeting of our general partner consists of Messrs. Joubert and Lynton and Dr. Olian. The purpose of the conflicts committee isStockholders to review and consider the resolution or course of action in respect of any conflicts of interest or potential conflicts of interest brought before it for determination or approval. The conflicts committee determines whether the resolution of any conflict of interest submitted to it is fair and reasonable to us. Any matters approved by the conflicts committee are conclusively deemed approved by us and our common shareholders and not a breach of our partnership agreement (or any agreement referred to therein) or of any duties that our general partner or its affiliates or associates may owe to us or our common shareholders. In addition, the conflicts committee may review and approve any related person transactions, other than those that are approved by the audit committee, as described under “Item 13. Certain Relationships and Related Transactions, and Director Independence—Statement of Policy Regarding Transactions with Related Persons,” and may establish guidelines or rules to cover specific categories of transactions.
Equity Incentive Committee
The equity incentive committee of our general partner consists of Messrs. Arougheti, Kaplan, Ressler and Rosenthal. The purpose of the equity incentive committee is to (i) assist the board of directors of our general partner in discharging its responsibilities relating to granting equity incentive awards to service providers of the company other than directors and executive officers subject to Section 16 of the Exchange Act, (ii) administer the Ares Management, L.P. 2014 Equity Incentive Plan (the “2014 Equity Incentive Plan”) as the equity incentive committee other than with respect to directors and executive officers of the company subject to Section 16 of the Exchange Act and (iii) recommend to the board of directors of our general partner such other matters as the equity incentive committee deems appropriate.
Code of Business Conduct and Ethics
We have a Code of Business Conduct and Ethics, which applies to, among others, our principal executive officer, principal financial officer and principal accounting officer. This code is available on our internet website at http://www.ares‑ir.com. We intend to disclose any amendment to or waiver of the Code of Business Conduct and Ethics on behalf of an executive officer or director either on our Internet website or in a Form 8‑K filing.
Corporate Governance Guidelines
We have Corporate Governance Guidelines that address significant issues of corporate governance and set forth procedures by which our general partner and board of directors carry out their respective responsibilities. Our Corporate Governance Guidelines do not prohibit directors from serving simultaneously on multiple companies’ boards but our Audit Committee charter requires that our Board must determine that the simultaneous service of an Audit Committee member on the audit committees of more than three public companies would not impair such member’s ability to effectively serve on our Audit Committee. The Corporate Governance Guidelines are available on our internet website at http://www.ares‑ir.com.
Communications to the Board of Directors
The independent directors of our general partner’s board of directors meet regularly. At each meeting of the independent directors, the independent directors choose a director to lead the meeting. All interested parties, including any employee or shareholder, may send communications to the independent directors of our general partner’s board of directors by writing to: the General Counsel, Ares Management, L.P., 2000 Avenue of the Stars, 12th Floor, Los Angeles, California 90067.
Section 16(a) Beneficial Ownership Reporting Compliance
Section 16(a) of the Exchange Act requires the executive officers and directors of our general partner, and persons who own more than ten percent of a registered class of our voting equity securities to file initial reports of ownership and reports of changes in ownershipbe filed with the SECSecurities and to furnish us with copies of all Section 16(a) forms they file. To our knowledge, based solely on our review of the copies of such reports furnished to us or written representations from such persons that they were not required to file a Form 5 to report previously unreported ownership or changes in ownership, we believe that, with respect to the fiscal year ended December 31, 2017, such persons complied with all such filing requirements.


ITEM 11.  EXECUTIVE COMPENSATION
COMPENSATION DISCUSSION AND ANALYSIS
Compensation Philosophy
Our business as a global alternative asset manager is dependent on the performance of our named executive officers (“NEOs”) and other key employees. Among other things, we depend on their ability to find, select and execute investments, oversee and improve the operations of our portfolio companies, find and develop relationships with fund investors and other sources of capital and provide other services essential to our success. Our compensation program is designed to attract, motivate and retain talented professionals who drive our success.
Our compensation philosophy has several primary objectives: (1) establish a clear relationship between performance and compensation, (2) align the interests of our NEOs and other key employees with our fund investors and shareholders to maximize value and (3) provide competitive incentive compensation opportunities, with an appropriate balance between short-term and long-term incentives.
Base salaries are dictated by employee proficiency and experience in their roles. In addition to base salary, we utilize a blend of variable and long-term pay vehicles to further incentivize and retain talent and provide an overall compensation package that is competitive with the market.
Performance-based discretionary bonuses are generally paid annually to employees based on our profitability, market analysis and employee performance. Select senior professionals may also receive carried interest or incentive fee participation in our funds. These awards will be distributed based on the rules of each individual fund, which generally provide for distributions either around the time of the fund’s inception or annually. Certain senior professionals are awarded carried interest or incentive fees in funds outside of their business lines to provide incentives for coordination and collaboration across the firm. In addition, our senior professionals are often offered the opportunity to invest their own capital in our private commingled funds (generally on a no fee, no carry basis).
We believe that carried interest and incentive fee participation as well as investment in our funds aligns the interests of our NEOs and other key employees with those of the investors in our funds, and this alignment has been a key contributor to our strong performance and growth. We also believe that ownership in our funds and the Company by our NEOs results in alignment of their interests with those of our fund investors and shareholders.
Our compensation program is a management tool supporting our mission and values. We believe our program supports, reinforces and aligns our values, business strategy and operations with the goal of increasing assets under management and profitability.
Certain of the Holdco Members (Antony P. Ressler, Michael J. Arougheti, David B. Kaplan and Bennett Rosenthal) in their capacity as our senior Partners, together with Michael R. McFerran, a Holdco Member and our chief financial officer and principal financial officer, are our NEOs for 2017. Incentive fee arrangements with our NEOs are described below under "Elements of Compensation-Incentive Fees." Our NEOs have entered into fair competition agreements with us that are described below under “-Summary Compensation Table-Fair Competition Provisions.”
Determination of Compensation for Named Executive Officers
We do not have a compensation committee. The Holdco Members, in their capacity as managers of Ares Partners Holdco LLC, make all determinations regarding the cash compensation of our NEOs, such as salaries and bonuses.
The Equity Incentive Committee of our general partner has been delegated the authority to make equity awards to individuals other than our executive officers and directors. The board of directors of our general partner makes all final determinations regarding equity awards pertaining to our executive officers and directors.  For NEOs, carried interest and incentive fee awards are generally determined by the Holdco Members and approved by the Conflicts Committee of the board of directors of our general partner.
It is our policy that the Holdco Members who are Co-Founders generally do not receive compensation other than carried interest and incentive fees or, in certain circumstances, equity grants. For 2017, Mr. McFerran’s salary and bonus decisions were based on his individual performance, the performance of the business or group for which he has responsibility and his ability to contribute to our overall performance in both the long and short term. Salary and bonus determinations are based on the judgment

of the Holdco Members and do not rely on quantitative performance targets or other formulaic calculations.  Factors that the Holdco Members typically consider in making such salary and bonus determinations include the NEO’s role, level of responsibilities and contributions to our success. The Holdco Members also consider the NEO’s prior-year compensation while balancing short-term and long-term incentives.
Elements of Compensation
Our NEOs are generally compensated through a combination of carried interest and incentive fees that are designed to reward performance and align the interests of our NEOs with the interests of our fund investors and shareholders, and for NEOs who are not Holdco Members, equity awards. In 2017, Mr. McFerran was the only NEO to receive a base salary and discretionary bonus payment, and Mr. McFerran was the only NEO that received equity awards.
We believe that the elements of compensation for our NEOs serve the primary objectives of our compensation program.  However, we periodically review the compensation of our key employees, including our NEOs, and, from time to time, may implement new plans or programs or otherwise make changes to the compensation structure relating to current or future key employees, including our NEOs.
Annual Base Salary. In 2017, Mr. McFerran was the only NEO who received an annual salary, the details of which are set out in the Summary Compensation Table that follows.
We intend the base salary of Mr. McFerran to reflect his position, duties and responsibilities as our chief financial officer, as well as recognize his anticipated contribution to our ongoing initiatives and future success.  Mr. McFerran was appointed as our Chief Operating Officer effective January 1, 2018 and his base salary was adjusted to $1,200,000 to reflect his new position. Although we believe that the base salary of our NEOs should not typically be the most significant amount of total compensation, we intend that any base salary amounts should attract and retain top talent as well as assist with the payment of basic living costs throughout the year.
Annual Cash Discretionary Bonus Payments. For 2017, Mr. McFerran is the only NEO who received an annual discretionary bonus.
Mr. McFerran’s total discretionary bonus was determined by certain of the Holdco members in their capacity as managers of Ares Partners Holdco LLC and recognizes Mr. McFerran’s individual contribution to our overall goals and performance. We intend the discretionary bonus payment to reward Mr. McFerran for assisting us to achieve our annual goals, both for the Company as a whole and in his respective area of responsibility.  Factors that were included in determining the size of the bonus payment include Mr. McFerran’s accomplishments in driving our results, his leadership and management of his team and our overall performance. Comparisons were made to prior year performance and to our other senior professionals with the intention to reward, motivate and retain Mr. McFerran.
A portion of the 2017 annual discretionary bonus awarded to Mr. McFerran was granted in January 2018 in the form of restricted units to be settled in common shares. We paid 78% of his total discretionary bonus in cash in December 2017, and we awarded the balance in January 2018 as a grant of restricted units equal to 22% of his total discretionary bonus.
Incentive Fees. The general partners or managers of certain of our funds receive performance‑based fees from our funds based on the applicable fund’s performance each year. Our senior professionals may be awarded a percentage of such incentive fees. These incentive fees are determined based on the seniority of the senior professional and the role of such senior professional in the applicable fund. We intend our incentive fee awards to incentivize the growth of our various operations and help align our investment and other professionals, including our NEOs, with our fund investors and shareholders.  Messrs. Arougheti and McFerran are the only NEOs who received incentive fees in 2017. For many partners and managers, these awards are made annually, are not subject to vesting and generally are forfeitable upon termination of employment in certain circumstances. However, for Mr. Arougheti, certain of the incentive fees are structured such that, notwithstanding his termination of employment with us, he may be eligible to continue to receive distributions relating to a declining portion of his incentive fee allocation for a period of up to twelve quarters following his termination of employment. The incentive fee participation interests held by our senior professionals generally are subject to dilution. Incentive fees, if any, in respect of a particular fund are paid to the senior professional only when actually received by the general partner, manager or other Ares entity entitled to receive such fees. In addition, the fees in which our senior professionals are entitled to share do not include base management fees, administrative fees or other expense reimbursements received from our funds. Because our senior professionals’ entitlement to incentive fees is generally subject to the fund meeting investment performance hurdles, the interests of our senior professionals are strongly aligned with the interests of our fund investors, thus ultimately benefitting our fund investors and shareholders through our success as a whole.

Carried Interest. The general partners or affiliates of certain of our funds receive a preferred allocation of income and gains from our funds if specified returns are achieved, which we refer to as “carried interest.” We intend our carried interest awards to incentivize the growth of our various operations and help align our senior professionals (including our NEOs) with our fund investors and shareholders. Our senior professionals (including our NEOs) who work in these operations collectively own a majority of the carried interest. The percentage of carried interest owned by individual senior professionals varies and generally is subject to dilution for senior professionals owning a larger portion of the carried interest by fund. The percentage of carried interest is determined based on the seniority of the senior professional and the role of such senior professional in such fund. Ownership of carried interest by senior professionals may be subject to a range of vesting conditions, including continued employment, thus serving as an important employment retention mechanism. Carried interest generally vests over the longer of a fund’s investment period and five or six years from the date of grant, but may also vest in connection with the end of the fund for certain funds. For certain of our NEOs, certain of their carried interest awards will accelerate upon termination of such NEO’s services to us without cause or by reason of death or disability of such NEO. Each of our NEOs (except Mr. McFerran) received cash distributions attributable to carried interest in 2017.
In addition, the general partners that receive allocations of carried interest generally are subject to contingent repayment obligations, under which the general partners are required to return to the applicable fund distributions from carried interest in certain situations. Our senior professionals (including certain of our NEOs) who receive allocations of carried interest are personally subject to this contingent repayment obligation, pursuant to which they may be required to repay previous distributions. Because the amount of carried interest distributions is directly tied to the realized performance of the underlying fund, our senior professionals’ direct ownership of carried interest fosters a strong alignment of their interests with the interests of our fund investors, thus ultimately benefitting our fund investors and shareholders through our success as a whole.
Ares Owners Holdings L.P. Interests. Messrs. Ressler, Arougheti, Kaplan and Rosenthal, as Holdco Members, receive cash distributions from Ares Owners Holdings L.P. based on their ownership of units in Ares Owners Holdings L.P. Such amounts are distributions in respect of their equity ownership interests and are not taxed as compensation. However, for purposes of this disclosure we have included the distributions from Ares Owners Holdings L.P. in calculating Messrs. Ressler, Arougheti, Kaplan and Rosenthal’s total compensation. We believe inclusion of the cash distributions on the Holdco Members’ interests in Ares Owners Holdings L.P. for purposes of this disclosure is appropriate because such distributions provide a more accurate reflection of incentives payable to, and amounts received by, Messrs. Ressler, Arougheti, Kaplan and Rosenthal since they otherwise do not receive cash compensation because of their substantial ownership interest in Ares Owners Holdings, L.P. For additional information related to the Ares Owners Holdings L.P., see “Part I. Item 1 - Business”.
Options and Other Equity Grants. 
We may grant equity to incentivize our NEOs’ continued employment and to align their interests with our fund investors and shareholders. We utilize options to purchase common shares (“options”) and grants of restricted shares to be settled in common shares as our principal forms of long-term equity compensation. Option and restricted share awards are granted pursuant to our 2014 Equity Incentive Plan. NEOs are entitled to cash dividends, if any, in respect of restricted shares. In March 2017, pursuant to the terms of his offer letter, we granted Mr. McFerran 27,248 restricted units. On each of the third and fourth anniversaries of Mr. McFerran’s commencement of employment, Mr. McFerran is entitled to receive a further equity grant, subject to continued employment. The restricted units granted to Mr. McFerran in March 2017 vest in equal installments on the third, fourth and fifth anniversaries of the date of grant, subject to continued employment.
Upon termination of employment for any reason, the unvested portion of Mr. McFerran’s equity grants will generally be forfeited. However, if Mr. McFerran’s termination of employment or service is as a result of Mr. McFerran’s termination without Cause (as defined in his offer letter) or by reason of death or disability after the first anniversary of the date of grant and prior to the second anniversary of the date of grant, 11% of Mr. McFerran’s equity grants will vest. If Mr. McFerran’s termination of employment or service is as a result of Mr. McFerran’s termination without Cause or by reason of death or disability after the second anniversary of the date of grant and prior to the third anniversary of the date of grant, 22% of Mr. McFerran’s equity grants will vest. For further information regarding Mr. McFerran’s equity grants, see “-Termination Payments-Equity Arrangements with Michael McFerran.”
Deferred Unit Awards. Beginning in 2016, we awarded a portion of the annual discretionary bonus to key employees (including those NEOs who receive annual discretionary bonuses) in the form of restricted units to be settled in common shares. These restricted units vest in four equal installments on the first, second, third and fourth anniversaries of the date of grant, subject to continued employment. We refer to these restricted units as “Deferred Units.”  In January 2017 we granted 11,462 Deferred Units to Mr. McFerran and in January 2018 we granted 12,103 Deferred Units to Mr. McFerran, in each case, in respect of his discretionary bonus for the preceding calendar year. Generally, upon termination of employment, the unvested portion of the award will lapse. Upon termination of employment without Cause, by reason of death or disability, or for normal retirement

or early retirement, the unvested portion of the award will vest upon termination of employment and the Deferred Units granted in 2017 and 2018 will be paid upon the termination. We believe the period of deferral and the vesting schedule sufficiently aligns the interests of NEOs who receive discretionary bonuses with our interests, as well as the interests of our fund investors and shareholders.
Pursuant to the 2014 Equity Incentive Plan, in January 2017 we granted 100,000 restricted units to Mr. McFerran. The restricted units granted to Mr. McFerran in January 2017 were granted in recognition of his continued service to the Company and will vest on the fifth anniversary of the date of grant, subject to continued employment. Upon termination of employment for any reason, the unvested portion of Mr. McFerran’s January 2017 equity grant will be forfeited.
401(k) Retirement Plan. Mr. McFerran is currently the only NEO who is eligible to participate in our 401(k) program. We intend that participation in our 401(k) program will assist him to set aside funds for retirement in a tax efficient manner. The Ares retirement plan provides options for contributing to a traditional pre-tax 401(k), a post-tax Roth 401(k) or a combination of both, up to allowable IRS limits. In addition, we provide a discretionary match equal to 50% of the first 6% of the individual’s earnings, up to allowable IRS limits. The match is subject to a four-year vesting schedule, vesting 25% per year over the first four years of employment at Ares. Once employed for four years, 100% of any match outstanding or due to the employee is vested.
Termination Payments
Equity Arrangements with Michael McFerran. With respect to equity grants to Mr. McFerran, other than his August 15, 2016 award, January 31, 2017 award, and the Deferred Units, in the event that Mr. McFerran’s employment is terminated without Cause or by reason of death or disability after the first anniversary of the date of grant and prior to the second anniversary of the date of grant, 11% of any grants of restricted units and options will vest.  In the event that Mr. McFerran’s employment is terminated without Cause or by reason of death or disability after the second anniversary of the date of grant and prior to the third anniversary of the date of grant, 22% of any grants of restricted units and options will vest.
Deferred Unit Awards. If Mr. McFerran’s employment is terminated without Cause, by reason of his death or disability or for early or normal retirement, the unvested portion of his Deferred Units will vest and the Deferred Units granted in 2016 will be paid on the previously scheduled vesting dates, while the Deferred Units granted in 2017 and 2018 will vest and be settled upon termination.
Incentive Fees and Carried Interest.  For certain of our NEOs, certain of their carried interest awards will accelerate upon termination of such NEO’s services to us without cause or by reason of death or disability of such NEO.  Our incentive fee awards are generally annual awards and forfeitable upon termination of employment in certain circumstances.  However, for Mr. Arougheti, certain of the incentive fees are structured such that, notwithstanding his termination of employment with us, he may be eligible to continue to receive distributions relating to a declining portion of his incentive fee allocation for a period of up to twelve quarters following his termination of employment.
Compensation Risk Assessment
Our compensation policies are targeted to incentivize investing in a risk-controlled fashion and are intended to discourage undue risk. Therefore, the key elements of our compensation consists of the grant of equity and, for senior professionals, carried interest subject to multi-year vesting or annual awards of incentive fees, particularly as employees become more senior in the organization and assume more leadership. We believe this policy encourages long-term thinking and protects us against excessive risk and investing for short-term gain.
Our funds generally distribute carried interest with respect to the disposition of an investment only after we have returned to our investors a preferred return and allocable capital relating to such disposition. As a result, in analyzing investments and making investment decisions, our investment professionals are motivated to take a long-term view of their investments, as short-term results typically do not affect their compensation and because they will have to return previously distributed excess carry due to subsequent under-performance of a fund.  Importantly, the amount of carried interest paid to these investment professionals is determined by the performance of the fund as a whole, rather than specific investments, meaning that they have a material interest in every investment. This approach discourages excessive risk taking, as even a hugely successful single investment will result in carried interest payments only if the overall performance of the fund exceeds the requisite hurdle.
Incentive fees are generally paid out to the general partner or manager annually upon the achievement of the requisite hurdles by such fund and our senior professionals similarly receive their proportion of the incentive fee only upon receipt of payment by the fund. Certain of our funds also have “high water marks” such that if the high water mark for a particular fund is not surpassed even if such fund had positive returns in such period, we would not earn an incentive fee with respect to such fund

during a particular period as a result of losses in prior periods. Such hurdle rates or high water marks are an incentive to our professionals to maximize returns over the long run, as excessive risk taking and poor performance in the short term will affect their future receipt of incentive fees.
Compensation Committee Report
As described above, the board of directors of our general partner does not have a compensation committee. The entire board of directors has reviewed and discussed with management the foregoing Compensation Discussion and Analysis and, based on such review and discussion, has determined that the Compensation Discussion and Analysis should be included in this annual report.
Michael J. Arougheti
David B. Kaplan
John H. Kissick
Antony P. Ressler
Bennett Rosenthal
Paul G. Joubert
Michael Lynton
Dr. Judy D. Olian
Compensation Committee Interlocks and Insider Participation
As described above, we do not have a compensation committee. Other than the grant of equity awards by the board of directors of our general partner to our executive officers, the Holdco Members make all determinations regarding executive officer compensation. In such capacity, the Holdco Members have determined that maintaining our existing compensation practices as closely as possible is desirable and intend that these practices will continue. Accordingly, the Holdco Members do not intend to establish a compensation committee of the board of directors of our general partner. For a description of certain transactions between us and our senior professionals see “Item 13.  Certain Relationships and Related Transactions, and Director Independence."

COMPENSATION OF OUR EXECUTIVE OFFICERS
Summary Compensation Table for Fiscal 2017
The following table contains information about the compensation paid to or earned by each of our named executive officers during the most recently completed fiscal year.
    Salary Bonus 
Stock
Awards
 
Option
Awards
 
Non-Equity
Incentive
Plan
Compensation
 
Change in
Pension Value
and Nonqualified
Deferred
Compensation
Earnings
 
All Other
Compensation
 Total
Name and Principal Position Year ($)(1) ($)(2) ($)(3) ($)(3) ($) ($) ($) ($)(12)
Antony P. Ressler, Co-Founder, Executive Chairman and Former Chief Executive Officer
 2017 


 108,904,413
(4)(10)108,904,413
  2016 


 94,074,455
(4)(10)94,074,455
  2015 


 72,367,328
(4)(10)72,367,328
Michael J Arougheti, Co-Founder, Chief Executive Officer and President
 2017 


 22,090,000
(5)(10)22,090,000
  2016 


 19,905,069
(5)(10)19,905,069
  2015 


 22,549,681
(5)(10)22,549,681
David B. Kaplan, Co-Founder and Partner
 2017 


 54,242,110
(6)(10)54,242,110
  2016 


 44,465,897
(6)(10)44,465,897
  2015 


 17,506,743
(6)(10)17,506,743
Bennett Rosenthal, Co-Founder and Partner
 2017 


 54,242,110
(6)(10)54,242,110
  2016 


 44,465,897
(6)(10)44,465,897
  2015 


 17,506,743
(6)(10)17,506,743
Michael R. McFerran, Chief Financial Officer and Chief Operating Officer(7)
 2017 1,000,000
 937,500
 2,650,751


 577
(8)4,588,828
  2016 1,000,000
 787,500
 2,390,749


 8,736
(9)4,186,985
  2015 774,307
 597,500
 473,025
 951,654
 
 
 88,294
(11)2,884,780
(1)
In 2017, 2016 and 2015,we did not make salary payments to Messrs. Ressler, Arougheti, Kaplan or Rosenthal.
(2)Represents the cash portion of the discretionary bonuses, which were paid in December 2017 and 2016, and January 2016 related to 2017, 2016 and 2015, respectively. As further described in “—Compensation Discussion and Analysis—Annual Cash Discretionary Bonus Payments”, Mr. McFerran received 22%, 21% and 23% of his 2017, 2016 and 2015 discretionary bonuses in restricted units granted in January 2018, January 2017 and January 2016, respectively, which are not included in these amounts.
(3)Represents the grant date fair value of restricted units and options to purchase common shares computed in accordance with ASC Topic 718. See Note 15 to our Consolidated Financial Statements included in this Annual Report on Form 10-K.
(4)Includes actual cash distributions attributable to 'carried interest' allocations of $31,915,796, $32,345,129 and $4,374,304 in 2017, 2016 and 2015, respectively.
(5)Includes actual cash distributions attributable to 'carried interest' allocations of $166,528, $553,796 and $210,324 and 'incentive fee' payments of $5,800,608, $6,423,991 and $8,100,339 for 2017, 2016 and 2015, respectively.
(6)Includes actual cash distributions attributable to 'carried interest' allocations of $38,119,246, $31,538,615 and $3,267,725 in 2017, 2016 and 2015, respectively.
(7)Mr. McFerran became an NEO in March 2015.
(8)Includes $577 of actual cash distributions attributable to 'incentive fee' payments, and there were no matching contributions under our 401(k) plan.
(9)Includes $5,194 of actual cash distributions attributable to 'incentive fee' payments and $3,542 in matching contributions under our 401(k) plan.
(10)Messrs. Ressler, Arougheti, Kaplan and Rosenthal (and their family members and estate planning vehicles) also received cash distributions from Ares Owners Holdings L.P. based on their ownership of units in Ares Owners Holdings L.P. Such amounts are distributions in respect of their equity ownership interests and are included in compensation amounts presented. Mr. Ressler received distributions of $76,988,617, $61,729,326 and $67,993,024 in 2017, 2016 and 2015, respectively. Each of Messrs. Arougheti, Kaplan and Rosenthal received distributions of $16,122,864, $12,927,282 and $14,239,018 in 2017, 2016 and 2015, respectively.

(11)Represents a relocation allotment of $88,294 received in 2015 in connection with his move from San Francisco, California to Los Angeles, California. This amount was to compensate him for the transportation of household goods to his new residence and temporary housing and tax gross-up for moving-related assistance reported as personal taxable income.
(12)Excluding the cash distributions from Ares Owners Holdings L.P. based on their ownership of units in Ares Owners Holdings L.P., total compensation in 2017 for (i) Mr. Ressler was $31,915,796, (ii) Mr. Arougheti was $5,967,136, and (iii) Messrs. Kaplan and Rosenthal was $38,119,246.
Offer Letter with Michael R. McFerran
We entered into an offer letter with Mr. McFerran on March 10, 2015 relating to Mr. McFerran’s employment as chief financial officer, establishing his position and duties and providing for initial compensatory terms. 
See “—Compensation Discussion and Analysis” for a discussion of the current compensatory terms applicable to NEOs.
Grants of Plan-Based Awards in 2017
The following table contains information about each grant of an award made to our NEOs in 2017 under any plan, including awards that subsequently have been transferred.
Name 
Grant
Date(1)
 
Stock Awards:
Number of Shares
of Stock or Units
(8)
 
Option Awards: Number of Securities Underlying Options

 
Exercise or
Base Price of
Option Awards
($/Sh)
 Grant Date Fair Value of Stock and Option Awards(2) ($)
Antony P. Ressler  


Michael J Arougheti  


David B. Kaplan  


Bennett Rosenthal  


Michael R. McFerran 1/20/2017 11,462
(3)
 
 228,094
  1/31/2017(4)100,000
(5)
 
 1,945,000
  3/23/2017(6)27,248
(7)
 
 477,657
(1)For information regarding the timing of restricted units and option grants, see “—Elements of Compensation—Options and Other Equity Grants.”
(2)Represents the grant date fair value of restricted units and options to purchase common shares computed in accordance with ASC Topic 718. See Note 15 to our Consolidated Financial Statements included in this Annual Report on Form 10-K.
(3)Represents restricted units granted under our 2014 Equity Incentive Plan to be settled in common shares, awarded to Mr. McFerran as a portion of his annual discretionary bonus. The restricted units generally vest in four equal installments on each of January 20, 2018, 2019, 2020, and 2021, subject to continued employment and earlier vesting upon the occurrence of specified events.  
(4)This award was approved by the Board of Directors on January 13, 2017.
(5)Represents restricted units granted under our 2014 Equity Incentive Plan to be settled in common shares upon vesting. The restricted units generally vest on January 31, 2022, subject to continued employment.
(6)On March 17, 2015, in connection with the approval of Mr. McFerran's offer letter, the Board of Directors approved annual restricted unit grants to Mr. McFerran as forth in his offer letter. Subject to Mr. McFerran's continued employment, these grants are made on each anniversary of March 23, 2015 until March 23, 2019.
(7)Represents restricted units granted under our 2014 Equity Incentive Plan to be settled in common shares upon vesting. The restricted units generally vest in three equal installments on each of March 23, 2020, 2021 and 2022, subject to continued employment and earlier vesting upon the occurrence of specified events.  
(8)For further information regarding the vesting of restricted units and options, see “—Elements of Compensation—Options and Other Equity Grants.”

Outstanding Equity Awards at Fiscal Year-End
The following table contains information concerning unvested equity awards unexercised options; stock that has not vested; and equity incentive plan awards outstanding for each NEO asExchange Commission within 120 days of December 31, 2017:2023.


166

  Option Awards Stock Awards
Name 
Number of
Securities
Underlying
Unexercised
Options

 
Number of
Securities
Underlying
Unexercised
Options
Unexercisable
 Option Exercise Price ($) 
Option
Expiration
Date
 
Number of Shares or Units of Stock That Have Not Vested

 
Market Value
of Shares or
Units of
Stock That
Have Not Vested
($)
 
Equity Incentive Plan Awards: Number of Unearned Shares, Units or Other Rights That Have Not Vested

 
Equity Incentive Plan Awards: Market or Payout Value of Unearned Shares, Units or Other Rights That Have Not Vested
($)
Antony P. Ressler 
 
 
 - 


Michael J Arougheti 
 
 
 - 


David B. Kaplan 
 
 
 - 


Bennett Rosenthal 
 
 
 - 


Michael R. McFerran 
 254,453
(1)18.35
 March 23, 2025 313,756
(2)
(3)
(4)
(5) (6) (7) (8)
6,275,120
 
 
Item 14. Principal Accounting Fees and Services
(1)The options granted on March 23, 2015 vest in equal installments on each of March 23, 2018, March 23, 2019 and March 23, 2020, subject to continued employment and earlier vesting upon the occurrence of specified events.
(2)27,248 of the restricted units were granted on March 23, 2015 and vest in equal installments on each of March 23, 2018, March 23, 2019 and March 23, 2020, subject to continued employment and earlier vesting upon the occurrence of specified events.
(3)15,068 of the restricted units were granted on January 20, 2016 and vest in equal installments on each of January 20, 2017, January 20, 2018, January 20, 2019 and January 20, 2020, subject to continued employment and earlier vesting upon the occurrence of specified events. 3,767 restricted units vested on January 20, 2017 and 11,301 remain unvested.
(4)36,497 of the restricted units were granted on March 23, 2016 and vest in equal installments on each of March 23, 2019, March 23, 2020, and March 23, 2021, subject to continued employment and earlier vesting upon the occurrence of specified events.
(5)100,000 of the restricted units were granted on August 15, 2016 and vest on August 15, 2021, subject to continued employment.
(6)11,462 of the restricted units were granted on January 20, 2017 and vest in equal installments on each of January 20, 2018; January 20, 2019; January 20, 2020; and January 20, 2021, subject to continued employment and earlier vesting upon the occurrence of specified events.
(7)100,000 of the restricted units were granted on January 31, 2017 and vest on January 31, 2022, subject to continued employment.
(8)27,248 of the restricted units were granted on March 23, 2017 and vest in equal installments on each of March 23, 2020, March 23, 2021, and March 23, 2022, subject to continued employment and earlier vesting upon the occurrence of specified events.

Common Shares and Ares Operating Group Units
We refer to the common shares and Ares Operating Group Units and common units received in exchange for such Ares Operating Group Units as “subject units.”
The subject units receivedinformation required by our senior professional owners are fully vested. Unless otherwise determinedthis item is incorporated by our general partner, a senior professional owner will generally forfeit 25% of his or her subject units (i) in the case of Messrs. Arougheti, Kaplan, Rosenthal or Ressler, if such person resigns or (ii) generally in the case of a senior professional owner other than those listed in clause (i), if such senior professional owner resigns or is terminated for cause, in all cases prior to the fifth anniversary of our initial public offering or the second anniversary of our initial public offering if such person is at least 60 years old on the date of any resignation.
The subject units owned by each of our senior professional owners are generally subject to the following transfer restrictions: none of the subject units may be transferred or exchanged in the first two years following our initial public offering and up to 20% of the subject units may be transferred or exchanged in each year following the second anniversary of our initial public offering and prior to the seventh anniversary of our initial public offering. However, sales may occur prior to such time

pursuant to acquisitions or other transactions or programs approved by our general partner. After May 2021, any of the subject units may be transferred or exchanged at any time, subject to the restrictions in the exchange agreement.
The forfeiture provisions and transfer restrictions set forth above are generally applicable. There may be some different arrangements for some individuals in isolated instances, none of which are applicablereference to our NEOs.
Assuming that all of the outstanding Ares Operating Group Units were exchanged for common shares, each of Messrs. Arougheti, Kaplan and Rosenthal would hold, directly or indirectly, common shares representing 6.58% of the total number of common shares outstanding and Mr. Ressler would hold, directly or indirectly, common shares representing 31.14% of the total number of common shares outstanding, in each case subject to transfer restrictions and forfeiture provisions. Mr. McFerran does not hold any Ares Operating Group Units. Assuming that all of the outstanding Ares Operating Group Units were exchanged for common shares, an additional 60 or more senior professionals would own common shares representing approximately 18.61% of the total number of common shares outstanding.
Option Exercises and Stock Vested
Our NEOs did not exercise any options from compensation-related equity awards in fiscal 2017. 
Our NEOs, other than Mr. McFerran, did not vest into equity from compensation-related equity awards in fiscal 2017. On January 20, 2017, Mr. McFerran received 3,767 vested Deferred Units representing 25% Mr. McFerran’s January 2016 award.
Pension Benefits For 2017
We provide no pension benefits to our NEOs.
Nonqualified Deferred Compensation For 2017
We provide no defined contribution plansdefinitive Proxy Statement for the deferral2024 Annual Meeting of compensation on a basis that is not tax-qualified.
Potential Payments upon Termination or Change-in-Control
Other than as set forth below, our NEOs are not entitledStockholders to any additional payments or benefits upon termination of employment, upon a change in control or upon retirement, death or disability. For certain of our NEOs, certain of their carried interest awards will accelerate upon termination of such NEO’s services to us without cause or by reason of death or disability of such NEO. 
Equity Arrangementsbe filed with Michael McFerran
In the event that Mr. McFerran’s employment is terminated without Cause or by reason of death or disability after the first anniversary of the date of grantSecurities and prior to the second anniversary of the date of grant, 11% of the restricted units granted on March 23, 2015, March 23, 2016, and March 23, 2017 and options granted on March 23, 2015 will vest. In the event that Mr. McFerran’s employment is terminated without Cause or by reason of death or disability after the second anniversary of the date of grant and prior to the third anniversary of the date of grant, 22% of any restricted units granted on March 23, 2015, March 23, 2016, and March 23, 2017 and options granted on March 23, 2015 will vest. If Mr. McFerran had experienced a termination without Cause or by reason of death or disability on December 31, 2017, Mr. McFerran would have vested in restricted units having a value of $200,180, based on the closing price for our common shares on December 29, 2017, which was $20.00.
Deferred Unit Awards
If Mr. McFerran’s employment is terminated without Cause, by reason of his death or disability or for early or normal retirement, the unvested portion of his Deferred Units will vest and the Deferred Units granted in 2016 will be paid on the previously scheduled vesting dates. If Mr. McFerran had experienced a termination without Cause, by reason of death or disability or for early or normal retirement on December 31, 2017, Mr. McFerran would have vested in Deferred Units having a value of $455,260, based on the closing price of our common shares on December 29, 2017, which was $20.00.


Pay Ratio
As a result of the rules recently adopted by the SEC under the Dodd-Frank Act, we are required to disclose the ratio of the annual total compensation of our CEO to the annual total compensation of our median employee, using certain permitted methodologies. To determine our CEO pay ratio and our median employee, we took the following steps:
We identified our median employee utilizing data asExchange Commission within 120 days of December 31, 2017 (the “Determination Date”) by examining the total amount2023.

167


We did not make any material assumptions, adjustments, or estimates with respect to total compensation. We did not annualize the compensation for any employees.

We included non-U.S. employees by converting their total compensation to U.S. Dollars from the applicable local currency using the 10-month average exchange rate from January 1, 2017 through October 31, 2017.
We believe the use of total compensation for all employees is a consistently applied compensation measure because the SEC released guidance providing that compensation determined based on the Company’s tax and/or payroll records is an appropriate consistently applied compensation measure.

After identifying the median employee based on total compensation, we calculated annual total compensation for that employee using the same methodology we used for our named executive officers as set forth in the Summary Compensation Table in this Annual Report on Form 10-K. The annual total compensation of our median employee for 2017 was $198,500.

The annual total compensation of our CEO for 2017 was $108,904,413, which includes distributions on his equity ownership in Ares Owners Holdings L.P. See the Summary Compensation Table above.

Our pay ratio may not be comparable to the CEO pay ratios presented by other companies. We believe our methodology most accurately reflects the incentives provided to our executives and employees in their roles at the Company. Based on the methodology described above, for 2017, the ratio of the annual total compensation of our CEO to the annual total compensation of the median employee (other than our CEO) is 549:1; excluding distributions on equity ownership in Ares Owners Holdings L.P., the ratio of the annual total compensation of our CEO to the annual total compensation of the median employee (other than our CEO) is 161:1. We believe excluding distributions on equity ownership in Ares Owners Holdings, L.P. reflects a pay ratio determined based on a methodology more similar to the methodologies used by our peers. As of January 1, 2018, Antony P. Ressler stepped down from his position as CEO and Michael J. Arougheti was appointed as the new CEO. The ratio of the annual total compensation of Mr. Arougheti, our current CEO, to the median employee is 111:1; excluding Mr. Arougheti’s distributions on equity ownership in Ares Owners Holdings L.P., the ratio of Mr. Arougheti’s annual total compensation, to the median employee is 30:1.

Fair Competition Provisions
In connection with the Reorganization, Ares Owners Holdings L.P. entered into new fair competition agreements with the NEOs, and Mr. McFerran entered into a fair competition agreement upon commencement of his employment. Such agreements contain customary restrictive covenants, including a non‑competition provision that runs through the one‑year period following withdrawal or dissociation from Ares Owners Holdings L.P. and provisions relating to non‑solicitation of employees and clients that run through the one‑year period following termination of employment. In addition, such agreements require our NEOs to preserve confidential information and include assignments of intellectual property to us and our affiliates, including investment track records.
Compensation of our Directors
Each director who is not an employee of or service provider to (other than as a director) any entity related to Ares Management, L.P. (“independent directors”) receives an annual retainer of $100,000, payable in cash for the actual service period. An additional annual cash retainer of $15,000 is payable annually to the chair of our audit committee. In addition, independent

directors received an initial equity grant of 3,947 restricted units upon the completion of our initial public offering, pursuant to the 2014 Equity Incentive Plan, which vested at a rate of one‑third per year, beginning on the first anniversary of the grant date.
We also reimburse independent directors for reasonable out‑of‑pocket expenses incurred in connection with the performance of their duties as directors, including travel expenses in connection with their attendance in‑person at board and committee meetings. Directors who are employees of or provide services to (other than as a director) any entity related to Ares Management, L.P. did not receive any compensation for their services as directors. See “Item 13. Certain Relationships and Related Transactions, and Director Independence-Other Transactions.”

Directors Compensation Table
The following table contains information concerning the compensation of the non-employee directors for the fiscal year ended December 31, 2017.
Name 
Fees Earned or Paid in Cash
($)
 
Stock
Awards
($)(1)
 
Option
Awards
($)
 
Non-Equity
Incentive Plan
Compensation
($)
 
Change in
Pension Value
and Nonqualified
Deferred
Compensation
Earnings
 
All Other
Compensation
($)
 
Total
($)
Paul G. Joubert 115,000


 115,000
John H. Kissick(2) 


 11,144,713
(3)11,144,713
Michael Lynton 100,000


 100,000
Dr. Judy D. Olian 100,000


 100,000
(1)On May 1, 2014, Messrs. Joubert and Lynton and Dr. Olian were each granted 3,947 restricted units, vesting in equal installments on each of May 1, 2015, 2016 and 2017. As of December 31, 2017, Messrs. Joubert and Lynton and Dr. Olian have each vested all of their respective grants of 3,947 restricted units.
(2)Mr. Kissick receives no compensation for his service as a member of our board of directors.
(3)Includes actual cash distributions attributable to 'carried interest' allocations of $4,726,004 and incentive fee payments of $42,969. Mr. Kissick (and his family members and estate planning vehicles) also received cash distributions from Ares Owners Holdings L.P. based on his ownership of units in Ares Owners Holdings L.P. Such amounts are distributions in respect of his equity ownership interests and are included in compensation amounts presented. Mr. Kissick received distributions of $6,375,740 in 2017.

ITEM 12.  SECURITY OWNERSHIP OF CERTAIN BENEFICIAL OWNERSAND MANAGEMENT AND RELATED SHAREHOLDER MATTERS
The following table sets forth certain information regarding the beneficial ownership of our common shares and Ares Operating Group Units as of February 15, 2018 by (1) each person known to us to beneficially own more than 5% of any class of the outstanding voting securities of Ares Management, L.P., (2) each of the directors and named executive officers of our general partner and (3) all directors and executive officers of our general partner as a group. We are managed by our general partner, Ares Management GP LLC, and the limited partners of Ares Management, L.P. do not presently have the right to elect or remove our general partner or its directors. Accordingly, we do not believe the common shares are “voting securities” as such term is defined in Rule 12b‑2 under the Exchange Act.
The number and percentage of common shares and Ares Operating Group Units beneficially owned is based on the number of our common shares and Ares Operating Group Units issued and outstanding as of February 15, 2018.
Beneficial ownership is determined in accordance with the rules of the SEC. Under these rules, more than one person may be deemed a beneficial owner of the same securities, and a person may be deemed a beneficial owner of securities as to which he has no economic interest. Beneficial ownership reflected in the table below includes the total units held by the individual and his or her personal planning vehicles. The address of each beneficial owner set forth below is c/o Ares Management, L.P., 2000 Avenue of the Stars, 12th Floor, Los Angeles, California 90067.

  
Common Units with
Voting Power
Beneficially
Owned(1)(2)
 
Ares Operating Group
Units Beneficially
Owned(1)(2)(3)
Name of Beneficial Owner Number % of Class Number % of Class
Directors and Named Executive Officers:                    
Michael J Arougheti 
 
 10,421,596
 4.91%
David B. Kaplan 
 
 10,421,596
 4.91%
John H. Kissick 
 
 4,121,190
 1.94%
Antony P. Ressler 
 
 49,764,375
 23.43%
Bennett Rosenthal 
 
 10,421,596
 4.91%
Paul G. Joubert 


Michael Lynton 


Dr. Judy D. Olian 


Michael R. McFerran 


All directors and executive officers as a group (10 persons) 
 
 85,742,971
 40.38%
(1)
Subject to certain restrictions, the Ares Operating Group Units are exchangeable for common shares of Ares Management, L.P. on a one‑for‑one basis (subject to the terms of the exchange agreement). See “Item 13. Certain Relationships and Related Transactions, and Director Independence—Exchange Agreement.” As noted above, we do not believe the common shares are “voting securities” as such term is defined in Rule 12b‑2 under the Exchange Act. Including common shares receivable upon exchange of the Ares Operating Group Units listed above, each of Messrs. Arougheti, Kaplan and Rosenthal own or have the right to receive 13,901,648 common shares; Mr. Kissick owns or has the right to receive 5,572,936 common shares; Mr. Ressler owns or has the right to receive 65,785,153common shares; Mr. McFerran owns or has the right to receive 335,497 common shares; Mr. Joubert owns or has the right to receive 13,947 common shares; Dr. Olian owns or has the right to receive 5,747 common shares; and Mr. Lynton owns or has the right to receive 3,947common shares. See “Item 11. Executive Compensation.”
(2)Ares Voting LLC, an entity wholly owned by Ares Partners Holdco LLC, which is in turn owned and controlled by the Holdco Members, holds a special voting share in Ares Management, L.P. that entitles it, on those few matters that may be submitted for a vote of our common shareholders, to a number of votes that is equal to the aggregate number of Ares Operating Group Units held by the limited partners of the Ares Operating Group entities that do not hold a special voting share.
(3)Information presented does not include Ares Operating Group Units with respect to which our named executive officers may be deemed to have shared control due to their control of Ares Voting LLC.
Securities Authorized for Issuance under Equity Incentive Plans
The table set forth below provides information concerning the awards that may be issued under the 2014 Equity Incentive Plan as of December 31, 2017:
Plan Category 
Number of securities to
be issued upon exercise
of outstanding options,
warrants and rights(1)
 
Weighted‑average
exercise price of
outstanding options,
warrants and rights
 
Number of securities
remaining available for
future issuance under
equity compensation plans
(excluding securities
reflected in column (a))(2)
  (a) (b) (c)
Equity compensation plans approved by security holders 
 
 
Equity compensation plans not approved by security holders 33,757,927
 $11.53
 26,284,165
Total 33,757,927
 $11.53
 26,284,165
(1)Reflects the aggregate number of outstanding non‑qualified options, unit appreciation rights, common shares, restricted units, deferred restricted units, phantom units, unit equivalent awards and other awards based on common shares, to which we collectively refer as our “units,” granted under the 2014 Equity Incentive Plan as of December 31, 2017.
(2)The aggregate number of units available for future grants under our 2014 Equity Incentive Plan is increased on the first day of each fiscal year by the number of units equal to the positive difference, if any, of (a) 15% of the aggregate number of common shares and Ares Operating Group Units outstanding on the last day of the immediately preceding fiscal year (excluding Ares Operating Group Units held by Ares Management, L.P. or its wholly owned subsidiaries) minus (b) the aggregate number of our units otherwise available for future grants under our 2014 Equity Incentive Plan as of such date (unless the administrator of the 2014 Equity Incentive Plan should decide to increase the number of common shares available for future grants under the plan by a lesser amount). The units underlying any award granted under the 2014 Equity Incentive Plan that expire, terminate or are cancelled (other than in connection of a payment) without being settled in units will again become available for awards under the 2014 Equity Incentive Plan. Awards

settled solely in cash do not use units under the 2014 Equity Incentive Plan. As of January 1, 2018, pursuant to this formula,31,853,504 units were available for issuance under the 2014 Equity Incentive Plan.
ITEM 13.  CERTAIN RELATIONSHIPS AND RELATED TRANSACTIONS, AND DIRECTOR INDEPENDENCE
Our General Partner
Our general partner manages all of our operations and activities. For so long as, as determined on January 31 of each year, the Ares control condition is satisfied, the board of directors of our general partner has no authority other than that which Ares Partners Holdco LLC, the member of our general partner and an entity owned and controlled by the Holdco Members, chooses to delegate to it. If the Ares control condition is not satisfied, the board of directors of our general partner will be responsible for the oversight of our business and operations.
Our common shareholders have limited voting rights and have no right to remove our general partner or, except in the limited circumstances described below, elect the directors of our general partner. Our common shareholders have no right to elect the directors of our general partner unless the Ares control condition is not satisfied. For so long as the Ares control condition is satisfied, our general partner’s board of directors is elected in accordance with its limited liability company agreement, which provides that directors are appointed and removed by Ares Partners Holdco LLC, the member of our general partner. Ares Partners Holdco LLC is owned by the Holdco Members and managed by a board of managers which is composed of Messrs. Arougheti, Berry, de Veer, Kaplan, McFerran, Ressler and Rosenthal. Mr. Ressler has veto power over decisions by the board of managers. The Holdco Members, through Ares Owners Holdings L.P. and the special voting shares held by Ares Voting LLC, have approximately 71.59% of the voting power of Ares Management, L.P. As a result, our common shareholders have limited ability to influence decisions regarding our businesses.
Tax Receivable Agreement
The holders of Ares Operating Group Units, subject to any applicable transfer restrictions and other provisions, may on a quarterly basis (subject to the terms of the exchange agreement), exchange their Ares Operating Group Units for our common shares on a one‑for‑one basis or, at our option, for cash. A holder of Ares Operating Group Units must exchange one Ares Operating Group Unit in each of the Ares Operating Group entities to effect an exchange for a common share of Ares Management, L.P. The relevant Ares Operating Group entities (and any other entities as may be determined by our general partner) has made or will make an election under Section 754 of the Code for each taxable year in which an exchange of Ares Operating Group Units for common shares occurs, which is expected to result in increases to the tax basis of its assets at the time of an exchange of Ares Operating Group Units. These exchanges are expected to result in increases in the tax basis of the tangible and intangible assets of the relevant Ares Operating Group entity that may reduce the amount of tax that we would otherwise be required to pay in the future. These increases in tax basis may also decrease gains (or increase losses) on future dispositions of certain capital assets to the extent tax basis is allocated to those capital assets. The IRS may challenge all or part of the tax basis increase and increased deductions, and a court could sustain such a challenge.
We entered into a tax receivable agreement with the TRA Recipients that provides for the payment by us to the TRA Recipients of 85% of the amount of cash tax savings, if any, in U.S. federal, state, local and foreign income tax that we actually realize (or is deemed to realize in the case of an early termination payment by us or a change in control, as discussed below) as a result of increases in tax basis and certain other tax benefits related to our entering into the tax receivable agreement. The reduction in the statutory corporate tax rate from 35% to 21% would generally reduce the amount of cash tax savings and thus reduce the amount of the payments to the TRA Recipients. On the other hand, due to the Tax Election, a greater percentage of our income will be subject to corporate taxation and thus generally increase the amount payable under the tax receivable agreement. This payment obligation is our obligation and not the obligation of the Ares Operating Group. We will benefit from the remaining 15% of cash tax savings, if any, in income tax we realize. For purposes of the tax receivable agreement, the cash tax savings in income tax will be computed by comparing our actual income tax liability (calculated with certain assumptions) to the amount of such taxes that we would have been required to pay had there been no increase to the tax basis of our assets as a result of the exchanges and had we not entered into the tax receivable agreement. A limited partner of an Ares Operating Group entity may elect to exchange Ares Operating Group Units in a tax‑free transaction where the limited partner is making a charitable contribution or otherwise with our consent. In such a case, the exchange will not result in an increase in the tax basis of the assets of the relevant Ares Operating Group entity and no payments will be made under the tax receivable agreement. 
The term of the tax receivable agreement commenced on May 1, 2014 and will continue until all such tax benefits have been utilized or expired, unless we exercise our right to terminate the tax receivable agreement for an amount based on the agreed payments remaining to be made under the agreement (as described in more detail below) or we breach any of its material obligations under the tax receivable agreement in which case all obligations will generally be accelerated and due as if we had exercised its

right to terminate the tax receivable agreement. Estimating the amount of payments that may be made under the tax receivable agreement is by its nature imprecise, as the calculation depends on a variety of factors. The actual increase in tax basis, as well as the amount and timing of any payments under the tax receivable agreement, will vary depending upon a number of factors, including:
the timing of exchanges—for instance, the increase in any tax deductions will vary depending on the fair value, which may fluctuate over time, of the depreciable or amortizable assets of the relevant Ares Operating Group entity at the time of each exchange;
the price of our common shares at the time of the exchange—the increase in any tax deductions, as well as the tax basis increase in other assets, of the Ares Operating Group, is proportional to the price of our common shares at the time of the exchange;
the extent to which such exchanges are taxable—if an exchange is not taxable for any reason, increased deductions will not be available; and
the amount and timing of our income—we will be required to pay 85% of the cash tax savings as and when realized, if any.
If we do not have taxable income, we are not required (absent a change of control or other circumstances requiring an early termination payment) to make payments under the tax receivable agreement for that taxable year because no cash tax savings will have been actually realized. However, any cash tax savings that do not result in realized benefits in a given tax year will likely generate tax attributes that may be utilized to generate benefits in previous or future tax years. The utilization of such tax attributes will result in payments under the tax receivables agreement.
Future payments under the tax receivable agreement in respect of subsequent exchanges are expected to be substantial. It is possible that future transactions or events could increase or decrease the actual cash tax savings realized and the corresponding tax receivable agreement payments. There may be a material negative effect on our liquidity if, as a result of timing discrepancies or otherwise, the payments under the tax receivable agreement exceed the actual cash tax savings we realize in respect of the tax attributes subject to the tax receivable agreement and/or distributions to us by the Ares Operating Group are not sufficient to permit us to make payments under the tax receivable agreement after it has paid taxes. The payments under the tax receivable agreement are not conditioned upon the TRA Recipients’ continued ownership of us or the Ares Operating Group.
In addition, the tax receivable agreement provides that upon a change of control, our obligations under the tax receivables agreement with respect to exchanged or acquired Ares Operating Group Units (whether exchanged or acquired before or after such change of control) would be accelerated based on certain assumptions, including that we would have sufficient taxable income to fully utilize the deductions arising from the increased tax deductions and tax basis and other benefits related to entering into the tax receivable agreement.
Furthermore, we may elect to terminate the tax receivable agreement early by making an immediate payment equal to the present value of the anticipated future cash tax savings. In determining such anticipated future cash tax savings, the tax receivable agreement includes several assumptions, including (1) that any Ares Operating Group Units that have not been exchanged are deemed exchanged for the market value of the common shares at the time of termination, (2) we will have sufficient taxable income in each future taxable year to fully realize all potential tax savings, (3) the tax rates for future years will be those specified in the law as in effect at the time of termination and (4) certain non‑amortizable assets are deemed disposed of within specified time periods. In addition, the present value of such anticipated future cash tax savings are discounted at a rate equal to the lesser of (i) 6.5% and (ii) LIBOR plus 100 basis points.
As a result of the change in control provisions and the early termination right, we could be required to make payments under the tax receivable agreement that are greater than or less than the specified percentage of the actual cash tax savings that we realize in respect of the tax attributes subject to the tax receivable agreement. In these situations, our obligations under the tax receivable agreement could have a substantial negative impact on our liquidity.
Decisions made by the Holdco Members in the course of running our businesses may influence the timing and amount of payments that are received by the TRA Recipients (including, among others, the Holdco Members and other executive officers) under the tax receivable agreement. For example, the earlier disposition of assets following an exchange or acquisition transaction will generally accelerate payments under the tax receivable agreement and increase the present value of such payments, and the disposition of assets before an exchange or acquisition transaction will increase the tax liability of an exchanging holder without giving rise to any rights to payments under the tax receivable agreement. As an additional example, if future holders of Ares

Operating Group Units do not become TRA Recipients, upon an exchange of Ares Operating Group Units by such future holders, current TRA Recipients (including, among others, the Holdco Members and other executive officers) will be entitled to a portion of the payments payable under the tax receivable agreement with respect to such exchanges.
Payments under the tax receivable agreement will be based on the tax reporting positions that we will determine. Although we are not aware of any issue that would cause the IRS to challenge a tax basis increase, we will not be reimbursed for any payments previously made under the tax receivable agreement with respect to a tax basis increase that is successfully challenged. As a result, in certain circumstances, payments could be made under the tax receivable agreement in excess of our cash tax savings.
Investor Rights Agreement
In connection with the initial public offering, we entered into an Investor Rights Agreement that grants Ares Owners Holdings L.P. and the Strategic Investors the right, under certain circumstances and subject to certain restrictions, to require us to register under the Securities Act common shares delivered in exchange for Ares Operating Group Units or common shares of Ares Management, L.P. otherwise held by them. In addition, we may be required to make available shelf registration statements permitting sales of common shares into the market from time to time over an extended period. Lastly, the parties to the Investor Rights Agreement have the ability to exercise certain piggyback registration rights in respect of common shares held by them in connection with registered offerings requested by other registration rights holders or initiated by us. Under the Investor Rights Agreement, the Strategic Investors have the right to observe the board meetings of our general partner, subject to an ownership threshold.
Ares Operating Group Governing Agreements
Ares Management, L.P. is a holding company and, indirectly through direct subsidiaries, controls and holds equity interests in the Ares Operating Group entities. Ares Management, L.P., either directly or through direct subsidiaries, is the general partner of each of the Ares Operating Group entities. Accordingly, Ares Management, L.P. operates and controls all of the business and affairs of the Ares Operating Group and, through the Ares Operating Group entities and their operating entity subsidiaries, conducts our businesses. Directly or through direct subsidiaries, Ares Management, L.P. has unilateral control over all of the affairs and decision making of the Ares Operating Group. Furthermore, the subsidiaries of Ares Management, L.P. cannot admit substitute general partners to the Ares Operating Group entities without the approval of Ares Management, L.P. or the relevant direct subsidiary.
Pursuant to the governing agreements of the Ares Operating Group entities, the general partner of each of the Ares Operating Group entities has the right to determine when distributions related to the common shares will be made to the partners of the Ares Operating Group entities and the amount of any such distributions. If a distribution to the common shareholders is authorized, such distribution is made to the partners of the Ares Operating Group entities pro rata in accordance with the percentages of their respective partnership units.
Each of the Ares Operating Group entities has an identical number of partnership units outstanding. As of February 15, 2018, there were 212,835,221 Ares Operating Group Units outstanding. The holders of partnership units in the Ares Operating Group entities, including Ares Management, L.P. or its direct subsidiaries, may incur U.S. federal, state and local income taxes on their proportionate share of any net taxable income of the Ares Operating Group. Net profits and net losses of the Ares Operating Group entities are allocated to their partners (including Ares Management, L.P. or its direct subsidiaries), generally pro rata in accordance with the percentages of their respective partnership units. The agreements of the Ares Operating Group entities provide for cash distributions, which we refer to as “tax distributions,” to the partners of such entities if the general partners of the Ares Operating Group entities determine that the taxable income of the relevant Ares Operating Group entity gives rise to taxable income for its partners. Generally, these tax distributions are computed based on our estimate of the net taxable income of the relevant entity multiplied by an assumed tax rate equal to the highest effective marginal combined U.S. federal, state and local income tax rate prescribed for an individual or corporate resident in Los Angeles, California or New York, New York, whichever is higher (taking into account the non‑deductibility of certain expenses and the character of our income). The Ares Operating Group makes tax distributions only to the extent distributions from such entities for the relevant year are otherwise insufficient to cover such tax liabilities.
Subject to any applicable transfer restrictions and other provisions, these partnership units may be exchanged for our common shares as described under “—Exchange Agreement” below.
Exchange Agreement

In connection with the initial public offering, we entered into an exchange agreement (which was amended and restated on April 3, 2017) with the holders of Ares Operating Group Units providing that such holders, subject to any applicable transfer restrictions, may up to four times each year (subject to the terms of the exchange agreement) exchange their Ares Operating Group Units for our common shares on a one‑for‑one basis, subject to customary conversion rate adjustments for splits, unit distributions and reclassifications, or, at our option, for cash. A holder of Ares Operating Group Units must exchange one Ares Operating Group Unit in each of the three Ares Operating Group entities to effect an exchange for a common share of Ares Management, L.P. Ares Management, L.P. holds, directly or through its subsidiaries, a number of Ares Operating Group Units equal to the number of common shares that Ares Management, L.P. has issued. As a holder exchanges its Ares Operating Group Units, Ares Management, L.P.’s direct or indirect interest in the Ares Operating Group will be correspondingly increased.
Firm Use of Our Co‑Founders’ Private Aircraft
In the normal course of business, our personnel have made use of aircraft owned by Mr. Ressler and by Messrs. Kaplan and Rosenthal together. Messrs. Ressler, Kaplan and Rosenthal paid for their purchases of the aircraft and bear all operating, personnel and maintenance costs associated with their operation for personal use. Payment by us or certain of our affiliates for the business use of these aircraft by Messrs. Ressler, Kaplan and Rosenthal and other of our personnel is generally made at market rates, which totaled $234,780 during 2017 for Mr. Ressler, and $238,954 for each of Messrs. Kaplan and Rosenthal during 2017 with respect to their shared aircraft.
Co‑Investments and Other Investment Transactions
Our senior professionals have the opportunity to invest their own capital alongside certain of our funds’ limited partners in a particular fund. Co‑investments are investments in a fund on the same terms and conditions as fund investors, except that generally these co‑investments are not subject to management fees or carried interest. These investment opportunities are available to our senior professionals and for other professionals associated with the activities of such fund whom we have determined to have a status that reasonably permits us to offer them these types of investments in compliance with applicable laws. See “Item 1. Business—Capital Invested In and Through Our Funds.”
During the year ended December 31, 2017, the following executive officers and directors (and their family members and estate planning vehicles) invested their own capital in and alongside our funds: Mr. Arougheti invested an aggregate of $2,394,224; Mr. Kaplan invested an aggregate of $6,910,670; Mr. Kissick invested an aggregate of $6,956,742; Mr. Ressler invested an aggregate of $11,280,323; Mr. Rosenthal invested an aggregate of $6,910,669; Mr. McFerran invested an aggregate of $154,763; and Mr. Weiner invested an aggregate of $619,653. During the year ended December 31, 2017, the following executive officers and directors (and their family members and estate planning vehicles) received distributions from our funds as a result of their invested capital: Mr. Arougheti received $2,969,296; Mr. Kaplan received $5,297,263; Mr. Kissick received $9,750,740; Mr. Ressler received $17,745,905; Mr. Rosenthal received $5,292,438; and Mr. Weiner received $1,209,407.
Securities of Publicly Traded Vehicles
From time to time, our managed funds, senior professionals and directors may have the opportunity to purchase securities of our publicly traded vehicles in connection with certain offerings made by such entities. During the year ended December 31, 2017, none of the entities, executive officers and directors (and their family members and estate planning vehicles) purchased the securities in these offerings. From time to time our executive officers and directors may also purchase the securities of our publicly traded funds in market transactions.
Statement of Policy Regarding Transactions with Related Persons
The audit committee of the board of directors of our general partner is charged with reviewing for approval or ratification all transactions with “related persons” (as defined in paragraph (a) of Item 404 Regulation S‑K) that are brought to the audit committee’s attention.
Indemnification
Our partnership agreement provides that in most circumstances we will indemnify the following persons, to the fullest extent permitted by law, from and against all losses, claims, damages, liabilities, joint or several, expenses (including legal fees and expenses), judgments, fines, penalties, interest, settlements or other amounts on an after tax basis: our general partner, any departing general partner, any person who is or was a tax matters partner, member, manager, officer or director of our general partner or any departing general partner, any member, manager officer or director of our general partner or any departing general partner who is or was serving at the request of our general partner or any departing general partner as a director, officer, manager,

employee, trustee, fiduciary, partner, tax matters partner, member, representative, agent or advisor of another person, any person who controls our general partner or any departing general partner, any person who is named in our Form S‑1 filed with the SEC on April 22, 2014 as being or about to become a director or of our general partner and any person our general partner in its sole discretion designates as an “indemnitee” for purposes of our partnership agreement. We have agreed to provide this indemnification unless there has been a final and non‑appealable judgment entered by a court of competent jurisdiction determining that these persons acted in bad faith or with criminal intent. We have also agreed to provide this indemnification for criminal proceedings. Any indemnification under these provisions will only be out of our assets. The general partner is not personally liable for, and does not have any obligation to contribute or loan funds or assets to us to enable it to effectuate, indemnification. We purchased insurance against liabilities asserted against and expenses incurred by persons for our activities, regardless of whether we would have the power to indemnify the person against liabilities under our partnership agreement.
Item 14.  Principal Accountant Feesand Services
The following table sets forth the aggregate fees for professional service provided by our independent registered public accounting firm, Ernst & Young LLP, for the years ended December 31, 2017 and 2016:
 For the Year Ended December 31,
 2017 2016
 The Company Ares Funds The Company Ares Funds
 (Dollars in thousands)
Audit fees(1)$3,319
 $7,841
 $3,363
 $6,739
Audit-related fees(2)701
 2,538
 
 2,704
Tax fees(3)101
 324
 70
 221
All other fees(4)18


Total$4,139
 $10,703
 $3,433
 $9,664
(1)Audit fees consisted of fees for services related to the annual audit of our consolidated financial statements, reviews of our interim consolidated financial statements on Form 10-Q, SEC registration statements, accounting consultations and services that are normally provided in connection with statutory and regulatory filings and engagements.
(2)Audit-related fees consisted of fees related to financial due diligence services in connection with internal controls readiness assessment, attestation services and agreed‑ upon procedures, as well as acquisitions of portfolio companies for investment by funds managed by the Company and the Ares Funds.
(3)Tax fees consisted of fees related to tax compliance and tax advisory services.
(4)All other fees consisted of advisory services related to regulatory matters.
In accordance with our audit committee charter, the audit committee is required to approve, in advance, all audit and non‑audit services to be provided by our independent registered public accounting firm, Ernst & Young LLP. All services reported in the Audit, Audit‑related, Tax and All other categories above were approved by the audit committee. Our audit committee charter is available on our website at www.aresmgmt.com under the “Investor Resources—Corporate Governance” section.

PART IV.

Item 15. Exhibits, Financial Statement Schedules
(a)Documents Filed with Report:
Report of Independent Registered Public Accounting Firm (PCAOB ID: 42)
Consolidated Statements of Financial Condition as of December 31, 20172023 and 2016 2022
Consolidated Statements of Operations for the years ended December 31, 2017, 20162023, 2022 and 2015 2021
Consolidated Statements of Comprehensive Income for the years ended December 31, 2017, 20162023, 2022 and 2015 2021
Consolidated Statements of Changes in Equity for the years ended December 31, 2017, 20162023, 2022 and 2015  2021
Consolidated Statements of Cash Flows for the years ended December 31, 2017, 20162023, 2022 and 2015 2021
Notes to Consolidated Financial Statements 
(b)Exhibits.
The following is a list of all exhibits filed or furnished as part of this report.
Exhibit
No.
Description
Exhibit
No.3.1
Description
Second Amended and Restated Certificate of Limited PartnershipIncorporation of Ares Management L.P.Corporation (incorporated by reference to Exhibit 3.1 to the Registrant’s AnnualQuarterly Report on Form 10-K for the year ended December 31, 201510-Q (File No. 001-36429,001-36429) filed with the SEC on February 29, 2016)November 7, 2022).
Third Amended and Restated Limited Partnership AgreementBylaws of Ares Management L.P., dated March 1, 2018.Corporation (incorporated by reference to Exhibit 99.4 to the Registrant’s Current Report on Form 8-K (File No. 001-36429) filed with the SEC on November 15, 2018).
Description of Ares Management Corporation’s Securities.
Indenture dated as of October 8, 2014 among Ares Finance Co. LLC, Ares Management, L.P., Ares Holdings Inc., Ares Domestic Holdings Inc., Ares Real Estate Holdings LLC, Ares Holdings L.P., Ares Domestic Holdings L.P., Ares Investments L.P., Ares Real Estate Holdings L.P., Ares Management LLC, Ares Investments Holdings LLC and U.S. Bank National Association, as trustee (incorporated by reference to Exhibit 4.1 to the Registrant’s Current Report on Form 8‑K8-K (File No. 001‑36429)001-36429) filed with the SEC on October 8, 2014).
First Supplemental Indenture dated as of October 8, 2014 among Ares Finance Co. LLC, Ares Management, L.P., Ares Holdings Inc., Ares Domestic Holdings Inc., Ares Real Estate Holdings LLC, Ares Holdings L.P., Ares Domestic Holdings L.P., Ares Investments L.P., Ares Real Estate Holdings L.P., Ares Management LLC, Ares Investments Holdings LLC and U.S. Bank National Association, as trustee (incorporated by reference to Exhibit 4.2 to the Registrant’s Current Report on Form 8‑K8-K (File No. 001‑36429)001-36429) filed with the SEC on October 8, 2014).
First Amendment, dated as of August 7, 2015, to the First Supplemental Indenture, dated October 8, 2014, to the indenture, dated October 8, 2014, among Ares Finance Co. LLC, the guarantors party thereto and U.S. Bank National Association, as trustee (incorporated by reference to Exhibit 10.2 to the Registrant'sRegistrant’s Current Report on Form 8-K (File No. 001-36429) filed with the SEC on August 7, 2015).
Form of 4.000% Senior Note due 2024 (incorporated by reference to Exhibit 4.34.2 to the Registrant’s Current Report on Form 8‑K8-K (File No. 001‑36429)001-36429) filed with the SEC on October 8, 2014).
Amended Form of 7.00% Series A Preferred Share Certificate.
Amended and Restated Limited Partnership Agreement of Ares Holdings L.P., dated June 8, 2016Stock Certificate (incorporated by reference to Exhibit 10.199.5 to the Registrant’s Current Report on Form 8-K (File No. 001-36429) filed with the SEC on November 15, 2018).
Indenture dated as of June 15, 2020 among Ares Finance Co. II LLC, Ares Holdings L.P., Ares Investments L.P., Ares Management LLC, Ares Investments Holdings LLC, Ares Finance Co. LLC and Ares Offshore Holdings L.P. and U.S. Bank National Association, as trustee (incorporated by reference to Exhibit 4.1 to the Registrant’s Current Report on Form 8-K (File No. 001-36429) filed with the SEC on June 9, 2016)15, 2020).
Second AmendedFirst Supplemental Indenture dated as of June 15, 2020 among Ares Finance Co. II LLC, Ares Holdings L.P., Ares Investments L.P., Ares Management LLC, Ares Investments Holdings LLC, Ares Finance Co. LLC and Restated Limited Partnership Agreement of Ares Offshore Holdings L.P. dated June 8, 2016and U.S. Bank National Association, as trustee (incorporated by reference to Exhibit 10.34.2 to the Registrant’s Current Report on Form 8-K (File No. 001-36429) filed with the SEC on June 9, 2016)15, 2020).
Amended and Restated Limited Partnership AgreementForm of Ares Investments L.P. dated June 8, 20163.250% Senior Note due 2030 (incorporated by reference to Exhibit 10.44.2 to the Registrant’s Current Report on Form 8-K (File No. 001-36429) filed with the SEC on June 9, 2016)15, 2020).
168

Exhibit
No.
Description
FormIndenture dated as of Investor Rights AgreementJune 30, 2021 among Ares Finance Co. III LLC, Ares Holdings L.P., Ares
Investments Holdings LLC, Ares Management LLC, Ares Finance Co. LLC, Ares Finance Co. II LLC and
U.S. Bank National Association, as trustee
(incorporated by reference to Exhibit 10.64.1 to the Registrant’s Registration StatementCurrent Report on Form S‑1/A8-K (File No. 333‑194919)001-36429) filed with the SEC on April 16, 2014)July 1, 2021).
Form of 4.125% Fixed Rate Resettable Subordinated Notes due 2051 incorporated by reference to Exhibit 4.1 to the Registrant’s Current Report on Form 8-K (File No. 001-36429) filed with the SEC on July 1, 2021).
Indenture dated as of January 21, 2022 among Ares Finance Co. IV LLC, Ares Holdings L.P., Ares Investments Holdings LLC, Ares Management LLC, Ares Finance Co. LLC, Ares Finance Co. II LLC, Ares Finance Co. III LLC and U.S. Bank National Association, as trustee (incorporated by reference to Exhibit 4.1 to the Registrant’s Current Report on 8-K (File No. 001-36429) filed with the SEC on January 21, 2022).
First Supplemental Indenture dated as of January 21, 2022 among Ares Finance Co. IV LLC, Ares Holdings L.P., Ares Investments Holdings LLC, Ares Management LLC, Ares Finance Co. LLC, Ares Finance Co. II LLC, Ares Finance Co. III LLC and U.S. Bank National Association, as trustee (incorporated by reference to Exhibit 4.2 to the Registrant’s Current Report on Form 8-K (File No. 001-36429) filed with the SEC on January 21, 2022).
Form of 3.650% Senior Note due 2052 (incorporated by reference to Exhibit 4.2 to the Registrant’s Current Report on Form 8-K (File No. 001-36429) filed with the SEC on January 21, 2022).
Base Indenture, dated as of November 10, 2023, by and between Ares Management Corporation and U.S. Bank Trust Company, National Association, as trustee (incorporated by reference to Exhibit 4.1 to Registrant’s Current Report on Form 8-K (File No. 001-36429) filed with the SEC on November 13, 2023).
First Supplemental Indenture, dated as of November 10, 2023, by and among Ares Management Corporation, Ares Holdings L.P., Ares Management LLC, Ares Investments Holdings LLC, Ares Finance Co. LLC, Ares Finance Co. II LLC, Ares Finance Co. III LLC and Ares Finance Co. IV LLC, as the guarantors, and U.S. Bank Trust Company, National Association, as trustee (incorporated by reference to Exhibit 4.2 to Registrant’s Current Report on Form 8-K (File No. 001-36429) filed with the SEC on November 13, 2023).
Form 6.375% Senior Notes due 2028 (incorporated by reference to Exhibit 4.2 to the Registrant’s Current Report on Form 8-K (File No. 001-36429) filed with the SEC on November 13, 2023).
Fourth Amended and Restated Limited Partnership Agreement of Ares Holdings L.P., dated April 1, 2021 (incorporated by reference to Exhibit 10.1 to the Registrant’s Annual Report on Form 10-K for the year ended December 31, 2021 (File No. 001-36429) filed with the SEC on February 28, 2022).
Investor Rights Agreement, dated November 26, 2018 (incorporated by reference to Exhibit 10.2 to the Registrant’s Annual Report on Form 10-K for the year ended December 31, 2021 (File No. 001-36429) filed with the SEC on February 28, 2022).
Third Amended & Restated 2014 Equity Incentive Plan (incorporated by reference to Exhibit 10.210.3 to the Registrant’s CurrentAnnual Report on Form 8‑K10-K for the year ended December 31, 2021 (File No. 001‑36429)001-36429) filed with the SEC on May 7, 2014)February 28, 2022). #

Exhibit
No.10.4
Description
SecondFifth Amended and Restated Exchange Agreement, dated as of April 3, 20171, 2021 (incorporated by reference to Exhibit 10.4 to the Registrant’s Annual Report on Form 10-K for the year ended December 31, 2021 (File No. 001-36429) filed with the SEC on February 28, 2022).
Fourth Amended and Restated Tax Receivable Agreement, dated May 1, 2023 (incorporated by reference to Exhibit 10.1 to the Registrant’s Quarterly Report on Form 10-Q (File No. 001-36429) filed with the SEC on May 8, 2017)2023).
Tax Receivable Agreement (incorporated by reference to Exhibit 10.1 to the Registrant’s Current Report on Form 8‑K (File No. 001‑36429) filed with the SEC on May 7, 2014).
Sixth Amended and Restated Credit Agreement, dated as of April 21, 2014, by and among Ares Holdings LLC, Ares Domestic Holdings L.P., Ares Investments LLC, Ares Real Estate Holdings L.P., the Guarantors party thereto, the Lenders party thereto and JPMorgan Chase Bank, N.A. (incorporated by reference to Exhibit 10.10 to the Registrant’s Registration Statement on Form S‑1/S-1/A (File No. 333‑194919)333-194919) filed with the SEC on April 28, 2014).
Amendment No. 1, dated as of July 15, 2014, to the Sixth Amended and Restated Senior Credit Agreement, dated as of April 21, 2014, by and among Ares Holdings LLC,L.P., Ares Domestic Holdings L.P., Ares Investments LLC,L.P., Ares Real Estate Holdings L.P., the Guarantors party thereto, the Lenders party thereto and JPMorgan Chase Bank, N.A. (incorporated by reference to Exhibit 10.1 to the Registrant’s Quarterly Report on Form 10‑Q (File No. 001‑36429)001-36429) filed with the SEC on November 12, 2014).
Amendment No. 2, dated as of September 24, 2014, to the Sixth Amended and Restated Senior Credit Agreement, dated as of April 21, 2014, by and among Ares Holdings LLC,L.P., Ares Domestic Holdings L.P., Ares Investments LLC,L.P., Ares Real Estate Holdings L.P., the Guarantors party thereto, the Lenders party thereto and JPMorgan Chase Bank, N.A. (incorporated by reference to Exhibit 10.2 to the Registrant’s Quarterly Report on Form 10‑Q (File No. 001‑36429)001-36429) filed with the SEC on November 12, 2014).
169

Exhibit
No.
Description
Amendment No. 3, dated as of July 23, 2015, to the Sixth Amended and Restated Senior Credit Agreement, dated as of April 21, 2014, by and among Ares Holdings LLC,L.P., Ares Domestic Holdings L.P., Ares Investments LLC,L.P., Ares Real Estate Holdings L.P., the Guarantors party thereto, the Lenders party thereto and JPMorgan Chase Bank, N.A. (incorporated by reference to Exhibit 10.1 to the Registrant’s Current Report on Form 8‑K (File No. 001‑36429)001-36429) filed with the SEC on July 28, 2015).
Amendment No. 4, dated as of August 5, 2015, to the Sixth Amended and Restated Senior Credit Agreement, dated as of April 21, 2014, by and among Ares Holdings LLC,L.P., Ares Domestic Holdings L.P., Ares Investments LLC,L.P., Ares Real Estate Holdings L.P., the Guarantors party thereto, the Lenders party thereto and JPMorgan Chase Bank, N.A. (incorporated by reference to Exhibit 10.1 to the Registrant’s Current Report on Form 8‑K (File No. 001‑36429)001-36429) filed with the SEC on August 7, 2015).
Amendment No. 5, dated as of December 16, 2015, to the Sixth Amended and Restated Senior Credit Agreement, dated as of April 21, 2014, by and among Ares Holdings LLC,L.P., Ares Domestic Holdings L.P., Ares Investments LLC,L.P., Ares Real Estate Holdings L.P., the Guarantors party thereto, the Lenders party thereto and JPMorgan Chase Bank, N.A. (incorporated by reference to Exhibit 10.1 to the Registrant’s Current Report on Form 8‑K (File No. 001‑36429)001-36429) filed with the SEC on December 21, 2015).
Amendment No. 6, dated as of May 23, 2016, to the Sixth Amended and Restated Senior Credit Agreement, dated as of April 21, 2014, by and among Ares Holdings LLC,L.P., Ares Domestic Holdings L.P., Ares Investments LLC,L.P., Ares Real Estate Holdings L.P., the Guarantors party thereto, the Lenders party thereto and JPMorgan Chase Bank, N.A. (incorporated by reference to Exhibit 10.1 to the Registrant’s Current Report on Form 8-K (File No. 001-36429) filed with the SEC on May 26, 2016).
Amendment No. 7, dated as of February 24, 2017, to the Sixth Amended and Restated Senior Credit Agreement, dated as of April 21, 2014, by and among Ares Holdings L.P., Ares Investments L.P., the Guarantors party thereto, the Lenders party thereto and JPMorgan Chase Bank, N.A. (incorporated by reference to Exhibit 10.15 to the Registrant’s Annual Report on Form 10-K for the year ended December 31, 2016 (File No. 001-36429,001-36429), filed with the SEC on February 27, 2017).

Amendment No. 8, dated as of March 21, 2019, to the Sixth Amended and Restated Senior Credit Agreement, dated as of April 21, 2014, by and among Ares Holdings L.P., Ares Investments L.P., the Guarantors party thereto, the Lenders party thereto and JPMorgan Chase Bank, N.A. (incorporated by reference to Exhibit 10.1 to the Registrant’s Current Report on Form 8-K (File No. 001-36429) filed with the SEC on March 26, 2019).
Amendment No. 9, dated as of March 30, 2020, to the Sixth Amended and Restated Senior Credit Agreement, dated as of April 21, 2014, by and among Ares Holdings L.P., Ares Investments L.P., the Guarantors party thereto, the Lenders party thereto and JPMorgan Chase Bank, N.A. (incorporated by reference to Exhibit 10.1 to the Registrant’s Current Report on Form 8-K (File No. 001-36429) filed with the SEC on April 1, 2020).
Amendment No. 10, dated as of March 31, 2021, to the Sixth Amended and Restated Senior Credit Agreement, dated as of April 21, 2014, by and among Ares Holdings L.P., Ares Investments L.P., the Guarantors party thereto, the Lenders party thereto and JPMorgan Chase Bank, N.A. (incorporated by reference to Exhibit 10.1 to the Registrant’s Current Report on Form 8-K (File No. 001-36429) filed with the SEC on April 2, 2021).
Restated Investment Advisory and Management Agreement between Ares Capital Corporation and Ares Capital Management LLC, dated as of June 6, 2011 (incorporated by reference to Exhibit 10.11 to the Registrant’s Registration Statement on Form S‑1/S-1/A (File No. 333‑194919)333-194919) filed with the SEC on April 16, 2014).
Form of IndemnificationSecond Amended and Restated Investment Advisory and Management Agreement, dated June 6, 2019, between Ares Capital Corporation and Ares Capital Management LLC (incorporated by reference to Exhibit 10.12exhibit 10.2 to the Registrant’s Registration StatementQuarterly Report on Form S‑1/A10-Q (File No. 333‑194919)001-36429) filed with the SEC on April 22, 2014)November 6, 2019). #
Form of Restricted Unit Agreement under the Second Amended & Restated 2014 Equity Incentive Plan (incorporated by reference to Exhibit 10.1810.2 to the Registrant’s Registration Statement on Form S-8 POS (File No. 333-225271) filed with the SEC on November 26, 2018).
Form of Option Agreement under the Second Amended & Restated 2014 Equity Incentive Plan (incorporated by reference to Exhibit 10.21 to the Registrant’s Annual Report on Form 10-K for the year ended December 31, 20162021 (File No. 001-36429,001-36429) filed with the SEC on February 27, 2017)28, 2022). #
.
Form of OptionPhantom Unit Agreement under the Second Amended & Restated 2014 Equity Incentive Plan (incorporated by reference to Exhibit 10.410.22 to the Registrant’s CurrentAnnual Report on Form 8‑K10-K for the year ended December 31, 2021 (File No. 001‑36429)001-36429) filed with the SEC on May 7, 2014)February 28, 2022). #
Form of Phantom Unit Agreement under the 2014 Equity Incentive Plan (incorporated by reference to Exhibit 10.5 to the Registrant’s Current Report on Form 8‑K (File No. 001‑36429) filed with the SEC on May 7, 2014). #
Form of ARCC Incentive Fee Award (incorporated by reference to Exhibit 10.16 to the Registrant’s Registration Statement on Form S‑1/A (File No. 333‑194919)333-194919) filed with the SEC on April 11, 2014).

170

Exhibit
No.
Description
Exhibit
Description
Form of Amended and Restated Limited Partnership Agreement of Carry Vehicles (incorporated by reference to Exhibit 10.28 to the Registrant’s Annual Report on Form 10-K for the year ended December 31, 2015 (File No. 001-36429,001-36429), filed with the SEC on February 29, 2016).
Form of Supplemental Award Agreement for Carried Interest (incorporated by reference to Exhibit 10.29 to the Registrant’s Annual Report on Form 10-K for the year ended December 31, 2015 (File No. 001-36429,001-36429), filed with the SEC on February 29, 2016).
Form of Annual Incentive Fee Award Letter (incorporated by reference to Exhibit 10.24 to the Registrant’s Annual Report on Form 10-K for the year ended December 31, 2016 (File No. 001-36429,001-36429), filed with the SEC on February 27, 2017).

Form of Annual Incentive Fee Award Letter.
Form of Deferred Restricted Unit Agreement under the Second Amended & Restated 2014 Equity Incentive Plan (incorporated by reference to Exhibit 10.2510.3 to the Registrant’s Registration Statement on Form S-8 POS (File No. 333-225271) filed with the SEC on November 26, 2018).
Form of Director Restricted Unit Agreement under the Second Amended & Restated 2014 Equity Incentive Plan (incorporated by reference to Exhibit 10.4 to the Registrant’s Registration Statement on Form S-8 POS (File No. 333-225271) filed with the SEC on November 26, 2018).
Restricted Unit Agreement, dated as of July 31, 2018, by and between Michael J Arougheti and Ares Management, L.P. (incorporated by reference to Exhibit 10.1 to the Registrant’s Quarterly Report on Form 10-Q (File No. 001-36429) filed with the SEC on August 6, 2018).
Stock Purchase Agreement, dated July 9, 2019, between GBIG Holdings, Inc. and Aspida Holdco, LLC (incorporated by reference to Exhibit 2.1 to the Registrant’s Current Report on Form 8-K (File 001-36429) filed with the SEC on July 9, 2019).
Share Purchase Agreement, dated March 27, 2020, between Sumitomo Mitsui Banking Corporation and Ares Management Corporation (incorporated by reference to Exhibit 10.1 to the Registrant’s Current Report on Form 8-K (File 001-36429) filed with the SEC on March 30, 2020).
Investor Rights Agreement, dated March 31, 2020, by and between Sumitomo Mitsui Banking Corporation and Ares Management Corporation (incorporated by reference to Exhibit 10.32 to the Registrant’s Annual Report on Form 10-K for the year ended December 31, 20162021 (File No. 001-36429,001-36429) filed with the SEC on February 27, 2017)28, 2022).
Offer Letter for Michael R. McFerran, dated March 10, 2015Form of Executive Officer Time-Based Restricted Unit Agreement under the Second Amended & Restated 2014 Equity Incentive Plan (incorporated by reference to Exhibit 10.2610.35 to the Registrant’s Annual Report on Form 10-K for the year ended December 31, 2020 (File No. 001-36429) filed with the SEC on March 20, 2015)February 25, 2021).
Form of Executive Officer Performance-Based Restricted Unit Agreement under the Second Amended & Restated 2014 Equity Incentive Plan (incorporated by reference to Exhibit 10.36 to the Registrant’s Annual Report on Form 10-K for the year ended December 31, 2020 (File No. 001-36429) filed with the SEC on February 25, 2021).
Transaction Support and Fee WaiverForm of Indemnification Agreement (incorporated by reference to Exhibit 10.35 to the Registrant’s Annual Report on Form 10-K for the year ended December 31, 2021 (File No. 001-36429) filed with the SEC on February 28, 2022).
Share Purchase Agreement, dated May 23, 2016,April 5, 2021, by and between Ares CapitalSumitomo Mitsui Banking Corporation and Ares Capital Management Corporation (incorporated by reference to Exhibit 1.2 to the Registrant’s Current Report on 8-K (File No. 001-36429) filed with SEC on April 8, 2021).
Nomination Agreement, dated February 23, 2022, by and between Ares Management Corporation and Ares Partners Holdco LLC (incorporated by reference to Exhibit 10.210.37 to the Registrant’s Annual Report on Form 10-K for the year ended December 31, 2021 (File No. 001-36429) filed with the SEC on February 28, 2022).
Amendment No. 11, dated as of March 31, 2022, to the Sixth Amended and Restated Senior Credit Agreement, dated as of April 21, 2014, by and among Ares Holdings L.P., the Guarantors party thereto, the Lenders party thereto and JPMorgan Chase Bank, N.A. (incorporated by reference to Exhibit 10.1 to the Registrant’s Current Report on Form 8-K (File No. 001-36429) filed with the SEC on May 26, 2016)April 6, 2022).
Form of Restricted Unit Agreement under the Third Amended & Restated 2014 Equity Incentive Plan.
Form of Deferred Restricted Unit Agreement under the Third Amended & Restated 2014 Equity Incentive Plan.
Ares Management Corporation 2023 Equity Incentive Plan (incorporated herein by reference to Annex B
to the Registrant’s Definitive Proxy Statement (File No. 001-36429) filed with the Commission on April
28, 2023).
171

Exhibit
No.
Description
Form of Restricted Unit Agreement under the 2023 Equity Incentive Plan (incorporated by reference to Exhibit 10.3 to the Registrant’s Registration Statement on Form S-8 (File No. 333-273232) filed with the SEC on July 13, 2023).
Form of Deferred Restricted Unit Agreement under the 2023 Equity Incentive Plan (incorporated by reference to Exhibit 10.4 to the Registrant’s Registration Statement on Form S-8 (File No. 333-273232) filed with the SEC on July 13, 2023).
Form of Director Restricted Unit Agreement under the 2023 Equity Incentive Plan (incorporated by reference to Exhibit 10.5 to the Registrant’s Registration Statement on Form S-8 (File No. 333-273232) filed with the SEC on July 13, 2023).
Form of Executive Officer Time-Based Restricted Unit Agreement under the 2023 Equity Incentive Plan (incorporated by reference to Exhibit 10.6 to the Registrant’s Registration Statement on Form S-8 (File No. 333-273232) filed with the SEC on July 13, 2023).
Form of Executive Officer Performance-Based Restricted Unit Agreement under the 2023 Equity Incentive Plan (incorporated by reference to Exhibit 10.7 to the Registrant’s Registration Statement on Form S-8 (File No. 333-273232) filed with the SEC on July 13, 2023).
Form of Annual Incentive Fee Restricted Unit Agreement under the 2023 Equity Incentive Plan.
Form of Aircraft Time Sharing Agreement.
Subsidiaries of Ares Management L.P.Corporation.
Consent of Ernst and Young LLP.
Certification of the Chief Executive Officer pursuant to Rule 13a‑14(a)13a-14(a).
Certification of the Chief Financial Officer pursuant to Rule 13a‑14(a)13a-14(a).
Certification of the Chief Executive Officer and Chief Financial Officer pursuant to 18 U.S.C. Section 1350.
Second Amended and Restated AgreementPolicy Relating to Recovery of Limited Liability Company of the General Partner of the Registrant (incorporated by reference to Exhibit 99.1 to the Registrant’s Current Report on Form 8-K (File No. 001-36429) filed with the SEC on June 9, 2016)Erroneously Awarded Compensation (Clawback Policy).
101.INS*Inline XBRL Instance Document.
101.SCH*Inline XBRL Taxonomy Extension Schema Document.
101.CAL*Inline XBRL Taxonomy Extension Calculation Linkbase Document.
101.DEF*Inline XBRL Taxonomy Extension Definition Linkbase Document.
101.LAB*Inline XBRL Taxonomy Extension Label Linkbase Document.
101.PRE*Inline XBRL Taxonomy Extension Presentation Linkbase Document.
104*Cover Page Interactive Data File - the cover page interactive data file does not appear in the Interactive Data File because its XBRL tags are embedded within the Inline XBRL document.
* Filed herewith.
** These certifications are not deemed filed by the SEC and are not to be incorporated by reference in any filing we make under the Securities Act of 1933 or the Securities Exchange Act of 1934, irrespective of any general incorporation language in any filings.
# Denotes a management contract or compensation plan or arrangement.


Item 16. Form 10-K Summary of 10-K

None.

172

SIGNATURES

Pursuant to the requirements of Section 13 or 15(d) of the Securities Exchange Act of 1934, the registrant has duly caused this report to be signed on its behalf by the undersigned, thereunto duly authorized.
ARES MANAGEMENT CORPORATION
ARES MANAGEMENT, L.P.
Dated: February 27, 2024By:
By:Ares Management GP LLC, its general partner
Dated: March 1, 2018By:/s/ Michael J Arougheti
Name:Michael J Arougheti
Title:Co‑Founder,Co-Founder, Chief Executive Officer & President (Principal Executive Officer)


173

Pursuant to the requirements of the Securities Exchange Act of 1934, this report has been signed below by the following persons on behalf of the registrant and in the capacities and on the dates indicated.

By:
By:/s/ Antony P. Ressler
Name:Antony P. ResslerDated: March 1, 2018February 27, 2024
Title:Executive Chairman & Co‑Founder Co-Founder
By:/s/ Michael J Arougheti
Name:Michael J AroughetiDated: March 1, 2018February 27, 2024
Title:Director, Co‑Founder,Co-Founder, Chief Executive Officer & President (Principal Executive Officer)
By:/s/ Jarrod Phillips
By:/s/ Michael R. McFerranName:Jarrod PhillipsDated: February 27, 2024
Name:Title:Michael R. McFerranDated: March 1, 2018
Title:Chief Financial Officer
(Principal Financial
& Chief Operating Officer (Principal Financial and Accounting Officer) 
By:/s/ R. Kipp deVeer
By:Name:R. Kipp deVeerDated: February 27, 2024
Title:Director & Head of Credit Group
By:/s/ David B. Kaplan
Name:Name:David B. KaplanDated: March 1, 2018February 27, 2024
Title:Director Co‑Founder & PartnerCo-Founder
By:/s/ John H. Kissick
Name:John H. KissickDated: March 1, 2018
Title:Director, Co‑Founder & Partner
By:/s/ Bennett Rosenthal
Name:Bennett RosenthalDated: March 1, 2018February 27, 2024
Title:Director, Co‑FounderCo-Founder & PartnerChairman of Private Equity Group
By:/s/ Ashish Bhutani
Name:Ashish BhutaniDated: February 27, 2024
By:Title:Director
By:/s/ Antoinette Bush
Name:Antoinette BushDated: February 27, 2024
Title:Director
By:/s/ Paul G. Joubert
Name:Paul G. JoubertDated: March 1, 2018February 27, 2024
Title:Director
By:/s/ Michael Lynton
Name:Michael LyntonDated: March 1, 2018February 27, 2024
Title:Director
By:/s/ Eileen Naughton
Name:Eileen NaughtonDated: February 27, 2024
By:Title:Director
By:/s/ Judy D. Olian
Name:Dr. Judy D. OlianDated: March 1, 2018February 27, 2024
Title:Director


174


INDEX TO CONSOLIDATED FINANCIAL STATEMENTS


F-1

Report of Independent Registered Public Accounting Firm

To the Stockholders and the Board of Directors and Unitholders of Ares Management L.P.Corporation
 
Opinion on the Financial Statements


We have audited the accompanying consolidated statements of financial condition of Ares Management L.P.Corporation (the “Company”)Company) as of December 31, 20172023 and 2016,2022, the related consolidated statements of operations, comprehensive income, changes in equity and cash flows for each of the three years in the period ended December 31, 2017,2023, and the related notes (collectively referred to as the “consolidated financial statements”). In our opinion, the consolidated financial statements present fairly, in all material respects, the financial position of the Company at December 31, 20172023 and 2016,2022, and the results of its operations and its cash flows for each of the three years in the period ended December 31, 2017,2023, in conformity with U.S. generally accepted accounting principles.


We also have audited, in accordance with the standards of the Public Company Accounting Oversight Board (United States) (“PCAOB”)(PCAOB), the Company'sCompany’s internal control over financial reporting as of December 31, 2017,2023, based on criteria established in Internal Control-IntegratedControl—Integrated Framework issued by the Committee of Sponsoring Organizations of the Treadway Commission (2013 framework), and our report dated March 1, 2018February 27, 2024 expressed an unqualified opinion thereon.


Basis for Opinion


These financial statements are the responsibility of the Company's management. Our responsibility is to express an opinion on the Company’s financial statements based on our audits. We are a public accounting firm registered with the PCAOB and are required to be independent with respect to the Company in accordance with the U.S. federal securities laws and the applicable rules and regulations of the Securities and Exchange Commission and the PCAOB.


We conducted our audits in accordance with the standards of the PCAOB. Those standards require that we plan and perform the audit to obtain reasonable assurance about whether the financial statements are free of material misstatement, whether due to error or fraud. Our audits included performing procedures to assess the risks of material misstatement of the financial statements, whether due to error or fraud, and performing procedures that respond to those risks. Such procedures included examining, on a test basis, evidence regarding the amounts and disclosures in the financial statements. Our audits also included evaluating the accounting principles used and significant estimates made by management, as well as evaluating the overall presentation of the financial statements. We believe that our audits provide a reasonable basis for our opinion.


Critical Audit Matter

The critical audit matter communicated below is a matter arising from the current period audit of the financial statements that was communicated or required to be communicated to the audit committee and that: (1) relates to accounts or disclosures that are material to the financial statements and (2) involved our especially challenging, subjective or complex judgments. The communication of the critical audit matter does not alter in any way our opinion on the consolidated financial statements, taken as a whole, and we are not, by communicating the critical audit matter below, providing a separate opinion on the critical audit matter or on the accounts or disclosures to which it relates.

F-2

Valuation of underlying investments of equity method investments

Description of the Matter
At December 31, 2023, the carrying value of the Company’s investments totaled $4,624.9 million, primarily consisting of equity method private investment partnership interests - principal of $535.3 million and equity method - carried interest of $3,413.0 million. As discussed further in Note 2. Summary of Significant Accounting Policies to the consolidated financial statements, the underlying investments of the Company’s equity method investments (“underlying investments”) are reported at fair value as determined by management by applying the valuation techniques and using the significant unobservable inputs described therein.

Auditing management’s determination of the fair value of the underlying investments that are valued using significant unobservable inputs is complex and involves a high degree of auditor subjectivity to address the higher estimation uncertainty.
How We Addressed the Matter
in Our Audit
We obtained an understanding, evaluated the design and tested the operating effectiveness of controls over the Company’s investment valuation process for the underlying investments. This included management’s review controls over the assessment of the valuation techniques and significant unobservable inputs used to estimate the fair value of the underlying investments and management’s review of the completeness and accuracy of the data used in these estimates.

Our audit procedures included, among others, evaluating, on a sample basis, the valuation techniques and significant unobservable inputs used by the Company in valuing the underlying investments and testing, on a sample basis, the mathematical accuracy of the related valuation models.

For example, for a sample of underlying investments that were valued using the market approach, we performed procedures to evaluate the appropriateness of significant unobservable inputs such as the selected earnings before interest, taxes, depreciation and amortization multiples or revenue multiples that were derived from comparable companies. These procedures included assessing the appropriateness of management’s determination of the comparable companies, and, where applicable, comparing the selected multiples to market observed transactions of such companies. For a sample of underlying investments that were valued using the discounted cash flow valuation technique, we performed procedures to evaluate the appropriateness of significant unobservable inputs such as the selected discount rates and projections of future cash flows. These procedures included comparing the selected discount rates to market data and/or recalculating these discount rates using investee specific information, such as the weighted average cost of capital. In addition, these procedures included comparing future projections to the current performance and the historical growth rates of the investees as well as to the growth rates of publicly traded comparable companies.

In some instances, with the involvement of our valuation specialists, we independently developed fair value estimates using investee specific and market information and compared our estimates to the fair value of the underlying investments. We searched for and evaluated information that corroborated or contradicted the significant unobservable inputs. We also evaluated subsequent events and transactions and considered whether they corroborated or contradicted the year-end valuations.


/s/ Ernst & Young LLP

We have served as the Company’s auditor since 2011.

Los Angeles, California
March 1, 2018February 27, 2024

F-3


Ares Management L.P.Corporation
Consolidated Statements of Financial Condition

(Amounts in Thousands, Except
UnitShareData)
 As of December 31,
 2017 2016
Assets 
  
Cash and cash equivalents$118,929
 $342,861
Investments647,335
 468,471
Performance fees receivable1,099,847
 759,099
Due from affiliates165,750
 162,936
Deferred tax asset, net8,326
 6,731
Other assets107,730
 65,565
Intangible assets, net40,465
 58,315
Goodwill143,895
 143,724
Assets of Consolidated Funds:   
Cash and cash equivalents556,500
 455,280
Investments, at fair value5,582,842
 3,330,203
Due from affiliates15,884
 3,592
Dividends and interest receivable12,568
 8,479
Receivable for securities sold61,462
 21,955
Other assets1,989
 2,501
Total assets$8,563,522
 $5,829,712
Liabilities   
Accounts payable, accrued expenses and other liabilities$81,955
 $83,336
Accrued compensation27,978
 131,736
Due to affiliates14,642
 17,564
Performance fee compensation payable846,626
 598,050
Debt obligations616,176
 305,784
Liabilities of Consolidated Funds:   
Accounts payable, accrued expenses and other liabilities64,316
 21,056
Payable for securities purchased350,145
 208,742
CLO loan obligations, at fair value4,963,194
 3,031,112
Fund borrowings138,198
 55,070
Total liabilities7,103,230
 4,452,450
Commitments and contingencies
 
Preferred equity (12,400,000 units issued and outstanding at December 31, 2017 and 2016)298,761
 298,761
Non-controlling interest in Consolidated Funds528,488
 338,035
Non-controlling interest in Ares Operating Group entities358,186
 447,615
Controlling interest in Ares Management, L.P.: 
  
Partners' Capital (82,280,033 units and 80,814,732 units, issued and outstanding at December 31, 2017 and 2016, respectively)279,065
 301,790
Accumulated other comprehensive (benefit) loss, net of tax(4,208) (8,939)
Total controlling interest in Ares Management, L.P.274,857
 292,851
Total equity1,460,292
 1,377,262
Total liabilities, non-controlling interests and equity$8,563,522
 $5,829,712
As of December 31,
20232022
Assets 
Cash and cash equivalents$348,274 $389,987 
Investments (includes accrued carried interest of $3,413,007 and $3,106,577 as of December 31, 2023 and 2022, respectively)4,624,932 3,974,734 
Due from affiliates896,746 758,472 
Other assets429,979 381,137 
Right-of-use operating lease assets249,326 155,950 
Intangible assets, net1,058,495 1,208,220 
Goodwill1,123,976 999,656 
Assets of Consolidated Funds:
Cash and cash equivalents1,149,511 724,641 
Investments held in trust account523,038 1,013,382 
Investments, at fair value14,078,549 12,191,251 
Due from affiliates14,151 15,789 
Receivable for securities sold146,851 124,050 
Other assets86,672 65,570 
Total assets$24,730,500 $22,002,839 
Liabilities  
Accounts payable, accrued expenses and other liabilities$233,884 $231,921 
Accrued compensation287,259 510,130 
Due to affiliates240,254 252,798 
Performance related compensation payable2,514,610 2,282,209 
Debt obligations2,965,480 2,273,854 
Operating lease liabilities319,572 190,616 
Liabilities of Consolidated Funds:
Accounts payable, accrued expenses and other liabilities189,523 168,286 
Due to affiliates3,554 4,037 
Payable for securities purchased484,117 314,193 
CLO loan obligations, at fair value12,345,657 10,701,720 
Fund borrowings125,241 168,046 
Total liabilities19,709,151 17,097,810 
Commitments and contingencies
Redeemable interest in Consolidated Funds522,938 1,013,282 
Redeemable interest in Ares Operating Group entities24,098 93,129 
Non-controlling interests in Consolidated Funds1,258,445 1,074,356 
Non-controlling interests in Ares Operating Group entities1,322,469 1,135,023 
Stockholders’ Equity
Class A common stock, $0.01 par value, 1,500,000,000 shares authorized (187,069,907 shares and 173,892,036 shares issued and outstanding as of December 31, 2023 and 2022, respectively)1,871 1,739 
Non-voting common stock, $0.01 par value, 500,000,000 shares authorized (3,489,911 shares issued and outstanding as of December 31, 2023 and 2022)35 35 
Class B common stock, $0.01 par value, 1,000 shares authorized (1,000 shares issued and outstanding as of December 31, 2023 and 2022)  
Class C common stock, $0.01 par value, 499,999,000 shares authorized (117,024,758 shares and 117,231,288 shares issued and outstanding as of December 31, 2023 and 2022, respectively)1,170 1,172 
Additional paid-in-capital2,391,036 1,970,754 
Accumulated deficit(495,083)(369,475)
Accumulated other comprehensive loss, net of tax(5,630)(14,986)
Total stockholders’ equity1,893,399 1,589,239 
Total equity4,474,313 3,798,618 
Total liabilities, redeemable interest, non-controlling interests and equity$24,730,500 $22,002,839 
See accompanying notes to the consolidated financial statements.

F-4

Ares Management L.P.Corporation
Consolidated Statements of Operations
(Amounts in Thousands, Except UnitShare Data)
 Year ended December 31,
 202320222021
Revenues
Management fees$2,551,150 $2,136,433 $1,611,047 
Carried interest allocation618,579 458,012 2,073,551 
Incentive fees276,627 301,187 332,876 
Principal investment income36,516 12,279 99,433 
Administrative, transaction and other fees149,012 147,532 95,184 
Total revenues3,631,884 3,055,443 4,212,091 
Expenses
Compensation and benefits1,486,698 1,498,590 1,162,633 
Performance related compensation607,522 518,829 1,740,786 
General, administrative and other expenses660,146 695,256 444,178 
Expenses of Consolidated Funds43,492 36,410 62,486 
Total expenses2,797,858 2,749,085 3,410,083 
Other income (expense)
Net realized and unrealized gains on investments77,573 4,732 19,102 
Interest and dividend income19,276 9,399 9,865 
Interest expense(106,276)(71,356)(36,760)
Other income, net4,819 13,119 14,402 
Net realized and unrealized gains on investments of Consolidated Funds262,700 73,386 77,303 
Interest and other income of Consolidated Funds995,545 586,529 437,818 
Interest expense of Consolidated Funds(754,600)(411,361)(258,048)
Total other income, net499,037 204,448 263,682 
Income before taxes1,333,063 510,806 1,065,690 
Income tax expense172,971 71,891 147,385 
Net income1,160,092 438,915 918,305 
Less: Net income attributable to non-controlling interests in Consolidated Funds274,296 119,333 120,369 
Net income attributable to Ares Operating Group entities885,796 319,582 797,936 
Less: Net income (loss) attributable to redeemable interest in Ares Operating Group entities226 (851)(1,341)
Less: Net income attributable to non-controlling interests in Ares Operating Group entities411,244 152,892 390,440 
Net income attributable to Ares Management Corporation474,326 167,541 408,837 
Less: Series A Preferred Stock dividends paid  10,850 
Less: Series A Preferred Stock redemption premium  11,239 
Net income attributable to Ares Management Corporation Class A and non-voting common stockholders$474,326 $167,541 $386,748 
Net income per share of Class A and non-voting common stock:
Basic$2.44 $0.87 $2.24 
Diluted$2.42 $0.87 $2.15 
Weighted-average shares of Class A and non-voting common stock:
Basic184,523,524 175,510,798 163,703,626 
Diluted195,773,426 175,510,798 180,112,271 
 For the Years Ended December 31,
 2017 2016 2015
      
Revenues     
Management fees (includes ARCC Part I Fees of $105,467, $121,181 and $121,491 for the years ended December 31, 2017, 2016 and 2015, respectively)$722,419
 $642,068
 $634,399
Performance fees636,674
 517,852
 150,615
Administrative, transaction and other fees56,406
 39,285
 29,428
Total revenues1,415,499
 1,199,205
 814,442
Expenses     
Compensation and benefits514,109
 447,725
 414,454
Performance fee compensation479,722
 387,846
 111,683
General, administrative and other expenses196,730
 159,776
 224,798
Transaction support expense275,177
 
 
Expenses of Consolidated Funds39,020
 21,073
 18,105
Total expenses1,504,758
 1,016,420
 769,040
Other income (expense)     
Net realized and unrealized gain on investments67,034
 28,251
 17,009
Interest and dividend income12,715
 23,781
 14,045
Interest expense(21,219) (17,981) (18,949)
Debt extinguishment expense
 
 (11,641)
Other income, net19,470
 35,650
 21,680
Net realized and unrealized gain (loss) on investments of Consolidated Funds100,124
 (2,057) (24,616)
Interest and other income of Consolidated Funds187,721
 138,943
 117,373
Interest expense of Consolidated Funds(126,727) (91,452) (78,819)
Total other income239,118
 115,135
 36,082
Income before taxes149,859

297,920

81,484
Income tax (benefit) expense(23,052) 11,019
 19,064
Net income172,911
 286,901
 62,420
Less: Net income (loss) attributable to non-controlling interests in Consolidated Funds60,818
 3,386
 (5,686)
Less: Net income attributable to redeemable interests in Ares Operating Group entities
 456
 338
Less: Net income attributable to non-controlling interests in Ares Operating Group entities35,915
 171,251
 48,390
Net income attributable to Ares Management, L.P.76,178

111,808

19,378
Less: Preferred equity distributions paid21,700
 12,176
 
Net income attributable to Ares Management, L.P. common unitholders$54,478

$99,632

$19,378
Net income attributable to Ares Management, L.P. per common unit: 
  
  
Basic$0.62
 $1.22
 $0.23
Diluted$0.62
 $1.20
 $0.23
Weighted-average common units: 
  
  
Basic81,838,007
 80,749,671
 80,673,360
Diluted81,838,007
 82,937,030
 80,673,360
Distribution declared and paid per common unit$1.13
 $0.83
 $0.88


Substantially all revenue is earned from affiliated funds of the Company.
See accompanying notes to the consolidated financial statements.

F-5

Ares Management L.P.Corporation
Consolidated Statements of Comprehensive Income
(Amounts in Thousands)
Year ended December 31,
For the Years Ended December 31,
2017 2016 2015
Net income$172,911
 $286,901
 $62,420
Other comprehensive income:     
Net income
Net income
Foreign currency translation adjustments, net of tax
Foreign currency translation adjustments, net of tax13,927
 (15,754) (8,638)
Total comprehensive income186,838
 271,147
 53,782
Less: Comprehensive income (loss) attributable to non-controlling interests in Consolidated Funds62,165
 3,336
 (5,834)
Less: Comprehensive income attributable to redeemable interests in Ares Operating Group entities
 409
 302
Total comprehensive income
Less: Comprehensive income attributable to non-controlling interests in Consolidated Funds
Less: Comprehensive income (loss) attributable to redeemable interest in Ares Operating Group entities
Less: Comprehensive income attributable to non-controlling interests in Ares Operating Group entities43,764
 159,914
 43,169
Comprehensive income attributable to Ares Management, L.P.$80,909

$107,488

$16,145
Less: Comprehensive income attributable to non-controlling interests in Ares Operating Group entities
Comprehensive income attributable to Ares Management Corporation
See accompanying notes to the consolidated financial statements.

F-6


Ares Management L.P.Corporation
Consolidated Statements of Changes in Equity 
(Amounts in Thousands)
Series A Preferred StockClass A Common StockNon- voting
Common Stock
Class C Common StockAdditional Paid-in-CapitalAccumulated DeficitAccumulated
Other
Comprehensive
Income (Loss)
Non-Controlling
Interest in
Ares Operating
Group Entities
Non-Controlling
Interest in Consolidated
Funds
Total
Equity
Balance as of December 31, 2020$298,761 $1,472 $ $1,124 $1,043,669 $(151,824)$483 $738,369 $539,720 $2,471,774 
Changes in ownership interests and related tax benefits— 70 — (25)(133,289)— — (97,735)13,487 (217,492)
Issuances of common stock— 122 35 — 827,273 — — — — 827,430 
Capital contributions— — — 87 — — — 539,020 33,644 572,751 
Redemption of preferred stock(310,000)— — — — — — — — (310,000)
Dividends/distributions(10,850)— — — — (324,306)— (269,200)(98,897)(703,253)
Net income22,089 — — — — 386,748 — 390,440 120,369 919,646 
Currency translation adjustment, net of tax— — — — — — (2,338)(1,628)(16,871)(20,837)
Equity compensation— — — — 138,710 — — 98,481 — 237,191 
Stock option exercises— 20 — — 37,196 — — — — 37,216 
Balance as of December 31, 2021 1,684 35 1,186 1,913,559 (89,382)(1,855)1,397,747 591,452 3,814,426 
Changes in ownership interests and related tax benefits— 43 — (14)(96,413)— — (105,680)4,006 (198,058)
Issuances of common stock— — — 12,834 — — — — 12,835 
Capital contributions— — — — — — — 5,195 549,396 554,591 
Dividends/distributions— — — — — (447,634)— (386,843)(178,291)(1,012,768)
Net income— — — — — 167,541 — 152,892 119,333 439,766 
Currency translation adjustment, net of tax— — — — — — (13,131)(8,814)(11,540)(33,485)
Equity compensation— — — — 119,580 — — 80,526 — 200,106 
Stock option exercises— 11 — — 21,194 — — — — 21,205 
Balance as of December 31, 2022 1,739 35 1,172 1,970,754 (369,475)(14,986)1,135,023 1,074,356 3,798,618 
Changes in ownership interests and related tax benefits— 59 — (2)(60,755)— — 93,956 (313,781)(280,523)
Issuances of common stock— 26 — — 239,519 — — — — 239,545 
Capital contributions— — — — — — — 3,887 320,185 324,072 
Dividends/distributions— — — — — (599,934)— (427,849)(101,128)(1,128,911)
Net income— — — — — 474,326 — 411,244 274,296 1,159,866 
Currency translation adjustment, net of tax— — — — — — 9,356 6,023 4,517 19,896 
Equity compensation— — — — 155,606 — — 100,185 — 255,791 
Stock option exercises— 47 — — 85,912 — — — — 85,959 
Balance as of December 31, 2023$ $1,871 $35 $1,170 $2,391,036 $(495,083)$(5,630)$1,322,469 $1,258,445 $4,474,313 

               
 Preferred Equity 
Partners'
Capital
 
Accumulated
Other
Comprehensive
Income (Loss)
  
Non-controlling
interest in Ares
Operating
Group Entities
 Equity Appropriated for Consolidated Funds 
Non-Controlling
Interest in
Consolidated
Funds
 
Total 
Equity
Balance at December 31, 2014$
 $285,025
 $(1,386)  $463,493
 $(37,926) $4,988,729
 $5,697,935
Cumulative effect of accounting change due to the adoption of ASU 2015-02


 25,352
 (4,651,189) (4,625,837)
Relinquished with deconsolidation of funds


 1,652
 1,652
Changes in ownership interests
 7,280
 
  (7,362) 
 
 (82)
Deferred tax liabilities arising from allocation of contributions and Partners' capital
 (735) 
  (97) 
 
 (832)
Contributions
 
 
  85
 
 88,567
 88,652
Issuance of AOG Units in connection with acquisitions
 
 
  25,468
 
 
 25,468
Distributions
 (70,999) 
  (145,763) 
 (85,746) (302,508)
Net income (loss)
 19,378
 
  48,390
 16,089
 (21,775) 62,082
Currency translation adjustment
 
 (3,233)  (5,221) (148) 
 (8,602)
Equity compensation
 11,588
 
  18,890
 
 
 30,478
Balance at December 31, 2015
 251,537
 (4,619)  397,883
 3,367
 320,238
 968,406
Cumulative effect of accounting change due to the adoption of ASU 2014-13


 (3,367) 
 (3,367)
Issuance of preferred equity298,761


 298,761
Changes in ownership interests
 1,446
 
  (2,327) 
 
 (881)
Reallocation of equity due to redemption of ownership interest
 1,276
 
  2,061
 
 
 3,337
Deferred tax assets effects arising from allocation of Partners' capital
 724
 
  3
 
 
 727
Contributions


 132,932
 132,932
Distributions(12,176) (67,041) 
  (132,961) 
 (118,471) (330,649)
Net income12,176
 99,632
 
  171,251
 
 3,386
 286,445
Currency translation adjustment
 
 (4,320)  (11,337) 
 (50) (15,707)
Equity compensation
 14,216
 
  23,042
 
 
 37,258
Balance at December 31, 2016298,761
 301,790

(8,939)

447,615


338,035

1,377,262
Changes in ownership interests
 (5,370) 
  (10,286) 
 
 (15,656)
Deferred tax liabilities effects arising from allocation of Partners' capital  (6,609)    89
     (6,520)
Contributions
 1,036
 
  4,213
 
 190,154
 195,403
Distributions(21,700) (92,587) 
  (169,069) 
 (61,866) (345,222)
Net income21,700
 54,478
 
  35,915
 
 60,818
 172,911
Currency translation adjustment
 
 4,731
  7,849
 
 1,347
 13,927
Equity compensation
 26,327
 
  41,860
 
 
 68,187
Balance at December 31, 2017$298,761
 $279,065
 $(4,208)  $358,186
 $
 $528,488
 $1,460,292

See accompanying notes to the consolidatedfinancial statements.


F-7

Ares Management L.P.Corporation
Consolidated Statements of Cash Flows
(Amounts in Thousands)
 For the Years Ended December 31,
 2017 2016 2015
      
Cash flows from operating activities:     
Net income$172,911
 $286,901
 $62,420
Adjustments to reconcile net income to net cash provided by (used in) operating activities: 
  
  
Equity compensation expense69,711
 39,065
 32,244
Depreciation and amortization32,809
 37,455
 55,275
Debt extinguishment expenses
 
 11,641
Net realized and unrealized gain on investments(67,034) (28,251) (17,009)
Contingent consideration(20,156) (17,674) (21,064)
Other non-cash amounts(1,731) 
 10
Investments purchased(257,295) (120,413) (150,231)
Proceeds from sale of investments154,278
 145,439
 59,979
Allocable to non-controlling interests in Consolidated Funds: 
  
  
Receipt of non-cash interest income and dividends from investments(453) (7,720) (8,288)
Net realized and unrealized (gain) loss on investments(100,124) 2,057
 24,616
Amortization on debt and investments(4,017) (4,566) (1,197)
Investments purchased(4,058,936) (2,263,891) (1,643,079)
Proceeds from sale or pay down of investments2,303,315
 1,498,398
 1,049,765
Cash flows due to changes in operating assets and liabilities: 
  
  
Net performance fees receivable(90,444) (28,306) 20,611
Due to/from affiliates(2,483) (26,000) 8,017
Other assets(28,674) (162) 32,232
Accrued compensation and benefits(105,109) 9,181
 (6,028)
Accounts payable, accrued expenses and other liabilities14,559
 5,328
 (37,194)
Deferred taxes(8,112) (28,463) 1,427
Allocable to non-controlling interest in Consolidated Funds: 
  
  
Change in cash and cash equivalents held at Consolidated Funds(101,224) (295,769) 1,154,889
Cash acquired/relinquished with consolidation/deconsolidation of Consolidated Funds198,297
 
 (870,390)
Change in other assets and receivables held at Consolidated Funds(48,837) 3,872
 (1,444)
Change in other liabilities and payables held at Consolidated Funds85,654
 167,864
 (285,188)
Net cash used in operating activities(1,863,095) (625,655) (527,986)
Cash flows from investing activities: 
  
  
Acquisitions, net of cash acquired
 
 (64,437)
Purchase of furniture, equipment and leasehold improvements, net(33,160) (11,913) (10,676)
Net cash used in investing activities(33,160) (11,913) (75,113)
Cash flows from financing activities: 
  
  
Proceeds from debt issuance, net of offering costs
 
 316,449
Proceeds from credit facility455,000
 147,000
 185,000
Proceeds from term notes100,459
 26,036
 35,250
Repayments of credit facility(245,000) (257,000) (75,000)
Repayments of term notes
 
 (328,250)
Contributions4,213
 
 
Proceeds from the issuance of preferred equity, net of issuance costs
 298,761
 
Distributions (261,656) (200,663) (217,760)
Preferred equity distributions(21,700) (12,176) 
Redemption of redeemable interest and put option liability
 (40,000) 
Taxes paid in net settlement of vested common units(14,308) 
 
Stock option exercise1,036
 
 
Tax from share-based payment81
 
 
Other financing activities(1,394) (701) 85
Allocable to non-controlling interest in Consolidated Funds: 
  
  
Contributions from non-controlling interests in Consolidated Funds190,154
 132,932
 88,567
Distributions to non-controlling interests in Consolidated Funds(61,866) (118,471) (85,746)
Borrowings under loan obligations by Consolidated Funds2,949,949
 1,621,514
 763,811
Repayments under loan obligations by Consolidated Funds(1,440,010) (716,468) (100,869)
Net cash provided by financing activities1,654,958
 880,764
 581,537
Effect of exchange rate changes17,365
 (21,818) (5,813)
Net change in cash and cash equivalents(223,932)
221,378

(27,375)
Cash and cash equivalents, beginning of period342,861
 121,483
 148,858
Cash and cash equivalents, end of period$118,929
 $342,861
 $121,483
Supplemental information: 
  
  
Ares Management, L.P. and consolidated subsidiaries: 
  
  
Cash paid during the period for interest$17,222
 $15,390
 $15,792
Cash paid during the period for income taxes$18,034
 $26,402
 $13,587
Consolidated Funds: 
  
  
Cash paid during the period for interest$76,889
 $53,704
 $43,894
Cash paid during the period for income taxes$145
 $378
 $1,057
Non-cash increase in assets and liabilities: 
  
  
Issuance of AOG Units to non-controlling interest holders in connection with acquisitions$
 $
 $25,468
 Year ended December 31,
 202320222021
Cash flows from operating activities:  
Net income$1,160,092 $438,915 $918,305 
Adjustments to reconcile net income to net cash used in operating activities:
Equity compensation expense255,965 200,391 237,191 
Depreciation and amortization231,712 341,341 113,293 
Net realized and unrealized (gains) losses on investments(90,737)10,929 (88,978)
Other non-cash amounts74 — (31,070)
Investments purchased(507,932)(371,124)(340,199)
Proceeds from sale of investments206,163 182,493 273,382 
Adjustments to reconcile net income to net cash used in operating activities allocable to non-controlling interests in Consolidated Funds:
Net realized and unrealized gains on investments(262,700)(73,386)(77,303)
Other non-cash amounts(101,465)(33,822)(35,879)
Investments purchased(8,847,856)(9,434,029)(13,067,564)
Proceeds from sale of investments8,149,617 8,198,812 9,970,609 
Cash flows due to changes in operating assets and liabilities:
Net carried interest and incentive fees receivable(48,858)(20,612)(745,021)
Due to/from affiliates(220,421)39,073 (180,928)
Other assets21,532 (105,205)213,825 
Accrued compensation and benefits20,383 200,769 142,815 
Accounts payable, accrued expenses and other liabilities27,864 (51,685)125,168 
Cash flows due to changes in operating assets and liabilities allocable to redeemable and non-controlling interest in Consolidated Funds:
Change in cash and cash equivalents held at Consolidated Funds(424,870)324,550 (526,815)
Net cash relinquished with consolidation/deconsolidation of Consolidated Funds(623)— (39,539)
Change in other assets and receivables held at Consolidated Funds(20,247)151,895 (180,953)
Change in other liabilities and payables held at Consolidated Funds219,046 (733,417)723,616 
Net cash used in operating activities(233,261)(734,112)(2,596,045)
Cash flows from investing activities:  
Purchase of furniture, equipment and leasehold improvements, net of disposals(67,183)(35,796)(27,226)
Acquisitions, net of cash acquired(43,896)(301,583)(1,057,407)
Net cash used in investing activities(111,079)(337,379)(1,084,633)
Cash flows from financing activities:  
Net proceeds from issuance of Class A and non-voting common stock— — 827,430 
Proceeds from Credit Facility1,410,000 1,380,000 883,000 
Proceeds from issuance of senior and subordinated notes499,010 488,915 450,000 
Repayments of Credit Facility(1,215,000)(1,095,000)(468,000)
Dividends and distributions (1,030,666)(836,364)(593,506)
Series A Preferred Stock dividends— — (10,850)
Redemption of Series A Preferred Stock— — (310,000)
Stock option exercises85,959 21,205 37,216 
Taxes paid related to net share settlement of equity awards(157,007)(201,311)(226,101)
Other financing activities2,943 4,055 11,509 
Allocable to redeemable and non-controlling interests in Consolidated Funds:
Contributions from redeemable and non-controlling interests in Consolidated Funds855,456 549,396 1,033,644 
Distributions to non-controlling interests in Consolidated Funds(101,128)(178,291)(98,897)
Redemptions of redeemable interests in Consolidated Funds(1,045,874)— — 
Borrowings under loan obligations by Consolidated Funds1,387,297 1,140,680 2,048,932 
Repayments under loan obligations by Consolidated Funds(398,864)(145,222)(80,752)
Net cash provided by financing activities292,126 1,128,063 3,503,625 
Effect of exchange rate changes10,501 (10,240)(19,104)
Net change in cash and cash equivalents(41,713)46,332 (196,157)
Cash and cash equivalents, beginning of period389,987 343,655 539,812 
Cash and cash equivalents, end of period$348,274 $389,987 $343,655 
Supplemental disclosure of non-cash financing activities:
Issuance of AOG Units and Class A common stock in connection with acquisition-related activities$239,545 $12,835 $510,848 
Issuance of AOG Units in connection with settlement of management incentive program$245,647 $— $— 
Supplemental disclosure of cash flow information:
Cash paid during the period for interest$722,643 $320,329 $205,085 
Cash paid during the period for income taxes$62,007 $104,864 $22,788 
See accompanying notes to the consolidated financial statements.

F-7
F-8

Ares Management L.P.Corporation
Notes to the Consolidated Financial Statements
(Dollars in Thousands, Except UnitShare Data and As Otherwise Noted)


1. ORGANIZATION AND BASIS OF PRESENTATION 
Ares Management L.P. ("the Company"Corporation (the “Company”), a Delaware limited partnership,corporation, together with its subsidiaries, is a leading global alternative asset management firm that operates three distinct but complementary investment groups: themanager operating integrated groups across Credit, Group, the Private Equity, GroupReal Assets and the Real Estate Group. Secondaries. Information about segments should be read together with Note 18, “Segment“Note 14. Segment Reporting.” Subsidiaries of the Company serve as the general partners and/or investment managers to various investment funds and managed accounts within each investment group (the “Ares Funds”), which are generally organized as pass‑through entities for income tax purposes. Such. These subsidiaries provide investment advisory services to the Ares Funds in exchange for management fees. Ares is managed and operated by its general partner, Ares Management GP LLC. Unless the context requires otherwise, references to “Ares” or the “Company” refer to Ares Management, L.P. together with its subsidiaries.

The accompanying audited financial statements include the consolidated results of the Company and its subsidiaries. The Company is a holding company and the Company’s sole assets are equity interests in Ares Holdings Inc. (“AHI”), Ares Offshore Holdings, Ltd., and Ares AI Holdings L.P. In this annual report, the following of the Company’s subsidiaries are collectively referred to as the “Ares Operating Group”: Ares Offshore Holdings L.P. (“Ares Offshore”), Ares Holdings L.P. (“Ares Holdings”), and Ares Investments L.P. (“Ares Investments”). The Company, indirectly through its wholly owned subsidiaries, is the general partner of each of the Ares Operating Group entities. The Companythat operates and controls all of the businesses and affairs of and conducts all of its material business activities through Ares Holdings L.P. (“Ares Holdings”). Ares Holdings represents all the activities of the “Ares Operating Group” or “AOG” and may be referred to interchangeably. The Company, indirectly through its wholly owned subsidiary, Ares Holdco LLC, is the general partner of the Ares Operating Group.Group entity.
In addition, certain Ares-affiliated funds, related co-investment entities and collateralized loan obligations (“CLOs”) (collectively, the “Consolidated Funds”) managed by Ares Management LLC (“AM LLC”)
The Company and its wholly owned subsidiaries manages or controls certain entities that have been consolidated in the accompanying financial statements for the periods presented as described in Note 2, “Summary“Note 2. Summary of Significant Accounting Policies.” These entities include Ares funds, co-investment vehicles, collateralized loan obligations or funds (collectively “CLOs”) and special purpose acquisition companies (“SPACs”) (collectively, the “Consolidated Funds”).

Including the results of the Consolidated Funds significantly increases the reported amounts of the assets, liabilities, revenues, expenses and cash flows inwithin the accompanying consolidated financial statements; however,statements. However, the Consolidated Funds results included herein have no direct effect on the net income attributable to controlling interestsAres Management Corporation or to its Stockholders’ Equity, except where accounting for a redemption or liquidation preference requires the reallocation of ownership based on total controlling equity.specific terms of a profit sharing agreement. Instead, economic ownership interests of the investors in the Consolidated Funds are reflected as redeemable and non-controlling interests in Consolidated Funds and as equity appropriated for Consolidated Funds in the accompanying consolidated financial statements.Funds. Further, cash flows allocable to redeemable and non-controlling interest in Consolidated Funds are specifically identifiable inwithin the Consolidated Statements of Cash Flows.
Change in Company Structure
In July 2016, the Company simplified its existing structure and Domestic Holdings was merged with and into AHI, Ares Domestic was merged with and into Ares Holdings, and Ares Real Estate was merged with and into Ares Investments. Ares Holdings, Ares Offshore, and Ares Investments are the surviving entities and are collectively referred to as the “Ares Operating Group.”

F-8

Ares Management, L.P.
Notes to the Consolidated Financial Statements
(Dollars in Thousands, Except Unit Data and As Otherwise Noted)


As of December 31, 2017, the structure and ownership interests of the Company are reflected below:
Non-Controlling Interests in Ares Operating Group Entities
The non-controlling interests in the Ares Operating Group (“AOG”) entities represent a component of equity and net income attributable to the owners of the AOG Units that are not held directly or indirectly by the Company. These interests are adjusted for contributions to and distributions from AOG during the reporting period and are allocated income from the AOG entities based on their historical ownership percentage for the proportional number of days in the reporting period.  

F-9

Ares Management, L.P.
Notes to the Consolidated Financial Statements
(Dollars in Thousands, Except Unit Data and As Otherwise Noted)


2. SUMMARY OF SIGNIFICANT ACCOUNTING POLICIES
Basis of AccountingPresentation
The accompanying consolidated financial statements are prepared in accordance with the generally accepted accounting principles in the United States (“GAAP”). The Company’s Consolidated Funds are investment companies under GAAP based on the following characteristics: the Consolidated Funds obtain funds from one or more investors and provide investment management services and the Consolidated Funds’ business purpose and substantive activities are investing funds for returns from capital appreciation and/or investment income. Therefore, investments of Consolidated Funds are recorded at fair value and the unrealized appreciation (depreciation) in an investment’s fair value is recognized on a current basis inwithin the Consolidated Statements of Operations. Additionally, the Consolidated Funds do not consolidate their majority-owned and controlled investments in portfolio companies. In the preparation of these consolidated financial statements, the Company has retained the investment company accounting for the Consolidated Funds under GAAP.
All of the investments held and CLO loan obligations issued by the Consolidated Funds are presented at their estimated fair values inwithin the Company’s Consolidated Statements of Financial Condition. Net income attributable to the investors inholders of subordinated notes of the CLOs is included inpresented within net income (loss) attributable to non-controlling interests in Consolidated Funds inwithin the Consolidated Statements of Operations.

The Company has reclassified certain prior period amounts to conform to the current year presentation.


Use of Estimates


The preparation of financial statements in conformity with GAAP requires management to make assumptions and estimates that affect the reported amounts of assets and liabilities, the disclosure of contingent assets and liabilities at the date of the financial statements and the reported amounts of revenues, expenses and investmentother income (loss)(expense) during the reporting periods. Assumptions and estimates regarding the valuation of investments involve a high degree of judgment and complexity
F-9

Ares Management Corporation
Notes to the Consolidated Financial Statements (Continued)
(Dollars in Thousands, Except Share Data and As Otherwise Noted)
and may have a significant impact on performance fees.net income. Actual results could differ from these estimates and such differences could be material to the consolidated financial statements.

Principles of Consolidation
As of January 1, 2015, the Company adopted the Financial Accounting Standards Board (“FASB") Accounting Standards Update No. ("ASU") 2015-02, Amendments to the Consolidation Analysis” (see Note 19 for information regarding the impact of the adoption). Accordingly, theThe Company consolidates those entities in which it has a direct or indirect controlling financial interest based on either a variable interest model (“VIEs”) or voting interest model.model (“VOE”). As such, the Company consolidates (a)(i) entities in which it holds a majority voting interest or has majority ownership and control over the operational, financial and investing decisions of that entity including Ares affiliates and affiliated funds and co-investment entities and (b)(ii) entities that the Company concludes are variable interest entities (“VIEs”), including limited partnerships and CLOs, in which the Company has more than insignificant economic interest and power to direct the activities that most significantly impact the entities, and for which the Company is deemed to be the primary beneficiary.
The Company determines whether an entity should be consolidated by first evaluating whether it holds a variable interest in the entity. Fees that are customary and commensurate with the level of services provided by the Company, and where the Company does not hold other economic interests in the entity that would absorb more than an insignificant amount of the expected losses or returns of the entity, would not be considered a variable interest. The Company factors in all economic interests, including proportionate interests through related parties, to determine if fees are considered a variable interest. As the Company’s interests in funds are primarily management fees, performancecarried interest, incentive fees, and/or insignificant direct or indirect equity interests through related parties, the Company is not considered to have a variable interest in many of these entities. Entities that are not VIEs are further evaluated for consolidation under the voting interest model (“VOE”).

F-10

Ares Management, L.P.
Notes to the Consolidated Financial Statements
(Dollars in Thousands, Except Unit Data and As Otherwise Noted)


model.
Variable Interest Model
An
The Company considers an entity is considered to be a variable interest entity (“VIE”)VIE if any of the following conditions exist: (a)(i) the total equity investment at risk is not sufficient to permit the entity to finance its activities without additional subordinated financial support, (b)support; (ii) the holders of equity investment at risk, as a group, lack either the direct or indirect ability through voting rights or similar rights to make decisions that have a significant effect on the success of the entity or the obligation to absorb the expected losses or right to receive the expected residual returns,returns; or (c)(iii) the voting rights of some equity investors are disproportionate to their obligation to absorb losses of the entity, their rights to receive returns from an entity, or both and substantially all of the entity’s activities either involve or are conducted on behalf of an investor with disproportionately few voting rights.

The Company consolidates all VIEs for which it is the primary beneficiary. An entityThe Company determines it is determined to be the primary beneficiary ifwhen it holds a controlling financial interest, which is defined as having (a)has the power to direct the activities of the VIE that most significantly impact the entity’s economic performance and (b) the obligation to absorb losses of the entity or the right to receive benefits from the entity that could potentially be significant to the VIE.

The Company determines whether it is the primary beneficiary of a VIE at the time it becomes involved with a VIE and continuously reconsiders the conclusion. In evaluating whether the Company is the primary beneficiary, the Company evaluates its direct and indirect economic interests in the entity. The consolidation analysis is generally performed qualitatively, however, if the primary beneficiary is not readily determinable, a quantitative analysis may also be performed. This analysis requires judgment. These judgments include: (1)(i) determining whether the equity investment at risk is sufficient to permit the entity to finance its activities without additional subordinated financial support, (2)support; (ii) evaluating whether the equity holders, as a group, can make decisions that have a significant effect on the success of the entity, (3)entity; (iii) determining whether two or more parties'parties’ equity interests should be aggregated, (4)aggregated; (iv) determining whether the equity investors have proportionate voting rights to their obligations to absorb losses or rights to receive returns from an entityentity; and (5)(v) evaluating the nature of relationships and activities of the parties involved in determining which party within a related-party group is most closely associated with a VIE and hence would be deemed the primary beneficiary.
Voting Interest Model
The Company consolidated entities, including limited partnerships and similar entities, in which it held a majority voting interest and those entities in which it had majority ownership and control over the operational, financial and investing decisions, including Ares affiliates and affiliated funds and co-investment entities.Consolidated CLOs
The Company’s total exposure to consolidated VOEs represents the value of its economic ownership interest in these entities. Valuation changes associated with investments held at fair value by these consolidated VOEs are reflected in non-operating income (expense) and partially offset in net income (loss) attributable to non-controlling interests for the portion not attributable to the Company.
Equity Appropriated for Consolidated Funds
As of December 31, 20172023 and 2016,2022, the Company consolidated ten28 and seven25 CLOs respectively. Effective January 1, 2016, the Company adopted ASU 2014-13, Measuring the Financial Assets and the Financial Liabilities of a (“Consolidated Collateralized Financing Entity. The Company applied the guidance using a modified retrospective approach by recording a cumulative-effect adjustment of $3.4 million to equity appropriated for Consolidated Funds as of January 1, 2016.CLOs”), respectively.
Prior to the adoption of ASU 2014-13, the Company elected the fair value option for eligible liabilities to mitigate the accounting mismatch between the carrying value of the assets and liabilities of its consolidated CLOs. As a result, the Company accounted for the excess of fair value of assets over liabilities as an increase in equity appropriated for Consolidated Funds.
Pursuant to the adoption of ASU 2014-13, the Company is required to determine whether the fair values of the financial assets or financial liabilities are more observable. Beginning January 1, 2016, theThe Company has determined that the fair value of the financial assets of the consolidatedConsolidated CLOs, which are mostly Level II assets within the GAAP fair value hierarchy, are more observable than the fair value of the financial liabilities of its consolidatedConsolidated CLOs, which are mostly Level III liabilities within the GAAP fair value hierarchy. As a result, the financial assets of consolidatedConsolidated CLOs are measured at fair value and the financial liabilities of the consolidatedConsolidated CLOs are measured in consolidation as: (1)(i) the sum of the fair value of the financial assets, and the carrying value of any nonfinancial assets held temporarily, less (2)(ii) the sum of the fair value of any beneficial interests retained by

the Company (other than those that
F-11
F-10

Ares Management L.P.Corporation
Notes to the Consolidated Financial Statements (Continued)
(Dollars in Thousands, Except UnitShare Data and As Otherwise Noted)


the Company (other than those that represent compensation for services), and the Company’s carrying value of any beneficial interests that represent compensation for services. The resulting amount is allocated to the individual financial liabilities (other than the beneficial interests retained by the Company).
The loan obligations issued by the CLOs are backedcollateralized by diversified collateral asset portfolios and by structured debt or equity. In exchange for managing the collateral for the CLOs, the Company typically earns a variety of management fees, including senior and subordinated management fees, and in some cases, contingent performance fees. In cases where the Company earns fees from a fund that it consolidates with the CLOs, those fees have been eliminated as intercompany transactions. The Company's holdings in these CLOs are generally subordinated to other interests in the entities and entitle the Company to receive a pro rata portion of the residual cash flows, if any, from the entities. Additionally, the Company may invest in other senior secured notes, which are repaid based on available cash flows subject to priority of payments under each consolidated CLO's governing documents.incentive fee income. Investors in the CLOs generally have no recourse against the Company for any losses sustained in the capital structure of each CLO.
Business Combinations
In accounting for business acquisitions, the Company separates recognition of goodwill from the assets acquired and the liabilities assumed, at the acquisition date fair values. The Company accounts for business combinations using the acquisition method of accounting by allocating the purchase price of the acquisition to the fair value of each asset acquired and liability assumed as of the acquisition date. Contingent consideration obligations are recognized as of the acquisition date at fair value based on the probability that contingency will be realized. Goodwill as of the acquisition date is measured as the excess of consideration transferred over the net of the acquisition date fair values of the assets acquired and the liabilities assumed. Acquisition-related costs in connection with a business combination are expensed as incurred.
Management’s determination of fair value of assets acquired and liabilities assumed at the acquisition date as well as contingent consideration are based on the best information available in the circumstances, and may incorporate management’s own assumptions and involve a significant degree of judgment and estimates that are inherently uncertain and subject to refinement. As a result, during the measurement period, which may be up to one year from the acquisition date, the Company records adjustments to the assets acquired and liabilities assumed with the corresponding offset to goodwill. Upon the conclusion of the measurement period or final determination of the values of assets acquired or liabilities assumed, whichever comes first, any subsequent adjustments are recorded to the consolidated statements of operations.
For a given acquisition, management may identify certain pre-acquisition contingencies as of the acquisition date and may extend the review and evaluation of these pre-acquisition contingencies throughout the measurement period to obtain sufficient information to assess whether management includes these contingencies as a part of the fair value estimates of assets acquired and liabilities assumed and, if so, to determine their estimated amounts. If management cannot reasonably determine the fair value of a pre-acquisition contingency by the end of the measurement period, which is generally the case given the nature of such matters, the Company will recognize an asset or a liability for such pre-acquisition contingency if: (i) it is probable that an asset existed or a liability had been incurred at the acquisition date and (ii) the amount of the asset or liability can be reasonably estimated. Subsequent to the measurement period, changes in the estimates of such contingencies would affect earnings and could have a material effect on the consolidated statements of operations and financial condition.
Fair Value Measurements
GAAP establishes a hierarchalhierarchical disclosure framework that prioritizes the inputs used in measuring financial instruments at fair value into three levels based on their market price observability. Market price observability is affected by a number of factors, including the type of instrument and the characteristics specific to the instrument. Financial instruments with readily available quoted prices from an active market or for which fair value can be measured based on actively quoted prices generally have a higher degree of market price observability and a lesser degree of judgment inherent in measuring fair value.

Financial assets and liabilities measured and reported at fair value are classified as follows:
Level I—Quoted prices in active markets for identical instruments.

F-12

Ares Management, L.P.
Notes to the Consolidated Financial Statements
(Dollars in Thousands, Except Unit Data and As Otherwise Noted)


Level II—Quoted prices for similar instruments in active markets; quoted prices for identical or similar instruments in inactive markets; and model‑derivedmodel-derived valuations with directly or indirectly observable significant inputs. Level II inputs include prices in markets with few transactions, non-current prices, prices for which little public information exists or prices that vary substantially over time or among brokered market makers. Other inputs include interest rates,rate, yield curves, volatilities,curve, volatility, prepayment risks,risk, loss severities,severity, credit risksrisk and default rates.
rate.
Level III—Valuations that rely on one or more significant unobservable inputs. These inputs reflect the Company’s assessment of the assumptions that market participants would use to value the instrument based on the best information available.
Management's determination of fair value includes various valuation techniques. These techniques may include market approach, recent transaction price, net asset value (“NAV”) approach, discounted cash flows, and may use one or more significant unobservable inputs such as EBITDA or revenue multiples, discount rates, weighted average cost of capital, exit multiples, terminal growth rates and other unobservable inputs.
In some instances, an instrument may fall into more than one level of the fair value hierarchy. In such instances, the instrument’s level within the fair value hierarchy is based on the lowest of the three levels (with Level III being the lowest) that is significant to the fair value measurement. The Company’s assessment of the significance of an input requires judgment and considers factors specific to the instrument. The Company accounts for the transfer of assets into or out of each fair value hierarchy level as of the beginning of the reporting period. (See Note 6period (see “Note 5. Fair Value” for further detail).
Cash and Cash Equivalents
Cash and cash equivalents for the Company includes investments with maturities at purchase of less than three months, money market funds and demand deposits. Cash and cash equivalents held at Consolidated Funds represents cash that, although not legally restricted, is not available to support the general liquidity needs of the Company, as the use of such amounts is generally limited to the investment activities of the Consolidated Funds.

As the servicer to certain real estate investments, certain subsidiaries of the Company collect escrow deposits from borrowers to ensure the borrowers’ obligations are met. These escrow deposits are represented as cash and cash equivalents for the Company and are offset by escrow cash liability within accounts payable and accrued expenses in the Consolidated Statements of Financial Condition.
At December 31, 20172023 and 2016,2022, the Company had cash balances with financial institutions in excess of Federal Deposit Insurance Corporation insured limits. The Company monitors the credit standing of these financial institutions.

Investments held in trust account

Investments held in trust account represents funds raised through the initial public offerings of our sponsored SPACs that are presented within Consolidated Funds. The funds raised are held in a trust account that is restricted for use and may only be used for purposes of completing an initial business combination or redemption of public shares as set forth in the trust
F-11

Ares Management Corporation
Notes to the Consolidated Financial Statements (Continued)
(Dollars in Thousands, Except Share Data and As Otherwise Noted)
agreement. The portfolio of investments for the SPACs is comprised of United States (“U.S.”) government securities or money market funds meeting certain conditions under Rule 2a-7 promulgated under the Investment Company Act that invest only in direct U.S. government treasury obligation. The U.S. Treasury securities typically have original maturities of six months or less when purchased and are recorded at fair value. Interest income received on such investments is separately presented from the overall change in fair value and is recognized within interest and other income of Consolidated Funds within the Consolidated Statements of Operations. Any remaining change in fair value of such investments, that is not recognized as interest income, is recognized within net realized and unrealized gains on investments of Consolidated Funds within the Consolidated Statements of Operations.

Investments
The Company has retainedinvestments of the specialized investment company accounting guidance under GAAP with respect to its Consolidated Funds which hold substantially all of its investments. Thus, the consolidated investments are reflected inwithin the Consolidated Statements of Financial Condition at fair value, with unrealized appreciation (depreciation) resulting from changes in fair value reflected as a component of net change inrealized and unrealized appreciation (depreciation)gains on investments inwithin the Consolidated Statements of Operations. Fair value is the amount that would be received to sell an asset, or paid to transfer a liability,Certain investments are denominated in an orderly transaction between market participantsforeign currency and are translated into U.S. dollars at the measurement date (i.e., the exit price).each reporting date.

Equity Method Investments
The Company accounts for its investments in which it has or is otherwise presumed to have significant influence, including investments in unconsolidated funds, and strategic investments and carried interest, using the equity method of accounting. TheThe carrying amounts of equity method investments are reflected in investments inwithin the Consolidated Statements of Financial Condition. As the underlying investments of the Company's equity method investments are reported at fair value, the carrying value of the equity method investments approximates fair value. The carrying value of investments accounted for using equity method accounting is determined based on amounts invested by the Company, adjusted for the equity in earnings or losses of the investee allocated based on the respective partnership agreements, less distributions received.

The Company evaluates the equity method investments for impairment whenever events or changes in circumstances indicate that the carrying amounts of such investments may not be recoverable. TheExcept for carried interest, the Company’s share of the investee’s income and expenses for the Company’s equity method investments is includedpresented either within principal investment income or net realized and unrealized gain (loss)gains on investments within the Consolidated Statements of Operations.

F-13

Ares Management, L.P.
Notes to Carried interest allocation is presented separately as a revenue line item within the Consolidated Statements of Operations, and the accrued carried interest is presented within investments within the Consolidated Statements of Financial StatementsCondition.
(Dollars in Thousands, Except Unit Data and As Otherwise Noted)


Held-to-Maturity Investments
The Company classifies its securitiesIn addition, certain of the Company's equity method investments as held-to-maturity investments when the Company has the positive intent and ability to hold the securities to maturity. Held-to-maturity securities are reported as investments and are recorded at amortized cost. On a periodic basis, the Company reviews its held-to-maturity investment portfolio for impairment. If a decline infair value. The fair value option has been elected to simplify the accounting for certain financial instruments. The fair value option election is deemedirrevocable and is applied to be other-than-temporary,financial instruments on an individual basis at initial recognition or at eligible remeasurement events. Changes in the held-to-maturity investment is written down byfair value of such instruments with the impairment amount through earnings.fair value option elected are presented within net realized and unrealized gains on investments within the Consolidated Statements of Operations.

Derivative Instruments

In the normal course of business, the Company and the Consolidated Funds are exposed to certain risks relating to their ongoing operations and use various types of derivative instruments primarily to mitigate against interest rate and foreign exchange risk. The derivative instruments are not designated as hedging instruments under the accounting standards for derivatives and hedging. These derivative instruments include foreign currency forward contracts, interest rate swaps, asset swaps and warrants.
The Company recognizes all derivatives as either assets or liabilities inreports each of its derivative instruments at fair value within the Consolidated Statements of Financial Condition withinas either other assets or accounts payable, accrued expenses and other liabilities, respectively,respectively. These amounts may be offset to the extent that there is a legal right to offset and reports themif elected by management.
Derivative instruments are marked-to-market daily based upon quotations from pricing services or by the Company and the change in value, if any, is recorded as an unrealized gain (loss). Upon settlement of the instrument, the Company records any realized gain (loss). Changes in value are reflected within net realized and unrealized gains on investments within the Consolidated Statements of Operations.
F-12

Ares Management Corporation
Notes to the Consolidated Financial Statements (Continued)
(Dollars in Thousands, Except Share Data and As Otherwise Noted)
Business Combinations

The Company accounts for business combinations using the acquisition method of accounting, under which the purchase price of the acquisition, including the fair value of certain elements of contingent consideration, is allocated to the assets acquired and liabilities assumed using the fair values determined by management as of the acquisition date. Contingent consideration obligations are recognized as of the acquisition date at fair value.value based on the probability that contingency will be realized. Any fair value of purchase consideration in excess of the fair value of the assets acquired less liabilities assumed is recorded as goodwill. Conversely, any excess of the fair value of the net assets acquired over the purchase consideration is recognized as a bargain purchase gain. Critical estimates in valuing certain of the intangible assets acquired include, but are not limited to, future expected cash inflows and outflows, future fundraising assumptions, expected useful life, discount rates and income tax rates. The acquisition method of accounting allows for a measurement period for up to one year after the acquisition date to make adjustments to the purchase price allocation as the Company obtains more information regarding asset valuations and liabilities assumed. Acquisition-related costs incurred in connection with a business combination are expensed as incurred.

Goodwill and Intangible Assets
Intangible Assets
The Company'sCompany’s finite-lived intangible assets consistconsists primarily of contractual rights to earn future management fees and performance fees from the acquired management contracts. Finite-lived intangible assets are amortized on a straight-line basis over their estimated useful lives, ranging from approximately 3.51.6 to 13.5 years. The purchase price of thean acquired management contract is treated as an intangible asset and is amortized over the life of the contract. Amortization is included as part of general, administrative and other expenses inwithin the Consolidated Statements of Operations.
The Company tests finite‑livedfinite-lived intangible assets for impairment if certain events occur or circumstances change indicating that the carrying amount of the intangible asset may not be recoverable. The Company uses a two-step process to evaluate impairment. The first step comparesevaluates impairment by comparing the estimated undiscounted future cash flowflows attributable to the intangible asset being evaluated with its carrying amount. The second step, used to measure the amount of potential impairment, compares the fair value of the intangible asset with its carrying amount. If an impairment is determined to exist by management, the Company accelerates amortization expense so that the carrying valueamount represents fair value. The Company estimates fair value using a discounted future cash flow methodology.
The Company tests indefinite-lived intangible assets annually for impairment. If, after assessing qualitative factors, the Company believes that it is more likely than not that the fair value of the indefinite-lived intangible asset is less than its carrying amount, the Company will evaluate impairment quantitatively to determine and record the amount of impairment as the excess of the carrying amount of the indefinite-lived intangible asset over its fair value.
The Company also tests indefinite-lived intangible assets for impairment if certain events occur or circumstances change indicating that the carrying amount of the intangible asset may not be recoverable or that the useful lives of these assets are no longer appropriate. Inherent in such fair value determinations are certain judgments and estimates relating to future cash flows, including the Company’s strategic plans with regard to the indefinite-lived intangible assets.
Goodwill
Goodwill represents the excess cost over identifiable net assetsof purchase price of an acquired business.business over the fair value of its identifiable net assets. The Company tests goodwill annually for impairment. If, after assessing qualitative factors, the Company believes that it is more likely than not that the fair value of the reporting unit is less than its carrying value,amount, the Company will use a two‑step process to evaluate impairment. The first step comparesimpairment quantitatively and record the fair valueamount of goodwill impairment as the excess of the carrying amount of the reporting unit withover its carrying amount, including goodwill. The second step, used to measure the amount of any potential impairment, compares the implied fair value of the reporting unit with the carrying amount of goodwill.value.
The Company also tests goodwill for impairment in other periods if an event occurs or circumstances change such that it is more likely than not to reduce the fair value of the reporting unit below its carrying amounts.amount. Inherent in such fair value determinations are certain judgments and estimates relating to future cash flows, including the Company’s interpretation of current economic indicators and market valuations, and assumptions about the Company’s strategic plans with regard to its operations. Due to the uncertainties associated with such estimates, actual results could differ from such estimates.

F-13

Ares Management Corporation
Notes to the Consolidated Financial Statements (Continued)
(Dollars in Thousands, Except Share Data and As Otherwise Noted)
Fixed Assets
Fixed assets, consisting of furniture, fixtures, computer hardware, equipment, internal-use software and equipment, leasehold improvements and computer hardware and internal use software, are recorded at cost, less accumulated depreciation and amortization. Fixed assets are includedpresented within other assets onwithin the Company’s Consolidated Statements of Financial Condition.
Direct costs associated with developing, purchasing or otherwise acquiring software for internal use (“Internal Use Software”) are capitalized and amortized on a straight-line basis over the expected useful life of the software, beginning when the software is ready for its intended purpose. Costs incurred for upgrades and enhancements that will not result in additional functionality are expensed as incurred.
Fixed assets are depreciated or amortized on a straight-line methodbasis over an asset'sasset’s estimated useful life, with the corresponding depreciation and amortization expense includedpresented within general, administrative and other expenses onwithin the Company’s Consolidated Statements of Operations. The estimated useful life for leasehold improvements is the lesser of the lease terms and

F-14

Ares Management, L.P.
Notes to the Consolidated Financial Statements
(Dollars in Thousands, Except Unit Data and As Otherwise Noted)


term or the life of the asset, and forwith a maximum of 10 years, while other fixed assets and Internal Use Software isinternal-use software are generally depreciated between three and seven years. Fixed assets are reviewed for impairment whenever events or changes in circumstances indicate that the carrying amount of an asset may not be recoverable.
Leases
The Company has entered into operating and finance leases for corporate offices and certain equipment and makes the determination if an arrangement constitutes a lease at inception. Operating leases are presented within right-of-use operating lease assets and operating lease liabilities within the Company’s Consolidated Statements of Financial Condition. Finance lease assets are capitalized as a component of fixed assets and finance lease liabilities are presented within accounts payable, accrued expenses and other liabilities within the Consolidated Statements of Financial Condition. Leases with an initial term of 12 months or less are expensed as incurred and not capitalized within the Consolidated Statements of Financial Condition.

Right-of-use operating lease assets represent the Company’s right to use an underlying asset for the lease term and operating lease liabilities represent the Company’s obligation to make lease payments arising from the lease. Operating lease right-of-use assets and corresponding lease liabilities are recognized at commencement date based on the present value of lease payments over the lease term. As most of the Company’s leases do not provide an implicit rate, the Company uses its incremental borrowing rate based on the information available at commencement date in determining the present value of lease payments. The Company uses the implicit rate when readily determinable. The right-of-use operating lease asset also includes any lease prepayments and excludes lease incentives. Lease terms may include options to extend or terminate the lease when it is reasonably certain that the company will exercise that option. Lease expense is primarily recognized on a straight-line basis over the lease term. The Company has lease agreements with lease and non-lease components, which are generally accounted for separately.
Non-Controlling Interests

The non-controlling interests in AOG entities represent a component of equity and net income attributable to the owners of the Ares Operating Group Units (“AOG Units”) that are not held directly or indirectly by the Company. These owners consist predominantly of Ares Owners Holdings L.P. but also include other strategic distribution partnerships with whom the Company has established joint ventures and other non-controlling strategic investors. Non-controlling interests in AOG entities are adjusted for contributions to and distributions from AOG during the reporting period and are allocated income from the AOG entities either based on their historical ownership percentage for the proportional number of days in the reporting period or based on the activity associated with certain membership interests.

The non-controlling interests in Consolidated Funds represents a component of equity and net income attributable to ownership interests that third parties hold in Consolidated Funds.
Redeemable Interest

Redeemable interest in AOG entities was established in connection with the SSG Acquisition as described in “Note 13. Equity and Redeemable Interest.” Redeemable interest in AOG entities was initially recorded at fair value on the date of acquisition within mezzanine equity within the Consolidated Statements of Financial Condition. Income (loss) is allocated based on the ownership percentage attributable to the redeemable interest. The Company determined that the redemption of the
F-14

Ares Management Corporation
Notes to the Consolidated Financial Statements (Continued)
(Dollars in Thousands, Except Share Data and As Otherwise Noted)
redeemable interest is probable as of the date of acquisition. At each balance sheet date, the carrying value of the redeemable interest is presented at the redemption amount, as defined in accordance with the terms of a contractual arrangement between the Company and the former owners of SSG, to the extent that the redemption amount exceeds the initial measurement on the date of acquisition. The Company recognizes changes in the redemption amount with corresponding adjustments against retained earnings, or additional paid-in-capital in the absence of retained earnings, within stockholders’ equity within the Consolidated Statements of Financial Condition.
Redeemable interest in Consolidated Funds represent the Class A ordinary shares issued by each of the Company’s sponsored SPACs, as applicable. The Class A ordinary shares issued by our SPACs (the “Class A ordinary shares”) are redeemable for cash by the public shareholders in the event that they do not complete a business combination or tender offer associated with shareholder approval provisions. The Class A ordinary shareholders have redemption rights that are considered to be outside of the SPAC’s control.
Revenue Recognition
The Company recognizes revenue in a way that depicts the transfer of promised goods or services to customers in an amount that reflects the consideration to which the Company expects to be entitled in exchange for those goods or services. The Company’s revenue is based on contracts with a determinable transaction price and distinct performance obligations with probable collectability. Revenues primarily consist of management fees,are not recognized until the performance fees and administrative, transaction and other fees.

obligation(s) are satisfied.
Management Fees
Management fees are generally based on a defined percentage of fair value of assets, total commitments, invested capital, net asset value ("NAV"), net investment income,NAV, NAV plus unfunded commitments, total assets or par value of the investment portfolios managed by the Company. Principally all management fees are earned from affiliated funds of the Company. The contractual terms of management fees vary by fund structure and investment strategy. Management fees are recognized as revenue in the period advisory services are rendered, subject to the Company’s assessment of collectability.
Management fees also include a quarterly performance fee on the net investment income ("ARCC (“Part I Fees"Fees”) fromof Ares Capital Corporation (NASDAQ: ARCC) ("ARCC"(“ARCC”), a publicly traded business development company registered under the Investment Company ActCION Ares Diversified Credit Fund (“CADC”) and managed by a subsidiary of the Company.Ares Strategic Income Fund (“ASIF”).
ARCC Part I Fees are equal to 20.0% of its net investment income (before ARCC Part I Fees and incentive fees payable based on capital gains), subject to a fixed "hurdle rate" of 1.75% per quarter, or 7.0% per annum. No fee is recognized until ARCC's net investment income exceeds a 1.75% hurdle rate, with a "catch-up" provision such that the Company receives 20% of ARCC's net investment income from the first dollar earned. Such fees from ARCC are classified as management fees as they are paid quarterly, predictable and recurring in nature, not subject to contingent repayment and are typically cash settled each quarter.
Performance Fees
Performance fee revenues consist of incentive fees and carried interest. Performance fees are based on certain specific hurdle rates as defined in the applicable investment management agreements or governing documents. Substantially all performance fees are earned from affiliated funds of the Company.Performance fees receivable is presented separately in the Consolidated Statements of Financial Condition and represents performance fees recognized but not yet collected. The timing of the payment of performance fees due to the general partner or investment manager varies depending on the terms of each applicable agreement.
Incentive Fees
Incentive fees earned on the performance of certain fund structures, typically in credit funds, are recognized based on the fund’s performance during the period, subject to the achievement of minimum return levels, or high water marks, in accordance with the respective terms set out in each fund’s investment management agreement. Incentive fees are recorded on an accrual basis to the extent such amounts are contractually due. Accrued but unpaid incentive fees as of the reporting date are recorded in performance fees receivable in the Consolidated Statements of Financial Condition. Incentive fees are realized at the end of a measurement period, typically annually. Once realized, such fees are not subject to reversal.
Fee RateFee BaseHurdle rate
ARCC Part I Fees20.00%Net investment income (before ARCC Part I Fees and ARCC Part II Fees)Fixed hurdle rate of 1.75% per quarter, or 7.00% per annum. No fees are recognized until ARCC’s net investment income exceeds a 1.75% hurdle rate, with a catch-up provision to ensure that the Company receives 20.00% of the net investment income from the first dollar earned.
CADC Part I Fees15.00%Net investment income (before CADC Part I Fees)Fixed hurdle rate of 1.50% per quarter, or 6.00% per annum. No fees are recognized until CADC’s net investment income exceeds the hurdle rate, with a catch-up provision to ensure that the Company receives 15.00% of the net investment income from the first dollar earned.
ASIF Part I Fees12.50%Net investment income (before ASIF Part I Fees and ASIF Part II Fees)Fixed hurdle rate of 1.25% per quarter, or 5.00% per annum. No fees are recognized until ASIF’s net investment income exceeds a 1.25% hurdle rate, with a catch-up provision to ensure that the Company receives 12.50% of the net investment income from the first dollar earned.
Carried Interest Allocation
In certain fund structures, typically in private equity and real estate equity funds, carried interest is allocated to the Company based on cumulative fund performance to date, subject to the achievement of minimum return levels in accordance with the respective terms set out in each fund’s investment management agreement. At the end of each reporting period, a fund will allocate carried interest applicable to the Company based upon an assumed liquidation of that fund'sfund’s net assets on the reporting date, irrespective of whether such amounts have been realized. Carried interest is recorded to the extent such amounts have been allocated, and may be subject to reversal to the extent that the amount allocated exceeds the amount due to the general partner or investment manager based on a fund’s cumulative investment returns.
As the fair value of underlying assets varies between reporting periods, it is necessary to make adjustments to amounts recorded as carried interest to reflect eithereither: (i) positive performance resulting in an increase in the carried interest allocated to the CompanyCompany; or (ii) negative performance that would cause the amount due to the Company to be less than the amount previously

F-15

Ares Management L.P.Corporation
Notes to the Consolidated Financial Statements (Continued)
(Dollars in Thousands, Except UnitShare Data and As Otherwise Noted)


previously recognized as revenue, resulting in a negative adjustment toreversal of previously recognized carried interest allocated to the Company. Accrued but unpaid carried interest as of the reporting date is recorded in performance fees receivable inwithin investments within the Consolidated Statements of Financial Condition.
Carried Interestinterest is realized when an underlying investment is profitably disposed of, or upon the return of each limited partner’s capital plus a preferred return, and the fund’s cumulative returns are in excess of the specific hurdle rates as defined in the applicable investment management agreements or governing documents. Since carried interest is subject to reversal, the Company may need to accrue for potential repayment of previously received carried interest. This accrual represents all amounts previously distributed to the Company that would need to be repaid to the funds if the funds were to be liquidated based on the current fair value of the underlying funds’ investments as of the reporting date. The actual repayment obligations, however, generally does not become realized until the end of a fund’s life. As of December 31, 2017 and 2016,
The Company accounts for carried interest, which represents a performance-based capital allocation from an investment fund to the Company, had noas earnings from financial assets within the scope of ASC 323, Investments-Equity Method and Joint Ventures. The Company recognizes carried interest allocation as a separate revenue line item in the Consolidated Statements of Operations with accrued contingent repayment obligations that would needcarried interest as of the reporting date reported within investments within the Consolidated Statements of Financial Condition. Substantially all carried interest allocation is earned from affiliated funds of the Company.

Incentive Fees
Incentive fees earned on the performance of certain fund structures, typically in credit funds, certain real estate and secondaries funds, are recognized based on the fund’s performance during the period, subject to be paid if the funds were liquidated at fair valueachievement of minimum return levels in accordance with the respective terms set out in each fund’s investment management agreement. Incentive fees are realized at the reporting dates.end of a measurement period, typically annually. Once realized, such fees are no longer subject to reversal.

Principal Investment Income

Principal investment income consists of interest and dividend income and net realized and unrealized gain (loss) from the equity method investments that the Company manages.

Administrative, Transaction and Other Fees

The Company provides administrative services to certainearns other sources of its affiliated fundsrevenue that are reported withinclassified as administrative, andtransaction or other fees. The administrative fees generally represent expense reimbursements for a portion of overhead and other expenses incurred by certain Operations Management Group professionals directly attributable to performing services for a fund but may also be based on a fund’s NAV for certain funds domiciled outside the U.S. The Company also receives transaction fees from certain affiliated funds for activities related to fund transactions, such as loan originations. These fees are recognized as other revenue in the period in which the administrative services and the transaction related services are rendered. Administrative fees represent fees that the Company earns for providing administrative services to certain funds. These fees may either reflect expense reimbursements for costs incurred by certain professionals in performing services for a fund or may be based on fixed percentage of a fund’s invested capital. Transaction fees are typically earned from the arrangement and origination of loans and are generated primarily from funds within the direct lending and infrastructure debt strategies. Other fees includes sales-based and asset-based fees from the Company’s non-traded vehicles and 1031 exchange programs. Other fees may include various property-related fees earned from certain real estate funds, such as acquisition, development and property management.


Equity-Based Compensation

The Company recognizes expense related to equity-based compensation infor which it receives employee services in exchange for (a)for: (i) equity instruments of the Company, (b) derivatives based on the Company’s common unitsCompany; or (c)(ii) liabilities that are based on the fair value of the Company’s equity instruments. Equity-based compensation expense represents expenses associated with restricted units options and phantom unitsoptions granted under the Ares Management, L.P. 20142023 Equity Incentive Plan (“Equity(the “Equity Incentive Plan”).

Equity-based compensation expense for restricted units and options is determined based on the fair value of the respective equity award on the grant date and is recognized on a straight-line basis over the requisite service period, with a corresponding increase in partners’ capital.additional paid-in-capital. Grant date fair value of the restricted units wasis determined to beby the most recent closing price of shares of the Company’s Class A common units. Certainstock.
The Company has granted certain performance-based restricted units areunit awards with market conditions. These awards generally have vesting conditions based upon the volume-weighted, average closing price of Class A common stock meeting or exceeding a stated price over a period of time, referred to as the market condition. Vesting is also generally subject to a lock-up provision that expires oncontinued
F-16

Ares Management Corporation
Notes to the fifth anniversary ofConsolidated Financial Statements (Continued)
(Dollars in Thousands, Except Share Data and As Otherwise Noted)
employment at the IPO.time such market condition is achieved. The Company used Finnerty’s average strike-price put option model to estimate the discount associated with this lack of marketability. The Company estimated the grant date fair valuevalues of these awards are based on a probability distributed Monte-Carlo simulation. Due to the existence of the optionsmarket condition, the vesting period for the awards is not explicit, and as such, compensation expense is recognized on a straight-line basis over the median vesting period derived from the positive iterations of the grant date using Black-Scholes option pricing model. Monte Carlo simulations where the market condition is achieved.
The phantom units will be settled in cash and therefore represent a liability that is required to be remeasured at each reporting period. Fair value of phantom units was determined to be the most recent closing price each reporting period.
In 2016, the Company adopted ASU 2016-09, Compensation - Stock Compensation (Topic 718). In accordance with ASU 2016-09, the Company elected to recognizerecognizes share-based award forfeitures in the period they occur as a reversal of previously recognized compensation expense. The reduction in compensation expense is determined based on the specific awards forfeited during that period.
The Company records deferred tax assets or liabilities for equity compensation plan awards based on deductions for income tax purposes of equity-based compensation recognized at the statutory tax rate in the jurisdiction in which the Company is expected to receive a tax deduction. In addition, differences between the deferred tax assets recognized for financial reporting purposesin accordance with GAAP and the actual tax deduction reported onin the Company’s income tax returns are recorded as adjustments to partners’ capital. Ifpresented within income tax expense within the Consolidated Statements of Operations before taking into consideration the tax deduction is less thaneffects of the deferred tax asset, the calculated shortfall reduces the pool of excess tax benefits. If the pool of excess tax benefits is reduced to zero, then subsequent shortfalls would increase the income tax expense.investment in AOG.
Equity-based compensation expense is presented within compensation and benefits inwithin the Consolidated Statements of Operations.
Performance FeeRelated Compensation
The Company has agreed to pay to certain professionals a portion of the performancecarried interest and incentive fees earned from certain funds, including income from

F-16

Ares Management, L.P.
Notes to the Consolidated Financial Statements
(Dollars in Thousands, Except Unit Data and As Otherwise Noted)


Consolidated Funds that is eliminated in consolidation, to investment and non-investment professionals.consolidation. Depending on the nature of each fund, the performance fee allocationcarried interest and incentive fees may be structured as a fixed percentage subject to vesting based on continued employment or service (generally over a period of five to six years) or as an annual award that is fully vested for the particular year. Other limitations may apply to performance fee allocationcarried interest and incentive fees as set forth in the applicable governing documents of the fund or award documentation. Performance feerelated compensation is recognized in the same period that the related performance fee iscarried interest and incentive fees are recognized. Performance feerelated compensation can be reversed during periods when there is a decline in performance feesreversal of carried interest that werewas previously recognized.
Performance feerelated compensation payable represents the amounts payable to professionals who are entitled to a proportionate share of performance feescarried interest in one or more funds.funds and include the associated payroll related taxes. Performance related compensation payable also includes allocations to charitable organizations as part of the Company’s philanthropic initiatives. The liability is calculated based upon the changes to realized and unrealized performance feescarried interest but not payable until the performance feecarried interest itself is realized.
Net Realized and Unrealized Gains/(Losses) on Investments
Realized gains (losses) occur when the Company redeems all or a portion of its investment or when the Company receives cash income, such as dividends or distributions. Unrealized appreciation (depreciation) results from changes in the fair value of the underlying investment as well as from the reversal of previously recognized unrealized appreciation (depreciation) at the time an investment is realized. Realized and unrealized gains (losses) are presented together as net realized and unrealized gains on investments within the Consolidated Statements of Operations. Also, the Company’s share of the investee’s income and expenses for the Company’s equity method investments is presented within net realized and unrealized gains on investments.
Interest and Dividend Income
Interest, dividends and other investment income are included inwithin interest and dividend income. Interest income is recognized on an accrual basis using the effective interest method to the extent that such amounts are expected to be collected using the effective interest method.collected. Dividends and other investment income are recorded when the right to receive payment is established.
Net Realized and Unrealized Gain (Loss) on Investments
Realized gain (loss) occurs when the Company redeems all or a portion of its investment or when the Company receives cash income, such as dividends or distributions. Unrealized appreciation (depreciation) results from changes in the fair value of the underlying investment as well as the reversal of previously recognized unrealized appreciation (depreciation) at the time an investment is realized. Realized and unrealized gains (losses) are presented together as net realized and unrealized gain (loss) on investments in the Consolidated Statements of Operations. Also, the Company’s share of the investee’s income and expenses for the Company’s equity method investments is included within net realized and unrealized gain (loss) on investments.
Foreign Currency
The U.S. dollar is the Company'sCompany’s functional currency; however, certain transactions of the Company may not be denominated in U.S. dollars. Income and expense and gain and loss transactions denominated in foreign currencies are generally translated into U.S. dollars monthly using the average exchange rates during the respective transaction period. Foreign exchange revaluation arising from these transactions is recognized within other income, (expense) innet within the Consolidated
F-17

Ares Management Corporation
Notes to the Consolidated Financial Statements (Continued)
(Dollars in Thousands, Except Share Data and As Otherwise Noted)
Statements of Operations. For the years ended December 31, 20172023, 2022 and 2015,2021, the Company recognized $1.7$9.1 million, $13.5 million and $0.3$4.8 million, respectively, in transaction losses related to foreign currencies revaluation. For the year ended December 31, 2016, the Company recognized $16.2 million in transaction gain related to foreign currencies revaluation.
In addition, the combined and consolidated results include certain foreign subsidiaries and Consolidated Funds that use functional currencies other than the U.S. dollar. Assets and liabilities of these foreign subsidiaries are translated to U.S. dollars at the prevailing exchange rates as of the reporting date. Income and expense and gain and loss transactions denominated in foreign currencies are generally translated into U.S. dollars monthly using the average exchange rates during the respective transaction period. Translation adjustments resulting from this process are recorded to currency translation adjustment in accumulated other comprehensive income.
Income Taxes
PriorThe Company elects to be taxed as a corporation and all earnings allocated to the Effective Date (defined below), a substantial portion of the Company’s earnings flow through to owners of the Company without being subject to entity level income taxes. Consequently, a significant portion of the Company’s earnings reflects no provision for income taxes except those for foreign, state, city and local income taxes incurred at the entity level. A portion of the Company’s operations is held through AHI, as well as corporate subsidiaries of Ares Investments, which are U.S. corporations for tax purposes. AHI is subject to U.S. corporate tax on earnings that flow through from Ares Holdings with respect to both AOG Units and preferred units at the Ares Operating Group level. Their income is subject to U.S. federal, state and local income taxes and certain of their foreign subsidiaries are subject to foreign income taxes (for which a foreign tax credit can generally offset U.S. corporate taxes imposed on the same income).taxes. A provision for corporate level income taxes imposed on AHI’sunrealized gains and income items as well as taxes imposed on certain subsidiaries’ earnings is included in the Company’sconsolidated tax provision. The Company’sAlso included in the consolidated tax provision also includesare entity level income taxes incurred by certain affiliated funds and co‑investment entities that areConsolidated Funds. The portion of consolidated in these financial statements.

F-17

Ares Management, L.P.
Notesearnings not allocated to the Consolidated Financial StatementsCompany flows through to owners of the AOG entities without being taxed at the corporate level.
(Dollars in Thousands, Except Unit Data and As Otherwise Noted)


Income taxes are accounted for using the liability method of accounting. Under this method, deferred tax assets and liabilities are recognized for the expected future tax consequences of differences between the carrying amounts of assets and liabilities and their respective tax basis, using tax rates in effect for the year in which the differences are expected to reverse. The effect on deferred assets and liabilities of a change in tax rates is recognized as income, in the period when the change is enacted. Deferred tax assets are reduced by a valuation allowance when it is more likely than not that some portion or all of the deferred tax assets will not be realized. Current and deferred tax liabilities are reported on a net basis inand the deferred tax assets, net is presented within other assets within the Consolidated Statements of Financial Condition.

The Company analyzes its tax filing positions in all U.S. federal, state, local and foreign tax jurisdictions where it is required to file income tax returns for all open tax years in these jurisdictions. The Company recognizes the tax benefit from an uncertain tax position only if it is more likely than not that the tax position will be sustained upon examination by the taxing authorities based on the technical merits of the position. The tax benefit recognized in the financial statements for a particular tax position is based on the largest benefit that is more likely than not to be realized. The amount of unrecognized tax benefits (“UTBs”) is adjusted as appropriate for changes in facts and circumstances, such as significant amendments to existing tax law, new regulations or interpretations by the taxing authorities, new information obtained during a tax examination, or resolution of an examination. The Company recognizes bothBoth accrued interest and penalties where appropriate, related to UTBs, inwhen incurred, are presented within general, administrative and other expenses inwithin the Consolidated Statements of Operations.

Tax laws are complex and subject to different interpretations by the taxpayer and respective governmental taxing authorities. Significant judgment is required in determining tax expense and in evaluating tax positions, including evaluating uncertainties under GAAP. The Company reviews its tax positions quarterly and adjusts its tax balances as new legislation is passed or new information becomes available.available.
Income Allocation
Income (loss) before taxes is allocated based on each partner’s average daily ownership of the Ares Operating Group entities for each year presented.
Earnings Per Common UnitShare
Basic earnings per share of Class A and non-voting common unit arestock is computed by dividing income available to Class A and non-voting common unitholdersstockholders by the weighted-average number shares of Class A and non-voting common unitsstock outstanding during the period. Income available to common unitholdersAres Management Corporation represents net income attributable to Ares Management, L.P. after given effectClass A and non-voting common stockholders. Basic earnings per share of Class A and non-voting common stock is computed by using the two-class method. The two-class method is an earnings allocation method under which earnings per share is calculated for shares of Class A and non-voting common stock and participating securities considering both dividends declared (or accumulated) and participation rights in undistributed earnings as if all such earnings had been distributed during the period. Because the holders of unvested restricted units have the right to preferred distributions paid.participate in dividends when declared, the unvested restricted units are considered participating securities to the extent they are expected to vest.
Diluted earnings per unitshare of Class A and non-voting common stock is computed by dividing income available to Class A and non-voting common unitholdersstockholders by the weighted-average number of shares of Class A and non-voting common unitsstock outstanding during the period, increased to include the number of additional shares of Class A common unitsstock that would have been outstanding if the potentially dilutive securities had been issued. Potentially dilutive securities include outstanding options to acquire units,shares of Class A common stock, unvested restricted units and AOG Units exchangeable for shares of Class A common units.stock. The effect of potentially dilutive securities is reflected in diluted earnings per unitshare of Class A and non-
F-18

Ares Management Corporation
Notes to the Consolidated Financial Statements (Continued)
(Dollars in Thousands, Except Share Data and As Otherwise Noted)
voting common stock using the more dilutive result of the treasury stock method or the two-class method.
Unvested share-based payment awards that contain non-forfeitable rights The treasury stock method is used to distribution or distribution equivalents (whether paid or unpaid) are participatingdetermine potentially dilutive securities resulting from options and are considered in the computation of earnings per unit pursuant to the two-class method. Unvestedunvested restricted units that pay distribution equivalents are deemed participating securities and are included in basic and diluted earnings per unit calculationgranted under the two-class method.Equity Incentive Plan.
Comprehensive Income (Loss)
Comprehensive income (loss) consists of net income (loss) and other appreciation (depreciation) affecting partners' capitalstockholders’ equity that, under GAAP, arehas been excluded from net income (loss).income. The Company'sCompany’s other comprehensive income (loss) includes foreign currency translation adjustments.
Recent Accounting Pronouncements
The Company considers the applicability and impact of all ASUs issued.accounting standard updates (“ASU”) issued by the Financial Accounting Standards Board (“FASB”). ASUs not listed below were assessed and either

F-18

Ares Management, L.P.
Notes to the Consolidated Financial Statements
(Dollars in Thousands, Except Unit Data and As Otherwise Noted)


determined to be not applicable or expected to have minimal impact on its consolidated financial statements.
Revenue Recognition:
In May 2014,November 2023, the FASB issued ASU 2014-09,Revenue from Contracts with Customers2023-07, Segment Reporting (Topic 606).280) Improvements to Reportable Segment Disclosures. ASU 2014-092023-07 requires entitiesdisclosure of significant segment expenses that are regularly provided to recognize revenue in a way that depicts the transferchief operating decision maker (“CODM”) and included within each reported measure of promised goodssegment profit or services to customers inloss, an amount that reflectsand description of its composition for other segment items to reconcile to segment profit or loss, and the consideration to which the entity expects to be entitled to in exchange for those goods or services. The guidance includes a five-step framework that requires an entity to: (i) identify the contract(s) with a customer, (ii) identify the performance obligations in the contract, (iii) determine the transaction price, (iv) allocate the transaction price to the performance obligations in the contract,title and (v) recognize revenue when the entity satisfies a performance obligation. This ASU provides alternative methods of adoption. In August 2015, the FASB issued ASU 2015-14,Revenue fromContracts with Customers, Deferralposition of the Effective Date. Company’s CODM. The amendments in this update also expand the interim segment disclosure requirements.ASU 2015-14 defers2023-07 is effective for the effective date of ASU 2014-09 by oneCompany’s fiscal year toending December 15, 20172024 and for fiscal years, andthe Company’s interim periods within those years, beginning after that datewith the first quarter ended 2025. Early adoption is permitted and permits early adoption of the standard, but not before the original effective date for fiscal years beginning after December 15, 2016. In March, April and May 2016, the FASB issued additional ASUs clarifying certain aspects of ASU 2014-09. The core principle of ASU 2014-09 was not changed by the additional guidance.
During 2016, four ASUs: ASU 2016-08, Revenue from Contracts with Customers (Topic 606): Principal versus Agent Considerations; ASU 2016-10, Revenue from Contracts with Customers (Topic 606): Identifying Performance Obligations and Licensing; ASU 2016-12, Revenue from Contracts with Customers (Topic 606): Narrow Scope Improvements and Practical Expedients; and ASU2016-20, Technical Corrections and Improvements to Topic 606, Revenue from Contracts with Customers, were issued to provide clarification to previously issued revenue recognition guidance (ASU 2014-09) that has not yet been implemented. These updatesamendments in this update are required to be adopted with ASU 2014-09, but are not expected to change its application by the Company.
The Company has substantially completed its assessment of the impact of the revenue recognition guidance. The assessment includesapplied on a detailed review of investment management agreements, establishing which agreements are expected to be in place, and understanding when revenue would be recognized under those agreements.
Accordingly, the Company has concluded that carried interests, which are a performance-based capital allocation to the Company based on cumulative fund performance to-date, represent equity method investments that are not in the scope of the amended revenue recognition guidance. Effective January 1, 2018, the Company will change its policy for recognition and measurement of carried interest. This accounting policy change will not change the timing or amount of revenue recognized related to carried interest. These amounts are currently recognized within performance fees in the Consolidated Statements of Operations. Under the equity method of accounting, the Company will recognize its allocations of carried interest or incentive fees along with the allocations proportionate to the Company’s ownership in each fund. The Company will apply a full retrospective application and prior periods presented will be recast. The impact of adoption will be a reclassification of carried interest to equity income and will have no impact on net income (loss) attributable to Ares Management, L.P.
The Company has concluded that the majority of its performance-based incentive fees are within the scope of the amended revenue recognition guidance. This accounting change will delay recognition of unrealized incentive fees compared to our current accounting treatment, and it is not expected to have a material impact on the Company’s consolidated financial statements.
The Company has evaluated the impact of the amended revenue recognition guidance on other revenue streams including management fees, and it is not expected to have a material impact on its consolidated financial statements. The Company has also concluded that considerations for reporting certain revenues gross versus net are not expected to have a material impact on its consolidated financial statements.
Other Guidance:
In February 2016, the FASB issued ASU 2016-02, Leases (Topic 842). The objective of the guidance in ASU 2016-02 is to increase transparency and comparability among organizations by recognizing lease assets and liabilities in the balance sheet and disclosing key information. ASU 2016-02 amends previous lease guidance, which required a lessee to categorize and account for leases as either operating leases or capital leases, and instead requires a lessee to recognize a lease liability and a right-of-use asset on the entity’s balance sheet for all leases with terms that exceed one year. The lease liability and right-of-use asset are to be carried at the present value of remaining expected future lease payments. The guidance should be applied using a modified retrospective approach. ASU 2016-02 is effective for public entities for annual reporting periods beginning after December 15,

F-19

Ares Management, L.P.
Notes to the Consolidated Financial Statements
(Dollars in Thousands, Except Unit Data and As Otherwise Noted)


2018 and interim periods within those reporting periods, with early adoption permitted.basis. The Company is currently compiling all leases and right–of–use terms to evaluateevaluating the impact of this guidance on its consolidated financial statements.


In May 2016,December 2023, the FASB issued ASU 2016-13, Financial Instruments - Credit Losses2023-09, Income Taxes (Topic 326): Measurement740) Improvements to Income Tax Disclosures. ASU 2023-09requires disclosure of Credit Losses on Financial Instruments. The objectivedisaggregated income taxes paid in both U.S. and foreign jurisdictions, prescribes standard categories for the components of the guidance ineffective tax rate reconciliation and modifies other income tax-related disclosures. ASU 2016-13 is to allow entities to recognize estimated credit losses in the period that the change in valuation occurs. ASU 2016-13 requires an entity to present financial assets measured on an amortized cost basis on the balance sheet net of an allowance for credit losses. Available for sale and held to maturity debt securities are also required to be held net of an allowance for credit losses. The guidance should be applied using a modified retrospective approach. ASU 2016-132023-09 is effective for public entities for annual reporting periods beginning afterthe Company’s fiscal year ending December 15, 2019 and interim periods within those reporting periods.31, 2025. Early adoption is permitted for annual and quarterly reporting periods beginning after December 15, 2018.the amendments in this update should be applied on a prospective basis, though retrospective adoption is permitted. The Company does not believeis currently evaluating the impact of this guidance will have a material impact on its consolidated financial statements.
In October 2016,
3. GOODWILL AND INTANGIBLE ASSETS
Intangible Assets, Net
The following table summarizes the FASB issued ASU 2016-16, Income Taxes (Topic 740): Intra-Entity Transferscarrying value, net of Assets Other Than Inventory. Current GAAP prohibits the recognition of current and deferred income taxes for an intra-entity asset transfer until the asset has been sold to an outside party. In addition, interpretations of this guidance have developed in practice for transfers of certain intangible and tangible assets. This prohibition on recognition is an exception to the principle of comprehensive recognition of current and deferred income taxes in GAAP. To more faithfully represent the economics of intra-entity asset transfers, the amendments in this ASU require that entities recognize the income tax consequences of an intra-entity transfer of an asset other than inventory when the transfer occurs. The amendments in this ASU do not change GAAP for the pre-tax effects of an intra-entity asset transfer under ASC 810, Consolidation, or for an intra-entity transfer of inventory. The guidance should be applied on a modified retrospective basis through a cumulative-effect adjustment directly to retained earnings asaccumulated amortization, of the beginningCompany’s intangible assets:
Weighted Average Amortization Period (in years) as of December 31, 2023As of December 31,
20232022
Management contracts4.3$604,242 $586,077 
Client relationships8.5200,920 262,301 
Trade nameN/A— 11,079 
Other0.8500 500 
Finite-lived intangible assets805,662 859,957 
Foreign currency translation1,126 935 
Total finite-lived intangible assets806,788 860,892 
Less: accumulated amortization(316,093)(220,472)
Finite-lived intangible assets, net490,695 640,420 
Indefinite-lived management contracts567,800 567,800 
Intangible assets, net$1,058,495 $1,208,220 
On October 2, 2023, the Company completed the acquisition of the period of adoption. ASU 2016-16 is effective for publicinvestment management business and related operating entities for annual reporting periods beginning after December 15, 2017, including interim reporting periods within those annual reporting periods with early adoption permitted.collectively doing business as Crescent Point Capital (“Crescent Point”) (the “Crescent Point Acquisition”). The Company does not believe this guidance will have a material impact on its consolidated financial statements.

In January 2017,Crescent Point Acquisition adds complementary investment capabilities to expand the FASB issued ASU 2017-01, Business Combinations (Topic 805): ClarifyingCompany’s presence in the Definition of a Business. ASU 2017-01 clarifiesAsia-Pacific region. Following the definition of a business with the objective of adding guidance to assist with evaluating whether a transaction should be accounted for as an acquisition or a disposal of a business. This ASU provides specific evaluation process, and factors that should be used in this determination. The guidance should be applied prospectively. ASU 2017-01 is effective for public entities for annual reporting periods beginning after December 15, 2017 and interim periods within those reporting periods, with early adoption permitted. This guidance will not have a material impact on the Company's consolidated financial statements.
In January 2017, the FASB issued ASU 2017-04, Intangibles - Goodwill and Other (Topic 350): Simplifying the Test for Goodwill Impairment. Currently, goodwill impairment requires an entity to perform a two-step test to determine the amount of goodwill impairment. In Step 1, an entity compares the fair value of a reporting unit with its carrying amount, including goodwill. If the carrying amountcompletion of the reporting unit exceeds its fair value,Crescent Point Acquisition, the entity performs Step 2 and compares the implied fair valueresults of goodwill with the carrying amount of that goodwill for that reporting unit. An impairment charge equal to the amount by which the carrying amount of goodwill for the reporting unit exceeds the implied fair value of that goodwill is recorded, limited to the amount of goodwill allocated to that reporting unit. ASU 2017-04 simplifies the goodwill impairment test by removing Step 2 of the test. An entity will apply a one-step quantitative test and record the amount of goodwill impairment as the excess of a reporting unit's carrying amount over its fair value, not to exceed the total amount of goodwill allocated to the reporting unit. The new guidance does not amend the optional qualitative assessment of goodwill impairment. The guidance should be applied prospectively. ASU 2017-04 is effective for public entities for annual reporting periods beginning after December 15, 2019 and interim periodsCrescent Point are presented within those reporting periods, with early adoption permitted. This guidance will not have a material impact on the Company's consolidated financial statements.
In February 2017, the FASB issued ASU 2017-05, Other Income-Gains and Losses from the Derecognition of Nonfinancial Assets (Subtopic 610-20): Clarifying the Scope of Asset Derecognition Guidance and Accounting for Partial Sales of Nonfinancial Assets. ASU 2017-05 clarifies the application of current accounting guidance to the derecognition of nonfinancial assets, including partial sales of nonfinancial assets. This ASU specifies that an entity should allocate the consideration to each distinct asset using the guidance established in ASC 606 on allocating the transaction price to performance obligations. For partial sales of nonfinancial assets, ASU 2017-05 also requires an entity to derecognize a portion of the nonfinancial asset when the entity no longer has a controlling financial interest in the legal entity holding the asset and the entity has transferred control of the asset in accordance with ASC 606. Any noncontrolling or retained interest should be measured at fair value. The guidance should be adopted using

F-20
F-19

Ares Management L.P.Corporation
Notes to the Consolidated Financial Statements (Continued)
(Dollars in Thousands, Except UnitShare Data and As Otherwise Noted)


either a full or modified retrospective approach. ASU 2017-05 is effective for public entities for annual reporting periods beginning after December 15, 2017 and interim periods within those reporting periods, with early adoption permitted. This guidance will not have a material impact on the Company's consolidated financial statements.
In May 2017, the FASB issued ASU 2017-09, Compensation-Stock Compensation (Topic 718): Scope of Modification Accounting. ASU 2017-09 clarifies the application of current accounting guidance to the modification of share-based compensation awards. This ASU specifies that an entity should account for the impact of an award modification in accordance with ASC Topic 718 unless all of the following conditions are met: (i) the fair value of the modified award is the same as the fair value of the original award prior to the modification; (ii) the vesting conditions of the modified award are the same as the original award prior to the modification; and (iii) the classification of the modified award as an equity instrument or liability instrument is the same as the original award. The guidance should be applied prospectively to awards modified on or after the adoption date. ASU 2017-09 is effective for public entities for annual reporting periods beginning after December 15, 2017 and interim periods within those reporting periods, with early adoption permitted. This guidance will not have a material impact on the Company's consolidated financial statements.

F-21

Ares Management, L.P.
Notes to the Consolidated Financial Statements
(Dollars in Thousands, Except Unit Data and As Otherwise Noted)


3. BUSINESS COMBINATIONS
Acquisition of EIF Management, LLC
In January 2015, the Company acquired of all of the outstanding membership interests of EIF Management, LLC (“EIF”), an asset manager in the U.S. power and energy assets industry. As a result of the acquisition, the Company expanded into an energy infrastructure equity strategy focused on generating long-term, cash-flowing investments in the power generation, transmission and midstream energy sector.
The acquisition date fair value of the consideration transferred totaled $149.2 million, which consisted of the following:
Cash$64,532
Equity (1,578,947 Ares Operating Group units)25,468
Contingent consideration59,171
Total$149,171
Private Equity Group. The Company allocated $90.6$32.7 million and $22.3 million of the purchase price to the fair value of the acquired net assets.management contracts and client relationships, respectively. The remaining $58.6acquired management contracts and client relationships had a weighted average amortization period from the date of acquisition of 5.5 years and 9.0 years, respectively.

During the year ended December 31, 2023, the Company recorded non-cash impairment charges of $78.7 million, including: (i) $65.7 million to the carrying value of client relationships from the purchase price was recorded as goodwill. The financial resultsacquisition of EIFLandmark Partners, LLC (the “Landmark Acquisition”) that are included within the consolidated financial statements presented herein. EIF is presented withinSecondaries Group, where the Company’s Private Equity Group segment.
The transaction included contingent consideration that is payable to EIF’s former membership interest holders if Ares successfully launches a new fund (“Fund V”) that meets certain revenue andprimary indicator of impairment was the lower expected fee paying commitment targets during Fund V’s commitment period. Theassets under management in a private equity secondaries fund from existing investors as of the date of the Landmark Acquisition; (ii) $4.6 million and $0.7 million to the fair value of management contracts of certain funds within the liability for contingent considerationReal Assets Group and Credit Group, respectively, in connection with lower than expected future fee revenue generated from these funds; and (iii) $7.8 million to the carrying value of SSG trade name as the Company rebranded Ares SSG as APAC credit and discontinued the use of the acquisition date was approximately $59.2 million, which includes cash and equity consideration that are not subject to vesting or are fully vested, and is included inSSG trade name.

During the purchase price consideration described above (see Note 11 for subsequent valuation adjustments). Additionally, in accordance with the membership interest purchase agreement, as part of the contingent consideration,year ended December 31, 2022, the Company also agreedrecorded non-cash impairment charges of $181.6 million to grant certain equity consideration that would generally vest ratably over a period of two to five years after Fund V’s final closing.
Supplemental information on an unaudited pro forma basis, as if the EIF acquisition had been consummated as of January 1, 2015 is as follows:
 Year Ended
 December 31, 2015
  
Total revenues$56,659
Net income attributable to Ares Management, L.P.$2,267
Earnings per common unit, basic and diluted$0.03
The unaudited pro forma supplemental information is based on estimates and assumptions, which the Company believes are reasonable. These results are not necessarily indicative of the Company’s consolidated financial condition or statements of operations in future periods or the results that actually would have been realized had the Company and EIF been a combined entity during the period presented. These amounts have been calculated after applying the Company’s accounting policies and adjusting the results of EIF to reflect the additional amortization that would have been charged assuming the fair value adjustmentsof a trade name and management contracts related to: (i) the decision to intangiblerebrand its secondaries group as Ares Secondaries and to discontinue the ongoing use of the Landmark trade name; (ii) the fair value of certain management contracts in connection with lower than expected fee paying assets had been applied on January 1, 2014, together withunder management; and (iii) the consequential tax effects.shorter expected lives of certain funds as a result of returning capital to fund investors sooner than initially planned.
Transaction Support Expense
On January 3, 2017, ARCC and American Capital, Ltd. (“ACAS”) consummated a merger transaction valued at approximately $4.2 billion (the "ARCC-ACAS Transaction"). To support the ARCC-ACAS Transaction, the Company, through its subsidiary Ares Capital Management LLC, which serves as the investment adviser to ARCC, paid $275.2 million to ACAS shareholders in accordance with the terms and conditions set forth in the merger agreement.

F-22

Ares Management, L.P.
Notes to the Consolidated Financial Statements
(Dollars in Thousands, Except Unit Data and As Otherwise Noted)


4. GOODWILL AND INTANGIBLE ASSETS
The following table summarizes the carrying value for the Company's intangible assets:
 Weighted Average Amortization Period as of As of December 31,
 December 31, 2017 2017 2016
Management contracts2.0 years $67,306
 $111,939
Client relationships10.5 years 38,600
 38,600
Trade name4.5 years 3,200
 3,200
Intangible assets, gross  109,106

153,739
Foreign currency translation  
 (3,205)
Total intangible assets acquired  109,106

150,534
Less: accumulated amortization  (68,641) (92,219)
Intangible assets, net  $40,465

$58,315

Amortization expense associated with intangible assets, excluding the accelerated amortization described above, was $17.9$126.0 million, $26.6$133.6 million and $46.2$91.3 million for the years ended December 31, 2017,  20162023, 2022 and 2015,2021, respectively, and is presented within general, administrative and other expenses within the Consolidated Statements of Operations. During 2017,the year ended December 31, 2023, the Company removed $41.4$109.3 million of impaired and fully-amortized intangible assets that were fully amortized.assets.
At
As of December 31, 2017,2023, future annual amortization of finite-lived intangible assets for the years 20182024 through 20222028 and thereafter is estimated to be:
YearAmortization
2024$115,722 
2025102,987 
202677,047 
202762,907 
202838,904 
Thereafter93,128 
Total$490,695 
YearAmortization
2018$9,031
20194,458
20204,071
20213,987
20223,192
Thereafter15,726
Total$40,465

Goodwill

The following table summarizes the carrying value of the Company'sCompany’s goodwill:
Credit GroupPrivate Equity GroupReal Assets GroupSecondaries GroupOtherTotal
Balance as of December 31, 2021$32,196 $58,600 $53,339 $417,738 $226,099 $787,972 
Acquisitions— — 213,314 (96)— 213,218 
Reallocation— (10,530)10,530 — — — 
Foreign currency translation— — — (22)(1,512)(1,534)
Balance as of December 31, 202232,196 48,070 277,183 417,620 224,587 999,656 
Acquisitions— 124,392 22 — — 124,414 
Reallocation224,587 — — — (224,587)— 
Foreign currency translation(104)— — 10 — (94)
Balance as of December 31, 2023$256,679 $172,462 $277,205 $417,630 $ $1,123,976 

In connection with the Crescent Point Acquisition, the Company allocated $124.4 million of the purchase price to goodwill.

F-20

Ares Management Corporation
Notes to the Consolidated Financial Statements (Continued)
(Dollars in Thousands, Except Share Data and As Otherwise Noted)
In connection with the SSG Buyout described in “Note 13. Equity and Redeemable Interest,” the former Ares SSG reporting unit has been transferred in its entirety to the Credit Group and the total goodwill assets:of $224.6 million has been reallocated accordingly.

 Credit Private
Equity
 Real
Estate
 Total
Balance as of December 31, 2015$32,196
 $58,600
 $53,271
 $144,067
Foreign currency translation
 
 (343) (343)
Balance as of December 31, 201632,196

58,600

52,928

143,724
Foreign currency translation
 
 171
 171
Balance as of December 31, 2017$32,196
 $58,600
 $53,099
 $143,895
There was no impairment of goodwill recorded during the years ended December 31, 2017, 20162023 and 2015.2022. The impact of foreign currency translation is reflected within other comprehensive income.income within theConsolidated Statements of Comprehensive Income.


F-23

Ares Management, L.P.
Notes to the Consolidated Financial Statements
(Dollars in Thousands, Except Unit Data and As Otherwise Noted)


5.4. INVESTMENTS

The following table summarizes the Company’s investments are comprised of: (i) equity method investments, (ii) other investments and (iii) held-to-maturity investments. investments:
Investments, excluding held-to-maturity investments
As ofPercentage of total investments as of
December 31,December 31,
2023202220232022
Equity method investments:
Equity method - carried interest
$3,413,007 $3,106,577 73.8%78.2%
Equity method private investment partnership interests - principal535,292 543,592 11.613.7
Equity method private investment partnership interests and other (held at fair value)418,778 123,170 9.03.1
Equity method private investment partnership interests and other44,989 47,439 1.01.2
Total equity method investments4,412,066 3,820,778 95.496.2
Fixed income securities105,495 51,771 2.31.2
Collateralized loan obligations20,799 25,163 0.40.6
Collateralized loan obligations and fixed income securities, at fair value126,294 76,934 2.71.8
Common stock, at fair value86,572 77,022 1.92.0
Total investments$4,624,932 $3,974,734 
   

Percentage of total investments
 December 31, December 31,
 2017 2016 2017 2016
Private Investment Partnership Interests:       
Equity method private investment partnership interests(1)$369,774
 $309,512
 57.1% 68.5%
Other private investment partnership interests, at fair value80,767
 53,229
 12.5% 11.8%
Total private investment partnership interests450,541

362,741
 69.6% 80.3%
Collateralized Loan Obligations:       
Collateralized loan obligations, at fair value195,158

89,111
 30.1% 19.7%
Common Stock:       
Common stock, at fair value1,636

100
 0.3% 0.0%
Total investments$647,335

$451,952


(1)Investment or portion of the investment is denominated in foreign currency and is translated into U.S. dollars at each reporting date.


Equity Method Investments

The Company’s equity method investments include investments that are not consolidated but over which the Company exerts significant influence. The Company evaluates each of its equity method investments to determine if any were significant as defined by guidance from the United States Securities and Exchange Commission.SEC. As of and for the years ended December 31, 2017, 20162023, 2022 and 2015,2021, no individual equity method investment held by the Company met the significance criteria. As such, the Company is not required to present separate financial statements for any of its equity method investments.


F-24

Ares Management, L.P.
Notes to the Consolidated Financial Statements
(Dollars in Thousands, Except Unit Data and As Otherwise Noted)


The following tables present summarized financial information for the Company'sCompany’s equity method investments, forwhich are primarily funds managed by the years ended December 31, 2017, 2016 and 2015.Company:

As of and for the Year Ended December 31, 2023
Credit GroupPrivate Equity GroupReal Assets GroupSecondaries GroupOtherTotal
Statement of Financial Condition
Investments$21,366,223 $6,971,840 $17,757,664 $13,497,266 $38,212 $59,631,205 
Total assets23,015,503 7,110,511 18,792,446 13,808,556 38,284 62,765,300 
Total liabilities5,152,522 130,727 6,528,302 3,632,879 418 15,444,848 
Total equity17,862,981 6,979,784 12,264,144 10,175,677 37,866 47,320,452 
Statement of Operations
Revenues$2,123,547 $594,464 $1,036,710 $1,960 $— $3,756,681 
Expenses(759,485)(191,613)(632,433)(482,478)(1,658)(2,067,667)
Net realized and unrealized gains (losses) from investments247,619 600,322 (599,200)373,064 (7,316)614,489 
Income tax expense(5,192)(555)(10,197)— (19)(15,963)
Net income (loss)$1,606,489 $1,002,618 $(205,120)$(107,454)$(8,993)$2,287,540 

F-21
 As of December 31, 2017 and the Year then Ended
 Credit Private Equity Real Estate Total
Statement of Financial Condition(1)       
Investments$5,903,009
 $9,849,829
 $2,997,789
 $18,750,627
Total assets6,435,364
 10,033,790
 3,174,149
 19,643,303
Total liabilities665,680
 519,349
 202,174
 1,387,203
Total equity5,769,684
 9,514,441
 2,971,975
 18,256,100
        
Statement of Operations(1)       
Revenues$603,682
 $144,829
 $154,967
 $903,478
Expenses(169,086) (91,803) (67,396) (328,285)
Net realized and unrealized gain from investments41,185
 2,335,027
 365,091
 2,741,303
Income tax expense(2,700) (31,359) (13,092) (47,151)
Net income$473,081
 $2,356,694
 $439,570
 $3,269,345

 As of December 31, 2016 and the Year then Ended
 Credit Private Equity Real Estate Total
Statement of Financial Condition(1)       
Investments$4,365,460
 $8,857,500
 $2,477,523
 $15,700,483
Total assets4,884,680
 9,143,070
 2,625,264
 16,653,014
Total liabilities522,443
 197,380
 510,252
 1,230,075
Total equity4,362,237
 8,945,690
 2,115,012
 15,422,939
        
Statement of Operations(1)       
Revenues$416,228
 $839,723
 $114,937
 $1,370,888
Expenses(107,465) (134,573) (77,021) (319,059)
Net realized and unrealized gain from investments36,316
 1,489,624
 171,467
 1,697,407
Income tax expense(345) (27,587) (5,380) (33,312)
Net income$344,734
 $2,167,187
 $204,003
 $2,715,924
(1)In prior year presentation, certain funds that are equity method investments were not included in the table above. Current year presentation has been recast to show this immaterial prior period disclosure.


F-25

Ares Management L.P.Corporation
Notes to the Consolidated Financial Statements (Continued)
(Dollars in Thousands, Except UnitShare Data and As Otherwise Noted)


As of and for the Year Ended December 31, 2022
Credit GroupPrivate Equity GroupReal Assets GroupSecondaries GroupOtherTotal
Statement of Financial Condition
Investments$17,633,914 $9,376,032 $13,052,820 $12,719,333 $51,239 $52,833,338 
Total assets20,883,559 9,947,821 14,440,914 12,931,082 51,825 58,255,201 
Total liabilities5,770,070 937,326 5,007,250 3,716,111 6,615 15,437,372 
Total equity15,113,489 9,010,495 9,433,664 9,214,971 45,210 42,817,829 
Statement of Operations
Revenues$1,341,368 $271,873 $618,796 $2,874 $— $2,234,911 
Expenses(438,690)(153,372)(357,845)(289,741)(1,500)(1,241,148)
Net realized and unrealized gains (losses) from investments12,464 (482,260)304,068 (11,173)1,365 (175,536)
Income tax expense(4,724)92 (36,501)— (10)(41,143)
Net income (loss)$910,418 $(363,667)$528,518 $(298,040)$(145)$777,084 

 For the Year Ended December 31, 2015
 Credit Private Equity Real Estate Total
Statement of Operations(1)       
Revenues$313,833
 $350,444
 $95,340
 $759,617
Expenses(60,389) (124,216) (65,340) (249,945)
Net realized and unrealized gain from investments(118,035) 243,470
 86,074
 211,509
Income tax expense(3,293) (22,004) (13,104) (38,401)
Net income$132,116
 $447,694
 $102,970
 $682,780
As of and for the Year Ended December 31, 2021
Credit GroupPrivate Equity GroupReal Assets GroupSecondaries GroupOtherTotal
Statement of Operations
Revenues$1,342,427 $229,539 $326,507 $911 $— $1,899,384 
Expenses(305,452)(177,380)(170,008)(89,281)(22,609)(764,730)
Net realized and unrealized gains (losses) from investments438,083 2,161,730 1,179,698 1,399,009 (4,898)5,173,622 
Income tax benefit (expense)(4,511)(19,125)(1,167)— — (24,803)
Net income (loss)$1,470,547 $2,194,764 $1,335,030 $1,310,639 $(27,507)$6,283,473 
(1)In prior year presentation, certain funds that are equity method investments were not included in the table above. Current year presentation has been recast to show this immaterial prior period disclosure.


The Company recognizedfollowing table presents the Company’s other income, net gains relatedfrom to its equity method investments, of $66.8 million, $57.1 million and $23.8 million for the years ended December 31, 2017, 2016 and 2015, respectively,which were included within principal investment income, net realized and unrealized gaingains on investments, and within interest and dividend income within the Consolidated Statements of Operations.Operations:
.
Year ended December 31,
202320222021
Total other income, net related to equity method investments$86,729 $21,657 $114,856 
The material assets of
With respect to the Company'sCompany’s equity method investments, the material assets are expected to generate either long-termlong term capital appreciation and and/or interest income, the material liabilities are debt instruments collateralized by, or related to, the financing of the assets and net income is materially comprised of the changes in fair value of these net assets.

Held-to-Maturity Investments
The Company classifies certain investments as held-to-maturity investments whenfollowing table summarizes the Company has the positive intent and ability to hold the securities to maturity. Held-to-maturity securities are reported as investments and are recorded at amortized cost. A summary of the cost andchanges in fair value of CLO notes classified as held-to maturitythe Company’s equity method investments is as follows:held at fair value, which are included within net realized and unrealized gains on investments within the Consolidated Statements of Operations:
Year ended December 31,
202320222021
Equity method private investment partnership interests and other (held at fair value)$50,772 $5,626 $7,100 


F-22
 As of December 31,
 2017 2016
Amortized cost$
 $16,519
Unrealized loss, net
 (116)
Fair value$
 $16,403
Based on the Company's ability and intent to hold the investments until maturity and the underlying credit performance of such investments, the Company has determined that the net unrealized losses are temporary impairments as of December 31, 2016.
During the year ended December 31, 2017, the Company redeemed its remaining held-to-maturity investments balance of $18.5 million at par, which approximated the amortized cost, with no gain or loss recognized. Redemption occurred in connection with the restructuring and refinancing of the underlying collateral facility during the year ended December 31, 2017.

F-26

Ares Management L.P.Corporation
Notes to the Consolidated Financial Statements (Continued)
(Dollars in Thousands, Except UnitShare Data and As Otherwise Noted)


Investments of the Consolidated Funds
Investments
The following table summarizes investments held in the Consolidated Funds are summarized below:Funds:
Fair Value as ofPercentage of total investments as of
December 31,December 31,
2023202220232022
Fixed income investments:
Loans and securitization vehicles$10,616,458 $9,280,522 72.7%70.3%
Bonds578,949 786,961 4.06.0
Money market funds and U.S. treasury securities523,038 1,013,382 3.67.7
Total fixed income investments11,718,445 11,080,865 80.384.0
Partnership interests1,642,489 1,392,169 11.210.5
Equity securities1,240,653 731,599 8.55.5
Total investments, at fair value$14,601,587 $13,204,633 

 Fair value at Fair value as a percentage of total investments at
 December 31, December 31, December 31, December 31,
 2017 2016 2017 2016
United States:       
Fixed income securities:       
Consumer discretionary$1,295,732
 $665,773
 23.2% 20.0%
Consumer staples55,073
 64,840
 1.0% 1.9%
Energy176,836
 45,409
 3.2% 1.4%
Financials270,520
 139,285
 4.8% 4.2%
Healthcare, education and childcare449,888
 246,403
 8.1% 7.4%
Industrials370,926
 149,632
 6.6% 4.5%
Information technology167,089
 194,394
 3.0% 5.8%
Materials185,170
 139,994
 3.3% 4.2%
Telecommunication services399,617
 261,771
 7.2% 7.9%
Utilities77,102
 47,800
 1.4% 1.4%
Total fixed income securities (cost: $3,459,318 and $1,945,977 at December 31, 2017 and 2016, respectively)3,447,953

1,955,301
 61.8%
58.7%
Equity securities:       
Energy126
 421
 0.0% 0.0%
Total equity securities (cost: $2,265 and $2,872 at December 31, 2017 and 2016, respectively)126
 421
 0.0% 0.0%
Partnership interests:       
Partnership interests232,332
 171,696
 4.2% 5.2%
Total partnership interests (cost: $190,000 and $147,000 at December 31, 2017 and 2016, respectively)232,332

171,696
 4.2%
5.2%

F-27

Ares Management, L.P.
Notes to the Consolidated Financial Statements
(Dollars in Thousands, Except Unit Data and As Otherwise Noted)


 Fair value at Fair value as a percentage of total investments at
 December 31, December 31, December 31, December 31,
 2017 2016 2017 2016
Europe:       
Fixed income securities:       
Consumer discretionary$604,608
 $274,678
 10.8% 8.2%
Energy2,413
 
 0.0% %
Consumer staples76,361
 39,197
 1.4% 1.2%
Financials81,987
 28,769
 1.5% 0.9%
Healthcare, education and childcare209,569
 111,589
 3.8% 3.4%
Industrials145,706
 118,466
 2.6% 3.6%
Information technology21,307
 49,507
 0.4% 1.5%
Materials213,395
 124,629
 3.8% 3.7%
Telecommunication services182,543
 118,632
 3.3% 3.6%
Utilities
 4,007
 % 0.1%
Total fixed income securities (cost: $1,545,297 and $892,108 at December 31, 2017 and 2016, respectively)1,537,889

869,474
 27.6%
26.2%
Equity securities:       
Consumer staples
 1,517
 % 0.0%
Healthcare, education and childcare63,155
 41,329
 1.1% 1.2%
Telecommunication services
 24
 % 0.0%
Total equity securities (cost: $67,198 and $67,290 at December 31, 2017 and 2016, respectively)63,155

42,870
 1.1%
1.2%
Asia and other:       
Fixed income securities:       
Consumer discretionary2,008
 24,244
 0.0% 0.7%
Financials12,453
 1,238
 0.2% 0.0%
Healthcare, education and childcare
 10,010
 % 0.3%
Telecommunication services21,848
 8,696
 0.4% 0.3%
Total fixed income securities (cost: $36,180 and $46,545 at December 31, 2017 and 2016, respectively)36,309

44,188
 0.6%
1.3%
Equity securities:       
Consumer discretionary59,630
 44,642
 1.1% 1.3%
Consumer staples45,098
 50,101
 0.8% 1.5%
Healthcare, education and childcare44,637
 32,598
 0.8% 1.0%
Industrials16,578
 16,578
 0.3% 0.5%
Total equity securities (cost: $122,418 and $122,418 at December 31, 2017 and 2016, respectively)165,943

143,919
 3.0%
4.3%

F-28

Ares Management, L.P.
Notes to the Consolidated Financial Statements
(Dollars in Thousands, Except Unit Data and As Otherwise Noted)


 Fair value at Fair value as a percentage of total investments at
 December 31, December 31, December 31, December 31,
 2017 2016 2017 2016
Canada:       
Fixed income securities:       
Consumer discretionary$6,757
 $
 0.1% $
Consumer staples15,351
 5,256
 0.3% 0.2%
Energy33,715
 12,830
 0.6% 0.4%
Healthcare, education and childcare
 15,509
 % 0.5%
Industrials18,785
 1,401
 0.3% 0.0%
Telecommunication services6,189
 13,852
 0.1% 0.4%
Total fixed income securities (cost: $80,201 and $48,274 at December 31, 2017 and 2016, respectively)80,797

48,848
 1.4%
1.5%
Equity securities:       
Consumer discretionary5,912
 164
 0.1% 0.0%
Total equity securities (cost: $17,202 and $408 at December 31, 2017 and 2016, respectively)5,912
 164
 0.1% 0.0%
Australia:       
Fixed income securities:       
Consumer discretionary10,863
 5,627
 0.2% 0.2%
Energy1,563
 6,046
 0.0% 0.2%
Industrials
 2,926
 % 0.1%
Utilities
 21,154
 % 0.6%
Total fixed income securities (cost: $12,714 and $37,975 at December 31, 2017 and 2016, respectively)12,426

35,753
 0.2%
1.1%
Equity Securities:       
Utilities
 17,569
 % 0.5%
Total equity securities (cost: $0 and $18,442 at December 31, 2017 and 2016, respectively)

17,569
 %
0.5%
Total fixed income securities5,115,374
 2,953,564
 91.6% 88.8%
Total equity securities235,136
 204,943
 4.2% 6.0%
Total partnership interests232,332
 171,696
 4.2% 5.2%
Total investments, at fair value$5,582,842

$3,330,203


At December 31, 20172023 and 2016, 2022, no single issuer or investments,investment, including derivative instruments and underlying portfolio investments of the Consolidated Funds, had a fair value that exceeded 5.0% of the Company’s total assets.


F-29

Ares Management, L.P.
Notes to the Consolidated Financial Statements
(Dollars in Thousands, Except Unit Data and As Otherwise Noted)


6.5. FAIR VALUE
Financial Instrument Valuations
The valuation techniques used by the Company to measure fair value maximize the use of observable inputs and minimize the use of unobservable inputs. The valuation techniques applied to investments held by the Company and by the Consolidated Funds vary depending on the nature of the investment.
CLOs and CLO loan obligations: The fair value of fixed income CLOs held by the Company are estimated based on variouseither a third-party pricing servicesservice or broker quotesquote and are classified as Level III. The Company adopted ASU 2014-13 asmeasures its CLO loan obligations of January 1, 2016, under which the CompanyConsolidated Funds by first determinesdetermining whether the fair values of the financial assets or financial liabilities of its consolidatedConsolidated CLOs are more observable.
Contingent consideration: The Company determined thatgenerally determines the fair value of its contingent consideration liabilities by using a probability weighted expected return method, including the financial assetsMonte Carlo simulation model. These models consider a range of assumptions including historical experience, prior period performance, current progress towards targets, probability-weighted scenarios, and management’s own assumptions. The discount rate used is determined based on the consolidated CLOs, whichweighted average cost of capital for the Company. Once the associated targets are mostly Level II assets, are more observable thanachieved, the contingent consideration is reported at the settlement amount. The fair value of the financialCompany’s contingent consideration liabilities of its consolidated CLOs, which are mostly Level III liabilities. As a result, the financial assets of consolidated CLOs are measured at fair value and the financial liabilities of the consolidated CLOs are measured in consolidation as: (1) the sum of the fair value of the financial assets, and the carrying value of any nonfinancial assets held temporarily, less (2) the sum of the fair value of any beneficial interests retained by the Company (other than those that represent compensation for services), and the Company’s carrying value of any beneficial interests that represent compensation for services. The resulting amount is allocated to the individual financial liabilities (other than the beneficial interests retained by the Company).
Prior to 2016, the Company had elected the fair value option to measure its CLO loan obligations as the Company had determined that the fair value of these obligations better correlated with the value of the assets held by the CLOs, which are held to provide the cash flows for the note obligations. The fair value of CLO liabilities was estimated based on various third-party pricing service and internal valuation models. The valuation models utilized discounted cash flows and took into consideration prepayment and loss assumptions, based on historical experience and projected performance, economic factors, the characteristics and condition of the underlying collateral, comparable yields for similar securities and recent trading activity. These securities were classified as Level III. Liabilities recorded in connection with the Company’s contingent consideration are included within accounts payable, accrued expenses and other liabilities in the ConsolidatedStatements of Financial Condition and the associated changes in fair value are included within other income, net in the Consolidated Statements of Operations.
Corporate debt, bonds, bank loans, securitization vehicles and derivative instruments: The fair value of corporate debt, bonds, bank loans, securitization vehicles and derivative instruments is estimated based on quoted market prices, dealer quotations or alternative pricing sources supported by observable inputs. These investments are generally classified withinas Level II. The Company obtains prices from independent pricing services that generally utilize broker quotes and may use various other pricing techniques, which take into account appropriate factors such as yield, quality, coupon rate, maturity, type of issue, trading characteristics and other data. If management is only able to obtain a single broker quote, or utilizeutilizes a pricing model, such securities will generally be classified as Level III.
Equity and equity-related securities: Securities traded on a national securities exchange are stated at the last reported sales price on the day of valuation. To the extent these securities are actively traded and valuation adjustments are not applied, they are classified as Level I. Securities that trade in markets that are not considered to be active but are valued based on quoted market prices, dealer quotations or alternative pricing sources supported by observable inputs obtained by the Company from independent pricing services are classified as Level II. Securities that have market prices that are not readily available, utilize
F-23

Ares Management Corporation
Notes to the Consolidated Financial Statements (Continued)
(Dollars in Thousands, Except Share Data and As Otherwise Noted)
valuation models of third-party pricing service or internal models using unobservable inputs to determine the fair value are classified as Level III.
Money market funds and U.S. treasury securities: The fair value of money market funds and U.S. treasury securities is estimated using quoted market prices in active markets. These investments are classified as Level I.
Partnership interests: The Company generally values its investments using the NAV per share equivalent calculated by the investment manager as a practical expedient to determining an independent fair value or estimates based on various valuation models of third-party pricing services, as well as internal models. The Company does not categorize within the fair value hierarchy investments where fair value is measured using the net asset value per share practical expedient.
Certain investments of the Company are valued at NAV per share of the fund. In limited circumstances, the Company may determine, based on its own due diligence and investment procedures, that NAV per share does not represent fair value. In such circumstances, the Company will estimate the fair value in good faith and in a manner that it reasonably chooses, in accordance with the requirements of GAAP.chooses. As of December 31, 20172023 and 2016,2022, NAV per share represents the fair value of the Company’s investments for the Company and discountedin partnership interests. Discounted cash flow analysis ismodel has been used to determine the fair value forof an investment in a partnership interest held by the Consolidated Funds.Funds where NAV per share was not deemed to be representative of fair value.

The substantial majority of the Company'sCompany’s private commingled funds are closed-ended, and accordingly, do not permit investors to redeem their interests other than in limited circumstances that are beyond the control of the Company, such as instances

F-30

Ares Management, L.P.
Notes to the Consolidated Financial Statements
(Dollars in Thousands, Except Unit Data and As Otherwise Noted)


in which retaining the interest could cause the investor to violate a law, regulation or rule. Investors inThe Company also has open-ended and evergreen funds where investors have the right to withdraw their capital, subject to the terms of the respective constituent documents, over periods generally ranging from one month to three years. In addition, separately managed investmentthe Company has minority investments in vehicles forthat may only have a single fundother investor that may allow such investors to terminate the fund at the discretion of the investor pursuant to the terms of the applicable constituent documents of such vehicle.
Contingent consideration: The Company generally determines the fair value of its contingent consideration liabilities by using a discounted cash flow approach based on the most likely outcome. The most likely outcome is determined using the best information available, which may be based on one or more of the following factors: historical experience, prior period performance, current progress towards targets, probability-weighted scenarios, and management's own assumptions. The discount rate used is determined based on the weighted average cost of capital for the Company. The fair value of the Company's contingent consideration liabilities are classified as Level III. Contingent consideration liabilities are included within accounts payable, accrued expenses and other liabilities in the Consolidated Statements of Financial Condition.
Level III Valuations
In the absence of observable market prices, the Company values Level III investments using consistent valuation methodologies, typically market- or income-based approaches. The main inputs into the Company’s valuation model for Level III securities include earnings multiples (based on the historical earnings of the issuer) and discounted cash flows. The Company may also consider original transaction price, recent transactions in the same or similar instruments, completed third‑party transactions in comparable instruments and other liquidity, credit and market risk factors. The quarterly valuation process for Level III investments begins with each investment or loan being valued by the investment or valuation teams. The valuations are then reviewed and approved by the valuation committee, which consists of senior members of the investment team and other senior managers. All Level III investment values are ultimately approved by the valuation committees and designated investment professionals. For certain investments, the valuation process also includes a review by independent valuation parties, at least annually, to determine whether the fair values determined by management are reasonable. Results of the valuation process are evaluated each quarter, including an assessment of whether the underlying calculations should be adjusted. In connection with this process, the Company evaluates changes in fair value measurements from period to period for reasonableness, considering items such as industry trends, general economic and market conditions and factors specific to the investment.
Certain Level III assets are valued using prices obtained from brokers or pricing vendors. The Company typically obtains one to two non-binding broker quotes. The Company seeks to obtain at least one quote directly from a broker making a market for the asset and one price from a pricing vendor for each security or similar securities. For investments where more than one quote is received, the investments are classified as Level II. For investments where only one quote is received, the investments are classified as Level III as the quoted prices may be indicative of securities that are in an inactive market, or may require adjustment for investment-specific factors or restrictions. Generally, the Company does not adjust any of the prices received from these sources but material prices are reviewed against the Company’s valuation models with a limited exception for securities that are deemed to have no value. The Company evaluates the prices obtained from brokers and pricing vendors based on available market information, including trading activity of the subject or similar securities or by performing a comparable security analysis to ensure that fair values are reasonably estimated. The Company may also perform back-testing of valuation information obtained from brokers and pricing vendors against actual prices received in transactions to validate pricing discrepancies. In addition to on-going monitoring and back-testing, the Company performs due diligence procedures over pricing vendors to understand their methodology and controls to support their use in the valuation process and to ensure compliance with required accounting disclosures.


F-31
F-24

Ares Management L.P.Corporation
Notes to the Consolidated Financial Statements (Continued)
(Dollars in Thousands, Except UnitShare Data and As Otherwise Noted)


Fair Value of Financial Instruments Held by the Company and Consolidated Funds
The following tables below summarize the financial assets and financial liabilities measured at fair value for the Company and the Consolidated Funds as of December 31, 2017:2023:
Financial Instruments of the CompanyLevel I Level II Level III Investments Measured at NAVTotal 
Assets, at fair value
Investments:
Common stock and other equity securities$— $86,572 $412,491 $— $499,063 
Collateralized loan obligations and fixed income securities— — 126,294 — 126,294 
Partnership interests— — — 6,287 6,287 
Total investments, at fair value— 86,572 538,785 6,287 631,644 
Derivatives-foreign currency forward contracts— 1,129 — — 1,129 
Total assets, at fair value$ $87,701 $538,785 $6,287 $632,773 
Liabilities, at fair value
Derivatives-foreign currency forward contracts$— $(2,645)$— $— $(2,645)
Total liabilities, at fair value$ $(2,645)$ $ $(2,645)

Financial Instruments of the Consolidated FundsLevel I Level II Level III Investments Measured at NAVTotal 
Assets, at fair value
Investments:
Fixed income investments:
Loans and securitization vehicles$— $9,879,915 $736,543 $— $10,616,458 
Bonds— 575,379 3,570 — 578,949 
Money market funds and U.S. treasury securities523,038 — — — 523,038 
Total fixed income investments523,038 10,455,294 740,113 — 11,718,445 
Partnership interests— — — 1,642,489 1,642,489 
Equity securities47,503 2,750 1,190,400 — 1,240,653 
Total investments, at fair value570,541 10,458,044 1,930,513 1,642,489 14,601,587 
Derivatives-foreign currency forward contracts— 9,126 — — 9,126 
Total assets, at fair value$570,541 $10,467,170 $1,930,513 $1,642,489 $14,610,713 
Liabilities, at fair value
Loan obligations of CLOs$— $(12,345,657)$— $— $(12,345,657)
Derivatives:
Foreign currency forward contracts— (9,491)— — (9,491)
Asset swaps— — (1,291)— (1,291)
Total derivative liabilities, at fair value— (9,491)(1,291)— (10,782)
Total liabilities, at fair value$ $(12,355,148)$(1,291)$ $(12,356,439)

F-25

Financial Instruments of the Company
 Level I  Level II  Level III  Investments
Measured
at NAV
 Total 
Assets, at fair value          
Investments:          
Fixed income - collateralized loan obligations $
 $
 $195,158
 $
 $195,158
Equity securities 520
 1,116
 
 
 1,636
Partnership interests 
 
 44,769
 35,998
 80,767
Total investments, at fair value 520

1,116

239,927

35,998

277,561
Derivatives-foreign exchange contracts 
 498
 
 
 498
Total assets, at fair value $520

$1,614

$239,927

$35,998

$278,059
Liabilities, at fair value          
Derivatives-foreign exchange contracts $
 $(2,639) $
 $
 $(2,639)
  Total liabilities, at fair value $

$(2,639)
$

$

$(2,639)
Financial Instruments of Consolidated Funds Level I  Level II  Level III  Total 
Assets, at fair value        
Investments:        
Fixed income investments:        
Bonds $
 $82,151
 $7,041
 $89,192
Loans 
 4,755,335
 260,848
 5,016,183
Collateralized loan obligations 
 10,000
 
 10,000
Total fixed income investments 

4,847,486

267,889

5,115,375
Equity securities 72,558
 
 162,577
 235,135
Partnership interests 
 
 232,332
 232,332
Other 


Total investments, at fair value 72,558

4,847,486

662,798

5,582,842
   Derivatives:        
Foreign exchange contracts 


Asset swaps - other 
 
 1,366
 1,366
  Total derivative assets, at fair value 


1,366

1,366
Total assets, at fair value $72,558

$4,847,486

$664,164

$5,584,208
Liabilities, at fair value        
Asset swaps - other $
 $
 $(462) $(462)
Loan obligations of CLOs 
 (4,963,194) 
 (4,963,194)
  Total liabilities, at fair value $

$(4,963,194)
$(462)
$(4,963,656)

F-32

Ares Management L.P.Corporation
Notes to the Consolidated Financial Statements (Continued)
(Dollars in Thousands, Except UnitShare Data and As Otherwise Noted)


The following tables below summarize the financial assets and financial liabilities measured at fair value for the Company and the Consolidated Funds as of December 31, 2016:2022:
Financial Instruments of the CompanyLevel I Level II Level III Investments Measured at NAVTotal 
Assets, at fair value
Investments:
Common stock and other equity securities$— $77,022 $121,785 $— $198,807 
Collateralized loan obligations and fixed income securities— — 76,934 — 76,934 
Partnership interests— — — 1,385 1,385 
Total investments, at fair value— 77,022 198,719 1,385 277,126 
Derivatives-foreign currency forward contracts— 4,173 — — 4,173 
Total assets, at fair value$ $81,195 $198,719 $1,385 $281,299 
Liabilities, at fair value
Derivatives-foreign currency forward contracts$— $(3,423)$— $— $(3,423)
Total liabilities, at fair value$ $(3,423)$ $ $(3,423)

Financial Instruments of the Consolidated FundsLevel ILevel IILevel IIIInvestments Measured at NAVTotal
Assets, at fair value
Investments:
Fixed income investments:
Loans and securitization vehicles$— $8,663,678 $616,844 $— $9,280,522 
Money market funds and U.S. treasury securities1,013,382 — — — 1,013,382 
Bonds— 534,137 252,824 — 786,961 
Total fixed income investments1,013,382 9,197,815 869,668 — 11,080,865 
Partnership interests— — 368,655 1,023,514 1,392,169 
Equity securities719 — 730,880 — 731,599 
Total investments, at fair value1,014,101 9,197,815 1,969,203 1,023,514 13,204,633 
Derivatives-foreign currency forward contracts— 2,900 — — 2,900 
Total assets, at fair value$1,014,101 $9,200,715 $1,969,203 $1,023,514 $13,207,533 
Liabilities, at fair value
Loan obligations of CLOs$— $(10,701,720)$— $— $(10,701,720)
Derivatives:
Warrants(9,326)— — — (9,326)
Asset swaps— — (3,556)— (3,556)
 Foreign currency forward contracts— (2,942)— — (2,942)
Total derivative liabilities, at fair value(9,326)(2,942)(3,556)— (15,824)
Total liabilities, at fair value$(9,326)$(10,704,662)$(3,556)$ $(10,717,544)


F-26

Financial Instruments of the Company
 Level I  Level II  Level III  Investments
Measured
at NAV(1)
 Total 
Assets, at fair value          
Investments:          
Fixed income - collateralized loan obligations $
 $
 $89,111
 $
 $89,111
Equity securities 100


 100
Partnership interests 
 
 33,410
 19,819
 53,229
Total investments, at fair value 100
 
 122,521
 19,819
 142,440
Derivatives-foreign exchange contracts 
 3,171
 
 
 3,171
Total assets, at fair value $100
 $3,171
 $122,521
 $19,819
 $145,611
Liabilities, at fair value          
Contingent considerations $
 $
 $(22,156) $
 $(22,156)
Total liabilities, at fair value $
 $
 $(22,156) $
 $(22,156)
(1)In prior year presentation, certain funds that are equity method investments were included in the column as the carrying value approximates NAV. Current year presentation has been modified to remove those amounts.

Financial Instruments of Consolidated Funds Level I  Level II  Level III  Total 
Assets, at fair value        
Investments:        
Fixed income investments:        
Bonds $
 $104,886
 $37,063
 $141,949
Loans 
 2,606,423
 199,217
 2,805,640
Collateralized loan obligations 
 
 5,973
 5,973
Total fixed income investments 
 2,711,309
 242,253
 2,953,562
Equity securities 56,662
 17,569
 130,690
 204,921
Partnership interests 
 
 171,696
 171,696
Asset swaps - other 
 24
 
 24
Total investments, at fair value 56,662
 2,728,902
 544,639
 3,330,203
Derivatives:        
Foreign exchange contracts 
 529
 
 529
Asset swaps - other 
 
 291
 291
Total derivative assets, at fair value 
 529
 291
 820
Total assets, at fair value $56,662
 $2,729,431
 $544,930
 $3,331,023
Liabilities, at fair value        
Asset swaps - other $
 $
 $(2,999) $(2,999)
Loan obligations of CLOs 
 (3,031,112) 
 (3,031,112)
Total liabilities, at fair value $
 $(3,031,112) $(2,999) $(3,034,111)


F-33

Ares Management L.P.Corporation
Notes to the Consolidated Financial Statements (Continued)
(Dollars in Thousands, Except UnitShare Data and As Otherwise Noted)


The following tables set forth a summary of changes in the fair value of the Level III measurements for the year ended December 31, 2017:measurements:
Level III Assets of the CompanyEquity SecuritiesFixed IncomeTotal
Balance as of December 31, 2022$121,785 $76,934 $198,719 
Purchases(1)
244,335 88,480 332,815 
Sales/settlements(2)
(2)(37,332)(37,334)
Realized and unrealized appreciation (depreciation), net46,373 (1,788)44,585 
Balance as of December 31, 2023$412,491 $126,294 $538,785 
Change in net unrealized appreciation/depreciation included in earnings related to financial assets still held at the reporting date$46,161 $(1,577)$44,584 
  Level III Assets Level III Liabilities
Level III Assets and Liabilities of the Company Fixed Income Partnership 
Interests
 Total Contingent Considerations
Balance, beginning of period $89,111
 $33,410
 $122,521
 $22,156
Purchases(1) 143,579
 169
 143,748
 
Sales/settlements(2) (39,047) 
 (39,047) (1,000)
Expired contingent considerations 
 
 
 (1,000)
Realized and unrealized appreciation (depreciation), net 1,515
 11,190
 12,705
 (20,156)
Balance, end of period $195,158

$44,769

$239,927

$
Increase in unrealized appreciation/depreciation included in earnings related to financial assets and liabilities still held at the reporting date $2,752
 $11,359
 $14,111
 $

Level III Assets of Consolidated Funds Equity Securities Fixed Income Partnership
Interests
 Derivatives, Net Total
Balance, beginning of period $130,690
 $242,253
 $171,696
 $(2,708) $541,931
Additions(3) 
 14,479
 
 1,393
 15,872
Transfer in 
 45,526
 
 
 45,526
Transfer out (6,581) (100,643) 
 
 (107,224)
Purchases(1) 6,691
 240,723
 88,000
 
 335,414
Sales(2) (3,701) (180,248) (45,000) 
 (228,949)
Settlement, net 
 
 
 (2,192) (2,192)
Amortized discounts/premiums 
 247
 
 244
 491
Realized and unrealized appreciation (depreciation), net 35,478
 5,552
 17,636
 4,167
 62,833
Balance, end of period $162,577

$267,889

$232,332

$904

$663,702
Increase (decrease) in unrealized appreciation/depreciation included in earnings related to financial assets still held at the reporting date $33,990
 $31
 $17,636
 $(705) $50,952
Level III Net Assets of Consolidated FundsEquity SecuritiesFixed IncomePartnership InterestsDerivatives, NetTotal
Balance as of December 31, 2022$730,880 $869,668 $368,655 $(3,556)$1,965,647 
Transfer out due to changes in consolidation(2,076)(4,563)(374,049)— (380,688)
Transfer in— 247,661 — — 247,661 
Transfer out(36,681)(504,037)— — (540,718)
Purchases(1)
347,583 813,564 49,000 — 1,210,147 
Sales/settlements(2)
(2,595)(700,944)(48,889)(154)(752,582)
Realized and unrealized appreciation, net153,289 18,764 5,283 2,419 179,755 
Balance as of December 31, 2023$1,190,400 $740,113 $ $(1,291)$1,929,222 
Change in net unrealized appreciation/depreciation included in earnings related to financial assets and liabilities still held at the reporting date$152,336 $(15,623)$ $1,590 $138,303 
(1)Purchases include paid‑in‑kind interest and securities received in connection with restructurings.
(2)Sales/settlements include distributions, principal redemptions and securities disposed of in connection with restructurings.
(3)Additions relates to a CLO that was refinanced and restructured that is now consolidated.

(1)Purchases include paid-in-kind interest and securities received in connection with restructurings.

(2)Sales/settlements include distributions, principal redemptions and securities disposed of in connection with restructurings.


F-27

Ares Management Corporation
Notes to the Consolidated Financial Statements (Continued)
(Dollars in Thousands, Except Share Data and As Otherwise Noted)
The following tables set forth a summary of changes in the fair value of the Level III measurements for the year ended December 31, 2016:measurements:
Level III Assets and Liabilities of the CompanyEquity  SecuritiesFixed IncomePartnership InterestsContingent ConsiderationTotal
Balance as of December 31, 2021$108,949 $52,397 $2,575 $(57,435)$106,486 
Transfer in due to changes in consolidation1,491 — — — 1,491 
Purchases(1)
894 32,392 — — 33,286 
Sales/settlements(2)
68 (2,425)(2,538)58,873 53,978 
Change in fair value— — — (1,438)(1,438)
Realized and unrealized appreciation (depreciation), net10,383 (5,430)(37)— 4,916 
Balance as of December 31, 2022$121,785 $76,934 $ $ $198,719 
Change in net unrealized appreciation/depreciation included in earnings related to financial assets and liabilities still held at the reporting date$12,448 $(5,430)$ $ $7,018 
  Level III Assets Level III Liabilities
Level III Assets and Liabilities of the Company Fixed Income Partnership 
Interests
 Total Contingent Considerations
Balance, beginning of period $55,752
 $51,703
 $107,455
 $40,831
Purchases(1) 33,053
 9,000
 42,053
 
Sales/settlements(2) (3,698) 
 (3,698) (1,000)
Realized and unrealized appreciation (depreciation), net 4,004
 (27,293) (23,289) (17,675)
Balance, end of period $89,111

$33,410

$122,521

$22,156
Increase (decrease) in unrealized appreciation/depreciation included in earnings related to financial assets and liabilities still held at the reporting date $3,437
 $(7,293) $(3,856) $(17,675)


F-34

Ares Management, L.P.
Notes to the Consolidated Financial Statements
(Dollars in Thousands, Except Unit Data and As Otherwise Noted)


Level III Assets of Consolidated Funds Equity Securities Fixed Income Partnership Interests Derivatives, Net Total
Balance, beginning of period $129,809
 $249,490
 $86,902
 $(10,307) $455,894
Transfer in 
 59,790
 
 
 59,790
Transfer out (344) (90,952) 
 
 (91,296)
Purchases(1) 15,849
 167,338
 65,906
 
 249,093
Sales(2) (18,029) (125,642) (3,606) (81) (147,358)
Amortized discounts/premiums 
 2,660
 
 57
 2,717
Realized and unrealized appreciation (depreciation), net 3,405
 (20,431) 22,494
 7,623
 13,091
Balance, end of period $130,690

$242,253

$171,696

$(2,708)
$541,931
Increase (decrease) in unrealized appreciation/depreciation included in earnings related to financial assets still held at the reporting date $8,333
 $(9,391) $22,494
 $5,660
 $27,096
Level III Net Assets of Consolidated FundsEquity SecuritiesFixed IncomePartnership InterestsDerivatives, NetTotal
Balance as of December 31, 2021$339,183 $742,952 $238,673 $(3,105)$1,317,703 
Transfer in— 184,037 94,386 — 278,423 
Transfer out— (202,333)— — (202,333)
Purchases(1)
323,699 732,477 59,258 — 1,115,434 
Sales/settlements(2)
(31,932)(536,125)(52,828)— (620,885)
Realized and unrealized appreciation (depreciation), net99,930 (51,340)29,166 (451)77,305 
Balance as of December 31, 2022$730,880 $869,668 $368,655 $(3,556)$1,965,647 
Change in net unrealized appreciation/depreciation included in earnings related to financial assets and liabilities still held at the reporting date$70,591 $(54,058)$29,166 $(376)$45,323 
(1)Purchases include paid‑in‑kind interest and securities received in connection with restructurings.
(2)Sales/settlements include distributions, principal redemptions and securities disposed of in connection with restructurings.

(1)Purchases include paid-in-kind interest and securities received in connection with restructurings.
The Company recognizes transfers between the levels as(2)Sales/settlements include distributions, principal redemptions, securities disposed of the beginning of the period. in connection with restructurings and contingent consideration payments.

Transfers out of Level III were generally attributable to certain investments that experienced a more significant level of market activity during the period and thus were valued using observable inputs either from independent pricing services or multiple brokers. Transfers into Level III were generally attributable to certain investments that experienced a less significant level of market activity during the period and thus were only able to obtain one or fewer quotes from a broker or independent pricing service. During


F-28

Ares Management Corporation
Notes to the year ended December 31, 2017, two of the Company's investments were transferred from a Level II to a Level I fair value measurement at their fair values totaling $7.5 million as of the transfer date. The investments transferred represent equity securities that were previously less actively traded that began to have significant levels of market activity to support quoted market prices during the second quarter of 2017. For the year ended December 31, 2016, there were no transfers between Level IConsolidated Financial Statements (Continued)
(Dollars in Thousands, Except Share Data and Level II. As Otherwise Noted)
The following table sets forth a summary of changes in the fair value of the Level III liabilities for the CLO loan obligations for the years ended December 31, 2017 and 2016:
 For the Year Ended December 31,
 2017 2016
Balance, beginning of period$
 $2,174,352
Accounting change due to the adoption of ASU 2014-13(1)
 (2,174,352)
Balance, end of period$
 $
(1) Upon adoption of ASU 2014-13, the debt obligations of consolidated CLOs are no longer considered Level III financial liabilities under the GAAP fair value hierarchy. As of January 1, 2016, the debt obligations of consolidated CLOs are measured on the basis of the fair value of the financial assets of the CLO and are classified as Level II financial liabilities.
The following table summarizestables summarize the quantitative inputs and assumptions used for the Company’s Level III measurements as of December 31, 2017:
 Fair Value Valuation Technique(s) Significant Unobservable Input(s) Range
Assets       
Partnership interests$44,769
 Other N/A N/A
Fixed income - collateralized loan obligations195,158
 Broker quotes and/or 3rd party pricing services N/A N/A
Total$239,927


F-35

Ares Management, L.P.
Notes to the Consolidated Financial Statements
(Dollars in Thousands, Except Unit Data and As Otherwise Noted)


The following table summarizes the quantitative inputs and assumptions used for the Company’s Level III measurements as of December 31, 2016:
 Fair Value  Valuation Technique(s)  Significant Unobservable Input(s) Range
Assets       
Partnership interests$33,410
 Other N/A N/A
Fixed income - collateralized loan obligations89,111
 Broker quotes and/or 3rd party pricing services N/A N/A
Total$122,521
      
Liabilities       
Contingent consideration liabilities       
 $20,278
 Other N/A N/A
 1,878
 Discounted cash flow Discount rate 6.5%
Total$22,156
      

The following table summarizes the quantitative inputs and assumptions used for the Consolidated Funds’ Level III measurements as of December 31, 2017:2023:
Level III Measurements of the CompanyFair ValueValuation Technique(s)Significant Unobservable Input(s)RangeWeighted Average
Assets
Equity securities
$154,460 Discounted cash flowDiscount rate20.0% -30.0%25.0%
118,846 Market approachMultiple of book value1.3x - 1.6x1.5x
100,000 
Transaction price(1)
N/AN/AN/A
6,447 Market approachEnterprise value / LTM multiple of FRE15.4x15.4x
32,738 OtherN/AN/AN/A
Fixed income investments
83,000 
Transaction price(1)
N/AN/AN/A
20,799 Broker quotes and/or 3rd party pricing servicesN/AN/AN/A
22,495 OtherN/AN/AN/A
Total assets$538,785 
 Fair Value Valuation Technique(s) Significant Unobservable Input(s) Range Weighted
Average
Assets         
Equity securities         
 $63,155
 Enterprise value market multiple analysis EBITDA multiple(2) 2.7x 2.7x
 61,215
 Market approach (comparable companies) Net income multiple
Illiquidity discount
 27.0x - 36.2x
25.0%
 33.7x
25.0%
 126
 Broker quotes and/or 3rd party pricing services N/A N/A N/A
 38,081
 Transaction price(1) N/A N/A N/A
Partnership interests232,332
 Discounted cash flow Discount rate 19.0% 19.0%
Fixed income securities         
 222,413
 Broker quotes and/or 3rd party pricing services N/A N/A N/A
 45,243
 Income approach Yield 10.8% - 22.5% 12.1%
 233
 Market approach (comparable companies) EBITDA multiple(2) 6.5x 6.5x
Derivative instruments1,366
 Broker quotes and/or 3rd party pricing services N/A N/A N/A
Total assets$664,164
        
Liabilities         
Derivatives instruments$(462) Broker quotes and/or 3rd party pricing services N/A N/A N/A
Total liabilities$(462)        

Level III Measurements of the Consolidated FundsFair ValueValuation Technique(s)Significant Unobservable Input(s)RangeWeighted Average
Assets
Equity securities
$648,581 Discounted cash flowDiscount rate10.0% - 16.0%13.0%
537,733 Market approachMultiple of book value1.0x - 1.7x1.3x
3,909 Market approach
EBITDA multiple(2)
4.5x - 32.4x8.9x
177 OtherN/AN/AN/A
Fixed income investments
516,070 Broker quotes and/or 3rd party pricing servicesN/AN/AN/A
188,322 Market approachYield8.3% - 24.1%12.2%
2,974 Market approach
EBITDA multiple(2)
4.5x - 32.4x9.0x
32,747 OtherN/AN/AN/A
Total assets$1,930,513 
Liabilities
Derivative instruments$(1,291)Broker quotes and/or 3rd party pricing servicesN/AN/AN/A
Total liabilities$(1,291)
(1)Transaction price consists of securities recently purchased or restructured. The Company determined that there was no change to the valuation based on the underlying assumptions used at the closing of such transactions.
(2)“EBITDA” in the table above is a Non-GAAP financial measure and refers to earnings before interest, tax, depreciation and amortization.

(1)Transaction price consists of securities purchased or restructured. The Company determined that there was no change to the valuation based on the underlying assumptions used at the closing of such transactions.
(2)“EBITDA” in the table above is a non-GAAP financial measure and refers to earnings before interest, tax, depreciation and amortization.


F-36
F-29

Ares Management L.P.Corporation
Notes to the Consolidated Financial Statements (Continued)
(Dollars in Thousands, Except UnitShare Data and As Otherwise Noted)


The following table summarizestables summarize the quantitative inputs and assumptions used for the Company’s and the Consolidated Funds’ Level III measurements as of December 31, 2016:
 Fair Value Valuation Technique(s) Significant Unobservable Input(s) Range Weighted
Average
Assets         
Equity securities         
 $43,011
 EV market multiple analysis EBITDA multiple(2) 2.0x - 11.2x 2.3x
 32,598
 Market approach (comparable companies) Net income multiple
Illiquidity discount
 30.0x - 40.0x
25.0%
 35.0x
25.0%
 421
 Broker quotes and/or 3rd party pricing services N/A N/A N/A
 54,660
 Transaction price(1) N/A N/A N/A
Partnership interests171,696
 Discounted cash flow Discount rate 20.0% 20.0%
Fixed income securities         
 170,231
 Broker quotes and/or 3rd party pricing services N/A N/A N/A
 6,693
 EV market multiple analysis EBITDA multiple(2) 7.1x 7.1x
 5,473
 Income approach Collection rates 1.2x 1.2x
 28,595
 Income approach Yield 6.0% - 13.6% 10.9%
 24,052
 Discounted cash flow Discount rate 7.8% - 15.3% 11.1%
 1,776
 Market approach (comparable companies) EBITDA multiple(2) 6.5x 6.5x
 4,887
 Transaction price(1) N/A N/A N/A
 546
 Market approach EBITDA Multiple(2) 6.1x 6.1x
Derivative instruments291
 Broker quotes and/or 3rd party pricing services N/A N/A N/A
Total assets$544,930
        
Liabilities         
Derivatives instruments$2,999
 Broker quotes and/or 3rd party pricing services N/A N/A N/A
Total liabilities$2,999
        
2022:
Level III Measurements of the CompanyFair Value Valuation Technique(s) Significant Unobservable Input(s)RangeWeighted Average
Assets
Equity securities
$106,295 Market approachMultiple of book value1.3x - 3.2x2.4x
15,490 
Transaction price(1)
N/AN/AN/A
(1)
Fixed income investments
30,189 
Transaction price consists of securities recently purchased or restructured. The Company determined that there has been no change to the valuation based on the underlying assumptions used at the closing of such transactions.
(1)N/AN/AN/A
(2)25,163 “EBITDA” in the table above is a Non-GAAP financial measure and refers to earnings before interest, tax, depreciation and amortization.Broker quotes and/or 3rd party pricing servicesN/AN/AN/A
21,582 OtherN/AN/AN/A
Total assets$198,719


Level III Measurements of the Consolidated FundsFair Value Valuation Technique(s) Significant Unobservable Input(s) RangeWeighted Average
Assets
Equity securities
$401,229 Discounted cash flowDiscount rate8.0% - 18.0%12.0%
290,258 Market approachMultiple of book value1.0x - 1.2x1.2x
 36,681 Market approachNet income multiple30.0x30.0x
2,064 Market approach
EBITDA multiple(2)
6.3x - 31.0x13.6x
648 OtherN/AN/AN/A
Partnership interests368,655 Discounted cash flowDiscount rate10.3% - 22.0%18.9%
Fixed income investments
731,708 Broker quotes and/or 3rd party pricing servicesN/AN/AN/A
125,612 Market approachYield6.6% - 21.7%12.8%
6,155 
Transaction price(1)
N/AN/AN/A
4,479 Market approach
EBITDA multiple(2)
8.0x - 9.0x8.5x
1,714 OtherN/AN/AN/A
Total assets$1,969,203 
Liabilities
Derivative instruments$(3,556)Broker quotes and/or 3rd party pricing servicesN/AN/AN/A
Total liabilities$(3,556)
(1)Transaction price consists of securities purchased or restructured. The Company determined that there has been no change to the valuation based on the underlying assumptions used at the closing of such transactions.
(2)“EBITDA” in the table above is a non-GAAP financial measure and refers to earnings before interest, tax, depreciation and amortization.

The Company's investmentsConsolidated Funds have limited partnership interests in private equity funds managed by the Company that are valued using net asset value (“NAV”) haveNAV per share. The terms and conditions thatof these funds do not allow for redemptionredemptions without certain events or approvals that are outside the Company'sCompany’s control. A summary of

The following table summarizes the investments held at fair value by segment and the remaining unfunded commitments are presented below:of the Consolidated Funds interests valued using NAV per share:
As of December 31,
20232022
Investments (held at fair value)$1,642,489 $1,023,514 
Unfunded commitments738,621 869,016 

F-30
  As of December 31, 2017 As of December 31, 2016
Segment Fair Value  Unfunded 
Commitments
 Fair Value Unfunded 
Commitments
Non-core investments(1) $35,998
 $16,492
 $19,819
 $34,500
Totals $35,998

$16,492

$19,819

$34,500
(1) Non-core investments are reported within the Company's Operations Management Group ("OMG").


F-37

Ares Management L.P.Corporation
Notes to the Consolidated Financial Statements (Continued)
(Dollars in Thousands, Except UnitShare Data and As Otherwise Noted)


7. DERIVATIVE FINANCIAL INSTRUMENTS
In the normal course of business, the Company and the Consolidated Funds are exposed to certain risks relating to their ongoing operations and use various types of derivative instruments primarily to mitigate against credit and foreign exchange risk. The derivative instruments used by the Company and Consolidated Funds include warrants, currency options, interest rate swaps, credit default swaps and forward contracts.  The derivative instruments are not designated as hedging instruments under the accounting standards for derivatives and hedging. The Company recognizes all of its derivative instruments at fair value as either assets or liabilities in the Consolidated Statements of Financial Condition within other assets or accounts payable, accrued expenses and other liabilities, respectively.
By using derivatives, the Company and the Consolidated Funds are exposed to counterparty credit risk if counterparties to the derivative contracts do not perform as expected. If a counterparty fails to perform, the Company's counterparty credit risk is equal to the amount reported as a derivative asset in the Consolidated Statements of Financial Condition. The Company minimizes counterparty credit risk through credit approvals, limits, monitoring procedures, executing master netting arrangements and obtaining collateral, where appropriate.
To the extent the master netting arrangements and other criteria meet the applicable requirements, which includes determining the legal enforceability of the arrangements, the Company may choose to offset the derivative assets and liabilities in the same currency by specific derivative type, or in the event of default by the counterparty, offset derivative assets and liabilities with the same counterparty. The Company generally presents derivative and other financial instruments on a gross basis within the Consolidated Statements of Financial Condition, with certain instruments subject to enforceable master netting arrangements that could allow for the derivative and other financial instruments to be offset. The Consolidated Funds present derivative and other financial instruments on a net basis. This election is determined at management's discretion on a fund by fund basis. The Company has retained each Consolidated Fund's presentation upon consolidation.
Qualitative Disclosures of Derivative Financial Instruments
Derivative instruments are marked-to-market daily based upon quotations from pricing services or by the Company and the change in value, if any, is recorded as an unrealized gain (loss) within net realized and unrealized gain (loss) on investments in the Consolidated Statements of Operations. Upon settlement of the instrument, the Company records the realized gain (loss) within net realized and unrealized gain (loss) on investments in the Consolidated Statements of Operations.
Significant derivative instruments utilized by the Company and the Consolidated Funds during the reporting periods presented include the following:
Forward Foreign Currency Contracts: The Company and the Consolidated Funds enter into foreign currency forward exchange contracts to hedge against foreign currency exchange rate risk on certain non-U.S. dollar denominated cash flows. When entering into a forward currency contract, the Company and the Consolidated Funds agree to receive and/or deliver a fixed quantity of foreign currency for an agreed-upon price on an agreed-upon future date. Forward foreign currency contracts involve elements of market risk in excess of the amounts reflected in the Consolidated Statements of Financial Condition. The Company and the Consolidated Funds bear the risk of an unfavorable change in the foreign exchange rate underlying the forward foreign currency contract. In addition, the potential inability of the counterparties to meet the terms of their contracts poses a risk to the Company and the Consolidated Funds.
Interest Rate Swaps: The Company and the Consolidated Funds enter into interest rate swap contracts to mitigate their interest rate risk exposure to higher floating interest rates. Interest rate swaps represent an agreement between two counterparties to exchange cash flows based on the difference in two interest rates, applied to the notional principal amount for a specified period. The payment flows are generally netted, with the difference being paid by one party to the other. The interest rate swap contracts effectively mitigate the Company and the Consolidated Funds’ exposure to interest rate risk by converting a portion of the Company and the Consolidated Funds’ floating rate debt to a fixed rate basis.
Asset Swap: The Consolidated Funds enter into asset swap contracts to hedge against foreign currency exchange rate risk on certain non-Euro denominated loans. Assets swap contracts provide the Consolidated Funds with the opportunity to purchase or sell an underlying asset that are not denominated in Euros and a pre agreed exchange rate and receive Euro interest payments from the swap counter party in exchange for non-Euro interest payments which are pegged to the currency of the underlying loan

F-38

Ares Management, L.P.
Notes to the Consolidated Financial Statements
(Dollars in Thousands, Except Unit Data and As Otherwise Noted)


and applicable interest rates. The swap contracts can be optionally cancelled at any time, normally due the disposal or redemption of the underlying asset, however in the absence of sale or redemption the swap contracts maturity matches that of the underlying asset. By entering into asset swap contracts to exchange interest payments and principal on equally valued loans denominated in a different currency than that of the underlying assets the Consolidated Funds can mitigate the risk of exposure to foreign currency fluctuations. Generally, the fair value of asset swap contracts are calculated using a model which utilizes the spread between the fair value of the underlying asset and the exercise value of the contract, as well as any other relevant inputs. Broker quotes may also be used to calculate the fair value of asset swaps, if available.
Quantitative Disclosures of Derivative Financial Instruments
The following tables identify the fair value and notional amounts of derivative contracts by major product type on a gross basis for the Company and the Consolidated Funds as of December 31, 2017 and 2016.  These amounts may be offset (to the extent that there is a legal right to offset) and presented on a net basis within other assets or accounts payable, accrued expenses and other liabilities in the Consolidated Statements of Financial Condition:
  As of December 31, 2017 As of December 31, 2016
  Assets  Liabilities  Assets  Liabilities 
The Company Notional(1) Fair Value Notional(1) Fair Value Notional(1) Fair Value Notional(1) Fair Value
Foreign exchange contracts $13,724
 $498
 $51,026
 $2,639
 $62,830
 $3,171
 $
 $
Total derivatives, at fair value $13,724
 $498
 $51,026
 $2,639
 $62,830
 $3,171
 $
 $
  As of December 31, 2017 As of December 31, 2016
  Assets Liabilities Assets  Liabilities 
Consolidated Funds  Notional(1) Fair Value Notional(1) Fair Value Notional(1) Fair Value Notional(1) Fair Value
Foreign exchange contracts $
 $
 $
 $
 $25,304
 $529
 $
 $
Asset swap - other 5,363
 1,366
 1,840
 462
 3,575
 291
 204
 2,999
Total derivatives, at fair value 5,363

1,366

1,840

462

28,879

820

204

2,999
Other—equity(2) 


 253
 24
 
 
Total $5,363

$1,366

$1,840

$462

$29,132

$844

$204

$2,999
(1)Represents the total contractual amount of derivative assets and liabilities outstanding.
(2)Includes the fair value of warrants which are presented as equity securities within investments of the Consolidated Funds in the Consolidated Statements of Financial Condition.

F-39

Ares Management, L.P.
Notes to the Consolidated Financial Statements
(Dollars in Thousands, Except Unit Data and As Otherwise Noted)


The following tables present a summary of net realized gains (losses) and unrealized appreciation (depreciation) on the Company's derivative instruments, which are included within net realized and unrealized gain (loss) on investments in the Consolidated Statements of Operations, for the years ended December 31, 2017, 2016 and 2015:
  For the Year Ended December 31,
The Company 2017 2016 2015
Net realized gain (loss) on derivatives      
Interest rate contracts—Swaps $
 $(337) $(1,318)
Foreign exchange contracts:      
Purchased options 
 
 2,022
Foreign currency forward contracts (1,830) 1,783
 8,379
Net realized gain (loss) on derivatives $(1,830) $1,446
 $9,083
Net change in unrealized appreciation (depreciation) on derivatives      
Interest rate contracts—Swaps $
 $214
 $633
Foreign exchange contracts:      
Purchased options 
 
 (1,057)
Foreign currency forward contracts (5,299) 2,008
 (2,556)
Net change in unrealized appreciation (depreciation) on derivatives $(5,299) $2,222
 $(2,980)
  For the Year Ended December 31,
Consolidated Funds 2017 2016 2015
Net realized gain (loss) on derivatives of Consolidated Funds      
Foreign currency forward contracts $(181) $(1,008) $3,752
Asset swap - other 903
 (1,322) (4,332)
Net realized gain (loss) on derivatives of Consolidated Funds $722
 $(2,330) $(580)
Net change in unrealized appreciation (depreciation) on derivatives of Consolidated Funds      
Equity contracts:      
Warrants(1) $
 $26
 $(71)
Foreign exchange contracts:      
Foreign currency forward contracts (529) 900
 (1,867)
Asset swap - other 2,338
 7,685
 (2,934)
Net change in unrealized appreciation (depreciation) on derivatives of Consolidated Funds $1,809
 $8,611
 $(4,872)
(1)Realized and unrealized gains (losses) on warrants are also reflected within investments of Consolidated Funds.
The table below sets forth the rights of offset and related arrangements associated with the Company's derivative and other financial instruments as of December 31, 2017 and 2016. The column titled "Gross Amounts Not Offset in the Statement of Financial Position" in the table below relates to derivative instruments that are eligible to be offset in accordance with applicable accounting guidance but for which management has elected not to offset in the Consolidated Statements of Financial Condition.
        Gross Amount Not Offset in the Statement of Financial Position  
The Company as of December 31, 2017 
Gross Amounts
of Recognized Assets (Liabilities)
 
Gross Amounts
Offset in Assets
(Liabilities) 
 
Net Amounts of
Assets (Liabilities)
Presented 
 
Financial
Instruments 
 Net Amount 
Assets:          
Derivatives $498
 $
 $498
 $(498) $
Liabilities:          
Derivatives (2,639) 
 (2,639) 498
 (2,141)
Net derivative liabilities $(2,141)
$

$(2,141)
$

$(2,141)

F-40

Ares Management, L.P.
Notes to the Consolidated Financial Statements
(Dollars in Thousands, Except Unit Data and As Otherwise Noted)


        Gross Amount Not Offset in the Statement of Financial Position  
The Company as of December 31, 2016 Gross Amounts
of Recognized Assets (Liabilities)
 Gross Amounts
Offset in Assets
(Liabilities) 
 Net Amounts of
Assets (Liabilities)
Presented 
 Financial
Instruments 
 Net Amount 
Assets:          
Derivatives $3,171
 $
 $3,171
 $
 $3,171
Liabilities:          
Derivatives 


Net derivative assets $3,171

$

$3,171

$

$3,171
The table below sets forth the rights of offset and related arrangements associated with the Consolidated Funds' derivative and other financial instruments as of December 31, 2017 and 2016. The column titled "Gross Amounts Not Offset in the Statement of Financial Position" in the table below relates to derivative instruments that are eligible to be offset in accordance with applicable accounting guidance but for which management has elected not to offset in the Consolidated Statements of Financial Condition.
        Gross Amounts Not Offset in the Statement of Financial Position  
Consolidated Funds as of December 31, 2017 Gross Amounts of Recognized Assets (Liabilities) 
Gross Amounts
Offset in Assets
(Liabilities) 
 
Net Amounts of
Assets (Liabilities) Presented 
 
Financial
Instruments 
  Net Amount 
Assets:           
Derivatives $1,750
 $(384) $1,366
 $
  $1,366
Liabilities:           
Derivatives (846) 384
 (462) 
  (462)
Net derivatives assets $904

$

$904

$


$904
        Gross Amounts Not Offset in the Statement of Financial Position  
Consolidated Funds as of December 31, 2016 Gross Amounts of Recognized Assets (Liabilities) 
Gross Amounts
Offset in Assets
(Liabilities) 
 
Net Amounts of
Assets (Liabilities) Presented 
 
Financial
Instruments 
  Net Amount 
Assets:           
Derivatives $2,243
 $(1,423) $820
 $
  $820
Liabilities:           
Derivatives (4,422) 1,423
 (2,999) 
  (2,999)
Net derivatives liabilities $(2,179)
$

$(2,179)
$


$(2,179)

F-41

Ares Management, L.P.
Notes to the Consolidated Financial Statements
(Dollars in Thousands, Except Unit Data and As Otherwise Noted)


8.6. DEBT
The following table summarizes the Company’s and its subsidiaries’ debt obligations:
      As of December 31, 2017 As of December 31, 2016
 Debt Origination DateMaturity Original Borrowing Amount Carrying
Value
 Interest Rate Carrying
Value
 Interest Rate
Credit Facility(1)Revolver2/24/2022 N/A
 $210,000
 3.09% $
 —%
Senior Notes(2)10/8/201410/8/2024 $250,000
 245,308
 4.21% 244,684
 4.21%
2015 Term Loan(3)9/2/20157/29/2026 $35,205
 35,037
 2.86% 35,063
 2.74%
2016 Term Loan(4)12/21/20161/15/2029 $26,376
 25,948
 3.08% 26,037
 2.66%
2017 Term Loan A(4)3/22/20171/22/2028 $17,600
 17,407
 2.90% N/A
 N/A
2017 Term Loan B(4)5/10/201710/15/2029 $35,198
 35,062
 2.90% N/A
 N/A
2017 Term Loan C(4)6/22/20177/30/2029 $17,211
 17,078
 2.88% N/A
 N/A
2017 Term Loan D(4)11/16/201710/15/2030 $30,450
 30,336
 2.77% N/A
 N/A
Total debt obligations     $616,176
   $305,784
  
As of December 31,
20232022
Debt Origination DateMaturityOriginal Borrowing AmountCarrying ValueInterest RateCarrying ValueInterest Rate
Credit Facility(1)
Revolving3/31/2027N/A$895,000 6.37%$700,000 5.37%
2024 Senior Notes(2)
10/8/201410/8/2024$250,000 249,427 4.21248,693 4.21
2028 Senior Notes(3)
11/10/202311/10/2028500,000 494,863 6.42— N/A
2030 Senior Notes(4)
6/15/20206/15/2030400,000 397,050 3.28396,602 3.28
2052 Senior Notes(5)
1/21/20222/1/2052500,000 484,199 3.77483,802 3.77
2051 Subordinated Notes(6)
6/30/20216/30/2051450,000 444,941 4.13444,757 4.13
Total debt obligations$2,965,480 $2,273,854 

(1)
The AOG entities are borrowers under the Credit Facility, which, as amended in February 2017 and increased in September 2017, provides a $1.065 billion revolving line of credit. It has a variable interest rate based on LIBOR(1)The revolver commitments were $1.325 billion as of December 31, 2023. Ares Holdings is the borrower under the Credit Facility. The Credit Facility has a variable interest rate based on Secured Overnight Financing Rate (“SOFR”) or a base rate plus an applicable margin, which is subject to adjustment based on the achievement of certain environmental, social and governance (“ESG”)-related targets, with an unused commitment fee paid quarterly, which is subject to change with the Company’s underlying credit agency rating. As of December 31, 2017, base rate loans bear interest calculated based on the base rate plus 0.50% and the LIBOR rate loans bear interest calculated based on LIBOR plus 1.50%. The unused commitment fee is 0.20% per annum. There is a base rate and LIBOR floor of zero.
(2)
The Senior Notes were issued in October 2014 by Ares Finance Co. LLC (“AFC”), a subsidiary of the Company, at 98.268% of the face amount with interest paid semi-annually. The Company may redeem the Senior Notes prior to maturity, subject to the terms of the indenture.
(3)
The 2015 Term Loan was entered into in August 2015 by a subsidiary of the Company that acts as a manager to a CLO. The 2015 Term Loan is secured by collateral in the form of CLO senior tranches owned by the Company. To the extent the assets are not sufficient to cover the Term Loan, there is no further recourse to the Company to fund or repay the remaining balance. Interest is paid quarterly, and the Company also pays a fee of 0.025% of a maximum investment amount.
(4)
The 2016 and 2017 Term Loans ("Term Loans") were entered into by a subsidiary of the Company that acts as a manager to a CLO. The Term Loans are secured by collateral in the form of CLO senior tranches and subordinated notes owned by the Company. Collateral associated with one of the Term Loans may be used to satisfy outstanding liabilities of another term loan should the collateral fall short. To the extent the assets associated with these Term Loans are not sufficient, there is no further recourse to the Company to fund or repay the remaining balance. Interest is paid quarterly, and the Company also pays a fee of 0.03% of a maximum investment amount.
As of December 31, 2017,2023, base rate loans bear interest calculated based on the prime rate and the SOFR loans bear interest calculated based on SOFR plus 1.00%. The unused commitment fee is 0.10% per annum. There is a base rate and SOFR floor of zero. Due to the achievement of the ESG-related targets, the Company’s base rate and unused commitment fee have been reduced by 0.05% and 0.01%, respectively, from July 2023 through June 2024.
(2)The 2024 Senior Notes were issued in October 2014 by Ares Finance Co. LLC, an indirect subsidiary of the Company, at 98.27% of the face amount with interest paid semi-annually. The Company may redeem the 2024 Senior Notes prior to maturity, subject to the terms of the indenture governing the 2024 Senior Notes.
(3)The 2028 Senior Notes were issued in November 2023 by the Company, at 99.80% of the face amount with interest paid semi-annually. The Company may redeem the 2028 Senior Notes prior to maturity, subject to the terms of the indenture governing the 2028 Senior Notes.
(4)The 2030 Senior Notes were issued in June 2020 by Ares Finance Co. II LLC, an indirect subsidiary of the Company, at 99.77% of the face amount with interest paid semi-annually. The Company may redeem the 2030 Senior Notes prior to maturity, subject to the terms of the indenture governing the 2030 Senior Notes.
(5)The 2052 Senior Notes were issued in January 2022 by Ares Finance Co. IV LLC, an indirect subsidiary of the Company, at 97.78% of the face amount with interest paid semi-annually. The Company may redeem the 2052 Senior Notes prior to maturity, subject to the terms of the indenture governing the 2052 Senior Notes.
(6)The 2051 Subordinated Notes were issued in June 2021 by Ares Finance Co. III LLC, an indirect subsidiary of the Company with interest paid semi-annually at a fixed rate of 4.125%. Beginning June 30, 2026, the interest rate will reset on every fifth year based on the five-year U.S. Treasury Rate plus 3.237%. The Company may redeem the 2051 Subordinated Notes prior to maturity or defer interest payments up to five consecutive years, subject to the terms of the indenture governing the 2051 Subordinated Notes.

As of December 31, 2023, the Company and its subsidiaries were in compliance with all covenants under the Credit Facility, Senior Notes and Term Loandebt obligations.
Debt obligations of the Company and its subsidiaries are reflected at cost. The Company typically incurs and pays debt issuance costs when entering into a new debt obligation or when amending an existing debt agreement. Debt issuance costs related to the Company's2024, 2028, 2030 and 2052 Senior Notes (the “Senior Notes”) and Term Loans2051 Subordinated Notes are recorded as a reduction of the corresponding debt obligation, and debt issuance costs related to the Credit Facility are included inwithin other assets inwithin the Consolidated Statements of Financial Condition. All debt issuance costs are amortized over the remaining term of the related obligation. The following table showsobligation into interest expense within the activityConsolidated Statements of the Company's debt issuance costs:Operations.


F-42
F-31

Ares Management L.P.Corporation
Notes to the Consolidated Financial Statements (Continued)
(Dollars in Thousands, Except UnitShare Data and As Otherwise Noted)


The following table presents the activity of the Company’s debt issuance costs:
Credit Facility Senior Notes Term Loans 
Unamortized debt issuance costs as of December 31, 2015$6,241
 $2,035
 $207
 
Credit Facility
Credit Facility
Credit Facility
Unamortized debt issuance costs as of December 31, 2021
Debt issuance costs incurred
Debt issuance costs incurred548
 
 340
 
Amortization of debt issuance costs(1,989) (232) (21) 
Unamortized debt issuance costs as of December 31, 20164,800
 1,803
 526
 
Amortization of debt issuance costs
Unamortized debt issuance costs as of December 31, 2022
Debt issuance costs incurred
Debt issuance costs incurred3,394
 
 733
 
Amortization of debt issuance costs(1,651) (232) (88) 
Unamortized debt issuance costs as of December 31, 2017$6,543
 $1,571
 $1,171
 
Amortization of debt issuance costs
Unamortized debt issuance costs as of December 31, 2023
Loan Obligations of the Consolidated CLOs
Loan obligations of the Consolidated Funds that are CLOs ("Consolidated CLOs")CLOs represent amounts due to holders of debt securities issued by the Consolidated CLOs. The Company measures the loan obligations of the Consolidated CLOs using the fair value of the financial assets of its Consolidated CLOs.
As of December 31, 2017 and 2016, the
The following loan obligations were outstanding and classified as liabilities of the Company’s Consolidated CLOs:
 As of December 31, 2017 As of December 31, 2016
 
Loan
Obligations
 
Fair Value of
Loan Obligations
 Weighted 
Average
Remaining Maturity 
In Years 
 Loan
Obligations
 Fair Value of Loan Obligations Weighted Average Remaining Maturity In Years 
Senior secured notes(1)$4,801,582
 $4,776,883
 10.57 $2,839,779
 $2,841,440
 9.68
Subordinated notes(2)276,169
 186,311
 11.25 284,046
 189,672
 9.97
Total loan obligations of Consolidated CLOs$5,077,751
 $4,963,194
   $3,123,825
 $3,031,112
  
As of December 31,
20232022
Fair Value of
Loan Obligations
Weighted 
Average
 Interest Rate
Weighted 
Average
 Remaining Maturity 
(in years)
Fair Value of
Loan Obligations
Weighted 
Average
 Interest Rate
Weighted
Average
Remaining Maturity 
(in years)
Senior secured notes$11,606,289 6.64%8.2$10,142,545 4.84%8.8
Subordinated notes(1)
739,368 N/A6.9559,175 N/A7.8
Total loan obligations of Consolidated CLOs$12,345,657 $10,701,720 
(1)Original borrowings under the senior secured notes totaled $4.8 billion, with various maturity dates ranging from October 2024 to October 2030. The weighted average interest rate as of December 31, 2017 was 4.48%.
(2)Original borrowings under the subordinated notes totaled $276.2 million, with various maturity dates ranging from October 2024 to October 2030. They do not have contractual interest rates, but instead receive distributions from the excess cash flows generated by each Consolidated CLO.
(1)The notes do not have contractual interest rates; instead, holders of the notes receive distributions from the excess cash flows generated by each Consolidated CLO.

Loan obligations of the Consolidated CLOs are collateralized by the assets held by the Consolidated CLOs, consisting of cash and cash equivalents, corporate loans, corporate bonds and other securities. The assets of one Consolidated CLO may not be used to satisfy the liabilities of another Consolidated CLO. Loan obligations of the Consolidated CLOs include floating rate notes, deferrable floating rate notes, revolving lines of credit and subordinated notes. Amounts borrowed under the notes are repaid based on available cash flows subject to priority of payments under each Consolidated CLO’s governing documents. Based on the terms of these facilities, the creditors of the facilities have no recourse to the Company.
Credit Facilities of the Consolidated Funds
Certain Consolidated Funds maintain credit facilities to fund investments between capital drawdowns. These facilities generally are collateralized by the unfunded capital commitments of the Consolidated Funds’ limited partners, bear an annual commitment fee based on unfunded commitments and contain various affirmative and negative covenants and reporting obligations, including restrictions on additional indebtedness, liens, margin stock, affiliate transactions, dividends and distributions, release of capital commitments and portfolio asset dispositions. The creditors of these facilities have no recourse to the Company. Credit facilitiesCompany and only have recourse to a subsidiary of the Consolidated Funds are reflected at cost inCompany to the Consolidated Statements of Financial Condition.extent the debt is guaranteed by such subsidiary. As of December 31, 20172023 and 2016,2022, the Consolidated Funds were in compliance with all financial and non‑financial covenants under such credit facilities.

F-43F-32

Ares Management L.P.Corporation
Notes to the Consolidated Financial Statements (Continued)
(Dollars in Thousands, Except UnitShare Data and As Otherwise Noted)


The Consolidated Funds had the following revolving bank credit facilities and term loans outstandingoutstanding:
As of December 31,
20232022
Maturity DateTotal Capacity
Outstanding Loan(1)
Effective Rate
Outstanding Loan(1)
Effective Rate
Credit Facilities:
10/13/2023(2)$112,817 N/AN/A$77,496 5.89%
7/1/202418,000 $15,241 6.88%15,550 6.25
7/23/2024125,000 110,000 8.2975,000 7.28
9/24/2026150,000 — N/A— N/A
9/12/202754,000 — N/A— N/A
Total borrowings of Consolidated Funds$125,241 $168,046 
(1)The fair values of the borrowings approximate the carrying value as the interest rate on the borrowings is a floating rate.
(2)Represents a credit facility of a Consolidated Fund that was deconsolidated during the second quarter of 2023. The total capacity represents the balance as of December 31, 2017 and 2016:2022.

      As of December 31, 2017 As of December 31, 2016 
Type of Facility Maturity Date Total Capacity 
Outstanding
Loan(1)
 Effective Rate Outstanding Loan(1) Effective Rate 
Credit Facilities:             
  1/1/2023 $18,000
 $12,942
 2.88% $12,942
 2.38% 
  6/30/2018 $48,042
 48,042
 1.55%(2)42,128
 1.55%(2)
  3/7/2018 $71,500
 71,500
 2.89% N/A
 N/A 
Revolving Term Loan 8/19/2019 $11,429
 5,714
 5.86% N/A
 N/A 
Total borrowings of Consolidated Funds     $138,198
   $55,070
   
(1)The fair values of the borrowings approximate the carrying value, as the interest rate on the borrowings is a floating rate.
(2)The effective rate is based on the three month EURIBOR or zero, whichever is higher, plus an applicable margin.

9. REDEEMABLE INTERESTS AND EQUITY COMPENSATION PUT OPTION LIABILITY
The following table sets forth a summary of changes in the redeemable interests and equity compensation put option liability in Consolidated Funds as of December 31, 2016 and 2015:
 As of December 31,
  2016 2015
Redeemable interests in Ares Operating Group Entities  
  
Beginning balance $23,505
 $23,988
Net income 
 
Distributions 
 
Currency translation adjustment 
 
Equity compensation 
 
Tandem award compensation adjustment 
 
Equity Balance Post-Reorganization 23,505
 23,988
Issuance cost 
 
Allocation of contributions in excess of the carrying value of the net assets (dilution) 
 
Reallocation of Partners' capital for change in ownership interest 
 82
Deferred tax liabilities arising from allocation of contribution and Partners' capital 
 (1)
Redemption of redeemable interest in consolidated subsidiary (20,000) 
Forfeiture of equity in connection with redemption of ownership interest (3,337) 
Distributions (661) (998)
Net income 456
 338
Currency translation adjustment (47) (36)
Equity compensation 84
 132
Ending Balance $
 $23,505
Upon acquisition of Indicus Advisors, LLP (“Indicus”) in November 2011, certain former owners of Indicus, who became employees of the Company (“Indicus Owners”), exchanged their respective equity interests in Indicus for a 1% ownership interest (the “Equity Interest”) in the Predecessor entities of the Company. One-half of the Equity Interest was fully vested, was determined to be consideration exchanged pursuant to the acquisition (the “Purchase Consideration”) and was classified as redeemable interest. The remaining one-half of the Equity Interest was classified as a tandem award. The tandem award was comprised of a service

F-44

Ares Management, L.P.
Notes to the Consolidated Financial Statements
(Dollars in Thousands, Except Unit Data and As Otherwise Noted)


condition that vested on the earlier of the fifth anniversary of the award date or a qualifying liquidity event (the “Service Award”), and a put option on their Equity Interest was a strike price of $40 million exercisable at a future date (the “Fixed Price Put Option”). The Fixed Price Put Option was not detachable from the Equity Interest. The Company determined that the Fixed Price Put Option did not require bifurcation from the host contract and that the Equity Interest is not mandatorily redeemable. The two parts of the Equity Interest, the Purchase Consideration and the Service Award, were accounted for separately.

The Purchase Consideration was classified in the redeemable interest in Ares Operating Group to be paid in cash in an amount equal to $20 million, with the residual value reclassified to permanent equity. The put option liability portion of the Service Award of $20 million was classified as a liability to be paid in cash in an amount equal to $20.0 million.
In July 2016, the Indicus Owners exercised their Fixed Price Put Option. The Company paid the Indicus Owners $40 million with $20 million recorded as a reduction to the put option liability, and $20 million recorded as a reduction to the redeemable interest in AOG entities. The residual value of the redeemable interest in the AOG entities of $3.3 million was reclassified to permanent equity. The payment to settle the put option resulted in an increase in tax basis. In connection with this payment, a liability was recorded for the Company’s obligations under the tax receivable agreement (“TRA”) with respect to the tax savings that resulted from the amortization of the increased basis.

10.7. OTHER ASSETS

The components of other assets as of December 31, 2017 and 2016 were as follows:
 As of December 31,
 20232022
Other assets of the Company:  
Accounts and interest receivable$128,756 $120,903 
Fixed assets, net122,223 79,678 
Deferred tax assets, net21,549 68,933 
Other assets157,451 111,623 
Total other assets of the Company$429,979 $381,137 
Other assets of Consolidated Funds:  
Dividends and interest receivable$74,045 $60,321 
Income tax and other receivables12,627 5,249 
Total other assets of Consolidated Funds$86,672 $65,570 
 As of December 31,
 2017 2016
Other assets of the Company: 
  
Accounts and interest receivable$3,025
 $1,071
Fixed assets, net61,151
 40,759
Other assets43,554
 23,735
Total other assets of the Company$107,730
 $65,565
Other assets of Consolidated Funds: 
  
Income tax and other receivables1,989
 2,501
Total other assets of Consolidated Funds$1,989
 $2,501

Fixed Assets, Net
Fixed
The components of fixed assets included the followingwere as of December 31, 2017 and 2016:follows:
 As of December 31,
 20232022
Office and computer equipment$52,681 $41,547 
Internal-use software51,226 57,200 
Leasehold improvements134,272 84,820 
Fixed assets, at cost238,179 183,567 
Less: accumulated depreciation(115,956)(103,889)
Fixed assets, net$122,223 $79,678 
 Year Ended December 31,
 2017 2016
Furniture$9,303
 $8,498
Office and computer equipment19,164
 16,712
Internal-use software19,055
 10,974
Leasehold improvements52,021
 40,994
Fixed assets, at cost99,543
 77,178
Less: accumulated depreciation(38,392) (36,419)
Fixed assets, net$61,151
 $40,759

For the years ended December 31, 2017,  20162023, 2022 and 2015,2021, depreciation expense was $12.6$31.4 million, $8.2$26.2 million and $6.9$22.1 million, respectively, whichand is included inwithin general, administrative and other expense inexpenses within the Consolidated Statements of Operations. During 2017,2023, the Company removed approximately $11.2disposed of $19.8 million of fixed assets that were fully depreciated.


F-45
F-33

Ares Management L.P.Corporation
Notes to the Consolidated Financial Statements (Continued)
(Dollars in Thousands, Except UnitShare Data and As Otherwise Noted)


11.8. COMMITMENTS AND CONTINGENCIES
Indemnification Arrangements
Consistent with standard business practices in the normal course of business, the Company enters into contracts that contain indemnities for affiliates of the Company, persons acting on behalf of the Company or such affiliates and third parties. The terms of the indemnities vary from contract to contract and the Company’s maximum exposure under these arrangements cannot be determined and has not been recorded inwithin the Consolidated Statements of Financial Condition. As of December 31, 2017,2023, the Company has not had prior claims or losses pursuant to these contracts and expects the risk of loss to be remote.
Commitments
As of December 31, 20172023 and 2016,2022, the Company had aggregate unfunded commitments to invest in funds it manages or to support certain strategic initiatives of $285.7$1,030.6 million and $535.3$677.9 million, respectively, including commitmentsrespectively.
Guarantees
The Company has entered into agreements with financial institutions to both non-consolidatedguarantee credit facilities held by certain funds. In the ordinary course of business, the guarantee of credit facilities held by funds may indicate control and Consolidated Funds. Total unfunded commitments included $16.5 million and $89.2 millionresult in commitments to funds not managed byconsolidation of the Company asfund. As of December 31, 20172023 and 2016,2022, the Company’s maximum exposure to losses from guarantees was $122.3 million and $31.5 million, respectively.
Contingent Liabilities
In connection with the Crescent Point Acquisition during the fourth quarter of 2023, the Company established a management incentive program (the “Crescent Point MIP”) with certain professionals. The Crescent Point MIP represents a contingent liability not to exceed $75.0 million and is based on the achievement of revenue targets from the fundraising of a future private equity fund during the measurement period.
The Company expects to settle the liability with a combination of 33% cash and 67% equity awards. Expense associated with the cash and equity components are recognized ratably over the measurement period, which represents the service period and will end on the final fundraising date for the fund. The Crescent Point MIP is remeasured each period with incremental changes in fair value included within compensation and benefits expense within the Consolidated Statements of Operations. Following the measurement period end date, the cash component will be paid and the equity component will be settled with shares of the Company’s Class A common stock and granted at fair value.
As of December 31, 2023, the fair value of the contingent liability was $75.0 million, of which the Company has recorded $5.0 million of compensation expense with an offset to accrued compensation within the Consolidated Statements of Financial Condition.
In connection with the acquisition of EIF, contingent consideration was payable to EIF’s former membership interest holders if certain funds and co-investment vehicles met certain revenue and fee paying commitment targetsAMP Capital’s infrastructure debt platform (the “Infrastructure Debt Acquisition”) during their commitment period. Since the revenue and fee paying targets were not met, the liability associated with the EIF contingent consideration, which was $20.3 million as of December 31, 2016, was reversed in the first quarter of 2017, resulting in2022, the Company established a $20.3management incentive program (the “Infrastructure Debt MIP”) with certain professionals. The Infrastructure Debt MIP represents a contingent liability not to exceed $48.5 million gain recorded within other incomeand is based on the Company's Consolidated Statementsachievement of Operations.revenue targets from the fundraising of certain infrastructure debt funds during the measurement periods.
ARCC Fee Waiver
In conjunctionThe Company expects to settle each portion of the liability with a combination of 15% cash and 85% equity awards. Expense associated with the ARCC-ACAS Transaction,cash components are recognized ratably over the Company agreed to waive up to $10 million per quarterrespective measurement periods, which will end on the final fundraising date for each of ARCC's Part I Fees for ten calendar quarters, which beganthe infrastructure debt funds included in the second quarter of 2017. ARCC Part I FeesInfrastructure Debt MIP agreement. Expense associated with the equity component is recognized ratably over the service periods, which will only be waived to the extent they are paid. If Part I Fees are less than $10 million in any single quarter, the shortfall will not carryover to the subsequent quarters. As of December 31, 2017, there are seven remaining quarters as partcontinue for four years beyond each of the fee waiver agreement,measurement period end dates. The Infrastructure Debt MIP is remeasured each period with a maximum of $70 millionincremental changes in potential waivers. ARCC Part I Fees are reported net of the fee waiver.
Operating Leases
The Company's operating lease agreements are generally subject to escalation provisions on base rental payments, as well as certain costs incurred by the property ownerfair value included within compensation and are recognized on a straight-line basis over the term of the lease agreement. Rentbenefits expense includes base contractual rent. Rent expense for the years ended December 31, 2017, 2016 and 2015 was $26.1 million, $26.4 million and $18.5 million, respectively, and is recorded within general, administrative and other expenses in the Consolidated Statements of Operations. The leases expire in various years ranging from 2018 to 2027.  
The future minimum commitmentsFollowing each of the measurement period end dates, the cash component will be paid and restricted units for the Company's operating leases are as follows:portion of the Infrastructure Debt MIP award earned will be granted at fair value. The unpaid liability at the respective measurement period end dates will be reclassified from liability to additional paid-in-capital and any difference between the fair value of the
F-34
2018$26,849
201926,251
202022,032
202117,726
202219,451
Thereafter51,969
Total$164,278
Guarantees
The Company guaranteed loans provided to certain professionals to support the professionals investments in affiliated co-investment entities, permitting these professionals to invest alongside the Company and its investors in the funds managed by the Company. The total committed and outstanding loan balances were not material as of December 31, 2017 and 2016.

F-46

Ares Management L.P.Corporation
Notes to the Consolidated Financial Statements (Continued)
(Dollars in Thousands, Except UnitShare Data and As Otherwise Noted)


Infrastructure Debt MIP award earned at the respective measurement period end date and the previously recorded compensation expense will be recognized over the remaining four year service period as equity-based compensation expense.
Performance FeesThe revenue target was achieved for one of the infrastructure debt funds during the fourth quarter of 2022. As of December 31, 2022, the fair value of the contingent liability related to this portion of the award was $21.8 million and the Company recorded $7.0 million within accrued compensation within the Consolidated Statements of Financial Condition. During the first quarter of 2023, the associated liability for this portion of the award was settled with a $3.4 million cash payment and the remaining amount equity-settled and reclassified to additional paid-in-capital. For the year ended December 31, 2022, compensation expense of $7.0 million, related to the achieved portion of the award, is presented within compensation and benefits within the Consolidated Statements of Operations.
As of December 31, 2023, the maximum contingent liability associated with the remaining Infrastructure Debt MIP is $15.0 million. As of December 31, 2023 and 2022, the fair value of the contingent liability was $13.6 million and $13.5 million. As of December 31, 2023 and 2022, the Company has recorded $4.4 million and $2.2 million, respectively, within accrued compensation within the Consolidated Statements of Financial Condition. Compensation expense associated with the remaining Infrastructure Debt MIP of $2.3 million and $2.2 million for the years ended December 31, 2023 and 2022, respectively, is presented within compensation and benefits within the Consolidated Statements of Operations.
Carried Interest
Carried interest is affected by changes in the fair values of the underlying investments in the funds that are advised by the Company. Valuations, on an unrealized basis, can be significantly affected by a variety of external factors including, but not limited to, public equity market volatility, industry trading multiples and interest rates. Generally, if at the termination of a fund (and increasingly at interim points in the life of a fund), the fund has not achieved investment returns that (in most cases) exceed the preferred return threshold or (in all cases) the general partner receives net profits over the life of the fund in excess of its allocable share under the applicable partnership agreement, the Company will be obligated to repay carried interest that was received by the Company in excess of the amounts to which the Company is entitled. This contingent obligation is normally reduced by income taxes paid by the Company related to its carried interest. 
AtSenior professionals of the Company who have received carried interest distributions are responsible for funding their proportionate share of any contingent repayment obligations. However, the governing agreements of certain of the Company’s funds provide that if a current or former professional does not fund his or her respective share for such fund, then the Company may have to fund additional amounts beyond what was received in carried interest, although the Company will generally retain the right to pursue any remedies under such governing agreements against those carried interest recipients who fail to fund their obligations.
Additionally, at the end of the life of the funds there could be a payment due to a fund by the Company if the Company has recognized more carried interest than was ultimately earned. The general partner obligation amount, if any, will depend on final realized values of investments at the end of the life of the fund.
As of December 31, 20172023 and 2016,2022, if the Company assumed all existing investments were worthless, the amount of performance feescarried interest subject to potential repayment, net of tax distributions, which may differ from the recognition of revenue, would have been approximately $476.1$78.5 million and $418.3$128.4 million, respectively, of which approximately $370.0$54.5 million and $323.9$101.0 million, respectively, is reimbursable to the Company by certain professionals.professionals who are the recipients of such carried interest. Management believes the possibility of all of the investments becoming worthless is remote. As of December 31, 20172023 and 2016,2022, if the funds were liquidated at their fair values, there would be no contingent repayment obligation and accordingly, the Company did not record a contingent repayment liability as of either date.or liability.
Litigation
From time to time, the Company is named as a defendant in legal actions relating to transactions conducted in the ordinary course of business. Although there can be no assurance of the outcome of such legal actions, in the opinion of management, the Company does not have a potential liability related to any current legal proceeding or claim that would individually or in the aggregate materially affect its results of operations, financial condition or cash flows.

F-35

Ares Management Corporation
12.Notes to the Consolidated Financial Statements (Continued)
(Dollars in Thousands, Except Share Data and As Otherwise Noted)
Leases

The Company leases primarily consists of operating leases for office space and certain office equipment. The Company’s leases have remaining lease terms of one to 13 years. The tables below present certain supplemental quantitative disclosures regarding the Company’s operating leases:

Maturity of operating lease liabilitiesAs of December 31, 2023
2024$51,399 
202551,884 
202648,206 
202737,497 
202827,408 
Thereafter180,050 
Total future payments396,444 
Less: interest76,872 
Total operating lease liabilities$319,572 

Year ended December 31,
Classification within general, administrative and other expenses202320222021
Operating lease expense$49,531 $42,746 $38,135 

Year ended December 31,
Supplemental information on the measurement of operating lease liabilities202320222021
Operating cash flows for operating leases$45,103 $46,558 $37,500 
Leased assets obtained in exchange for new operating lease liabilities168,876 43,331 57,624 

As of December 31,
Lease term and discount rate20232022
Weighted-average remaining lease terms (in years)8.45.5
Weighted-average discount rate4.3%2.7%


F-36

Ares Management Corporation
Notes to the Consolidated Financial Statements (Continued)
(Dollars in Thousands, Except Share Data and As Otherwise Noted)
9. RELATED PARTY TRANSACTIONS
Substantially all of the Company’s revenue is earned from its affiliates, including management fees, performance fees, and administrative expense reimbursements.affiliates. The related accounts receivable are included within due from affiliates within the Consolidated Statements of Financial Condition, except that performance fees receivable,accrued carried interest, which are entirelyis predominantly due from affiliated funds, areis presented separately within investments within the Consolidated Statements of Financial Condition.
The Company has investment management agreements with various funds and accountsthe Ares Funds that it manages. In accordance with these agreements, the Consolidatedthese Ares Funds may bear certain operating costs and expenses which are initially paid by the Company and subsequently reimbursed by the ConsolidatedAres Funds. In addition, the Company has agreements to provide administrative services to various entities.
The Company also has entered into agreements with related parties to beis reimbursed for its expenses incurred forin providing administrative services to suchcertain related parties, including ARCC, ACRE, ARDC, Ivy Hill Asset Management, L.P., ACF FinCo I L.Pour publicly-traded and CION Ares Diversified Credit Fund.non-traded vehicles. In addition, certain private funds pay administrative fees based on invested capital. The Company is also party to agreements with certain funds which pay fees to the Company to provide various property-related services, such as acquisition, development and property management as well as fees for the sale and distribution of fund shares in our non-traded vehicles.

Employees and other related parties may be permitted to participate in co-investment vehicles that generally invest in Ares fundsFunds alongside fund investors. Participation is limited by law to individuals who qualify under applicable securities laws. These co-investment vehicles generally do not require these individuals to pay management fees, carried interest or performanceincentive fees.
PerformanceCarried interest and incentive fees from the funds can be distributed to professionals or their related entities on a current basis, subject, in the case of carried interest programs, to repayment by the subsidiary of the Company that acts as general partner of the relevant fund in the event that certain specified return thresholds are not ultimately achieved. The professionals have personally guaranteed, subject to certain limitations, the obligations of these subsidiaries in respect of this general partner obligation. Such guarantees are several, and not joint, and are limited to distributions received by the relevant recipient.
The Company considers its professionals and non-consolidated funds to be affiliates. Amounts due from and to affiliates were comprisedcomposed of the following:

As of December 31,
 20232022
Due from affiliates:  
Management fees receivable from non-consolidated funds$560,629 $456,314 
Incentive fee receivable from non-consolidated funds159,098 169,979 
Payments made on behalf of and amounts due from non-consolidated funds and employees177,019 132,179 
Due from affiliates—Company$896,746 $758,472 
Amounts due from non-consolidated funds$14,151 $15,789 
Due from affiliates—Consolidated Funds$14,151 $15,789 
Due to affiliates: 
Management fee received in advance and rebates payable to non-consolidated funds$9,585 $8,701 
Tax receivable agreement liability191,299 118,466 
Undistributed carried interest and incentive fees33,374 121,332 
Payments made by non-consolidated funds on behalf of and payable by the Company5,996 4,299 
Due to affiliates—Company$240,254 $252,798 
Amounts due to portfolio companies and non-consolidated funds$3,554 $4,037 
Due to affiliates—Consolidated Funds$3,554 $4,037 
F-47

Ares Management, L.P.
Notes to the Consolidated Financial Statements
(Dollars in Thousands, Except Unit Data and As Otherwise Noted)


 As of December 31,
 2017 2016
Due from affiliates:   
Management fees receivable from non-consolidated funds$126,506
 $123,781
Payments made on behalf of and amounts due from non-consolidated funds and employees39,244
 39,155
Due from affiliates—Company$165,750
 $162,936
Amounts due from portfolio companies and non-consolidated funds$15,884
 $3,592
Due from affiliates—Consolidated Funds$15,884
 $3,592
Due to affiliates: 
  
Management fee rebate payable to non-consolidated funds$5,213
 $7,914
Management fees received in advance1,729
 1,788
Tax receivable agreement liability3,503
 4,748
Payments made by non-consolidated funds on behalf of and amounts due from the Company4,197
 3,114
Due to affiliates—Company$14,642
 $17,564

Due from and Due to Ares Funds and Portfolio Companies
In the normal course of business, the Company pays certain expenses on behalf of Consolidated Funds and non-consolidated funds for which it is reimbursed. Amounts advanced on behalf ofConversely, Consolidated Funds and non-consolidated funds may pay certain expenses that are eliminated in consolidation.reimbursed by the Company. Certain expenses initially paid by the Company, primarily professional services,
F-37

Ares Management Corporation
Notes to the Consolidated Financial Statements (Continued)
(Dollars in Thousands, Except Share Data and As Otherwise Noted)
travel and other costs associated with particular portfolio company holdings, are subject to reimbursement by the portfolio companies.


13.10. INCOME TAXES

The Company’s effective income tax rate is dependent on many factors, including the estimated nature and amounts of many amounts and the mix of revenuesincome and expenses between U.S. corporate subsidiaries that areallocated to the non-controlling interests without being subject to federal, state and local income taxes and those subsidiaries that are not.at the corporate level. Additionally, the Company’s effective tax rate is influenced by the amount of income tax provision recorded for any affiliated funds and co-investment entitiesvehicles that are consolidated in thesethe Company’s consolidated financial statements. Consequently, the effective income tax rate is subject to significant variation from period to period.
The Company files its tax returns as prescribed by the tax laws of the jurisdictions in which it operates. In the normal course of business, the Company is subject to examination by U.S. federal, state, local and foreign tax regulators.authorities. With limited exceptions, the Company is no longer subject to income tax audits by taxing authorities for any years before 2013.prior to 2020. Although the outcome of tax audits is always uncertain, the Company does not believe the outcome of any future audit will have a material adverse effect on the Company’s consolidated financial statements.
On December 22, 2017, the Tax Cuts and Jobs Act was enacted into law creating significant and material updates to the Internal Revenue Code. The most significant change is a decrease of the corporate tax rate from 35% to 21%. The reduction in the corporate tax rate is effective for tax years beginning on or after January 1, 2018. The Company estimated the tax effects of the Tax Cuts and Jobs Act in its fourth quarter tax provision in accordance with its understanding of the changes and guidance available as of the date of this filing. The result was a $0.7 million income tax benefit in the fourth quarter of 2017, the period of enactment of the new tax law. The provisional amount relates to the remeasurement of certain deferred tax assets and liabilities based on the new rates at which they are expected to be reversed. Other significant changes are also included in the Tax Cuts and Jobs Act and will continue to be analyzed.
On December 22, 2017, the SEC issued Staff Accounting Bulletin (“SAB”) 118 to address the application of U.S. GAAP in regards to the change in tax law for registrants that do not have all of the necessary information available to analyze and calculate the accounting impact for the tax effects of the Tax Cuts and Jobs Act. Under SAB 118, the Company determined that approximately $0.7 million of deferred tax benefit should be recorded as a result of the remeasurement of certain deferred tax assets and liabilities that are impacted by the reduction in the U.S. corporate federal income tax rate at December 31, 2017. Additional work is necessary for a more detailed analysis on the tax effects of all aspects of the Tax Cuts and Jobs Act. Any subsequent adjustments to these amounts will be recorded to tax expense in the quarter that the required analysis is completed.

F-48

Ares Management, L.P.
Notes to the Consolidated Financial Statements
(Dollars in Thousands, Except Unit Data and As Otherwise Noted)


The provision for income taxes attributable to the Company and the Consolidated Funds, consisted of the following for the years ended December 31, 2017, 2016 and 2015:  following:
 Year ended December 31,
Provision for Income Taxes202320222021
The Company
Current:   
U.S. federal income tax expense$34,051 $42,452 $40,861 
State and local income tax expense13,316 7,614 12,121 
Foreign income tax expense24,029 14,119 11,684 
71,396 64,185 64,666 
Deferred:
U.S. federal income tax expense85,610 10,660 68,201 
State and local income tax expense15,872 2,131 13,040 
Foreign income tax expense (benefit)(3,730)(5,416)1,390 
97,752 7,375 82,631 
Total:
U.S. federal income tax expense119,661 53,112 109,062 
State and local income tax expense29,188 9,745 25,161 
Foreign income tax expense20,299 8,703 13,074 
Income tax expense169,148 71,560 147,297 
Consolidated Funds
Current: 
Foreign income tax expense3,823 331 88 
Income tax expense3,823 331 88 
Total Provision for Income Taxes
Total current income tax expense75,219 64,516 64,754 
Total deferred income tax expense97,752 7,375 82,631 
Income tax expense$172,971 $71,891 $147,385 


F-38
  Year Ended December 31,
Provision for Income Taxes - The Company 2017 2016 2015
Current:      
U.S. federal income tax (benefit) $(21,559) $19,419
 $12,064
State and local income tax 454
 3,706
 4,839
Foreign income tax 3,741
 8,458
 1,509
  (17,364) 31,583
 18,412
Deferred:      
U.S. federal income tax (benefit) (3,466) (14,247) 356
State and local income tax (benefit) (2,414) (1,400) 306
Foreign income tax (benefit) (1,695) (4,180) (14)
  (7,575) (19,827) 648
Total:      
U.S. federal income tax (benefit) (25,025) 5,172
 12,420
State and local income tax (benefit) (1,960) 2,306
 5,145
Foreign income tax 2,046
 4,278
 1,495
Income tax expense (benefit) (24,939) 11,756
 19,060
       
Provision for Income Taxes - Consolidated Funds      
Current:  
  
  
U.S. federal income tax 
 
 
State and local income tax 
 
 
Foreign income tax (benefit) 1,887
 (737) 4
  1,887
 (737) 4
Deferred:      
U.S. federal income benefit 
 
 
State and local income benefit 
 
 
Foreign income benefit 


Total:      
U.S. federal income benefit 
 
 
State and local income benefit 
 
 
Foreign income tax (benefit) 1,887
 (737) 4
Income tax expense (benefit) 1,887
 (737) 4
       
Total Provision for Income Taxes      
Total current income tax expense (benefit) (15,477) 30,846
 18,416
Total deferred income tax expense (benefit) (7,575) (19,827) 648
Total income tax expense (benefit) $(23,052) $11,019
 $19,064


F-49

Ares Management L.P.Corporation
Notes to the Consolidated Financial Statements (Continued)
(Dollars in Thousands, Except UnitShare Data and As Otherwise Noted)


The effective income tax rate differed from the federal statutory rate for the following reasons for the years ended December 31, 2017, 2016 and 2015:  reasons:
 Year ended December 31,
 202320222021
Income tax expense at federal statutory rate21.0%21.0%21.0%
Income passed through to non-controlling interests(9.6)(8.9)(9.2)
State and local taxes, net of federal benefit1.72.21.9
Foreign taxes(0.7)(1.4)(0.1)
Permanent items0.20.6(0.3)
Disallowed executive compensation0.20.10.7
Other, net0.30.3(0.2)
Valuation allowance(0.1)0.2
Total effective rate13.0%14.1%13.8%
  Year Ended December 31,
  2017 2016 2015
Income tax expense at federal statutory rate 35.0 % 35.0% 35.0%
Income passed through to non-controlling interests (51.1) (27.6) (24.2)
State and local taxes, net of federal benefit (1.4) 0.9
 5.6
Foreign taxes 0.3
 (0.9) 1.4
Permanent items 0.3
 (2.2) 6.0
Tax Cuts and Jobs Act (0.4) 
 
Other, net 0.4
 (1.7) 0.9
Valuation allowance 1.3
 0.2
 (1.3)
Total effective rate (15.6)% 3.7% 23.4%

Deferred Taxes
The income tax effects of temporary differences that give rise to significant portions of deferred tax assets and liabilities were as follows as of December 31, 20172023 and 2016:  2022. Deferred tax assets, net are included within other assets within the Consolidated Statements of Financial Condition.
 As of December 31,
Deferred Tax Assets and Liabilities of the Company20232022
Deferred tax assets  
Amortizable tax basis for AOG Unit exchanges$205,627 $124,217 
Net operating losses and capital loss carryforwards1,829 2,192 
Other, net6,511 6,089 
Total gross deferred tax assets213,967 132,498 
Valuation allowance(942)(2,155)
Total net deferred tax assets213,025 130,343 
Deferred tax liabilities 
Investment in partnerships(191,476)(61,410)
Total deferred tax liabilities(191,476)(61,410)
Deferred tax assets, net$21,549 $68,933 
  As of December 31,
Deferred Tax Assets and Liabilities of the Company 2017 2016
Deferred tax assets    
Net operating losses $2,827
 $99
Investment in partnerships 
 3,774
Other, net 6,542
 2,897
Total gross deferred tax assets 9,369
 6,770
Valuation allowance (15) (39)
Total deferred tax assets, net 9,354
 6,731
Deferred tax liabilities    
Investment in partnerships (1,028) 
Other, net 
 
Total deferred tax liabilities (1,028) 
Net deferred tax assets $8,326
 $6,731

 As of December 31,
Deferred Tax Assets and Liabilities of the Consolidated Funds20232022
Deferred tax assets  
Other, net$2,598 $— 
Total gross deferred tax assets2,598  
Valuation allowance(2,598)— 
Total deferred tax assets, net$ $ 
  As of December 31,
Deferred Tax Assets and Liabilities of the Consolidated Funds 2017 2016
Deferred tax assets    
Net operating loss $4,703
 $4,951
Other, net 2,173
 53
Total gross deferred tax assets 6,876
 5,004
Valuation allowance (6,876) (5,004)
Total deferred tax assets, net $
 $

In assessing the realizability of deferred tax assets, the Company considers whether it is probable that some or all of the deferred tax assets will not be realized. In determining whether the deferred taxes are realizable, the Company considers the period of expiration of the tax asset, historical and projected taxable income, and tax liabilities for the tax jurisdiction in which the tax asset is located. Valuation allowances are provided to reduce the amounts of deferred tax assets to an amount that is more likely

F-50

Ares Management, L.P.
Notes to the Consolidated Financial Statements
(Dollars in Thousands, Except Unit Data and As Otherwise Noted)


than not to be realized based on an assessment of positive and negative evidence, including estimates of future taxable income necessary to realize future deductible amounts.
The Company’s income tax provision includes corporate income taxes and other entity level income taxes, as well as income taxes incurred by Consolidated Funds.
As of December 31, 2023 and 2022, the valuation allowance for the Company’s deferred tax assets increased by $1.9was $0.9 million in 2017 due to additional net valuation allowances recordedand $2.2 million, respectively. The deferred tax assets related to operating losses generated deductible temporary differences in variousforeign jurisdictions and certain capital loss
F-39

Ares Management Corporation
Notes to the Consolidated Financial Statements (Continued)
(Dollars in whichThousands, Except Share Data and As Otherwise Noted)
carryforwards do not meet the Company operates, offset by the reduction of valuation allowances recorded in prior years for which the Company is able to conclude that the realization of the related deferred tax asset is more likely than not asthreshold and have a valuation allowance recorded for the net balance.
As of December 31, 2017. The valuation allowance for deferred tax assets increased by $0.5 million in 2016 due to additional net valuation allowances recorded related to operating losses incurred in various jurisdictions in which the Company operates, offset by the reduction of valuation allowances recorded in prior years for which the Company is able to conclude that the realization of the related deferred tax asset is more likely than not as of December 31, 2016.
At December 31, 2017,2023, the Company had $24.8$10.6 million of net operating loss ("NOL"(“NOL”) carryforwards attributableand other tax attributes related to its consolidated fundsConsolidated Funds available to reduce future foreign income taxes for which a full valuation allowance has been provided. The majority of the foreign NOLs generally have no expiry. The Company generated a NOL for U.S. federal income tax purposes of approximately $71.2 million in 2017, primarily driven by the deduction of the ACAS transaction support payment made in the first quarter of 2017. The Company anticipates to carryback the NOL to the 2015 and 2016 tax years for U.S. federal income tax purposes resulting in a tax receivable of approximately $21.8 million. The deduction also generated state NOLs which will be carried forward and available to reduce state income taxes.

As of, and for the three years ended December 31, 2017, 20162023, 2022 and 2015,2021, the Company had no significant uncertain tax positions.

14.11. EARNINGS PER COMMON UNITSHARE
The Company has Class A and non-voting common stock outstanding. The non-voting common stock has the same economic rights as the Class A common stock; therefore, earnings per share is presented on a combined basis. Income of the Company has been allocated on a proportionate basis to the two common stock classes.

Basic earnings per share of Class A and non-voting common unitstock is computed by dividing income available to common unitholders byusing the weighted‑average number of common units outstanding during the period.two-class method. Diluted earnings per share of Class A and non-voting common unitstock is computed using the more dilutive method of either the two-class method or the treasury stock method.
The treasury stock method is used to determine potentially dilutive securities resulting from options and unvested restricted units granted under the 2014 Equity Incentive Plan. The two-class method is an earnings allocation method under which earnings per unit is calculated for common units and participating securities considering both dividends declared (or accumulated) and participation rights in undistributed earnings as if all such earnings had been distributed during the period. Because the holders of unvested restricted units have the right to participate in distributions when declared, the unvested restricted units are considered participating securities to the extent they are expected to vest.
For the years ended December 31, 20172023 and 2015, the two-class method was the more dilutive method for the unvested restricted units. For the year ended December 31, 20162021, the treasury stock method was the more dilutive method. For the year ended December 31, 2022, the two-class method forwas the unvested restricted units. No participating securities had rights to undistributed earnings during any period presented.more dilutive method.

The computation of diluted earnings per common unit for the years ended December 31, 2017, 2016 and 2015share excludes the following options, restricted units and AOG Units as their effect would have been anti-dilutive:
 For the Year Ended December 31,
 2017 2016 2015
Options21,001,916
 22,781,597
 24,082,415
Restricted units14,105,481
 47,182
 4,657,761
AOG Units130,244,013
 131,499,652
 132,427,608

F-51

Ares Management, L.P.
Notes to the Consolidated Financial Statements
(Dollars in Thousands, Except Unit Data and As Otherwise Noted)


Year ended December 31,
202320222021
Restricted units2,071 — 132 
AOG Units118,804,252 — 116,226,798 
The following table presents the computation of basic and diluted earnings per common unit:share:
Year ended December 31,
202320222021
Basic earnings per share of Class A and non-voting common stock:
Net income attributable to Ares Management Corporation Class A and non-voting common stockholders$474,326 $167,541 $386,748 
Dividends declared and paid on Class A and non-voting common stock(571,923)(429,104)(309,835)
Distributions on unvested restricted units(21,303)(14,096)(10,986)
Undistributed earnings allocable to participating unvested restricted units— — (7,138)
Undistributed net income (dividends in excess of earnings) available to Class A and non-voting common stockholders$(118,900)$(275,659)$58,789 
Basic weighted-average shares of Class A and non-voting common stock184,523,524 175,510,798 163,703,626 
Undistributed basic earnings (dividends in excess of earnings) per share of Class A and non-voting common stock$(0.64)$(1.57)$0.36 
Dividend declared and paid per Class A and non-voting common stock3.08 2.44 1.88 
Basic earnings per share of Class A and non-voting common stock$2.44 $0.87 $2.24 
Diluted earnings per share of Class A and non-voting common stock:
Net income attributable to Ares Management Corporation Class A and non-voting common stockholders$474,326 $167,541 $386,748 
Distributions on unvested restricted units— (14,096)— 
Net income available to Class A and non-voting common stockholders$474,326 $153,445 $386,748 
Effect of dilutive shares:
Restricted units9,347,318 — 11,209,144 
Options1,902,584 — 5,199,501 
Diluted weighted-average shares of Class A and non-voting common stock195,773,426 175,510,798 180,112,271 
Diluted earnings per share of Class A and non-voting common stock$2.42 $0.87 $2.15 
F-40
 For the Year Ended December 31,
 2017 2016 2015
Net income attributable to Ares Management, L.P. common unitholders$54,478
 $99,632
 $19,378
Earnings distributed to participating securities (restricted units)(3,588) (1,257) (646)
Preferred stock dividends(1)
 (8) (15)
Net income available to common unitholders$50,890
 $98,367
 $18,717
Basic weighted-average common units81,838,007
 80,749,671
 80,673,360
Basic earnings per common unit$0.62
 $1.22
 $0.23
Net income (loss) attributable to Ares Management, L.P. common unitholders$54,478
 $99,632
 $19,378
Earnings distributed to participating securities (restricted units)(3,588) 
 (646)
Preferred stock dividends(1)
 (8) (15)
Net income available to common unitholders$50,890

$99,624
 $18,717
Effect of dilutive units:     
Restricted units
 2,187,359
 
Diluted weighted-average common units81,838,007
 82,937,030
 80,673,360
Diluted earnings per common unit$0.62
 $1.20
 $0.23

Ares Management Corporation
Notes to the Consolidated Financial Statements (Continued)
(Dollars in Thousands, Except Share Data and As Otherwise Noted)
(1)Dividends relate to the preferred shares that were issued by Ares Real Estate Holdings LLC and were redeemed on July 1, 2016.
15.12. EQUITY COMPENSATION
Equity Incentive Plan
In 2014,April 2023, the Company adoptedCompany’s board of directors approved the 2014 Equity Incentive Plan. UnderPlan to replace the Third Amended and Restated 2014 Equity Incentive Plan the Company granted options to acquire 24,835,227 common units, 4,936,051 restricted units to be settled in common units and 686,395 phantom common units to be settled in cash. Based on a formula as defined in the (“2014 Equity Incentive Plan, the total number of units available to be issued under the 2014Plan”). The Equity Incentive Plan resetswas approved by stockholders on June 12, 2023, and may increase on January 1 each year.  Accordingly, on January 1, 2017,as of that date, the total number of unitsshares available for issuance under the 2014 Equity Incentive Plan was 69,122,318 and may reset to 31,686,457 units, and ason January 1 of each year, based on a formula set forth in the Equity Incentive Plan. As of December 31, 2017, 26,284,165 units remain2023, 69,150,100 shares remained available for issuance.issuance under the Equity Incentive Plan.
Generally, unvested phantom units, restricted units and options are forfeited upon termination of employment in accordance with the 2014 Equity Incentive Plan. The Company recognizes forfeitures as a reversal of previously recognized compensation expense in the period they occur.the forfeiture occurs.
Equity-based compensation expense, net of forfeitures, recorded by the Company is includedpresented in the following table:
Year ended December 31,
 202320222021
Restricted units$255,965 $200,391 $170,980 
Restricted units with a market condition— — 66,211 
Equity-based compensation expense$255,965 $200,391 $237,191 
 For the Year Ended December 31,
 2017 2016 2015
Restricted units$54,339
 $21,894
 $14,035
Options13,848
 15,450
 16,575
Phantom units1,524
 1,721
 1,634
Equity-based compensation expense$69,711
 $39,065
 $32,244

Restricted Units

Each restricted unit represents an unfunded, unsecured right of the holder to receive a share of the Company’s Class A common unitstock on a specific date. The restricted units generally vest and are settled in shares of Class A common units eitherstock either: (i) at a rate of one‑thirdone-third per year, beginning on the third anniversary of the grant date,date; (ii) in their entiretyat a rate of one quarter per year, beginning on the fifthsecond anniversary of the grant date or the holder’s employment commencement date or (iii) at a rate of one quarterone-third per year,

F-52

Ares Management, L.P.
Notes to the Consolidated Financial Statements
(Dollars in Thousands, Except Unit Data and As Otherwise Noted)


beginning on the first anniversary of the grant date.date, in each case generally subject to the holder’s continued employment as of the applicable vesting date (subject to accelerated vesting upon certain qualifying terminations of employment or retirement eligibility provisions). Compensation expense associated with restricted units is recognized on a straight-line basis over the requisite service period of the award.

Restricted units are delivered net of the holder’s payroll related taxes upon vesting. For the year ended December 31, 2023, 3.8 million restricted units vested and 2.2 million shares of Class A common stock were delivered to the holders. For the year ended December 31, 2022, 5.5 million restricted units vested and 3.1 million shares of Class A common stock were delivered to the holders.

The holders of restricted units, other than awards that have not yet been issued as described in the subsequent sections, generally have the right to receive as current compensation an amount in cash equal toto: (i) the amount of any distributiondividend paid with respect to a share of Class A common unitstock multiplied by (ii) the number of restricted units held at the time such distributionsdividends are declared (“DistributionDividend Equivalent”). During the year ended December 31, 2017, the Company declared four quarterly distributions of $0.28, $0.13, $0.31 and $0.41 per common unit to common unitholders of record at the close of business on March 10, May 30, August 18, and November 17, respectively. For the year ended December 31, 2017, Distribution Equivalents were made to the holders of restricted units in the aggregate amount of $16.0 million, which are presented as distributions within the Consolidated Statement of Changes in Equity. When units are forfeited, the cumulative amount of distribution equivalentsDividend Equivalents previously paid is reclassified to compensation and benefits expense inwithin the Consolidated Statements of Operations.

The following table summarizes the Company’s dividends declared and Dividend Equivalents paid during the year ended December 31, 2023:
Record DateDividends
Per Share
Dividend Equivalents Paid
March 17, 2023$0.77 $12,032 
June 16, 20230.77 11,874 
September 15, 20230.77 11,704 
December 15, 20230.77 11,596 

During the first quarter of 2023, the Company approved the future grant of restricted units to certain senior executives in each of 2024, 2025 and 2026, subject to the holder’s continued employment and acceleration in certain instances. The vesting period of these awards are at a rate of 25% per year, beginning on the second anniversary of the grant date. Given that these
F-41

Ares Management Corporation
Notes to the Consolidated Financial Statements (Continued)
(Dollars in Thousands, Except Share Data and As Otherwise Noted)
future restricted units have been communicated to the recipient, the Company accounts for these awards as if they have been granted and recognizes the compensation expense on a straight-line basis over the service period. The restricted units that have been approved and communicated but not yet granted are not eligible to receive a Dividend Equivalent until the grant date.

The following table presents unvested restricted units’ activity during the year ended December 31, 2017:activity:
 Restricted UnitsWeighted Average
Grant Date Fair
Value Per Unit
Balance as of December 31, 202216,662,999 $48.76 
Granted4,780,786 78.97 
Vested(3,826,544)38.46 
Forfeited(257,412)58.75 
Balance as of December 31, 202317,359,829 $59.20 
 Restricted Units 
Weighted Average
Grant Date Fair
Value Per Unit
Balance - January 1, 20178,058,372
 $16.38
Granted7,999,669
 18.60
Vested(1,843,730) 16.57
Forfeited(462,423) 18.19
Balance - December 31, 201713,751,888
 $17.58

The total compensation expense expected to be recognized in all future periods associated with the restricted units is approximately $169.5$650.9 million as of December 31, 20172023 and is expected to be recognized over the remaining weighted average period of 3.493.4 years.
Options
EachOptions
Upon exercise, each option entitles the holders to purchase from the Company upon exercise thereof, one share of Class A common unitstock at the stated exercise price. The term of the options is generally ten10 years, beginning on the grant date. The options generally vest at a rateall of one-third per year, beginning on the third anniversary of the grant date. Compensation expense associated with these options is being recognized on a straight-line basis over the requisite service period of the respective award. As of December 31, 2017, there was $21.0 million of total unrecognized compensation expense that is expected to be recognized over the remaining weighted average period of 1.35 years. Net cash proceeds from the exercises of stock options was $1.1 million for the year end December 31, 2017. The Company realized tax benefits of approximately $0.1 million from those exercises.which expire in May 2024.
A summary of unvested options activity during the year ended December 31, 20172023 is presented below:
 OptionsWeighted Average Exercise PriceWeighted Average Remaining Life
(in years)
Aggregate Intrinsic Value
Balance as of December 31, 20225,170,219 $19.00 1.3$255,616 
Exercised(5,090,695)19.00 — — 
Expired— — — — 
Forfeited— — — — 
Balance as of December 31, 202379,524 $19.00 0.3$7,946 
Exercisable as of December 31, 202379,524 $19.00 0.3$7,946 
 Options Weighted Average Exercise Price 
Weighted Average
Remaining Life
(in years)
 Aggregate Intrinsic Value
Balance - January 1, 201722,232,134
 $18.99
 7.35 $4,586
Granted
 
  
Exercised(54,500) 19.00
  205
Expired(523,440) 19.00
  
Forfeited(1,159,169) 19.00
  
December 31, 201720,495,025
 $18.99
 6.09 $20,611
Exercisable at December 31, 20177,369,430
 $19.00
 5.62 $7,369
Net cash proceeds from exercises of stock options were $86.0 million for the year ended December 31, 2023. The Company realized tax benefits of approximately $53.9 million from those exercises.

Aggregate intrinsic value represents the value of the Company’s closing unitshare price of Class A common stock on the last trading day of the period in excess of the weighted-average exercise price multiplied by the number of options exercisable or expected to vest.
13. EQUITY AND REDEEMABLE INTEREST
Common Stock

The fairCompany’s common stock consists of Class A, Class B, Class C and non-voting common stock, each $0.01 par value per share. The non-voting common stock has the same economic rights as the Class A common stock. Sumitomo Mitsui Banking Corporation (“SMBC”) is the sole holder of an awardthe non-voting common stock. The Class B common stock and Class C common stock are non-economic and holders are not entitled to dividends from the Company or to receive any assets of the Company in the event of any dissolution, liquidation or winding up of the Company. Ares Management GP LLC is affected bythe sole holder of the Class B common stock and Ares Voting LLC (“Ares Voting”) is the sole holder of the Class C common stock.
Except as otherwise expressly provided in the Company’s unit priceCertificate of Incorporation (the “Certificate of Incorporation”), the Company’s common stockholders are entitled to vote on all matters on which stockholders of a corporation are generally entitled to vote under the date of grant as well as other assumptionsDelaware General Corporation Law (the “DGCL”), including the estimated volatilityelection of the Company’s unit price over the termboard of directors. Holders of shares of the awards and the estimated periodCompany’s Class A common stock are entitled to one vote per share of time that

F-53
F-42

Ares Management L.P.Corporation
Notes to the Consolidated Financial Statements (Continued)
(Dollars in Thousands, Except UnitShare Data and As Otherwise Noted)


management expects employeesthe Company’s Class A common stock. On any date on which the Ares Ownership Condition (as defined in the Certificate of Incorporation) is satisfied, holders of shares of the Company’s Class B common stock are, in the aggregate, entitled to hold their unit options.a number of votes equal to (x) four times the aggregate number of votes attributable to the Company’s Class A common stock minus (y) the aggregate number of votes attributable to the Company’s Class C common stock. On any date on which the Ares Ownership Condition is not satisfied, holders of shares of the Company’s Class B common stock are not entitled to vote on any matter submitted to a vote of the Company’s stockholders. The estimated periodholder of time that management expects employeesshares of the Company’s Class C common stock is generally entitled to hold their options was estimated asa number of votes equal to the midpoint betweennumber of AOG Units (as defined in the vesting dateCertificate of Incorporation) held of record by each Ares Operating Group Limited Partner (as defined in the Certificate of Incorporation) other than the Company and maturity date.its subsidiaries.
The fair valueCompany has a stock repurchase program that allows for the repurchase of each option granted during each yearup to $150.0 million of shares of Class A common stock. Under the program, shares may be repurchased from time to time in open market purchases, privately negotiated transactions or otherwise, including in reliance on Rule 10b5-1 of the Securities Act. The renewal of the program is measuredsubject to authorization by the Company’s board of directors on an annual basis. As of December 31, 2023, the program was scheduled to expire in March 2024, and the renewal was subsequently authorized by the Company’s board of directors and will expire in March 2025. Repurchases under the program, if any, will depend on the date of the grant using the Black‑Scholes option pricing modelprevailing market conditions and the following weighted average assumptions:
 For the Year Ended December 31,
 2017(2) 2016(2) 2015
Risk-free interest rateN/A N/A 1.71% to 1.80%
Weighted average expected dividend yieldN/A N/A 5.00%
Expected volatility factor(1)N/A N/A 35.00% to 36.00%
Expected life in yearsN/A N/A 6.66 to 7.49
(1)   Expected volatility is based on comparable companies using daily stock prices.
(2) There were no new options granted duringother factors. During the years ended December 31, 20172023, 2022 and 2016.
Phantom Units
Each phantom unit represents an unfunded, unsecured right2021, the Company did not repurchase any shares as part of the holder to receive an amountstock repurchase program.

The following table presents the changes in cash per phantom unit equaleach class of common stock:
Class A Common StockNon-Voting Common StockClass B Common StockClass C Common StockTotal
Balance as of December 31, 2022173,892,036 3,489,911 1,000 117,231,288 294,614,235 
Issuance of stock2,591,432 — — — 2,591,432 
Issuance of AOG Units(1)
— — — 3,473,026 3,473,026 
Exchanges of AOG Units3,679,556 — — (3,679,556)— 
Stock option exercises, net of shares withheld for tax4,742,044 — — — 4,742,044 
Vesting of restricted stock awards, net of shares withheld for tax2,164,839 — — — 2,164,839 
Balance as of December 31, 2023187,069,907 3,489,911 1,000 117,024,758 307,585,576 
(1) Represents issuance of AOG Units to the average closing pricerecipients of a common unit for the 15 trading days immediately prior to,management incentive program from the acquisition of Black Creek Group’s real estate investment advisory and distribution business (the “Black Creek Acquisition”), which relieved the 15 trading days immediatelyassociated liability following the vesting date. The phantom units will vest in equal installments over five years at the anniversaries of the IPO date. The phantom units are accounted for as liability awards with compensation expensemaximum contingent payment being recognized on a straight-line basis based on the number of unvested units. Forfeitures will reduce the expenses in the period in which the forfeiture occurs.
A summary of unvested phantom units’ activity during the year ended December 31, 2017 is presented below:
     
  Phantom Units Weighted Average Grant Date Fair Value Per Unit
Balance - January 1, 2017 266,138
 $19.00
Vested (87,222) 19.00
Forfeited (22,763) 19.00
December 31, 2017 156,153
 $19.00
The fair value of the awards is remeasured at each reporting period and was $20.00 per unitmet as of December 31, 2017. Based on2022. Pursuant to an agreement with the fair valuerecipients of the awards at December 31, 2017, $2.1 millionBlack Creek Acquisition management incentive program, a portion of unrecognized compensation expensesuch AOG Units were issued in connection with phantom units outstanding is expected to be recognized over a weighted average periodlieu of 1.33 years. For the year ended December 31, 2017, the Company paid $1.7 million to settle vested phantom units.
Adoption of ASU 2016-09
The Company adopted ASU 2016-09 effective January 1, 2016 using a modified retrospective approach and recorded a cumulative-effect adjustment with the following impact to beginning equity:
 Partners' Capital Non-Controlling Interest in AOG Entities Redeemable Interest in AOG Entities
Balance at December 31, 2015$251,537
 $397,883
 $23,505
Retained earnings(3,357) (5,470) (38)
Paid-in-capital - equity compensation3,767
 6,138
 43
Distributions - dividend equivalent(410) (668) (5)
Balance at December 31, 2015 (as adjusted)$251,537
 $397,883
 $23,505

F-54

Ares Management, L.P.
Notescash consideration which was payable pursuant to the Consolidated Financial Statements
(DollarsBlack Creek Acquisition management incentive program. Issuances of Class C Common stock corresponds with increases in Thousands, Except Unit Data and As Otherwise Noted)


16. EQUITY
Ares Management,Owners Holdings L.P.

Common Units:
Common units represent limited partnership interests’s ownership interest in the Company. The holders of common units are entitled to participate pro rata in distributions from the Company and to exercise the rights or privileges that are available to common unitholders under the Company’s partnership agreement. The common unitholders have limited voting rights and have no right to remove the Company’s general partner, Ares Management GP LLC, or, except in limited circumstances, to elect the directors of the general partner.AOG entities.

The following table presents each partner'spartner’s AOG Units and corresponding ownership interest in each of the Ares Operating GroupAOG entities, as of December 31, 2017 and 2016, as well as its daily average ownership of AOG Units in each of the Ares Operating Group entities for the years ended December 31, 2017, 2016 and 2015.AOG entities:
Daily Average Ownership
As of December 31, 2023As of December 31, 2022Year ended December 31,
AOG UnitsDirect Ownership InterestAOG UnitsDirect Ownership Interest202320222021
Ares Management Corporation190,559,818 61.95%177,381,947 60.21%60.83%59.76%58.48%
Ares Owners Holdings, L.P.117,024,758 38.05117,231,288 39.7939.1740.2441.52
Total307,584,576 100.00%294,613,235 100.00%
  As of December 31, Daily Average Ownership 
  2017 2016  For the Year Ended December 31, 
  AOG Units Direct Ownership Interest AOG Units Direct Ownership Interest 2017 2016 2015 
Ares Management, L.P. 82,280,033
 38.75% 80,814,732
 38.26% 38.59% 38.04% 37.86% 
Ares Owners Holding L.P. 117,576,663
 55.36% 117,928,313
 55.82% 55.52% 56.07% 56.27% 
Affiliate of Alleghany Corporation 12,500,000
 5.89% 12,500,000
 5.92% 5.89% 5.89% 5.87% 
Total 212,356,696
 100.00% 211,243,045
 100.00%       

The Company’s ownership percentage of the AOG Units will continue to change upon: (i) the vesting of restricted units and exercise of options that were granted under the Equity Incentive Plan; (ii) the exchange of AOG Units for shares of Class A common units;stock; (iii) the cancellation of AOG Units in connection with certain individuals’ forfeiture of AOG Units upon termination of employmentemployment; and (iv) the issuance of new AOG Units, including in connection with acquisitions.acquisitions, among other strategic reasons. Holders of the AOG Units, subject to any applicable transfer restrictions, may up to four times each year (subject to the terms of the exchange agreement) exchange their AOG Units for shares of Class A common unitsstock on a one-for-one basis. Equity is reallocated among partners upon a change in ownership to ensure each partners’ capital account properly reflects their respective claim on the residual value of the Company. This change is reflected as either a reallocation of interest or as dilution inwithin the Consolidated Statements of Changes in Equity.
Preferred Equity
As of December 31, 2017 and 2016, the Company had 12,400,000 units of Series A Preferred Equity (the “Preferred Equity”) outstanding. When, as and if declared by the Company’s board of directors, distributions on the Preferred Equity are payable quarterly at a rate per annum equal to 7.00%. The Preferred Equity may be redeemed at the Company’s option, in whole or in part, at any time on or after June 30, 2021, at a price of $25.00 per unit.

Secondary Offering
On March 2, 2017, AREC Holdings Ltd., a wholly owned subsidiary of Abu Dhabi Investment Authority ("ADIA" or “the selling unitholder”) sold 7,500,000 units of the Company's common units through a public secondary offering. The Company did not receive any of the proceeds from the offering. The Company incurred approximately $0.7 million of expenses related to the secondary offering transaction. The fees related to the secondary offering were non-operating expenses and are included in other income, net in the Consolidated Statements of Operations. The selling unitholder paid the underwriting discounts and commissions and/or similar charges incurred for the sale of the common units.


F-55F-43

Ares Management L.P.Corporation
Notes to the Consolidated Financial Statements (Continued)
(Dollars in Thousands, Except UnitShare Data and As Otherwise Noted)


17. MARKET AND OTHER RISK FACTORSRedeemable Interest
Due
On July 1, 2020, the Company completed its acquisition of a majority interest in SSG Capital Holdings Limited and its operating subsidiaries (“SSG” and subsequently rebranded as “Ares SSG”) (the “SSG Acquisition”). In connection with the SSG Acquisition, the former owners of SSG retained a 20% ownership interest in the operations acquired by the Company. In certain circumstances, the Company had the ability to acquire full ownership of SSG pursuant to a contractual arrangement to be initiated by the natureCompany or by the former owners of SSG. Since the acquisition of the Company's investment strategy,remaining interest in SSG was not within the Company's portfoliosole discretion, the ownership interest held by the former owners of investments has significant marketSSG was classified as a redeemable interest and credit risk. Asrepresented mezzanine equity.

In connection with a result,merger agreement to acquire the Company is subject to market, credit and other risk factors, including, but not limited to the following:
Market Risk
The market price of investments may significantly fluctuate during the period of investment. Investments may decline in value due to factors affecting securities markets generally or particular industries representedremaining 20% ownership interest in the securities markets. The valueAres SSG fee-generating business that was retained by the former owners of an investment may decline due to general market conditions which are not specifically related to such investment, such as real or perceived adverse economic conditions, changes in the general outlook for corporate earnings, changes in interest or currency rates or adverse investor sentiment generally. They may also decline due to factors that affectSSG (the “SSG Buyout”), a particular industry or industries, such as labor shortages or increased production costs and competitive conditions within an industry.
Limited Liquidity of Investments
The Company invests in securities that may not be readily marketable. Illiquid investments may trade at a discount from comparable, more liquid investments, and at times there may be no market at all for such investments. Subordinate investments may be less marketable, or in some instances illiquid, because of the absence of registration under federal securities laws, contractual restrictions on transfer, the small size of the market and the small size of the issue (relative to issues of comparable interests). As a result, the Company may encounter difficulty in selling its investments or may, if required to liquidate investments to satisfy redemption requests of its investors or debt service obligations, be compelled to sell such investments at less than fair value. 
Counterparty Risk
Some of the markets in which the Company invests are over-the-counter or interdealer markets. The participants in such markets are typically not subject to credit evaluation and regulatory oversight unlike members of exchange-based markets. The lack of oversight exposes the Company to the risk that a counterparty will not settle a transaction in accordance with its terms and conditions because of a dispute over the terms of the applicable contract (whether or not such dispute is bona fide) or because of a credit or liquidity problem, causing the Company to suffer losses. Such counterparty risk is accentuated for contracts with longer maturities where events may intervene to prevent settlement, or where the Company has concentrated its transactions with a single or small group of counterparties.
Credit Risk
There are no restrictions on the credit quality of the investments the Company makes. Investments may be deemed by nationally recognized rating agencies to have substantial vulnerability to default in payment of interest and/or principal. Some investments may have low-quality ratings or be unrated. Lower rated and unrated investments have major risk exposure to adverse conditions and are considered to be predominantly speculative. Generally, such investments offer a higher return potential than higher rated investments, but involve greater volatility of price and greater risk of loss of income and principal.
In general, the ratings of nationally recognized rating organizations represent the opinions of agencies as to the quality of the securities they rate. Such ratings, however, are relative and subjective; they are not absolute standards of quality and do not evaluate the market value risk of the relevant securities. It is also possible that a rating agency might not change its rating of a particular issue on a timely basis to reflect subsequent events. The Company may use these ratings as initial criteria for the selection of portfolio assets for the Company but is not required to utilize them.
Currency Risk
The Company may invest in financial instruments and enter into transactions denominated in currencies other than US dollars its functional currency. Although the Company may seek to hedge currency exposure through financial instruments, the Company may still be exposed to risks that the exchange rate of its currency relative to other foreign currencies may change in a manner that has an adverse effect on the value of that portion of the Company's assets or liabilities denominatedredeemable interest in currencies other thanAOG entities was purchased on March 31, 2023, and the functional currency.Company now owns 100% of Ares SSG’s fee-generating business. The SSG Buyout was effectuated through newly issued shares of Class A common stock. The remaining redeemable interest in AOG entities represents ownership in certain investments that were not included in the SSG Buyout and continues to be presented at the redemption amount within mezzanine equity within the Consolidated Statements of Financial Condition.

During the year ended December 31, 2023, the shareholders of Ares Acquisition Corporation (formerly NYSE: AAC) (“AAC I”) elected to redeem the remaining amount of AAC I’s trust account following the extensions of the period to complete a business combination and the subsequent determination that it would not complete a business combination. On April 25, 2023, Ares Acquisition Corporation II (NYSE: AACT) (“AAC II”), the Company’s second sponsored SPAC, consummated its initial public offering and generated gross proceeds of $500.0 million. As of December 31, 2023, the 50,000,000 AAC II Class A ordinary shares are presented at the redemption amount within mezzanine equity within the Consolidated Statements of Financial Condition.
F-56
F-44

Ares Management L.P.Corporation
Notes to the Consolidated Financial Statements (Continued)
(Dollars in Thousands, Except UnitShare Data and As Otherwise Noted)


The following table summarizes the activities associated with the redeemable interest in AOG entities:
18.
Total
Balance as of December 31, 2020$100,366
Distributions(2,390)
Net loss(1,341)
Currency translation adjustment, net of tax(627)
Balance as of December 31, 202196,008
Distributions(1,887)
Net loss(851)
Currency translation adjustment, net of tax(426)
Equity compensation285 
Balance as of December 31, 202293,129
Changes in ownership interests and related tax benefits(66,507)
Distributions(2,883)
Net income226 
Currency translation adjustment, net of tax(41)
Equity compensation174 
Balance as of December 31, 2023$24,098

The following table summarizes the activities associated with the redeemable interest in Consolidated Funds:
Total
Balance as of December 31, 2021$1,000,000
Change in redemption value13,282 
Balance as of December 31, 20221,013,282
Gross proceeds from the initial public offering of AAC II500,000 
Change in redemption value55,530 
Redemptions from Class A ordinary shares of AAC I(1,045,874)
Balance as of December 31, 2023$522,938

14. SEGMENT REPORTING
The Company operates through its three distinct operating segments. In 2017,On March 31, 2023, the Company executed the SSG Buyout. The Company rebranded Ares SSG as Ares Asia and the Ares SSG credit business, including the Asian special situations, Asian secured lending and APAC direct lending strategies, as APAC credit. APAC credit has been reclassified certain expenses from OMGeffective January 1, 2023 and is now presented within the Credit Group. In connection with this reclassification, the Company will no longer use Strategic Initiatives to itsdescribe all other operating segments.segments, instead reporting the collective results as Other. The Company reclassified activities of APAC credit to the Credit Group to better align the segment presentation with the global asset classes and investment strategies. Separately, the Private Equity Group includes APAC private equity following the Crescent Point Acquisition. The Company has modified historical results to conform with its current presentation.
The Company’s threeCompany operating segments are:are summarized below:
Credit Group: The Company’s Credit Group is a leading manager of credit strategies across the non-investment grade credit universe in the U.S. and Europe, with approximately $71.7 billion of assets under management and 139 funds as of December 31, 2017. The Credit Group offers a range ofmanages credit strategies across the liquid and illiquid spectrum, including syndicated loans, high yield bonds,liquid credit, opportunities, structuredalternative credit, investments and U.S. and European direct lending. The Credit Group provides solutions for traditional fixed income investors seeking to access the syndicated loans and high yield bond markets and capitalizes on opportunities across traded corporate credit. It additionally provides investors access to directly originated fixed and floating rate credit assets and the ability to capitalize on illiquidity premiums across the credit spectrum. The Credit Group’s syndicated loans strategy focuses on liquid, traded non-investment grade secured loans to corporate issuers. The high yield bond strategy seeks to deliver a diversified portfolio of liquid, traded non-investment grade corporate bonds, including secured, unsecured and subordinated debt instruments. Credit opportunities is a “go anywhere” strategy seeking to capitalize on market inefficiencies and relative value opportunities across the capital structure. The structured credit strategy invests across the capital structures of syndicated collateralized loan obligation vehicles (CLOs) and in directly-originated asset-backed instruments comprised of diversified portfolios of consumer and commercial assets. The Company is one of the largest self-originating direct lenders to the U.S. and European middle markets, providing one-stop financing solutions for small-to-medium sized companies, which the Company believes are increasingly underserved by traditional lenders. The Company provides investors access to these capabilities through several vehicles, including commingled funds, separately managed accounts and a publicly traded vehicle. The Credit Group conducts its U.S. corporate lending activities primarily through ARCC, the largest business development company as of December 31, 2017, by both market capitalization and total assets. In addition, the Credit Group manages a commercial finance business that provides asset-based and cash flow loans to small and middle-market companies, as well as asset-based facilities to specialty finance companies. The Credit Group’s European direct lending platform is one of the most significant participants in the European middle-market, focusing on self-originated investments in illiquid middle-market credits.and APAC credit.
Private Equity Group: The Company’s Private Equity Group has approximately $24.5 billion of assets under management as of December 31, 2017, broadly categorizingcategorizes its investment strategies as corporate private equity, U.S. powerspecial opportunities and energy infrastructure and special situations. As of December 31, 2017, the group managed five corporateAPAC private equity commingled funds focused on North America and Europe and two focused on greater China, five commingled funds and six related co-investment vehicles focused on U.S. power and energy infrastructure and three special situations funds. In its North American and European flexible capital strategy, the Company targets opportunistic majority or shared-control investments in businesses with strong franchises and attractive growth opportunities in North America and Europe.equity.
Real Assets Group: The U.S. power and energy infrastructure strategy targets U.S. energy infrastructure-related assets across the power generation, transmission and midstream sectors, seeking attractive risk-adjusted equity returns with current cash flow and capital appreciation. The special situations strategy seeks to invest opportunistically across a broad spectrum of distressed or mispriced investments, including corporate debt, rescue capital, private asset-backed investments, post-reorganization securities and non-performing portfolios.
Real Estate Group: The Company’s Real EstateAssets Group manages comprehensive public and private equity and debt strategies with approximately $10.2 billionacross real estate and infrastructure investments.
Secondaries Group: The Secondaries Group invests in secondary markets across a range of assets under management across 42 funds asalternative asset class strategies, including private equity, real estate, infrastructure and credit.

F-45

Ares Management Corporation
Notes to mismanagedthe Consolidated Financial Statements (Continued)
(Dollars in Thousands, Except Share Data and capital-starved assets, as well asAs Otherwise Noted)
Other: Other represents a compilation of operating segments and strategic investments that seek to expand the Company’s reach and its scale in new development, ultimately selling stabilized assets back intoand existing global markets but individually do not meet reporting thresholds. These results include activities from: (i) Ares Insurance Solutions (“AIS”), the market. The Real Estate Group manages both a value-add strategy and an opportunistic strategy. The value-add strategy seeksCompany’s insurance platform that provides solutions to create value by buying assets at attractive valuations and through activeinsurance clients including asset management, of income-producing properties acrosscapital solutions and corporate development; and (ii) the U.S. and Western Europe. The opportunistic strategy focuses on manufacturing core assets through development, redevelopment and fixing distressed capital structures across major properties inSPACs sponsored by the U.S. and Europe. The Company’s debt strategies leverage the Real Estate Group’s diverse sources of capital to directly originate and manage commercial mortgage investments on properties that range from stabilized to requiring hands-on value creation.  In addition to managing private debt funds, the Real Estate Group makes debt investments through a publicly traded commercial mortgage REIT, ACRE. Company, among others.
The Company has an Operations Management Group (the “OMG”) thatOMG consists of five shared resource groups to support the Company’s operating segments by providing infrastructure and administrative support in the areas of accounting/finance,

F-57

Ares Management, L.P.
Notes to the Consolidated Financial Statements
(Dollars in Thousands, Except Unit Data and As Otherwise Noted)


operations/ operations, information technology, business development/corporatelegal, compliance, human resources, strategy, legal/compliancerelationship management and human resources.distribution. The OMG includes Ares Wealth Management Solutions, LLC (“AWMS”) that facilitates the product development, distribution, marketing and client management activities for investment offerings in the global wealth management channel. Additionally, the OMG provides services to certain of the Company’s investment companiesmanaged funds and partnerships,vehicles, which reimburse the OMG for expenses either equal to the costcosts of services provided.provided or as a percentage of invested capital. The OMG’s revenues and expenses are not allocated to the Company’s three reportableoperating segments but the Company does consider the cost structurefinancial results of the OMG when evaluating its financial performance.
Non-GAAPIn February 2024, the Company announced that the special opportunities strategy, historically reported as a component of the Private Equity Group, will be integrated into the Credit Group to align management of this strategy and will form the foundation for a new opportunistic credit strategy. For segment reporting purposes, the change will require the reclassification of the special opportunities strategy from the Private Equity Group to the Credit Group and will be presented in the Company’s consolidated financial statements beginning in 2024.
Segment Profit Measures: These measures supplement and should be considered in addition to, and not in lieu of, the Consolidated Statements of Operations prepared in accordance with GAAP.
Economic net income (“ENI”), a non-GAAP measure, is an operating metric used by management to evaluate total operating performance, a decision tool for deployment of resources, and an assessment of the performance of the Company’s business segments. ENI differs from net income by excluding (a) income tax expense, (b) operating results of the Consolidated Funds, (c) depreciation and amortization expense, (d) placement fees and underwriting costs (e) the effects of changes arising from corporate actions, and (f) certain other items that the Company believes are not indicative of its total operating performance. Changes arising from corporate actions include equity-based compensation expenses, the amortization of intangible assets, transaction costs associated with mergers and acquisitions and capital transactions, and expenses incurred in connection with corporate reorganization.  
Fee related earnings (“FRE”), a non-GAAP measure, refers to a component of ENI that is used to assess core operating performance by determining whether recurring revenue, primarily consisting of management fees and fee related performance revenues, is sufficient to cover operating expenses and to generate profits. FRE differs from income before taxes computed in accordance with GAAP as it adjusts for the items included in the calculation of ENI and excludes net performance fees, performance fee compensation,income, investment income from the Consolidated Fundsour funds and non-consolidated funds andadjusts for certain other items that the Company believes are not indicative of its core operating performance.
Performance Fee related earnings (“PRE”),performance revenues, together with fee related performance compensation, is presented within FRE because it represents incentive fees from perpetual capital vehicles that is measured and eligible to be received on a non-GAAP measure, is used to assess the Company’s investment performance net of performance fee compensation. PRE differs from income (loss) before taxes computed in accordance with GAAP as it only includes performance fees, performance fee compensationrecurring basis and total investment and other income earnednot dependent on realization events from the Consolidated Funds and non-consolidated funds.underlying investments.
Realized income (“RI”), a non-GAAP measure, is an operating metric used by management to evaluate performance of the business based on tangible operating performance and the contribution of each of the business segments to that performance, while removing the fluctuations of unrealized income and expenses, which may or may not be eventually realized at the levels presented and whose realizations depend more on future outcomes than current business operations. RI differs from net income before taxes by excluding (a) income tax expense, (b)excluding: (i) operating results of ourthe Consolidated Funds, (c)Funds; (ii) depreciation and amortization expense, (d)expense; (iii) the effects of changes arising from corporate actions, (e)actions; (iv) unrealized gains and losses related to performancecarried interest, incentive fees and investment performanceperformance; and (e)adjusts for certain other items that we believethe Company believes are not indicative of our tangible operating performance. Changes arising from corporate actions include equity-based compensation expenses, the amortization of intangible assets, transaction costs associated with mergers, acquisitions and capital transactions, placement fees andactivities, underwriting costs and expenses incurred in connection with corporate reorganization.
Distributable earnings (“DE”), a non-GAAP measure, Placement fee adjustment represents the net portion of either expense deferral or amortization of upfront fees to placement agents that is an operating metric that assessespresented to match the Company’s performance withouttiming of expense recognition with the effects ofperiod over which management fees are expected to be earned from the Consolidated Funds and the impact of unrealized income and expenses, which generally fluctuate with fair value changes. Among other things, this metric also is used to assistassociated fund for segment purposes but have been expensed in determining amounts potentially available for distribution. However, the declaration, payment, and determination of the amount of distributions to unitholders, if any, is at the sole discretion of the Company’s Board of Directors, which may change the distribution policy at any time. Distributable earnings is calculated as the sum of fee related earnings, realized performance fees, realized performance fee compensation, realized net investment and other income, and is reduced by expenses arising from transaction costs associated with acquisitions, placement fees and underwriting costs, expenses incurred in connection with corporate reorganization and depreciation. Distributable earnings differs from income before taxes computedadvance in accordance with GAAP as it is typically presented before giving effect to unrealized performance fees, unrealized performance fee compensation, unrealized net investment income,GAAP. For periods in which the amortization of intangibles and equity compensation expense. DEupfront fees for segment purposes is higher than the GAAP expense, the placement fee adjustment is presented prioras a reduction to the effect of income taxes andRI. Management believes RI is a more appropriate metric to distributions made toevaluate the Company’s preferred unitholders, unless otherwise noted.current business operations.
Management makes operating decisions and assesses the performance of each of the Company’s business segments based on financial and operating metrics and other data that is presented before giving effect to the consolidation of any of the Consolidated

F-58

Ares Management, L.P.
Notes to the Consolidated Financial Statements
(Dollars in Thousands, Except Unit Data and As Otherwise Noted)


Funds. Consequently, all segment data excludes the assets, liabilities and operating results related to the Consolidated Funds and non‑consolidatednon-consolidated funds. Total assets by segments is not disclosed because such information is not used by the Company’s chief operating decision maker in evaluating the segments.
F-46

Ares Management Corporation
Notes to the Consolidated Financial Statements (Continued)
(Dollars in Thousands, Except Share Data and As Otherwise Noted)
Many of the Ares Funds managed by the Company have mandates that allow for investing across different geographic regions, including North America, Europe, Asia-Pacific and the Middle East. The primary geographic region in which the Company invests in is North America and the majority of its revenues are generated in North America.

F-47

Ares Management Corporation
Notes to the Consolidated Financial Statements (Continued)
(Dollars in Thousands, Except Share Data and As Otherwise Noted)
The following table presentstables present the financial results for the Company’s operating segments, as well as the OMG, for the year ended December 31, 2017:OMG:
Year ended December 31, 2023
Credit GroupPrivate Equity GroupReal Assets GroupSecondaries GroupOtherTotal SegmentsOMGTotal
Management fees$1,749,796 $230,251 $389,437 $174,942 $27,087 $2,571,513 $— $2,571,513 
Fee related performance revenues167,333 — 334 12,782 — 180,449 — 180,449 
Other fees35,257 3,076 29,695 22 374 68,424 23,685 92,109 
Compensation and benefits(598,125)(85,024)(153,870)(62,160)(15,812)(914,991)(361,124)(1,276,115)
General, administrative and other expenses(96,733)(35,762)(46,789)(21,199)(3,119)(203,602)(200,613)(404,215)
Fee related earnings1,257,528 112,541 218,807 104,387 8,530 1,701,793 (538,052)1,163,741 
Performance income—realized271,550 117,899 20,990 5,460 — 415,899 — 415,899 
Performance related compensation—realized(175,193)(89,767)(12,768)(4,678)— (282,406)— (282,406)
Realized net performance income96,357 28,132 8,222 782 — 133,493 — 133,493 
Investment income (loss)—realized20,111 (1,434)(4,498)— 170 14,349 — 14,349 
Interest and other investment income—realized21,975 4,952 11,055 4,867 16,623 59,472 748 60,220 
Interest expense(27,300)(21,422)(16,391)(8,980)(32,026)(106,119)(156)(106,275)
Realized net investment income (loss)14,786 (17,904)(9,834)(4,113)(15,233)(32,298)592 (31,706)
Realized income$1,368,671 $122,769 $217,195 $101,056 $(6,703)$1,802,988 $(537,460)$1,265,528 
Year ended December 31, 2022
Credit GroupPrivate Equity GroupReal Assets GroupSecondaries GroupOtherTotal SegmentsOMGTotal
Management fees$1,416,518 $199,837 $347,808 $176,694 $11,671 $2,152,528 $— $2,152,528 
Fee related performance revenues71,497 — 167,693 235 — 239,425 — 239,425 
Other fees31,992 1,888 35,879 — 274 70,033 24,529 94,562 
Compensation and benefits(462,681)(86,561)(240,015)(53,743)(12,108)(855,108)(317,396)(1,172,504)
General, administrative and other expenses(79,434)(30,697)(39,739)(12,685)(2,089)(164,644)(155,017)(319,661)
Fee related earnings977,892 84,467 271,626 110,501 (2,252)1,442,234 (447,884)994,350 
Performance income—realized156,929 123,806 133,130 4,156 — 418,021 — 418,021 
Performance related compensation—realized(97,621)(90,300)(83,105)(3,515)— (274,541)— (274,541)
Realized net performance income59,308 33,506 50,025 641 — 143,480 — 143,480 
Investment income (loss)—realized7,078 3,432 3,115 — 861 14,486 (37)14,449 
Interest and other investment income (expense)—realized27,288 2,546 9,045 3,683 9,130 51,692 (1,588)50,104 
Interest expense(15,932)(15,953)(11,346)(5,660)(21,781)(70,672)(684)(71,356)
Realized net investment income (loss)18,434 (9,975)814 (1,977)(11,790)(4,494)(2,309)(6,803)
Realized income$1,055,634 $107,998 $322,465 $109,165 $(14,042)$1,581,220 $(450,193)$1,131,027 
F-48
 Credit Group Private Equity Group Real
Estate Group
 Total
Segments
 OMG Total
Management fees (Credit Group includes ARCC Part I Fees of $105,467)$481,466
 $198,498
 $64,861
 $744,825
 $
 $744,825
Other fees20,830
 1,495
 106
 22,431
 
 22,431
Compensation and benefits(192,022) (68,569) (39,586) (300,177) (113,558) (413,735)
General, administrative and other expenses(33,308) (17,561) (10,519) (61,388) (75,143) (136,531)
Fee related earnings276,966

113,863

14,862
 405,691
 (188,701) 216,990
Performance fees—realized21,087
 287,092
 9,608
 317,787
 
 317,787
Performance fees—unrealized54,196
 191,559
 80,160
 325,915
 
 325,915
Performance fee compensation—realized(9,218) (228,774) (4,338) (242,330) 
 (242,330)
Performance fee compensation—unrealized(35,284) (153,148) (48,960) (237,392) 
 (237,392)
Net performance fees30,781

96,729

36,470
 163,980
 
 163,980
Investment income—realized7,102
 22,625
 5,534
 35,261
 3,880
 39,141
Investment income—unrealized5,480
 38,754
 2,626
 46,860
 8,627
 55,487
Interest and other investment income5,660
 3,906
 2,495
 12,061
 1,267
 13,328
Interest expense(12,405) (5,218) (1,650) (19,273) (1,946) (21,219)
Net investment income5,837

60,067

9,005
 74,909
 11,828
 86,737
Performance related earnings36,618

156,796

45,475
 238,889
 11,828
 250,717
Economic net income$313,584

$270,659

$60,337
 $644,580
 $(176,873) $467,707
Realized income$293,724
 $192,814
 $24,527
 $511,065
 $(185,625) $325,440
Distributable earnings$268,737
 $187,733
 $19,189
 $475,659
 $(204,024) $271,635
Total assets$837,562
 $1,255,454
 $306,463
 $2,399,479
 $119,702
 $2,519,181

F-59

Ares Management L.P.Corporation
Notes to the Consolidated Financial Statements (Continued)
(Dollars in Thousands, Except UnitShare Data and As Otherwise Noted)


Year ended December 31, 2021
Credit GroupPrivate Equity GroupReal Assets GroupSecondaries GroupOtherTotal SegmentsOMGTotal
Management fees$1,128,887 $181,918 $218,202 $97,945 $8,325 $1,635,277 $— $1,635,277 
Fee related performance revenues86,480 — 51,399 — — 137,879 — 137,879 
Other fees27,152 1,070 13,038 — 33 41,293 8,478 49,771 
Compensation and benefits(429,150)(78,156)(127,679)(25,215)(7,917)(668,117)(226,725)(894,842)
General, administrative and other expenses(61,712)(21,625)(24,181)(6,862)(752)(115,132)(100,645)(215,777)
Fee related earnings751,657 83,207 130,779 65,868 (311)1,031,200 (318,892)712,308 
Performance income—realized207,450 171,637 95,270 70 — 474,427 — 474,427 
Performance related compensation—realized(131,902)(137,576)(59,056)(49)— (328,583)— (328,583)
Realized net performance income75,548 34,061 36,214 21 — 145,844 — 145,844 
Investment income (loss)—realized1,985 (3,754)17,700 19 17 15,967 — 15,967 
Interest and other investment income—realized20,728 11,514 7,252 2,261 3,597 45,352 226 45,578 
Interest expense(8,098)(7,925)(6,394)(836)(12,971)(36,224)(536)(36,760)
Realized net investment income (loss)14,615 (165)18,558 1,444 (9,357)25,095 (310)24,785 
Realized income$841,820 $117,103 $185,551 $67,333 $(9,668)$1,202,139 $(319,202)$882,937 
The following table presents the financial results for the Company’s operating segments, as well as the OMG, for the year ended December 31, 2016:
 Credit Group Private Equity Group Real
Estate Group
 Total
Segments
 OMG Total
Management fees (Credit Group includes ARCC Part I Fees of $121,181)$444,664
 $147,790
 $66,997
 $659,451
 $
 $659,451
Other fees(1)9,953
 1,544
 854
 12,351
 
 12,351
Compensation and benefits(182,901) (61,276) (41,091) (285,268) (99,447) (384,715)
General, administrative and other expenses(28,539) (14,679) (10,603) (53,821) (60,916) (114,737)
Fee related earnings243,177

73,379

16,157

332,713

(160,363)
172,350
Performance fees—realized51,435
 230,162
 11,401
 292,998
 
 292,998
Performance fees—unrealized22,851
 188,287
 17,334
 228,472
 
 228,472
Performance fee compensation—realized(11,772) (184,072) (2,420) (198,264) 
 (198,264)
Performance fee compensation—unrealized(26,109) (149,956) (13,517) (189,582) 
 (189,582)
Net performance fees36,405

84,421

12,798

133,624


133,624
Investment income (loss)—realized4,928
 18,773
 931
 24,632
 (14,606) 10,026
Investment income (loss)—unrealized11,848
 (613) 5,418
 16,653
 (2,197) 14,456
Interest and other investment income26,119
 16,579
 1,661
 44,359
 149
 44,508
Interest expense(8,609) (5,589) (1,056) (15,254) (2,727) (17,981)
Net investment income (loss)34,286

29,150

6,954

70,390

(19,381)
51,009
Performance related earnings70,691

113,571

19,752

204,014

(19,381)
184,633
Economic net income$313,868

$186,950

$35,909

$536,727

$(179,744)
$356,983
Realized income$301,706
 $149,544
 $26,611
 $477,861
 $(177,533) $300,328
Distributable earnings$294,814
 $144,140
 $21,594
 $460,548
 $(196,242) $264,306
Total assets$650,435
 $1,218,412
 $232,862
 $2,101,709
 $74,383
 $2,176,092

The following table presents the financial results for the Company’s operating segments, as well as the OMG, for the year ended December 31, 2015:
 Credit Group Private Equity Group Real
Estate Group
 Total
Segments
 OMG Total
Management fees (Credit Group includes ARCC Part I Fees of $121,491)$432,769
 $152,104
 $66,045
 $650,918
 $
 $650,918
Other fees414
 1,406
 2,779
 4,599
 
 4,599
Compensation and benefits(174,262) (56,859) (42,632) (273,753) (86,869) (360,622)
General, administrative and other expenses(30,322) (15,647) (15,766) (61,735) (56,168) (117,903)
Fee related earnings228,599

81,004

10,426

320,029

(143,037)
176,992
Performance fees—realized87,583
 24,849
 9,516
 121,948
 
 121,948
Performance fees—unrealized(71,341) 87,809
 15,179
 31,647
 
 31,647
Performance fee compensation—realized(44,110) (19,255) (1,826) (65,191) 
 (65,191)
Performance fee compensation—unrealized36,659
 (74,598) (8,553) (46,492) 
 (46,492)
Net performance fees8,791

18,805

14,316

41,912


41,912
Investment income—realized13,274
 6,840
 2,658
 22,772
 (23) 22,749
Investment income (loss)—unrealized(15,731) (13,205) 1,522
 (27,414) 52
 (27,362)
Interest and other investment income10,429
 6,166
 259
 16,854
 379
 17,233
Interest expense(7,075) (5,936) (977) (13,988) (1,158) (15,146)
Net investment income (loss)897

(6,135)
3,462

(1,776)
(750)
(2,526)
Performance related earnings9,688

12,670

17,778

40,136

(750)
39,386
Economic net income$238,287

$93,674

$28,204

$360,165

$(143,787)
$216,378
Realized income$288,700
 $93,668
 $20,056
 $402,424
 $(143,839) $258,585
Distributable earnings$279,630
 $88,767
 $14,831
 $383,228
 $(152,639) $230,589
Total assets$530,758
 $927,758
 $186,058
 $1,644,574
 $96,637
 $1,741,211

F-60

Ares Management, L.P.
Notes to the Consolidated Financial Statements
(Dollars in Thousands, Except Unit Data and As Otherwise Noted)


(1)For the year ended December 31, 2015, the Company presented compensation and benefits expenses and general, administrative and other expenses net of the administrative fees earned from certain funds. As a result, for the year ended December 31, 2015, $21.6 million and $4.4 million of administrative fees have been reclassified from other fees to compensation and benefits expenses and general, administrative and other expenses, respectively.
The following table presents the components of the Company’s operating segments’ revenue, expenses and other income (expense):
realized net investment income:
 For the Year Ended December 31,
 2017 2016 2015
Segment Revenues     
Management fees (includes ARCC Part I Fees of $105,467, $121,181 and $121,491 for the years ended December 31, 2017, 2016 and 2015, respectively)$744,825
 $659,451
 $650,918
Other fees22,431
 12,351
 4,599
Performance fees—realized317,787
 292,998
 121,948
Performance fees—unrealized325,915
 228,472
 31,647
Total segment revenues$1,410,958
 $1,193,272
 $809,112
Segment Expenses     
Compensation and benefits$300,177
 $285,268
 $273,753
General, administrative and other expenses61,388
 53,821
 61,735
Performance fee compensation—realized242,330
 198,264
 65,191
Performance fee compensation—unrealized237,392
 189,582
 46,492
Total segment expenses$841,287
 $726,935
 $447,171
Other Income (Expense)     
Investment income—realized$35,261
 $24,632
 $22,772
Investment income (loss)—unrealized46,860
 16,653
 (27,414)
Interest and other investment income12,061
 44,359
 16,854
Interest expense(19,273) (15,254) (13,988)
Total other income (expense)$74,909
 $70,390
 $(1,776)
Year ended December 31,
202320222021
Segment revenues
Management fees$2,571,513 $2,152,528 $1,635,277 
Fee related performance revenues180,449 239,425 137,879 
Other fees68,424 70,033 41,293 
Performance income—realized415,899 418,021 474,427 
Total segment revenues$3,236,285 $2,880,007 $2,288,876 
Segment expenses
Compensation and benefits$914,991 $855,108 $668,117 
General, administrative and other expenses203,602 164,644 115,132 
Performance related compensation—realized282,406 274,541 328,583 
Total segment expenses$1,400,999 $1,294,293 $1,111,832 
Segment realized net investment income (expense)
Investment income—realized$14,349 $14,486 $15,967 
Interest and other investment income —realized59,472 51,692 45,352 
Interest expense(106,119)(70,672)(36,224)
Total segment realized net investment income (expense)$(32,298)$(4,494)$25,095 

The following table reconciles segment revenue to Ares consolidated revenues:
F-49
 For the Year Ended December 31,
 2017 2016 2015
Total segment revenue$1,410,958
 $1,193,272
 $809,112
Revenue of Consolidated Funds eliminated in consolidation(27,498) (18,522) (13,279)
Administrative fees(1)34,049
 26,934
 26,007
Performance fees reclass(2)(1,936) (2,479) (7,398)
Revenue of non-controlling interests in consolidated
subsidiaries(3)
(74) 
 
Total consolidated adjustments and reconciling items4,541
 5,933
 5,330
Total consolidated revenue$1,415,499

$1,199,205
 $814,442
(1)Represents administrative fees that are presented in administrative, transaction and other fees in the Company’s Consolidated Statements of Operations and are netted against the respective expenses for segment reporting.
(2)Related to performance fees for AREA Sponsor Holdings LLC, an investment pool. Changes in value of this investment are reflected within other income in the Company’s Consolidated Statements of Operations.
(3)Adjustments for administrative fees reimbursed attributable to certain of our joint venture partners.


F-61

Ares Management L.P.Corporation
Notes to the Consolidated Financial Statements (Continued)
(Dollars in Thousands, Except UnitShare Data and As Otherwise Noted)


The following table reconciles the Company’s consolidated revenues to segment expenses to Ares consolidated expenses:revenue:
 For the Year Ended December 31,
 2017 2016 2015
Total segment expenses$841,287
 $726,935
 $447,171
Expenses of Consolidated Funds added in consolidation65,501
 42,520
 36,417
Expenses of Consolidated Funds eliminated in consolidation(26,481) (21,447) (18,312)
Administrative fees(1)34,049
 26,934
 26,007
OMG expenses188,701
 160,363
 143,037
Acquisition and merger-related expenses280,055
 773
 40,482
Equity compensation expense69,711
 39,065
 32,244
Placement fees and underwriting costs19,765
 6,424
 8,825
Amortization of intangibles17,850
 26,638
 46,227
Depreciation expense12,631
 8,215
 6,942
Expenses of non-controlling interests in consolidated subsidiaries(2)1,689
 
 
Total consolidation adjustments and reconciling items663,471
 289,485
 321,869
Total consolidated expenses$1,504,758

$1,016,420
 $769,040
Year ended December 31,
202320222021
Total consolidated revenue$3,631,884 $3,055,443 $4,212,091 
Performance income—unrealized(305,370)(107,153)(1,744,056)
Management fees of Consolidated Funds eliminated in consolidation48,201 46,324 44,896 
Performance income of Consolidated Funds eliminated in consolidation13,672 11,529 5,458 
Administrative, transaction and other fees of Consolidated Funds eliminated in consolidation7,166 17,013 4,483 
Administrative fees(1)
(63,144)(69,414)(49,223)
OMG revenue(23,685)(24,354)(8,478)
Acquisition-related incentive fees(2)
— — (47,873)
Principal investment income, net of eliminations(36,516)(12,278)(99,433)
Net revenue of non-controlling interests in consolidated subsidiaries(35,923)(37,103)(28,989)
Total consolidation adjustments and reconciling items(395,599)(175,436)(1,923,215)
Total segment revenue$3,236,285 $2,880,007 $2,288,876 
(1)Represents administrative fees that are presented in administrative, transaction and other fees in the Company’s Consolidated Statements of Operations and are netted against the respective expenses for segment reporting.
(2)Costs being borne by certain of our joint venture partners.

(1)Represents administrative fees from expense reimbursements that are presented within administrative, transaction and other fees within the Company’s Consolidated Statements of Operations and are netted against the respective expenses for segment reporting.
(2)Represents a component of the purchase price from incentive fees associated with one-time contingent consideration recorded in connection with the Black Creek Acquisition. 100% of the fees recognized in 2021 is presented within incentive fees in the Company’s Consolidated Statements of Operations of which 50% is included on an unconsolidated basis.

The following table reconciles the Company’s consolidated expenses to segment other income to Ares consolidated other income:expenses:
 For the Year Ended December 31,
 2017 2016 2015
Net investment income (loss)$74,909
 $70,390
 $(1,776)
Other income from Consolidated Funds added in consolidation, net154,869
 37,388
 13,695
Other income (expense) from Consolidated Funds eliminated in consolidation, net(25,646) 4,856
 12,007
Other income of non-controlling interests in consolidated subsidiaries(2)24
 
 
OMG other expense11,828
 (19,381) (750)
Performance fee reclass(1)1,936
 2,479
 7,398
Change in value of contingent consideration20,156
 17,675
 21,064
Merger related expenses
 
 (15,446)
Other non-cash expense1,730
 1,728
 (110)
Offering costs(688) 
 
Total consolidation adjustments and reconciling items164,209
 44,745
 37,858
Total consolidated other income$239,118

$115,135
 $36,082
Year ended December 31,
202320222021
Total consolidated expenses$2,797,858 $2,749,085 $3,410,083 
Performance related compensation-unrealized(206,923)(88,502)(1,316,205)
Expenses of Consolidated Funds added in consolidation(93,167)(86,988)(113,024)
Expenses of Consolidated Funds eliminated in consolidation50,108 50,833 50,538 
Administrative fees(1)
(62,773)(68,255)(49,223)
OMG expenses(561,737)(472,413)(327,370)
Acquisition and merger-related expense(12,000)(15,197)(21,162)
Equity compensation expense(255,790)(200,106)(237,191)
Acquisition-related compensation expense(2)
(7,334)(206,252)(66,893)
Placement fee adjustment5,819 (2,088)(78,883)
Depreciation and amortization expense(233,185)(335,083)(106,705)
Expense of non-controlling interests in consolidated subsidiaries(19,877)(30,741)(32,133)
Total consolidation adjustments and reconciling items(1,396,859)(1,454,792)(2,298,251)
Total segment expenses$1,400,999 $1,294,293 $1,111,832 
(1)Related to performance fees for AREA Sponsor Holdings LLC. Changes in value of this investment are reflected within other (income) expense in the Company’s Consolidated Statements of Operations.
(2)Costs being borne by certain of our joint venture partners.

(1)Represents administrative fees from expense reimbursements that are presented within administrative, transaction and other fees within the Company’s Consolidated Statements of Operations and are netted against the respective expenses for segment reporting.
(2)Represents contingent obligations (“earnouts”) resulting from the Landmark Acquisition, the Black Creek Acquisition, the Infrastructure Debt Acquisition and the Crescent Point Acquisition that are recorded as compensation expense and are presented within compensation and benefits within the Company’s Consolidated Statements of Operations.


F-62
F-50

Ares Management L.P.Corporation
Notes to the Consolidated Financial Statements (Continued)
(Dollars in Thousands, Except UnitShare Data and As Otherwise Noted)


The following table reconciles the Company’s consolidated other income to segment realized net investment income:
Year ended December 31,
202320222021
Total consolidated other income$499,037 $204,448 $263,682 
Investment (income) loss—unrealized(184,929)12,769 (58,694)
Interest and other investment (income) loss—unrealized6,448 (25,603)6,249 
Other income, net from Consolidated Funds added in consolidation(492,848)(250,144)(256,375)
Other expense, net from Consolidated Funds eliminated in consolidation(16,485)(16,484)(2,868)
OMG other (income) expense1,074 14,419 (1,368)
Principal investment income155,632 48,223 120,896 
Other (income) expense, net976 1,873 (19,886)
Other (income) loss of non-controlling interests in consolidated subsidiaries(1,203)6,005 (26,541)
Total consolidation adjustments and reconciling items(531,335)(208,942)(238,587)
Total segment realized net investment income (expense)$(32,298)$(4,494)$25,095 

The following table presents the reconciliation of income before taxes as reported in the Consolidated Statements of Operations to segment results of ENI, RI FRE, PRE and DE:FRE:
 For the Year Ended December 31,
 2017 2016 2015
Economic net income     
Income before taxes$149,859
 $297,920
 $81,484
Adjustments:     
Amortization of intangibles17,850
 26,638
 46,227
Depreciation expense12,631
 8,215
 6,942
Equity compensation expenses69,711
 39,065
 32,244
Acquisition and merger-related expenses259,899
 (16,902) 34,864
Placement fees and underwriting costs19,765
 6,424
 8,825
OMG expenses, net176,873
 179,744
 143,787
Offering costs688
 
 
Other non-cash expense(1,730) (1,728) 110
Expense of non-controlling interests in Consolidated subsidiaries(2)1,739
 
 
(Income) loss before taxes of non-controlling interests in Consolidated Funds, net of eliminations(62,705) (2,649) 5,682
Total consolidation adjustments and reconciling items494,721
 238,807
 278,681
Economic net income644,580
 536,727
 360,165
Total performance fees income - unrealized(325,915) (228,472) (31,647)
Total performance fee compensation - unrealized237,392
 189,582
 46,492
Total investment (income) loss - unrealized(44,992) (19,976) 27,414
Realized income511,065
 477,861
 402,424
Total performance fees income - realized(317,787) (292,998) (121,948)
Total performance fee compensation - realized242,330
 198,264
 65,191
Total investment (income) loss - realized(29,917) (50,414) (25,638)
Fee related earnings405,691
 332,713
 320,029
Performance fees—realized317,787
 292,998
 121,948
Performance fee compensation—realized(242,330) (198,264) (65,191)
Investment and other income realized, net29,913
 50,415
 25,638
Additional adjustments:     
Dividend equivalent(1)(12,427) (4,181) (2,688)
One-time acquisition costs(1)(118) (457) (1,553)
Income tax expense(1)(1,677) (3,199) (1,462)
Non-cash items720
 870
 (758)
Placement fees and underwriting costs(1)(16,324) (6,431) (8,817)
Depreciation(1)(5,576) (3,916) (3,918)
Distributable earnings$475,659
 $460,548
 $383,228
Performance related earnings     
Economic net income$644,580
 $536,727
 $360,165
Less: fee related earnings(405,691) (332,713) (320,029)
Performance related earnings$238,889

$204,014
 $40,136
Year ended December 31,
202320222021
Income before taxes$1,333,063 $510,806 $1,065,690 
Adjustments:
Depreciation and amortization expense233,185 335,083 106,705 
Equity compensation expense255,419 198,948 237,191 
Acquisition-related compensation expense(1)
7,334 206,252 66,893 
Acquisition-related incentive fees(2)
— — (47,873)
Acquisition and merger-related expense12,000 15,197 21,162 
Placement fee adjustment(5,819)2,088 78,883 
OMG expense, net539,126 462,478 317,524 
Other (income) expense, net976 1,874 (19,886)
Income before taxes of non-controlling interests in consolidated subsidiaries(17,249)(357)(23,397)
Income before taxes of non-controlling interests in Consolidated Funds, net of eliminations(278,119)(119,664)(120,457)
Total performance income—unrealized(305,370)(107,153)(1,744,056)
Total performance related compensation—unrealized206,923 88,502 1,316,205 
Total investment income—unrealized(178,481)(12,834)(52,445)
Realized income1,802,988 1,581,220 1,202,139 
Total performance income—realized(415,899)(418,021)(474,427)
Total performance related compensation—realized282,406 274,541 328,583 
Total investment (income) loss—realized32,298 4,494 (25,095)
Fee related earnings$1,701,793 $1,442,234 $1,031,200 
(1)
Certain costs are reduced by the amounts attributable to OMG, which is excluded from segment results.
(2)Adjustments for administrative fees reimbursed and other revenue items attributable to certain of our joint venture partners.

(1)Represents earnouts resulting from the Landmark Acquisition, the Black Creek Acquisition, the Infrastructure Debt Acquisition and the Crescent Point Acquisition that are recorded as compensation expense and are presented within compensation and benefits within the Company’s Consolidated Statements of Operations.

(2)Represents a component of the purchase price from incentive fees associated with one-time contingent consideration recorded in connection with the Black Creek Acquisition. 100% of the fees recognized in 2021 is presented within incentive fees within the Company’s Consolidated Statements of Operations of which 50% is included on an unconsolidated basis for segment reporting purposes.


F-63
F-51

Ares Management L.P.Corporation
Notes to the Consolidated Financial Statements (Continued)
(Dollars in Thousands, Except UnitShare Data and As Otherwise Noted)


The reconciliation of total segment assets to total assets reported in the Consolidated Statements of Financial Condition consists of the following:
 For the Year Ended December 31,
 2017 2016 2015
Total segment assets$2,399,479
 $2,101,709
 $1,644,574
Total assets from Consolidated Funds added in Consolidation6,231,245
 3,822,010
 2,760,419
Total assets from the Company eliminated in Consolidation(186,904) (168,390) (180,222)
Operating Management Group assets119,702
 74,383
 96,637
Total consolidated adjustments and reconciling items6,164,043
 3,728,003
 2,676,834
Total consolidated assets$8,563,522
 $5,829,712
 $4,321,408

F-64

Ares Management, L.P.
Notes to the Consolidated Financial Statements
(Dollars in Thousands, Except Unit Data and As Otherwise Noted)


19.15. CONSOLIDATION
Adoption of ASU 2015-02
The Company adopted ASU 2015-02 under the modified retrospective approach with an effective date of January 1, 2015. As a result of the adoption of ASU 2015-02, the Company deconsolidated certain previously consolidated CLOs and certain previously consolidated non-CLOs effective January 1, 2015 as the Company is no longer deemed to be the primary beneficiary. The deconsolidation of such entities had the following impact on the Consolidated Statement of Financial Condition as of January 1, 2015:
 As of January 1, 2015
 
As originally
reported
 
As
adjusted
 
Effect of
deconsolidation
CLOs:     
Number of entities31
 4
 (27)
Total assets$12,682,054
 $2,109,780
 $(10,572,274)
Total liabilities$12,719,980
 $2,122,355
 $(10,597,625)
Cumulative- effect adjustment to equity appropriated for Consolidated Funds$
 $25,352
 $25,352
Non-CLOs:     
Number of entities35
 6
 (29)
Total assets$7,271,422
 $395,730
 $(6,875,692)
Total liabilities$1,242,484
 $55,430
 $(1,187,054)
Cumulative- effect adjustment to redeemable interests in Consolidated Funds and non-controlling interest in Consolidated Funds$
 $(5,688,639) $(5,688,639)
Total impact of deconsolidation of entities:     
Number of entities66
 10
 (56)
Total assets$19,953,476
 $2,505,510
 $(17,447,966)
Total liabilities$13,962,463
 $2,177,785
 $(11,784,679)
Cumulative- effect adjustment to redeemable interests in Consolidated Funds and non-controlling interest in Consolidated Funds$
 $(5,663,287) $(5,663,287)
The impact of the adoption on redeemable interest in Consolidated Funds and non-controlling interest in Consolidated Funds as of January 1, 2015 was a reduction of $1.0 billion and $4.6 billion, respectively. Adoption of the amended guidance had no impact on net income attributable to Ares Management, L.P.
Based on the Company’s assessments, no additional entities have been consolidated in the Company’s financial statements purely as a result of the adoption of ASU 2015-02. Additionally, under the new accounting guidance, certain consolidated entities previously accounted for as voting interest entities (“VOEs”) became VIEs, while certain entities previously accounted for as VIEs became VOEs. 
Deconsolidated Funds
Certain funds that have historically been consolidated in the financial statements that are no longer consolidated because, as of the reporting period: (a) the Company deconsolidated(i) such funds as a result of a change in accounting principle, including fifty-six entities for the year ended December 31, 2015, (b) such funds werehave been liquidated or dissolved, including two funds for the year ended December 31, 2017,dissolved; or (c)(ii) the Company is no longer deemed to be the primary beneficiary of the VIEs as it has no longer has a significant economic interest in two funds forinterest. During the year ended December 31, 2015. There were no additional funds2023, the Company deconsolidated forone SPAC as a result of liquidation and one private fund as a result of a significant change in ownership. During the year ended December 31, 2016. For deconsolidated funds,2022, the Company will continue to servedid not deconsolidate any entity. During the year ended December 31, 2021, the Company deconsolidated one CLO as the general partner and/or investment manager until such funds are fully liquidated.a result of a significant change in ownership.


F-65

Ares Management, L.P.
Notes to the Consolidated Financial Statements
(Dollars in Thousands, Except Unit Data and As Otherwise Noted)


Investments in Consolidated Variable Interest Entities
The Company consolidates entities thatin which the Company has a variable interest in, and as the general partner or investment manager, has both the power to direct the most significant activities and a potentially significant economic interest. Investments in the consolidated VIEs are reported at fair value and representsrepresent the Company’s maximum exposure to loss.
Investments in Non-Consolidated Variable Interest Entities
The Company holds interests in certain VIEs that are not consolidated as the Company is not the primary beneficiary. The Company'sCompany’s interest in such entities generally is in the form of direct equity interests, fixed fee arrangements or both. The maximum exposure to loss represents the potential loss of assets by the Company relating to its direct investments in these non-consolidated entities. Investments in the non-consolidated VIEs are heldcarried at their carrying value, which approximates fair value.
The Company'sCompany’s interests in consolidated and non-consolidated VIEs, as presented inwithin the Consolidated Statements of Financial Condition, and theirits respective maximum exposure to loss relating to non-consolidated VIEs, and its net income attributable to non-controlling interests related to consolidated VIEs, as presented within the Consolidated Statements of Operations, are as follows:
As of December 31,
20232022
Maximum exposure to loss attributable to the Company’s investment in non-consolidated VIEs(1)
$503,376 $393,549 
Maximum exposure to loss attributable to the Company’s investment in consolidated VIEs(1)
910,600 537,239 
Assets of consolidated VIEs15,484,962 13,128,088 
Liabilities of consolidated VIEs13,409,257 11,593,867 
 As of December 31,
 2017 2016
Maximum exposure to loss attributable to the Company's investment in non-consolidated VIEs$413,415
 $268,950
Maximum exposure to loss attributable to the Company's investment in consolidated VIEs$175,620
 $153,746
Assets of consolidated VIEs$6,231,245
 $3,822,010
Liabilities of consolidated VIEs$5,538,054
 $3,360,329
(1)As of December 31, 2023 and 2022, the Company’s maximum exposure of loss for CLO securities was equal to the cumulative fair value of our capital interest in CLOs and totaled $83.1 million and $82.0 million, respectively.

Year ended December 31,
202320222021
Net income attributable to non-controlling interests related to consolidated VIEs$204,571 $105,797 $115,217 
F-52
 For the Years Ended December 31,
 2017 2016 2015
Net income (loss) attributable to non-controlling interests related to consolidated VIEs$60,818
 $3,386
 $(5,686)


F-66

Ares Management L.P.Corporation
Notes to the Consolidated Financial Statements (Continued)
(Dollars in Thousands, Except UnitShare Data and As Otherwise Noted)


CONSOLIDATING SCHEDULESConsolidating Schedules
The following supplemental financial information illustrates the consolidating effects of the Consolidated Funds on the Company'sCompany’s financial condition, as of December 31, 2017 and 2016 and results from operations for the years ended December 31, 2017,  2016 and 2015.  cash flows:
 As of December 31, 2023
 Consolidated
Company Entities 
Consolidated
Funds 
Eliminations Consolidated 
Assets    
Cash and cash equivalents$348,274 $— $— $348,274 
Investments (includes $3,413,007 of accrued carried interest)5,546,209 — (921,277)4,624,932 
Due from affiliates1,068,089 — (171,343)896,746 
Other assets429,979 — — 429,979 
Right-of-use operating lease assets249,326 — — 249,326 
Intangible assets, net1,058,495 — — 1,058,495 
Goodwill1,123,976 — — 1,123,976 
Assets of Consolidated Funds
Cash and cash equivalents— 1,149,511 — 1,149,511 
Investments held in trust account— 523,038 — 523,038 
Investments, at fair value— 14,078,549 — 14,078,549 
Due from affiliates— 25,794 (11,643)14,151 
Receivable for securities sold— 146,851 — 146,851 
Other assets— 86,672 — 86,672 
Total assets$9,824,348 $16,010,415 $(1,104,263)$24,730,500 
Liabilities    
Accounts payable, accrued expenses and other liabilities$245,526 $— $(11,642)$233,884 
Accrued compensation287,259 — — 287,259 
Due to affiliates240,254 — — 240,254 
Performance related compensation payable2,514,610 — — 2,514,610 
Debt obligations2,965,480 — — 2,965,480 
Operating lease liabilities319,572 — — 319,572 
Liabilities of Consolidated Funds
Accounts payable, accrued expenses and other liabilities— 189,523 — 189,523 
Due to affiliates— 174,897 (171,343)3,554 
Payable for securities purchased— 484,117 — 484,117 
CLO loan obligations, at fair value— 12,458,266 (112,609)12,345,657 
Fund borrowings— 125,241 — 125,241 
Total liabilities6,572,701 13,432,044 (295,594)19,709,151 
Commitments and contingencies
Redeemable interest in Consolidated Funds 522,938  522,938 
Redeemable interest in Ares Operating Group entities24,098   24,098 
Non-controlling interest in Consolidated Funds 2,055,433 (796,988)1,258,445 
Non-controlling interest in Ares Operating Group entities1,326,913  (4,444)1,322,469 
Stockholders’ Equity
Class A common stock, $0.01 par value, 1,500,000,000 shares authorized (187,069,907 shares issued and outstanding)1,871 — — 1,871 
Non-voting common stock, $0.01 par value, 500,000,000 shares authorized (3,489,911 shares issued and outstanding)35 — — 35 
Class B common stock, $0.01 par value, 1,000 shares authorized (1,000 shares issued and outstanding)— — — — 
Class C common stock, $0.01 par value, 499,999,000 shares authorized (117,024,758 shares issued and outstanding)1,170 — — 1,170 
Additional paid-in-capital2,398,273 — (7,237)2,391,036 
Accumulated deficit(495,083)— — (495,083)
Accumulated other comprehensive loss, net of tax(5,630)— — (5,630)
       Total stockholders’ equity1,900,636  (7,237)1,893,399 
       Total equity3,227,549 2,055,433 (808,669)4,474,313 
 Total liabilities, redeemable interest, non-controlling interests and equity$9,824,348 $16,010,415 $(1,104,263)$24,730,500 
F-53
 As of December 31, 2017
 Consolidated
Company 
Entities 
 Consolidated
Funds 
 Eliminations  Consolidated 
Assets 


Cash and cash equivalents$118,929
 $
 $
 $118,929
Investments822,955
 
 (175,620) 647,335
Performance fees receivable1,105,180
 
 (5,333) 1,099,847
Due from affiliates171,701
 
 (5,951) 165,750
Intangible assets, net40,465
 
 
 40,465
Goodwill143,895
 
 
 143,895
Deferred tax asset, net8,326
 
 
 8,326
Other assets107,730
 
 
 107,730
Assets of Consolidated Funds 


Cash and cash equivalents
 556,500
 
 556,500
Investments, at fair value
 5,582,842
 
 5,582,842
Due from affiliates
 15,884
 
 15,884
Dividends and interest receivable
 12,568
 
 12,568
Receivable for securities sold
 61,462
 
 61,462
Other assets
 1,989
 
 1,989
       Total assets$2,519,181
 $6,231,245
 $(186,904) $8,563,522
Liabilities 


Accounts payable, accrued expenses and other liabilities$81,955
 $
 $
 $81,955
Accrued compensation27,978
 
 
 27,978
Due to affiliates14,642
 
 
 14,642
Performance fee compensation payable846,626
 
 
 846,626
Debt obligations616,176
 
 
 616,176
Liabilities of Consolidated Funds 


Accounts payable, accrued expenses and other liabilities
 64,316
 
 64,316
Due to affiliates
 11,285
 (11,285) 
Payable for securities purchased
 350,145
 
 350,145
CLO loan obligations
 4,974,110
 (10,916) 4,963,194
Fund borrowings
 138,198
 
 138,198
       Total liabilities1,587,377
 5,538,054
 (22,201) 7,103,230
Commitments and contingencies


Preferred equity (12,400,000 units issued and outstanding)298,761
 
 
 298,761
Non-controlling interest in Consolidated Funds
 693,191
 (164,703) 528,488
Non-controlling interest in Ares Operating Group entities358,186
 
 
 358,186
Controlling interest in Ares Management, L.P.: 


   Partners' Capital (82,280,033 units issued and outstanding)279,065
 
 
 279,065
   Accumulated other comprehensive loss, net of tax(4,208) 
 
 (4,208)
       Total controlling interest in Ares Management, L.P.274,857
 
 
 274,857
       Total equity931,804

693,191

(164,703)
1,460,292
       Total liabilities, non-controlling interests and equity$2,519,181

$6,231,245

$(186,904)
$8,563,522

F-67

Ares Management L.P.Corporation
Notes to the Consolidated Financial Statements (Continued)
(Dollars in Thousands, Except UnitShare Data and As Otherwise Noted)


 As of December 31, 2022
 Consolidated
Company Entities 
Consolidated
Funds 
EliminationsConsolidated 
Assets    
Cash and cash equivalents$389,987 $— $— $389,987 
Investments (includes $3,106,577 of accrued carried interest)4,515,955 — (541,221)3,974,734 
Due from affiliates949,532 — (191,060)758,472 
Other assets381,137 — — 381,137 
Right-of-use operating lease assets155,950 — — 155,950 
Intangible assets, net1,208,220 — — 1,208,220 
Goodwill999,656 — — 999,656 
Assets of Consolidated Funds
Cash and cash equivalents— 724,641 — 724,641 
Investments held in trust account— 1,013,382 — 1,013,382 
Investments, at fair value— 12,187,392 3,859 12,191,251 
Due from affiliates— 26,531 (10,742)15,789 
Receivable for securities sold— 124,050 124,050 
Other assets— 65,570 65,570 
Total assets$8,600,437 $14,141,566 $(739,164)$22,002,839 
Liabilities    
Accounts payable, accrued expenses and other liabilities$242,663 $— $(10,742)$231,921 
Accrued compensation510,130 — — 510,130 
Due to affiliates252,798 — — 252,798 
Performance related compensation payable2,282,209 — — 2,282,209 
Debt obligations2,273,854 — — 2,273,854 
Operating lease liabilities190,616 — — 190,616 
Liabilities of Consolidated Funds
Accounts payable, accrued expenses and other liabilities— 175,435 (7,149)168,286 
Due to affiliates— 191,238 (187,201)4,037 
Payable for securities purchased— 314,193 — 314,193 
CLO loan obligations, at fair value— 10,797,332 (95,612)10,701,720 
Fund borrowings— 168,046 — 168,046 
Total liabilities5,752,270 11,646,244 (300,704)17,097,810 
Commitments and contingencies
Redeemable interest in Consolidated Funds 1,013,282  1,013,282 
Redeemable interest in Ares Operating Group entities93,129   93,129 
Non-controlling interest in Consolidated Funds 1,482,040 (407,684)1,074,356 
Non-controlling interest in Ares Operating Group entities1,147,269  (12,246)1,135,023 
Stockholders’ Equity
Class A common stock, $0.01 par value, 1,500,000,000 shares authorized (173,892,036 shares issued and outstanding)1,739 — — 1,739 
Non-voting common stock, $0.01 par value, 500,000,000 shares authorized (3,489,911 shares issued and outstanding)35 — — 35 
Class B common stock, $0.01 par value, 1,000 shares authorized ($1,000 shares issued and outstanding)— — — — 
Class C common stock, $0.01 par value, 499,999,000 shares authorized (117,231,288 shares issued and outstanding)1,172 — — 1,172 
Additional paid-in-capital1,989,284 — (18,530)1,970,754 
Accumulated deficit(369,475)— — (369,475)
Accumulated other comprehensive loss, net of tax(14,986)— — (14,986)
       Total stockholders’ equity1,607,769  (18,530)1,589,239 
       Total equity2,755,038 1,482,040 (438,460)3,798,618 
       Total liabilities, redeemable interest, non-controlling interests and equity$8,600,437 $14,141,566 $(739,164)$22,002,839 

F-54
 As of December 31, 2016
 Consolidated
Company 
Entities 
 Consolidated
Funds 
 Eliminations Consolidated 
Assets   
  
  
Cash and cash equivalents$342,861
 $
 $
 $342,861
Investments622,215
 
 (153,744) 468,471
Performance fees receivable767,429
 
 (8,330) 759,099
Due from affiliates169,252
 
 (6,316) 162,936
Intangible assets, net58,315
 
 
 58,315
Goodwill143,724
 
 
 143,724
Deferred tax asset, net6,731
 
 
 6,731
Other assets65,565
 
 
 65,565
Assets of Consolidated Funds   


Cash and cash equivalents
 455,280
 
 455,280
Investments, at fair value
 3,330,203
 
 3,330,203
Due from affiliates
 3,592
 
 3,592
Dividends and interest receivable
 8,479
 
 8,479
Receivable for securities sold
 21,955
 
 21,955
Other assets
 2,501
 
 2,501
Total assets$2,176,092

$3,822,010

$(168,390)
$5,829,712
Liabilities   
  
  
Accounts payable and accrued expenses$83,336
 $
 $
 $83,336
Accrued compensation131,736
 
 
 131,736
Due to affiliates17,959
 
 (395) 17,564
Performance fee compensation payable598,050
 
 
 598,050
Debt obligations305,784
 
 
 305,784
Equity compensation put option liability


Deferred tax liability, net


Liabilities of Consolidated Funds   


Accounts payable, accrued expenses and other liabilities
 21,056
 
 21,056
Due to affiliates
 10,599
 (10,599) 
Payable for securities purchased
 208,742
 
 208,742
CLO loan obligations
 3,064,862
 (33,750) 3,031,112
Fund borrowings
 55,070
 
 55,070
Total liabilities1,136,865

3,360,329

(44,744)
4,452,450
Commitments and contingencies


Preferred equity (12,400,000 units issued and outstanding)298,761
 
 
 298,761
Non-controlling interest in Consolidated Funds
 461,681
 (123,646) 338,035
Non-controlling interest in Ares Operating Group entities447,615
 
 
 447,615
Controlling interest in Ares Management, L.P.: 


   Partners' Capital (80,814,732 units issued and outstanding)301,790
 
 
 301,790
   Accumulated other comprehensive loss, net of tax benefit(8,939) 
 
 (8,939)
Total controlling interest in Ares Management, L.P.292,851
 
 
 292,851
Total equity1,039,227
 461,681
 (123,646) 1,377,262
Total liabilities, non-controlling interests and equity$2,176,092

$3,822,010

$(168,390) $5,829,712


F-68

Ares Management L.P.Corporation
Notes to the Consolidated Financial Statements (Continued)
(Dollars in Thousands, Except UnitShare Data and As Otherwise Noted)


 Year ended December 31, 2023
 Consolidated
Company Entities 
Consolidated
Funds 
Eliminations Consolidated
Revenues    
Management fees$2,599,351 $— $(48,201)$2,551,150 
Carried interest allocation631,150 — (12,571)618,579 
Incentive fees277,728 — (1,101)276,627 
Principal investment income155,632 — (119,116)36,516 
Administrative, transaction and other fees156,178 — (7,166)149,012 
Total revenues3,820,039  (188,155)3,631,884 
Expenses    
Compensation and benefits1,486,698 — — 1,486,698 
Performance related compensation607,522 — — 607,522 
General, administrative and other expense660,579 — (433)660,146 
Expenses of the Consolidated Funds— 93,167 (49,675)43,492 
Total expenses2,754,799 93,167 (50,108)2,797,858 
Other income (expense)    
Net realized and unrealized gains on investments76,415 — 1,158 77,573 
Interest and dividend income29,850 — (10,574)19,276 
Interest expense(106,276)— — (106,276)
Other income (expense), net(10,285)— 15,104 4,819 
Net realized and unrealized gains on investments of the Consolidated Funds— 239,802 22,898 262,700 
Interest and other income of the Consolidated Funds— 1,010,649 (15,104)995,545 
Interest expense of the Consolidated Funds— (757,603)3,003 (754,600)
Total other income (expense), net(10,296)492,848 16,485 499,037 
Income before taxes1,054,944 399,681 (121,562)1,333,063 
Income tax expense169,148 3,823 — 172,971 
Net income885,796 395,858 (121,562)1,160,092 
Less: Net income attributable to non-controlling interests in Consolidated Funds— 395,858 (121,562)274,296 
Net income attributable to Ares Operating Group entities885,796   885,796 
Less: Net income attributable to redeemable interest in Ares Operating Group entities226 — — 226 
Less: Net income attributable to non-controlling interests in Ares Operating Group entities411,244 — — 411,244 
Net income attributable to Ares Management Corporation Class A and non-voting common stockholders$474,326 $ $ $474,326 


F-55
 For the Year Ended December 31, 2017
 
Consolidated
Company 
Entities 
 Consolidated
Funds 
 Eliminations  Consolidated 
Revenues 


Management fees (includes ARCC Part I Fees of $105,467)$744,825
 $
 $(22,406) $722,419
Performance fees641,766
 
 (5,092) 636,674
Administrative, transaction and other fees56,406
 
 
 56,406
Total revenues1,442,997


(27,498)
1,415,499
Expenses 


Compensation and benefits514,109
 
 
 514,109
Performance fee compensation479,722
 
 
 479,722
General, administrative and other expense196,730
 
 
 196,730
Transaction support expense275,177
 
 
 275,177
Expenses of Consolidated Funds
 65,501
 (26,481) 39,020
Total expenses1,465,738

65,501

(26,481)
1,504,758
Other income (expense) 


Net realized and unrealized gain on investments96,568
 
 (29,534) 67,034
Interest and dividend income15,076
 
 (2,361) 12,715
Interest expense(21,219) 
 
 (21,219)
Other income, net19,470
 
 
 19,470
Net realized and unrealized gain on investments of Consolidated Funds
 126,836
 (26,712) 100,124
Interest and other income of Consolidated Funds
 187,721
 
 187,721
Interest expense of Consolidated Funds
 (159,688) 32,961
 (126,727)
Total other income109,895

154,869

(25,646)
239,118
Income before taxes87,154

89,368

(26,663)
149,859
Income tax expense (benefit)(24,939) 1,887
 
 (23,052)
Net income112,093

87,481

(26,663)
172,911
Less: Net income attributable to non-controlling interests in Consolidated Funds
 87,481
 (26,663) 60,818
Less: Net income attributable to non-controlling interests in Ares Operating Group entities35,915
 
 
 35,915
Net income attributable to Ares Management, L.P.76,178


76,178
Less: Preferred equity distributions paid21,700
 
 
 21,700
Net income attributable to Ares Management, L.P. common unitholders$54,478

$

$

$54,478

F-69

Ares Management L.P.Corporation
Notes to the Consolidated Financial Statements (Continued)
(Dollars in Thousands, Except UnitShare Data and As Otherwise Noted)


 Year ended December 31, 2022
 Consolidated
Company Entities 
Consolidated
Funds 
EliminationsConsolidated 
Revenues    
Management fees$2,182,757 $— $(46,324)$2,136,433 
Carried interest allocation465,561 — (7,549)458,012 
Incentive fees305,167 — (3,980)301,187 
Principal investment income48,222 — (35,943)12,279 
Administrative, transaction and other fees164,545 — (17,013)147,532 
Total revenues3,166,252  (110,809)3,055,443 
Expenses
Compensation and benefits1,498,590 — — 1,498,590 
Performance related compensation518,829 — — 518,829 
General, administrative and other expense695,511 — (255)695,256 
Expenses of the Consolidated Funds— 86,988 (50,578)36,410 
Total expenses2,712,930 86,988 (50,833)2,749,085 
Other income (expense)
Net realized and unrealized gains (losses) on investments(27,924)— 32,656 4,732 
Interest and dividend income25,196 — (15,797)9,399 
Interest expense(71,356)— — (71,356)
Other income, net11,904 — 1,215 13,119 
Net realized and unrealized gains on investments of the Consolidated Funds— 87,287 (13,901)73,386 
Interest and other income of the Consolidated Funds— 587,744 (1,215)586,529 
Interest expense of the Consolidated Funds— (424,887)13,526 (411,361)
Total other income (expense), net(62,180)250,144 16,484 204,448 
Income before taxes391,142 163,156 (43,492)510,806 
Income tax expense71,560 331 — 71,891 
Net income319,582 162,825 (43,492)438,915 
Less: Net income attributable to non-controlling interests in Consolidated Funds— 162,825 (43,492)119,333 
Net income attributable to Ares Operating Group entities319,582   319,582 
Less: Net loss attributable to redeemable interest in Ares Operating Group entities(851)— — (851)
Less: Net income attributable to non-controlling interests in Ares Operating Group entities152,892 — — 152,892 
Net income attributable to Ares Management Corporation Class A and non-voting common stockholders$167,541 $ $ $167,541 

F-56
 For the Year Ended December 31, 2016
 Consolidated
Company 
Entities 
 Consolidated
Funds 
 Eliminations  Consolidated 
Revenues 


Management fees (includes ARCC Part I Fees of $121,181)$659,451
 $
 $(17,383) $642,068
Performance fees518,991
 
 (1,139) 517,852
Administrative, transaction and other fees39,285
 
 
 39,285
Total revenues1,217,727


(18,522)
1,199,205
Expenses 


Compensation and benefits447,725
 
 
 447,725
Performance fee compensation387,846
 
 
 387,846
General, administrative and other expense159,776
 
 
 159,776
Expenses of Consolidated Funds
 42,520
 (21,447) 21,073
Total expenses995,347


42,520


(21,447)
1,016,420
Other income (expense) 


Net realized and unrealized gain on investments26,961
 
 1,290
 28,251
Interest and dividend income28,261
 
 (4,480) 23,781
Interest expense(17,981) 
 
 (17,981)
Other income, net35,650
 
 
 35,650
Net realized and unrealized loss on investments of Consolidated Funds
 (2,999) 942
 (2,057)
Interest and other income of Consolidated Funds
 138,943
 
 138,943
Interest expense of Consolidated Funds
 (98,556) 7,104
 (91,452)
Total other income72,891
 37,388
 4,856
 115,135
Income (loss) before taxes295,271


(5,132)

7,781

297,920
Income tax expense (benefit)11,756
 (737) 
 11,019
Net income (loss)283,515
 (4,395) 7,781
 286,901
Less: Net income (loss) attributable to non-controlling interests in Consolidated Funds
 (4,395) 7,781
 3,386
Less: Net income attributable to redeemable interests in Ares Operating Group entities456
 
 
 456
Less: Net income attributable to non-controlling interests in Ares Operating Group entities171,251
 
 
 171,251
Net income attributable to Ares Management, L.P.$111,808


$


$

$111,808
Less: Preferred equity distributions paid12,176


 12,176
Net income attributable to Ares Management, L.P. common unitholders$99,632
 $
 $
 $99,632

F-70

Ares Management L.P.Corporation
Notes to the Consolidated Financial Statements (Continued)
(Dollars in Thousands, Except UnitShare Data and As Otherwise Noted)

Year ended December 31, 2021
Consolidated
Company 
Entities 
Consolidated
Funds
EliminationsConsolidated
Revenues
Management fees$1,655,943 $— $(44,896)$1,611,047 
Carried interest allocation2,073,551 — — 2,073,551 
Incentive fees338,334 — (5,458)332,876 
Principal investment income120,896 — (21,463)99,433 
Administrative, transaction and other fees99,667 — (4,483)95,184 
Total revenues4,288,391  (76,300)4,212,091 
Expenses
Compensation and benefits1,162,633 — — 1,162,633 
Performance related compensation1,740,786 — — 1,740,786 
General, administrative and other expense444,178 — — 444,178 
Expenses of the Consolidated Funds— 113,024 (50,538)62,486 
Total expenses3,347,597 113,024 (50,538)3,410,083 
Other income (expense)
Net realized and unrealized gains on investments11,920 — 7,182 19,102 
Interest and dividend income14,199 — (4,334)9,865 
Interest expense(36,760)— — (36,760)
Other income, net15,080 — (678)14,402 
Net realized and unrealized gains on investments of the Consolidated Funds— 91,390 (14,087)77,303 
Interest and other income of the Consolidated Funds— 437,140 678 437,818 
Interest expense of the Consolidated Funds— (272,155)14,107 (258,048)
Total other income, net4,439 256,375 2,868 263,682 
Income before taxes945,233 143,351 (22,894)1,065,690 
Income tax expense147,297 88 — 147,385 
Net income797,936 143,263 (22,894)918,305 
Less: Net income attributable to non-controlling interests in Consolidated Funds— 143,263 (22,894)120,369 
Net income attributable to Ares Operating Group entities797,936   797,936 
Less: Net loss attributable to redeemable interest in Ares Operating Group entities(1,341)— — (1,341)
Less: Net income attributable to non-controlling interests in Ares Operating Group entities390,440 — — 390,440 
Net income attributable to Ares Management Corporation408,837   408,837 
Less: Series A Preferred Stock dividends paid10,850   10,850 
Less: Series A Preferred Stock redemption premium11,239   11,239 
Net income attributable to Ares Management Corporation Class A and non-voting common stockholders$386,748 $ $ $386,748 


F-57

Ares Management Corporation
Notes to the Consolidated Financial Statements (Continued)
(Dollars in Thousands, Except Share Data and As Otherwise Noted)

 Year ended December 31, 2023
 Consolidated
Company Entities 
Consolidated
Funds
EliminationsConsolidated
Cash flows from operating activities:  
Net income$885,796 $395,858 $(121,562)$1,160,092 
Adjustments to reconcile net income to net cash provided by (used in) operating activities:
Equity compensation expense255,965 — — 255,965 
Depreciation and amortization231,712 — — 231,712 
Net realized and unrealized gains on investments(197,874)— 107,137 (90,737)
Other non-cash amounts74 — — 74 
Investments purchased(726,051)— 218,119 (507,932)
Proceeds from sale of investments214,938 — (8,775)206,163 
Adjustments to reconcile net income to net cash used in operating activities allocable to non-controlling interests in Consolidated Funds:
Net realized and unrealized gains on investments— (239,802)(22,898)(262,700)
Other non-cash amounts— (101,465)— (101,465)
Investments purchased— (8,847,856)— (8,847,856)
Proceeds from sale of investments— 8,149,617 — 8,149,617 
Cash flows due to changes in operating assets and liabilities:
Net carried interest and incentive fees receivable(61,429)— 12,571 (48,858)
Due to/from affiliates(200,704)— (19,717)(220,421)
Other assets21,532 — — 21,532 
Accrued compensation and benefits20,383 — — 20,383 
Accounts payable, accrued expenses and other liabilities28,765 — (901)27,864 
Cash flows due to changes in operating assets and liabilities allocable to non-controlling interest in Consolidated Funds:
Change in cash and cash equivalents held at Consolidated Funds— — (424,870)(424,870)
Net cash relinquished with consolidation/deconsolidation of Consolidated Funds— (623)— (623)
Change in other assets and receivables held at Consolidated Funds— (53,916)33,669 (20,247)
Change in other liabilities and payables held at Consolidated Funds— 219,046 — 219,046 
Net cash provided by (used in) operating activities473,107 (479,141)(227,227)(233,261)
Cash flows from investing activities: 
Purchase of furniture, equipment and leasehold improvements, net of disposals(67,183)— — (67,183)
Acquisitions, net of cash acquired(43,896)— — (43,896)
Net cash used in investing activities(111,079)  (111,079)
Cash flows from financing activities: 
Proceeds from Credit Facility1,410,000 — — 1,410,000 
Proceeds from issuance of senior notes499,010 — — 499,010 
Repayments of Credit Facility(1,215,000)— — (1,215,000)
Dividends and distributions (1,030,666)— — (1,030,666)
Stock option exercises85,959 — — 85,959 
Taxes paid related to net share settlement of equity awards(157,007)— — (157,007)
Other financing activities2,943 — — 2,943 
Allocable to redeemable and non-controlling interests in Consolidated Funds:
Contributions from redeemable and non-controlling interests in Consolidated Funds— 1,071,575 (216,119)855,456 
Distributions to non-controlling interests in Consolidated Funds— (119,604)18,476 (101,128)
Redemptions of redeemable interests in Consolidated Funds— (1,045,874)— (1,045,874)
Borrowings under loan obligations by Consolidated Funds— 1,387,297 — 1,387,297 
Repayments under loan obligations by Consolidated Funds— (398,864)— (398,864)
Net cash provided by (used in) financing activities(404,761)894,530 (197,643)292,126 
Effect of exchange rate changes1,020 9,481 — 10,501 
Net change in cash and cash equivalents(41,713)424,870 (424,870)(41,713)
Cash and cash equivalents, beginning of period389,987 724,641 (724,641)389,987 
Cash and cash equivalents, end of period$348,274 $1,149,511 $(1,149,511)$348,274 
Supplemental disclosure of non-cash financing activities:
Issuance of Class A common stock in connection with acquisition-related activities$239,545 $— $— $239,545 
Issuance of AOG Units in connection with settlement of management incentive program$245,647 $— $— $245,647 
Supplemental disclosure of cash flow information:
Cash paid during the period for interest$98,920 $623,723 $— $722,643 
Cash paid during the period for income taxes$61,563 $444 $— $62,007 
F-58

Ares Management Corporation
Notes to the Consolidated Financial Statements (Continued)
(Dollars in Thousands, Except Share Data and As Otherwise Noted)
 For the Year Ended December 31, 2015
 Consolidated
Company 
Entities 
 Consolidated
Funds 
 Eliminations  Consolidated 
Revenues       
Management fees (includes ARCC Part I Fees of $121,491)$650,918
 $
 $(16,519) $634,399
Performance fees146,197
 
 4,418
 150,615
Administrative, transaction and other fees30,606
 
 (1,178) 29,428
Total revenues827,721
 
 (13,279) 814,442
Expenses 


Compensation and benefits414,454
 
 
 414,454
Performance fee compensation111,683
 
 
 111,683
General, administrative and other expense224,798
 
 
 224,798
Expenses of Consolidated Funds
 36,417
 (18,312) 18,105
Total expenses750,935
 36,417
 (18,312) 769,040
Other income (expense) 


Net realized and unrealized gain on investments2,784
 
 14,225
 17,009
Interest and dividend income17,542
 
 (3,497) 14,045
Interest expense(18,949) 
 
 (18,949)
Debt extinguishment expense(11,641) 
 
 (11,641)
Other expense, net20,644
 
 1,036
 21,680
Net realized and unrealized loss on investments of Consolidated Funds
 (17,614) (7,002) (24,616)
Interest and other income of Consolidated Funds
 117,373
 
 117,373
Interest expense of Consolidated Funds
 (86,064) 7,245
 (78,819)
Total other income10,380
 13,695
 12,007
 36,082
Income (loss) before taxes87,166

(22,722)
17,040

81,484
Income tax expense19,060
 4
 
 19,064
Net income68,106
 (22,726) 17,040
 62,420
Less: Net income (loss) attributable to non-controlling interests in Consolidated Funds
 (22,726) 17,040
 (5,686)
Less: Net income attributable to redeemable interests in Ares Operating Group entities338
 
 
 338
Less: Net income attributable to non-controlling interests in Ares Operating Group entities48,390
 
 
 48,390
Net income attributable to Ares Management, L.P.$19,378

$

$

$19,378
 Year ended December 31, 2022
 Consolidated
Company Entities 
Consolidated
Funds
EliminationsConsolidated
Cash flows from operating activities:  
Net income$319,582 $162,825 $(43,492)$438,915 
Adjustments to reconcile net income to net cash provided by (used in) operating activities:
Equity compensation expense200,391 — — 200,391 
Depreciation and amortization341,341 — — 341,341 
Net realized and unrealized losses on investments15,717 — (4,788)10,929 
Investments purchased(443,505)— 72,381 (371,124)
Proceeds from sale of investments303,987 — (121,494)182,493 
Adjustments to reconcile net income to net cash used in operating activities allocable to non-controlling interests in Consolidated Funds:
Net realized and unrealized gains on investments— (87,287)13,901 (73,386)
Other non-cash amounts— (33,822)— (33,822)
Investments purchased— (9,408,078)(25,951)(9,434,029)
Proceeds from sale of investments— 8,198,812 — 8,198,812 
Cash flows due to changes in operating assets and liabilities:
Net carried interest and incentive fees receivable(28,161)— 7,549 (20,612)
Due to/from affiliates(125,407)— 164,480 39,073 
Other assets(101,275)— (3,930)(105,205)
Accrued compensation and benefits200,769 — — 200,769 
Accounts payable, accrued expenses and other liabilities(50,471)— (1,214)(51,685)
Cash flows due to changes in operating assets and liabilities allocable to non-controlling interest in Consolidated Funds:
Change in cash and cash equivalents held at Consolidated Funds— — 324,550 324,550 
Change in other assets and receivables held at Consolidated Funds— 286,895 (135,000)151,895 
Change in other liabilities and payables held at Consolidated Funds— (733,417)— (733,417)
Net cash provided by (used in) operating activities632,968 (1,614,072)246,992 (734,112)
Cash flows from investing activities: 
Purchase of furniture, equipment and leasehold improvements, net of disposals(35,796)— — (35,796)
Acquisitions, net of cash acquired(301,583)— — (301,583)
Net cash used in investing activities(337,379)  (337,379)
Cash flows from financing activities: 
Proceeds from Credit Facility1,380,000 — — 1,380,000 
Proceeds from issuance of senior notes488,915 — — 488,915 
Repayments of Credit Facility(1,095,000)— — (1,095,000)
Dividends and distributions (836,364)— — (836,364)
Stock option exercises21,205 — — 21,205 
Taxes paid related to net share settlement of equity awards(201,311)— — (201,311)
Other financing activities4,055 — — 4,055 
Allocable to non-controlling interests in Consolidated Funds: 
Contributions from non-controlling interests in Consolidated Funds— 596,777 (47,381)549,396 
Distributions to non-controlling interests in Consolidated Funds— (303,230)124,939 (178,291)
Borrowings under loan obligations by Consolidated Funds— 1,140,680 — 1,140,680 
Repayments under loan obligations by Consolidated Funds— (145,222)— (145,222)
Net cash provided by (used in) financing activities(238,500)1,289,005 77,558 1,128,063 
Effect of exchange rate changes(10,757)517 — (10,240)
Net change in cash and cash equivalents46,332 (324,550)324,550 46,332 
Cash and cash equivalents, beginning of period343,655 1,049,191 (1,049,191)343,655 
Cash and cash equivalents, end of period$389,987 $724,641 $(724,641)$389,987 
Supplemental disclosure of non-cash financing activities:
Issuance of Class A common stock in connection with acquisition-related activities$12,835 $— $— $12,835 
Supplemental disclosure of cash flow information:
Cash paid during the period for interest$59,463 $260,866 $— $320,329 
Cash paid during the period for income taxes$104,544 $320 $— $104,864 


20.

F-59

Ares Management Corporation
Notes to the Consolidated Financial Statements (Continued)
(Dollars in Thousands, Except Share Data and As Otherwise Noted)
Year ended December 31, 2021
Consolidated
Company 
Entities 
Consolidated
Funds
EliminationsConsolidated
Cash flows from operating activities:
Net income$797,936 $143,263 $(22,894)$918,305 
Adjustments to reconcile net income to net cash provided by (used in) operating activities:
Equity compensation expense237,191 — — 237,191 
Depreciation and amortization113,293 — — 113,293 
Net realized and unrealized gains on investments(96,331)— 7,353 (88,978)
Other non-cash amounts(31,070)— — (31,070)
Investments purchased(561,762)— 221,563 (340,199)
Proceeds from sale of investments296,483 — (23,101)273,382 
Adjustments to reconcile net income to net cash used in operating activities allocable to non-controlling interests in Consolidated Funds:
Net realized and unrealized gains on investments— (91,390)14,087 (77,303)
Other non-cash amounts— (35,879)— (35,879)
Investments purchased— (13,075,187)7,623 (13,067,564)
Proceeds from sale of investments— 9,970,609 — 9,970,609 
Cash flows due to changes in operating assets and liabilities:
Net carried interest and incentive fees receivable(745,021)— — (745,021)
Due to/from affiliates(187,374)— 6,446 (180,928)
Other assets210,106 — 3,719 213,825 
Accrued compensation and benefits142,815 — — 142,815 
Accounts payable, accrued expenses and other liabilities124,489 — 679 125,168 
Cash flows due to changes in operating assets and liabilities allocable to non-controlling interest in Consolidated Funds:
Change in cash and cash equivalents held at Consolidated Funds— — (526,815)(526,815)
Net cash acquired with consolidation/deconsolidation of Consolidated Funds— (39,539)— (39,539)
Change in other assets and receivables held at Consolidated Funds— (174,409)(6,544)(180,953)
Change in other liabilities and payables held at Consolidated Funds— 746,616 (23,000)723,616 
Net cash provided by (used in) operating activities300,755 (2,555,916)(340,884)(2,596,045)
Cash flows from investing activities:
Purchase of furniture, equipment and leasehold improvements, net of disposals(27,226)— — (27,226)
Acquisitions, net of cash acquired(1,057,407)— — (1,057,407)
Net cash used in investing activities(1,084,633)  (1,084,633)
Cash flows from financing activities:
Net proceeds from issuance of Class A common stock827,430 — — 827,430 
Proceeds from Credit Facility883,000 — — 883,000 
Proceeds from issuance of subordinated notes450,000 — — 450,000 
Repayments of Credit Facility(468,000)— — (468,000)
Dividends and distributions (593,506)— — (593,506)
Series A Preferred Stock dividends(10,850)— — (10,850)
Redemption of Series A Preferred Stock(310,000)— — (310,000)
Stock option exercises37,216 — — 37,216 
Taxes paid related to net share settlement of equity awards(226,101)— — (226,101)
Other financing activities11,509 — — 11,509 
Allocable to non-controlling interests in Consolidated Funds:
Contributions from non-controlling interests in Consolidated Funds— 1,239,831 (206,187)1,033,644 
Distributions to non-controlling interests in Consolidated Funds— (119,153)20,256 (98,897)
Borrowings under loan obligations by Consolidated Funds— 2,048,932 — 2,048,932 
Repayments under loan obligations by Consolidated Funds— (80,752)— (80,752)
Net cash provided by financing activities600,698 3,088,858 (185,931)3,503,625 
Effect of exchange rate changes(12,977)(6,127)— (19,104)
Net change in cash and cash equivalents(196,157)526,815 (526,815)(196,157)
Cash and cash equivalents, beginning of period539,812 522,376 (522,376)539,812 
Cash and cash equivalents, end of period$343,655 $1,049,191 $(1,049,191)$343,655 
Supplemental disclosure of non-cash financing activities:
Issuance of AOG Units in connection with acquisition-related activities$510,848 $— $— $510,848 
Supplemental disclosure of cash flow information:
Cash paid during the period for interest$34,170 $170,915 $— $205,085 
Cash paid during the period for income taxes$22,603 $185 $— $22,788 
F-60

Ares Management Corporation
Notes to the Consolidated Financial Statements (Continued)
(Dollars in Thousands, Except Share Data and As Otherwise Noted)
16. SUBSEQUENT EVENTS
The Company evaluated all events or transactions that occurred after December 31, 20172023 through the date the consolidated financial statements were issued. During this period, the Company had the following material subsequent events that require disclosure:
In February 2018,2024, the Company’s board of directors of the Company's general partner declared a distribution of $0.40 per common unit, for the five months ended February 28, 2018, inclusive of $0.25 per common unit for the fourth quarter of 2017 and $0.15 per common unit for the first two months of the first quarter of 2018, payable on February 28, 2018 to common unitholders of record at the close of business on February 26, 2018.
In February 2018, the board of directors of the Company's general partner declared a quarterly distributiondividend of $0.4375$0.93 per preferred equity unitshare of Class A and non-voting common stock payable on March 29, 2024 to preferred equity unitholderscommon stockholders of record at the close of business on March 15, 2018, with a payment date of March 31, 2018.2024.
The Company has filed an election with the Internal Revenue Service (“IRS”) to be treated as a U.S. corporation for U.S. federal income tax purposes, with an effective date of March 1, 2018 (the “Effective Date”). Although the Company will be treated as a corporation for U.S. federal income tax purposes, we will remain a limited partnership under state law.


F-71
F-61

Ares Management, L.P.
Notes to the Consolidated Financial Statements
(Dollars in Thousands, Except Unit Data and As Otherwise Noted)


For March 2018, the first month that the Company is taxed as a corporation, the board of directors of the Company's general partner declared a dividend of $0.0933 per common share to be payable on April 30, 2018 to holders of record on April 16, 2018.

21. QUARTERLY FINANCIAL DATA (UNAUDITED)
Unaudited quarterly information for each of the three months in the years ended December 31, 2017 and 2016 are presented below.  
 For the Three Months Ended
 March 31, 2017 June 30, 2017 September 30, 2017 December 31, 2017
Revenues$241,657
 $533,890
 $283,671
 $356,281
Expenses491,467
 448,197
 254,127
 310,967
Other income59,222
 29,387
 58,880
 91,629
Income (loss) before provision for income taxes(190,588) 115,080
 88,424
 136,943
Net income (loss)(156,324) 113,827
 83,872
 131,536
Net income (loss) attributable to Ares Management, L.P.(41,134) 49,878
 27,838
 39,596
Preferred equity distributions paid5,425
 5,425
 5,425
 5,425
Net income (loss) attributable to Ares Management, L.P. common unitholders(46,559) 44,453
 22,413
 34,171
Net income (loss) attributable to Ares Management L.P. per common unit: 


Basic$(0.58) $0.54
 $0.26
 $0.40
Diluted$(0.58) $0.53
 $0.26
 $0.39
Distributions declared per common unit(1)$0.13
 $0.31
 $0.41
 $0.40
 For the Three Months Ended
 March 31, 2016 June 30, 2016 September 30, 2016 December 31, 2016
Revenues$136,015
 $369,535
 $335,460
 $358,195
Expenses129,538
 303,935
 283,374
 299,573
Other income (loss)(15,451) 17,406
 73,339
 39,841
Income (loss) before provision for income taxes(8,974) 83,006
 125,425
 98,463
Net income (loss)(13,639) 87,440
 117,784
 95,316
Net income (loss) attributable to Ares Management, L.P.(3,090) 37,574
 43,305
 34,019
Preferred equity distributions paid
 
 6,751
 5,425
Net income (loss) attributable to Ares Management, L.P. common unitholders(3,090) 37,574
 36,554
 28,594
Net income (loss) attributable to Ares Management L.P. per common unit: 


Basic$(0.04) $0.46
 $0.45
 $0.35
Diluted$(0.04) $0.46
 $0.43
 $0.34
Distributions declared per common unit(1)$0.15
 $0.28
 $0.20
 $0.28
(1)Distributions declared per common unit are reflected to match the period the income is earned. 

* * *

F-72