TABLE OF CONTENTS
| Item | Page | ||||||||||
| Summary Risk Factors | |||||||||||
| Market for the Registrant's Securities, Related Stockholder Matters, and Issuer Purchases of Equity Securities | |||||||||||
| [Reserved] | |||||||||||
| Management's Discussion and Analysis of the Account's Financial Condition and Results of Operations | |||||||||||
| Disclosure Regarding Foreign Jurisdiction that Prevent Inspection | |||||||||||
| Form 10-K Summary | |||||||||||
PART I
ITEM 1. BUSINESS.
General. The TIAA Real Estate Account (the “Real Estate Account”, the “Account” or the “Registrant”) was established on February 22, 1995, as an insurance company separate account of Teachers Insurance and Annuity Association of America (“TIAA”), a New York insurance company, by resolution of TIAA’s Board of Trustees (the “Board”). The Account, which invests mainly in real estate and real estate-related investments, is a variable annuity investment option offered through individual, group and tax-deferred annuity contracts available to employees in the academic, medical, cultural and research fields. The Account commenced operations on July 3, 1995, and interests in the Account were first offered to eligible participants (or “contract owners”) on October 2, 1995.
The Account offers individual and group accumulating annuity contracts (with contributions made on a pre-tax or after-tax basis), as well as individual lifetime and term-certain variable payout annuity contracts (including the payment of death benefits to beneficiaries). Investors are entitled to transfer funds to or from the Account under certain circumstances. Funds invested in the Account for each category of contract are expressed in terms of units, and unit values will fluctuate depending on the Account’s performance.
The Account is regulated by the New York State Department of Financial Services (“NYDFS”), and the insurance departments of certain other jurisdictions in which the annuity contracts are offered. Although TIAA owns the assets of the Real Estate Account and the Account’s obligations are obligations of TIAA, the Account’s income, investment gains and investment losses are credited to or charged against the assets of the Account without regard to TIAA’s other income, gains, or losses. Under New York insurance law, the Account cannot be charged with liabilities incurred by any other TIAA business activities or any other TIAA separate account.
The Real Estate Account is designed as an option for retirement and tax-deferred savings plans for employees of non-profit and governmental institutions. TIAA currently offers the Real Estate Account under the following annuity contracts:
•RAs and GRAs (Retirement Annuities and Group Retirement Annuities)
•SRAs (Supplemental Retirement Annuities)
•GSRAs (Group Supplemental Retirement Annuities)
•Retirement Choice and Retirement Choice Plus Annuities
•GAs (Group Annuities) and Institutionally Owned GSRAs
•Traditional and Roth IRAs (Individual Retirement Annuities) including SEP IRAs (Simplified Employee Pension Plans)
•Keoghs
•ATRAs (After-Tax Retirement Annuities)
•Real Estate Account Accumulation Contract
Note that state regulatory approval may be pending for certain of these contracts and these contracts may not currently be available in every state. TIAA may also offer the Real Estate Account as an investment option under additional contracts, both at the individual and plan sponsor level, in the future.
Investment Objective. The Real Estate Account seeks to generate favorable total returns primarily through the rental income and appreciation of a diversified portfolio of directly held, private real estate investments and real estate-related investments, while offering investors guaranteed, daily liquidity.
Investment Strategy
Real Estate-Related Investments. The Account intends to have between 75% and 85% of its net assets invested directly in real estate or real estate-related investments with the goal of producing favorable long-term returns primarily through rental income and appreciation. These investments may consist of:
•Direct ownership interests in domestic and foreign real estate;
•Direct ownership of real estate through interests in joint ventures; or
3
•Indirect interests in real estate through real estate-related securities, such as:
◦public and/or privately placed, domestic and foreign, registered and unregistered equity investments in real estate investment trusts (“REITs”), which investments may consist of registered or unregistered common or preferred stock interests;
◦private real estate limited partnerships and limited liability companies;companies (collectively, “real estate funds”);
◦real estate operating businesses;
◦investments in equity or debt securities of domestic and foreign companies whose operations involve real estate (i.e., that primarily own, develop or manage real estate) which may not be REITs; and
◦domestic or foreign loans, including conventional commercial mortgage loans, participating mortgage loans, secured domestic and foreign (including U.K.) mezzanine loans, subordinated loans and collateralized mortgage obligations, including commercial mortgage-backed securities (“CMBS”), collateralized mortgage obligations (“CMOs”) and other similar investments.
The Account’s principal strategy is to purchase direct ownership interests in income-producing real estate, primarilyincluding the four primary sectors of office, industrial, retail, and multi-family, properties.and alternative real estate sectors (defined as real estate outside of the four primary sectors noted above). The Account is targeted to holdtargets holding between 65% and 80%85% of the Account’s net assets in such direct ownership interests.
In addition, while the Account is authorized to hold up to 25% of its net assets in liquid real estate-related securities, such asincluding publicly traded REITs and CMBS, managementCMBS. Management intends that the Account will not hold more than 10% of its net assets in such securities on a long-term basis. Traditionally, less than 10% of the Account’s net assets have comprised interests in these securities; although, the Account has held approximately 10% of its net assets in equity REIT securities at times. In addition, under the Account’s current investment guidelines, the Account is authorized to hold up to 10% of its net assets in CMBS. As of December 31, 2017, REIT securities comprised approximately 5.0%2021, the Account did not hold any publicly traded REITs or CMBS.
In making commercial real estate investments within the Account, TIAA seeks to make investments that are suitable from a financial perspective, taking into account the potential financial impacts associated with industry recognized environmental, social and governance (“ESG”) criteria. The Account intends to promote awareness of these criteria to its joint venture partners, vendors and other stakeholders in connection with portfolio related activity involving commercial real estate transactions. TIAA believes awareness, and, as appropriate, implementation of ESG criteria in commercial real estate holdings is beneficial to total long-term returns for the Account. In its evaluation of commercial real estate opportunities, the Account will take ESG considerations into account as part of the Account’s net assets,financial assessment of a commercial real estate portfolio asset, and not to achieve a desired outcome or as an investment qualification or screen. Ultimately, the Account held no CMBS aswill make an investment decision that incorporates ESG criteria only to the extent that the criteria is reasonably expected to enhance our understanding of such date.the investment's ability to achieve desired returns for the Account.
•Money market instruments and other cash equivalents. These will usually be high-quality, short-term debt instruments, including U.S. Government or government agency securities, commercial paper, certificates of
4
deposit, bankers’ acceptances, repurchase agreements, interest-bearing time deposits, and corporate debt securities; and
However, from time to time the Account’s non-real estate-related liquid, fixed-income investments may comprise less than 15% (and possibly less than 10%) of its assets (on a net basis and/or a gross basis), especially during and immediately following periods of significant net participantcontract owner outflows. In addition, the Account, from time to time and on a temporary basis, may hold in excess of 25% of its net assets in non-real estate-related liquid, fixed-income investments, particularly during times of significant inflows into the Account and/or a lack of attractive real estate-related investments available in the market.
Liquid Securities Generally. Primarily due to management’s need to manage fluctuations in cash flows, in particular during and immediately following periods of significant participantcontract owner net transfer activity into or out of the Account, the Account may, on a temporary basis (i) exceed the upper end of its targeted holdings (currently 35% of the Account’s net assets) in liquid securities of all types, including both publicly traded non-real estate-related liquid investments and liquid real estate-related securities, such as REITs, and structured securities including ABS, RMBS, CMBS and MBS, or (ii) be below the low end of its targeted holdings in such liquid securities (currently 15% of the Account’s net assets).
The portion of the Account’s net assets invested in liquid investments of all types may exceed the upper end of its target, for example, if (i) the Account receives a large inflow of money in a short period of time, in particular due to significant participantcontract owner transfer activity into the Account, (ii) the Account receives significant proceeds from sales or financings of direct real estate assets, (iii) there is a lack of attractive direct real estate investments available on the market, and/or (iv) the Account anticipates more near-term cash needs, including to apply to acquire or improve direct real estate investments, pay expenses or repay indebtedness.
Foreign Investments. The Account from time to time willmay also make foreign real estate, andforeign real estate-related investments and foreign liquid, fixed-income investments. Under the Account’s investment guidelines, investments in direct foreign real estate and real estate loans, together with foreign real estate-related securities and foreign non-real estate-related liquid, fixed-income investments may not comprise more than 25% of the Account’s net assets. However, management does not intend such foreign investments, in the aggregate, to exceed 10% of the Account's net assets. As of December 31, 2017,2021, the Account did not hold anyheld $39.9 million in foreign real estate investments.
In managing any domestic or foreign mezzanine debt or other domestic or foreign loans or securities, the Account may enter into certain derivatives transactions (including forward currency contracts and swaps, futures contracts, put and call options and other hedging transactions) in order to hedge against the risks of exchange rate uncertainties, interest rate uncertainties and foreign currency or market fluctuations impacting the Account’s domestic or foreign investments. The Account does not intend to speculate in such transactions.
Investments Summary. At December 31, 2017,2021, the Account’s net assets totaled $24.9$28.1 billion. As of that date, the Account’s investments in real estate properties, real estate joint ventures, limited partnerships,real estate funds, a real estate operating business and loans receivable, and real estate-related marketable securities, net of the fair value of mortgage loans payable on real estate and the Account's outstanding balance on the line of credit, represented 84.4%92.1% of the Account’s net assets.
Borrowing. The Account is authorized to borrow money and assume or obtain a mortgage on a property (i.e., make leveraged real estate investments). Under in accordance with the Account’s current investment guidelines. Under such guidelines, management intends to maintain the Account’s loan-to-value ratio (as defined below) at or below 30% (measured at the time of incurrence and after giving effect thereto). Forms of borrowing may include:
•placing new debt on properties;
•refinancing outstanding debt;
•assuming debt on the Account’s properties;
5
•extending the maturity date of outstanding debt; or
•an unsecured line of credit, credit facility or credit facility.bank loan; or
•the issuance of debt securities.
The Account’s loan-to-value ratio at any time is based on the ratio of the outstanding principal amount of the Account’s debt to the Account’s total gross asset value.value and excludes leverage, if any, employed by REITs and underlying partnerships or investment funds in which the Account invests. This ratio will be measured at the time of any debt incurrence and will be assessed after giving effect thereto. The Account’s total gross asset value, for these purposes, is equal to the total fair value of the Account’s assets (including the fair value of the Account’s interest in joint ventures), with no reduction associated with any indebtedness on such assets. In calculating outstanding indebtedness, we include only the Account’s actual percentage interest in any borrowings on a joint venture investment and not that of any joint venture partner. Also, at the time the Account (or a joint venture in which the Account is a partner) enters into a revolving or other line of credit, management includes only amounts outstanding when calculating outstanding indebtedness.
As of December 31, 2017,2021, the aggregate principal amount of mortgages secured by the Account's wholly-owned properties was $2.1 billion. When combined with the Account’s equity share of the $3.2 billion in mortgages held within and serviced by the Account’s joint venture investments, $500.0 million outstanding on the Account's line of credit and $240.3 million in loans collateralized by loans receivable, the Account's total outstanding debt (including the Account’s share of debt on its joint venture investments) was $4.6is $6.1 billion, andwhich is used to derive the Account’s loan-to-value ratio was 15.5%.of 17.6% as of December 31, 2021.
In times of high net inflow activity, in particular during times of high net participantcontract owner transfer inflows, management may determine to apply a portion of such cash flows to make prepayments of indebtedness prior to scheduled maturity, which would have the effect of reducing the Account’s loan-to-value ratio. Such prepayments may require the Account to pay fees or ‘yield maintenance’"yield maintenance" amounts to lenders.
The Account may only borrow up to 70% of the then-current value of a property, although construction loans may be for 100% of costs incurred in developing the property. Except for construction loans, any mortgage loans on a property will be non-recourse to the Account, meaningAccount. For this purpose, non-recourse means that if there is a default on a loan in respect to a specific property, the lender will have recourse to (i.e., be able to foreclose on) only the property encumbered (or the joint venture owning the property), or to other specific Account properties that may have been pledged as security for the defaulted loan, but not to any other assets of the Account. When possible,
Currently, TIAA, on behalf of the Account, will seekmaintains a senior revolving unsecured line of credit pursuant to havean existing credit agreement with a syndicate of third-party bank lenders, including JPMorgan Chase Bank, N.A., as administrative agent (the “Credit Agreement”). The Account may use the proceeds of borrowings under the Credit Agreement for funding general organizational purposes of the Account in the ordinary course of business, including financing certain real estate portfolio investments. The Account may enter into additional unsecured lines of credit, credit facilities and term bank loans mature at varying timesunderwritten by one or more third-party lenders. In addition, from time to limittime, the risks of borrowing.Account may, if permitted by applicable insurance laws, borrow capital for operating or other needs by offering debt securities
Risk Factors. The Account’s assets and income can be affected by a variety of risk factors. These risks are more fully described under Item 1A of this report.
Personnel and Management. The Account has no officers, directors or employees. TIAA employees, under the direction and control of the Board, manage the investment of the Account’s assets, following investment management procedures TIAA has adopted for the Account. References to “Management” herein refer to the employees and officers of TIAA responsible for management of the Account. In addition, TIAA performs administration functions for the Account (which includes receiving and allocating premiums, calculating and making annuity payments and providing recordkeeping and other services). Distribution services for the Account (which include, without limitation, distribution of the annuity contracts, advising existing annuity contract owners in connection with their accumulations and helping employers implement and manage retirement plans) are performed by TIAA-CREF Individual & Institutional Services, LLC (“Services”), a wholly-owned subsidiary of TIAA and registered broker-dealer and member of the Financial Industry Regulatory Authority (“FINRA”). TIAA and
6
Services provide investment advisory,management, administration, and distribution services, as applicable, to the Account on an “at-cost” basis.
Contracts. TIAA offers the Account as a variable option for the annuity contracts listed earlier in this Item 1, although some employer plans may not offer the Account as an option for certain contracts. Each payment to the Account buys a number of accumulation units. Similarly, any transfer or withdrawal from the Account results in the redemption of a number of accumulation units. The price paid for an accumulation unit, and the price received for an accumulation unit when redeemed, is the accumulation unit value (“AUV”) calculated for the business day on which the participant’scontract owner’s purchase, redemption or transfer request is received in good order (unless a participantcontract owner asks for a later date for a redemption or transfer).
Subject to the terms of the contracts and a participant’scontract owner’s employer’s plan, a participantcontract owner can move money to and from the Account in the following ways, among others:
•from the Account to a College Retirement Equities Fund ("CREF"(“CREF”) investment account, a TIAA Access variable account (if available), TIAA’s Traditional Annuity or a mutual fund (including TIAA-CREF affiliated mutual funds) or other options available under the plan;
•to the Account from a CREF investment account, a TIAA Access variable account (if available), TIAA’s Traditional Annuity (transfers from TIAA’s Traditional Annuity under RA, GRA or Retirement Choice contracts are subject to restrictions), a TIAA-CREF affiliated mutual fund or from other companies/ plans;
•by withdrawing cash; and/or
•by setting up a program of automatic withdrawals or transfers.
Importantly, transfers out of the Account to a TIAA or CREF account or into another investment option can be executed on any business day, but are limited to once per calendar quarter, although some plans may allow systematic transfers that result in more than one transfer per calendar quarter. TIAA reserves the right to stop accepting transfers into the Account at any time. Other limited exceptions may apply. Also, transfers to CREF accounts or to certain other options may be restricted by an employer’s plan, current tax law or by the terms of a participant’scontract owner’s contract. In addition, with most contracts, individual participantscontract owners are subject to certain limitations on making internal transfers into their Account accumulation if, after giving effect to such transfer, the total value of such participant’scontract owner’s Account accumulation (under all contracts issued to such participant)contract owner) would exceed $150,000. Categories of transactions that TIAA deems “internal funding vehicle transfers” for purposes of this limitation are described in the applicable contract or endorsement form in the Account’s prospectus. The effective date of the limitation as it applies to an individual participantcontract owner will be reflected on his or her applicable contract or endorsement form.
Appraisals and Valuations. With respect to the Account’s real property investments or associated interest in the underlying property held by a joint venture investment (collectively "real properties"“real properties”), following the initial purchase of a property or the making of a mortgage loan on a property by the Account (at which time the Account normally receives an independent appraisal on such property), each of the Account’s real properties are appraised, and mortgage loans are valued, at least once every calendar quarter or sooner as circumstances arise. Each of the Account’s real estate properties areis appraised each quarter by an independent third-party state-certified (or its foreign equivalent) appraiser (which we refer to in this report as an “independent appraiser”) who is a member of a professional appraisal organization. In addition, TIAA’s internal appraisal staff performs a review of each of these quarterly appraisals, in conjunction with the Account’s independent fiduciary, and TIAA’s internal appraisal staff or the independent fiduciary may request an additional appraisal or valuation outside of this quarterly cycle. Any differences in the conclusions of TIAA’s internal appraisal staff and the independent appraiser will be reviewed by the independent fiduciary, which will make a final determination on the matter (which may include ordering a subsequent independent appraisal).
In general, the Account records appraisals of its real estate properties spread out throughout the quarter, which is intended to result in appraisal adjustments and thus adjustments to the valuations of its holdings (to the extent adjustments are made) happen regularly throughout each quarter and not on one specific day in each period. In addition, an estimated daily equivalent of net operating income is taken into consideration and is adjusted for actual transactional activity. The remaining assets in the Account are primarily marketable securities that are priced on a
7
daily basis. See “Management’s Discussion and Analysis of the Account’s Financial Condition and Results of Operations—Critical Accounting Policies”Estimates” in this Form 10-K for more information on how each class of the Account’s investments are valued.
Liquidity Guarantee. The TIAA General Account provides the Account with a liquidity guarantee enabling the Account to have funds available to meet participantcontract owner redemption, transfer or cash withdrawal requests. The Account pays TIAA for the risk associated with providing the liquidity guarantee through a daily deduction from the Account’s net assets. If the Account cannot fund participantcontract owner requests from the Account’s own cash flow and liquid investments, the TIAA General Account will fund them by purchasing accumulation units issued by the Account (accumulation units that are purchased by TIAA are generally referred to as “liquidity units”). ThisThe liquidity guarantee is required by the NYDFS. TIAA guarantees that participantscontract owners can redeem their accumulation units at the accumulation unit value next determined after their transfer or cash withdrawal request is received in good order. Liquidity units owned by TIAA are valued in the same manner as accumulation units owned by the Account’s participants.contract owners.
Redemption of Liquidity Units. The independent fiduciary is vested with oversight and approval over any redemption of TIAA’s liquidity units, acting in the best interests of Real Estate Account participants.
To the extent liquidity units are held by the TIAA General Account, the independent fiduciary reserves the right to authorize or direct the redemption of all or a portion of liquidity units at any time. Upon termination and liquidation of the Account (wind-up), any liquidity units held by TIAA will be the last units redeemed, unless the independent fiduciary directs otherwise.
Independent Fiduciary. Because TIAA’s ability to purchase and sell liquidity units raises certain technical issues under the Employee Retirement Income Security Act of 1974, as amended (“ERISA”), TIAA applied for and received a prohibited transaction exemption from the U.S. Department of Labor in 1996 (PTE 96-76)(“PTE 96-76”). In connection with the exemption, TIAA has appointed an independent fiduciary for the Account, with overall responsibility for reviewing the Account’s transactions to determine whether they are in accordance with the Account’s investment guidelines.
SitusAMC Real Estate Valuation Services, LLC, formerly known as RERC, LLC,, a real estate consulting firm whose principal offices are located in West Des Moines, IA (“RERC”SitusAMC”), was appointed as independent fiduciary effectivebeginning March 1, 2006 and currently serves as the Account’s independent fiduciary, pursuant to an amended and restatedengagement letter agreement effective March 1, 2018,2022, whose term expires on February 28, 2021.2027. The independent fiduciary’s responsibilities include:
•reviewing and approving the Account’s investment guidelines and monitoring whether the Account’s investments comply with those guidelines;
•reviewing and approving valuation procedures for the Account’s properties;
•approving adjustments to any property valuations that change the value of the property or the Account as a whole above or below certain prescribed levels, or that are made within three months of the annual independent appraisal;
•reviewing and approving how the Account values accumulation and annuity units;
•approving the appointment of all independent appraisers;
•reviewing the purchase and sale of units by TIAA to ensure that the Account uses the correct unit values; and
•requiring appraisals besides those normally conducted, if the independent fiduciary believes that any of the properties have changed materially, or that an additional appraisal is necessary to ensure the Account has correctly valued a property.
In addition, the independent fiduciary has certain responsibilities with respect to the Account that it had historically undertaken or is currently undertaking with respect to TIAA’s purchase and ownership of liquidity units, including among other things, reviewing the purchases and redemption of liquidity units by TIAA to ensure the Account uses the correct unit values. In connection therewith, as set forth in PTE 96-76, the independent fiduciary’s responsibilities include:
8
•establishing the percentage of total accumulation units that TIAA’s ownership should not exceed (the “trigger point”) and creating a method for changing the trigger point;
•approving any adjustment of TIAA’s ownership interest in the Account and, in its discretion, requiring an adjustment if TIAA’s ownership of liquidity units reaches the trigger point; and
•once the trigger point has been reached, participating in any program to reduce TIAA’s ownership in the Account by utilizing cash flow or liquid investments in the Account, or by utilizing the proceeds from asset sales. If the independent fiduciary were to determine that TIAA’s ownership should be reduced following the trigger point, its role in participating in any asset sales program would include (i) participating in the selection of properties for sale, (ii) providing sales guidelines, and (iii) approving those sales if, in the independent fiduciary’s opinion, such sales are desirable to reduce TIAA’s ownership of liquidity units.
Available Information. The Account’s annual report on Form 10-K, quarterly reports on Form 10-Q, and any amendments to those reports, filed by the Account with the Securities and Exchange Commission on or after the date hereof, can be accessed free of charge at www.tiaa.org. Information contained on this website is expressly not incorporated by reference into this Annual Reportannual report on Form 10-K.
SUMMARY RISK FACTORS.
Investing in the Account involves a high degree of risk. Some, but not all, of the risks and uncertainties that we face are risks related to:
•Acquiring, owning and selling real property and real estate investments, including risks related to general economic and real estate market conditions, the risk that the Account’s properties become too concentrated (whether by geography, sector or by tenant mix) and the risk that the sales price of a property might differ from its estimated or appraised value;
•Property valuations, including the fact that the Account’s appraisals are generally obtained on a quarterly basis and there may be periods in between appraisals of a property during which the value attributed to the property for purposes of the Account’s daily accumulation unit value may be more or less than the actual realizable value of the property;
•Financing the Account’s properties, including the risk of default on loans secured by the Account’s properties (which could lead to foreclosure);
•Contract owner transactions, in particular that (i) significant net contract owner transfers out of the Account may impair our ability to pursue or consummate new investment opportunities, (ii) significant net contract owner transfers into the Account may result, on a temporary basis, in our cash holdings and/or holdings in liquid non-real estate-related investments exceeding our long-term targeted holding levels and (iii) high levels of cash and liquid non-real estate-related investments in the Account during times of appreciating real estate values can impair the Account’s overall return;
•Joint ventures and real estate funds, including the risk that the Account may have limited rights with respect to the joint venture or that a co-venturer or fund manager may have financial difficulties;
•Governmental regulatory matters such as zoning laws, rent control laws, and property and other taxes;
•Potential liability for damage to the environment or injury to individuals caused by hazardous substances used or found on its properties, as well as risks associated with federal and state environmental laws may impose restrictions on the manner in which a property may be used;
•Certain catastrophic losses that may be uninsurable, as well as risks related to climate-related changes and hazards, which could adversely impact the Account’s investment returns;
•Utilization of ESG criteria in its commercial real estate underwriting may result in the Account foregoing some commercial real estate market opportunities and subsequently underperforming relative to other investment vehicles that do not utilize such ESG criteria in selecting portfolio properties;
•Countries with emerging market, foreign commercial real properties, foreign real estate loans, foreign debt investments and foreign securities investments that may experience unique risks such as changes in currency exchange rates, imposition of market controls or currency exchange controls, seizure, expropriation or
9
nationalization of assets, political, social or diplomatic events or unrest, regulatory and taxation risks and risks associated with enforcing judgments in foreign countries that could cause the Account to lose money;
•Investments in REITs, including changes in the value of the underlying properties or by the quality of any credit extended, as well as exposure to market risk due to changing conditions in the financial markets;
•Investments in mortgage-backed securities, which are subject to the same risks inherent in real estate investing, making mortgage loans and investing in debt securities. For example, the underlying mortgage loans may experience defaults, are subject to prepayment risks and are sensitive to economic conditions impacting the credit markets generally;
•Risks associated with the Account’s investments in mortgage loans, including (i) borrower default that results in the Account being unable to recover its original investment, (ii) liens that may have priority over the Account’s security interest, (iii) a deterioration in the financial condition of tenants, and (iv) changes in interest rates for the Account’s variable-rate mortgage loans and other debt instruments;
•Risks associated with the Account’s investments in, and leasing of, single-family real estate include risks relating to the condition of the properties, the credit quality and employment stability of the tenants, and compliance with applicable local laws regarding the acquisition and leasing of single family real estate;
•Investment securities issued by U.S. Government agencies and U.S. Government-sponsored entities, including the risk that the issuer may not have their securities backed by the full faith and credit of the U.S. Government, which could adversely affect the pricing and value of such securities;
•Risks associated with investments in liquid, fixed-income investments and real estate-related liquid assets (which could include, from time to time, registered or unregistered REIT securities and CMBS), and non-real estate-related liquid assets, including the risk that:
•the issuer will not be able to pay principal and interest when due (or in the case of structured securities, the risk that the underlying collateral for the security may be insufficient to support such interest or principal payments) or that the issuer’s earnings will fall;
•credit spreads may increase;
•the changing conditions in financial markets may cause the Account’s investments or interest rates to experience volatility;
•securities (or the underlying collateral in the case of structured securities) are downgraded should TIAA and/or rating agencies believe the issuer’s business outlook or creditworthiness has deteriorated;
•the level of current income from a portfolio of fixed-income investments may decline in certain interest rate environments;
•during periods of falling interest rates, an issuer may call (or repay) a fixed-income security prior to maturity, or pay off their loans sooner than expected, resulting in a decline in income;
•during periods of rising interest rates, borrowers may pay off their mortgage and other loans later than expected, preventing the Account from reinvesting principal proceeds at higher interest rates;
•securities issued by the U.S. Government or one of its agencies or instrumentalities may receive varying levels of support from the U.S. Government, which could affect the Account’s ability to recover should they default;
•events affecting states and municipalities, including severe financial difficulties, may adversely impact the Account’s investments and its performance;
•the issuer of non-U.S. sovereign debt or the governmental authorities that control the repayment of such debt may be unable or unwilling to repay principal or interest when due;
•the inability to receive the principal or interest collectable on multinational or supranational foreign debt;
•the Account’s investment decisions may cause the Account to underperform relative to others in the marketplace;
•foreign (non-U.S.) currencies may decline in value relative to the U.S. dollar and adversely affect the value of the Account’s investments impacted by foreign currencies;
•investments in derivatives and other types of hedging strategies may result in the Account losing more than the principal amount invested;
10
•currency management strategies may substantially change the Account’s exposure to currencies and currency exchange rates and could result in losses to the Account;
•transactions involving a counterparty to a derivative or other instrument, or to a third party responsible for servicing the instrument, are subject to the credit risk of the counterparty or third party;
•SEC Rule 144A securities may be less liquid and have less investor protections than publicly traded securities;
•illiquid investments may be difficult for the Account to sell for the value at which they are carried; and
•the Account could experience losses if banks fail;
•Conflicts of interests associated with TIAA serving as investment manager of the Account and provider of the liquidity guarantee while also serving as an investment manager to other real estate accounts or funds;
•Lending securities, which has the Account bear the market risk with respect to the investment of collateral or a portion of the income generated by interest paid by the securities lending agent on the cash collateral balance; and
•The Account’s requirement to sell property in the event that TIAA owns too large of a percentage of the Account’s accumulation units, which sales could occur at a time or price that is not optimal for the Account’s returns.
•The tax rules applicable to the contracts vary and your rights under a contract may be subject to the terms of your employer's retirement plan itself, regardless of the terms of the contract.
This summary does not address all of the risks that we face. Additional discussion of the risks summarized above, and other risks that we face, can be found in the “Risk Factors” section directly below.
ITEM 1A. RISK FACTORS.
The value of your investment in the Account will fluctuate based on the value of the Account’s assets, the income the assets generate and the Account’s expenses. ParticipantsContract owners can lose money by investing in the Account. The past performance of the Account is not indicative of future results. There is risk associated with an investor attempting to “time” an investment in the Account’s units, or effecting a redemption of an investor’s units. The Account’s assets and income can be affected by many factors, and you should consider the specific risks presented below before investing in the Account. In particular, for a discussion of how forward-looking statements contained in this annual report on Form 10-K are subject to uncertainties that are difficult to predict, which may be beyond management’s control and which could cause actual results to differ materially from historical experience or management’s present expectations, please refer to the subsection entitled “Forward-Looking Statements,” which is contained in the section entitled “Management’s Discussion and Analysis of the Account’s Financial Condition and Results of Operations.”
RISKS ASSOCIATED WITH REAL ESTATE INVESTING
General Risks of Acquiring and Owning Real Property. As referenced elsewhere in this report, the substantial majority of the Account’s net assets consist of direct ownership interests in real estate. As such, the Account is particularly subject to the risks inherent in acquiring and owning real property, including in particular the following:
•Adverse Global and Domestic Economic Conditions. The economic conditions in the markets where the Account’s properties are located may be adversely impacted by factors which include:
◦adverse domestic or global economic conditions, particularly in the event of a deep recession which results in significant employment losses across many sectors of the economy and reduced levels of consumer spending;
◦a weak market for real estate generally and/or in specific locations where the Account may own property, including, among other reasons, as a result of an epidemic, pandemic or other health-related issue in one or more markets where the Account owns property;
◦business closings, industry or sector slowdowns, employment losses and related factors;
◦the availability of financing (both for the Account and potential purchasers of the Account’s properties);
◦an oversupply of, or a reduced demand for, certain types of real estate properties;
11
◦natural disasters (including hurricanes and tsunamis), rising sea levels due to global climate warming or otherwise, flooding and other significant and severe weather-related events;
◦health emergencies, such as pandemics and epidemics;
◦cyber attacks;
◦terrorist attacks and/or other man-made events; and
◦decline in population or shifting demographics.
The incidence of some or all of these factors could reduce occupancy, rental rates and the fair value of the Account’s real properties or interests in investment vehicles (such as limited partnerships)real estate funds) which directly hold real properties.
Concentration Risk.The Account may experience periods in which its investments are geographically concentrated, either regionally or in certain markets with similar demographics. Further, while the Account seeks diversification across itsthe four primary property types:sectors of office, industrial, retail and multi-family, properties,as well as across alternative real estate sectors, the Account may experience periods where it has concentration in one property type, increasing the potential exposure if there were to be an oversupply of, or a reduced demand for, certain types of real estate properties in the markets in which the Account operates.
Also, the Account may experience periods in which its tenant base is concentrated within a particular primary industry sector. For example, the Account owns and operates a number ofsector (e.g., retail mall shopping centers, industrial properties which typically feature larger tenant concentration. The insolvency and/or closing of a single tenant in one of our industrial properties may significantly impair the income generated byoffice space) or an industrial property, and may also depress the value of such property.
alternative real estate sector. If any or all of these events occur, the Account’s income and performance may be adversely impacted disproportionately by deteriorating economic conditions in those areas or industry sectors in which the Account’s investments are concentrated. Also, the Account could experience a more rapid negative change in the value of its real estate investments than would be the case if its real estate investments were more diversified.
Leasing Risk. A number of factors could cause the Account’s rental income, a key source of the Account’s revenue and investment return, to decline, which would adversely impact the Account’s results and investment returns. These factors include the following:
•A property may be unable to attract new tenants or retain existing tenants. This situation could be exacerbated if a concentration of lease expirations occurred during any one time period or multiple tenants exercise early termination at the same time.
•The financial condition of our tenants may be adversely impacted, particularly in a prolonged economic downturn. The Account could lose revenue if tenants do not pay rent when contractually obligated, request some form of rent relief and/or default under a lease at one of the Account’s properties. Such a default could occur if a tenant declared bankruptcy, suffered from a lack of liquidity, failed to continue to operate its business or for other reasons. In the event of any such default, we may experience a delay in, or an inability to effect, the enforcement of our rights against that tenant, particularly if that tenant filed for bankruptcy protection. Further, any disputes with tenants could involve costly and time consuming litigation.
•In the event a tenant vacates its space atin one of the Account’s properties, whether as a result of a default, the expiration of the lease term, rejection of the lease in bankruptcy or otherwise, given current market conditions, we may not be able to re-lease the vacant space either (i) for as much as the rent payable under the previous lease or (ii) at all. Also, we may not be able to re-lease such space without incurring substantial expenditures for tenant improvements and other lease-up related costs, while still being obligated for any mortgage payments, real estate taxes and other expenditures related to the property.
In some instances, ourthe Account’s properties may be specifically suited to and/or outfitted for the particular needs of a certain tenant based on the type of business the tenant operates. For example, many companies desire space with an open floor plan. WeThe Account may have difficulty obtaining a new tenant for any vacant space in ourits properties, particularly if the current structure of the developed property (e.g., floor plan or otherwise) limits the types of businesses that can use the space without major renovation, which may require usthe Account to incur substantial expense in re-planning the space. Also, upon expiration of a lease, the space preferences of ourthe Account’s major tenants may no longer align with the space they previously rented, which could cause those tenants to not renew their lease, or may require usthe Account to expend significant sums to reconfigure the space to their needs.
12
•The Account owns and operates retail properties, which, in addition to the risks listed above, are subject to specific risks, including the insolvency and/or closing of an anchor tenant.tenant for certain properties. Many times, anchor tenants will be “big box” stores and other large retailers that can be particularly adversely impacted by a global recession, competition from online retailers and reduced consumer spending generally. Factors that can impact the level of consumer spending include increases in fuel and energy costs, residential and commercial real estate and mortgage conditions, labor and healthcare costs, access to credit, consumer confidence and other macroeconomic factors. Under certain circumstances, co-tenancy clauses in tenants’ leases may allow certain tenants in a retail property to terminate their leases or reduce or withhold rental payments when overall occupancy at the property falls below certain minimum levels. The insolvency and/or closing of an anchor tenant may also cause such tenants to terminate their leases, or to fail to renew their leases at expiration.
•The Account also owns and operates office properties, which, in addition to the risks listed above, are subject to specific risks, including the risk of long term demand for traditional office space declining significantly in the future as employers shift from traditional in-office working models to work-from-home and hybrid working arrangements as a result of the ongoing COVID-19 pandemic or other factors.
•From time to time, the Account may own and lease single family real estate. In addition to the risks listed above, single-family real estate investment may subject the Account to a variety of additional risks, including risks relating to the condition of the properties, the credit quality and employment stability of the tenants, and compliance with applicable local laws regarding the acquisition and leasing of single family real estate. Until recently, the single-family rental business consisted primarily of private and individual investors in local markets and was managed individually or by small, local property managers. This part of our real estate-related investment strategy involves purchasing, renovating, maintaining and managing residential properties and leasing them to suitable tenants. Large, well-capitalized institutional investors such as the Account have only recently entered this business and, as a result, there are very few peer companies with an established long-term track record to assist us in predicting whether our single family investment strategy can be implemented and sustained successfully over time. Furthermore, the single family real estate that we acquire vary materially in terms of time to possession, renovation, quality and type of construction, location and hazards. Our success depends on our ability to acquire single family properties that can be quickly possessed renovated, repaired, upgraded and rented with minimal expense and maintained in rentable condition. Our ability to identify and acquire such properties is fundamental to this part of our real related investment strategy. In addition, the recent market and regulatory environments relating to single-family residential properties have been changing rapidly, making future trends difficult to forecast. For example, an increasing number of homeowners now wait for an eviction notice or eviction proceedings to commence before vacating foreclosed premises, which can significantly increase the time period between the acquisition and leasing of a single family property. Such changes affect the accuracy of our assumptions on investment return for single family properties and, in turn, may adversely affect the Account’s performance.
Competition. The Account may face competition for real estate investments from multiple sources, including individuals, corporations, insurance companies or other insurance company separate accounts, as well as real estate limited partnerships, real estate investment funds, commercial developers, pension plans, other institutional and foreign investors and other entities engaged in real estate investment activities. Some of these competitors may have similar financial and other resources as the Account, and/or they may have investment strategies and policies (including the ability to incur significantly more leverage than the Account) that allow them to compete more aggressively for real estate investment opportunities, which could result in the Account paying higher prices for investments, experiencing delays in acquiring investments or failing to consummate such purchases. Any resulting delays in the acquisition of investments, or the failure to consummate acquisitions the Account deems desirable, may increase the Account’s costs or otherwise adversely affect the Account’s investment results.
In addition, the Account’s properties may be located close to properties that are owned by other real estate investors and that compete with the Account for tenants. These competing properties may be better located, more suitable for tenants than our properties, or have owners who may compete more aggressively for tenants, resulting in a competitive advantage for these other properties. WeThe Account may also face similar competition from other properties that may be developed
in the future. This competition may limit the Account’s ability to lease space, increase its costs of securing tenants, and limit ourthe Account’s ability to maximize our rents and/or require the Account to make capital improvements it otherwise would not, in order to make its properties more attractive to prospective tenants.
13
Operating Costs. A property’s cash flow could decrease if operating costs, such as property taxes, utilities, litigation expenses associated with a property, maintenance and insurance costs that are not reimbursed by tenants, increase in relation to gross rental income, or if the property needs unanticipated repairs and renovations. In addition, the Account’s expenses of owning and operating a property are not necessarily reduced when the Account’s income from a property is reduced.
Condemnation. A governmental agency may condemn and convert for a public use (i.e.(i.e., through eminent domain) all or a portion of a property owned by the Account. While the Account would receive compensation in connection with any such condemnation, such compensation may not be in an amount the Account believes represents the equivalent value for the condemned property. Further, a partial condemnation could impair the ability of the Account to maximize the value of the property during its operation, including making it more difficult to find new tenants or retain existing tenants. Finally, a property which has been subject to a partial condemnation may be more difficult to sell at a price the Account believes is appropriate.
Terrorism and Acts of War and Violence. Terrorist attacks may harm our property investments. The Account can provide no assurance that there will not be further terrorist attacks against the United States or U.S. businesses or elsewhere in the world. These attacks or armed conflicts may directly or indirectly impact the value of the property we ownthe Account owns or that secure our loans. Losses resulting from these types of events may be uninsurable or not insurable to the full extent of the loss suffered. Moreover, any of these events could cause consumer confidence and spending to decrease or result in increased volatility in the United States, worldwide financial markets, and the global economy. Such events could also result in economic uncertainty in the United States or abroad. Adverse economic conditions resulting from terrorist activities could reduce demand for space in the Account’s properties and thereby reduce the value of the Account’s properties and therefore your investment return.
Risk of Limited Warranty. Purchasing a property “as is” or with limited warranties, which limit the Account’s recourse if due diligence fails to identify all material risks, can negatively impact the Account by reducing the value of such properties and increasing the Account’s cost to hold or sell properties.
Risk of ESG-Related Factors. Third party property management services employed by TIAA may not sufficiently assess and/or appropriately manage ESG-related criteria when acquiring and/or operating commercial real property held in the Account’s portfolio, and any resulting ESG-related financial performance issues with the commercial property may have the potential in certain circumstances to negatively impact the value of the property and resulting investment returns for the Account.
General Risks of Selling Real Estate Investments. Among the risks of selling real estate investments are:
•The sale price of an Account property might differ, perhaps significantly, from its estimated or appraised value, leading to losses or reduced profits to the Account.
•The Account might not be able to sell a property at a particular time for a price which management believes represents its fair or full value. This illiquidity may result from the cyclical nature of real estate, general economic conditions impacting the location of the property, disruption in the credit markets or the availability of financing on favorable terms or at all, and the supply of and demand for available tenant space, among other reasons. This might make it difficult to raise cash quickly which could impair the Account’s liquidity position (particularly during any period of sustained significant net participantcontract owner outflows) and also could lead to Account losses. Further, the liquidity guarantee does not serve as a working capital facility or credit line to enhance the Account’s liquidity levels generally, as its purpose is tied to participantscontract owners having the ability to redeem their accumulation units upon demand (thus alleviating the Account’s need to dispose of properties solely to increase liquidity levels in what management deems a suboptimal sales environment).
•The Account may need to provide financing to a purchaser if no cash buyers are available, or if buyers are unable to receive financing on terms enabling them to consummate the purchase. Such seller financing introduces a risk that the counterparty may not perform its obligations to repay the amounts borrowed from the Account to complete the purchase.
•For any particular property, the Account may be required to make expenditures for improvements to, or to correct defects in, the property before the Account is able to market and/or sell the property.
14
•Interests in real estate limited partnershipsfunds tend to be, in particular, illiquid and the Account may be unable to dispose of such investments at opportune times.
•Sales of the Account’s properties are subject to other risks including, but not limited to, negative changes in the climate for real estate, risks related to local, regional, national and global economic conditions, overbuilding and increased competition, property taxes and operating expenses, uninsured losses at properties due to terrorism, natural disasters or acts of violence, and costs resulting from the cleanup of environmental problems.
Valuation and Appraisal Risks. Investments in the Account’s assets are stated at fair value, which is defined as the price that would be received to sell the asset in an orderly transaction between market participants at the measurement date. Because fair value excludes transaction costs that will be incurred to sell an investment, the Account's unit value won't necessarily reflect the net realizable value of its investments. Determination of fair value, particularly for real estate assets, involves significant judgment. Valuation of the Account’s real estate properties (which comprise a substantial majority of the Account’s net assets) are based on real estate appraisals, which are estimates of property values based on a professional’sprofessional's opinion and may not be accurate predictors of the amount the Account would actually receive if it sold a property. Appraisals can be subjective in certain respects and rely on a variety of assumptions and conditions at that property or in the market in which the property is located, which may change materially after the appraisal is conducted. Among other things, market prices for comparable real estate may be volatile, in particular if there has been a lack of recent transaction activity in such market. Any future disruptions in the macroeconomy,macro-economy, real estate markets and the credit markets, such as those that occurred from 2008-2011 or that were caused by the COVID-19 pandemic, could lead to a significant decline in real estate transaction activity in most markets and sectors in which the Account is invested. The resulting lack of observable transaction data may make it more difficult for a property appraisal to determine the fair value of the Account’s investment in one or more real estate assets. In addition, a portion of the data used by appraisers is based on historical information at the time the appraisal is conducted, and subsequent changes to such data, after an appraiser has used such data in connection with the appraisal, may not be adequately captured in the appraised value. Also, to the extent that the Account uses a relatively small number of independent appraisers to value a significant portion of its properties, valuations may be subject to any institutional biases of such appraisers and their valuation procedures.
Further, as the Account generally obtains appraisals on a quarterly basis, there may be circumstances in the period between appraisals or interim valuation adjustments in which the true realizable value of a property is not reflected in the Account’s daily net asset value calculation or in the Account’s periodic Consolidated Financial Statements.consolidated financial statements. This disparity may be more apparent when the commercial and/or residential real estate markets experience an overall and possibly dramatic decline (or increase) in property values in a relatively short period of time between appraisals.
If the appraised values of the Account’s properties as a whole are too high, those participantscontract owners who purchased accumulation units prior to (i) a downward valuation adjustment of a property or multiple properties or (ii) a property or properties being sold for a lower price than the appraised value will be credited with less of an interest than if the value had previously been adjusted downward. Also, those participantscontract owners who redeem during any such period will have received more than their pro rata share of the value of the Account’s assets, to the detriment of other non-redeeming participants.contract owners. In particular, appraised property values may prove to be too high (as a whole) in a rapidly declining commercial real estate market. Further, implicit in the Account’s definition of fair value is a principal assumption that there will be a reasonable time to market a given property and that the property will be exchanged between a willing buyer and willing seller in a non-distressed scenario. However, an appraised value may not reflect the actual realizable value that would be obtained in a rush sale where time was of the essence. Also, appraised values may lag actual realizable values to the extent there is significant and rapid economic deterioration in a particular geographic market or a particular sector within a geographic market.
If the appraised values of the Account’s properties as a whole are too low, those participantscontract owners who redeem prior to (i) an upward valuation adjustment of a property or multiple properties or (ii) a property or properties being sold
15
for a higher price than the appraised value will have received less than their pro rata share of the value of the Account’s assets, and those participantscontract owners who purchase units during any such period will be credited with more than their pro rata share of the value of the Account’s assets.
Finally, the Account recognizes items of income (such as net operating income from real estate investments, distributions from real estate limited partnershipsfunds or joint ventures, or dividends from REIT stocks) and expense in many cases on an intermittent basis, where the Account cannot predict with certainty the magnitude or the timing of such items. As such, even as the Account estimates items of net operating income on a daily basis, the AUV for the Account may fluctuate, perhaps significantly, from day to day, as a result of adjusting these estimates for the actual recognizedrealized item of income or expense.
Risks of Borrowing. The Account acquires some of its properties subject to existing financing and from time to time borrows new funds at the time of purchase. The Account may borrow pursuant to mortgages placed on individual properties, or under anthe Account’s Credit Agreement, under another unsecured line of credit, credit facility or credit facility.term bank loan into which the Account enters in the future, or under the terms of debt securities issued by the Account. Also, the Account may from time to time place new leverage on, increase the leverage already placed on, or refinance maturing debt on, existing properties the Account owns. Under the Account’sAccount's current investment guidelines, the Account intends to maintain its loan-to-value ratio at or below 30% (measured at the time of incurrence and after giving effect thereto). with a targeted loan-to-value ratio of 20% or less. As of December 31, 2017,2021, the Account’s loan-to-value ratio was 15.5%approximately 17.6%. Also, the Account may borrow up to 70% of the then-current value of a particular property. Non-construction mortgage loans on a property will be non-recourse to the Account.
Account, except for standard non-recourse carve outs. Among the risks of borrowing money, including borrowing under athe Credit Agreement, any additional future line of credit, credit facility or term bank loan, the issuance of debt securities by the Account, or under another line of credit or credit facility, or otherwise investing in a property subject to a mortgage are:are the following:
•General Economic Conditions. General economic conditions, dislocations in the capital or credit markets generally or the market conditions then in effect in the real estate finance industry, may hinder the Account’s
ability to obtain financing or refinancing for its property investments on favorable terms or at all, regardless of the quality of the Account’s property for which financing or refinancing is sought. Such unfavorable terms might include high interest rates, increased fees and costs and restrictive covenants applicable to the Account’s operation of the property. Longer term disruptions in the capital and credit markets as a result of uncertainty, changing or increased regulation, reduced alternatives, rising interest rates or failures of significant financial institutions could adversely affect our access to financing necessary to make profitable real estate investments. Our failure to obtain financing or refinancing on favorable terms due to the current state of the credit markets or otherwise could have an adverse impact on the returns of the Account. Also, the Account’s ability to continue to secure financing may be impaired if negative marketplace effects, such as those which followed from the worldwide economic slowdown following the banking2008-2011 financial crisis of 2008 andor the subsequent sovereign debt and banking difficulties recently experienced in parts of the eurozone,Eurozone, were to persist. These difficultiesoccur. Such marketplace effects could includeresult in tighter lending standards instituted by banks and financial institutions, the reduced availability of credit facilities and project finance facilities from banks and the fall of consumer and/or business confidence.
•Default Risk. The property or group of encumbered properties may not generate sufficient cash flow to support the debt service on the loan, themortgage loan. The property may also fail to meet certain financial or operating covenants contained in the loan documents and/or the property may have negative equity (i.e.(i.e., the loan balance exceeds the value of the property) or inadequate equity. In addition, income from properties or investments or any other source of income for the Account may not generate sufficient cash flow to support the debt service on a line of credit or credit facility.facility or debt securities issued by the Account. In any of these circumstances, we (or a joint venture in which we invest) may default on the loan, including due to the failure to make required debt service payments when due. If a loan is in default, the Account or the venture may determine that it is not economically desirable and/or in the best interests of the Account to continue to make payments on the loan (including accessing other sources of funds to support debt service on the loan), and/or the Account or venture may not be able to otherwise remedy such default on commercially reasonable terms or at all. In either case, the lender then could accelerate the outstanding amount due on the loan and/or foreclose on the underlying property, in which case the Account could lose the value of its investment in the foreclosed property. Further,
16
any such default or acceleration could trigger a default under loan agreements in respect of other Account properties pledged as security for the defaulted loan or other loans. Finally, any such default could subject the Account to the costs of litigation, increase the Account’s borrowing costs, or result in less favorable terms, with respect to financing future properties or entering into future lines of credit or credit facilities.
facilities, obtaining future bank term loans or issuing debt securities.•Balloon Maturities.If the Account obtains a mortgage loan that involves a balloon payment, there is a risk that the Account maywill not be able to make the lump sum principal payment due under the loan at the end of the loan term, or otherwise obtain adequate refinancing on terms commercially acceptable to the Account or at all. The Account then may be forced to sell the property or other properties under unfavorable market conditions, restructure the loan on terms not advantageous to the Account, or default on its mortgage, resulting in the lender exercising its remedies, which may include repossession of the property, and the Account could lose the value of its investment in that property.
•Variable Interest Rate Risk.If the Account obtains variable-rate loans, the Account’s returns may be volatile when interest rates are volatile. Generally, changes in interest rates will have a smaller effect on the market value of variable-rate loans than on the market value of comparable fixed-rate obligations. Further, the Account is exposed to interest rate risk with respect to variable-rate indebtedness based on current property-level mortgage financings, and may become exposed to such interest rate risk in any future borrowings under the Credit Agreement, one or more future bank term loans or any issuance of debt securities. Any increase in interest rates under such debt financing arrangements would directly result in higher interest expense costs to the extent that the Account takes out fixed-rate loans and interest rates subsequently decline, this may cause the Account to pay interest at above-market rates for a significant period of time.Account. Any interest rate hedging activities the Account engages in to mitigate this risk may not fully protect the Account from the impact of interest rate volatility.
As of December 31, 2021, the outstanding principal balance of our variable rate indebtedness, including mortgage loans payable and line of credit was $754.2 million.•Variable Rate Demand Obligation (“VRDO”) Risk. To the extent the Account obtains financing pursuant to a variable rate demand obligationVRDO subject to periodic remarketing or similar mechanisms, the Account or the joint ventures in which it invests could face higher borrowing costs if the remarketing results in a higher prevailing interest rate. In addition, the terms of such variable rate obligationsVRDOs may allow the remarketing agent to cause the Account or venture to repay the loan on demand in the event insufficient market demand for such loans is present. In particular, RGM 42, LLC, a joint venture in which the Account holds a 70% interest, is the borrower under a VRDO loan program.
•Valuation Risk.The market valuation of mortgage loans payable could have an adverse impact on the Account’s performance. Valuations of mortgage loans payable are generally based on the amount at which the liability could be transferred in a current transaction, exclusive of transaction costs, and such valuations are subject to
a number of assumptions and factors with respect to the loan and the underlying property, a change in any of which could cause the value of a mortgage loan to fluctuate. In addition, the Account may not be able to transact at a price deemed to be attractive, if at all, which may inhibit the Account from pursuing its investment strategies or negatively impact the values of portfolio holdings. Further, an increase in interest rates or other adverse conditions (e.g., inflation/deflation, increased selling of fixed-income investments across other pooled investment vehicles or accounts, changes in investor perception or changes in government intervention in the markets) may lead to increased transaction activity by contract owners and increased portfolio turnover, which could reduce liquidity for certain Account investments, adversely affect values of portfolio holdings and increase the Account’s costs.
•Underlying Leverage Risk by Certain Portfolio Investments. Certain of the Account’s portfolio investments, including investments in certain REITs, joint ventures and real estate funds and other investment vehicles often utilize leverage in connection with their investment activity. Such leverage is generally not included in the Account’s loan-to-value calculation. In addition, higher amounts of leverage by such portfolio investments could cause the investments to lose money and negatively impact the Account's performance.
A general disruption in the credit markets, such as the disruption experienced in 2008 and 2009 or that caused by the COVID-19 pandemic in 2020, may aggravate some or all of these risks.
Investment and Cash Management Risks Associated with Contract Owner Transactions. The amount the Account has available to invest in new properties and other real estate-related assets will depend, in large part, on the level of net contract owner transfers into or out of the Account as well as contract owner premiums into the
17
Account. As noted elsewhere in this report, the Account intends to hold between 15% and 25% of its net assets in liquid, fixed-income investments. These liquid assets are intended to be used to satisfy contract owner redemption requests and meet the Account’s expense needs (including, from time to time, obligations on debt). Significant contract owner transaction activity into or out of the Account’s units is generally not predictable, and wide fluctuations can occur as a result of macroeconomic, geopolitical or market conditions (including market disruptions, volatility or downturns), the performance of equities or fixed income securities or general investor sentiment, regardless of the historical performance of the Account or of the performance of the real estate asset class generally. In the event that the Account were to experience significant net contract owner transfers out of the Account, such transfers can eventually cause the Account’s liquid, fixed-income investments to comprise less than 10% of the Account’s assets (on a net and total basis), as occurred over the course of 2021. As of December 31, 2021, the Account’s liquid, fixed-income investments comprised 7.9% of its net assets. Such situations could trigger the need to execute the TIAA liquidity guarantee. If a significant amount of net contract owner transfers out of the Account were to recur, particularly in high volumes, the Account may not have enough available liquid assets to pursue, or consummate, new investment opportunities presented to us that are otherwise attractive to the Account. This, in turn, could harm the Account’s returns. Even though the Account has over time experienced both net inflows (purchases) and net outflows (redemptions) of contract owner investments on an annual basis, there is no guarantee that net outflow or redemption activity will not increase, perhaps in a significant and rapid manner, particularly in response to market cycles in the domestic and foreign securities and commercial real estate markets and other factors.
Alternatively, periods of significant net transfer activity into the Account can result in the Account holding a higher percentage of its net assets in liquid, fixed-income investments than the Account’s managers would target to hold under the Account’s long-term strategy. At times, the portion of the Account’s net assets invested in these types of liquid instruments may exceed 25%, particularly if the Account receives a large inflow of money in a short period of time, coupled with a lack of attractive real estate-related investments on the market. Also, large inflows from contract owner transactions often occur in times of appreciating real estate values and pricing, which can render it challenging to execute on some transactions at ideal prices.
In an appreciating real estate market generally, a large percentage of assets held in liquid, fixed-income investments and not in real estate and real estate-related investments may impair the Account’s overall returns. This scenario may be exacerbated in a low interest rate environment for U.S. Treasury and Agency securities and other liquid, fixed-income investments. In addition, to manage cash flow, the Account may temporarily hold a higher percentage of its net assets in liquid real estate-related securities, such as REIT and CMBS securities, than its long-term targeted holdings in such securities, particularly during and immediately following times of significant net transfer activity into the Account. Such holdings could increase the volatility of the Account’s returns.
Joint OwnershipVenture Investment Risks. Investing in joint venture partnershipsventures or other forms of joint property ownership may involve special risks, many of which are exacerbated when the consent of parties other than the Account is required to take action.
•The co-venturer may have interests or goals inconsistent with those of the Account, including during times when a co-venturer may be experiencing financial difficulty. For example:
◦a co-venturer may desire a higher current income return on a particular investment than does the Account (which may be motivated by a longer-term investment horizon or exit strategy), or vice versa, which could cause difficulty in managing a particular asset;
◦a co-venturer may desire to maximize or minimize leverage in the venture, which may be at odds with the Account’s strategy;
◦a co-venturer may be more or less likely than the Account to agree to modify the terms of significant agreements (including loan agreements) binding the venture, or may significantly delay in reaching a determination whether to do so, each of which may frustrate the business objectives of the Account and/or lead to a default under a loan secured by a property owned by the venture; or
◦for reasons related to its own business strategy, a co-venturer may have different concentration standards as to its investments (geographically, by sector, or by tenant), which might frustrate the execution of the business plan for the joint venture.
18
•The co-venturer may be unable to fulfill its obligations (such as to fund its pro rata share of committed capital, expenditures or guarantee obligations of the venture) during the term of such agreement or may become insolvent or bankrupt, any of which could expose the Account to greater liabilities than expected and frustrate the investment objective of the venture.
•If a co-venturer doesn’tdoes not follow the Account’s instructions or adhere to the Account’s policies, the jointly owned properties, and consequently the Account, might be exposed to greater liabilities than expected.
•The Account may have limited rights with respect to the underlying property pursuant to the terms of the joint venture, including the right to operate, manage or dispose of a property, and a co-venturer could have approval rights over the marketing or the ultimate sale of the underlying property.
•The terms of the Account’s ventures often provide for complicated agreements which can impede our ability to direct the sale of the property owned by the venture at times the Account views most favorable. One such agreement is a buy-sell"buy-sell" right, which may force us to make a decision (either to buy our co-venturer’s interest or sell our interest to our co-venturer) at inopportune times.
•A co-venturer can make it harder for the Account to transfer its equity interest in the venture to a third party, which could adversely impact the valuation of the Account’s interest in the venture.
•To the extent the Account serves as the general partner or managing member in a venture, it may owe certain contractual or other duties to the co-venturer, including fiduciary duties, which may present perceived or actual conflicts of interest in the management of the underlying assets. Such an arrangement could also subject the Account to liability to third parties in the performance of its duties as a general partner or managing member.
•The venture may incur higher than normal levels of investment leverage, including levels that exceed the Account’s typical loan-to-value ratio.
•A partner that administratively operates a particular co-venture may not sufficiently assess and/or appropriately manage ESG-related criteria when acquiring and/or operating commercial real property, and any resulting ESG-related financial performance issues with the commercial property may have the potential in certain circumstances to negatively impact the value of, and subsequent investment returns on, the property.
Risks of Developing or Redeveloping Real Estate or Buying Recently Constructed Properties. If the Account chooses to develop or redevelop a property or buys a recently constructed property, it may face the following risks:
•There may be delays or unexpected increases in the cost of property development, redevelopment and construction due to strikes, bad weather, material shortages, increases in material and labor costs or other events.
•There are risks associated with potential underperformance or non-performance by, and/or solvency of a contractor we select or other third party vendors involved in developing or redeveloping the property.
•If the Account were viewed as developing or redeveloping underperforming properties, suffering losses on our investments, or defaulting on any loans on our properties, our reputation could be damaged. Damage to our
reputation could make it more difficult to successfully develop or acquire properties in the future and to continue to grow and expand our relationships with our lenders, venture partners and tenants.
•Because external factors may have changed from when the project was originally conceived (e.g., slower growth in the local economy, higher interest rates, overbuilding in the area, or changes in the regulatory and permitting environment), the property may not attract tenants on the schedule we originally planned and/or may not operate at the income and expense levels first projected.
Real Estate Regulatory Risks. Government regulation at the federal, state and local levels, including, without limitation, zoning laws, rent control or rent stabilization laws, laws regulating housing on the Account’s multifamilymulti-family and single family properties, the Americans with Disabilities Act, property taxes and fiscal, accounting, environmental or other government policies, could operate or change in a way that adversely affects the Account and its properties. For example, these regulations could raise the cost of acquiring, owning, improving or maintaining properties, present barriers to otherwise desirable investment opportunities or make it harder to sell, rent, finance, or refinance properties either on economically desirable terms, or at all, due to the increased costs associated with regulatory compliance.
19
In addition, some state and local municipal jurisdictions, such as New York City, Boston, MA, and Washington D.C. and the States of Washington and Colorado, have enacted legislation which compels building owners to meet standards for energy efficiency or carbon emission limits which may result in unplanned capital expenditures or require amendments to leases or other financial agreements with tenants (which represent a significant portion of building energy consumption) to improve building efficiency. If standards are not met, the Account could be subject to fines and/or other regulatory penalties that may impact the value of non-compliant building held in the Account’s portfolio. Additional state and local jurisdictions (including foreign jurisdictions where the Account could own commercial property) that have committed to achieve carbon reduction, clean energy standards and other ESG-related criteria may implement similar legislation impacting commercial real estate that could increase costs and negatively impact the performance of such properties in the Account’s portfolio where it may not be financially feasible to meet such standards.
Environmental Risks. How well a company manages its impacts on the natural environment can support longer-term sustainable growth, or present unmitigated costs and risks. The Account may be liable for damage to the environment or injury to individuals caused by hazardous substances used or found on its properties. Under various environmental regulations, the Account may also be liable, as a current or previous property owner or mortgagee, for the cost of removing or cleaning up hazardous substances found on a property, even if it did not know of and was not responsible for the hazardous substances. If any hazardous substances are present or the Account does not properly clean up any hazardous substances, or if the Account fails to comply with regulations requiring it to actively monitor the business activities on its premises, the Account may have difficulty selling or renting a property or be liable for monetary penalties. Further, environmental laws may impose restrictions on the manner in which a property may be used, the tenants which may be allowed, or the manner in which businesses may be operated, which may require the Account to expend funds in order to comply with these laws. These laws may also cause the most ideal use of the property to differ from that originally contemplated and as a result could impair the Account’s returns. The cost of any required clean-up relating to a single real estate investment (including remediating contaminated property) and the Account’s potential liability for environmental damage, including paying personal injury claims and performing under indemnification obligations to third parties, could exceed the value of the Account’s investment in a property, the property’s value, or in an extreme case, a significant portion of the Account’s assets. Finally, while the Account may from time to time acquire third-party insurance related to environmental risks, such insurance coverage may be inadequate to cover the full cost of any loss and would cause the Account to be reliant on the financial health of our third-party insurer at the time any such claim is submitted.
Uninsurable LossesLoss Risks. Certain catastrophic losses (e.g.(e.g., from earthquakes, wars, terrorist acts, nuclear accidents, hurricanes, wind,tsunamis, high winds, wildfires, inland or coastal floods, rising sea levels or environmental or industrial hazards or accidents) may be uninsurable or so expensive to insure against that it is economically disadvantageous to buy insurance for them. Further, the terms and conditions of the insurance coverage the Account has on its properties, in conjunction with the type of loss actually suffered at a property, may subject the property, or the Account as a whole, to a cap on insurance proceeds that is less than the loss or losses suffered. If a disaster that we have not insured against occurs, if the insurance contains a high deductible, and/or if the aggregate insurance proceeds for a particular type of casualty are capped, the Account could lose some of its original investment and any future profits from the property. Also, the Account may not have sufficient access to internal or external sources of funding to repair or reconstruct a damaged property to the extent insurance proceeds do not cover the full loss. In addition, some leases may permit a tenant to terminate its obligations in certain situations, regardless of whether those events are fully covered by insurance. In that case, the Account would not receive rental income from the property while that tenant’s space is vacant, and any such vacancy might impact the value of that property. Finally, as with respect to all third-party insurance, we arethe Account is reliant on the continued financial health of such insurers and their ability to pay on valid claims. If the financial health of an insurer were to deteriorate quickly, we
the Account may not be able to find adequate coverage from another carrier on favorable terms, which could adversely impact the Account’s investment returns.
Physical Climate Change Related Financial Risks. Many of the Account’s commercial properties are located within geographical regions in the United States and likely foreign jurisdictions in the future that currently are, and in the future will continue to be, affected by increasingly severe and adverse weather conditions across the globe, including, among others, earthquakes, hurricanes, tsunamis, high winds, wildfires, changes in rainfall patterns,
20
inland or coastal flooding, and rising sea levels. Impacts from climate change may include significant risks to global financial assets and economic growth. As regions experience changes to the climate and extreme weather events become more frequent and intense, commercial real estate assets within the Account that are located in such regions could be adversely impacted by direct damage to buildings and other improvements thereon and result in loss of revenue, the incurrence of unplanned capital and other expenses not covered by insurance, and increase operating expenses for such properties, including utility, insurance and maintenance costs. Climate related changes and resulting hazards may stress local populations (including as a result of malnutrition, mortality and population migration), real estate financing and operational systems, and local infrastructure to the point where such changes and hazards negatively impact local market attractiveness of such properties as investments, rental market growth, and ultimately decrease demand for and value of commercial real estate in such regions. Any resulting losses from such climate changes and hazards could adversely impact the Account’s investment returns; however, should climate change assumptions be incorrect it may result in the Account forgoing investments that may have ultimately been beneficial to the Account.
Climate Change Transition Risks. Climate change poses long-term risks to investments that should be assessed and mitigated. Risks fall into two primary categories, as outlined with the Task Force on Climate related Financials Disclosures (“TCFD”):
•Physical Risk; and
•Low Carbon Transition Related Risks: Transitioning to a low-carbon economy may entail extensive policy, legal, regulatory, technology and market changes as public and private organizations and institutions attempt to mitigate and adapt to climate change. Depending on the nature, speed and focus of these changes, transition risks may pose varying levels of financial and reputational risk to organizations and, by definition, also to their investors and portfolio assets (such as those held by the Account). While transition risk is relevant across sectors, it is likely to be especially severe for carbon-intensive industries. The Account will attempt to develop a specific pathway to achieve net zero carbon impact across its portfolio properties (“Net Zero Carbon”) in order to mitigate financial risk associated with the transition to a low-carbon economy as part of what TIAA believes is its fiduciary responsibility to mitigate risk in the Account’s portfolio and enhance the financial performance for the Account’s real estate investments. Given the long-term nature of commercial real estate investments, TIAA will target to protect and enhance the value of the Account’s commercial real estate investments by achieving Net Zero Carbon prior to the time period where a commercial real estate investment may become obsolete or illiquid if it cannot reasonably reduce emissions to meet required standards. TIAA will continue to ensure that all portfolio investment decisions for the Account with regard to Net Zero Carbon are based on expected financial performance, taking into account potential risks to asset value or liquidity, and opportunities to improve performance through improvements to commercial real estate properties held by the Account that reduce energy use and carbon emissions and thus decrease long-term costs for the Account.
ESG Criteria Risks. Management of the Account looks to utilize industry recognized environmental, social and governance (ESG) criteria in its commercial real estate underwriting given TIAA’s view that the application of such criteria, as part of the underwriting process, is beneficial in achieving positive long-term returns for the Account. In its evaluation of commercial real estate opportunities, the Account will take ESG considerations into account as part of the financial assessment of a commercial real estate portfolio asset, and not to achieve a desired outcome or as an investment qualification or screen. Ultimately, the Account will make an investment decision that incorporates ESG criteria only to the extent that the criteria is reasonably expected to enhance the ability to achieve desired returns for the Account. However, the Account's utilization of ESG criteria in its commercial real estate underwriting may, if economic risk or financial opportunity projections do not materialize in the way we have anticipated, result in the Account forgoing some commercial real estate market opportunities that could have ultimately been beneficial to the Account. Consequently, the Account may underperform other investment vehicles that do not utilize such ESG criteria in selecting portfolio properties.
21
Foreign Real Property Investment Risks. Investment in foreign commercial real properties, foreign real estate loans, and foreign debt investments may present the following special risks:
•The value of foreign investments or rental income can increase or decrease due to changes or fluctuations in foreign currency exchange rates, imposition of currency exchange control or market control regulations, possible expropriation or confiscatory taxation, political, social, diplomatic and economic developments and foreign regulations. The Account translates into U.S. dollars purchases and sales of securities, income receipts and expense payments made in foreign currencies at the exchange rates prevailing on the respective dates of the transactions. The effect of any changes in currency exchange rates on foreign debt investments and loans payable is included in the Account’s net realized and unrealized gains and losses. As such, fluctuations in currency exchange rates, even if hedged, may impair or reduce the Account’s returns and result in poorer overall performance of the Account than if it had not acquired such foreign investments or entered into any foreign currency hedging transactions.
•In managing any domestic or foreign commercial real property investments, the Account may, but is not required to, use or enter into forward currency contracts and foreign currency swaps, and may buy or sell put and call options and futures contracts on foreign currencies as well as other types of derivatives transactions (including interest rate swaps and options, futures contracts or swaps) in order to hedge against the risks of currency or exchange rate uncertainties, interest rate uncertainties and foreign currency or market fluctuations impacting the Account’s domestic or foreign real estate investments. Changes in exchange rates and exchange control regulations or interest rates may increase or reduce the value of domestic or foreign real estate investments. Currency hedging, interest rate hedging and similar transactions involve special risks and may limit potential gains due to increases in a currency’s value or changes in interest rates. Unanticipated changes in interest rates, domestic or foreign securities prices or currency exchange rates may result in poorer overall performance of the Account than if it had not entered into any such currency-related or interest rate-related hedging transactions for such real property investments. In addition, the Account could incur additional costs of paying hedge unwind fees, if it has to terminate cross-currency or interest rate swaps, futures contracts or options prematurely due to early repayment of domestic or foreign mortgage loans related to such properties. The Account does not intend to speculate in foreign currency exchange transactions, forward currency contracts, interest rate options, futures contracts or swaps or other types of hedging transactions related to its portfolio of domestic or foreign real property investments.
•Non-U.S. jurisdictions may impose withholding taxes on the Account as a result of its investment activity in that jurisdiction. TIAA may be eligible for a foreign tax credit in respect of such tax paid by the Account and such credit (if available to TIAA) would be reimbursed to the Account. However, there may be circumstances where TIAA is unable to receive some or all of the benefit of a foreign tax credit and the Account would thus not receive reimbursement, which could harm the value of the Account’s units.
•Foreign real estate markets may have different liquidity and volatility attributes than U.S. markets.
•The regulatory environment in non-U.S. jurisdictions may disfavor owners and operators of real estate investment properties, resulting in less predictable and/or economically harmful outcomes if the Account were to face a significant dispute with a tenant or with a regulator itself.
•The Account may be subject to increased risk of regulatory scrutiny pursuant to U.S. federal statutes, such as the Foreign Corrupt Practices Act, which, among other things, requires robust compliance and oversight programs to help prevent violations. The costs associated with maintaining such programs, in addition to costs associated with a potential regulatory inquiry, could impair the Account’s returns and divert management’s attention from other Account activities.
•It may be more difficult for the Account to obtain and collect a judgment on foreign investments than on domestic investments, and the costs to the Account that are associated with contesting claims relating to foreign investments may exceed those costs associated with a similar claim on domestic investments.
22
RISKS OF INVESTING IN REAL ESTATE INVESTMENT TRUST (REIT) SECURITIES
The Account investsmay invest in registered and unregistered REIT securities for diversification, liquidity management and other purposes. The Account’s investment in REITs may also increase, as a percentage of net assets, during periods in which the Account is experiencing large net inflow activity, in particular due to net participantcontract owner transfers into the Account. As of December 31, 2017,2021, the Account did not hold any REIT securities comprised approximately 5.0% of the Account’s net assets.securities. Investments in REIT securities are part of the Account’s real estate-related investment strategy and are subject to many of the same general risks associated with direct real property ownership. In particular, equity REITs may be affected by changes in the value of the underlying properties owned by the entity, while mortgage REITs may be affected by the quality of any credit extended. Moreover, changes in consumer behavior that affect the use of commercial spaces could negatively impact the value of properties underlying certain REITs. In addition to these risks, because REIT investments are securities and generally publicly traded, they may be exposed to market risk and potentially significant price volatility due to changing conditions in the financial markets and, in particular, changes in overall interest rates, regardless of the value of the underlying real estate such REIT may own. In general, during periods of high interest rates, REITs may lose some of their appeal for investors who may be able to obtain higher yields from other income-producing investments, such as long-term bonds. Rising interest rates generally increase the cost of financing for real estate projects, which could cause the value of an equity REIT to decline. During periods of declining interest rates, mortgagors may elect to prepay mortgages held by mortgage REITs, which could lower or diminish the yield on the REIT. Also, sales of REIT securities by the Account for liquidity management purposes may occur at times when values of such securities have declined and it is otherwise an inopportune time to sell the security. Volatility in REITs can cause significant fluctuations in the Account’s AUV on a daily basis, as they are correlated to equity markets which have experienced significant day to day fluctuations over the past few years.
Finally, certain REITs may be self-liquidating in that a specific term of existence is provided for in their trust document. In acquiring the securities of REITs, the Account runs the risk that it will sell them at an inopportune time. REITs do not pay federal income taxes if they distribute most of their earnings to their shareholders and meet other tax requirements. Many of the requirements to qualify as a REIT, however, are highly technical and complex. Failure to qualify as a REIT results in tax consequences, as well as disqualification from operating as a REIT for a period of time. Consequently, if the Account invests in securities of a REIT that later fails to qualify as a REIT, this may adversely affect the performance of our investment.
RISKS OF MORTGAGE-BACKED SECURITIES
The Account from time to time has invested in mortgage-backed securities and may in the future invest in such securities. Mortgage-backed securities, such as CMBS and RMBS, are subject to many of the same general risks inherent in real estate investing, making mortgage loans and investing in debt securities. The underlying mortgage loans may experience defaults with greater frequency than projected when such mortgages were underwritten, which would impact the values of these securities, and could hamper our ability to sell such securities. In particular, these types of investments may be subject to prepayment risk or extension risk (i.e.(i.e., the risk that borrowers will repay the loans earlier or later than anticipated). If the underlying mortgage assets experience faster than anticipated prepayments of principal, the Account could fail to recoup some or all of its initial investment in these securities, since the original price paid by the Account was based in part on assumptions regarding the receipt of interest payments. If the underlying mortgage assets are repaid later than anticipated, the Account could lose the opportunity to reinvest the anticipated cash flows at a time when interest rates might be rising. The rate of prepayments depends on a variety of geographic, social and other functions, including prevailing market interest rates and general economic factors. Further, it is possible that issuers of U.S. Government Securities will not have the funds to meet their payment obligations in the future, and the U.S. governmentGovernment may change its support of, and policies regarding, Fannie Mae and Freddie Mac, Fannie Mae and thus,Freddie Mac have been operating under conservatorship, with the Account may be unableFederal Housing Finance Administration (“FHFA”) acting as their conservator, since September 2008. The entities are dependent upon the continued support of the U.S. Department of the Treasury and FHFA in order to acquire agency mortgage-backed securities incontinue their business operations. These factors, among others, could affect the future status and evenrole of Fannie Mae and Freddie Mac and the value of their securities and the securities which they guarantee. Even if the Account so acquired them,such securities, such changes may result inhave a negative effect on the pricing of such securities. Other policy changes impacting Fannie Mae and Freddie Mac and/or U.S. governmentGovernment programs related to mortgages that may be implemented in the future could create market uncertainty and affect the actual or perceived credit quality of issued securities, adversely affecting mortgage-backed securities through an increased risk of loss.
23
Importantly, the fair market value of these securities is also highly sensitive to changes in interest rates, liquidity of the secondary market and economic conditions impacting financial institutions and the credit markets generally. Note that the potential for appreciation, which could otherwise be expected to result from a decline in interest rates, may be limited by any increased prepayments. Further, volatility and disruption in the mortgage market and credit markets generally (such as was the case in 2008 and 2009) may cause there to be a very limited or even no secondary market for these securities and they therefore may be harder to sell than other securities.
RISKS OF INVESTING IN MORTGAGE LOANS AND RELATED INVESTMENTS
The Account’s investment strategy includes, to a limited extent, investments in mortgage loans (i.e., the Account serving as lender).
General Risks of Mortgage Loans. The Account will be subject to the risks inherent in making mortgage loans, including:
•The borrower may default on the loan, requiring that the Account foreclose on the underlying property to protect the value of its mortgage loan. Since its mortgage loans are usually non-recourse, the Account must rely solely on the value of a property for its security. In addition, there is a risk of delay in exercising any contractual remedies due to actions of the borrower, including, without limitation, bankruptcy or insolvency of the borrower.
•The larger the mortgage loan compared to the value of the property securing it, the greater the loan’s risk. Upon default, the Account may not be able to sell the property for its estimated or appraised value. Also, certain liens on the property, such as mechanic’s or tax liens, may have priority over the Account’s security interest.
•A deterioration in the financial condition of tenants, which could be caused by general or local economic conditions or other factors beyond the control of the Account, or the bankruptcy or insolvency of a major tenant, may adversely affect the income of a property, which could increase the likelihood that the borrower will default under its obligations.
•The borrower may be unable to make a lump sum principal payment due under a mortgage loan at the end of the loan term, unless it can refinance the mortgage loan with another lender.
•If interest rates are volatile during the loan period, the Account’s variable-ratevariable rate mortgage loans could have volatile yields. Further, to the extent the Account makes mortgage loans with fixed interest rates, it may receive lower yields than that which is then available in the market if interest rates rise generally.
Interest Rate Risk. The risk that the value or yield of fixed-income investments may decline if interest rates change. In general, when prevailing interest rates decline, the market values of outstanding fixed-income investments (particularly those paying a fixed rate of interest) tend to increase while yields on similar newly issued fixed-income investments tend to decrease, which could adversely affect the Account’s income. Conversely, when prevailing interest rates increase, the market values of outstanding fixed-income investments (particularly those paying a fixed rate of interest) tend to decline while yields on similar newly issued fixed-incomefixed income investments tend to increase. If a fixed-income investment pays a floating or variable rate of interest, changes in prevailing interest rates may increase or decrease the investment’s yield. Fixed-income investments with longer durations tend to be more sensitive to interest rate changes than shorter-term investments. Interest rate risk is generally heightened during periods when prevailing interest rates are low or negative. During periods of very low or negative interest rates, a fixed-income investment may not be able to maintain positive returns. As of December 31, 2021, interest rates in the United States and in certain foreign markets have risen from historic low levels. In general, changing interest rates could have unpredictable effects on the markets and may expose fixed-income and related markets to heightened volatility. A wide variety of factors can cause interest rates to rise (e.g., central bank monetary policies, inflation rates, or general economic conditions). Additional interest rate-related risk include the following:
•London Interbank Offered Rate (“LIBOR”) Risks. LIBOR is an average interest rate, determined by the ICE Benchmark Administration, that banks charge one another for the use of short-term money. Certain instruments in which the Account may invest are subject to rates that are tied to a specific interest rate, such as LIBOR. The United Kingdom’s Financial Conduct Authority, which regulates LIBOR, has announced that the FCA will no longer persuade nor compel banks to submit rates for the calculation of LIBOR after 2021. On March 5, 2021, the FCA announced that all LIBOR settings will either cease to be provided by any administrator, or no longer
24
be representative immediately after December 31, 2021, for all four LIBOR settings (British Pound (“GBP”), Euro, Swiss Franc and Japanese Yen) and one-week and two-month U.S. dollar LIBOR settings, and immediately after June 30, 2023 for the remaining U.S. dollar LIBOR settings, including three-month U.S. dollar LIBOR. At this time, no consensus exists as to what rate or rates will become accepted alternatives to LIBOR, although the Alternative Reference Rates Committee, a steering committee convened by the Board of Governors of the Federal Reserve System and the Federal Reserve Bank of New York and comprised of large U.S. financial institutions, has recommended the use of the Secured Overnight Financing Rate (“SOFR”), which is intended to replace U.S. dollar LIBOR and measures the cost of overnight borrowings through repurchase agreement transactions collateralized with U.S. Treasury securities. Another potential replacement rate is the Sterling Overnight Index Average Rate (“SONIA”), which is intended to replace GBP LIBOR and measures the overnight interest rate paid by banks for unsecured transactions in the sterling market. Other replacement rates could be adopted by market participants. Although the transition process away from LIBOR has become increasingly well-defined in advance of the anticipated discontinuation date, there remains uncertainty regarding the future utilization of LIBOR and the nature of any replacement rate. Any potential effects of the transition away from LIBOR on the Account or on certain instruments in which the Account invests can be difficult to ascertain, and they may vary depending on factors that include, but are not limited to: (i) existing fallback or termination provisions in individual contracts and (ii) whether, how, and when industry participants develop and adopt new reference rates and fallbacks for both legacy and new products and instruments. In addition, interest rate provisions included in such contracts may need to be renegotiated in contemplation of the transition away from LIBOR. The transition may also result in a reduction in the value of certain instruments held by the Account or a reduction in the effectiveness of related Account transactions such as currency or other hedges. In addition, an instrument’s transition to a replacement rate could result in variations in the reported yields of such instrument held by the Account. The usefulness of LIBOR as a benchmark could deteriorate during the transition period and, at this time, it is not possible to predict the effect of the establishment of SOFR, SONIA or any other replacement rates or any other reforms to LIBOR. Any such effects of the transition away from LIBOR, as well as other unforeseen effects, could result in losses to the Account; and
•Negative Interest Rate Risk. Certain European countries and Japan have pursued negative interest rate policies, the consequences of which are uncertain. In response to recent volatility and economic uncertainty, the U.S. government and certain foreign central banks have taken steps to stabilize markets by, among other things, reducing interest rates. A negative interest rate policy is an unconventional central bank monetary policy tool where nominal target interest rates are set with a negative value (i.e., below zero percent) intended to help create self-sustaining growth in the local economy. If a bank charges negative interest, instead of receiving interest on deposits, a depositor must pay the bank fees to keep money with the bank. As a result, certain debt instruments have recently begun to trade at negative yields, which means the purchaser of the instrument may receive at maturity less than the total amount invested. Negative interest rates may become more prevalent among foreign (non-U.S.) issuers, and potentially within the United States. These market conditions may increase the Account’s exposure to the risks associated with rising interest rates. A wide variety of factors can cause interest rates or yields of U.S. Treasury securities (or yields of other types of bonds) to rise. This is especially true under current market conditions because, as of December 31, 2021, interest rates in the United States and in certain foreign markets are at low levels. Thus, the Account currently faces a heightened level of risk associated with rising interest rates. This could be driven by a variety of factors, including, but not limited, to central bank monetary policies, changing inflation or real growth rates, general economic conditions, increasing bond issuances or reduced market demand for low yielding investments. To the extent the Federal Reserve Board continues to raise interest rates, there is a risk that rates across the financial system may rise. To the extent the Account has a bank deposit or holds a debt or mortgage instrument with a negative interest rate to maturity, the Account would generate a negative return on that investment. A number of factors may contribute to debt instruments trading at a negative yield. While negative yields can be expected to reduce demand for fixed-income investments trading at a negative interest rate, investors may be willing to continue to purchase such investments for a number of reasons including, but not limited to, price insensitivity, arbitrage opportunities across fixed-income markets, rules-based investment strategies, capital preservation, reduced volatility, or decreased investment opportunities. If negative interest rates become more prevalent in the market, it is
25
expected that investors will seek to reallocate assets to other income-producing assets such as investment-grade and high-yield debt instruments, or equity investments that pay a dividend. This increased demand for higher yielding assets may cause the price of such instruments to rise while triggering a corresponding decrease in yield and the value of debt instruments over time. In addition, a move to higher yielding investments may cause investors, including the Account, to seek fixed-income investments with longer duration and/or potentially reduced credit quality in order to seek the desired level of yield. These considerations may limit the Account’s ability to locate fixed-income instruments containing the desired risk/return profile. Changing interest rates, including, but not limited to, rates that fall below zero, could have unpredictable effects on the markets and may expose fixed-income and related markets to heightened volatility and potential illiquidity, increasing the potential for losses for the Account.
Extension Risk. The risk that during periods of rising interest rates, borrowers pay off their mortgage loans later than expected, preventing the Account from reinvesting principal proceeds at higher interest rates, resulting in less income than potentially available. These risks are normally present in mortgage- backedmortgage-backed securities and other asset-backed securities.ABS. For example, homeowners have the option to prepay their mortgages. Therefore, the duration of a security backed by home mortgages can lengthen depending on homeowner prepayment activity. A decline in the prepayment rate and the resulting increase in duration of fixed-income securities held by the Account can result in losses to the Account.
Prepayment Risks. Risk. The Account’s mortgage loan investments will usually be subject to the risk that the borrower repays a loan early. Also, the Account may be unable to reinvest the proceeds at as high an interest rate as the original mortgage loan rate, resulting in a decline in income. These risks are normally present in mortgage-backed securities and other ABS. For example, homeowners have the option to prepay their mortgages. Therefore, the duration of a security backed by home mortgages can shorten depending on homeowner prepayment activity. A rise in the prepayment rate and the resulting decline in duration of fixed-income securities held by the Account can result in losses to investors in the Account.
Interest Limitations. The interest rate we charge on mortgage loans may inadvertently violate state usury laws that limit rates, if, for example, state law changes during the loan term. If this happens, the Account could incur penalties or may be unable to enforce payment of the loan.
Risks of Investing in Domestic and Foreign MezzanineDebt or Loans.The Account may invest from time to time in domestic and foreign (including U.K.) mezzanine and other debts or loans to entities which own real estate assets. Generally these loans will be secured by a pledge of the equity securities of the entity, but not by a first lien security interest in the property itself. As such, the Account’s recovery in the event of an adverse circumstance at the property (such as a default under a mortgage loan on the property) will be subordinated to the recovery available to the first lien mortgage lender(s) to the property. The Account’s remedy may solely consist of foreclosing on the equity interest in the entity owning the property, and that equity interest will be junior in right of a recovery to a loan secured by the property owned by the entity. Also, as a subordinated lender, the Account may have limited rights to exercise control over the process by which the mortgage loan is restructured or the property is liquidated following a default. Any of these circumstances may result in the Account being unable to recover some or all of its original investment.
Risks of Currency Hedging Strategies for Domestic and Foreign Mezzanine Loans. Loans and Securities. In managing any domestic or foreign (including U.K.) mezzanine debt or other domestic or foreign debt,loans, securities or real estate, the Account may use or enter into forward currency contracts and foreign currency swaps, and may buy or sell put and call options and futures contracts on foreign currencies as well as other types of derivatives transactions (including interest rate swaps and options, futures contracts or swaps) in order to hedge against the risks of exchange rate uncertainties, interest rate uncertainties and foreign currency or market fluctuations impacting the Account’s domestic or foreign portfolioloans, securities and real estate investments. Changes in exchange rates and exchange control regulations or interest rates may increase or reduce the value of domestic or foreign (including U.K.) mezzanine debt or other debt.types of loans,securities and real estate. Currency hedging, interest rate hedging and similar transactions involve special risks and may limit potential gains due to increases in a currency’s value.value or changes in interest rates. Unanticipated changes in interest rates, domestic or foreign securities prices or currency exchange rates may result in poorer overall performance of the Account than if it had not entered into any such currency-related transactions.or interest rate-related hedging transactions for such loans and securities. In addition, the Account could incur additional costs of paying hedge unwind fees, if it
26
has to terminate cross-currency or interest rate swaps, futures contracts or options prematurely due to early repayment of domestic or foreign mezzanine or other foreign debt.debt or securities. The Account does not intend to speculate in foreign currency exchange transactions, or forward currency contracts.contracts, interest rate options, futures contracts or swaps or other types of hedging transactions relating to its portfolio of domestic and foreign loans and securities.
Risks of Participations. To the extent the Account invested in a participating mortgage, the following additional risks would apply:
◦The participation feature, in tying the Account’s returns to the performance of the underlying asset, might generate insufficient returns to make up for the higher interest rate the loan would have obtained without the participation feature.
◦In very limited circumstances, a court may characterize the Account’s participation interest as a partnership or joint venture with the borrower and the Account could lose the priority of its security interest or become liable for the borrower’s debts.
RISKS OF U.S. GOVERNMENT AND GOVERNMENT AGENCY SECURITIES LENDINGAND CORPORATE OBLIGATIONS
It is possible that issuers of U.S. Government securities will not have the funds to meet their payment obligations in the investmentfuture. Federal Home Loan Mortgage Corp. (“FHLMC”) and Federal National Mortgage Association (“FNMA”) have been operating under conservatorship, with the FHFA acting as their conservator, since September 2008. The FHFA and U.S. Presidential administration have made public statements regarding plans to consider ending the conservatorships. In the event that FHLMC or FNMA are taken out of collateralconservatorships, it is unclear how their respective capital structure would be constructed and what impact, if any, there would be on FHLMC’s or FNMA’s creditworthiness and guarantees of certain mortgage-backed securities. The entities are dependent upon the continued support of the U.S. Department of the Treasury and FHFA in order to continue their business operations. These factors, among others, could affect the future status and role of FHLMC and FNMA and the riskvalue of their securities and the borrower or Agentsecurities which they guarantee.
Uncertainty regarding the status of negotiations in the U.S. Congress to increase the statutory debt ceiling may default on its contractual obligations to the Account. Each Agent bearsincrease the risk that the borrowerU.S. Government may default on payments on certain U.S. Government securities, including those held by the Account.
In addition, the Account may invest in corporate obligations (such as commercial paper and other types of corporate debt obligations) and while the Account seeks out such holdings in short-term or intermediate-term, higher-quality liquid instruments, the ability of the Account to sell these securities may be uncertain, particularly when there are general dislocations in the finance or credit markets. Any such volatility could have a negative impact on the value of these securities. Further, transaction activity may fluctuate significantly from time to time, which could impair the Account’s ability to dispose of a security at a favorable time, regardless of the credit quality of the underlying issuer. Also, inherent with investing in any corporate obligation is the risk that the credit quality of the issuer will deteriorate, which could cause the obligations to be downgraded and hamper the value or the liquidity of these
27
securities. Finally, any further downgrades or threatened downgrades of the credit rating for U.S. Government obligations generally could impact the pricing and liquidity of agency securities or corporate obligations in a manner which could impact the value of the Account’s units. On one occasion, the long-term credit rating of the United States has been downgraded by at least one leading rating agency as a result of disagreements within the U.S. Government over raising the debt ceiling to repay outstanding obligations. Similar situations in the future could result in higher interest rates, lower prices of U.S. Treasury securities and increase the costs of various kinds of debt, which may adversely affect the Account.
RISKS OF LIQUID, FIXED-INCOME INVESTMENTS
The Account’s investments in liquid, fixed-income investments, whether real estate-related securities (such as REITs, CMBS or some loans receivable) or non real estate-related securities (such as ABS, MBS, RMBS, CLOs, CMOs, CDOs, cash equivalents, municipal bond securities, other domestic and foreign government and corporate securities and structured securities), and whether debt or equity, are subject to the following general risks:
Issuer Risk (often called Financial Risk). The risk that an issuer’s earnings or revenue prospects and overall financial position will deteriorate (or be perceived to deteriorate by market participants, rating agencies, pricing services or otherwise), causing a decline in the value of the issuer’s financial instruments over short or extended periods of time. In times of market turmoil, perceptions of an issuer’s credit risk can quickly change and even large, well-established issuers may deteriorate rapidly with little or no warning.
Credit Risk. The risk that the issuer of the fixed-income investments may not be able or willing to meet interest or principal payments when the payments become due, or, in the case of structured securities, the risk that the underlying collateral for the security may be insufficient to support such interest or principal payments, thereby causing a loss to the Account on the investment. Credit risk is heightened in times of market turmoil when perceptions of an issuer’s credit risk can quickly change and even large, well-established issuers and/or governments or, in the case of structured securities, higher quality underlying collateral for the security, may deteriorate rapidly with little or no warning.
Credit Spread Risk. The risk that credit spreads (i.e., the difference in yield between securities that is due to differences in each security’s respective credit quality) may increase when market participants believe that bonds generally have a greater risk of default. Increasing credit spreads may reduce the market values of the Account’s securities. Credit spreads often increase more for lower-rated and unrated securities than for investment-grade securities. In addition, when credit spreads increase, reductions in market value will generally be greater for longer-maturity securities.
Market Volatility, Liquidity and Valuation Risk. The risk that volatile or dramatic reductions in trading activity, or the cessation of trading at any time, whether due to general market turmoil, limited dealer capacity, problems experienced by a single company or a market sector, or other factors, such as natural disasters or public emergencies (pandemics and epidemics), in securities markets make it difficult for the Account to properly value its obligationinvestments. In such situations, the Account may not be able to returnpurchase or sell a securities investment at an attractive price, if at all. This risk is particularly acute to the loanedextent the Account holds equity securities, which have experienced significant short-term price volatility in recent years.
Interest Rate Risk. The risk that increases or volatility in interest rates can cause the prices of certain fixed-income investments to decline. This risk is heightened to the extent the Account invests in fixed-income investments and during periods when prevailing interest rates are low. Periods of very low or negative interest rates may challenge the Account’s ability to maintain positive returns. As of December 31, 2021, interest rates in the United States and in certain foreign markets have risen recently from historic low levels in anticipation of tightening monetary policy by central banks, which may increase the Account’s exposure to risks associated with rising interest rates. In general, changing interest rates could have unpredictable effects on the markets and may expose fixed-income and related markets to heightened volatility. A wide variety of factors can cause interest rates to rise (e.g., central bank monetary policies, inflation rates, or general economic conditions).
Downgrade Risk. The risk that securities are subsequently downgraded should TIAA and/or rating agencies believe the issuer’s business outlook or creditworthiness has deteriorated. If this occurs, the values of these investments may
28
decline, or it may affect the issuer’s ability to raise additional capital for operational or financial purposes and increase the chance of default, as a downgrade may be seen in the financial markets as a signal of an issuer’s deteriorating financial position.
Income Volatility Risk. Income volatility refers to the degree and speed with which changes in prevailing market interest rates diminish the level of current income from the Account’s portfolio of fixed-income securities. The risk of income volatility is that the level of current income from a portfolio of fixed-income securities may decline in certain interest rate environments.
Call Risk. The risk that an issuer will redeem a fixed-income investment prior to maturity. This often happens when prevailing interest rates are lower than the rate specified for the fixed-income investment. If a fixed-income investment is called early, the Account may not be able to benefit fully from the increase in value that other fixed-income investments experience when interest rates decline. Additionally, the Account would likely have to reinvest the payoff proceeds at current yields, which are likely to be lower than the fixed-income investment in which the Account originally invested, resulting in a decline in income.
Prepayment Risk. The risk that, during periods of falling interest rates, borrowers may pay off their loans sooner than expected, forcing the Account to reinvest the unanticipated proceeds at lower interest rates, resulting in a decline in income. These risks are normally present in mortgage-backed securities and other asset-backed securities. For example, borrowers have the option to prepay their mortgages. Therefore, the duration of a security backed by home mortgages can shorten depending on borrower prepayment activity. A rise in the prepayment rate and the resulting decline in duration of fixed-income securities held by the Account can result in losses to the Account.
Extension Risk. The risk that, during periods of rising interest rates, borrowers may pay off their mortgage loans later than expected, preventing a Fund from reinvesting principal proceeds at higher interest rates, resulting in less income than potentially available. These risks are normally present in mortgage-backed securities and other asset-backed securities. For example, homeowners have the option to prepay their mortgages. Therefore, the duration of a security backed by home mortgages can lengthen depending on homeowner prepayment activity. A decline in the prepayment rate and the resulting increase in duration of fixed-income securities held by the Account can result in losses to the Account.
U.S. Government Securities Risk. Securities issued by the U.S. Government or one of its agencies or instrumentalities may receive varying levels of support from the U.S. Government, which could affect the Account’s ability to recover should they default. Therefore, securities issued by U.S. Government agencies or instrumentalities that are not backed by the full faith and credit of the U.S. Government may involve increased risk of loss of principal and interest. In addition, the value of U.S. Government securities may be affected by changes in the credit rating of the U.S. Government. To the extent the Account invests significantly in securities issued or guaranteed by the U.S. Government or its agencies or instrumentalities, any market movements, regulatory changes or changes in political or economic conditions that affect the securities of the U.S. Government or its agencies or instrumentalities in which the Account invests may have a significant impact on the Account’s performance. Events that would adversely affect the market prices of securities issued or guaranteed by one U.S. Government agency or instrumentality may adversely affect the market prices of securities issued or guaranteed by other agencies or instrumentalities.
State and Municipal Investment Risk. Events affecting states and municipalities may adversely affect the Account’s investments and its performance. These events may include severe financial difficulties and continued budget deficits, economic or political policy changes, tax base erosion, state constitutional limits on tax increases, and changes in the credit ratings assigned to state and municipal issuers of debt instruments that the Account may hold. Since 2008, many states and municipalities have experienced—and continue to experience—severe financial difficulties. As a result, the economies and fiscal condition of these states and municipalities have deteriorated significantly as a result of a number of economic and other factors, including continued state and local housing crises, high unemployment levels, a drop in tax revenue and periods of larger national economic slowdown. The continued deterioration of state and municipal economies has resulted in large state and municipal budget deficits and it is unclear at this time when and how states and municipalities will close their budget gaps or how those
29
solutions might affect state or municipal governments. A negative change in any one of these or other areas could affect the ability of state or municipal issuers to meet their debt obligations and result in losses to the Account.
Foreign Securities Investment Risk. Foreign investments, which may include securities of foreign issuers, securities or contracts traded or acquired in non-U.S. markets or on non-U.S. exchanges, or securities or contracts payable or denominated in non-U.S. currencies, can involve special risks that arise from one or more of the following events or circumstances: (1) changes in currency exchange rates; (2) possible imposition of market controls or currency exchange controls; (3) possible imposition of withholding taxes on dividends and interest; (4) possible seizure, expropriation or nationalization of assets; (5) more limited financial information or difficulties interpreting it because of foreign regulations and accounting standards; (6) lower liquidity and higher volatility in some foreign markets; (7) the impact of political, social or diplomatic events; (8) economic sanctions or other measures by the United States or other governments; (9) the difficulty of evaluating some foreign economic trends; and (10) the possibility that a foreign government could restrict an issuer from paying principal and interest to investors outside the country. Brokerage commissions and custodial and transaction costs are often higher for foreign investments, and it may be difficult for the Account to use foreign laws and courts to enforce financial or legal obligations. Foreign investments may also be subject to risk of loss because of more or less foreign government regulation, less public information, and less stringent investor protections and disclosure standards.
Emerging Markets Risk. The risk of foreign investment often increases in countries with emerging markets. For example, these countries may have more unstable governments than developed countries, and their economies may be based on only a few industries. Emerging markets countries may also have less stringent regulation of accounting, auditing, financial reporting, and recordkeeping requirements, which could affect the Account’s ability to evaluate potential investments. Because their financial markets may be very small, share prices of financial instruments in emerging market countries may be volatile and difficult to determine. Financial instruments of issuers in these countries may have lower overall liquidity than those of issuers in more developed countries. In addition, foreign investors such as the Agent is contractually obligatedAccount are subject to indemnifya variety of special restrictions in many emerging market countries. The risks outlined above are often more pronounced in “frontier markets” in which the Account may invest. Moreover, legal remedies for investors in emerging markets (including derivative litigation) may be more limited, and U.S. authorities may have less ability to bring actions against bad actors in emerging markets countries. Frontier markets are those emerging markets that are considered to be among the smallest, least mature and least liquid. These factors may make investing in frontier market countries significantly riskier than investing in other countries.
Fixed-Income Foreign Investment Risk. Foreign fixed-income securities investments, including securities or contracts payable or denominated in non-U.S. currencies, can involve special risks that arise from one or more of the following events or circumstances: (1) changes in currency exchange rates; (2) possible imposition of market controls or currency exchange controls; (3) possible imposition of withholding taxes on dividends and interest; (4) possible seizure, expropriation or nationalization of assets; (5) more limited financial information about the foreign debt issuer or difficulties interpreting it because of foreign regulations and accounting standards; (6) lower liquidity and higher volatility in some foreign markets; (7) the impact of political, social or diplomatic events; (8) economic sanctions or other measures by the United States or other governments; (9) the difficulty of evaluating some foreign economic trends; and (10) the possibility that a foreign government could restrict an issuer from paying principal and interest on its debt obligations to investors outside the country. It may also be difficult to use foreign laws and courts to force a foreign issuer to make principal and interest payments on its debt obligations. In addition, the cost of servicing external debt will also generally be adversely affected by rising international interest rates because many external debt obligations bear interest at rates which are adjusted based upon international interest rates. The risks described above often increase in countries with emerging markets. For example, the ability of a foreign sovereign issuer, especially in an emerging market country, to make timely and ultimate payments on its debt obligations may be strongly influenced by the issuer’s balance of payments, including export performance, its access to international credit and investments, fluctuations of interest rates and the extent of its foreign reserves. If a deterioration occurs in the foreign country’s balance of payments, it could impose temporary restrictions on foreign capital remittances. In addition, there is a risk of restructuring certain foreign debt obligations that could reduce and reschedule interest and principal payments.
30
Sovereign Debt Risk. The risk that the issuer of non-U.S. sovereign debt or the governmental authorities that control the repayment of such debt may be unable or unwilling to repay principal or interest when due. This may result from political or social factors, the general economic environment of a country, levels of foreign debt or foreign currency exchange rates, among other possible reasons. To the extent the issuer or controlling governmental authority is unable or unwilling to repay principal or interest when due, the Account may have limited recourse to compel payment in the event of default and could result in losses to the Account.
Supranational Debt Risk. The risk that the issuer of multinational or supranational foreign debt (e.g., the European Union or the International Monetary Fund (IMF)) that controls the repayment of such debt may be unable or unwilling to repay principal or interest when due. This may result from, among other possible reasons, political or social factors (e.g., the sudden or gradual disintegration of the multinational or supranational organization), the general economic environment of the countries or foreign markets that comprise the organization, levels of foreign debt or foreign currency exchange rates. To the extent the issuer or controlling multinational or supranational authority is unable or unwilling to repay principal or interest when due, the Account may have limited recourse to compel payment in the event of default and could result in losses to the Account.
Active Management Risk. The risk that the Account’s strategy, investment selection or trading execution for securities, including REIT stocks, may cause the Account to underperform relative to a stated benchmark index or funds or accounts with similar investment objectives.
Currency Risk. The risk of a decline in the value of a foreign currency versus the U.S. dollar, which reduces the dollar value of securities denominated in that foreign currency. The overall impact on the Account’s holdings can be significant and long lasting depending on the currencies represented in the portfolio, how each currency appreciates or depreciates in relation to the U.S. dollar, and whether currency positions are hedged. Foreign currency exchange rates may fluctuate significantly over short periods of time, particularly with respect to emerging markets currencies. Currency exchange rates can also be affected unpredictably by intervention by U.S. or foreign governments or central banks, or by currency controls or political developments.
Derivatives Risk. The risks associated with investing in derivatives may be different and greater than the risks associated with directly investing in the underlying securities and other instruments. Derivatives such as swaps are subject to risks such as liquidity risk, interest rate risk, market risk, and credit risk. These derivatives involve the risk of mispricing or improper valuation and the risk that the prices of certain options, futures, swaps (including credit default swaps), forwards and other types of derivative instruments may not correlate perfectly with the prices or performance of the underlying security, currency, rate, index or other asset. Certain derivatives present counterparty risk, or the risk of default by the other party to the contract, and some derivatives are, or may suddenly become, illiquid. Some of these risks exist for futures, options and swaps which may trade on established markets. Unanticipated changes in interest rates, securities prices or currency exchange rates may result in poorer overall performance of the Account than if it had not entered into derivatives transactions. The potential for loss as a result of investing in derivatives, and the speed at which such losses can be realized, may be greater than investing directly in the underlying security or other instrument. Derivative investments can create leverage by magnifying investment losses or gains, and the Account could lose more than the amount invested.
Currency Management Strategies Risk. Currency management strategies, including forward currency contracts, may substantially change the Account’s exposure to currency exchange rates and could result in losses to the Account if currencies do not perform as TIAA expects. In addition, currency management strategies, to the extent that such strategies reduce the Account’s exposure to currency risks, may also reduce the Account’s ability to benefit from favorable changes in currency exchange rates. There is no assurance that TIAA’s use of currency management strategies will benefit the Account or that they will be, or can be, used at appropriate times. Furthermore, there may not be a perfect correlation between the amount of exposure to a particular currency and the amount of securities in the portfolio denominated in that currency. Currency markets are generally less regulated than securities markets. Derivatives transactions, especially forward currency contracts and currency-related futures contracts and swap agreements, may involve significant amounts of currency management strategies risk.
Counterparty and Third Party Risk. Transactions involving a counterparty to a derivative or other instrument, or a third party responsible for servicing the instrument, are subject to the credit risk of the counterparty or third party,
31
and to the counterparties or third party’s ability to perform in accordance with the terms of the transaction. If a counterparty defaults, the Account may have contractual remedies but the Account may be unable to enforce them due to the application of bankruptcy, insolvency and other laws affecting the rights of creditors. Counterparty risk is still present even if a counterparties' obligations are secured by collateral because, for example, the Account’s interest in collateral may not be perfected or additional collateral may not be promptly posted as required. The Account is also subject to counterparty risk to the extent it executes a significant portion of its securities or derivatives transactions through a single broker, dealer, or futures commission merchant.
Rule 144A Securities Risk. The risk that SEC Rule 144A securities may be less liquid, and have less disclosure and investor protections, than publicly traded securities. Such securities may involve a high degree of business and financial risk and may result in losses to the Account.
Illiquid Investments Risk.The risk that illiquid investments may be difficult to sell for the value at which they are carried, if at all, or at any price within the desired time frame. Illiquid investments are those that are not reasonably expected to be sold or disposed of in current market conditions in seven calendar days or less without the sale or disposition significantly changing the market value of the investment. The Account’s investments in illiquid investments may reduce the returns of the Account because it may be unable to sell the illiquid investment at an advantageous time or price, which could prevent the Account from taking advantage of other investment opportunities. Illiquid investments may trade less frequently, in lower quantities and/or at a discount as compared to more liquid investments, which may cause the Account to receive distressed prices and incur higher transaction costs when selling such investments. Securities that are liquid at the time of purchase may subsequently become illiquid due to events such as adverse developments for an issuer, industry-specific developments, market events, rising interest rates, changing economic conditions or investor perceptions and geopolitical risk. Dislocations in certain parts of markets have resulted, and may continue to result, in reduced liquidity for certain investments. It is uncertain when financial markets will improve and economic conditions will stabilize. Liquidity of financial markets may also be affected by government intervention and political, social, health, economic or market developments. During periods of market stress, the Account’s assets could potentially experience significant levels of illiquidity.
Deposit/Money Market Risk. The risk that, to the extent the Account’s cash held in bank deposit accounts exceeds federally insured limits as to that bank, the Account could experience losses if banks fail. In addition, there is some risk that investments held in money market accounts or funds can suffer losses. Further, to the extent that a defaultsignificant portion of the Account’s net assets at any particular time consist of cash, cash equivalents and non-real estate-related liquid securities, the Account’s returns may suffer as compared to the return that could have been generated by more profitable real estate-related investments. Such a borrower, somepotential negative impact on returns may be exacerbated in times of low prevailing interest rates payable on many classes of liquid securities, such as is the case as of the date hereof and which may persist in the future.
COVID-19-Related Risks to Liquid Securities. In addition to the risks noted above, the U.S. capital markets have continued to experience extreme volatility and disruption during the COVID-19 pandemic. Some economists and investment banks have expressed concern that the continued spread of COVID-19 globally could lead to a prolonged global economic downturn, which, in addition to affecting our investments in real property, would adversely impact the Account’s investments in real-estate and non-real estate-related liquid assets. Disruptions in the capital markets have increased the spread between the yields realized on risk-free and higher risk securities, resulting in illiquidity in parts of the capital markets. Such disruptions may adversely affect the Account’s business, financial position and results of operations.
Structured Securities Risk. The risk that the value of a structured security or its underlying collateral can rise or fall in inverse proportion to the movement of interest rates. In addition, structured securities are often subject to limited liquidity, market volatility, the credit risk of the issuer or the underlying collateral for the security, changes in credit spreads charged by the market for taking the issuer’s or underlying collateral’s credit risk, early termination events (which can lower the payout at maturity), contractual provisions that may impose maximum gains, participation rights or similar features that limit investment return on the security, and hidden fees and costs embedded in the price of the security, all of which can adversely impact the loanedvalue of, and result in the loss of principal or interest on, the security at maturity.
32
GLOBAL ECONOMIC RISKS
National and regional economies and financial markets have become increasingly interconnected, which increases the possibilities that conditions in one country, region or market might adversely impact issuers in a different country, region or market. Changes in legal, political, regulatory, tax and economic conditions may cause fluctuations in markets and securities and commercial real property prices around the world, which could negatively impact the value of the Account’s investments. For example, the United Kingdom’s referendum decision to leave the European Union resulted in the depreciation in value of the British pound, short term declines in the stock markets and ongoing economic and political uncertainty concerning the consequences of the exit. Similar major economic or political disruptions, particularly in large economies like China, may have global negative economic and market repercussions. Additionally, events such as war, terrorism, natural and environmental disasters and the spread of infectious illnesses, pandemics or other public health emergencies may adversely affect the global economy and the securities, local commercial real estate markets and issuers in which the Account invests. Recent examples of such events include the outbreak of the COVID-19 pandemic, resulting in government imposed shutdowns across the globe. These events have reduced and could continue to reduce consumer demand and economic output, result in market closures, travel restrictions or quarantines, and generally have a significant impact on the economy, including the commercial real estate sector. Governmental and quasi-governmental authorities and regulators throughout the world have responded to the current impact of the COVID-19 pandemic with a variety of significant fiscal and monetary policy changes, including, but not been returned.
limited to, direct capital infusions into companies, new monetary programs and lower interest rates. An unexpected or quick reversal of these policies, or the ineffectiveness of these policies, could increase volatility in securities and commercial real estate markets, which could adversely affect the Account’s investments.
CONFLICTS OF INTEREST WITHIN TIAA
General. Officers of TIAA that provide advice with respect to the Account may also provide investment advice with respect to investments owned by TIAA, and investments managed by affiliates of TIAA. In addition, TIAA and its affiliates offer (and may in the future offer) other accounts and investment products that are not managed under an “at cost” expense structure. Therefore, TIAA and its officers may at times face various conflicts of interest. Many of the officers of TIAA involved in performing services to the Account will have competing demands on their time. The officers will devote such time to the affairs of the Account as TIAA’s management determines, in its sole discretion exercising good faith, is necessary to properly service the Account. TIAA believes that it has sufficient personnel to discharge its responsibility to the Account, the TIAA General Account, and other accounts to avoid conflicts of interest. TIAA or its affiliates may form and/or manage other real estate investment vehicles in the future and we will take steps to assure that those vehicles are integrated into appropriate conflict of interest policies. TIAA does not accept acquisition or placement fees for the services it provides to the Account. (Each of the Account, the TIAA General Account, and such other accounts, funds or real estate investment vehicles that are established or may be established by TIAA or its affiliates in the future, are herein referred to as an “account.”)
Liquidity Guarantee.In addition, as discussed elsewhere in this report, the TIAA General Account provides a liquidity guarantee to the Account. While an independent fiduciary is responsible under the prohibited transaction exemption issued to the Account in 1996 under PTE 96-76 (“PTE 96-76”) for establishing a “trigger point” (a percentage of TIAA’s ownership of liquidity units beyond which TIAA’s ownership may be reduced at the fiduciary’s direction), there is no express cap on the amount TIAA may be obligated to fund under this guarantee. Further, the Account’s independent fiduciary oversees any redemption of TIAA liquidity units. TIAA’s ownership of liquidity units (including the potential for changes in its levels of ownership in the future) from time to time could result in the perception that TIAA is taking into account its own economic interests while serving as investment manager for the Account. In particular, the value of TIAA’s liquidity units fluctuates in the same manner as the value of accumulation units held by all participants.contract owners. Any perception of a conflict of interest could cause participantscontract
33
owners to transfer accumulations out of the Account to another investment option, which could have an adverse impact on the Account’s ability to act most optimally upon its investment strategy.
RISKS OF SECURITIES LENDING
In lending its securities, the Account bears the market risk with respect to the investment of collateral and the risk the borrower or securities lending agent (the “Agent”) may default on its contractual obligations to the Account. Each Agent bears the risk that the borrower may default on its obligation to return the loaned securities as the Agent is contractually obligated to indemnify the Account if at the time of a default by a borrower some or all of the loaned securities have not been returned. Substitute payments for dividends received by the Account for securities loaned out by the Account will not be considered as qualified dividend income or as eligible for the corporate dividend received deduction.
REQUIRED PROPERTY SALES UNDER THE PTE
If TIAA were to own too large a percentage of the Account’s accumulation units through funding the liquidity guarantee (as determined by the Account’s independent fiduciary), the independent fiduciary could, pursuant to its obligations under PTE 96-76, require the Account to sell commercial real properties or other portfolio assets in the Account to reduce TIAA’s ownership interest. Any such required sales could occur at times and at prices that depress the sale proceeds to the Account and result in losses to the Account.
NO OPPORTUNITY FOR PRIOR REVIEW OF TRANSACTIONS
Investors do not have the opportunity to evaluate the economic or financial merit of the purchase, sale or financing of a property or other investment before the Account completes the transaction, so investors will need to rely solely on TIAA’s judgment and ability to select investments consistent with the Account’s investment objective and policies. Further, the Account may change its investment objective and pursue specific investments in accordance with any such amended investment objective without the consent of the Account’s investors.
RISKS OF REGISTRATION UNDER THE INVESTMENT COMPANY ACT OF 1940
The Account has not registered, and management intends to continue to operate the Account so that it will not have to register, as an “investment company” under the Investment Company Act of 1940, as amended (the “Investment Company Act”). Generally, a company is an “investment company” and required to register under the Investment Company Act if, among other things, it holds itself out as being engaged primarily, or proposes to engage primarily, in the business of investing, reinvesting or trading in securities, or it is engaged or proposes to engage in the business of investing, reinvesting, owning, holding or trading in securities and owns or proposes to acquire investment securities having a value exceeding 40% of the value of such company’s total assets (exclusive of government securities and cash items) on an unconsolidated basis.
If in the future the Account wereelected to or was obligated to register as an investment company, the Account would have to comply with a variety of substantive requirements under the Investment Company Act that impose, among other things, limitations on capital structure, restrictions on certain investments, compliance with reporting, record keeping,record-keeping, voting and proxy disclosure requirements and other rules and regulations that could significantly increase its operating expenses and reduce its operating flexibility. To maintain compliance with the exemptions from the Investment Company Act, the Account may be unable to sell assets it would otherwise want to sell and may be unable to purchase securities it would otherwise want to purchase, which might materially adversely impact the Account’s performance.
CYBERSECURITY AND OTHER BUSINESS CONTINUITY RISKS
With the increased use of connected technologies such as the Internet to conduct business, the Account and its service providers (including, but not limited to, TIAA, Services, the independent fiduciary and the Account’s custodian and financial intermediaries) are susceptible to cybersecurity risks. In general, cybersecurity attacks can result from infection by computer viruses or other malicious software or from deliberate actions or unintentional events, including gaining unauthorized access through “hacking” or other means to digital systems, networks, or devices that are used to service the Account’s operations in order to misappropriate assets or sensitive information, corrupt data, or cause operational disruption. Cybersecurity attacks can also be carried out in a manner that does not
34
require gaining unauthorized access, including by carrying out a “denial-of-service” attack on the Account or its service providers’ websites.providers. In addition, authorized persons could inadvertently or intentionally release and possibly destroy confidential or proprietary information stored on the Account’s systems or the systems of its service providers.
Cybersecurity failures by the Account or any of its service providers, or the issuers of any portfolio securities in which the Account invests (e.g., issuers of REIT stocks or debt securities), have the ability to result in disruptions to and impacts on business operations and may adversely affect the Account and the value of your accumulation units. Such disruptions or impacts may result in: financial losses; interference with the processing of contract transactions, including the processing of orders from TIAA’s website; interfere with the Account’s ability to calculate AUVs; barriers to trading and order processing; Account contract owners’ inability to transact business with the Account; violations of applicable federal and state privacy or other laws,laws; regulatory fines, penalties, reputational damage, reimbursement or other compensation costs,costs; or additional compliance costs. The Account and its service providers may also maintain sensitive information (including relating to personally identifiable information of investors) and a cybersecurity breach may cause such information to be lost, improperly accessed, used or disclosed. The Account may incur additional, incremental costs to prevent
and mitigate the risks of cybersecurity attacks or incidents in the future. The Account and its contract owners could be negatively impacted by such cyber-attackscybersecurity attacks or incidents. Although the Account has established business continuity plans and risk-based processes and controls to address such cybersecurity risks, there are inherent limitations in such plans and systems in part due to the evolving nature of technology and cybersecurity attack tactics. As a result, it is possible that the Account or the Account’s service providers will not be able to adequately identify or prepare for all cybersecurity attacks. In addition, the Account cannot directly control the cybersecurity plans or systems implemented by its service providers.
TAX RISKS
The tax rules applicable to the contracts vary according to the type of retirement plan and income. To broaden the incometerms and conditions of the plan. Your rights under a contract may be subject to the terms of the retirement plan itself, regardless of the terms of the contract. Adverse tax baseconsequences may result if contributions, distributions, and other transactions with respect to pay for the rate cuts and pass-through income deduction, many corporate deductions have been eliminatedcontract are not made or modified and many individual deductions suspended until 2026. With most provisions effectiveeffected in compliance with applicable law. We cannot provide detailed information on January 1, 2018all tax aspects of the Joint Committee on Taxation (“JCT”) estimatescontracts. Moreover, the tax aspects that the Act will increase the federal deficit by approximately $1.5 trillion over 10 years. The JCT also estimates that the Act will result in some economic growth over the same period. While the Act is expectedapply to have effectsa particular person’s contract may vary depending on the economyfacts applicable to that person and state of residence. Tax rules may change without notice. We cannot predict whether, when, or how these rules could change. Any change could affect contracts purchased before the change. We cannot predict what, if any, legislation will impactactually be proposed or enacted. Before making contributions to your contract or taking other action related to your contract, you should consult with a tax advisor to determine the performancetax implications of real estatean investment in, and credit markets, those effects cannot be predicted.payments received under, the contract.
ITEM 1B. UNRESOLVED STAFF COMMENTS.
Not applicable.
35
ITEM 2. PROPERTIES.
THE PROPERTIES—GENERAL
In the table below, participantscontract owners will find general information about each of the Account’s investments as of December 31, 2017.2021. The Account’s investments include both properties that are wholly-ownedwholly owned by the Account and properties owned by the Account’s joint venture investments. Certain investments include a portfolio of properties.
| Property | Location | Ownership Percentage | Rentable Area (Sq. ft.)(1) | Percent Leased | Fair Value(2) (millions) | |||||||||||||||
| OFFICE PROPERTIES | ||||||||||||||||||||
| 1001 Pennsylvania Ave | Washington, D.C. | 100.00% | 761,714 | 91.1% | $ | 811.2 | (3) | |||||||||||||
| Lincoln Centre | Dallas, TX | 100.00% | 1,624,006 | 76.5% | 538.7 | |||||||||||||||
| 99 High Street | Boston, MA | 100.00% | 730,210 | 87.5% | 530.7 | (3) | ||||||||||||||
| 701 Brickell Avenue | Miami, FL | 100.00% | 686,333 | 88.9% | 490.3 | (3) | ||||||||||||||
| Colorado Center | Santa Monica, CA | 50.00% | 1,189,114 | 83.1% | 377.3 | (4) | ||||||||||||||
| 780 Third Avenue | New York, NY | 100.00% | 513,402 | 52.7% | 374.5 | (3) | ||||||||||||||
| Four Oaks Place | Houston, TX | 51.00% | 2,341,067 | 82.8% | 347.4 | (4) | ||||||||||||||
| 1900 K Street, NW | Washington, D.C. | 100.00% | 358,610 | 97.6% | 336.0 | (3) | ||||||||||||||
| Wilshire Rodeo Plaza | Beverly Hills, CA | 100.00% | 256,144 | 84.8% | 322.1 | |||||||||||||||
| Foundry Square II | San Francisco, CA | 50.10% | 520,218 | 85.7% | 315.7 | |||||||||||||||
| 21 Penn Plaza | New York, NY | 100.00% | 379,281 | 92.1% | 312.5 | |||||||||||||||
| One Boston Place | Boston, MA | 50.25% | 805,247 | 83.4% | 265.8 | |||||||||||||||
| Seavest MOB | Pittsburgh, PA | 98.30% | 764,154 | 96.0% | 243.2 | (4) | ||||||||||||||
| 1401 H Street, NW | Washington, D.C. | 100.00% | 359,789 | 94.1% | 228.5 | (3) | ||||||||||||||
| Campus Pointe 1 | San Diego, CA | 45.00% | 449,759 | 99.2% | 221.8 | |||||||||||||||
| Fort Point Creative Exchange Portfolio | Boston, MA | 100.00% | 406,674 | 62.8% | 206.0 | |||||||||||||||
| 837 Washington Street | New York, NY | 100.00% | 55,497 | 100.0% | 203.0 | |||||||||||||||
| 88 Kearny Street | San Francisco, CA | 100.00% | 233,887 | 60.7% | 199.3 | |||||||||||||||
| 501 Boylston | Boston, MA | 50.10% | 611,039 | 71.0% | 192.2 | (4) | ||||||||||||||
| Campus Pointe 2 & 3 | San Diego, CA | 45.00% | 305,006 | 100.0% | 177.4 | |||||||||||||||
| Camput Pointe 6 | San Diego, CA | 45.00% | 314,103 | 87.6% | 169.6 | |||||||||||||||
| Fourth & Madison | Seattle, WA | 51.00% | 845,533 | 95.3% | 164.3 | (4) | ||||||||||||||
| Juniper MOB Portfolio | Various | 50.00% | 674,007 | 90.6% | 163.2 | |||||||||||||||
| 150 Industrial Road | San Carlos, CA | 98.00% | 229,640 | 100.0% | 151.3 | |||||||||||||||
| Vista Station Office Portfolio | Draper, UT | 100.00% | 400,000 | 100.0% | 124.5 | (3) | ||||||||||||||
| 440 Ninth Avenue | New York, NY | 88.52% | 410,815 | 88.8% | 123.1 | (4) | ||||||||||||||
| 1600 Broadway Street | Denver, CO | 100.00% | 444,595 | 84.6% | 108.0 | |||||||||||||||
| 101 Pacific Coast Highway | El Segundo, CA | 100.00% | 200,228 | 91.4% | 95.3 | |||||||||||||||
| The Ellipse at Ballston | Arlington, VA | 100.00% | 197,741 | 72.2% | 77.3 | |||||||||||||||
| 9625 Towne Centre Drive | San Diego, CA | 49.90% | 163,648 | 100.0% | 73.8 | |||||||||||||||
| Wilton Woods Corporate Campus | Wilton, CT | 100.00% | 534,196 | 68.4% | 73.7 | |||||||||||||||
| Campus Pointe 5 | San Diego, CA | 45.00% | 269,048 | 100.0% | 64.7 | |||||||||||||||
| 200 Middlefield Road | Menlo Park, CA | 100.00% | 43,081 | 85.5% | 59.2 | |||||||||||||||
| West Lake North Business Park | Westlake Village, CA | 100.00% | 197,366 | 79.3% | 58.6 | |||||||||||||||
| Camelback Center | Phoenix, AZ | 100.00% | 236,553 | 75.0% | 55.0 | |||||||||||||||
| 101 North Tryon Street | Charlotte, NC | 85.00% | 546,751 | 53.2% | 47.4 | (4) | ||||||||||||||
| 8270 Greensboro Drive | McLean, VA | 100.00% | 160,296 | 69.0% | 45.2 | |||||||||||||||
| 3131 McKinney | Dallas, TX | 100.00% | 146,651 | 49.2% | 44.4 | |||||||||||||||
| 30700 Russell Ranch | Westlake Village, CA | 100.00% | 136,262 | 97.7% | 36.6 | |||||||||||||||
36
| Property | Location | Year Built | Year Purchased | Rentable Area (Sq. ft.)(1) | Percent Leased | Annual Avg. Base Rent Per Leased Sq. Ft.(2) | Fair Value(3) (in millions) | |||||
| OFFICE PROPERTIES | ||||||||||||
| 1001 Pennsylvania Ave | Washington, D.C. | 1987 | 2004 | 780,425 | 79.9% | $ | 51.84 | $ | 785.0 | (4) | ||
| Fourth & Madison | Seattle, WA | 2002 | 2004 | 845,533 | 86.7% | 25.18 | 530.0 | (4) | ||||
| 501 Boylston Street | Boston, MA | 1940, 1961 | 2006 | 610,075 | 97.4% | 51.41 | 505.2 | (4) | ||||
| 99 High Street | Boston, MA | 1971 | 2005 | 732,432 | 90.1% | 48.02 | 502.1 | |||||
| 780 Third Avenue | New York, NY | 1984 | 1999 | 489,985 | 82.1% | 59.90 | 427.0 | (4) | ||||
| 701 Brickell Avenue | Miami, FL | 1986 | 2002 | 677,667 | 94.5% | 24.06 | 368.5 | (4) | ||||
| Lincoln Centre | Dallas, TX | 1984 | 2005 | 1,625,465 | 88.1% | 22.99 | 358.0 | |||||
| 55 Second Street | San Francisco, CA | 2002 | 2014 | 379,328 | 77.6% | 49.58 | 355.5 | (4) | ||||
Colorado Center(5) | Santa Monica, CA | 1984 | 2004 | 1,128,745 | 82.4% | 55.81 | 351.0 | |||||
Four Oaks Place(13) | Houston, TX | 1983, 2016 | 2012 | 2,333,310 | 81.6% | 24.53 | 338.7 | |||||
| 1900 K Street NW | Washington, D.C. | 1996 | 2004 | 345,781 | 98.5% | 47.78 | 330.0 | (4) | ||||
| Wilshire Rodeo Plaza | Beverly Hills, CA | 1935, 1984 | 2006 | 252,305 | 78.2% | 65.71 | 327.8 | |||||
400 Fairview(12) | Seattle, WA | 2015 | 2015 | 341,868 | 97.5% | 35.72 | 263.7 | |||||
Foundry Square II(17) | San Francisco, CA | 2002 | 2014 | 508,527 | 98.5% | 55.02 | 262.7 | |||||
| 21 Penn Plaza | New York, NY | 1931, 2012-2014 | 2014 | 373,335 | 94.2% | 29.05 | 261.2 | |||||
One Boston Place(6) | Boston, MA | 1970 | 2002 | 804,444 | 79.9% | 44.59 | 229.1 | |||||
| Fort Point Portfolio | Boston, MA | 1890-1920, 1986-2010 | 2016 | 406,754 | 92.7% | 40.20 | 223.1 | |||||
| 837 Washington Street | New York, NY | 1938, 2012-2014 | 2015 | 55,497 | 100.0% | 172.70 | 210.0 | |||||
409 & 499 Illinois Street(20) | San Francisco, CA | 2008, 2010 | 2015 | 463,985 | 99.0% | 51.37 | 209.3 | |||||
225 Binney Street(19) | Cambridge, MA | 2013 | 2015 | 305,212 | 100.0% | 40.50 | 201.9 | |||||
| 1401 H Street NW | Washington, D.C. | 1992 | 2006 | 350,787 | 74.5% | 49.13 | 201.1 | (4) | ||||
| Millennium Corporate Park | Redmond, WA | 1999, 2000 | 2006 | 536,958 | 96.3% | 19.63 | 184.1 | |||||
| 88 Kearny Street | San Francisco, CA | 1986 | 1999 | 227,882 | 84.1% | 58.69 | 174.2 | |||||
| Castro Station | Mountain View, CA | 2000, 2013 | 2015 | 114,809 | 93.7% | 90.29 | 169.0 | |||||
| 430 West 15th Street | New York, NY | 1950 | 2016 | 98,087 | 100.0% | 102.61 | 145.8 | |||||
| Urban Centre | Tampa, FL | 1984, 1987 | 2005 | 555,434 | 83.2% | 29.65 | 143.3 | |||||
Campus Pointe 1(22) | San Diego, CA | 1980, 2012 | 2016 | 449,759 | 72.9% | 37.30 | 143.0 | |||||
| Wilton Woods Corporate Campus | Wilton, CT | 1974, 2001 | 2001 | 531,606 | 78.6% | 24.01 | 133.0 | |||||
Campus Pointe 2 & 3(22) (30) | San Diego, CA | 1997, 2016 | 2016, 2017 | 305,006 | 100.0% | 36.83 | 127.1 | |||||
| Pacific Plaza | San Diego, CA | 2000, 2002 | 2007 | 217,823 | 48.9% | 22.16 | 115.2 | |||||
| The Ellipse at Ballston | Arlington, VA | 1989 | 2006 | 196,817 | 85.4% | 41.51 | 83.7 | |||||
1500 Owens(21) | San Francisco, CA | 2009 | 2015 | 158,267 | 100.0% | 50.59 | 77.5 | |||||
| 200 Middlefield Road | Menlo Park, CA | 1967, 2012-2013 | 2014 | 41,933 | 100.0% | 78.51 | 61.4 | |||||
| West Lake North Business Park | Westlake Village, CA | 2000 | 2004 | 197,366 | 95.1% | 29.96 | 60.3 | |||||
| Property | Location | Ownership Percentage | Rentable Area (Sq. ft.)(1) | Percent Leased | Fair Value(2) (millions) | |||||||||||||||
| Campus Pointe 4 | San Diego, CA | 45.00% | 44,034 | 100.0% | $ | 31.3 | ||||||||||||||
| 817 Broadway | New York, NY | 61.46% | 139,062 | 24.1% | 25.2 | (4) | ||||||||||||||
| Subtotal—Office Properties | 83.1% | $ | 8,485.3 | |||||||||||||||||
| INDUSTRIAL PROPERTIES | ||||||||||||||||||||
| Ontario Industrial Portfolio | Various | 100.00% | 3,361,602 | 100.0% | $ | 836.0 | ||||||||||||||
| Great West Industrial Portfolio | Rancho Cucamonga and Fontana, CA | 100.00% | 1,358,925 | 100.0% | 402.0 | |||||||||||||||
| Dallas Industrial Portfolio | Dallas and Coppell, TX | 100.00% | 3,684,941 | 100.0% | 333.0 | |||||||||||||||
| Cerritos Industrial Park | Cerritos, CA | 100.00% | 934,213 | 99.1% | 281.0 | |||||||||||||||
| Southern CA RA Industrial Portfolio | Los Angeles, CA | 100.00% | 920,078 | 96.7% | 267.7 | |||||||||||||||
| Oakmont IE West Portfolio | Fontana, CA | 100.00% | 709,941 | 100.0% | 244.0 | |||||||||||||||
| Rainier Corporate Park | Fife, WA | 100.00% | 1,104,071 | 100.0% | 210.9 | |||||||||||||||
| South River Road Industrial | Cranbury, NJ | 100.00% | 858,957 | 100.0% | 198.3 | |||||||||||||||
| Frontera Industrial Business Park | San Diego, CA | 100.00% | 794,330 | 99.6% | 181.4 | |||||||||||||||
| Pinto Business Park | Houston, TX | 100.00% | 1,641,141 | 90.6% | 174.6 | |||||||||||||||
| Rancho Cucamonga Industrial Portfolio | Rancho Cucamonga, CA | 100.00% | 573,000 | 100.0% | 164.0 | |||||||||||||||
| Seneca Industrial Park | Pembroke Park, FL | 100.00% | 882,182 | 96.3% | 163.1 | |||||||||||||||
| Regal Logistics Campus | Seattle, WA | 100.00% | 968,535 | 100.0% | 161.0 | |||||||||||||||
| Northern CA RA Industrial Portfolio | Oakland, CA | 100.00% | 625,304 | 99.1% | 147.3 | |||||||||||||||
| Shawnee Ridge Industrial Portfolio | Atlanta, GA | 100.00% | 1,422,922 | 100.0% | 132.1 | |||||||||||||||
| Ontario Mills Industrial Portfolio | Ontario, CA | 100.00% | 435,733 | 100.0% | 129.2 | |||||||||||||||
| Hendricks Gateway | Indianapolis, IN | 100.00% | 1,072,069 | 100.0% | 115.0 | |||||||||||||||
| Weston Business Center EF | Weston, FL | 100.00% | 396,090 | 100.0% | 110.0 | |||||||||||||||
| Stevenson Point | Newark, CA | 100.00% | 312,885 | 100.0% | 106.0 | |||||||||||||||
| Chicago Caleast Industrial Portfolio | Chicago, IL | 100.00% | 1,145,152 | 98.3% | 103.0 | |||||||||||||||
| Weston Business Center | Weston, FL | 100.00% | 455,268 | 100.0% | 97.2 | |||||||||||||||
| Northwest Houston Industrial Portfolio | Houston, TX | 100.00% | 1,010,957 | 92.0% | 88.3 | |||||||||||||||
| Pinnacle Industrial Portfolio | Grapevine, TX | 100.00% | 899,200 | 100.0% | 87.3 | |||||||||||||||
| Centre Pointe and Valley View | Los Angeles County, CA | 100.00% | 307,685 | 100.0% | 83.3 | |||||||||||||||
| The Hub | Long Island City, NY | 95.00% | 345,643 | 72.8% | 82.3 | (4) | ||||||||||||||
| Broward Industrial Portfolio | Various, FL | 100.00% | 355,088 | 100.0% | 82.2 | |||||||||||||||
| Pacific Corporate Park | Fife, WA | 100.00% | 388,783 | 100.0% | 79.4 | |||||||||||||||
| Northeast RA Industrial Portfolio | Boston, MA | 100.00% | 384,126 | 100.0% | 77.3 | |||||||||||||||
| 200 Milik Street | Carteret, NJ | 100.00% | 232,134 | 100.0% | 75.4 | |||||||||||||||
| Midway 840 | Mount Juliet, TN | 100.00% | 670,680 | 100.0% | 70.8 | |||||||||||||||
| Landover Logistics | Landover, MD | 100.00% | 360,550 | 84.0% | 67.7 | |||||||||||||||
| Atlanta Industrial Portfolio | Lawrenceville, GA | 100.00% | 495,440 | 100.0% | 60.9 | |||||||||||||||
| Fairfield Tolenas Development | Fairfield, CA | 95.00% | 427,020 | —% | 59.0 | |||||||||||||||
| Northwest RA Industrial Portfolio | Seattle, WA | 100.00% | 312,321 | 100.0% | 57.9 | |||||||||||||||
| Otay Mesa Industrial Portfolio | San Diego, CA | 100.00% | 265,712 | 100.0% | 52.6 | |||||||||||||||
| I-35 Logistics Center | Fort Worth, TX | 95.00% | 119,665 | 56.1% | 50.6 | |||||||||||||||
| One Beeman Road | Northborough, MA | 100.00% | 342,900 | 100.0% | 49.7 | |||||||||||||||
| Chicago Industrial Portfolio | Chicago, IL | 100.00% | 334,824 | 88.7% | 46.6 | |||||||||||||||
| Almond Avenue | Fontana, CA | 100.00% | 146,864 | 100.0% | 45.3 | |||||||||||||||
37
| Property | Location | Year Built | Year Purchased | Rentable Area (Sq. ft.)(1) | Percent Leased | Annual Avg. Base Rent Per Leased Sq. Ft.(2) | Fair Value(3) (in millions) | |||||
| Camelback Center | Phoenix, AZ | 2001 | 2007 | 232,615 | 86.1% | $ | 24.86 | $ | 59.8 | |||
The Hub(25) | Long Island City, NY | 1924 | 2016 | 303,803 | 42.0% | 15.27 | 56.9 | |||||
| 8270 Greensboro Drive | McLean, VA | 2000 | 2005 | 158,341 | 86.0% | 30.92 | 50.3 | |||||
817 Broadway(26) | New York, NY | 1900 | 2016 | 139,410 | 73.0% | 16.37 | 23.0 | |||||
Campus Pointe 4(22) | San Diego, CA | 1991, 2015 | 2017 | 44,034 | 100.0% | 25.02 | 8.8 | |||||
| Subtotal—Office Properties | 85.9% | $ | 9,057.3 | |||||||||
| INDUSTRIAL PROPERTIES | ||||||||||||
| Ontario Industrial Portfolio | Various, CA | 1997-1998 | 1998, 2000, 2004 | 3,361,599 | 100.0% | $ | 5.03 | $ | 398.6 | |||
| Dallas Industrial Portfolio | Dallas and Coppell, TX | 1997-2001 | 2000-2002 | 3,684,941 | 94.1% | 3.34 | 213.2 | |||||
| Great West Industrial Portfolio | Rancho Cucamonga and Fontana, CA | 2004-2005 | 2008 | 1,358,925 | 100.0% | 5.42 | 167.0 | |||||
| Cerritos Industrial Park | Cerritos, CA | 1970-1977 | 2012 | 934,213 | 100.0% | 5.86 | 142.0 | |||||
| Southern CA RA Industrial Portfolio | Los Angeles, CA | 1982 | 2004 | 920,078 | 92.1% | 7.27 | 138.0 | |||||
| Pinto Business Park | Houston, TX | 2014, 2015, 2016 | 2015, 2016 | 1,641,141 | 57.2% | 5.26 | 131.6 | |||||
| Rainier Corporate Park | Fife, WA | 1991-1997 | 2003 | 1,104,399 | 95.9% | 5.48 | 123.7 | |||||
| Amazon Distribution Center | Teterboro, NJ | 1958, 1974 | 2013 | 616,992 | 100.0% | 9.00 | 110.0 | |||||
| Seneca Industrial Park | Pembroke Park, FL | 1999-2001 | 2007 | 882,182 | 95.2% | 6.34 | 108.8 | |||||
| Chicago Industrial Portfolio | Chicago and Joliet, IL | 1997-2000 | 1998, 2000 | 1,427,748 | 100.0% | 4.40 | 100.3 | |||||
| Regal Logistics Campus | Seattle, WA | 1999-2004 | 2005 | 968,535 | 100.0% | 4.06 | 100.0 | |||||
| Weston Business Center | Weston, FL | 1998-1999 | 2011 | 679,918 | 67.0% | 7.75 | 92.8 | |||||
| Shawnee Ridge Industrial Portfolio | Atlanta, GA | 2000-2005 | 2005 | 1,422,922 | 100.0% | 3.66 | 91.1 | |||||
| South River Road Industrial | Cranbury, NJ | 1999 | 2001 | 858,957 | 100.0% | 3.94 | 87.8 | |||||
| Oakmont IE West Portfolio | Fontana, CA | 2014-2015 | 2015 | 709,941 | 100.0% | 5.16 | 87.6 | |||||
| Northern CA RA Industrial Portfolio | Oakland, CA | 1981 | 2004 | 657,602 | 94.8% | 7.11 | 87.4 | |||||
| Chicago Caleast Industrial Portfolio | Chicago, IL | 1974, 2005 | 2003 | 1,145,152 | 100.0% | 4.34 | 80.5 | |||||
| Rancho Cucamonga Industrial Portfolio | Rancho Cucamonga, CA | 2000-2002 | 2000, 2001, 2002, 2004 | 573,000 | 100.0% | 11.41 | 71.9 | |||||
| Northwest Houston Industrial Portfolio | Houston, TX | 1981 | 2014 | 1,010,912 | 100.0% | 4.45 | 70.7 | |||||
| Ontario Mills Industrial Portfolio | Ontario, CA | 2014 | 2014 | 435,733 | 100.0% | 5.23 | 58.5 | |||||
Commerce LIC(27) | Long Island City, NY | 1949 | 2017 | 255,564 | 81.4% | 13.38 | 58.2 | |||||
| Frontera Industrial Business Park | San Diego, CA | 1989, 2015 | 2017 | 517,207 | 69.1% | 8.81 | 56.4 | |||||
| Broward Industrial Portfolio | Various, FL | Various | 2017 | 401,368 | 83.2% | 8.57 | 54.2 | |||||
| Pinnacle Industrial Portfolio | Grapevine, TX | 2003, 2004, 2006 | 2006 | 899,200 | 100.0% | 2.70 | 53.3 | |||||
| 200 Milik Street | Carteret, NJ | 2013 | 2015 | 232,134 | 100.0% | 10.96 | 53.1 | |||||
| Stevenson Point | Newark, CA | 2000 | 2015 | 312,885 | 95.6% | 11.46 | 50.9 | |||||
| Centre Pointe and Valley View | Los Angeles County, CA | 1965, 1989 | 2004 | 307,685 | 83.4% | 7.57 | 47.8 | |||||
| Pacific Corporate Park | Fife, WA | 2006 | 2012 | 388,783 | 100.0% | 5.17 | 45.5 | |||||
| Landover Logistics | Landover, MD | 2013 | 2014 | 360,550 | 46.4% | 8.21 | 43.4 | |||||
| Property | Location | Ownership Percentage | Rentable Area (Sq. ft.)(1) | Percent Leased | Fair Value(2) (millions) | |||||||||||||||
| Riverside 202 Industrial | Phoenix, AZ | 100.00% | 319,860 | 100.0% | $ | 33.3 | ||||||||||||||
| 10 New Maple | Pine Brook, NJ | 100.00% | 266,338 | 95.0% | 32.7 | |||||||||||||||
| Jackson Shaw Forward Portfolio: Centerpoint | San Antonio, TX | 100.00% | 302,518 | —% | 29.6 | |||||||||||||||
| Park 10 Distribution | Houston, TX | 100.00% | 152,638 | 100.0% | 14.5 | |||||||||||||||
| Chisolm Trail | Houston, TX | 100.00% | 86,904 | 64.8% | 5.7 | |||||||||||||||
| Subtotal—Industrial Properties | 95.8% | $ | 5,889.2 | |||||||||||||||||
| RETAIL PROPERTIES | ||||||||||||||||||||
| The Florida Mall | Orlando, FL | 50.00% | 1,112,424 | 82.9% | $ | 613.7 | (4) | |||||||||||||
| Fashion Show | Las Vegas, NV | 50.00% | 1,904,448 | 95.2% | 557.8 | (4) | ||||||||||||||
| Westwood Marketplace | Los Angeles, CA | 100.00% | 202,202 | 100.0% | 174.0 | |||||||||||||||
| Village Crossing | Skokie, IL | 100.00% | 722,457 | 95.0% | 153.8 | |||||||||||||||
| Pacific City | Huntington Beach, CA | 100.00% | 189,951 | 81.2% | 140.0 | (3) | ||||||||||||||
| Florida Retail Portfolio | Various, FL | 80.00% | 328,594 | 86.0% | 128.2 | |||||||||||||||
| Birkdale Village | Huntersville, NC | 93.00% | 128 | 94.1% | 127.7 | (4) | ||||||||||||||
| 350 Washington | Boston, MA | 100.00% | 147,353 | 92.6% | 125.0 | |||||||||||||||
| Bridgepointe Shopping Center | San Mateo, CA | 100.00% | 231,519 | 61.6% | 121.0 | |||||||||||||||
| West Town Mall | Knoxville, TN | 50.00% | 777,065 | 93.5% | 116.6 | (4) | ||||||||||||||
| Fayette Pavilion | Fayetteville, GA | 100.00% | 1,521,852 | 92.7% | 113.4 | |||||||||||||||
| Plaza America | Reston, VA | 100.00% | 164,232 | 88.0% | 108.0 | |||||||||||||||
| Marketfair | West Windsor, NJ | 100.00% | 243,212 | 95.0% | 96.1 | |||||||||||||||
| The Shops at Wisconsin Place | Chevy Chase, MD | 100.00% | 117,202 | 78.5% | 89.2 | (5) | ||||||||||||||
| Miami International Mall | Miami, FL | 50.00% | 1,085,795 | 92.6% | 84.9 | (4) | ||||||||||||||
| Marketplace at Mill Creek | Buford, GA | 100.00% | 401,896 | 91.4% | 83.8 | (3) | ||||||||||||||
| Publix at Weston Commons | Weston, FL | 100.00% | 126,922 | 92.7% | 73.1 | |||||||||||||||
| Charleston Plaza | Mountain View, CA | 100.00% | 132,590 | 50.6% | 72.1 | |||||||||||||||
| South Denver Marketplace | Denver, CO | 100.00% | 261,135 | 100.0% | 69.5 | |||||||||||||||
| Overlook At King Of Prussia | King of Prussia, PA | 100.00% | 192,218 | 95.0% | 53.5 | (3) | ||||||||||||||
| Valencia Town Center | Valencia, CA | 50.00% | 1,251,396 | 69.9% | 51.5 | (4) | ||||||||||||||
| Pavilion at Turkey Creek | Knoxville, TN | 100.00% | 452,770 | 96.6% | 51.2 | |||||||||||||||
| Winslow Bay Commons | Mooresville, NC | 100.00% | 441,773 | 99.4% | 49.0 | (3) | ||||||||||||||
| Columbiana Station | Columbia, SC | 100.00% | 435,592 | 88.1% | 48.2 | |||||||||||||||
| Southside at McEwen | Franklin, TN | 100.00% | 92,470 | 89.3% | 47.9 | |||||||||||||||
| Creeks at Virginia Center | Glen Allen, VA | 100.00% | 265,973 | 85.2% | 46.7 | |||||||||||||||
| Heritage Pavilion | Smyrna, GA | 100.00% | 255,971 | 100.0% | 45.6 | |||||||||||||||
| 32 South State Street | Chicago, IL | 100.00% | 96,354 | 100.0% | 42.9 | (3) | ||||||||||||||
| The Forum at Carlsbad | Carlsbad, CA | 50.00% | 262,448 | 94.4% | 40.9 | (4) | ||||||||||||||
| Alexander Place | Raleigh, NC | 100.00% | 198,309 | 88.3% | 40.4 | |||||||||||||||
| Cypress Trace | Fort Myers, FL | 100.00% | 279,171 | 85.9% | 37.9 | |||||||||||||||
| Riverchase Village | Hoover, AL | 100.00% | 176,211 | 96.4% | 34.9 | |||||||||||||||
| Town and Country | Knoxville, TN | 100.00% | 650,229 | 97.2% | 33.2 | |||||||||||||||
| 401 West 14th Street | New York, NY | 42.19% | 62,200 | 86.3% | 31.2 | (4) | ||||||||||||||
| River Ridge | Birmingham, AL | 100.00% | 349,734 | 98.4% | 26.9 | |||||||||||||||
| Market Square | Fort Myers, FL | 100.00% | 118,945 | 89.6% | 21.9 | |||||||||||||||
| Shoppes at Lake Mary | Lake Mary, FL | 100.00% | 74,234 | 93.9% | 20.5 | |||||||||||||||
38
| Property | Location | Year Built | Year Purchased | Rentable Area (Sq. ft.)(1) | Percent Leased | Annual Avg. Base Rent Per Leased Sq. Ft.(2) | Fair Value(3) (in millions) | |||||
| Northeast RA Industrial Portfolio | Boston, MA | 2000 | 2004 | 384,126 | 100.0% | $ | 6.30 | $ | 40.9 | |||
| Northwest RA Industrial Portfolio | Seattle, WA | 1996 | 2004 | 312,321 | 99.2% | 3.46 | 38.5 | |||||
| One Beeman Road | Northborough, MA | 1985 | 2017 | 342,900 | 100.0% | 7.01 | 33.8 | |||||
| Atlanta Industrial Portfolio | Lawrenceville, GA | 1996-1999 | 2000 | 495,440 | 100.0% | 7.86 | 32.4 | |||||
| Beltway North Commerce Center | Houston, TX | 2014 | 2015 | 352,000 | — | — | 19.3 | |||||
| Park 10 Distribution | Houston, TX | 1980 | 2014 | 152,638 | 50.1% | 4.71 | 10.3 | |||||
| Subtotal—Industrial Properties | 92.4% | $ | 3,099.5 | |||||||||
| RETAIL PROPERTIES | ||||||||||||
Fashion Show(24) | Las Vegas, NV | 1981 | 2016 | 1,899,875 | 98.3% | $ | 36.00 | $ | 844.4 | |||
The Florida Mall(8) | Orlando, FL | 1986 | 2002 | 1,071,832 | 100.0% | 55.12 | 758.4 | |||||
DDR Joint Venture(7) | Various, U.S.A. | Various | 2007 | 8,351,983 | 91.6% | 15.61 | 636.2 | |||||
| The Forum at Carlsbad | Carlsbad, CA | 2003 | 2011 | 265,707 | 96.5% | 39.95 | 221.0 | (4) | ||||
Miami International Mall(8) | Miami, FL | 1982 | 2002 | 304,269 | 100.0% | 54.04 | 166.0 | |||||
Florida Retail Portfolio(9) | Various, FL | 1974, 2005 | 2006 | 436,277 | 99.6% | 25.29 | 150.6 | |||||
West Town Mall(8) | Knoxville, TN | 1972 | 2002 | 961,143 | 100.0% | 17.60 | 140.4 | |||||
Valencia Town Center(16) | Valencia, CA | 1991 | 2012 | 1,076,311 | 97.1% | 17.85 | 138.8 | |||||
Pacific City(23) | Huntington Beach, CA | 2015 | 2016 | 189,945 | 92.9% | 36.95 | 134.9 | |||||
| Westwood Marketplace | Los Angeles, CA | 1950 | 2002 | 202,202 | 100.0% | 30.56 | 131.9 | |||||
| Bridgepointe Shopping Center | San Mateo, CA | 1998 | 2017 | 229,769 | 81.5% | 28.41 | 124.5 | |||||
| Plaza America | Reston, VA | 1995 | 2014 | 164,398 | 92.7% | 34.32 | 117.0 | |||||
The Shops at Wisconsin Place(14) | Chevy Chase, MD | 2007-2010 | 2012 | 117,202 | 97.5% | 49.91 | 110.0 | |||||
| Marketfair | West Windsor, NJ | 1987 | 2006 | 242,866 | 97.8% | 27.85 | 102.9 | |||||
| Charleston Plaza | Mountain View, CA | 2006 | 2012 | 132,590 | 100.0% | 36.71 | 93.0 | |||||
| Publix at Weston Commons | Weston, FL | 2005 | 2006 | 126,922 | 98.9% | 28.42 | 74.8 | |||||
| South Denver Marketplace | Denver, CO | 1996-1998 | 2013 | 261,135 | 100.0% | 16.16 | 72.7 | |||||
| 32 South State Street | Chicago, IL | 1925 | 2016 | 96,354 | 100.0% | 27.58 | 48.3 | (4) | ||||
| Southside at McEwen | Franklin, TN | 2012 | 2014 | 92,470 | 100.0% | 25.34 | 48.2 | |||||
401 West 14th Street(18) | New York, NY | 1923, 2007 | 2014 | 62,200 | 100.0% | 136.94 | 46.4 | |||||
| 1619 Walnut Street | Philadelphia, PA | 1937, 2013 | 2013 | 34,047 | 100.0% | 41.33 | 24.1 | |||||
| Subtotal—Retail Properties | 95.3% | $ | 4,184.5 | |||||||||
| OTHER COMMERCIAL PROPERTIES | ||||||||||||
425 Park Avenue(10) | New York, NY | N/A | 2011 | N/A | N/A | N/A | $ | 457.0 | ||||
Storage Portfolio I(11) | Various, U.S.A. | 1972, 1990 | 2003 | 1,681,229 | 93.2% | 18.70 | 177.5 | |||||
Storage Portfolio II(29) | Various, U.S.A. | Various | 2017 | 2,300,756 | 95.8% | 11.78 | 91.8 | |||||
9625 Towne Centre Drive(28) | San Diego, CA | N/A | 2017 | N/A | N/A | N/A | 15.1 | |||||
| Subtotal—Other Commercial Properties | 94.7% | $ | 741.4 | |||||||||
| Subtotal—Commercial Properties | 91.6% | $ | 17,082.7 | |||||||||
| RESIDENTIAL PROPERTIES | ||||||||||||
| Palomino Park | Highlands Ranch, CO | 1996-2001 | 2005 | N/A | 94.2% | N/A | $ | 329.7 | (4) | |||
| The Colorado | New York, NY | 1987 | 1999 | N/A | 96.0% | N/A | 256.2 | (4) | ||||
| The Corner | New York, NY | 2010 | 2011 | N/A | 91.8% | N/A | 251.0 | (4) | ||||
| The Woodley | Washington, D.C. | 2014 | 2014 | N/A | 94.3% | N/A | 191.0 | |||||
MiMA(15) | New York, NY | 2010 | 2012 | N/A | 97.0% | N/A | 189.2 | |||||
| Property | Location | Ownership Percentage | Rentable Area (Sq. ft.)(1) | Percent Leased | Fair Value(2) (millions) | |||||||||||||||
| 1619 Walnut Street | Philadelphia, PA | 100.00% | 34,047 | 30.0% | $ | 17.3 | ||||||||||||||
| Warwick Shopping Center | Warwick, RI | 100.00% | 159,958 | 85.3% | 12.5 | |||||||||||||||
| Subtotal—Retail Properties | 89.8% | $ | 3,802.0 | |||||||||||||||||
| OTHER PROPERTIES | ||||||||||||||||||||
| Storage Portfolio IV | Various, U.S.A. | 90.00% | 2,187,384 | 91.2% | $ | 389.2 | ||||||||||||||
| Storage Portfolio II | Various, U.S.A. | 90.00% | 2,690,942 | 97.3% | 285.9 | (4) | ||||||||||||||
| Storage Portfolio I | Various, U.S.A. | 66.02% | 1,683,922 | 95.2% | 161.8 | (4) | ||||||||||||||
| Lincoln Centre - Hilton Dallas | Dallas, TX | 100.00% | 384,791 | 43.4% | 98.1 | |||||||||||||||
| Storage Portfolio III | Various, U.S.A. | 90.00% | 359,977 | 95.8% | 65.8 | |||||||||||||||
| Port St. Lucie | Port St. Lucie, FL | 100.00% | N/A | N/A | 55.2 | (6) | ||||||||||||||
| Castleforbes | Dublin, Ireland | 51.00% | N/A | N/A | 39.9 | (6) | ||||||||||||||
| 735 Watkins Mill | Washington, D.C. | 50.00% | N/A | N/A | 6.5 | (6) | ||||||||||||||
| Subtotal—Other Properties | 92.1% | $ | 1,102.4 | |||||||||||||||||
| Subtotal—Commercial Properties | 90.8% | $ | 19,278.9 | |||||||||||||||||
| RESIDENTIAL PROPERTIES | ||||||||||||||||||||
| Simpson Housing Portfolio | Various, U.S.A. | 80.00% | N/A | 94.6% | $ | 689.2 | (4) | |||||||||||||
| The Colorado | New York, NY | 100.00% | N/A | 98.3% | 260.2 | (3) | ||||||||||||||
| THP Student Housing Portfolio | Various, U.S.A. | 97.00% | N/A | 92.7% | 249.4 | (4) | ||||||||||||||
| Holly Street Village | Pasadena, CA | 100.00% | N/A | 95.2% | 189.1 | (3) | ||||||||||||||
| Houston Apartment Portfolio | Houston, TX | 100.00% | N/A | 91.0% | 173.4 | |||||||||||||||
| AmpliFi - Fullerton | Fullerton, CA | 100.00% | N/A | 95.2% | 168.0 | |||||||||||||||
| Terra House | San Jose, CA | 100.00% | N/A | 92.0% | 166.1 | |||||||||||||||
| Stella | Marina Del Rey, CA | 100.00% | N/A | 96.4% | 164.9 | |||||||||||||||
| Larkspur Courts | Larkspur, CA | 100.00% | N/A | 93.1% | 163.0 | |||||||||||||||
| The Louis at 14th | Washington, D.C. | 100.00% | N/A | 91.0% | 161.2 | |||||||||||||||
| BLVD63 | San Diego, CA | 100.00% | N/A | 99.3% | 161.0 | |||||||||||||||
| Mass Court | Washington, D.C. | 100.00% | N/A | 95.4% | 157.2 | |||||||||||||||
| The Legacy at Westwood | Los Angeles, CA | 100.00% | N/A | 92.0% | 157.1 | (3) | ||||||||||||||
| Hudson Woodstock | Woodstock, GA | 100.00% | N/A | 96.4% | 148.0 | |||||||||||||||
| The Palatine | Arlington, VA | 100.00% | N/A | 90.8% | 141.0 | |||||||||||||||
| The Manor at Flagler Village | Fort Lauderdale, FL | 100.00% | N/A | 96.9% | 140.1 | |||||||||||||||
| Henley at Kingstowne | Alexandria, VA | 100.00% | N/A | 93.0% | 129.2 | (3) | ||||||||||||||
| Union - South Lake Union | Seattle, WA | 100.00% | N/A | 85.6% | 129.0 | (3) | ||||||||||||||
| Regents Court | San Diego, CA | 100.00% | N/A | 94.0% | 128.0 | (3) | ||||||||||||||
| Ashford Meadows Apartments | Herndon, VA | 100.00% | N/A | 92.3% | 122.4 | |||||||||||||||
| 803 Corday | Naperville, IL | 100.00% | N/A | 95.5% | 120.0 | |||||||||||||||
| Circa Green Lake | Seattle, WA | 100.00% | N/A | 89.4% | 115.0 | (3) | ||||||||||||||
| MiMA | New York, NY | 70.00% | N/A | 98.2% | 114.7 | (4) | ||||||||||||||
| Creekside Alta Loma | Rancho Cucamonga, CA | 100.00% | N/A | 96.2% | 114.0 | |||||||||||||||
| Sole at Brandon | Riverview, FL | 100.00% | N/A | 90.9% | 111.0 | |||||||||||||||
| Casa Palma | Coconut Creek, FL | 100.00% | N/A | 93.4% | 109.1 | |||||||||||||||
| Rancho Del Mar | San Clemente, CA | 100.00% | N/A | 94.4% | 107.9 | |||||||||||||||
| The District at La Frontera | Austin, TX | 100.00% | N/A | 91.4% | 106.6 | (3) | ||||||||||||||
| Fusion 1560 | St. Petersburg, FL | 100.00% | N/A | 92.9% | 106.0 | (3) | ||||||||||||||
39
| Property | Location | Year Built | Year Purchased | Rentable Area (Sq. ft.)(1) | Percent Leased | Annual Avg. Base Rent Per Leased Sq. Ft.(2) | Fair Value(3) (in millions) | |||||
| Stella | Marina Del Rey, CA | 2013 | 2013 | N/A | 93.4% | N/A | $ | 179.7 | ||||
| The Louis at 14th | Washington, D.C. | 2013-2014 | 2014 | N/A | 93.3% | N/A | 176.0 | |||||
| Mass Court | Washington, D.C. | 2004 | 2012 | N/A | 85.7% | N/A | 171.0 | (4) | ||||
| 250 North 10th Street | Brooklyn, NY | 2014 | 2015 | N/A | 95.3% | N/A | 163.1 | |||||
| BLVD63 | San Diego, CA | 2014 | 2016 | N/A | 92.2% | N/A | 162.1 | |||||
| Houston Apartment Portfolio | Houston, TX | 1984-2004 | 2006 | N/A | 90.3% | N/A | 158.7 | |||||
| The Manor at Flagler Village | Fort Lauderdale, FL | 2014 | 2015 | N/A | 90.8% | N/A | 148.1 | |||||
| Holly Street Village | Pasadena, CA | 1997 | 2013 | N/A | 94.4% | N/A | 148.0 | |||||
| Larkspur Courts | Larkspur, CA | 1991 | 1999 | N/A | 87.9% | N/A | 143.7 | |||||
| The Legacy at Westwood | Los Angeles, CA | 2001 | 2002 | N/A | 94.7% | N/A | 143.0 | (4) | ||||
| The Palatine | Arlington, VA | 2008 | 2011 | N/A | 94.3% | N/A | 123.2 | (4) | ||||
| Union - South Lake Union | Seattle, WA | 2012 | 2015 | N/A | 93.7% | N/A | 111.0 | |||||
| Ashford Meadows Apartments | Herndon, VA | 1998 | 2000 | N/A | 91.1% | N/A | 107.3 | (4) | ||||
| South Florida Apartment Portfolio | Boca Raton and Plantation, FL | 1986 | 2001 | N/A | 93.1% | N/A | 105.1 | |||||
| Regents Court | San Diego, CA | 2001 | 2002 | N/A | 93.2% | N/A | 99.1 | (4) | ||||
| Circa Green Lake | Seattle, WA | 2009 | 2012 | N/A | 93.0% | N/A | 97.5 | |||||
| Casa Palma | Coconut Creek, FL | 2014 | 2015 | N/A | 90.3% | N/A | 95.0 | |||||
| 803 Corday | Naperville, IL | 1999 | 2017 | N/A | 84.1% | N/A | 94.5 | |||||
| Township Apartments | Redwood City, CA | 2014 | 2014 | N/A | 96.2% | N/A | 89.8 | |||||
| Oceano at Warner Center | Woodland Hills, CA | 2012 | 2013 | N/A | 95.1% | N/A | 89.0 | |||||
| The Residences at the Village of Merrick Park | Coral Gables, FL | 2003 | 2012 | N/A | 79.2% | N/A | 76.0 | |||||
| Greene Crossing | Columbia, SC | 2015 | 2016 | N/A | 99.7% | N/A | 67.2 | |||||
| The Bridges | Minneapolis, MN | 2014 | 2017 | N/A | 100.0% | N/A | 62.4 | |||||
| Prescott Wallingford Apartments | Seattle, WA | 2012 | 2012 | N/A | 94.8% | N/A | 62.0 | |||||
| Allure at Camarillo | Camarillo, CA | 2003 | 2017 | N/A | 87.3% | N/A | 59.6 | |||||
| The Maroneal | Houston, TX | 1998 | 2005 | N/A | 91.3% | N/A | 56.6 | |||||
| The Manor Apartments | Plantation, FL | 2013 | 2014 | N/A | 97.0% | N/A | 52.6 | |||||
| Westcreek | Westlake Village, CA | 1988 | 1997 | N/A | 93.7% | N/A | 51.4 | |||||
| The Cordelia | Portland, OR | 2014 | 2015 | N/A | 87.4% | N/A | 49.0 | |||||
| Cliffs at Barton Creek | Austin, TX | 1994 | 2013 | N/A | 89.0% | N/A | 45.9 | |||||
| Orion on Orpington | Orlando, FL | 2007 | 2017 | N/A | 99.5% | N/A | 44.4 | |||||
| The Ashton | Washington, D.C. | 2009 | 2015 | N/A | 69.4% | N/A | 37.5 | |||||
| The Knoll | Minneapolis, MN | 2013 | 2017 | N/A | 99.8% | N/A | 34.0 | (4) | ||||
| Subtotal—Residential Properties | 93.5% | $ | 4,520.6 | |||||||||
| Total—All Properties | 92.0% | $ | 21,603.3 | |||||||||
| Property | Location | Ownership Percentage | Rentable Area (Sq. ft.)(1) | Percent Leased | Fair Value(2) (millions) | |||||||||||||||
| Oceano at Warner Center | Woodland Hills, CA | 100.00% | N/A | 93.4% | $ | 103.0 | ||||||||||||||
| Sole at Brandon | Riverview, FL | 100.00% | N/A | 92.9% | 99.9 | |||||||||||||||
| Ascent at Windward | Alpharetta, GA | 100.00% | N/A | 91.8% | 92.6 | |||||||||||||||
| Greene Crossing | Columbia, SC | 100.00% | N/A | 98.5% | 89.2 | |||||||||||||||
| Lofts at SoDo | Orlando, FL | 100.00% | N/A | 94.8% | 87.6 | (3) | ||||||||||||||
| 5 West | Tampa, FL | 100.00% | N/A | 92.5% | 86.9 | |||||||||||||||
| Prescott Wallingford Apartments | Seattle, WA | 100.00% | N/A | 96.1% | 86.5 | |||||||||||||||
| Churchill on the Park | Dallas, TX | 100.00% | N/A | 91.3% | 84.4 | |||||||||||||||
| Carrington Park | Plano, TX | 100.00% | N/A | 91.8% | 84.3 | |||||||||||||||
| Biltmore at Midtown | Atlanta, GA | 100.00% | N/A | 87.3% | 82.8 | (3) | ||||||||||||||
| Boca Arbor Club | Boca Raton, FL | 100.00% | N/A | 98.7% | 80.2 | |||||||||||||||
| Centric Gateway | Charlotte, NC | 100.00% | N/A | 93.9% | 79.4 | |||||||||||||||
| The Residences at the Village of Merrick Park | Coral Gables, FL | 100.00% | N/A | 97.5% | 77.0 | |||||||||||||||
| Cherry Knoll | Germantown, MD | 100.00% | N/A | 95.3% | 73.1 | (3) | ||||||||||||||
| Allure at Camarillo | Camarillo, CA | 100.00% | N/A | 95.2% | 71.6 | |||||||||||||||
| Glen Lake | Atlanta, GA | 100.00% | N/A | 91.1% | 69.7 | |||||||||||||||
| The Bridges | Minneapolis, MN | 100.00% | N/A | 92.8% | 69.2 | |||||||||||||||
| Westcreek | Westlake Village, CA | 100.00% | N/A | 96.8% | 65.5 | |||||||||||||||
| Orion on Orpington | Orlando, FL | 100.00% | N/A | 100.0% | 64.4 | |||||||||||||||
| The Maroneal | Houston, TX | 100.00% | N/A | 91.9% | 63.5 | |||||||||||||||
| Lakepointe at Jacaranda | Plantation, FL | 100.00% | N/A | 98.0% | 59.8 | |||||||||||||||
| The Row at the Stadium | Columbia, SC | 98.50% | N/A | 100.0% | 58.7 | |||||||||||||||
| Cliffs at Barton Creek | Austin, TX | 100.00% | N/A | 96.2% | 56.5 | |||||||||||||||
| Park Creek | Fort Worth, TX | 100.00% | N/A | 92.3% | 54.0 | |||||||||||||||
| The Manor Apartments | Plantation, FL | 100.00% | N/A | 94.9% | 52.5 | |||||||||||||||
| The Cordelia | Portland, OR | 100.00% | N/A | 94.8% | 38.9 | |||||||||||||||
| The Knoll | Minneapolis, MN | 100.00% | N/A | 92.3% | 38.7 | |||||||||||||||
| The Ashton | Washington, D.C. | 100.00% | N/A | 98.0% | 29.2 | |||||||||||||||
| Subtotal—Residential Properties | 94.1% | $ | 6,800.9 | |||||||||||||||||
| Total—All Properties | 92.1% | $ | 26,079.8 | |||||||||||||||||
(1)The square footage is an approximate measure and is subject to periodic remeasurement.
(2)Wholly owned properties are represented at fair value and gross of any debt, while joint venture properties are represented at the net equity value.
(3)Property is subject to a mortgage. The fair value shown represents the Account's interest gross of debt.
(4)Property held by the joint venture is subject to a mortgage. The fair value reflects the Account's interest in the joint venture and is net of debt.
(5)Fair value shown reflects a retail property wholly-owned by the Account, as well as the Account's 33.33% interest in a joint venture investment.
(6)Investment represents developable land or land currently under development.
40
Commercial (Non-Residential) Investments
Major Tenants: The following tables list the Account’s ten most significant tenants based on the total space they occupied as of December 31, 20172021 in each of the Account’s commercial property types.
| Major Office Tenants | Occupied Sq. Ft. | % of Total Rentable Area of Account’s Office Properties | % of Total Rentable Area of Non-Residential Properties | |||||||||||||||||
BHP Petroleum (Americas), Inc.(1) | 1,002,947 | 5.1 | % | 1.5 | % | |||||||||||||||
WeWork(3) | 485,564 | 2.5 | % | 0.7 | % | |||||||||||||||
Crowell & Moring LLP(2) | 391,757 | 2.0 | % | 0.6 | % | |||||||||||||||
Hulu LLC(1) | 342,939 | 1.7 | % | 0.5 | % | |||||||||||||||
Atmos Energy Corporation(2) | 312,238 | 1.6 | % | 0.5 | % | |||||||||||||||
Eli Lilly and Company(1) | 305,006 | 1.5 | % | 0.5 | % | |||||||||||||||
Leidos, Inc.(1) | 269,048 | 1.4 | % | 0.4 | % | |||||||||||||||
Signal Pharmaceuticals(1) | 251,893 | 1.3 | % | 0.4 | % | |||||||||||||||
Bank of New York Mellon(1) | 226,165 | 1.1 | % | 0.3 | % | |||||||||||||||
McKenna Long & Aldridge LLP(2) | 211,528 | 1.1 | % | 0.3 | % | |||||||||||||||
| Major Industrial Tenants | Occupied Sq. Ft. | % of Total Rentable Area of Account’s Industrial Properties | % of Total Rentable Area of Non-Residential Properties | |||||||||||||||||
Wal-Mart Stores, Inc.(2) | 1,099,112 | 3.4 | % | 1.6 | % | |||||||||||||||
XPO Logistics, LLC(2) | 1,072,069 | 3.3 | % | 1.6 | % | |||||||||||||||
Federal Express(2) | 1,036,064 | 3.2 | % | 1.5 | % | |||||||||||||||
Regal West Corporation(2) | 968,535 | 3.0 | % | 1.4 | % | |||||||||||||||
Custom Goods, LLC(2) | 886,055 | 2.8 | % | 1.3 | % | |||||||||||||||
Kumho Tire U.S.A. Inc.(2) | 830,485 | 2.6 | % | 1.2 | % | |||||||||||||||
Del Monte Fresh Product, N.A., Inc.(2) | 689,660 | 2.1 | % | 1.0 | % | |||||||||||||||
R.R Donnelley & Sons Company(2) | 659,157 | 2.0 | % | 1.0 | % | |||||||||||||||
Rheem Sales Company, Inc.(2) | 656,600 | 2.0 | % | 1.0 | % | |||||||||||||||
HD Supply(2) | 648,121 | 2.0 | % | 1.0 | % | |||||||||||||||
| Major Retail Tenants | Occupied Sq. Ft. | % of Total Rentable Area of Account’s Retail Properties | % of Total Rentable Area of Non-Residential Properties | |||||||||||||||||
Target Corporation(2) | 784,349 | 4.9 | % | 1.2 | % | |||||||||||||||
Dick's Sporting Goods, Inc.(3) | 664,453 | 4.2 | % | 1.0 | % | |||||||||||||||
Macy's Inc.(1) | 496,603 | 3.1 | % | 0.7 | % | |||||||||||||||
Belk, Inc.(3) | 372,812 | 2.4 | % | 0.6 | % | |||||||||||||||
J.C. Penney Corporation, Inc (1) | 330,096 | 2.1 | % | 0.5 | % | |||||||||||||||
Best Buy Co., Inc.(2) | 313,219 | 2.0 | % | 0.5 | % | |||||||||||||||
Nordstrom Inc.(3) | 304,610 | 1.9 | % | 0.4 | % | |||||||||||||||
PetSmart, Inc.(2) | 268,061 | 1.7 | % | 0.4 | % | |||||||||||||||
Ross Stores, Inc.(2) | 232,811 | 1.5 | % | 0.3 | % | |||||||||||||||
Wal-Mart Stores, Inc.(2) | 209,751 | 1.3 | % | 0.3 | % | |||||||||||||||
(1)Tenant occupied space within joint venture investments.
(2)Tenant occupied space within wholly-owned investments.
(3)Tenant occupied space within wholly-owned and joint venture investments.
41
| Major Office Tenants | Occupied Sq. Ft. | % of Total Rentable Area of Account’s Office Properties | % of Total Rentable Area of Non-Residential Properties | ||||||
BHP Petroleum (Americas), Inc.(1) | 1,143,464 | 6.2 | % | 1.7 | % | ||||
Microsoft Corporation(2) | 479,193 | 2.6 | % | 0.7 | % | ||||
Crowell & Moring LLP(2) | 399,471 | 2.2 | % | 0.6 | % | ||||
Atmos Energy Corporation(2) | 312,238 | 1.7 | % | 0.5 | % | ||||
Biogen MA Inc(1) | 305,212 | 1.7 | % | 0.5 | % | ||||
Eli Lilly and Company(1) | 305,006 | 1.7 | % | 0.5 | % | ||||
Bank of New York Mellon(1) | 281,071 | 1.5 | % | 0.4 | % | ||||
Fibrogen Inc(1) | 238,707 | 1.3 | % | 0.4 | % | ||||
Bridgewater Associates LP(2) | 227,883 | 1.2 | % | 0.3 | % | ||||
Pearson Education Inc(2) | 225,299 | 1.2 | % | 0.3 | % | ||||
| Major Industrial Tenants | Occupied Sq. Ft. | % of Total Rentable Area of Account’s Industrial Properties | % of Total Rentable Area of Non-Residential Properties | ||||||
Wal-Mart Stores, Inc.(2) | 1,099,112 | 3.7 | % | 1.7 | % | ||||
Regal West Corporation(2) | 968,535 | 3.2 | % | 1.5 | % | ||||
Restoration Hardware, Inc.(2) | 886,052 | 2.9 | % | 1.3 | % | ||||
Kumho Tire U.S.A. Inc.(2) | 830,485 | 2.8 | % | 1.2 | % | ||||
Del Monte Fresh Product, N.A., Inc.(2) | 689,660 | 2.3 | % | 1.0 | % | ||||
Amazon.com(2) | 684,988 | 2.3 | % | 1.0 | % | ||||
R.R Donnelley & Sons Company(2) | 659,157 | 2.2 | % | 1.0 | % | ||||
Rheem Sales Company, Inc.(2) | 656,600 | 2.2 | % | 1.0 | % | ||||
Global Equipment Company, Inc.(2) | 647,228 | 2.1 | % | 1.0 | % | ||||
Campbell Soup Supply Company(2) | 573,000 | 1.9 | % | 0.9 | % | ||||
| Major Retail Tenants | Occupied Sq. Ft. | % of Total Rentable Area of Account’s Retail Properties | % of Total Rentable Area of Non-Residential Properties | ||||||
Dick's Sporting Goods, Inc.(1) | 599,887 | 3.3 | % | 0.9 | % | ||||
Macy's Inc.(1) | 496,603 | 2.7 | % | 0.7 | % | ||||
Belk, Inc.(1) | 371,706 | 2.1 | % | 0.6 | % | ||||
Kohl's Corporation(1) | 349,777 | 1.9 | % | 0.5 | % | ||||
J.C. Penney Corporation, Inc(1) | 327,027 | 1.8 | % | 0.5 | % | ||||
Ross Stores, Inc.(1) | 320,189 | 1.8 | % | 0.5 | % | ||||
PetSmart, Inc.(3) | 308,294 | 1.7 | % | 0.5 | % | ||||
Nordstrom Inc.(3) | 304,610 | 1.7 | % | 0.5 | % | ||||
Bed Bath and Beyond Inc.(3) | 274,897 | 1.5 | % | 0.4 | % | ||||
Best Buy Co., Inc.(3) | 266,914 | 1.5 | % | 0.4 | % | ||||
The following tables list the rentable area for long term leases subject to expiring leases during the next ten years and an aggregate figure for expirations in 20282032 and after, in the Account’s commercial (non-residential) properties that are both wholly-owned by the Account and held within the Account’s joint venture investments. While many of the leases contain renewal options with varying terms, these charts assume that none of the tenants exercise their renewal options, including those with terms that expired on December 31, 20172021 or are month to month leases.
Office Properties
Year of Lease Expiration | Number of Tenants with Expiring Leases | Rental Income Associated with Such Leases (in millions)(1) | Expiring Rent as a % of Rental Revenue(1) | Rentable Area Subject to Expiring Leases (sq. ft.) | % of Total Rentable Area of Account’s Office Properties Represented by Expiring Leases | Year of Lease Expiration | Number of Tenants with Expiring Leases | Base Rent Associated with Such Leases (millions)(1) | Expiring Rent as a % of Rental Income(1) | Rentable Area Subject to Expiring Leases (sq. ft.) | % of Total Rentable Area of Account’s Office Properties Represented by Expiring Leases | |||||||||||||||||||||||||||||||||||||
| 2018 | 145 | $ | 31.9 | 2.0 | % | 1,804,560 | 9.8 | % | ||||||||||||||||||||||||||||||||||||||||
| 2019 | 107 | 26.6 | 1.7 | % | 1,490,087 | 8.1 | % | |||||||||||||||||||||||||||||||||||||||||
| 2020 | 112 | 24.8 | 1.6 | % | 1,238,303 | 6.8 | % | |||||||||||||||||||||||||||||||||||||||||
| 2021 | 100 | 39.7 | 2.5 | % | 2,169,627 | 11.8 | % | |||||||||||||||||||||||||||||||||||||||||
| 2022 | 86 | 27.3 | 1.7 | % | 1,447,026 | 7.9 | % | 2022 | 151 | $ | 29.7 | 1.7 | % | 1,468,568 | 7.5 | % | ||||||||||||||||||||||||||||||||
| 2023 | 51 | 31.2 | 2.0 | % | 1,076,236 | 5.9 | % | 2023 | 120 | 32.9 | 1.9 | % | 1,376,271 | 7.0 | % | |||||||||||||||||||||||||||||||||
| 2024 | 49 | 34.6 | 2.2 | % | 1,389,215 | 7.6 | % | 2024 | 125 | 30.8 | 1.7 | % | 1,634,622 | 8.3 | % | |||||||||||||||||||||||||||||||||
| 2025 | 49 | 38.8 | 2.5 | % | 1,075,773 | 5.9 | % | 2025 | 125 | 62.0 | 3.5 | % | 2,198,238 | 11.2 | % | |||||||||||||||||||||||||||||||||
| 2026 | 23 | 36.8 | 2.3 | % | 1,242,177 | 6.8 | % | 2026 | 85 | 40.5 | 2.3 | % | 1,653,546 | 8.4 | % | |||||||||||||||||||||||||||||||||
| 2027 | 14 | 9.5 | 0.6 | % | 283,086 | 1.5 | % | 2027 | 62 | 31.6 | 1.8 | % | 1,142,028 | 5.8 | % | |||||||||||||||||||||||||||||||||
| 2028 | 2028 | 70 | 23.9 | 1.3 | % | 1,229,321 | 6.2 | % | ||||||||||||||||||||||||||||||||||||||||
| 2029 | 2029 | 43 | 19.4 | 1.1 | % | 868,312 | 4.4 | % | ||||||||||||||||||||||||||||||||||||||||
| 2030 | 2030 | 31 | 18.7 | 1.1 | % | 602,502 | 3.1 | % | ||||||||||||||||||||||||||||||||||||||||
| 2031 | 2031 | 20 | 28.2 | 1.6 | % | 903,331 | 4.6 | % | ||||||||||||||||||||||||||||||||||||||||
| Thereafter | 38 | 157.8 | 10.1 | % | 2,421,977 | 13.2 | % | Thereafter | 70 | 86.5 | 4.9 | % | 2,352,398 | 12.0 | % | |||||||||||||||||||||||||||||||||
| Total | 774 | $ | 459.0 | 29.2 | % | 15,638,067 | 85.3 | % | Total | 902 | $ | 404.2 | 22.9 | % | 15,429,137 | 78.5 | % | |||||||||||||||||||||||||||||||
Industrial Properties
| Year of Lease Expiration | Number of Tenants with Expiring Leases | Base Rent Associated with Such Leases (millions)(1) | Expiring Rent as a % of Rental Income(1) | Rentable Area Subject to Expiring Leases (sq. ft.) | % of Total Rentable Area of Account’s Industrial Properties Represented by Expiring Leases | |||||||||||||||||||||||||||
| 2022 | 110 | $ | 21.6 | 1.2 | % | 6,012,559 | 18.7 | % | ||||||||||||||||||||||||
| 2023 | 96 | 19.3 | 1.1 | % | 5,298,203 | 16.5 | % | |||||||||||||||||||||||||
| 2024 | 114 | 21.5 | 1.2 | % | 4,443,431 | 13.8 | % | |||||||||||||||||||||||||
| 2025 | 56 | 12.8 | 0.7 | % | 3,023,080 | 9.4 | % | |||||||||||||||||||||||||
| 2026 | 67 | 22.1 | 1.2 | % | 6,525,064 | 20.3 | % | |||||||||||||||||||||||||
| 2027 | 28 | 6.1 | 0.3 | % | 870,918 | 2.7 | % | |||||||||||||||||||||||||
| 2028 | 10 | 8.3 | 0.5 | % | 1,039,071 | 3.2 | % | |||||||||||||||||||||||||
| 2029 | 8 | 5.1 | 0.3 | % | 900,645 | 2.8 | % | |||||||||||||||||||||||||
| 2030 | 1 | 0.1 | — | % | 45,220 | 0.1 | % | |||||||||||||||||||||||||
| 2031 | 5 | 5.2 | 0.3 | % | 1,229,836 | 3.8 | % | |||||||||||||||||||||||||
| Thereafter | 6 | 3.4 | 0.2 | % | 1,007,748 | 3.1 | % | |||||||||||||||||||||||||
| Total | 501 | $ | 125.5 | 7.0 | % | 30,395,775 | 94.4 | % | ||||||||||||||||||||||||
42
Year of Lease Expiration | Number of Tenants with Expiring Leases | Rental Income Associated with Such Leases (in millions)(1) | Expiring Rent as a % of Rental Revenue(1) | Rentable Area Subject to Expiring Leases (sq. ft.) | % of Total Rentable Area of Account’s Industrial Properties Represented by Expiring Leases | |||||||||||
| 2018 | 91 | $ | 12.8 | 0.8 | % | 5,389,412 | 17.9 | % | ||||||||
| 2019 | 98 | 8.6 | 0.5 | % | 2,831,141 | 9.4 | % | |||||||||
| 2020 | 84 | 15.0 | 1.0 | % | 5,217,347 | 17.3 | % | |||||||||
| 2021 | 67 | 15.7 | 1.0 | % | 4,182,295 | 13.9 | % | |||||||||
| 2022 | 68 | 15.1 | 1.0 | % | 5,211,508 | 17.3 | % | |||||||||
| 2023 | 22 | 6.7 | 0.4 | % | 1,671,885 | 5.6 | % | |||||||||
| 2024 | 10 | 3.9 | 0.2 | % | 1,380,239 | 4.6 | % | |||||||||
| 2025 | 12 | 5.0 | 0.3 | % | 705,155 | 2.3 | % | |||||||||
| 2026 | 6 | 5.6 | 0.4 | % | 829,665 | 2.8 | % | |||||||||
| 2027 | 7 | 1.0 | 0.1 | % | 293,352 | 1.0 | % | |||||||||
| Thereafter | 1 | — | — | % | 19,320 | 0.1 | % | |||||||||
| Total | 466 | $ | 89.4 | 5.7 | % | 27,731,319 | 92.2 | % | ||||||||
Retail Properties
| Year of Lease Expiration | Number of Tenants with Expiring Leases | Base Rent Associated with Such Leases (millions)(1) | Expiring Rent as a % of Rental Income(1) | Rentable Area Subject to Expiring Leases (sq. ft.) | % of Total Rentable Area of Account’s Retail Properties Represented by Expiring Leases | |||||||||||||||||||||||||||
| 2022 | 282 | $ | 17.0 | 1.0 | % | 1,558,698 | 9.8 | % | ||||||||||||||||||||||||
| 2023 | 295 | 20.4 | 1.1 | % | 1,658,225 | 10.5 | % | |||||||||||||||||||||||||
| 2024 | 238 | 19.1 | 1.1 | % | 1,689,473 | 10.7 | % | |||||||||||||||||||||||||
| 2025 | 189 | 23.4 | 1.3 | % | 1,527,249 | 9.6 | % | |||||||||||||||||||||||||
| 2026 | 176 | 14.9 | 0.8 | % | 1,822,005 | 11.5 | % | |||||||||||||||||||||||||
| 2027 | 105 | 9.6 | 0.5 | % | 658,767 | 4.2 | % | |||||||||||||||||||||||||
| 2028 | 64 | 7.5 | 0.4 | % | 445,561 | 2.8 | % | |||||||||||||||||||||||||
| 2029 | 48 | 3.9 | 0.2 | % | 256,664 | 1.6 | % | |||||||||||||||||||||||||
| 2030 | 76 | 15.5 | 0.9 | % | 521,399 | 3.3 | % | |||||||||||||||||||||||||
| 2031 | 54 | 6.1 | 0.3 | % | 642,538 | 4.1 | % | |||||||||||||||||||||||||
| Thereafter | 37 | 11.1 | 0.6 | % | 1,187,469 | 7.5 | % | |||||||||||||||||||||||||
| Total | 1,564 | $ | 148.5 | 8.2 | % | 11,968,048 | 75.6 | % | ||||||||||||||||||||||||
Year of Lease Expiration | Number of Tenants with Expiring Leases | Rental Income Associated with Such Leases (in millions)(1) | Expiring Rent as a % of Rental Revenue(1) | Rentable Area Subject to Expiring Leases (sq. ft.) | % of Total Rentable Area of Account’s Retail Properties Represented by Expiring Leases | |||||||||||
| 2018 | 257 | $ | 17.8 | 1.1 | % | 1,412,539 | 7.8 | % | ||||||||
| 2019 | 258 | 16.1 | 1.0 | % | 1,861,769 | 10.3 | % | |||||||||
| 2020 | 248 | 18.4 | 1.2 | % | 1,607,886 | 8.9 | % | |||||||||
| 2021 | 263 | 19.4 | 1.2 | % | 1,990,624 | 11.0 | % | |||||||||
| 2022 | 226 | 15.8 | 1.0 | % | 2,305,081 | 12.7 | % | |||||||||
| 2023 | 161 | 12.8 | 0.8 | % | 1,575,690 | 8.7 | % | |||||||||
| 2024 | 127 | 13.4 | 0.9 | % | 753,031 | 4.2 | % | |||||||||
| 2025 | 140 | 20.5 | 1.3 | % | 931,649 | 5.1 | % | |||||||||
| 2026 | 101 | 10.4 | 0.7 | % | 931,213 | 5.1 | % | |||||||||
| 2027 | 77 | 6.7 | 0.4 | % | 564,358 | 3.1 | % | |||||||||
| Thereafter | 47 | 12.8 | 0.8 | % | 1,070,538 | 5.9 | % | |||||||||
| Total | 1,905 | $ | 164.1 | 10.4 | % | 15,004,378 | 82.8 | % | ||||||||
Certain leases provide for additional rental amounts based upon the recovery of actual operating expenses in excess of specified base amounts, sales volume or contractual increases as defined in the lease agreement. These contractual contingent rentals are not included in the table above.
The following table details the leasing activity during the year ended December 31, 2017.
2021.
Leasing Activity (sq. ft.) | |||||||||
| Vacant space beginning of year | |||||||||
| Vacant space acquired during the year | |||||||||
| Vacant space disposed of during the year | |||||||||
| Vacant space placed into service during the year | |||||||||
| Expiring leases during the year | |||||||||
| Vacant space end of year | |||||||||
| Average remaining lease term* | |||||||||
*Includes office, industrial and retail properties.
Based on leases in place at December 31, 2017,2021, leases representing approximately 12.9%13.3% of net rentable area are scheduled to expire throughout 2018. Rents associated with such2022. Upon lease expirations, are generally at or belowcurrent prevailing market rents inrent estimates will be applied to the Account’s primary metropolitan markets.respective space based on market-oriented rollover assumptions.
Residential PropertiesInvestments
The Account’s residential property investment portfolio consisted of 38 properties as of December 31, 2017,is comprised of first class or luxury multi-family, garden, mid-rise, and high-rise apartment buildings, including one investment held in a joint venture. The portfolio contains approximately 12,924 units located in 11 states and the District of Columbia. The portfolio was 93.5% leased as of December 31, 2017. Ten of the residential properties in the portfolio are subject to mortgages, including one joint venture investment.buildings. The complexes generally contain one to three bedroom apartment units with a range of amenities, such as patios or balconies, washers and dryers, and central air conditioning. Many of these apartment communities have on-site fitness facilities, including some with swimming pools. Rents on each of the properties tend to be comparable with competitive communities and are not subject to rent regulation. The Account is resp
43
The following table contains detailed information regarding the apartment complexes in the Account’s portfolio as of December 31, 2017.2021.
| Property | Location | Number Of Units | Average Unit Size (Sq. Ft.) | |||||||||||||||||
| The Ashton | Washington, D.C. | 49 | 1,639 | |||||||||||||||||
| The Residences at the Village of Merrick Park | Coral Gables, FL | 120 | 1,231 | |||||||||||||||||
| Glen Lake | Atlanta, GA | 270 | 1,199 | |||||||||||||||||
| The Legacy at Westwood | Los Angeles, CA | 187 | 1,181 | |||||||||||||||||
Houston Apartment Porfolio(1) | Houston, TX | 877 | 1,158 | |||||||||||||||||
| Birkdale Village | Huntersville, NC | 320 | 1,147 | |||||||||||||||||
| Casa Palma | Coconut Creek, FL | 350 | 1,123 | |||||||||||||||||
| Ascent at Windward | Alpharetta, GA | 328 | 1,075 | |||||||||||||||||
| Sole at Brandon | Riverview, FL | 366 | 1,060 | |||||||||||||||||
| The Palatine | Arlington, VA | 262 | 1,055 | |||||||||||||||||
| Ashford Meadows Apartments | Herndon, VA | 440 | 1,050 | |||||||||||||||||
Simpson Housing Portfolio(1) | Various, U.S.A. | 3,827 | 1,010 | |||||||||||||||||
| Larkspur Courts | Larkspur, CA | 248 | 1,001 | |||||||||||||||||
| 5 West | Tampa, FL | 318 | 978 | |||||||||||||||||
| The Manor Apartments | Plantation, FL | 197 | 977 | |||||||||||||||||
| Cherry Knoll | Germantown, MD | 300 | 968 | |||||||||||||||||
| The Manor at Flagler Village | Fort Lauderdale, FL | 382 | 964 | |||||||||||||||||
| Stella | Marina Del Rey, CA | 250 | 941 | |||||||||||||||||
| Lofts at SoDo | Orlando, FL | 308 | 961 | |||||||||||||||||
| Cliffs at Barton Creek | Austin, TX | 210 | 952 | |||||||||||||||||
| Westcreek | Westlake Village, CA | 126 | 951 | |||||||||||||||||
| 803 Corday | Naperville, IL | 440 | 937 | |||||||||||||||||
| Carrington Park | Plano, TX | 364 | 936 | |||||||||||||||||
| Oceano at Warner Center | Woodland Hills, CA | 244 | 935 | |||||||||||||||||
| Henley at Kingstowne | Alexandria, VA | 358 | 930 | |||||||||||||||||
| The Maroneal | Houston, TX | 309 | 928 | |||||||||||||||||
| District at La Frontera | Austin, TX | 512 | 920 | |||||||||||||||||
| Boca Arbor Club | Boca Raton, FL | 304 | 896 | |||||||||||||||||
| Centric Gateway | Charlotte, NC | 297 | 890 | |||||||||||||||||
| Creekside Alta Loma | Rancho Cucamonga, CA | 290 | 887 | |||||||||||||||||
| Regents Court | San Diego, CA | 251 | 886 | |||||||||||||||||
| Allure at Camarillo | Camarillo, CA | 165 | 880 | |||||||||||||||||
| Lakepointe at Jacaranda | Plantation, FL | 246 | 880 | |||||||||||||||||
| Holly Street Village | Pasadena, CA | 374 | 879 | |||||||||||||||||
| The Colorado | New York, NY | 175 | 877 | |||||||||||||||||
| Churchill on the Park | Dallas, TX | 448 | 868 | |||||||||||||||||
| Avana | San Clemente, CA | 250 | 841 | |||||||||||||||||
| Mass Court | Washington, DC | 371 | 836 | |||||||||||||||||
| Fusion 1560 | St. Petersburg, FL | 325 | 834 | |||||||||||||||||
| Park Creek Apartments | Fort Worth, TX | 300 | 833 | |||||||||||||||||
| Sole at City Center | West Balm Beach, FL | 317 | 822 | |||||||||||||||||
| Terra House | San Jose, CA | 348 | 814 | |||||||||||||||||
| Biltmore at Midtown | Atlanta, GA | 276 | 766 | |||||||||||||||||
| Circa Green Lake | Seattle, WA | 199 | 765 | |||||||||||||||||
44
| Property | Location | Number Of Units | Average Unit Size (Sq. Ft.) | Avg. Rent Per Unit/ Per Month | |||||||
Palomino Park(1) | Highlands Ranch, CO | 1,184 | 1,100 | 1,765 | |||||||
Houston Apartment Porfolio(1) | Houston, TX | 877 | 1,158 | 1,722 | |||||||
Greene Crossing(2) | Columbia, SC | 727 | 369 | 830 | |||||||
The Bridges(2) | Minneapolis, MN | 720 | 262 | 514 | |||||||
Orion on Orpington(2) | Orlando, FL | 624 | 324 | 592 | |||||||
South Florida Apartment Portfolio(1) | Boca Raton and Plantation, FL | 550 | 888 | 1,452 | |||||||
| MiMA | New York, NY | 500 | 739 | 4,547 | |||||||
The Knoll(2) | Minneapolis, MN | 452 | 230 | 442 | |||||||
| Ashford Meadows Apartments | Herndon, VA | 440 | 1,050 | 1,712 | |||||||
| 803 Corday | Naperville, IL | 440 | 937 | 1,540 | |||||||
| The Manor at Flagler Village | Fort Lauderdale, FL | 382 | 964 | 2,309 | |||||||
| Holly Street Village | Pasadena, CA | 374 | 879 | 2,318 | |||||||
| Mass Court | Washington, D.C. | 371 | 834 | 2,791 | |||||||
| Casa Palma | Coconut Creek, FL | 350 | 1,123 | 1,943 | |||||||
| BLVD 63 | San Diego, CA | 332 | 1,250 | 3,521 | |||||||
| The Maroneal | Houston, TX | 309 | 928 | 1,590 | |||||||
| Union - South Lake Union | Seattle, WA | 284 | 696 | 2,065 | |||||||
| The Louis at 14th | Washington, D.C. | 268 | 665 | 3,066 | |||||||
| The Palatine | Arlington, VA | 262 | 1,055 | 2,689 | |||||||
| Regents Court | San Diego, CA | 251 | 886 | 2,237 | |||||||
| Larkspur Courts | Larkspur, CA | 248 | 1,001 | 3,273 | |||||||
| Oceano at Warner Center | Woodland Hill, CA | 244 | 935 | 2,200 | |||||||
| Stella | Marina Del Rey, CA | 244 | 970 | 3,527 | |||||||
| 250 North 10th Street | Brooklyn, NY | 234 | 676 | 3,609 | |||||||
| The Woodley | Washington, D.C. | 212 | 1,117 | 4,631 | |||||||
| Cliffs at Barton Creek | Austin, TX | 210 | 952 | 1,615 | |||||||
| Circa Green Lake | Seattle, WA | 199 | 765 | 2,157 | |||||||
| The Manor Apartments | Plantation, FL | 197 | 977 | 2,176 | |||||||
| The Corner | New York, NY | 196 | 791 | 6,442 | |||||||
| The Legacy at Westwood | Los Angeles, CA | 187 | 1,181 | 4,804 | |||||||
| The Colorado | New York, NY | 175 | 876 | 6,298 | |||||||
| Allure at Camarillo | Camarillo, CA | 165 | 880 | 2,036 | |||||||
| Prescott Wallingford Apartments | Seattle, WA | 154 | 663 | 1,888 | |||||||
| The Cordelia | Portland, OR | 135 | 667 | 1,838 | |||||||
| Township Apartments | Redwood City, CA | 132 | 914 | 3,565 | |||||||
| Westcreek | Westlake Village, CA | 126 | 951 | 2,563 | |||||||
| The Residences at the Village of Merrick Park | Coral Gables, FL | 120 | 1,231 | 3,484 | |||||||
| The Ashton | Washington, D.C. | 49 | 1,612 | 4,277 | |||||||
| Property | Location | Number Of Units | Average Unit Size (Sq. Ft.) | |||||||||||||||||
| MiMA | New York, NY | 500 | 739 | |||||||||||||||||
| Union - South Lake Union | Seattle, WA | 284 | 695 | |||||||||||||||||
| The Cordelia | Portland, OR | 135 | 667 | |||||||||||||||||
| Prescott Wallingford Apartments | Seattle, WA | 154 | 665 | |||||||||||||||||
| The Louis at 14th | Washington, DC | 268 | 665 | |||||||||||||||||
The Bridges(2) | Minneapolis, MN | 720 | 523 | |||||||||||||||||
The Knoll(2) | Minneapolis, MN | 452 | 459 | |||||||||||||||||
Greene Crossing(2) | Columbia, SC | 727 | 444 | |||||||||||||||||
THP Student Housing Portfolio(1)(2) | Various, U.S.A. | 4,647 | 496 | |||||||||||||||||
BLVD 63(2) | San Diego, CA | 1,379 | 361 | |||||||||||||||||
Orion on Orpington(2) | Orlando, FL | 624 | 324 | |||||||||||||||||
| Hudson Woodstock | Woodstock, GA | 498 | 1,110 | |||||||||||||||||
| AmpliFi | Fullerton, CA | 290 | 901 | |||||||||||||||||
(1)Represents a portfolio containing multiple properties.
(2)Investment is a student housing asset. Units are rented per bedroom, and multiple bedrooms can exist in one apartment.
Other Real Estate Investments
In addition to the Account's commercial and residential real estate investments, the Account has other real estate investments comprised of four storage portfolios, two properties under development, two developable parcels of land and a hotel. The storage portfolios are held through joint ventures with an established operator in the self-storage industry. The storage portfolios are diversified throughout the United States, with exposure present in more than twenty metropolitan areas. The two properties under development are an office property and retail property, each located in the Washington D.C. area. The developable land sites are slated for an office property, located in Port St. Lucie, FL and a multifamily property located in North Dock, Dublin, Ireland. The hotel, located in Dallas, TX, is located within the Lincoln Centre campus, which is also the location of an office property held by the Account.
ITEM 3. LEGAL PROCEEDINGS.
In the normal course of business, the Account may be named, from time to time, as a defendantor may be involved in various legal actions, including arbitrations, class actions and other litigation.
The Account establishes an accrual for all litigation and regulatory matters when it believes it is probable that a loss has been incurred and the amount of the loss can be reasonably estimated. Once established, accruals are adjusted, as appropriate, in light of additional information. The amount of loss ultimately incurred in relation to those matters may be higher or lower than the amounts accrued for those matters.
As of the date of this annual report,December 31, 2021, management of the Account does not believe that the results of any such claims or litigation, individually or in the aggregate, will have a material effect on the Account’s business, financial position or results of operations.
ITEM 4. MINE SAFETY DISCLOSURES.
Not applicable.
45
PART II
ITEM 5. MARKET FOR THE REGISTRANT’S SECURITIES, RELATED STOCKHOLDER MATTERS, AND ISSUER PURCHASES OF EQUITY SECURITIES.
Market Information. There is no established public trading market for securities issued by the Account. Accumulation units in the Account are sold to eligible participantscontract owners at the Account’s current accumulation unit value, which is based on the value of the Account’s then current net assets, and are redeemable in accordance with the terms of the participant’scontract owner’s annuity contract. For the period from January 1, 20172021 to December 31, 2017,2021, the high and low accumulation unit values for the Account were $398.329$514.765 and $381.785,$436.778, respectively. For the period January 1, 20162020 to December 31, 2016,2020, the high and low accumulation unit values for the Account were $381.636$442.781 and $362.267,$433.383, respectively.
Holders. The approximate number of Account contract owners at December 31, 20172021 was 1,045,110.989,851.
Securities Authorized for Issuance under Equity Compensation Plans. Not applicable.
Use of Proceeds. Not applicable.
Purchases of Equity Securities by Issuer. Not applicable.
ITEM 6. SELECTED FINANCIAL DATA.[RESERVED]
| Years Ended December 31, | ||||||||||||||||||||
| 2017 | 2016 | 2015 | 2014 | 2013 | ||||||||||||||||
| Investment income: | ||||||||||||||||||||
| Real estate income, net | $ | 582.0 | $ | 546.4 | $ | 486.2 | $ | 457.0 | $ | 391.0 | ||||||||||
| Income from real estate joint ventures and limited partnerships | 214.1 | 161.8 | 140.1 | 148.1 | 104.7 | |||||||||||||||
| Dividends and interest | 80.4 | 58.9 | 57.6 | 47.7 | 45.1 | |||||||||||||||
| Total investment income | 876.5 | 767.1 | 683.9 | 652.8 | 540.8 | |||||||||||||||
| Expenses | 205.2 | 202.0 | 182.9 | 163.0 | 145.1 | |||||||||||||||
| Investment income, net | 671.3 | 565.1 | 501.0 | 489.8 | 395.7 | |||||||||||||||
| Net realized and unrealized gains on investments and mortgage loans payable | 387.1 | 619.8 | 1,145.4 | 1,628.4 | 1,060.2 | |||||||||||||||
| Net increase in net assets resulting from operations | 1,058.4 | 1,184.9 | 1,646.4 | 2,118.2 | 1,455.9 | |||||||||||||||
| Participant transactions, net | (420.5 | ) | 759.8 | 884.6 | 802.9 | 916.3 | ||||||||||||||
| TIAA redemption of Liquidity Units | — | — | — | — | (325.4 | ) | ||||||||||||||
| Net increase in net assets | $ | 637.9 | $ | 1,944.7 | $ | 2,531.0 | $ | 2,921.1 | $ | 2,046.8 | ||||||||||
| Years Ended December 31, | ||||||||||||||||||||
| 2017 | 2016 | 2015 | 2014 | 2013 | ||||||||||||||||
| Total assets | $ | 27,453.6 | $ | 26,985.2 | $ | 24,399.4 | $ | 22,408.7 | $ | 19,417.1 | ||||||||||
| Total liabilities | 2,511.0 | 2,680.5 | 2,039.4 | 2,579.7 | 2,509.2 | |||||||||||||||
| Total net assets | $ | 24,942.6 | $ | 24,304.7 | $ | 22,360.0 | $ | 19,829.0 | $ | 16,907.9 | ||||||||||
| Number of per accumulation unit amounts | 61.3 | 62.4 | 60.4 | 57.9 | 55.3 | |||||||||||||||
| Net asset value, per accumulation unit | $ | 398.329 | $ | 381.636 | $ | 362.773 | $ | 335.393 | $ | 298.872 | ||||||||||
| Mortgage loans payable | $ | 2,238.3 | $ | 2,332.1 | $ | 1,794.4 | $ | 2,373.8 | $ | 2,279.1 | ||||||||||
| 2017 | Year Ended December 31, 2017 | |||||||||||||||||||
| For the Three Months Ended | ||||||||||||||||||||
| March 31 | June 30 | September 30 | December 31 | |||||||||||||||||
| Investment income, net | $ | 139.2 | $ | 166.0 | $ | 180.6 | $ | 185.5 | $ | 671.3 | ||||||||||
| Net realized and unrealized gain on investments and mortgage loans payable | 135.1 | 32.3 | 86.2 | 133.5 | 387.1 | |||||||||||||||
| Net increase in net assets resulting from operations | $ | 274.3 | $ | 198.3 | $ | 266.8 | $ | 319.0 | $ | 1,058.4 | ||||||||||
| Total return | 1.13 | % | 0.81 | % | 1.08 | % | 1.29 | % | 4.37 | % | ||||||||||
| 2016 | Year Ended December 31, 2016 | |||||||||||||||||||
| For the Three Months Ended | ||||||||||||||||||||
| March 31 | June 30 | September 30 | December 31 | |||||||||||||||||
| Investment income, net | $ | 121.7 | $ | 153.0 | $ | 136.5 | $ | 153.9 | $ | 565.1 | ||||||||||
| Net realized and unrealized gain on investments and mortgage loans payable | 302.1 | 144.5 | 25.9 | 147.3 | 619.8 | |||||||||||||||
| Net increase in net assets resulting from operations | $ | 423.8 | $ | 297.5 | $ | 162.4 | $ | 301.2 | $ | 1,184.9 | ||||||||||
| Total return | 1.89 | % | 1.28 | % | 0.68 | % | 1.26 | % | 5.20 | % | ||||||||||
ITEM 7. MANAGEMENT’S DISCUSSION AND ANALYSIS OF THE ACCOUNT’S FINANCIAL CONDITION AND RESULTS OF OPERATIONS.
The following discussion and analysis of the Account's financial condition and results of operations should be read together with the consolidated financial statementsConsolidated Financial Statements and notes contained in this report and with consideration to the sub-section entitled “Forward-looking Statements,” which begins below, and the section entitled “Item 1A. Risk Factors.” The past performance of the Account is not indicative of future results.
Forward-looking Statements
Some statements in this Form 10-K which are not historical facts may be “forward-looking statements” within the meaning of Section 27A of the Securities Act of 1933, Section 21E of the Securities Exchange Act of 1934 and the Private Securities Litigation Reform Act of 1995. Forward-looking statements include statements about management’s expectations, beliefs, intentions or strategies for the future, include the assumptions and beliefs underlying these forward-looking statements, and are based on current expectations, estimates and projections about the real estate industry, domestic and global economic conditions, including conditions in the credit and capital markets, the sectors, and markets in which the Account invests and operates, and the transactions described in this Form 10-K. While management believes the assumptions underlying its forward-looking statements and information to be reasonable, such information may be subject to uncertainties and may involve certain risks which may be difficult to predict and are beyond management’s control. These risks and uncertainties could cause actual results to differ materially from those contained in any forward-looking statement. These risks and uncertainties include, but are not limited to, the following:
More detailed discussions of certain of these risk factors are contained in the section of this Form 10-K entitled “Item 1A. Risk Factors” and also in the section entitled “Item 7A. Quantitative and Qualitative Disclosures About Market Risk,” that could cause actual results to differ materially from historical experience or management’s present expectations.
Caution should be taken not to place undue reliance on management’s forward-looking statements, which represent management’s views only as of the date that this report is filed. Neither management nor the Account undertake any obligation to update publicly or revise any forward-looking statement, whether as a result of new information, changed assumptions, future events or otherwise.
Commercial real estate market statistics discussed in this section are obtained by the Account from sources that management considers reliable, but some of the data areis preliminary for the year or quarter ended December 31, 2017
46
2021 and may be subsequently revised. Prior period data may have been adjusted to reflect updated calculations. Investors should not rely exclusively on the data presented below in forming a judgment regarding the current or prospective performance of the commercial real estate market generally.
Economic Overview and Outlook
| Actuals | Forecast | |||||||||||||||||||||||||||||||||||||||||||
| 1Q 2021 | 2Q 2021 | 3Q 2021 | 4Q 2021 | 2022 | 2023 | |||||||||||||||||||||||||||||||||||||||
Economy(1) | ||||||||||||||||||||||||||||||||||||||||||||
| Gross Domestic Product ("GDP") | 6.3% | 6.7% | 2.3% | 6.9% | 3.8% | 2.5% | ||||||||||||||||||||||||||||||||||||||
| Employment Growth (Thousands) | 1,934 | 1,267 | 1,630 | 1,834 | 296 | 175 | ||||||||||||||||||||||||||||||||||||||
| Unemployment Rate | 6.2% | 5.9% | 5.1% | 3.9% | 3.7% | 3.5% | ||||||||||||||||||||||||||||||||||||||
Interest Rates(2) | ||||||||||||||||||||||||||||||||||||||||||||
| 10 Year Treasury | 1.32% | 1.59% | 1.32% | 1.54% | 2.15% | 2.44% | ||||||||||||||||||||||||||||||||||||||
Sources: Blue Chip Economic Indicators, Blue Chip Financial Forecasts, BEA, Bureau of Economic Analysis (“BEA”), U.S. Gross Domestic Product (“GDP”) growth moderated slightlyLabor Statistics, Federal Reserve and Moody's Analytics
*Data subject to 2.6% in the fourth quarter from 3.2% in the third quarter. Consumer spending made the largest contribution, but growth was also supported by business investment, particularly on equipment, the housing market, and government spending. The trade deficit and weak inventories brought down growth. Despite the moderation in fourth quarter growth, the current three-quarter stretch for revision
(1)GDP growth wasrates are annual rates. Quarterly unemployment rates are the strongestreported value for the final month of the quarter while average annual values represent a twelve-month average.
(2)The Treasury rates are an average over the stated period.
After a 2021 dominated by upside risks — to growth, inflation, interest rates, and investment returns — we see a more balanced outlook heading into 2022. Global economic growth and inflation will slow this year from their fastest rates in three years. For all of 2017,decades, but will likely remain relatively high. We have positive growth and investment return outlooks in 2022 despite fading stimulus and continued supply/demand imbalances. U.S. GDP increased at a 2.3% annual rate compared to 1.5%6.9% quarter-over-quarter (seasonally adjusted annualized rate) in 2016.Q4 2021 and 5.7% year-over-year. The U.S. labor market also continuedhas restored almost 18.7 million of the 21 million jobs lost at the beginning of the pandemic, as measured by nonfarm employment, bringing the unemployment rate to expand during 2017,3.9% as of Q4 2021. The economy is estimated to have gained 1.8 million jobs in Q4 2021, according to the nonfarm payroll measurement from the U.S. Bureau of Labor Statistics.
As of December 31, 2021, the 7-day averages of COVID-19 cases and deaths, 399,400 and 1,280, respectively (according to the CDC), increased from prior quarter levels due to the spread of the Omicron variant of COVID-19. However, deaths from COVID-19 are still significantly lower now than they were in January 2021, when the 7-day average death rate peaked at 3,500. As of December 31, 2021, 205 million Americans have been fully vaccinated against COVID-19, and 72 million have received a COVID-19 vaccine booster shot. Most states have not instituted new mitigation measures to control the spread of the Omicron variant; however, some mitigation strategies remain in place.
2021 was a year of historically strong growth, fueled by a combination of unprecedented fiscal and monetary stimulus and a once-in-a-century global economic reopening. Growth was suppressed mainly by the unexpected surge in COVID-19 over the summer that interrupted the global recovery and exacerbated issues with products reaching consumers. We anticipate that many factors contributing positively to growth will fade in 2022, but we believe that the strong consumer demand and the inflation they helped create remain as we head into a new year. While the positive demand shock of 2021 has receded, it has not gone away entirely. The hole left by expiring stimulus is filled by robust wage growth in a prematurely tight labor market. For the first time in recent history, workers have a clear upper hand over employers in negotiations over terms of employment. We think the economic benefits of this realignment outweigh the potential costs.
Meanwhile, the supply/demand imbalance in the global market for goods are expected to begin to resolve. Global manufacturing output and trade are already at all-time highs, but production could rise further to meet demand and
47
help businesses replenish depleted inventories. More countries will fully reopen as their populations are vaccinated against COVID-19, and global consumers are expected to resume activities like leisure and travel that have yet to see full recoveries. There are encouraging signs of reacceleration in China and other Asian economies after a recent series of lockdowns, with Japan likely in store for better growth after a Delta-induced contraction in fall 2021. Supply chain stress will ease as factories return to full production capacity across East and Southeast Asia. At the same time, higher consumer spending in reopening countries are expected to lift overall growth in the region and around the world.
Inflation is running high in developed economies, while unemployment continues to trend lower and wage growth accelerates. Global production, orders, and shipments are at or near full employment,all-time highs, but input costs and delivery delays remain. We continue to expect price increases — which peaked in the first half of 2021 — to moderate as supply increases and consumer preferences shift. U.S. personal spending is well above its pre-pandemic trend, but the mix of that spending remains skewed toward goods over services. Even a term usedpartial reversion to indicateJanuary 2020 conditions would have a labor market operating with little to no slack. Bureau of Labor Statistics data indicate that fourth quarter job growth totaled 647,000disinflationary effect, as compared to 425,000 during the third quarter. For the year, 2.2 million jobs were added, generally consistent with 2.3 million in 2016. The unemployment rate ended the fourth quarter at 4.1%, down from 4.7% at the end of 2016 and hasservice prices have not been this low since late 2000.under nearly as much pressure as goods prices.
| 2017 | 1Q 2017 | 2Q 2017 | 3Q 2017 | 4Q 2017 | Forecast | |||||||||
| 2018 | 2019 | |||||||||||||
Economy(1) | ||||||||||||||
| Gross Domestic Product ("GDP") | 2.3% | 1.2% | 3.1% | 3.2% | 2.6% | 2.7% | 2.4% | |||||||
| Employment Growth (Thousands) | 2,173 | 532 | 569 | 425 | 647 | 1,986 | 1,644 | |||||||
| Unemployment Rate | 4.4% | 4.5% | 4.3% | 4.2% | 4.1% | 3.9% | 3.8% | |||||||
Interest Rates(2) | ||||||||||||||
| 10 Year Treasury | 2.3% | 2.4% | 2.3% | 2.2% | 2.4% | 2.7% | 3.2% | |||||||
Real Estate Market Conditions and Outlook
The pandemic severely impacted real estate property types dependent on social interactions such as retail, office, and lodging. While the retail and office sectors have continued to underperform, the lodging sector has recovered quickly, with prices exceeding pre-pandemic levels in particular sub-sectors. Simultaneously, the pandemic has accelerated online shopping, the movement to the suburbs and Sunbelt cities, and the shift to the digital economy. As a result, warehouse, storage, single-family rentals, and data center values have risen since the onset of the pandemic and have continued to outperform during recent quarters. Additionally, health care and medical research spending is increasing, which has benefited the life science and medical office sectors. According to Real Capital Analytics, U.S. real estate transaction activity remained healthy, but less active thanvolumes are up 88% year-to-year as of December 2021. In 2021, apartments and industrial captured approximately 62% of total U.S. transaction volumes, illustrating the strong investor interest in these two property types.
The Account experienced materially positive appreciation within the warehouse, apartment, and alternative real estate sectors during 2016. Real Capital Analytics reported that sales of office, industrial, retail, multi-family and other commercial properties totaled $122.3 billion in the fourth quarter of 2017, down 13% from fourth quarter 2016. For all2021, driving a net participant return of 2017, transaction volume totaled $463.9 billion; down 7% from 2016 levels. The Green Street Advisors’ Commercial Property Price Index (“CPPI”) has been relatively flat throughout 2017, with a less than 1% decline in 2017 as compared to 2016. Reflecting changes in consumer spending5.96%. Attractive supply and growth of e-commerce,demand fundamentals, favorable borrowing costs, and heightened investor appetite for the industrial and regional mall CPPI had the largest swings of 9% and -11%, respectively, over the past 12 months.
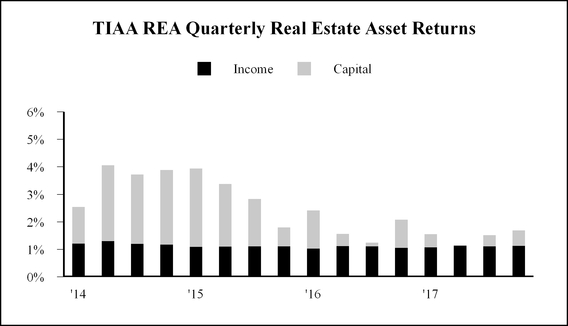
48
Data for the Account’s top five markets in terms of market value as of December 31, 20172021 are provided below. TheseThe five markets presented below represent 46.1%42.1% of the Account’s total real estate portfolio. Across all markets, the Account’s properties are 92.0%92.1% leased. Occupancy for properties in the Account’s Washington D.C. market is the weakest of the top five, reflective of elevated vacancy at two of the Account’s assets. Recently signed leases will increase future occupancy at these assets.
| Top 5 Metro Areas by Fair Value | Account % Leased Fair Value Weighted* | Number of Property Investments | Metro Area Fair Value as a % of Total RE Portfolio** | Metro Area Fair Value as a % of Total Investments** | ||||
| New York-Jersey City-White Plains, NY-NJ | 93.4% | 16 | 12.9% | 10.3% | ||||
| Washington-Arlington-Alexandria, DC-VA-MD-WV | 85.9% | 13 | 11.2% | 8.9% | ||||
| Los Angeles-Long Beach-Glendale, CA | 89.9% | 12 | 8.8% | 7.0% | ||||
| Boston, MA | 91.7% | 5 | 6.9% | 5.5% | ||||
| San Francisco-Redwood City-South San Francisco, CA | 89.7% | 8 | 6.3% | 5.0% | ||||
| Top 5 Metro Areas by Fair Value | Account % Leased Fair Value Weighted* | Number of Property Investments | Metro Area Fair Value as a % of Total RE Portfolio** | Metro Area Fair Value as a % of Total Investments** | ||||||||||||||||||||||
| Los Angeles-Long Beach-Anaheim, CA | 86.6% | 21 | 10.9% | 9.2% | ||||||||||||||||||||||
| Washington-Arlington-Alexandria, DC-VA-MD-WV | 88.7% | 18 | 10.2% | 8.6% | ||||||||||||||||||||||
| Riverside-San Bernardino-Ontario, CA | 100.0% | 7 | 7.4% | 6.3% | ||||||||||||||||||||||
| New York-Newark-Jersey City, NY-NJ-PA | 83.5% | 12 | 7.0% | 5.9% | ||||||||||||||||||||||
| Miami-Fort Lauderdale-West Palm Beach, FL | 95.0% | 14 | 6.6% | 5.6% | ||||||||||||||||||||||
*Weighted by fair value, which differs from the calculations provided for market comparisons to CBRE-EA data and are used here to reflect the fair value of the Account’s monetary investments in those markets.
**Wholly-owned properties are represented at fair value and gross of any debt, while joint venture properties are represented at the net equity value.
Office
Vacancy nationwide held steady at 12.2% in 2017, as compared to 1.3% growth in 2016. Demand for office space is driven by employment trends in office-using sectors such as finance and professional & business services. In the fourth quarter, job growth remained steady in both. The financial services sector added 21,000 jobs during the fourth quarter as compared to 33,000 in the third quarter while the professional and business services sector increased by 115,000 jobs during the fourth quarter compared to 120,000 in the third quarter. The financial services and professional and business services sectors added 134,000 and 527,000 jobs, respectively. For comparison, those same sectors added 176,000 and 534,000 jobs, respectively for 2016. Supply has increased from its post-recession lows, but continued projected steady employment growth bodes well for office market conditions in most major metropolitan areas in 2018.
As of December 31, 2021, the Account's rents from office tenants were not materially affected by the COVID-19 pandemic, but the duration of the effects of the COVID-19 pandemic remain unknown. Tenants requesting rent relief have generally requested rent deferrals for office use.
a limited period of time (i.e., less than six months), with the unpaid rent to be paid over the duration of the remaining lease. Additionally, if tenants vacate due to lease expirations, redeployment of the vacated space may be challenging in the near term due to unfavorable leasing conditions.
49
| Account Square Foot Weighted Average Vacancy | Market Vacancy* | |||||||||||||
| Top 5 Office Metropolitan Areas | Total Sector by Metro Area ($M) | % of Total Investments | 2017 Q4 | 2017 Q3 | 2017 Q4 | 2017 Q3 | ||||||||
| Account / Nation | 14.1% | 15.1% | 13.0% | 12.9% | ||||||||||
| Boston, MA | $ | 1,459.5 | 5.4% | 11.0% | 10.9% | 9.8% | 9.8% | |||||||
| Washington-Arlington-Alexandria, DC-VA-MD-WV | 1,450.2 | 5.3% | 16.5% | 16.5% | 15.3% | 15.4% | ||||||||
| San Francisco-Redwood City-South San Francisco, CA | 1,140.5 | 4.2% | 7.5% | 8.3% | 7.8% | 7.1% | ||||||||
| New York-Jersey City-White Plains, NY-NJ | 1,123.7 | 4.1% | 22.1% | 22.5% | 9.4% | 9.4% | ||||||||
| Seattle-Bellevue-Everett, WA | 977.7 | 3.6% | 8.2% | 8.2% | 7.6% | 7.8% | ||||||||
| Account Square Foot Weighted Average Vacancy | Market Vacancy* | |||||||||||||||||||||||||||||||||||||
| Top 5 Office Metropolitan Areas | Total Sector by Metro Area ($M) | % of Total Investments | 2021 Q4 | 2021 Q3 | 2021 Q4 | 2021 Q3 | ||||||||||||||||||||||||||||||||
| Account / Nation | 16.9% | 17.1% | 12.2% | 12.2% | ||||||||||||||||||||||||||||||||||
| Washington-Arlington-Alexandria, DC-VA-MD-WV | $ | 1,498.3 | 4.8% | 11.0% | 13.8% | 14.7% | 14.7% | |||||||||||||||||||||||||||||||
| Boston-Cambridge-Newton, MA-NH | 1,194.5 | 3.9% | 21.7% | 19.9% | 9.4% | 9.4% | ||||||||||||||||||||||||||||||||
| New York-Newark-Jersey City, NY-NJ-PA | 1,038.3 | 3.4% | 28.3% | 28.1% | 12.1% | 11.9% | ||||||||||||||||||||||||||||||||
| Los Angeles-Long Beach-Anaheim, CA | 932.7 | 3.0% | 16.0% | 17.7% | 13.6% | 13.5% | ||||||||||||||||||||||||||||||||
| San Diego-Carlsbad, CA | 738.8 | 2.4% | 2.7% | 1.4% | 11.2% | 11.7% | ||||||||||||||||||||||||||||||||
*Source: CoStar. Market vacancy is defined as the percentage of space vacant.available for rent. The Account’s vacancy is defined as the square foot-weighted percentage of un-leasedunleased space.
Industrial
The industrial sector remains solidhas experienced record demand in 2021, despite the challenges of the COVID-19 pandemic, and high demand is expected to continue in 2022. The pandemic has accelerated consumers' long-term shift to e-commerce, and this shift has caused demand for industrial space to rise. We expect e-commerce expansion will continue to drive demand for space. Despite adaptive reuse of existing spaces, as well as record setting delivery of new developments, demand continues to expand supported by thirty consecutive quarters of positive net absorption. Industrial market conditions benefit from economic growth,outweigh supply, which includes industrial production, international trade flows, and consumer spending. The appreciation of the dollar continued to weigh on exportcould slow leasing activity but the decline in exports has been partially offset by growth in imports, which are a key driver of warehouse demand. Strong consumer spending has also had a positive impact on the industrial market, particularly in the e-commerce space, which has supported strong demand for warehouse space in many markets. Economic conditions and the increasing demand for warehouse space is reflected in the2022.
The national industrial availability ratedecreased to 4.2% in the fourth quarter of 7.4% for 2017,2021 from 4.6% in the lowest rate since 2001. Construction has increased in response to historically low availability rates, but is concentrated in relatively few markets and often with a tenant lined up. National rent growth remained strong at 5.0% in 2017 as compared to 5.1% in 2016. With supply beginning to increase, the industrial market may be approaching a plateau; vacancy improvements are likely to become more modest, and near-term rent growth expectations more tempered.
As of December 31, 2021, the recent signingAccount's rents from industrial tenants were not materially affected by the COVID-19 pandemic, but the duration of the effects of the COVID-19 pandemic remain unknown. Tenants requesting rent relief have generally requested rent deferrals for a numberlimited period of small leases.time (i.e., less than six months), with the unpaid rent to be paid over the duration of the remaining lease.
| Account Square Foot Weighted Average Vacancy | Market Vacancy* | |||||||||||||||||||||||||||||||||||||
| Top 5 Industrial Metropolitan Areas | Total Sector by Metro Area ($M) | % of Total Investments | 2021 Q4 | 2021 Q3 | 2021 Q4 | 2021 Q3 | ||||||||||||||||||||||||||||||||
| Account / Nation | 4.2% | 2.7% | 4.2% | 4.6% | ||||||||||||||||||||||||||||||||||
| Riverside-San Bernardino-Ontario, CA | $ | 1,820.5 | 5.9% | 0.0% | 0.0% | 1.5% | 2.0% | |||||||||||||||||||||||||||||||
| Los Angeles-Long Beach-Anaheim, CA | 632.0 | 2.0% | 1.8% | 3.8% | 1.6% | 2.0% | ||||||||||||||||||||||||||||||||
| Seattle-Tacoma-Bellevue, WA | 509.2 | 1.6% | —% | 2.9% | 4.3% | 4.7% | ||||||||||||||||||||||||||||||||
| Miami-Fort Lauderdale-West Palm Beach, FL | 452.5 | 1.5% | 1.5% | 0.4% | 3.2% | 3.7% | ||||||||||||||||||||||||||||||||
| Dallas-Fort Worth-Arlington, TX | 420.3 | 1.4% | —% | —% | 5.3% | 5.6% | ||||||||||||||||||||||||||||||||
| Account Square Foot Weighted Average Vacancy | Market Vacancy* | |||||||||||||
| Top 5 Industrial Metropolitan Areas | Total Sector by Metro Area ($M) | % of Total Investments | 2017 Q4 | 2017 Q3 | 2017 Q4 | 2017 Q3 | ||||||||
| Account / Nation | 7.6% | 9.7% | 7.4% | 7.4% | ||||||||||
| Riverside-San Bernardino-Ontario, CA | $ | 783.6 | 2.9% | 0.0% | 0.0% | 6.5% | 6.2% | |||||||
| Los Angeles-Long Beach-Glendale, CA | 327.8 | 1.2% | 5.7% | 9.0% | 4.4% | 4.2% | ||||||||
| New York-Jersey City-White Plains, NY-NJ | 309.1 | 1.1% | 2.4% | 2.4% | 6.9% | 6.6% | ||||||||
| Tacoma-Lakewood, WA | 307.7 | 1.1% | 1.7% | 7.3% | 4.7% | 4.7% | ||||||||
| Dallas-Plano-Irving, TX | 266.5 | 1.0% | 4.7% | 4.7% | 7.9% | 7.6% | ||||||||
*Source: CoStar. Market availabilityvacancy is defined as the percentage of space available for rent. AccountThe Account's vacancy is the square foot-weighted percentage of un-leasedunleased space.
Multi-Family
Apartment demand, previously suppressed by the COVID-19 pandemic, is generated fromnow being driven by a combination of economic, demographicgrowing economy and socio-economic factors including job growth, household formations, and trendsis expected to rise above pre-pandemic level in the U.S. homeownership rate. Of the four main property types, the apartment market is the furthest along in its real estate cycle.2022.
50
The national apartment vacancy rate increased fordecreased from 2.9% in the seventh consecutivethird quarter on a year-over-year basis and is now 4.9%, up slightly from 4.8% duringof 2021 to 2.6% in the fourth quarter, 2016. At this point inas reported by RealPage. This can be attributed to urban market occupancy increasing, nearing their pre-pandemic levels, as COVID-19 restrictions are stripped back, vaccination rates increase and more people are returning to the cycle, softening market conditions are not unexpected as rent growth decreased to -0.3%downtown areas for 2017 as compared to 1.6% in 2016. A few major markets such as Boston, Chicago, Houston,entertainment and New York had negative rent growth for the year, which brought down the overall national average. With completions finally peaking, CBRE-EA expects that the apartment market will generally stabilize, with demand supported by increasing household formation and steady job growth.
work. The vacancy rate of the Account’s multi-familyapartment properties increased to average 6.5%5.9% in the fourth quarter of 20172021 as compared with 6.4%to 5.4% in the third quarter. prior quarter, as small increases can be seen across the portfolio.
As shown inof December 31, 2021, the following table,Account's rents from multifamily tenants were not materially affected by the average vacancy rateCOVID-19 pandemic, but the duration of the Account’s properties declined in threeeffects of its five top markets. New York’s increases in vacancy are primarily reflective of seasonal leasing patterns. Vacancy rates in Denver, Washington D.C., Los Angeles, and Fort Lauderdale can be attributed to the high amount of higher end product competing directly with the Account’s assets that have yet to be absorbed.COVID-19 pandemic remain unknown.
| Account Units Weighted Average Vacancy | Market Vacancy* | |||||||||||||||||||||||||||||||||||||
| Top 5 Apartment Metropolitan Areas | Total Sector by Metro Area ($M) | % of Total Investments | 2021 Q4 | 2021 Q3 | 2021 Q4 | 2021 Q3 | ||||||||||||||||||||||||||||||||
| Account / Nation | 5.9% | 5.4% | 2.6% | 2.9% | ||||||||||||||||||||||||||||||||||
| Los Angeles-Long Beach-Anaheim, CA | $ | 917.1 | 3.0% | 5.3% | 5.0% | 2.2% | 2.8% | |||||||||||||||||||||||||||||||
| Washington-Arlington-Alexandria, DC-VA-MD-WV | 813.3 | 2.6% | 6.8% | 7.8% | 2.9% | 3.5% | ||||||||||||||||||||||||||||||||
| Miami-Fort Lauderdale-West Palm Beach, FL | 629.7 | 2.0% | 4.5% | 3.4% | 2.0% | 3.7% | ||||||||||||||||||||||||||||||||
| Atlanta-Sandy Springs-Roswell, GA | 393.1 | 1.3% | 7.6% | 10.0% | 2.9% | 3.9% | ||||||||||||||||||||||||||||||||
| San Diego-Carlsbad, CA | 380.0 | 1.2% | 2.5% | 2.0% | 1.4% | 1.6% | ||||||||||||||||||||||||||||||||
| Account Units Weighted Average Vacancy | Market Vacancy* | |||||||||||||
| Top 5 Apartment Metropolitan Areas | Total Sector by Metro Area ($M) | % of Total Investments | 2017 Q4 | 2017 Q3 | 2017 Q4 | 2017 Q3 | ||||||||
| Account / Nation | 6.5% | 6.4% | 4.9% | 4.6% | ||||||||||
| New York-Jersey City-White Plains, NY-NJ | $ | 859.5 | 3.2% | 4.4% | 3.1% | 5.0% | 3.3% | |||||||
| Washington-Arlington-Alexandria, DC-VA-MD-WV | 806.0 | 3.0% | 9.5% | 8.2% | 5.0% | 4.7% | ||||||||
| Los Angeles-Long Beach-Glendale, CA | 559.7 | 2.1% | 5.6% | 6.2% | 4.1% | 3.8% | ||||||||
| Denver-Aurora-Lakewood, CO | 329.7 | 1.2% | 5.8% | 7.7% | 5.6% | 4.9% | ||||||||
| Fort Lauderdale-Pompano Beach-Deerfield Beach, FL | 295.7 | 1.1% | 8.1% | 8.3% | 5.7% | 5.8% | ||||||||
*Source: RealPage. Market vacancy is the percentage of units vacant. The Account’s vacancy is the percentage of unleased units.
Retail
The Account's retail centers by adding medical offices, health clubs, gourmet grocery stores, and public spaces with regular community events. Management believes that the end result will be a setportfolio is composed primarily of financially healthier retailers andhigh-end lifestyle shopping centers that offer customers more compelling products and curated experiences. Ultimately, e-commerce will makeregional malls in large metropolitan or tourist centers. The retail portfolio is managed to minimize significant exposure to any single retailer. The Account has over 1,100 retailers more efficient, but it will require substantial investment to create a seamless, interactive in-store experience that resonatesacross its portfolio, with consumers.
its largest retail exposure comprising less than 5.0% of total retail rentable area. The Account’s retail properties are high-quality assets that are well-leased and strategically-positioned in strong markets. The national availability rate remained essentially unchanged at 9.6%vacancy was 10.2% in the fourth quarter but saw anof 2021, down slightly from 10.7% in the third quarter.
Retail tenants requesting rent relief have generally requested rent deferrals for a limited period of time (i.e., less than six months), with the unpaid rent to be paid over the duration of the remaining lease. The Account is closely monitoring the collectability of accrued rental income and adjusting its allowances for uncollectible rent as needed.
| Account Square Foot Weighted Average Vacancy | Market Vacancy* | |||||||||||||||||||||||||||||||||||||
| Total by Retail Type ($M) | % of Total Investments | 2021 Q4 | 2021 Q3 | 2021 Q4 | 2021 Q3 | |||||||||||||||||||||||||||||||||
| National Retail | 10.2% | 10.7% | 4.6% | 4.8% | ||||||||||||||||||||||||||||||||||
| Lifestyle & Mall | $ | 1,775.0 | 5.7% | 12.6% | 12.6% | 7.4% | 7.7% | |||||||||||||||||||||||||||||||
| Neighborhood, Community & Strip** | 1,323.5 | 4.3% | 7.0% | 8.7% | 6.7% | 7.0% | ||||||||||||||||||||||||||||||||
| Power Center** | 599.7 | 1.9% | 15.5% | 13.3% | 5.3% | 5.5% | ||||||||||||||||||||||||||||||||
*Source: CoStar. Market vacancy is the percentage of space available for rent. The Account's vacancy is the square foot-weighted percentage of unleased space.
51
**The Power Center designation is reserved for properties with three or more anchor units. Anchor units are leased to large retailers such as department stores, home improvement stores, and warehouse clubs. Properties with the Neighborhood, Community and Strip designation consist of two or less anchor units.
Hotel
The impact of the COVID-19 pandemic on the hospitality sector has been especially severe among hotels that cater primarily to business travelers. Business travel has been curtailed significantly, with travel limited primarily to those who must travel for essential reasons. Business travel is likely to continue to be depressed during the first quarter of 2022, due to the spread of COVID variants. Leisure travel has continued to increase and is expected to remain steady, with inbound travelers from abroad increasing hotel demand in 2022.
INVESTMENTS
As of December 31, 2017,2021, the Account had total net assets of $24.9$28.1 billion, a 2.6%20.8% increase from December 31, 2016. The increase in the Account’s net assets was primarily due to net investment income and net appreciation in value of the Account’s investments, partially offset by net participant outflows.2020.
As of December 31, 2017,2021, the Account owned aheld 84.3% of its total of 138investments in real estate investments (110 of which were wholly-owned, 28 of which were held in joint ventures). Theand real estate portfolio included 39 officejoint ventures. The Account also held investments (including 13 held in joint ventures), 35 industrialloans receivable, including those with related parties, representing 4.8% of total investments, (including one held in a joint venture), 38 apartmentU.S. government agency notes representing 2.8% of total investments, (including one held in a joint venture), 22 retail investments (including ten held in joint ventures), two storage facilities that are joint venture investments, one joint venture interest in land held for future development and one leasehold interest encumbered by a ground lease. Of the real estate funds representing 2.6% of total investments, 33 are subject to debt (including 14 joint venture investments).U.S. treasury securities representing 2.5% of total investments, corporate bonds representing 1.8%, and a real estate operating business representing 1.2% of total investments.
The outstanding principal on mortgage loans payable on the Account’s wholly-owned real estate portfolio as of December 31, 20172021 was $2.2$2.1 billion. The Account’s proportionate share of outstanding principal on mortgage loans payable within its joint venture investments was $2.4$3.2 billion, which is netted against the underlying properties when determining the joint venture investments fair value presented on the Consolidated Schedules of Investments. When the mortgage loans payable within the joint venture investments are considered, totalTotal outstanding principal on the Account’s portfolio as of December 31, 20172021, inclusive of loans payable within the joint venture investments, $240.3 million in loans collateralized by a loan receivable and $500.0 million outstanding on the Account's line of credit, was $4.6$6.1 billion, which represented a loan-to-value ratio of 15.5%17.6%. The Account currently has no Account-level debt.
Management believes that the Account’s real estate portfolio is diversified by location and property type. The Account’s largest investment, Fashion Show Mall, located in Las Vegas, NV, represented 5.3% of total real estate investments and 4.3% of total investments. The Account does not intend to buy and sell its real estate investments simply to make short-term profits. Rather, the Account’s general strategy in selling real estate investments is to dispose of those assets that management believes (i) have maximized in value, (ii) have underperformed or face deteriorating property-specific or market conditions, (iii) need significant capital infusions in the future, (iv) are appropriate to dispose of in order to remain consistent with the Account’s intent to diversify the Account by property type and geographic location (including reallocating the Account’s exposure to or away from certain property types in certain geographic locations), or (v) otherwise do not satisfy the investment objectives of the Account. Management, from time to time, will evaluate the need to manage liquidity in the Account as part of its analysis as to whether to undertake a particular asset sale. The Account may reinvest any sale proceeds that it does not need to pay operating expenses or to meet debt service or redemption requests (e.g., participantcontract owner withdrawals or benefit payments).
The following charts reflect the Account’s ten largest investments based on the fair values and the diversification of the Account's real estate assets by region and property type and the Account's ten largest investments based on fair value at December 31, 2017.2021.
52
| Ten Largest Real Estate Investments | ||||||||||||||||||||||||
| Property Investment Name | Ownership Percentage | City | State | Type | Gross Real Estate Fair Value(1) | Debt Fair Value(2) | Net Real Estate Fair Value(3) | Property as a % of Total Real Estate Portfolio(4) | Property as a % of Total Investments(5) | |||||||||||||||
| Fashion Show Mall | 50% | Las Vegas | NV | Retail | $ | 1,263.1 | $ | 426.9 | $ | 836.2 | 5.3% | 4.3% | ||||||||||||
| DDR | 85% | Various | U.S.A. | Retail | 1,219.4 | 596.1 | 623.3 | 5.1% | 4.1% | |||||||||||||||
| The Florida Mall | 50% | Orlando | FL | Retail | 925.5 | 173.0 | 752.5 | 3.9% | 3.1% | |||||||||||||||
| 1001 Pennsylvania Avenue | 100% | Washington | D.C. | Office | 785.0 | 328.6 | 456.4 | 3.3% | 2.7% | |||||||||||||||
| Colorado Center | 50% | Santa Monica | CA | Office | 588.6 | 267.9 | 320.7 | 2.5% | 2.0% | |||||||||||||||
| Fourth and Madison | 100% | Seattle | WA | Office | 530.0 | 199.8 | 330.2 | 2.2% | 1.8% | |||||||||||||||
| 501 Boylston Street | 100% | Boston | MA | Office | 505.2 | 210.8 | 294.4 | 2.1% | 1.7% | |||||||||||||||
| 99 High Street | 100% | Boston | MA | Office | 502.1 | — | 502.1 | 2.1% | 1.7% | |||||||||||||||
| 425 Park Avenue | 100% | New York | NY | Ground Lease | 457.0 | — | 457.0 | 1.9% | 1.5% | |||||||||||||||
| 780 Third Avenue | 100% | New York | NY | Office | 427.0 | 168.7 | 258.3 | 1.8% | 1.4% | |||||||||||||||
Diversification by Fair Value(1) | ||||||||||||||||||||||||||||||||||||||
West(2) | South(3) | East(4) | Midwest(5) | Foreign(6) | Total | |||||||||||||||||||||||||||||||||
| Office | 11.3 | % | 5.8 | % | 15.1 | % | 0.2 | % | — | % | 32.4 | % | ||||||||||||||||||||||||||
| Apartment | 9.3 | % | 9.2 | % | 6.9 | % | 1.1 | % | — | % | 26.5 | % | ||||||||||||||||||||||||||
| Industrial | 13.6 | % | 5.7 | % | 2.2 | % | 1.0 | % | — | % | 22.5 | % | ||||||||||||||||||||||||||
| Retail | 4.7 | % | 5.9 | % | 2.9 | % | 0.8 | % | — | % | 14.3 | % | ||||||||||||||||||||||||||
Other(7) | 1.2 | % | 1.7 | % | 1.0 | % | 0.2 | % | 0.2 | % | 4.3 | % | ||||||||||||||||||||||||||
| Total | 40.1 | % | 28.3 | % | 28.1 | % | 3.3 | % | 0.2 | % | 100.0 | % | ||||||||||||||||||||||||||
(1)Wholly-owned properties are represented at fair value and gross of any debt, while joint venture properties are represented at the net equity value.
Diversification by Fair Value(1) | |||||||||||||||
| West | East | South | Midwest | Total | |||||||||||
| Office | 16.1 | % | 20.2 | % | 5.6 | % | — | % | 41.9 | % | |||||
| Apartment | 8.4 | % | 8.0 | % | 3.6 | % | 0.9 | % | 20.9 | % | |||||
| Retail | 8.1 | % | 3.0 | % | 7.6 | % | 0.7 | % | 19.4 | % | |||||
| Industrial | 7.5 | % | 2.0 | % | 4.1 | % | 0.8 | % | 14.4 | % | |||||
Other(2) | 0.6 | % | 2.6 | % | 0.1 | % | 0.1 | % | 3.4 | % | |||||
| Total | 40.7 | % | 35.8 | % | 21.0 | % | 2.5 | % | 100.0 | % | |||||
(2)Properties in the “West” region are located in: AK, AZ, CA, CO, HI, ID, MT, NM, NV, OR, UT, WA, WY
(3)Properties in the “East” region are located in: CT, DC, DE, KY, MA, MD, ME, NC, NH, NJ, NY, PA, RI, SC, VA, VT, WV
(4)Properties in the “South” region are located in: AL, AR, FL, GA, LA, MS, OK, TN, TX
(5)Properties in the “Midwest” region are located in: IA, IL, IN, KS, MI, MN, MO, ND, NE, OH, SD, WI
(6)Represents a developable land investment in Ireland.
(7)Represents interests in Storage Portfolio investments, a hotel investment and land.
| Ten Largest Real Estate Investments | ||||||||||||||||||||||||||||||||||||||||||||||||||||||||
| Property Investment Name | Ownership Percentage | City | State | Type | Gross Real Estate Fair Value(1) | Debt Fair Value(2) | Net Real Estate Fair Value(3) | Property as a % of Total Real Estate Portfolio(4) | Property as a % of Total Investments(5) | |||||||||||||||||||||||||||||||||||||||||||||||
| Simpson Housing Portfolio | 80% | Various | U.S.A. | Apartment | $ | 1,072.0 | $ | 392.1 | $ | 679.9 | 3.7% | 3.1% | ||||||||||||||||||||||||||||||||||||||||||||
| Fashion Show | 50% | Las Vegas | NV | Retail | 968.3 | 418.5 | 549.8 | 3.3% | 2.8% | |||||||||||||||||||||||||||||||||||||||||||||||
| Ontario Industrial Portfolio | 100% | Ontario | CA | Industrial | 836.0 | — | 836.0 | 2.9% | 2.4% | |||||||||||||||||||||||||||||||||||||||||||||||
| 1001 Pennsylvania Avenue | 100% | Washington | DC | Office | 811.3 | 308.1 | 503.2 | 2.8% | 2.4% | |||||||||||||||||||||||||||||||||||||||||||||||
| The Florida Mall | 50% | Orlando | FL | Retail | 736.0 | 148.4 | 587.6 | 2.5% | 2.2% | |||||||||||||||||||||||||||||||||||||||||||||||
| Colorado Center | 50% | Santa Monica | CA | Office | 632.5 | 277.9 | 354.6 | 2.2% | 1.9% | |||||||||||||||||||||||||||||||||||||||||||||||
| Lincoln Centre | 100% | Dallas | TX | Office | 538.7 | — | 538.7 | 1.8% | 1.6% | |||||||||||||||||||||||||||||||||||||||||||||||
| 99 High Street | 100% | Boston | MA | Office | 530.7 | 282.7 | 248.0 | 1.8% | 1.6% | |||||||||||||||||||||||||||||||||||||||||||||||
| 701 Brickell Avenue | 100% | Miami | FL | Office | 490.3 | 184.1 | 306.2 | 1.7% | 1.4% | |||||||||||||||||||||||||||||||||||||||||||||||
| Storage Portfolio II | 90% | Various | U.S.A. | Other | 465.8 | 183.4 | 282.4 | 1.6% | 1.4% | |||||||||||||||||||||||||||||||||||||||||||||||
(1)The Account's share of the fair value of the property investment, gross of debt.
(2)Debt fair values are presented at the Account's ownership interest.
(3)The Account's share of the fair value of the property investment, net of debt.
(4)Total real estate portfolio is the aggregate fair value of the Account's wholly-owned properties and the properties held within a joint venture, gross of debt.
(5)Total investments are the aggregate fair value of all investments held by the Account, gross of debt. Total investments, as calculated within this table, will vary from total investments, as calculated in the Account's Schedule of Investments, as joint venture investments are presented in the Schedule of Investments at their net equity position in accordance with U.S. Generally Accepted Accounting Principals ("GAAP").
Property Investments Acquired in 2021 (millions) | |||||||||||||||||||||||||||||||||||||||||
| Property Name | Ownership Percentage | Property Type | City | State | Net Purchase Price (less closing costs(1) | Mortgage Debt | |||||||||||||||||||||||||||||||||||
| Wholly-Owned | |||||||||||||||||||||||||||||||||||||||||
Frontera Business Park(3) | 100.00% | Industrial | San Diego | CA | $ | 13.1 | $ | — | |||||||||||||||||||||||||||||||||
| Hendricks Gateway | 100.00% | Industrial | Clayton | IN | 101.3 | — | |||||||||||||||||||||||||||||||||||
53
Property Investments Acquired in 2017 (in millions) | |||||||||||||||
| Property Name | Ownership Percentage | Property Type | City | State | Net Acquisition Cost (less closing costs) | Mortgages Acquired | |||||||||
| Wholly-Owned | |||||||||||||||
| One Beeman Road | 100.00% | Industrial | Northborough | MA | $ | 33.5 | $ | — | |||||||
| The Bridges | 100.00% | Apartments | Minneapolis | MN | 60.9 | — | |||||||||
| The Knoll | 100.00% | Apartments | Minneapolis | MN | 32.5 | 17.7 | |||||||||
| 803 Corday | 100.00% | Apartments | Naperville | IL | 92.9 | — | |||||||||
| Broward Industrial Portfolio | 100.00% | Industrial | Various | FL | 54.1 | — | |||||||||
| Orion on Orpington | 100.00% | Apartments | Orlando | FL | 42.3 | — | |||||||||
| Bridgepointe Shopping Center | 100.00% | Retail | San Mateo | CA | 124.1 | — | |||||||||
| Frontera Industrial Business Park | 100.00% | Industrial | San Diego | CA | 56.0 | — | |||||||||
| Allure at Camarillo | 100.00% | Apartments | Camarillo | CA | 59.7 | — | |||||||||
| Total Wholly-Owned | $ | 556.0 | $ | 17.7 | |||||||||||
| Joint Ventures | |||||||||||||||
| Commerce LIC | 97.50% | Industrial | Long Island City | NY | $ | 54.3 | $ | — | |||||||
| DDR - Village Crossing Phase I | 85.00% | Retail | Niles | IL | 44.4 | — | |||||||||
| Storage Portfolio II | 90.00% | Storage | Various | U.S.A. | 267.5 | 175.0 | |||||||||
| 9625 Towne Centre Drive | 35.86% | Land | San Diego | CA | 13.8 | — | |||||||||
| Campus Pointe 3 | 45.00% | Land | San Diego | CA | 13.0 | — | |||||||||
| Campus Pointe 4 | 45.00% | Office | San Diego | CA | 8.7 | — | |||||||||
| Total Joint Ventures | $ | 401.7 | $ | 175.0 | |||||||||||
| Total | $ | 957.7 | $ | 192.7 | |||||||||||
Property Investments Acquired in 2021 (millions) | |||||||||||||||||||||||||||||||||||||||||
| Property Name | Ownership Percentage | Property Type | City | State | Net Purchase Price (less closing costs(1) | Mortgage Debt | |||||||||||||||||||||||||||||||||||
| Port St. Lucie | 100.00% | Land | Port St. Lucie | FL | $ | 13.6 | $ | — | |||||||||||||||||||||||||||||||||
| Weston Business Center - E&F | 100.00% | Industrial | Weston | FL | 110.0 | — | |||||||||||||||||||||||||||||||||||
| Hudson Woodstock | 100.00% | Apartments | Woodstock | GA | 147.6 | — | |||||||||||||||||||||||||||||||||||
| AmpliFi | 100.00% | Apartments | Fullerton | CA | 168.2 | — | |||||||||||||||||||||||||||||||||||
| Jackson Shaw Forward Portfolio | 100.00% | Industrial | San Antonio | TX | 27.0 | — | |||||||||||||||||||||||||||||||||||
| Total Wholly-Owned | $ | 580.8 | $ | — | |||||||||||||||||||||||||||||||||||||
| Joint Ventures | |||||||||||||||||||||||||||||||||||||||||
Juniper MOB Portfolio(4) | 50.00% | Office | Various | U.S.A | $ | 90.1 | $ | — | |||||||||||||||||||||||||||||||||
Storage Portfolio IV(5) | 90.00% | Storage | Various | U.S.A | 360.1 | $ | — | ||||||||||||||||||||||||||||||||||
| The Row at the Stadium | 98.50% | Apartments | Columbia | SC | 54.6 | $ | — | ||||||||||||||||||||||||||||||||||
TREA NW Forum at Carlsbad JV LLC(6) | 50.00% | Retail | Carlsbad | CA | 92.9 | $ | 57.0 | ||||||||||||||||||||||||||||||||||
| 735 Watkins Mill | 50.00% | Land | Gaithersburg | MD | 5.9 | $ | — | ||||||||||||||||||||||||||||||||||
| Castleforbes | 51.00% | Land | North Docklands | Dublin | 34.7 | $ | — | ||||||||||||||||||||||||||||||||||
Seavest MOB Portfolio(7) | 98.30% | Office | Various | U.S.A | 414.0 | $ | 165.3 | ||||||||||||||||||||||||||||||||||
| Total Joint Ventures | $ | 1,052.3 | $ | 222.3 | |||||||||||||||||||||||||||||||||||||
| Total Properties Acquired | $ | 1,633.1 | $ | 222.3 | |||||||||||||||||||||||||||||||||||||
Property Investments Sold in 2021 (millions) | |||||||||||||||||||||||||||||||||||||||||
| Property Name | Ownership Percentage | Property Type | City | State | Net Sales Price (less selling expense)(2) | Mortgage Loan Payoff | |||||||||||||||||||||||||||||||||||
| Wholly-Owned | |||||||||||||||||||||||||||||||||||||||||
| Pacific Plaza | 100.00% | Office | San Diego | CA | $ | 122.0 | $ | — | |||||||||||||||||||||||||||||||||
Ascent at Windward(8) | 100.00% | Apartments | Alpharetta | GA | 0.4 | 34.6 | |||||||||||||||||||||||||||||||||||
| Palomino Park | 100.00% | Apartments | Highlands | CO | 433.4 | — | |||||||||||||||||||||||||||||||||||
| Bellevue Place | 100.00% | Retail | Nashville | TN | 10.3 | — | |||||||||||||||||||||||||||||||||||
| Woodstock Square | 100.00% | Retail | Woodstock | GA | 37.5 | — | |||||||||||||||||||||||||||||||||||
| Newnan Pavilion | 100.00% | Retail | Newnan | GA | 41.3 | — | |||||||||||||||||||||||||||||||||||
The Forum at Carlsbad(9) | 100.00% | Retail | Carlsbad | CA | 178.8 | 82.8 | |||||||||||||||||||||||||||||||||||
| Fort Point Creative Exchange Portfolio | 100.00% | Office | Boston | MA | 72.7 | — | |||||||||||||||||||||||||||||||||||
| Eisenhower Crossing | 100.00% | Retail | Macon | GA | 11.4 | — | |||||||||||||||||||||||||||||||||||
| The Palantine | 100.00% | Apartments | Arlington | VA | — | 73.2 | |||||||||||||||||||||||||||||||||||
| Total Wholly-Owned | $ | 907.8 | $ | 190.6 | |||||||||||||||||||||||||||||||||||||
| Joint Ventures | |||||||||||||||||||||||||||||||||||||||||
Florida Retail Portfolio(10) | 80.00% | Retail | Palm Harbor | FL | $ | 19.7 | $ | — | |||||||||||||||||||||||||||||||||
I-35 Logistics Center(11) | 95.00% | Land | Forth Worth | TX | 15.2 | — | |||||||||||||||||||||||||||||||||||
| 1500 Owens | 49.90% | Office | San Francisco | CA | 81.7 | — | |||||||||||||||||||||||||||||||||||
| 409-499 Illinois St | 40.00% | Office | San Francisco | CA | 253.9 | — | |||||||||||||||||||||||||||||||||||
| 225 Binney Street | 70.00% | Office | Cambridge | MA | 330.4 | — | |||||||||||||||||||||||||||||||||||
| Total Joint Ventures | $ | 700.9 | $ | — | |||||||||||||||||||||||||||||||||||||
| Total Properties Sold | $ | 1,608.7 | $ | 190.6 | |||||||||||||||||||||||||||||||||||||
(1)The net purchase price represents the Account's interest.
54
Property Investments Sold in 2017 (in millions) | ||||||||||||||||
| Property Name | Ownership Percentage | Property Type | City | State | Net Sales Price (less selling expense) | Mortgages Paid | ||||||||||
| Wholly-Owned | ||||||||||||||||
| Mazza Gallerie | 100.00% | Retail | Washington | D.C. | $ | 74.3 | $ | — | ||||||||
Atlanta Industrial Portfolio(1) | 100.00% | Industrial | McDonough | GA | 39.1 | — | ||||||||||
Ontario Industrial Portfolio(1) | 100.00% | Industrial | Various | CA | 66.0 | — | ||||||||||
Rancho Cucamonga Industrial Portfolio(1) | 100.00% | Industrial | Various | CA | 104.8 | — | ||||||||||
| The Pepper Building | 100.00% | Apartments | Philadelphia | PA | 51.7 | — | ||||||||||
| Kierland Apartment Portfolio | 100.00% | Apartments | Scottsdale | AZ | 147.1 | — | ||||||||||
| The Caruth | 100.00% | Apartments | Dallas | TX | 82.2 | 45.0 | ||||||||||
| Total Wholly-Owned | $ | 565.2 | $ | 45.0 | ||||||||||||
| Joint Ventures | ||||||||||||||||
DDR - McFarland Plaza(2)(3) | 85.00% | Retail | Tuscaloosa | AL | $ | 14.7 | $ | 7.4 | ||||||||
DDR - Costco Plaza(2)(3) | 85.00% | Retail | White Marsh | MD | 11.0 | 8.9 | ||||||||||
| Total Joint Ventures | $ | 25.7 | $ | 16.3 | ||||||||||||
| Total | $ | 590.9 | $ | 61.3 | ||||||||||||
(2)The net sales price represents the Account's interest.
(3)Partial acquisition. The Account purchased Building 3 within Frontera Business Park, an industrial property wholly-owned by the Account.
(4)Partial acquisition. The Account purchased a 50% interest in ten office properties located throughout the United States. These properties will be held in the Juniper MOB Portfolio joint venture.
(5)The Account purchased a 90% interest in a portfolio of 27 storage properties located throughout the United States. These properties will be collectively known as Storage Portfolio IV.
(6)The Account sold 50% of its ownership in The Forum at Carlsbad to Northwood Investors. Concurrent with the sale, the Account and Northwood Investors formed a joint venture known as TREA NW Forum at Carlsbad JV LLC, each contributing 50% interest. The amount shown represents the Account's 50% interest in the joint venture.
(7)The Account's purchased a 98.3% interest in a portfolio of 11 office properties located throughout the United States. These properties will be collectively know as Seavest MOB Portfolio.
(8)The Account sold a small portion of land on the property to the City of Alpharetta for use in a road widening and improvement project.
(9)The Account sold 50% of its ownership in The Forum at Carlsbad to Northwood Investors. Concurrent with the sale, the Account and Northwood Investors formed a joint venture known as TREA NW Forum at Carlsbad JV LLC, each contributing 50% interest. The amounts shown represent the sale of the Account's wholly-owned investment.
(10)Partial sale. The Account sold a retail property within Florida Retail Portfolio.
(11)Partial sale. The Account sold Building 3 within I-35 Logistics Center.
Results of Operations
Year Ended December 31, 20172021 Compared to Year Ended December 31, 20162020
Years Ended December 31, | Change | ||||||||||||||
| 2017 | 2016 | $ | % | ||||||||||||
| INVESTMENT INCOME | |||||||||||||||
| Real estate income, net | |||||||||||||||
| Rental income | $ | 1,059.6 | $ | 1,009.0 | $ | 50.6 | 5.0 | % | |||||||
| Real estate property level expenses: | |||||||||||||||
| Operating expenses | 221.2 | 218.1 | 3.1 | 1.4 | % | ||||||||||
| Real estate taxes | 166.7 | 158.7 | 8.0 | 5.0 | % | ||||||||||
| Interest expense | 89.7 | 85.8 | 3.9 | 4.5 | % | ||||||||||
| Total real estate property level expenses | 477.6 | 462.6 | 15.0 | 3.2 | % | ||||||||||
| Real estate income, net | 582.0 | 546.4 | 35.6 | 6.5 | % | ||||||||||
| Income from real estate joint ventures and limited partnerships | 214.1 | 161.8 | 52.3 | 32.3 | % | ||||||||||
| Interest | 54.1 | 26.4 | 27.7 | 104.9 | % | ||||||||||
| Dividends | 26.3 | 32.5 | (6.2 | ) | (19.1 | )% | |||||||||
| TOTAL INVESTMENT INCOME | 876.5 | 767.1 | 109.4 | 14.3 | % | ||||||||||
| Expenses | |||||||||||||||
| Investment management charges | 72.0 | 72.6 | (0.6 | ) | (0.8 | )% | |||||||||
| Administrative charges | 59.3 | 62.1 | (2.8 | ) | (4.5 | )% | |||||||||
| Distribution charges | 25.7 | 27.7 | (2.0 | ) | (7.2 | )% | |||||||||
| Mortality and expense risk charges | 1.2 | 1.2 | — | — | % | ||||||||||
| Liquidity guarantee charges | 47.0 | 38.4 | 8.6 | 22.4 | % | ||||||||||
| TOTAL EXPENSES | 205.2 | 202.0 | 3.2 | 1.6 | % | ||||||||||
| INVESTMENT INCOME, NET | $ | 671.3 | $ | 565.1 | $ | 106.2 | 18.8 | % | |||||||
| Rental Income | Operating Expenses | Real Estate Taxes | ||||||||||||||||||||||||||||||||||
| Change | Change | Change | ||||||||||||||||||||||||||||||||||
| 2017 | 2016 | $ | % | 2017 | 2016 | $ | % | 2017 | 2016 | $ | % | |||||||||||||||||||||||||
| Same Property | $ | 971.1 | $ | 947.1 | $ | 24.0 | 2.5 | % | $ | 201.1 | $ | 199.5 | $ | 1.6 | 0.8 | % | $ | 151.7 | $ | 147.3 | $ | 4.4 | 3.0 | % | ||||||||||||
| Properties Acquired | 70.3 | 21.6 | 48.7 | N/M | 15.0 | 5.4 | 9.6 | N/M | 12.5 | 6.0 | 6.5 | N/M | ||||||||||||||||||||||||
| Properties Sold | 18.2 | 40.3 | (22.1 | ) | N/M | 5.1 | 13.2 | (8.1 | ) | N/M | 2.5 | 5.4 | (2.9 | ) | N/M | |||||||||||||||||||||
| Impact of Properties Acquired/Sold | 88.5 | 61.9 | 26.6 | N/M | 20.1 | 18.6 | 1.5 | N/M | 15.0 | 11.4 | 3.6 | N/M | ||||||||||||||||||||||||
| Total Property Portfolio | $ | 1,059.6 | $ | 1,009.0 | $ | 50.6 | 5.0 | % | $ | 221.2 | $ | 218.1 | $ | 3.1 | 1.4 | % | $ | 166.7 | $ | 158.7 | $ | 8.0 | 5.0 | % | ||||||||||||
Years Ended December 31, | Change | ||||||||||||||
| 2017 | 2016 | $ | % | ||||||||||||
| NET REALIZED AND UNREALIZED GAIN (LOSS) ON INVESTMENTS AND MORTGAGE LOANS PAYABLE | |||||||||||||||
| Net realized gain (loss) on investments: | |||||||||||||||
| Real estate properties | $ | 42.0 | $ | (6.2 | ) | $ | 48.2 | N/M | |||||||
| Real estate joint ventures and limited partnerships | (21.9 | ) | 0.6 | (22.5 | ) | N/M | |||||||||
| Marketable securities | 17.6 | 25.6 | (8.0 | ) | (31.3 | )% | |||||||||
| Total realized gain on investments: | 37.7 | 20.0 | 17.7 | 88.5 | % | ||||||||||
| Net change in unrealized appreciation on: | |||||||||||||||
| Real estate properties | 135.5 | 317.5 | (182.0 | ) | (57.3 | )% | |||||||||
| Real estate joint ventures and limited partnerships | 146.8 | 236.9 | (90.1 | ) | (38.0 | )% | |||||||||
| Marketable securities | 50.0 | 30.0 | 20.0 | 66.7 | % | ||||||||||
| Loans receivable | 1.2 | 0.3 | 0.9 | N/M | |||||||||||
| Mortgage loans payable | 15.9 | 15.1 | 0.8 | 5.3 | % | ||||||||||
| Net change in unrealized appreciation on investments and mortgage loans payable | 349.4 | 599.8 | (250.4 | ) | (41.7 | )% | |||||||||
| NET REALIZED AND UNREALIZED GAIN ON INVESTMENTS AND MORTGAGE LOANS PAYABLE | $ | 387.1 | $ | 619.8 | $ | (232.7 | ) | (37.5 | )% | ||||||
Net Investment Income
The following table shows the results of operations for the years ended December 31, 20162021 and 20152020 and the dollar and percentage changes for those periods (dollars in millions)(millions).
| Years Ended December 31, | Change | |||||||||||||||||||||||||
| 2021 | 2020 | $ | % | |||||||||||||||||||||||
| INVESTMENT INCOME | ||||||||||||||||||||||||||
| Real estate income, net | ||||||||||||||||||||||||||
| Rental income | $ | 1,194.8 | $ | 1,192.6 | $ | 2.2 | 0.2 | % | ||||||||||||||||||
| Real estate property level expenses: | ||||||||||||||||||||||||||
| Operating expenses | 266.9 | 261.1 | 5.8 | 2.2 | % | |||||||||||||||||||||
| Real estate taxes | 208.1 | 209.2 | (1.1) | (0.5) | % | |||||||||||||||||||||
| Interest expense | 90.5 | 97.5 | (7.0) | (7.2) | % | |||||||||||||||||||||
| Total real estate property level expenses | 565.5 | 567.8 | (2.3) | (0.4) | % | |||||||||||||||||||||
| Real estate income, net | 629.3 | 624.8 | 4.5 | 0.7 | % | |||||||||||||||||||||
| Income from real estate joint ventures | 191.1 | 146.8 | 44.3 | 30.2 | % | |||||||||||||||||||||
| Income from real estate funds | 15.9 | 10.4 | 5.5 | 52.9 | % | |||||||||||||||||||||
| Interest | 81.5 | 105.7 | (24.2) | (22.9) | % | |||||||||||||||||||||
| Dividends | — | 18.0 | (18.0) | (100.0) | % | |||||||||||||||||||||
| TOTAL INVESTMENT INCOME | 917.8 | 905.7 | 12.1 | 1.3 | % | |||||||||||||||||||||
| Expenses | ||||||||||||||||||||||||||
| Investment management charges | 62.4 | 65.3 | (2.9) | (4.4) | % | |||||||||||||||||||||
| Administrative charges | 51.1 | 48.5 | 2.6 | 5.4 | % | |||||||||||||||||||||
| Distribution charges | 26.2 | 26.5 | (0.3) | (1.1) | % | |||||||||||||||||||||
| Mortality and expense risk charges | 1.3 | 1.2 | 0.1 | 8.3 | % | |||||||||||||||||||||
| Liquidity guarantee charges | 69.1 | 59.4 | 9.7 | 16.3 | % | |||||||||||||||||||||
| TOTAL EXPENSES | 210.1 | 200.9 | 9.2 | 4.6 | % | |||||||||||||||||||||
| INVESTMENT INCOME, NET | $ | 707.7 | $ | 704.8 | $ | 2.9 | 0.4 | % | ||||||||||||||||||
The table below illustrates and compares rental income, operating expenses and real estate taxes for properties held by the Account for the entirety of each respective year, "same property," as compared to the comparative increases or decreases associated with the acquisition and disposition of properties throughout each respective year.
55
Years Ended December 31, | Change | ||||||||||||||
| 2016 | 2015 | $ | % | ||||||||||||
| INVESTMENT INCOME | |||||||||||||||
| Real estate income, net | |||||||||||||||
| Rental income | $ | 1,009.0 | $ | 919.1 | $ | 89.9 | 9.8 | % | |||||||
| Real estate property level expenses: | |||||||||||||||
| Operating expenses | 218.1 | 207.4 | 10.7 | 5.2 | % | ||||||||||
| Real estate taxes | 158.7 | 144.4 | 14.3 | 9.9 | % | ||||||||||
| Interest expense | 85.8 | 81.1 | 4.7 | 5.8 | % | ||||||||||
| Total real estate property level expenses | 462.6 | 432.9 | 29.7 | 6.9 | % | ||||||||||
| Real estate income, net | 546.4 | 486.2 | 60.2 | 12.4 | % | ||||||||||
| Income from real estate joint ventures and limited partnerships | 161.8 | 140.1 | 21.7 | 15.5 | % | ||||||||||
| Interest | 26.4 | 10.1 | 16.3 | N/M | |||||||||||
| Dividends | 32.5 | 47.5 | (15.0 | ) | (31.6 | )% | |||||||||
| TOTAL INVESTMENT INCOME | 767.1 | 683.9 | 83.2 | 12.2 | % | ||||||||||
| Expenses | |||||||||||||||
| Investment management charges | 72.6 | 69.3 | 3.3 | 4.8 | % | ||||||||||
| Administrative charges | 62.1 | 56.9 | 5.2 | 9.1 | % | ||||||||||
| Distribution charges | 27.7 | 23.9 | 3.8 | 15.9 | % | ||||||||||
| Mortality and expense risk charges | 1.2 | 1.1 | 0.1 | 9.1 | % | ||||||||||
| Liquidity guarantee charges | 38.4 | 31.7 | 6.7 | 21.1 | % | ||||||||||
| TOTAL EXPENSES | 202.0 | 182.9 | 19.1 | 10.4 | % | ||||||||||
| INVESTMENT INCOME, NET | $ | 565.1 | $ | 501.0 | $ | 64.1 | 12.8 | % | |||||||
| Rental Income | Operating Expenses | Real Estate Taxes | |||||||||||||||||||||||||||||||||||||||||||||
| Change | Change | Change | |||||||||||||||||||||||||||||||||||||||||||||
| 2021 | 2020 | $ | % | 2021 | 2020 | $ | % | 2021 | 2020 | $ | % | ||||||||||||||||||||||||||||||||||||
| Same Property | $ | 1,021.2 | $ | 1,016.4 | $ | 4.8 | 0.5 | % | $ | 230.5 | $ | 226.4 | $ | 4.1 | 1.8 | % | $ | 180.2 | $ | 179.9 | $ | 0.3 | 0.2 | % | |||||||||||||||||||||||
| Properties Acquired | 129.4 | 100.6 | 28.8 | 28.6 | % | 25.9 | 18.5 | 7.4 | 40.0 | % | 20.4 | 17.3 | 3.1 | 17.9 | % | ||||||||||||||||||||||||||||||||
| Properties Sold | 44.2 | 75.6 | (31.4) | (41.5) | % | 10.5 | 16.2 | (5.7) | (35.2) | % | 7.5 | 12.0 | (4.5) | (37.5) | % | ||||||||||||||||||||||||||||||||
| Impact of Properties Acquired/Sold | 173.6 | 176.2 | (2.6) | (1.5) | % | 36.4 | 34.7 | 1.7 | 4.9 | % | 27.9 | 29.3 | (1.4) | (4.8) | % | ||||||||||||||||||||||||||||||||
| Total Property Portfolio | $ | 1,194.8 | $ | 1,192.6 | $ | 2.2 | 0.2 | % | $ | 266.9 | $ | 261.1 | $ | 5.8 | 2.2 | % | $ | 208.1 | $ | 209.2 | $ | (1.1) | (0.5) | % | |||||||||||||||||||||||
N/M—Not meaningful
Rental Income:
Rental income increased $89.9$2.2 million, or 9.8%0.2%, as a result of net acquisition activity,primarily driven by increases across the industrial, apartment and retail sectors due to decreases in rent concessions and bad debt expenses which increased in 2020 due to the COVID-19 pandemic. The Account's hotel property also experienced an increase in income due to an increase in occupancy and higher rental rates primarily in the Eastern office sector.levels.
Operating Expenses:
Operating expenses increased $10.7$5.8 million, or 5.2%2.2%, primarily attributed to a rise in repairs and maintenance costs amongst office properties. These types of expenses are expected to continue to rise as usage of space increases with more and more people returning to the office as recovery from the COVID-19 pandemic continues. The apartment sector also experienced an increase in operating expenses as costs for services related to maintaining the properties increased.
Real Estate Taxes:
Real estate taxes decreased $1.1 million, or 0.5%, primarily attributed to net acquisitionsdisposition activity.
Interest Expense:
Interest expense decreased $7.0 million, or 7.2%, primarily due to a lower average interest rate on outstanding principal balances of loans payable, paired with a lower average outstanding principal balance of loans payable, as compared to the same period in 2020.
Income from Real Estate Joint Ventures:
Income from real estate joint ventures increased $44.3 million, or 30.2%, which is attributed to the Account's retail joint venture investments, most notably, a retail property located in Las Vegas, Nevada. The increases can be attributed to reduced COVID-19 restrictions, which promoted higher foot traffic at brick-and-mortar retail locations.
Income from Real Estate Funds:
Income from real estate funds increased $5.5 million, or 52.9%, when compared to 2020, as a result of the increase in investments in real estate funds, including the purchase of additional interests pursuant to existing commitments.
Interest and dividend income:
Interest income decreased $24.2 million, primarily attributed to the reduction of short-term securities held by the Account. The reduction was a result of an effort to fund heavy net participant outflows in 2020 due to the COVID-19 pandemic. Net participant outflows have since subsided and the Account has started to rebuild its short-term securities portfolio, reinvesting over $1.0 billion in government-issued securities and corporate bonds since the beginning of 2021. The Account did not have any dividend income in 2021 due to the sale of its REIT portfolio at the end of 2020.
Expenses:
Investment management, administrative and distribution costs charged to the Account are associated with managing the Account. Investment management charges are comprised primarily of fixed components, but fluctuate based on the size of the Account’s portfolio of investments, whereas administrative and distribution charges are comprised of
56
more variable components that generally correspond with movements in net assets. Both distribution services (pursuant to the Distribution Agreement) and administrative services are provided to the Account by Services and TIAA, respectively, on an at cost basis. These expenses decreased $0.6 million, a nominal change from the prior year.
Mortality and expense risk and liquidity guarantee expenses are contractual charges to the Account from TIAA for TIAA’s assumption of these risks and provision of the liquidity guarantee. The rate for these charges is established annually and is charged at a fixed rate based on the Account’s net assets. Mortality and expense risk expenses remained relatively flat between the comparative periods. Liquidity guarantee expenses increased $9.7 million as a result of the eight basis point increase to the liquidity guarantee expense charge that became effective on August 1, 2021.
Net Realized and Unrealized Gains and Losses on Investments and Loans Payable
The following table shows the net realized and unrealized (losses) gains on investments and loans payable for the years ended December 31, 2021 and 2020 and the dollar and percentage changes for those periods (millions).
| Years Ended December 31, | Change | |||||||||||||||||||||||||
| 2021 | 2020 | $ | % | |||||||||||||||||||||||
| NET REALIZED AND UNREALIZED GAIN (LOSS) ON INVESTMENTS AND LOANS PAYABLE | ||||||||||||||||||||||||||
| Net realized gain (loss) on investments: | ||||||||||||||||||||||||||
| Real estate properties | $ | 215.9 | $ | (52.8) | $ | 268.7 | N/M | |||||||||||||||||||
| Real estate joint ventures | 199.8 | (454.9) | 654.7 | N/M | ||||||||||||||||||||||
| Real estate funds | 3.5 | (5.6) | 9.1 | N/M | ||||||||||||||||||||||
| Marketable securities | (0.1) | 103.0 | (103.1) | N/M | ||||||||||||||||||||||
| Loans receivable | (14.1) | (1.6) | (12.5) | N/M | ||||||||||||||||||||||
| Total realized gain (loss) on investments | 405.0 | (411.9) | 816.9 | N/M | ||||||||||||||||||||||
| Net change in unrealized gain (loss) on: | ||||||||||||||||||||||||||
| Real estate properties | 2,250.3 | (296.1) | 2,546.4 | N/M | ||||||||||||||||||||||
| Real estate joint ventures | 644.5 | (22.2) | 666.7 | N/M | ||||||||||||||||||||||
| Real estate funds | 98.7 | (18.6) | 117.3 | N/M | ||||||||||||||||||||||
| Real estate operating business | 74.9 | (0.2) | 75.1 | N/M | ||||||||||||||||||||||
| Marketable securities | (9.2) | (148.1) | 138.9 | N/M | ||||||||||||||||||||||
| Loans receivable | 22.7 | (33.0) | 55.7 | N/M | ||||||||||||||||||||||
| Loans receivable with related parties | — | 0.4 | (0.4) | N/M | ||||||||||||||||||||||
| Loans payable | 12.2 | (3.1) | 15.3 | N/M | ||||||||||||||||||||||
| Net change in unrealized gain (loss) on investments and loans payable | 3,094.1 | (520.9) | 3,615.0 | N/M | ||||||||||||||||||||||
| NET REALIZED AND UNREALIZED GAIN (LOSS) ON INVESTMENTS AND LOANS PAYABLE | $ | 3,499.1 | $ | (932.8) | $ | 4,431.9 | N/M | |||||||||||||||||||
N/M—Not meaningful
Real Estate Properties:
Wholly-owned real estate investments experienced net realized and unrealized gains of $2.5 billion during 2021, compared to losses of $348.9 million during 2020. Net gains within the portfolio were primarily driven by strong appreciation across all real estate sectors, most notably in the Western industrial sector. Rising demand in the industrial sector has increased average market and contract rents.
Real Estate Joint Ventures:
Real estate joint ventures experienced net realized and unrealized gains of $844.3 million in 2021, compared to $477.1 million in net losses during 2020. Net gains are primarily attributed to the Account's joint venture investments in apartment properties, particularly student housing investments, which saw favorable valuations due to an increase in average market rents and decreased terminal capitalization rates. The Account's joint venture investments in storage properties also saw a large increase in appreciation, which is reflective of capitalization rate compression in the self-storage industry.
57
Real Estate Funds:
Real estate funds incurred net realized and unrealized gains of $102.2 million in 2021, compared to $24.2 million in net losses during 2020. Net gains in 2021 are a result of favorable valuations of real estate investments.funds, primarily attributed to COVID-19 market recovery.
Marketable Securities:
The Account’s marketable securities positions experienced net realized and unrealized losses of $9.3 million for the year ended December 31, 2021, compared to net realized and unrealized losses of $45.1 million for 2020. The change is a result of the short and intermediate-term nature of the Account's U.S. Treasuries, government agency notes and corporate bond holdings.
Loans Receivable, including those with related parties:
Loans receivable, including loans receivable with related parties, experienced net realized and unrealized gains of $8.6 million during the 2021 compared to losses of $34.2 million in 2020. Net gains are attributable to favorable valuations, one of which had been in an unrealized loss position for some time due to its default status but is now current.
Loans Payable:
Loans payable experienced unrealized gains of $12.2 million during 2021, compared to unrealized losses of $3.1 million during 2020. The unrealized gains in 2021 were attributable to increases in U.S. Treasury yields driven by inflation risk, partially offset by narrowing of credit spreads.
Year Ended December 31, 2020 Compared to Year Ended December 31, 2019
Net Investment Income
The following table shows the results of operations for the years ended December 31, 2020 and 2019 and the dollar and percentage changes for those periods (millions).
| Years Ended December 31, | Change | |||||||||||||||||||||||||
| 2020 | 2019 | $ | % | |||||||||||||||||||||||
| INVESTMENT INCOME | ||||||||||||||||||||||||||
| Real estate income, net | ||||||||||||||||||||||||||
| Rental income | $ | 1,192.6 | $ | 1,103.5 | $ | 89.1 | 8.1 | % | ||||||||||||||||||
| Real estate property level expenses: | ||||||||||||||||||||||||||
| Operating expenses | 261.1 | 237.5 | 23.6 | 9.9 | % | |||||||||||||||||||||
| Real estate taxes | 209.2 | 187.4 | 21.8 | 11.6 | % | |||||||||||||||||||||
| Interest expense | 97.5 | 105.7 | (8.2) | (7.8) | % | |||||||||||||||||||||
| Total real estate property level expenses | 567.8 | 530.6 | 37.2 | 7.0 | % | |||||||||||||||||||||
| Real estate income, net | 624.8 | 572.9 | 51.9 | 9.1 | % | |||||||||||||||||||||
| Income from real estate joint ventures and funds | 157.2 | 214.0 | (56.8) | (26.5) | % | |||||||||||||||||||||
| Interest | 105.7 | 173.0 | (67.3) | (38.9) | % | |||||||||||||||||||||
| Dividends | 18.0 | 23.2 | (5.2) | (22.4) | % | |||||||||||||||||||||
| TOTAL INVESTMENT INCOME | 905.7 | 983.1 | (77.4) | (7.9) | % | |||||||||||||||||||||
| Expenses | ||||||||||||||||||||||||||
| Investment management charges | 65.3 | 68.1 | (2.8) | (4.1) | % | |||||||||||||||||||||
| Administrative charges | 48.5 | 50.0 | (1.5) | (3.0) | % | |||||||||||||||||||||
| Distribution charges | 26.5 | 31.7 | (5.2) | (16.4) | % | |||||||||||||||||||||
| Mortality and expense risk charges | 1.2 | 1.3 | (0.1) | (7.7) | % | |||||||||||||||||||||
| Liquidity guarantee charges | 59.4 | 57.8 | 1.6 | 2.8 | % | |||||||||||||||||||||
| TOTAL EXPENSES | 200.9 | 208.9 | (8.0) | (3.8) | % | |||||||||||||||||||||
| INVESTMENT INCOME, NET | $ | 704.8 | $ | 774.2 | $ | (69.4) | (9.0) | % | ||||||||||||||||||
58
The table below illustrates and compares rental income, operating expenses and real estate taxes for properties held by the Account for the entirety of each respective year, "same property," as compared to the comparative increases or decreases associated with the acquisition and disposition of properties throughout each respective year.
N/M—Not meaningful
| Rental Income | Operating Expenses | Real Estate Taxes | |||||||||||||||||||||||||||||||||||||||||||||
| Change | Change | Change | |||||||||||||||||||||||||||||||||||||||||||||
| 2020 | 2019 | $ | % | 2020 | 2019 | $ | % | 2020 | 2019 | $ | % | ||||||||||||||||||||||||||||||||||||
| Same Property | $ | 976.4 | $ | 977.4 | $ | (1.0) | (0.1) | % | $ | 214.6 | $ | 212.1 | $ | 2.5 | 1.2 | % | $ | 175.4 | $ | 172.5 | $ | 2.9 | 1.7 | % | |||||||||||||||||||||||
| Properties Acquired | 187.8 | 22.2 | 165.6 | N/M | 41.7 | 4.9 | 36.8 | N/M | 30.5 | 3.4 | 27.1 | N/M | |||||||||||||||||||||||||||||||||||
| Properties Sold | 28.4 | 103.9 | (75.5) | — | 4.8 | 20.5 | (15.7) | — | 3.3 | 11.5 | (8.2) | — | |||||||||||||||||||||||||||||||||||
| Impact of Properties Acquired/Sold | 216.2 | 126.1 | 90.1 | 71.5 | % | 46.5 | 25.4 | 21.1 | — | 33.8 | 14.9 | 18.9 | N/M | ||||||||||||||||||||||||||||||||||
| Total Property Portfolio | $ | 1,192.6 | $ | 1,103.5 | $ | 89.1 | 8.1 | % | $ | 261.1 | $ | 237.5 | $ | 23.6 | 9.9 | % | $ | 209.2 | $ | 187.4 | $ | 21.8 | 11.6 | % | |||||||||||||||||||||||
Rental Income:
Rental income increased $89.1 million, or 8.1%, primarily driven by net acquisition activity, offset slightly by declines in income from retail properties resulting from shut-downs related to the COVID-19 pandemic.
Operating Expenses:
Operating expenses increased $23.6 million, or 9.9%, primarily attributed to net acquisition activity and modest increases to expenses across the apartment and industrial portfolios. These increases were partially offset by a decline in operating expenses related to office properties, as many still remain closed due to the COVID-19 pandemic with plans to continue working remotely into 2021.
Real Estate Taxes:
Real estate taxes increased $14.3$21.8 million, or 9.9%. Increases were11.6%, primarily associated with theattributed to net acquisitions of real estate investments. An additional factor to the increase was higheracquisition activity as well as rising property tax assessments resulting from increases in values across the real estateAccount's portfolio, particularly inmost notably within the Easternoffice and Western office sector.apartment sectors.
Interest Expense:
Interest expense increased $4.7decreased $8.2 million, or 5.8%7.8%, primarily due to a higherlower average interest rate on outstanding principal balance on mortgagebalances of loans payable.payable as compared to the same period in 2019.
Income from Real Estate Joint Ventures and Limited Partnerships:Funds:
Income from real estate joint ventures and limited partnerships increased $21.7funds decreased $56.8 million, or 15.5%26.5%, which is attributed primarily related to netthe full acquisition activity. The Account acquired over $1.1 billionof DDRTC Core Retail Fund LLC in the first quarter of 2020, which changed balance sheet classification from joint venture to wholly-owned, paired with a decline in income from multiple retail investments, which have struggled during the year.year due to the ongoing COVID-19 pandemic.
Interest and Dividend Income:dividend income:
Interest income increased as a resultdecreased $67.3 million, primarily attributed to the reduction of short-term securities held by the Account’s investment in loans receivable, while dividendAccount. Dividend income decreased proportionately with$5.2 million due to the Account's averageAccount selling its remaining REIT holdings.
Expenses:
Mortality and expense risk and liquidity guarantee chargesexpenses are contractual charges to the Account from TIAA for TIAA’s assumption of these risks.risks and provision of the liquidity guarantee. The rate for these charges generally is established annually; the currentannually and are charged at a fixed rate is effective May 1, 2016 through April 30, 2017, and is charged based on the Account’s net assets. These expenses increased $1.5 million, or 2.5%, as a result of the four basis point increase to the expense charge for the liquidity guarantee in 2019, which became effective on August 1, 2019, partially offset by the decline in average net assets.
59
Net Realized and Unrealized Gains and Losses on Investments and Mortgage Loans Payable
The following table shows the net realized and unrealized (losses) gains (losses) on investments and mortgage loans payable for the years ended December 31, 20162020 and 20152019 and the dollar and percentage changes for those periods (dollars in millions)(millions).
Years Ended December 31, | Change | ||||||||||||||
| 2016 | 2015 | $ | % | ||||||||||||
| NET REALIZED AND UNREALIZED GAIN (LOSS) ON INVESTMENTS AND MORTGAGE LOANS PAYABLE | |||||||||||||||
| Net realized gain (loss) on investments: | |||||||||||||||
| Real estate properties | $ | (6.2 | ) | $ | 215.4 | $ | (221.6 | ) | N/M | ||||||
| Real estate joint ventures and limited partnerships | 0.6 | 167.3 | (166.7 | ) | (99.6 | )% | |||||||||
| Marketable securities | 25.6 | 235.8 | (210.2 | ) | (89.1 | )% | |||||||||
| Total realized gain on investments: | 20.0 | 618.5 | (598.5 | ) | (96.8 | )% | |||||||||
| Net change in unrealized appreciation (depreciation) on: | |||||||||||||||
| Real estate properties | 317.5 | 487.2 | (169.7 | ) | (34.8 | )% | |||||||||
| Real estate joint ventures and limited partnerships | 236.9 | 288.6 | (51.7 | ) | (17.9 | )% | |||||||||
| Marketable securities | 30.0 | (255.1 | ) | 285.1 | N/M | ||||||||||
| Loans receivable | 0.3 | 0.6 | (0.3 | ) | (50.0 | )% | |||||||||
| Mortgage loans payable | 15.1 | 5.6 | 9.5 | N/M | |||||||||||
| Net change in unrealized appreciation on investments and mortgage loans payable | 599.8 | 526.9 | 72.9 | 13.8 | % | ||||||||||
| NET REALIZED AND UNREALIZED GAIN ON INVESTMENTS AND MORTGAGE LOANS PAYABLE | $ | 619.8 | $ | 1,145.4 | $ | (525.6 | ) | (45.9 | )% | ||||||
| Years Ended December 31, | Change | |||||||||||||||||||||||||
| 2020 | 2019 | $ | % | |||||||||||||||||||||||
| NET REALIZED AND UNREALIZED GAIN (LOSS) ON INVESTMENTS AND LOANS PAYABLE | ||||||||||||||||||||||||||
| Net realized gain (loss) on investments: | ||||||||||||||||||||||||||
| Real estate properties | $ | (52.8) | $ | 583.1 | $ | (635.9) | N/M | |||||||||||||||||||
| Real estate joint ventures and funds | (460.5) | (114.4) | (346.1) | N/M | ||||||||||||||||||||||
| Marketable securities | 103.0 | 301.1 | (198.1) | (65.8) | % | |||||||||||||||||||||
| Loans receivable | (1.6) | — | (1.6) | N/M | ||||||||||||||||||||||
| TOTAL REALIZED (LOSS) GAIN ON INVESTMENTS | (411.9) | 769.8 | (1,181.7) | N/M | ||||||||||||||||||||||
| Net change in unrealized gain (loss) on: | ||||||||||||||||||||||||||
| Real estate properties | (296.1) | (56.8) | (239.3) | N/M | ||||||||||||||||||||||
| Real estate joint ventures and funds | (40.8) | 50.3 | (91.1) | N/M | ||||||||||||||||||||||
| Real estate operating business | (0.2) | — | (0.2) | N/M | ||||||||||||||||||||||
| Marketable securities | (148.1) | 0.7 | (148.8) | N/M | ||||||||||||||||||||||
| Loans receivable | (33.0) | (3.8) | (29.2) | N/M | ||||||||||||||||||||||
| Loans receivable with related parties | 0.4 | (0.3) | 0.7 | N/M | ||||||||||||||||||||||
| Loans payable | (3.1) | (107.1) | 104.0 | (97.1) | % | |||||||||||||||||||||
| NET CHANGE IN UNREALIZED LOSS ON INVESTMENTS AND LOANS PAYABLE | (520.9) | (117.0) | (403.9) | N/M | ||||||||||||||||||||||
| NET REALIZED AND UNREALIZED (LOSS) GAIN ON INVESTMENTS AND LOANS PAYABLE | $ | (932.8) | $ | 652.8 | $ | (1,585.6) | N/M | |||||||||||||||||||
Real Estate Properties:
Real Estate Joint Ventures and Limited Partnerships:Funds:
Marketable Securities:
The Account’s marketable securities positions experienced net realized and unrealized gainslosses of $55.6$45.1 million for the year ended December 31, 20162020, compared to net realized and unrealized lossesgains of $19.3$301.8 million for 2019. The performance of the year ended December 31, 2015. During 2016, the markets for REITs increasedAccount’s REIT portfolio was generally in the U.S. as measured byline with the FTSE NAREIT All Equity REITs Index;Index during the Account’s real estate related equity securities were in line with these market movements.
Loans Receivable, including those with related parties:
Loans receivable, including loans receivable with related parties, experienced net realized and unrealized losses of $34.2 million during the 2020 compared to losses of $4.1 million in 2019. Net losses are attributed to uncertainty caused by the COVID-19 pandemic, as the market has growing concern that cash flow from real estate collateral will be insufficient to cover debt service, most notably mezzanine loans collateralized by office and hospitality properties.
60
Loans Payable:
Liquidity and Capital Resources
As of December 31, 20172021 and 2016,2020, the Account’s cash and cash equivalents and non-real estate-related marketable securities had a value of $3.9$2.2 billion and $4.1$0.8 billion, respectively (15.6%(7.9% and 16.7%3.3% of the Account’s net assets at such dates, respectively).
Liquidity Guarantee
Management cannot predict whether any future TIAA liquidity unit purchases will be required under this liquidity guarantee. If net outflows were to occur (even if not at the same intensity as they did in 2008 and early 2009),2020, it could have a negative impact on the Account’s operations and returns and could require TIAA to purchase additional liquidity units, perhaps to a significant degree, as was the case in late 2008 and early 2009.
TIAA’s obligation to provide Account participantscontract owners liquidity through purchases of liquidity units is not subject to an express regulatory or contractual limitation, although as described in the following paragraph, the independent fiduciary may (but is not obligated to) require the reduction of TIAA’s interest through sales of assets from the Account if TIAA’s interest exceeds the trigger point. Even if the independent fiduciary so requires TIAA’s obligation to provide liquidity under the guarantee, which is required by the New York State Department of Financial Services, will continue. Management believes that TIAA has the ability to meet its obligations under this liquidity guarantee.
Whenever TIAA owns liquidity units, the duties of the Account’s independent fiduciary, as part of its monitoring of the Account, include reviewing the purchase and redemption of liquidity units by TIAA to ensure the Account uses the correct accumulation unit values. In addition, the independent fiduciary’s responsibilities include:
•establishing the percentage of total accumulation units that TIAA’s ownership should not exceed (the “trigger point”) and creating a method for reviewing the trigger point;
•approving any adjustment of TIAA’s ownership interest in the Account and, in its discretion, requiring an adjustment if TIAA’s ownership of liquidity units reaches the trigger point; and
•once the trigger point has been reached, participating in any program to reduce TIAA’s ownership in the Account by utilizing cash flow or liquid investments in the Account, or by utilizing the proceeds from asset sales. If the independent fiduciary were to determine that TIAA’s ownership should be reduced following the trigger point, its role in participating in any asset sales program would include (i) participating in the selection of properties for sale, (ii) providing sales guidelines and (iii) approving those sales if, in the independent fiduciary’s opinion, such sales are desirable to reduce TIAA’s ownership of liquidity units.
In establishing the appropriate trigger point, including whether or not to require certain actions once the trigger point has been reached, the independent fiduciary will assess, among other things and to the extent consistent with the Prohibited Transaction Exemption (PTE 96-76) issued by the U.S. Department of Labor in 1996PTE 96-76 with respect to the
liquidity guarantee and the independent fiduciary’s duties under ERISA, the risk that a conflict of interest could arise due to the level of TIAA’s ownership interest in the Account.
61
Redemption of Liquidity Units. The independent fiduciary is vested with oversight and approval over any redemption of TIAA’s liquidity units, acting in the best interests of Real Estate Account participants.
As a general matter, the independent fiduciary may authorize or direct the redemption of all or a portion of liquidity units at any time and TIAA will request the approval of the independent fiduciary before any liquidity units are redeemed. Upon termination and liquidation of the Account (wind-up), any liquidity units held by TIAA will be the last units redeemed, unless the independent fiduciary directs otherwise.
Net Income and Marketable Securities
Net investment income continues to be an additional source of liquidity for the Account. Net investment income was $671.3$707.7 million for the year ended December 31, 20172021 as compared to $565.1$704.8 million during 2016.in the prior year. Total net investment income increased slightly as described more fully in the Results of Operations section.
Leverage
As of December 31, 2017, cash and cash equivalents, along with real estate-related and non-real estate-related marketable securities comprised 20.6% of the Account’s net assets. The Account’s real estate-related marketable securities primarily consist of publicly traded REITs. The Account’s liquid assets continue to be available to purchase suitable real estate properties, meet the Account’s debt obligations, expense needs, and participant redemption requests (i.e., participant withdrawals or benefit payments).
As of December 31, 2017, there2021, total principal and interest payments due for mortgages on properties held directly by the account, and five collateralized by a loan receivable, are no mortgage obligations secured by real estate investments wholly-owned$2.4 billion and $315.7 million, respectively. See Contractual Obligations table below for future payment schedule. Principal and interest payments due in the next twelve months for mortgages on properties held directly by the Account maturing within the next twelve months.are $270.7 million and $85.9 million, respectively. The Account currently has sufficient liquidity in the form of cash and cash equivalents and short term securities to meet its current mortgage obligations.
The Account's Credit Agreement, which is a $500.0 million unsecured revolving credit loan, is used to facilitate short-term cash needs. As of December 31, 2021, the Account had $500.0 million outstanding on the line of credit.
In times of high net inflow activity, in particular during times of high net participantcontract owner transfer inflows, management may determine to apply a portion of such cash flows to make prepayments of indebtedness prior to scheduled maturity, which would have the effect of reducing the Account’s loan-to-value ratio.
Contractual Obligations(1)
The following table sets forth a summary regarding the Account’s known contractual obligations, including required interest payments for those items that are interest bearing, as of December 31, 2021 (millions):
| Amounts Due During Years Ending December 31, | ||||||||||||||||||||||||||||||||||||||||||||
| 2022 | 2023 | 2024 | 2025 | 2026 | Thereafter | Total | ||||||||||||||||||||||||||||||||||||||
| Loans Payable: | ||||||||||||||||||||||||||||||||||||||||||||
| Principal Payments | $ | 270.7 | $ | 523.1 | $ | 245.6 | $ | 621.4 | $ | 170.2 | $ | 531.6 | $ | 2,362.6 | ||||||||||||||||||||||||||||||
Interest Payments(2) | 81.1 | 65.8 | 54.3 | 37.8 | 22.8 | 45.9 | 307.7 | |||||||||||||||||||||||||||||||||||||
| Total Loans Payable | $ | 351.8 | $ | 588.9 | $ | 299.9 | $ | 659.2 | $ | 193.0 | $ | 577.5 | $ | 2,670.3 | ||||||||||||||||||||||||||||||
Ground Leases(3) | 2.3 | 2.3 | 2.4 | 2.4 | 2.4 | 414.0 | 425.8 | |||||||||||||||||||||||||||||||||||||
Other Commitments(4) | 486.8 | — | — | — | — | — | 486.8 | |||||||||||||||||||||||||||||||||||||
Tenant improvements(5) | 69.3 | — | — | — | — | — | 69.3 | |||||||||||||||||||||||||||||||||||||
| Total Contractual Obligations | $ | 910.2 | $ | 591.2 | $ | 302.3 | $ | 661.6 | $ | 195.4 | $ | 991.5 | $ | 3,652.2 | ||||||||||||||||||||||||||||||
(1)The contractual obligations do not include payments on the line of credit, due to its short-term nature, or payments on debt held in joint ventures, which are the obligation of the individual joint venture entities.
(2)These amounts represent interest payments due on loans payable based on the stated rates at December 31, 2021.
62
(3)These amounts represent future minimum annual payments related to ground leases at December 31, 2021.
(4)This includes the Account’s commitment to purchase interest in its real estate funds and remaining funding commitments on loans receivable, which could be called by the partner or borrower at any time.
(5)This amount represents tenant improvements and leasing inducements committed by the Account as of December 31, 2021.
Recent Transactions
The following describes property and property-related transactions by the Account during the fourth quarter of 2017.2021. Except as noted, the expenses for operating the properties purchased are either borne or reimbursed, in whole or in part, by the property tenants, although the terms vary under each lease.
Real Estate Properties and Joint Ventures
Purchases
| Property Name | Purchase Date | Ownership Percentage | Sector | Location | Net Purchase Price (1) | |||||||||||||||||||||||||||
| 735 Watkins Mill | 10/01/2021 | 50.00% | Land | Gaithersburg, MD | $ | 5.9 | ||||||||||||||||||||||||||
Storage Portfolio IV(2) | 10/06/2021 | 90.00% | Storage | Phoenix, AZ | 17.3 | |||||||||||||||||||||||||||
| Weston Business Center - E&F | 10/14/2021 | 100.00% | Industrial | Weston, FL | 110.0 | |||||||||||||||||||||||||||
Dry Creek(3) | 10/21/2021 | 50.00% | Office | Englewood, CO | 11.5 | |||||||||||||||||||||||||||
Storage Portfolio IV(2) | 11/02/2021 | 90.00% | Storage | Sugarland, TX | 11.8 | |||||||||||||||||||||||||||
| Castleforbes | 11/15/2021 | 51.00% | Land | Dublin, Republic of Ireland | 34.7 | |||||||||||||||||||||||||||
| Hudson Woodstock | 11/17/2021 | 100.00% | Apartments | Woodstock, GA | 147.6 | |||||||||||||||||||||||||||
| AmpliFi | 12/01/2021 | 100.00% | Apartments | Fullerton, CA | 168.2 | |||||||||||||||||||||||||||
Storage Portfolio IV(2) | 12/06/2021 | 90.00% | Storage | Orlando, FL | 14.6 | |||||||||||||||||||||||||||
Storage Portfolio IV(2) | 12/06/2021 | 90.00% | Storage | St. Cloud, FL | 17.1 | |||||||||||||||||||||||||||
Storage Portfolio IV(2) | 12/08/2021 | 90.00% | Storage | Palmdale, CA | 15.4 | |||||||||||||||||||||||||||
Sonterra Medical Park(3) | 12/10/2021 | 50.00% | Office | San Antonio, TX | 21.0 | |||||||||||||||||||||||||||
| Jackson Shaw Forward Portfolio | 12/15/2021 | 100.00% | Industrial | San Antonio, TX | 27.0 | |||||||||||||||||||||||||||
Storage Portfolio IV(2) | 12/16/2021 | 90.00% | Storage | Missouri City, TX | 17.2 | |||||||||||||||||||||||||||
Storage Portfolio IV(2) | 12/16/2021 | 90.00% | Storage | Englewood, CO | 13.3 | |||||||||||||||||||||||||||
Storage Portfolio IV(2) | 12/17/2021 | 90.00% | Storage | Zion, IL | 10.9 | |||||||||||||||||||||||||||
Storage Portfolio IV(2) | 12/17/2021 | 90.00% | Storage | Cicero, IL | 6.4 | |||||||||||||||||||||||||||
Storage Portfolio IV(2) | 12/22/2021 | 90.00% | Storage | Avon, CT | 19.8 | |||||||||||||||||||||||||||
Grandview Physicians Plaza(4) | 12/22/2021 | 98.30% | Office | Birmingham, AL | 94.1 | |||||||||||||||||||||||||||
Arapahoe Medical Plaza I(4) | 12/22/2021 | 98.30% | Office | Littleton, CO | 23.6 | |||||||||||||||||||||||||||
Arapahoe Medical Plaza II(4) | 12/22/2021 | 98.30% | Office | Littleton, CO | 11.3 | |||||||||||||||||||||||||||
Lincoln Court Medical Pavilion(4) | 12/22/2021 | 98.30% | Office | Littleton, CO | 6.8 | |||||||||||||||||||||||||||
Storage Portfolio IV(2) | 12/23/2021 | 90.00% | Storage | Bronx, NY | 14.2 | |||||||||||||||||||||||||||
Storage Portfolio IV(2) | 12/28/2021 | 90.00% | Storage | Clayton, NC | 18.1 | |||||||||||||||||||||||||||
Kirkwood Professional Plaza(4) | 12/28/2021 | 98.30% | Office | Dearborn, MI | 60.3 | |||||||||||||||||||||||||||
NYU Medical Plaza(4) | 12/28/2021 | 98.30% | Office | Bethpage, NY | 30.4 | |||||||||||||||||||||||||||
AHN Brentwood(4) | 12/28/2021 | 98.30% | Office | Brentwood, PA | 43.4 | |||||||||||||||||||||||||||
AHN Harmar(4) | 12/28/2021 | 98.30% | Office | Harmar, PA | 20.8 | |||||||||||||||||||||||||||
AHN Hempfield(4) | 12/28/2021 | 98.30% | Office | Greensburg, PA | 52.3 | |||||||||||||||||||||||||||
AHN McCandless(4) | 12/28/2021 | 98.30% | Office | McCandless, PA | 36.6 | |||||||||||||||||||||||||||
Common Street Professional Building(3) | 12/29/2021 | 50.00% | Office | New Braunfels, TX | 4.4 | |||||||||||||||||||||||||||
Sonterra Medical IV(3) | 12/29/2021 | 50.00% | Office | San Antonio, TX | 3.1 | |||||||||||||||||||||||||||
Loker Medical Arts Pavilion(4) | 12/29/2021 | 98.30% | Office | Los Angeles, CA | 34.4 | |||||||||||||||||||||||||||
(1) The net purchase price represents the purchase price and closing costs.
(2) During the fourth quarter of 2021, the Account purchased multiple storage properties located in various cities throughout the United States. These properties are held in the Account's Storage Portfolio IV joint venture investment, in which the Account has a 90% interest.
(3) Property held in Juniper MOB Portfolio.
(4) Property held in Seavest MOB Portfolio.
63
| Property Name | Purchase Date | Ownership Percentage | Sector | Location | Net Purchase Price (1) | |||||||
| Bridgepointe Shopping Center | 11/10/2017 | 100.00% | Retail | San Mateo, CA | $ | 124.1 | ||||||
| Frontera Industrial Business Park | 11/16/2017 | 100.00% | Industrial | San Diego, CA | 56.0 | |||||||
| Allure at Camarillo | 11/30/2017 | 100.00% | Apartments | Camarillo, CA | 59.7 | |||||||
Storage Portfolio II (2)(3) | 11/30/2017 | 90.00% | Storage | Various, U.S.A. | 267.5 | |||||||
| 9625 Towne Centre Drive | 12/19/2017 | 35.86% | Land | San Diego, CA | 13.8 | |||||||
| Campus Pointe 3 | 12/19/2017 | 45.00% | Land | San Diego, CA | 13.0 | |||||||
| Campus Pointe 4 | 12/28/2017 | 45.00% | Office | San Diego, CA | 8.7 | |||||||
| Property Name | Sales Date | Ownership Percentage | Sector | Location | Net Sales Price (1) | Realized Gain on Sale(2) | |||||||||||||||||||||||||||||
| 1500 Owens | 10/05/2021 | 49.90% | Office | San Francisco, CA | $ | 81.7 | $ | 7.7 | |||||||||||||||||||||||||||
| 409-499 Illinois Street | 10/05/2021 | 40.00% | Office | San Francisco, CA | 253.9 | 51.7 | |||||||||||||||||||||||||||||
Fort Point Creative Exchange Portfolio(3) | 12/15/2021 | 100.00% | Office | Boston, MA | 72.7 | 22.4 | |||||||||||||||||||||||||||||
| Eisenhower Crossing | 12/17/2021 | 100.00% | Retail | Macon, GA | 11.4 | 0.8 | |||||||||||||||||||||||||||||
| 225 Binney Street | 12/23/2021 | 70.00% | Office | Cambridge, MA | 330.4 | 140.3 | |||||||||||||||||||||||||||||
(1) The net sales price represents the sales price, less selling expenses.
(2) Majority of the realized gain has been previously recognized as unrealized gains in the Account's Consolidated Statements of Operations.
(3) Partial disposition.
Loans Receivable
Originations
| Transaction Date | Interest Rate | Sector | Maturity Date | Amount | ||||||||||||||||||||||||||||
| Sixth & Main | 10/20/2021 | 3.85% + LIBOR | Office | 11/09/2025 | $ | 67.4 | ||||||||||||||||||||||||||
Financings
Assumption of debt
| Property Name | Transaction Date | Interest Rate | Sector | Maturity Date | Principal Amount | |||||||||||||||||||||||||||
| Grandview Physicians Plaza | 12/22/2021 | 1.50% + LIBOR | Office | 11/16/2023 | $ | 35.2 | ||||||||||||||||||||||||||
| Arapahoe Medical Plaza I | 12/22/2021 | 1.95% + LIBOR | Office | 03/05/2026 | 10.6 | |||||||||||||||||||||||||||
| Arapahoe Medical Plaza II | 12/22/2021 | 1.95% + LIBOR | Office | 03/05/2026 | 5.0 | |||||||||||||||||||||||||||
| Lincoln Court Medical Pavilion | 12/22/2021 | 2.35% + LIBOR | Office | 10/15/2022 | 1.8 | |||||||||||||||||||||||||||
| Kirkwood Professional Plaza | 12/28/2021 | 4.87% | Office | 11/30/2027 | 22.1 | |||||||||||||||||||||||||||
| NYU Medical Plaza | 12/28/2021 | 2.50% + LIBOR | Office | 12/22/2026 | 11.8 | |||||||||||||||||||||||||||
| AHN Brentwood | 12/28/2021 | 2.70% | Office | 09/29/2025 | 17.3 | |||||||||||||||||||||||||||
| AHN Harmar | 12/28/2021 | 2.70% | Office | 09/29/2025 | 9.2 | |||||||||||||||||||||||||||
| AHN Hempfield | 12/28/2021 | 2.70% | Office | 09/25/2025 | 24.2 | |||||||||||||||||||||||||||
| AHN McCandless | 12/28/2021 | 2.70% | Office | 09/29/2025 | 15.4 | |||||||||||||||||||||||||||
| Loker Medical Arts Pavilion | 12/29/2021 | 2.10% + LIBOR | Office | 06/14/2024 | 12.7 | |||||||||||||||||||||||||||
New debt
| Transaction Date | Interest Rate | Sector | Maturity Date | Principal Amount | ||||||||||||||||||||||||||||
| Spring House Innovation Park | 11/23/2021 | 1.25% + LIBOR | Office | 07/09/2024 | $ | 40.0 | ||||||||||||||||||||||||||
| Reserve at Chino Hills | 11/12/2021 | 1.50% + LIBOR | Apartment | 08/09/2025 | 68.2 | |||||||||||||||||||||||||||
| Sixth & Main | 12/08/2021 | 1.87% + LIBOR | Office | 11/09/2025 | 40.4 | |||||||||||||||||||||||||||
Debt payoff
| Property Name | Transaction Date | Interest Rate | Sector | Maturity Date | Principal Amount | |||||||||||||||||||||||||||
| Ascent at Windward | 10/01/2021 | 3.51% | Apartment | 01/01/2022 | $ | 34.6 | ||||||||||||||||||||||||||
| The Palantine | 10/11/2021 | 4.25% | Apartment | 01/10/2022 | 73.2 | |||||||||||||||||||||||||||
64
Other
| Transaction Date | Transaction Type | Transaction Amount | ||||||||||||||||||
| Line of | ||||||||||||||||||||
| Property Name | Sales Date | Ownership Percentage | Sector | Location | Net Sales Price (1) | Realized Gain (Loss) on Sale(2) | |||||||||
| Kierland Apartment Portfolio | 10/27/2017 | 100.00% | Apartments | Scottsdale, AZ | $ | 147.1 | $ | (27.2 | ) | ||||||
The Caruth (3) | 11/13/2017 | 100.00% | Apartments | Dallas, TX | 82.2 | 10.8 | |||||||||
DDR - Costco Plaza (4) | 12/21/2017 | 85.00% | Retail | White Marsh, MD | 11.0 | (12.3 | ) | ||||||||
| 11/16/2021 | Withdrawal | $ | 200.00 | ||||||||||||||
| 12/17/2021 | Withdrawal | 300.00 | ||||||||||||
| Property Name | Financing Date | Ownership Percentage | Sector | Location | Financing Amount(1) | |||||||
| The Caruth | 11/13/2017 | 100.00% | Apartments | Dallas, TX | $ | (45.0 | ) | |||||
Storage Portfolio II (2) | 11/30/2017 | 90.00% | Storage | Various, U.S.A. | 175.0 | |||||||
DDR - Costco Plaza | 12/21/2017 | 85.00% | Retail | White Marsh, MD | (8.9 | ) | ||||||
| Amounts Due During Years Ending December 31, | ||||||||||||||||||||||||||||
| 2018 | 2019 | 2020 | 2021 | 2022 | Thereafter | Total | ||||||||||||||||||||||
| Mortgage Loans Payable: | ||||||||||||||||||||||||||||
| Principal Payments | $ | 13.7 | $ | 107.2 | $ | 171.7 | $ | 125.0 | $ | 335.7 | $ | 1,485.3 | $ | 2,238.6 | ||||||||||||||
Interest Payments(2) | 86.7 | 85.4 | 80.3 | 71.5 | 62.3 | 150.7 | 536.9 | |||||||||||||||||||||
| Total Mortgage Loans Payable | $ | 100.4 | $ | 192.6 | $ | 252.0 | $ | 196.5 | $ | 398.0 | $ | 1,636.0 | $ | 2,775.5 | ||||||||||||||
Other Commitments(3) | 32.0 | — | — | — | — | — | 32.0 | |||||||||||||||||||||
Tenant improvements(4) | 47.6 | — | — | — | — | — | 47.6 | |||||||||||||||||||||
| Total Contractual Obligations | $ | 180.0 | $ | 192.6 | $ | 252.0 | $ | 196.5 | $ | 398.0 | $ | 1,636.0 | $ | 2,855.1 | ||||||||||||||
Critical Accounting PoliciesEstimates
Management’s discussion and analysis of the Account’s financial condition and results of operations is based on the Account’s consolidated financial statements,Consolidated Financial Statements, which have been prepared by management in accordance with GAAP. The preparation of the Account’s financial statements in conformity with GAAP requires management to make estimates and assumptions that affect the financial statementsreported amounts of assets, liabilities, income and disclosures. Someexpenses. Management considers the valuation of these estimatesreal estate properties and assumptions require applicationvaluation of difficult, subjective, and/or complex judgments about the effect of matters that are inherently uncertain and that may change in subsequent periods. Management evaluates its estimates and assumptions on an ongoing basis. Management bases its estimates on historical experience and on various other assumptions that it believesreal estate joint ventures to be reasonable undercritical accounting estimates because they involve a significant level of estimation uncertainty and have a material impact on the circumstances, theAccount’s financial condition and results of which form the basis for making judgments about the carrying values of assets and liabilities of the Account that are not readily apparent from other sources. Actual results may differ from these estimates under different assumptions or conditions.operations.
Valuation of Real Estate Properties—
Investments in real estate properties are stated at fair value, as determined in accordance with policies and procedures reviewed by the Investment Committeedetermination of the Board and in accordance with the responsibilitieswhich involves significant levels of the Board as a whole. Accordingly, the Account does not record depreciation. Determination of fair value involves judgment because the actual fair value of real estate can be determined only by negotiation between the parties in a sales transaction. The Account’s primary objective when valuing its real estate investments will be to produce a valuation that represents a reasonable estimate of the fair value of its investments. Implicit in the Account’s definition of fair value are the consummation of a sale as of a specified date and the passing of title from seller to buyer under conditions whereby:
Property and investment values are affected by, among other things, the availability of capital, occupancy rates, rental rates, and interest and inflation rates. As a result, determining real estate and investment values involves many assumptions. Key inputs and assumptions include, but are not limited to, rental income and expense amounts, related rental income and expense growth rates, capital expenditures, discount rates and capitalization rates. Valuation techniques include discounted cash flow analysis, prevailing marketdirect capitalization rates or multiples applied to earnings from the property,analysis, analysis of recent comparable sales transactions, actual sale negotiations and bona fide purchase offers received from third parties. Amounts ultimately realized from each investment may vary significantly from the fair value presented.
Valuation of Real Estate Joint Ventures—
Real estate joint ventures are stated at the fair value of the Account’s ownership interests of the underlying entities. The Account’s ownership interests are valued based on the fair value of the underlying real estate, any related mortgage loans payable, and other factors, such as ownership percentage, ownership rights, buy/sell agreements, distribution provisions and capital call obligations. Upon the dispositionThe fair value of all real estate investmentsheld by an investee entity, the Account will continue to state its equityjoint ventures is determined in the remaining net assets ofsame manner and involves the investee entity during the wind down period, if any, at fair value until the dissolution of the investee entity.
same judgment, uncertainties and assumptions described above in Valuation of Real Estate Limited Partnerships—Limited partnership interests are stated atProperties.
For further discussion of the Account’s valuation methodologies used to determine the fair value of the Account’s ownership in the partnership which are recorded based upon the changes in the net asset values of the limited partnershipsinvestments as determined from the financial statements of the limited partnerships when received by the Account. Prior to the receipt of the financial statements from the limited partnerships, the Account estimates the value of its interest in good faith and will from time to time seek input from the issuer or the sponsor of the investments. Since market quotations
ITEM 7A. QUANTITATIVE AND QUALITATIVE DISCLOSURES ABOUT MARKET RISK.
The Account’s real estate holdings, including real estate joint ventures, limited partnershipsfunds, an operating business and loans receivable including those with related parties, which, as of December 31, 2017,2021, represented 81.1%92.9% of the Account’s total investments, expose the Account to a variety of risks. These risks include, but are not limited to:
•General Real Estate Risk—The risk that the Account’s property values or rental and occupancy rates could go down due to general economic conditions, a weak market for real estate generally, disruptions in the credit and/or capital markets, or changing supply and demand for certain types of properties;
•Appraisal Risk—The risk that the sale price of an Account property (i.e., the value that would be determined by negotiations between independent parties) might differ substantially from its estimated or appraised value, leading to losses or reduced profits to the Account upon sale;
•Risk Relating to Property Sales—The risk that the Account might not be able to sell a property at a particular time for its full value, particularly in a poor market. This might make it difficult to raise cash quickly and also could lead to Account losses;
65
•Risks of Borrowing—The risk that interest rate changes may impact Account returns if the Account takes out a mortgage on a property, buys a property subject to a mortgage or holds a property subject to a mortgage, and hedging against such interest rate changes, if undertaken by the Account, may entail additional costs and be unsuccessful; and
•Foreign Currency Risk—The risk that the value of the Account’s foreign investments, related debt, or rental income could increase or decrease due to changes in foreign currency exchange rates or foreign currency exchange control regulations, and hedging against such currency changes, if undertaken by the Account, may entail additional costs and be unsuccessful.
The Account believes the diversification of its real estate portfolio, both geographically and by sector, along with its quarterly valuation procedure, helps manage the real estate and appraisal risks described above.
As of December 31, 2017, 18.9%2021, 7.1% of the Account’s total investments were comprised of marketable securities. Marketable securities may include high-quality debt instruments (i.e., government agency notes) and REIT securities. The Account's Consolidated Statements of Investments sets forth the general financial terms of these instruments, along with their fair values, as determined in accordance with procedures described earlier in Critical Accounting PoliciesEstimates section above and in Note 1–Organization and Significant Accounting Policies to the Account’s Consolidated Financial Statements included herewith. As of the date of this report,December 31, 2021, the Account does not invest in derivative financial investments, nor does the Account engage in any hedging activity, although it may do so in selected circumstances in the future.
Risks associated with investments in real estate-related liquid assets (which could include, from time to time, REIT securities and CMBS), and non-real estate-related liquid assets, including financial/credit risk, market volatility risk, interest rate volatility risk and deposit/money market risk.include the following:
•Financial/Credit Risk—The risk, for debt securities, that the issuer will not be able to pay principal and interest when due (and/or declare bankruptcy or be subject to receivership) and, for equity securities such as common or preferred stock, that the issuer’s current earnings will fall or that its overall financial soundness will decline, reducing the security’s value.
•Market Volatility Risk—The risk that the Account’s investments will experience price volatility due to changing conditions in the financial markets regardless of the credit quality or financial condition of the underlying issuer. This risk is particularly acute to the extent the Account holds equity securities, which have experienced significant short-term price volatility over the past year. Also, to the extent the Account holds debt securities, changes in overall interest rates can cause price fluctuations.
•Interest Rate Volatility—The risk that interest rate volatility may affect the Account’s current income from an investment.
•Deposit/Money Market Risk—The risk that, to the extent the Account’s cash held in bank deposit accounts exceeds federally insured limits as to that bank, the Account could experience losses if banks fail. The Account does not believe it has exposure to significant concentration of deposit risk. In addition, there is some risk that investments held in money market accounts can suffer losses.
In addition, to the extent the Account were to hold mortgage-backed securities (including commercial mortgage-backed securities) these securities are subject to prepayment risk or extension risk (i.e., the risk that borrowers will repay the loans earlier or later than anticipated). If the underlying mortgage assets experience faster than anticipated repayments of principal, the Account could fail to recoup some or all of its initial investment in these securities, since the original price paid by the Account was based in part on assumptions regarding the receipt of interest payments. If the underlying mortgage assets are repaid later than anticipated, the Account could lose the opportunity to reinvest the anticipated cash flows at a time when interest rates might be rising. The rate of prepayment depends on a variety of geographic, social and other functions, including prevailing market interest rates and general economic factors. The fair value of these securities is also highly sensitive to changes in interest rates. Note that the potential for appreciation, which could otherwise be expected to result from a decline in interest rates, may be limited by any increased prepayments. These securities may be harder to sell than other securities.
In addition to these risks, real estate equity securities (such as REIT stocks and mortgage-backed securities) would be subject to many of the same general risks inherent in real estate investing, making mortgage loans and investing
66
in debt securities. For more information on the risks associated with all of the Account’s investments, see Item“Item 1A. “RiskRisk Factors” in this Form 10-K.
ITEM 8. CONSOLIDATED FINANCIAL STATEMENTS AND SUPPLEMENTARY DATA.
INDEX TO CONSOLIDATED FINANCIAL STATEMENTS
TIAA REAL ESTATE ACCOUNT
| Page | |||||
68
REPORT OF MANAGEMENT RESPONSIBILITY
To the Participants of the TIAA Real Estate Account:
The accompanying consolidated financial statements of the TIAA Real Estate Account (“Account”) of Teachers Insurance and Annuity Association of America (“TIAA”) are the responsibility of TIAA’s management. They have been prepared in accordance with accounting principles generally accepted in the United States of America and have been presented fairly and objectively in accordance with such principles.
TIAA has established and maintains an effective system of internal controls over financial reporting designed to provide reasonable assurance that assets are properly safeguarded, that transactions are properly executed in accordance with management’s authorization, and to carry out the ongoing responsibilities of management for reliable consolidated financial statements. In addition, TIAA’s internal audit personnel provide regular reviews and assessments of the internal controls and operations of the Account, and the Senior Managing Director,Executive Vice President, Chief Auditor of Internal Audit regularly reports to the Audit Committee of the TIAA Board of Trustees.
The independent registered public accounting firm of PricewaterhouseCoopers LLP has audited the accompanying consolidated financial statements for the years ended December 31, 2017, 20162021, 2020 and 2015.2019. The report of the independent auditors reportregistered public accounting firm expresses an independent opinion on the fairness of presentation of the Account’s consolidated financial statements.
The Audit Committee of the TIAA Board of Trustees, comprised entirely of independent, non-management trustees, meets regularly with management, representatives of the independent registered public accounting firm and internal audit group personnel to review matters relating to financial reporting, internal controls and auditing. In addition to the annual independent audit of the Account’s consolidated financial statements, the New York State Insurance Department of Financial Services and other state insurance departments regularly examine the operations and consolidated financial statements of the Account as part of their periodic corporate examinations.
| March | /s/ | ||||
Executive Vice President | |||||
| (Principal Executive Officer) | |||||
| /s/ | |||||
| (Principal Financial and Accounting Officer) | |||||
69
REPORT OF THE AUDIT COMMITTEE
To the Participants of the TIAA Real Estate Account:
The TIAA Audit Committee (“Committee”) oversees the financial reporting process of the TIAA Real Estate Account (“Account”) on behalf of TIAA’s Board of Trustees. The Committee operates in accordance with a formal written charter (copies of which are available upon request) which describes the Audit Committee’s responsibilities. All members of the Committee are independent, as defined under the listing standards of the New York Stock Exchange.
Management has the primary responsibility for the Account’s Consolidated Financial Statements, development and maintenance of a strong system of internal controls and disclosure controls, and compliance with applicable laws and regulations. In fulfilling its oversight responsibilities, the Committee reviewed and approved the audit plans of the internal audit group and the independent registered public accounting firm in connection with their respective audits of the Account. The Committee also meets regularly with the internal audit group and the independent registered public accounting firm, both with and without management present, to discuss the results of their examinations, their evaluation of internal controls, and the overall quality of financial reporting. As required by its charter, the Committee will formally evaluate rotation of the independent registered public accounting firm whenever circumstances warrant, but in no event will the evaluation be less frequent than every ten years of the engagement.
The Committee reviewed and discussed the accompanying audited consolidated financial statementsConsolidated Financial Statements with management, including a discussion of the quality and appropriateness of the accounting principles and financial reporting practices followed, the reasonableness of significant judgments, and the clarity and completeness of disclosures in the consolidated financial statements. The Committee has also discussed the audited consolidated financial statementsConsolidated Financial Statements with PricewaterhouseCoopers LLP, the independent registered public accounting firm responsible for expressing an opinion on the conformity of these audited consolidated financial statementsConsolidated Financial Statements with accounting principles generally accepted in the United States of America.
The discussion with PricewaterhouseCoopers LLP focused on their judgments concerning the quality and appropriateness of the accounting principles and financial reporting practices followed by the Account, the clarity and completeness of the consolidated financial statementsaudited Consolidated Financial Statements and related disclosures, and other significant matters, such as any significant changes in accounting policies, internal controls, management judgments and estimates, and the nature of any uncertainties or unusual transactions. In addition, the Committee discussed with PricewaterhouseCoopers LLP, the auditors’ independence from management and the Account, and has received a written disclosure regarding such independence, as required by the Securities and Exchange Commission.
Based on the review and discussions referred to above, the Committee has approved the release of the accompanying audited consolidated financial statementsConsolidated Financial Statements for publication and filing with appropriate regulatory authorities.
Jason E. Brown, Audit Committee Member
Jeffrey R. Brown, Audit Committee Member
Maureen O’Hara, Audit Committee Member
Dorothy K. Robinson, Audit Committee Member
La June Montgomery Tabron, Audit Committee Member
March 15, 201810, 2022
70
REPORT OF INDEPENDENT REGISTERED PUBLIC ACCOUNTING FIRM
To the Board of Trustees of Teachers Insurance and Annuity Association of America and Participants of TIAA Real Estate Account
Opinion on the Financial Statements
We have audited the accompanying consolidated statements of assets and liabilities, including the consolidated schedules of investments, of TIAA Real Estate Account and its subsidiaries (the “Account”) as of December 31, 2021 and 2020, and the related consolidated statements of operations, of changes in net assets and of cash flows for each of the three years in the period ended December 31, 2021, including the related notes (collectively referred to as the “consolidated financial statements”). In our opinion, the consolidated financial statements present fairly, in all material respects, the financial position of the Account as of December 31, 2021 and 2020, and the results of its operations, the changes in its net assets and its cash flows for each of the three years in the period ended December 31, 2021 in conformity with accounting principles generally accepted in the United States of America.
Basis for Opinion
These consolidated financial statements are the responsibility of the Account’s management. Our responsibility is to express an opinion on the Account’s consolidated financial statements based on our audits. We are a public accounting firm registered with the Public Company Accounting Oversight Board (United States) (PCAOB) and are required to be independent with respect to the Account in accordance with the U.S. federal securities laws and the applicable rules and regulations of the Securities and Exchange Commission and the PCAOB.
We conducted our audits of these consolidated financial statements in accordance with the standards of the PCAOB. Those standards require that we plan and perform the audits to obtain reasonable assurance about whether the consolidated financial statements are free of material misstatement, whether due to error or fraud. The Account is not required to have, nor were we engaged to perform, an audit of its internal control over financial reporting. As part of our audits we are required to obtain an understanding of internal control over financial reporting but not for the purpose of expressing an opinion on the effectiveness of the Account's internal control over financial reporting. Accordingly, we express no such opinion.
Our audits included performing procedures to assess the risks of material misstatement of the consolidated financial statements, whether due to error or fraud, and performing procedures that respond to those risks. Such procedures included examining, on a test basis, evidence regarding the amounts and disclosures in the consolidated financial statements. Our audits also included evaluating the accounting principles used and significant estimates made by management, as well as evaluating the overall presentation of the consolidated financial statements. We believe that our audits provide a reasonable basis for our opinion.
Critical Audit Matters
The critical audit matter communicated below is a matter arising from the current period audit of the consolidated financial statements that was communicated or required to be communicated to the audit committee and that (i) relates to accounts or disclosures that are material to theconsolidated financial statements and (ii) involved our especially challenging, subjective, or complex judgments. The communication of critical audit matters does not alter in any way our opinion on the consolidatedfinancial statements, taken as a whole, and we are not, by communicating the critical audit matter below, providing a separate opinion on the critical audit matter or on the accounts or disclosures to which it relates.
Valuation of Real Estate Properties and Real Estate Joint Ventures
As described in Notes 1 and 5 to the consolidated financial statements, the Account had total investments in real estate properties of $18.9 billion and real estate joint ventures of $7.2 billion as of December 31, 2021. Investments in real estate properties are stated at fair value and investments in real estate joint ventures are stated at fair value of the Account’s ownership based on the fair value of the underlying real estate, any related loans payable, and other factors. To determine the valuation of the real estate properties and the real estate joint ventures, management utilizes the income approach, either the discounted cash flow or direct capitalization valuation model, provided by an independent third party appraiser, using key inputs and assumptions including, but not limited to, rental income and expense amounts, related rental income and expense growth rates, capital expenditures, discount rates, and
71
capitalization rates (terminal capitalization rates for the discounted cash flow model and overall capitalization rates for the direct capitalization model).
The principal considerations for our determination that performing procedures relating to valuation of real estate properties and real estate joint ventures is a critical audit matter are (i) the significant judgment by management in establishing significant inputs and assumptions related to the discount rate, terminal capitalization rate, and rental income and expense amounts, which in turn led to a high degree of auditor judgment, subjectivity, and effort in performing procedures and evaluating audit evidence related to these significant inputs and assumptions; and (ii) the audit effort involved the use of professionals with specialized skill and knowledge.
Addressing the matter involved performing procedures and evaluating audit evidence in connection with forming our overall opinion on the consolidated financial statements. These procedures included testing the effectiveness of controls relating to the valuation of real estate properties and real estate joint ventures, including controls over the review of the competency and qualifications of third party appraisers, the completeness and accuracy of data used by the appraisers in the valuation models, and the completeness of consideration of material events subsequent to the appraisal. These procedures also included, among others (i) testing management's process for determining the fair value of the real estate properties and real estate joint ventures; (ii) testing the completeness and accuracy of certain data used in the models; (iii) evaluating the appropriateness of the valuation models; and (iv) evaluating the significant inputs and assumptions used by management related to the discount rate, terminal capitalization rate, and rental income and expense amounts by comparing assumptions to external market data and considering current and past performance of the real estate properties and real estate joint ventures. Professionals with specialized skill and knowledge were used to assist in the evaluation of the assumptions.
/s/ PricewaterhouseCoopers LLP (Auditor Firm ID 238)
Charlotte, North Carolina
March 10, 2022
We have served as the Account's auditor since 2005.
72
TIAA REAL ESTATE ACCOUNT
AUDITED CONSOLIDATED STATEMENTS OF ASSETS AND LIABILITIES
(In millions, except per accumulation unit amounts)
| December 31, | ||||||||||||||||||||
| 2021 | 2020 | |||||||||||||||||||
| ASSETS | ||||||||||||||||||||
| Investments, at fair value: | ||||||||||||||||||||
| Real estate properties (cost: $14,163.2 and $13,986.3) | $ | 18,903.9 | $ | 16,476.7 | ||||||||||||||||
| Real estate joint ventures (cost: $5,497.9 and $5,021.9) | 7,175.9 | 6,128.9 | ||||||||||||||||||
| Real estate funds (cost: $692.9 and $373.3) | 811.5 | 393.2 | ||||||||||||||||||
| Real estate operating business (cost: $251.6 and $250.2) | 326.3 | 250.0 | ||||||||||||||||||
| Marketable securities (cost: $2,217.0 and $739.3) | 2,207.8 | 739.3 | ||||||||||||||||||
| Loans receivable (cost: $1,434.3 and $1,527.6) | 1,422.7 | 1,493.2 | ||||||||||||||||||
| Loans receivable with related parties (cost: $69.8 and $69.3) | 69.9 | 69.4 | ||||||||||||||||||
| Total investments (cost: $24,326.7 and $21,967.9) | 30,918.0 | 25,550.7 | ||||||||||||||||||
| Cash and cash equivalents | 21.2 | 37.8 | ||||||||||||||||||
| Due from investment manager | 9.9 | 17.9 | ||||||||||||||||||
| Other | 327.3 | 331.4 | ||||||||||||||||||
| TOTAL ASSETS | 31,276.4 | 25,937.8 | ||||||||||||||||||
| LIABILITIES | ||||||||||||||||||||
| Loans payable, at fair value | ||||||||||||||||||||
| (principal outstanding: $2,362.6 and $2,381.3) | 2,380.5 | 2,411.4 | ||||||||||||||||||
| Line of credit, at fair value | 500.0 | — | ||||||||||||||||||
| Accrued real estate property expenses | 287.6 | 246.5 | ||||||||||||||||||
| Other | 36.3 | 36.0 | ||||||||||||||||||
| TOTAL LIABILITIES | 3,204.4 | 2,693.9 | ||||||||||||||||||
| COMMITMENTS AND CONTINGENCIES | 0 | 0 | ||||||||||||||||||
| NET ASSETS | ||||||||||||||||||||
| Accumulation Fund | 27,476.0 | 22,729.0 | ||||||||||||||||||
| Annuity Fund | 596.0 | 514.9 | ||||||||||||||||||
| TOTAL NET ASSETS | $ | 28,072.0 | $ | 23,243.9 | ||||||||||||||||
| NUMBER OF ACCUMULATION UNITS OUTSTANDING | 53.4 | 52.0 | ||||||||||||||||||
| NET ASSET VALUE, PER ACCUMULATION UNIT | $ | 514.765 | $ | 436.722 | ||||||||||||||||
| December 31, | ||||||||||
| 2017 | 2016 | |||||||||
| ASSETS | ||||||||||
| Investments, at fair value: | ||||||||||
| Real estate properties (cost: $12,972.5 and $12,818.1) | $ | 15,742.7 | $ | 15,452.8 | ||||||
| Real estate joint ventures and limited partnerships (cost: $4,675.3 and $4,530.4) | 6,003.0 | 5,759.9 | ||||||||
| Marketable securities: | ||||||||||
| Real estate related (cost: $991.0 and $883.9) | 1,238.0 | (1) | 1,081.5 | (1) | ||||||
| Other (cost: $3,888.1 and $4,054.0) | 3,887.5 | 4,053.8 | ||||||||
| Loans receivable (cost: $296.7 and $294.8) | 298.8 | 295.7 | ||||||||
| Total investments (cost: $22,823.6 and $22,581.2) | 27,170.0 | 26,643.7 | ||||||||
| Cash and cash equivalents | 11.7 | 3.0 | ||||||||
| Due from investment manager | 1.0 | 5.9 | ||||||||
| Other | 270.9 | (2) | 332.6 | (2) | ||||||
| TOTAL ASSETS | 27,453.6 | 26,985.2 | ||||||||
| LIABILITIES | ||||||||||
| Mortgage loans payable, at fair value | ||||||||||
| (principal outstanding: $2,238.6 and $2,316.5) | 2,238.3 | 2,332.1 | ||||||||
| Accrued real estate property expenses | 199.1 | 202.2 | ||||||||
| Payable for collateral for securities loaned | 18.5 | 93.0 | ||||||||
| Other | 55.1 | 53.2 | ||||||||
| TOTAL LIABILITIES | 2,511.0 | 2,680.5 | ||||||||
| COMMITMENTS AND CONTINGENCIES | ||||||||||
| NET ASSETS | ||||||||||
| Accumulation Fund | 24,430.8 | 23,813.5 | ||||||||
| Annuity Fund | 511.8 | 491.2 | ||||||||
| TOTAL NET ASSETS | $ | 24,942.6 | $ | 24,304.7 | ||||||
| NUMBER OF ACCUMULATION UNITS OUTSTANDING | 61.3 | 62.4 | ||||||||
| NET ASSET VALUE, PER ACCUMULATION UNIT | $ | 398.329 | $ | 381.636 | ||||||
See notes to the audited consolidated financial statements
73
TIAA REAL ESTATE ACCOUNT
AUDITED CONSOLIDATED STATEMENTS OF OPERATIONS
| Years Ended December 31, | ||||||||||||||||||||
| 2021 | 2020 | 2019 | ||||||||||||||||||
| INVESTMENT INCOME | ||||||||||||||||||||
| Real estate income, net | ||||||||||||||||||||
| Rental income | $ | 1,194.8 | $ | 1,192.6 | $ | 1,103.5 | ||||||||||||||
| Real estate property level expenses and taxes: | ||||||||||||||||||||
| Operating expenses | 266.9 | 261.1 | 237.5 | |||||||||||||||||
| Real estate taxes | 208.1 | 209.2 | 187.4 | |||||||||||||||||
| Interest expense | 90.5 | 97.5 | 105.7 | |||||||||||||||||
| Total real estate property level expenses and taxes | 565.5 | 567.8 | 530.6 | |||||||||||||||||
| Real estate income, net | 629.3 | 624.8 | 572.9 | |||||||||||||||||
| Income from real estate joint ventures | 191.1 | 146.8 | 208.6 | |||||||||||||||||
| Income from real estate funds | 15.9 | 10.4 | 5.4 | |||||||||||||||||
| Interest | 81.5 | 105.7 | 173.0 | |||||||||||||||||
| Dividends | — | 18.0 | 23.2 | |||||||||||||||||
| TOTAL INVESTMENT INCOME | 917.8 | 905.7 | 983.1 | |||||||||||||||||
| Expenses | ||||||||||||||||||||
| Investment management charges | 62.4 | 65.3 | 68.1 | |||||||||||||||||
| Administrative charges | 51.1 | 48.5 | 50.0 | |||||||||||||||||
| Distribution charges | 26.2 | 26.5 | 31.7 | |||||||||||||||||
| Mortality and expense risk charges | 1.3 | 1.2 | 1.3 | |||||||||||||||||
| Liquidity guarantee charges | 69.1 | 59.4 | 57.8 | |||||||||||||||||
| TOTAL EXPENSES | 210.1 | 200.9 | 208.9 | |||||||||||||||||
| INVESTMENT INCOME, NET | 707.7 | 704.8 | 774.2 | |||||||||||||||||
| NET REALIZED AND UNREALIZED GAIN (LOSS) ON INVESTMENTS AND LOANS PAYABLE | ||||||||||||||||||||
| Net realized gain (loss) on investments | ||||||||||||||||||||
| Real estate properties | 215.9 | (52.8) | 583.1 | |||||||||||||||||
| Real estate joint ventures | 199.8 | (454.9) | (111.0) | |||||||||||||||||
| Real estate funds | 3.5 | (5.6) | (3.4) | |||||||||||||||||
| Marketable securities | (0.1) | 103.0 | 301.1 | |||||||||||||||||
| Loans receivable | (14.1) | (1.6) | — | |||||||||||||||||
| Net realized gain (loss) on investments | 405.0 | (411.9) | 769.8 | |||||||||||||||||
| Net change in unrealized gain (loss) on | ||||||||||||||||||||
| Real estate properties | 2,250.3 | (296.1) | (56.8) | |||||||||||||||||
| Real estate joint ventures | 644.5 | (22.2) | 10.8 | |||||||||||||||||
| Real estate funds | 98.7 | (18.6) | 39.5 | |||||||||||||||||
| Real estate operating business | 74.9 | (0.2) | — | |||||||||||||||||
| Marketable securities | (9.2) | (148.1) | 0.7 | |||||||||||||||||
| Loans receivable | 22.7 | (33.0) | (3.8) | |||||||||||||||||
| Loans receivable with related parties | — | 0.4 | (0.3) | |||||||||||||||||
| Loans payable | 12.2 | (3.1) | (107.1) | |||||||||||||||||
| Net change in unrealized gain (loss) on investments and loans payable | 3,094.1 | (520.9) | (117.0) | |||||||||||||||||
| NET REALIZED AND UNREALIZED GAIN (LOSS) ON INVESTMENTS AND LOANS PAYABLE | 3,499.1 | (932.8) | 652.8 | |||||||||||||||||
| NET INCREASE (DECREASE) IN NET ASSETS RESULTING FROM OPERATIONS | $ | 4,206.8 | $ | (228.0) | $ | 1,427.0 | ||||||||||||||
| Years Ended December 31, | ||||||||||||
| 2017 | 2016 | 2015 | ||||||||||
| INVESTMENT INCOME | ||||||||||||
| Real estate income, net | ||||||||||||
| Rental income | $ | 1,059.6 | $ | 1,009.0 | $ | 919.1 | ||||||
| Real estate property level expenses and taxes: | ||||||||||||
| Operating expenses | 221.2 | 218.1 | 207.4 | |||||||||
| Real estate taxes | 166.7 | 158.7 | 144.4 | |||||||||
| Interest expense | 89.7 | 85.8 | 81.1 | |||||||||
| Total real estate property level expenses and taxes | 477.6 | 462.6 | 432.9 | |||||||||
| Real estate income, net | 582.0 | 546.4 | 486.2 | |||||||||
| Income from real estate joint ventures and limited partnerships | 214.1 | 161.8 | 140.1 | |||||||||
| Interest | 54.1 | 26.4 | 10.1 | |||||||||
| Dividends | 26.3 | 32.5 | 47.5 | |||||||||
| TOTAL INVESTMENT INCOME | 876.5 | 767.1 | 683.9 | |||||||||
| Expenses | ||||||||||||
| Investment management charges | 72.0 | 72.6 | 69.3 | |||||||||
| Administrative charges | 59.3 | 62.1 | 56.9 | |||||||||
| Distribution charges | 25.7 | 27.7 | 23.9 | |||||||||
| Mortality and expense risk charges | 1.2 | 1.2 | 1.1 | |||||||||
| Liquidity guarantee charges | 47.0 | 38.4 | 31.7 | |||||||||
| TOTAL EXPENSES | 205.2 | 202.0 | 182.9 | |||||||||
| INVESTMENT INCOME, NET | 671.3 | 565.1 | 501.0 | |||||||||
| NET REALIZED AND UNREALIZED GAIN (LOSS) ON INVESTMENTS AND MORTGAGE LOANS PAYABLE | ||||||||||||
| Net realized gain (loss) on investments | ||||||||||||
| Real estate properties | 42.0 | (6.2 | ) | 215.4 | ||||||||
| Real estate joint ventures and limited partnerships | (21.9 | ) | 0.6 | 167.3 | ||||||||
| Marketable securities | 17.6 | 25.6 | 235.8 | |||||||||
| Net realized gain on investments | 37.7 | 20.0 | 618.5 | |||||||||
| Net change in unrealized appreciation (depreciation) on | ||||||||||||
| Real estate properties | 135.5 | 317.5 | 487.2 | |||||||||
| Real estate joint ventures and limited partnerships | 146.8 | 236.9 | 288.6 | |||||||||
| Marketable securities | 50.0 | 30.0 | (255.1 | ) | ||||||||
| Loans receivable | 1.2 | 0.3 | 0.6 | |||||||||
| Mortgage loans payable | 15.9 | 15.1 | 5.6 | |||||||||
Net change in unrealized appreciation on investments and mortgage loans payable | 349.4 | 599.8 | 526.9 | |||||||||
NET REALIZED AND UNREALIZED GAIN ON INVESTMENTS AND MORTGAGE LOANS PAYABLE | 387.1 | 619.8 | 1,145.4 | |||||||||
NET INCREASE IN NET ASSETS RESULTING FROM OPERATIONS | $ | 1,058.4 | $ | 1,184.9 | $ | 1,646.4 | ||||||
See notes to the audited consolidated financial statements
74
TIAA REAL ESTATE ACCOUNT
AUDITED CONSOLIDATED STATEMENTS OF CHANGES IN NET ASSETS
| Years Ended December 31, | ||||||||||||||||||||
| 2021 | 2020 | 2019 | ||||||||||||||||||
| FROM OPERATIONS | ||||||||||||||||||||
| Investment income, net | $ | 707.7 | $ | 704.8 | $ | 774.2 | ||||||||||||||
| Net realized gain (loss) on investments | 405.0 | (411.9) | 769.8 | |||||||||||||||||
| Net change in unrealized gain (loss) on investments and loans payable | 3,094.1 | (520.9) | (117.0) | |||||||||||||||||
| NET INCREASE (DECREASE) IN NET ASSETS RESULTING FROM OPERATIONS | 4,206.8 | (228.0) | 1,427.0 | |||||||||||||||||
| FROM PARTICIPANT TRANSACTIONS | ||||||||||||||||||||
| Premiums | 2,981.7 | 2,025.9 | 2,655.9 | |||||||||||||||||
| Annuity payments | (47.7) | (47.8) | (47.3) | |||||||||||||||||
| Withdrawals and death benefits | (2,312.7) | (5,814.1) | (2,570.3) | |||||||||||||||||
| NET INCREASE (DECREASE) IN NET ASSETS RESULTING FROM PARTICIPANT TRANSACTIONS | 621.3 | (3,836.0) | 38.3 | |||||||||||||||||
| NET INCREASE (DECREASE) IN NET ASSETS | 4,828.1 | (4,064.0) | 1,465.3 | |||||||||||||||||
| NET ASSETS | ||||||||||||||||||||
| Beginning of period | 23,243.9 | 27,307.9 | 25,842.6 | |||||||||||||||||
| End of period | $ | 28,072.0 | $ | 23,243.9 | $ | 27,307.9 | ||||||||||||||
| Years Ended December 31, | ||||||||||||
| 2017 | 2016 | 2015 | ||||||||||
| FROM OPERATIONS | ||||||||||||
| Investment income, net | $ | 671.3 | $ | 565.1 | $ | 501.0 | ||||||
| Net realized gain on investments | 37.7 | 20.0 | 618.5 | |||||||||
| Net change in unrealized appreciation on investments and mortgage loans payable | 349.4 | 599.8 | 526.9 | |||||||||
NET INCREASE IN NET ASSETS RESULTING FROM OPERATIONS | 1,058.4 | 1,184.9 | 1,646.4 | |||||||||
| FROM PARTICIPANT TRANSACTIONS | ||||||||||||
| Premiums | 2,561.7 | 3,064.2 | 2,852.3 | |||||||||
| Annuity payments | (43.4 | ) | (41.0 | ) | (36.7 | ) | ||||||
| Withdrawals and death benefits | (2,938.8 | ) | (2,263.4 | ) | (1,931.0 | ) | ||||||
NET INCREASE (DECREASE) IN NET ASSETS RESULTING FROM PARTICIPANT TRANSACTIONS | (420.5 | ) | 759.8 | 884.6 | ||||||||
| NET INCREASE IN NET ASSETS | 637.9 | 1,944.7 | 2,531.0 | |||||||||
| NET ASSETS | ||||||||||||
| Beginning of period | 24,304.7 | 22,360.0 | 19,829.0 | |||||||||
| End of period | $ | 24,942.6 | $ | 24,304.7 | $ | 22,360.0 | ||||||
See notes to the audited consolidated financial statements
75
TIAA REAL ESTATE ACCOUNT
AUDITED CONSOLIDATED STATEMENTS OF CASH FLOWS
| Years Ended December 31, | ||||||||||||||||||||
| 2021 | 2020 | 2019 | ||||||||||||||||||
| CASH FLOWS FROM OPERATING ACTIVITIES | ||||||||||||||||||||
| Net increase (decrease) in net assets resulting from operations | $ | 4,206.8 | $ | (228.0) | $ | 1,427.0 | ||||||||||||||
| Adjustments to reconcile net changes in net assets resulting from operations to net cash provided by (used in) operating activities: | ||||||||||||||||||||
| Net realized (gain) loss on investments | (405.0) | 411.9 | (769.8) | |||||||||||||||||
| Net change in unrealized (gain) loss on investments and loans payable | (3,094.1) | 520.9 | 117.0 | |||||||||||||||||
| Purchase of real estate properties | (581.8) | (1,147.7) | (1,059.7) | |||||||||||||||||
| Capital improvements on real estate properties | (283.9) | (242.4) | (304.4) | |||||||||||||||||
| Proceeds from sale of real estate properties | 920.9 | 612.1 | 1,285.4 | |||||||||||||||||
| Purchases of long term investments | (1,231.2) | (1,322.6) | (1,373.4) | |||||||||||||||||
| Proceeds from long term investments | 711.2 | 2,357.7 | 1,210.5 | |||||||||||||||||
| Purchases and originations of loans receivable | (326.2) | (118.0) | (695.5) | |||||||||||||||||
| Originations of loans receivable with related parties | (0.5) | — | (69.3) | |||||||||||||||||
| Proceeds from sales of loans receivable | 294.5 | 63.0 | 50.8 | |||||||||||||||||
| Proceeds from payoffs of loans receivable | 110.8 | 28.6 | 50.8 | |||||||||||||||||
| (Increase) Decrease in other investments | (1,477.8) | 3,398.5 | (54.9) | |||||||||||||||||
| Change in due from investment manager | 8.0 | (12.4) | (3.3) | |||||||||||||||||
| Decrease (Increase) in other assets | 5.6 | (43.1) | 23.3 | |||||||||||||||||
| Decrease (Increase) in other liabilities | 25.0 | (2.9) | (70.4) | |||||||||||||||||
| NET CASH (USED IN) PROVIDED BY OPERATING ACTIVITIES | (1,117.7) | 4,275.6 | (235.9) | |||||||||||||||||
| CASH FLOWS FROM FINANCING ACTIVITIES | ||||||||||||||||||||
| Proceeds from line of credit | 500.0 | 540.0 | 250.0 | |||||||||||||||||
| Payments on line of credit | — | (790.0) | — | |||||||||||||||||
| Mortgage loan proceeds received | 188.9 | — | 47.5 | |||||||||||||||||
| Payments on mortgage loans | (207.6) | (168.9) | (106.8) | |||||||||||||||||
| Premiums | 2,981.7 | 2,025.9 | 2,655.9 | |||||||||||||||||
| Annuity payments | (47.7) | (47.8) | (47.3) | |||||||||||||||||
| Withdrawals and death benefits | (2,312.7) | (5,814.1) | (2,570.3) | |||||||||||||||||
| NET CASH PROVIDED BY (USED IN) FINANCING ACTIVITIES | 1,102.6 | (4,254.9) | 229.0 | |||||||||||||||||
| NET (DECREASE) INCREASE IN CASH, CASH EQUIVALENTS AND RESTRICTED CASH | (15.1) | 20.7 | (6.9) | |||||||||||||||||
| CASH, CASH EQUIVALENTS AND RESTRICTED CASH | ||||||||||||||||||||
| Beginning of period cash, cash equivalents and restricted cash | 61.1 | 40.4 | 47.3 | |||||||||||||||||
| Net (decrease) increase in cash, cash equivalents and restricted cash | (15.1) | 20.7 | (6.9) | |||||||||||||||||
| End of period cash, cash equivalents and restricted cash | $ | 46.0 | $ | 61.1 | $ | 40.4 | ||||||||||||||
| SUPPLEMENTAL DISCLOSURES | ||||||||||||||||||||
| Cash paid for interest | $ | 94.9 | $ | 97.8 | $ | 107.8 | ||||||||||||||
| Mortgage loan assumed as part of a real estate acquisition | $ | — | $ | 289.6 | $ | 181.0 | ||||||||||||||
| Loan receivable converted to equity in real estate investment | $ | — | $ | (1.7) | $ | — | ||||||||||||||
| Loan assignment as part of a real estate disposition | $ | — | $ | 77.4 | $ | 471.8 | ||||||||||||||
| Years Ended December 31, | ||||||||||||
| 2017 | 2016 | 2015 | ||||||||||
| CASH FLOWS FROM OPERATING ACTIVITIES | ||||||||||||
| Net increase in net assets resulting from operations | $ | 1,058.4 | $ | 1,184.9 | $ | 1,646.4 | ||||||
| Adjustments to reconcile net changes in net assets resulting from operations to net cash provided by (used in) operating activities: | ||||||||||||
| Net realized gain on investments | (37.7 | ) | (20.0 | ) | (618.5 | ) | ||||||
| Net change in unrealized appreciation on investments and mortgage loans payable | (349.4 | ) | (599.8 | ) | (526.9 | ) | ||||||
| Purchase of real estate properties | (538.2 | ) | (623.9 | ) | (1,229.6 | ) | ||||||
| Capital improvements on real estate properties | (130.1 | ) | (157.2 | ) | (167.9 | ) | ||||||
| Proceeds from sale of real estate properties | 525.5 | 251.1 | 442.9 | |||||||||
| Purchases of long term investments | (592.0 | ) | (1,379.4 | ) | (1,102.4 | ) | ||||||
| Proceeds from long term investments | 385.3 | 68.3 | 1,499.8 | |||||||||
| Increase in loans receivable | (1.9 | ) | (194.8 | ) | (100.0 | ) | ||||||
| (Increase) decrease in other investments | 165.9 | 153.6 | (376.5 | ) | ||||||||
| Change in due to (from) investment manager | 4.9 | (0.2 | ) | 1.5 | ||||||||
| (Increase) decrease in other assets | 61.7 | (102.4 | ) | (33.3 | ) | |||||||
| Increase (decrease) in other liabilities | (72.6 | ) | 122.3 | 29.1 | ||||||||
NET CASH PROVIDED BY (USED IN) OPERATING ACTIVITIES | 479.8 | (1,297.5 | ) | (535.4 | ) | |||||||
| CASH FLOWS FROM FINANCING ACTIVITIES | ||||||||||||
| Mortgage loan proceeds received | — | 563.5 | — | |||||||||
| Payments of mortgage loans | (50.6 | ) | (34.7 | ) | (373.8 | ) | ||||||
| Premiums | 2,561.7 | 3,064.2 | 2,852.3 | |||||||||
| Annuity payments | (43.4 | ) | (41.0 | ) | (36.7 | ) | ||||||
| Withdrawals and death benefits | (2,938.8 | ) | (2,263.4 | ) | (1,931.0 | ) | ||||||
NET CASH (USED IN) PROVIDED BY FINANCING ACTIVITIES | (471.1 | ) | 1,288.6 | 510.8 | ||||||||
NET INCREASE (DECREASE) IN CASH AND CASH EQUIVALENTS | 8.7 | (8.9 | ) | (24.6 | ) | |||||||
| CASH AND CASH EQUIVALENTS | ||||||||||||
| Beginning of period | 3.0 | 11.9 | 36.5 | |||||||||
| End of period | $ | 11.7 | $ | 3.0 | $ | 11.9 | ||||||
| SUPPLEMENTAL DISCLOSURES | ||||||||||||
| Cash paid for interest | $ | 89.9 | $ | 84.2 | $ | 82.7 | ||||||
| Debt assumed as part of a real estate acquisition | $ | 17.7 | $ | 24.0 | $ | — | ||||||
| Loan assignment as part of a real estate disposition | $ | 45.0 | $ | — | $ | 200.0 | ||||||
| Conversion of note receivable | $ | — | $ | — | $ | 100.6 | ||||||
| As of December 31, | |||||||||||||||||
| 2021 | 2020 | 2019 | |||||||||||||||
| Cash and cash equivalents | $ | 21.2 | $ | 37.8 | $ | 15.1 | |||||||||||
Restricted cash(1) | 24.8 | 23.3 | 25.3 | ||||||||||||||
| TOTAL CASH, CASH EQUIVALENTS AND RESTRICTED CASH | $ | 46.0 | $ | 61.1 | $ | 40.4 | |||||||||||
(1) Restricted cash is included within other assets on the Account's Consolidated Statements of Assets and Liabilities.
See notes to the audited consolidated financial statements
76
TIAA REAL ESTATE ACCOUNT
NOTES TO THE CONSOLIDATED FINANCIAL STATEMENTS
Note 1—Organization and Significant Accounting Policies
Business: The TIAA Real Estate Account (“Account”) is an insurance separate account of Teachers Insurance and Annuity Association of America (“TIAA”) and was established by resolution of TIAA’s Board of Trustees (the “Board”) on February 22, 1995, under the insurance laws of the State of New York for the purpose of funding variable annuity contracts issued by TIAA. The Account offers individual and group accumulating annuity contracts (with contributions made on a pre-tax or after-tax basis), as well as individual lifetime and term-certain variable payout annuity contracts (including the payment of death benefits to beneficiaries). Investors are entitled to transfer funds to or from the Account and make withdrawals from the Account on a daily basis under certain circumstances. Funds invested in the Account for each category of contract are expressed in terms of units, and unit values will fluctuate depending on the Account’s performance.
The investment objective of the Account is to seek favorable long-termtotal returns primarily through rental income and capital appreciation fromof a diversified portfolio of directly held, private real estate investments and real estate-related investments owned by the Account.while offering investors guaranteed, daily liquidity. The Account holds real estate properties directly and through subsidiaries wholly-owned by TIAA for the sole benefit of the Account. The Account also holds limited interests in real estate joint ventures and limited partnerships,funds, as well as investments in loans receivable with commercial real estate properties as underlying collateral. Additionally, the Account invests in real estate-related and non-real estate-related publicly traded securities, cash and other instruments to maintain adequate liquidity levels for operating expenses, capital expenditures and to fund benefit payments (withdrawals, transfers and related transactions).
Estimates:The Consolidated Financial Statements were prepared in accordance with accounting principles generally accepted in the United States of America, which requires the use of estimates made by management. Actual results may vary from those estimates, and such differences may be material.
The following is a summaryoutbreak of the significant accounting policiesnovel coronavirus (commonly known as “COVID-19”) and the subsequent global pandemic began significantly impacting the U.S. and global financial markets and economies during the first quarter of 2020. During the second and third quarters of 2020, the Account received multiple requests for rent and loan payment relief as a result of the COVID-19 pandemic, however, the requests slowed during the fourth quarter of 2020 and no new requests were received in 2021. Requests were generally been comprised of deferrals, with payments postponed for a brief period (i.e., less than six months) and then repaid over the remaining duration of the contract.
As of December 31, 2021, the Account has not had material exposure to rent concessions, tenant defaults or loan defaults. The duration and extent of COVID-19 over the long-term cannot be reasonably estimated at this time. The ultimate impact of the COVID-19 pandemic and the extent to which the COVID-19 pandemic impacts the Account’s business, results of operations, investments, and cash flows will depend on future developments, which are highly uncertain and difficult to predict.
Basis of Presentation: The accompanying Consolidated Financial Statements include the Account and those subsidiaries wholly-owned by TIAA for the benefit of the Account. Certain prior period amounts have been reclassified for comparative purposes to conform to the current period financial statement presentation. These reclassifications had no effect on previously reported results of operations. All significant intercompany accounts and transactions between the Account and such subsidiaries have been eliminated.
The Accumulation Unit Value (“AUV”) used for financial reporting purposes may differ from the AUV used for processing transactions. The AUV used for financial reporting purposes includes security and participant (or "contract owner") transactions effective through the period end date to which this report relates. Total return is computed based on the AUV used for processing transactions.
Determination of Investments at Fair Value: The Account reports all investments at fair value in accordance with the Financial Accounting Standards Board (“FASB”) Accounting Standards Codification (“ASC”) 946, Financial
77
Services—Investment Companies. Further in accordance with the adoption of the fair value option allowed under ASC 825, Financial Instruments, and at the election of Account management, mortgage loans payable and a line of credit are reported at fair value. The FASB has defined fair value as the price that would be received to sell an asset or paid to transfer a liability in an orderly transaction between market participants.participants excluding transaction costs.
The following is a description of the valuation methodologies used to determine the fair value of the Account’s investments and investment related mortgage loans payable.
Valuation of Real Estate Properties—Investments in real estate properties are stated at fair value, as determined in accordance with policies and procedures reviewed by the Investment Committee of the Board and in accordance with the responsibilities of the Board as a whole. Accordingly, the Account does not record depreciation. Determination of fair value involves significant levels of judgment because the actual fair value of real estate can be determined only by negotiation between the parties in a sales transaction.
The Account’s primary objective when valuing its real estate investments will be to produce a valuation that represents a reasonable estimate of the fair value of its investments.
Implicit in the Account’s definition of fair value are the consummation of a sale as of a specified date and the passing of title from seller to buyer under conditions whereby:
•Buyer and seller are typically motivated;
•Both parties are well informed or well advised and acting in what they consider their best interests;
•A reasonable time is allowed for exposure in the open market;
•Payment is made in terms of cash or in terms of financial arrangements comparable thereto; and
•The price represents the normal consideration for the property sold unaffected by special or creative financing or sales concessions granted by anyone associated with the sale.
Property and investment values are affected by, among other things, the availability of capital, occupancy rates, rental rates, and interest and inflation rates. As a result, determining real estate and investment values involves many assumptions. Key inputs and assumptions include, but are not limited to, rental income and expense amounts, related rental income and expense growth rates, capital expenditures, discount rates and capitalization rates. Valuation techniques include discounted cash flow analysis, prevailing marketdirect capitalization rates or multiples applied to earnings from the property,analysis, analysis of recent comparable sales transactions, actual sale negotiations and bona fide purchase offers received from third parties. Amounts ultimately realized from each investment may vary significantly from the fair value presented.
Real estate properties owned by the Account are initially valued based on an independent third party appraisal, as reviewed by TIAA’s internal appraisal staff and as applicable by the Account’s independent fiduciary at the time of the closing of the purchase. Such initial valuation may result in a potential unrealized gain or loss reflecting the difference between an investment’s fair value (i.e., exit price) and its cost basis (which is inclusive of transaction costs).
Subsequently, each property is appraised each quarter by an independent third party appraiser, reviewed by TIAA’s internal appraisal staff and as applicable the Account’s independent fiduciary. In general, the Account obtains appraisals of its real estate properties spread out throughout the quarter, which is intended to result in appraisal adjustments, and thus, adjustments to the valuations of its holdings (to the extent such adjustments are made) that happen regularly throughout each quarter and not on one specific day or month in each period.
Further, management reserves the right to order an appraisal and/or conduct another valuation outside of the normal quarterly process when facts or circumstances at a specific property change. For example, under certain circumstances a valuation adjustment could be made when the account receives a bona fide bid for the sale of a property held within the Account or one of the Account’s joint ventures. Adjustments may be made for events or circumstances indicating an impairment of a tenant’s ability to pay amounts due to the Account under a lease (including due to a bankruptcy filing of that tenant). Alternatively, adjustments may be made to reflect the execution or renewal of a significant lease. Also, adjustments may be made to reflect factors (such as sales values for comparable properties or local employment rate) bearing uniquely on a particular region in which the Account holds properties. TIAA’s internal appraisal staff oversees the entire appraisal process, in conjunction with the Account’s independent fiduciary (the independent fiduciary is more fully described in the following paragraph). Any
78
differences in the conclusions of TIAA’s internal appraisal staff and the independent appraiser will be reviewed by the independent fiduciary, which will make a final determination on the matter (which may include ordering a subsequent independent appraisal).
The independent fiduciary, RERC, LLC,SitusAMC, has been appointed by a special subcommittee of the Investment Committee of the Board to, among other things, oversee the appraisal process. The independent fiduciary must approve all independent appraisers used by the Account. All appraisals are performed in accordance with Uniform Standards of Professional Appraisal Practices, the real estate appraisal industry standards created by The Appraisal Foundation. Real estate appraisals are estimates of property values based on a professional’s opinion. Appraisals of properties held outside of the U.S. are performed in accordance with industry standards commonly applied in the applicable jurisdiction. These independent appraisers are always expected to be MAI-designated members of the Appraisal Institute (or its European equivalent, Royal Institute of Chartered Surveyors) and state certified appraisers from national or regional firms with relevant property type experience and market knowledge. Under the Account’s current procedures, each independent appraisal firm will be rotated off of a particular property at least every three years, although such appraisal firm may perform appraisals of other Account properties subsequent to such rotation.
Also, the independent fiduciary can require additional appraisals if factors or events have occurred that could materially change a property’s value (including those identified above) and such change is not reflected in the quarterly valuation review, or otherwise to ensure that the Account is valued appropriately. The independent fiduciary must also approve any valuation change of real estate-related assets where a property’s value changed by more than 6% from the most recent independent annual appraisal, or if the value of the Account would change by more than 4% within any calendar quarter or more than 2% since the prior calendar month. When a real estate property is subject to a mortgage, the property is valued independently of the mortgage and the property and mortgage fair values are reported separately (see Valuation of Mortgage Loans Payable). The independent fiduciary reviews and approves all mortgage valuation adjustments before such adjustments are recorded by the Account. The Account continues to use the revised value for each real estate property and mortgage loan payable to calculate the Account’s daily net asset value until the next valuation review or appraisal.
Valuation of Real Estate Joint Ventures—Real estate joint ventures are stated at the fair value of the Account’s ownership interests of the underlying entities. The Account’s ownership interests are valued based on the fair value of the underlying real estate, any related mortgage loans payable, and other factors, such as ownership percentage, ownership rights, buy/sell agreements, distribution provisions and capital call obligations. The fair value of real estate and loans payable held by joint ventures is determined in the same manner described above in Valuation of Real Estate Properties. The independent fiduciary reviews and approves all valuation adjustments before such adjustments are recorded by the Account. Upon the disposition of all real estate investments by an investee entity, the Account will continue to state its equity in the remaining net assets of the investee entity during the wind down period, if any, which occurs prior to the dissolution of the investee entity.
Valuation of Real Estate Limited PartnershipsFunds—Limited partnershipReal estate fund interests are stated at the fair value of the Account’s ownership in the partnership which are recorded based uponfund. Management uses net asset value information provided by fund managers as a practical expedient to estimate fair value. The Account receives estimates from fund managers on a quarterly basis, and audited information is provided annually. Upon receipt of the changes ininformation, management reviews and concludes on whether the net asset values provided are an appropriate representation of the limited partnerships as determined from the financial statementsfair value of the limited partnerships when received byAccount's interests in the Account. Prior to the receiptreal estate funds and makes valuation adjustments as necessary. Valuation of the financial statements from the limited partnerships, the Account estimates the value of its interest in good faith and will from time to time seek input from the issuer or the sponsor of the investments. Since market quotations are not readily available, the limited partnership interests are valued at fair value as determined in good faith by managementreal estate funds proceeds under the direction of the Investment Committee of the Board and in accordance with the responsibilities of the Board as a whole.
Valuation of Real Estate Operating Businesses—Real estate operating businesses are held at fair value, which is equal to their cost basis on the initial investment date. Subsequently, valuations are completed on a quarterly basis, with a third-party vendor utilized semi-annually and the interim quarters completed by TIAA’s internal valuation department. Valuations are subject to review by the independent fiduciary. Fair value is based on the enterprise value of the business, subject to any preferential distributions that would be required upon liquidation, if applicable.
Management reserves the right to order an external valuation outside of the normal quarterly process when facts or circumstances at the business materially change from the latest available valuation. Any differences in the conclusions of TIAA’s internal valuation department and the external vendor will be reviewed by the independent
79
fiduciary, which will make a final determination on the matter (which may include ordering a subsequent additional valuation).
Valuation of Marketable Securities—Equity securities listed or traded on any national market or exchange are valued at the last sale price as of the close of the principal securities market or exchange on which such securities are traded or, if there is no sale, at the mean of the last bid and askedask prices on such market or exchange, exclusive of transaction costs.
Valuation of Debt Securities—Debt securities with readily available market quotations, other than money market instruments, are generally valued at the most recent bid price or the equivalent quoted yield for such securities (or those of comparable maturity, quality and type). Debt securities for which market quotations are not readily available, are valued at fair value as determined in good faith by management and the Investment Committee of the Board and in accordance with the responsibilities of the Board as a whole.
Short-term investments are valued in the same manner as debt securities, as described above.
Money market instruments are valued at amortized cost, which approximates fair value.
Valuation of Loans Receivable (i.e. the Account as a creditor)—Loans receivable are stated at fair value and are initially valued at the face amount of the loan funding. Subsequently, loans receivable are valued at least quarterly by TIAA’s internal valuation department based on market factors, such as market interest rates and spreads for comparable loans, the liquidity for loans of similar characteristics, the performance of the underlying collateral (such as the loan-to-value ratio and the cash flow of the underlying collateral) and the credit quality of the counterparty. The independent fiduciary
reviews and approves all loan receivable valuation adjustments before such adjustments are recorded by the Account. The Account continues to use the revised value for each loan receivable to calculate the Account’s daily net asset value until the next valuation review. Loan origination costs are expensed as incurred.
Valuation of Mortgage Loans Payable (i.e. the Account as a debtor)—Mortgage or other loans payable, including the Account's line of credit, are stated at fair value. The estimated fair valuesvalue of mortgage loans payable areis generally based on the amount at which the liability could be transferred toin a third partycurrent transaction, exclusive of transaction costs. Mortgage loans payableFair values are valued internally by TIAA’s internal valuation department, as reviewed by the Account’s independent fiduciary, at least quarterlyestimated based on market factors, such as market interest rates and spreads foron comparable loans, the liquidity for loans of similar characteristics, the performance of the underlying collateral (such as the loan-to-value ratio and the cash flow of the underlying collateral), the liquidity for mortgage loans of similar characteristics, the maturity date of the loan, and the return demands of the market.market, and the credit quality of the Account. Different assumptions or changes in future market conditions could significantly affect estimated fair values. At times, the Account may assume debt in connection with the purchase of real estate, including under the Credit Agreement (as defined below) or additional credit facilities or other lines of credit in the future or the issuance of debt securities by the Account.
See Note 5—Assets and Liabilities Measured at Fair Value on a Recurring Basis for further discussion and disclosure regarding the determination of the fair value of the Account’s investments.
Foreign Currency Transactions and Translation: Portfolio The Account's investments, and other assets and liabilities that are denominated in a foreign currenciescurrency are translated into U.S. dollars using the effective exchange rates at the end of the period. Transactions, such as the purchases and sales of securities or properties, income received, and expenses paid, executed in a foreign currency are translated into U.S. dollars at the effective exchange rates prevailing atrate on the enddate of the period. Purchases and salestransaction. The effects of securities, income receipts and expense payments made in foreign currencies are translated into U.S. dollars at the exchange rates prevailing on the respective dates of the transactions. The effect of any changes in foreign currency exchange ratesrate translation on portfolio investmentsthe Account's assets and mortgage loans payableliabilities are included in net realized and unrealized gains and losses on real estate properties and mortgage loans payable. Net realized gains and losses on foreign currency transactions include dispositionthe Account's Consolidated Statements of foreign currencies, and currency gains and losses between the accrual and receipt dates of portfolio investment income and between the trade and settlement dates of portfolio investment transactions.Operations.
Accumulation and Annuity Funds: The accumulation fund represents the net assets attributable to participantscontract owners in the accumulation phase of their investment (“Accumulation Fund”). The annuity fund represents the net assets attributable to the participantscontract owners currently receiving annuity payments (“Annuity Fund”). The net increase or decrease in net assets from investment operations is apportioned between the accounts based upon their relative daily net asset values. Once an Account participant begins receiving lifetime annuity income benefits, payment levels cannot be reduced as a result of the Account’s actual mortality experience. In addition, the contracts pursuant to which the Account is offered are required to stipulate the maximum expense charge for all Account level expenses that can be assessed, which is not to exceed 2.5% of average net assets per year. The Account pays a fee to TIAA to assume mortality and expense risks.
80
Accounting for Investments: The investments held by the Account are accounted for as follows:
Real Estate Properties—Rent from real estate properties consists of all amounts earned under tenant operating leases, including base rent, recoveries of real estate taxes and other expenses and charges for miscellaneous services provided to tenants. Rental income is recognized in accordance with the billing terms of the lease agreements. The Account bears the direct expenses of the real estate properties owned. These expenses include, but are not limited to, fees to local property management companies, property taxes, utilities, maintenance, repairs, insurance, and other operating and administrative costs. An estimate of the net operating income earned from each real estate property is accrued by the Account on a daily basis and such estimates are adjusted when actual operating results are determined.
Real Estate Joint Ventures—The Account has limited ownership interests in various real estate joint ventures (collectively, the “joint ventures”). The Account records its contributions as increases to its investments in the joint ventures, and distributions from the joint ventures are treated as income within income from real estate joint ventures and limited partnerships in the Account’s Consolidated Statements of Operations. Distributions that are identified as returns of capital are recorded as a reduction to the cost basis of the investment, whereas distributions identified as capital gains or losses are recorded as realized gains or losses. Income distributions from the joint ventures are recorded based on the Account’s proportional interest of the income distributed by the joint ventures. Income earnedand losses incurred but not yet distributed toor realized from the Account by the joint ventures isare recorded as unrealized gains and losses.
within income from real estate joint ventures and limited partnershipsfunds in the Account’s Consolidated Statements of Operations. Distributions that are identified as returns of capital are recorded as a reduction to the cost basis of the investment, whereas distributions identified as capital gains or losses are recorded as realized gains or losses. Unrealized gains and losses are recorded based upon the changes in the net asset values of the limited partnershipsreal estate funds as determined from the financial statements of the limited partnershipsreal estate funds when received by the Account. Prior to the receipt of the financial statements from the limited partnerships,real estate funds, the Account estimates the value of its interest in good faith and will from time to time seek input fromusing information provided by the issuer or the sponsor of the investments.limited partners. Changes in value based on such estimates are recorded by the Account as unrealized gains and losses.
Real Estate Operating Business—The Account has a non-controlling ownership interest in one real estate operating business. The Account records contributions into the business as increases to the cost basis of its investment. Distributions are characterized by the business as either income, capital gains, or return of capital. Distributions classified as income are presented within income from real estate operating businesses in the Account’s Consolidated Statements of Operations. Distributions identified as capital gains are presented as realized gains in the Account’s Consolidated Statements of Operations. Distributions identified as returns of capital are recorded as a reduction to the cost basis of the investment. Unrealized gains and losses are recorded based upon the changes in the fair value of the enterprise value of the business.
Marketable Securities—Transactions in marketable securities are accounted for as of the date the securities are purchased or sold (trade date). Interest income is recorded as earned. Dividend income is recorded on the ex-dividend date within dividend income. Dividends that are identified as returns of capital are recorded as a reduction to the cost basis of the investment, whereas dividends identified as capital gains or losses are recorded as realized gains or losses. Realized gains and losses on securities transactions are accounted for on the specific identification method.
Loans Receivable—Loans receivable are stated atThe Account may originate, purchase or sell loans collateralized by real estate. The cost basis of originated loans is comprised of the principal balance and direct costs incurred that represent a component of loan’s reported fair value and are initially valued atvalue. The cost basis of purchased loans consists of the face amountpurchase price of the loan funding. Subsequently,and additional direct costs incurred that represent a component of the loan’s reported fair value. Additional costs incurred by the Account to originate or purchase loans receivable are valued at least quarterly by TIAA’s internal valuation department with changes inthat do not represent a component of a loan’s fair value flowing through unrealized gain (loss).are recorded as expenses in the period incurred. Nonrefundable origination fees paid by borrowers are recognized as interest income once all activities required to execute the loan are completed. Prepayment fees received from the payoff of loans in advance of their maturity date are recognized as interest income on the date the payoff occurs. Interest income from loans receivablein accrual status is recognized usingbased on the effective interest method over the expected lifecurrent coupon rate of the loan. Allloans.
81
Interest income from loans receivable heldin accrual status is recognized based on the current coupon rate of the loans. Interest income accruals are suspended when a loan becomes a non-performing loan, defined as a loan more than ninety days in arrears or at any point when management believes the full collection of principal is doubtful. Interest income on non-performing loans is recognized only as cash payments are received. Loans can be rehabilitated to date were originated directly bynormal accrual status once all past due interest has been collected and management believes the Account.full collection of principal is likely.
Realized and Unrealized Gains and Losses—Realized gains and losses are recorded at the time an investment is sold or a distribution is received in relation to an investment sale from a joint venture or limited partnership.fund. Real estate and loan receivable transactions are accounted for as of the date on which the purchase or sale transactions for the real estate properties close (settlement date). The Account recognizes a realized gain on the sale of a real estate propertyan investment to the extent that the contract sales price exceeds the cost-to-date of the propertyinvestment being sold. A realized loss occurs when the cost-to-date exceeds the sales price. Realized gains and losses from partial sales of non-financial assets are recognized in accordance with ASC 610-20 - Gains and Losses from the Derecognition of Nonfinancial Assets. Realized gains and losses from the sale of financial assets are recognized in accordance with ASC 860 - Transfers and Servicing. Unrealized gains and losses are recorded as the fair values of the Account’s investments are adjusted, and as discussed within the Real Estate Joint Ventures, Real Estate Funds and Limited PartnershipsLoans Receivable sections above.
Net Assets—The Account’s net assets as of the close of each valuation day are valued by taking the sum of:
•the value of the Account’s cash; cash equivalents, and short-term and other debt instruments;
•the value of the Account’s other securities and other non-real estate assets;
•the value of the individual real properties (based on the most recent valuation of that property) and other real estate-related investments owned by the Account;
•an estimate of the net operating income accrued by the Account from its properties, other real estate-related investments and non-real estate-related investments (including short-term marketable securities) since the end of the prior valuation day; and
•actual net operating income earned from the Account’s properties, other real estate-related investments and non-real estate-related investments (but only to the extent any such item of income differs from the estimated income accrued for on such investments),
and then reducing the sum by liabilities held within the Account, including the daily investment management fee, administration and distribution fees, mortality and expense fee, and liquidity guarantee fee, and certain other expenses attributable to operating the Account. Daily estimates of net operating income are adjusted to reflect actual net operating income on a monthly basis, at which time such adjustments (if any) are reflected in the Account’s unit value.
After the end of every quarter, the Account reconciles the amount of expenses deducted from the Account (which is established in order to approximate the costs that the Account will incur) with the expenses the Account actually incurred. If there is a difference, the Account adds it to or deducts it from the Account in equal daily installments over the remaining days of the following quarter. Material differences may be repaid in the current calendar quarter. The Account’s at-cost deductions are based on projections of Account assets and overall expenses, and the size of any adjusting payments will be directly affected by the difference between management’s projections and the Account’s actual assets or expenses.
Variable Interest Entities: Variable interests are financial relationships which expose a reporting entity to the risks and rewards of variability in the entity's assets and operations. When variable interests exist, they are subject to evaluation under the variable interest entity ("VIE") model if any one of the following four characteristics are present: a) the entity is insufficiently capitalized; b) the equity holders do not have power to control the activities that most significantly impact the entity's financial performance; c) the voting rights of the equity holders are not proportionate to their economic interests; or d) the equity holders are not exposed to the residual losses or benefits that would normally be associated with equity interests.
ASC 810 - Consolidation prohibits a reporting entity that qualifies as an investment company under ASC 946 - Financial Services - Investment Companies from consolidating an investee that is not an investment company. This
82
scope exception does not apply to situations in which an investment company has an interest in another investment company. Accordingly, the Account's investments in other investment companies (e.g., real estate funds) are subject to evaluation under the VIE model.
The Account may lend securities to qualified borrowers to generate additional income. When loaning securities,consolidates a VIE if it concludes that the Account retainsis the primary beneficiary of the VIE. The primary beneficiary has both: a) the power to direct the activities of a VIE that most significantly impact the VIE's economic performance; and b) the obligation to absorb losses or the right to receive benefits of owningthat could potentially be significant to the securities, including the economic equivalent of dividends or interest generatedVIE. The following activities have been identified by the securities. Cash collateral received for securitiesAccount as having the most significant impact on loan is maintained exclusively in an interest-bearing deposit account. All income generateda VIE's economic performance:
•control over the ability to acquire and dispose of investments held by the securities lending program is reflected within interest income on entity;
•the Account's Consolidated Statementsability to kick out a managing entity without cause, either unilaterally or with a group of Operations.equity investors;
•the ability to modify the power of the managing entity without its consent; and
•control over the day-to-day decision making of the underlying investments
An equity investor in a VIE may not actively be involved in the significant activities (i.e., it may cede day-to-day decision making to a third party), but if the equity investor has approval rights or some other mechanism to retain ultimate control, the equity investor with these rights would be concluded as having power over the activity.
On a quarterly basis, the Account evaluates all involvements with VIEs, including any changes to governing powers of continuing VIEs. The consolidation status of VIEs may change as a result of such continued evaluation. At the reporting date, the Account was not deemed to be the primary beneficiary of any VIEs. Refer to Note 7—Investments in Real Estate Funds for additional detail.
Cash and Cash Equivalents: Cash and cash equivalents are balances held by the Account in bank deposit accounts which, at times, may exceed federally insured limits. The Account’s management monitors these balances to mitigate the exposure of risk due to concentration and has not experienced any losses from such concentration.
Other Assets and Other Liabilities: Other assets and other liabilities consist of operating assets and liabilities utilized and held at each individual real estate property investment. Other assets consist of, amongst other items, cash, tenant receivables and prepaid expenses; whereas other liabilities primarily consist of security deposits. Other assets also include cash collateral held for securities on loan.
Federal Income Taxes: Based on provisions of the Internal Revenue Code, Section 817, the Account is taxed as a segregated asset account of TIAA and as such, the Account incurs no material federal income tax attributable to the net investment activity of the Account. The Account’s federal income tax return is generally subject to examination for a period of three years after filed. State and local tax returns may be subject to examination for an additional period of time depending on the jurisdiction. Management has analyzed the Account’s tax positions taken for all open federal income tax years and has concluded that no provision for federal income tax is required in the Account’s Consolidated Financial Statements.
Restricted Cash: The Account held $42.3 million and $45.8 million as of December 31, 2017 and 2016, respectively,restricted cash in escrow accounts for security deposits, as required by certain states, as well as property taxes, insurance, and various other property related matters as required by certain creditors related to outstanding mortgage loans payable collateralized by certain real estate investments. These amounts are recorded within Other Assetsother assets on the Account's Consolidated Statements of Assets and Liabilities. See Note 8—Mortgage 9—Loans Payable for additional information regarding the Account’s outstanding mortgage loans payable.
Changes in Net Assets: Premiums include premiums paid by existing accumulation unit holders in the Account and transfers into the Account. Withdrawals and death benefits include withdrawals out of the Account which include transfers out of the Account and required minimum distributions.
Due to/from Investment Manager: Due to/from investment manager represents amounts that are to be paid or received by TIAA on behalf of the Account. Amounts generally are paid or received by the Account within one1 or two2 business days and no interest is contractually charged on these amounts.
83
Securities Lending: The Account may lend securities to qualified borrowers to earn additional income. The Account receives cash collateral against the loaned securities and maintains cash collateral in an amount not less than 100% of the market value of loaned securities during the period of the loan; any additional collateral required due to changes in security values is delivered to the Account the next business day. Cash collateral received by the Account is invested exclusively in an interest-bearing deposit account. The value of the loaned securities and the liability to return the cash collateral received are reflected in the Consolidated Statements of Assets and Liabilities. When loaning securities, the Account retains the benefits of owning the securities, including the economic equivalent of dividends or interest generated by the securities. All income generated by the securities lending program is reflected within interest income on the Consolidated Statements of Operations.
Securities lending transactions are for real-estate related equity securities, and the resulting loans are continuous, can be recalled at any time, and have no set maturity. Securities lending income recognized by the Account consists of interest earned on cash collateral and lending fees, net of any rebates to the borrower and compensation to the agent. Such income is reflected within interest income on the Consolidated Statements of Operations. In lending its securities, the Account bears the market risk with respect to the investment of collateral and the risk that the agent may default on its contractual obligations to the Account. The agent bears the risk that the borrower may default on its obligation to return the loaned securities as the agent is contractually obligated to indemnify the Account if at the time of a default by a borrower some or all of the loan securities have not been returned.
Recent Accounting Pronouncements: In May 2014,July 2021, the FASB issued Accounting Standard Update 2014-09, Revenue from ContractsASU 2021-05—Leases (Topic 842): Lessors—Certain Leases with CustomersVariable Lease Payments (“ASU 2014-09”2021-05”). The amendments in ASU 2014-09 supersedes all existing revenue recognition guidance2021-05 amend the lease classification requirements for lessors to align them with practice under Topic 840. Lessors should classify and establishesaccount for a five-step model to measurelease with variable lease payments that do not depend on a reference index or a rate as an operating lease if certain criteria are met. When a lease is classified as operating, the lessor does not recognize a net investment in the lease, does not derecognize the underlying asset, and, therefore, does not recognize revenue. ASU 2014-09 will bea selling profit or loss. The amendments are effective for fiscal years beginning after December 15, 2017, the Account will adopt ASU 2014-09 as of January 1, 2018 utilizing the modified retrospective adoption approach. The Account has completed its implementation analysis of ASU 2014-09 and determined it will be immaterially impacted by the adoption.
In March 2020, the FASB issued ASU 2016-012020-04, Facilitation of the Effects of Reference Rate Reform on Financial Reporting (“ASU 2020-04”). The guidance provides optional expedients and exceptions for applying generally accepted accounting principles to contract modifications and hedging relationships, subject to meeting certain criteria, that reference the London Interbank Offered Rate ("LIBOR") or another reference rate expected to be discontinued. The expedients and exceptions are effective for the period from March 12, 2020 through December 31, 2022. Management does not expect the guidance to materially impact the Account.
Note 2—Management Agreements, Arrangements and Related Party Transactions
Investment advisorymanagement, administrative and distribution services are provided to the Account at cost by TIAA. Services provided at cost are paid by the Account on a daily basis based upon projected expenses to be provided to the Account. Payments are adjusted periodically to ensure daily payments are as close as possible to the Account’s actual expenses incurred. Differences between actual expenses and the amounts paid by the Account are reconciled and adjusted quarterly.
Investment management services for the Account are provided by TIAA employees,officers, under the direction and control of the Board, and its Investment Committee, pursuant to investment management procedures adopted by TIAA for the Account. TIAA’s investment management decisions for the Account are subject to review by the Account’s independent fiduciary. TIAA also provides various portfolio accounting and related services for the Account.
The Account is a party to the Distribution Agreement for the Contracts Funded by the TIAA Real Estate Account (the “Distribution Agreement”), dated January 1, 2008, by and among TIAA, for itself and on behalf of the Account, and TIAA-CREF Individual and Institutional Services, LLC (“Services”), a wholly-owned subsidiary of
84
TIAA, a registered broker-dealer and a member of the Financial Industry Regulatory Authority. Pursuant to the Distribution Agreement, Services performs distribution services for the Account which include, among other things, (i) distribution of annuity contracts issued by TIAA and funded by the Account, (ii) advising existing annuity contract owners in connection with their accumulations and (iii) helping employers implement and manage retirement plans. In addition, TIAA performs administrative functions for the Account, which include, among other things, (i) maintaining accounting records and performing accounting services, (ii) receiving and allocating premiums, (iii) calculating and making annuity payments, (iv) processing withdrawal requests, (v) providing regulatory compliance and reporting services, (vi) maintaining the Account’s records of contract ownership and (vii) otherwise assisting generally in all aspects of the Account’s operations. Both distribution services (pursuant to the Distribution Agreement) and administrative services are provided to the Account by Services and TIAA, as applicable, on an at cost basis.
The Distribution Agreement is terminable by either party upon 60 days written notice and terminates automatically upon any assignment thereof.
In addition to providing the services described above, TIAA and Services provide investment management, administrative and distribution services at cost. TIAA and Services receive payments fromcharges the Account onfees to bear certain mortality and expense risks and risks with providing the liquidity guarantee. These fees are charged as a daily basis according to formulaspercentage of the net assets of the Account. Rates for these fees are established each year and adjusted periodically with the objectiveannually.
Once an Account participant begins receiving lifetime annuity income benefits, payment levels cannot be reduced as a result of keeping the payments as close as possible to the Account’s expenses actually incurred. Any differences between actual expensesmortality experience. As such, mortality and the amounts paid by the Accountexpense risk are adjusted quarterly.contractual charges for TIAA’s assumption of this risk.
Expenses for the services and fees described above are available foridentified as such transfer and withdrawal requests by purchasing accumulation units of the Account.
The independent fiduciary, which has the right to adjust the trigger point, has established the trigger point at 45% of the outstanding accumulation units and it will continue to monitor TIAA’s ownership interest in the Account and provide further recommendations as necessary.
| Related Party | Equity Ownership Interest | Interest Rate | Maturity Date | Fair Value at | ||||||||||||||||||||||||||||||||||||||||
| Principal | December 31, 2021 | December 31, 2020 | ||||||||||||||||||||||||||||||||||||||||||
| 2021 | 2020 | |||||||||||||||||||||||||||||||||||||||||||
| $ | 36.5 | $ | 36.5 | MRA Hub 34 Holding, LLC | 95.00% | 2.50% + LIBOR | 9/1/2022 | $ | 36.5 | $ | 36.5 | |||||||||||||||||||||||||||||||||
| 0.5 | — | MRA 34 LLC | —% | 3.75% + LIBOR | 8/26/2022 | 0.5 | — | |||||||||||||||||||||||||||||||||||||
| 32.8 | 32.8 | THP Student Housing, LLC | 97.00% | 3.20% | 9/1/2024 | 32.9 | 32.9 | |||||||||||||||||||||||||||||||||||||
| TOTAL LOANS RECEIVABLE WITH RELATED PARTIES | $ | 69.9 | $ | 69.4 | ||||||||||||||||||||||||||||||||||||||||
Note 3—CreditConcentration Risk Concentrations
Concentrations of credit risk may arise when a number of properties or tenants are located in a similar geographic region such that the economic conditions of that region could impact tenants’ obligations to meet their contractual obligations or cause the values of individual properties to decline. TheAdditionally, concentrations of risk may arise if any one tenant comprises a significant amount of the Account's rent, or if tenants are concentrated in a particular industry.
As of December 31, 2021, the Account hashad no significant concentrations of tenants as no single tenant hashad annual contract rent that makesmade up more than 2%4% of the rental income of the Account. Moreover, the Account's tenants have no notable concentration present in any one industry.
85
The Account’s wholly-owned real estate investments and investments in joint ventures are primarily located in the United States. The following table represents the diversification of the Account’s portfolio by region and property type as of December 31, 2017:2021:
Diversification by Fair Value(1) | ||||||||||||||||||||||||||||||||||||||
West(2) | South(3) | East(4) | Midwest(5) | Foreign(6) | Total | |||||||||||||||||||||||||||||||||
| Office | 11.3 | % | 5.8 | % | 15.1 | % | 0.2 | % | — | % | 32.4 | % | ||||||||||||||||||||||||||
| Apartment | 9.3 | % | 9.2 | % | 6.9 | % | 1.1 | % | — | % | 26.5 | % | ||||||||||||||||||||||||||
| Industrial | 13.6 | % | 5.7 | % | 2.2 | % | 1.0 | % | — | % | 22.5 | % | ||||||||||||||||||||||||||
| Retail | 4.7 | % | 5.9 | % | 2.9 | % | 0.8 | % | — | % | 14.3 | % | ||||||||||||||||||||||||||
Other(7) | 1.2 | % | 1.7 | % | 1.0 | % | 0.2 | % | 0.2 | % | 4.3 | % | ||||||||||||||||||||||||||
| Total | 40.1 | % | 28.3 | % | 28.1 | % | 3.3 | % | 0.2 | % | 100.0 | % | ||||||||||||||||||||||||||
Diversification by Fair Value(1) | |||||||||||||||
| West | East | South | Midwest | Total | |||||||||||
| Office | 16.1 | % | 20.2 | % | 5.6 | % | — | % | 41.9 | % | |||||
| Apartment | 8.4 | % | 8.0 | % | 3.6 | % | 0.9 | % | 20.9 | % | |||||
| Retail | 8.1 | % | 3.0 | % | 7.6 | % | 0.7 | % | 19.4 | % | |||||
| Industrial | 7.5 | % | 2.0 | % | 4.1 | % | 0.8 | % | 14.4 | % | |||||
Other(2) | 0.6 | % | 2.6 | % | 0.1 | % | 0.1 | % | 3.4 | % | |||||
| Total | 40.7 | % | 35.8 | % | 21.0 | % | 2.5 | % | 100.0 | % | |||||
(2)Properties in the “West” region are located in: AK, AZ, CA, CO, HI, ID, MT, NM, NV, OR, UT, WA, WY
(3)Properties in the “East” region are located in: CT, DC, DE, KY, MA, MD, ME, NC, NH, NJ, NY, PA, RI, SC, VA, VT, WV
(4)Properties in the “South” region are located in: AL, AR, FL, GA, LA, MS, OK, TN, TX
(5)Properties in the “Midwest” region are located in: IA, IL, IN, KS, MI, MN, MO, ND, NE, OH, SD, WI
(6)Represents a developable land investment in Ireland.
(7)Represents interests in Storage Portfolio investments, a hotel investment and land.
Note 4—Leases
The Account’s wholly-owned real estate properties are leased to tenants under operating lease agreements which expire on various dates through 2090.2032. Rental income is recognized in accordance with the billing terms of the lease agreements. The leases do not have material variable payments, material residual value guarantees or material restrictive covenants. Certain leases have the option to extend or terminate at the tenant's discretion, with termination options resulting in additional fees due to the Account. Aggregate minimum annual rentals for wholly-owned real estate investments owned by the Account through the non-cancelable lease term, excluding short-term residential leases, are as follows (in millions)(millions):
| Years Ending December 31, | |||
| 2018 | $ | 592.3 | |
| 2019 | 556.9 | ||
| 2020 | 503.6 | ||
| 2021 | 426.7 | ||
| 2022 | 354.1 | ||
| Thereafter | 2,764.6 | ||
| Total | $ | 5,198.2 | |
| For the Years Ending December 31, | |||||
| 2022 | $ | 635.8 | |||
| 2023 | 594.2 | ||||
| 2024 | 517.7 | ||||
| 2025 | 436.1 | ||||
| 2026 | 330.2 | ||||
| Thereafter | 1,172.7 | ||||
| Total | $ | 3,686.7 | |||
Certain leases provide for additional rental amounts based upon the recovery of actual operating expenses in excess of specified base amounts, sales volume or contractual increases as defined in the lease agreement. These contractual contingent rentals are not included in the table above.
The Account has ground leases for which the Account is the lessee. The leases do not contain material residual value guarantees or material restrictive covenants. The fair value of right-of-use assets and leases liabilities related to ground leases are reflected on the balance sheet within other assets and other liabilities, respectively.
The fair values and key terms of the right-of-use assets and lease liabilities related to the Account's ground leases are as follows (millions):
86
| As of December 31, 2021 | ||||||||
| Assets: | ||||||||
| Right-of-use assets, at fair value | $ | 40.3 | ||||||
| Liabilities: | ||||||||
| Ground lease liabilities, at fair value | $ | 40.3 | ||||||
| Key Terms | ||||||||
| Weighted-average remaining lease term (years) | 69.5 | |||||||
Weighted-average discount rate(1) | 7.71 | % | ||||||
(1) Discount rates are reflective of the rates utilized during the most recent appraisal of the associated real estate investments.
For the year ended December 31, 2021, operating lease costs related to ground leases were $2.3 million. These costs include variable lease costs, which are immaterial. Aggregate future minimum annual payments for ground leases held by the Account are as follows (millions):
| For the Years Ending December 31, | |||||
| 2022 | $ | 2.3 | |||
| 2023 | 2.3 | ||||
| 2024 | 2.4 | ||||
| 2025 | 2.4 | ||||
| 2026 | 2.4 | ||||
| Thereafter | 414.0 | ||||
| Total | $ | 425.8 | |||
In April 2020, the FASB staff released guidance focused on treatment of concessions related to the effects of the COVID-19 pandemic on the application of lease modification guidance in Accounting Standards Codification (“ASC”) 842, “Leases.” The guidance provides a practical expedient to forgo the associated reassessments required by ASC 842 when changes to a lease result in similar or lower future consideration. There was no material exposure to rent concessions or lease defaults for tenants impacted by the COVID-19 pandemic for the year ended December 31, 2021.
Note 5—Assets and Liabilities Measured at Fair Value on a Recurring Basis
Valuation Hierarchy: The Account’s fair value measurements are grouped categorically into three levels, as defined by the FASB. The levels are defined as follows:
•Level 1—Valuations using unadjusted1 fair value inputs are quoted prices for assets tradedidentical items in active, liquid and visible markets such as stocks listed on the New York Stock Exchange. Active markets are defined as having the following characteristics for the measured asset or liability: (i) many transactions, (ii) current prices, (iii) price quotes not varying substantially among market makers, (iv) narrow bid/ask spreads and (v) most information regarding the issuer is publicly available. Level 1 assets held by the Account are generally marketable equity securities.stock exchanges.
•Level 3 fair value inputs reflect our best estimate of inputs and assumptions market participants would use in pricing an asset or liability either directly or indirectly. Level 2at the measurement date. The inputs include:
An investment’s categorization within the valuation hierarchy described above is based upon the lowest level of input that is significant to the fair value measurement. The Account’s limited partnershipReal estate fund investments are excluded from the valuation hierarchy, as these investments are fair valued using thetheir net asset value per share as a practical expedient which excludes the investmentssince market quotations or values from the valuation hierarchy.
87
The following tables show the major categories of assets and liabilities measured at fair value on a recurring basis as of December 31, 20172021 and 2016,2020, using unadjusted quoted prices in active markets for identical assets (Level 1); significant other observable inputs (Level 2); significant unobservable inputs (Level 3); and Practical Expedient (in millions)(millions):
| Description | Level 1: Quoted Prices in Active Markets for Identical Assets | Level 2: Significant Other Observable Inputs | Level 3: Significant Unobservable Inputs | Fair Value Using Practical Expedient | Total at December 31, 2021 | |||||||||||||||||||||||||||
| Real estate properties | — | — | 18,903.9 | — | 18,903.9 | |||||||||||||||||||||||||||
| Real estate joint ventures | — | — | 7,175.9 | — | 7,175.9 | |||||||||||||||||||||||||||
| Real estate funds | — | — | — | 811.5 | 811.5 | |||||||||||||||||||||||||||
| Real estate operating business | — | — | 326.3 | — | 326.3 | |||||||||||||||||||||||||||
| Marketable securities: | ||||||||||||||||||||||||||||||||
| United States Government agency notes | — | 864.1 | — | — | 864.1 | |||||||||||||||||||||||||||
| Foreign Government agency notes | — | 7.6 | — | — | 7.6 | |||||||||||||||||||||||||||
| United States Treasury securities | — | 784.3 | — | — | 784.3 | |||||||||||||||||||||||||||
| Corporate bonds | — | 551.8 | — | — | 551.8 | |||||||||||||||||||||||||||
Loans receivable(1) | — | — | 1,492.6 | — | 1,492.6 | |||||||||||||||||||||||||||
| Total Investments at December 31, 2021 | $ | — | $ | 2,207.8 | $ | 27,898.7 | $ | 811.5 | $ | 30,918.0 | ||||||||||||||||||||||
| Loans payable | $ | — | $ | — | $ | (2,380.5) | $ | — | $ | (2,380.5) | ||||||||||||||||||||||
| Line of credit | $ | — | $ | — | $ | (500.0) | $ | — | $ | (500.0) | ||||||||||||||||||||||
| Description | Level 1: Quoted Prices in Active Markets for Identical Assets | Level 2: Significant Other Observable Inputs | Level 3: Significant Unobservable Inputs | Fair Value Using Practical Expedient | Total at December 31, 2017 | Description | Level 1: Quoted Prices in Active Markets for Identical Assets | Level 2: Significant Other Observable Inputs | Level 3: Significant Unobservable Inputs | Fair Value Using Practical Expedient | Total at December 31, 2020 | |||||||||||||||||||||||||||||||||||||||||
| Real estate properties | $ | — | $ | — | $ | 15,742.7 | $ | — | $ | 15,742.7 | Real estate properties | $ | — | $ | — | $ | 16,476.7 | $ | — | $ | 16,476.7 | |||||||||||||||||||||||||||||||
| Real estate joint ventures | — | — | 5,860.6 | — | 5,860.6 | Real estate joint ventures | — | — | 6,128.9 | — | 6,128.9 | |||||||||||||||||||||||||||||||||||||||||
| Limited partnerships | — | — | — | 142.4 | 142.4 | |||||||||||||||||||||||||||||||||||||||||||||||
| Real estate funds | Real estate funds | — | — | — | 393.2 | 393.2 | ||||||||||||||||||||||||||||||||||||||||||||||
| Real estate operating business | Real estate operating business | 250.0 | — | 250.0 | ||||||||||||||||||||||||||||||||||||||||||||||||
| Marketable securities: | Marketable securities: | |||||||||||||||||||||||||||||||||||||||||||||||||||
| Real estate-related | 1,238.0 | — | — | — | 1,238.0 | |||||||||||||||||||||||||||||||||||||||||||||||
| Government agency notes | — | 2,872.3 | — | — | 2,872.3 | Government agency notes | — | 157.0 | — | — | 157.0 | |||||||||||||||||||||||||||||||||||||||||
| United States Treasury securities | — | 1,015.2 | — | — | 1,015.2 | United States Treasury securities | — | 582.3 | — | — | 582.3 | |||||||||||||||||||||||||||||||||||||||||
| Loans receivable | — | — | 298.8 | — | 298.8 | |||||||||||||||||||||||||||||||||||||||||||||||
| Total Investments at December 31, 2017 | $ | 1,238.0 | $ | 3,887.5 | $ | 21,902.1 | $ | 142.4 | $ | 27,170.0 | ||||||||||||||||||||||||||||||||||||||||||
| Mortgage loans payable | $ | — | $ | — | $ | (2,238.3 | ) | $ | — | $ | (2,238.3 | ) | ||||||||||||||||||||||||||||||||||||||||
Loans receivable(1) | Loans receivable(1) | — | — | 1,562.6 | — | 1,562.6 | ||||||||||||||||||||||||||||||||||||||||||||||
| Total Investments at December 31, 2020 | Total Investments at December 31, 2020 | $ | — | $ | 739.3 | $ | 24,418.2 | $ | 393.2 | $ | 25,550.7 | |||||||||||||||||||||||||||||||||||||||||
| Loans payable | Loans payable | $ | — | $ | — | $ | (2,411.4) | $ | — | $ | (2,411.4) | |||||||||||||||||||||||||||||||||||||||||
| Line of credit | Line of credit | $ | — | $ | — | $ | — | $ | — | $ | — | |||||||||||||||||||||||||||||||||||||||||
(1) Amount shown is reflective of loans receivable and loans receivable with related parties.
88
| Description | Level 1: Quoted Prices in Active Markets for Identical Assets | Level 2: Significant Other Observable Inputs | Level 3: Significant Unobservable Inputs | Fair Value Using Practical Expedient | Total at December 31, 2016 | |||||||||||||||
| Real estate properties | $ | — | $ | — | $ | 15,452.8 | $ | — | $ | 15,452.8 | ||||||||||
| Real estate joint ventures | — | — | 5,622.4 | — | 5,622.4 | |||||||||||||||
| Limited partnerships | — | — | — | 137.5 | 137.5 | |||||||||||||||
| Marketable securities: | ||||||||||||||||||||
| Real estate-related | 1,081.5 | — | — | — | 1,081.5 | |||||||||||||||
| Government agency notes | — | 2,308.9 | — | — | 2,308.9 | |||||||||||||||
| United States Treasury securities | — | 1,744.9 | — | — | 1,744.9 | |||||||||||||||
| Loans receivable | — | — | 295.7 | — | 295.7 | |||||||||||||||
| Total Investments at December 31, 2016 | $ | 1,081.5 | $ | 4,053.8 | $ | 21,370.9 | $ | 137.5 | $ | 26,643.7 | ||||||||||
| Mortgage loans payable | $ | — | $ | — | $ | (2,332.1 | ) | $ | — | $ | (2,332.1 | ) | ||||||||
The following tables show the reconciliation of the beginning and ending balances for assets and liabilities measured at fair value on a recurring basis using significant unobservable inputs (Level 3) during the years ended December 31, 20172021 and 2016 (in millions)2020 (millions):
| Real Estate Properties | Real Estate Joint Ventures | Real Estate Operating Business | Loans Receivable(3) | Total Level 3 Investments | Loans Payable | Line of Credit | ||||||||||||||||||||||||||||||||||||||
| For the year ended December 31, 2021 | ||||||||||||||||||||||||||||||||||||||||||||
| Beginning balance January 1, 2021 | $ | 16,476.7 | $ | 6,128.9 | $ | 250.0 | $ | 1,562.6 | $ | 24,418.2 | $ | (2,411.4) | $ | — | ||||||||||||||||||||||||||||||
| Total realized and unrealized (losses) gains included in changes in net assets | 2,466.2 | 844.3 | 74.9 | 8.6 | 3,394.0 | 12.2 | — | |||||||||||||||||||||||||||||||||||||
Purchases(1) | 881.9 | 899.6 | 1.4 | 326.7 | 2,109.6 | (188.9) | (500.0) | |||||||||||||||||||||||||||||||||||||
| Sales | (920.9) | — | — | (294.5) | (1,215.4) | — | — | |||||||||||||||||||||||||||||||||||||
Settlements(2) | — | (696.9) | — | (110.8) | (807.7) | 207.6 | — | |||||||||||||||||||||||||||||||||||||
| Ending balance December 31, 2021 | $ | 18,903.9 | $ | 7,175.9 | $ | 326.3 | $ | 1,492.6 | $ | 27,898.7 | $ | (2,380.5) | $ | (500.0) | ||||||||||||||||||||||||||||||
Real Estate Properties | Real Estate Joint Ventures | Loans Receivable | Total Level 3 Investments | Mortgage Loans Payable | ||||||||||||||||
| For the year ended December 31, 2017 | ||||||||||||||||||||
| Beginning balance January 1, 2017 | $ | 15,452.8 | $ | 5,622.4 | $ | 295.7 | $ | 21,370.9 | $ | (2,332.1 | ) | |||||||||
| Total realized and unrealized gains included in changes in net assets | 177.5 | 123.5 | 1.2 | 302.2 | 15.9 | |||||||||||||||
Purchases(1) | 682.9 | 419.0 | 1.9 | 1,103.8 | (17.7 | ) | ||||||||||||||
| Sales | (570.5 | ) | — | — | (570.5 | ) | — | |||||||||||||
Settlements(2) | — | (304.3 | ) | — | (304.3 | ) | 95.6 | |||||||||||||
| Ending balance December 31, 2017 | $ | 15,742.7 | $ | 5,860.6 | $ | 298.8 | $ | 21,902.1 | $ | (2,238.3 | ) | |||||||||
| Real Estate Properties | Real Estate Joint Ventures | Real Estate Operating Business | Loans Receivable(3) | Total Level 3 Investments | Loans Payable | Line of Credit | ||||||||||||||||||||||||||||||||||||||
| For the year ended December 31, 2020 | ||||||||||||||||||||||||||||||||||||||||||||
| Beginning balance January 1, 2020 | $ | 15,835.0 | $ | 7,204.2 | $ | — | $ | 1,572.1 | $ | 24,611.3 | $ | (2,365.0) | $ | (250.0) | ||||||||||||||||||||||||||||||
| Total realized and unrealized gains (losses) included in changes in net assets | (348.9) | (477.0) | (0.2) | (34.2) | (860.3) | (3.1) | — | |||||||||||||||||||||||||||||||||||||
Purchases(1) | 1,680.1 | 247.2 | 250.2 | 118.0 | 2,295.5 | (289.6) | (540.0) | |||||||||||||||||||||||||||||||||||||
| Sales | (689.5) | — | — | (64.7) | (754.2) | — | — | |||||||||||||||||||||||||||||||||||||
Settlements(2) | — | (845.5) | — | (28.6) | (874.1) | 246.3 | 790.0 | |||||||||||||||||||||||||||||||||||||
| Ending balance December 31, 2020 | $ | 16,476.7 | $ | 6,128.9 | $ | 250.0 | $ | 1,562.6 | $ | 24,418.2 | $ | (2,411.4) | $ | — | ||||||||||||||||||||||||||||||
(1)Includes purchases, contributions for joint ventures, capital expenditures, lending for loans receivable and assumption of loans payable.
Real Estate Properties | Real Estate Joint Ventures | Loans Receivable | Total Level 3 Investments | Mortgage Loans Payable | ||||||||||||||||
| For the year ended December 31, 2016 | ||||||||||||||||||||
| Beginning balance January 1, 2016 | $ | 14,606.2 | $ | 4,068.4 | $ | 100.6 | $ | 18,775.2 | $ | (1,794.4 | ) | |||||||||
| Total realized and unrealized gains included in changes in net assets | 311.3 | 242.8 | 0.3 | 554.4 | 15.1 | |||||||||||||||
Purchases(1) | 786.4 | 1,313.6 | 194.8 | 2,294.8 | (587.5 | ) | ||||||||||||||
| Sales | (251.1 | ) | — | — | (251.1 | ) | — | |||||||||||||
Settlements(2) | — | (2.4 | ) | — | (2.4 | ) | 34.7 | |||||||||||||
| Ending balance December 31, 2016 | $ | 15,452.8 | $ | 5,622.4 | $ | 295.7 | $ | 21,370.9 | $ | (2,332.1 | ) | |||||||||
(2)Includes operating income for real estate joint ventures net of distributions, principal payments and payoffs of loans receivable, and principal payments and extinguishment of loans payable.
(3)Amount shown is reflective of loans receivable and loans receivable with related parties.
The following table shows quantitative information about unobservable inputs related to the Level 3 fair value measurements as of December 31, 2017.2021.
| Type | Asset Class | Valuation Technique(s) | Unobservable Inputs | Range (Weighted Average) | ||||||||||||||
| Real Estate Properties and Joint Ventures | Office | Income Approach—Discounted Cash Flow | Discount Rate | |||||||||||||||
| Terminal Capitalization Rate | 4.5%– | |||||||||||||||||
| Income Approach—Direct Capitalization | Overall Capitalization Rate | |||||||||||||||||
| Industrial | Income Approach—Discounted Cash Flow | Discount Rate | ||||||||||||||||
| Terminal Capitalization Rate | ||||||||||||||||||
| Income Approach—Direct Capitalization | Overall Capitalization Rate | |||||||||||||||||
| Residential | Income Approach—Discounted Cash Flow | Discount Rate | ||||||||||||||||
| Terminal Capitalization Rate | ||||||||||||||||||
89
| Type | Asset Class | Valuation Technique(s) | Unobservable Inputs | Range (Weighted Average) | ||||||||||
| Income Approach—Direct Capitalization | Overall Capitalization Rate | |||||||||||||
| Retail | Income Approach—Discounted Cash Flow | Discount Rate | ||||||||||||
| Terminal Capitalization Rate | ||||||||||||||
| Income Approach—Direct Capitalization | Overall Capitalization Rate | 4.5% - 9.3% (5.2%) | ||||||||||||
| Hotel | Income Approach—Discounted Cash Flow | Discount Rate | 9.8% | |||||||||||
| Terminal Capitalization Rate | 7.8% | |||||||||||||
| Income Approach—Direct Capitalization | Overall Capitalization Rate | |||||||||||||
| Real Estate Operating Business | Income Approach—Discounted Cash Flow | Discount Rate | 7.3% | |||||||||||
| Terminal Growth Rate | 4.0% | |||||||||||||
| Market Approach | EBITDA Multiple | 21.6x | ||||||||||||
| Loans Receivable, including those with related parties | Office | Discounted Cash Flow | Loan-to-Value Ratio | 41.9% - 94.7% (73.1%) | ||||||||||
| Equivalency Rate | 2.4% - 9.5% (5.7%) | |||||||||||||
| Discounted Cash Flow | Loan-to-Value Ratio | |||||||||||||
| Equivalency Rate | 4.3% - 5.1% (4.6%) | |||||||||||||
| Residential | Discounted Cash Flow | Loan-to-Value Ratio | 38.4% - 77.3% (49.1%) | |||||||||||
| Equivalency Rate | 2.5% - 8.6% (5.0%) | |||||||||||||
| Retail & Hospitality | Discounted Cash Flow | Loan-to-Value Ratio | 59.8% - 79.8% (65.0%) | |||||||||||
| Equivalency Rate | 3.5% - 6.9% (5.2%) | |||||||||||||
| Loans Payable | Office | Discounted Cash Flow | Loan-to-Value Ratio | 36.1% - 63.5% (45.8%) | ||||||||||
| Equivalency Rate | 1.8% - 3.7% (3.2%) | |||||||||||||
| Net Present Value | Loan-to-Value Ratio | |||||||||||||
| Weighted Average Cost of Capital Risk Premium Multiple | ||||||||||||||
| Industrial | Discounted Cash Flow | Loan-to-Value Ratio | ||||||||||||
| Equivalency Rate | 3.3% | |||||||||||||
| Net Present Value | Loan-to-Value Ratio | |||||||||||||
| Weighted Average Cost of Capital Risk Premium Multiple | ||||||||||||||
| Discounted Cash Flow | Loan-to-Value Ratio | |||||||||||||
| Equivalency Rate | ||||||||||||||
| Net Present Value | Loan-to-Value Ratio | |||||||||||||
| Weighted Average Cost of Capital Risk Premium Multiple | ||||||||||||||
| Discounted Cash Flow | Loan-to-Value Ratio | |||||||||||||
| Equivalency Rate | ||||||||||||||
| Net Present Value | Loan-to-Value Ratio | 36.0% - 76.3% (46.0%) | ||||||||||||
| Weighted Average Cost of Capital Risk Premium Multiple | 1.2 - 1.9 (1.4) | |||||||||||||
90
The following table shows quantitative information about unobservable inputs related to the Level 3 fair value measurements as of December 31, 2016.
2020.
| Type | Asset Class | Valuation Technique(s) | Unobservable Inputs | Range (Weighted Average) | ||||||||||
| Real Estate Properties and Joint Ventures | Office | Income Approach—Discounted Cash Flow | Discount Rate | 5.5%– | ||||||||||
| Terminal Capitalization Rate | ||||||||||||||
| Income Approach—Direct Capitalization | Overall Capitalization Rate | |||||||||||||
| Industrial | Income Approach—Discounted Cash Flow | Discount Rate | ||||||||||||
| Terminal Capitalization Rate | ||||||||||||||
| Income Approach—Direct Capitalization | Overall Capitalization Rate | |||||||||||||
| Residential | Income Approach—Discounted Cash Flow | Discount Rate | ||||||||||||
| Terminal Capitalization Rate | ||||||||||||||
| Income Approach—Direct Capitalization | Overall Capitalization Rate | |||||||||||||
| Retail | Income Approach—Discounted Cash Flow | Discount Rate | 5.0% | |||||||||||
| Terminal Capitalization Rate | 4.3% | |||||||||||||
| Income Approach—Direct Capitalization | Overall Capitalization Rate | 4.0% - 11.5% (5.2%) | ||||||||||||
| Hotel | Income Approach—Discounted Cash Flow | Discount Rate | 10.3% | |||||||||||
| Terminal Capitalization Rate | 7.8% | |||||||||||||
| Income Approach—Direct Capitalization | Overall Capitalization Rate | |||||||||||||
| Real Estate Operating Business | Income Approach—Discounted Cash Flow | Discount Rate | 7.3% | |||||||||||
| Terminal Growth Rate | 2.5% | |||||||||||||
| Market Approach | EBITDA Multiple | 13.9x | ||||||||||||
| Loans Receivable, including those with related parties | Office | Discounted Cash Flow | Loan-to-Value Ratio | 50.6% - 91.8% (77.2%) | ||||||||||
| Equivalency Rate | 3.5% - 9.6% (6.6%) | |||||||||||||
| Discounted Cash Flow | Loan-to-Value Ratio | |||||||||||||
| Equivalency Rate | 4.3% - 12.7% (6.8%) | |||||||||||||
| Residential | Discounted Cash Flow | Loan-to-Value Ratio | 47.4% - 74.7% (64.1%) | |||||||||||
| Equivalency Rate | 3.2% - 7.0% (4.9%) | |||||||||||||
| Retail & Hospitality | Discounted Cash Flow | Loan-to-Value Ratio | 61.2% - 86.2% (68.7%) | |||||||||||
| Equivalency Rate | 5.4% - 9.9% (6.3%) | |||||||||||||
| Loans Payable | Office | Discounted Cash Flow | Loan-to-Value Ratio | 35.4% - 54.9% (45.5%) | ||||||||||
| Equivalency Rate | 2.4% - 3.3% (3.0%) | |||||||||||||
| Net Present Value | Loan-to-Value Ratio | |||||||||||||
| Weighted Average Cost of Capital Risk Premium Multiple | ||||||||||||||
| Industrial | Discounted Cash Flow | Loan-to-Value Ratio | ||||||||||||
| Equivalency Rate | ||||||||||||||
| Net Present Value | Loan-to-Value Ratio | |||||||||||||
| Weighted Average Cost of Capital Risk Premium Multiple | ||||||||||||||
| Residential | Discounted Cash Flow | Loan-to-Value Ratio | ||||||||||||
| Equivalency Rate | ||||||||||||||
| Net Present Value | Loan-to-Value Ratio | |||||||||||||
| Weighted Average Cost of Capital Risk Premium Multiple | ||||||||||||||
91
| Type | Asset Class | Valuation Technique(s) | Unobservable Inputs | Range (Weighted Average) | ||||||||||
| Retail | Discounted Cash Flow | Loan-to-Value Ratio | ||||||||||||
| Equivalency Rate | 2.8% - 4.2% | |||||||||||||
| Net Present Value | Loan-to-Value Ratio | 40.2% - 73.4% (47.6%) | ||||||||||||
| Weighted Average Cost of Capital Risk Premium Multiple | 1.3 - 1.8 (1.4) | |||||||||||||
Real Estate Properties and Joint Ventures: The significant unobservable inputs used in the fair value measurement of the Account’s real estate property and joint venture investments are the selection of certain investment rates (Discount Rate, Terminal Capitalization Rate, and Overall Capitalization Rate). Significant increases (decreases) in any of those inputs in isolation would result in significantly lower (higher) fair value measurements, respectively.
Loans Payable:Receivable: The significant unobservable inputs used in the fair value measurement of the Account’s mortgageloans receivable are the loan to value ratios and the selection of certain credit spreads. Significant increases (decreases) in any of those inputs in isolation would result in a significantly lower (higher) fair value, respectively.
Loans Payable: The significant unobservable inputs used in the fair value measurement of the Account’s loans payable are the loan-to-valueloan to value ratios and the selection of certain credit spreads and weighted average cost of capital risk premiums. Significant increases (decreases) in any of those inputs in isolation would result in a significantly lower (higher) fair value, respectively.
During the years ended December 31, 20172021 and 20162020 there were no transfers between Levels 1, 2 or 3.
The amount of total net unrealized (losses) gains included in changes in net assets attributable to the change in net unrealized gains relating to Level 3 investments and mortgage loans payable using significant unobservable inputs still held as of the reporting date is as follows (in millions)(millions):
| Real Estate Properties | Real Estate Joint Ventures | Real Estate Operating Business | Loans Receivable | Total Level 3 Investments | Mortgage Loans Payable | |||||||||||||||||||||||||||||||||
| For the year ended December 31, 2021 | $ | 2,371.8 | $ | 745.7 | $ | 74.9 | $ | 10.9 | $ | 3,203.3 | $ | 12.2 | ||||||||||||||||||||||||||
| For the year ended December 31, 2020 | $ | (344.2) | $ | (382.8) | $ | (0.2) | $ | (32.7) | $ | (759.9) | $ | (3.1) | ||||||||||||||||||||||||||
Real Estate Properties | Real Estate Joint Ventures | Loans Receivable | Total Level 3 Investments | Mortgage Loans Payable | ||||||||||||||||
| For the year ended December 31, 2017 | $ | 185.1 | $ | 125.2 | $ | 1.2 | $ | 311.5 | $ | 15.9 | ||||||||||
| For the year ended December 31, 2016 | $ | 314.2 | $ | 242.4 | $ | 0.3 | $ | 556.9 | $ | 15.1 | ||||||||||
Note 6—Investments in Joint Ventures
The Account owns interests in several real estate properties through joint ventures and receives distributions and allocations of profits and losses from the joint ventures based on the Account’s ownership interest in those investments. Several of these joint ventures have mortgage loans payable collateralized by the properties owned by the aforementioned joint ventures. At December 31, 2017,2021, the Account held investments in joint ventures with ownership interest percentages that ranged from 33.3% to 97.5%98.5%. Certain joint ventures are subject to adjusted distribution percentages when earnings in the investment reach a pre-determined threshold. The fair value of the Account’s equity interest in these joint ventures was $5.9 billion and $5.6 billion at December 31, 2017 and 2016, respectively. The Account’s proportionate share of the mortgage loans payable held within the joint venture investments at fair value was $2.4 billion and $2.1 billion at December 31, 2017 and 2016, respectively. The Account’s share in the outstanding principal of the mortgage loans payable held within the joint venture investments was $2.4 billion and $2.1 billion at December 31, 2017 and 2016, respectively.
A condensed summary of the gross financial position and results of operations of the combined joint ventures is shown below (in millions)(millions):
92
| December 31, | December 31, | |||||||||||||||||||||
| 2017 | 2016 | 2021 | 2020 | |||||||||||||||||||
| Assets | Assets | |||||||||||||||||||||
| Real estate properties, at fair value | $ | 14,240.8 | $ | 13,539.0 | Real estate properties, at fair value | $ | 16,681.2 | $ | 15,494.7 | |||||||||||||
| Other assets | 337.1 | 316.1 | Other assets | 684.9 | 696.0 | |||||||||||||||||
| Total assets | $ | 14,577.9 | $ | 13,855.1 | Total assets | $ | 17,366.1 | $ | 16,190.7 | |||||||||||||
| Liabilities & Equity | Liabilities & Equity | |||||||||||||||||||||
| Mortgage notes payable and other obligations, at fair value | $ | 3,995.7 | $ | 3,452.9 | Mortgage notes payable and other obligations, at fair value | $ | 5,187.3 | $ | 4,959.6 | |||||||||||||
| Other liabilities | 150.7 | 213.9 | Other liabilities | 240.7 | 250.0 | |||||||||||||||||
| Total liabilities | 4,146.4 | 3,666.8 | Total liabilities | 5,428.0 | 5,209.6 | |||||||||||||||||
| Total equity | 10,431.5 | 10,188.3 | Total equity | 11,938.1 | 10,981.1 | |||||||||||||||||
| Total liabilities and equity | $ | 14,577.9 | $ | 13,855.1 | Total liabilities and equity | $ | 17,366.1 | $ | 16,190.7 | |||||||||||||
| Years ended December 31, | Years ended December 31, | |||||||||||||||||||||||||||||||
| 2017 | 2016 | 2015 | 2021 | 2020 | 2019 | |||||||||||||||||||||||||||
| Operating Revenue and Expenses | Operating Revenue and Expenses | |||||||||||||||||||||||||||||||
| Revenues | $ | 869.2 | $ | 714.6 | $ | 609.5 | Revenues | $ | 1,040.5 | $ | 1,021.6 | $ | 1,126.5 | |||||||||||||||||||
| Expenses | 426.9 | 365.0 | 318.6 | Expenses | 577.7 | 571.9 | 604.1 | |||||||||||||||||||||||||
| Excess of revenues over expenses | $ | 442.3 | $ | 349.6 | $ | 290.9 | Excess of revenues over expenses | $ | 462.8 | $ | 449.7 | $ | 522.4 | |||||||||||||||||||
Note 7—Investments in Limited PartnershipsReal Estate Funds
The Account has ownership interests in real estate funds (each a “Fund”, and collectively the “Funds”). The Funds are setup as limited partnerships or entities similar to a limited partnership, and as such, meet the definition of a VIE as the limited partners collectively lack the power, through voting or similar rights, to direct the activities of the Fund that most significantly impact the Fund's economic performance. Management has determined that the Account is not the primary beneficiary for any of the Funds, as the Account lacks the power to direct the activities of each Fund that most significantly impact the respective Fund's economic performance, and the Account further lacks substantive kick-out rights to remove the entity with these powers. Refer to Note 1—Organization and Significant Accounting Policies for a description of the methodology used to determine the primary beneficiary of a VIE.
No financial support (such as loans or financial guarantees) was provided to the Funds during the year ended December 31, 2021. The Account is contractually obligated to make additional capital contributions in certain Funds in future years. These commitments are included in the maximum exposure to loss presented below.
The carrying amount and maximum exposure to loss relating to unconsolidated VIEs in which the Company holds a variable interest but is not the primary beneficiary were as follows at December 31, 2021 (in millions):
| Fund Name | Carrying Amount | Maximum Exposure to Loss | Liquidity Provisions | Investment Strategy | |||||||||||||||||||
| LCS SHIP Venture I, LLC (90.0% Account Interest) | $ | 230.2 | $ | 230.2 | Redemptions prohibited prior to liquidation. | To invest in senior housing properties. | |||||||||||||||||
| Liquidation estimated to begin no earlier than 2025. | |||||||||||||||||||||||
| The Account is permitted to sell or transfer its interest in the fund, subject to consent and approval of the manager. | |||||||||||||||||||||||
93
| Veritas - Trophy VI, LLC (90.4% Account Interest) | $ | 81.6 | $ | 102.2 | Redemptions prohibited prior to liquidation. | To invest in multi-family properties primarily in the San Francisco Bay and Los Angeles metropolitan statistical area ("MSA"). | |||||||||||||||||
| The Account is not permitted to sell or transfer its interest in the fund until August 2022. After this date, the Account can sell or transfer its interest in the fund with the consent and approval of the manager. | |||||||||||||||||||||||
| SP V - II, LLC (61.8% Account Interest) | $ | 102.3 | $ | 115.2 | Redemptions prohibited prior to liquidation. | To invest in medical office properties in the U.S. | |||||||||||||||||
| Liquidation estimated to begin no earlier than 2022. | |||||||||||||||||||||||
| The Account is permitted to sell or transfer its interest in the fund, subject to consent and approval of the manager. | |||||||||||||||||||||||
| Taconic New York City GP Fund, LP (60.0% Account Interest) | $ | 29.8 | $ | 34.0 | Redemptions prohibited prior to liquidation. | To invest in real estate and real estate-related assets in the New York City MSA. | |||||||||||||||||
| Liquidation estimated to begin no earlier than 2024. | |||||||||||||||||||||||
| The Account is permitted to sell its interest in the fund, subject to consent and approval of the general partner. | |||||||||||||||||||||||
| Silverpeak NRE FundCo LLC (90.0% Account Interest) | $ | 62.9 | $ | 100.2 | Redemptions prohibited prior to liquidation. | To invest in alternative real estate investments primarily in major U.S. metropolitan markets. | |||||||||||||||||
| Liquidation estimated to begin no earlier than 2028. | |||||||||||||||||||||||
| The Account is permitted to sell its interest in the fund to qualified institutional investors, subject to consent and approval of the manager. | |||||||||||||||||||||||
| IDR - Core Property Index Fund, LLC (2.5% Account Interest) | $ | 40.6 | $ | 40.6 | Redemptions are permitted for a full calendar quarter and upon at least 90 days prior written notice, subject to fund availability. | To invest primarily in open-ended funds that fall within the NFI-ODCE Index and are actively managed. | |||||||||||||||||
| The Account is permitted to sell its interest in the fund, subject to consent and approval of the manager. | |||||||||||||||||||||||
| Townsend Group Value-Add Fund (99.0% Account Interest) | $ | 114.8 | $ | 240.7 | Redemptions prohibited prior to liquidation. | To invest in value-add real estate investment opportunities in the U.S. market. | |||||||||||||||||
| Liquidation estimated to begin no earlier than 2027. | |||||||||||||||||||||||
| The Account is prohibited from transferring its interest in the fund without consent by the general partner, which can be withheld in their sole discretion | |||||||||||||||||||||||
| Flagler REA Healthcare Properties Partnership (90.0% Account Interest) | $ | 26.5 | $ | 27.8 | Redemptions prohibited prior to liquidation. | To acquire healthcare properties within the top 50 MSA's in the U.S. | |||||||||||||||||
| Liquidation estimated to begin no earlier than 2025. | |||||||||||||||||||||||
| The Account is permitted to transfer its interest in the fund to a qualified institutional investor, subject to the right first offer by the partner, following the one year anniversary of the fund launch. | |||||||||||||||||||||||
| Grubb Southeast Real Estate Fund VI, LLC (66.7% Account Interest) | $ | 34.5 | $ | 34.5 | Redemptions prohibited prior to liquidation. | To acquire office investments across the Southeast. | |||||||||||||||||
| Liquidation estimated to begin no earlier than 2026. | |||||||||||||||||||||||
| The Account is permitted to sell or transfer its interest in the fund with the consent and approval of the manager. | |||||||||||||||||||||||
| Silverpeak NRE FundCo 2 LLC (90.0% Account Interest) | $ | 62.8 | $ | 106.5 | Redemptions prohibited prior to liquidation. | To invest in value-add real estate investment opportunities in the top 25 major U.S. metropolitan markets. | |||||||||||||||||
| The Account is permitted to sell its interest in the fund to qualified institutional investors, subject to consent and approval of the manager. | |||||||||||||||||||||||
94
| JCR Capital - REA Preferred Equity Parallel Fund (31.1% Account Interest) | $ | 25.5 | $ | 100.8 | Redemptions prohibited prior to liquidation. | To invest primarily in multi-family properties. | |||||||||||||||||
| Liquidation estimated to begin no earlier than 2026. | |||||||||||||||||||||||
| The Account is prohibited from transferring its interest in the fund without consent by the general partner, which can be withheld in their sole discretion | |||||||||||||||||||||||
| Total | $ | 811.5 | $ | 1,132.7 | |||||||||||||||||||
Note 8—Loans Receivable
The Account’s loan receivable portfolio is primarily comprised of mezzanine loans secured by the borrower’s indirect interest in commercial real estate. Mezzanine loans are subordinate to first mortgages on the underlying real estate collateral. The following property types represent the underlying real estate collateral for the Account's mezzanine loans (in millions):
| December 31, 2021 | December 31, 2020 | ||||||||||||||||||||||||||||||||||
| Principal Outstanding | Fair Value | % of Fair Value | Principal Outstanding | Fair Value | % of Fair Value | ||||||||||||||||||||||||||||||
Office(1) | $ | 862.4 | $ | 853.4 | 57.2 | % | $ | 794.5 | $ | 778.4 | 49.9 | % | |||||||||||||||||||||||
Apartments(1) | 253.3 | 252.0 | 16.9 | % | 262.2 | 259.7 | 16.6 | % | |||||||||||||||||||||||||||
| Industrial | 161.4 | 161.3 | 10.8 | % | 194.3 | 194.3 | 12.4 | % | |||||||||||||||||||||||||||
| Storage | — | — | — | % | 82.0 | 73.8 | 4.7 | % | |||||||||||||||||||||||||||
| Hotel | 125.3 | 125.3 | 8.4 | % | 135.3 | 129.9 | 8.3 | % | |||||||||||||||||||||||||||
| Retail | 101.7 | 100.6 | 6.7 | % | 128.6 | 126.5 | 8.1 | % | |||||||||||||||||||||||||||
| $ | 1,504.1 | $ | 1,492.6 | 100.0 | % | $ | 1,596.9 | $ | 1,562.6 | 100.0 | % | ||||||||||||||||||||||||
(1) Includes loans receivable with related parties.
The Account investsmonitors the risk profile of the loan receivable portfolio with the assistance of a third-party rating service that models the loans and assigns risk ratings based on inputs such as loan-to-value ratios, yields, credit quality of the borrowers, property types of the collateral, geographic and local market dynamics, physical condition of the collateral, and the underlying structure of the loans. Ratings for loans are updated monthly. Assigned ratings can range from AAA to C, with an AAA designation representing debt with the lowest level of credit risk and C representing a greater risk of default or principal loss. Loans that are more than 90 days past due are classified as delinquent and assigned a D rating. Mezzanine debt in limited partnerships, limited liability companies and private real estate equity investment trustsgood health is typically reflective of a risk rating in the B range (e.g., BBB, BB, or B), as these ratings reflect borrowers' having adequate financial resources to service their financial commitments, but also acknowledging that own real estate properties and real estate related securities including mezzanine debt. adverse economic conditions, should they occur, would likely impede on a borrowers' ability to pay. All borrowers of loans rated C or higher are current as of December 31, 2021.
The Account receives distributions from these investmentsfollowing table presents the fair values of the Account's loan portfolio based on the Account’s ownership interest percentage. Atrisk ratings as of December 31, 2017,2021, listed in order of the Account held ownership interests in three limited partnerships and one limited liability company ranging from 5.3%strength of the risk rating (from strongest to 60.0%.weakest):
95
| December 31, 2021 | December 31, 2020 | |||||||||||||||||||||||||||||||||||||
| Number of Loans | Fair Value | % of Fair Value | Number of Loans | Fair Value | % of Fair Value | |||||||||||||||||||||||||||||||||
| AA | 1 | 62.6 | 4.2 | % | — | — | — | % | ||||||||||||||||||||||||||||||
| A | 4 | 248.5 | 16.6 | % | — | — | — | % | ||||||||||||||||||||||||||||||
| BBB | 6 | 374.7 | 25.1 | % | 1 | 69.6 | 4.5 | % | ||||||||||||||||||||||||||||||
| BB | 10 | 437.8 | 29.3 | % | 10 | 444.6 | 28.5 | % | ||||||||||||||||||||||||||||||
| B | 5 | 144.3 | 9.7 | % | 11 | 758.2 | 48.5 | % | ||||||||||||||||||||||||||||||
| C | 2 | 154.8 | 10.4 | % | 2 | 147.0 | 9.4 | % | ||||||||||||||||||||||||||||||
| D | — | — | — | % | 1 | 73.8 | 4.7 | % | ||||||||||||||||||||||||||||||
NR(1) | 3 | 69.9 | 4.7 | % | 2 | 69.4 | 4.4 | % | ||||||||||||||||||||||||||||||
| 31 | $ | 1,492.6 | 100.0 | % | 27 | $ | 1,562.6 | 100.0 | % | |||||||||||||||||||||||||||||
(1) "NR" designates loans not assigned an internal credit rating. As of December 31, 20172021 and 2016, the fair value2020, this is comprised of the Account’s ownership interest was $142.4 million and $137.5 million, respectively.3 loans with related parties. The loans are collateralized by equity interests in real estate investments.
Note 8—Mortgage 9—Loans Payable
At December 31, 20172021 and 2016,2020, the Account had outstanding mortgage loans payable secured by the following properties (in millions)(millions):
| Property | Interest Rate and Payment Frequency(2) | Principal Amounts Outstanding as of December 31, | Maturity | |||||||||||||||||||||||
| 2021 | 2020 | |||||||||||||||||||||||||
| Ascent at Windward | 3.51% paid monthly | $ | — | $ | 34.6 | January 1, 2022 | ||||||||||||||||||||
| The Palatine | 4.25% paid monthly | — | 74.4 | January 10, 2022 | ||||||||||||||||||||||
| The Forum at Carlsbad | 4.25% paid monthly | — | 84.0 | March 1, 2022 | ||||||||||||||||||||||
| Fusion 1560 | 3.42% paid monthly | 37.4 | 37.4 | June 10, 2022 | ||||||||||||||||||||||
San Diego Office Portfolio(4) | 3.62% paid monthly | 51.4 | 51.2 | August 9, 2022 | ||||||||||||||||||||||
The Colorado(1) | 3.69% paid monthly | 84.7 | 86.4 | November 1, 2022 | ||||||||||||||||||||||
The Legacy at Westwood(1) | 3.69% paid monthly | 43.2 | 44.0 | November 1, 2022 | ||||||||||||||||||||||
Regents Court(1) | 3.69% paid monthly | 36.6 | 37.3 | November 1, 2022 | ||||||||||||||||||||||
1001 Pennsylvania Avenue(1) | 3.70% paid monthly | 308.1 | 314.3 | June 1, 2023 | ||||||||||||||||||||||
| Biltmore at Midtown | 3.94% paid monthly | 36.4 | 36.4 | July 5, 2023 | ||||||||||||||||||||||
| Cherry Knoll | 3.78% paid monthly | 35.3 | 35.3 | July 5, 2023 | ||||||||||||||||||||||
| Lofts at SoDo | 3.94% paid monthly | 35.1 | 35.1 | July 5, 2023 | ||||||||||||||||||||||
| Pacific City | 2.00% + LIBOR paid monthly | 105.0 | 105.0 | October 1, 2023 | ||||||||||||||||||||||
The Stratum(4) | 2.45% paid monthly | 39.8 | — | May 9, 2024 | ||||||||||||||||||||||
Spring House Innovation Park(4) | 1.25% + LIBOR paid monthly | 40.5 | — | July 9, 2024 | ||||||||||||||||||||||
| 1401 H Street, NW | 3.65% paid monthly | 115.0 | 115.0 | November 5, 2024 | ||||||||||||||||||||||
The District at La Frontera(1) | 3.84% paid monthly | 37.8 | 38.4 | December 1, 2024 | ||||||||||||||||||||||
The District at La Frontera(1) | 4.96% paid monthly | 4.2 | 4.2 | December 1, 2024 | ||||||||||||||||||||||
| Circa Green Lake | 3.71% paid monthly | 52.0 | 52.0 | March 5, 2025 | ||||||||||||||||||||||
| Union - South Lake Union | 3.66% paid monthly | 57.0 | 57.0 | March 5, 2025 | ||||||||||||||||||||||
| Holly Street Village | 3.65% paid monthly | 81.0 | 81.0 | May 1, 2025 | ||||||||||||||||||||||
Henley at Kingstowne(1) | 3.60% paid monthly | 69.1 | 70.3 | May 1, 2025 | ||||||||||||||||||||||
| 32 South State Street | 4.48% paid monthly | 24.0 | 24.0 | June 6, 2025 | ||||||||||||||||||||||
Vista Station Office Portfolio(1) | 4.00% paid monthly | 19.3 | 19.9 | July 1, 2025 | ||||||||||||||||||||||
| 780 Third Avenue | 3.55% paid monthly | 150.0 | 150.0 | August 1, 2025 | ||||||||||||||||||||||
| 780 Third Avenue | 3.55% paid monthly | 20.0 | 20.0 | August 1, 2025 | ||||||||||||||||||||||
96
| Property | Interest Rate and Payment Frequency(2) | Principal Amounts Outstanding as of December 31, | Maturity | |||||||||
| 2017 | 2016 | |||||||||||
The Legend at Kierland(4)(5) | 4.97% paid monthly | $ | — | $ | 21.8 | August 1, 2017 | ||||||
The Tradition at Kierland(4)(5) | 4.97% paid monthly | — | 25.8 | August 1, 2017 | ||||||||
Mass Court(1)(4) | 2.88% paid monthly | 92.1 | 92.6 | September 1, 2019 | ||||||||
Red Canyon at Palomino Park(4)(6) | 5.34% paid monthly | 27.1 | 27.1 | August 1, 2020 | ||||||||
Green River at Palomino Park(4)(6) | 5.34% paid monthly | 33.2 | 33.2 | August 1, 2020 | ||||||||
Blue Ridge at Palomino Park(4)(6) | 5.34% paid monthly | 33.4 | 33.4 | August 1, 2020 | ||||||||
Ashford Meadows Apartments(4) | 5.17% paid monthly | 44.6 | 44.6 | August 1, 2020 | ||||||||
The Knoll(1)(4) | 3.98% paid monthly | 17.5 | — | December 5, 2020 | ||||||||
The Corner(4) | 4.66% paid monthly | 105.0 | 105.0 | June 1, 2021 | ||||||||
The Palatine(1)(4) | 4.25% paid monthly | 78.8 | 80.0 | January 10, 2022 | ||||||||
The Forum at Carlsbad(1)(4) | 4.25% paid monthly | 88.9 | 90.0 | March 1, 2022 | ||||||||
The Colorado(4) | 3.69% paid monthly | 91.7 | 91.7 | November 1, 2022 | ||||||||
The Legacy at Westwood(1)(4) | 3.69% paid monthly | 46.7 | 46.7 | November 1, 2022 | ||||||||
Regents Court(1)(4) | 3.69% paid monthly | 39.6 | 39.6 | November 1, 2022 | ||||||||
The Caruth(4)(8) | 3.69% paid monthly | — | 45.0 | November 1, 2022 | ||||||||
Fourth & Madison(4) | 3.75% paid monthly | 200.0 | 200.0 | June 1, 2023 | ||||||||
| 1001 Pennsylvania Avenue | 3.70% paid monthly | 330.0 | 330.0 | June 1, 2023 | ||||||||
1401 H Street NW(4) | 3.65% paid monthly | 115.0 | 115.0 | November 5, 2024 | ||||||||
32 South State Street(4) | 4.48% paid monthly | 24.0 | 24.0 | June 6, 2025 | ||||||||
780 Third Avenue(4) | 3.55% paid monthly | 150.0 | 150.0 | August 1, 2025 | ||||||||
780 Third Avenue(4) | 3.55% paid monthly | 20.0 | 20.0 | August 1, 2025 | ||||||||
701 Brickell Avenue(4) | 3.66% paid monthly | 184.0 | 184.0 | April 1, 2026 | ||||||||
55 Second Street(4)(7) | 3.74% paid monthly | 137.5 | 137.5 | October 1, 2026 | ||||||||
| 1900 K Street, NW | 3.93% paid monthly | 163.0 | 163.0 | April 1, 2028 | ||||||||
501 Boylston Street(4) | 3.70% paid monthly | 216.5 | 216.5 | April 1, 2028 | ||||||||
| Total Principal Outstanding | 2,238.6 | 2,316.5 | ||||||||||
Fair Value Adjustment(3) | (0.3 | ) | 15.6 | |||||||||
| Total mortgage loans payable | $ | 2,238.3 | $ | 2,332.1 | ||||||||
| Property | Interest Rate and Payment Frequency(2) | Principal Amounts Outstanding as of December 31, | Maturity | |||||||||||||||||||||||
| 2021 | 2020 | |||||||||||||||||||||||||
Reserve at Chino Hills(4) | 1.50% + LIBOR paid monthly | $ | 68.2 | $ | — | August 9, 2025 | ||||||||||||||||||||
Vista Station Office Portfolio(1) | 4.20% paid monthly | 42.9 | 43.9 | November 1, 2025 | ||||||||||||||||||||||
Sixth & Main(4) | 1.87% + LIBOR paid monthly | 40.4 | — | November 9, 2025 | ||||||||||||||||||||||
701 Brickell Avenue(1) | 3.66% paid monthly | 182.0 | 184.0 | April 1, 2026 | ||||||||||||||||||||||
| Marketplace at Mill Creek | 3.82% paid monthly | 39.6 | 39.6 | September 11, 2027 | ||||||||||||||||||||||
| Overlook At King Of Prussia | 3.82% paid monthly | 40.8 | 40.8 | September 11, 2027 | ||||||||||||||||||||||
| Winslow Bay | 3.82% paid monthly | 25.8 | 25.8 | September 11, 2027 | ||||||||||||||||||||||
| 1900 K Street, NW | 3.93% paid monthly | 163.0 | 163.0 | April 1, 2028 | ||||||||||||||||||||||
| 99 High Street | 3.90% paid monthly | 277.0 | 277.0 | March 1, 2030 | ||||||||||||||||||||||
| Total Principal Outstanding | $ | 2,362.6 | $ | 2,381.3 | ||||||||||||||||||||||
Fair Value Adjustment(3) | 17.9 | 30.1 | ||||||||||||||||||||||||
| Total Loans Payable | $ | 2,380.5 | $ | 2,411.4 | ||||||||||||||||||||||
(1)The mortgage is adjusted monthly for principal payments.
(2)All interest rates are fixed except for Pacific City, Spring House Innovation Park, Reserve at Chino Hills and Sixth & Main, which have variable interest rates based on a spread above the one month London Interbank Offered Rate, as published by ICE Benchmark Administration Limited. Some mortgages held by the Account are structured to begin principal and interest payments after an initial interest only period.
(3)The fair value adjustment consists of the difference (positive or negative) between the principal amount of the outstanding debt and the fair value of the outstanding debt. See Note 1—Organization and Significant Accounting Policies.
(4)The loan is collateralized by a mezzanine loan receivable. The mezzanine loan receivable is collateralized by the property reflected within the table above.
Principal payment schedule on mortgage loans payable as of December 31, 20172021 was as follows (in millions):
| Amount | |||||
| 2022 | $ | 270.7 | |||
| 2023 | 523.1 | ||||
| 2024 | 245.6 | ||||
| 2025 | 621.4 | ||||
| 2026 | 170.2 | ||||
| Thereafter | 531.6 | ||||
| Total maturities | $ | 2,362.6 | |||
| Amount | |||
| 2018 | $ | 13.7 | |
| 2019 | 107.2 | ||
| 2020 | 171.7 | ||
| 2021 | 125.0 | ||
| 2022 | 335.7 | ||
| Thereafter | 1,485.3 | ||
| Total maturities | $ | 2,238.6 | |
Note 9—10—Line of Credit
The Account has a senior revolving unsecured line of credit with a syndicate of third-party bank lenders, including JPMorgan Chase Bank, N.A. (“Credit Agreement”) with a maximum total commitment of $500.0 million. Draws against the Credit Agreement can take the form of Eurodollar Loans or Alternate Base Rate Loans (“ABR Loans”). Eurodollar Loans and ABR Loans require a minimum funding of $5.0 million. The Account previously held an unused, stand-alone, $500.0 million unsecured line of credit scheduled to mature in August 2021 that was terminated in May 2021.
Eurodollar Loans are issued for a term of twelve months or less and bear interest during the period (“Interest Period”) at a rate equal to the Adjusted London Interbank Offered Rate (“Adjusted LIBOR”) plus a spread (the “Eurodollar Applicable Rate”), with the spread dependent upon the leverage ratio of the Account. Adjusted LIBOR is calculated by multiplying the Statutory Reserve Rate, as determined by the Federal Reserve Board for Eurodollar liabilities, by LIBOR, as determined by the Intercontinental Exchange on the date of issuance that corresponds to the length of the Interest Period. The Account may prepay Eurodollar Loans at any time during the life of the loan without penalty. The Account is limited to 5 active Eurodollar Loans on the Credit Agreement; however, the
97
Account may retire and initiate new Eurodollar Loans without restriction so long as the total number of loans in active status does not exceed the limit.
ABR Loans are issued for a specific length of time and bear interest at a rate equal to the highest rate among the following calculations plus a spread (the "ABR Applicable Rate"), with the spread dependent on the leverage ratio of the Account: (i) the Prime Rate on the date of issuance, with the Prime Rate being defined as the rate of interest last quoted by the Wall Street Journal as the Prime Rate; (ii) the Federal Reserve Bank of New York (“NYFRB”) rate as provided by the NYFRB on the date of issuance plus 0.5%; or (iii) the Adjusted LIBOR rate plus 1.0%. The Account may prepay ABR Loans at any time during the life of the loan without penalty.
For the years ended December 31, 2021 and 2020, expenses charged to the Account related to the Credit Agreements were $2.5 million and $4.9 million, respectively. As of December 31, 2021, the Account was in compliance with all covenants required by the Credit Agreement.
The following table provides a summary of the key characteristics of the Credit Agreement as of December 31, 2021:
| Current Balance | $ | 500.0 | ||||||
| Maximum Capacity (in millions) | $ | 500.0 | ||||||
| Inception Date | September 20, 2018 | |||||||
| Maturity Date | September 20, 2022 | (1) | ||||||
| Extension Option | Yes | (1) | ||||||
| Eurodollar Applicable Rate Range | 0.85% - 1.05% | |||||||
| ABR Applicable Rate Range | 0.85% - 1.05% | |||||||
Unused Fee(2) | 0.20% per annum | |||||||
(1)On July 16, 2021, the Account exercised its option to extend the commitment terms until September 20, 2022, with 1 consecutive twelve month extension option remaining. The Account may request an additional $250.0 million in commitments from the lenders at any time; however, this request is subject to approval at the sole discretion of the lenders and is not a guarantee that an expansion beyond the original $500.0 million commitment will be granted.
(2)The Account is charged a fee on the unused portion of the Credit Agreement.
Note 11—Financial Highlights
Selected condensed financial information for an Accumulation Unit of the Account is presented below. Per Accumulation Unit data is calculated on average units outstanding.
| Years ended December 31, | ||||||||||||||||||||||||||||||||
| 2021 | 2020 | 2019 | 2018 | 2017 | ||||||||||||||||||||||||||||
| Per Accumulation Unit Data: | ||||||||||||||||||||||||||||||||
| Rental income | $ | 22.672 | $ | 21.145 | $ | 18.165 | $ | 17.757 | $ | 17.132 | ||||||||||||||||||||||
| Real estate property level expenses and taxes | 10.731 | 10.067 | 8.734 | 8.548 | 7.722 | |||||||||||||||||||||||||||
| Real estate income, net | 11.941 | 11.078 | 9.431 | 9.209 | 9.410 | |||||||||||||||||||||||||||
| Other income | 5.474 | 4.980 | 6.752 | 6.162 | 4.762 | |||||||||||||||||||||||||||
| Total income | 17.415 | 16.058 | 16.183 | 15.371 | 14.172 | |||||||||||||||||||||||||||
Expense charges(1) | 3.987 | 3.562 | 3.439 | 3.161 | 3.318 | |||||||||||||||||||||||||||
| Investment income, net | 13.428 | 12.496 | 12.744 | 12.210 | 10.854 | |||||||||||||||||||||||||||
| Net realized and unrealized gain (loss) on investments and loans payable | 64.615 | (16.196) | 10.262 | 6.877 | 5.839 | |||||||||||||||||||||||||||
| Net increase (decrease) in Accumulation Unit Value | 78.043 | (3.700) | 23.006 | 19.087 | 16.693 | |||||||||||||||||||||||||||
| Accumulation Unit Value: | ||||||||||||||||||||||||||||||||
| Beginning of period | $436.722 | $440.422 | $417.416 | $398.329 | $381.636 | |||||||||||||||||||||||||||
| End of period | $514.765 | $436.722 | $440.422 | $417.416 | $398.329 | |||||||||||||||||||||||||||
98
| Years ended December 31, | ||||||||||||||||||||
| 2017 | 2016 | 2015 | 2014 | 2013 | ||||||||||||||||
| Per Accumulation Unit Data: | ||||||||||||||||||||
| Rental income | $ | 17.132 | $ | 16.433 | $ | 15.538 | $ | 15.862 | $ | 15.313 | ||||||||||
| Real estate property level expenses and taxes | 7.722 | 7.534 | 7.319 | 7.788 | 8.112 | |||||||||||||||
| Real estate income, net | 9.410 | 8.899 | 8.219 | 8.074 | 7.201 | |||||||||||||||
| Other income | 4.762 | 3.594 | 3.342 | 3.459 | 2.759 | |||||||||||||||
| Total income | 14.172 | 12.493 | 11.561 | 11.533 | 9.960 | |||||||||||||||
Expense charges(1) | 3.318 | 3.290 | 3.092 | 2.880 | 2.672 | |||||||||||||||
| Investment income, net | 10.854 | 9.203 | 8.469 | 8.653 | 7.288 | |||||||||||||||
| Net realized and unrealized gain on investments and mortgage loans payable | 5.839 | 9.660 | 18.911 | 27.868 | 19.015 | |||||||||||||||
| Net increase in Accumulation Unit Value | 16.693 | 18.863 | 27.380 | 36.521 | 26.303 | |||||||||||||||
| Accumulation Unit Value: | ||||||||||||||||||||
| Beginning of period | 381.636 | 362.773 | 335.393 | 298.872 | 272.569 | |||||||||||||||
| End of period | $ | 398.329 | $ | 381.636 | $ | 362.773 | $ | 335.393 | $ | 298.872 | ||||||||||
| Total return | 4.37 | % | 5.20 | % | 8.16 | % | 12.22 | % | 9.65 | % | ||||||||||
| Ratios to Average net Assets: | ||||||||||||||||||||
Expenses(1) | 0.83 | % | 0.86 | % | 0.86 | % | 0.89 | % | 0.92 | % | ||||||||||
| Investment income, net | 2.72 | % | 2.41 | % | 2.37 | % | 2.68 | % | 2.50 | % | ||||||||||
| Portfolio turnover rate: | ||||||||||||||||||||
Real estate properties(2) | 2.7 | % | 1.3 | % | 5.7 | % | 6.5 | % | 2.1 | % | ||||||||||
Marketable securities(3) | 5.7 | % | 3.5 | % | 10.0 | % | 15.9 | % | 8.4 | % | ||||||||||
| Accumulation Units outstanding at end of period (in millions): | 61.3 | 62.4 | 60.4 | 57.9 | 55.3 | |||||||||||||||
| Net assets end of period (in millions) | $ | 24,942.6 | $ | 24,304.7 | $ | 22,360.0 | $ | 19,829.0 | $ | 16,907.9 | ||||||||||
| Years ended December 31, | ||||||||||||||||||||||||||||||||
| 2021 | 2020 | 2019 | 2018 | 2017 | ||||||||||||||||||||||||||||
| Total return | 17.87 | % | (0.84) | % | 5.51 | % | 4.79 | % | 4.37 | % | ||||||||||||||||||||||
| Ratios to Average net Assets: | ||||||||||||||||||||||||||||||||
Expenses(1) | 0.84 | % | 0.81 | % | 0.78 | % | 0.76 | % | 0.83 | % | ||||||||||||||||||||||
| Investment income, net | 2.82 | % | 2.85 | % | 2.90 | % | 2.95 | % | 2.72 | % | ||||||||||||||||||||||
| Portfolio turnover rate: | ||||||||||||||||||||||||||||||||
Real estate properties(2) | 7.6 | % | 7.1 | % | 7.8 | % | 11.8 | % | 2.7 | % | ||||||||||||||||||||||
Marketable securities(3) | — | % | 113.4 | % | 28.7 | % | 5.1 | % | 5.7 | % | ||||||||||||||||||||||
| Accumulation Units outstanding at end of period (millions): | 53.4 | 52.0 | 60.8 | 60.7 | 61.3 | |||||||||||||||||||||||||||
| Net assets end of period (millions) | $28,072.0 | $23,243.9 | $27,307.9 | $25,842.6 | $24,942.6 | |||||||||||||||||||||||||||
(1)Expense charges per Accumulation Unit and the Ratio of Expenses to average net assets reflect the year to date Account level expenses and exclude real estate property level expenses which are included in real estate income, net.
(2)Real estate investment portfolio turnover rate is calculated by dividing the lesser of purchases or sales of real estate property investments (including contributions to, or return of capital distributions received from, existing joint venture and Funds investments) by the average value of the portfolio of real estate investments held during the period.
(3)Marketable securities portfolio turnover rate is calculated by dividing the lesser of purchases or sales of securities, excluding securities having maturity dates at acquisition of one year or less, by the average value of the portfolio securities held during the period.
Note 10—12—Accumulation Units
Changes in the number of Accumulation Units outstanding were as follows (in millions):
| Years ended December 31, | ||||||||||||||||||||
| 2021 | 2020 | 2019 | ||||||||||||||||||
| Outstanding: | ||||||||||||||||||||
| Beginning of period | 52.0 | 60.8 | 60.7 | |||||||||||||||||
| Credited for premiums | 6.4 | 4.6 | 6.2 | |||||||||||||||||
| Annuity, other periodic payments, withdrawals and death benefits | (5.0) | (13.4) | (6.1) | |||||||||||||||||
| End of period | 53.4 | 52.0 | 60.8 | |||||||||||||||||
| Years ended December 31, | |||||||||
| 2017 | 2016 | 2015 | |||||||
| Outstanding: | |||||||||
| Beginning of period | 62.4 | 60.4 | 57.9 | ||||||
| Credited for premiums | 6.6 | 8.2 | 8.1 | ||||||
| Annuity, other periodic payments, withdrawals and death benefits | (7.7 | ) | (6.2 | ) | (5.6 | ) | |||
| End of period | 61.3 | 62.4 | 60.4 | ||||||
Note 11—13—Commitments and Contingencies
Commitments—TheAs of December 31, 2021 and 2020, the Account had $32.0 million and $39.0 million of outstandingthe following immediately callable commitments to purchase additional interests in its limited partnershipreal estate funds or provide additional funding through its loan receivable investments as of December 31, 2017 and 2016, respectively.(in millions):
| Commitment Expiration | December 31, 2021 | December 31, 2020 | ||||||||||||||||||
Real Estate Funds(1) | ||||||||||||||||||||
| LCS SHIP Venture I, LLC | 06/2021 | $ | — | $ | 28.1 | |||||||||||||||
| Grubb Southeast Real Estate Fund VI, LLC | 06/2021 | — | 81.5 | |||||||||||||||||
| Townsend Group Value-Add Fund | 12/2021 | 125.9 | 241.9 | |||||||||||||||||
| Veritas Trophy VI, LLC | 08/2022 | 20.6 | 29.4 | |||||||||||||||||
| SP V - II, LLC | 09/2022 | 12.9 | 67.1 | |||||||||||||||||
| JCR Capital - REA Preferred Equity Parallel Fund | 12/2022 | 75.3 | 92.3 | |||||||||||||||||
| Silverpeak NRE FundCo 2 LLC | 12/2022 | 43.7 | — | |||||||||||||||||
| Silverpeak NRE FundCo LLC | 12/2022 | 37.3 | 81.1 | |||||||||||||||||
| Taconic New York City GP Fund | 11/2023 | 4.2 | 6.0 | |||||||||||||||||
| Flagler - REA Healthcare Properties Partnership | 02/2025 | 1.2 | 49.6 | |||||||||||||||||
| $ | 321.1 | $ | 677.0 | |||||||||||||||||
99
| Commitment Expiration | December 31, 2021 | December 31, 2020 | ||||||||||||||||||
Loans Receivable(2) | ||||||||||||||||||||
| Rosemont Towson | 09/2021 | $ | — | $ | 1.2 | |||||||||||||||
| BREP VIII Industrial Mezzanine | 03/2022 | 22.4 | 15.5 | |||||||||||||||||
| SCG Oakland Portfolio Mezzanine | 03/2022 | 6.1 | 6.5 | |||||||||||||||||
| 311 South Wacker Mezzanine | 06/2022 | 2.2 | 5.4 | |||||||||||||||||
| San Diego Office Portfolio Senior Loan | 08/2022 | 6.8 | 7.0 | |||||||||||||||||
| San Diego Office Portfolio Mezzanine | 08/2022 | 2.2 | 2.3 | |||||||||||||||||
| MRA Hub 34 Holding, LLC | 08/2022 | 1.5 | 1.5 | |||||||||||||||||
| 1330 Broadway Mezzanine | 09/2022 | 10.9 | 10.9 | |||||||||||||||||
| Liberty Park Mezzanine | 11/2022 | 2.6 | 3.1 | |||||||||||||||||
| Colony New England Hotel Portfolio Senior Loan | 11/2022 | 14.1 | 14.1 | |||||||||||||||||
| Colony New England Hotel Portfolio Mezzanine | 11/2022 | 4.7 | 4.7 | |||||||||||||||||
| Exo Apartments Senior Loan | 01/2023 | — | 7.1 | |||||||||||||||||
| Exo Apartments Mezzanine | 01/2023 | 2.4 | 2.4 | |||||||||||||||||
| Five Oak Mezzanine | 03/2023 | 1.6 | 2.3 | |||||||||||||||||
| 5 Points Towers Mezzanine | 03/2024 | 4.2 | — | |||||||||||||||||
| The Stratum Senior Loan | 05/2024 | 2.0 | — | |||||||||||||||||
| The Stratum Mezzanine | 05/2024 | 0.7 | — | |||||||||||||||||
| Spring House Innovation Park Senior Loan | 07/2024 | 38.0 | — | |||||||||||||||||
| Spring House Innovation Park Mezzanine | 07/2024 | 12.7 | — | |||||||||||||||||
| The Reserve at Chino Hills | 08/2025 | 20.0 | — | |||||||||||||||||
| Sixth and Main Senior Loan | 11/2025 | 6.9 | — | |||||||||||||||||
| Sixth and Main Mezzanine | 11/2025 | 3.7 | — | |||||||||||||||||
| $ | 165.7 | $ | 84.0 | |||||||||||||||||
| TOTAL COMMITMENTS | $ | 486.8 | $ | 761.0 | ||||||||||||||||
(1)Additional capital can be called during the commitment period at any time. The commitment at December 31, 2017period can only be extended by the manager with the consent of the Account. The commitment expiration date is related toreflective of the Taconic New York City GP Fund, LP, in whichmost recent signed agreement between the Account has entered into an agreement to provide funding. As of December 31, 2017, $13.0 millionand the fund manager, including any side letter agreements.
(2)Advances from the Account can be requested during the commitment period at any time. The commitment expiration date is reflective of the original $45.0 million commitment has been funded. Once the remaining commitment is funded,most recent signed agreement between the Account anticipates holding a 60% - 90% interest inand the fund.borrower, including any side letter agreements. Certain loans contain extension clauses on the term of the loan that do not require the Account's prior consent. If elected, the Account's commitment may be extended through the extension term.
Contingencies—In the normal course of business, the Account may be named, from time to time, as a defendantor may be involved in various legal actions, including arbitrations,arbitration, class actions and other litigation.
The Account establishes an accrual for all litigation and regulatory matters when it believes it is probable that a loss has been incurred and the amount of the loss can be reasonably estimated. Once established, accruals are adjusted, as appropriate, in light of additional information. The amount of loss ultimately incurred in relation to those matters may be higher or lower than the amounts accrued for those matters.
As of the date of this annual report,December 31, 2021, management of the Account does not believe that the results of any such claims or litigation, individually or in the aggregate, will have a material effect on the Account’s business, financial position or results of operations.
Note 12—Securities Lending14—Subsequent Events
In preparing these financial statements, the Account has evaluated events and transactions for potential recognition or disclosure subsequent to December 31, 2021, through March 10, 2022, the date the financial statements were available to be issued.
Real Estate Properties and Joint Ventures
Purchases
| Property Name | Purchase Date | Ownership Percentage | Sector | Location | Net Purchase Price (1) | |||||||||||||||||||||||||||
SYNC at Vinings(2) | 01/06/2022 | 95.00% | Apartments | Atlanta, GA | $ | 87.0 | ||||||||||||||||||||||||||
SYNC at Ten Oaks(2) | 01/06/2022 | 95.00% | Apartments | Lawrenceville, GA | 70.1 | |||||||||||||||||||||||||||
SYNC at Purgatory Creek(2) | 01/06/2022 | 95.00% | Apartments | San Marcos, TX | 62.5 | |||||||||||||||||||||||||||
SYNC at Kingsland Ranch(2) | 01/06/2022 | 95.00% | Apartments | Katy, TX | 67.0 | |||||||||||||||||||||||||||
| Storage Portfolio IV | 01/12/2022 | 90.00% | Storage | Marietta, GA | 20.9 | |||||||||||||||||||||||||||
| Storage Portfolio IV | 01/12/2022 | 90.00% | Storage | Tucker, GA | 17.7 | |||||||||||||||||||||||||||
Northpark III(3) | 02/04/2022 | 100.00% | Industrial | Brooklyn Park, MN | 38.9 | |||||||||||||||||||||||||||
Northpark V(3) | 02/04/2022 | 100.00% | Industrial | Brooklyn Park, MN | 27.9 | |||||||||||||||||||||||||||
Park 81 East(3) | 02/04/2022 | 100.00% | Industrial | Maple Grove, MN | 56.3 | |||||||||||||||||||||||||||
Constellation Business Center(3) | 02/04/2022 | 100.00% | Industrial | White Bear Township, MN | 14.0 | |||||||||||||||||||||||||||
| Carson South End Co-GP Development | 02/18/2022 | 75.00% | Land | Charlotte, NC | 28.9 | |||||||||||||||||||||||||||
Bethpage Land(4) | 03/03/2022 | 98.30% | Land | Bethpage, NY | 0.3 | |||||||||||||||||||||||||||
Marin Cancer Institute(5) | 03/07/2022 | 50.00% | Office | Greenbrae, CA | 18.4 | |||||||||||||||||||||||||||
Lakeside Medical Building(5) | 03/07/2022 | 50.00% | Office | San Francisco, CA | 10.2 | |||||||||||||||||||||||||||
Valley Medical Building I(5) | 03/07/2022 | 50.00% | Office | Van Nuys, CA | 8.6 | |||||||||||||||||||||||||||
Valley Medical Building II(5) | 03/07/2022 | 50.00% | Office | Van Nuys, CA | 7.8 | |||||||||||||||||||||||||||
Fountain Grove Medical Building(5) | 03/07/2022 | 50.00% | Office | Santa Rosa, CA | 5.0 | |||||||||||||||||||||||||||
(1) The Account may lend securities to qualified borrowers to earn additional income. net purchase price represents the purchase price and closing costs.
(2) Property held within the Sun Holdings Multifamily Portfolio.
(3) Property held within the Minneapolis Core Portfolio.
(4) Property held within the Seavest MOB Portfolio.
(5) Property held within the Juniper MOB Portfolio.
Sales
| Property Name | Sales Date | Ownership Percentage | Sector | Location | Net Sales Price (1) | Realized Gain on Sale(2) | |||||||||||||||||||||||||||||
| 150 Industrial Road | 02/01/2022 | 98.00% | Office | San Carlos, CA | $ | 147.7 | $ | 49.5 | |||||||||||||||||||||||||||
| Warwick Shopping Center | 03/03/2022 | 100.00% | Retail | Warwick, RI | 11.8 | 0.3 | |||||||||||||||||||||||||||||
| South Denver Marketplace | 03/03/2022 | 100.00% | Retail | Lone Tree, CO | 73.0 | 1.0 | |||||||||||||||||||||||||||||
(1) The Account receives cash collateral againstnet sales price represents the loaned securities and maintains cash collateral in an amount notsales price, less than 100%selling expenses.
(2) Majority of the market value of loaned securities during the period of the loan; any additional collateral required due to changes in security values is delivered to the Account the next business day. Cash collateral received by the Account is invested exclusively in an interest-bearing deposit account. The value of the loaned securities and the liability to return the cash collateral received are reflectedrealized gain has been previously recognized as unrealized gains in the Account's Consolidated Statements of Assets and Liabilities. As of December 31, 2017, securities lending transactions are for real-estate related equity securities, and the resulting loans are continuous, can be recalled at any time, and have no set maturity. Securities lending income recognized by the Account consists of interest earned on cash collateral and lending fees, net of any rebates to the borrower and compensation to the agent. Such income is reflected within interest income on the Account's Consolidated Statements of Operations. In lending its securities, the Account bears the market risk with respect to the investment of collateral and the risk that the agent may default on its contractual obligations to the Account. The agent bears the risk that the borrower may default on its obligation to return the loaned securities as the agent is contractually obligated to indemnify the Account if at the time of a default by a borrower some or all of the loan securities have not been returned.
Financings
| Property Name | Transaction Date | Interest Rate | Sector | Maturity Date | Principal Amount | |||||||||||||||||||||||||||
SYNC at Vinings(2) | 01/06/2022 | 1.92% + SOFR | Apartment | 02/01/2029 | $ | 56.7 | ||||||||||||||||||||||||||
SYNC at Ten Oaks(2) | 01/06/2022 | 1.92% + SOFR | Apartment | 02/01/2029 | 45.9 | |||||||||||||||||||||||||||
SYNC at Purgatory Creek(2) | 01/06/2022 | 1.92%+ SOFR | Apartment | 02/01/2029 | 41.8 | |||||||||||||||||||||||||||
SYNC at Kingsland Ranch(2) | 01/06/2022 | 1.92%+ SOFR | Apartment | 02/01/2029 | 45.5 | |||||||||||||||||||||||||||
101
| Property Name | Transaction Date | Interest Rate | Sector | Maturity Date | Principal Amount | |||||||||||||||||||||||||||
| Florida Mall | 02/04/2022 | 1.97%+ SOFR | Retail | 02/09/2024 | $ | 300.0 | ||||||||||||||||||||||||||
| Property Name | Transaction Date | Interest Rate | Sector | Maturity Date | Principal Amount | |||||||||||||||||||||||||||
| Fusion 1560 | 02/22/2022 | 3.42% | Apartment | 06/10/2022 | $ | 37.4 | ||||||||||||||||||||||||||
102
TIAA REAL ESTATE ACCOUNT
CONSOLIDATED SCHEDULES OF INVESTMENTS
(Dollar values shown in millions)
REAL ESTATE PROPERTIES—57.9%67.3% and 58.0%70.9%
| Property Name | Property Type | Fair Value at December 31, | ||||||||||||||||||||||||||||||
| Location | 2021 | 2020 | ||||||||||||||||||||||||||||||
| River Ridge | Alabama | Retail | $ | 26.9 | $ | 29.0 | ||||||||||||||||||||||||||
| Riverchase Village | Alabama | Retail | 34.9 | 36.1 | ||||||||||||||||||||||||||||
| Camelback Center | Arizona | Office | 55.0 | 52.0 | ||||||||||||||||||||||||||||
| Riverside 202 Industrial | Arizona | Industrial | 33.3 | 30.4 | ||||||||||||||||||||||||||||
| 101 Pacific Coast Highway | California | Office | 95.3 | 94.7 | ||||||||||||||||||||||||||||
| 200 Middlefield Road | California | Office | 59.2 | 60.2 | ||||||||||||||||||||||||||||
| 30700 Russell Ranch | California | Office | 36.6 | 36.5 | ||||||||||||||||||||||||||||
| 88 Kearny Street | California | Office | 199.3 | 199.3 | ||||||||||||||||||||||||||||
| Allure at Camarillo | California | Apartment | 71.6 | 62.0 | ||||||||||||||||||||||||||||
| Almond Avenue | California | Industrial | 45.3 | 13.4 | ||||||||||||||||||||||||||||
| AmpliFi - Fullerton | California | Apartment | 168.0 | — | ||||||||||||||||||||||||||||
| BLVD63 | California | Apartment | 161.0 | 145.1 | ||||||||||||||||||||||||||||
| Bridgepointe Shopping Center | California | Retail | 121.0 | 124.1 | ||||||||||||||||||||||||||||
| Centre Pointe And Valley View | California | Industrial | 83.3 | 62.1 | ||||||||||||||||||||||||||||
| Cerritos Industrial Park | California | Industrial | 281.0 | 171.8 | ||||||||||||||||||||||||||||
| Charleston Plaza | California | Retail | 72.1 | 95.3 | ||||||||||||||||||||||||||||
| Creekside Alta Loma | California | Apartment | 114.0 | 85.5 | ||||||||||||||||||||||||||||
| Frontera Industrial Business Park | California | Industrial | 181.4 | 101.2 | ||||||||||||||||||||||||||||
| Great West Industrial Portfolio | California | Industrial | 402.0 | 215.1 | ||||||||||||||||||||||||||||
| Holly Street Village | California | Apartment | 189.1 | (1) | 153.1 | (1) | ||||||||||||||||||||||||||
| Larkspur Courts | California | Apartment | 163.0 | 141.0 | ||||||||||||||||||||||||||||
| The Legacy at Westwood | California | Apartment | 157.1 | (1) | 149.1 | (1) | ||||||||||||||||||||||||||
| Northern CA RA Industrial Portfolio | California | Industrial | 147.3 | 117.2 | ||||||||||||||||||||||||||||
| Oakmont IE West Portfolio | California | Industrial | 244.0 | 123.9 | ||||||||||||||||||||||||||||
| Oceano at Warner Center | California | Apartment | 103.0 | 90.1 | ||||||||||||||||||||||||||||
| Ontario Industrial Portfolio | California | Industrial | 836.0 | 540.4 | ||||||||||||||||||||||||||||
| Ontario Mills Industrial Portfolio | California | Industrial | 129.2 | 79.2 | ||||||||||||||||||||||||||||
| Otay Mesa Industrial Portfolio | California | Industrial | 52.6 | 40.2 | ||||||||||||||||||||||||||||
| Pacific City | California | Retail | 140.0 | (1) | 158.0 | (1) | ||||||||||||||||||||||||||
| Pacific Plaza | California | Office | — | 111.0 | ||||||||||||||||||||||||||||
| Rancho Cucamonga Industrial Portfolio | California | Industrial | 164.0 | 95.4 | ||||||||||||||||||||||||||||
| Rancho del Mar | California | Apartment | 107.9 | 93.5 | ||||||||||||||||||||||||||||
| Regents Court | California | Apartment | 128.0 | (1) | 103.0 | (1) | ||||||||||||||||||||||||||
| Southern CA RA Industrial Portfolio | California | Industrial | 267.7 | 160.9 | ||||||||||||||||||||||||||||
| Stella | California | Apartment | 164.9 | 161.0 | ||||||||||||||||||||||||||||
| Stevenson Point | California | Industrial | 106.0 | 75.0 | ||||||||||||||||||||||||||||
| Terra House | California | Apartment | 166.1 | 140.2 | ||||||||||||||||||||||||||||
| The Forum at Carlsbad | California | Retail | — | 203.0 | (1) | |||||||||||||||||||||||||||
| Westcreek | California | Apartment | 65.5 | 55.4 | ||||||||||||||||||||||||||||
| West Lake North Business Park | California | Office | 58.6 | 58.3 | ||||||||||||||||||||||||||||
| Westwood Marketplace | California | Retail | 174.0 | 150.0 | ||||||||||||||||||||||||||||
| Wilshire Rodeo Plaza | California | Office | 322.1 | 311.4 | ||||||||||||||||||||||||||||
| 1600 Broadway | Colorado | Office | 108.0 | 116.0 | ||||||||||||||||||||||||||||
| Palomino Park | Colorado | Apartment | — | 352.1 | ||||||||||||||||||||||||||||
103
| Location/Description | Type | Fair Value at December 31, | ||||||||||
| 2017 | 2016 | |||||||||||
| Arizona: | ||||||||||||
| Camelback Center | Office | $ | 59.8 | $ | 56.4 | |||||||
| Kierland Apartment Portfolio | Apartments | — | 127.9 | (1) | ||||||||
| California: | ||||||||||||
| 55 Second Street | Office | 355.5 | (1) | 335.0 | (1) | |||||||
| 88 Kearny Street | Office | 174.2 | 172.3 | |||||||||
| 200 Middlefield Road | Office | 61.4 | 60.5 | |||||||||
| Allure at Camarillo | Apartments | 59.6 | — | |||||||||
| BLVD63 | Apartments | 162.1 | 157.0 | |||||||||
| Bridgepointe Shopping Center | Retail | 124.5 | — | |||||||||
| Castro Station | Office | 169.0 | 158.2 | |||||||||
| Centre Pointe and Valley View | Industrial | 47.8 | 42.8 | |||||||||
| Cerritos Industrial Park | Industrial | 142.0 | 126.3 | |||||||||
| Charleston Plaza | Retail | 93.0 | 92.0 | |||||||||
| Frontera Industrial Business Park | Industrial | 56.4 | — | |||||||||
| Great West Industrial Portfolio | Industrial | 167.0 | 166.1 | |||||||||
| Holly Street Village | Apartments | 148.0 | 146.0 | |||||||||
| Larkspur Courts | Apartments | 143.7 | 140.5 | |||||||||
| Northern CA RA Industrial Portfolio | Industrial | 87.4 | 76.7 | |||||||||
| Oakmont IE West Portfolio | Industrial | 87.6 | 82.7 | |||||||||
| Oceano at Warner Center | Apartments | 89.0 | 88.3 | |||||||||
| Ontario Industrial Portfolio | Industrial | 398.6 | (11) | 438.0 | ||||||||
| Ontario Mills Industrial Portfolio | Industrial | 58.5 | 52.0 | |||||||||
| Pacific Plaza | Office | 115.2 | 115.0 | |||||||||
| Rancho Cucamonga Industrial Portfolio | Industrial | 71.9 | (11) | 174.2 | ||||||||
| Regents Court | Apartments | 99.1 | (1) | 89.9 | (1) | |||||||
| Southern CA RA Industrial Portfolio | Industrial | 138.0 | 135.0 | |||||||||
| Stella | Apartments | 179.7 | 173.1 | |||||||||
| Stevenson Point | Industrial | 50.9 | 49.3 | |||||||||
| The Forum at Carlsbad | Retail | 221.0 | (1) | 221.5 | (1) | |||||||
| The Legacy at Westwood | Apartments | 143.0 | (1) | 142.1 | (1) | |||||||
| Township Apartments | Apartments | 89.8 | 89.6 | |||||||||
| West Lake North Business Park | Office | 60.3 | 60.0 | |||||||||
| Westcreek | Apartments | 51.4 | 48.2 | |||||||||
| Westwood Marketplace | Retail | 131.9 | 125.0 | |||||||||
| Wilshire Rodeo Plaza | Office | 327.8 | 320.7 | |||||||||
| Colorado: | ||||||||||||
| Palomino Park | Apartments | 329.7 | (1) | 314.1 | (1) | |||||||
| South Denver Marketplace | Retail | 72.7 | 73.0 | |||||||||
| Connecticut: | ||||||||||||
| Wilton Woods Corporate Campus | Office | 133.0 | 141.9 | |||||||||
| Florida: | ||||||||||||
| 701 Brickell Avenue | Office | 368.5 | (1) | 380.7 | (1) | |||||||
| Broward Industrial Portfolio | Industrial | 54.2 | — | |||||||||
| Casa Palma | Apartments | 95.0 | 97.0 | |||||||||
| Orion on Orpington | Apartments | 44.4 | — | |||||||||
| Publix at Weston Commons | Retail | 74.8 | 73.0 | |||||||||
| Seneca Industrial Park | Industrial | 108.8 | 102.7 | |||||||||
| South Florida Apartment Portfolio | Apartments | 105.1 | 104.1 | |||||||||
| The Manor Apartments | Apartments | 52.6 | 53.6 | |||||||||
| The Manor at Flagler Village | Apartments | 148.1 | 150.8 | |||||||||
TIAA REAL ESTATE ACCOUNT
CONSOLIDATED SCHEDULES OF INVESTMENTS
(Dollar values shown in millions)
| Property Name | Property Type | Fair Value at December 31, | ||||||||||||||||||||||||||||||
| Location | 2021 | 2020 | ||||||||||||||||||||||||||||||
| South Denver Marketplace | Colorado | Retail | $ | 69.5 | $ | 65.1 | ||||||||||||||||||||||||||
| Wilton Woods Corporate Campus | Connecticut | Office | 73.7 | 100.0 | ||||||||||||||||||||||||||||
| 5 West | Florida | Apartment | 86.9 | 63.0 | ||||||||||||||||||||||||||||
| 701 Brickell Avenue | Florida | Office | 490.3 | (1) | 421.5 | (1) | ||||||||||||||||||||||||||
| Broward Industrial Portfolio | Florida | Industrial | 82.2 | 68.5 | ||||||||||||||||||||||||||||
| Casa Palma | Florida | Apartment | 109.1 | 98.7 | ||||||||||||||||||||||||||||
| Cypress Trace | Florida | Retail | 37.9 | 35.9 | ||||||||||||||||||||||||||||
| Fusion 1560 | Florida | Apartment | 106.0 | (1) | 72.7 | (1) | ||||||||||||||||||||||||||
| Lakepointe at Jacaranda | Florida | Apartment | 59.8 | 48.7 | ||||||||||||||||||||||||||||
| Lofts at SoDo | Florida | Apartment | 87.6 | (1) | 65.3 | (1) | ||||||||||||||||||||||||||
| Market Square | Florida | Retail | 21.9 | 20.1 | ||||||||||||||||||||||||||||
| Orion on Orpington | Florida | Apartment | 64.4 | 51.6 | ||||||||||||||||||||||||||||
| Port St. Lucie | Florida | Other | 55.2 | — | ||||||||||||||||||||||||||||
| Publix at Weston Commons | Florida | Retail | 73.1 | 69.6 | ||||||||||||||||||||||||||||
| Seneca Industrial Park | Florida | Industrial | 163.1 | 128.7 | ||||||||||||||||||||||||||||
| Shoppes At Lake Mary | Florida | Retail | 20.5 | 19.6 | ||||||||||||||||||||||||||||
| Sole at Brandon | Florida | Apartment | 99.9 | 78.0 | ||||||||||||||||||||||||||||
| Sole at City Center | Florida | Apartment | 111.0 | 100.0 | ||||||||||||||||||||||||||||
| Boca Arbor Club | Florida | Apartment | 80.2 | 63.9 | ||||||||||||||||||||||||||||
| The Manor Apartments | Florida | Apartment | 52.5 | 47.5 | ||||||||||||||||||||||||||||
| The Manor at Flagler Village | Florida | Apartment | 140.1 | 131.2 | ||||||||||||||||||||||||||||
| The Residences at the Village of Merrick Park | Florida | Apartment | 77.0 | 69.5 | ||||||||||||||||||||||||||||
| Weston Business Center | Florida | Industrial | 97.2 | 81.7 | ||||||||||||||||||||||||||||
| Weston Business Center EF | Florida | Industrial | 110.0 | — | ||||||||||||||||||||||||||||
| Ascent at Windward | Georgia | Apartment | 92.6 | 72.3 | (1) | |||||||||||||||||||||||||||
| Atlanta Industrial Portfolio | Georgia | Industrial | 60.9 | 41.5 | ||||||||||||||||||||||||||||
| Biltmore at Midtown | Georgia | Apartment | 82.8 | (1) | 72.6 | (1) | ||||||||||||||||||||||||||
| Eisenhower Crossing | Georgia | Retail | — | 12.9 | ||||||||||||||||||||||||||||
| Fayette Pavilion | Georgia | Retail | 113.4 | 101.4 | ||||||||||||||||||||||||||||
| Glen Lake | Georgia | Apartment | 69.7 | 59.0 | ||||||||||||||||||||||||||||
| Heritage Pavilion | Georgia | Retail | 45.6 | 40.6 | ||||||||||||||||||||||||||||
| Hudson Woodstock | Georgia | Apartment | 148.0 | — | ||||||||||||||||||||||||||||
| Marketplace At Mill Creek | Georgia | Retail | 83.8 | (1) | 76.4 | (1) | ||||||||||||||||||||||||||
| Newnan Pavilion | Georgia | Retail | — | 40.0 | ||||||||||||||||||||||||||||
| Shawnee Ridge Industrial Portfolio | Georgia | Industrial | 132.1 | 104.0 | ||||||||||||||||||||||||||||
| Woodstock Square | Georgia | Retail | — | 32.0 | ||||||||||||||||||||||||||||
| 32 South State Street | Illinois | Retail | 42.9 | (1) | 48.5 | (1) | ||||||||||||||||||||||||||
| 803 Corday | Illinois | Apartment | 120.0 | 92.6 | ||||||||||||||||||||||||||||
| Chicago CalEast Industrial Portfolio | Illinois | Industrial | 103.0 | 85.3 | ||||||||||||||||||||||||||||
| Chicago Industrial Portfolio | Illinois | Industrial | 46.6 | 33.0 | ||||||||||||||||||||||||||||
| Village Crossing | Illinois | Retail | 153.8 | 136.1 | ||||||||||||||||||||||||||||
| Hendricks Gateway | Indiana | Industrial | 115.0 | — | ||||||||||||||||||||||||||||
| Cherry Knoll | Maryland | Apartment | 73.1 | (1) | 57.8 | (1) | ||||||||||||||||||||||||||
| Landover Logistics Center | Maryland | Industrial | 67.7 | 54.3 | ||||||||||||||||||||||||||||
| The Shops at Wisconsin Place | Maryland | Retail | 73.5 | 72.1 | ||||||||||||||||||||||||||||
104
| Location/Description | Type | Fair Value at December 31, | ||||||||||
| 2017 | 2016 | |||||||||||
| The Residences at the Village of Merrick Park | Apartments | $ | 76.0 | $ | 74.1 | |||||||
| Urban Centre | Office | 143.3 | 121.4 | |||||||||
| Weston Business Center | Industrial | 92.8 | 92.7 | |||||||||
| Georgia: | ||||||||||||
| Atlanta Industrial Portfolio | Industrial | 32.4 | (6) | 62.8 | ||||||||
| Shawnee Ridge Industrial Portfolio | Industrial | 91.1 | 86.7 | |||||||||
| Illinois: | ||||||||||||
| 32 State Street | Retail | 48.3 | (1) | 46.5 | (1) | |||||||
| 803 Corday | Apartments | 94.5 | ||||||||||
| Chicago Caleast Industrial Portfolio | Industrial | 80.5 | 81.8 | |||||||||
| Chicago Industrial Portfolio | Industrial | 100.3 | 85.5 | |||||||||
| Maryland: | ||||||||||||
| Landover Logistics Center | Industrial | 43.4 | 39.8 | |||||||||
| The Shops at Wisconsin Place | Retail | 90.0 | 92.8 | |||||||||
| Massachusetts: | ||||||||||||
| 99 High Street | Office | 502.1 | 514.1 | |||||||||
| 501 Boylston Street | Office | 505.2 | (1) | 490.3 | (1) | |||||||
| Fort Point Creative Exchange Portfolio | Office | 223.1 | 223.0 | |||||||||
| Northeast RA Industrial Portfolio | Industrial | 40.9 | 41.3 | |||||||||
| One Beeman Road | Industrial | 33.8 | — | |||||||||
| Minnesota: | ||||||||||||
| The Bridges | Apartments | 62.4 | — | |||||||||
| The Knoll | Apartments | 34.0 | (1) | — | ||||||||
| New Jersey: | ||||||||||||
| 200 Milik Street | Industrial | 53.1 | 51.2 | |||||||||
| Marketfair | Retail | 102.9 | 104.2 | |||||||||
| Amazon Distribution Center | Industrial | 110.0 | 101.0 | |||||||||
| South River Road Industrial | Industrial | 87.8 | 71.9 | |||||||||
| New York: | ||||||||||||
| 21 Penn Plaza | Office | 261.2 | 275.2 | |||||||||
| 250 North 10th Street | Apartments | 163.1 | 162.0 | |||||||||
| 425 Park Avenue | Ground Lease | 457.0 | 450.0 | |||||||||
| 430 West 15th Street | Office | 145.8 | 116.1 | |||||||||
| 780 Third Avenue | Office | 427.0 | (1) | 425.0 | (1) | |||||||
| 837 Washington Street | Office | 210.0 | 215.0 | |||||||||
| The Colorado | Apartments | 256.2 | (1) | 258.1 | (1) | |||||||
| The Corner | Apartments | 251.0 | (1) | 250.0 | (1) | |||||||
| Oregon: | ||||||||||||
| The Cordelia | Apartments | 49.0 | 50.0 | |||||||||
| Pennsylvania: | ||||||||||||
| 1619 Walnut Street | Retail | 24.1 | 23.4 | |||||||||
| The Pepper Building | Apartments | — | 52.9 | |||||||||
| South Carolina: | ||||||||||||
| Greene Crossing | Apartments | 67.2 | 65.8 | |||||||||
| Tennessee: | ||||||||||||
| Southside at McEwen | Retail | 48.2 | 48.8 | |||||||||
| Texas: | ||||||||||||
| Beltway North Commerce Center | Industrial | 19.3 | 19.5 | |||||||||
| Cliffs at Barton Creek | Apartments | 45.9 | 45.8 | |||||||||
| Dallas Industrial Portfolio | Industrial | 213.2 | 201.3 | |||||||||
| Houston Apartment Portfolio | Apartments | 158.7 | 159.3 | |||||||||
TIAA REAL ESTATE ACCOUNT
CONSOLIDATED SCHEDULES OF INVESTMENTS
(Dollar values shown in millions)
| Property Name | Property Type | Fair Value at December 31, | ||||||||||||||||||||||||||||||
| Location | 2021 | 2020 | ||||||||||||||||||||||||||||||
| 350 Washington | Massachusetts | Retail | $ | 125.0 | $ | 121.0 | ||||||||||||||||||||||||||
| 99 High Street | Massachusetts | Office | 530.7 | (1) | 540.2 | (1) | ||||||||||||||||||||||||||
| Fort Point Creative Exchange Portfolio | Massachusetts | Office | 206.0 | 264.6 | ||||||||||||||||||||||||||||
| Northeast RA Industrial Portfolio | Massachusetts | Industrial | 77.3 | 44.2 | ||||||||||||||||||||||||||||
| One Beeman Road | Massachusetts | Industrial | 49.7 | 36.0 | ||||||||||||||||||||||||||||
| The Bridges | Minnesota | Apartment | 69.2 | 66.0 | ||||||||||||||||||||||||||||
| The Knoll | Minnesota | Apartment | 38.7 | 37.2 | ||||||||||||||||||||||||||||
| 10 New Maple Avenue | New Jersey | Industrial | 32.7 | 21.0 | ||||||||||||||||||||||||||||
| 200 Milik Street | New Jersey | Industrial | 75.4 | 59.1 | ||||||||||||||||||||||||||||
| Marketfair | New Jersey | Retail | 96.1 | 98.4 | ||||||||||||||||||||||||||||
| South River Road Industrial | New Jersey | Industrial | 198.3 | 138.5 | ||||||||||||||||||||||||||||
| 21 Penn Plaza | New York | Office | 312.5 | 302.5 | ||||||||||||||||||||||||||||
| 780 Third Avenue | New York | Office | 374.5 | (1) | 354.3 | (1) | ||||||||||||||||||||||||||
| 837 Washington Street | New York | Office | 203.0 | 211.0 | ||||||||||||||||||||||||||||
| The Colorado | New York | Apartment | 260.2 | (1) | 243.1 | (1) | ||||||||||||||||||||||||||
| Alexander Place | North Carolina | Retail | 40.4 | 39.9 | ||||||||||||||||||||||||||||
| Centric Gateway | North Carolina | Apartment | 79.4 | 74.0 | ||||||||||||||||||||||||||||
| Winslow Bay Commons | North Carolina | Retail | 49.0 | (1) | 46.9 | (1) | ||||||||||||||||||||||||||
| The Cordelia | Oregon | Apartment | 38.9 | 40.8 | ||||||||||||||||||||||||||||
| 1619 Walnut Street | Pennsylvania | Retail | 17.3 | 16.7 | ||||||||||||||||||||||||||||
| Overlook At King Of Prussia | Pennsylvania | Retail | 53.5 | (1) | 55.6 | (1) | ||||||||||||||||||||||||||
| Warwick Shopping Center | Rhode Island | Retail | 12.5 | 17.8 | ||||||||||||||||||||||||||||
| Columbiana Station | South Carolina | Retail | 48.2 | 47.0 | ||||||||||||||||||||||||||||
| Greene Crossing | South Carolina | Apartment | 89.2 | 81.3 | ||||||||||||||||||||||||||||
| Bellevue Place | Tennessee | Retail | — | 8.4 | ||||||||||||||||||||||||||||
| Midway 840 | Tennessee | Industrial | 70.8 | 50.9 | ||||||||||||||||||||||||||||
| Pavilion at Turkey Creek | Tennessee | Retail | 51.2 | 51.1 | ||||||||||||||||||||||||||||
| Southside at McEwen | Tennessee | Retail | 47.9 | 48.2 | ||||||||||||||||||||||||||||
| Town and Country | Tennessee | Retail | 33.2 | 30.7 | ||||||||||||||||||||||||||||
| 3131 McKinney | Texas | Office | 44.4 | 39.3 | ||||||||||||||||||||||||||||
| Carrington Park | Texas | Apartment | 84.3 | 66.7 | ||||||||||||||||||||||||||||
| Churchill on the Park | Texas | Apartment | 84.4 | 72.3 | ||||||||||||||||||||||||||||
| Cliffs at Barton Creek | Texas | Apartment | 56.5 | 45.6 | ||||||||||||||||||||||||||||
| Dallas Industrial Portfolio | Texas | Industrial | 333.0 | 258.3 | ||||||||||||||||||||||||||||
| Jackson Shaw Forward Portfolio: Centerpoint | Texas | Industrial | 29.6 | — | ||||||||||||||||||||||||||||
| Lincoln Centre - Hilton Dallas | Texas | Other | 98.1 | 63.6 | ||||||||||||||||||||||||||||
| Chisolm Trail | Texas | Industrial | 5.7 | 5.2 | (8) | |||||||||||||||||||||||||||
| Lincoln Centre | Texas | Office | 538.7 | 467.7 | ||||||||||||||||||||||||||||
| The Maroneal | Texas | Apartment | 63.5 | 58.8 | ||||||||||||||||||||||||||||
| Montecito Apartments | Texas | Apartment | 53.4 | 51.6 | ||||||||||||||||||||||||||||
| Northwest Houston Industrial Portfolio | Texas | Industrial | 88.3 | 75.5 | ||||||||||||||||||||||||||||
| Park 10 Distribution Center | Texas | Industrial | 14.5 | 12.0 | ||||||||||||||||||||||||||||
| Park Creek Apartments | Texas | Apartment | 54.0 | 43.1 | ||||||||||||||||||||||||||||
| Phoenician Apartments | Texas | Apartment | 55.6 | 50.5 | ||||||||||||||||||||||||||||
| Pinnacle Industrial Portfolio | Texas | Industrial | 87.3 | 75.5 | ||||||||||||||||||||||||||||
105
| Location/Description | Type | Fair Value at December 31, | ||||||||||
| 2017 | 2016 | |||||||||||
| Lincoln Centre | Office | $ | 358.0 | $ | 347.0 | |||||||
| Northwest Houston Industrial Portfolio | Industrial | 70.7 | 68.2 | |||||||||
| Park 10 Distribution | Industrial | 10.3 | 11.3 | |||||||||
| Pinnacle Industrial Portfolio | Industrial | 53.3 | 52.8 | |||||||||
| Pinto Business Park | Industrial | 131.6 | 134.2 | |||||||||
| The Caruth | Apartments | — | 84.3 | (1) | ||||||||
| The Maroneal | Apartments | 56.6 | 52.1 | |||||||||
| Virginia: | ||||||||||||
| 8270 Greensboro Drive | Office | 50.3 | 47.6 | |||||||||
| Ashford Meadows Apartments | Apartments | 107.3 | (1) | 107.2 | (1) | |||||||
| Plaza America | Retail | 117.0 | 109.0 | |||||||||
| The Ellipse at Ballston | Office | 83.7 | 79.8 | |||||||||
| The Palatine | Apartments | 123.2 | (1) | 130.9 | (1) | |||||||
| Washington: | ||||||||||||
| Circa Green Lake | Apartments | 97.5 | 92.5 | |||||||||
| Fourth and Madison | Office | 530.0 | (1) | 521.0 | (1) | |||||||
| Millennium Corporate Park | Office | 184.1 | 190.1 | |||||||||
| Northwest RA Industrial Portfolio | Industrial | 38.5 | 31.7 | |||||||||
| Pacific Corporate Park | Industrial | 45.5 | 42.0 | |||||||||
| Prescott Wallingford Apartments | Apartments | 62.0 | 58.8 | |||||||||
| Rainier Corporate Park | Industrial | 123.7 | 104.0 | |||||||||
| Regal Logistics Campus | Industrial | 100.0 | 83.1 | |||||||||
| Union - South Lake Union | Apartments | 111.0 | 105.3 | |||||||||
| Washington D.C.: | ||||||||||||
| 1001 Pennsylvania Avenue | Office | 785.0 | (1) | 810.0 | (1) | |||||||
| 1401 H Street, NW | Office | 201.1 | (1) | 230.0 | (1) | |||||||
| 1900 K Street, NW | Office | 330.0 | (1) | 335.0 | (1) | |||||||
| Mass Court | Apartments | 171.0 | (1) | 169.0 | (1) | |||||||
| Mazza Gallerie | Retail | — | 78.0 | |||||||||
| The Ashton | Apartments | 37.5 | 39.2 | |||||||||
| The Louis at 14th | Apartments | 176.0 | 183.2 | |||||||||
| The Woodley | Apartments | 191.0 | 203.0 | |||||||||
| TOTAL REAL ESTATE PROPERTIES | ||||||||||||
| (Cost $12,972.5 and $12,818.1) | $ | 15,742.7 | $ | 15,452.8 | ||||||||
TIAA REAL ESTATE ACCOUNT
CONSOLIDATED SCHEDULES OF INVESTMENTS
(Dollar values shown in millions)
| Property Name | Property Type | Fair Value at December 31, | ||||||||||||||||||||||||||||||
| Location | 2021 | 2020 | ||||||||||||||||||||||||||||||
| Pinto Business Park | Texas | Industrial | $ | 174.6 | $ | 153.8 | ||||||||||||||||||||||||||
| San Montego Apartments | Texas | Apartment | 64.4 | 55.2 | ||||||||||||||||||||||||||||
| The District on La Frontera | Texas | Apartment | 106.6 | (1) | 72.4 | (1) | ||||||||||||||||||||||||||
| Vista Station Office Portfolio | Utah | Office | 124.5 | (1) | 116.3 | (1) | ||||||||||||||||||||||||||
| 8270 Greensboro Drive | Virginia | Office | 45.2 | 46.0 | ||||||||||||||||||||||||||||
| Ashford Meadows Apartments | Virginia | Apartment | 122.4 | 107.4 | ||||||||||||||||||||||||||||
| Creeks At Virginia Center | Virginia | Retail | 46.7 | 47.5 | ||||||||||||||||||||||||||||
| The Ellipse at Ballston | Virginia | Office | 77.3 | 79.8 | ||||||||||||||||||||||||||||
| Henley at Kingstowne | Virginia | Apartment | 129.2 | (1) | 107.4 | (1) | ||||||||||||||||||||||||||
| Plaza America | Virginia | Retail | 108.0 | 103.0 | ||||||||||||||||||||||||||||
| The Palatine | Virginia | Apartment | 141.0 | 125.0 | (1) | |||||||||||||||||||||||||||
| Circa Green Lake | Washington | Apartment | 115.0 | (1) | 96.0 | (1) | ||||||||||||||||||||||||||
| Northwest RA Industrial Portfolio | Washington | Industrial | 57.9 | 49.6 | ||||||||||||||||||||||||||||
| Pacific Coast Corporate Park | Washington | Industrial | 79.4 | 66.8 | ||||||||||||||||||||||||||||
| Prescott Wallingford Apartments | Washington | Apartment | 86.5 | 67.4 | ||||||||||||||||||||||||||||
| Rainier Corporate Park | Washington | Industrial | 210.9 | 169.9 | ||||||||||||||||||||||||||||
| Regal Logistics Campus | Washington | Industrial | 161.0 | 132.0 | ||||||||||||||||||||||||||||
| Union - South Lake Union | Washington | Apartment | 129.0 | (1) | 111.0 | (1) | ||||||||||||||||||||||||||
| 1001 Pennsylvania Avenue | Washington, D.C. | Office | 811.2 | (1) | 806.8 | (1) | ||||||||||||||||||||||||||
| 1401 H Street, NW | Washington, D.C. | Office | 228.5 | (1) | 217.1 | (1) | ||||||||||||||||||||||||||
| 1900 K Street, NW | Washington, D.C. | Office | 336.0 | (1) | 338.0 | (1) | ||||||||||||||||||||||||||
| Mass Court | Washington, D.C. | Apartment | 157.2 | 160.0 | ||||||||||||||||||||||||||||
| The Ashton | Washington, D.C. | Apartment | 29.2 | 30.7 | ||||||||||||||||||||||||||||
| The Louis | Washington, D.C. | Apartment | 161.2 | 160.1 | ||||||||||||||||||||||||||||
| (Cost $14,163.2 and $13,986.3) | $ | 18,903.9 | $ | 16,476.7 | ||||||||||||||||||||||||||||
REAL ESTATE JOINT VENTURES—21.6%25.6% and 21.1%26.4%
| Entity/Property Name | Account Interest | Property Type | Fair Value at December 31, | |||||||||||||||||||||||||||||||||||
| Location | 2021 | 2020 | ||||||||||||||||||||||||||||||||||||
| TREA GM Industrial Road Owner LLC 150 Industrial Road | 98.00% | California | Office | $ | 151.3 | $ | 101.2 | |||||||||||||||||||||||||||||||
| ARE-San Francisco No 36 LLC 1500 Owens Street | 49.90% | California | Office | — | 89.8 | |||||||||||||||||||||||||||||||||
| ARE-San Francisco No 43 LLC 409-499 Illinois Street | 40.00% | California | Office | — | 242.8 | |||||||||||||||||||||||||||||||||
| ARE-SD Region No 39 LLC 9625 Towne Centre Drive | 49.90% | California | Office | 73.8 | 60.6 | |||||||||||||||||||||||||||||||||
| TREA Campus Pointe 1, LLC Campus Pointe 1 | 45.00% | California | Office | 221.8 | 177.3 | |||||||||||||||||||||||||||||||||
| TREA Campus Pointe 2 & 3, LLC Campus Pointe 2 & 3 | 45.00% | California | Office(5) | 177.4 | 154.7 | |||||||||||||||||||||||||||||||||
| ARE SD Region No 47 LLC Campus Pointe 4 | 45.00% | California | Office | 31.3 | 11.2 | |||||||||||||||||||||||||||||||||
| TREA Campus Pointe 5, LLC Campus Pointe 5 | 45.00% | California | Office | 64.7 | 45.0 | |||||||||||||||||||||||||||||||||
| ARE-SD Regions No 58, LLC Campus Pointe 6 | 45.00% | California | Office | 169.6 | 130.6 | |||||||||||||||||||||||||||||||||
106
| Location/Description | Type | Fair Value at December 31, | ||||||||||
| 2017 | 2016 | |||||||||||
| California: | ||||||||||||
CA—Colorado Center LP Colorado Center (50% Account Interest) | Office | $ | 351.0 | (2) | $ | 567.8 | ||||||
PC Borrower, LLC Pacific City (70% Account Interest) | Retail | 134.9 | 128.5 | |||||||||
TREA 9625 Towne Center, LLC 9625 Towne Centre Drive (35.86% Account Interest) | Land | 15.1 | — | |||||||||
| TREA Campus Pointe 1, LLC Campus Pointe 1 (45% Account Interest) | Office | 143.0 | 137.5 | |||||||||
| TREA Campus Pointe 2 & 3, LLC Campus Pointe 2 & 3 (45% Account Interest) | Office (12) | 127.1 | 85.7 | |||||||||
| TREA Campus Pointe 4, LLC Campus Pointe 4 (45% Account Interest) | Office | 8.8 | — | |||||||||
T-C 1500 Owens, LLC 1500 Owens Street (49.9% Account Interest) | Office | 77.5 | 74.8 | |||||||||
T-C Foundry Square II Venture LLC Foundry Square II (50.1% Account Interest) | Office | 262.7 | 200.1 | (2) | ||||||||
T-C Illinois Street, LLC 409-499 Illinois Street (40% Account Interest) | Office | 209.3 | 196.8 | |||||||||
Valencia Town Center Associates LP Valencia Town Center (50% Account Interest) | Retail | 138.8 | (2) | 128.0 | (2) | |||||||
| Florida: | ||||||||||||
Florida Mall Associates, Ltd The Florida Mall (50% Account Interest) | Retail | 758.4 | (2) | 755.8 | (2) | |||||||
TREA Florida Retail, LLC Florida Retail Portfolio (80% Account Interest) | Retail | 150.6 | 147.6 | |||||||||
West Dade County Associates Miami International Mall (50% Account Interest) | Retail | 166.0 | (2) | 161.1 | (2) | |||||||
| Maryland: | ||||||||||||
WP Project Developer The Shops at Wisconsin Place (33.33% Account Interest) | Retail | 20.0 | 19.4 | |||||||||
| Massachusetts: | ||||||||||||
One Boston Place REIT One Boston Place (50.25% Account Interest) | Office | 229.1 | 224.2 | |||||||||
T-C 225 Binney, LLC 225 Binney Street (70% Account Interest) | Office | 201.9 | 194.9 | |||||||||
| Nevada | ||||||||||||
Fashion Show Holding I, LLC Fashion Show (50% Account Interest) | Retail | 844.4 | (2) | 839.1 | (2) | |||||||
| New York: | ||||||||||||
401 West 14th Street, LLC 401 West 14th Street (42.19% Account Interest) | Retail | 46.4 | (2) | 41.1 | (2) | |||||||
817 Broadway Owner, LLC 817 Broadway (61.46% Account Interest) | Office | 23.0 | (2) | 20.8 | (2) | |||||||
MRA Hub 34 Holding, LLC The Hub (95% Account Interest) | Office | 56.9 | (2) | 54.9 | (2) | |||||||
RGM 42, LLC MiMA (70% Account Interest) | Apartments | 189.2 | (2) | 194.7 | (2) | |||||||
TIAA REAL ESTATE ACCOUNT
CONSOLIDATED SCHEDULES OF INVESTMENTS
(Dollar values shown in millions)
| Entity/Property Name | Account Interest | Property Type | Fair Value at December 31, | |||||||||||||||||||||||||||||||||||
| Location | 2021 | 2020 | ||||||||||||||||||||||||||||||||||||
| Colorado Center LP Colorado Center | 50.00% | California | Office | $ | 377.3 | (2) | $ | 346.4 | (2) | |||||||||||||||||||||||||||||
| TREA JP Venture Fairfield LLC Fairfield Tolenas Development | 95.00% | California | Industrial | 59.0 | 26.6 | |||||||||||||||||||||||||||||||||
| T-C Foundry Square II Venture LLC Foundry Square II | 50.10% | California | Office | 315.7 | 307.5 | |||||||||||||||||||||||||||||||||
| TREA The Forum at Carlsbad Investor Member The Forum at Carlsbad | 50.00% | California | Retail | 40.9 | (2) | — | ||||||||||||||||||||||||||||||||
| Valencia Town Center Associates LP Valencia Town Center | 50.00% | California | Retail | 51.5 | (2) | 93.0 | (2) | |||||||||||||||||||||||||||||||
| TREA Florida Retail, LLC Florida Retail Portfolio | 80.00% | Florida | Retail | 128.2 | 155.5 | |||||||||||||||||||||||||||||||||
| West Dade County Associates Miami International Mall | 50.00% | Florida | Retail | 84.9 | (2) | 110.0 | (2) | |||||||||||||||||||||||||||||||
| Florida Mall Associates Ltd The Florida Mall | 50.00% | Florida | Retail | 613.7 | (2) | 655.8 | (2) | |||||||||||||||||||||||||||||||
| TREA MCC3 Investor Member LLC 735 Watkins Mill | 50.00% | Maryland | Land | 6.5 | — | |||||||||||||||||||||||||||||||||
| WP Project Developer LLC The Shops at Wisconsin Place | 33.33% | Maryland | Retail | 15.7 | 17.2 | |||||||||||||||||||||||||||||||||
| ARE-MA Region No 34 LLC 225 Binney Street | 70.00% | Massachusetts | Office | — | 233.6 | |||||||||||||||||||||||||||||||||
| T-C 501 Boylston Street Venture LLC 501 Boylston | 50.10% | Massachusetts | Office | 192.2 | (2) | 195.1 | (2) | |||||||||||||||||||||||||||||||
| One Boston Place REIT One Boston Place | 50.25% | Massachusetts | Office | 265.8 | 259.3 | |||||||||||||||||||||||||||||||||
| Fashion Show Holding I LLC Fashion Show | 50.00% | Nevada | Retail | 557.8 | (2) | 568.7 | (2) | |||||||||||||||||||||||||||||||
| 401 West 14th Associates LLC 401 West 14th Street | 42.19% | New York | Retail | 31.2 | (2) | 27.1 | (2) | |||||||||||||||||||||||||||||||
| 440 Ninth Avenue Holdings LLC 440 Ninth Avenue | 88.52% | New York | Office | 123.1 | (2) | 133.1 | (2) | |||||||||||||||||||||||||||||||
| 817 Broadway Holdings LLC 817 Broadway | 61.46% | New York | Office | 25.2 | (2) | 26.0 | (2) | |||||||||||||||||||||||||||||||
| RGM 42 LLC MiMA | 70.00% | New York | Apartments | 114.7 | (2) | 92.2 | (2) | |||||||||||||||||||||||||||||||
| MRA Hub 34 Holding LLC The Hub | 95.00% | New York | Industrial | 82.3 | (2) | 79.2 | (2) | |||||||||||||||||||||||||||||||
| Crescent/TREA 101 North Tryon Venture LLC 101 North Tryon Street | 85.00% | North Carolina | Office | 47.4 | (2) | 56.0 | (2) | |||||||||||||||||||||||||||||||
| NAP Birkdale, LLC Birkdale Village | 93.00% | North Carolina | Retail | 127.7 | (2) | 109.0 | (2,9) | |||||||||||||||||||||||||||||||
| TREA The Row at the Stadium Investor Member The Row at the Stadium | 98.50% | South Carolina | Apartments | 58.7 | — | |||||||||||||||||||||||||||||||||
| West Town Mall Joint Venture West Town Mall | 50.00% | Tennessee | Retail | 116.6 | (2) | 122.9 | (2) | |||||||||||||||||||||||||||||||
| Four Oaks Venture LP Four Oaks Place | 51.00% | Texas | Office | 347.4 | (2) | 336.2 | (2) | |||||||||||||||||||||||||||||||
| FW I-35 Logistics Center LLC I-35 Logistics Center | 95.00% | Texas | Industrial | 50.6 | 33.1 | |||||||||||||||||||||||||||||||||
| TREA 4th and Madison Investor Member LLC Fourth and Madison | 51.00% | Washington | Office | 164.3 | (2) | 172.0 | (2) | |||||||||||||||||||||||||||||||
107
| Location/Description | Type | Fair Value at December 31, | ||||||||||
| 2017 | 2016 | |||||||||||
TREA 35th Street LIC Investor Member, LLC Commerce LIC (97.5% Account Interest) | Industrial | $ | 58.2 | $ | — | |||||||
| Tennessee: | ||||||||||||
West Town Mall, LLC West Town Mall (50% Account Interest) | Retail | 140.4 | (2) | 154.4 | (2) | |||||||
| Texas: | ||||||||||||
Four Oaks Venture LP Four Oaks Place LP (51% Account Interest) | Office | 338.7 | (2) | 342.3 | (2) | |||||||
| Washington: | ||||||||||||
T-C REA 400 Fairview Investor, LLC 400 Fairview (90% Account Interest) | Office | 263.7 | 243.6 | |||||||||
| Various: | ||||||||||||
DDRTC Core Retail Fund, LLC DDR Joint Venture (85% Account Interest) | Retail | 636.2 | (2,3) | 552.8 | (2,3) | |||||||
Storage Portfolio I, LLC Storage Portfolio (75% Account Interest) | Storage | 177.5 | (2,3) | 156.5 | (2,3) | |||||||
Storage Portfolio II, LLC Storage Portfolio (90% Account Interest) | Storage | 91.8 | (2,3) | — | ||||||||
TOTAL REAL ESTATE JOINT VENTURES (Cost $4,534.5 and $4,393.2) | $ | 5,860.6 | $ | 5,622.4 | ||||||||
| LIMITED PARTNERSHIPS—0.5% and 0.5% | ||||||||||||
| Clarion Gables Multi-Family Trust LP (7.74% Account Interest) | $ | 126.7 | $ | 121.6 | ||||||||
| Colony Realty Partners LP (5.27% Account Interest) | — | 3.1 | (10) | |||||||||
| Lion Gables Apartment Fund (18.46% Account Interest) | — | 0.2 | (5) | |||||||||
| Taconic New York City GP Fund, LP (60% Account Interest) | 10.8 | 4.8 | ||||||||||
| Transwestern Mezz Realty Partners III, LLC (11.708% Account Interest) | 4.9 | 7.8 | ||||||||||
TOTAL LIMITED PARTNERSHIPS (Cost $140.8 and $137.2) | $ | 142.4 | $ | 137.5 | ||||||||
TOTAL REAL ESTATE JOINT VENTURES AND LIMITED PARTNERSHIPS (Cost $4,675.3 and $4,530.4) | $ | 6,003.0 | $ | 5,759.9 | ||||||||
TIAA REAL ESTATE ACCOUNT
CONSOLIDATED SCHEDULES OF INVESTMENTS
(Dollar values shown in millions)
| Entity/Property Name | Account Interest | Property Type | Fair Value at December 31, | |||||||||||||||||||||||||||||||||||
| Location | 2021 | 2020 | ||||||||||||||||||||||||||||||||||||
| Juniper MOB Investment Venture, LLC Juniper MOB Portfolio | 50.00% | Various, U.S.A. | Office | $ | 163.2 | (3) | $ | 65.4 | (3) | |||||||||||||||||||||||||||||
| TREA SV MOB Investor Member LLC Seavest MOB Portfolio | 98.30% | Various, U.S.A. | Office | 243.2 | (2,3) | — | (2,3) | |||||||||||||||||||||||||||||||
| TREA SH Venture LLC Simpson Housing Portfolio | 80.00% | Various, U.S.A. | Apartments | 689.2 | (2,3) | 427.5 | (2,3) | |||||||||||||||||||||||||||||||
| THP Student Housing, LLC THP Student Housing Portfolio | 97.00% | Various, U.S.A. | Apartments | 249.4 | (2,3) | 188.7 | (2,3) | |||||||||||||||||||||||||||||||
| Storage Portfolio I, LLC Storage Portfolio | 66.02% | Various, U.S.A. | Storage | 161.8 | (2,3) | 93.6 | (2,3) | |||||||||||||||||||||||||||||||
| Storage Portfolio II, LLC Storage Portfolio II | 90.00% | Various, U.S.A. | Storage | 285.9 | (2,3) | 131.7 | (2,3) | |||||||||||||||||||||||||||||||
| Storage Portfolio III JV LLC Storage Portfolio III | 90.00% | Various, U.S.A. | Storage | 65.8 | (3) | 53.3 | (3) | |||||||||||||||||||||||||||||||
| TREA Self Storage Investor Member IV LLC Storage Portfolio IV | 90.00% | Various, U.S.A. | Storage | 389.2 | (3) | — | ||||||||||||||||||||||||||||||||
| TREA European Investment Holdco LP Castleforbes | 51.00% | Foreign | Land | 39.9 | (10) | — | ||||||||||||||||||||||||||||||||
TOTAL REAL ESTATE JOINT VENTURES (Cost $5,497.9 and $5,021.9) | $ | 7,175.9 | $ | 6,128.9 | ||||||||||||||||||||||||||||||||||
| REAL ESTATE FUNDS—2.9% and 1.7% | ||||||||||||||||||||||||||||||||||||||
| Fair Value at December 31, | ||||||||||||||||||||||||||||||||||||||
| Fund Name | Account Interest | 2021 | 2020 | |||||||||||||||||||||||||||||||||||
| LCS SHIP Venture I, LLC | 90.00% | $ | 230.2 | $ | 200.9 | |||||||||||||||||||||||||||||||||
| Veritas Trophy VI, LLC | 90.40% | 81.6 | 54.6 | |||||||||||||||||||||||||||||||||||
| Taconic New York City GP Fund | 60.00% | 29.8 | 31.6 | |||||||||||||||||||||||||||||||||||
| SP V - II, LLC | 61.80% | 102.3 | 31.3 | |||||||||||||||||||||||||||||||||||
| IDR - Core Property Index Fund, LLC | 2.70% | 40.6 | 24.6 | |||||||||||||||||||||||||||||||||||
| Silverpeak NRE FundCo LLC | 90.00% | 62.9 | 18.8 | |||||||||||||||||||||||||||||||||||
| Grubb Southeast Real Estate Fund VI, LLC | 66.67% | 34.5 | 18.0 | |||||||||||||||||||||||||||||||||||
| JCR Capital - REA Preferred Equity Parallel Fund | 31.10% | 25.5 | 7.2 | |||||||||||||||||||||||||||||||||||
| Townsend Group Value-Add Fund | 99.00% | 114.8 | 5.8 | |||||||||||||||||||||||||||||||||||
| Flagler-REA Healthcare Properties Partnership | 90.00% | 26.5 | 0.4 | |||||||||||||||||||||||||||||||||||
| Silverpeak NRE FundCo II LLC | 90.00% | 62.8 | — | |||||||||||||||||||||||||||||||||||
TOTAL REAL ESTATE FUNDS (Cost $692.9 and $373.3) | $ | 811.5 | $ | 393.2 | ||||||||||||||||||||||||||||||||||
| REAL ESTATE OPERATING BUSINESS—1.2% and 1.1% | ||||||||||||||||||||||||||||||||||||||
| Fair Value at December 31, | ||||||||||||||||||||||||||||||||||||||
| Fund Name | Account Interest | 2021 | 2020 | |||||||||||||||||||||||||||||||||||
| Colony Zeus Partners LP | 34.70% | $ | 326.3 | $ | 250.0 | |||||||||||||||||||||||||||||||||
TOTAL REAL ESTATE OPERATING BUSINESS (Cost $251.6 and $250.2) | $ | 326.3 | $ | 250.0 | ||||||||||||||||||||||||||||||||||
108
| Shares | Issuer | Fair Value at December 31, | |||||||||||||
| 2017 | 2016 | 2017 | 2016 | ||||||||||||
| 90,769 | 84,437 | Acadia Realty Trust | $ | 2.5 | $ | 2.8 | |||||||||
| 31,513 | 26,717 | Agree Realty Corporation | 1.6 | 1.2 | |||||||||||
| 2,309 | 2,132 | Alexander's, Inc. | 0.9 | 0.9 | |||||||||||
| 103,464 | 83,175 | Alexandria Real Estate Equities, Inc. | 13.5 | 9.2 | |||||||||||
| 53,951 | — | Altisource Residential Corporation | 0.6 | — | |||||||||||
| 43,804 | 41,010 | American Assets Trust, Inc. | 1.7 | 1.8 | |||||||||||
| 148,817 | 138,467 | American Campus Communities, Inc. | 6.1 | 6.9 | |||||||||||
| — | 6,347 | American Farmland Company | — | 0.1 | |||||||||||
| 263,720 | 233,916 | American Homes 4 Rent | 5.8 | 4.9 | |||||||||||
| 462,615 | 443,315 | American Tower Corp. | 66.0 | 46.8 | |||||||||||
| 171,065 | 163,592 | Apartment Investment and Management Company | 7.5 | 7.4 | |||||||||||
| 231,041 | 223,733 | Apple Hospitality Inc. | 4.5 | 4.5 | |||||||||||
| 47,395 | 38,282 | Armada Hoffler Properties Inc. | 0.7 | 0.6 | |||||||||||
| 27,462 | 27,631 | Ashford Hospitality Prime Inc. | 0.3 | 0.4 | |||||||||||
| 88,009 | 96,553 | Ashford Hospitality Trust, Inc. | 0.6 | 0.7 | |||||||||||
| 150,694 | 143,728 | Avalonbay Communities, Inc. | 26.9 | 25.5 | |||||||||||
| 24,509 | 21,354 | Bluerock Residential Growth, Inc. | 0.2 | 0.3 | |||||||||||
| 168,560 | 160,997 | Boston Properties, Inc. | 21.9 | 20.3 | |||||||||||
| 189,208 | 183,336 | Brandywine Realty Trust | 3.4 | 3.0 | |||||||||||
| 336,302 | 319,555 | Brixmore Porperty Group Inc | 6.3 | 7.8 | |||||||||||
| 99,633 | 91,727 | Camden Property Trust | 9.2 | 7.7 | |||||||||||
| — | 89,419 | Care Capital Properties, Inc. | — | 2.2 | |||||||||||
| 85,789 | 64,966 | CareTrust REIT Inc. | 1.4 | 1.0 | |||||||||||
| 48,438 | 43,788 | Catchmark Timber Trust, Inc. | 0.6 | 0.5 | |||||||||||
| 185,540 | 178,895 | CBL & Associates Properties, Inc. | 1.1 | (9) | 2.1 | ||||||||||
| 92,124 | 92,124 | Cedar Shopping Centers, Inc. | 0.6 | 0.6 | |||||||||||
| 49,866 | 39,759 | Chatham Lodging Trust | 1.1 | 0.8 | |||||||||||
| 64,702 | 63,363 | Chesapeake Lodging Trust | 1.8 | 1.6 | |||||||||||
| 32,933 | — | City Office REIT, Inc. | 0.4 | — | |||||||||||
| 15,330 | — | Clipper Realty, Inc. | 0.2 | — | |||||||||||
| 583,920 | — | Colony Northstar, Inc. | 6.7 | — | |||||||||||
| — | 50,961 | Colony Starwood Homes | — | 1.5 | |||||||||||
| 131,158 | 130,704 | Columbia Property Trust Inc. | 3.0 | 2.8 | |||||||||||
| — | 161,499 | Communication Sales & Leasing, Inc. | — | 4.1 | |||||||||||
| 17,855 | 13,231 | Community Healthcare Trust, Inc. | 0.5 | 0.3 | |||||||||||
| 130,237 | 117,878 | CoreCivic, Inc. | 2.9 | 2.9 | |||||||||||
| 12,695 | 12,695 | Corenergy Infrastructure Trust, Inc. | 0.5 | 0.4 | |||||||||||
| 37,213 | 35,452 | CoreSite Realty Corporation | 4.2 | 2.8 | |||||||||||
| 109,361 | 98,668 | Corporate Office Properties Trust | 3.2 | 3.1 | |||||||||||
| 458,712 | 358,876 | Cousins Properties Incorporated | 4.2 | 3.1 | |||||||||||
| 440,146 | 378,286 | Crown Castle International Corporation | 48.9 | 32.8 | |||||||||||
| 197,633 | 189,128 | Cubesmart | 5.7 | 5.1 | |||||||||||
| 98,521 | 80,245 | CyrusOne Inc. | 5.9 | 3.6 | |||||||||||
| 101,202 | 95,203 | DCT Industrial Trust, Inc. | 5.9 | 4.6 | |||||||||||
| 340,952 | 326,844 | DDR Corp | 3.1 | 5.0 | |||||||||||
| 219,132 | 211,566 | DiamondRock Hospitality Company | 2.5 | 2.4 | |||||||||||
| 223,448 | 166,911 | Digital Realty Trust, Inc. | 25.5 | 16.4 | |||||||||||
| 174,051 | 146,715 | Douglas Emmett, Inc. | 7.1 | 5.4 | |||||||||||
| 388,940 | 371,513 | Duke Realty Corporation | 10.6 | 9.9 | |||||||||||
| — | 79,039 | DuPont Fabros Technology, Inc. | — | 3.5 | |||||||||||
| 46,776 | 38,107 | Easterly Government Properties, Inc. | 1.0 | 0.8 | |||||||||||
| 36,626 | 34,448 | EastGroup Properties, Inc. | 3.2 | 2.5 | |||||||||||
| 82,652 | 76,609 | Education Realty Trust, Inc. | 2.9 | 3.2 | |||||||||||
| 139,642 | 128,313 | Empire State Realty Trust | 2.9 | 2.6 | |||||||||||
| 68,867 | 66,086 | EPR Properties | 4.5 | 4.7 | |||||||||||
TIAA REAL ESTATE ACCOUNT
CONSOLIDATED SCHEDULES OF INVESTMENTS
(Dollar values shown in millions)
OTHER MARKETABLE SECURITIES—7.9% and 3.2%
U.S. GOVERNMENT AGENCY NOTES—3.1% and 0.7%
| Principal | Issuer | Yield(4) | Maturity Date | Fair Value at December 31, | ||||||||||||||||||||||||||||||||||
| 2021 | 2020 | 2021 | 2020 | |||||||||||||||||||||||||||||||||||
| $ | — | $ | 43.0 | Farmer Mac Discount Notes | 0.101% | 10/29/2021 | $ | — | $ | 43.0 | ||||||||||||||||||||||||||||
| 4.0 | — | Farmer Mac Discount Notes | 0.010% | 1/3/2022 | 4.0 | — | ||||||||||||||||||||||||||||||||
| 47.5 | — | Farmer Mac Discount Notes | 0.005%-1.752% | 2/28/2022 | 47.5 | — | ||||||||||||||||||||||||||||||||
| 25.0 | — | Federal Farm Credit Discount Notes | 0.050% | 2/16/2022 | 25.0 | — | ||||||||||||||||||||||||||||||||
| 13.9 | — | Federal Farm Credit Discount Notes | 0.030% | 2/25/2022 | 13.9 | — | ||||||||||||||||||||||||||||||||
| 12.5 | — | Federal Farm Credit Discount Notes | 0.040% | 3/1/2022 | 12.5 | — | ||||||||||||||||||||||||||||||||
| 35.0 | — | Federal Farm Credit Discount Notes | 0.040% | 3/17/2022 | 35.0 | — | ||||||||||||||||||||||||||||||||
| 25.0 | — | Federal Farm Credit Discount Notes | 0.051% | 4/8/2022 | 25.0 | — | ||||||||||||||||||||||||||||||||
| 20.0 | — | Federal Farm Credit Discount Notes | 0.070% | 5/11/2022 | 20.0 | — | ||||||||||||||||||||||||||||||||
| 8.0 | — | Federal Farm Credit Discount Notes | 0.071% | 5/23/2022 | 8.0 | — | ||||||||||||||||||||||||||||||||
| — | 24.0 | Federal Home Loan Bank Discount Notes | 0.086% | 5/19/2021 | — | 24.0 | ||||||||||||||||||||||||||||||||
| — | 65.0 | Federal Home Loan Bank Discount Notes | 0.091% | 5/26/2021 | — | 65.0 | ||||||||||||||||||||||||||||||||
| — | 10.0 | Federal Home Loan Bank Discount Notes | 1.734% | 11/19/2021 | — | 10.0 | ||||||||||||||||||||||||||||||||
| — | 15.0 | Federal Home Loan Bank Discount Notes | 1.700% | 12/20/2021 | — | 15.0 | ||||||||||||||||||||||||||||||||
| 13.0 | — | Federal Home Loan Bank Discount Notes | 0.010% | 1/3/2022 | 13.0 | — | ||||||||||||||||||||||||||||||||
| 28.5 | — | Federal Home Loan Bank Discount Notes | 0.010% | 1/4/2022 | 28.5 | — | ||||||||||||||||||||||||||||||||
| 123.3 | — | Federal Home Loan Bank Discount Notes | 0.005%-0.049% | 1/5/2022 | 123.3 | — | ||||||||||||||||||||||||||||||||
| 54.8 | — | Federal Home Loan Bank Discount Notes | 0.041%-0.046% | 1/10/2022 | 54.8 | — | ||||||||||||||||||||||||||||||||
| 25.0 | — | Federal Home Loan Bank Discount Notes | 0.005%-0.041% | 1/12/2022 | 25.0 | — | ||||||||||||||||||||||||||||||||
| 30.0 | — | Federal Home Loan Bank Discount Notes | 0.050% | 1/20/2022 | 30.0 | — | ||||||||||||||||||||||||||||||||
| 11.0 | — | Federal Home Loan Bank Discount Notes | 0.040% | 1/21/2022 | 11.0 | — | ||||||||||||||||||||||||||||||||
| 38.0 | — | Federal Home Loan Bank Discount Notes | 0.010% | 1/28/2022 | 38.0 | — | ||||||||||||||||||||||||||||||||
| 20.0 | — | Federal Home Loan Bank Discount Notes | 0.050% | 2/4/2022 | 20.0 | — | ||||||||||||||||||||||||||||||||
| 20.4 | — | Federal Home Loan Bank Discount Notes | 0.035%-0.050% | 2/9/2022 | 20.4 | — | ||||||||||||||||||||||||||||||||
| 6.3 | — | Federal Home Loan Bank Discount Notes | 0.020%-0.045% | 2/16/2022 | 6.3 | — | ||||||||||||||||||||||||||||||||
| 134.2 | — | Federal Home Loan Bank Discount Notes | 0.020%-0.051% | 2/18/2022 | 134.2 | — | ||||||||||||||||||||||||||||||||
| 25.1 | — | Federal Home Loan Bank Discount Notes | 0.050% | 2/22/2022 | 25.1 | — | ||||||||||||||||||||||||||||||||
| 50.0 | — | Federal Home Loan Bank Discount Notes | 0.050% | 2/23/2022 | 50.0 | — | ||||||||||||||||||||||||||||||||
| 50.0 | — | Federal Home Loan Bank Discount Notes | 0.040% | 3/9/2022 | 50.0 | — | ||||||||||||||||||||||||||||||||
| 28.0 | — | Federal Home Loan Bank Discount Notes | 0.051%-0.054% | 4/1/2022 | 28.0 | — | ||||||||||||||||||||||||||||||||
| 15.6 | — | Federal Home Loan Bank Discount Notes | 0.060% | 4/8/2022 | 15.6 | — | ||||||||||||||||||||||||||||||||
TOTAL U.S. GOVERNMENT AGENCY NOTES (Cost $864.1 and $157.0) | $ | 864.1 | $ | 157.0 | ||||||||||||||||||||||||||||||||||
FOREIGN GOVERNMENT AGENCY NOTES—0.0% and 0.0%
| Principal | Issuer | Yield(4) | Maturity Date | Fair Value at December 31, | ||||||||||||||||||||||||||||||||||
| 2021 | 2020 | 2021 | 2020 | |||||||||||||||||||||||||||||||||||
| $ | 2.5 | $ | — | Kommuninvest I Sverige | 0.550% | 7/5/2023 | $ | 2.5 | $ | — | ||||||||||||||||||||||||||||
| 2.1 | — | Japan Bank for International Cooperation | 0.530% | 4/15/2024 | 2.1 | — | ||||||||||||||||||||||||||||||||
| 3.1 | — | Swedish Export Credit | 0.680% | 10/7/2024 | 3.0 | — | ||||||||||||||||||||||||||||||||
TOTAL FOREIGN GOVERNMENT AGENCY NOTES (Cost $7.7 and $0.0) | $ | 7.6 | $ | — | ||||||||||||||||||||||||||||||||||
109
| Shares | Issuer | Fair Value at December 31, | |||||||||||||
| 2017 | 2016 | 2017 | 2016 | ||||||||||||
| 85,048 | 74,499 | Equinix Inc. | $ | 38.5 | $ | 26.6 | |||||||||
| 132,344 | 132,412 | Equity Commonwealth | 4.0 | 4.0 | |||||||||||
| 89,456 | 81,207 | Equity Lifestyle Properties, Inc. | 8.0 | 5.9 | |||||||||||
| — | 97,735 | Equity One, Inc. | — | 3.0 | |||||||||||
| 390,235 | 378,516 | Equity Residential | 24.9 | 24.4 | |||||||||||
| 39,142 | 39,142 | Escrow Winthrop Realty Trust | 0.3 | 0.3 | |||||||||||
| 71,499 | 68,928 | Essex Property Trust, Inc. | 17.3 | 16.0 | |||||||||||
| 133,620 | 123,598 | Extra Space Storage, Inc. | 11.7 | 9.5 | |||||||||||
| 33,146 | 20,247 | Farmland Partners, Inc. | 0.3 | (9) | 0.2 | (9) | |||||||||
| 78,850 | 75,390 | Federal Realty Investment Trust | 10.5 | 10.7 | |||||||||||
| — | 146,636 | FelCor Lodging Trust Incorporated | — | 1.2 | |||||||||||
| 130,114 | 122,078 | First Industrial Realty Trust, Inc. | 4.1 | 3.4 | |||||||||||
| — | 62,454 | First Potomac Realty Trust | — | 0.7 | |||||||||||
| 266,222 | 247,510 | Forest City Realty Trust A | 6.4 | 5.2 | |||||||||||
| 68,809 | 62,347 | Four Corners Property Trust | 1.8 | 1.3 | |||||||||||
| 119,538 | 105,457 | Franklin Street Properties Corp. | 1.3 | 1.4 | |||||||||||
| 221,037 | 215,403 | Gaming and Leisure Properties, Inc. | 8.2 | 6.6 | |||||||||||
| 674,285 | 528,439 | General Growth Properties, Inc. | 15.8 | 13.2 | |||||||||||
| 134,715 | 75,332 | GEO Group Inc./The | 3.2 | 2.7 | |||||||||||
| 36,337 | 27,304 | Getty Realty Corp. | 1.0 | 0.7 | |||||||||||
| 30,560 | 24,752 | Gladstone Commercial Corporation | 0.6 | 0.5 | |||||||||||
| 11,775 | — | Gladstone Land Corporation | 0.2 | — | |||||||||||
| 14,323 | 14,323 | Global Medical REIT, Inc. | 0.1 | (9) | 0.1 | (9) | |||||||||
| 73,715 | 169,785 | Global Net Lease, Inc. | 1.5 | 1.3 | |||||||||||
| 102,459 | 74,542 | Government Properties Income Trust | 1.9 | 1.4 | |||||||||||
| 173,959 | 439,336 | Gramercy Property Trust Inc. | 4.6 | 4.0 | |||||||||||
| 513,801 | 488,199 | HCP, Inc. | 13.4 | 14.5 | |||||||||||
| 133,528 | 121,172 | Healthcare Realty Trust Inc. | 4.3 | 3.7 | |||||||||||
| 221,345 | 148,194 | Healthcare Trust of America | 6.6 | 4.3 | |||||||||||
| 45,394 | 38,921 | Hersha Hospitality Trust | 0.8 | 0.8 | |||||||||||
| 111,471 | 105,127 | Highwoods Properties, Inc. | 5.7 | 5.4 | |||||||||||
| 179,103 | 172,557 | Hospitality Properties Trust | 5.3 | 5.5 | |||||||||||
| 799,202 | 784,264 | Host Hotels & Resorts, Inc. | 15.9 | 14.8 | |||||||||||
| 171,423 | 130,545 | Hudson Pacific Properties, Inc. | 5.9 | 4.5 | |||||||||||
| 93,383 | 64,154 | Independence Realty Trust, Inc. | 0.9 | 0.6 | |||||||||||
| 130,841 | 130,841 | Investors Real Estate Trust | 0.7 | 0.9 | |||||||||||
| 320,427 | — | Invitation Homes, Inc. | 7.6 | — | |||||||||||
| 302,923 | 251,283 | Iron Mountain Inc. | 11.4 | 8.2 | |||||||||||
| 1,500,000 | 1,500,000 | iShares Dow Jones US Real Estate Index Fund | 121.5 | (9) | 115.4 | (9) | |||||||||
| 94,915 | — | JBG Smith Properties | 3.3 | — | |||||||||||
| 106,012 | 96,739 | Kilroy Realty Corporation | 7.9 | 7.1 | |||||||||||
| 451,921 | 446,152 | Kimco Realty Corporation | 8.2 | 11.2 | |||||||||||
| 90,119 | 86,474 | Kite Realty Group Trust | 1.8 | 2.0 | |||||||||||
| 91,259 | 86,839 | Lamar Advertising Corporation | 6.8 | 5.8 | |||||||||||
| 124,427 | 118,625 | LaSalle Hotel Properties | 3.5 | 3.6 | |||||||||||
| 257,171 | 246,697 | Lexington Realty Trust | 2.5 | 2.7 | |||||||||||
| 161,972 | 154,875 | Liberty Property Trust | 7.0 | 6.1 | |||||||||||
| 50,130 | 48,870 | Life Storage, Inc. | 4.5 | 4.2 | |||||||||||
| 42,489 | 41,261 | LTC Properties, Inc. | 1.9 | 1.9 | |||||||||||
| 99,130 | 93,046 | Mack-Cali Realty Corporation | 2.1 | 2.7 | |||||||||||
| 29,800 | 23,475 | Medequities Realty Trust, Inc. | 0.3 | 0.3 | |||||||||||
| 399,374 | 337,220 | Medical Properties Trust, Inc. | 5.5 | 4.1 | |||||||||||
| 123,965 | 118,873 | Mid-America Apartment Communities, Inc. | 12.5 | 11.6 | |||||||||||
| 80,492 | 69,038 | Monmouth Real Estate Investment Corporation | 1.4 | 1.1 | |||||||||||
| — | 175,519 | Monogram Residential Trust Inc. | — | 1.9 | |||||||||||
| 43,294 | 38,542 | National Health Investors, Inc. | 3.3 | 2.9 | |||||||||||
TIAA REAL ESTATE ACCOUNT
CONSOLIDATED SCHEDULES OF INVESTMENTS
(Dollar values shown in millions)
UNITED STATES TREASURY SECURITIES—2.8% and 2.5%
| Principal | Issuer | Yield(4) | Maturity Date | Fair Value at December 31, | ||||||||||||||||||||||||||||||||||
| 2021 | 2020 | 2021 | 2020 | |||||||||||||||||||||||||||||||||||
| $ | — | $ | 24.1 | United States Treasury Bills | 0.071% | 1/19/2021 | $ | — | $ | 24.1 | ||||||||||||||||||||||||||||
| — | 84.0 | United States Treasury Bills | 0.091% | 1/21/2021 | — | 84.0 | ||||||||||||||||||||||||||||||||
| — | 100.0 | United States Treasury Bills | 0.094% | 1/28/2021 | — | 100.0 | ||||||||||||||||||||||||||||||||
| — | 50.0 | United States Treasury Bills | 0.091% | 2/23/2021 | — | 50.0 | ||||||||||||||||||||||||||||||||
| — | 47.8 | United States Treasury Bills | 0.092% | 3/2/2021 | — | 47.8 | ||||||||||||||||||||||||||||||||
| — | 80.0 | United States Treasury Bills | 0.092% | 3/11/2021 | — | 79.9 | ||||||||||||||||||||||||||||||||
| 10.5 | — | United States Treasury Bills | 0.020% | 1/6/2022 | 10.4 | — | ||||||||||||||||||||||||||||||||
| 25.0 | — | United States Treasury Bills | 0.010% | 2/17/2022 | 25.0 | — | ||||||||||||||||||||||||||||||||
| 49.9 | — | United States Treasury Bills | 0.080% | 4/30/2022 | 49.9 | — | ||||||||||||||||||||||||||||||||
| 50.0 | — | United States Treasury Bills | 0.150% | 6/23/2022 | 50.0 | — | ||||||||||||||||||||||||||||||||
| 20.0 | — | United States Treasury Bills | 0.120% | 10/6/2022 | 20.0 | — | ||||||||||||||||||||||||||||||||
| 105.0 | — | United States Treasury Bills | 0.155%-0.168% | 3/31/2023 | 104.5 | — | ||||||||||||||||||||||||||||||||
| 25.0 | — | United States Treasury Bills | 0.160% | 4/30/2023 | 24.9 | — | ||||||||||||||||||||||||||||||||
| 20.0 | — | United States Treasury Bills | 0.160% | 5/31/2023 | 19.9 | — | ||||||||||||||||||||||||||||||||
| 208.9 | — | United States Treasury Bills | 0.238%-0.270% | 6/30/2023 | 207.9 | — | ||||||||||||||||||||||||||||||||
| 20.0 | — | United States Treasury Bills | 0.200% | 7/31/2023 | 19.8 | — | ||||||||||||||||||||||||||||||||
| 69.9 | — | United States Treasury Bills | 0.218%-0.220% | 8/31/2023 | 69.4 | — | ||||||||||||||||||||||||||||||||
| 25.0 | — | United States Treasury Bills | 0.360% | 4/15/2024 | 24.7 | — | ||||||||||||||||||||||||||||||||
| 24.9 | — | United States Treasury Bills | 0.370% | 5/15/2024 | 24.7 | — | ||||||||||||||||||||||||||||||||
| 49.8 | — | United States Treasury Bills | 0.391%-0.474% | 6/15/2024 | 49.3 | — | ||||||||||||||||||||||||||||||||
| 34.9 | — | United States Treasury Bills | 0.446%-0.463% | 7/15/2024 | 34.6 | — | ||||||||||||||||||||||||||||||||
| 49.9 | — | United States Treasury Bills | 0.450% | 9/15/2024 | 49.3 | — | ||||||||||||||||||||||||||||||||
| — | 5.0 | United States Treasury Cash Management Bill | 0.010% | 1/5/2021 | — | 5.0 | ||||||||||||||||||||||||||||||||
| — | 56.5 | United States Treasury Cash Management Bill | 0.108% | 1/12/2021 | — | 56.5 | ||||||||||||||||||||||||||||||||
| — | 85.0 | United States Treasury Cash Management Bill | 0.086% | 3/9/2021 | — | 85.0 | ||||||||||||||||||||||||||||||||
| — | 50.0 | United States Treasury Cash Management Bill | 0.096% | 4/13/2021 | — | 50.0 | ||||||||||||||||||||||||||||||||
TOTAL UNITED STATES TREASURY SECURITIES (Cost $788.7 and $582.3) | $ | 784.3 | $ | 582.3 | ||||||||||||||||||||||||||||||||||
CORPORATE BOND SECURITIES—2.0% and 0.0%
| Principal | Issuer | Coupon Rate | Credit Rating(7) | Maturity Date | Fair Value at December 31, | |||||||||||||||||||||||||||||||||||||||
| 2021 | 2020 | 2021 | 2020 | |||||||||||||||||||||||||||||||||||||||||
| $ | 3.2 | $ | — | Abbvie, Inc. | 0.660% | BBB+ | 11/14/2023 | $ | 3.1 | $ | — | |||||||||||||||||||||||||||||||||
| 10.5 | — | Abbvie, Inc. | 0.870%-0.969% | BBB+ | 11/21/2024 | 10.4 | — | |||||||||||||||||||||||||||||||||||||
| 4.9 | — | American Express Credit Account | 0.290% | AAA | 10/15/2025 | 4.9 | — | |||||||||||||||||||||||||||||||||||||
| 3.9 | — | American Express Credit Account | 0.930% | NR | 11/15/2026 | 3.9 | — | |||||||||||||||||||||||||||||||||||||
| 5.7 | — | AmeriCredit Automobile Receivables Trust | 0.780% | NR | 8/18/2026 | 5.6 | — | |||||||||||||||||||||||||||||||||||||
| 2.7 | — | AmeriCredit Automobile Receivables Trust | 0.550% | AAA | 12/18/2026 | 2.6 | — | |||||||||||||||||||||||||||||||||||||
| 3.2 | — | American Honda Finance | 0.600% | A- | 10/10/2023 | 3.1 | — | |||||||||||||||||||||||||||||||||||||
| 5.0 | — | American Honda Finance | 0.790% | A- | 8/9/2024 | 4.9 | — | |||||||||||||||||||||||||||||||||||||
| 5.0 | — | Astrazeneca Finance, LLC | 0.720% | A- | 5/28/2024 | 5.0 | — | |||||||||||||||||||||||||||||||||||||
| 4.0 | — | Banco Santander | 0.710% | A+ | 6/30/2024 | 4.0 | — | |||||||||||||||||||||||||||||||||||||
| 15.4 | — | Bank of America Corporation | 0.517%-0.613% | A- | 12/20/2023 | 15.3 | — | |||||||||||||||||||||||||||||||||||||
110
| Shares | Issuer | Fair Value at December 31, | |||||||||||||
| 2017 | 2016 | 2017 | 2016 | ||||||||||||
| 165,743 | 154,142 | National Retail Properties, Inc. | $ | 7.1 | $ | 6.8 | |||||||||
| 49,957 | 44,249 | National Storage Affiliates Trust | 1.4 | 1.0 | |||||||||||
| 90,062 | 83,324 | New Senior Investment Group | 0.7 | 0.8 | |||||||||||
| — | 175,401 | New York REIT | — | 1.8 | |||||||||||
| 19,294 | 17,140 | Nexpoint Residential Trust, Inc. | 0.5 | 0.4 | |||||||||||
| 61,800 | 59,329 | NorthStar Realty Europe Corp. | 0.8 | 0.7 | |||||||||||
| — | 189,799 | NorthStar Realty Finance Corp. | — | 2.9 | |||||||||||
| 214,048 | 181,435 | Omega Healthcare Investors, Inc. | 5.9 | (9) | 5.7 | ||||||||||
| 16,324 | 16,324 | One Liberty Properties, Inc. | 0.4 | 0.4 | |||||||||||
| 152,483 | 144,614 | Outfront Media Inc. | 3.5 | 3.6 | |||||||||||
| 225,256 | 157,741 | Paramount Group Inc. | 3.6 | 2.5 | |||||||||||
| 159,738 | — | Park Hotels & Resorts, Inc. | 4.6 | — | |||||||||||
| — | 45,533 | Parkway Properties, Inc. | — | 1.0 | |||||||||||
| 75,337 | 75,815 | Pebblebrook Hotel Trust | 2.8 | 2.3 | |||||||||||
| 69,866 | 69,866 | Pennsylvania Real Estate Investment Trust | 0.8 | 1.3 | |||||||||||
| 195,747 | 141,267 | Physicians Realty Trust | 3.5 | 2.7 | |||||||||||
| 159,189 | 153,053 | Piedmont Office Realty Trust, Inc. | 3.1 | 3.2 | |||||||||||
| 44,326 | 39,487 | Potlatch Corporation | 2.2 | 1.6 | |||||||||||
| 39,774 | 25,352 | Preferred Apartment Communities, Inc. | 0.8 | 0.4 | |||||||||||
| 577,161 | 549,455 | ProLogis | 37.2 | 29.0 | |||||||||||
| 21,348 | 20,916 | PS Business Parks, Inc. | 2.7 | 2.4 | |||||||||||
| 161,952 | 152,197 | Public Storage, Inc. | 33.8 | 34.0 | |||||||||||
| 53,551 | 47,125 | QTS Realty Trust, Inc. | 2.9 | 2.3 | |||||||||||
| 104,106 | 98,883 | Quality Care Properties | 1.4 | 1.5 | |||||||||||
| 84,467 | 82,342 | Ramco-Gershenson Properties Trust | 1.2 | 1.4 | |||||||||||
| 140,926 | 129,796 | Rayonier, Inc. | 4.5 | 3.4 | |||||||||||
| 308,355 | 270,184 | Realty Income Corporation | 17.6 | 15.5 | |||||||||||
| 163,631 | 109,616 | Regency Centers Corporation | 11.3 | 7.6 | |||||||||||
| 118,002 | 113,887 | Retail Opportunity Investment | 2.4 | 2.4 | |||||||||||
| 248,555 | 247,302 | Retail Properties of America | 3.3 | 3.8 | |||||||||||
| 83,912 | 67,197 | Rexford Industrial Realty Inc. | 2.4 | 1.6 | |||||||||||
| 185,465 | 131,026 | RLJ Lodging Trust | 4.1 | 3.2 | |||||||||||
| 48,519 | 50,994 | Ryman Hospitality Properties | 3.3 | 3.2 | |||||||||||
| 191,602 | 68,440 | Sabra Health Care REIT Inc. | 3.6 | 1.7 | |||||||||||
| 11,006 | — | Safety Income and Growth, Inc. | 0.2 | — | |||||||||||
| 12,343 | 14,267 | Saul Centers, Inc. | 0.8 | 0.9 | |||||||||||
| 131,401 | — | SBA Communications Corporation | 21.5 | — | |||||||||||
| 69,474 | 71,466 | Select Income Real Estate Investment Trust | 1.7 | 1.8 | |||||||||||
| 259,176 | 248,749 | Senior Housing Properties Trust | 5.0 | 4.7 | |||||||||||
| — | 36,820 | Silver Bay Realty Trust Corp. | — | 0.6 | |||||||||||
| 340,430 | 329,687 | Simon Property Group, Inc. | 58.5 | 58.6 | |||||||||||
| 105,521 | 106,453 | SL Green Realty Corp. | 10.7 | 11.4 | |||||||||||
| 498,344 | 483,032 | Spirit Realty Capital Inc. | 4.3 | 5.2 | |||||||||||
| 102,712 | 78,649 | Stag Industrial, Inc. | 2.8 | 1.9 | |||||||||||
| 187,343 | 162,012 | STORE Capital Corporation | 4.9 | 4.0 | |||||||||||
| 113,544 | 88,627 | Summit Hotel Properties, Inc. | 1.7 | 1.4 | |||||||||||
| 83,430 | 68,173 | Sun Communities, Inc. | 7.7 | 5.2 | |||||||||||
| 247,441 | 227,526 | Sunstone Hotel Investors, L.L.C. | 4.1 | 3.5 | |||||||||||
| 101,087 | 100,862 | Tanger Factory Outlet Centers, Inc. | 2.7 | (9) | 3.6 | ||||||||||
| 64,816 | 63,335 | Taubman Centers, Inc. | 4.2 | 4.7 | |||||||||||
| 58,066 | 48,484 | Terreno Realty Corporation | 2.0 | 1.4 | |||||||||||
| 149,606 | 150,999 | The Macerich Company | 9.8 | 10.7 | |||||||||||
| 54,543 | 50,411 | Tier Inc. | 1.1 | 0.9 | |||||||||||
| 289,926 | 280,233 | UDR, Inc. | 11.2 | 10.2 | |||||||||||
| 34,876 | 27,329 | UMH Properties, Inc. | 0.5 | 0.4 | |||||||||||
| 182,231 | — | UNITI Group, Inc. | 3.2 | (9) | — | ||||||||||
| 14,449 | 14,676 | Universal Health Realty Income Trust | 1.1 | 1.0 | |||||||||||
| 112,531 | 93,500 | Urban Edge Properties | 2.9 | 2.6 | |||||||||||
TIAA REAL ESTATE ACCOUNT
CONSOLIDATED SCHEDULES OF INVESTMENTS
(Dollar values shown in millions)
| Principal | Issuer | Coupon Rate | Credit Rating(7) | Maturity Date | Fair Value at December 31, | |||||||||||||||||||||||||||||||||||||||
| 2021 | 2020 | 2021 | 2020 | |||||||||||||||||||||||||||||||||||||||||
| $ | 3.0 | $ | — | Bank of America Corporation | 0.600% | A- | 5/28/2024 | $ | 3.0 | $ | — | |||||||||||||||||||||||||||||||||
| 2.2 | — | Bank of America Corporation | 1.180% | BBB+ | 8/26/2024 | 2.1 | — | |||||||||||||||||||||||||||||||||||||
| 1.0 | — | Bank of America Credit Card Trust | 0.450% | AAA | 9/15/2026 | 1.0 | — | |||||||||||||||||||||||||||||||||||||
| 5.0 | — | Bank of Montreal | 0.450% | A- | 9/15/2023 | 5.0 | — | |||||||||||||||||||||||||||||||||||||
| 5.0 | — | Bank of Montreal | 0.520% | A- | 12/8/2023 | 5.0 | — | |||||||||||||||||||||||||||||||||||||
| 5.0 | — | Bank of Montreal | 0.690% | A- | 7/9/2024 | 4.9 | — | |||||||||||||||||||||||||||||||||||||
| 3.0 | — | Bank of New York Mellon Corporation | 0.550% | A | 4/26/2024 | 3.0 | — | |||||||||||||||||||||||||||||||||||||
| 3.0 | — | Bank of Nova Scotia | 0.720% | A- | 4/15/2024 | 3.0 | — | |||||||||||||||||||||||||||||||||||||
| 5.0 | — | Bank of Nova Scotia | 0.450% | A- | 9/15/2023 | 5.0 | — | |||||||||||||||||||||||||||||||||||||
| 2.4 | — | BOC Aviation USA Corporation | 1.750% | A- | 4/29/2024 | 2.4 | — | |||||||||||||||||||||||||||||||||||||
| 4.9 | — | Barclays Dryrock Issuance | 0.650% | AAA | 7/15/2027 | 4.8 | — | |||||||||||||||||||||||||||||||||||||
| 5.0 | — | Baxter International, Inc. | 1.340% | BBB | 11/29/2024 | 5.0 | — | |||||||||||||||||||||||||||||||||||||
| 5.0 | — | Canadian Imperial Bank | 0.610% | BBB+ | 12/14/2023 | 4.9 | — | |||||||||||||||||||||||||||||||||||||
| 6.0 | — | Canadian Pacific Railway | 1.410% | BBB+ | 12/2/2024 | 6.0 | — | |||||||||||||||||||||||||||||||||||||
| 4.9 | — | Capital One Multi Asset | 0.190% | AAA | 8/15/2024 | 4.9 | — | |||||||||||||||||||||||||||||||||||||
| 5.0 | — | Carmax Auto | 0.770% | AAA | 6/15/2026 | 5.0 | — | |||||||||||||||||||||||||||||||||||||
| 2.4 | — | Carmax Auto | 0.580% | AAA | 9/15/2026 | 2.3 | — | |||||||||||||||||||||||||||||||||||||
| 5.0 | — | Carmax Auto Owner Trust | 0.530% | AAA | 2/17/2026 | 5.0 | — | |||||||||||||||||||||||||||||||||||||
| 8.2 | — | Carvana Auto Receivables Trust | 1.330% | AAA | 1/11/2027 | 8.2 | — | |||||||||||||||||||||||||||||||||||||
| 3.1 | — | Cigna Corporation | 0.540% | A- | 7/15/2023 | 3.1 | — | |||||||||||||||||||||||||||||||||||||
| 13.0 | — | Citigroup Inc. | 0.709%-0.868% | BBB+ | 10/30/2024 | 12.9 | — | |||||||||||||||||||||||||||||||||||||
| 2.1 | — | CNH Equipment Trust | 0.460% | AAA | 8/17/2026 | 2.1 | — | |||||||||||||||||||||||||||||||||||||
| 3.3 | — | CNH Equipment Trust | 0.830% | AAA | 12/15/2026 | 3.3 | — | |||||||||||||||||||||||||||||||||||||
| 5.3 | — | Credit Agricole London | 1.060% | A- | 10/4/2024 | 5.2 | — | |||||||||||||||||||||||||||||||||||||
| 5.0 | — | Credit Suisse New York | 0.530% | A+ | 8/9/2023 | 5.0 | — | |||||||||||||||||||||||||||||||||||||
| 5.0 | — | Discover Card Execution Note Trust | 0.610% | AAA | 9/15/2026 | 4.9 | — | |||||||||||||||||||||||||||||||||||||
| 7.8 | — | DTE Energy Corporation | 0.914%-0.918% | BBB | 10/1/2024 | 7.7 | — | |||||||||||||||||||||||||||||||||||||
| 3.5 | — | Enbridge, Inc. | 0.590% | BBB+ | 10/4/2023 | 3.5 | — | |||||||||||||||||||||||||||||||||||||
| 5.0 | — | Equitable Financial Life | 0.830% | A+ | 8/12/2024 | 4.9 | — | |||||||||||||||||||||||||||||||||||||
| 5.0 | — | European Investment Bank | 0.500% | AAA | 7/24/2024 | 4.9 | — | |||||||||||||||||||||||||||||||||||||
| 4.9 | — | Eversource Energy | 0.980% | BBB+ | 10/1/2024 | 4.8 | — | |||||||||||||||||||||||||||||||||||||
| 5.0 | — | Fed Caisses Desjardins | 0.730% | A- | 5/21/2024 | 4.9 | — | |||||||||||||||||||||||||||||||||||||
| 5.0 | — | Ford Credit Auto | 0.680% | AAA | 10/15/2024 | 5.0 | — | |||||||||||||||||||||||||||||||||||||
| 5.0 | — | Ford Credit Auto | 0.670% | AAA | 12/15/2024 | 4.9 | — | |||||||||||||||||||||||||||||||||||||
| 2.1 | — | GM Financial Automobile | 0.680% | AAA | 5/20/2025 | 2.1 | — | |||||||||||||||||||||||||||||||||||||
| 2.2 | — | GM Financial | 0.490% | AAA | 6/16/2026 | 2.2 | — | |||||||||||||||||||||||||||||||||||||
| 1.8 | — | GM Financial | 0.700% | AAA | 9/16/2026 | 1.8 | — | |||||||||||||||||||||||||||||||||||||
| 3.0 | — | Goldman Sachs Group, Inc. | 1.230% | BBB+ | 12/6/2023 | 3.0 | — | |||||||||||||||||||||||||||||||||||||
| 2.1 | — | Goldman Sachs Group, Inc. | 0.820% | BBB+ | 2/20/2024 | 2.1 | — | |||||||||||||||||||||||||||||||||||||
| 5.0 | — | Goldman Sachs Group, Inc. | 0.710% | BBB+ | 3/8/2024 | 5.0 | — | |||||||||||||||||||||||||||||||||||||
| 8.5 | — | Goldman Sachs Group, Inc. | 0.666%-0.725% | BBB+ | 9/10/2024 | 8.4 | — | |||||||||||||||||||||||||||||||||||||
| 5.0 | — | Goldman Sachs Group, Inc. | 0.940% | BBB+ | 10/21/2024 | 5.0 | — | |||||||||||||||||||||||||||||||||||||
| 4.9 | — | Honda Auto | 0.340% | AAA | 8/15/2025 | 4.9 | — | |||||||||||||||||||||||||||||||||||||
111
| Shares | Issuer | Fair Value at December 31, | |||||||||||||
| 2017 | 2016 | 2017 | 2016 | ||||||||||||
| 31,959 | 31,959 | Urstadt Biddle Properties, Inc. | $ | 0.7 | $ | 0.8 | |||||||||
| 388,195 | 371,296 | Ventas, Inc. | 23.3 | 23.2 | |||||||||||
| 1,065,264 | 1,012,629 | VEREIT, Inc. | 8.3 | 8.6 | |||||||||||
| 188,214 | 177,780 | Vornado Realty Trust | 14.7 | 18.6 | |||||||||||
| 203,651 | 193,859 | Washington Prime Group, Inc. | 1.4 | 2.0 | |||||||||||
| 85,659 | 78,200 | Washington Real Estate Investment Trust | 2.7 | 2.6 | |||||||||||
| 132,066 | 120,820 | Weingarten Realty Investors | 4.3 | 4.3 | |||||||||||
| 401,236 | 380,425 | Welltower Inc. | 25.6 | 25.5 | |||||||||||
| 816,991 | 783,938 | Weyerhaeuser Company | 28.8 | 23.6 | |||||||||||
| 38,883 | 32,110 | Whitestone Real Estate Investment Trust B | 0.6 | 0.5 | |||||||||||
| 116,079 | 95,234 | WP Carey Inc. | 8.0 | 5.6 | |||||||||||
| 118,158 | 113,720 | Xenia Hotels & Resorts Inc. | 2.6 | 2.2 | |||||||||||
| TOTAL REAL ESTATE-RELATED MARKETABLE SECURITIES (Cost $991.0 and $883.9) | $ | 1,238.0 | $ | 1,081.5 | |||||||||||
TIAA REAL ESTATE ACCOUNT
CONSOLIDATED SCHEDULES OF INVESTMENTS
(Dollar values shown in millions)
| Principal | Issuer | Coupon Rate | Credit Rating(7) | Maturity Date | Fair Value at December 31, | |||||||||||||||||||||||||||||||||||||||
| 2021 | 2020 | 2021 | 2020 | |||||||||||||||||||||||||||||||||||||||||
| $ | 3.5 | $ | — | Honda Auto | 0.420% | AAA | 11/18/2025 | $ | 3.5 | $ | — | |||||||||||||||||||||||||||||||||
| 2.5 | — | Honda Auto Receivables Owner Trust | 0.900% | AAA | 1/21/2026 | 2.5 | — | |||||||||||||||||||||||||||||||||||||
| 3.3 | — | HSBC Holdings PLC | 0.750% | A- | 8/17/2024 | 3.3 | — | |||||||||||||||||||||||||||||||||||||
| 2.2 | — | Hyundai Auto | 0.390% | AAA | 9/15/2025 | 2.2 | — | |||||||||||||||||||||||||||||||||||||
| 3.0 | — | Hyundai Capital America | 0.910% | BBB+ | 6/14/2024 | 2.9 | — | |||||||||||||||||||||||||||||||||||||
| 3.0 | — | Hyundai Capital America | 1.090% | BBB+ | 9/17/2024 | 2.9 | — | |||||||||||||||||||||||||||||||||||||
| 10.6 | — | Ing Groep Nv | 0.634%-0.729% | A- | 10/2/2023 | 10.5 | — | |||||||||||||||||||||||||||||||||||||
| 3.9 | — | John Deere Owner Trust | 0.540% | AAA | 3/16/2026 | 3.9 | — | |||||||||||||||||||||||||||||||||||||
| 5.3 | — | Jpmorgan Chase & Co. | 0.750% | A- | 12/5/2024 | 5.3 | — | |||||||||||||||||||||||||||||||||||||
| 5.0 | — | Jpmorgan Chase & Co. | 0.560% | A- | 3/16/2024 | 5.0 | — | |||||||||||||||||||||||||||||||||||||
| 10.0 | — | KFW | 0.530% | AAA | 9/20/2024 | 9.9 | — | |||||||||||||||||||||||||||||||||||||
| 1.3 | — | Kia Corporation | 1.120% | BBB+ | 4/16/2024 | 1.3 | — | |||||||||||||||||||||||||||||||||||||
| 3.2 | — | Marathon Petroleum Corporation | 0.980% | BBB | 9/15/2024 | 3.2 | — | |||||||||||||||||||||||||||||||||||||
| 5.0 | — | Met Life Glob Funding I | 0.600% | AA- | 6/7/2024 | 4.9 | — | |||||||||||||||||||||||||||||||||||||
| 5.0 | — | Mondelez Intl Hldings Ne | 0.830% | BBB | 9/24/2024 | 4.9 | — | |||||||||||||||||||||||||||||||||||||
| 5.2 | — | Morgan Stanley | 0.700% | BBB | 5/22/2023 | 5.2 | — | |||||||||||||||||||||||||||||||||||||
| 5.0 | — | Morgan Stanley | 0.550% | BBB+ | 1/25/2024 | 5.0 | — | |||||||||||||||||||||||||||||||||||||
| 1.7 | — | Morgan Stanley | 0.740% | BBB+ | 4/5/2024 | 1.7 | — | |||||||||||||||||||||||||||||||||||||
| 5.0 | — | Morgan Stanley | 0.740% | BBB+ | 1/22/2025 | 4.9 | — | |||||||||||||||||||||||||||||||||||||
| 7.0 | — | National Rural Utilities Cooperative | 1.050% | A- | 10/18/2024 | 6.9 | — | |||||||||||||||||||||||||||||||||||||
| 0.8 | — | Natwest Markets PLC | 0.880% | A- | 8/12/2024 | 0.8 | — | |||||||||||||||||||||||||||||||||||||
| 5.0 | — | NBN Co. Ltd. | 1.000% | AA | 10/8/2024 | 4.9 | — | |||||||||||||||||||||||||||||||||||||
| 3.0 | — | New York Life Global Funding | 0.580% | AA+ | 4/26/2024 | 3.0 | — | |||||||||||||||||||||||||||||||||||||
| 5.0 | — | Nextera Energy Capital | 0.510% | BBB+ | 3/1/2023 | 5.0 | — | |||||||||||||||||||||||||||||||||||||
| 8.8 | — | Niagara Mohawk Power | 1.020% | BBB+ | 10/1/2024 | 8.7 | — | |||||||||||||||||||||||||||||||||||||
| 13.7 | — | Oracle Corporation | 0.834%-0.887% | BBB+ | 11/15/2024 | 13.5 | — | |||||||||||||||||||||||||||||||||||||
| 3.0 | — | Phillips 66 | 0.810% | BBB+ | 2/15/2024 | 3.0 | — | |||||||||||||||||||||||||||||||||||||
| 2.0 | — | Pioneer Natural Resource | 0.560% | BBB | 5/15/2023 | 2.0 | — | |||||||||||||||||||||||||||||||||||||
| 5.0 | — | Principal Lfe Glb Fnd Ii | 0.790% | A+ | 8/23/2024 | 4.9 | — | |||||||||||||||||||||||||||||||||||||
| 5.0 | — | Protective Life | 0.800% | AA- | 7/5/2024 | 4.9 | — | |||||||||||||||||||||||||||||||||||||
| 5.7 | — | Raytheon Tech Corporation | 0.580% | A- | 12/15/2023 | 5.6 | — | |||||||||||||||||||||||||||||||||||||
| 5.0 | — | Royal Bank of Canada | 0.690% | A | 7/29/2024 | 4.9 | — | |||||||||||||||||||||||||||||||||||||
| 10.0 | — | Salesforce.Com, Inc. | 0.660% | A+ | 7/15/2024 | 9.9 | — | |||||||||||||||||||||||||||||||||||||
| 2.9 | — | Santander Drive Auto | 0.350% | AAA | 2/18/2025 | 2.9 | — | |||||||||||||||||||||||||||||||||||||
| 3.2 | — | Santander Drive Auto | 0.340% | AAA | 3/17/2025 | 3.2 | — | |||||||||||||||||||||||||||||||||||||
| 2.9 | — | Santander Drive Auto Receivable | 0.520% | AAA | 8/15/2025 | 2.9 | — | |||||||||||||||||||||||||||||||||||||
| 8.3 | — | Shell International Fin | 0.682%-0.753% | A+ | 11/7/2024 | 8.2 | — | |||||||||||||||||||||||||||||||||||||
| 5.2 | — | Societe Generale | 1.270% | BBB | 10/16/2024 | 5.1 | — | |||||||||||||||||||||||||||||||||||||
| 5.3 | — | Sumitomo Mitsui Finl Grp | 0.630% | A- | 10/16/2023 | 5.3 | — | |||||||||||||||||||||||||||||||||||||
| 5.2 | — | Sumitomo Mitsui Finl Grp | 0.920% | A- | 9/27/2024 | 5.1 | — | |||||||||||||||||||||||||||||||||||||
| 10.0 | — | Swedish Export Credit | 0.600% | NR | 11/10/2023 | 9.9 | — | |||||||||||||||||||||||||||||||||||||
| 8.0 | — | Thermo Fisher Scientific | 1.230% | BBB+ | 10/18/2024 | 8.0 | — | |||||||||||||||||||||||||||||||||||||
| 5.0 | — | Toronto Dominion Bank | 0.750% | A | 9/10/2024 | 4.9 | — | |||||||||||||||||||||||||||||||||||||
| 5.0 | — | Toyota Auto | 0.620% | AAA | 11/17/2025 | 5.0 | — | |||||||||||||||||||||||||||||||||||||
112
| Principal | Issuer | Yield(4) | Maturity Date | Fair Value at December 31, | ||||||||||||||||
| 2017 | 2016 | 2017 | 2016 | |||||||||||||||||
| $ | — | $ | 22.0 | Fannie Mae Discount Notes | 0.416% | 2/1/2017 | $ | — | $ | 22.0 | ||||||||||
| — | 42.0 | Fannie Mae Discount Notes | 0.366% - 0.482% | 3/1/2017 | — | 42.0 | ||||||||||||||
| — | 10.0 | Fannie Mae Discount Notes | 0.427% | 3/3/2017 | — | 10.0 | ||||||||||||||
| — | 20.0 | Fannie Mae Discount Notes | 0.427% | 3/6/2017 | — | 20.0 | ||||||||||||||
| — | 20.0 | Fannie Mae Discount Notes | 0.406% | 3/13/2017 | — | 20.0 | ||||||||||||||
| — | 30.3 | Fannie Mae Discount Notes | 0.406% | 3/27/2017 | — | 30.3 | ||||||||||||||
| — | 25.0 | Fannie Mae Discount Notes | 0.406% | 3/28/2017 | — | 25.0 | ||||||||||||||
| — | 30.0 | Fannie Mae Discount Notes | 0.518% | 4/18/2017 | — | 29.9 | ||||||||||||||
| — | 24.0 | Fannie Mae Discount Notes | 0.483% - 0.579% | 4/19/2017 | — | 24.0 | ||||||||||||||
| — | 31.5 | Fannie Mae Discount Notes | 0.447% - 0.539% | 5/1/2017 | — | 31.5 | ||||||||||||||
| — | 49.9 | Fannie Mae Discount Notes | 0.518% | 5/2/2017 | — | 49.9 | ||||||||||||||
| — | 39.9 | Fannie Mae Discount Notes | 0.539% | 5/5/2017 | — | 39.9 | ||||||||||||||
| 10.0 | — | Fannie Mae Discount Notes | 1.077% | 1/9/2018 | 10.0 | — | ||||||||||||||
| 14.2 | — | Fannie Mae Discount Notes | 1.093% | 1/10/2018 | 14.2 | — | ||||||||||||||
| 40.0 | — | Fannie Mae Discount Notes | 1.115% | 1/11/2018 | 40.0 | — | ||||||||||||||
| 19.0 | — | Fannie Mae Discount Notes | 1.118% | 1/19/2018 | 19.0 | — | ||||||||||||||
| 30.0 | — | Fannie Mae Discount Notes | 1.038% | 1/22/2018 | 30.0 | — | ||||||||||||||
| 46.2 | — | Fannie Mae Discount Notes | 1.038% | 1/23/2018 | 46.1 | — | ||||||||||||||
| 35.1 | — | Fannie Mae Discount Notes | 1.038% | 1/24/2018 | 35.1 | — | ||||||||||||||
| 14.6 | — | Fannie Mae Discount Notes | 1.088% | 1/29/2018 | 14.5 | — | ||||||||||||||
| 35.1 | — | Fannie Mae Discount Notes | 1.079% | 1/30/2018 | 35.1 | — | ||||||||||||||
| 26.2 | — | Fannie Mae Discount Notes | 1.109% - 1.225% | 2/7/2018 | 26.2 | — | ||||||||||||||
| 25.0 | — | Fannie Mae Discount Notes | 1.145% | 2/16/2018 | 25.0 | — | ||||||||||||||
| 50.0 | — | Fannie Mae Discount Notes | 1.140% - 1.150% | 2/20/2018 | 49.9 | — | ||||||||||||||
| 30.2 | — | Fannie Mae Discount Notes | 1.140% | 2/21/2018 | 30.2 | — | ||||||||||||||
| 40.0 | — | Fannie Mae Discount Notes | 1.221% | 3/7/2018 | 39.9 | — | ||||||||||||||
| 40.0 | — | Fannie Mae Discount Notes | 1.221% | 3/8/2018 | 39.9 | — | ||||||||||||||
| 34.1 | — | Fannie Mae Discount Notes | 1.221% | 3/9/2018 | 34.0 | — | ||||||||||||||
| 20.0 | — | Fannie Mae Discount Notes | 1.303% | 3/13/2018 | 19.9 | — | ||||||||||||||
| 37.2 | — | Fannie Mae Discount Notes | 1.313% | 3/19/2018 | 37.0 | — | ||||||||||||||
| 15.0 | — | Fannie Mae Discount Notes | 1.303% | 3/20/2018 | 15.0 | — | ||||||||||||||
| 10.0 | — | Fannie Mae Discount Notes | 1.308% | 3/22/2018 | 10.0 | — | ||||||||||||||
| 39.3 | — | Fannie Mae Discount Notes | 1.318% | 3/29/2018 | 39.1 | — | ||||||||||||||
| 30.0 | — | Fannie Mae Discount Notes | 1.323% | 4/2/2018 | 29.9 | — | ||||||||||||||
| 35.2 | — | Fannie Mae Discount Notes | 1.313% - 1.323% | 4/3/2018 | 35.1 | — | ||||||||||||||
| 40.0 | — | Fannie Mae Discount Notes | 1.334% | 4/9/2018 | 39.9 | — | ||||||||||||||
| — | 19.9 | Farmer Mac Discount Notes | 0.682% | 6/1/2017 | — | 19.9 | ||||||||||||||
| 14.0 | — | Farmer Mac Discount Notes | 1.169% | 2/1/2018 | 14.0 | — | ||||||||||||||
| — | 15.5 | Federal Farm Credit Bank Discount Notes | 0.376% - 0.381% | 2/22/2017 | — | 15.5 | ||||||||||||||
| — | 34.7 | Federal Home Loan Bank Discount Notes | 0.304% - 0.355% | 1/3/2017 | — | 34.7 | ||||||||||||||
| — | 40.0 | Federal Home Loan Bank Discount Notes | 0.345% | 1/4/2017 | — | 40.0 | ||||||||||||||
| — | 29.2 | Federal Home Loan Bank Discount Notes | 0.355% - 0.447% | 1/6/2017 | — | 29.2 | ||||||||||||||
| — | 7.1 | Federal Home Loan Bank Discount Notes | 0.299% - 0.345% | 1/9/2017 | — | 7.1 | ||||||||||||||
| — | 25.0 | Federal Home Loan Bank Discount Notes | 0.325% | 1/10/2017 | — | 25.0 | ||||||||||||||
| — | 50.0 | Federal Home Loan Bank Discount Notes | 0.304% - 0.396% | 1/11/2017 | — | 50.0 | ||||||||||||||
| — | 33.0 | Federal Home Loan Bank Discount Notes | 0.365% - 0.396% | 1/12/2017 | — | 33.0 | ||||||||||||||
| — | 50.0 | Federal Home Loan Bank Discount Notes | 0.386% | 1/13/2017 | — | 50.0 | ||||||||||||||
| — | 36.0 | Federal Home Loan Bank Discount Notes | 0.345% | 1/17/2017 | — | 36.0 | ||||||||||||||
| — | 42.1 | Federal Home Loan Bank Discount Notes | 0.294% - 0.365% | 1/18/2017 | — | 42.1 | ||||||||||||||
| — | 20.0 | Federal Home Loan Bank Discount Notes | 0.284% | 1/20/2017 | — | 20.0 | ||||||||||||||
| — | 50.0 | Federal Home Loan Bank Discount Notes | 0.335% | 1/23/2017 | — | 50.0 | ||||||||||||||
| — | 47.0 | Federal Home Loan Bank Discount Notes | 0.345% | 1/24/2017 | — | 47.0 | ||||||||||||||
| — | 34.8 | Federal Home Loan Bank Discount Notes | 0.304% - 0.360% | 1/25/2017 | — | 34.8 | ||||||||||||||
| — | 45.0 | Federal Home Loan Bank Discount Notes | 0.294% - 0.406% | 1/27/2017 | — | 45.0 | ||||||||||||||
| — | 25.0 | Federal Home Loan Bank Discount Notes | 0.416% | 1/30/2017 | — | 25.0 | ||||||||||||||
TIAA REAL ESTATE ACCOUNT
CONSOLIDATED SCHEDULES OF INVESTMENTS
(Dollar values shown in millions)
| Principal | Issuer | Coupon Rate | Credit Rating(7) | Maturity Date | Fair Value at December 31, | |||||||||||||||||||||||||||||||||||||||
| 2021 | 2020 | 2021 | 2020 | |||||||||||||||||||||||||||||||||||||||||
| $ | 4.2 | $ | — | Toyota Auto | 0.440% | AAA | 1/15/2026 | $ | 4.2 | $ | — | |||||||||||||||||||||||||||||||||
| 3.6 | — | Trane Technologies Lux | 0.980% | BBB | 11/1/2024 | 3.6 | — | |||||||||||||||||||||||||||||||||||||
| 5.0 | — | UBS AG London | 0.730% | A+ | 8/9/2024 | 4.9 | — | |||||||||||||||||||||||||||||||||||||
| 5.0 | — | Unilever Capital Corporation | 0.640% | A+ | 8/12/2024 | 5.0 | — | |||||||||||||||||||||||||||||||||||||
| 5.0 | — | UnitedHealth Group, Inc. | 0.600% | A+ | 5/15/2024 | 5.0 | — | |||||||||||||||||||||||||||||||||||||
| 4.4 | — | Verizon Master Trust | 0.870% | AAA | 5/20/2027 | 4.5 | — | |||||||||||||||||||||||||||||||||||||
| 5.3 | — | Verizon Communications | 1.040% | BBB+ | 11/1/2024 | 5.3 | — | |||||||||||||||||||||||||||||||||||||
| 3.8 | — | Verizon Master Trust | 1.010% | AAA | 4/20/2028 | 3.8 | — | |||||||||||||||||||||||||||||||||||||
| 6.5 | — | Volkswagen Auto Loan Enhanced | 1.030% | AAA | 6/22/2026 | 6.5 | — | |||||||||||||||||||||||||||||||||||||
| 11.5 | — | Volkswagen Group America | 0.958%-1.046% | BBB+ | 9/26/2024 | 11.3 | — | |||||||||||||||||||||||||||||||||||||
| 3.0 | — | Volkswagen Group America | 0.700% | BBB+ | 11/22/2023 | 3.0 | — | |||||||||||||||||||||||||||||||||||||
| 5.0 | — | Wec Energy Group, Inc. | 0.790% | BBB+ | 3/15/2024 | 4.9 | — | |||||||||||||||||||||||||||||||||||||
| 2.5 | — | World Omni Auto | 0.430% | AAA | 6/15/2026 | 2.5 | — | |||||||||||||||||||||||||||||||||||||
| 3.0 | — | World Omni Auto | 0.450% | AAA | 8/17/2026 | 3.0 | — | |||||||||||||||||||||||||||||||||||||
| 5.0 | — | World Omni Automobile | 0.430% | AAA | 8/15/2024 | 5.0 | — | |||||||||||||||||||||||||||||||||||||
| 2.9 | — | World Omni Auto Receivables Trust | 0.830% | AAA | 10/15/2026 | 2.9 | — | |||||||||||||||||||||||||||||||||||||
TOTAL CORPORATE BOND SECURITIES (Cost $556.5 and $0.0) | $ | 551.8 | $ | — | ||||||||||||||||||||||||||||||||||||||||
LOANS RECEIVABLE—5.1% and 6.4%
| Principal | Maturity Date | Fair Value at December 31, | ||||||||||||||||||||||||||||||||||||||||||
| 2021 | 2020 | Borrower | Property Type | Interest Rate(6) | 2021 | 2020 | ||||||||||||||||||||||||||||||||||||||
| $ | 54.7 | $ | 54.3 | SCG Oakland Portfolio | Office | 4.25% + LIBOR | 3/1/2022 | $ | 54.4 | $ | 54.3 | |||||||||||||||||||||||||||||||||
| 92.9 | 89.7 | 311 South Wacker Mezzanine | Office | 4.70% + LIBOR | 6/7/2022 | 92.2 | 86.5 | |||||||||||||||||||||||||||||||||||||
| 60.0 | 60.0 | River North Point Junior Mezzanine | Office | 4.30% + LIBOR | 7/9/2021 | 60.0 | 59.2 | |||||||||||||||||||||||||||||||||||||
| 41.7 | 68.6 | Blackstone RioCan Retail Portfolio Mezzanine | Retail | 4.65% + LIBOR | 6/9/2022 | 40.6 | 66.5 | |||||||||||||||||||||||||||||||||||||
| 60.0 | 60.0 | SoNo Collection Mezzanine | Retail | 6.75% + LIBOR | 8/6/2021 | 60.0 | 60.0 | |||||||||||||||||||||||||||||||||||||
| 98.7 | 124.7 | Project Glacier Mezzanine | Industrial | 4.40% + LIBOR | 10/9/2022 | 98.7 | 124.7 | |||||||||||||||||||||||||||||||||||||
| 17.1 | 16.7 | Liberty Park Mezzanine | Office | 6.080% | 11/9/2021 | 17.0 | 16.6 | |||||||||||||||||||||||||||||||||||||
| — | 125.0 | State Street Financial Center Mezzanine | Office | 6.500% | 11/10/2021 | — | 122.0 | |||||||||||||||||||||||||||||||||||||
| — | 20.0 | Modera Observatory Park Mezzanine | Apartments | 4.34% + LIBOR | 6/10/2022 | — | 19.7 | |||||||||||||||||||||||||||||||||||||
| 68.6 | 68.3 | San Diego Office Portfolio Mezzanine & Senior Loan | Office | 2.45% + LIBOR | 8/9/2022 | 68.6 | 67.7 | |||||||||||||||||||||||||||||||||||||
| — | 20.8 | Rosemont Towson Mezzanine | Apartments | 4.15% + LIBOR | 9/9/2022 | — | 20.7 | |||||||||||||||||||||||||||||||||||||
| 125.3 | 135.2 | Colony New England Hotel Portfolio Mezzanine & Senior Loan | Hotel | 2.80% + LIBOR | 11/9/2022 | 125.3 | 129.9 | |||||||||||||||||||||||||||||||||||||
| 33.9 | 135.5 | Exo Apartments Mezzanine | Apartments | 2.30% + LIBOR | 1/9/2023 | 33.9 | 134.9 | |||||||||||||||||||||||||||||||||||||
| 14.1 | 13.4 | Five Oak Mezzanine | Office | 2.35% + LIBOR | 4/9/2023 | 14.1 | 13.4 | |||||||||||||||||||||||||||||||||||||
| 30.6 | 30.6 | 1330 Broadway Mezzanine | Office | 5.01% + LIBOR | 8/10/2023 | 30.6 | 30.2 | |||||||||||||||||||||||||||||||||||||
| — | 82.0 | Great Value Storage Portfolio Mezzanine | Storage | 7.875% | 12/6/2023 | — | 73.8 | |||||||||||||||||||||||||||||||||||||
| 85.0 | 85.0 | Park Avenue Tower Mezzanine | Office | 4.35% + LIBOR | 3/9/2024 | 84.1 | 85.0 | |||||||||||||||||||||||||||||||||||||
113
| Principal | Issuer | Yield(4) | Maturity Date | Fair Value at December 31, | ||||||||||||||||
| 2017 | 2016 | 2017 | 2016 | |||||||||||||||||
| $ | — | $ | 34.7 | Federal Home Loan Bank Discount Notes | 0.467% - 0.497% | 2/1/2017 | $ | — | $ | 34.7 | ||||||||||
| — | 42.0 | Federal Home Loan Bank Discount Notes | 0.406% | 2/3/2017 | — | 42.0 | ||||||||||||||
| — | 15.0 | Federal Home Loan Bank Discount Notes | 0.416% | 2/7/2017 | — | 15.0 | ||||||||||||||
| — | 10.2 | Federal Home Loan Bank Discount Notes | 0.376% | 2/10/2017 | — | 10.2 | ||||||||||||||
| — | 50.0 | Federal Home Loan Bank Discount Notes | 0.386% - 0.487% | 2/17/2017 | — | 50.0 | ||||||||||||||
| — | 30.0 | Federal Home Loan Bank Discount Notes | 0.365% | 2/21/2017 | — | 30.0 | ||||||||||||||
| — | 30.0 | Federal Home Loan Bank Discount Notes | 0.437% | 2/22/2017 | — | 30.0 | ||||||||||||||
| — | 50.0 | Federal Home Loan Bank Discount Notes | 0.396% | 2/24/2017 | — | 50.0 | ||||||||||||||
| — | 20.0 | Federal Home Loan Bank Discount Notes | 0.533% | 2/27/2017 | — | 20.0 | ||||||||||||||
| — | 10.1 | Federal Home Loan Bank Discount Notes | 0.518% | 3/3/2017 | — | 10.1 | ||||||||||||||
| — | 15.0 | Federal Home Loan Bank Discount Notes | 0.523% | 3/6/2017 | — | 15.0 | ||||||||||||||
| — | 30.0 | Federal Home Loan Bank Discount Notes | 0.538% | 3/8/2017 | — | 30.0 | ||||||||||||||
| — | 45.8 | Federal Home Loan Bank Discount Notes | 0.447% - 0.574% | 3/10/2017 | — | 45.8 | ||||||||||||||
| — | 20.0 | Federal Home Loan Bank Discount Notes | 0.543% | 3/14/2017 | — | 20.0 | ||||||||||||||
| — | 40.5 | Federal Home Loan Bank Discount Notes | 0.528% - 0.579% | 3/17/2017 | — | 40.5 | ||||||||||||||
| — | 49.9 | Federal Home Loan Bank Discount Notes | 0.538% | 3/20/2017 | — | 49.9 | ||||||||||||||
| — | 36.1 | Federal Home Loan Bank Discount Notes | 0.533% | 3/22/2017 | — | 36.1 | ||||||||||||||
| — | 28.0 | Federal Home Loan Bank Discount Notes | 0.427% - 0.518% | 3/23/2017 | — | 28.0 | ||||||||||||||
| — | 40.0 | Federal Home Loan Bank Discount Notes | 0.528% | 3/24/2017 | — | 40.0 | ||||||||||||||
| — | 25.0 | Federal Home Loan Bank Discount Notes | 0.548% | 3/28/2017 | — | 25.0 | ||||||||||||||
| — | 31.0 | Federal Home Loan Bank Discount Notes | 0.558% | 3/29/2017 | — | 31.0 | ||||||||||||||
| — | 6.4 | Federal Home Loan Bank Discount Notes | 0.477% | 3/31/2017 | — | 6.4 | ||||||||||||||
| — | 49.9 | Federal Home Loan Bank Discount Notes | 0.559% | 4/17/2017 | — | 49.9 | ||||||||||||||
| — | 26.0 | Federal Home Loan Bank Discount Notes | 0.548% - 0.605% | 4/19/2017 | — | 26.0 | ||||||||||||||
| — | 20.1 | Federal Home Loan Bank Discount Notes | 0.488% | 4/28/2017 | — | 20.1 | ||||||||||||||
| — | 25.0 | Federal Home Loan Bank Discount Notes | 0.538% - 0.600% | 5/5/2017 | — | 25.0 | ||||||||||||||
| — | 37.2 | Federal Home Loan Bank Discount Notes | 0.558% - 0.641% | 5/12/2017 | — | 37.2 | ||||||||||||||
| 20.2 | — | Federal Home Loan Bank Discount Notes | 1.069% | 1/2/2018 | 20.2 | — | ||||||||||||||
| 40.0 | — | Federal Home Loan Bank Discount Notes | 1.079% | 1/3/2018 | 40.0 | — | ||||||||||||||
| 40.0 | — | Federal Home Loan Bank Discount Notes | 1.068% | 1/5/2018 | 40.0 | — | ||||||||||||||
| 40.0 | — | Federal Home Loan Bank Discount Notes | 1.068% | 1/8/2018 | 40.0 | — | ||||||||||||||
| 33.0 | — | Federal Home Loan Bank Discount Notes | 1.058% | 1/9/2018 | 33.0 | — | ||||||||||||||
| 50.0 | — | Federal Home Loan Bank Discount Notes | 1.068% - 1.118% | 1/10/2018 | 50.0 | — | ||||||||||||||
| 30.0 | — | Federal Home Loan Bank Discount Notes | 1.089% - 1.108% | 1/12/2018 | 30.0 | — | ||||||||||||||
| 38.1 | — | Federal Home Loan Bank Discount Notes | 1.068% | 1/16/2018 | 38.1 | — | ||||||||||||||
| 50.0 | — | Federal Home Loan Bank Discount Notes | 1.094% - 1.118% | 1/17/2018 | 50.0 | — | ||||||||||||||
| 30.2 | — | Federal Home Loan Bank Discount Notes | 1.063% | 1/19/2018 | 30.1 | — | ||||||||||||||
| 20.0 | — | Federal Home Loan Bank Discount Notes | 1.134% | 1/22/2018 | 20.0 | — | ||||||||||||||
| 38.0 | — | Federal Home Loan Bank Discount Notes | 1.063% | 1/25/2018 | 37.9 | — | ||||||||||||||
| 36.1 | — | Federal Home Loan Bank Discount Notes | 1.063% | 1/26/2018 | 36.1 | — | ||||||||||||||
| 29.2 | — | Federal Home Loan Bank Discount Notes | 1.069% - 1.290% | 1/29/2018 | 29.1 | — | ||||||||||||||
| 24.3 | — | Federal Home Loan Bank Discount Notes | 1.225% | 2/6/2018 | 24.2 | — | ||||||||||||||
| 47.1 | — | Federal Home Loan Bank Discount Notes | 1.069% - 1.220% | 2/9/2018 | 47.1 | — | ||||||||||||||
| 11.8 | — | Federal Home Loan Bank Discount Notes | 1.140% | 2/14/2018 | 11.8 | — | ||||||||||||||
| 25.0 | — | Federal Home Loan Bank Discount Notes | 1.130% | 2/16/2018 | 25.0 | — | ||||||||||||||
| 10.0 | — | Federal Home Loan Bank Discount Notes | 1.306% | 2/21/2018 | 10.0 | — | ||||||||||||||
| 40.0 | — | Federal Home Loan Bank Discount Notes | 1.120% | 2/26/2018 | 39.9 | — | ||||||||||||||
| 39.4 | — | Federal Home Loan Bank Discount Notes | 1.120% - 1.186% | 2/27/2018 | 39.3 | — | ||||||||||||||
| 22.2 | — | Federal Home Loan Bank Discount Notes | 1.161% - 1.232% | 3/2/2018 | 22.1 | — | ||||||||||||||
| 45.0 | — | Federal Home Loan Bank Discount Notes | 1.212% - 1.313% | 3/12/2018 | 44.9 | — | ||||||||||||||
| 28.0 | — | Federal Home Loan Bank Discount Notes | 1.176% | 3/13/2018 | 27.9 | — | ||||||||||||||
| 5.0 | — | Federal Home Loan Bank Discount Notes | 1.318% | 3/16/2018 | 5.0 | — | ||||||||||||||
| 40.0 | — | Federal Home Loan Bank Discount Notes | 1.304% | 3/27/2018 | 39.9 | — | ||||||||||||||
| 47.4 | — | Federal Home Loan Bank Discount Notes | 1.304% | 3/28/2018 | 47.2 | — | ||||||||||||||
| 40.2 | — | Federal Home Loan Bank Discount Notes | 1.324% | 4/11/2018 | 40.0 | — | ||||||||||||||
| 15.2 | — | Federal Home Loan Bank Discount Notes | 1.359% | 4/12/2018 | 15.2 | — | ||||||||||||||
| 29.1 | — | Federal Home Loan Bank Discount Notes | 1.354% | 4/16/2018 | 29.0 | — | ||||||||||||||
| 39.2 | — | Federal Home Loan Bank Discount Notes | 1.365% | 4/19/2018 | 39.0 | — | ||||||||||||||
TIAA REAL ESTATE ACCOUNT
CONSOLIDATED SCHEDULES OF INVESTMENTS
(Dollar values shown in millions)
| Principal | Maturity Date | Fair Value at December 31, | ||||||||||||||||||||||||||||||||||||||||||
| 2021 | 2020 | Borrower | Property Type | Interest Rate(6) | 2021 | 2020 | ||||||||||||||||||||||||||||||||||||||
| $ | 62.6 | $ | 69.6 | BREP VIII Industrial Loan Facility Mezzanine | Industrial | 5.00% + LIBOR | 3/9/2026 | $ | 62.6 | $ | 69.6 | |||||||||||||||||||||||||||||||||
| 20.0 | 20.0 | Aspen Lake Office Portfolio Mezzanine | Office | 8.250% | 3/10/2028 | 20.0 | 20.0 | |||||||||||||||||||||||||||||||||||||
| 95.0 | 95.0 | Merritt on the River Office Portfolio Mezzanine | Office | 8.000% | 8/1/2028 | 87.9 | 87.0 | |||||||||||||||||||||||||||||||||||||
| 100.0 | 100.0 | Charles River Plaza North Mezzanine | Office | 6.080% | 4/6/2029 | 100.0 | 100.0 | |||||||||||||||||||||||||||||||||||||
| 53.0 | 53.0 | Sol y Luna Mezzanine | Apartments | 6.550% | 1/6/2030 | 51.6 | 51.5 | |||||||||||||||||||||||||||||||||||||
| 45.7 | — | 5 Points Towers | Apartments | 5.50% + LIBOR | 3/9/2024 | 45.7 | — | |||||||||||||||||||||||||||||||||||||
| 53.0 | — | The Stratum | Office | 3.15% + LIBOR | 5/9/2024 | 53.0 | — | |||||||||||||||||||||||||||||||||||||
| 66.9 | — | Spring House Innovation Park | Office | 3.15% + LIBOR | 7/9/2024 | 66.9 | — | |||||||||||||||||||||||||||||||||||||
| 88.0 | — | Reserve at Chino Hills | Apartments | 2.40% + LIBOR | 8/9/2025 | 88.0 | — | |||||||||||||||||||||||||||||||||||||
| 67.5 | — | Sixth & Main | Office | 3.85% + LIBOR | 11/9/2025 | 67.5 | — | |||||||||||||||||||||||||||||||||||||
TOTAL LOANS RECEIVABLE (Cost $1,434.3 and $1,527.6) | $ | 1,422.7 | $ | 1,493.2 | ||||||||||||||||||||||||||||||||||||||||
| Principal | Issuer | Yield(4) | Maturity Date | Fair Value at December 31, | ||||||||||||||||
| 2017 | 2016 | 2017 | 2016 | |||||||||||||||||
| $ | 40.2 | $ | — | Federal Home Loan Bank Discount Notes | 1.365% | 4/20/2018 | $ | 40.0 | $ | — | ||||||||||
| 33.2 | — | Federal Home Loan Bank Discount Notes | 1.365% | 4/23/2018 | 33.0 | — | ||||||||||||||
| 34.2 | — | Federal Home Loan Bank Discount Notes | 1.375% | 4/24/2018 | 34.1 | — | ||||||||||||||
| 15.2 | — | Federal Home Loan Bank Discount Notes | 1.371% | 4/25/2018 | 15.2 | — | ||||||||||||||
| 28.4 | — | Federal Home Loan Bank Discount Notes | 1.403% | 5/4/2018 | 28.2 | — | ||||||||||||||
| — | 16.1 | Freddie Mac Discount Notes | 0.345% | 1/9/2017 | — | 16.1 | ||||||||||||||
| — | 25.0 | Freddie Mac Discount Notes | 0.335% | 1/10/2017 | — | 25.0 | ||||||||||||||
| — | 30.0 | Freddie Mac Discount Notes | 0.391% | 1/20/2017 | — | 30.0 | ||||||||||||||
| — | 13.1 | Freddie Mac Discount Notes | 0.426% | 1/30/2017 | — | 13.1 | ||||||||||||||
| — | 40.0 | Freddie Mac Discount Notes | 0.447% | 2/6/2017 | — | 40.0 | ||||||||||||||
| — | 36.9 | Freddie Mac Discount Notes | 0.436% - 0.457% | 2/7/2017 | — | 36.9 | ||||||||||||||
| — | 44.2 | Freddie Mac Discount Notes | 0.360% | 2/8/2017 | — | 44.2 | ||||||||||||||
| — | 25.0 | Freddie Mac Discount Notes | 0.360% | 2/10/2017 | — | 25.0 | ||||||||||||||
| — | 40.0 | Freddie Mac Discount Notes | 0.365% | 2/13/2017 | — | 40.0 | ||||||||||||||
| — | 30.0 | Freddie Mac Discount Notes | 0.376% | 2/14/2017 | — | 30.0 | ||||||||||||||
| — | 20.0 | Freddie Mac Discount Notes | 0.467% | 2/21/2017 | — | 20.0 | ||||||||||||||
| — | 27.0 | Freddie Mac Discount Notes | 0.386% | 2/27/2017 | — | 27.0 | ||||||||||||||
| — | 15.0 | Freddie Mac Discount Notes | 0.401% | 3/3/2017 | — | 15.0 | ||||||||||||||
| — | 35.2 | Freddie Mac Discount Notes | 0.406% | 3/7/2017 | — | 35.2 | ||||||||||||||
| — | 14.0 | Freddie Mac Discount Notes | 0.411% | 3/14/2017 | — | 14.0 | ||||||||||||||
| — | 50.0 | Freddie Mac Discount Notes | 0.427% | 3/21/2017 | — | 49.9 | ||||||||||||||
| — | 18.0 | Freddie Mac Discount Notes | 0.600% | 4/21/2017 | — | 18.0 | ||||||||||||||
| — | 39.9 | Freddie Mac Discount Notes | 0.457% | 5/3/2017 | — | 39.9 | ||||||||||||||
| — | 22.9 | Freddie Mac Discount Notes | 0.483% | 5/4/2017 | — | 22.9 | ||||||||||||||
| 41.2 | — | Freddie Mac Discount Notes | 1.101% - 1.149% | 2/2/2018 | 41.2 | — | ||||||||||||||
| 50.0 | — | Freddie Mac Discount Notes | 1.101% - 1.139% | 2/5/2018 | 49.9 | — | ||||||||||||||
| 25.0 | — | Freddie Mac Discount Notes | 1.090% | 2/6/2018 | 25.0 | — | ||||||||||||||
| 20.1 | — | Freddie Mac Discount Notes | 1.100% | 2/7/2018 | 20.0 | — | ||||||||||||||
| 42.2 | — | Freddie Mac Discount Notes | 1.099% | 2/12/2018 | 42.1 | — | ||||||||||||||
| 40.0 | — | Freddie Mac Discount Notes | 1.099% | 2/13/2018 | 39.9 | — | ||||||||||||||
| 30.0 | — | Freddie Mac Discount Notes | 1.109% | 2/14/2018 | 30.0 | — | ||||||||||||||
| 39.5 | — | Freddie Mac Discount Notes | 1.120% - 1.130% | 2/23/2018 | 39.4 | — | ||||||||||||||
| 50.0 | — | Freddie Mac Discount Notes | 1.151% | 3/5/2018 | 49.9 | — | ||||||||||||||
| 50.0 | — | Freddie Mac Discount Notes | 1.151% | 3/6/2018 | 49.9 | — | ||||||||||||||
| 49.8 | — | Freddie Mac Discount Notes | 1.182% - 1.202% | 3/14/2018 | 49.6 | — | ||||||||||||||
| 34.2 | — | Freddie Mac Discount Notes | 1.182% | 3/16/2018 | 34.1 | — | ||||||||||||||
| 10.8 | — | Freddie Mac Discount Notes | 1.192% | 3/19/2018 | 10.7 | — | ||||||||||||||
| 32.8 | — | Freddie Mac Discount Notes | 1.202% | 3/20/2018 | 32.7 | — | ||||||||||||||
| 40.0 | — | Freddie Mac Discount Notes | 1.202% | 3/21/2018 | 39.9 | — | ||||||||||||||
| 30.0 | — | Freddie Mac Discount Notes | 1.182% | 3/22/2018 | 29.9 | — | ||||||||||||||
| 40.0 | — | Freddie Mac Discount Notes | 1.212% | 3/23/2018 | 39.9 | — | ||||||||||||||
| 40.0 | — | Freddie Mac Discount Notes | 1.223% | 3/26/2018 | 39.9 | — | ||||||||||||||
| 24.1 | — | Freddie Mac Discount Notes | 1.228% | 4/4/2018 | 24.0 | — | ||||||||||||||
| 57.7 | — | Freddie Mac Discount Notes | 1.228% - 1.269% | 4/5/2018 | 57.5 | — | ||||||||||||||
| 35.2 | — | Freddie Mac Discount Notes | 1.289% | 4/6/2018 | 35.0 | — | ||||||||||||||
| 34.9 | — | Freddie Mac Discount Notes | 1.325% - 1.330% | 4/10/2018 | 34.7 | — | ||||||||||||||
| 40.0 | — | Freddie Mac Discount Notes | 1.325% | 4/11/2018 | 39.8 | — | ||||||||||||||
| 27.2 | — | Freddie Mac Discount Notes | 1.324% | 4/12/2018 | 27.0 | — | ||||||||||||||
| 40.0 | — | Freddie Mac Discount Notes | 1.334% | 4/13/2018 | 39.8 | — | ||||||||||||||
| 30.1 | — | Freddie Mac Discount Notes | 1.365% | 4/17/2018 | 30.0 | — | ||||||||||||||
| 35.2 | — | Freddie Mac Discount Notes | 1.365% | 4/18/2018 | 35.0 | — | ||||||||||||||
| 4.0 | — | Freddie Mac Discount Notes | 1.366% | 5/4/2018 | 4.0 | — | ||||||||||||||
TOTAL GOVERNMENT AGENCY NOTES (Cost $2,872.8 and $2,309.0) | $ | 2,872.3 | $ | 2,308.9 | ||||||||||||||||
| Principal | Issuer | Yield(4) | Maturity Date | Fair Value at December 31, | |||||||||||||||||
| 2017 | 2016 | 2017 | 2016 | ||||||||||||||||||
| $ | — | $ | 35.9 | United States Treasury Bills | 0.345% - 0.369% | 1/5/2017 | $ | — | $ | 35.9 | |||||||||||
| — | 47.9 | United States Treasury Bills | 0.423% - 0.428% | 1/19/2017 | — | 48.0 | |||||||||||||||
| — | 36.1 | United States Treasury Bills | 0.371% - 0.401% | 1/26/2017 | — | 36.1 | |||||||||||||||
| — | 60.1 | United States Treasury Bills | 0.363% - 0.423% | 2/2/2017 | — | 60.1 | |||||||||||||||
| — | 75.0 | United States Treasury Bills | 0.315% - 0.426% | 2/9/2017 | — | 75.0 | |||||||||||||||
| — | 48.0 | United States Treasury Bills | 0.325% - 0.437% | 2/16/2017 | — | 48.0 | |||||||||||||||
| — | 48.0 | United States Treasury Bills | 0.448% - 0.473% | 2/23/2017 | — | 48.0 | |||||||||||||||
| — | 36.0 | United States Treasury Bills | 0.368% - 0.477% | 3/2/2017 | — | 36.0 | |||||||||||||||
| — | 48.7 | United States Treasury Bills | 0.386% - 0.518% | 3/9/2017 | — | 48.7 | |||||||||||||||
| — | 59.9 | United States Treasury Bills | 0.406% - 0.481% | 3/16/2017 | — | 60.0 | |||||||||||||||
| — | 129.0 | United States Treasury Bills | 0.380% - 0.533% | 3/23/2017 | — | 129.0 | |||||||||||||||
| — | 25.9 | United States Treasury Bills | 0.396% - 0.518% | 3/30/2017 | — | 25.9 | |||||||||||||||
| — | 58.9 | United States Treasury Bills | 0.411% - 0.509% | 4/6/2017 | — | 58.9 | |||||||||||||||
| — | 130.8 | United States Treasury Bills | 0.518% - 0.529% | 4/13/2017 | — | 130.8 | |||||||||||||||
| — | 49.9 | United States Treasury Bills | 0.514% - 0.559% | 4/20/2017 | — | 49.9 | |||||||||||||||
| — | 48.2 | United States Treasury Bills | 0.554% - 0.781% | 4/27/2017 | — | 48.2 | |||||||||||||||
| — | 49.9 | United States Treasury Bills | 0.514% | 5/4/2017 | — | 49.9 | |||||||||||||||
| — | 42.0 | United States Treasury Bills | 0.601% - 0.623% | 5/11/2017 | — | 42.0 | |||||||||||||||
| — | 30.1 | United States Treasury Bills | 0.584% - 0.620% | 5/18/2017 | — | 30.1 | |||||||||||||||
| — | 32.0 | United States Treasury Bills | 0.587% | 6/8/2017 | — | 32.0 | |||||||||||||||
| — | 74.8 | United States Treasury Bills | 0.541% - 0.654% | 7/20/2017 | — | 74.7 | |||||||||||||||
| — | 86.7 | United States Treasury Bills | 0.574% - 0.591% | 8/17/2017 | — | 86.6 | |||||||||||||||
| — | 34.8 | United States Treasury Bills | 0.696% - 0.934% | 9/14/2017 | — | 34.8 | |||||||||||||||
| 17.8 | — | United States Treasury Bills | 1.036% - 1.177% | 1/2/2018 | 17.8 | — | |||||||||||||||
| 75.0 | — | United States Treasury Bills | 1.063% - 1.084% | 1/4/2018 | 75.0 | — | |||||||||||||||
| 21.2 | — | United States Treasury Bills | 1.128% - 1.236% | 1/11/2018 | 21.2 | — | |||||||||||||||
| 40.0 | — | United States Treasury Bills | 1.114% | 1/18/2018 | 40.0 | — | |||||||||||||||
| 71.0 | — | United States Treasury Bills | 1.132% | 1/25/2018 | 70.9 | — | |||||||||||||||
| 36.0 | — | United States Treasury Bills | 1.106% | 2/1/2018 | 36.0 | — | |||||||||||||||
| 93.0 | — | United States Treasury Bills | 1.075% - 1.077% | 2/8/2018 | 92.9 | — | |||||||||||||||
| 98.0 | — | United States Treasury Bills | 1.106% - 1.122% | 2/22/2018 | 97.8 | — | |||||||||||||||
| 81.0 | — | United States Treasury Bills | 1.060% - 1.117% | 3/1/2018 | 80.8 | — | |||||||||||||||
| 154.0 | — | United States Treasury Bills | 1.374% - 1.433% | 3/29/2018 | 153.5 | — | |||||||||||||||
| 24.0 | — | United States Treasury Bills | 1.440% | 5/24/2018 | 23.9 | — | |||||||||||||||
| 85.0 | — | United States Treasury Bills | 1.432% | 6/7/2018 | 84.5 | — | |||||||||||||||
| — | 69.9 | United States Treasury Notes | 0.431% - 0.451% | 1/31/2017 | — | 69.9 | |||||||||||||||
| — | 46.9 | United States Treasury Notes | 0.441% - 0.471% | 2/15/2017 | — | 47.0 | |||||||||||||||
| — | 49.7 | United States Treasury Notes | 0.502% | 2/28/2017 | — | 49.7 | |||||||||||||||
| — | 50.0 | United States Treasury Notes | 0.542% | 3/15/2017 | — | 50.0 | |||||||||||||||
| — | 50.0 | United States Treasury Notes | 0.515% | 3/31/2017 | — | 50.0 | |||||||||||||||
| — | 69.6 | United States Treasury Notes | 0.550% - 0.621% | 5/31/2017 | — | 69.6 | |||||||||||||||
| — | 40.1 | United States Treasury Notes | 0.580% | 6/15/2017 | — | 40.1 | |||||||||||||||
| — | 50.0 | United States Treasury Notes | 0.586% | 6/30/2017 | — | 50.0 | |||||||||||||||
| — | 30.0 | United States Treasury Notes | 0.668% - 0.710% | 7/31/2017 | — | 30.0 | |||||||||||||||
| 50.0 | — | United States Treasury Notes | 1.148% - 1.180% | 1/31/2018 | 50.0 | — | |||||||||||||||
| 40.0 | — | United States Treasury Notes | 1.175% - 1.184% | 2/15/2018 | 40.0 | — | |||||||||||||||
| 48.0 | — | United States Treasury Notes | 1.200% | 2/28/2018 | 47.9 | — | |||||||||||||||
| 40.0 | — | United States Treasury Notes | 1.179% | 3/15/2018 | 40.0 | — | |||||||||||||||
| 43.1 | — | United States Treasury Notes | 1.333% - 1.378% | 6/15/2018 | 43.0 | — | |||||||||||||||
TOTAL UNITED STATES TREASURY SECURITIES (Cost $1,015.3 and $1,745.0) | $ | 1,015.2 | $ | 1,744.9 | |||||||||||||||||
TOTAL OTHER MARKETABLE SECURITIES (Cost $3,888.1 and $4,054.0) | $ | 3,887.5 | $ | 4,053.8 | |||||||||||||||||
TOTAL MARKETABLE SECURITIES (Cost $4,879.1 and $4,937.9) | $ | 5,125.5 | $ | 5,135.3 | |||||||||||||||||
LOANS RECEIVABLE—1.1%RECEIVABLE WITH RELATED PARTIES—0.2% and 1.1%0.3%
| Principal | Maturity Date | Fair Value at December 31, | ||||||||||||||||||||||||||||||||||||||||||
| 2021 | 2020 | Borrower | Property Type | Interest Rate(6) | 2021 | 2020 | ||||||||||||||||||||||||||||||||||||||
| $ | 36.5 | $ | 36.5 | MRA Hub 34 Holding, LLC | Office | 2.50% + LIBOR | 9/1/2022 | $ | 36.5 | $ | 36.5 | |||||||||||||||||||||||||||||||||
| 0.5 | — | MRA 34 LLC | Office | 3.75 + LIBOR | 8/26/2022 | 0.5 | — | |||||||||||||||||||||||||||||||||||||
| 32.8 | 32.8 | THP Student Housing, LLC | Apartments | 3.200% | 9/1/2024 | 32.9 | 32.9 | |||||||||||||||||||||||||||||||||||||
TOTAL LOANS RECEIVABLE WITH RELATED PARTIES (Cost $69.8 and $69.3) | $ | 69.9 | $ | 69.4 | ||||||||||||||||||||||||||||||||||||||||
TOTAL INVESTMENTS (Cost $24,326.7 and $21,967.9) | $ | 30,918.0 | $ | 25,550.7 | ||||||||||||||||||||||||||||||||||||||||
| Maturity Date | Fair Value at December 31, | ||||||||||||||||
| Borrower | Interest Rate(7) | 2017 | 2016 | ||||||||||||||
DJM Capital Partners(8) | 4.200% | 7/1/2018 | $ | 34.2 | $ | 32.3 | |||||||||||
| Simply Self Storage Portfolio | 8.250% | 9/6/2021 | 37.6 | 37.6 | |||||||||||||
| State Street Financial Center Junior Mezz | 6.500% | 11/10/2021 | 125.1 | 125.2 | |||||||||||||
| Charles River Plaza North | 6.080% | 4/6/2029 | 101.9 | 100.6 | |||||||||||||
| TOTAL LOANS RECEIVABLE (Cost $296.7 and $294.8) | $ | 298.8 | $ | 295.7 | |||||||||||||
| TOTAL INVESTMENTS (Cost $22,823.6 and $22,581.2) | $ | 27,170.0 | $ | 26,643.7 | |||||||||||||
(1)The investment has a loan payable outstanding, as indicated in Note 9 - Loans Payable.
(2)The fair value reflects the Account’s interest in the joint venture and is net of debt.
(5)A portion of Trusteesthis investment consists of Teachers Insuranceland currently under development.
(6)Fixed interest rate loans are represented with a single rate. Variable interest rate loans are presented with their base spread and Annuity Associationthe corresponding index rate. All variable interest loans currently held by the Account use the one month LIBOR rate on U.S. dollar deposits as the index rate, as published by ICE Benchmark Administration Limited.
(7)Credit ratings are sourced from Standard & Poor's ("S&P"), Moody's or Fitch. Ratings are presented using the S&P rating tier definition. (NR designation represents "Not Rated").
(8)Property previously held within Colony Industrial Portfolio.
(9)On November 19, 2020, the Account sold 7% of America and Participants of TIAA Real Estate Accountits ownership in Birkdale Village, retaining a 93% ownership in TREA NAP Birkdale Village LLC, a joint venture with North American Properties.
114
ADDITIONAL INFORMATION
ITEM 9. CHANGES IN AND DISAGREEMENTS WITH ACCOUNTANTS ON ACCOUNTING AND FINANCIAL DISCLOSURE.
Not applicable.
ITEM 9A. CONTROLS AND PROCEDURES.
(a) The registrant maintains a system of disclosure controls and procedures that are designed to provide reasonable assurance that information required to be disclosed in the registrant’s reports under the Securities Exchange Act of 1934, as amended (the “Exchange Act”), is recorded, processed, summarized and reported within the time periods specified in the SEC’s rules and forms, and that such information is accumulated and communicated to management, including the registrant’s Principal Executive Officer (“PEO”) and the Principal Financial Officer (“PFO”), as appropriate, to allow timely decisions regarding required disclosure.
Under the supervision and participation of the registrant’s management, including the registrant’s PEO and PFO, the registrant conducted an evaluation (as required under Rules 13a-15(b) and 15d-15(b) under the Exchange Act, under the supervision and with the participation of our PEO and PFO, of the effectiveness of our disclosure controls and procedures (as defined in Rules 13a-15(e) and 15d-15(e) under the Exchange Act). Based upon management’s review, the PEO and the PFO concluded with reasonable assurance that the registrant’s disclosure controls and procedures were effective as of December 31, 2017.2021.
(b) Management’s Report on Internal Control over Financial Reporting. Management is responsible for establishing and maintaining adequate internal control over financial reporting. Internal control over financial reporting, as defined in Exchange Act Rules 13a-15(f) and 15d-15(f), is a process designed by, or under the supervision of the Account’s PEO and PFO to provide reasonable assurance regarding the reliability of financial reporting and the preparation of the Account’s Consolidated Financial Statements for external purposes in accordance with U.S. generally accepted accounting principles.
Because of its inherent limitations, internal control over financial reporting may not prevent or detect misstatements. Also, projections of any evaluation of effectiveness to future periods are subject to the risk that controls may become inadequate because of changes in conditions, or that the degree of compliance with the policies or procedures may deteriorate.
Management has made a comprehensive review, evaluation, and assessment of the Account’s internal control over financial reporting as of December 31, 2017.2021. In making its assessment of internal control over financial reporting, management used the criteria issued by the Committee of Sponsoring Organizations of the Treadway Commission in Internal Control-Integrated Framework (2013 Framework). Based on this assessment, management has concluded that as of December 31, 2017,2021, the Account’s internal control over financial reporting was effective to provide reasonable assurance regarding the reliability of financial reporting and the preparation of consolidated financial statements for external purposes in accordance with U.S. generally accepted accounting principles.
This annual report does not include an attestation report of the registrant’s independent registered public accounting firm regarding internal control over financial reporting. Management’s report was not subject to attestation by the Registrant’s independent registered public accounting firm pursuant to the rules of the U.S. Securities and Exchange Commission that permit the company to provide only management’s report in this annual report.
(c) Changes in internal control over financial reporting. There have been no changes in the registrant’s internal control over financial reporting that occurred during the registrant’s last fiscal quarter that materially affected, or are reasonably likely to materially affect, the registrant’s internal control over financial reporting.
ITEM 9B. OTHER INFORMATION
Not applicable.
ITEM 9C. DISCLOSURE REGARDING FOREIGN JURISDICTION THAT PREVENTS INSPECTION
Not applicable.
115
PART III
ITEMS 10 AND 11. DIRECTORS, EXECUTIVE OFFICERS, AND CORPORATE GOVERNANCE OF THE REGISTRANT; EXECUTIVE COMPENSATION.
The TIAA Real Estate Account has no officers or directors. Rather, TIAA officers, under the direction and control of the Board, manage the investment of the Account's assets, following investment management procedures that TIAA has adopted for the Account. No TIAA trusteeTrustee or executive officer receives compensation from the Account. The Trustees and certain executive officers of TIAA as of March 1, 2018,2022, their years of birth and their principal occupations during at least the lastpast five years, are as follows:
Trustees
Director, Fiat Chrysler Automobiles (2014President and Chief Executive Officer (2013 to present). Member, Plymouth Ventures Partnership II Advisory2016), and Special Advisor, Board (2010(2016), Weight Watchers International, Inc. Chairman (2018 to present). Director Medical University of South Carolina Foundation (2013(2012 to present), and Trustee, Washington University in St. Louis (1987 to 2013 and 2014Big Lots, Inc. Investment Committee Member (2021 to present), Atlantic Health Systems.
Samuel R. Bright, YOB: 1984
Chief Product and Experience Officer, Upwork (2020 to present). Vice President, General Manager – Verticals (2019 to 2020); Vice President, Soft Goods (2018 to 2019); Senior Director, Art & Collectibles (2016 to 2018); and a series of other M&A and Strategic Partnership roles (2012 to 2016), eBay. President and Board Member of certain Upwork subsidiaries (2020 to present). Advisory Council Member, Smithsonian National Postal Museum (2019 to present). Board Member, Benetech (2016 to 2021).
Jason E. Brown, YOB: 1978
CEO, MRO Corp. (2022 to present). CEO, Discovery Health Partners (2018 to 2022). President, Evolent Health (2014 to 2018). Board Member, YMCA Chicago.
Jeffrey R. Brown, YOB: 1968
Josef and Margot Lakonishok Professor of Business and Dean of the Gies College of Business at the University of Illinois at Urbana-Champaign (2015 to present). ProfessorChair (2019 to present) and Member (2016 to present), Board of Finance and DirectorManagers of the Center for Business and Public Policy,Illinois Global Gateway, LLC. Member, Board of Managers of University of Illinois at Urbana-Champaign (2007Research Park (2019 to present). Board Member, Center for Audit Quality (2016 to present).
Lisa W. Hess, YOB: 1955
President and Managing Partner, SkyTop Capital (2010 to present)2020). Director, Radian Group, Inc. (2011 to present). Director, TIAA, FSB (a wholly owned subsidiary of TIAA) (2015 to present).
Edward M. Hundert, M.D., YOB: 1956
Dean for Medical Education, Associate Director of the Center for Bioethics and Daniel D. Federman, M.D. Professor in Residence of Global Health and Social Medicine and Medical Education, Harvard University Medical School (2014 to present). Senior lecturer in Medical Ethics (2007 to 2014), Director of theFaculty member, Massachusetts General Hospital Center for TeachingLaw, Brain and Learning, Harvard Medical SchoolBehavior (2011 to 2014)present).
116
La June Montgomery Tabron, YOB: 1962
President and CEO of the W.K. Kellogg Foundation (2014 to present). Board Member, Kellogg Company, Chair of the W.K. Kellogg Trust (2014 to present). Board Member, Bronson Healthcare Group (2011 to present), and Detroit Regional Partnership (2019 to present).
Maureen O’Hara, YOB: 1953
R.W. Purcell Professor of Finance, Johnson Graduate School of Management, Cornell University (1992 to present), where she has taught since 1979. Professor of Finance, University of Technology Sydney (2016 to 2018). Director, National Bureau of Economic Research (2021 to present). Executive Advisor, Symbiont (2015 to present). Executive Advisor, Ava Labs, Inc. (2019 to present). Executive Advisor, BMLL Technologies (2022 to present).
Donald K. Peterson, YOB: 1949
Dorothy K. Robinson, YOB: 1951
Senior Of Counsel, K&L Gates (2016 to present). Senior Counselor to the President Yale University (2014 to 2015)., General Counsel (1986 to 2014), and Vice President and General Counsel,(1995 to 2014), Yale University. Trustee, Swarthmore College (2019 to present). Trustee, Yale University (1995Press, London (2015 to 2014)present). Director, Oak Spring Garden Foundation (2018 to present). Director, TIAA, FSB (a wholly owned subsidiary of TIAA) (2015 to present).
Kim M. Sharan, YOB: 1957
Founder and CEO, Kim M. Sharan, LLC (2004(2014 to present). Consultant, The Council (2021 to present). Partner, Connective Partners (2022 to present). President of Financial Planning and Wealth Strategies and Chief Marketing Officer, Ameriprise Financial (2002(2005 to 2014). Board Member, Partner HerePartnerHere (2014 to present). Director,Executive Advisor, Own the Room (2016 to present). Executive Advisor, Hearsay Social (2019 to 2021). Executive Advisor, Girls, Inc. (2014(2020 to present). Executive Advisor, Yext (2016 to 2018 and 2021 to present). Executive Advisor, Vera Health (2021 to present). Member, Council for Economic Education (2021 to present). Director, TIAA, FSB (a wholly owned subsidiary of TIAA) (2020 to present).
, Maurice P. During ’22 Professor in Demographic Studies (1999 to 2021) and Professor of Sociology and Public Affairs (1997 to 1999), Princeton University (since 1999)University. President, American Academy of Political and Social Science (2021 to present). Director, Novume SolutionsRobin Hood Foundation (2017 to present). Trustee (2004 to 2021), Board Chair (2017 to present), Trustee (2004 to present)2021), Alfred P. Sloan Foundation. Trustee, Jacobs Foundation of Switzerland (1999Urban Institute (2019 to present). Board member, Robin Hood Foundation (2017Director, Holdsworth Center (2019 to present).
Officer—Trustees
President and Chief Executive Officer of TIAA (effective as of May 1, 2021).
Prior positions: Chief Executive Officer, Consumer Banking (2016-2021) andCREF (since 2008).Chief Executive Officer, Chase Auto Finance (2013-2016) at JPMorgan Chase & Co.
Prior positions: Chief Executive Officer, Consumer Banking (2016-2021) and
Other TIAA Executive Officers
Senior Executive Vice President, Chief FinancialProduct and Business Development Officer, TIAA; Manager, TIAA-CREF Individual & Institutional Services, LLC. Prior Positions: Executive Vice President, National Wealth Advisory Services; Senior Managing Director, National Wealth Advisory Services, TIAA. Managing Director and the Head of TIAAInternational Wealth Management at Morgan Stanley (2017-2019).
117
Christine E. Dugan, YOB: 1963
Executive Vice President and Product General Manager – Institutional Lifetime Income, TIAA. Prior positions: Senior Vice President, Chief Actuary, TIAA. U.S. Life M&A Leader at Willis Towers Watson (2016-2018).
Austin P. Wachter, YOB: 1974
Executive Vice President, Chief FinancialAccounting Officer and Principal Accounting Officer of CREF. Prior position:Corporate Controller, TIAA; Executive Vice President, Chief FinancialAccounting Officer of TIAA.
and Corporate Controller, CREF. Prior positions: Senior ExecutiveManaging Director, Controller, Nuveen; Senior Managing Director, Nuveen Controller, CREF; Managing Director, Nuveen Controller, CREF; Vice President, Institutional Financial Services Chief Executive Officer of TIAA, and ExecutiveFunds Treasurer TGAM Controller, TIAA; Vice President, of the TIAA-CREF Fund Complex. Prior positions: Executive Vice President and Chief Operating Officer of TIAA.
Portfolio Management Team
Randy Giraldo, YOB: 1975
Managing Director, Portfolio Manager, Head of TIAA Real Estate Account. Head of Portfolio Management for THRE division of Nuveen.Account, TIAA. Prior position: Managing Director.
Audit Committee Financial Expert
On February 10, 2016,17, 2022, the Board of Trustees of TIAA determined that Jeffrey R. Brown, Lisa W. Hess, La June Montgomery Tabron and Donald K. PetersonMaureen O’Hara qualify as Audit Committee Financial Experts. Each such Trustee is independent (as that term is used in Item 7(d)(3)(iv) of Schedule 14A under the Securities Exchange Act of 1934) and has not accepted, directly or indirectly, any consulting, advisory or other compensatory fee from TIAA, other than in his or her capacity as Trustee.
Code of EthicsConduct
The Board of Trustees of TIAA has adopted a code of ethicsconduct for senior financial officers, including its principal executive officer, principal financial officer, principal accounting officer, or controller, and persons performing similar functions, in conformity with rules promulgated under the Sarbanes-Oxley Act of 2002.
The code of ethicsconduct is filed as an exhibit to this annual report.
During the reporting period, there were no implicit or explicit waivers granted by the Registrant from any provision of the code of ethics.conduct.
ITEM 12. SECURITY OWNERSHIP OF CERTAIN BENEFICIAL OWNERS AND MANAGEMENT AND RELATED STOCKHOLDER MATTERS.
Not applicable.
ITEM 13. CERTAIN RELATIONSHIPS AND RELATED TRANSACTIONS, AND DIRECTOR INDEPENDENCE.
The TIAA General Account plays a significant role in operating the Account, including providing a liquidity guarantee, and investment advisory, administrative, and other services. In addition, Services, a wholly-owned subsidiary of TIAA, provides distribution services for the Account.
Liquidity Guarantee. If the Account’s liquid assets and its cash flow from operating activities and participant transactions are insufficient to fund redemption requests, the TIAA general account has agreed to purchase liquidity units. TIAA thereby guarantees that a participant can redeem accumulation units at their net asset value next determined. For the year ended December 31, 2017,2021, the Account expensed $47.0$69.1 million for this liquidity guarantee from TIAA through a daily deduction from the net assets of the Account.
Investment Advisory and Administration Services/Mortality and Expense Risks Borne by TIAA. Deductions are made each valuation day from the net assets of the Account for various services required to manage investments, administer the Account and distribute the contracts. These services are performed at cost by TIAA and Services. Deductions are also made each valuation day to cover mortality and expense risks borne by TIAA.
118
For the year ended December 31, 2017,2021, the Account expensed $72.0$62.4 million for investment management services and $1.2$1.3 million for mortality and expense risks provided/borne by TIAA. For the same period, the Account expensed $85.0$77.3 million for administrative and distribution services provided by TIAA and Services.
ITEM 14. PRINCIPAL ACCOUNTANT FEES AND SERVICES.
PricewaterhouseCoopers LLP (“PwC”) performs independent audits of the registrant’s consolidated financial statements. To maintain auditor independence and avoid even the appearance of conflicts of interest, the registrant, as a policy, does not engage PwC for management advisory or consulting services.
Audit Fees. PwC’s fees for professional services rendered for the audits of the registrant’s annual consolidated financial statements for the years ended December 31, 20172021 and 20162020 and review of consolidated financial statements included in the registrant’s quarterly reports were $1,198,800$1,190,052 and $1,163,900$1,181,332 respectively.
Audit-Related Fees. The registrant had no audit-related services for the years ended December 31, 20172021 and 2016.2020.
Tax Fees. PwC had no tax fees with respect to registrant for the years ended December 31, 20172021 and 2016.2020.
All Other Fees. Other than as set forth above, there were no additional fees with respect to registrant.
Preapproval Policy. In June of 2003, theThe audit committee of the Board (“Audit Committee”) has adopted a Preapproval Policy for External Audit Firm Services (the “Policy”), which applies to the registrant. The Policy describes the types of services that may be provided by the independent auditor to the registrant without impairing the auditor’s independence. Under the Policy, the Audit Committee is required to preapprove services to be performed by the registrant’s independent auditor in order to ensure that such services do not impair the auditor’s independence.
The Policy requires the Audit Committee to: (i) appoint the independent auditor to perform the financial statement audit for the registrant and certain of its affiliates, including approving the terms of the engagement and (ii) preapprove the audit, audit-related and tax services to be provided by the independent auditor and the fees to be charged for provision of such services from year to year.
PART IV
ITEM 15. EXHIBITS AND FINANCIAL STATEMENT SCHEDULES.
| (1) | (A) | |||||||
| (3) | (A) | |||||||
Restated Charter of TIAA (as amended)5 | ||||||||
| (B) | ||||||||
Amended Bylaws of TIAA6 | ||||||||
| (4) | (A) | |||||||
Forms of RA, GRA, GSRA, SRA, IRA Real Estate Account Endorsements,2Keogh Contract,3Retirement Select and Retirement Select Plus Contracts and Endorsements1 and Retirement Choice and Retirement Choice Plus Contracts3 | ||||||||
| (B) | ||||||||
Forms of Income-Paying Contracts2 | ||||||||
| (C) | ||||||||
Form of Contract Endorsement for Internal Transfer Limitation7 | ||||||||
| (D) | ||||||||
Form of Non-ERISA Retirement Choice Plus Contract9(2) Form of Non-ERISA Retirement Choice Plus Certificate9 | ||||||||
| (E) | ||||||||
Form of Trust Company Retirement Choice Contract10(2) Form of Trust Company Retirement Choice Certificate10 | ||||||||
| (F) | ||||||||
Form of Trust Company Retirement Choice Plus Contract11 | ||||||||
| (G) | ||||||||
| (H) | ||||||||
| (I) | ||||||||
| (K) | ||||||||
| (L) | ||||||||
| (M) | ||||||||
| (N) | ||||||||
| (O) | ||||||||
| (P) | ||||||||
| (Q) | ||||||||
| (10) | (A) | |||||||
| (B) | ||||||||
Custodian Agreement, dated as of March 3, 2008, by and between TIAA, on behalf of the Registrant, and State Street Bank and Trust Company, | ||||||||
| (21) | Subsidiaries of the Registrant | |||||||
| (14) | ||||||||
| (32) | ||||||||
| (101) | The following financial information from the annual report on Form 10-K for the | |||||||
*Filed herewith.
**Furnished electronically herewith.
(1)Previously filed and incorporated herein by reference to Exhibit 4(A) to the Account’s Pre-Effective Amendment No. 1 to the Registration Statement on Form S-1 filed April 29, 2004 (File No. 333-113602).
120
(2)Previously filed and incorporated herein by reference to the Account’s Post-Effective Amendment No. 2 to the Registration Statement on Form S-1 filed April 30, 1996 (File No. 33-92990).
(3)Previously filed and incorporated herein by reference to the Account’s Post-Effective Amendment No. 1 to the Registration Statement on Form S-1 filed May 2, 2005 (File No. 333-121493).
(4)Previously filed and incorporated herein by reference to Exhibit 1(A) to the Account’s Registration Statement on Form S-1, filed with the Commission on March 15, 2013 (File No. 333-187309).
(5)Previously filed and incorporated herein by reference to Exhibit 3(A) to the Account’s Registration Statement On Form S-1, filed with the Commission on April 22, 2015 (File No. 333-202583).
(6)Previously filed and incorporated herein by reference to Exhibit 3(B) to the Account’s Registration Statement on Form S-1, filed with the Commission on April 22, 2015 (File No. 333-202583).
(7)Previously filed and incorporated by reference to Exhibit 4(C) to the Account’s Quarterly Report on Form 10-Q for the quarter ended September 30, 2010 and filed with the Commission on November 12, 2010 (File No. 33-92990).
(8)Previously filed and incorporated herein by reference to Exhibit 10(B) to the Annual Report on Form 10-K of the Account for the fiscal year ended December 31, 2012 and filed with the Commission on March 14, 2013 (File No. 33-92990).
(9)Previously filed and incorporated by reference to Exhibit 4(D)(1) and 4(D)(2) to the Account's Registration Statement on Form S-1, filed with the Commission on March 21, 2017 (File No. 333-216849).
(10)Previously filed and incorporated by reference to Exhibit 4(E)(1) and 4(E)(2) to the Account's Registration Statement on Form S-1, filed with the Commission on March 21, 2017 (File No. 333-216849).
(11)Previously filed and incorporated by reference to Exhibit 4(F)(1) and 4(F)(2) to the Account's Registration Statement on Form S-1, filed with the Commission on March 21, 2017 (File No. 333-216849).
(12)Previously filed and incorporated by reference to Exhibit 10.1 to the Account's Current Report on Form 8-K, filed with the Commission on February 16, 2022 (File No. 33-92990).
(13)Previously filed and incorporated by reference to Exhibit 4(G) to the Account’s Annual Report on Form 10-K, filed with the Commission on March 15, 2018 (File No. 33-92990).
(14)Previously filed and incorporated by reference to Exhibit 4(H) to the Account’s Annual Report on Form 10-K, filed with the Commission on March 15, 2018 (File No. 33-92990).
(15)Previously filed and incorporated by reference to Exhibit 4(I) to the Account’s Annual Report on Form 10-K, filed with the Commission on March 15, 2018 (File No. 33-92990).
(16)Previously filed and incorporated by reference to Exhibit 4(J)(1) and 4(J)(2) to the Account’s Annual Report on Form 10-K, filed with the Commission on March 14, 2019 (File No. 33-92990).
(17)Previously filed and incorporated by reference to Exhibit 4(K) to the Account’s Annual Report on Form 10-K, filed with the Commission on March 14, 2019 (File No. 33-92990).
(18)Previously filed and incorporated by reference to Exhibit 4(L)(1) and 4(L)(2) to the Account’s Annual Report on Form 10-K, filed with the Commission on March 12, 2020 (File No. 33-92990).
(19)Previously filed and incorporated by reference to Exhibit 4(M) to the Account’s Annual Report on Form 10-K, filed with the Commission on March 11, 2021 (File No. 33-92990).
(20)Previously filed and incorporated by reference to Exhibit 4(N) to the Account’s Annual Report on Form 10-K, filed with the Commission on March 11, 2021 (File No. 33-92990).
(21)Previously filed and incorporated by reference to Exhibit 4(O) to the Account’s Annual Report on Form 10-K, filed with the Commission on March 11, 2021 (File No. 33-92990).
(22)Previously filed and incorporated by reference to Exhibit 4(P) to the Account’s Annual Report on Form 10-K, filed with the Commission on March 11, 2021 (File No. 33-92990).
(23)Previously filed and incorporated by reference to Exhibit 4(Q) to the Account’s Annual Report on Form 10-K, filed with the Commission on March 11, 2021 (File No. 33-92990).
ITEM 16. FORM 10-K SUMMARY.
Not applicable.
121
SIGNATURES
Pursuant to the requirements of the Securities Exchange Act of 1934, as amended, the registrant, TIAA Real Estate Account, has duly caused this annual report on Form 10-K to be signed on its behalf by the undersigned, thereunto duly authorized, in New York, New York, on the 15th10th day of March, 2018.
2022.
| TIAA REAL ESTATE ACCOUNT | ||||||||
| By: | ||||||||
TEACHERS INSURANCE AND ANNUITY ASSOCIATION OF AMERICA | ||||||||
| March | /s/ | |||||||
| Executive Vice President | ||||||||
| and Product General Manager –Institutional Lifetime Income, Teachers Insurance and Annuity Association of America (Principal Executive Officer) | ||||||||
Pursuant to the requirements of the Securities Exchange Act of 1934, as amended, this Report has been signed by the following trustees and officers of Teachers Insurance and Annuity Association of America, in the capacities and on the dates indicated.
| Signature | Title | Date | ||||||||||||
/s/ THASUNDA BROWN DUCKETT | President and Chief Executive Officer of Teachers Insurance and Annuity Association of America and Trustee | March | ||||||||||||
/s/ CHRISTINE E. DUGAN | Executive Vice President | March | ||||||||||||
/s/ AUSTIN P. WACHTER | March | |||||||||||||
/s/ JAMES R. CHAMBERS | Chairman of the Board of Trustees | March | ||||||||||||
/s/ BRIGHT | Trustee | March | ||||||||||||
/s/ JASON E. BROWN | Trustee | March | ||||||||||||
/s/ JEFFREY R. BROWN | Trustee | March | ||||||||||||
/s/ LISA W. HESS | Trustee | March | ||||||||||||
/s/ EDWARD M. HUNDERT, M.D. | Trustee | March | ||||||||||||
/s/ GINA L. LOFTEN | Trustee | March | ||||||||||||
/s/ LA JUNE MONTGOMERY TABRON | Trustee | March | ||||||||||||
/s/ MAUREEN O’HARA | Trustee | March | ||||||||||||
/s/ PETERSON | Trustee | March | ||||||||||||
/s/ DOROTHY K. ROBINSON | Trustee | March | ||||||||||||
/s/ KIM M. SHARAN | Trustee | March | ||||||||||||
/s/ MARTA TIENDA | Trustee | March | ||||||||||||
122
SUPPLEMENTAL INFORMATION TO BE FURNISHED WITH REPORTS FILED PURSUANT TO
SECTION 15(D) OF THE ACT BY REGISTRANTS WHICH HAVE NOT REGISTERED
SECURITIES PURSUANT TO SECTION 12 OF THE ACT
Because the Registrant has no voting securities, nor its own management or board of directors, no annual report or proxy materials will be sent to contract owners holding interests in the Account.
123