UNITED STATES
SECURITIES AND EXCHANGE COMMISSION
WASHINGTON, D.C. 20549
FORM 10-K
(Mark One)
☒ ANNUAL REPORT PURSUANT TO SECTION 13 OR 15(d) OF THE SECURITIES EXCHANGE ACT OF 1934
For the fiscal year ended December 31, 20192020
or
☐ TRANSITION REPORT PURSUANT TO SECTION 13 OR 15(d) OF THE SECURITIES EXCHANGE ACT OF 1934
For the transition period from ________ to ________
Commission File Number 0-23702
STEVEN MADDEN, LTD.
(Exact name of registrant as specified in its charter)
| Delaware | 13-3588231 | |||||||
| (State or other jurisdiction of | (I.R.S. Employer Identification No.) | |||||||
| incorporation or organization) | ||||||||
52-16 Barnett Avenue,, Long Island City,, New York11104
(Address of principal executive offices) (Zip Code)
(Registrant's Telephone Number, Including Area Code): (718) 446-1800
Securities Registered Pursuant to Section 12(b) of the Act:
| Title of each class | Trading symbol(s) | Name of each exchange on which registered | ||||||
| Common Stock, par value $.0001 per share | SHOO | The NASDAQ Stock Market LLC | ||||||
Securities Registered Pursuant to Section 12(g) of the Act: None
Indicate by check mark if the registrant is a well-known seasoned issuer, as defined in Rule 405 of the Securities Act.
Yes ☒ No ☐
Indicate by check mark if the registrant is not required to file reports pursuant to Section 13 or 15(d) of the Securities Act.
Yes ☐ No ☒
Indicate by check mark whether the registrant: (1) has filed all reports required to be filed by Section 13 or 15(d) of the Securities Exchange Act of 1934 during the preceding 12 months (or for such shorter period that the registrant was required to file such reports), and (2) has been subject to such filing requirements for the past 90 days.
Yes ☒ No ☐
Indicate by check mark whether the registrant has submitted electronically every Interactive Data File required to be submitted and posted pursuant to Rule 405 of Regulation S-T (§232.405 of this chapter) during the preceding 12 months (or for such shorter period that the registrant was required to submit and post such files).
Yes ☒ No ☐
Indicate by check mark whether the registrant is a large accelerated filer, an accelerated filer, a non-accelerated filer, a smaller reporting company or an emerging growth company. See the definitions of “large accelerated filer”, “accelerated filer”, “smaller reporting company” and "emerging growth company" in Rule 12b-2 of the Exchange Act.
| Large accelerated filer | ☒ | Accelerated filer | ☐ | Emerging growth company | ☐ | ||||||||||||||||||
| Non-accelerated filer | ☐ | Smaller reporting company | ☐ | ||||||||||||||||||||
If an emerging growth company, indicate by check mark if the registrant has elected not to use the extended transition period for complying with any new or revised financial accounting standards provided pursuant to Section 13(a) of the Exchange Act. ☐
Indicate by check mark whether the registrant has filed a report on and attestation to its management’s assessment of the effectiveness of its internal control over financial reporting under Section 404(b) of the Sarbanes-Oxley Act (15 U.S.C. 7262(b)) by the registered public accounting firm that prepared or issued its audit report.
☒
Indicate by check mark whether the registrant is a shell company (as defined in Rule 12b-2 of the Exchange Act).
Yes ☐ No ☒
The aggregate market value of the common equity held by non-affiliates of the registrant (assuming for these purposes, but without conceding, that all executive officers and directors are “affiliates” of the registrant) as of June 28, 2019,30, 2020, the last business day of the registrant's most recently completed second fiscal quarter, was $2,847,066,470$2,027,460,245 (based on the closing sale price of the registrant's common stock on that date as reported on The NASDAQ Global Select Market).
The number of outstanding shares of the registrant's common stock as of February 26, 202025, 2021 was 83,799,28882,715,209 shares.
DOCUMENTS INCORPORATED BY REFERENCE:
PART III INCORPORATES CERTAIN INFORMATION BY REFERENCE FROM THE REGISTRANT'S DEFINITIVE PROXY STATEMENT FOR THE REGISTRANT'S 20202021 ANNUAL MEETING OF STOCKHOLDERS.
TABLE OF CONTENTS
| PART I | |||||
| PART II | |||||
| PART III | |||||
| PART IV | |||||
SAFE HARBOR STATEMENT UNDER THE U.S. PRIVATE SECURITIES LITIGATION REFORM ACT OF 1995
This Annual Report on Form 10-K contains “forward-looking statements” within the meaning of the safe harbor provisions of the U.S. Private Securities Litigation Reform Act of 1995. Examples of forward-looking statements include, among others, statements regarding revenue and earnings guidance, plans, strategies, objectives, expectations and intentions. You can identify forward-looking statements by words such as: “may,” “will,” “expect,” “believe,” “should,” “anticipate,” “project,” “predict,” “plan,” “intend,” or “estimate,” and similar expressions or the negative of these expressions. Forward-looking statements are neither historical facts nor assurances of future performance. Instead, they represent our current beliefs, expectations and assumptions regarding anticipated events and trends affecting our business and industry based on information available as of the time such statements are made. We caution investors that such forward-looking statements are inherently subject to risks and uncertainties, many of which cannot be predicted with accuracy and some of which may be outside of our control. Our actual results and financial condition may differ materially from those indicated in these forward-looking statements. As such, investors should not rely upon them. Important risk factors include:
•our ability to maintain adequate liquidity when negatively impacted by unforeseen events such as an epidemic or pandemic (COVID-19), which may cause disruption to our business operations and temporary closure of Company-operated and wholesale partner retail stores, resulting in a significant reduction in revenue for an indeterminable period of time;
•our ability to accurately anticipate fashion trends and promptly respond to consumer demand;
•our ability to compete effectively in a highly competitive market;
•our ability to adapt our business model to rapid changes in the retail industry;
•our dependence on the hiringretention and retentionhiring of key personnel;
•our ability to successfully implement growth strategies and integrate acquired businesses;
•our ability to achieve operating results that are consistent with prior financial guidance;
•disruptions to product delivery systems and our ability to properly manage inventory;
•our reliance on independent manufacturers to produce ourand deliver products in a timely manner, especially when faced with adversities such as work stoppages, transportation delays, public health emergencies, social unrest, changes in local economic conditions, and political upheavals as well as their ability to meet our quality standards;
•changes in trade policies and tariffs imposed by the United States government and the governments of other nations in which we manufacture and sell our products;
•legal, regulatory, political and economic risks that may affect our sales in international markets;
•additional tax liabilities resulting from audits by various taxing authorities;
•our ability to adequately protect our trademarks and other intellectual property rights;
•changes in U.S. and foreign tax laws that could have an adverse effect on our financial results; and
•other risks and uncertainties indicated from time to time in our filings with the Securities and Exchange Commission.
These risks and uncertainties, along with the risk factors discussed under Item 1A. “Risk Factors” in this Annual Report on Form 10-K, should be considered in evaluating any forward-looking statements contained in this report. We do not undertake any obligation to publicly update any forward-looking statement, including without limitation, any guidance regarding revenue or earnings, whether as a result of new information, future developments or otherwise.
PART I
ITEM 1. BUSINESS
($ in thousands, except earnings per share and per share data)
Overview
Steven Madden, Ltd. and its subsidiaries (collectively, the “Company”, "we", "our", or "us", as applicable) design, source, market and sell fashion-forward name brandbranded and private label footwear for women, men and childrenchildren. In addition, we design, source, market and name brandsell branded fashion handbags, apparel and accessories, as well as private label fashion handbags apparel and accessories. We also license some ofmarket and sell our trademarks for use in connection with the manufacturing, marketing and sale of various products by third party licensees. Our products are marketed through our retail stores and our e-commerce websites within the United States, Canada, Mexico, our joint ventures in Europe, South Africa, Israel, Taiwan and China, as well as better department stores, major department stores, mid-tier department stores, specialty stores, luxury retailers, value priced retailers, national chains, mass merchants, online retailers and catalogonline retailers, throughout the United States, Canada, Mexico and certain other European nations. In addition, we haveour products are marketed through our retail stores and our e-commerce websites within the United States, Canada and Mexico, our joint ventures in Europe, South Africa, Israel, Taiwan and China, and under special distribution arrangements for the marketing of our products in Spain, Italy, Australia,certain European countries, the Middle East, India, South and Central America, New ZealandOceania and Singapore.various countries in Asia. Our product line includeslines include a broad range of contemporary styles designed to establish or capitalize on market trends, complemented by core product offerings. We have
1
established a reputation for design creativity and our ability to offer quality products in popular styles at accessible price points, delivered in an efficient manner and time frame.
Steven Madden, Ltd. was incorporated in New York on July 9, 1990, reincorporated under the same name in Delaware in November 1998 and completed its initial public offering in December 1993. Shares of Steven Madden, Ltd. common stock, $0.0001 par value per share, currently trade on the NASDAQ Global Select Market under the symbol "SHOO." Our principal executive offices are located at 52-16 Barnett Avenue, Long Island City, NY 11104. Our telephone number is (718) 446-1800 and our website address is http://www.stevemadden.com.
We file Annual Reports on Form 10-K, Quarterly Reports on Form 10-Q, Current Reports on Form 8-K and other reports and information with the Securities and Exchange Commission (the “SEC”) pursuant to Section 13(a) or 15(d) of the Securities Exchange Act of 1934, as amended (the “Exchange Act”). These reports, any amendments to such reports, and our proxy statements for our stockholders' meetings are available free of charge on the "Investor Relations" section of our website as soon as reasonably practicable after such material is electronically filed with, or furnished to, the SEC. We will provide paper copies of such filings free of charge upon request. In addition, the SEC maintains an Internet site that contains reports, proxy and information statements and other information regarding us, which is available at http://www.sec.gov.
We have a Code of Ethics for our Chief Executive Officer and our senior financial officers, as well as a Code of Business Conduct and Ethics specific to directors of our Company, each of which is attached as an exhibit to our 2014 Annual Report on Form 10-K filed with the SEC on February 26, 2015. We also have a Code of Conduct that is applicable to all of our employees, which is attached as an exhibit to our 2018 Annual Report on Form 10-K filed with the SEC on February 28, 2019. Each of these codes is posted on our website, http://www.stevemadden.com. We will provide paper copies of these codes free of charge upon request. We intend to disclose on our website any amendments to, or waivers of, these codes that would otherwise be reportable on a current report on Form 8-K. Such disclosure would be posted within four business days following the date of the amendment or waiver.
Recent Developments
On January 4, 2021, upon the recommendation of the Nominating/Corporate Governance Committee, our Board of Directors appointed Maria Teresa Kumar to fill the newly created directorship resulting from the expansion in the size of the Board of Directors from nine members to ten members. Ms. Kumar has also been appointed to serve on the Corporate Social Responsibility Committee.
On February 24, 2021, our Board of Directors approved the reinstatement of a quarterly cash dividend. The quarterly dividend toof $0.15 per share is payable on our outstanding shares of common stock. The dividend was paid on December 27, 2019March 26, 2021 to stockholders of record as of the close of business on DecemberMarch 16, 2019.2021.
Product Distribution Segments
Our business comprises five distinct segments: Wholesale Footwear, Wholesale Accessories/Apparel, Retail, First Cost and Licensing.
Our Wholesale Footwear segment comprises the following brands:
| Steve Madden® | DV | |||||||
| Madden Girl® | Mad Love® | |||||||
| Madden® | Steven by Steve Madden® | |||||||
| Report® | ||||||||
| Dolce Vita® | Superga® (under license) | |||||||
The segment also includes our International business and part of our private label footwear business. An agreement under which we licensed the Kate Spade® trademark terminated on December 31, 2019.
2
Our Wholesale Accessories/Apparel segment comprises the following brands:
| Steve Madden® | |||||
| Madden | |||||
| Anne Klein® (under license) | |||||
| Cupcakes & Cashmere® (under license) | |||||
| Cejon® | |||||
It also includes our International business and part of our private label accessories business. An agreementThe agreements under which we licensed the Donna Karan® trademarkJocelyn® and DKNY® trademarks terminated onas of December 31, 2019.2020. The agreement under which we license the Cupcakes & Cashmere® trademark will terminate in April 2021.
Steven Madden Retail, Inc., our wholly-ownedwholly owned retail subsidiary, operates Steve Madden, Steven Superga and GREATSSuperga retail stores, domestically and internationally, as well as Steve Madden, Superga, Betsey Johnson, Blondo, Dolce Vita, GREATS and BB Dakota and Jocelyn e-commerce websites.
Our First Cost segment represents activities of one of our wholly-ownedwholly owned subsidiaries that earns commissions for serving as a buying agent for footwear products under private labels for many of the country'sU.S. large mass-market retailers, shoe chains and other value pricedvalue-priced retailers.
Our Licensing segment is engaged in the licensing of the Steve Madden®, Steven by Steve Madden® and Madden Girl® trademarks for use in connection with the manufacture, marketing and sale of apparel, outerwear, hosiery, jewelry, watches, eyeglasses, sunglasses, hair accessories, fragrance, umbrellas, bedding and bath, and luggage. In addition, we license the Betsey Johnson® trademark for use in connection with the manufacture, marketing and sale of women's and children’s apparel, hosiery, fragrance and beauty, sleepwear, swimwear, activewear, jewelry, headbands,hair accessories, watches, slippers, bedding and bath, luggage, umbrellas and medical scrubs. We also license the Dolce Vita® trademark for use in connection with the manufacture, marketing and sale of swimwear and the FREEBIRD by Steven® trademark for operation of retail stores.
Wholesale Footwear Segment
Steve Madden Women's. We design, source and market our Steve Madden brand to department stores, specialty stores, luxury retailers, value priced retailers, national chains, mass merchants,and online retailers and catalog retailers throughout the United States.retailers. The Steve Madden brand has become a leading life-style brand in the fashion consciousfashion-conscious marketplace. Steve Madden Women's offers fashion forward footwear designed to appeal to customers (primarily women ages 16 to 35) seeking exciting, newtrending footwear designs at affordable prices.price points. New products for Steve Madden Women's are test marketed at Company-owned retail stores. Typically, within a few days, we can determine whether the test product appeals to our customers. This enables us to use our flexible sourcing model to rapidly respond to changing trends and customer preferences, which we believe is essential for success in the fashion industry. Retail price points for Steve Madden Women's products range from $59 to $189.
Madden Girl. We design, source and market a full collection of directional young women's shoes under the Madden Girl® brand. Madden Girl® is geared towards girls and young women ages 13 to 25 and is an “opening price point” brand currently sold at major department stores, mid-tier retailers, online retailers and specialty stores. Retail price points for Madden Girl products range from $39 to $79.
Steve Madden Men's. We design, source and market a lifestyle collection of men's footwear for the fashion forwardfashion-forward man, ages 18 to 45, under the Steve Madden® brand. Retail channels include major department stores, mid-tier department stores, better specialty stores, online retailers and independent shoe stores throughout the United States. Retail price points for Steve Madden Men's products range from $69 to $169.
Madden. The Madden® brand is a collection of casual and business casual collection of footwear designed to meet the ever-evolving needs of the trend conscioustrend-conscious young male consumer, ages 16 to 35. Madden products range from $40 to $90 and are sold to national specialty stores, department stores, mid-tier department stores, online retailers, off-price retailers and independent specialty stores.
Steven. We design, source and market women's fashion footwear under the Steven® trademark through major department stores, better footwear specialty stores and shopping networks throughout the United States. Priced a tier above the Steve Madden Women's brand, Steven products are designed to appeal to fashion conscious women ages 25 to 45 who grew up
3
wearing Steve Madden footwear and are looking for a shoe with an emphasis on comfort. Retail price points for Steven products range from $89 to $169.
Betsey Johnson. On October 5, 2010, we acquired the Betsey Johnson® trademark and substantially all other intellectual property of Betsey Johnson LLC. Products branded under the Betsey Johnson shoe brand are distributed through department stores and online retailers. Retail price points for Betsey Johnson products range from $99$79 to $139.$189.
Superga. On February 9, 2011, we entered into a license agreement with Basic Properties America Inc. and BasicNet S.p.A., for the use of the Superga® trademark in connection with the marketing and sale of footwear. Founded in Italy in 1911, Superga is recognized for its fashion sneakers in a wide range of colors, fabrics and prints for women, men and children. Retail price points for Superga products range from $65 to $99.$129.
Report. We acquired the Report® brand in May 2011. It is a junior women's footwear brand with retail price points ranging from $20 to $100 per pair. We design, manufacture, market and sell Report branded products to major department stores, mid-tier department stores and independently owned boutiques throughout the United States.
Mad Love. The Mad Love® brand is an exclusive beach-to-the-street lifestyle brand created to appeal to women with a young attitude and active lifestyle and marketed exclusively to Target. Beginning in spring 2021, Mad Love® will become a sustainable brand, designed and created with the mission to make our earth a better place. Retail price points for Mad Love products range from $15 to $23.
Dolce Vita. In August 2014, we acquired the Dolce Vita® and DV® brands. Dolce Vita® is a contemporary women's footwear brand with retail price points ranging from $79 to $225. Our Dolce Vita® brand products are distributed through major department stores, mid-tier department stores and independently owned boutiques primarily throughout the United States. The DV® brand is a contemporary women's footwear brand with retail price points ranging from $20$39 to $75.$99. DV® products are distributed through major department stores, off-price department stores, online retailers and independently owned boutiques primarily throughout the United States.
Blondo. In January 2015, we acquired the intellectual property and related assets of Blondo, a fashion-oriented footwear brand specializing in waterproofwater resistant leather boots, booties, shoes and sneakers. Founded over 100 years ago, Blondo products are sold to wholesale customers, including better department stores and specialty boutiques in both the United States and Canada. Retail price points for Blondo products range from $99 to $199.$250.
GREATS. In August 2019, we acquired the intellectual property and related assets of GREATS, a Brooklyn-based digitally native footwear brand specializing in premium quality, responsibly made sneakers for men and women.women, which are sold primarily via the Internet. Founded in 2014, GREATS is a pioneer and the first digitally native sneaker brand. GREATS also partners with better department stores like Nordstrom as well as specialty boutiques in the United States. Retail price points for GREATS products range from $119 to $199.
Anne Klein. In January 2018, we entered into a license agreement with Nine West Development LLC for a license to use the Anne Klein®, AK Sport®, AK Anne Klein Sport® and Lion Head Design® trademarks in connection with the marketing and sale of footwear. The Anne Klein® brand is recognized as being synonymous with American sportswear. Retail price points for Anne Klein products range from $49 to $129.
International Division. The International division, utilizing some of the brands discussed above, markets products to better department stores, major department stores, mid-tier department stores, specialty stores, luxury retailers, value priced retailers, national chains, mass merchants online retailers and catalogonline retailers through wholly owned subsidiaries in Canada and Mexico and joint venture partnerships in Europe (excluding Italy, Spain and Greece, where we had preexisting distributors), South Africa, Israel, China and Taiwan. In addition, the International division works through special distribution arrangements for the marketing and sale of our products in Spain, Italy, Greece, South Korea, Australia, the Middle East, India, South and Central America, New Zealand and Singapore.Southeast Asia.
4
Private label business. We design, source and market private label footwear primarily to mid-tier chains and mass market merchants. In addition, we design, source and market footwear for third-party brands, such as Material Girl® and Candies®.
Wholesale Accessories/Apparel Segment
Our Wholesale Accessories/Apparel segment designs, sources and markets name brands and sells them to department stores, mass merchants, value priced retailers, online retailers and specialty stores throughout the United States, Canada, and Mexico and through our joint ventures and International distributor network. These brandsproducts include the following brands as well as private label fashion handbags and accessories:
| Steve Madden® | |||||
| Steven by Steve Madden® | BB | ||||
| Madden Girl® | Anne Klein® (under license) | ||||
| Betsey Johnson® | |||||
| Cupcakes & Cashmere® (under license) | |||||
We market and sell cold weather accessories, fashion scarves, wraps and other trend accessories primarily under our Steve Madden®, BB Dakota®, Cejon®, Betsey Johnson® and Big Buddha® brand names and private labels to department stores and specialty stores.
Retail Segment
As of December 31, 2019,2020, we owned and operated 227218 retail stores, including 146143 Steve Madden full-price stores, 6866 Steve Madden outlet stores, 2one Steven stores, 2 GREATS stores, 1store, one Superga store and 8seven e-commerce websites (Steve Madden, Superga, Betsey Johnson, Blondo, Dolce Vita, GREATS and BB Dakota and Jocelyn)Dakota; our Jocelyn website was terminated as of December 31, 2020). In 2019,2020, we added 8three full-price stores 8and two outlet stores and 2 e-commerce websites and closed 17nine full-price stores, 2four outlet stores and 1one e-commerce website. In addition, during 2019,2020, we closed 1214 concessions in ChinaSouth Africa and one concession in Taiwan and opened 1one concession in Taiwan,China, ending the year with 3117 company-operated concessions in international markets. Steve Madden stores are located in major shopping malls and in urban street locations across the United States, Canada, Mexico, South Africa, Israel, China and Taiwan. Comparative store sales (sales of those stores, including the e-commerce websites, that were open for at least twelve months) increased 6.1% in fiscal year 2019 from the prior year. We exclude new locations from the comparable store base for the first year of operations. Stores that are closed for renovations are removed from the comparable store base.
We believe that our retail storesdirect to consumer business ("DTC") will continue to enhance overall sales and profitability andas well as our ability to react swiftlyquickly to changing consumer trends. Our stores play an important role in our integrated retail strategy and serve as fulfillment and return locations for our e-commerce business. We areDTC business also launching buy-online-return-in-store in select locations. Our stores also serveserves as a marketing tool that allows us to strengthen global brand recognition and to showcase selected items from our full line of branded and licensed products. Furthermore, our retail stores provideit provides us with venuesa channel to test and introduce new products, designs and merchandising strategies. We often test new designs at ourof Steve Madden products in our retail storesbusiness before scheduling them for mass production and wholesale distribution. In addition to these test marketing benefits, we have been able to leverage sales information gathered at Steve Madden retail stores to assist our wholesale customers in their order placement and inventory management. Our stores play an important role in our integrated retail strategy and also serve as fulfillment and return locations for our e-commerce business. We have also launched buy online, pickup in-store in all U.S. full-price locations. We expect to open 10three to 13five new retail stores in international markets and close 4two to 6five locations, globally in 2020.2021.
First Cost Segment
The First Cost segment earns commissions for serving as a buying agent for footwear products under private labels for many of the large mass-market retailers, shoe chains and other mid-tier retailers. As a buying agent, we utilize our expertise and our relationships with shoe manufacturers to facilitate the production of private label shoes to customer specifications. We believe that operating in the private label market provides us additional non-branded sales opportunities and leverages our overall sourcing and design capabilities. Our First Cost segment earns commissions serving as a buying agent for the procurement of women's, men's and children's footwear for large retailers, including Kohl's, Fred Meyer and Meijers.retailers. In addition, by leveraging the strength of our Steve Madden brands and product designs, we are able to partially recover our design, product and development costs from our suppliers.
5
Licensing Segment
We license our Steve Madden®, Steven by Steve Madden® and Madden Girl® trademarks for use in connection with the manufacture, marketing and sale of apparel, outerwear, hosiery, jewelry, watches, eyeglasses, sunglasses, hair accessories, fragrance, umbrellas, bedding and bath, and luggage. In addition, we license the Betsey Johnson® trademark for use in connection with the manufacture, marketing and sale of women's and children’s apparel, hosiery, fragrance and beauty, sleepwear, swimwear, activewear, jewelry, headbands,hair accessories, watches, slippers, bedding and bath, luggage, umbrellas and medical scrubs. We also license the Dolce Vita® trademark for use in connection with the manufacture, marketing and sale of swimwear and the FREEBIRD by Steven® trademark for operation of retail stores. Most of our license agreements require the licensee to pay us a royalty based on actual net sales, a minimum royalty in the event that specified net sales targets are not achieved and a percentage of sales for advertising the brand.
See Note Q to our consolidated financial statements included in this Annual Report on Form 10-K for additional information relating to our five operating segments.
Product Design and Development
We have established a reputation for our creative designs, marketing and trendy products at affordable price points. Our future success will substantially depend on our ability to continue to anticipate and react swiftly to changing consumer demands. To meet this objective, we have developed what we believe is an unparalleled design process that allows us to recognize and respond quickly to changing consumer demands. Our design team strives to create designs that fit our image, reflect current or anticipated trends and can be manufactured in a timely and cost-effective manner. Most new products are tested in select Steve Madden retail stores. Based on these tests, among other things, management selects the Company'sour products that are then offered for wholesale and retail distribution nationwide. We believe that our design and testing processes and flexible sourcing models
provide our brands with a significant competitive advantage allowing us to mitigate the risk of incurring costs associated with the production and distribution of less desirable designs.
Product Sourcing and Distribution
We source each of our product lines separately based on the individual design, style and quality specifications of the products in such product lines. We do not own or operate any foreign manufacturing facilities; rather, we use agents and our own sourcing office to source our products from independently owned manufacturers primarily in China and also in Cambodia, Mexico, Brazil, India, Vietnam, Italy and other European nations. We have established relationships with a number of manufacturers and agents in each of these countries. We have not entered into any long-term manufacturing or supply contracts. We believe that a sufficient number of alternative sources exist for the manufacture of our products.
We continually monitor the availability of the principal raw materials used in our footwear, which are currently available from a number of sources in various parts of the world. We track inventory flow on a regular basis, monitor sell-through data and incorporate input on product demand from wholesale customers.
The manufacturers of our products are required to meet quality, human rights, safety and other standard requirements. We are committed to the safety and well-being of the workers throughout our supply chain.
Our products are manufactured overseas and most of our products are shipped via ocean freight carriers to ports principally in California and to a lesser extent in New Jersey, and via truck from Mexico to our third-party distribution facility in Texas. We rely to a lesser extent on air carriers for the shipping of products. Once our products arrive in the U.S., we distribute them mainly from eightsix third-party distribution centers, fivefour located in California, one located in Texas, one located in Tennessee and one located in New Jersey. Our products are also distributed through a Company-operated distribution center located in Canada. Our products are also distributed through our third-party distribution facility in Mexico. By utilizing distribution facilities specializing in fulfillment for certain wholesale accounts, Steve Madden retail stores and Internet customers, we believe that our customers are served more promptly and efficiently. Suppliers of products for our businesses in Canada and Mexico and our joint ventures in Europe, South Africa, Israel, Taiwan and China ship to ports in the respective countries, and products for our overseas distributors are shipped to freight forwarders primarily in China and Mexico where the distributor arranges for subsequent shipment.
6
Customers
Our wholesale customers consist principally of better department stores, major department stores, mid-tier department stores, national chains, mass merchants, value priced retailers, specialty stores online retailers and catalogonline retailers. These customers, in no particular order, include:
| Nordstrom, Inc. | The TJX Companies, Inc. | ||||
| Dillard's, Inc. | |||||
| Macy's, Inc. | Ross Stores, Inc. | ||||
| Designer Brands, Inc. | |||||
| Kohl's Corporation | Target Corporation | ||||
For the year ended December 31, 2019, Wal-Mart Stores,2020, Walmart Inc. represented 11.9%approximately 13.9% of total revenue. At December 31, 2019, Wal-Mart Stores,2020, Walmart Inc. represented 17.9%19.0% of total accounts receivable, Target Corporation represented 13.6%14.9% of total accounts receivable, Ross Stores, Inc. represented 11.8% of total accounts receivable, The TJX Companies, Inc. represented 11.7% of total accounts receivable and Nordstrom, Inc. represented 10.6%10.3% of total accounts receivable. WeThe Company did not have any other customers who accounted for more than 10% of total revenue or any other customers who accounted for more than 10% of total accounts receivable.
Distribution Channels
United States, Canada, Mexico, Europe, South Africa, Israel, Taiwan and China
We sell our products principally through department stores, specialty stores, online retailers, luxury retailers, national chains and mass merchants in the United States, Canada, Mexico and certain European nations. In addition, we sell our products in our Company-owned retail stores in the United States, Canada and Mexico, under our joint ventures in Europe, South Africa, Israel, Taiwan and China, and on our e-commerce websites. For the year ended December 31, 2019,2020, our two Wholesale segments and our Retail segment generated net sales of approximately $1,446,953$949,554 and $321,182,$239,389, or 81%79% and 18%20% of our total revenue, respectively. Each of these distribution channels is described below.
Department Stores. We currently sell our products to approximately 2,2001,800 doors of 1512 department storesstore retailers throughout the United States, Canada, Mexico and certain European nations. Our major accounts include Nordstrom, Inc., Macy's, Inc., Dillard's, Inc., Belk, Inc. and Bloomingdale's, Inc.
We provide merchandising support to our department store customers, including in-store fixtures and signage, supervision of displays and merchandising of our various product lines. Our wholesale merchandising effort includes the creation of in-store concept shops in which we showcase a broader collection of our branded products. These in-store concept shops create an environment that is consistent with our image and are designed to enable the retailer to display and sell a greater volume of our products per square foot. In addition, these in-store concept shops encourage longer term commitment by the retailer to our products and enhance consumer brand awareness.
In addition to merchandising support, our key account executives maintain weekly communications with their respective accounts to guide them in placing orders and to assist them in managing inventory, assortment and retail sales. We also leverage our sell-through data gathered at our retail stores to assist department stores in allocating their open-to-buy dollars to the most popular styles in the product line and phasing out styles with weaker sell-through, which, in turn, reduces markdown exposure at the end of the season.
National Chains and Mass Merchants. We currently sell to national chains and mass merchants throughout the United States, Canada, Mexico and certain European nations. Our major accounts include Wal-Mart Stores,Walmart Inc., Target Corporation and Kohl's Corporation.
Shoe Chains/Specialty Stores/Catalog Sales.Stores. We currently sell to shoe chains and specialty store locations throughout the United States, Canada, Mexico and certain European nations. Our major specialty store accounts include DSW Designer Shoe Warehouse,Brands, Famous Footwear and Gap, Inc. We offer our specialty store accounts similar merchandising, sell-through and inventory tracking support offered to our department store accounts. Sales of our products are also made through certain catalogs.
7
Off-Price. We currently sell to off-price retailers throughout the United States, Canada, Mexico and certain European nations. Our major accounts include The TJX Companies, Inc., Ross Stores, Inc. and Burlington Stores, Inc.
Internet Sales. We operate 8seven Internet e-commerce website stores (Steve Madden, Superga, Betsey Johnson, Blondo, Dolce Vita, GREATS and BB Dakota and Jocelyn)Dakota; our Jocelyn website was terminated as of December 31, 2020) where customers can purchase numerous styles of our Steve Madden Women's, Steven, Madden Men's, Superga, Betsey Johnson, Blondo, Dolce Vita and GREATS footwear and BB Dakota and JocelynBB Dakota x Steve Madden apparel and accessory products, as well as selected styles of Madden Girl footwear and accessory products. We also sell to online retailers throughout the United States, Europe, and Canada. Our major accounts include Zappos, Amazon, Zolando, and Amazon.ASOS.
Steve Madden, Steve Madden Outlet, Steven Superga and GREATSSuperga Retail Stores. As of December 31, 2019,2020, we operated 146143 Steve Madden full-price stores within the United States, Canada and Mexico and under our joint ventures in South Africa, China, Taiwan and Israel. We also operated 6866 Steve Madden outlet stores, 2one Steven stores, 2 GREATS storesstore and 1one Superga store within the United States. We also operated 8seven e-commerce websites (Steve Madden, Superga, Betsey Johnson, Blondo, Dolce Vita, GREATS and BB Dakota and Jocelyn)Dakota; our Jocelyn website was terminated as of December 31, 2020). We believe that our retail stores will continue to enhance overall sales and profitability, and our ability to react swiftly to changing consumer trends. Our stores play an important role in our integrated retail strategy and also serve as fulfillment and return locations for our e-commerce business. In 2020 we launched a program where customers can buy online and pick up in store at all of our Steve Madden full-price locations within the United States. We arehave also launchinglaunched buy-online-return-in-store in select locations. Our stores also serve as a marketing tool that allows us to strengthen global brand recognition and to showcase selected items from our full line of branded and licensed products. Furthermore, our retail stores provide us with venuesa channel to test and introduce new products, designs and merchandising strategies. We often test new designs at our Steve Madden retail stores before scheduling them for mass production and wholesale distribution. In addition to these test marketing benefits, we have also been able to leverage
sales information gathered at Steve Madden retail stores to assist our wholesale customers in their order placement and inventory management.
A typical Steve Madden store is approximately 1,500 to 2,000 square feet and is located in a mall or street location that we expect will attract the highest concentration of our core demographic, style-conscious customer base. The Steven and Superga stores, which are generally the same size as our Steve Madden stores, have a more sophisticated design and format styled to appeal to a more mature target audience. The GREATS stores are approximately 1,000 to 1,500 square feet and are located in New York and Miami. The typical outlet store is approximately 2,000 to 2,500 square feet and is located within outlet malls throughout the United States. In addition to carefully analyzing mall demographicsOur stores play an important role in our integrated retail strategy and serve as fulfillment and return locations we set profitability guidelines for each potential store site. Specifically, we target well trafficked sites at which the demographics fit our consumer profile and seek new locations where the projected fixed annual rent expense stays within our guidelines. By setting these guidelines, we seek to identify stores that will contribute to our overall profitability bothe-commerce business. We have also launched buy online, pickup in-store in the near and longer terms.select locations.
International Distributors
In addition to the countries and territories mentioned above, our products are available in many other countries and territories worldwide via retail selling and distribution agreements. Under the terms of these agreements, the distributors and retailers purchase product from us and are generally required to open a minimum number of stores each year and to pay a fee for each pair of footwear purchased and an additional sales royalty as a percentage of sales or a predetermined amount per unit of sale. Most of the distributors are required to purchase a minimum number of our products within specified periods. The agreements currently in place expire on various dates and include automatic renewals at the distributors' option provided certain conditions are met. These agreements are exclusive in their specific territories, which include certain European territories,countries, the Middle East, South and Central America, Oceania and various countries in Asia.
Competition
The fashion industry is highly competitive. We compete with specialty shoe, apparel and accessory companies as well as companies with diversified footwear product lines, such as Aldo, Sam Edelman, Deckers Outdoor CorporationJessica Simpson, Lucky Brand and Vince Camuto. Our competitors may have greater financial and other resources than we do. We believe effective marketing and advertising, favorable brand image, fashionable styling, high quality, value and fast manufacturing turnaround are the most important competitive factors, and we intend to continue to employ these elements in our business. However, we cannot be certain that we will be able to compete successfully against our current and future competitors, or that competitive pressures will not have a material adverse effect on our business, financial condition and results of operations.
8
Marketing and Sales
We have focused on creating an integrated brandintegrated-brand building program to establish our Company as a leading designer of fashion footwear for style-conscious young women and men. Principal marketing activities include social media and digital marketing efforts, influencer marketing, public relations, including product and brand placements in lifestyle and fashion magazines and digital outlets, in-store promotions, and events, as well as personalpublic and media appearances by our founder and Creative and Design Chief, Steven Madden. We continue to promote our e-commerce websites where customers can purchase Steve Madden, Women's, Steven, Madden Men's, Superga, Betsey Johnson, Blondo, Dolce Vita and GREATS footwear and BB Dakota and JocelynBB Dakota x Steve Madden apparel and accessory products, as well as selectedselect styles of Madden Girl footwear and accessory products. We also connect with our customers through social media forums including Instagram, Facebook and Twitter.
Management Information Systems (MIS) Operations
Sophisticated information systems are essential to our ability to maintain our competitive position and to support our growth. Our Enterprise Resource Planning (“ERP”) system is an integrated system that supports our wholesale business in the areas of finance and accounting, manufacturing-sourcing, purchase order management, customer order management and inventory control. All of our North American wholesale businesses (other than Canada, which has a separate ERP system) and our Asia first-cost and sourcing operations are operated through this ERP system. Our warehouse management system is utilized by the majority of our third-party logistics providers and is fully integrated with our ERP system. A point of salepoint-of-sale system for our U.S. retail stores is integrated with a retail inventory management/store replenishment system. We have transitioned our e-commerce software to a major cloud-based provider. Complementing all of these systems are ancillary systems and third-party information processing services, including, among others, supply chain, business intelligence/data warehouse, Electronic Data Interchange, credit card processing and payroll. We undertake updates of all of these management information systems on a periodic basis in order to ensure that our functionality is continuously improved. In 2019, we invested $8,200 in a new data and recovery center, with substantially all of the project going into production in 2020.
Trademarks
We consider our Company-owned trademarks to be among our most valuable assets and have registered many of our marks in the United States and 131151 other countries and in numerous International Classes. From time to time, we adopt new trademarks and new logos and/or stylized versions of our trademarks in connection with the marketing of new product lines. We believe that these trademarks have significant value and are important for purposes of identifying our Company, the marketing of our products and the products of our licensees, distinguishing them from the products of others. What follows is a list of the trademarks we believe are most significant to our business:
| Steve Madden® | Report® | ||||
| Steven by Steve Madden® | Report Signature® | ||||
| Steven® | |||||
| Madden Girl® | |||||
| Stevies® | |||||
| Stevies plus Design® | |||||
| DV DOLCE VITA® | |||||
| Betseyville® | Blondo® | ||||
| Betsey Johnson® | Blondo Waterproof plus Heart Design® | ||||
| LUV BETSEY plus Kiss Design® | |||||
| LUV BETSEY by Betsey Johnson Design® | |||||
| Blue by Betsey Johnson® | COOL PLANETTM | ||||
| Steve Madden plus Design® | |||||
| FREEBIRD By Steven® | |||||
| GREATS® | |||||
We act aggressively to register trademarks and we monitor their use in order to protect them against infringement. There can be no assurance, however, that we will be able to effectively obtain rights to our marks worldwide. Moreover, no assurance can be given that others will not assert rights in, or ownership of, our marks and other proprietary rights or that we will be able to resolve any such conflicts successfully. Our failure to adequately protect our trademarks from unlawful and improper appropriation may have a material adverse effect on our business, financial condition, results of operations.
9
Trademark Licensing
Our strategy for the continued growth of our business includes expanding our presence beyond footwear, apparel and accessories through the selective licensing of our brands. As of December 31, 2019,2020, we license our Steve Madden®, Steven by Steve Madden® and Madden Girl® trademarks for use in connection with the manufacture, marketing and sale of outerwear, hosiery, jewelry, watches, eyeglasses and sunglasses, hair accessories, umbrellas, bedding, luggage, fragrance and men’s leather accessories. In addition, we license the Betsey Johnson® trademark for use in connection with the manufacture, marketing and sale of women's and children’s apparel, hosiery, swimwear, slippers, fragrance and beauty, sleepwear, activewear, medical scrubs, jewelry, watches, eyeglasses and sunglasses bedding and bath, luggage, umbrellas and household goods. We also license the Dolce Vita® trademark for use in connection with the manufacture, marketing and sale of swimwear and the FREEBIRD by Steven® trademark for operation of retail stores. Most of our license agreements require the licensee to pay us a royalty based on actual net sales, a minimum royalty in the event that specified net sales targets are not achieved and a percentage of sales for advertising the brand.
In addition to the licensing of our trademarks, we in-license the trademarks of third parties for use in connection with certain of our product lines. Generally, these licensing arrangements require us to make advertising payments to the licensor as well as royalty payments equal to a percentage of our net sales and/or a minimum royalty and in some cases additional payments in the event that specified net sales targets are not achieved.
See Notes BC and P to our consolidated financial statements included in this Annual Report on Form 10-K for additional disclosure regarding these licensing arrangements.
On February 3, 2020,1, 2021, we employed approximately 4,0002,800 employees, of whom approximately 2,5002,100 work full-time and approximately 1,500700 work part-time. Most of our part-time employees work in the Retail segment. Approximately 2,6001,700 of our employees are located in the United States, approximately 700600 employees are located in China and Hong Kong, and China, approximately 400180 employees are located in Canada, approximately 200160 employees are located in Mexico, approximately 10060 employees are located in Israel,Taiwan, approximately 8060 employees are located in South Africa and approximately 40 employees are located in Europe. None of our employees are represented by a union. Our management considers relations with our employees to be good. We have never experienced a material interruption of our operations due to a labor dispute.
Culture
Steve Madden is for the bold, expressive, and ambitious. Our core values – authenticity, initiative, tenacity, humility and trust are key to our competitive edge and are embedded throughout all levels of our Company. They motivate our growth, inspire our innovation, define our culture, and set the standard for all of our actions.
Authenticity: Show up to work as your true self
Initiative: Act upon good ideas quickly and be ready to iterate
Tenacity: Look at problems from all sides and be resourceful
Humility: Think from the perspective of others and always be open to learning
Trust: Build strong relationships with good will and integrity
Career Development
The fashion landscape is constantly shifting and evolving, which makes it especially important for us to invest in the ongoing career development of our employees. In service of this objective, we constantly seek out, promote, and improve upon internal programs and processes that make it possible for employees to reach their full potential. Some examples of this focus include our ongoing professional development relationship with the University of Arizona Global Campus, our tuition reimbursement program, our internal employee learning opportunities, and external conference and workshop offerings around specific industry content as well as leadership, coaching, and management training in general. Mentoring, timely performance evaluations and feedback are also key elements of our career development efforts at our Company.
Diversity and Inclusion
We believe that finding, employing and retaining people from all backgrounds, ethnicities, genders, lifestyles and belief systems have been the cornerstones of meeting the needs of our diverse consumer base and building a global business. By
10
embracing a diverse and inclusive workplace, we create an environment that offers all our employees opportunities to succeed. We want all our employees to be as successful as they can be and to reach their full potential no matter who they are, where they are from or what they believe. In the spirit of this core belief, we strive to build an increasingly inclusive culture where all employees feel free to express themselves and have opportunities to grow. In 2020, we engaged in the following diversity initiatives, among others:
•we established a Diversity and Inclusion Council made up of key leaders in our Company to oversee the implementation of our detailed Diversity and Inclusion Strategic Plan;
•employees formed two employee resource groups - one for Black employees and allies called Black Sole and one for LGBTQ employees and allies called SM Pride;
•we signed the Open to All pledge with other major brands and retailers;
•we joined the Black in Fashion Council;
•we implemented Company-wide Diversity and Inclusion training;
•we joined Hive Diversity and are partnering with Historically Black Colleges and Universities to establish diverse pipelines of talent and expand our recruiting; and
•we launched Adaptive Kids footwear, soon to expand to adults.
Wellness
We see personal health and fitness of our employees as key to long-term professional success, which is why we offer benefits and programs focused on physical, emotional, and financial well-being. These include mindfulness and meditation training, financial wellness seminars, health fairs, discounted gym memberships, free flu shots, and on-site discounted food. We also offer an Employee Assistance Program with a range of programs, resources and tools that can help with myriad issues. To help manage work-life balance, we offer a paid membership to Care.com so employees can find childcare, senior care, special needs care and other related services.
COVID-19
The health and safety of our team members is of the highest importance. Our focus on the safety of our team members is evident in our response to COVID-19 starting back in March 2020. We initially closed down all stores to ensure the safety of our customers and retail associates, and then we added working from home flexibility for our corporate positions that can be accomplished remotely. We increased cleaning protocols, implemented onsite temperature screening, upgraded our HVAC systems, provided personal protective equipment and related supplies as needed, established new spacing and schedules to maximize social distancing while at work, and have also provided regular communications regarding impacts of COVID-19, including health and safety protocols and procedures.
Seasonality and Other Factors
Our operating results are subject to some variability due to seasonality and other factors. For example, the highest percentage of our boot sales occur in the fall and winter months (our third and fourth fiscal quarters) and the highest percentage of our sandal sales occur in the spring and summer months (our first and second fiscal quarters). Historically, some of our businesses, including our Retail segment, have experienced holiday retail seasonality. Our diverse range of product offerings, however, provides some mitigation to the impact of seasonal changes in demand for certain items. In addition to seasonal fluctuations, our operating results fluctuate from quarter to quarter as a result of the weather, the timing of holidays and larger shipments of footwear, market acceptance of our products, pricing and presentation of the products offered and sold, the hiring and training of additional personnel, inventory write downs for obsolescence, the cost of materials, the product mix among our wholesale, retail and licensing businesses, the incurrence of other operating costs and factors beyond our control, such as general economic conditions and actions of competitors. Revenue levels in any period are also impacted by customer decisions to increase or decrease their inventory levels in response to anticipated consumer demand. Our customers may cancel orders, change delivery schedules or change the mix of products ordered with minimal notice to us.
Backlog
We had unfilled wholesale customer orders of approximately $328,600$310,198 and $369,458,$328,600, as of February 3, 20201, 2021 and February 1, 2019,3, 2020, respectively. Our backlog at a particular time is affected by a number of factors, including seasonality, timing of market weeks and wholesale customer purchases of our core products through our open stock program. Accordingly, a comparison of backlog from period to period may not be indicative of eventual shipments.
ITEM 1A. RISK FACTORS
You should carefully consider the risks and uncertainties we describe below and the other information in this Annual Report on Form 10-K before deciding to invest in, sell or retain shares of our common stock. These are not the only risks and uncertainties that we face. Other sections of this report may discuss factors that could adversely affect our business. Our industry is highly competitive and subject to rapid change. There may be additional risks and uncertainties that we do not currently know about, or that we currently believe are immaterial, or that we have not predicted, which may also harm our business or adversely affect us. If any of these risks or uncertainties actually occurs, our business, financial condition, results of operations and liquidity could be materially harmed.
COVID-19 RISKS
Our ability to maintain adequate liquidity when negatively impacted by unforeseen events such as an epidemic or pandemic such as COVID-19, which may cause disruption to our business operations and temporary closure of Company-operated and wholesale partner retail stores, resulting in a significant reduction in revenue for an indeterminable period of time.
In December 2019, COVID-19 emerged and spread worldwide. The World Health Organization declared COVID-19 a pandemic in March 2020, resulting in federal, state and local governments and private entities mandating various restrictions, including the closure of non-essential businesses, travel restrictions, restrictions on public gatherings, stay-at-home orders and advisories and quarantining of people who may have been exposed to the virus. After closely monitoring and taking into consideration the guidance from federal, state and local governments, in March 2020, we temporarily closed all of our stores and our corporate offices in the U.S. and the vast majority of our stores and offices globally. As of August 2020, the vast majority of our stores and corporate offices in the U.S. and globally reopened. In the fourth quarter 2020, we had to re-close one-third of our stores, and currently almost all our stores are open again. However, there can be no assurance that our stores or offices will continue to remain open if there is a subsequent surge in COVID-19 cases or national or local governments institute lock-down or other restrictive measures where we manufacture or sell our products. These and other similar factors have had and may continue to have a material adverse impact on our business, results of operations, financial position and cash flow.
INDUSTRY RISKS
The fashion footwear, accessories and apparel industry is subject to rapid changes in consumer preferences. If we do not accurately anticipate fashion trends and promptly respond to consumer demand, we could lose sales, our relationships with customers could be harmed and our brand loyalty could be diminished.
The strength of our brands and our success depends in significant part upon our ability to anticipate and promptly respond to product and fashion trends as well as to anticipate, gauge and react to changing consumer demands in a timely manner. There can be no assurance that our products will correspond to the changes in taste and demand or that we will be able to successfully advertise and market products that respond to trends and customer preferences. If we misjudge the market for our products, we may be faced with significant excess inventories for some products and missed opportunities as to others. In addition, misjudgments in merchandise selection could adversely affect our image with our customers resulting in lower sales and increased markdown allowances for customers, which could have a material adverse effect on our business, financial condition, results of operations and liquidity.
We face intense competition from both established companies and newer entrants into the market. Our failure to compete effectively could cause our market share to decline, which could harm our reputation and have a material adverse impact on our financial condition, results of operations and liquidity.
The fashion footwear, accessories and apparel industry is highly competitive and barriers to entry are low. Our competitors include specialty companies as well as companies with diversified product lines. Market growth in the sales of fashion footwear, accessories and apparel has encouraged the entry of many new competitors and increased competition from established companies. Many of these competitors, including Aldo, Sam Edelman, Deckers Outdoor CorporationJessica Simpson, Lucky Brand and Vince Camuto, may have significantly greater financial and other resources than we do, and there can be no assurance that we will be able to compete successfully with these and other fashion footwear, accessories and apparel companies. Increased competition could result in pricing pressures, increased marketing expenditures and loss of market share and could have a material adverse effect on our business, financial condition, results of operations and liquidity.
12
If we and the retailers that are our customers are unable to adapt to recent and anticipated changes in the retail industry, the sales of our products may decline, which could have a material adverse effect on our financial condition, results of operations and liquidity.
In recent years, the retail industry has experienced consolidation and other ownership changes. In the future, retailers in the United States and in foreign markets may further consolidate, undergo restructurings or reorganizations, or realign their affiliations, any of which could decrease the number of stores that carry our or our licensees’ products or increase the ownership concentration within the retail industry. Changing shopping patterns, including the rapid expansion of online retail shopping and the effect of the COVID-19 pandemic, have adversely affected customer traffic in mall and outlet centers, particularly in North America. We expect competition in the e-commerce market will intensify. As a greater portion of consumer expenditures with retailers occurs online and through mobile commerce applications, our brick-and-mortar retail customers who fail to successfully integrate their physical retail stores and digital retail may experience financial difficulties, including store closures, bankruptcies or liquidations. A continuation or worsening of these trends could cause financial difficulties for one or more of our major customers, which, in turn, could substantially increase our credit risk and have a material adverse effect on our results of operations, financial condition and cash flows. We have little or no control over how our customers will respond to the challenges posed by these changes in the retail industry. Our success will be determined, in part, on our and our customers’ ability to manage the impact of the rapidly changing retail environment and identify and capitalize on retail trends, including technology, e-commerce and other process efficiencies that will better service our customers. If we and our customers fail to compete successfully, our businesses, market share, results of operations and financial condition could be materially and adversely affected. While such changes in the retail industry themselves to date have not had a material adverse effect on our business or financial condition, results of operations and liquidity, there can be no assurance as to the future effect of any such changes.
RISKS RELATING TO OUR COMPANY
The loss of Steve Madden, our founder and Creative and Design Chief, or members of our executive management team could have a material adverse effect on our business.
The growth and success of our Company since its inception more than a quarter century ago is attributable, to a significant degree, to the talents, skills and efforts of our founder and Creative and Design Chief, Steven Madden. An extended or permanent loss of the services of Mr. Madden could severely disrupt our business and have a material adverse effect on our Company. We also depend on the contributions of the members of our senior management team. Our senior executives have substantial experience and expertise in our business and industry and have made significant contributions to our growth and success. Competition for executive talent in the fashion footwear, accessories and apparel industries is intense. While our employment agreements with Mr. Madden and most of our senior executives include a non-compete provision in the event of the termination of employment, the non-compete periods are of limited duration and scope. Although we believe we have depth within our senior management team, if we were to lose the services of our Creative and Design ChiefMr. Madden or any of our senior executives, and especially if any of these individuals were to join a competitor or form a competing company, our business and financial performance could be seriously harmed. A loss of the skills, industry knowledge, contacts and expertise of our Creative and Design ChiefMr. Madden or any of our senior executives could cause a setback to our operating plan and strategy.
If we are not successful in implementing our growth strategy or integrating acquired businesses, we may not be able to take advantage of certain market opportunities and may become less competitive.
and training of new personnel. However, in order to manage currently anticipated levels of future demand, we may be required to, among other things, expand our distribution facilities, establish relationships with new manufacturers to produce our products and continue to expand and improve our financial, management and operating systems. We may experience difficulty integrating acquired businesses into our operations and may not achieve anticipated synergies from such integration. There can be no assurance that we will be able to manage future growth effectively and a failure to do so could have a material adverse effect on our business, financial condition, results of operations and liquidity.
13
If one or more of our significant customers were to reduce or stop purchases of our products, our sales and profits could decline.
Our financial results are subject to quarterly fluctuations.
Our results of operations may fluctuate from quarter to quarter and are affected by a variety of factors, including:
•the timing of larger shipments of products;
•market acceptance of our products;
•the mix, pricing and presentation of the products offered and sold;
•the hiring and training of additional personnel;
•inventory write downs for obsolescence;
•the cost of materials;
•the product mix between wholesale, retail and licensing businesses;
•the incurrence of other operating costs;
•factors beyond our control, such as general economic conditions, declines in consumer confidence and actions of competitors;
•the timing of holidays; and
•weather conditions.
In addition, we expect that our sales and operating results may be significantly impacted by the opening of new retail stores and the introduction of new products. Accordingly, the results of operations in any quarter will not necessarily be indicative of the results that may be achieved for a full fiscal year or any future quarter.
Extreme or unseasonable weather conditions in locations where we or our customers and suppliers are located could adversely affect our business.
Our corporate headquarters and principal operational locations, including retail, distribution and warehousing facilities, may be subject to natural disasters and other severe weather and geological events that could disrupt our operations. The occurrence of such natural events may result in sudden disruptions in business conditions of the local economies affected, as well as of the regional and global economies. Such disruptions may result in decreased demand for our products and disruptions in our management functions, sales channels and manufacturing and distribution networks, which could have a material adverse effect on our business, financial condition and results of operations. Extreme weather events and changes in weather patterns can also influence customer trends and shopping habits. Extended periods of unseasonably warm temperatures during the winter season or cool weather during the summer season may diminish demand for our seasonal merchandise. Heavy snowfall, hurricanes or other severe weather events where our retail stores and the retail stores of our wholesale customers are located may decrease customer traffic in those stores and reduce our sales and profitability. If severe weather events force closure of or disrupt operations at the distribution centers we use for our merchandise, we could incur higher costs and experience longer lead times to distribute our products to our retail stores, wholesale customers or e-commerce customers. If prolonged, such extreme or unseasonable weather conditions could adversely affect our business, financial condition and results of operations.
We extend credit to most of our customers in the United States, and their failure to pay for products shipped to them could adversely affect our financial results.
We sell our products primarily to retail stores across the United States and extend credit based on an evaluation of each customer's financial condition, usually without collateral. Various retailers, including some of our customers, have experienced financial difficulties, which has increased the risk of extending credit to such retailers. Even though we seek to mitigate the risks of extending credit by factoring most of our accounts receivable and obtaining letters of credit for others, if any of our customers were to experience a shortage of liquidity, the risk that the customer's outstanding payables to us would not be paid
14
could cause us to curtail business with the customer or require us to assume more credit risk relating to the customer's accounts payable.
Our stock price may fluctuate substantially if our operating results are inconsistent with our forecasts or those of analysts who follow us.
The trading price of our common stock periodically may rise or fall based on the accuracy of forecasts of our future performance. One of our primary business objectives is to maximize the long-term strength, growth and profitability of our Company, rather than to achieve an earnings target in any particular fiscal quarter. We believe that this longer-term goal is in our best interests and those of our stockholders. Although we have temporarily suspended offering guidance as to our quarterly and annual forecast of net sales and earnings, we recognize that it may be helpful to our stockholders and potential investors to provide such guidance in the future. In that case, we will endeavor to provide meaningful and considered guidance at the time it is provided and generally expect to provide updates to our guidance when we report our quarterly results. However, our actual results may differ from our forecasts as the guidance is based on assumptions and expectations that may or may not come to pass. As such, we assume no responsibility to update any of our forward-looking statements at such times or otherwise. If and when we announce actual results that differ from those that we have forecast, the market price of our common stock could be adversely affected. Investors who rely on these forecasts in making investment decisions with respect to our common stock do so at their own risk. We take no responsibility for any losses suffered as a result of such changes in the price of our common stock.
In addition, outside securities analysts may follow our financial results and issue reports that discuss our historical financial results and their predictions of our future performance. These analysts' predictions are based upon their own opinions and are often different from our own forecasts. Our stock price could decline if our results are below the estimates or expectations of these outside analysts.
FOREIGN SOURCING RISKS
Disruptions to our product delivery systems and failure to effectively manage inventory based on business trends across various distribution channels could have a material adverse effect on our business, financial condition, results of operations and liquidity.
Most of our products for U.S. distribution are shipped to us via ocean freight carriers to ports primarily in California, and to a lesser extent in New Jersey and Texas. The trend-focused nature of the fashion industry and the rapid changes in customer preferences leave us vulnerable to the risk of inventory obsolescence. Our reliance upon ocean freight transportation for the delivery of our inventory exposes us to various inherent risks, including port workers’ union disputes and associated strikes, work slow-downs and stoppages, severe weather conditions, natural disasters, and terrorism, any of which could result in delivery delays and inefficiencies, increase our costs and disrupt our business. Any severe and prolonged disruption to ocean freight transportation could force us to use alternate and more expensive transportation systems. Efficient and timely inventory deliveries and proper inventory management are important factors in our operations. Inventory shortages can adversely affect the timing of shipments to customers and diminish sales and brand loyalty. Conversely, excess inventories can result in lower gross margins due to the excessive discounts and markdowns that may be necessary to reduce high inventory levels. Severe and extended delays in the delivery of our inventory or our inability to effectively manage our inventory could have a material adverse effect on our business, financial condition, results of operations and liquidity.
Our foreign manufacturers’ inability to produce our goods in a timely manner or to meet our quality standards could adversely affect our financial results and harm our brands’ reputation.
We do not own or operate any foreign manufacturing facilities and, therefore, are dependent upon third parties to manufacture most of our products. The risks inherent in reliance on foreign manufacturing include work stoppages, transportation delays, public health emergencies, social unrest, changes in local economic conditions, and political upheavals. During 2019, 88%2020, 78% of our total purchases were from China. In the first quarter of 2020, China is currently experiencingexperienced a public health emergency due to the spread of the coronavirus,COVID-19, and manufacturing facilities that produce our products have beenwere initially shut down beyondand then resumed at limited capacity. Subsequently, COVID-19 became a world-wide pandemic, affecting all of our foreign manufacturing facilities. Due to a resurgence of the customary lunar new year holiday. Although manufacturing has resumed, manufacturersCOVID-19 virus, some of those facilities have shut down entirely and others are currently notoperating at fulllimited capacity. We cannot accurately predict when and whether those manufacturers will return to full capacity or the extent to which the coronavirus epidemicCOVID-19 pandemic will have short- or long-term adverse effects on the ability of manufacturers in China and other countries to produce our products. The inability of Chinese or other manufacturers to ship orders of our products in a timely manner or to meet our quality standards could cause us to miss the delivery date requirements of our customers for those items. Such failures could result in the cancellation of orders, customers’ refusal to accept deliveries,
15
a reduction in purchase prices, and ultimately, termination of a customer relationship, any of which could have a material adverse effect on our business, financial condition, results of operations and liquidity. In that case, we may be required to seek alternative sources of materials or products. Although we believe that we can manage our exposure to these risks, we cannot be certain that we will be able to identify such alternative materials or sources without delay or without greater cost to us. Our inability to identify and secure alternative sources of supply in this situation could have a material adverse effect on our ability to satisfy customer orders.
Changes in trade policies and tariffs imposed by the United States government and the governments of other nations could have a material adverse effect on our business and results of operations.
Our operations are dependent upon products purchased, manufactured and sold internationally. Our sources of supply are subject to the usual risks of doing business abroad, such as the implementation of, or potential changes in, foreign and domestic trade policies, increases in import duties, anti-dumping measures, quotas, safeguard measures, trade restrictions, restrictions on the transfer of funds and, in certain parts of the world, political instability and terrorism. In 2018 and 2019, the United States government imposed significant tariffs and created the potential for significant additional changes in trade policies, including tariffs and government regulations affecting trade between the United States and countries where we purchase, manufacture and sell our products. These trends are affecting many global manufacturing and service sectors, including the footwear, accessories and apparel industries, and may cause us to face trade protectionism in many different regions of the world. These protectionist measures could result in increases in the cost of our products and adversely affect our sales and profitability.
Effective September 24, 2018, the United States government imposed additional tariffs on approximately $200 billion of goods imported from China. The additional tariffs on Chinese imports were initially set at a level of 10% and were increased to 25% in May 2019. This initial round of tariffs applied to handbags and certain other accessories that we produce. In August 2019, the United States government announced a second round of tariffs set at a level of 15% on approximately $300 billion of goods imported from China, including footwear, apparel and certain other accessories that we produce. The second round of tariffs became effective on September 1, 2019, for a portion of the covered products that we produce. Tariffs for the remaining covered products that we produce were scheduled to become effective on December 15, 2019, but were suspended indefinitely as part of the phase I trade agreement between the United States and China that was signed on January 15, 2020. In addition, as of February 14, 2020, the 15% tariff that was implemented on September 1, 2019 was reduced to 7.5%. China has already imposed retaliatory tariffs on a wide range of American products in response to these tariffs. Most of the products that we sell in the United States have been manufactured in China. The negative impact in gross margin in our wholesale business in the fourth quarter of 2018 and throughout 2019 was due, in part, to the impact of the 25% tariff on handbags and certain other accessory categories as well as the 15% tariff on footwear, apparel, and other accessory categories. Our efforts to mitigate the impact of these tariffs may not be successful, and the continued imposition of tariffs on products that we import from China could have a material adverse effect on our business and results of operations.
On November 30, 2018,December 31, 2020, the United StatesGeneralized System of America,Preferences ("GSP") expired. GSP is a trade program that provides nonreciprocal, duty-free treatment for certain U.S. imports (including handbags) from qualifying developing countries including Cambodia, Myanmar, Thailand, Indonesia, Sri Lanka, the United Mexican States,Philippines, and Canada Trade Agreement (the “USMCA”) was draftedPakistan, among others. We currently manufacture handbags in GSP countries, primarily Cambodia. The additional tariff to be paid on such products ranges from 3.3% to 17.6%. GSP has historically been renewed, despite lapsing several times, and upon renewal has been retroactive in nature. There is a current debate in Congress as partto whether reauthorize the program “as is” or revise GSP eligibility criteria to include environmental and labor conditions. If GSP is not renewed and our efforts to mitigate the impact of this additional tariff are not successful, the renegotiationimposition of the North American Free Trade Agreement (“NAFTA”) among the United States, Mexico and Canada. The U.S. House of Representatives ratified a revised version of the USMCAtariffs on December 19, 2019, and the Senate ratified it on January 16, 2020. It became effective upon the president's signature on January 29, 2020. We are presently evaluating the extent to which the USMCA would affect our business. Depending on how it is applied, it could necessitate changeshandbags that we manufacture in the way we conduct our business, including our product sourcing operations, andrelated countries could have a material adverse effect on our business and results of operations.
If our manufacturers, the manufacturers used by our licensees or our licensees themselves fail to use acceptable labor practices or to otherwise comply with local laws and other standards, our business could suffer.
Our products are manufactured by numerous independent manufacturers outside of the United States. We also have license agreements that permit our licensees to manufacture or contract to manufacture products using our trademarks. We impose, and require our licensees to impose, on these manufacturers environmental, health and safety standards for the benefit of their labor force. In addition, we require these manufacturers to comply with applicable standards for product safety. However, we do not control our independent manufacturers or licensing partners or their labor, product safety and other business practices. From time to time, our independent manufacturers may not comply with such standards or applicable local law or our licensees may not require their manufacturers to comply with such standards or applicable local law. The violation of such standards and laws by one of our independent manufacturers or by one of our licensing partners, or the divergence of a manufacturer's or a licensing partner's labor practices from those generally accepted as ethical in the United States, could harm our reputation, result in a product recall or require us to curtail our relationship with and locate a replacement for such
16
manufacturer. We could also be the focus of adverse publicity and our reputation could be damaged. Any of these events could have a material adverse effect on our business, financial condition, results of operations and liquidity.
GLOBAL BUSINESS RISKS
Our global operations expose us to a variety of legal, regulatory, political and economic risks that may adversely impact our results of operations in certain regions.
As aresult of our international operations, we are subject to risks associated with our operations in international markets as a result of a number of factors, many of which are beyond our control. These risks include, among other things:
•the challenge of managing broadly dispersed foreign operations;
•inflationary pressures and economic changes or volatility in foreign economies;
•the burdens of complying with the laws and regulations of both U.S. and foreign jurisdictions;
•additional or increased customs duties, tariffs, taxes and other charges on imports or exports;
•political corruption or instability;
•geopolitical regional conflicts, terrorist activity, political unrest, civil strife and acts of war;
•local business practices that do not conform to U.S. legal or ethical guidelines;
•anti-American sentiment in foreign countries in which we operate;
•delays in receipts of our products at our distribution centers due to labor unrest, increasing security requirements or other factors at U.S. or foreign ports;
•significant fluctuations in the value of the dollar against foreign currencies;
•increased difficulty in protecting our intellectual property in foreign jurisdictions;
•restrictions on the transfer of funds between the U.S. and foreign nations; and
•natural disasters or health epidemics in areas in which our businesses, customers, suppliers and licensees are located.
All of these factors could disrupt our operations or limit the countries in which we sell or source our products, significantly increase the cost of operating in or obtaining materials originating from certain countries, result in decreased revenues, and materially and adversely affect our product sales, financial condition and results of operations.
We are subject to the U.S. Foreign Corrupt Practices Act, which prohibits the payment of bribes to foreign officials to assist in obtaining or retaining business. We are also subject to anti-corruption laws of the foreign countries in which we operate. Although we have implemented policies and procedures that are designed to promote compliance with such laws, our employees, contractors and agents may take actions that violate our policies and procedures. Any such violation could result in sanctions or other penalties against us and have an adverse effect on our business, reputation and operating results.
Our business is exposed to foreign exchange rate fluctuations.
We make most of our purchases in U.S. dollars. However, we source substantially all of our products overseas, and as such, the cost of these products may be affected by changes in the value of the relevant currencies against the U.S. dollar. Changes in currency exchange rates may also affect the relative prices at which we and our foreign competitors sell products in the same market. We use forward foreign exchange contracts to hedge material exposure to adverse changes in foreign exchange rates. However, no hedging strategy can completely insulate us from foreign exchange risk. We are also exposed to gains and losses resulting from the effect that fluctuations in foreign currency exchange rates have on the reported results in our financial statements due to the translation of operating results and financial position of our foreign subsidiaries. There can be no assurance that foreign currency fluctuations will not have a material adverse effect on our business, financial condition, results of operations and liquidity.
17
We may be subject to additional tax liabilities as a result of audits by various taxing authorities.
We are subject to the tax laws and regulations of numerous jurisdictions as a result of our international operations. These tax laws and regulations are highly complex and significant judgment and specialized expertise is required in evaluating and estimating our worldwide provision for income taxes. We are subject to audit by the taxing authorities in each jurisdiction where we conduct our business and any one of these jurisdictions may assess additional taxes against us as a result of an audit. The final determination with respect to any tax audits, and any related litigation, could be different from our estimates or from our historical tax provisions and accruals. The outcome of any audit or audit-related litigation could have a material adverse effect on our operating results or cash flows in the periods for which that determination is made and may require a restatement of prior financial reports. In addition, future period earnings may be adversely impacted by litigation costs, settlement payments or interest or penalty assessments.
INFORMATION TECHNOLOGY RISKS
Disruption of our information technology systems and websites could adversely affect our financial results and our business reputation.
We are heavily dependent upon our information technology systems to record and process transactions and manage and operate all aspects of our business.
We also have e-commerce websites for direct retail sales.
Given the nature of our business and the significant number of transactions in which we engage annually, it is essential that we maintain constant operation of our information technology systems and websites and that they operate effectively. We depend on our in-house information technology employees and third parties, including “cloud” service providers, to maintain and periodically update and upgrade our systems and websites to support the growth of our business. We also maintain an off-site server data facility that records and processes information regarding our vendors and customers and their transactions with us. Our internal cybersecurity controls and systems are audited on an annual basis to ensure they are working effectively. External security testing is also conducted annually on our stores, corporate locations and e-commerce sites. Issues noted during audit or testing are remediated and subsequently retested to ensure proper closure. We are also audited both internally and externally to maintain compliance with the Sarbanes-Oxley Act, PCI-DSS, GDPR and CCPA. In addition, security training is conducted annually for our employees via a recognized market leading platform for Security Awareness and Training Solutions. Email Phishing campaigns are also conducted via this platform by the Information Security team throughout the year. A cyber security awareness campaign is launched each October in conjunction with Cyber Security Awareness Month. Despite our preventative efforts, our information technology systems and websites may, from time to time, be vulnerable to damage or interruption from events such as computer viruses, security breaches, power outages and difficulties in replacing or integrating the systems of acquired businesses. Any such problems or interruptions could result in loss of valuable business data, our customers' or employees' personal information, disruption of our operations and other adverse impacts to our business and require significant expenditures by us to remediate any such failure, problem or breach. In addition, we must comply with increasingly complex regulatory standards enacted to protect business and personal data and an inability to maintain compliance with these regulatory standards could subject us to legal risks and penalties. Although we maintain insurance coverage aimed at addressing certain of these risks, there can be no assurance that insurance coverage will be available or that the amounts of coverage will be adequate to cover a specific loss.
Our business and reputation could be adversely affected if our computer systems or the systems of our business partners or service providers, become subject to a data security or privacy breach or other disruption from a third party.
In addition to our own confidential and proprietary business information, a routine part of our business includes the gathering, processing and retention of sensitive and confidential information pertaining to our customers, employees and others. We, our business partners or our service providers may not have the resources or technical sophistication to anticipate or prevent the rapidly evolving and complex cyber-attacks being unleashed by increasingly sophisticated hackers and data thieves. As a result, our facilities and information technology systems, as well as those of our business partners and third-party service providers, may be vulnerable to cyber-attacks and breaches, acts of vandalism, ransomware, software viruses and other similar types of malicious activities. Any actual or threatened cyber-attack may cause us to incur unanticipated costs, including costs related to the hiring of additional computer experts, business interruption, engaging third-party cyber security consultants and upgrading our information security technologies. As a result of recent security breaches at a number of prominent companies, the media and public scrutiny of information security and privacy has become more intense and the regulatory environment has become more uncertain. Any compromise or breach of our information technology systems or those of our business partners or service providers that results in the misappropriation, loss or other unauthorized disclosure of a customer’s or other person’s private, confidential or proprietary information could result in:
18
•a loss of confidence in us by our customers and business partners;
•violate applicable privacy and other laws;
•expose us to litigation and significant potential liability; or
•require us to expend significant resources to remedy any such breach and redress any damages cause by such a breach.
We must also comply with increasingly rigorous regulatory standards for the protection of business and personal data enacted in the U.S., Europe and elsewhere. For example, the European Union’s General Data Protection Regulation (the “GDPR”) became effective on May 25, 2018. The GDPR imposes additional obligations on companies concerning the handling of personal data and provides certain individual privacy rights to persons whose data is stored. Our compliance with existing, proposed and recently enacted laws (including implementation of the privacy and process enhancements required by the GDPR) and regulations can be costly. Any failure by us to comply with these regulatory standards could subject us to significant legal and reputational harm.
INTELLECTUAL PROPERTY RISKS
Failure to adequately protect our trademarks and intellectual property rights, to prevent counterfeiting of our products or to defend claims against us related to our trademarks and intellectual property rights could reduce sales and adversely affect the value of our brands.
We believe that our trademarks and other proprietary rights are of major significance to our success and our competitive position, and we consider some of our trademarks, such as Steve Madden®, to be integral to our business and among our most valuable assets. Accordingly, we devote substantial resources to the establishment and protection of our trademarks on a worldwide basis. Nevertheless, policing unauthorized use of our intellectual property is difficult, expensive and time consuming. There can be no assurance that the actions we take to establish and protect our trademarks and other proprietary rights will be adequate to prevent imitation of our products by others or to prevent others from seeking to block sales of our products on the basis that our products violate the trademarks or other proprietary rights of others. Moreover, no assurance can be given that others will not assert rights in, or ownership of, trademarks and other proprietary rights of ours or that we will be able to successfully resolve such conflicts. We could incur substantial costs in legal actions relating to our use of intellectual property or the use of our intellectual property by others. In addition, the laws of certain foreign countries may not protect proprietary rights to the same extent as do the laws of the United States. Our failure to establish and protect such proprietary rights from unlawful and improper use could have a material adverse effect on our business, financial condition, results of operations and liquidity.
A portion of our revenue is dependent on licensing our trademarks. The actions of our licensees or the loss of a significant licensee could diminish our brand integrity and adversely affect our revenue and results of operations.
We license to others the rights to produce and market certain products that are sold under our trademarks. Although we retain significant control over our licensees’ products and advertising, we rely on our licensees for operational and financial control over their businesses. If the quality, image or distribution of our licensed products diminish, customer acceptance of and demand for our brands and products could decline. This could materially and adversely affect our business and results of operations. In fiscal year 2019,2020, approximately 90% of our net royalties were derived from our top five licensed product lines. A decrease in customer demand for any of these product lines could have a material adverse effect on our results of operations and financial condition. Furthermore, if we are unable to engage an adequate replacement for a terminated licensee or to engage such a replacement for an extended period, our revenues and results of operations could be adversely affected.
GENERAL RISK FACTORS
Changes in economic conditions may adversely affect our financial condition, results of operations and liquidity.
Our opportunities for long-term growth and profitability are accompanied by significant challenges and risks, particularly in the near term. Specifically, our business is dependent on consumer demand for our products and the purchase of our products by consumers is largely discretionary. Consumer confidence and discretionary spending could be adversely affected in response to financial market volatility, negative financial news, conditions in the real estate and mortgage markets, declines in income or asset values, changes to fuel and other energy costs, labor and healthcare costs, food costs and other economic factors. A downturn in economic conditions leading to a reduction in consumer confidence and discretionary spending could have a negative effect on our sales and results of operations during the year ending December 31, 20202021 and thereafter.
19
We are involved in various claims, litigations and other legal and regulatory proceedings and governmental investigations that arise from time to time in the ordinary course of our business. Due to the inherent uncertainties of litigation and such other proceedings and investigations, we cannot predict with accuracy the ultimate outcome of any such matters. An unfavorable outcome could have an adverse impact on our business, financial condition and results of operations.
Changes in tax laws could have an adverse effect upon our financial results.
We are subject to income taxation in various jurisdictions in the United States and numerous foreign jurisdictions. Tax laws and regulations, or their interpretation and application, in any jurisdiction are subject to significant changes. Legislation or other changes in the tax laws of the jurisdictions where we do business could increase our tax liability and adversely affect our
after-tax profitability. Adjustments to the incremental provisional tax expense may be made in future periods as actual amounts may differ due to, among other factors, a change in interpretation of the U.S. tax code and related tax accounting guidance, changes in assumptions made in developing these estimates, regulatory guidance that may be issued with respect to the applicable revisions to the U.S. tax code and state tax implications.
Other jurisdictions are contemplating changes or have unpredictable enforcement activity. Increases in applicable tax rates, implementation of new taxes, changes in applicable tax laws and interpretations of these tax laws and actions by tax authorities in jurisdictions in which we operate could reduce our after taxafter-tax income and have an adverse effect on our results of operations.
SEC rules relating to “conflict minerals” require us to incur additional expenses and could adversely affect our business.
The SEC has promulgated final rules mandated by the Dodd-Frank Wall Street Reform and Consumer Protection Act requiring the disclosure of the use of tantalum, tin, tungsten and gold, known as “conflict minerals,” included in products either manufactured by public companies or as to which public companies have contracted for the manufacture. These rules, adopted in an effort to prevent inadvertent support of armed conflict in the Democratic Republic of Congo and certain adjoining countries (collectively, the “DRC”), require companies to investigate their supply chains to determine whether these minerals are present in their products and, if so, from where the minerals originate. The rules also require disclosure and annual reporting as to whether or not conflict minerals, if used in the manufacture of the products offered, originate from the DRC. We currently require our manufacturers to comply with policies addressing legal and ethical concerns relating to labor, employment, political and social matters, including restrictions on the use of conflict minerals. Violation of these policies by our manufacturers could harm our reputation, disrupt our supply chain or increase our cost of goods sold. Additionally, violation of any of these policies by our manufacturers could cause us to face disqualification as a supplier for our customers and suffer reputational challenges. Due to the complexity of our supply chain, compliance with the rules requires significant efforts from a cross-operational team and diverts our management and personnel and results in potential costs of additional staff. Any of the foregoing could adversely affect our sales, net earnings, business and financial condition and results of operations.
Any failure to maintain effective internal control over our financial reporting could materially adversely affect us.
Section 404 of the Sarbanes-Oxley Act of 2002 requires us to include in our annual reports on Form 10-K an assessment by management of the effectiveness of our internal control over financial reporting. In particular, we must perform system and process evaluation and testing of our internal control over financial reporting to allow management and our independent registered public accounting firm to report on the effectiveness of our internal control over financial reporting, as required by Section 404 of the Sarbanes-Oxley Act of 2002. Our compliance with Section 404 may require us to incur substantial accounting expense and expend significant management efforts. Our failure to maintain effective internal controls could result in a determination by our auditors that a material weakness or significant deficiency exists in our internal controls. Such a determination could result in a loss of investor confidence in the reliability of our financial statements and could require
20
us to restate our quarterly or annual financial statements. These factors could, in turn, negatively affect the price of our common stock.
ITEM 1B. UNRESOLVED STAFF COMMENTS
None.
ITEM 2. PROPERTIES
We lease space for our headquarters, our retail stores, showrooms and office facilities in various locations in the United States, as well as overseas. We own one improved real property parcel in Long Island City, New York. We believe that our existing facilities are in good operating condition and are adequate for our present level of operations. The following table sets forth information with respect to our key properties:
| Location | Leased/Owned | Primary Use | Approximate Area Square Feet | ||||||||
| Dongguan, China | Leased | Offices and sample production | 154,900 | ||||||||
| Long Island City, NY | Leased | Executive offices | 111,000 | ||||||||
| Leased | Offices, | ||||||||||
| Bellevue, WA | Leased | Offices, Topline | 41,500 | ||||||||
| New York, NY | Leased | Offices and showroom, Accessories | 27,200 | ||||||||
| New York, NY | Leased | Showroom | 21,800 | ||||||||
| New York, NY | Leased | Offices and showroom, Schwartz & Benjamin | |||||||||
| Costa Mesa, CA | Leased | Offices, BB Dakota | 10,500 | ||||||||
| New York, NY | Leased | Offices and showroom | 10,000 | ||||||||
| Putian City, China | Leased | Offices | |||||||||
| Long Island City, NY | Leased | Storage | 7,200 | ||||||||
| León, Mexico | Leased | Offices | 6,400 | ||||||||
| Mexico City, Mexico | Leased | Offices, SM Mexico | 5,700 | ||||||||
| Leased | Offices | 4,800 | |||||||||
| Los Angeles, CA | Leased | Offices, BB Dakota | |||||||||
| Leased | Offices, GREATS | ||||||||||
| Miami Gardens, FL | Leased | Storage | 3,600 | ||||||||
| Los Angeles, CA | Leased | ||||||||||
| Leased | |||||||||||
| Long Island City, NY | Owned | Other | 2,200 | ||||||||
| Leased | |||||||||||
| Mississauga, Canada | Leased | Showroom | 1,000 | ||||||||
| Dallas, TX | Leased | Showroom | 1,000 | ||||||||
21
All of our retail stores are leased pursuant to leases that, under their original terms, extend for an average of ten years. Many of the leases contain rent escalation clauses to compensate for increases in operating costs and real estate taxes over the base year. The current terms of our retail store leases expire as follows:
| Year | Number of Stores | ||||
| 2021 | 31 | ||||
| 2022 | 56 | ||||
| 2023 | 36 | ||||
| 2024 | 21 | ||||
| 2025 | 26 | ||||
| 2026 | 23 | ||||
| 2027 | 9 | ||||
| 2028 | 6 | ||||
| 2029 | 5 | ||||
| 2030 | 2 | ||||
| Year | Number of Stores |
| 2020 | 33 |
| 2021 | 32 |
| 2022 | 44 |
| 2023 | 34 |
| 2024 | 20 |
| 2025 | 25 |
| 2026 | 15 |
| 2027 | 9 |
| 2028 | 6 |
| 2029 | 5 |
| 2030 | 1 |
ITEM 3. LEGAL PROCEEDINGS
In the ordinary course of business, we have various pending cases involving contractual disputes, employee-related matters, distribution matters, product liability claims, trademark infringement and other matters. In the opinion of management, after consulting with legal counsel, the liabilities, if any, resulting from these legal proceedings should not have a material impact on our financial condition, results of operations or liquidity.
ITEM 4. MINE SAFETY DISCLOSURES
Not applicable.
PART II
ITEM 5. MARKET FOR REGISTRANT'S COMMON EQUITY, RELATED STOCKHOLDER MATTERS AND
ISSUER PURCHASES OF EQUITY SECURITIES
($ in thousands, except share and per share data)
Market Information. Our shares of common stock have traded on the NASDAQ Global Select Market since August 1, 2007 under the trading symbol SHOO and were traded on the NASDAQ National Market prior to that date. The following table sets forth the range of high and low closing sales prices for our common stock during each fiscal quarter during the two-year period ended December 31, 20192020 as reported by the NASDAQ Global Select Market. The trading volume of our securities fluctuates and may be limited during certain periods. As a result, the liquidity of an investment in our securities may be adversely affected.
| Common Stock | |||||||||||||||||
| 2020 | High | Low | 2019 | High | Low | ||||||||||||
| Quarter ended March 31, 2020 | $43.47 | $16.38 | Quarter ended March 31, 2019 | $35.38 | $29.71 | ||||||||||||
| Quarter ended June 30, 2020 | $30.00 | $17.83 | Quarter ended June 30, 2019 | $36.87 | $29.43 | ||||||||||||
| Quarter ended September 30, 2020 | $25.13 | $18.47 | Quarter ended September 30, 2019 | $36.82 | $28.85 | ||||||||||||
| Quarter ended December 31, 2020 | $36.05 | $19.24 | Quarter ended December 31, 2019 | $44.80 | $33.20 | ||||||||||||
22
| Common Stock | |||||
| 2019 | High | Low | 2018 | High | Low |
| Quarter ended March 31, 2019 | $35.38 | $29.71 | Quarter ended March 31, 2018 | $32.85 | $27.77 |
| Quarter ended June 30, 2019 | $36.87 | $29.43 | Quarter ended June 30, 2018 | $37.00 | $28.60 |
| Quarter ended September 30, 2019 | $36.82 | $28.85 | Quarter ended September 30, 2018 | $39.30 | $34.54 |
| Quarter ended December 31, 2019 | $44.80 | $33.20 | Quarter ended December 31, 2018 | $35.56 | $27.88 |
Holders. As of February 26, 2020,25, 2021, there were 171156 holders of record and approximately 19,00023,000 beneficial owners of our common stock.
Dividends. Beginning in the first quarter of 2018, we began paying a quarterly cash dividend on our outstanding shares of common stock. We currently expectAt the end of March 2020, in response to continuethe COVID-19 pandemic, as a precautionary measure our Board of Directors temporarily suspended the payment of dividends. In February 2021, our Board of Directors declared a quarterly dividend of $0.15 per share payable on March 26, 2021 to pay a comparable cash dividend each quarter; however, thestockholders of record on March 16, 2021. The payment of future dividends will be subject to the discretion of our Board of Directors and will be contingent upon future earnings, if any, our financial condition, capital requirements, general business conditions and other factors. Therefore, we can give no assurance that cash dividends of any kind will be paid to holders of our common stock in the future.
Equity Compensation Plans. Information regarding our equity compensation plans as of December 31, 20192020 is disclosed in Item 12, “Security Ownership of Certain Beneficial Owners and Management and Related Stockholder Matters.”
Issuer Repurchases of Equity Securities. Our Board of Directors authorized a share repurchase program (the “Share Repurchase Program”), effective as of January 1, 2004. The Share Repurchase Program does not have a fixed expiration or termination date and may be modified or terminated by the Board of Directors at any time. On several occasions the Board of Directors has increased the amount authorized for repurchase of our common stock. Most recently, on April 24, 2019, the Board of Directors approved the extension of our Share Repurchase Program for up to $200,000 in repurchases of our common stock, which includesincluded the amount remaining under the prior authorization. The Share Repurchase Program permits us to effect repurchases from time to time through a combination of open market repurchases or in privately negotiated transactions at such prices and times as are determined to be in our best interest. In the middle of March 2020, in response to the COVID-19 pandemic, as a precautionary measure the Board of Directors temporarily suspended the repurchase of our common stock, which the Board of Directors reinstated on February 24, 2021. During the twelve months ended December 31, 2019,2020, we repurchased an aggregate of 2,381,340769,526 shares of our common stock under the Share Repurchase Program, at a weighted average price per share of $32.76,$32.97, for an aggregate purchase price of approximately $78,001,$25,369, which includes the amount remaining under the prior authorization. As of December 31, 2019,2020, approximately $136,959$111,590 remained available for future repurchases under the Share Repurchase Program. The following table presents the total number of shares of our common stock, $.0001 par value, purchased by us in the three months ended December 31, 2019,2020, the average price paid per share and the approximate dollar value of the shares that still could have been purchased at the end of the fiscal period pursuant to our Share Repurchase Program. See also Note L to the Consolidated Financial Statements. During the three months ended December 31, 2020, there were no sales by us of unregistered shares of common stock.
| Period | Total Number of Shares Purchased(1) | Average Price Paid per Share(1) | Total Number of Shares Purchased as part of Publicly Announced Plans or Programs | Maximum Dollar Amount of Shares that May Yet Be Purchased Under the Plans or Programs | |||||||||
| 10/1/2019 - 10/31/2019 | 2,411 | $ | 34.84 | — | $ | 141,759 | |||||||
| 11/1/2019 - 11/30/2019 | 9,114 | 41.94 | — | 141,759 | |||||||||
| 12/1/2019 - 12/31/2019 | 578,284 | 42.88 | 112,921 | 136,959 | |||||||||
| Total | 589,809 | $ | 42.83 | 112,921 | |||||||||
| Period | Total Number of Shares Purchased(1) | Average Price Paid per Share(1) | Maximum Dollar Amount of Shares that May Yet Be Purchased Under the Plans or Programs | ||||||||||||||||||||
| 10/1/2020 - 10/31/2020 | 2,505 | $ | 20.05 | $ | 111,590 | ||||||||||||||||||
| 11/1/2020 - 11/30/2020 | 5,350 | 27.54 | 111,590 | ||||||||||||||||||||
| 12/1/2020 - 12/31/2020 | 479,809 | 34.57 | 111,590 | ||||||||||||||||||||
| Total | 487,664 | $ | 34.42 | ||||||||||||||||||||
(1) The Steven Madden, Ltd. 2019 Incentive Compensation Plan and its predecessor plan, the Steven Madden, Ltd. Amended and Restated 2006 Stock Incentive Plan, each provide us with the right to deduct or withhold, or require participantsemployees to remit to us, an amount sufficient to satisfy all or part of the tax withholding obligations applicable to stock-based compensation awards. To the extent permitted, participants may elect to satisfy all or part of such withholding obligations by tendering to us previously owned shares or by having us withhold shares having a fair market value equal to the minimum statutory tax withholdingtax-withholding rate that could be imposed on the transaction. Included in this table are shares withheld during the fourth quarter of 20192020 in connection with the settlement of vested restricted stock to satisfy tax withholdingtax-withholding requirements in addition to the shares repurchased pursuant to the Share Repurchase Program. Of the total number of shares repurchased by us in the fourth quarter of 2019, 476,888 shares were withheld at an average price per share of $42.91, forwith an aggregate purchase price of approximately $20,464, in connection with the settlement of vested restricted stock and exercises of stock options to satisfy tax withholding requirements. Excluding the shares withheld in connection with the settlement of vested restricted stock and exercises of stock options, the average price per share was $42.50 in December 2019.$16,786.
23
Performance Graph. The following graph compares the yearly percentage change in the cumulative total stockholder return on our common stock during the period beginning on December 31, 2014,2015, and ending on December 31, 2019,2020, with the cumulative total return on the Russell 2000 Index and a peer group index. In 2016, we decided to remove the S&P 500 Footwear Index and replace it with a peer group index of companies we believe are engaged in similar businesses, because we believe the composition of the new peer group is more representative of our current business. The peer group index consists of six companies: Caleres, Inc., Crocs, Inc., Deckers Outdoor Corporation, Genesco Inc., Skechers U.S.A., Inc. and Wolverine World Wide, Inc.
The comparison assumes that $100 was invested on December 31, 20142015 in our common stock and in the foregoing indices and assumes the reinvestment of dividends.
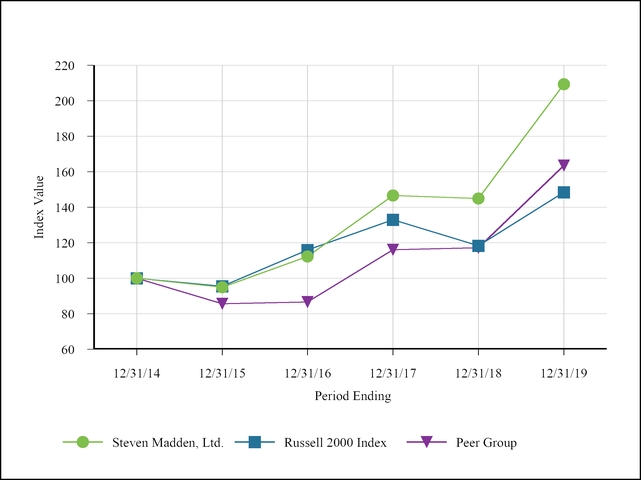
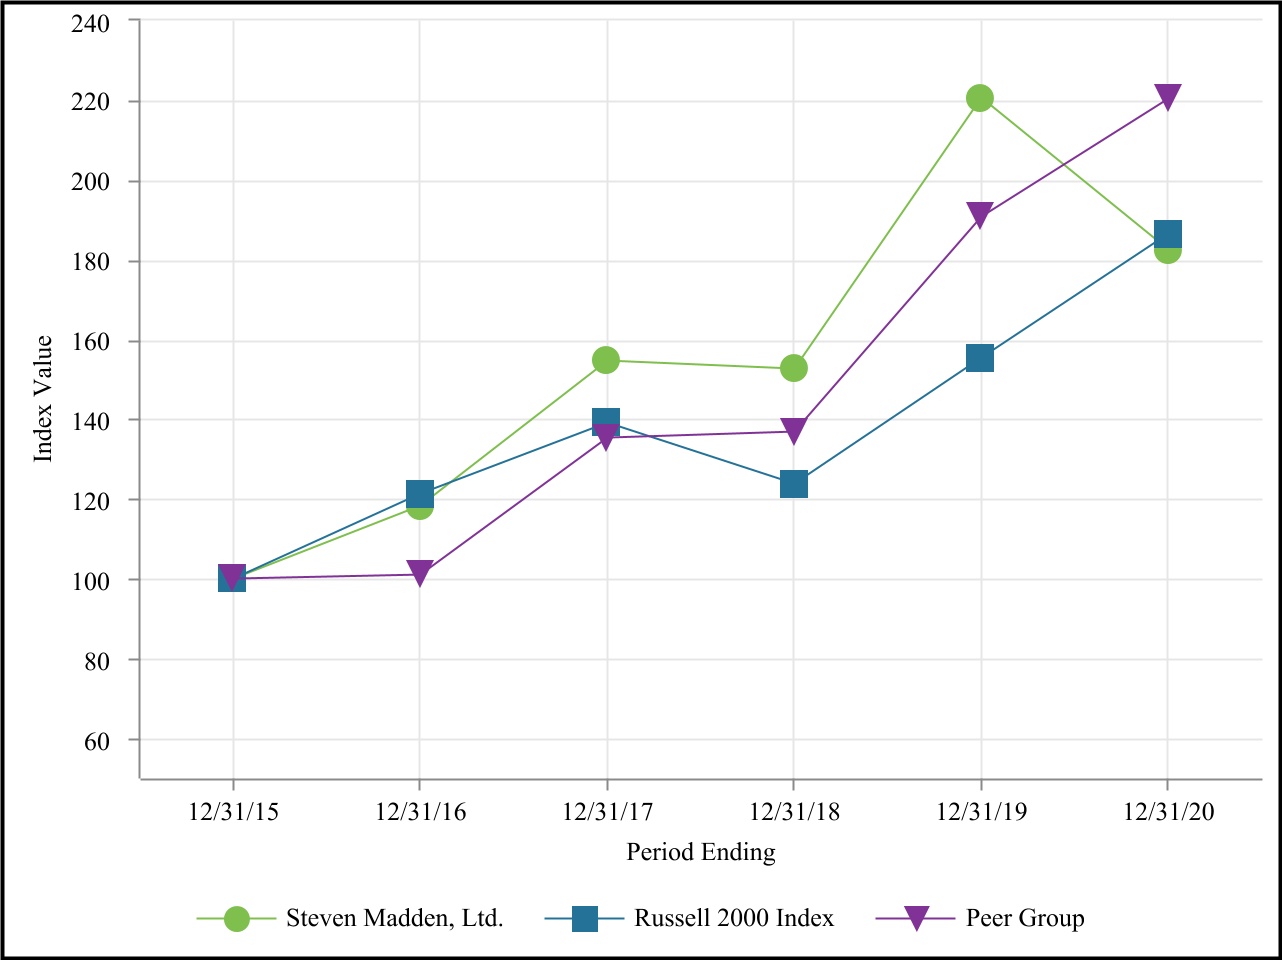
| 12/31/2015 | 12/31/2016 | 12/31/2017 | 12/31/2018 | 12/31/2019 | 12/31/2020 | ||||||||||||||||||||||||||||||||||||
| Steven Madden, Ltd. | $ | 100.00 | $ | 118.30 | $ | 154.53 | $ | 152.69 | $ | 220.54 | $ | 182.35 | |||||||||||||||||||||||||||||
| Russell 2000 Index | $ | 100.00 | $ | 121.31 | $ | 139.08 | $ | 123.76 | $ | 155.35 | $ | 186.36 | |||||||||||||||||||||||||||||
| Peer Group | $ | 100.00 | $ | 101.06 | $ | 135.37 | $ | 136.77 | $ | 190.82 | $ | 220.39 | |||||||||||||||||||||||||||||
24
| 12/31/2014 | 12/31/2015 | 12/31/2016 | 12/31/2017 | 12/31/2018 | 12/31/2019 | ||||||||||||||||||||
| Steven Madden, Ltd. | $ | 100.00 | $ | 94.94 | $ | 112.32 | $ | 146.72 | $ | 144.96 | $ | 209.38 | |||||||||||||
| Russell 2000 Index | $ | 100.00 | $ | 95.59 | $ | 115.95 | $ | 132.94 | $ | 118.30 | $ | 148.49 | |||||||||||||
| Peer Group | $ | 100.00 | $ | 85.75 | $ | 86.66 | $ | 116.08 | $ | 117.28 | $ | 163.63 | |||||||||||||
ITEM 6. SELECTED FINANCIAL DATA
($ in thousands, except share and per share data)
The following selected financial data has been derived from our audited consolidated financial statements. The Income Statement data relating to 2020, 2019 2018 and 2017,2018, and the Balance Sheet data as of December 31, 20192020 and 20182019 should be read in conjunction with the information provided in Item 7, “Management's Discussion and Analysis of Financial Condition and Results of Operations,” and the notes to our consolidated financial statements appearing elsewhere in this Annual Report on Form 10-K.
| INCOME STATEMENT DATA Year Ended December 31, | |||||||||||||||||||||||||||||
| 2020 | 2019 | 2018 | 2017 | 2016 | |||||||||||||||||||||||||
| Net sales | $ | 1,188,943 | $ | 1,768,135 | $ | 1,653,609 | $ | 1,546,098 | $ | 1,399,551 | |||||||||||||||||||
| Commission and licensing fee income | 12,871 | 19,022 | 24,125 | 20,985 | 20,301 | ||||||||||||||||||||||||
| Total revenue | 1,201,814 | 1,787,157 | 1,677,734 | 1,567,083 | 1,419,852 | ||||||||||||||||||||||||
| Cost of sales (exclusive of depreciation and amortization) | 737,273 | 1,101,140 | 1,037,571 | 968,357 | 877,568 | ||||||||||||||||||||||||
| Gross profit | 464,541 | 686,017 | 640,163 | 598,726 | 542,284 | ||||||||||||||||||||||||
| Operating expenses | 414,978 | 503,270 | 466,781 | 427,942 | 373,108 | ||||||||||||||||||||||||
| Impairment charges | 44,273 | 4,050 | — | 1,000 | — | ||||||||||||||||||||||||
| Impairment of lease right-of-use asset and store fixed assets | 36,895 | 1,883 | — | — | — | ||||||||||||||||||||||||
| (Loss)/income from operations | (31,605) | 176,814 | 173,382 | 169,784 | 169,176 | ||||||||||||||||||||||||
| Interest and other income - net | 1,620 | 4,412 | 3,958 | 2,543 | 1,824 | ||||||||||||||||||||||||
| (Loss)/income before provision for income taxes | (29,985) | 181,226 | 177,340 | 172,327 | 171,000 | ||||||||||||||||||||||||
| (Benefit)/provision for income taxes | (11,704) | 39,504 | 46,841 | 53,189 | 49,726 | ||||||||||||||||||||||||
| Net (loss)/income | (18,281) | 141,722 | 130,499 | 119,138 | 121,274 | ||||||||||||||||||||||||
| Less: net income attributable to non-controlling interests | 116 | 411 | 1,363 | 1,190 | 363 | ||||||||||||||||||||||||
| Net (loss)/income attributable to Steven Madden, Ltd. | $ | (18,397) | $ | 141,311 | $ | 129,136 | $ | 117,948 | $ | 120,911 | |||||||||||||||||||
| Basic net (loss)/income per share | $ | (0.23) | $ | 1.78 | $ | 1.58 | $ | 1.43 | $ | 1.41 | |||||||||||||||||||
| Diluted net (loss)/income per share | $ | (0.23) | $ | 1.69 | $ | 1.50 | $ | 1.36 | $ | 1.35 | |||||||||||||||||||
| Basic weighted average common shares outstanding | 78,635 | 79,577 | 81,664 | 82,736 | 85,664 | ||||||||||||||||||||||||
| Effect of dilutive securities - options/restricted stock | — | 4,069 | 4,433 | 4,009 | 3,670 | ||||||||||||||||||||||||
| Diluted weighted average common stock outstanding | 78,635 | 83,646 | 86,097 | 86,745 | 89,334 | ||||||||||||||||||||||||
| Cash dividends declared per common share | $ | 0.15 | $ | 0.57 | $ | 0.53 | $ | — | $ | — | |||||||||||||||||||
BALANCE SHEET DATA At December 31, | |||||||||||||||||||||||||||||
| 2020 | 2019 | 2018 | 2017 | 2016 | |||||||||||||||||||||||||
| Total assets | $ | 1,137,761 | $ | 1,278,647 | $ | 1,072,570 | $ | 1,057,161 | $ | 960,875 | |||||||||||||||||||
| Working capital | 462,325 | 437,608 | 478,436 | 438,906 | 345,544 | ||||||||||||||||||||||||
| Noncurrent liabilities | 111,476 | 156,152 | 33,199 | 41,617 | 36,676 | ||||||||||||||||||||||||
| Stockholders' equity | $ | 790,369 | $ | 841,224 | $ | 814,682 | $ | 808,932 | $ | 741,072 | |||||||||||||||||||
25
INCOME STATEMENT DATA Year Ended December 31, | |||||||||||||||||||
| 2019 | 2018 | 2017 | 2016 | 2015 | |||||||||||||||
| Net sales | $ | 1,768,135 | $ | 1,653,609 | $ | 1,546,098 | $ | 1,399,551 | $ | 1,405,239 | |||||||||
| Commission and licensing fee income | 19,022 | 24,125 | 20,985 | 20,301 | 25,681 | ||||||||||||||
| Total revenue | 1,787,157 | 1,677,734 | 1,567,083 | 1,419,852 | 1,430,920 | ||||||||||||||
| Cost of sales | 1,101,140 | 1,037,571 | 968,357 | 877,568 | 904,747 | ||||||||||||||
| Gross profit | 686,017 | 640,163 | 598,726 | 542,284 | 526,173 | ||||||||||||||
| Operating expenses | 505,153 | 466,781 | 427,942 | 373,108 | 351,480 | ||||||||||||||
| Impairment charges | 4,050 | — | 1,000 | — | 3,045 | ||||||||||||||
| Income from operations | 176,814 | 173,382 | 169,784 | 169,176 | 171,648 | ||||||||||||||
| Interest and other income - net | 4,412 | 3,958 | 2,543 | 1,824 | 818 | ||||||||||||||
| Income before provision for income taxes | 181,226 | 177,340 | 172,327 | 171,000 | 172,466 | ||||||||||||||
| Provision for income taxes | 39,504 | 46,841 | 53,189 | 49,726 | 58,811 | ||||||||||||||
| Net income | 141,722 | 130,499 | 119,138 | 121,274 | 113,655 | ||||||||||||||
| Less: net income attributable to non-controlling interests | 411 | 1,363 | 1,190 | 363 | 717 | ||||||||||||||
| Net income attributable to Steven Madden, Ltd. | $ | 141,311 | $ | 129,136 | $ | 117,948 | $ | 120,911 | $ | 112,938 | |||||||||
| Basic net income per share | $ | 1.78 | $ | 1.58 | $ | 1.43 | $ | 1.41 | $ | 1.28 | |||||||||
| Diluted net income per share | $ | 1.69 | $ | 1.50 | $ | 1.36 | $ | 1.35 | $ | 1.23 | |||||||||
| Basic weighted average common shares outstanding | 79,577 | 81,664 | 82,736 | 85,664 | 88,496 | ||||||||||||||
| Effect of dilutive securities - options/restricted stock | 4,069 | 4,433 | 4,009 | 3,670 | 3,217 | ||||||||||||||
| Diluted weighted average common stock outstanding | 83,646 | 86,097 | 86,745 | 89,334 | 91,713 | ||||||||||||||
| Cash dividends declared per common share | $ | 0.57 | $ | 0.53 | $ | — | $ | — | $ | — | |||||||||
BALANCE SHEET DATA At December 31, | |||||||||||||||||||
| 2019 | 2018 | 2017 | 2016 | 2015 | |||||||||||||||
| Total assets | $ | 1,278,647 | $ | 1,072,570 | $ | 1,057,161 | $ | 960,875 | $ | 914,385 | |||||||||
| Working capital | 437,608 | 478,436 | 438,906 | 345,544 | 284,178 | ||||||||||||||
| Noncurrent liabilities | 156,152 | 33,199 | 41,617 | 36,676 | 60,923 | ||||||||||||||
| Stockholders' equity | $ | 841,224 | $ | 814,682 | $ | 808,932 | $ | 741,072 | $ | 678,663 | |||||||||
ITEM 7. MANAGEMENT’S DISCUSSION AND ANALYSIS OF FINANCIAL CONDITION AND RESULTS OF
OPERATIONS
The following discussion of our financial condition and results of operations should be read in conjunction with our audited consolidated financial statements and notes thereto appearing elsewhere in this Annual Report on Form 10-K.
Overview:
($ in thousands, except retail sales data per square foot, earnings per share and per share data)
Steven Madden, Ltd. and its subsidiaries design, source, market and sell fashion-forward branded and private label footwear for women, men and children. In addition, we design, source, market and sell branded fashion handbags, apparel and accessories, as well as private label fashion handbags and accessories. We market and sell our products through better department stores, major department stores, mid-tier department stores, specialty stores, luxury retailers, value priced retailers, national chains, mass merchants, and online retailers, throughout the United States, Canada, Mexico Italy and certain other European nations. In addition, our products are marketed through our retail stores and our e-commerce websites within the United States, Canada and Mexico, our joint ventures in Europe, South Africa, Israel, Taiwan and China, and under special distribution arrangements in certain European territories,countries, the Middle East, South and Central America, Oceania and various countries in Asia. Our product line includeslines include a broad range of contemporary styles designed to establish or capitalize on market trends, complemented by core product offerings. We have established a reputation for design creativity and our ability to offer quality products in popular styles at accessible price points, delivered in an efficient manner and time frame.
Our business comprises five distinct segments (Wholesalesegments: Wholesale Footwear, Wholesale Accessories/Apparel, Retail, First Cost and Licensing).Licensing. Our Wholesale Footwear segment includes the following brands: Steve Madden Women's®, Madden Girl®, Steve Madden Men's®, Madden®, Madden NYC, Report®, Dolce Vita®, DV by Dolce Vita®, Mad Love®, Steven by Steve Madden®, Superga® (under license), Anne Klein® (under license), Betsey Johnson®, Betseyville®, Steve Madden Kids®, Stevies®, Brian Atwood®, GREATS® and Blondo®, and includes our International business and certain private label footwear business. An agreement to license the Kate Spade® trademark was terminated as of December 31, 2019. Our Wholesale Accessories/Apparel segment includes Steve Madden®, Big Buddha®, Madden NYC, Betsey Johnson®, Steven by Steve Madden®, Madden Girl®, Luv Betsey®, Brian Atwood®, DKNY® (under license), Anne Klein® (under license), Jocelyn, Cejon®, BB Dakota®, BB Dakota x Steve Madden, and Cupcakes & Cashmere® (under license) brands and includes our International business and certain private label accessories business. Steven Madden Retail, Inc., our wholly-ownedwholly owned retail subsidiary, that comprises of our Retail segment, operates Steve Madden, Steven, Superga GREATS and International retail stores, as well as Steve Madden, Superga, Betsey Johnson, Blondo, Dolce Vita, GREATS and BB Dakota and Jocelyn e-commerce websites. The First Cost segment represents activities of a subsidiary that earns commissions for serving as a buying agent for footwear products under private labels for many of the country'sU.S. large mass-market merchandisers, shoe chains and other value priced retailers. Our Licensing segment is engaged in the licensing of Steve Madden®, Steven by Steve Madden® and Madden Girl® trademarks for use in connection with the manufacture, marketing and sale of apparel, outerwear, hosiery, jewelry, watches, eyeglasses, sunglasses, hair accessories, fragrance, umbrellas, bedding and bath, and luggage. In addition, we license the Betsey Johnson® trademark for use in connection with the manufacture, marketing and sale of women's and children’s apparel, hosiery, fragrance and beauty, sleepwear, swimwear, activewear, jewelry, headbands,hair accessories, watches, slippers, bedding and bath, luggage, umbrellas and medical scrubs. We also license the Dolce Vita® trademark for use in connection with the manufacture, marketing and sale of swimwear and the FREEBIRD by Steven® trademark for operation of retail stores.
Dividends
On February 24, 2021, our Board of Directors approved the reinstatement of a quarterly cash dividend. The quarterly dividend of $0.15 per share is payable on March 26, 2021 to stockholders of record as of the close of business on March 16, 2021.
Reclassifications
| Years Ended December 31, | |||||||||||
| 2019 | 2018 | 2017 | |||||||||
| ($ in thousands) | |||||||||||
| Net Income | $ | 141,722 | $ | 130,499 | $ | 119,138 | |||||
| Add back: | |||||||||||
| Provision for income taxes | 39,504 | 46,841 | 53,189 | ||||||||
| Vendor support, bad debt expense, net of recovery and write-off of an unamortized buying agency agreement support payment related to the Payless ShoeSource bankruptcy (in First Cost segment) | 10,355 | 8,507 | — | ||||||||
| Provision for early lease termination charges and impairment of lease right-of-use asset | 5,423 | 1,693 | 5,123 | ||||||||
| Impairment of the Brian Atwood trademark | 4,050 | — | — | ||||||||
| Provision for legal charges and settlements | 3,977 | 2,837 | 6,713 | ||||||||
| Acquisition costs | 1,120 | — | — | ||||||||
| Divisional headquarters relocation expenses | 669 | — | — | ||||||||
| Loss related to a termination of a joint venture | 544 | — | — | ||||||||
| Provisions for bad debt expense, net of recovery related to the Payless ShoeSource bankruptcy (in Wholesale Footwear segment) | (1,668 | ) | 3,616 | 5,470 | |||||||
| Net benefit in connection with the reversal of a contingent liability partially offset by the acceleration of amortization related to the termination of the Kate Spade license agreement | (1,868 | ) | — | — | |||||||
| Schwartz & Benjamin acquisition integration charges and related restructuring | — | 2,065 | 3,639 | ||||||||
| Charges related to preferred interest investment | — | — | 2,700 | ||||||||
| Impairment of Wild Pair trademark | — | — | 1,000 | ||||||||
| Schwartz & Benjamin acquisition inventory fair value adjustment | — | — | 591 | ||||||||
| Schwartz & Benjamin amendment to the equity purchase agreement | — | — | (10,215 | ) | |||||||
| Deduct: | |||||||||||
| Interest and other income - net* | 4,412 | 3,958 | 2,543 | ||||||||
| Adjusted EBIT | 199,416 | 192,100 | 184,805 | ||||||||
| Add back: | |||||||||||
| Depreciation and amortization | 21,119 | 21,754 | 20,406 | ||||||||
| Loss on disposal of fixed assets | 920 | 1,220 | 1,455 | ||||||||
| Adjusted EBITDA | $ | 221,455 | $ | 215,074 | $ | 206,666 | |||||
| (*) Includes realized (losses)/gains on marketable securities and foreign exchange (losses)/gains. | |||||||||||
Executive Summary
In December 2019, COVID-19 emerged and spread worldwide. The World Health Organization declared COVID-19 a
26
pandemic in March 2020, resulting in federal, state and local governments and private entities mandating various restrictions, including the closure of non-essential businesses, travel restrictions, restrictions on public gatherings, stay-at-home orders and advisories and quarantining of people who may have been exposed to the virus. After closely monitoring and taking into consideration the guidance from federal, state and local governments, in March 2020, we temporarily closed all of our stores and our corporate offices in the U.S. and the vast majority of our stores and offices globally. As of August 2020, the vast majority of our stores and corporate offices in the U.S. and globally reopened. These and other factors have had and may continue to have a material impact on our business, results of operations, financial position and cash flow. In response to the COVID-19 pandemic, we took precautionary measures to maintain adequate liquidity and financial flexibility by temporarily suspending share repurchases and the quarterly cash dividend; temporarily suspending salaries of our founder and Creative and Design Chief, Steve Madden, our Chairman and Chief Executive Officer, Edward Rosenfeld, and our Board of Directors (all of which were reinstated on October 1); temporarily reducing salaries by 30% for our President, Chief Financial Officer, Chief Operating Officer and Chief Merchandising Officer (all of which were reinstated on August 1); temporarily reducing salaries by graduated amounts for all other employees earning over $100 per year (all of which were reinstated on August 1); significantly scaling back on non-essential operating expenses, and capital expenditures and inventory purchases.
The impact of COVID-19 resulted in an unprecedented decline in our revenue and earnings during the year ended 2020, including but not limited to, charges from adjustments to the carrying amount of certain trademarks, long-lived asset impairment charges and restructuring and other related charges. We expect the pandemic will continue to have a significant negative impact on our revenue and earnings during 2021.
Total revenue for 2020 decreased by 32.8% to $1,201,814 from $1,787,157 in 2019, increased by 6.5%with decreases in all segments as a result of the impact of the COVID-19 pandemic.
Net loss attributable to $1,787,157 from $1,677,734Steven Madden, Ltd. was $18,397 in 2018. Total revenue growth was primarily driven by our Wholesale Accessories/Apparel, Footwear and Retail segments, partially offset by a decline in revenue from our First Cost and Licensing segments. Net sales in the Wholesale Footwear segment increased by $53,725, or 5.1%, when2020 compared to the prior year. Net sales in the Wholesale Accessories/Apparel increased by $34,771, or 11.6%, when compared to the prior year. Net sales in the Retail segment increased by $26,030, or 8.8%, when compared to the prior year. First Cost segment revenue decreased by $3,785 or 33.7%, when compared to the prior year. Licensing segment revenue decreased by $1,318, or 10.2%, when compared to the prior year.
Our inventory turnover (calculated on a trailing four quarter average) for boththe years ended December 31, 2020 and 2019 was 7.1 times and 2018 was 8.1 times.times, respectively. Our total company accounts receivable average collection days were 73 days in 2020 compared to 70 days in 2019 compared to 69 days in 2018.2019. As of December 31, 2019,2020, we had $304,622$287,166 in cash, cash equivalents and marketable securities,short-term investments, no short or long-term debt and total stockholders’ equity of $841,224.$790,369. Working capital decreasedincreased to $437,608$462,325 as of December 31, 2019,2020, compared to $478,436$437,608 on December 31, 2018.2019. The decreaseincrease in working capital was primarily thedue to actions taken as a result of the addition of current operating lease liabilities of $38,624 in accordanceCOVID-19 pandemic.
As we look ahead, we remain focused on delivering trend-right product, deepening connections with our adoption of ASU 2016-02, "Leases"consumers, enhancing our digital commerce business, and cash used forefficiently managing our acquisitions, net of cash acquired of $37,173.inventory and expenses.
27
The following table sets forth information on operations for the periods indicated:
Selected Financial Information
| Years Ended December 31, ($ in thousands) | ||||||||||||||||||||||||||||||||||||||
| 2020 | 2019 | 2018 | ||||||||||||||||||||||||||||||||||||
| CONSOLIDATED: | ||||||||||||||||||||||||||||||||||||||
| Net sales | $ | 1,188,943 | 98.9 | % | $ | 1,768,135 | 98.9 | % | $ | 1,653,609 | 98.6 | % | ||||||||||||||||||||||||||
| Commission and licensing fee income | 12,871 | 1.1 | % | 19,022 | 1.1 | % | 24,125 | 1.4 | % | |||||||||||||||||||||||||||||
| Total revenue | 1,201,814 | 100.0 | % | 1,787,157 | 100.0 | % | 1,677,734 | 100.0 | % | |||||||||||||||||||||||||||||
| Cost of sales (exclusive of depreciation and amortization) | 737,273 | 61.3 | % | 1,101,140 | 61.6 | % | 1,037,571 | 61.8 | % | |||||||||||||||||||||||||||||
| Gross profit | 464,541 | 38.7 | % | 686,017 | 38.4 | % | 640,163 | 38.2 | % | |||||||||||||||||||||||||||||
| Operating expenses | 414,978 | 34.5 | % | 503,270 | 28.2 | % | 466,781 | 27.8 | % | |||||||||||||||||||||||||||||
| Impairment of intangibles | 44,273 | 3.7 | % | 4,050 | 0.2 | % | — | — | % | |||||||||||||||||||||||||||||
| Impairment of lease right-of-use asset and store fixed assets | 36,895 | 3.1 | % | 1,883 | 0.1 | % | — | — | % | |||||||||||||||||||||||||||||
| (Loss)/income from operations | (31,605) | (2.6) | % | 176,814 | 9.9 | % | 173,382 | 10.3 | % | |||||||||||||||||||||||||||||
| Interest and other income – net | 1,620 | 0.1 | % | 4,412 | 0.2 | % | 3,958 | 0.2 | % | |||||||||||||||||||||||||||||
| (Loss)/income before income taxes | (29,985) | (2.5) | % | 181,226 | 10.1 | % | 177,340 | 10.6 | % | |||||||||||||||||||||||||||||
| Net (loss)/income attributable to Steven Madden, Ltd. | $ | (18,397) | (1.5) | % | $ | 141,311 | 7.9 | % | $ | 129,136 | 7.7 | % | ||||||||||||||||||||||||||
| By Segment: | ||||||||||||||||||||||||||||||||||||||
| WHOLESALE FOOTWEAR SEGMENT: | ||||||||||||||||||||||||||||||||||||||
| Net sales | $ | 713,662 | 100.0 | % | $ | 1,112,091 | 100.0 | % | $ | 1,058,366 | 100.0 | % | ||||||||||||||||||||||||||
| Cost of sales (exclusive of depreciation and amortization) | 487,106 | 68.3 | % | 738,504 | 66.4 | % | 712,457 | 67.3 | % | |||||||||||||||||||||||||||||
| Gross profit | 226,556 | 31.7 | % | 373,587 | 33.6 | % | 345,909 | 32.7 | % | |||||||||||||||||||||||||||||
| Operating expenses | 162,357 | 22.7 | % | 206,055 | 18.5 | % | 205,771 | 19.4 | % | |||||||||||||||||||||||||||||
| Impairment of intangibles | 16,345 | 2.3 | % | 4,050 | 0.4 | % | — | — | % | |||||||||||||||||||||||||||||
| Income from operations | $ | 47,854 | 6.7 | % | $ | 163,482 | 14.7 | % | $ | 140,138 | 13.2 | % | ||||||||||||||||||||||||||
| WHOLESALE ACCESSORIES/APPAREL SEGMENT: | ||||||||||||||||||||||||||||||||||||||
| Net sales | $ | 235,892 | 100.0 | % | $ | 334,862 | 100.0 | % | $ | 300,091 | 100.0 | % | ||||||||||||||||||||||||||
| Cost of sales (exclusive of depreciation and amortization) | 164,984 | 69.9 | % | 236,731 | 70.7 | % | 208,352 | 69.4 | % | |||||||||||||||||||||||||||||
| Gross profit | 70,908 | 30.1 | % | 98,131 | 29.3 | % | 91,739 | 30.6 | % | |||||||||||||||||||||||||||||
| Operating expenses | 60,932 | 25.8 | % | 75,676 | 22.6 | % | 64,647 | 21.5 | % | |||||||||||||||||||||||||||||
| Impairment of intangibles | 27,472 | 11.6 | % | — | — | % | — | — | % | |||||||||||||||||||||||||||||
| (Loss)/income from operations | $ | (17,496) | (7.4) | % | $ | 22,455 | 6.7 | % | $ | 27,092 | 9.0 | % | ||||||||||||||||||||||||||
| RETAIL SEGMENT: | ||||||||||||||||||||||||||||||||||||||
| Net sales | $ | 239,389 | 100.0 | % | $ | 321,182 | 100.0 | % | $ | 295,152 | 100.0 | % | ||||||||||||||||||||||||||
| Cost of sales (exclusive of depreciation and amortization) | 85,183 | 35.6 | % | 125,905 | 39.2 | % | 116,762 | 39.6 | % | |||||||||||||||||||||||||||||
| Gross profit | 154,206 | 64.4 | % | 195,277 | 60.8 | % | 178,390 | 60.4 | % | |||||||||||||||||||||||||||||
| Operating expenses | 186,103 | 77.7 | % | 202,444 | 63.0 | % | 177,655 | 60.2 | % | |||||||||||||||||||||||||||||
| Impairment of intangibles | 456 | 0.2 | % | — | — | % | — | — | % | |||||||||||||||||||||||||||||
| Impairment of lease right-of-use asset and store fixed assets | 36,895 | 15.4 | % | 1,883 | 0.6 | % | — | — | % | |||||||||||||||||||||||||||||
| (Loss)/income from operations | $ | (69,248) | (28.9) | % | $ | (9,050) | (2.8) | % | $ | 735 | 0.2 | % | ||||||||||||||||||||||||||
| Number of stores | 218 | 227 | 229 | |||||||||||||||||||||||||||||||||||
| FIRST COST SEGMENT: | ||||||||||||||||||||||||||||||||||||||
| Commission fee income | $ | 3,902 | 100.0 | % | $ | 7,441 | 100.0 | % | $ | 11,226 | 100.0 | % | ||||||||||||||||||||||||||
| Gross profit | 3,902 | 100.0 | % | 7,441 | 100.0 | % | 11,226 | 100.0 | % | |||||||||||||||||||||||||||||
| Operating expenses | 2,395 | 61.4 | % | 15,618 | 209.9 | % | 15,775 | 140.5 | % | |||||||||||||||||||||||||||||
| Income/(loss) from operations | $ | 1,507 | 38.6 | % | $ | (8,177) | (109.9) | % | $ | (4,549) | (40.5) | % | ||||||||||||||||||||||||||
| LICENSING SEGMENT: | ||||||||||||||||||||||||||||||||||||||
| Licensing fee income | $ | 8,969 | 100.0 | % | $ | 11,581 | 100.0 | % | $ | 12,899 | 100.0 | % | ||||||||||||||||||||||||||
| Gross profit | 8,969 | 100.0 | % | 11,581 | 100.0 | % | 12,899 | 100.0 | % | |||||||||||||||||||||||||||||
| Operating expenses | 3,191 | 35.6 | % | 3,477 | 30.0 | % | 2,933 | 22.7 | % | |||||||||||||||||||||||||||||
| Income from operations | $ | 5,778 | 64.4 | % | $ | 8,104 | 70.0 | % | $ | 9,966 | 77.3 | % | ||||||||||||||||||||||||||
| Years Ended December 31, ($ in thousands) | |||||||||||||||||||||
| 2019 | 2018 | 2017 | |||||||||||||||||||
| CONSOLIDATED: | |||||||||||||||||||||
| Net sales | $ | 1,768,135 | 98.9 | % | $ | 1,653,609 | 98.6 | % | $ | 1,546,098 | 98.7 | % | |||||||||
| Commission and licensing fee income | 19,022 | 1.1 | % | 24,125 | 1.4 | % | 20,985 | 1.3 | % | ||||||||||||
| Total revenue | 1,787,157 | 100.0 | % | 1,677,734 | 100.0 | % | 1,567,083 | 100.0 | % | ||||||||||||
| Cost of sales | 1,101,140 | 61.6 | % | 1,037,571 | 61.8 | % | 968,357 | 61.8 | % | ||||||||||||
| Gross profit | 686,017 | 38.4 | % | 640,163 | 38.2 | % | 598,726 | 38.2 | % | ||||||||||||
| Operating expenses | 505,153 | 28.3 | % | 466,781 | 27.8 | % | 427,942 | 27.3 | % | ||||||||||||
| Impairment charges | 4,050 | 0.2 | % | — | — | % | 1,000 | 0.1 | % | ||||||||||||
| Income from operations | 176,814 | 9.9 | % | 173,382 | 10.3 | % | 169,784 | 10.8 | % | ||||||||||||
| Interest and other income – net | 4,412 | 0.2 | % | 3,958 | 0.2 | % | 2,543 | 0.2 | % | ||||||||||||
| Income before income taxes | 181,226 | 10.1 | % | 177,340 | 10.6 | % | 172,327 | 11.0 | % | ||||||||||||
| Net income attributable to Steven Madden, Ltd. | $ | 141,311 | 7.9 | % | $ | 129,136 | 7.7 | % | $ | 117,948 | 7.5 | % | |||||||||
| By Segment: | |||||||||||||||||||||
| WHOLESALE FOOTWEAR SEGMENT: | |||||||||||||||||||||
| Net sales | $ | 1,112,091 | 100.0 | % | $ | 1,058,366 | 100.0 | % | $ | 1,017,557 | 100.0 | % | |||||||||
| Cost of sales | 738,504 | 66.4 | % | 712,457 | 67.3 | % | 685,190 | 67.3 | % | ||||||||||||
| Gross profit | 373,587 | 33.6 | % | 345,909 | 32.7 | % | 332,367 | 32.7 | % | ||||||||||||
| Operating expenses | 206,055 | 18.5 | % | 205,771 | 19.4 | % | 198,353 | 19.5 | % | ||||||||||||
| Impairment charges | 4,050 | 0.4 | % | — | — | % | 1,000 | 0.1 | % | ||||||||||||
| Income from operations | $ | 163,482 | 14.7 | % | $ | 140,138 | 13.2 | % | $ | 133,014 | 13.1 | % | |||||||||
| WHOLESALE ACCESSORIES/APPAREL SEGMENT: | |||||||||||||||||||||
| Net sales | $ | 334,862 | 100.0 | % | $ | 300,091 | 100.0 | % | $ | 256,295 | 100.0 | % | |||||||||
| Cost of sales | 236,731 | 70.7 | % | 208,352 | 69.4 | % | 175,566 | 68.5 | % | ||||||||||||
| Gross profit | 98,131 | 29.3 | % | 91,739 | 30.6 | % | 80,729 | 31.5 | % | ||||||||||||
| Operating expenses | 75,676 | 22.6 | % | 64,647 | 21.5 | % | 57,092 | 22.3 | % | ||||||||||||
| Income from operations | $ | 22,455 | 6.7 | % | $ | 27,092 | 9.0 | % | $ | 23,637 | 9.2 | % | |||||||||
| RETAIL SEGMENT: | |||||||||||||||||||||
| Net sales | $ | 321,182 | 100.0 | % | $ | 295,152 | 100.0 | % | $ | 272,246 | 100.0 | % | |||||||||
| Cost of sales | 125,905 | 39.2 | % | 116,762 | 39.6 | % | 107,601 | 39.5 | % | ||||||||||||
| Gross profit | 195,277 | 60.8 | % | 178,390 | 60.4 | % | 164,645 | 60.5 | % | ||||||||||||
| Operating expenses | 204,327 | 63.6 | % | 177,655 | 60.2 | % | 165,771 | 60.9 | % | ||||||||||||
| (Loss)/income from operations | $ | (9,050 | ) | (2.8 | )% | $ | 735 | 0.2 | % | $ | (1,126 | ) | (0.4 | )% | |||||||
| Number of stores | 227 | 229 | 206 | ||||||||||||||||||
| FIRST COST SEGMENT: | |||||||||||||||||||||
| Commission fee income | $ | 7,441 | 100.0 | % | $ | 11,226 | 100.0 | % | $ | 9,493 | 100.0 | % | |||||||||
| Gross profit | 7,441 | 100.0 | % | 11,226 | 100.0 | % | 9,493 | 100.0 | % | ||||||||||||
| Operating expenses | 15,618 | 209.9 | % | 15,775 | 140.5 | % | 4,334 | 45.7 | % | ||||||||||||
| (Loss)/income from operations | $ | (8,177 | ) | (109.9 | )% | $ | (4,549 | ) | (40.5 | )% | $ | 5,159 | 54.3 | % | |||||||
| LICENSING SEGMENT: | |||||||||||||||||||||
| Licensing fee income | $ | 11,581 | 100.0 | % | $ | 12,899 | 100.0 | % | $ | 11,492 | 100.0 | % | |||||||||
| Gross profit | 11,581 | 100.0 | % | 12,899 | 100.0 | % | 11,492 | 100.0 | % | ||||||||||||
| Operating expenses | 3,477 | 30.0 | % | 2,933 | 22.7 | % | 2,392 | 20.8 | % | ||||||||||||
| Income from operations | $ | 8,104 | 70.0 | % | $ | 9,966 | 77.3 | % | $ | 9,100 | 79.2 | % | |||||||||
28
RESULTS OF OPERATIONS
($ in thousands)
Year Ended December 31, 2020 vs. Year Ended December 31, 2019
Consolidated:
Total revenue for the year ended December 31, 2020 decreased by 32.8% to $1,201,814 from $1,787,157 for fiscal 2019,with decreases in all segments as a result of the impact of the COVID-19 pandemic.For the year ended December 31, 2020, gross profit was $464,541, or 38.7% of total revenue, as compared to $686,017, or 38.4% of total revenue, in the prior year. The increase in gross profit as a percentage of total revenue was primarily due to the shift in sales to our higher-margin e-commerce business. Operating expenses in 2020 were $414,978, or 34.5% of total revenue, as compared $503,270, or 28.2% of total revenue, in 2019. The increase in operating expenses as a percentage of total revenue was primarily attributable to a deleverage on a lower sales base, but was also impacted by the impairment of lease right-of-use assets and store fixed assets, early lease termination and modification charges, and restructuring and other related charges as a result of the COVID-19 pandemic. The increase was partially offset by our reduction in workforce, furloughs, temporary salary reductions and reduced discretionary spending as a result of our initiatives to control expenses, along with the change in valuation of contingent considerations. In addition, for the years 2020 and 2019, impairments of intangibles of $44,273 and $4,050 were recorded, respectively. Also in 2020 and 2019, impairments for lease right-of-use assets and store fixed assets of $36,895 and $1,883 were recorded, respectively. The effective tax rate for the year ended December 31, 2020 increased to 39.0% compared to 21.8% last year. The increase in the effective tax rate is primarily due to the year-over-year benefit resulting from the exercising and vesting of share-based awards, an increase in tax benefit related to a net operating loss carryback claim set forth by the CARES Act, an increase in the GILTI tax, a decrease in the state taxes incurred, and an increase in 2019 pre-tax losses in jurisdictions with higher tax rates. Net loss attributable to Steven Madden, Ltd. for the year ended December 31, 2020 was $18,397 compared to net income attributable to Steven Madden, Ltd. of $141,311 for the year ended December 31, 2019.
Wholesale Footwear Segment:
Revenue from the Wholesale Footwear segment was $713,662, or 59.4%, and $1,112,091, or 62.2%, of our total revenue for the years ended December 31, 2020 and 2019, respectively. The decrease of 35.8% in revenue is primarily driven by the impact of the COVID-19 pandemic, including significant order cancellations. Gross profit in 2020 was $226,556, or 31.7% of Wholesale Footwear revenue, as compared to gross profit of $373,587, or 33.6% of Wholesale Footwear revenue, in 2019. The decrease in gross profit as a percentage of Wholesale Footwear revenue was primarily due to close-outs of excess inventory resulting from store closures and order cancellations from the impact of the COVID-19 pandemic and higher sales mix of our private label business, partially offset by lower markdowns. Operating expenses were $162,357, or 22.7% of Wholesale Footwear revenue, in 2020 compared to $206,055, or 18.5% of Wholesale Footwear revenue, in 2019. The increase in operating expenses as a percentage of Wholesale Footwear revenue was primarily attributable to a deleverage on a lower sales base in addition to restructuring and other related charges as a result of the COVID-19 pandemic, partially offset by our reduction in workforce, furloughs, temporary salary reductions and reduced discretionary spending as a result of our initiatives to control expenses. For 2020 and 2019, intangible impairment charges of $16,345 and $4,050 were recorded, respectively. Income from operations decreased to $47,854 for 2020 compared to $163,482 for 2019.
Wholesale Accessories/Apparel Segment:
Revenue from the Wholesale Accessories/Apparel segment accounted for $235,892, or 19.6%, and $334,862, or 18.7%, of total revenue for the years ended December 31, 2020 and 2019, respectively. The decrease of 29.6% in revenue was primarily attributable to the impact of the COVID-19 pandemic, including order cancellations. Gross profit was $70,908, or 30.1% of Wholesale Accessories/Apparel revenue, for 2020 as compared to $98,131, or 29.3% of Wholesale Accessories/Apparel revenue, in the prior year. The increase in gross profit as a percentage of Wholesale Accessories/Apparel revenue was primarily due to lower markdowns and an increase penetration of the higher margin BB Dakota apparel business. Operating expenses for 2020 were $60,932, or 25.8% of Wholesale Accessories/Apparel revenue, as compared to $75,676, or 22.6% of Wholesale Accessories/Apparel revenue, in 2019. The increase in operating expenses as a percentage of Wholesale Accessories/Apparel revenue was primarily attributable to a deleverage on a lower sales base, but was also impacted by restructuring and other related charges as a result of the COVID-19 pandemic. The increase in expenses was partially offset by our reduction in workforce, furloughs, temporary salary reductions and reduced discretionary spending as a result of our initiatives to control expenses, along with a change in valuation of a contingent consideration. For 2020, an intangible impairment charge of $27,472
29
was recorded. Loss from operations for the Wholesale Accessories/Apparel segment was $17,496 in 2020 compared to income from operations of $22,455 in 2019.
Retail Segment:
Revenue from the Retail segment accounted for $239,389, or 19.9% of total revenue, and $321,182, or 18.0%, of total revenue for the years ended December 31, 2020 and 2019, respectively. The decrease of 25.5% in revenue is primarily due to the COVID-19 pandemic, including the temporary closure of all of our brick-and-mortar stores in the U.S. and the vast majority of our brick-and-mortar stores globally from the second half of March through at least the end of May and subsequent mandated closures. During 2020, we added five stores and closed 14 stores. As of December 31, 2020 we had 218 retail stores compared to 227 stores as of December 31, 2019. The 218 stores currently in operation include 143 Steve Madden® full-price stores, 66 Steve Madden® outlet stores, one Steven® store, one Superga store and seven e-commerce websites. In addition, we operated 17 concessions in our international markets. During the year ended December 31, 2020, gross profit was $154,206, or 64.4% of Retail revenue compared to $195,277, or 60.8% of Retail revenue in 2019. The increase in gross profit as a percentage of Retail revenue was primarily due to a shift in sales to the higher-margin e-commerce business and less discounting. In 2020, operating expenses were $186,103, or 77.7% of Retail revenue, compared to $202,444, or 63.0% of Retail revenue in 2019. The increase in operating expenses as a percentage of Retail revenue was primarily attributable to a deleverage on a lower sales base, but was also impacted by the impairment of lease right-of-use assets and store fixed assets and restructuring and related charges as a result of the COVID-19 pandemic. The increase in expenses was partially offset by our reduction in workforce, furloughs, temporary salary reductions, rent reductions and reduced discretionary spending as a result of our initiatives to control expenses, along with the change in valuation of a contingent consideration. Also in 2020 and 2019, impairments for lease right-of-use assets and store fixed assets of $36,895 and $1,883 were recorded, respectively. For 2020, an intangible impairment charge of $456 was recorded. For the year ended December 31, 2020, loss from operations for the Retail segment was $69,248 compared to $9,050 in the prior year.
First Cost Segment:
Commission fee income generated by the First Cost segment accounted for $3,902, or 0.3% of total revenue, and $7,441, or 0.4% of total revenue for the years ended December 31, 2020 and 2019, respectively. Operating expenses decreased to $2,395 in 2020 from $15,618 in 2019. Operating expenses in 2020, included a benefit associated with the recovery from the Payless ShoeSource bankruptcy of $1,081 and in 2019 included charges to bad debt expenses associated with the Payless ShoeSource bankruptcy of $10,355. Income from operations was $1,507 for the year ended December 31, 2020 compared to a loss from operations of $8,177 in 2019.
Licensing Segment:
Licensing fee income generated by the Licensing segment accounted for $8,969, or 0.7% of total revenue, and $11,581, or 0.6% of total revenue for the years ended December 31, 2020 and 2019, respectively, which represents a $2,612, or 22.6%, decrease. Operating expenses decreased to $3,191 in 2020 from $3,477 in 2019. During the year ended December 31, 2020, income for the Licensing segment amounted to $5,778 as compared to the prior year income of $8,104.
Year Ended December 31, 2019 vs. Year Ended December 31, 2018
Total revenue for the year ended December 31, 2019 increased by 6.5% to $1,787,157 from $1,677,734 for fiscal 2018.Net sales for fiscal 2019 increased by 6.9% to $1,768,135$1,768,135 from $1,653,609$1,653,609 for fiscal 2018. Commission and licensing fee income for fiscal 2019 decreased by 21.2% to $19,022$19,022 from $24,125$24,125 for fiscal 2018. For the year ended December 31, 2019, gross margin as a percentage of total revenue increased to 38.4% in the current year compared to 38.2% in the prior year. For the year ended 2019, gross margin included a charge of $386 related to a termination of a joint venture. Operating expenses increased in 2019 to $505,153,$503,270, or 28.3%28.2% of total revenue, from $466,781, or 27.8% of total revenue, in 2018. For the years endedIn addition, in 2019 and 2018, operating expenses included certain chargesimpairments of $18,167 and $18,718, respectively. (See "Non-GAAP Financial Measures" aboveintangibles of $4,050 were recorded. Also in 2019, impairments for a descriptionlease right-of-use assets of these charges.) Excluding these charges, the increase in operating expenses primarily comprised (i) higher payroll and related expenses, (ii) higher warehouse and distribution expenses, (iii) higher marketing expenses, and (iv) higher occupancy related expenses.$1,883 were recorded. The effective tax rate for the year ended December 31, 2019 decreased to 21.8% compared to 26.4% in the same period last yearof 2018 primarily due to the year-over-year benefit resulting from the exercising and vesting of share-based awards, a decrease in the state taxes incurred, a decrease in prepaid tax adjustments, and an increase in 2019 pre-tax income in
30
jurisdictions with low tax rates. Net income attributable to Steven Madden, Ltd. for the year ended December 31, 2019 increased to $141,311 compared to $129,136 for the year ended December 31, 2018. Net income attributable to Steven Madden, Ltd. for fiscal 2019 and 2018 included net after-tax charges of $21,449 and $28,574, respectively. In 2019, these net charges included a (i) $8,602 after-tax expense, net of recovery associated with the Payless ShoeSource bankruptcy, (ii) $4,063 after-tax expense in connection with a provision for early lease termination charges and impairment of lease right-of-use asset, (iii) $3,033 after-tax impact of an impairment of the Brian Atwood trademark, (iv) $3,016 after-tax expense for a legal settlement and charges, (v) $2,590 tax expense in connection with deferred tax and other tax adjustments, (vi) $1,399 after-tax net benefit associated with the change in a contingent liability, partially offset by the acceleration of amortization related to the termination of the Kate Spade license agreement on December 31, 2019, (vii) $839 after-tax impact expense in connection with the acquisitions of GREATS and BB Dakota brands, (viii) $501 after-tax expense associated with a divisional headquarters relocation, and (ix) $204 after-tax expense related to the termination of a joint venture. In 2018, these charges included a (i) $11,481 after-tax expense, net of recovery associated with the Payless ShoeSource bankruptcy, (ii) $11,137 after tax expense in connection with the Tax Cuts and Jobs Act transition tax and taxing authorities audit and prepaid tax adjustments related to prior years, (iii) $2,478 after-tax expense in connection with a provision for legal and early lease termination charges, (iv) $1,536 after-tax expense in connection with the integration of the Schwartz & Benjamin acquisition and the related restructuring, (v) $1,028 tax expense related to an impairment to the preferred interest investment in Brian Atwood Italia Holding, LLC and (vi) $914 after-tax impact of expense related to a warehouse consolidation. Excluding these net charges, net income attributable to Steven Madden, Ltd. for the year 2019 and 2018 was $162,760 and $157,710, respectively.
Wholesale Footwear Segment:Segment:
Revenue generated by the Wholesale Footwear segment was $1,112,091, or 62.2%, of total revenue, and $1,058,366, or 63.1%, of our total revenue for the years ended December 31, 2019 and 2018, respectively. The increase in net revenue iswas primarily driven by strong growth in our Steve Madden Women's, along with the full year of recognizing revenue for the Anne Klein brand and an increase in our private label business, partially offset by not recognizing sales to Payless ShoeSource in the first half of 2019 compared to the first half of 2018.
Gross profit margin in 2019 was 33.6%, while gross profit margin in 2018 was 32.7%. The increase in gross profit margin of 90 basis points was primarily attributable to strong growth in Steve Madden Women's, along with not recognizing sales to the low-margin Payless ShoeSource customer. Operating expenses increased to $206,055, or 18.5% of revenue, in 2019 compared to $205,771, or 19.4% of revenue, in the same period of 2018. In 2019, operating expenses included a net benefit of $2,750, comprising of a net benefit of $1,868 associated with the change of a contingent liability and the acceleration of amortization related to the termination of the Kate Spade license agreement on December 31, 2019 and a recovery of $1,668 related to the Payless ShoeSource bankruptcy, partially offset by divisional headquarters relocation expenses of $669 and a charge of $117 related to an early lease termination. Also recordedRecorded in the Wholesale Footwear segment was a $4,050 impairment charge for the Brian Atwood trademark impacting operating income. In 2018, operating expenses included charges of $8,518, which consisted of $3,616 of bad debt expense related to the Payless ShoeSource bankruptcy, $2,837 related to provisionsincome for legal charges, and $2,065 related to Schwartz & Benjamin acquisition integration charges and related restructuring. Excluding these items, operating expenses increased to $208,805 or 18.8% of net sales, in 2019 compared to $197,253 or 18.6% of net sales in the same period of 2018.2019. The increase in
operating expenses primarily resulted from higher payroll and related expenses, warehouse and distribution expenses and other selling expenses associated with higher sales and the addition of the Anne Klein footwear business. Income from operations increased to $163,482 for 2019 compared to $140,138 for 2018. Income from operations, excluding the charges mentioned above, increased to $164,782 for the year ended December 31, 2019 compared to $148,656 for the year ended December 31, 2018.
Wholesale Accessories/Apparel Segment:Segment:
Revenue generated by the Wholesale Accessories/Apparel segment accounted for $334,862, or 18.7%, and $300,091, or 17.9%, of total revenue for the years ended December 31, 2019 and 2018, respectively. The increase in revenue was primarily due to growth in our Steve Madden branded handbags, the full year of recognizing sales for the Anne Klein brand, as well as the addition of the BB Dakota apparel business.
Gross profit margin in the Wholesale Accessories/Apparel segment decreased to 29.3% in 2019 from 30.6% in the prior year period. The 1.3% decrease in gross margin resulted from tariffs imposed on accessories when compared to 2018. In the year ended December 31, 2019, operating expenses increased to $75,676, or 22.6% of revenue, compared to $64,647, or 21.5% of revenue, in the year ended December 31, 2018. In 2019, operating expenses included a charge of $513 related to costs in the acquisition of the BB Dakota apparel brand and in 2018, operating expenses included a charge of $1,241 related to a warehouse consolidation. Excluding these charges, operating expenses in 2019 increased to $75,163, or 22.4% of revenue, compared to $63,406, or 21.1% of revenue. The increase primarily resulted from higher payroll related expenses associated with the increase in sales, as well as the addition of the BB Dakota apparel business. Also, contributing to the increase waswere higher warehouse and distribution expenses, other selling expenses and marketing expenses all based on higher sales volume. Income from operations for the Wholesale Accessories/Apparel segment decreased to $22,455 in 2019 compared to $27,092 in 2018. Income from operations, excluding the charges mentioned above, decreased to $22,968 in 2019 compared to $28,333 in 2018.
Revenue generated by the Retail segment accounted for $321,182, or 18.0%, and $295,152, or 17.6%, of total revenue for the years ended December 31, 2019 and 2018, respectively, which represents a $26,030, or 8.8%, increase. The increase in revenue iswas primarily due to an increase in comparable store sales of 6.1% driven by the significant growth in our e-commerce business. During 2019, we had net closures of 2 stores. The net closures comprised 17 full-price locations, 2 outlet locations and 1 e-commerce website, closures, partially offset by the addition of 8 full-price stores, 8 outlets and 2 e-commerce websites, which included the additional stores and e-commerce sites from the acquisition of GREATS and BB Dakota brands. As a result, we had 227 retail stores as of December 31, 2019, compared to 229 stores as of December 31, 2018. The 227 stores currently in operation include 146 Steve Madden® full-price stores, 68 Steve Madden® outlet stores, 2 Steven® stores, 2 GREATS® stores, 1 Superga store and 8 e-commerce websites. In addition, we operated 31 concessions in our international markets.Comparable store sales (sales of those stores, including the e-commerce websites, that were open for all of 2019) for the year ended December 31, 2019 increased 6.1% when compared to the prior year. We exclude new locations from the comparable store base for the first year of operations. Stores that are closed for renovations are removed from the comparable store base. During the year ended December 31, 2019, the gross profit margin increased to 60.8% from 60.4% in 2018 primarily due to higher margins in our e-commerce business partially offset by a loss of $386 related to the termination of a joint venture in China. In 2019, operating expenses increased to $204,327,$202,444, or 63.6%63.0% of revenue, from $177,655, or 60.2% of revenue, in 2018. InAlso in 2019, operating expenses included charges of $10,049, which comprised charges of $3,977 related to a legal settlement and charges, $3,423 related to early lease terminations, $1,883 of impairment ofimpairments for lease right-of-use assets $608 of costs related to the acquisition of the GREATS brand and $158 related to the termination of a joint venture in China. In 2018, operating expenses included a charge $452 related to early lease terminations. Excluding these charges, operating expenses increased to $194,278, or 60.5% of revenue, from $177,203, or 60.0% of revenue, in 2018, primarily due to growth in our e-commerce business, along with the addition of the GREATS brand.$1,883 were recorded. For the year ended December 31, 2019, loss from operations for the Retail segment was $9,050 compared to income from operations of $735 in the prior year. Income from operations, excluding the charges mentioned above, increased to $1,385 in 2019 compared to $1,187 in 2018.
31
First Cost Segment:Segment:
Commission fee income generated by the First Cost segment accounted for $7,441, or 0.4%, and $11,226, or 0.7% of total revenue for the years ended December 31, 2019 and 2018, respectively, which represents a $3,785, or 33.7%, decrease. The decrease in commission fee income is primarily due to the Payless ShoeSource bankruptcy that occurred in 2019. Operating expenses slightly decreased to $15,618 in 2019 from $15,775 in 2018. Operating expenses included charges associated with the Payless ShoeSource bankruptcy of $10,355 in 2019 related to vendor support, net recovery of bad debt expenses, and $8,507 in 2018 related to bad debt expenses and write-off of an unamortized buying agency support agreement. Excluding these charges, operating expenses
Licensing Segment:
Licensing fee income generated by the Licensing segment accounted for $11,581, or 0.6%, and $12,899, or 0.8% of total revenue for the years ended December 31, 2019 and 2018, respectively, which represents a $1,318, or 10.2%, decrease. The decrease in licensing fee income is primarily due to a decrease in royalties in connection with Payless ShoeSource bankruptcy. Operating expenses increased to $3,477 in 2019 from $2,933 in 2018. The increase in operating expenses was primarily due to higher marketing and payroll related expenses. During the year ended December 31, 2019, income for the Licensing segment amounted to $8,104 as compared to the prior year income of $9,966.
LIQUIDITY AND CAPITAL RESOURCES
($ in thousands)
Cash, cash equivalents and short-term investments totaled $304,622$287,166 and $266,999$304,622 at December 31, 20192020 and December 31, 2018,2019, respectively. At December 31, 2019,2020, we held $137,072,$158,610, or approximately 45%56%, of our total cash, cash equivalents and short-term investments in our foreign subsidiaries, and at December 31, 2018,2019, we held $198,110,$137,072, or approximately 74%45%, in our foreign subsidiaries.
We havehad a collection agency agreement with Rosenthal & Rosenthal, Inc. (“Rosenthal”). until May 6, 2020. The agreement providesprovided us with a credit facility in the amount of $30,000, having a sub-limit of $15,000 on the aggregate face amountamounts of letters of credit, at an interest
rate based, at our election, upon either the prime rate or LIBOR. The agreement can be terminated by us or Rosenthal at any timeEffective May 6, 2020, the credit facility was increased to $50,000 as a precautionary measure in response to the COVID-19 pandemic.
On July 22, 2020, we entered into a new $150,000, five-year, asset-based revolving credit facility with 60 days’ prior written notice. As of December 31, 2019, we had no borrowings against thisCitizens Bank, N.A. and various participating lenders, which replaced our credit facility.facility with Rosenthal.
As of December 31, 2019,2020, we had working capital of $437,608,$462,325, cash and cash equivalents of $264,101,$247,864, and short-term investments in marketable securities of $40,521$39,302 and did not have any long-termno debt.
We believe that based upon our current financial position and available cash, cash equivalents and marketable securities,short-term investments, we will meet all of our financial commitments and operating needs for at least the next twelve months. In addition, as a precautionary measure, we have entered into the $150,000 asset-based revolving credit facility, which provides additional liquidity and flexibility should we need it.
OPERATING ACTIVITIES
($ in thousands)
Cash provided by operations was $233,780$44,206 in 20192020 compared to cash provided by operations of $154,376$233,780 in the prior year. The primary sourcesreduction in cash provided by operations was primarily driven by the reduction of cash were net income as result of $141,722the COVID-19 pandemic and decreasesunfavorable changes in factor account receivables of $24,924, increasesour working capital, including unfavorable changes in accounts payable and accrued expenses and income taxes payable of $11,036 and prepaid expenses, prepaid tax, deposits and other of $9,466. This source of cash wasfactor accounts receivable, partially offset by the use of cash as a result of an increasefavorable changes in inventories and accounts receivable of $17,837.receivables.
INVESTING ACTIVITIES
($ in thousands)
During the year ended December 31, 20192020 cash used in investing activities was $27,748,$4,884, of which we invested $67,935$73,792 in marketable securities and received $95,671$75,470 from the maturities and sales of securities. We invested in two acquisitions, net of cash of $37,173, and made capital expenditures of $18,311,$6,562, principally for systems enhancements, leasehold improvements to office and improvements to existing stores and new stores.stores that were committed to and in final stages prior to the COVID-19 pandemic.
FINANCING ACTIVITIES
($ in thousands)
During the year ended December 31, 2019,2020, net cash used in financing activities was $142,178,$57,074, which primarily consisted of share repurchases of $101,768,$46,583, and payment of cash dividends of $48,426,$12,459, partially offset by proceeds from the exercise of stock options of $6,212.$1,609.
CONTRACTUAL OBLIGATIONS
($ in thousands)
Our contractual obligations as of December 31, 20192020 were as follows:
| Payment due by period | Payment due by period | |||||||||||||||||||||||||||||||||||||||||||||||||||
| Contractual Obligations | Total | 2020 | 2021-2022 | 2023-2024 | 2025 and after | Contractual Obligations | Total | 2021 | 2022-2023 | 2024-2025 | 2026 and after | |||||||||||||||||||||||||||||||||||||||||
| Operating lease obligations | $ | 193,914 | $ | 46,035 | $ | 70,060 | $ | 39,700 | $ | 38,119 | Operating lease obligations | $ | 147,889 | $ | 39,700 | $ | 53,312 | $ | 32,922 | $ | 21,955 | |||||||||||||||||||||||||||||||
| Purchase obligations | 62,869 | 62,869 | — | — | — | Purchase obligations | 64,523 | 64,523 | — | — | — | |||||||||||||||||||||||||||||||||||||||||
| Future minimum royalty and advertising payments | 28,680 | 8,535 | 16,520 | 3,625 | — | Future minimum royalty and advertising payments | 20,225 | 8,350 | 11,875 | — | — | |||||||||||||||||||||||||||||||||||||||||
| Transition tax | 16,410 | 1,563 | 3,126 | 6,837 | 4,884 | Transition tax | 14,847 | 1,563 | 4,493 | 8,791 | — | |||||||||||||||||||||||||||||||||||||||||
| Total | $ | 301,873 | $ | 119,002 | $ | 89,706 | $ | 50,162 | $ | 43,003 | Total | $ | 247,484 | $ | 114,136 | $ | 69,680 | $ | 41,713 | $ | 21,955 | |||||||||||||||||||||||||||||||
At December 31, 2019,2020, we had no$188 open letters of credit outstanding for the purchase of inventory.
We have employment agreements with our Creative and Design Chief, Steven Madden, and certain executive officers, which provide for the payment of compensation aggregating approximately $10,253 in 2020, $9,560$10,700 in 2021, $7,776$8,941 in 2022 and $7,026$7,774 in 2023. In addition, some of these employment agreements provide for discretionary bonuses and some provide for incentive compensation based on various performance criteria as well as other benefits, including stock-related compensation.
Transition tax of $16,410$14,847 was the result of the Tax Cuts and Jobs Act of 2017 (the "Tax Act"). For further information, refer to Note O to the Consolidated Financial Statements included in this Annual Report on Form 10-K. Excluded from the contractual obligations table above are long-term taxes payable of $1,150$2,295 as of December 31, 20192020 primarily related to uncertain tax positions, for which we are unable to make a reasonably reliable estimate of the timing of payments in individual years beyond one year due to uncertainties in the timing of tax audit outcomes.
DIVIDENDS
In February 2019,2020, our Board of Directors declared a quarterly cash dividend of $0.14 per share on our outstanding shares of common stock. The dividend was paid on March 29, 2019, to stockholders of record as of the close of business on March 19, 2019. We paid total cash dividends for the three months ended March 31, 2019 of $12,042.
33
Future quarterly cash dividend payments are also subject to the discretion of our Board of Directors and contingent upon future earnings, our financial condition, capital requirements, general business conditions, and other factors. Therefore, we can give no assurance that cash dividends of any kind will be paid to holders of our common stock in the future.
INFLATION
We do not believe that inflation and price changes have had a significant effect on our sales or profitability for the fiscal year ended December 31, 20192020 and the prior two fiscal years. Historically, we have minimized the impact of product cost increases by increasing prices, changing suppliers and improving operating efficiencies. However, no assurance can be given that we will be able to offset any such inflationary cost increases in the future.
OFF-BALANCE SHEET ARRANGEMENTS
We have no off-balance sheet arrangements.
CRITICAL ACCOUNTING POLICIES AND THE USE OF ESTIMATES
This Management’s Discussion and Analysis of Financial Condition and Results of Operations is based upon our consolidated financial statements included in this Annual Report on Form 10-K, which have been prepared in accordance with accounting principles generally accepted in the United States of America ("GAAP"). The preparation of these financial statements requires management to make estimates and judgments that affect the reported amounts of assets, liabilities, sales and expenses, and related disclosure of contingent assets and liabilities. Estimates by their nature are based on judgments and available information. Our estimates are made based upon historical factors, current circumstances and the experience and judgment of management. Assumptions and estimates are evaluated on an ongoing basis, and we may employ outside experts to assist in evaluations. Therefore, actual results could materially differ from those estimates under different assumptions and conditions. Management believes the following critical accounting estimates are more significantly affected by judgments and estimates used in the preparation of our consolidated financial statements: allowance for bad debts; customer returns, chargebacks and customer chargebacks;co-op advertising; inventory valuation; valuation of intangible assets; litigation reserves; and contingent payment liabilities.
Allowances for bad debts. Accounts receivable are reduced by an allowance for amounts that may be uncollectible in the future. Estimates are used in determining the allowance for doubtful accounts and are based on an analysis of the aging of accounts receivable, assessments of collectability based on historical trends, the financial condition of our customers and an evaluation of economic conditions. In general, the actual bad debt losses have historically been within our expectations and the allowances we have established. The reserve against our non-factored trade receivables also includes estimated losses that may result from customers’ inability to pay.
Customer returns, chargebacks and chargebacksco-op advertising. We provide variable consideration to our customers for chargebacks, discounts, co-op advertising, allowances, discounts, returns and other miscellaneous deductions that relate to the current period. The amount of the consideration for returns, discounts and compliance chargebacks is determined by analyzing aged receivables, current economic conditions, the prevailing retail environment and historical dilution levels for customers. We evaluate anticipated customer markdowns and advertising chargebacks by reviewing several performance indicators for our major customers. These performance indicators (which include inventory levels aton the retail floors, sell through rates and gross margin levels) are analyzed by management to estimate the amount of the anticipated customer allowance. Under our co-op advertising programs, we agree to reimburse the retailer for a portion of the costs incurred by the retailer to advertise and promote some of our products. We estimate the costs of co-op advertising programs based on the terms of the agreements with its retailer customers. Failure to correctly estimate the amount of the reserve could materially impact our results of operations and financial position.
Inventory valuation. Inventories are stated at lower of cost or market,net realizable value, on a first-in, first-out basis. We review inventory on a regular basis for excess and slow movingslow-moving inventory. The review is based on an analysis of inventory on hand, prior sales, and expected net realizable value through future sales. The analysis includes a review of inventory quantities on hand at period-end in relation to year-to-date sales and projections for sales in the foreseeable future as well as subsequent sales. We consider quantities on hand in excess of estimated future sales to be at risk for market impairment. The net realizable value, or market value, is determined based on the estimate of sales prices of such inventory through off-price or discount store channels. The likelihood of any material inventory write-down is dependent primarily on the expectation of future consumer demand for our product.products. A misinterpretation or misunderstanding of future consumer demand for our product,products, the economy, or other failure to estimate correctly, in addition to abnormal weather patterns, could result in inventory valuation changes, compared to the valuation determined to be appropriate as of the balance sheet date.
Valuation of intangible assets and goodwill. In accordance with applicable accounting guidance, we test goodwill and intangible assets with indefinite lives at least annually. This accounting guidance also requires that intangible assets with finite
34
lives be amortized over their respective lives to their estimated residual values and reviewed for impairment in accordance with applicable accounting guidance.
Indefinite-lived intangible assets and goodwill are assessed for impairment by performing a qualitative assessment that evaluates relevant events or circumstances in order to determine whether it is more likely than not that the fair value of an intangible or a reporting unit is less than its carrying amount. Factors considered include historical financial performance, macroeconomic and industry conditions and legal and regulatory environment. If it is more likely than not that the fair value of the reporting unit is less than its carrying amount, the fair value of the reporting unit is compared with its carrying amount, and if the fair value of the reporting unit is less than its carrying amount, an impairment is recognized equal to the amount by which the reporting unit's carrying value exceeds its fair value, not to exceed the carrying amount. We perform this annual assessment during our third quarter.quarter or if impairment indicators warrant a test.
Impairment of long-lived assets. We perform an impairment review of our long-lived assets, once events or changes in circumstances indicate, in management’s judgment, that the carrying value of such assets may not be recoverable. When such a determination has been made, management compares the carrying value of the asset groups with their estimated future undiscounted cash flows. If it is determined that an impairment has occurred, the fair value of the asset group is determined and compared to its carrying value. The excess of the carrying value over the fair value, if any, is recognized as a loss during that period. The impairment is calculated as the difference between asset carrying values and the fair value of the long-lived assets.
Litigation reserves. Estimated amounts for litigation claims that are probable and can be reasonably estimated are recorded as liabilities in our consolidated financial statements. The likelihood of a material change in these estimated reserves would be dependent on new claims as they may arise and the favorable or unfavorable events of a particular litigation. As additional information becomes available, management will assess the potential liability related to the pending litigation and revise its estimates. Such revisions in management’s estimates of a contingent liability could materially impact our results of operation and financial position.
Contingent payment liabilities. We have completed acquisitions that require us to make contingent payments to the sellers based on the future financial performance of the acquired businesses over a period from one to sixthree years. The fair value of the contingent payments is estimated using the present value of management's projections of the financial results of the acquired business. Failure to correctly project the financial results of the acquired businesses could materially impact our results of operations and financial position.
ITEM 7A. QUANTITATIVE AND QUALITATIVE DISCLOSURES ABOUT MARKET RISK
($ in thousands)
We do not engage in the trading of market risk sensitive instruments in the normal course of business. Our financing arrangements are subject to variable interest rates, primarily based on the prime rate and LIBOR. An analysisThe terms of our new $150,000 asset-based revolving credit agreement and our collection agency agreementagreements with Rosenthal & Rosenthal, Inc. can be found in the “LiquidityLiquidity and Capital Resources”Resources section under Part II,of Item 7 and in Note T and Note E, respectively, to the Consolidated Financial Statements included in this Annual Report on Form 10-K under the caption “Factor Receivable.” 10-K.
As of December 31, 2019,2020, we held marketable securitiesshort-term investments valued at approximately $40,521,$39,302, which consisted of certificates of deposit. The values of these securities may fluctuate as a result of changes in values, market interest rates and credit risk. We have the ability to hold these investments until maturity. In addition, any decline in interest rates would be expected to reduce our interest income.
We face market risk to the extent that our U.S. or foreign operations involve the transaction of business in foreign currencies. Also,In addition, our inventory purchases are primarily done in foreign jurisdictions and inventory purchases may be impacted by fluctuations in the exchange rates between the U.S. dollar and the local currencies of our contract manufacturers, which could have the effect of increasing the cost of goods sold in the future. We manage these risks primarily by denominating these purchases in U.S. dollars. To mitigate the risk of purchases that are denominated in foreign currencies we may enter into forward foreign exchange contracts for terms of no more than two years. A description of our accounting policies for derivative financial instruments is included in Notes BC and M to the Consolidated Financial Statements.
During 2019,2020, we entered into forward foreign exchange contracts with notional amounts totaling $72,409.$44,279. We performed a sensitivity analysis based on a model that measures the impact of a hypothetical change in foreign currency exchange rates to determine the effects that market risk exposures may have on the fair values of our forward foreign exchange contracts that were outstanding as of the year-end. As of December 31, 2019,2020, a 10% increase or decrease of the U.S. dollar against the exchange rates for foreign currencies under forward foreign exchange contracts would result in a net increase or decrease, respectively, in the fair value of our derivatives portfolio of approximately $4,591.$4,075.
In addition, we are exposed to translation risk in connection with our foreign operations in Canada, Mexico, Europe, South Africa, China, Taiwan and Israel because our subsidiaries and joint ventures in these countries utilize the local currency
35
as their functional currency, and those financial results must beare translated into U.S. dollars. As currency exchange rates fluctuate, foreign currency exchange rate translation adjustments reflected in our financial statements with respect to our foreign operations affects the comparability of financial results between years.
ITEM 8. FINANCIAL STATEMENTS AND SUPPLEMENTARY DATA
The information required by this Item is incorporated herein by reference to the consolidated financial statements listed in response to Item 15 of Part IV of this Annual Report on Form 10-K.
ITEM 9. CHANGES IN AND DISAGREEMENTS WITH ACCOUNTANTS ON ACCOUNTING AND
FINANCIAL DISCLOSURE
In connection with the audits of our consolidated financial statements for each of the two fiscal years ended December 31, 2019 and 2018, and in the subsequent interim period through March 6, 2020, there were (i) no disagreements between us and EisnerAmper on any matters of accounting principles or practices, financial statement disclosure or auditing scope or procedure, which disagreements, if not resolved to the satisfaction of EisnerAmper, would have caused it to make reference to the subject matter of the disagreements in connection with its report on the financial statements for such years and (ii) no “reportable events” as defined in Section 304(a)(1)(v) of SEC Regulation S-K and the related instructions thereto.
ITEM 9A. CONTROLS AND PROCEDURES
Disclosure Controls and Procedures
As required by Rule 13a-15(b) of the Securities Exchange Act of 1934, as amended (the "Exchange Act"), our management, including our Chief Executive Officer and Chief Financial Officer, has evaluated the effectiveness of our disclosure controls and procedures as of the end of the fiscal year covered by this Annual Report on Form 10-K. Based on that evaluation, the Chief Executive Officer and Chief Financial Officer have concluded that our disclosure controls and procedures (as defined in Rule 13a-15(e) under the Exchange Act) were effective as of the end of the fiscal year covered by this Annual Report on Form 10-K.
Management's Annual Report on Internal Control Over Financial Reporting
Management of Steven Madden, Ltd. is responsible for establishing and maintaining adequate internal control over financial reporting (as defined in Rule 13a-15(f) of the Exchange Act).
Our internal control over financial reporting is a process designed by, or under the supervision of, our principal executive officer and principal financial officer, and effected by the boardBoard of directors,Directors, management, and other personnel, to provide reasonable assurance regarding the reliability of financial reporting and the preparation of financial statements for external purposes in accordance with accounting principles generally accepted in the United States of America ("GAAP"). Our internal control over financial reporting includes those policies and procedures that (1) pertain to maintenance of records that, in reasonable detail, accurately and fairly reflect the transactions and dispositions of our assets; (2) provide reasonable assurance that transactions are recorded as necessary to permit preparation of financial statements in accordance with GAAP, and that our receipts and expenditures are being made only in accordance with authorizations of our management and directors; and (3) provide reasonable assurance regarding prevention or timely detection of unauthorized acquisition, use, or disposition of our assets that could have a material effect on the financial statements.
Because of its inherent limitations, internal control over financial reporting may not prevent or detect misstatements. Also, projections of any evaluation of effectiveness to future periods are subject to the risk that controls may become inadequate because of changes in conditions, or that the degree of compliance with the policies or procedures may deteriorate.
With the participation of the Chief Executive Officer and the Chief Financial Officer, our management conducted an evaluation of the effectiveness, as of the end of our fiscal year ended December 31, 2019,2020, of our internal control over financial reporting based on the framework and criteria established in the 2013 Internal Control-Integrated Framework, issued by the
36
Committee of Sponsoring Organizations of the Treadway Commission. Based on this evaluation our management has concluded that, as of December 31, 2019,2020, our internal control over financial reporting was effective.
Our independent registered public accounting firm, EisnerAmperErnst & Young LLP, has audited our consolidated financial statements and the effectiveness of our internal control over financial reporting as of December 31, 2019.2020. Their report appears in this Annual Report on Form 10-K.
Changes in Internal Control Over Financial Reporting
There was no change in our internal control over financial reporting, as identified in connection with the evaluation required by paragraph (d) of Rule 13a-15 of the Exchange Act, that occurred during the fiscal quarter ended December 31, 2019,2020, which has materially affected, or is reasonably likely to materially affect, our internal control over financial reporting.
ITEM 9B. OTHER INFORMATION
On February 27, 2020,25, 2021, we issued a press release reporting our financial results for the fiscal quarter and fiscal year ended December 31, 2019, a copy of which is attached as Exhibit 99.01 to this Annual Report.2020.
PART III
ITEM 10. DIRECTORS, EXECUTIVE OFFICERS AND CORPORATE GOVERNANCE
The information required to be furnished pursuant to this Item will be set forth in our proxy statement for the 20202021 Annual Meeting of Stockholders and is incorporated herein by reference.
ITEM 11. EXECUTIVE COMPENSATION
The information required to be furnished pursuant to this Item will be set forth in our proxy statement for the 20202021 Annual Meeting of Stockholders and is incorporated herein by reference.
ITEM 12. SECURITY OWNERSHIP OF CERTAIN BENEFICIAL OWNERS AND MANAGEMENT AND
RELATED STOCKHOLDER MATTERS
The information required to be furnished pursuant to this Item will be set forth in our proxy statement for the 20202021 Annual Meeting of Stockholders and is incorporated herein by reference.
ITEM 13. CERTAIN RELATIONSHIPS AND RELATED TRANSACTIONS, AND DIRECTOR
INDEPENDENCE
The information required to be furnished pursuant to this Item will be set forth in our proxy statement for the 20202021 Annual Meeting of Stockholders and is incorporated herein by reference.
ITEM 14. PRINCIPAL ACCOUNTING FEES AND SERVICES
The information required to be furnished pursuant to this Item will be set forth in our proxy statement for the 20202021 Annual Meeting of Stockholders and is incorporated herein by reference.
PART IV
ITEM 15. EXHIBITS AND FINANCIAL STATEMENT SCHEDULES
(a) Exhibits. See the exhibit index included herein.
(b) Financial Statements and Financial Statements Schedules
See Index to Consolidated Financial Statements included herein.
37
Exhibit Index
| The following materials from Steven Madden, Ltd.'s Annual Report on Form 10-K for the fiscal year ended December 31, | |||||
| 104 | Cover Page Interactive Data File, formatted in Inline Extensible Business Reporting Language (iXBRL).* | ||||
† Filed herewith.
# Indicates management contract or compensatory plan or arrangement required to be identified pursuant to Item 15(b) of this Annual Report on Form 10-K.
* This exhibit shall not be deemed “filed” for purposes of Section 18 of the Securities Exchange Act of 1934, as amended, or otherwise subject to the liability of that section, nor shall it be deemed incorporated by reference into any filing under the Securities Act of 1933, as amended, or the Securities Exchange Act of 1934, as amended, whether made before or after the date hereof and irrespective of any general incorporation language in any filing, except to the extent the Company specifically incorporates it by reference.
SIGNATURES
Pursuant to the requirements of Section 13 or 15(d) of the Securities Exchange Act of 1934, the Registrant has duly caused this report to be signed on its behalf by the undersigned thereunto duly authorized.
DATE: March 2, 202016, 2021
| STEVEN MADDEN, LTD. | ||
| /s/ EDWARD R. ROSENFELD | ||
| Edward R. Rosenfeld | ||
| Chairman and Chief Executive Officer | ||
| /s/ | ||
| Chief Financial Officer | ||
41
POWER OF ATTORNEY
KNOW ALL PERSONS BY THESE PRESENTS, that each of the undersigned constitutes and appoints Edward R. Rosenfeld and Arvind Dharia,Zine Mazouzi, and each of them, as attorneys-in-fact and agents, with full power of substitution and re-substitution, for and in the name, place and stead of the undersigned, in any and all capacities, to sign any and all amendments to this Annual Report on Form 10-K, and to file the same, with all exhibits thereto and all other documents in connection therewith, with the Securities and Exchange Commission, granting unto said attorneys-in-fact and agents full power and authority to do and perform each and every act and thing requisite and necessary to be done in and about the premises, as fully to all intents and purposes as the undersigned might or could do in person, hereby ratifying and confirming all that each of said attorney-in-fact or substitute or substitutes, may lawfully do or cause to be done by virtue hereof.
Pursuant to the requirements of the Securities Exchange Act of 1934, this report has been signed below by the following persons on behalf of the registrant in the capacities and on the dates indicated.
| Signature | Title | Date | ||||||
| /S/ EDWARD R. ROSENFELD | Chairman, Chief Executive Officer and Director | March | ||||||
| Edward R. Rosenfeld | ||||||||
| / | Chief Financial Officer | March | ||||||
| /S/ AMELIA NEWTON VARELA | President and Director | March | ||||||
| Amelia Newton Varela | ||||||||
| /S/ PETER MIGLIORINI | Director | March | ||||||
| Peter Migliorini | ||||||||
| /S/ RAVI SACHDEV | Director | March | ||||||
| Ravi Sachdev | ||||||||
| /S/ THOMAS H. SCHWARTZ | Director | March | ||||||
| Thomas H. Schwartz | ||||||||
| /S/ ROSE LYNCH | Director | March | ||||||
| Rose Lynch | ||||||||
| /S/ ROBERT SMITH | Director | March | ||||||
| Robert Smith | ||||||||
| /S/ MITCHELL S. KLIPPER | Director | March | ||||||
| Mitchell S. Klipper | ||||||||
| /S/ AL FERRARA | Director | March | ||||||
| Al Ferrara | ||||||||
| /S/ MARÍA TERESA KUMAR | Director | March 16, 2021 | ||||||
| María Teresa Kumar | ||||||||
42
INDEX TO CONSOLIDATED FINANCIAL STATEMENTS
Consolidated Balance Sheets as of December 31, | |||||
Consolidated Statements of (Loss)/Income for the years ended December 31, 2020, 2019 | |||||
Consolidated Statements of Comprehensive (Loss)/Income for the years ended December 31, 2020, 2019 | |||||
Consolidated Statements of Changes in Stockholders' Equity for the years ended December 31, 2020, 2019 | |||||
Consolidated Statements of Cash Flows for the years ended December 31, 2020, 2019 | |||||
To the Stockholders and the Board of Directors and Stockholders of
Steven Madden, Ltd.
Opinion on the Financial Statements
We have audited the accompanying consolidated balance sheetssheet of Steven Madden, Ltd. and Subsidiaries (the “Company")subsidiaries(the Company) as of December 31, 2019 and 2018, and2020, the related consolidated statements of income, comprehensive income, changes to stockholders’in stockholders' equity and cash flows for each of the years in the three-year periodyear ended December 31, 2019,2020, and the related notes (collectively referred to as the “financial“consolidated financial statements”). In our opinion, the consolidated financial statements present fairly, in all material respects, the consolidated financial position of the Company as ofat December 31, 2019 and 2018,2020, and the consolidated results of theirits operations and theirits cash flows for each of the years in the three-year periodyear ended December 31, 2019,2020, in conformity with accounting principlesU.S. generally accepted in the United States of America.
We also have audited, in accordance with the standards of the Public Company Accounting Oversight Board (United States) ("PCAOB")(PCAOB), the Company's internal control over financial reporting as of December 31, 2019,2020, based on criteria established in Internal Control - IntegratedControl-Integrated Framework(2013) issued by the Committee of Sponsoring Organizations of the Treadway Commission (“COSO”),(2013 framework) and our report dated March 2, 202016, 2021 expressed an unqualified opinion.opinion thereon.
Basis for Opinion
These financial statements are the responsibility of the Company’sCompany's management. Our responsibility is to express an opinion on the Company’s financial statements based on our audits. We are a public accounting firm registered with the PCAOB and are required to be independent with respect to the Company in accordance with the U.S. federal securities laws and the applicable rules and regulations of the Securities and Exchange Commission and the PCAOB.
We conducted our audits in accordance with the standards of the PCAOB. Those standards require that we plan and perform the audit to obtain reasonable assurance about whether the financial statements are free of material misstatement, whether due to error or fraud. Our audits included performing procedures to assess the risks of material misstatement of the financial statements, whether due to error or fraud, and performing procedures that respond to those risks. Such procedures included examining, on a test basis, evidence regarding the amounts and disclosures in the financial statements. Our audits also included evaluating the accounting principles used and significant estimates made by management, as well as evaluating the overall presentation of the financial statements. We believe that our audits provide a reasonable basis for our opinion.
Critical Audit Matters
The critical audit matters communicated below are matters arising from the current period audit of the financial statements that were communicated or required to be communicated to the audit committee and that: (1) relate to accounts or disclosures that are material to the financial statements and (2) involved our especially challenging, subjective or complex judgments. The communication of critical audit matters does not alter in any way our opinion on the consolidated financial statements, taken as a whole, and we are not, by communicating the critical audit matters below, providing separate opinions on the critical audit matters or on the accounts or disclosures to which they relate.
F-1
| Impairment of Long-Lived Assets at Retail Stores | ||||||||
| Description of the Matter | As discussed in Notes H and N to the consolidated financial statements, the Company evaluates its long-lived assets, including property and equipment and operating lease right-of-use assets at retail stores, for impairment whenever events or changes in circumstances indicate that the carrying amounts of such assets may not be recoverable. In determining whether an impairment indicator exists, the Company considers store operating performance criteria and qualitative measures at the lowest level for which identifiable cash flows are largely independent of cash flows for other assets and liabilities, which is at the store level. During the year ended December 31, 2020, the Company recognized impairment charges of $14.7 million and $22.2 million related to property and equipment and operating lease right-of-use assets, respectively, at certain of its retail stores. Auditing the Company’s impairment assessment of retail store long-lived assets was complex and highly judgmental due to the significant estimation required in determining the future cash flows used to assess recoverability of each retail store long-lived asset group (undiscounted) and determining the fair value (discounted). The significant assumptions used include estimated future cash flows directly related to the future operation of the stores and the discount rate used to determine fair value. Significant assumptions used in determining the fair value of certain operating lease right-of-use assets include the current market rent and discount rate for the remaining lease term of the related stores. These assumptions are subjective in nature and are affected by expectations about future market or economic conditions (including the effects of the global pandemic). | |||||||
| How We Addressed the Matter in Our Audit | We obtained an understanding, evaluated the design and tested the operating effectiveness of controls over the retail store long-lived assets impairment process, including, determining the undiscounted future cash flows of the stores and the fair value of the long-lived assets for the stores that were deemed to be impaired. We also tested controls over management’s review of the significant assumptions described above. Our testing of the Company’s impairment measurement included, among other procedures, evaluating the significant assumptions and operating data used to calculate the estimated future cash flows and to determine the fair value of the store long lived assets. For a sample of retail stores, we tested the completeness and accuracy of the data used by the Company in its analyses and we compared the significant assumptions used to determine the forecasted cash flows to historical results of the retail stores, current industry and economic trends and inquired of the Company’s executives to understand the business initiatives supporting the assumptions in the future cash flows. We involved our internal valuation specialists to assist in evaluating the fair value of certain operating lease right-of-use assets, which included assessing the estimated market rental rates of these leases by comparing them to rental rates for comparable leases and evaluating the applied discount rate. | |||||||
F-2
| Markdown Allowances | ||||||||
| Description of the Matter | As described in Note C to the consolidated financial statements, revenue recognized by the Company is measured as the amount of consideration the Company expects to receive in exchange for transferring goods, which includes estimates for variable consideration. Variable consideration includes markdown allowances which are recorded as a reduction of revenue in the period in which revenue is recognized. Estimating the amount of markdown allowances to be recorded requires management to review several performance indicators, including retailers’ inventory levels, sell-through rates and gross margin levels. Auditing management's estimate of markdown allowances reserves was complex and judgmental as reserve amounts are sensitive to changes in market or economic conditions (including the effects of the global pandemic), and have a direct, material impact on the amount of revenue recognized by the Company. There is also significant estimation required to establish markdown reserve rates by brand and customer, which are based on the Company's review of periodic negotiations with each customer and the expected performance of the products in the customers' stores. | |||||||
| How We Addressed the Matter in Our Audit | We obtained an understanding, evaluated the design and tested the operating effectiveness of internal controls over the Company's process to calculate the markdown allowances, including the consideration of historical experience, actual and forecasted results, and current economic and market conditions (including the effects of the global pandemic). To test the estimate of markdown allowances, we performed audit procedures that included, among others, assessing methodologies and testing the assumptions regarding periodic negotiations with each customer which include the application of market and economic conditions to individual customers and the expected performance of the products in the customers' stores that were used by the Company to calculate the projected markdown allowances to be issued upon settlement. We compared the significant assumptions used by management to current market and economic trends, historical results and other relevant factors. We also examined the historical accuracy of management's estimates and performed sensitivity analyses of significant assumptions to substantively test the changes in the estimate that would result from reasonable changes in the assumptions. | |||||||
/s/ EisnerAmperErnst & Young LLP
We have served as the Company’sCompany's auditor since 1995.2020.
March 2, 202016, 2021
F-3
Report of Independent Registered Public Accounting Firm
To the Stockholders and the Board of Directors and Stockholders
of Steven Madden, LtdLtd.
Opinion on Internal Control overOver Financial Reporting
We have audited Steven Madden, Ltd. and Subsidiaries’ (the “Company")subsidiaries’ internal control over financial reporting as of December 31, 2019,2020, based on criteria established in the Internal Control - Control—Integrated Framework (2013) issued by the Committee of Sponsoring Organizations of the Treadway Commission (“COSO”)(2013 framework) (the COSO criteria). In our opinion, the CompanySteven Madden, Ltd. and subsidiaries (the Company) maintained, in all material respects, effective internal control over financial reporting as of December 31, 2019,2020, based on criteria established in the Internal Control - Integrated Framework (2013) issued by COSO.COSO criteria.
We also have audited, in accordance with the standards of the Public Company Accounting Oversight Board (United States) ("PCAOB")(PCAOB), the consolidated balance sheetssheet of Steven Madden, Ltd. and Subsidiariesthe Company as of December 31, 2019 and 2018, and2020, the related consolidated statements of income, comprehensive income, changes in stockholders’stockholders' equity and cash flows for each of the years in the three-year periodyear ended December 31, 2019,2020, and the related notes and our report dated March 2, 202016, 2021 expressed an unqualified opinion.opinion thereon.
Basis for Opinion
The Company’s management is responsible for maintaining effective internal control over financial reporting and for its assessment of the effectiveness of internal control over financial reporting included in the accompanying Management’sManagement's Annual Report on Internal Control overOver Financial Reporting. Our responsibility is to express an opinion on the Company’s internal control over financial reporting based on our audit. We are a public accounting firm registered with the PCAOB and are required to be independent with respect to the Company in accordance with the U.S. federal securities laws and the applicable rules and regulations of the Securities and Exchange Commission and the PCAOB.
We conducted our audit in accordance with the standards of the PCAOB. Those standards require that we plan and perform the audit to obtain reasonable assurance about whether effective internal control over financial reporting was maintained in all material respects.
Our audit of internal control over financial reporting included obtaining an understanding of internal control over financial reporting, assessing the risk that a material weakness exists, and testing and evaluating the design and operating effectiveness of internal control based on the assessed risk. Our audit also includedrisk, and performing such other procedures as we considered necessary in the circumstances. We believe that our audit provides a reasonable basis for our opinion.
Definition and Limitations of Internal Control overOver Financial Reporting
Because of its inherent limitations, internal control over financial reporting may not prevent or detect misstatements. Also, projections of any evaluation of effectiveness to future periods are subject to the risk that controls may become inadequate because of changes in conditions, or that the degree of compliance with the policies or procedures may deteriorate.
/s/ Ernst & Young LLP
New York, New York
March 16, 2021
F-4
REPORT OF INDEPENDENT REGISTERED PUBLIC ACCOUNTING FIRM
To the Board of Directors and Stockholders of
Steven Madden Ltd.
Opinion on the Financial Statements
We have audited the accompanying consolidated balance sheet of Steven Madden Ltd. and Subsidiaries (the “Company”) as of December 31, 2019, and the related consolidated statements of income, comprehensive income, changes to stockholders’ equity, and cash flows for each of the years in the two-year period ended December 31, 2019, and the related notes (collectively referred to as the “financial statements”). In our opinion, the financial statements present fairly, in all material respects, the consolidated financial position of the Company as of December 31, 2019, and the consolidated results of their operations and their cash flows for each of the years in the two-year period ended December 31, 2019, in conformity with accounting principles generally accepted in the United States of America.
Adoption of New Accounting Standard
As discussed in Note N to the consolidated financial statements, the Company changed its method for accounting for leases in 2019.
Basis for Opinion
These financial statements are the responsibility of the Company’s management. Our responsibility is to express an opinion on the Company’s financial statements based on our audits. We are a public accounting firm registered with the Public Company Accounting Oversight Board (United States) (“PCAOB”) and are required to be independent with respect to the Company in accordance with the U.S. federal securities laws and the applicable rules and regulations of the Securities and Exchange Commission and the PCAOB.
We conducted our audits in accordance with the standards of the PCAOB. Those standards require that we plan and perform the audit to obtain reasonable assurance about whether the financial statements are free of material misstatement, whether due to error or fraud.
Our audits included performing procedures to assess the risks of material misstatement of the financial statements, whether due to error or fraud, and performing procedures that respond to those risks. Such procedures included examining, on a test basis, evidence regarding the amounts and disclosures in the financial statements. Our audits also included evaluating the accounting principles used and significant estimates made by management, as well as evaluating the overall presentation of the financial statements. We believe that our audits provide a reasonable basis for our opinion.
/s/ EisnerAmper LLP
Iselin, New Jersey
March 2, 2020
F-5
STEVEN MADDEN, LTD. AND SUBSIDIARIES
Consolidated Balance Sheets
(in thousands)
| December 31, | December 31, | |||||||||||||||||||||
| 2019 | 2018 | 2020 | 2019 | |||||||||||||||||||
| ASSETS | ASSETS | |||||||||||||||||||||
| Current assets: | Current assets: | |||||||||||||||||||||
| Cash and cash equivalents | $ | 264,101 | $ | 200,031 | Cash and cash equivalents | $ | 247,864 | $ | 264,101 | |||||||||||||
| Accounts receivable, net of allowances of $11,066 and $10,849 | 38,166 | 25,057 | ||||||||||||||||||||
| Short-term investments | Short-term investments | 39,302 | 40,521 | |||||||||||||||||||
| Accounts receivable, net of allowances of $8,943 and $11,066 | Accounts receivable, net of allowances of $8,943 and $11,066 | 25,044 | 38,166 | |||||||||||||||||||
| Factor accounts receivable | 216,471 | 241,395 | Factor accounts receivable | 252,671 | 216,471 | |||||||||||||||||
| Inventories | 136,896 | 137,247 | Inventories | 101,420 | 136,896 | |||||||||||||||||
| Marketable securities – available for sale | 40,521 | 66,968 | ||||||||||||||||||||
| Prepaid expenses and other current assets | 22,066 | 23,425 | Prepaid expenses and other current assets | 17,415 | 22,066 | |||||||||||||||||
| Prepaid taxes | 658 | 9,002 | ||||||||||||||||||||
| Income tax receivable and prepaid income taxes | Income tax receivable and prepaid income taxes | 14,525 | 658 | |||||||||||||||||||
| Total current assets | 718,879 | 703,125 | Total current assets | 698,241 | 718,879 | |||||||||||||||||
| Note receivable – related party | 1,558 | 1,927 | Note receivable – related party | 1,180 | 1,558 | |||||||||||||||||
| Property and equipment, net | 65,504 | 64,807 | Property and equipment, net | 43,268 | 65,504 | |||||||||||||||||
| Operating lease right-of-use asset | 155,700 | — | Operating lease right-of-use asset | 101,379 | 155,700 | |||||||||||||||||
| Deferred taxes | — | 9,321 | ||||||||||||||||||||
| Deferred tax assets | Deferred tax assets | 5,415 | 0 | |||||||||||||||||||
| Deposits and other | 2,948 | 1,967 | Deposits and other | 4,822 | 2,948 | |||||||||||||||||
| Goodwill – net | 171,349 | 148,112 | Goodwill – net | 168,265 | 171,349 | |||||||||||||||||
| Intangibles – net | 162,709 | 143,311 | Intangibles – net | 115,191 | 162,709 | |||||||||||||||||
| Total Assets | $ | 1,278,647 | $ | 1,072,570 | Total Assets | $ | 1,137,761 | $ | 1,278,647 | |||||||||||||
| LIABILITIES | LIABILITIES | |||||||||||||||||||||
| Current liabilities: | Current liabilities: | |||||||||||||||||||||
| Accounts payable | $ | 61,706 | $ | 79,802 | Accounts payable | $ | 73,904 | $ | 61,706 | |||||||||||||
| Accrued expenses | 169,895 | 130,592 | Accrued expenses | 118,083 | 169,895 | |||||||||||||||||
| Operating leases - current portion | 38,624 | — | Operating leases - current portion | 34,257 | 38,624 | |||||||||||||||||
| Contingent payment liability – current portion | — | 3,000 | ||||||||||||||||||||
| Income taxes payable | Income taxes payable | 5,799 | 0 | |||||||||||||||||||
| Accrued incentive compensation | 11,046 | 11,295 | Accrued incentive compensation | 3,873 | 11,046 | |||||||||||||||||
| Total current liabilities | 281,271 | 224,689 | Total current liabilities | 235,916 | 281,271 | |||||||||||||||||
| Contingent payment liability | 9,124 | — | Contingent payment liability | 207 | 9,124 | |||||||||||||||||
| Deferred rent | — | 15,786 | ||||||||||||||||||||
| Operating leases - long-term portion | 133,172 | — | Operating leases - long-term portion | 98,592 | 133,172 | |||||||||||||||||
| Deferred taxes | 5,877 | 4,041 | ||||||||||||||||||||
| Deferred tax liabilities | Deferred tax liabilities | 2,562 | 5,877 | |||||||||||||||||||
| Other liabilities | 7,979 | 13,372 | Other liabilities | 10,115 | 7,979 | |||||||||||||||||
| Total Liabilities | 437,423 | 257,888 | Total Liabilities | 347,392 | 437,423 | |||||||||||||||||
| Commitments, contingencies and other (Note P) | Commitments, contingencies and other (Note P) | 0 | 0 | |||||||||||||||||||
| STOCKHOLDERS’ EQUITY | STOCKHOLDERS’ EQUITY | |||||||||||||||||||||
| Preferred stock – $.0001 par value, 5,000 shares authorized; none issued; Series A Junior Participating preferred stock – $.0001 par value, 60 shares authorized; none issued | — | — | ||||||||||||||||||||
| Common stock – $.0001 par value, 245,000 shares authorized, 132,754 and 131,991 shares issued, 83,520 and 85,715 shares outstanding | 6 | 6 | ||||||||||||||||||||
| Preferred stock – $0.0001 par value, 5,000 shares authorized; none issued; Series A Junior Participating preferred stock – $0.0001 par value, 60 shares authorized; none issued | Preferred stock – $0.0001 par value, 5,000 shares authorized; none issued; Series A Junior Participating preferred stock – $0.0001 par value, 60 shares authorized; none issued | 0 | 0 | |||||||||||||||||||
| Common stock – $0.0001 par value, 245,000 shares authorized, 133,247 and 132,754 shares issued, 82,616 and 83,520 shares outstanding | Common stock – $0.0001 par value, 245,000 shares authorized, 133,247 and 132,754 shares issued, 82,616 and 83,520 shares outstanding | 8 | 6 | |||||||||||||||||||
| Additional paid-in capital | 454,217 | 424,835 | Additional paid-in capital | 478,463 | 454,217 | |||||||||||||||||
| Retained earnings | 1,310,406 | 1,217,521 | Retained earnings | 1,279,550 | 1,310,406 | |||||||||||||||||
| Accumulated other comprehensive loss | (30,440 | ) | (32,628 | ) | Accumulated other comprehensive loss | (29,164) | (30,440) | |||||||||||||||
| Treasury stock – 49,234 and 46,276 shares at cost | (905,688 | ) | (803,920 | ) | ||||||||||||||||||
| Treasury stock – 50,631 and 49,234 shares at cost | Treasury stock – 50,631 and 49,234 shares at cost | (952,271) | (905,688) | |||||||||||||||||||
| Total Steven Madden, Ltd. stockholders’ equity | 828,501 | 805,814 | Total Steven Madden, Ltd. stockholders’ equity | 776,586 | 828,501 | |||||||||||||||||
| Noncontrolling interest | 12,723 | 8,868 | Noncontrolling interest | 13,783 | 12,723 | |||||||||||||||||
| Total stockholders’ equity | 841,224 | 814,682 | Total stockholders’ equity | 790,369 | 841,224 | |||||||||||||||||
| Total Liabilities and Stockholders’ Equity | $ | 1,278,647 | $ | 1,072,570 | Total Liabilities and Stockholders’ Equity | $ | 1,137,761 | $ | 1,278,647 | |||||||||||||
See accompanying notes to consolidated financial statements
STEVEN MADDEN, LTD. AND SUBSIDIARIES
Consolidated Statements of (Loss)/Income
(in thousands, except per share data)
| Years Ended December 31, | Years Ended December 31, | |||||||||||||||||||||||||||||||
| 2019 | 2018 | 2017 | 2020 | 2019 | 2018 | |||||||||||||||||||||||||||
| Net sales | $ | 1,768,135 | $ | 1,653,609 | $ | 1,546,098 | Net sales | $ | 1,188,943 | $ | 1,768,135 | $ | 1,653,609 | |||||||||||||||||||
| Commission and licensing fee income | 19,022 | 24,125 | 20,985 | Commission and licensing fee income | 12,871 | 19,022 | 24,125 | |||||||||||||||||||||||||
| Total revenue | 1,787,157 | 1,677,734 | 1,567,083 | Total revenue | 1,201,814 | 1,787,157 | 1,677,734 | |||||||||||||||||||||||||
| Cost of sales | 1,101,140 | 1,037,571 | 968,357 | |||||||||||||||||||||||||||||
| Cost of sales (exclusive of depreciation and amortization) | Cost of sales (exclusive of depreciation and amortization) | 737,273 | 1,101,140 | 1,037,571 | ||||||||||||||||||||||||||||
| Gross profit | 686,017 | 640,163 | 598,726 | Gross profit | 464,541 | 686,017 | 640,163 | |||||||||||||||||||||||||
| Operating expenses | 505,153 | 466,781 | 427,942 | Operating expenses | 414,978 | 503,270 | 466,781 | |||||||||||||||||||||||||
| Impairment charges | 4,050 | — | 1,000 | |||||||||||||||||||||||||||||
| Income from operations | 176,814 | 173,382 | 169,784 | |||||||||||||||||||||||||||||
| Impairment of intangibles | Impairment of intangibles | 44,273 | 4,050 | 0 | ||||||||||||||||||||||||||||
| Impairment of lease right-of-use assets and store fixed assets | Impairment of lease right-of-use assets and store fixed assets | 36,895 | 1,883 | — | ||||||||||||||||||||||||||||
| (Loss)/income from operations | (Loss)/income from operations | (31,605) | 176,814 | 173,382 | ||||||||||||||||||||||||||||
| Interest and other income - net | 4,412 | 3,958 | 2,543 | Interest and other income - net | 1,620 | 4,412 | 3,958 | |||||||||||||||||||||||||
| Income before provision for income taxes | 181,226 | 177,340 | 172,327 | |||||||||||||||||||||||||||||
| Provision for income taxes (Note O) | 39,504 | 46,841 | 53,189 | |||||||||||||||||||||||||||||
| Net income | 141,722 | 130,499 | 119,138 | |||||||||||||||||||||||||||||
| (Loss)/income before provision for income taxes | (Loss)/income before provision for income taxes | (29,985) | 181,226 | 177,340 | ||||||||||||||||||||||||||||
| (Benefit)/provision for income taxes (Note O) | (Benefit)/provision for income taxes (Note O) | (11,704) | 39,504 | 46,841 | ||||||||||||||||||||||||||||
| Net (loss)/income | Net (loss)/income | (18,281) | 141,722 | 130,499 | ||||||||||||||||||||||||||||
| Less: net income attributable to noncontrolling interest | 411 | 1,363 | 1,190 | Less: net income attributable to noncontrolling interest | 116 | 411 | 1,363 | |||||||||||||||||||||||||
| Net income attributable to Steven Madden, Ltd. | $ | 141,311 | $ | 129,136 | $ | 117,948 | ||||||||||||||||||||||||||
| Net (loss)/income attributable to Steven Madden, Ltd. | Net (loss)/income attributable to Steven Madden, Ltd. | $ | (18,397) | $ | 141,311 | $ | 129,136 | |||||||||||||||||||||||||
| Basic net income per share | $ | 1.78 | $ | 1.58 | $ | 1.43 | ||||||||||||||||||||||||||
| Basic net (loss)/income per share | Basic net (loss)/income per share | $ | (0.23) | $ | 1.78 | $ | 1.58 | |||||||||||||||||||||||||
| Diluted net income per share | $ | 1.69 | $ | 1.50 | $ | 1.36 | ||||||||||||||||||||||||||
| Diluted net (loss)/income per share | Diluted net (loss)/income per share | $ | (0.23) | $ | 1.69 | $ | 1.50 | |||||||||||||||||||||||||
| Basic weighted average common shares outstanding | 79,577 | 81,664 | 82,736 | Basic weighted average common shares outstanding | 78,635 | 79,577 | 81,664 | |||||||||||||||||||||||||
| Effect of dilutive securities – options/restricted stock | 4,069 | 4,433 | 4,009 | Effect of dilutive securities – options/restricted stock | 0 | 4,069 | 4,433 | |||||||||||||||||||||||||
| Diluted weighted average common shares outstanding | 83,646 | 86,097 | 86,745 | Diluted weighted average common shares outstanding | 78,635 | 83,646 | 86,097 | |||||||||||||||||||||||||
| Cash dividends declared per common share | $ | 0.57 | $ | 0.53 | $ | — | Cash dividends declared per common share | $ | 0.15 | $ | 0.57 | $ | 0.53 | |||||||||||||||||||
See accompanying notes to consolidated financial statements
STEVEN MADDEN, LTD. AND SUBSIDIARIES
Consolidated Statements of Comprehensive (Loss)/Income
(in thousands)
| 2020 | ||||||||||||||||||||
| Pre-tax amounts | Tax benefit | After-tax amounts | ||||||||||||||||||
| Net (loss) | $ | (18,281) | ||||||||||||||||||
| Other comprehensive income: | ||||||||||||||||||||
| Foreign currency translation adjustment | $ | 2,551 | $ | 0 | 2,551 | |||||||||||||||
| (Loss) on cash flow hedging derivatives | (526) | 134 | (392) | |||||||||||||||||
| Total other comprehensive income | $ | 2,025 | $ | 134 | 2,159 | |||||||||||||||
| Comprehensive (loss) | (16,122) | |||||||||||||||||||
| Less: comprehensive income attributable to noncontrolling interests | 999 | |||||||||||||||||||
| Comprehensive (loss) attributable to Steven Madden, Ltd. | $ | (17,121) | ||||||||||||||||||
| 2019 | ||||||||||||||||||||
| Pre-tax amounts | Tax benefit/(expense) | After-tax amounts | ||||||||||||||||||
| Net income | $ | 141,722 | ||||||||||||||||||
| Other comprehensive income: | ||||||||||||||||||||
| Foreign currency translation adjustment | $ | 2,885 | $ | 0 | 2,885 | |||||||||||||||
| (Loss) on cash flow hedging derivatives | (1,387) | 333 | (1,054) | |||||||||||||||||
| Unrealized gain on marketable securities | 116 | (28) | 88 | |||||||||||||||||
| Total other comprehensive income | $ | 1,614 | $ | 305 | 1,919 | |||||||||||||||
| Comprehensive income | 143,641 | |||||||||||||||||||
| Less: comprehensive income attributable to noncontrolling interests | 142 | |||||||||||||||||||
| Comprehensive income attributable to Steven Madden, Ltd. | $ | 143,499 | ||||||||||||||||||
| 2018 | ||||||||||||||||||||
| Pre-tax amounts | Tax (expense) | After-tax amounts | ||||||||||||||||||
| Net income | $ | 130,499 | ||||||||||||||||||
| Other comprehensive (loss): | ||||||||||||||||||||
| Foreign currency translation adjustment | $ | (7,983) | $ | 0 | (7,983) | |||||||||||||||
| Gain on cash flow hedging derivatives | 1,150 | (276) | 874 | |||||||||||||||||
| Unrealized gain on marketable securities | 124 | (30) | 94 | |||||||||||||||||
| Total other comprehensive (loss) | $ | (6,709) | $ | (306) | (7,015) | |||||||||||||||
| Comprehensive income | 123,484 | |||||||||||||||||||
| Less: comprehensive income attributable to noncontrolling interests | 1,363 | |||||||||||||||||||
| Comprehensive income attributable to Steven Madden, Ltd. | $ | 122,121 | ||||||||||||||||||
| 2019 | ||||||||||||
| Pre-tax amounts | Tax benefit/(expense) | After-tax amounts | ||||||||||
| Net income | $ | 141,722 | ||||||||||
| Other comprehensive income: | ||||||||||||
| Foreign currency translation adjustment | $ | 2,885 | $ | — | 2,885 | |||||||
| (Loss) on cash flow hedging derivatives | (1,387 | ) | 333 | (1,054 | ) | |||||||
| Unrealized gain on marketable securities | 116 | (28 | ) | 88 | ||||||||
| Total other comprehensive income | $ | 1,614 | $ | 305 | 1,919 | |||||||
| Comprehensive income | 143,641 | |||||||||||
| Less: comprehensive income attributable to noncontrolling interests | 142 | |||||||||||
| Comprehensive income attributable to Steven Madden, Ltd. | $ | 143,499 | ||||||||||
| 2018 | ||||||||||||
| Pre-tax amounts | Tax (expense) | After-tax amounts | ||||||||||
| Net income | $ | 130,499 | ||||||||||
| Other comprehensive (loss): | ||||||||||||
| Foreign currency translation adjustment | $ | (7,983 | ) | $ | — | (7,983 | ) | |||||
| Gain on cash flow hedging derivatives | 1,150 | (276 | ) | 874 | ||||||||
| Unrealized gain on marketable securities | 124 | (30 | ) | 94 | ||||||||
| Total other comprehensive (loss) | $ | (6,709 | ) | $ | (306 | ) | (7,015 | ) | ||||
| Comprehensive income | 123,484 | |||||||||||
| Less: comprehensive income attributable to noncontrolling interests | 1,363 | |||||||||||
| Comprehensive income attributable to Steven Madden, Ltd. | $ | 122,121 | ||||||||||
| 2017 | ||||||||||||
| Pre-tax amounts | Tax benefit/(expense) | After-tax amounts | ||||||||||
| Net income | $ | 119,138 | ||||||||||
| Other comprehensive income: | ||||||||||||
| Foreign currency translation adjustment | $ | 6,836 | $ | — | 6,836 | |||||||
| (Loss) on cash flow hedging derivatives | (1,282 | ) | 468 | (814 | ) | |||||||
| Unrealized gain on marketable securities | 183 | (67 | ) | 116 | ||||||||
| Total other comprehensive income | $ | 5,737 | $ | 401 | 6,138 | |||||||
| Comprehensive income | 125,276 | |||||||||||
| Less: comprehensive income attributable to noncontrolling interests | 1,190 | |||||||||||
| Comprehensive income attributable to Steven Madden, Ltd. | $ | 124,086 | ||||||||||
See accompanying notes to consolidated financial statements