0001043219srt:RetailSiteMembersrt:MinimumMemberstpr:COnly:RealEstateDebtInvestmentsMember2020-01-012020-12-31
| | |
UNITED STATES SECURITIES AND EXCHANGE COMMISSION WASHINGTON, D.C. 20549
|
FORM 10-K
☒ ANNUAL REPORT PURSUANT TO SECTION 13 OR 15(d) OF THE SECURITIES EXCHANGE ACT OF 1934
FOR THE FISCAL YEAR ENDED: December 31, 20202023
OR
☐ TRANSITION REPORT PURSUANT TO SECTION 13 OR 15(d) OF THE SECURITIES EXCHANGE ACT OF 1934
FOR THE TRANSITION PERIOD FROM _______________ TO _________________
COMMISSION FILE NUMBER: 1-13447
ANNALY CAPITAL MANAGEMENT INC
(Exact Name of Registrant as Specified in its Charter)
| | | | | | | | |
| Maryland | 22-3479661 |
| (State or other jurisdiction of incorporation or organization) | (IRS Employer Identification No.) |
| | | |
| 1211 Avenue of the Americas | |
| New York, | New York | 10036 |
| (Address of principal executive offices) | (Zip Code) |
(212) 696-0100
(Registrant’s telephone number, including area code)
Securities registered pursuant to Section 12(b) of the Act:
| | | | | | | | |
| Title of Each Class | Trading Symbol(s) | Name of Each Exchange on Which Registered |
| | | |
| Common Stock, par value $0.01 per share | NLY | New York Stock Exchange |
| | |
| | |
| | |
| | |
| 6.95% Series F Fixed-to-Floating Rate Cumulative Redeemable Preferred Stock | NLY.F | New York Stock Exchange |
| 6.50% Series G Fixed-to-Floating Rate Cumulative Redeemable Preferred Stock | NLY.G | New York Stock Exchange |
| 6.75% Series I Fixed-to-Floating Rate Cumulative Redeemable Preferred Stock | NLY.I | New York Stock Exchange |
Securities registered pursuant to Section 12(g) of the Act: None
Indicate by check mark whether the registrant is a well-known seasoned issuer, as defined in Rule 405 of the Securities Act.
Yes ☑ No ☐
Indicate by check mark if the registrant is not required to file reports pursuant to Section 13 or Section 15(d) of the Act.
Yes ☐ No ☑
Indicate by check mark whether the registrant (1) has filed all reports required to be filed by Section 13 or 15(d) of the Securities Exchange Act of 1934 during the preceding 12 months (or for such shorter period that the registrant was required to file such reports), and (2) has been subject to such filing requirements for the past 90 days. Yes ☑ No ☐
Indicate by check mark whether the registrant has submitted electronically every Interactive Data File required to be submitted pursuant to Rule 405 of Regulation S-T (§ 232.405 of this chapter) during the preceding 12 months (or for such shorter period that the registrant was required to submit such files). Yes ☑ No ☐
Indicate by check mark whether the registrant is a large accelerated filer, an accelerated filer, a non-accelerated filer, a smaller reporting company, or an emerging growth company. See the definitions of “large accelerated filer,” “accelerated filer,” “smaller reporting company,” and “emerging growth company” in Rule 12b-2 of the Exchange Act.
| | | | | | | | | | | | | | | | | | | | | | | | | | | | | | | | | | | | | | | | | |
| Large accelerated filer | ☑ | | Accelerated filer | ☐ | | Non-accelerated filer | ☐ | | Smaller reporting company | ☐ | | Emerging growth company | ☐ |
| | | | | | | | | | | | | |
If an emerging growth company, indicate by check mark if the registrant has elected not to use the extended transition period for complying with any new or revised financial accounting standards provided pursuant to Section 13(a) of the Exchange Act. ☐
Indicate by check mark whether the registrant has filed a report on and attestation to its management’s assessment of the effectiveness of its internal control over financial reporting under Section 404(b) of the Sarbanes-Oxley Act (15 U.S.C. 7262(b)) by the registered public accounting firm that prepared or issued its audit report. ☑
If an emerging growth company,securities are registered pursuant to Section 12(b) of the Act, indicate by check mark ifwhether the financial statements of the registrant has elected notincluded in the filing reflect the correction of an error to usepreviously issued financial statements. ☐
Indicate by check mark whether any of those error corrections are restatements that required a recovery analysis of incentive-based compensation received by any of the extended transitionregistrant’s executive officers during the relevant recovery period for complying with any new or revised financial accounting standards provided pursuant to Section 13(a) of the Exchange Act.§240.10D-1(b). ☐
Indicate by check mark whether the registrant is a shell company (as defined in Rule 12b-2 of the Act). Yes ☐ No ☑
At June 30, 2020,2023, the aggregate market value of the voting common stock held by non-affiliates of the registrant was approximately $9.2$9.8 billion, based on the closing sales price of the registrant’s common stock on such date as reported on the New York Stock Exchange.
The number of shares of the registrant’s Common Stockcommon stock outstanding on February 2, 2021January 31, 2024 was 1,398,502,906.500,080,287.
DOCUMENTS INCORPORATED BY REFERENCE
The registrant intends to file a definitive proxy statement pursuant to Regulation 14A within 120 days of the end of the fiscal year ended December 31, 2020.2023. Portions of such proxy statement are incorporated by reference into Part III of this Form 10-K.
| | | | | | | | |
| ANNALY CAPITAL MANAGEMENT, INC.
2020 2023 FORM 10-K ANNUAL REPORT
TABLE OF CONTENTS | |
| | Page |
| | |
| | |
| | |
| | |
| | |
| | |
| | |
| | |
| | |
| | |
| | |
| | |
| | |
| | |
| | |
| | |
| | |
| | |
| | |
| | |
| | |
| | |
| | |
| | |
| | |
| | |
| | |
| |
| | |
Special Note Regarding Forward-Looking Statements
This presentation, other written or oral communications, and our public documents to which we refer contain or incorporate by reference certain forward-looking statements which are based on various assumptions (some of which are beyond our control) and may be identified by reference to a future period or periods or by the use of forward-looking terminology, such as “may,” “will,” “believe,” “expect,” “anticipate,” “continue,” or similar terms or variations on those terms or the negative of those terms. Such statements include those relating to the Company’s future performance, macro outlook, the interest rate and credit environments, tax reform and future opportunities. Actual results could differ materially from those set forth in forward-looking statements due to a variety of factors, including, but not limited to, changes in interest rates; changes in the yield curve; changes in prepayment rates; the availability of mortgage-backed securities (“MBS”) and other securities for purchase; the availability of financing and, if available, the terms of any financing; changes in the market value of the Company’s assets; changes in business conditions and the general economy; the Company’s ability to grow its residential credit business; the Company's ability to grow its mortgage servicing rights business; credit risks related to the Company’s investments in credit risk transfer securities and residential mortgage-backed securities and related residential mortgage credit assets; risks related to investments in mortgage servicing rights; the Company’s ability to consummate any contemplated investment opportunities; changes in government regulations or policy affecting the Company’s business; the Company’s ability to maintain its qualification as a REIT for U.S. federal income tax purposes; the Company’s ability to maintain its exemption from registration under the Investment Company Act of 1940; and operational risks or risk management failures by us or critical third parties, including cybersecurity incidents. For a discussion of the risks and uncertainties which could cause actual results to differ from those contained in the forward-looking statements, see “Risk Factors” in our most recent Annual Report on Form 10-K and any subsequent Quarterly Reports on Form 10-Q. The Company does not undertake, and specifically disclaims any obligation, to publicly release the result of any revisions which may be made to any forward-looking statements to reflect the occurrence of anticipated or unanticipated events or circumstances after the date of such statements, except as required by law.
Website and Social Media Disclosure
We use our website (www.annaly.com) and LinkedIn account (www.linkedin.com/company/annaly-capital-management) as channels of distribution of company information. The information we post through these channels may be deemed material. Accordingly, investors should monitor these channels, in addition to following our press releases, SEC filings and public conference calls and webcasts. In addition, you may automatically receive email alerts and other information about Annaly when you enroll your email address by visiting the “Investors” section of our website, then clicking on “Investor Resources” and selecting “Email Alerts” to complete the email notification form. Our website, any alerts and social media channels are not incorporated into this annual report on Form 10-K.
ANNALY CAPITAL MANAGEMENT, INC. AND SUBSIDIARIES
ITEM 1. BUSINESS
PART I
“Annaly,” “we,” “us,” or “our” refers to Annaly Capital Management, Inc. and our wholly-owned subsidiaries, except where it is made clear that the term means only the parent company.
Refer to the section titled “Glossary of Terms” located at the end of Part II, Item 7. “Management’s Discussion and Analysis of Financial Condition and Results of Operations.” for definitions of certain of the commonly used terms in this annual report on Form 10-K.
The following description of our business should be read in conjunction with the Consolidated Financial Statements and the related Notes thereto, and the information set forth under the heading “Special Note Regarding Forward-Looking Statements” in Item 7. “Management’s Discussion and Analysis of Financial Condition and Results of Operations.”
INDEX TO ITEM 1. BUSINESS
| | | | | |
| | Page |
| |
| |
| |
| |
| |
| |
| |
| |
| |
| |
| |
| |
Closing of the Internalization and Termination of the Management Agreement | |
| Information about our Executive Officers | |
| |
| |
| |
| |
| |
| |
ANNALY CAPITAL MANAGEMENT, INC. AND SUBSIDIARIES
ITEM 1. BUSINESS
Business Overview
Introduction
We are a leading diversified capital manager that invests in and finances residential and commercial assets.with investment strategies across mortgage finance. Our principal business objective is to generate net income for distribution to our stockholders and optimize our returns through prudent management of our diversified investment strategies. We are an internally-managed Maryland corporation founded in 1997 that has elected to be taxed as a real estate investment trust (“REIT”). Prior to the closing of the Internalization (as defined below under “Closing of the Internalization and Termination of the Management Agreement”) on June 30, 2020, we were externally managed by Annaly Management Company LLC (our “Former Manager”). Our common stock is listed on the New York Stock Exchange under the symbol “NLY.”
We use our capital coupled with borrowed funds to invest primarily in real estate related investments, earning the spread between the yield on our assets and the cost of our borrowings and hedging activities.
We believe that our business objectives are supported by our size and conservative financial posture relative to the industry, the extensive experience of our employees, the diversity of our investment strategy, a comprehensive risk management approach, the availability and diversification of financing sources and our operational efficiencies.
Investment Groups
Our fourthree investment groups are primarily comprised of the following:
| | | | | |
| Investment Groups | Description |
| Annaly Agency Group | Invests in Agency mortgage-backed securities (“MBS”) collateralized by residential mortgages which are guaranteed by Fannie Mae, Freddie Mac or Ginnie Mae.Mae and complementary investments within the Agency market, including Agency commercial MBS. |
| Annaly Residential Credit Group | Invests primarily in non-Agency residential mortgage assetswhole loans and securitized products within securitized productthe residential and whole loancommercial markets. |
Annaly Commercial Real EstateMortgage Servicing Rights Group | Originates and investsInvests in commercialmortgage servicing rights ("MSR"), which provide the right to service residential mortgage loans securities, and other commercial real estate debt and equity investments.in exchange for a portion of the interest payments made on the loans. |
| Annaly Middle Market Lending Group | Provides financing to private equity-backed middle market businesses, focusing primarily on senior debt within select industries.
In April 2022, we entered into a definitive agreement to sell substantially all of the assets that comprise our Middle Market Lending (“MML”) portfolio, including assets held on balance sheet as well as assets managed for third parties. During the year ended December 31, 2022, the assets comprising the MML portfolio were legally transferred. For additional information about this transaction, see the Note titled “Sale of Middle Market Lending Portfolio” in the Notes to the Consolidated Financial Statements included in Item 15. “Exhibits, Financial Statement Schedules.”
In March 2021, we entered into a definitive agreement to sell and exit our Commercial Real Estate (“CRE”) business with the platform and the significant majority of the assets transferred during the year ended December 31, 2021. During the year ended December 31, 2022, the remaining CRE assets and associated liabilities were transferred. For additional information about this transaction, see the Note titled “Sale of Commercial Real Estate Business” in the Notes to the Consolidated Financial Statements included in Item 15. “Exhibits, Financial Statement Schedules.”
Operating Platform
Our operating platform reflects our investments in systems, infrastructure and personnel. Our technology investments have led to the development of proprietary portfolio analytics, financial and capital allocation modeling, portfolio cash and accounting sub-ledger systems, and other risk and reporting tools, which, coupled with cutting-edge digital transformation applications, support the diversification and operating efficiency of our business.business and our ability to implement new investment strategies. Our operating platform supports our investments in Agency assets as well as residential credit assets, commercial real estate assets, residential mortgage loans, and mortgage servicing rights and corporate loans.rights. We believe that the diversity of our investment alternatives provides us the flexibility to adapt to changes in market conditions and to take advantage of potential opportunities.
Business and Investment Strategy
Shared Capital Model
Our company is comprised of fourthree investment groups, each of which has multiple investment options to capitalize on attractive relative returns and market opportunities. In aggregate, we maintain numerous investment options across our investment groups. Our shared capital model drives our capital allocation strategy allowing us to rotate our investments based on relative value while also managing risk.
Strategic Relationships
A key element of our strategy is to establish and grow strategic relationships with industry leading partners in order to develop and broaden access to quality originations flow as well as to leverage third party operations to efficiently manage operating
ANNALY CAPITAL MANAGEMENT, INC. AND SUBSIDIARIES
ITEM 1. BUSINESS
costs, all in an effort to generate attractive risk adjustedrisk-adjusted returns for our shareholders. Additionally, we have attracted capital partners to our business, augmenting our public capital markets efforts, which has resulted in increased scale without sacrificing balance sheet liquidity. Certain of our strategic relationships also afford us the opportunity to support communities through socially responsible investing.
We have created multiple strategic and capital partnerships across our investment groups including the following:
ANNALY CAPITAL MANAGEMENT, INC. AND SUBSIDIARIES
ITEM 1. BUSINESS
–Annaly Residential Credit Group has established relationships with key mortgage loan originators and aggregators including well-known money center banks, allowing us to efficiently source proprietary originations suited to our risk parameters.
–Annaly Commercial Real Estate Group maintains a partnership with Pearlmark Real Estate Partners, a leading real estate private equity sponsor, providing access to co-investment opportunities through their seasoned commercial real estate investment team.
–We have partnered with Pingora Loan Servicing, a premier mortgage servicer for MSR assets and a wholly-owned subsidiary of Bayview Asset Management, through our joint venture with GIC Private Limited (“GIC”), a leading Sovereign Wealth Fund.
–We have also partnered with GICsovereign wealth fund, through the creation of a joint venture with the purpose of investing in residential credit assets, including newly-originated residential loans and securities issued by our subsidiaries.
–We have partnered with Capital Impact Partners, a national community development financial institution, to create a social impact joint venture supporting projects in underserved communities across the country.
–We have partnered with Fifth Wall Ventures, the largest venture capital firm focused on technology for the real estate industry, through a commitment to invest in their funds that target investments in North American early- and late-stage real estate software and marketplace companies. The partnership aims to identify innovative platforms and services that provide efficiencies across our core investment strategies.
Our Portfolio and Capital Allocation Policy
Under our capital allocation policy and subject to oversight by our Board of Directors (“Board”), we may allocate our investments within our target asset classes as we determine to be appropriate from time to time.
Our Board may adopt changes to our capital allocation policy and targeted assets at its discretion.
The nature of our assets and our operations are intended to meet our REIT qualification requirements and our exemption from registration as an investment company under the Investment Company Act of 1940, as amended (“Investment Company Act”).
Our portfolio composition and capital allocation at December 31, 20202023 and 20192022 were as follows:
| | | | | | | | | | | | | | | | | | | | | | | |
| | December 31, 2020 | | December 31, 2019 |
| Investment Group | Percentage of Portfolio | | Capital Allocation (1) | | Percentage of Portfolio | | Capital Allocation (1) |
| Residential | | | | | | | |
Annaly Agency Group (2)(3) | 93% | | 78% | | 93% | | 74% |
Annaly Residential Credit Group (3) | 3% | | 7% | | 3% | | 10% |
| Commercial | | | | | | | |
Annaly Commercial Real Estate Group (3) | 2% | | 5% | | 2% | | 7% |
| Annaly Middle Market Lending Group | 2% | | 10% | | 2% | | 9% |
(1)Capital allocation represents the percentage of equity allocated to each category.
(2)Includes MSRs and TBA purchase contracts.
(3)Includes assets transferred or pledged to securitization vehicles net of debt issued by securitization vehicles.
| | | | | | | | | | | | | | | | | | | | | | | |
| | December 31, 2023 | | December 31, 2022 |
| Asset Classes | Percentage of Portfolio | | Capital Allocation (2) | | Percentage of Portfolio | | Capital Allocation (2) |
| | | | | | | |
Agency (1)(2) | 88% | | 61% | | 90% | | 66% |
Residential Credit (2) | 8% | | 20% | | 7% | | 19% |
MSR (2) | 3% | | 18% | | 2% | | 14% |
| | | | | | | |
| Commercial Real Estate | 1% | | 1% | | 1% | | 1% |
| | | | | | | |
(1) Includes to-be-announced forward contracts (“TBAs”). (2) Assets exclude assets transferred or pledged to securitization vehicles, include TBA purchase contracts (market value), unsettled MSR commitments, CMBX derivatives (market value), and retained securities that are eliminated in consolidation and are shown net of participations issued. |
Risk Appetite
We maintain a firm-wide risk appetite statement which defines the types and levels of risk we are willing to take in order to achieve our business objectives, and reflects our risk management philosophy. We engage in risk activities based on our core expertise that aim to enhance value for our stockholders. Our activities focus on income generation and capital preservation through proactive portfolio management, supported by a conservative liquidity and leverage posture.
The risk appetite statement asserts the following key risk parameters to guide our investment management activities:
ANNALY CAPITAL MANAGEMENT, INC. AND SUBSIDIARIES
ITEM 1. BUSINESS
| | | | | |
| Risk Parameter | Description |
Portfolio compositionComposition | We will maintain a portfolio comprised of target assets approved by our Board and in accordance with our capital allocation policy. |
| Leverage | We generally expect to maintain an economic leverage ratio no greater than 10:1.1 considerate of our overall capital allocation framework. |
Liquidity riskRisk | We will seek to maintain an unencumbered asset portfolio sufficient to meet our liquidity needs even under adverse market conditions. |
Interest rate riskRate Risk | We will seek to manage interest rate risk to protect the portfolio from adverse rate movements utilizing derivative instruments targeting both income generation and capital preservation. |
Credit riskRisk | We will seek to manage credit risk by making investments which conform withinto our specific investment policy parameters and optimize risk-adjusted returns. |
Capital preservationPreservation | We will seek to protect our capital base through disciplined risk management practices. |
ComplianceOperational Risk | We will seek to limit impacts to our business through disciplined operational risk management practices addressing areas including but not limited to, management of key third party relationships (i.e. originators, sub-servicers), human capital management, cybersecurity and technology related matters, business continuity and financial reporting risk. |
| Compliance, Regulatory and Legal | We will seek to comply with regulatory requirements needed to maintain our REIT status and our exemption from registration under the Investment Company Act and the licenses and registrationsapprovals of our regulated and licensed subsidiaries. |
ANNALY CAPITAL MANAGEMENT, INC. AND SUBSIDIARIES
ITEM 1. BUSINESS
Our Board has reviewed and approved the investment and operating policies and strategies that support our risk appetite statement set forth in this Form 10-K. Our Board has the power to modify or waive these policies and strategies to the extent that our Board, in its discretion, determines that the modification or waiver is in theour best interests of our stockholders.interests. Among other factors, market developments whichthat affect our policies and strategies or whichthat change our assessment of the market may cause our Board to revise our policies and strategies.
We may seek to expand our capital base in order to further increase our ability to acquire new and different types of assets when the potential returns from new investments appear attractive relative to the targeted risk-adjusted returns. We may in the future acquire assets or companies by offering our debt or equity securities in exchange for such opportunities.
Target Assets
Within the confines of the risk appetite statement, we seek to generate the highest risk-adjusted returns on capital invested, after consideration of the following:
•The amount, nature and variability of anticipated cash flows from the asset across a variety of interest rate, yield, spread, financing cost, credit loss and prepayment scenarios;
•The liquidity of the asset;
•The ability to pledge the asset to secure collateralized borrowings;
•When applicable, the credit of the underlying borrower;
•The costs of financing, hedging and managing the asset;
•The impact of the asset to our REIT compliance and our exemption from registration under the Investment Company Act; and
•The capital and operational requirements associated with the purchase and financing of the asset.
We target the purchase and sale of the following assets listed below as part of our investment strategy. Our targeted assets and asset acquisition strategy may change over time as market conditions change and as our business evolves.
ANNALY CAPITAL MANAGEMENT, INC. AND SUBSIDIARIES
ITEM 1. BUSINESS
| | | | | | | | |
| Investment Group | Targeted Asset Class | Description |
| Annaly Agency Group | Agency mortgage-backed securitiesMBS | Agency pass-through certificates issued or guaranteed by Freddie Mac, Fannie Mae or Ginnie Mae.Agencies. Other Agency MBS include collateralized mortgage obligations (“CMOs”), interest-only securities and inverse floaters |
| To-be-announced forward contracts (“TBAs”) | Forward contracts for Agency pass-through certificates |
Agency commercial mortgage-backed securitiesCMBS | Pass-through certificates collateralized by commercial mortgages guaranteed by Freddie Mac, Fannie Mae or Ginnie Mae |
Mortgage Servicing Rights (“MSRs”) | Rights to service a pool of residential loans in exchange for a portion of the interest payments made on the loansAgencies |
| Annaly Residential Credit Group | Residential mortgage loans | Residential mortgage loans that are not guaranteed by Freddie Mac, Fannie Mae or Ginnie Maethe Agencies |
Residential mortgage-backed securitiesMBS | Securities collateralized by pools of residential loans that are not guaranteed by one of the Agencies |
| Agency or private label credit risk transfer securities (“CRT”) | Risk sharing transactions issued by Freddie Mac and Fannie Mae and similarly structured transactions arranged by third party market participants, designed to synthetically transfer mortgage credit risk to private investors |
Annaly Commercial Real EstateMortgage Servicing Rights Group | CommercialMortgage Servicing Rights (“MSR”) | Rights to service a pool of residential mortgage loans | Loans collateralized by commercial real estate properties |
Commercial mortgage-backed securities | Securities collateralized by pools in exchange for a portion of commercial mortgagethe interest payments made on the loans |
| Mezzanine loans | Loans collateralized by commercial real estate properties subordinate to first mortgage loans |
| Real property | Commercial real estate properties that generate current cash flow
| Annaly Middle Market Lending Group | First lien middle market loansSenior secured loans made to middle market companies that are the first to be repaid in the event of a borrower default |
| Second lien middle market loans | Senior secured loans to middle market companies that have a junior claim on collateral to those of first lien loans
| | |
| | |
We believe that future interest rates and mortgage prepayment rates are very difficult to predict. Therefore, we seek to acquire assets which we believe will provide attractive returns over a broad range of interest rate and prepayment scenarios.
ANNALY CAPITAL MANAGEMENT, INC. AND SUBSIDIARIES
ITEM 1. BUSINESS
Capital Structure and Financing
Our capital structure is designed to offer an efficient complement of funding sources to generate positive risk-adjusted returns for our stockholders while maintaining appropriate liquidity to support our business and meet our financial obligations under periods of market stress. To maintain our desired capital profile, we utilize a mix of debt and equity funding. Debt funding may include the use of repurchase agreements, loans, securitizations, participations issued, lines of credit, asset backed lending facilities, corporate bond issuance, convertible bonds, mortgages payable or other liabilities. Equity capital primarily consists of common and preferred stock.
We finance our Agency mortgage-backed securities and residential credit investments primarily with repurchase agreements. We also finance certain commercial real estate investments with repurchase agreements. We seek to diversify our exposure and limit concentrations by entering into repurchase agreements with multiple counterparties. We enter into repurchase agreements with broker-dealers, commercial banks and other lenders that typically offer this type of financing. We enter into collateralized borrowings with financial institutions meeting internal credit standards and we monitor the financial condition of these institutions on a regular basis. At December 31, 2020,2023, we had $64.8$62.2 billion of repurchase agreements outstanding.
Additionally, our wholly-owned subsidiary, Arcola Securities, Inc. (“Arcola”), provides direct access to third party funding as a FINRA member broker-dealer.broker-dealer of the Financial Industry Regulatory Authority (“FINRA”). As an eligible institution, Arcola also raises funds through the General Collateral Finance Repo service offered by the Fixed Income Clearing Corporation (“FICC”), with FICC acting as the central counterparty. Arcola provides us greater depth and diversity of repurchase agreement funding while also limiting our counterparty exposure.
To reduce our liquidity riskrisk. we maintain a laddered approach to our repurchase agreements. At December 31, 2020,2023, the weighted average days to maturity was 6444 days.
We utilize diverse funding sources toalso finance our commercial investments, including bilateral borrowing facilities, securitization funding and, in the case of equity investments in commercial real estate,residential mortgage financing.loans through the issuance of securitization transactions sponsored by our wholly-owned subsidiary Onslow Bay Financial LLC (“Onslow Bay”) under the Onslow Bay private-label securitization program (“OBX”). We are a programmatic securitization sponsor of new origination, residential whole loans with 51 deals as of December 31, 2023 comprising $20.0 billion of issuance since the beginning of 2018. During the year ended December 31, 2023, we issued 13 OBX securitizations backed by $4.9 billion of residential whole loans.
We utilize leverage to enhance the risk-adjusted returns generated for our stockholders. We generally expect to maintain an economic leverage ratio of no greater than 10:1.1 considerate of our overall capital allocation framework. This ratio varies from time to time based upon various factors, including our management’s opinion of the level of risk of our assets and liabilities, our mix of assets, our liquidity position, our level of unused borrowing capacity, the availability of credit, over-collateralization levels required by lenders when we pledge assets to secure borrowings and, lastly, our assessment of domestic and international market conditions. Since the financial crisis beginning in 2007, we have maintained an economic leverage ratio below 8:1 which is generally lower than what ourand since the Coronavirus Disease 2019 (“COVID-19”) pandemic began, an economic leverage ratio had been priorcloser to 2007.or below 7:1. For
ANNALY CAPITAL MANAGEMENT, INC. AND SUBSIDIARIES
ITEM 1. BUSINESS
purposes of calculating this ratio, our economic leverage ratio is equal to the sum of Recourse Debt, cost basis of TBA and CMBX derivatives outstanding, and net forward purchases (sales) of investments divided by total equity.
Our target economic leverage ratio is determined under our capital management policy. Should our actual economic leverage ratio increase above the target level, we will consider appropriate measures. Our actions may include asset sales, changes in asset mix, reductions in asset purchases or originations, issuance of capital or other capital enhancing or risk reduction strategies.
The following table presents our leverage economic leverage and capital ratios as of the periods presented.
| | | | | | | | | | | |
| | December 31, 2020 | | December 31, 2019 |
| Leverage ratio | 5.1:1 | | 7.1:1 |
| Economic leverage ratio | 6.2:1 | | 7.2:1 |
| Capital ratio | 13.6% | | 12.0% |
| | | | | | | | | | | |
| | December 31, 2023 | | December 31, 2022 |
| GAAP leverage ratio | 6.8:1 | | 6.0:1 |
Economic leverage ratio * | 5.7:1 | | 6.3:1 |
| GAAP capital ratio | 12.2% | | 13.9% |
Economic capital ratio * | 14.0% | | 13.4% |
| * Represents a non-GAAP financial measure. Refer to the “Non-GAAP Financial Measures” section for additional information. |
Operating Platform
We maintain a flexible and scalable operating platform to support the management and maintenance of our diverse asset portfolio. We have invested in our infrastructure to enhance resiliency, efficiency, cybersecurity and scalability while also ensuring coverage of our target assets. Our information technology applications span the portfolio life-cycle including pre-trade analysis, trade execution and capture, trade settlement and financing, monitoring, management and financial accounting and reporting.
Technology applications also support our control functions including risk, compliance, and middle- and back-office functions.back-offices. We have added breadth to our operating platform to accommodate diverse asset classes and drive automation-based efficiencies.
ANNALY CAPITAL MANAGEMENT, INC. AND SUBSIDIARIES
ITEM 1. BUSINESS
Our business operations include a centralized collateral management function that permits in-house settlement and self-clearing, thereby creating greater control and management of our collateral. Through technology, we have also incorporated exception basedexception-based processing, critical data assurance and paperless workflows. Our infrastructure investment has driven operating efficiencies while expanding the platform. Routine disaster recovery and penetration testing enhances our systems resiliency, security and recovery of critical systems throughout the computing estate, and positioned us for a smooth transition to the remote work environment in which we currently operate due to Coronavirus Disease 2019 (“COVID-19”).estate.
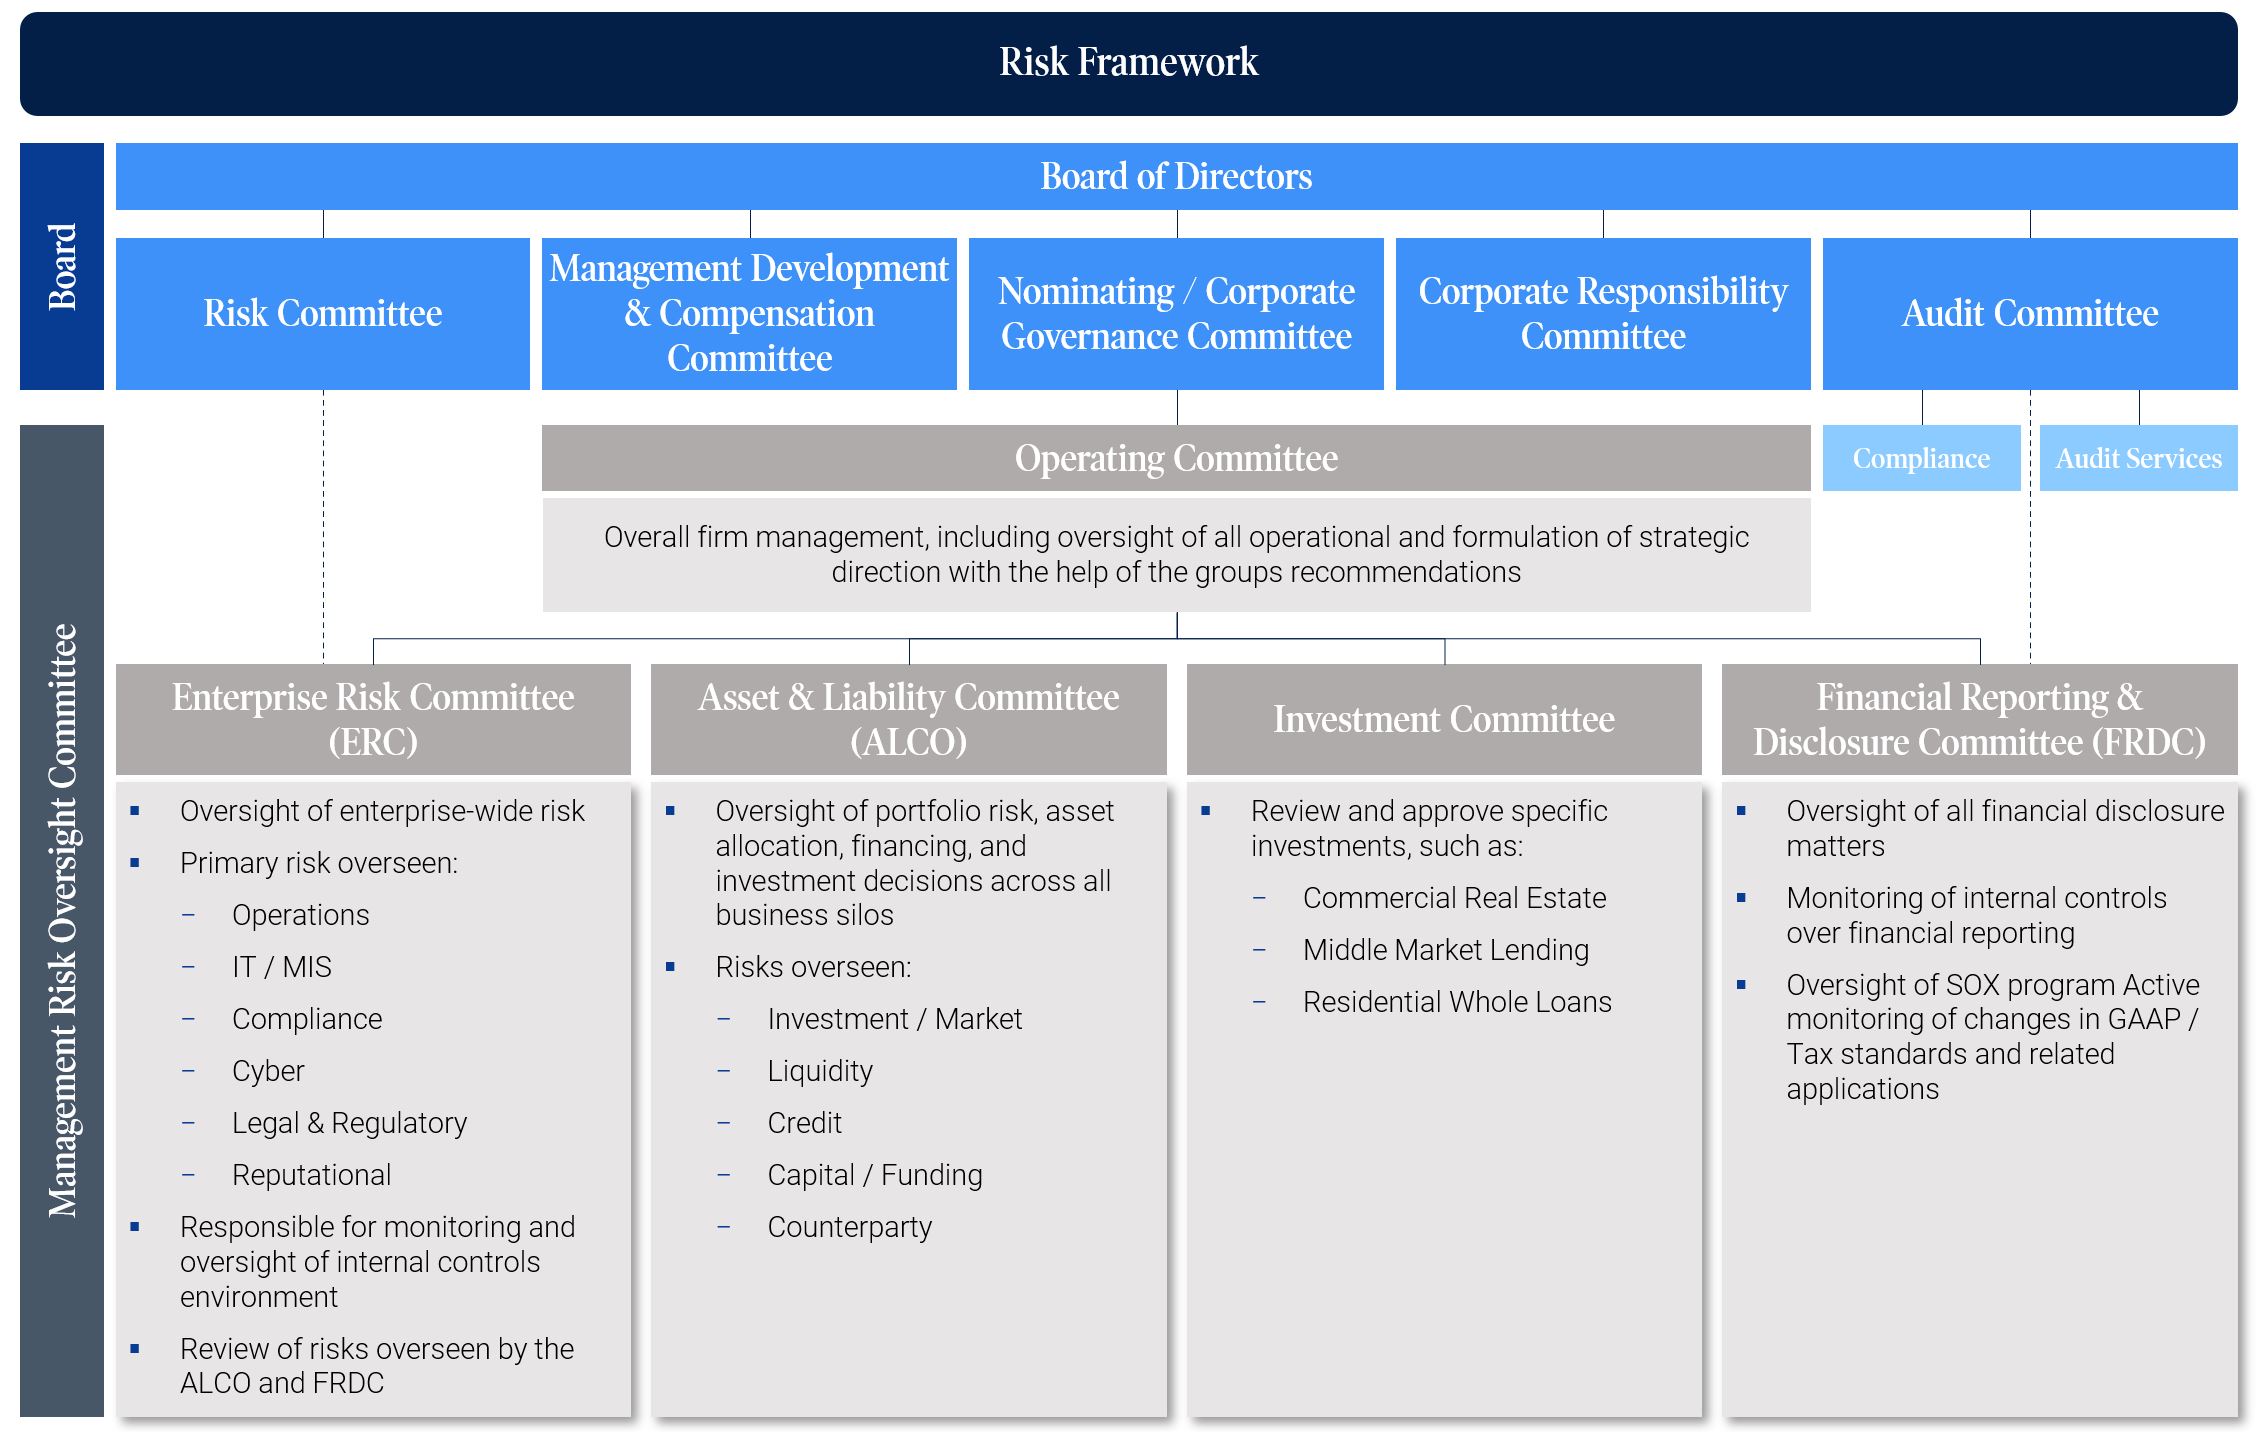
Risk Management
Risk is a natural element of our business. Effective risk management is of critical importance to our business strategy. The objective of our risk management framework is to identify, measure, monitor and control the key risks to which we are subject. Our approach to risk management is comprehensive and has been designed to foster a holistic view of risk. For a full discussion of our risk management process and policies please refer to the section titled “Risk Management” of Part II, Item 7. “Management’s Discussion and Analysis of Financial Condition and Results of Operations.”
Closing of the Internalization and Termination of the Management Agreement
On February 12, 2020, we entered into an internalization agreement (the “Internalization Agreement”) with our Former Manager and certain affiliates of our Former Manager. Pursuant to the Internalization Agreement, we agreed to acquire all of the outstanding equity interests of our Former Manager and our Former Manager’s direct and indirect parent companies from their respective owners (the “Internalization”) for nominal cash consideration ($1.00). In connection with the closing of the Internalization, on June 30, 2020, we acquired all of the assets and liabilities of our Former Manager (the net effect of which was immaterial in amount), and we transitioned from an externally-managed REIT to an internally-managed REIT. At the closing, all employees of our Former Manager became our employees. The parties also terminated the Amended and Restated Management Agreement by and between us and our Former Manager (the “Management Agreement”) and therefore we no longer pay a management fee to, or reimburse expenses of, our Former Manager. Pursuant to the Internalization Agreement, our Former Manager waived any termination fee. For additional information about the Internalization, see the Note titled “Related Party Transactions” in the Notes to the Consolidated Financial Statements included in Item 15. “Exhibits, Financial Statement Schedules.”
Information about our Executive Officers
The following table sets forth certain information as of January 31, 2021February 15, 2024 concerning our executive officers:
| | | | | | | | |
| Name | Age | Title |
| | |
| David L. Finkelstein | 4851 | Chief Executive Officer and Chief Investment Officer |
| Serena Wolfe | 4144 | Chief Financial Officer |
| Steven F. Campbell | 4851 | President and Chief Operating Officer |
Timothy P. Coffey | 47 | Chief Credit Officer |
Ilker Ertas | 50 | Head of Securitized Products |
| Anthony C. Green | 4649 | Chief Corporate Officer, Chief Legal Officer and Secretary |
David L. Finkelstein has served as the Chief Executive Officer of Annaly since March 2020 and Chief Investment Officer of Annaly since November 2016.2022. Mr. Finkelstein previously served as President of Annaly from March 2020 until December 2022 and Annaly’s Chief Investment Officer from November 2016 until December 2021. Prior to that, Mr. Finkelstein served as Annaly’s Chief Investment Officer, Agency and RMBS beginning in February 2015 and as Annaly’s Head of Agency Trading beginning in August 2013. Prior to joining Annaly in 2013, Mr. Finkelstein served for four years as an Officer in the Markets Group of the Federal Reserve Bank of New York where he was the primary strategist and policy advisor for the MBS purchase
ANNALY CAPITAL MANAGEMENT, INC. AND SUBSIDIARIES
ITEM 1. BUSINESS
program. Mr. Finkelstein has over 2025 years of experience in fixed income investments. Prior to the Federal Reserve Bank of New York, Mr. Finkelstein held Agency MBS trading positions at Salomon Smith Barney, Citigroup Inc. and Barclays PLC. Mr. Finkelstein is a member of the Treasury Market Practices Group sponsored by the Federal Reserve Bank of New York, as well as a member of the Financial Sector Advisory Council of the Federal Reserve Bank of Dallas. Mr. Finkelstein received his B.A. in Business Administration from the University of Washington and his M.B.A. from the University of Chicago, Booth School of Business. Mr. Finkelstein also holds the Chartered Financial Analyst® designation.
Serena Wolfe has served as Chief Financial Officer of Annaly since December 2019. Prior to joining Annaly in 2019, Ms. Wolfe served as a Partner at Ernst & Young (“EY”) since 2011 and as its Central Region Real Estate Hospitality & Construction (“RHC”) leader from 2017 to November 2019, managing the go-to-market efforts and client relationships across
ANNALY CAPITAL MANAGEMENT, INC. AND SUBSIDIARIES
ITEM 1. BUSINESS
the sector. Ms. Wolfe was previously also EY’s Global RHC Assurance Leader. Ms. Wolfe practiced with EY for over 20 years, including six years with EY Australia and 16 years with the U.S. practice. Ms. Wolfe currently serves on the boards of Lennar Corporation and Doma Holdings, Inc. Ms. Wolfe graduated from the University of Queensland with a Bachelor of Commerce in Accounting. She is a Certified Public Accountant in the states of New York California, Illinois and Pennsylvania.California.
Steven F. Campbell has served as President of Annaly since December 2022 and Chief Operating Officer of Annaly since June 2020. Prior to this position,these positions, Mr. Campbell served in a number of other senior roles at Annaly, including as Head of Business Operations from September 2019 to June 2020, Head of Credit Operations and Enterprise Risk from February 2018 to September 2019, Chief Operating Officer of Annaly Commercial Real Estate Group from December 2016 to February 2018 and Head of Credit Strategy from April 2015 to February 2018. Mr. Campbell has over 2025 years of experience in financial services. Prior to joining Annaly in 2015, Mr. Campbell held various roles over six years at Fortress Investment Group LLC, including serving as a Managing Director in the Credit Funds business. Prior to that, Mr. Campbell held positions at General Electric Capital Corporation and D.B. Zwirn & Co,Co., L.P. with a focus on credit and debt restructuring. Mr. Campbell currently serves on the Advisory Board for the Fitzgerald Institute of Real Estate at the University of Notre Dame. Mr. Campbell received a B.B.A. from the University of Notre Dame and a M.B.A. from the University of Chicago, Booth School of Business.
Timothy P. Coffey has served as Chief Credit Officer of Annaly since January 2016. Mr. Coffey served as Annaly’s Head of Middle Market Lending from 2010 until January 2016. Mr. Coffey has over 20 years of experience in leveraged finance and has held a variety of origination, execution, structuring and distribution positions. Prior to joining Annaly in 2010, Mr. Coffey served as Managing Director and Head of Debt Capital Markets in the Leverage Finance Group at Bank of Ireland. Prior to that, Mr. Coffey held positions at Scotia Capital, the holding company of Saul Steinberg’s Reliance Group Holdings and SC Johnson International. Mr. Coffey received his B.A. in Finance from Marquette University.
Ilker Ertas has served as Head of Securitized Products at Annaly since February 2019. Prior to this position, Mr. Ertas served in a number of other senior roles at Annaly, including as Head of RMBS Portfolios from February 2018 to February 2019, Head of Trading from February 2017 to February 2018, Head of Asset Trading from October 2016 to February 2017 and Managing Director, Agency & Residential Credit from June 2015 to October 2016. Mr. Ertas has 20 years of experience in U.S. fixed income markets. Prior to joining Annaly in 2015, Mr. Ertas was at Citigroup Inc., where he was most recently a Managing Director and Head of Mortgage Derivatives Trading. Mr. Ertas has also held mortgage trading positions at Barclays PLC and Lehman Brothers Holdings Inc. Mr. Ertas received a B.S. in Industrial Engineering from Bogazici University in Istanbul, Turkey and a M.B.A. from the Yale School of Management.
Anthony C. Green has served as Chief Corporate Officer of Annaly since January 2019 and as Chief Legal Officer and Secretary of Annaly since March 2017. Mr. Green previously served as Annaly’s Deputy General Counsel from 2009 until February 2017. Prior to joining Annaly, Mr. Green was a partner in the Corporate, Securities, Mergers & Acquisitions Group at the law firm K&L Gates LLP. Mr. Green has over 20 years of experience in corporate and securities law. Mr. Green holds a B.A. in Economics and Political Science from the University of Pennsylvania and a J.D. and LL.M. in International and Comparative Law from Cornell Law School.
Human Capital
In connection with the closing of the Internalization on June 30, 2020, we transitioned from an externally-managed REIT to an internally-managed REIT. Our human capital groupHuman Capital team oversees our human capitalcompany’s workforce management to ensure that it isits objectives are strategically integrated with ourthe firm’s goals and business plans. We proactively review human capital management best practices to continually enhance our employee experience. In addition, the Management Development and Compensation (“MDC”) Committee of the Board provides independent oversight of the our policies and strategies related to human capital management. Further, the Chair of the MDC Committee liaises on certain human capital topics with the Chair of the Corporate Responsibility Committee of the Board as appropriate.
As of December 31, 2020,2023, we had 180187 employees.
Our People and Culture
We recognize that ourOur employees are our most important asset,the driving force behind Annaly’s success, and we are committed to promoting their well-being, engagement, and development and fullto help them reach their highest potential. We areOur culture is focused on fostering ana diverse, inclusive and rewarding work environment for all our employees, with ongoing opportunities for career development, and wellness support that seeks to facilitate the achievement of their professional goals.and empowerment.
Our culture is built on sixfive core values: ownership, humility, accountability, communication, collaboration and diversity, equity and inclusion and humility.inclusion. These values are embedded in our professional and personal conduct and are crucial to how we operate our business. All employees are responsible for upholding these values, which form the bedrock of our culture and are vital to the continued success of our company. Guided by these values, we are committed to attracting, developing and retaining the best talent, with diverse experiences, perspectives and backgrounds.
We utilize employee surveys, including an annual engagement survey, to create an open and honest feedback forum,channels that foster our ability to actively engage and involve our employees in the design and evolution of our culture and our human capital strategies to enhance our overall productivity and mitigate risk. Our leaders review and incorporate survey feedback to increase employee engagement and drive positive changes throughout the firm.our company. We remain committed to maintaining an environment of consistent feedback as we strive for high employment satisfaction levels.
ANNALY CAPITAL MANAGEMENT, INC. AND SUBSIDIARIES
ITEM 1. BUSINESS
COVID-19
In response to COVID-19, our employees have largely worked remotely since March 2020. We supported our employees’ remote working through stipends to upgrade home office equipment. Since September 2020, there are a limited number of employees who voluntarily work in the office on occasion. We implemented a regular Coronavirus testing protocol to optimize our ability to provide a safe work environment. In addition to addressing physical health and safety concerns, we recognize that the pandemic has affected people’s daily emotional lives and mental health. As a result, we have increased our mental health offerings and hosted a multitude of virtual seminars to help keep our employees connected with one another and to equip them with tools to help alleviate some of the increased stress and burdens.
Diversity, Equity & Inclusion
The diversity of our employees brings a critical range of thought and experience throughoutenables our company cultivatingto cultivate innovation, fresh perspectives and vital new ideas.agility. Diversity, equity and inclusion are essential tenets of our corporate culture. Our human capital management group,Human Capital team, in coordination with our recently named Head of Inclusion andan Inclusion Support Committee of Executive Sponsors, is responsible for overseeing and continuing to improveadvance our diversity, equity and inclusion initiatives.
We are committed to achievingpromoting diversity, including gender and racial/ethnic diversity, across all levels of our company. With 50%62% of total employeesour Operating Committee and 58% of our overall population in 20202023 identifying as either female and/or racially/ethnically diverse, we are driven by the belief that having a diverse group of employees supports our continued long-term growth. In 2017, we launchedsuccess. Hosting over 30 community building events in 2023, our seven employee network groups, which include the Women’s Interactive Network which provides(“WIN”), the Asian American and Pacific Islander Employee Network, the Black Employee Network, the Latin American Employee Network, the Disabilities Within a Family Network, the Veteran’s Employee Network and the Annaly Pride Network, continue to evolve and advance. These employee networks help strengthen our inclusive culture by fostering a sense of belonging and engagement through targeted development and networking opportunities, knowledge exchanges, mentorship, coaching and volunteer efforts. Our
Additionally, we recognize and understand that education, candid conversations and continued training are key to embedding and advancing diversity, equity and inclusion within our organization and culture. To further promote and foster such a foundation, our efforts also include offering firm-wide initiatives like antraining on topics such as unconscious bias, training program offered in 2020allyship and inclusive leadership. To that end, we have hosted various forums for employees to establish foundational knowledge, language and understanding to support the strategic diversity and inclusion efforts of the firm, organizing forums toopenly discuss employees’their views and have provided opportunities for employee connection and networking, as well as actively seekingsought out feedback fromthrough periodic employee surveys.
Employee Development,Compensation, Benefits and Wellness
We seek to invest in and promote talent to cultivate a high-performance culture and build on the capabilities and full potential of our employees. We invest in a wide range of benefits and wellness initiatives for our employees to support healthy lifestyles and choices.
Our employee compensation program includes base salary, annual incentive bonuses and stock-based awards. Employee compensation packages are designed to align employee and stockholder interests and to provide incentives to attract, retain and motivate talented employees.
In addition, we invest in a wide range of benefits and wellness initiatives that support healthy lifestyles and choices for our employees. We offer employees benefits including health and insurance coverage, health savings and flexible spending accounts, telemedicine benefits, 401(K)401(k) plans, paid time off and family care resources. We also sponsor a wide range of initiatives that promote employee wellness and mental well-being, including access to talk therapy, health coaching, stress management support and a dedicated Wellness Week that includes a number of health and wellness related activities and seminars. Over the last few years, we have enhanced our parental and family care benefits to provide extended leave and fertility assistance.
At Annaly, we understand that it is our responsibility to provide an environment where our employees feel safe, motivated, empowered, and prepared, regardless of whatever challenges may arise. In addition to addressing physical health and safety concerns, we recognize that people’s daily emotional lives and mental health play a key role in their overall wellness. As such, we continue to evaluate ways to promote and expand our mental health offerings. Additionally, we recognize that part of meeting employee needs includes institutionalizing broader and longer-term flexibility where appropriate. Flexibility comes in many forms at Annaly, including vacation and sick time, hybrid work options and location strategy. We remain committed to evaluating the evolving definition of flexibility and promoting programs and practices that foster inclusivity and well-being both personally and professionally.
Learning and Development
We seek to advance and promote our employees’ capabilities and full potential by investing in a number of targeted learning and development opportunities. By aligning with our overall business strategy, we design our learning and development objectives to meet our employees’ needs and interests. Additionally, we have both a tuition reimbursement and learning reimbursement plan to cover all or part ofthat provide financial support toward the cost of education that furthersfurthering employee education in a fieldan area directly related to their specific job.
WeTo promote a sense of purpose, accountability and broader exposure, we offer a number of learning and development programs tailored to our employee needs and interestsnetworking opportunities that include senior leader-led small group sessions as well as our overall strategicone-on-one employee knowledge share sessions across the firm. More broadly, we continue to offer firmwide learning sessions that focus on core business objectives. For example,strategies and initiatives to foster holistic and inclusive learning. Further, we offer targeted professional development training for employees at various stages in their career. In 2020, we began offering firm-widefacilitate individual style and culture sessions where we facilitate discussionswith new employees to gain insights onpromote professional awareness and understanding of our company’s culture enhancement priorities.initiatives.
Corporate and Employee Philanthropy and Volunteerism
Our corporate giving has been focused on high-impact programs that seek to advance social issues we are committed to, including combating homelessness and advancing the professional development of women and underrepresented groups. In 2020, we also provided support to COVID-19 relief effortsgroups in our New York City community.finance. Annaly and our employees endeavor to meaningfully contribute to the communities where we live, work and invest by
ANNALY CAPITAL MANAGEMENT, INC. AND SUBSIDIARIES
ITEM 1. BUSINESS
partnering with well-established non-profit organizations and through Annaly’s corporate giving, employee volunteerism and our employee charity match program.
Regulatory Requirements
The financial services industry is subject to extensive regulation and supervision, and changes to regulations and supervisory practices are continuously being considered by regulators and policy makers worldwide. We continue to assess our business, risk management and compliance practices to conform to developments in the regulatory environment.
We have elected, organized and operated in a manner that qualifies us to be taxed as a REIT under the Internal Revenue Code of 1986, as amended and regulations promulgated thereunder (the “Code”). So long as we qualify for taxation as a REIT, we generally will not be subject to U.S. federal income tax on our taxable income that is distributed to our stockholders. Furthermore, substantially all of our assets, other than our taxable REIT subsidiaries (“TRSs”), consistsconsist of qualified REIT real estate assets (of the type described in Section 856(c)(5) of the Code).
We regularly monitor our investments and the income from these investments and, to the extent we enter into hedging transactions, we monitor income from our hedging transactions as well, so as to ensure at all times that we maintain our qualification as a REIT, and our exemption from registration under the Investment Company Act.Act and our exemption from registration as a commodity pool operator ("CPO") with the U.S. Commodity Futures Trading Commission ("CFTC").
Arcola is a member of FINRA, an SEC registered broker-dealer and is subject to regulations of the securities business that include but are not limited to trade practices, use and safekeeping of funds and securities, capital structure, recordkeeping and conduct of directors, officers and employees. As a self-clearing, registered broker dealer,broker-dealer, Arcola is required to maintain minimum net capital by the SEC and FINRA. Arcola consistently operates with capital in excess of its regulatory capital requirements as defined by SEC Rule 15c3-1.
ANNALY CAPITAL MANAGEMENT, INC. AND SUBSIDIARIES
ITEM 1. BUSINESS
We have a subsidiary that is registered with the SEC as an investment adviser under the Investment Advisers Act. As a result, we are subject to the anti-fraud provisions of the Investment Advisers Act and to fiduciary duties derived from these provisions that apply to our relationships with that subsidiary’s clients. These provisions and duties impose restrictions and obligations on us with respect to our dealings with our subsidiary’s clients, including, for example, restrictions on agency, cross and principal transactions. Our registered investment adviser subsidiary is subject to periodic SEC examinations and other requirements under the Investment Advisers Act and related regulations primarily intended to benefit advisory clients. These additional requirements relate to, among other things, maintaining an effective and comprehensive compliance program, recordkeeping and reporting requirements and disclosure requirements.
We also have a subsidiary that operates as a licensed mortgage aggregator and master servicer, which subjects it to individual state licensing laws and to supervision and examination by federal authorities, including the Consumer Financial Protection Bureau ("CFPB"), the U.S. Department of Housing and Urban Development (“HUD”), the SEC as well as various state licensing, supervisory and administrative agencies. We and our subsidiaries must also comply with a large number of federal, state and local consumer protection laws including, among others, the Gramm-Leach-Bliley Act, the Fair Debt Collection Practices Act, Real Estate Settlement Procedures Act, the Truth in Lending Act, and the Fair Credit Reporting Act, as well as state foreclosure laws and federal and local bankruptcy rules. These laws and regulations, which are frequently amended and adjusted, have, in recent years, led to an increase in both the scope of the requirements and the intensity of the supervision to which we are subject.
The financial services industryCFTC has jurisdiction over the regulation of swaps. The CFTC has asserted that this causes the operators of mortgage REITs that use swaps as part of their business model to fall within the statutory definition of CPO, and absent relief from the Market Participants Division of the CFTC, such operators generally much register as CPOs or qualify for an exemption from registration. On December 7, 2012, as a result of numerous requests for no-action relief from the CPO registration requirement for operators of mortgage REITs, the Division of Swap Dealer and Intermediary Oversight (the predecessor to the Market Participants Division) of the CFTC issued no-action relief entitled “No-Action Relief from the Commodity Pool Operator Registration Requirement for Commodity Pool Operators of Certain Pooled Investment Vehicles Organized as Mortgage Real Estate Investment Trusts” that permits a CPO to receive relief from the requirement to register by filing a claim to perfect the use of the relief. A claim submitted by a CPO will be effective upon filing, so long as the claim is subjectmaterially complete. The conditions that must be met relate to extensive regulationinitial margin and supervisionpremiums requirements, net income derived annually from commodity interest positions that are not qualifying hedging transactions, marketing of interests in the U.S. The Dodd-Frank Wall Street Reformmortgage REIT to the public and Consumer Protection Actidentification of 2010 (“Dodd-Frank Act”) and the rules thereunder significantly alteredentity as a mortgage real estate investment trust in its federal tax filings with the financial regulatory regime within which financial institutions operate. Other reformsIRS. We have been adopted or are being considered by other regulators and policy makers worldwide. We will continue to assess our business, risk management and compliance practices to conform to developmentssubmitted a claim for the relief set forth in the regulatory environment.no-action relief entitled “No-Action Relief from the Commodity Pool Operator Registration Requirement for Commodity Pool Operators of Certain Pooled Investment Vehicles Organized as Mortgage Real Estate Investment Trusts” and believe we meet the criteria for such relief set forth therein.
ANNALY CAPITAL MANAGEMENT, INC. AND SUBSIDIARIES
ITEM 1. BUSINESS
Competition
We operate in a highly competitive market for investment opportunities and competitionopportunities. Competition may limit our ability to acquire desirable investments in our target assets and could also affect the pricing of these investments. In acquiring our target assets, we will compete with financial institutions, institutional investors, other lenders, government entities and certain other REITs. For a full discussion of the risks associated with competition see the “Risks Related to Our Investing, Portfolio Management and Financing Activities” section in Item 1A. “Risk Factors.”
Corporate Governance
We strive to conduct our business in accordance with the highest ethical standards and in compliance with applicable governmental laws, rules and regulations. Our notable governance practices and policies include:
•We closed our management internalization transaction on June 30, 2020 and transitioned from an externally-managed REIT to an internally-managed REIT.
•Our Board is composed of a majority of independent directors, and our Audit, Management Development and Compensation, and Nominating/Corporate Governance Committees are composed exclusively of independent directors.
•We have separated the roles of Chair of the Board and Chief Executive Officer, and appointed an independent Chair of the Board.
•In December 2018, we amended our bylaws to declassify our Board over a three-year period with allAll directors standing forare elected on an annual election by our company’s annual meeting of stockholders in 2021.basis.
•We have adopted an enhanced director refreshment policy, which provides that an independent director may not stand for re-election at the next annual meeting of stockholders taking place at the end of his or her term following the earlier of his or her: (i) 15th anniversary of service on our Board or (ii) 73rd birthday.
•We have adopted a Code of Business Conduct and Ethics, which sets forth the basic principles and guidelines for resolving various legal and ethical questions that may arise in the workplace and in the conduct of our business. This code is applicable to our directors, officers and employees.
•We have adopted Corporate Governance Guidelines which, in conjunction with the charters of our Board committees, provide the framework for the governance of our company.
•We have procedures by which any of our employees, officers or directors may raise concerns
confidentially about our company’s conduct, accounting, internal controls or auditing matters with the Chair of the Board, the independent directors, or the Chair of the Audit Committee or through our whistleblower phone hotline or e-mail inbox.
•We have adopted an Insider Trading Policy that prohibits our directors, officers and employees, as well as those of our subsidiaries from buying or selling our securities on the basis of material nonpublic information and prohibits communicating material nonpublic information about our company to others. Our Insider Trading Policy prohibits our directors, officers and employees, from (1) holding our stock in a margin account as eligible collateral, or otherwise pledging our stock as collateral for a loan, or (2) engaging in any hedging transactions with respect to our equity securities held by them.
•Our executive officers are subject to a robusttwo clawback policy, which includes triggers forpolicies, one that covers financial restatements and a second for misconduct.
•Our executive officers are subject to stock ownership guidelines and holding restrictions.
ANNALY CAPITAL MANAGEMENT, INC. AND SUBSIDIARIES
ITEM 1. BUSINESSStockholders holding 25% of our common stock have the right to call a special meeting.
Distributions
In accordance with the requirements for maintaining REIT status, we intend to distribute to stockholders aggregate dividends equaling at least 90% of our REIT taxable income (determined without regard to the deduction of dividends paid and by excluding any net capital gain) for each taxable year and will endeavor to distribute at least 100% of our REIT taxable income so as not to be subject to tax. Distributions of economic profits from our enterprise could be classified as return of capital due to differences between book and tax accounting rules. We may make additional returns of capital when the potential risk-adjusted returns from new investments fail to exceed our cost of capital. Subject to the limitations of applicable securities and state corporation laws, we can return capital by making purchases of our own capital stock or through payment of dividends.
ANNALY CAPITAL MANAGEMENT, INC. AND SUBSIDIARIES
ITEM 1. BUSINESS
Available Information
Our website is www.annaly.com. We make available on this website under “Investors - SEC Filings,” free of charge, our annual reports on Form 10-K, quarterly reports on Form 10-Q, current reports on Form 8-K and any amendments to those reports as soon as reasonably practicable after we electronically file or furnish such materials to the SEC pursuant to Section 13 or 15(d) of the Securities Exchange Act of 1934 (the “Securities Exchange Act”). Our website and the information contained therein are not incorporated into this annual report on Form 10-K.
Also posted on our website, and available in print upon request of any stockholder to our Investor Relations Department, are charters for our Audit Committee, Management Development and Compensation Committee, Nominating/Corporate Governance Committee, Risk Committee and Corporate Responsibility Committee, our Corporate Governance Guidelines and our Code of Business Conduct and Ethics. Within the time period required by the SEC, we will post on our website any amendment to the Code of Business Conduct and Ethics and any waiver applicable to any executive officer, director or senior financial officer.
Our Investor Relations Department can be contacted at:
Annaly Capital Management, Inc.
1211 Avenue of the Americas
New York, New York 10036
Attn: Investor Relations
Telephone: 888-8ANNALY
E-mail: investor@annaly.com
The SEC also maintains a website that contains reports, proxy and information statements and other information we file with the SEC at www.sec.gov.
ANNALY CAPITAL MANAGEMENT, INC. AND SUBSIDIARIES
Item 1A. Risk Factors
An investment in our stock involves a number of risks. Before making an investment decision, you should carefully consider all of the risks described in this annual report on Form 10-K. If any of the risks discussed in this annual report on Form 10-K actually occur, our business, financial condition and results of operations could be materially adversely affected. If this were to occur, the trading price of our stock could decline significantly and you may lose all or part of your investment. Readers should not consider any descriptions of these factors to be a complete set of all potential risks that could affect us.
INDEX TO ITEM 1A. RISK FACTORS
ANNALY CAPITAL MANAGEMENT, INC. AND SUBSIDIARIES
Item 1A. Risk Factors
Summary of Risk Factors
Risks Related to COVID-19
•COVID-19 has affected, and will likely continue to affect, the U.S. economy, the mortgage REIT industry and our business.
•We cannot predict the effect that government policies, laws and plans in response to the COVID-19 pandemic will have on us.
Risks Related to Our Investing, Portfolio ManagementLiquidity and Financing Activities
•We may change our policies without stockholder approval.Funding
•Our strategy involves the use of leverage, which increases the risk that we may incur substantial losses.
•Our use of leverage may causeresult in margin calls and defaults and force us to sell assets under adverse market conditions.
•We may exceed our target leverage ratios, or weratios.
•We may not be able to achieve our optimal leverage.
•Failure to procure or renew funding on favorable terms, or at all, would adversely affect our results and financial condition.
•Failure to effectively manage our liquidity would adversely affect our results and financial condition.
•Risk management policiesVolatile market conditions for our assets can result in contraction in liquidity for those assets and procedures may not adequately identify all risks to our businesses.the related financing.
•An increase or decrease in prepayment rates may adversely affect our profitability.
•We are subject to reinvestment risk.
•Volatile market conditions for mortgages and mortgage-related assets can result in a significant contraction in liquidity.
•Competition may limit our ability to acquire desirable investments in our target assets and also affect the pricing of these assets.
•Increases in interest payments on our borrowings relative to the interest earnedwe earn on our interest earning assets may adversely affect our profitability.
•Differences in timing of interest rate adjustments on our interest earning assets and our borrowings may adversely affect profitability.
•Changes in the method pursuant to which LIBOR is determined and potential discontinuation of LIBOR may affect our results.
•An increase in interest rates may adversely affect the market value of our interest earning assets and, therefore, also our book value.
•We may experience declines in market value of our assets resulting in us recording impairments, which may effect on our results.
•The soundness of other financial institutions could adversely affect us.
•Our hedging strategies may be costly or ineffective and our use of derivatives may expose us to counterparty and liquidity risks.profitability.
•It may be uneconomical to "roll"“roll” our TBA dollar roll transactions or we may be unable to meet margin calls on our TBA contracts.
•Any incorrect, misleading or incomplete information used in connection with analytical models would subjectOur use of derivatives may expose us to potentialcounterparty and liquidity risks.
•Securitizations expose us to additional risks.
•Our use of non-recourse securitizations may expose us to risks which could result in losses to us.
•Counterparties may require us to enter into covenants that restrict our investment strategy.
•We may be unable to profitably execute or participate in future securitization transactions.
Risks of Ownership of Our Common Stock
•Our charter does not permit ownership of over 9.8% in number of shares or value of our common stock or any class of our preferred stock.
•Provisions contained in Maryland law may have anti-takeover effects, potentially preventing investors from receiving a “control premium” for their shares.
•We have not established a minimum dividend payment level and cannot assure stockholders of our ability to pay dividends in the future.
•Our reported GAAP financial results may not be an accurate indicator of future taxable income and dividend distributions.
Compliance, Regulatory & Legal Risks
•Accounting rules related to certain of our transactions are highly complex and involve significant judgment and assumptions.
•We are dependent on information systems and third parties; system failures or cybersecurity incidents could disrupt our business.
•Securitizations, including non-recourse securitizations, Our application of GAAP may expose usproduce financial results that fluctuate from one period to additional risks.
•Counterparties may require us to enter into restrictive covenants relating to our operations that may inhibit our ability to grow.
•We may enter into new lines of business, acquire other companies or engage in other strategic initiatives.
•We are subject to risks and liabilities in connection with sponsoring, investing in and managing new funds and other accounts.
•Investments in MSRs may expose us to additional risks.
•We depend on third-party service providers, including mortgage loan servicers, for a variety of services related to our business.
•Purchases and sales of Agency MBS by Federal Reserve may adversely affect the price and return associated with Agency MBS.another.
•New laws may be passed affecting the relationship between Fannie Mae, and Freddie Mac and the federal government.
Risks Related To Our Credit Assets
•We invest in securities in the credit risk transfer sector that are subject to mortgage credit risk.
•Prolonged economic slowdown or declining real estate values could impair the assets we may own and adversely affect our results.
•Geographic concentration exposes investors to greater risk of default and loss.
•Inadequate property insurance coverage could have an adverse impact on our operating results.
•We may incur losses when a borrower defaults on a loan and the underlying collateral value is less than the amount due.
•Our assets may become non-performing or sub-performing assets, which are subject to increased risks relative to performing loans.
•We may be required to repurchase commercial or residential mortgage loans or indemnify investors.
•Our due diligence of potential assets may not reveal all liabilities and other weaknesses.
•When we foreclose on an asset, we may come to own and operate the property securing the loan.
•Financial covenants could adversely affect our ability to conduct our business.
•Proposals to acquire mortgage loans by eminent domain may adversely affect the value of our assets.
•Our investments in corporate loans and debt securities for middle market companies carry risks.
Risks Related To Commercial Real Estate Debt, Preferred Equity Investments, Net Lease Real Estate Assets and Other Equity
•The real estate assets we acquire are subject to risks particular to real property, which may adversely affect our returns
•Commercial loan assets we originate and/or acquire depend on the ability of property owner to generate net income from operating.
•Commercial and non-Agency mortgage-backed securities we acquire may be subject to losses.
•Borrowers may be unable to repay the Remaining Principal Balance on the Maturity Date.
•The B-Notes that we originate and acquire may be subject to risks related to their privately negotiated structure and terms.
•The mezzanine loan assets and other subordinate debt positions that we originate and acquire involve greater risks of loss.
•We are subject to additional risks associated with loan participations and co-lending arrangements.
•Construction loans involve an increased risk of loss.
ANNALY CAPITAL MANAGEMENT, INC. AND SUBSIDIARIES
Item 1A. Risk Factors
•We may experience losses if the creditworthiness of our tenants deteriorates and they are unable to meet their lease obligations.
•Lease expirations, lease defaults and lease terminations may adversely affect our revenue.
•Our real estate investments are illiquid.
•We may not control the special servicing of the mortgage loans included in the commercial MBS in which we invest.
•Joint venture investments could be adversely affected by our lack of sole decision-making authority.
Risks Related To Our Residential Credit Business
•Our investments in non-Agency MBS or other investment assets of lower credit quality involve credit risk.
•Our investments in non-Agency MBS are collateralized by non-prime loans and may also include subprime mortgage loans.
•Our investments may include subordinated tranches of non-Agency MBS, which are subordinate in payment to senior securities.
•We are subject to counterparty risk and may be unable to seek indemnity or demand repurchase of residential whole loans.
•Our investments in residential whole loans subject us to servicing-related risks, including those associated with foreclosure.
•Challenges to the MERS® System could materially and adversely affect our business, results of operations and financial condition.
•We may be subject to liability for potential violations of truth-in-lending or other similar consumer protection laws and regulations.
•We may not be able to obtain or maintain the governmental licenses requiredcompliance with laws and regulations applicable to operate our Residential Credit and MSR businesses, including through the manner in which we oversee the compliance obligations of our third party service providers.
•Changes in laws or regulations governing our operations or our failure to comply with those laws or regulations may adversely affect our business.
•Our abilityThe increased focus on ESG and climate change issues by investors, governmental bodies and other stakeholders, as well as existing and proposed laws and regulations related to profitably execute or participate in future securitizations transactions, including, in particular, securitizations of residential mortgage loans, is dependent on numerous factors and if we are not able to achieve our desired level of profitability or if we are unable to execute or participate in future securitizations, or incur losses in connection therewith, it could have a material adverse impact onthese topics, may adversely affect our business and financial results.results and damage our reputation.
Risks Related to Our Business Structure
•We may be exposedare subject to complex and evolving laws, regulations, rules, standards and contractual obligations regarding data privacy and security, which could increase the cost of doing business, compliance risks to which we have not historically been exposed as a result of the Internalization.and potential liability.
•The departure of anyWe are subject to risks and liabilities in connection with sponsoring, investing in and managing new funds and other investment accounts, including potential regulatory risks.
•Loss of our key personnel could materially andInvestment Company Act exemption from registration would adversely affect us.
Risks Related to Our Taxation as a REIT
•Our failure to maintain our qualification as a REIT would have adverse tax consequences.
•We have certain distribution requirements, which could adversely affect our ability to execute our business plan.
•Distributions to tax-exempt investors may be classified as unrelated business taxable income.
•We may choose to pay dividends in our own stock, which may require stockholders to pay taxes in excess of cash dividends.
•Our inability to deduct certain compensation paid to our executives could require us to increase our distributions to stockholders.
•Limits on ownership of our stock could have adverse consequences to you and limit your opportunity to receive a premium.
•Our TRSs cannot constitute more than 20% of our total assets.
•TRSs are subject to regular corporate tax and REIT gross income tests limit the amount of dividends they can pay to REIT parents.
•Certain circumstances relating to a TRS may subject the REIT to a penalty tax.
•Even if we remain qualified as a REIT, we may face other tax liabilities that reduce our cash flow.
•Complying with REIT requirements may cause us to forgo or liquidate otherwise attractive opportunities.
•Liquidation of assets may jeopardize our REIT qualification or create additional tax liability for us.
•Failure of certain investments to qualify as real estate assets could adversely affect our status as a REIT.
•Complying with REIT requirements may limit our ability to hedge effectively and may cause us to incur tax liabilities.
•Qualifying as a REIT involves highly technical and complex provisions of the Code.
•The tax on prohibited transactions will limit our ability to engage in transactions, including certain methods of structuring CMOs.
•Some financing activities may subject us to U.S. federal income tax and could have negative tax consequences for our stockholders.
•The lease of qualified healthcare properties to a TRS is subject to special requirements.
•Uncertainty exists with respect to the treatment of our TBAs for purposes of the REIT asset and income tests.
•Dividends payable by REITs generally receive different tax treatment than dividend income from regular corporations.
•New legislation or administrative or judicial actioncould make it more difficult or impossible for us to remain qualified as a REIT.
Risks of Ownership of Our Common Stock
•The market price and trading volume of our common stock may be volatile and negatively impacted by broad market fluctuations.
•Our charter does not permit ownership of over 9.8% of our common or preferred stock without prior approval from our Board.
•Provisions contained in Maryland law that are reflected in our charter and bylaws may have anti-takeover effects.
•We have not established a minimum dividend payment level and cannot assure stockholders of our ability to pay dividends.
•Our reported GAAP financial results differ from the taxable income results that impact our dividend distribution requirements.
Regulatory Risks
•Loss of Investment Company Act exemption from registration would adversely affect us.
•Changes in laws or regulations governing our operations or our failure to comply with those laws or regulations may affect us.
ANNALY CAPITAL MANAGEMENT, INC. AND SUBSIDIARIES
Item 1A. Risk Factors
Risks Related to COVID-19
COVID-19 has adversely affected, and will likely continue to adversely affect, the U.S. economy, the mortgage REIT industry and our business.
General
COVID-19 is causing significant disruptions to the U.S. and global economies and has contributed to volatility and negative pressure in financial markets. COVID-19 and the related social distancing measures have had a broad negative impact on the U.S. and global economies as many businesses, particularly smaller ones within the service-sector, have been forced to close, furlough and/or lay off employees. As a result, U.S. unemployment claims have dramatically risen at unprecedented rates. Other economic activity, including retail sales and industrial production, have slowed as well. The pace, timing and strength of any recovery are still unknown and difficult to predict.
The U.S. federal government, as well as many state and local governments, have adopted a number of emergency measures and recommendations in response to the COVID-19 pandemic, including imposing travel bans, “shelter in place” restrictions, curfews, cancelling events, banning large gatherings, closing non-essential businesses, and generally promoting social distancing (including in the workplace, which has resulted in a significant increase in employees working remotely).Across the country, moratoriums are in place in certain states to stop evictions and foreclosures in an effort to lessen the financial burden created by the COVID-19 outbreak and various states have even promulgated guidance to regulated servicers requiring them to formulate policies to assist mortgagors in need as a result of the COVID-19 pandemic. A number of states have enacted laws which impose significant limits on the default remedies of lenders secured by real property.While some states have begun a phased relaxation of certain of these measures, substantial restrictions on economic activity remain in place. Although it cannot be predicted, additional policy action at the federal, state and local level is possible in the near future.The COVID-19 pandemic (and any future COVID-19 outbreaks) and resulting emergency measures has led (and may continue to lead) to significant disruptions in the global supply chain, global capital markets, the economy of the United States and the economies of other nations.Concern about the potential effects of the COVID-19 pandemic and the effectiveness of measures being put in place by governmental bodies and reserve banks at various levels as well as by private enterprisesto contain or mitigate its spread has adversely affected economic conditions and capital markets globally, and has led to significant volatility in global financial markets.There can be no assurance that the containment measures or other measures implemented from time to time will be successful in limiting the spread of the virus and what effect those measures will have on the economy.While non-essential economic activity is to some extent returning in certain jurisdictions, the timing of such return remains uncertain, and may vary substantially depending on the location and the type of activity.The disruption and volatility in the credit markets and the reduction of economic activity in severely affected sectors may continue for an extended period or indefinitely, and may worsen the recession in the United States and/or globally.
Beginning in the first quarter of 2020, particularly in March, COVID-19 began to adversely affect the mortgage REIT industry generally. In addition to negative general economic conditions, the impact of COVID-19 caused severe volatility across asset classes, including mortgage-related assets. In order to increase liquidity, fixed income investors were forced to sell U.S. Treasuries and Agency MBS, leading to an excess supply of these assets in need of redistribution. Pressure in financing markets and the need to meet margin obligations (particularly in the mortgage REIT industry in connection with repurchase financing obligations) created additional selling pressure in U.S. Treasury and Agency MBS markets, and widening of credit spreads. Other markets, including the market for residential credit and commercial real estate securities, also experienced similar trends, albeit on a relatively lesser scale.
Economic Conditions
The conditions related to COVID-19 discussed above have also adversely affected our business and we expect these conditions to continue during 2021. The significant decrease in economic activity and/or resulting decline in the housing market could have an adverse effect on the value of our investments in mortgage real estate-related assets, particularly residential real estate assets. In addition, as interest rates continue to decline as a result of demand for U.S. Treasury securities and the activities of the Federal Reserve, prepayments on our assets are likely to increase due to refinancing activity, which could have a material adverse effect on our results of operations. Further, in light of COVID-19’s impact on the overall economy, such as rising unemployment levels or changes in consumer behavior related to loans as well as government policies and pronouncements, borrowers may experience difficulties meeting their obligations or seek to forbear payment on or refinance their mortgage loans to avail themselves of lower rates. Elevated levels of delinquency or default would have an adverse impact on the value of our mortgage real estate related-assets. In addition to residential mortgage-related assets, the adverse economic conditions could negatively impact tenants on our commercial property assets and/or businesses in which we lend to in connection with our middle market lending activities, resulting in potential delinquencies, defaults or declines in asset values. To the extent current
ANNALY CAPITAL MANAGEMENT, INC. AND SUBSIDIARIES
Item 1A. Risk Factors
conditions persist or worsen, we expect there to be a negative effect on our results of operations, which may reduce earnings and, in turn, cash available for distribution to our stockholders. The continued spread of COVID-19 could also negatively impact the availability of key personnel necessary to conduct our business.
Financing Conditions
We may also experience more difficulty in our financing operations. COVID-19 has caused mortgage REITs to experience severe disruptions in financing operations (including the cost, attractiveness and availability of financing), especially the ability to utilize repurchase financing and the margin requirements related to such financing. The less liquid markets that make up a significant portion of our credit portfolio, including residential securities and whole loans, commercial real estate securities and loans and middle market lending, experienced significant disruption over this crisis period, marked by a sharp retraction in volumes and a lack of access to credit for borrowers. If conditions related to COVID-19 persist, we could experience an unwillingness or inability of our potential lenders to provide us with or renew financing, increased margin calls, and/or additional capital requirements. These conditions could force us to sell our assets at inopportune times or otherwise cause us to potentially revise our strategic business initiatives, which could adversely affect our business. To the extent the COVID-19 pandemic adversely affects our business and financial results, it may also have the effect of heightening many of the other risks described in this Annual Report on Form 10-K for the year ended December 31, 2020, such as our risks related to our use of leverage, management of our liquidity, exposure to counterparties, our ability to pay dividends in the future and our ability to protect our information technology networks and infrastructure from unauthorized access, misuse, malware, phishing and other events that could have a security impact as a result of our remote working environment or otherwise.
We cannot predict the effect that government policies, laws and plans adopted in response to the COVID-19 pandemic and global recessionary economic conditions will have on us.
The extent of the COVID-19-related disruptions and the duration of the pandemic as well as the long-term impacts of the social, economic, and financial disruptions caused by the COVID-19 pandemic are unknown at this time and may be severe.Governments have adopted, and we expect will continue to adopt, policies, laws and plans intended to address the COVID-19 pandemic and adverse developments in the credit, financial and mortgage markets. While the U.S. Federal Reserve, the U.S. government and other governments have implemented unprecedented financial support or relief measures in response to concerns surrounding the economic effects of the COVID-19 pandemic, the likelihood of such measures calming the volatility in the financial markets or addressing a long-term national or global economic downturn cannot be predicted and we cannot assure you that these programs will be effective or sufficient at addressing the adverse impacts of the pandemic or otherwise have a positive impact on our business.
Risks Related to Our Investing, Portfolio Management and Financing Activities
We may change our policies without stockholder approval.
Our Board has established very broad investment guidelines that may be amended from time to time. Our Board and management determine all of our significant policies, including our investment, financing, capital and asset allocation and distribution policies. They may amend or revise these policies at any time without a vote of our stockholders, or otherwise initiate a change in asset allocation. For example, in the first quarter of 2020, we proactively reduced the size of our Agency MBS portfolio in order to manage our leverage profile in response to COVID-19. Policy changes could adversely affect our financial condition, results of operations, the market price of our common stock or our ability to pay dividends or distributions.
Our strategy involves the use of leverage, which increases the risk that we may incur substantial losses.
We expect our leverage to vary with market conditions and our assessment of risk/return on investments. We incur this leverage by borrowing against a substantial portion of the market value of our assets. Leverage, which is fundamental to our investment strategy, creates significant risks. The risks associated with leverage are more acute during periods of economic slowdown or recession, which the U.S. economy has experienced in connection with the conditions created by the COVID-19 pandemic.
Because of our leverage, we may incur substantial losses if our borrowing costs increase, and we may be unable to execute our investment strategy if leverage is unavailable or is unavailable on attractive terms. The reasons our borrowing costs may increase or our ability to borrow may decline include, but are not limited to, the following:
•short-term interest rates increase;
•the market value of our investments available to collateralize borrowings decreases;
•the “haircut” applied to our assets under the repurchase agreements or other secured financing arrangements increases;
•interest rate volatility increases;
ANNALY CAPITAL MANAGEMENT, INC. AND SUBSIDIARIES
Item 1A. Risk Factors
•forced sales, particularly under adverse market conditions, such as those which occured as a result of the COVID-19 pandemic;
•there is a disruption in the repo market generally or the infrastructure that supports it; or
•the availability of financing in the market decreases.
Our leverage may cause margin calls and defaults and force us to sell assets under adverse market conditions.
Because of our leverage, a decline in the value of our interest earning assets may result in our lenders initiating margin calls. A margin call means that the lender requires us to pledge additional collateral to re-establish the ratio of the value of the collateral to the amount of the borrowing. Our fixed-rate mortgage-backed securities generally are more susceptible to margin calls as increases in interest rates tend to more negatively affect the market value of fixed-rate securities. Margin calls are most likely in market conditions in which the unencumbered assets that we would use to meet the margin calls have also decreased in value. The risks associated with margin calls are more acute during periods of economic slowdown or recession, which the U.S. economy has experienced in connection with the conditions created by the COVID-19 pandemic. We experienced margin calls much higher than historical norms during the onset of COVID-19.
If we are unable to satisfy margin calls, our lenders may foreclose on our collateral. This could force us to sell our interest earning assets under adverse market conditions, or allow lenders to sell those assets on our behalf at prices that could be below our estimation of their value. Additionally, in the event of our bankruptcy, our borrowings, which are generally made under repurchase agreements, may qualify for special treatment under the U.S. Bankruptcy Code. This special treatment would allow the lenders under these agreements to avoid the automatic stay provisions of the U.S. Bankruptcy Code and to liquidate the collateral under these agreements without delay.
We may exceed our target leverage ratios.
We generally expect to maintain an economic leverage ratio of less than 10:1. However, we are not required to stay below this economic leverage ratio. We may exceed this ratio by incurring additional debt without increasing the amount of equity we have. For example, if we increase the amount of borrowings under our master repurchase agreements with our existing or new counterparties or the market value of our portfolio declines, our economic leverage ratio would increase. If we increase our economic leverage ratio, the adverse impact on our financial condition and results of operations from the types of risks associated with the use of leverage would likely be more severe. Our target economic leverage ratio is set for the portfolio as a whole, rather than separately for each asset type. The economic leverage ratio on Agency mortgage-backed securities may exceed the target ratio for the portfolio as a whole. Because credit assets are generally less levered than Agency mortgage-backed securities, at a given economic leverage ratio an increased allocation to credit assets generally means an increase in economic leverage on Agency mortgage-backed securities. The economic leverage on our Agency mortgage-backed securities is the primary driver of the risk of being unable to meet margin calls discussed above.
We may not be able to achieve our optimal leverage.
We use leverage as a strategy to increase the return to our investors. However, we may not be able to achieve our desired leverage for any of the following reasons:
•we determine that the leverage would expose us to excessive risk;
•our lenders do not make funding available to us at acceptable rates; or
•our lenders require that we provide additional collateral to cover our borrowings.
Failure to procure or renew funding on favorable terms, or at all, would adversely affect our results and financial condition.
One or more of our lenders could be unwilling or unable to provide us with financing. This could potentially increase our financing costs and reduce our liquidity. Furthermore, if any of our potential lenders or existing lenders is unwilling or unable to provide us with financing or if we are not able to renew or replace maturing borrowings, we could be forced to sell our assets at an inopportune time when prices are depressed. Our business, results of operations and financial condition may be materially adversely affected by disruptions in the financial markets, including disruptions associated with the conditions created by the COVID-19 pandemic. We cannot assure you that, under such extreme conditions, these markets will remain an efficient source of financing for our assets. If our strategy is not viable, we will have to find alternative forms of financing for our assets, which may not be available. Further, as a REIT, we are required to distribute annually at least 90% of our REIT taxable income (subject to certain adjustments) to our stockholders and are, therefore, not able to retain significant amounts of our earnings for new investments. We cannot assure you that any, or sufficient, funding or capital will be available to us in the future on terms that are acceptable to us. If we cannot obtain sufficient funding on acceptable terms, there may be a negative impact on the
ANNALY CAPITAL MANAGEMENT, INC. AND SUBSIDIARIES
Item 1A. Risk Factors
market price of our common stock and our ability to make distributions to our stockholders. Moreover, our ability to grow will be dependent on our ability to procure additional funding. To the extent we are not able to raise additional funds through the issuance of additional equity or borrowings, our growth will be constrained.
Failure to effectively manage our liquidity would adversely affect our results and financial condition.
Our ability to meet cash needs depends on many factors, several of which are beyond our control. Ineffective management of liquidity levels could cause us to be unable to meet certain financial obligations. Potential conditions that could impair our liquidity include: unwillingness or inability of any of our potential lenders to provide us with or renew financing, margin calls, additional capital requirements applicable to our lenders, a disruption in the financial markets (especially in light of the disruption caused by the COVID-19 pandemic) or declining confidence in our reputation or in financial markets in general. These conditions could force us to sell our assets at inopportune times or otherwise cause us to potentially revise our strategic business initiatives.
Risk management policies and procedures may not adequately identify all risks to our businesses.
We have established and maintain risk management policies and procedures designed to support our risk framework, and to identify, measure, monitor and control financial risks. Risks include market risk (interest rate, spread and prepayment), liquidity risk, credit risk and operational risk.These policies and procedures may not sufficiently identify the full range of risks that we are or may become exposed to. Any changes to business activities, including expansion of traded or illiquid products, may result in our being exposed to different risks or an increase in certain risks. Our management may have less experience in identifying and managing the risks of new business activities. Any failure to identify and mitigate financial risks could result in an adverse impact to our financial condition, business or results of operations. Additionally, as regulations and markets in which we operate continue to evolve, our risk management policies and procedures may not always keep sufficient pace with those changes.
An increase or decrease in prepayment rates may adversely affect our profitability.
The mortgage-backed securities we acquire are backed by pools of mortgage loans. We receive payments, generally, from the payments that are made on the underlying mortgage loans. We often purchase mortgage-backed securities that have a higher coupon rate than the prevailing market interest rates. In exchange for a higher coupon rate, we typically pay a premium over par value to acquire these mortgage-backed securities. In accordance with U.S. generally accepted accounting principles (“GAAP”), we amortize the premiums on our mortgage-backed securities over the expected life of the related mortgage-backed securities. If the mortgage loans securing these mortgage-backed securities prepay at a more rapid rate than anticipated, we will have to amortize our premiums on an accelerated basis that may adversely affect our profitability.
Defaults on mortgage loans underlying Agency mortgage-backed securities typically have the same effect as prepayments because of the underlying Agency guarantee.
Prepayment rates generally increase when interest rates fall and decrease when interest rates rise, but changes in prepayment rates are difficult to predict. Prepayment rates also may be affected by conditions in the housing and financial markets, general economic conditions and the relative interest rates on fixed-rate and adjustable-rate mortgage loans. We may seek to minimize prepayment risk to the extent practical, and in selecting investments we must balance prepayment risk against other risks and the potential returns of each investment. No strategy can completely insulate us from prepayment risk. We may choose to bear increased prepayment risk if we believe that the potential returns justify the risk.
Conversely, a decline in prepayment rates on our investments will reduce the amount of principal we receive and therefore reduce the amount of cash we otherwise could have reinvested in higher yielding assets at that time, which could negatively impact our future operating results.
We are subject to reinvestment risk.
We also are subject to reinvestment risk as a result of changes in interest rates. Any significant decrease in economic activity or resulting decline in the housing market could have an adverse effect on our investments in mortgage-related assets. Declines in interest rates are generally accompanied by increased prepayments of mortgage loans, which in turn results in a prepayment of the related mortgage-backed securities. An increase in prepayments could result in the reinvestment of the proceeds we receive from such prepayments into lower yielding assets.Conversely, increases in interest rates are generally accompanied by decreased prepayments of mortgage loans, which could reduce our capital available to reinvest into higher-yielding assets.
ANNALY CAPITAL MANAGEMENT, INC. AND SUBSIDIARIES
Item 1A. Risk Factors
Volatile market conditions for mortgages and mortgage-related assets as well as the broader financial markets can result in a significant contraction in liquidity for mortgages and mortgage-related assets, which may adversely affect the value of the assets in which we invest.
Our results of operations are materially affected by conditions in the markets for mortgages and mortgage-related assets, including Agency mortgage-backed securities, as well as the broader financial markets and the economy generally.
Significant adverse changes in financial market conditions can result in a deleveraging of the global financial system and the forced sale of large quantities of mortgage-related and other financial assets. Concerns over economic recession, COVID-19 or other pandemic diseases, geopolitical issues including events such as the United Kingdom’s recent exit from the European Union (commonly referred to as “Brexit”), trade wars, unemployment, the availability and cost of financing, the mortgage market, the repurchase agreement market and a declining real estate market or prolonged government shutdown may contribute to increased volatility and diminished expectations for the economy and markets. Increased market uncertainty and instability in light of the COVID-19 pandemic in both U.S. and international capital and credit markets, combined with declines in business and consumer confidence and increased unemployment, have also contributed to volatility in domestic and international markets.
For example, as a result of the financial crises beginning in the summer of 2007 and through the subsequent credit and housing crisis, many traditional mortgage investors suffered severe losses in their residential mortgage portfolios and several major market participants failed or were impaired, resulting in a significant contraction in market liquidity for mortgage-related assets. This illiquidity negatively affected both the terms and availability of financing for all mortgage-related assets. Additionally, the recession resulting from the COVID-19 pandemic could be more protracted than the recession caused by the financial crisis, which could result in a significant rise in delinquencies and defaults on mortgage-related assets and further negatively impact market liquidity for mortgage-related assets.
Further increased volatility and deterioration in the markets for mortgages and mortgage-related assets as well as the broader financial markets may adversely affect the performance and market value of our Agency mortgage-backed securities. If these conditions exist, institutions from which we seek financing for our investments may tighten their lending standards or become insolvent, which could make it more difficult for us to obtain financing on favorable terms or at all. Our profitability and financial condition may be adversely affected if we are unable to obtain cost-effective financing for our investments.
Competition may limit our ability to acquire desirable investments in our target assets and could also affect the pricing of these assets.
We operate in a highly competitive market for investment opportunities. Our profitability depends, in large part, on our ability to acquire our target assets at attractive prices. In acquiring our target assets, we will compete with a variety of institutional investors, including other REITs, specialty finance companies, public and private funds, government entities, commercial and investment banks, commercial finance and insurance companies and other financial institutions. Many of our competitors are substantially larger and have considerably greater financial, technical, technological, marketing and other resources than we do. Other REITs with investment objectives that overlap with ours may elect to raise significant amounts of capital, which may create additional competition for investment opportunities. Some competitors may have a lower cost of funds and access to funding sources that may not be available to us. Many of our competitors are not subject to the operating constraints associated with REIT compliance or maintenance of an exemption from the Investment Company Act. In addition, some of our competitors may have higher risk tolerances or different risk assessments, which could allow them to consider a wider variety of investments and establish more relationships than us. Furthermore, competition for investments in our target assets may lead to the price of such assets increasing, which may further limit our ability to generate desired returns. We cannot provide assurance that the competitive pressures we face will not have a material adverse effect on our business, financial condition and results of operations. Also, as a result of this competition, desirable investments in our target assets may be limited in the future and we may not be able to take advantage of attractive investment opportunities from time to time, as we can provide no assurance that we will be able to identify and make investments that are consistent with our investment objectives.
An increase in the interest payments on our borrowings relative to the interest we earn on our interest earning assets may adversely affect our profitability.
We generally earn money based upon the spread between the interest payments we earn on our interest earning assets and the interest payments we must make on our borrowings. If the interest payments on our borrowings increase relative to the interest we earn on our interest earning assets, our profitability may be adversely affected. A significant portion of our assets are longer-term, fixed-rate interest earning assets, and a significant portion of our borrowings are shorter-term, floating-rate borrowings. Periods of rising interest rates or a relatively flat or inverted yield curve could decrease or eliminate the spread between the interest payments we earn on our interest earning assets and the interest payments we must make on our borrowings.
ANNALY CAPITAL MANAGEMENT, INC. AND SUBSIDIARIES
Item 1A. Risk Factors
Differences in timing of interest rate adjustments on our interest earning assets and our borrowings may adversely affect our profitability.
We rely primarily on short-term borrowings to acquire interest earning assets with long-term maturities. Some of the interest earning assets we acquire are adjustable-rate interest earning assets. This means that their interest rates may vary over time based upon changes in an objective index, such as:
•LIBOR. The rate banks charge each other for short-term Eurodollar loans.
•Treasury Rate. A monthly or weekly average yield of benchmark U.S. Treasury securities, as published by the Federal Reserve Board.
•Secured Overnight Financing Rate. A measure of the cost of borrowing cash overnight collateralized by U.S. Treasury securities, as published by the Federal Reserve Bank of New York.
These indices generally reflect short-term interest rates. The interest rates on our borrowings similarly reflect short-term interest rates. Nevertheless, the interest rates on our borrowings generally adjust more frequently than the interest rates on our adjustable-rate interest earning assets, which are also typically subject to periodic and lifetime interest rate caps. Accordingly, in a period of rising interest rates, we could experience a decrease in net income or a net loss because the interest rates on our borrowings adjust faster than the interest rates on our adjustable-rate interest earning assets.
Changes in the method pursuant to which LIBOR is determined and potential discontinuation of LIBOR may affect our results.
LIBOR and other indices which are deemed “benchmarks” are the subject of recent national, international, and other regulatory guidance and proposals for reform. These reforms may cause such benchmarks to perform differently than in the past, or have other consequences which cannot be predicted. In particular, regulators and law enforcement agencies in the U.K. and elsewhere conducted criminal and civil investigations into whether the banks that contributed information to the British Bankers’ Association (“BBA”) in connection with the daily calculation of various LIBOR rates (“LIBOR rates”) may have been under-reporting or otherwise manipulating or attempting to manipulate LIBOR rates. A number of BBA member banks have entered into settlements with their regulators and law enforcement agencies with respect to this alleged manipulation of LIBOR rates. LIBOR rates are calculated by reference to a market for interbank lending that continues to shrink, as it is based on increasingly fewer actual transactions. This increases the subjectivity of the calculation process and increases the risk of manipulation. Actions by the regulators or law enforcement agencies, as well as ICE Benchmark Administration (the current administrator), are expected to result in changes to the manner in which LIBOR rates are determined or the establishment of alternative reference rates. For example, on July 27, 2017, the U.K. Financial Conduct Authority announced that it intends to stop persuading or compelling banks to submit LIBOR rates after 2021.
It is not possible to predict the effect of these changes, other reforms, or the establishment of alternative reference rates in the United Kingdom or elsewhere. Furthermore, in the U.S., efforts to identify a set of U.S. dollar reference interest rates include proposals by the Alternative Reference Rates Committee of the Federal Reserve Board and the Federal Reserve Bank of New York. The U.S. Federal Reserve, in conjunction with the Alternative Reference Rates Committee, a steering committee comprised of large U.S. financial institutions, is considering replacing U.S. dollar LIBOR with the Secured Overnight Financing Rate (“SOFR”), a new index calculated by short-term repurchase agreements, backed by Treasury securities. The Federal Reserve Bank of New York began publishing SOFR rates in April 2018.
It is likely that U.S. Dollar LIBOR (“USD-LIBOR”) will be replaced by SOFR published by the Federal Reserve Bank of New York. The manner and timing of this shift is not known with certainty. It is possible, but unlikely, that USD-LIBOR will be used in new instruments created after 2021. Global regulators expect that the most-used tenors of USD-LIBOR will continue to be published through June 2023, but are encouraging regulated institutions to make the shift earlier. For each existing LIBOR-based instrument, the manner and timing of the switch depends on the terms of the relevant contract and the specifics of future events. The market transition away from LIBOR and towards SOFR is expected to be gradual and complicated. Any of these alternative methods may result in interest rates that are higher than if LIBOR were available in its current form, which could have a material adverse effect on results.
SOFR is not an exact replacement for USD-LIBOR. USD-LIBOR accounts for bank credit risk, while SOFR does not. Therefore, LIBOR and SOFR are expected to behave differently at times when market participants are concerned about the financial strength of banks. Also, SOFR is an overnight rate instead of a term rate. There is currently no perfect way to create robust, forward-looking SOFR term rates. A large and liquid market in SOFR-based futures could eventually lead to the ability to calculate forward-looking SOFR term rates, but currently the SOFR-based futures market is small relative to LIBOR-based futures markets. Regulators and other members of the Alternative Reference Rates Committee (“ARRC”) have indicated that market participants should stop using USD-LIBOR now, despite the unavailability of a forward-looking SOFR term rate.
ANNALY CAPITAL MANAGEMENT, INC. AND SUBSIDIARIES
Item 1A. Risk Factors
However, a large majority of new issuance of floating-rate instruments, including some transactions in which we are issuer or sponsor, still reference USD-LIBOR.
Regulators and other members of the ARRC have also indicated that all instruments that reference USD-LIBOR should include robust fallbacks. The ARRC has published fallbacks for several asset types, and the International Swaps and Derivatives Association (“ISDA”) has prepared documentation to implement fallbacks for derivatives.
Switching existing financial instruments and hedging transactions from LIBOR to SOFR requires calculations of a spread. ISDA has described the spread calculation methodology that will apply to derivatives that adopt the ISDA recommendations for derivatives. The spread calculation methodology for non-derivatives is currently not known. The spread calculation is intended to minimize value transfer between counterparties, borrowers, and lenders, but there is no assurance that the calculated spread will be fair and accurate.
The fallbacks recommended by the ARRC are different for various non-derivative instruments, and not all USD-LIBOR-based instruments will incorporate the recommended fallbacks. This could result in unexpected differences between our USD-LIBOR-based assets and our USD-LIBOR-based interest rate hedges.
Many existing USD-LIBOR-based instruments either do not contemplate the discontinuation of LIBOR, provide a fallback that in practice will make the instrument fixed-rate, or provide a fallback that one party may believe is contrary to the contractual intent. We have adhered to the ISDA 2020 IBOR Fallbacks Protocol, but may incur costs amending instruments not covered by that Protocol or by clearinghouse rulebooks to implement fallbacks recommended by the ARRC. We may decide not to amend, in which case we may bear the cost and risk of litigation. Some instruments, particularly consumer-facing adjustable-rate mortgages, are impractical to amend. With respect to those instruments, we may bear the cost and risk of litigation. Our lenders may be less willing to extend credit secured by assets that do not include robust fallbacks.
We and other market participants have less experience understanding and modeling SOFR-based assets and liabilities than LIBOR-based assets and liabilities, increasing the difficulty of investing, hedging, and risk management. Because the impact of USD-LIBOR cessation is dependent on unknown future facts, the language of individual contracts, and the outcome of potential future litigation, it is not currently practical for our valuation models to account for the cessation of LIBOR. We use service providers to validate the fair values of certain financial instruments. We are not aware of those service providers accounting for the cessation of LIBOR in their pricing models.
The process of transition involves operational risks. References to USD-LIBOR may be embedded in computer code or models, and we may not identify and correct all of those references. Because compounded SOFR is backward-looking rather than forward-looking, parties making or receiving USD-LIBOR-based payments may be unable to calculate payment amounts until the day that payment is due. Proposed mechanisms to solve the operational timing issue may result in a payment amount that does not fully reflect interest rates during the calculation period.
It is also possible that USD-LIBOR will continue to be published without being representative of any underlying market, meaning that some instruments would continue to be subject to the weaknesses of the LIBOR calculation process. A rate may also be published that continues to be named USD-LIBOR and therefore continues to be used for certain contracts, but is calculated pursuant to an entirely different methodology. Preparing for and addressing the cessation of USD-LIBOR cessation may require significant time and resources.
Holders of our fixed-to-floating preferred shares should refer to the relevant prospectus to understand the USD-LIBOR-cessation provisions applicable to that class. We do not currently intend to amend any classes of our fixed-to-floating preferred shares to change the existing USD-LIBOR cessation fallbacks. Each such class that is currently outstanding becomes callable at the same time it begins to pay a USD-LIBOR-based rate. Should we choose to call a class of preferred shares in order to avoid a dispute over the results of the USD-LIBOR fallbacks for that class, we may be forced to raise additional funds at an unfavorable time.
An increase in interest rates may adversely affect the market value of our interest earning assets and, therefore, also our book value.
Increases in interest rates may negatively affect the market value of our interest earning assets because in a period of rising interest rates, the value of certain interest earning assets may fall and reduce our book value. For example, our fixed-rate interest earning assets are generally negatively affected by increases in interest rates because in a period of rising rates, the coupon we earn on our fixed-rate interest earning assets would not change. Our book value would be reduced by the amount of a decline in the market value of our interest earning assets.
We may experience declines in the market value of our assets resulting in us recording impairments, which may have an adverse effect on our results of operations and financial condition.
ANNALY CAPITAL MANAGEMENT, INC. AND SUBSIDIARIES
Item 1A. Risk Factors
A decline in the market value of our mortgage-backed securities or other assets may require us to recognize an “other-than-temporary” impairment (“OTTI”) against such assets under GAAP. For a discussion of the assessment of OTTI, see the section titled “Significant Accounting Policies” in the Notes to the Consolidated Financial Statements included in Item 15. “Exhibits, Financial Statement Schedules.” The determination as to whether an OTTI exists and, if so, the amount we consider other-than-temporarily impaired is subjective, as such determinations are based on both factual and subjective information available at the time of assessment. As a result, the timing and amount of OTTI constitute material estimates that are susceptible to significant change.
The soundness of other financial institutions could adversely affect us.
Financial services institutions are interrelated as a result of trading, clearing, counterparty, borrower, or other relationships. We have exposure to many different counterparties, and routinely execute transactions with counterparties in the financial services industry, including brokers and dealers, commercial banks, investment banks, mutual and hedge funds, and other financial institutions. Many of these transactions expose us to credit or counterparty risk in the event of default of our counterparty or, in certain instances, our counterparty’s customers. Such credit risk could be heightened in respect of our European counterparties due to continuing uncertainty in the global finance market, including Brexit. There is no assurance that any such losses would not materially and adversely impact our revenues, financial condition and earnings.
Our hedging strategies may be costly, and may not hedge our risks as intended.
Our policies permit us to enter into interest rate swaps, caps and floors, interest rate swaptions, interest rate futures, and other derivative transactions to help us mitigate our interest rate and prepayment risks described above subject to maintaining our qualification as a REIT and our Investment Company Act exemption. We have used interest rate swaps and options to enter into interest rate swaps (commonly referred to as interest rate swaptions) to provide a level of protection against interest rate risks. We may also purchase or sell TBAs on Agency mortgage-backed securities, purchase or write put or call options on TBAs and invest in other types of mortgage derivatives, such as interest-only securities. No hedging strategy can protect us completely. Entering into interest rate hedging may fail to protect or could adversely affect us because, among other things: interest rate hedging can be expensive, particularly during periods of volatile interest rates; available hedges may not correspond directly with the risk for which protection is sought; and the duration of the hedge may not match the duration of the related asset or liability. The expected transition from LIBOR to alternative reference rates adds additional complication to our hedging strategies.
Our use of derivatives may expose us to counterparty and liquidity risks.
The Dodd-Frank Act, and regulations under it, have caused significant changes to the structure of the market for interest rate swaps and swaptions. These new structures change, but do not eliminate, the risks we face in our hedging activities.
Most swaps that we enter into must be cleared by a Derivatives Clearing Organization (“DCO”). DCOs are subject to regulatory oversight, use extensive risk management processes, and might receive “too big to fail” support from the government in the case of insolvency. We access the DCO through several Futures Commission Merchants (“FCMs”). For any cleared swap, we bear the credit risk of both the DCO and the relevant FCM, in the form of potential late or unrecoverable payments, potential difficulty or delay in accessing collateral that we have posted, and potential loss of any positive market value of the swap position. In the event of a default by the DCO or FCM, we also bear market risk, because the asset or liability being hedged is no longer effectively hedged.
Most swaps must be or are traded on a Swap Execution Facility. We bear additional fees for use of the DCO. We also bear fees for use of the Swap Execution Facility. We continue to bear risk of trade errors. Because the standardized swaps available on Swap Execution Facilities and cleared through DCOs are not as customizable as the swaps available before the implementation of Dodd-Frank Act, we may bear additional basis risk from hedge positions that do not exactly reflect the interest rate risk on the asset being hedged.
Futures transactions are subject to risks analogous to those of cleared swaps, except that for futures transactions we bear a higher risk that collateral we have posted is unavailable to us if the FCM defaults.
Some derivatives transactions, such as swaptions, are not currently required to be cleared through a DCO. Therefore, we bear the credit risk of the dealer with which we executed the swaption. TBA contracts and swaps on CMBX indexes are also not cleared, and we bear the credit risk of the dealer.
Derivative transactions are subject to margin requirements. The relevant contract or clearinghouse rules dictate the method of determining the required amount of margin, the types of collateral accepted and the timing required to meet margin calls.
ANNALY CAPITAL MANAGEMENT, INC. AND SUBSIDIARIES
Item 1A. Risk Factors
Additionally, for cleared swaps and futures, FCMs may have the right to require more margin than the clearinghouse requires. The requirement to meet margin calls can create liquidity risks, and we bear the cost of funding the margin that we post. Also, as discussed above, we bear credit risk if a dealer, FCM, or clearinghouse is holding collateral we have posted.
Generally, we attempt to retain the ability to close out of a hedging position or create an offsetting position. However, in some cases we may not be able to do so at economically viable prices, or we may be unable to do so without consent of the counterparty. Therefore, in some situations a derivative position can be illiquid, forcing us to hold it to its maturity or scheduled termination date.
It is possible that new regulations could be issued governing the derivatives market, or that additional types of derivatives switch to being executed on Swap Execution Facilities or cleared on a DCO. Ongoing regulatory change in this area could increase costs, increase risks, and adversely affect our business and results of operations.
It may be uneconomical to "roll" our TBA dollar roll transactions or we may be unable to meet margin calls on our TBA contracts, which could negatively affect our financial condition and results of operations.
From time to time, we enter into TBAs as an alternate means of investing in and financing Agency mortgage-backed securities. A TBA contract is an agreement to purchase or sell, for future delivery, an Agency mortgage-backed security with a specified issuer, term and coupon. A TBA dollar roll represents a transaction where TBA contracts with the same terms but different settlement dates are simultaneously bought and sold. The TBA contract settling in the later month typically prices at a discount to the earlier month contract with the difference in price commonly referred to as the “drop”. The drop is a reflection of the expected net interest income from an investment in similar Agency mortgage-backed securities, net of an implied financing cost, that would be foregone as a result of settling the contract in the later month rather than in the earlier month. The drop between the current settlement month price and the forward settlement month price occurs because in the TBA dollar roll market, the party providing the implied financing is the party that would retain all principal and interest payments accrued during the financing period. Accordingly, TBA dollar roll income generally represents the economic equivalent of the net interest income earned on the underlying Agency mortgage-backed security less an implied financing cost. Consequently, dollar roll transactions and such forward purchases of Agency securities represent a form of off-balance sheet financing and increase our "at risk" leverage.
The economic return of a TBA dollar roll generally equates to interest income on a generic TBA-eligible security less an implied financing cost, and there may be situations in which the implied financing cost exceeds the interest income, resulting in a negative carry on the position. If we roll our TBA dollar roll positions when they have a negative carry, the positions would decrease net income and amounts available for distributions to shareholders.
There may be situations in which we are unable or unwilling to roll our TBA dollar roll positions. The TBA transaction could have a negative carry or otherwise be uneconomical, we may be unable to find counterparties with whom to trade in sufficient volume, or we may be required to collateralize the TBA positions in a way that is uneconomical. Because TBA dollar rolls represent implied financing, an inability orunwillingness to roll has effects similar to any other loss of financing. If we do not roll our TBA positions prior to the settlement date, we would have to take physical delivery of the underlying securities and settle our obligations for cash. We may not have sufficient funds or alternative financing sources available to settle such obligations. Counterparties may also make margin calls as the value of a generic TBA-eligible security (and therefore the value of the TBA contract) declines. Margin calls on TBA positions or failure to roll TBA positions could have the effects described in the liquidity risks described above.
We use analytical models and data in connection with the valuation of our assets, and any incorrect, misleading or incomplete information used in connection therewith would subject us to potential risks.
Given our strategies and the complexity of the valuation of our assets, we must rely heavily on analytical models (both proprietary models developed by us and those supplied by third parties) and information and data supplied by our third party vendors and servicers. Models and data are used to value assets or potential asset purchases and also in connection with hedging our assets. When models and data prove to be incorrect, misleading or incomplete, any decisions made in reliance thereon expose us to potential risks. For example, by relying on models and data, especially valuation models, we may be induced to buy certain assets at prices that are too high, to sell certain other assets at prices that are too low or to miss favorable opportunities altogether. Similarly, any hedging based on faulty models and data may prove to be unsuccessful. Furthermore, despite our valuation validation processes our models may nevertheless prove to be incorrect.
Some of the risks of relying on analytical models and third-party data are particular to analyzing tranches from securitizations, such as commercial or residential mortgage-backed securities. These risks include, but are not limited to, the following: (i) collateral cash flows and/or liability structures may be incorrectly modeled in all or only certain scenarios, or may be modeled
ANNALY CAPITAL MANAGEMENT, INC. AND SUBSIDIARIES
Item 1A. Risk Factors
based on simplifying assumptions that lead to errors; (ii) information about collateral may be incorrect, incomplete, or misleading; (iii) collateral or bond historical performance (such as historical prepayments, defaults, cash flows, etc.) may be incorrectly reported, or subject to interpretation (e.g., different issuers may report delinquency statistics based on different definitions of what constitutes a delinquent loan); or (iv) collateral or bond information may be outdated, in which case the models may contain incorrect assumptions as to what has occurred since the date information was last updated.
Some of the analytical models used by us, such as mortgage prepayment models or mortgage default models, are predictive in nature. The use of predictive models has inherent risks. For example, such models may incorrectly forecast future behavior, leading to potential losses on a cash flow and/or a mark-to-market basis. In addition, the predictive models used by us may differ substantially from those models used by other market participants, with the result that valuations based on these predictive models may be substantially higher or lower for certain assets than actual market prices. Furthermore, since predictive models are usually constructed based on historical data supplied by third parties, the success of relying on such models may depend heavily on the accuracy and reliability of the supplied historical data and the ability of these historical models to accurately reflect future periods. Additionally, such models may be more prone to inaccuracies in light of the unprecedented conditions created by the COVID-19 pandemic. In particular, the economic, financial and related impacts of COVID-19 is and will be very difficult to model (including as related to the housing and mortgage markets), as the catalyst for these conditions (i.e., a global pandemic) is an event that is unparalleled in modern history and therefore is subject to wide variables, assumptions and inputs. Therefore, historical data used in analytical models may be less reliable in predicting future conditions. Further, the conditions created by COVID-19 have increased volatility across asset classes. Extreme volatility in any asset class, including real estate and mortgage-related assets, increases the likelihood of analytical models being inaccurate as market participants attempt to value assets that have frequent, significant swings in pricing.
Many of the models we use include LIBOR as an input. The expected transition away from LIBOR may require changes to models, may change the underlying economic relationships being modeled, and may require the models to be run with less historical data than is currently available for LIBOR. We may incorrectly value LIBOR-based instruments because our models do not currently account for LIBOR cessation.
All valuation models rely on correct market data inputs. If incorrect market data is entered into even a well-founded valuation model, the resulting valuations will be incorrect. However, even if market data is inputted correctly, “model prices” will often differ substantially from market prices, especially for securities with complex characteristics, such as derivative instruments or structured notes.
Accounting rules related to certain of our transactions are highly complex and involve significant judgment and assumptions, and changes in accounting treatment may adversely affect our profitability and impact our financial results. Additionally, our application of GAAP may produce financial results that fluctuate from one period to another.
Accounting rules for valuations of investments, mortgage loan sales and securitizations, investment consolidations, acquisitions of real estate and other aspects of our operations are highly complex and involve significant judgment and assumptions. These complexities could lead to a delay in preparation of financial information and the delivery of this information to our stockholders. Changes in accounting interpretations or assumptions could impact our financial statements and our ability to prepare our financial statements in a timely fashion. Our inability to prepare our financial statements in a timely fashion in the future would likely adversely affect our share price significantly. The fair value at which our assets may be recorded may not be an indication of their realizable value. Ultimate realization of the value of an asset depends to a great extent on economic and other conditions. Further, fair value is only an estimate based on good faith judgment of the price at which an investment can be sold since market prices of investments can only be determined by negotiation between a willing buyer and seller. If we were to liquidate a particular asset, the realized value may be more than or less than the amount at which such asset was recorded. Accordingly, the value of our common shares could be adversely affected by our determinations regarding the fair value of our investments, whether in the applicable period or in the future. Additionally, such valuations may fluctuate over short periods of time.
We have made certain accounting elections which may result in volatility in our periodic net income, as computed in accordance with GAAP. For example, changes in fair value of certain instruments are reflected in GAAP net income (loss) while others are reflected in Other comprehensive income (loss).
We are highly dependent on information systems and third parties, and systems failures or cybersecurity incidents could significantly disrupt our business, which may, in turn, negatively affect the market price of our common stock and our ability to operate our business.
Our business is highly dependent on communications and information systems. Any failure or interruption of our systems or cyber-attacks or security breaches of our networks or systems could cause delays or other problems in our securities trading
ANNALY CAPITAL MANAGEMENT, INC. AND SUBSIDIARIES
Item 1A. Risk Factors
activities, including mortgage-backed securities trading activities. A disruption or breach could also lead to unauthorized access to and release, misuse, loss or destruction of our confidential information or personal or confidential information of our employees or third parties, which could lead to regulatory fines, costs of remediating the breach, reputational harm, financial losses, litigation and increased difficulty doing business with third parties that rely on us to meet their own data protection requirements. In addition, we also face the risk of operational failure, termination or capacity constraints of any of the third parties with which we do business or that facilitate our business activities, including clearing agents or other financial intermediaries we use to facilitate our securities transactions, if their respective systems experience failure, interruption, cyber-attacks, or security breaches. Certain third parties provide information needed for our financial statements that we cannot obtain or verify from other sources. If one of those third parties experiences a system failure or cybersecurity incident, we may not have access to that information or may not have confidence in its accuracy. We may face increased costs as we continue to evolve our cyber defenses in order to contend with changing risks. These costs and losses associated with these risks are difficult to predict and quantify, but could have a significant adverse effect on our operating results. Additionally, the legal and regulatory environment surrounding information privacy and security in the U.S. and international jurisdictions is constantly evolving. New business initiatives have increased, and may continue to increase, the extent to which we are subject to such U.S. and international information privacy and security regulations. In addition, due to the transition to remote working environments as a result of the COVID-19 pandemic, there is an elevated risk of such events occurring.
Computer malware, viruses, computer hacking and phishing attacks have become more prevalent in our industry and we are from time to time subject to such attempted attacks. We rely heavily on our financial, accounting and other data processing systems. Although we have not detected a material cybersecurity breach to date, other financial institutions have reported material breaches of their systems, some of which have been significant. Even with all reasonable security efforts, not every breach can be prevented or even detected. It is possible that we have experienced an undetected breach. There is no assurance that we, or the third parties that facilitate our business activities, have not or will not experience a breach. We may be held responsible if certain third parties that facilitate our business activities experience a breach. It is difficult to determine what, if any, negative impact may directly result from any specific interruption or cyber-attacks or security breaches of our networks or systems (or the networks or systems of third parties that facilitate our business activities) or any failure to maintain performance, reliability and security of our technical infrastructure, but such computer malware, viruses, and computer hacking and phishing attacks may negatively affect our operations.
Our use of non-recourse securitizations may expose us to risks which could result in losses to us.
We utilize non-recourse securitizations of our assets in mortgage loans, especially loans that we originate, when they are available. Prior to any such financing, we may seek to finance assets with relatively short-term facilities until a sufficient portfolio is accumulated. As a result, we would be subject to the risk that we would not be able to acquire, during the period that any short-term facilities are available, sufficient eligible assets to maximize the efficiency of a securitization. We also would bear the risk that we would not be able to obtain a new short-term facility or would not be able to renew any short-term facilities after they expire should we need more time to seek and acquire sufficient eligible assets for a securitization. In addition, conditions in the capital markets, including potential volatility and disruption in the capital and credit markets, may not permit a non-recourse securitization at any particular time or may make the issuance of any such securitization less attractive to us even when we do have sufficient eligible assets. While we would intend to retain the non-investment grade tranches of securitizations and, therefore, still have exposure to any assets included in such securitizations, our inability to enter into such securitizations would increase our overall exposure to risks associated with direct ownership of such assets, including the risk of default. Our inability to refinance any short-term facilities would also increase our risk because borrowings thereunder would likely be recourse to us as an entity. If we are unable to obtain and renew short-term facilities or to consummate securitizations to finance our assets on a long-term basis, we may be required to seek other forms of potentially less attractive financing or to liquidate assets at an inopportune time or price. To the extent that we are unable to obtain financing for our assets, to the extent that we retain such assets in our portfolio, our returns on investment and earnings will be negatively impacted.
Securitizations expose us to additional risks.
In a securitization structure, we convey a pool of assets to a special purpose vehicle, the issuing entity, and in turn the issuing entity issues one or more classes of non-recourse notes pursuant to the terms of an indenture. The notes are secured by the pool of assets. In exchange for the transfer of assets to the issuing entity, we receive the cash proceeds of the sale of non-recourse notes and a 100% interest in certain subordinate interests of the issuing entity. The securitization of all or a portion of our commercial or residential loan portfolio might magnify our exposure to losses because any subordinate interest we retain in the issuing entity would be subordinate to the notes issued to investors and we would, therefore, absorb all of the losses sustained with respect to a securitized pool of assets before the owners of the notes experience any losses. Moreover, we cannot assure you that we will be able to access the securitization market or be able to do so at favorable rates (particularly in light of the
ANNALY CAPITAL MANAGEMENT, INC. AND SUBSIDIARIES
Item 1A. Risk Factors
unpredictable impact of the COVID-19 pandemic on the securitization markets). The inability to securitize our portfolio could adversely affect our performance and our ability to grow our business.
Counterparties may require us to enter into restrictive covenants relating to our operations that may inhibit our ability to grow our business and increase revenues.
If or when we obtain debt financing, lenders (especially in the case of credit facilities) may impose restrictions on us that would affect our ability to incur additional debt, make certain allocations or acquisitions, reduce liquidity below certain levels, make distributions to our stockholders, or redeem debt or equity securities, and may impact our flexibility to determine our operating policies and strategies. We may sell assets or reduce leverage at an inopportune time to avoid breaching these restrictions. If we fail to meet or satisfy any of these covenants, we would be in default under these agreements, and our lenders could elect to declare outstanding amounts due and payable, terminate their commitments, require the posting of additional collateral and enforce their interests against existing collateral. We may also be subject to cross-default and acceleration rights and, with respect to collateralized debt, the posting of additional collateral and foreclosure rights upon default. A default and resulting repayment acceleration could significantly reduce our liquidity, which could require us to sell our assets to repay amounts due and outstanding. This could also significantly harm our business, financial condition, results of operations and ability to make distributions, which could cause our share price to decline. A default could also significantly limit our financing alternatives such that we would be unable to pursue our leverage strategy, which could adversely affect our returns.
We may enter into new lines of business, acquire other companies or engage in other strategic initiatives, each of which may result in additional risks and uncertainties in our businesses.
We may pursue growth through acquisitions of other companies or other strategic initiatives. To the extent we pursue strategic investments or acquisitions, undertake other strategic initiatives or consider new lines of business, we will face numerous risks and uncertainties, including risks associated with:
•the availability of suitable opportunities;
•the level of competition from other companies that may have greater financial resources;
•our ability to assess the value, strengths, weaknesses, liabilities and potential profitability of potential acquisition opportunities accurately and negotiate acceptable terms for those opportunities;
•the required investment of capital and other resources;
•the lack of availability of financing and, if available, the terms of any financings;
•the possibility that we have insufficient expertise to engage in such activities profitably or without incurring inappropriate amounts of risk;
•the diversion of management’s attention from our core businesses;
•the potential loss of key personnel of an acquired business;
•assumption of liabilities in any acquired business;
•the disruption of our ongoing businesses;
•the increasing demands on or issues related to the combining or integrating operational and management systems and controls;
•compliance with additional regulatory requirements;
•costs associated with integrating and overseeing the operations of the new businesses;
•failure to realize the full benefits of an acquisition, including expected synergies, cost savings, or sales or growth opportunities, within the anticipated timeframe or at all; and
•post-acquisition deterioration in an acquired business that could result in lower or negative earnings contribution and/or goodwill impairment charges.
Entry into certain lines of business may subject us to new laws and regulations with which we are not familiar, or from which we are currently exempt, and may lead to increased litigation and regulatory risk. The decision to increase or decrease investments within a line of business may lead to additional risks and uncertainties. In addition, if a new or acquired business generates insufficient revenues or if we are unable to efficiently manage our expanded operations, our results of operations will be adversely affected. Our strategic initiatives may include joint ventures, in which case we will be subject to additional risks and uncertainties in that we may be dependent upon, and subject to liability, losses or reputational damage relating to systems, controls and personnel that are not under our control.
We are subject to risks and liabilities in connection with sponsoring, investing in and managing new funds and other investment accounts, including potential regulatory risks.
ANNALY CAPITAL MANAGEMENT, INC. AND SUBSIDIARIES
Item 1A. Risk Factors
We have, and may in the future, sponsor, manage and serve as general partner and/or manager of new funds or investment accounts, including collateralized loan obligations (“CLO”). Such sponsorship and management of, and investment in, such funds and accounts may involve risks not otherwise present with a direct investment in such funds, and accounts’ target investments, including, for example:
•the possibility that investors in the funds/accounts might become bankrupt or otherwise be unable to meet their capital commitment obligations;
•that operating and/or management agreements of a fund/account may restrict our ability to transfer or liquidate our interest when we desire or on advantageous terms;
•that our relationships with the investors will be generally contractual in nature and may be terminated or dissolved under the terms of the agreements, or we may be removed as general partner and/or manager (with or without cause), and in such event, we may not continue to manage or invest in the applicable fund/account;
•that disputes between us and the investors may result in litigation or arbitration that would increase our expenses and prevent our officers and directors from focusing their time and effort on our business and result in subjecting the investments owned by the applicable fund/account to additional risk; and
•that we may incur liability for obligations of a fund/account by reason of being its general partner or manager.
Further, in relation to our operations, we have a subsidiary that is registered with the SEC as an investment adviser under the Investment Advisers Act. As a result, we are subject to the anti-fraud provisions of the Investment Advisers Act and to fiduciary duties derived from these provisions that apply to our relationships with that subsidiary’s clients. These provisions and duties impose restrictions and obligations on us with respect to our dealings with our subsidiary’s clients, including, for example, restrictions on agency, cross and principal transactions. Our registered investment adviser subsidiary is subject to periodic SEC examinations and other requirements under the Investment Advisers Act and related regulations primarily intended to benefit advisory clients. These additional requirements relate to, among other things, maintaining an effective and comprehensive compliance program, recordkeeping and reporting requirements and disclosure requirements. The Investment Advisers Act generally grants the SEC broad administrative powers, including the power to limit or restrict an investment adviser from conducting advisory activities in the event it fails to comply with federal securities laws. Additional sanctions that may be imposed for failure to comply with applicable requirements under the Investment Advisers Act include the prohibition of individuals from associating with an investment adviser, the revocation of registrations and other censures and fines. We may in the future be required to register one or more entities as a commodity pool operator or commodity trading adviser, subjecting those entities to the regulations and oversight of the Commodity Futures Trading Commission and the National Futures Association. We may also become subject to various international regulations on the asset management industry.
Investments in MSRs may expose us to additional risks.
We invest in financial instruments whose cash flows are considered to be largely dependent on underlying MSRs that either directly or indirectly act as collateral for the investment. We expect to increase our exposure to MSR-related investments in 2021. Generally, we have the right to receive certain cash flows from the owner of the MSRs that are generated from the servicing fees and/or excess servicing spread associated with the MSRs. While we do not directly own MSRs, our investments in MSR-related assets indirectly expose us to risks associated with MSRs, including the following:
•Investments in MSRs are highly illiquid and subject to numerous restrictions on transfer and, as a result, there is risk that we would be unable to locate a willing buyer or get required approval to sell MSRs in the future should we desire to do so.
•Our rights to the excess servicing spread are subordinate to the interests of Fannie Mae, Freddie Mac and Ginnie Mae, and are subject to extinguishment. Fannie Mae and Freddie Mac each require approval of the sale of excess servicing spreads pertaining to their respective MSRs. We have entered into acknowledgment agreements or subordination of interest agreements with them, which acknowledge our subordinated rights.
•Changes in minimum servicing compensation for agency loans could occur at any time and could negatively impact the value of the income derived from MSRs.
•The value of MSRs is highly sensitive to changes in prepayment rates. Decreasing market interest rates are generally associated with increases in prepayment rates as borrowers are able to refinance their loans at lower costs. Prepayments result in the partial or complete loss of the cash flows from the related MSR.
ANNALY CAPITAL MANAGEMENT, INC. AND SUBSIDIARIES
Item 1A. Risk Factors
If we are not able to successfully manage these and other risks related to investing in MSRs, it may adversely affect the value of our MSR-related assets.
We depend on third-party service providers, including mortgage loan servicers and sub-servicers, for a variety of services related to our business. We are, therefore, subject to the risks associated with third-party service providers.
We depend on a variety of services provided by third-party service providers related to our investments in MSRs as well as for general operating purposes. For example, we rely on the mortgage servicers who service the mortgage loans underlying our MSRs to, among other things, collect principal and interest payments on such mortgage loans and perform loss mitigation services in accordance with applicable laws and regulations. Mortgage servicers and other service providers, such as trustees, bond insurance providers, due diligence vendors and document custodians, may fail to perform or otherwise not perform in a manner that promotes our interests.
For example, any legislation or regulation intended to reduce or prevent foreclosures through, among other things, loan modifications may reduce the value of mortgage loans, including those underlying our MSRs. Mortgage servicers may be required or otherwise incentivized by the Federal or state governments to pursue actions designed to assist mortgagors, such as loan modifications, forbearance plans and other actions intended to prevent foreclosure even if such loan modifications and other actions are not in the best interests of the beneficial owners of the mortgage loans. Similarly, legislation delaying the initiation or completion of foreclosure proceedings on specified types of residential mortgage loans or otherwise limiting the ability of mortgage servicers to take actions that may be essential to preserve the value of the mortgage loans may also reduce the value of mortgage loans underlying our MSRs. Any such limitations are likely to cause delayed or reduced collections from mortgagors and generally increase servicing costs. As a consequence of the foregoing matters, our business, financial condition and results of operations may be adversely affected.
Purchases and sales of Agency mortgage-backed securities by the Federal Reserve may adversely affect the price and return associated with Agency mortgage-backed securities.
The Federal Reserve owns approximately $2.0 trillion of Agency mortgage-backed securities as of December 31, 2020. In response to the market conditions created by the COVID-19 pandemic, the Federal Reserve has taken a number of proactive measures, including cutting its target benchmark interest rate to 0%-0.25%, instituting a quantitative easing program, including the purchase of an unconstrained amount of Agency residential mortgage-backed securities, and putting in place a commercial paper funding facility and term and overnight repurchase agreement financing facilities, all to bolster liquidity and to promote price stability and the smooth functioning of the mortgage-backed securities market. Certain actions taken by the U.S., including the Federal Reserve, in response to the COVID-19 pandemic may have a negative a impact on our results. For example, decreases in short-term interest rates, such as those announced by the Federal Reserve during the first quarter of 2020, may have a negative impact on our results. The Federal Reserve significantly further lowered interest rates in response to COVID-19 pandemic concerns. These market interest rate declines may negatively affect our results of operations.
New laws may be passed affecting the relationship between Fannie Mae and Freddie Mac, on the one hand, and the federal government, on the other, which could adversely affect the price of, or our ability to invest in and finance Agency mortgage-backed securities.
The interest and principal payments we expect to receive on the Agency mortgage-backed securities in which we invest are guaranteed by Fannie Mae, Freddie Mac or Ginnie Mae. Principal and interest payments on Ginnie Mae certificates are directly guaranteed by the U.S. government. Principal and interest payments relating to the securities issued by Fannie Mae and Freddie Mac are only guaranteed by each respective Agency.
In September 2008, Fannie Mae and Freddie Mac were placed into the conservatorship of the FHFA, their federal regulator, pursuant to its powers under The Federal Housing Finance Regulatory Reform Act of 2008, a part of the Housing and Economic Recovery Act of 2008. In addition to FHFA becoming the conservator of Fannie Mae and Freddie Mac, the U.S. Department of the Treasury entered into Preferred Stock Purchase Agreements with the FHFA and have taken various actions intended to provide Fannie Mae and Freddie Mac with additional liquidity in an effort to ensure their financial stability. In September 2019, FHFA and the U.S. Treasury Department agreed to modifications to the Preferred Stock Purchase Agreements that will permit Fannie Mae and Freddie Mac to maintain capital reserves of $25 billion and $20 billion, respectively.
Shortly after Fannie Mae and Freddie Mac were placed in federal conservatorship, the Secretary of the U.S. Treasury suggested that the guarantee payment structure of Fannie Mae and Freddie Mac in the U.S. housing finance market should be re-examined. The future roles of Fannie Mae and Freddie Mac could be significantly reduced and the nature of their guarantees could be eliminated or considerably limited relative to historical measurements. The U.S. Treasury could also stop providing
ANNALY CAPITAL MANAGEMENT, INC. AND SUBSIDIARIES
Item 1A. Risk Factors
credit support to Fannie Mae and Freddie Mac in the future. Any changes to the nature of the guarantees provided by Fannie Mae and Freddie Mac could redefine what constitutes an Agency mortgage-backed security and could have broad adverse market implications. If Fannie Mae or Freddie Mac was eliminated, or their structures were to change in a material manner that is not compatible with our business model, we would not be able to acquire Agency mortgage-backed securities from these entities, which could adversely affect our business operations.
The recent U.S. elections may result in changes in federal policy with significant impacts on the legal and regulatory framework affecting the mortgage industry. These changes, including personnel changes at the applicable regulatory agencies, may alter the nature and scope of oversight affecting the mortgage finance industry generally (particularly with respect to the future role of Fannie Mae and Freddie Mac).
Risks Related To Our Credit Assets
We invest in securities in the credit risk transfer sector that are subject to mortgage credit risk.
We invest in securities in the credit risk transfer CRT sector. The CRT sector is comprised of the risk sharing transactions issued by Fannie Mae (“CAS”) and Freddie Mac (“STACR”), and similarly structured transactions arranged by third party market participants. The securities issued in the CRT sector are designed to synthetically transfer mortgage credit risk from Fannie Mae and Freddie Mac to private investors. The holder of the securities in the CRT sector has the risk that the borrowers may default on their obligations to make full and timely payments of principal and interest. Investments in securities in the CRT sector could cause us to incur losses of income from, and/or losses in market value relating to, these assets if there are defaults of principal and/or interest on the pool of mortgages referenced in the transaction. The holder of the CRT may also bear the risk of the default of the issuer of the security.
A prolonged economic slowdown or declining real estate values could impair the assets we may own and adversely affect our operating results.
Our non-Agency mortgage-backed securities, mortgage loans, and mortgage loans for which we own the servicing rights, along with our commercial real estate debt, preferred equity, and real estate assets may be susceptible to economic slowdowns or recessions, which could lead to financial losses in our assets and a decrease in revenues, net income and asset values. Investors should consider the impact that the current recession resulting from the COVID-19 pandemic will have on the mortgage market and ability of mortgagors to make timely payments on their mortgage loans. Furthermore, the economic impact of the COVID-19 pandemic may result in a decline in real estate values (particularly in certain geographic areas).
Owners of Agency mortgage-backed securities are protected from the risk of default on the underlying mortgages by guarantees from Fannie Mae, Freddie Mac or, in the case of the Ginnie Mae, the U.S. Government. A default on those underlying mortgages exposes us to prepayment risk described above, but not a credit loss. However, we also acquire CRTs, non-Agency mortgage-backed securities and residential loans, which are backed by residential real property but, in contrast to Agency mortgage-backed securities, the principal and interest payments are not guaranteed by GSEs or the U.S. Government. Our CRT, non-Agency mortgage-backed securities and residential loan investments are therefore particularly sensitive to recessions and declining real estate values.
In the event of a default on one of our commercial mortgage loans or other commercial real estate debt or residential mortgage loans that we hold in our portfolio or a mortgage loan underlying CRT or non-Agency mortgage-backed securities in our portfolio, we bear the risk of loss as a result of the potential deficiency between the value of the collateral and the debt owed, as well as the costs and delays of foreclosure or other remedies, and the costs of maintaining and ultimately selling a property after foreclosure. Delinquencies and defaults on mortgage loans for which we own the servicing rights will adversely affect the amount of servicing fee income we receive and may result in increased servicing costs and operational risks due to the increased complexity of servicing delinquent and defaulted mortgage loans.
Geographic concentration exposes investors to greater risk of default and loss.
Repayments by borrowers and the market value of the related assets could be affected by economic conditions generally or specific to geographic areas or regions of the United States, and concentrations of mortgaged commercial and residential properties in particular geographic areas may increase the risk that adverse economic or other developments (including events of conditions related to the COVID-19 pandemic) or natural or man-made disasters affecting a particular region of the country could increase the frequency and severity of losses on mortgage loans or other real estate debt secured by those properties. From time to time, regions of the United States experience significant real estate downturns when others do not. Regional economic declines or conditions in regional real estate markets could adversely affect the income from, and market value of, the mortgaged properties. In addition, local or regional economies may be adversely affected to a greater degree than other areas of
ANNALY CAPITAL MANAGEMENT, INC. AND SUBSIDIARIES
Item 1A. Risk Factors
the country by developments affecting industries concentrated in such area. A decline in the general economic condition in the region in which mortgaged properties securing the related mortgage loans are located would result in a decrease in consumer demand in the region, and the income from and market value of the mortgaged properties may be adversely affected.
Other regional factors – e.g., rising sea levels, earthquakes, floods, forest fires, hurricanes or changes in governmental rules (including rules related to the COVID-19 pandemic) or fiscal policies – also may adversely affect the mortgaged properties. Assets in certain regional areas may be more susceptible to certain hazards (such as earthquakes, widespread fires, floods or hurricanes) than properties in other parts of the country and collateral properties located in coastal states may be more susceptible to hurricanes than properties in other parts of the country. As a result, areas affected by such events often experience disruptions in travel, transportation and tourism, loss of jobs and an overall decrease in consumer activity, and often a decline in real estate-related investments. There can be no assurance that the economies in such impacted areas will recover sufficiently to support income producing real estate at pre-event levels or that the costs of the related clean-up will not have a material adverse effect on the local or national economy.
Inadequate property insurance coverage could have an adverse impact on our operating results.
Commercial and residential real estate assets may suffer casualty losses due to risks (including acts of terrorism) that are not covered by insurance or for which insurance coverage requirements have been contractually limited by the related loan documents. Moreover, if reconstruction or major repairs are required following a casualty, changes in laws that have occurred since the time of original construction may materially impair the borrower’s ability to effect such reconstruction or major repairs or may materially increase the cost thereof.
There is no assurance that borrowers have maintained or will maintain the insurance required under the applicable loan documents or that such insurance will be adequate. In addition, since the residential mortgage loans generally do not require maintenance of terrorism insurance, we cannot assure you that any property will be covered by terrorism insurance. Therefore, damage to a collateral property caused by acts of terror may not be covered by insurance and may result in substantial losses to us.
We may incur losses when a borrower defaults on a loan and the underlying collateral value is less than the amount due.
If a borrower defaults on a non-recourse loan, we will only have recourse to the real estate-related assets collateralizing the loan. If the underlying collateral value is less than the loan amount, we may suffer a loss. Conversely, some of our loans may be unsecured or are secured only by equity interests in the borrowing entities. These loans are subject to the risk that other lenders in the capital stack may be directly secured by the real estate assets of the borrower or may otherwise have a superior right to repayment. Upon a default, those collateralized senior lenders would have priority over us with respect to the proceeds of a sale of the underlying real estate. In cases described above, we may lack control over the underlying asset collateralizing our loan or the underlying assets of the borrower before a default, and, as a result, the value of the collateral may be reduced by acts or omissions by owners or managers of the assets. In addition, the value of the underlying real estate may be adversely affected by some or all of the risks referenced below with respect to our owned real estate.
Some of our loans may be backed or supported by individual or corporate guarantees from borrowers or their affiliates that are not secured. If the guarantees are not fully or partially secured, we typically rely on financial covenants from borrowers and guarantors that are designed to require the borrower or guarantor to maintain certain levels of creditworthiness. Where we do not have recourse to specific collateral pledged to satisfy such guarantees or recourse loans, we will only have recourse as an unsecured creditor to the general assets of the borrower or guarantor, some or all of which may be pledged as collateral for other lenders. There can be no assurance that a borrower or guarantor will comply with its financial covenants, or that sufficient assets will be available to pay amounts owed to us under our loans and guarantees. As a result of these factors, we may suffer additional losses that could have a material adverse effect on our financial performance.
Upon a borrower bankruptcy, we may not have full recourse to the assets of the borrower to satisfy our loan. In addition, certain of our loans are subordinate to other debt. If a borrower defaults on our loan or on debt senior to our loan, or upon a borrower bankruptcy, our loan will be satisfied only after the senior debt holder receives payment. Where debt senior to our loan exists, the presence of intercreditor arrangements may limit our ability to amend our loan documents, assign our loans, accept prepayments, exercise our remedies (through “standstill” periods) and control decisions made in bankruptcy proceedings. Bankruptcy and borrower litigation can significantly increase collection costs and the time needed for us to acquire title to the underlying collateral (if applicable), during which time the collateral and/or a borrower’s financial condition may decline in value, causing us to suffer additional losses.
If the value of collateral underlying a loan declines or interest rates increase during the term of a loan, a borrower may not be able to obtain the necessary funds to repay our loan at maturity through refinancing because the underlying property revenue
ANNALY CAPITAL MANAGEMENT, INC. AND SUBSIDIARIES
Item 1A. Risk Factors
cannot satisfy the debt service coverage requirements necessary to obtain new financing. If a borrower is unable to repay our loan at maturity, we could suffer additional loss that may adversely impact our financial performance.
Our assets may become non-performing or sub-performing assets in the future, which are subject to increased risks relative to performing loans.
Our assets may in the near or the long term become non-performing or sub-performing assets, which are subject to increased risks relative to performing assets. Commercial loans and residential mortgage loans may become non-performing or sub-performing for a variety of reasons that result in the borrower being unable to meet its debt service and/or repayment obligations, such as the underlying property being too highly leveraged, the financial distress of the borrower, or in the case of a commercial loan, decreasing income generated from the underlying property. Such non-performing or sub-performing assets may require a substantial amount of workout negotiations and/or restructuring, which may involve substantial cost and divert the attention of our management from other activities and may entail, among other things, a substantial reduction in interest rate, the capitalization of interest payments and/or a substantial write-down of the principal of the loan. Even if a restructuring were successfully accomplished, the borrower may not be able or willing to maintain the restructured payments or refinance the restructured loan upon maturity.
From time to time we may find it necessary or desirable to foreclose the liens of loans we acquire or originate, and the foreclosure process may be lengthy and expensive. Borrowers may resist foreclosure actions by asserting numerous claims, counterclaims and defenses to payment against us (such as lender liability claims and defenses) even when such assertions may have no basis in fact or law, in an effort to prolong the foreclosure action and force the lender into a modification of the loan or a favorable buy-out of the borrower’s position. In some states, foreclosure actions can take several years or more to litigate. At any time prior to or during the foreclosure proceedings, the borrower may file for bankruptcy, which would have the effect of staying the foreclosure actions and further delaying the resolution of our claims. Foreclosure may create a negative public perception of the related property, resulting in a diminution of its value. Even if we are successful in foreclosing on a loan, the liquidation proceeds upon sale of the underlying real estate may not be sufficient to recover our cost basis in the loan, resulting in a loss to us. Furthermore, any costs or delays involved in the foreclosure of a loan or a liquidation of the underlying property will further reduce the proceeds and thus increase our loss. Any such reductions could materially and adversely affect the value of the commercial loans in which we invest.
It is anticipated that as a result of financial difficulties due to the COVID-19 pandemic, borrowers will continue to request forbearance or other relief with respect to their mortgage payments. In addition, across the country, moratoriums are in place in certain states to stop evictions and foreclosures in an effort to lessen the financial burden created by the COVID-19 pandemic and various states have even promulgated guidance to regulated servicers requiring them to formulate policies to assist mortgagors in need as a result of the COVID-19 pandemic. It is anticipated that other forbearance programs, foreclosure moratoriums or other programs or mandates will be imposed or extended, including those that will impact mortgage related assets. Moratoriums on foreclosures may significantly impair the servicer’s abilities or our ability to pursue loss mitigation strategies in a timely and effective manner.
Whether or not we have participated in the negotiation of the terms of a loan, there can be no assurance as to the adequacy of the protection of the terms of the loan, including the validity or enforceability of the loan and the maintenance of the anticipated priority and perfection of the applicable security interests. Furthermore, claims may be asserted that might interfere with enforcement of our rights. In the event of a foreclosure, we may assume direct ownership of the underlying real estate. The liquidation proceeds upon sale of that real estate may not be sufficient to recover our cost basis in the loan, resulting in a loss to us. Any costs or delays involved in the effectuation of a foreclosure of the loan or a liquidation of the underlying property will further reduce the proceeds and increase our loss.
Whole loan mortgages are also subject to “special hazard” risk (property damage caused by hazards, such as earthquakes or environmental hazards, not covered by standard property insurance policies), and to bankruptcy risk (reduction in a borrower’s mortgage debt by a bankruptcy court). In addition, claims may be assessed against us on account of our position as mortgage holder or property owner, as applicable, including responsibility for tax payments, environmental hazards and other liabilities, which could have a material adverse effect on our results of operations, financial condition and our ability to make distributions to our stockholders.
We may be required to repurchase commercial or residential mortgage loans or indemnify investors if we breach representations and warranties, which could have a negative impact on our earnings.
When we sell or securitize loans, we will be required to make customary representations and warranties about such loans to the loan purchaser. Our mortgage loan sale agreements will require us to repurchase or substitute loans in the event we breach a representation or warranty given to the loan purchaser. In addition, we may be required to repurchase loans as a result of
ANNALY CAPITAL MANAGEMENT, INC. AND SUBSIDIARIES
Item 1A. Risk Factors
borrower fraud or in the event of early payment default on a mortgage loan. Likewise, we may be required to repurchase or substitute loans if we breach a representation or warranty in connection with our securitizations. The remedies available to a purchaser of mortgage loans are generally broader than those available to us against the originating broker or correspondent. Further, if a purchaser enforces its remedies against us, we may not be able to enforce the remedies we have against the sellers. The repurchased loans typically can only be financed at a steep discount to their repurchase price, if at all. They are also typically sold at a significant discount to the unpaid principal balance. Significant repurchase activity could adversely affect our cash flow, results of operations, financial condition and business prospects.
Our and our third party service providers’ and servicers’ due diligence of potential assets may not reveal all of the liabilities associated with such assets and may not reveal other weaknesses in such assets, which could lead to losses.
Before acquiring a commercial or residential real estate debt asset, we will assess the strengths and weaknesses of the borrower, originator or issuer of the asset as well as other factors and characteristics that are material to the performance of the asset. In making the assessment and otherwise conducting customary due diligence, we will rely on resources available to us, including our third party service providers and servicers. This process is particularly important with respect to newly formed originators or issuers because there may be little or no information publicly available about these entities and assets. There can be no assurance that our due diligence process will uncover all relevant facts or that any asset acquisition will be successful.
When we foreclose on an asset, we may come to own and operate the property securing the loan, which would expose us to the risks inherent in that activity.
When we foreclose on a commercial or residential real estate asset, we may take title to the property securing that asset, and if we do not or cannot sell the property, we would then come to own and operate it as “real estate owned.” Owning and operating real property involves risks that are different (and in many ways more significant) than the risks faced in owning a debt instrument secured by that property. In addition, we may end up owning a property that we would not otherwise have decided to acquire directly at the price of our original investment or at all. Further, some of the properties underlying the assets we are acquiring are of a different type or class than property we have had experience operating directly, including properties such as hotels, hospitals, and skilled nursing facilities. Accordingly, we may not manage these properties as well as they might be managed by another owner, and our returns to investors could suffer. If we foreclose on and come to own property, our financial performance and returns to investors could suffer.
Financial covenants could adversely affect our ability to conduct our business.
The commercial mortgages on our equity properties generally contain customary negative covenants that limit our ability to further mortgage the properties, to enter into material leases or other agreements or materially modify existing leases or other agreements without lender consent, to access cash flow in certain circumstances, and to discontinue insurance coverage, among other things. With respect to the long-term, fixed rate mortgage loans secured by certain of our healthcare properties and insured by the U.S. Department of Housing and Urban Development (“HUD”), the approval of HUD is also required for certain actions. These restrictions could adversely affect operations, and our ability to pay debt obligations. In addition, in some instances guaranties given by Annaly entities as further security for these mortgage loans contain affirmative covenants to maintain a minimum net worth and liquidity.
Proposals to acquire mortgage loans by eminent domain may adversely affect the value of our assets.
Local governments have taken steps to consider how the power of eminent domain could be used to acquire residential mortgage loans and there can be no certainty whether any mortgage loans sought to be purchased will be mortgage loans held in securitization trusts and what purchase price would be paid for any such mortgage loans. Any such actions could have a material adverse effect on the market value of our mortgage-backed securities, mortgage loans and MSRs. There is also no certainty as to whether any such action without the consent of investors would face legal challenge, and, if so, the outcome of any such challenge.
Our investments in corporate loans and debt securities for middle market companies carry risks.
We invest a percentage of our assets directly in the ownership of corporate loans and debt securities for middle market companies. Non-investment grade or unrated loans to middle market businesses may carry more inherent risks than loans to larger, investment grade publicly traded entities. These middle market companies generally have less access to public capital
ANNALY CAPITAL MANAGEMENT, INC. AND SUBSIDIARIES
Item 1A. Risk Factors
markets, and generally have higher financing costs. Such companies, particularly in an economic slowdown or recession, may be in a weaker financial position, may need more capital to expand or compete, and may be unable to obtain financing from their respective private capital providers, public capital markets or from traditional sources, such as commercial banks. In an economic downturn, middle market loan obligors, which may be highly leveraged, may be unable to meet their debt service requirements. Middle market businesses may have narrower product lines, be more vulnerable to exogenous events and maintain smaller market shares than large businesses. Therefore, they may be more vulnerable to competitors’ actions and market conditions, as well as general economic downturns. Middle market businesses may have more difficulties implementing enterprise resource plans and may face greater challenges integrating acquisitions than large businesses. These businesses may also experience variations in operating results. The success of a middle market company may depend on the management talents and efforts of one or two persons or a small group of persons. The death, disability or resignation of one or more of these persons may have a material adverse impact on such middle market company and its ability to repay its obligations. A deterioration in the value of our investments in corporate loans and debt securities for middle market companies could have an adverse impact on our results of operations.
Risks Related To Commercial Real Estate Debt, Preferred Equity Investments, Net Lease Real Estate Assets and Other Equity Ownership of Real Estate Assets
The real estate assets we acquire are subject to risks particular to real property, which may adversely affect our returns from certain assets and our ability to make distributions to our stockholders.
We own assets secured by real estate and own real estate directly through direct purchases or realization or upon a default of mortgage loans. Real estate assets are subject to various risks, including:
•acts of God, including earthquakes, hurricanes, floods and other natural disasters, which may result in uninsured losses;
•acts of war or terrorism, including the consequences of terrorist attacks;
•adverse changes in national and local economic and market conditions;
•changes in governmental laws and regulations, fiscal policies and zoning ordinances and the related costs of compliance with laws and regulations, fiscal policies and ordinances;
•the potential for uninsured or under-insured property losses; and
•environmental conditions of the real estate.
Under various U.S. federal, state and local environmental laws, ordinances and regulations, a current or previous owner of real estate (including, in certain circumstances, a secured lender that succeeds to ownership or control of a property) may become liable for the costs of removal or remediation of certain hazardous or toxic substances at, on, under or in its property.
If any of these or similar events occurs, it may reduce our return from an affected property or investment and reduce or eliminate our ability to make distributions to stockholders.
The commercial loan assets we originate and/or acquire depend on the ability of the property owner to generate net income from operating the property. Failure to do so may result in delinquency and/or foreclosure.
Commercial loans are secured by real property and are subject to risks of delinquency and foreclosure, and risks of loss that may be greater than similar risks associated with loans made on the security of single-family residential property. The ability of a borrower to repay a loan secured by an income-producing property typically is dependent primarily upon the successful operation of such property rather than upon the existence of independent income or assets of the borrower. In light of the COVID-19 pandemic and related stay-at-home orders, certain businesses may not be able to open or to open at full capacity to customers, which may have an effect on their ability to generate income. If the income of the property is reduced, the borrower’s ability to repay the loan may be impaired. The income of an income-producing property can be adversely affected by, among other things,
•changes in national, regional or local economic conditions or specific industry segments, including the credit and securitization markets;
•declines in regional or local real estate values;
•declines in regional or local rental or occupancy rates;
•increases in interest rates, real estate tax rates and other operating expenses;
•tenant mix;
•success of tenant businesses and the tenant’s ability to meet their lease obligations;
•property management decisions;
•property location, condition and design;
•competition from comparable types of properties;
•government orders regulating the operation of a tenant’s business;
•changes in laws that increase operating expenses or limit rents that may be charged;
ANNALY CAPITAL MANAGEMENT, INC. AND SUBSIDIARIES
Item 1A. Risk Factors
•eviction moratoriums;
•costs of remediation, and liabilities associated with environmental conditions;
•the potential for uninsured or underinsured property losses;
•changes in governmental laws and regulations, including fiscal policies, zoning ordinances and
environmental legislation and the related costs of compliance;
•acts of God, terrorist attacks, pandemics, social unrest and civil disturbances;
•litigation and condemnation proceedings regarding the properties; and
•bankruptcy proceedings.
In the event of any default under a loan held directly by us, we will bear a risk of loss of principal to the extent of any deficiency between the value of the collateral and the principal and accrued interest (and other unpaid sums) under the loan, which could have a material adverse effect on our cash flow from operations and limit amounts available for distribution to our stockholders. In the event of the bankruptcy of a mortgage loan borrower, the mortgage loan to such borrower will be deemed to be secured only to the extent of the value of the underlying collateral at the time of bankruptcy (as determined by the bankruptcy court), and the lien securing the mortgage loan will be subject to the avoidance powers of the bankruptcy trustee or debtor-in-possession to the extent the lien is unenforceable under state law. Workouts and/or foreclosure of a commercial real estate loan can be an expensive and lengthy process, which could have a substantial negative effect on our anticipated return on such commercial real estate.
Commercial and non-Agency mortgage-backed securities we acquire may be subject to losses.
In general, losses on a mortgaged property securing a mortgage loan included in a securitization will be borne first by the equity holder of the property, then by the holder of a mezzanine loan or B-Note, if any, then by the “first loss” subordinated security holder generally, the “B-Piece” buyer, and then by the holder of a higher-rated security. In the event of default and the exhaustion of any equity support, mezzanine loans or B-Notes, and any classes of securities junior to those that we acquire, we may not be able to recover all of our capital in the securities we purchase. In addition, if the underlying mortgage portfolio has been overvalued by the originator, or if the values subsequently decline, less collateral is available to satisfy interest and principal payments due on the related mortgage-backed securities. The prices of lower credit quality mortgage-backed securities are generally less sensitive to interest rate changes than more highly rated mortgage-backed securities, but more sensitive to adverse economic downturns or individual issuer developments. The projection of an economic downturn, for example, could cause a decline in the price of lower credit quality mortgage-backed securities because the ability of obligors of mortgages underlying mortgage-backed securities to make principal and interest payments may be impaired. In such event, existing credit support in the securitization structure may be insufficient to protect us against loss of our principal and interest on these securities.
Borrowers may be unable to repay the remaining principal balance on the maturity date.
Many commercial loans are non-amortizing balloon loans that provide for substantial payments of principal due at their stated maturities. Commercial loans with substantial remaining principal balances at their stated maturity date involve greater risk than fully-amortizing loans. This is because the borrower may be unable to repay the loan at that time.
A borrower’s ability to repay a mortgage loan on its stated maturity date typically will depend upon its ability either to refinance the mortgage loan or to sell the mortgaged property at a price sufficient to permit repayment. A borrower’s ability to achieve either of these goals will be affected by a number of factors, including:
•the availability of, and competition for, credit for commercial real estate projects, which fluctuate over time;
•the prevailing interest rates;
•the net operating income generated by the related mortgaged properties;
•the fair market value of the related mortgaged properties;
•the borrower’s equity in the related mortgaged properties;
•significant tenant rollover at the related mortgaged properties;
•the borrower’s financial condition;
•the operating history and occupancy level of the related mortgaged properties;
•reductions in applicable government assistance/rent subsidy programs;
•changes in zoning or tax laws;
•changes in competition in the relevant location;
•changes in rental rates in the relevant location;
•changes in government regulation and fiscal policy;
•the state of fixed income and mortgage markets;
•the availability of credit for multi-family and commercial properties;
ANNALY CAPITAL MANAGEMENT, INC. AND SUBSIDIARIES
Item 1A. Risk Factors
•prevailing general and regional economic conditions; and
•the availability of funds in the credit markets which fluctuates over time.
Whether or not losses are ultimately sustained, any delay in the collection of a balloon payment on the maturity date will likely extend the weighted average life of our investment.
The B-Notes that we originate and acquire may be subject to additional risks related to the privately negotiated structure and terms of the transaction, which may result in losses to us.
We may originate and acquire B-Notes. A B-Note is a mortgage loan interest typically (1) secured by a first mortgage on a single large commercial property or group of related properties and (2) subordinated to an A-Note secured by the same first mortgage on the same collateral. As a result, if a borrower defaults, there may not be sufficient funds remaining for B-Note holders after payment to the A-Note holders. However, because each transaction is privately negotiated, B-Notes can vary in their structural characteristics and risks. For example, the rights of holders of B-Notes to control the process following a borrower default may vary from transaction to transaction. Further, B-Notes may be secured by a single property and so reflect the risks associated with significant concentration. Significant losses related to our B-Notes would result in operating losses for us and may limit our ability to make distributions to our stockholders.
The mezzanine loan assets and other subordinate debt positions that we originate and acquire involve greater risks of loss than senior loans.
We originate and acquire mezzanine loans, which take the form of subordinated loans secured by a pledge of the ownership interests by an entity that directly or indirectly owns the property-owning entity. We also make commercial real estate preferred equity investments, which, unlike mezzanine loans, generally are not secured by a pledge of equity interests and may be less liquid investments. Although as a holder of preferred equity we may protect our position with covenants that limit the activities of the entity in which we hold an interest and protect our equity by obtaining a contractual right to control the underlying property or force a sale after an event of default, should such a default occur, we would only be able to proceed against the entity in which we hold an interest, and not the real property owned by such entity and ultimately underlying the investment. These types of subordinate debt assets involve a higher degree of risk than senior mortgage lending secured by income-producing real property, because the loan may become unsecured or unrecoverable as a result of foreclosure by the senior lender on its mortgage or the exercise of remedies by a lender holding a mezzanine loan that is senior to our subordinate debt. In the event of a bankruptcy of the entity providing the pledge of ownership interests as security for a mezzanine loan, we may not have full recourse to the assets of such entity, or the assets of the entity may not be sufficient to satisfy our mezzanine loan. If a borrower defaults on our mezzanine loan, preferred equity investment, or debt senior to our loan, or in the event of a borrower bankruptcy, our subordinate debt will be satisfied only after the senior debt. As a result, we may not recover some or all of our investment. In addition, mezzanine loans and preferred equity investments may have higher loan-to-value ratios than conventional mortgage loans, resulting in the borrower having less equity in the property and increasing the risk of loss of principal. Further, any subordinate debt investment may give rise to sudden liquidity needs in order for us to protect our position. Significant losses related to our mezzanine loans and/or preferred equity positions would result in operating losses for us and may limit our ability to make distributions to our stockholders.
We are subject to additional risks associated with loan participations and co-lending arrangements.
Some of our loans may be participation interests or co-lender arrangements in which we share the rights, obligations and benefits of the loan with other lenders. We may need the consent of these parties to exercise our rights under such loans, including rights with respect to amendment of loan documentation, enforcement proceedings upon a default and the institution of, and control over, foreclosure proceedings. Similarly, certain participants may be able to take actions to which we object but to which we will be bound if our participation interest represents a minority interest. We may be adversely affected by this lack of control.
Construction loans involve an increased risk of loss.
We have in the past and may in the future acquire and/or originate construction loans. If we fail to fund our entire commitment on a construction loan or if a borrower otherwise fails to complete the construction of a project, there could be adverse consequences associated with the loan, including: a loss of the value of the property securing the loan, especially if the
ANNALY CAPITAL MANAGEMENT, INC. AND SUBSIDIARIES
Item 1A. Risk Factors
borrower is unable to raise funds to complete it from other sources; a borrower claim against us for failure to perform under the loan documents; increased costs to the borrower that the borrower is unable to pay; a bankruptcy filing by the borrower; and abandonment by the borrower of the collateral for the loan.
If we do not have an adequate completion guarantee backed by a person or entity with sufficient creditworthiness, risks of cost overruns and non-completion of renovation of the properties underlying rehabilitation loans may result in significant losses. The renovation, refurbishment or expansion of a mortgaged property by a borrower involves risks of cost overruns and non-completion. Estimates of the costs of improvements to bring an acquired property up to standards established for the market position intended for that property may prove inaccurate. Other risks may include rehabilitation costs exceeding original estimates, possibly making a project uneconomical, environmental risks and rehabilitation and subsequent leasing of the property not being completed on schedule. If such renovation is not completed in a timely manner, or if it costs more than expected, the borrower may experience a prolonged impairment of net operating income and may not be able to make payments on our investment, which could result in significant losses.
We may experience losses if the creditworthiness of our tenants deteriorates and they are unable to meet their lease obligations.
We own properties leased to tenants and receive rents from tenants during the contracted term of such leases. Such leases include space leases and operating leases. A tenant’s ability to pay rent is determined by its creditworthiness, among other factors. If a tenant’s credit deteriorates, the tenant may default on its obligations under our lease and may also become bankrupt. The bankruptcy or insolvency of our tenants or other failure to pay is likely to adversely affect the income produced by our real estate assets. If a tenant defaults, we may experience delays and incur substantial costs in enforcing our rights as landlord. If a tenant files for bankruptcy, we may not be able to evict the tenant solely because of such bankruptcy or failure to pay. A court, furthermore, may authorize a tenant to reject and terminate its lease with us. In such a case, our claim against the tenant for unpaid, future rent would be subject to a statutory cap that might be substantially less than the remaining rent owed under the lease. In addition, certain amounts paid to us within 90 days prior to the tenant’s bankruptcy filing could be required to be returned to the tenant’s bankruptcy estate. In any event, it is highly unlikely that a bankrupt or insolvent tenant would pay in full amounts it owes us under a lease that it intends to reject. In other circumstances, where a tenant’s financial condition has become impaired, we may agree to partially or wholly terminate the lease in advance of the termination date in consideration for a lease termination fee that is likely less than the total contractual rental amount. Without regard to the manner in which the lease termination occurs, we are likely to incur additional costs in the form of tenant improvements and leasing commissions in our efforts to lease the space to a new tenant.
With respect to a deterioration affecting an operating tenant of one or more of our healthcare properties, there can be no assurance that we would be able to identify suitable replacement tenants or enter into leases with new tenants on terms as favorable to us as the current leases or that we would be able to lease those properties at all. Our ability to reposition our properties with a suitable replacement tenant or operator could be significantly delayed or limited by state licensing, receivership or other laws, as well as by the Medicare and Medicaid change-of-ownership rules, and we could incur substantial additional expenses in connection with any licensing, receivership or change-of-ownership proceedings. Our ability to locate and attract suitable replacement tenants also could be impaired by the specialized healthcare uses or contractual restrictions on use of the properties, and we may be forced to spend substantial amounts to adapt the properties to other uses. If we are not successful in identifying suitable replacements on a timely basis we may be required to fund certain expenses and obligations (e.g., real estate taxes, debt costs and maintenance expenses) to preserve the value of, and avoid the imposition of liens on, our properties while they are being repositioned. In addition, we may incur certain obligations and liabilities, including obligations to indemnify the replacement tenant or operator, which could adversely affect our business, results of operations and financial condition.
The risks associated with properties leased to tenants are more acute during periods of economic slowdown or recession, especially if these periods are accompanied by high unemployment and declining real estate values. A weakening economy, high unemployment and declining real estate values significantly increase the likelihood that a tenant’s creditworthiness may deteriorate, which in turn may adversely affect us.
In any of the foregoing circumstances, our financial performance could be materially adversely affected.
Lease expirations, lease defaults and lease terminations may adversely affect our revenue.
Lease expirations and lease terminations may result in reduced revenues if the lease payments received from replacement tenants are less than the lease payments received from the expiring or terminating tenants. In addition, lease defaults or lease terminations by one or more significant tenants or the failure of tenants under expiring leases to elect to renew their leases, could cause us to experience long periods of vacancy with no revenue from a facility and to incur substantial capital
ANNALY CAPITAL MANAGEMENT, INC. AND SUBSIDIARIES
Item 1A. Risk Factors
expenditures and/or lease concessions to obtain replacement tenants. The risk of lease expirations and lease terminations is more acute during periods of economic slowdown or recession, especially if these periods are accompanied by high unemployment and declining real estate values.
Our real estate investments are illiquid.
Because real estate investments are relatively illiquid, our ability to adjust the portfolio promptly in response to economic or other conditions will be limited. Certain significant expenditures generally do not change in response to economic or other conditions, including: (i) debt service (if any), (ii) real estate taxes, and (iii) operating and maintenance costs. This combination of variable revenue and relatively fixed expenditures may result, under certain market conditions, in reduced earnings and could have an adverse effect on our financial condition.
We may not control the special servicing of the mortgage loans included in the commercial mortgage-backed securities in which we invest and, in such cases, the special servicer may take actions that could adversely affect our interests.
With respect to the commercial mortgage-backed securities in which we may invest, overall control over the special servicing of the related underlying mortgage loans will be held by a “directing certificate holder” or a “controlling class representative,” which is appointed by the holders of the most subordinate class of commercial mortgage-backed securities in such series. To the extent that we acquire classes of existing series of commercial mortgage-backed securities originally rated AAA, for example, we will not have the right to appoint the directing certificate holder. In connection with the servicing of the specially serviced mortgage loans, the related special servicer may, at the direction of the directing certificate holder, take actions with respect to the specially serviced mortgage loans that could adversely affect our interests.
Joint venture investments could be adversely affected by our lack of sole decision-making authority and reliance upon a co-venturer’s financial condition.
We co-invest with third parties through joint ventures. Although we generally retain control and decision-making authority in a joint venture relationship, in some circumstances (such as major decisions) we may not be permitted to exercise sole decision-making authority regarding such joint venture or the subject property. Investments in joint ventures may involve risks not present were a third party not involved, including the possibility that co-venturers might become bankrupt or otherwise fail to fund their share of required capital contributions. Additionally, our co-venturers might at any time have economic or other business interests or goals which are inconsistent with our business interests or goals, and we may in certain circumstances be liable for the actions of our co-venturers. Consequently, actions by any such co-venturer might result in subjecting properties owned by the joint venture to additional risk, although these risks are mitigated by transaction structure and the terms and conditions of agreements governing the relationship.
Risks Related To Our Residential Credit Business
Our investments in non-Agency mortgage-backed securities (including re-performing loans (“RPL”) / non-performing loans (“NPL”) which we have acquired in recent periods) or other investment assets of lower credit quality, including our investments in MSRs or seasoned re-performing and non-performing residential whole loans, involve credit risk, which could materially adversely affect our results of operations.
Our current investment strategy includes seeking growth in our residential credit business. The holder of a mortgage or mortgage-backed securities assumes the risk that the related borrowers may default on their obligations to make full and timely payments of principal and interest. Under our investment policy, we have the ability to acquire non-Agency mortgage-backed securities, residential whole loans, MSRs and other investment assets of lower credit quality. In general, non-Agency mortgage-backed securities carry greater investment risk than Agency mortgage-backed securities because they are not guaranteed as to principal or interest by the U.S. Government, any federal agency or any federally chartered corporation. Non-investment grade, non-Agency securities tend to be less liquid, may have a higher risk of default and may be more difficult to value than investment grade bonds. Higher-than-expected rates of default and/or higher-than-expected loss severities on the mortgages underlying our non-Agency mortgage-backed securities, MSRs or on our residential whole loan investments may adversely affect the value of those assets. Accordingly, defaults in the payment of principal and/or interest on our non-Agency mortgage-backed securities, residential whole loan investments, MSRs and other investment assets of less-than-high credit quality would likely result in our incurring losses of income from, and/or losses in market value relating to, these assets.
ANNALY CAPITAL MANAGEMENT, INC. AND SUBSIDIARIES
Item 1A. Risk Factors
We have investments in non-Agency mortgage-backed securities collateralized by non-prime loans and may also have investments collateralized by subprime mortgage loans, which, due to lower underwriting standards, are subject to increased risk of losses.
We have certain investments in non-Agency mortgage-backed securities backed by collateral pools containing mortgage loans that were originated under underwriting standards that were less strict than those used in underwriting “prime mortgage loans.” These lower standards permitted mortgage loans, often with LTV ratios in excess of 80%, to be made to borrowers having impaired credit histories, lower credit scores, higher debt-to-income ratios and/or unverified income. Difficult economic conditions, including increased interest rates and lower home prices, can result in non-prime and subprime mortgage loans having increased rates of delinquency, foreclosure, bankruptcy and loss (including such as during the credit crisis of 2007-2008 and the housing crisis that followed), and are likely to otherwise experience delinquency, foreclosure, bankruptcy and loss rates that are higher, and that may be substantially higher, than those experienced by mortgage loans underwritten in a more traditional manner. Thus, because of higher delinquency rates and losses associated with non-prime and subprime mortgage loans, the performance of our non-Agency mortgage-backed securities that are backed by these types of loans could be correspondingly adversely affected, which could materially adversely impact our results of operations, financial condition and business.
Our investments may include subordinated tranches of non-Agency mortgage-backed securities, which are subordinate in right of payment to more senior securities.
Our investments may include subordinated tranches of non-Agency mortgage-backed securities, which are subordinated classes of securities in a structure of securities collateralized by a pool of mortgage loans and, accordingly, are the first or among the first to bear the loss upon a restructuring or liquidation of the underlying collateral and the last to receive payment of interest and principal. Additionally, estimated fair values of these subordinated interests tend to be more sensitive to changes in economic conditions than more senior securities. As a result, such subordinated interests generally are not actively traded and may not be liquid investments.
We are subject to counterparty risk and may be unable to seek indemnity or require counterparties to repurchase residential whole loans if they breach representations and warranties, which could cause us to suffer losses.
When selling or securitizing mortgage loans, sellers typically make customary representations and warranties about such loans. Residential mortgage loan purchase agreements may entitle the purchaser of the loans to seek indemnity or demand repurchase or substitution of the loans in the event the seller of the loans breaches a representation or warranty given to the purchaser. There can be no assurance that a mortgage loan purchase agreement will contain appropriate representations and warranties, that we or the trust that purchases the mortgage loans would be able to enforce a contractual right to repurchase or substitution, or that the seller of the loans will remain solvent or otherwise be able to honor its obligations under its mortgage loan purchase agreements. The inability to obtain or enforce an indemnity or require repurchase of a significant number of loans could adversely affect our results of operations, financial condition and business.
Our investments in residential whole loans subject us to servicing-related risks, including those associated with foreclosure.
In connection with the acquisition and securitization of residential whole loans, we rely on unaffiliated servicing companies to service and manage the mortgages underlying our Non-Agency mortgage-backed securities and our residential whole loans. If a servicer is not vigilant in seeing that borrowers make their required monthly payments, borrowers may be less likely to make these payments, resulting in a higher frequency of default. If a servicer takes longer to liquidate non-performing mortgages, our losses related to those loans may be higher than originally anticipated.
Any failure by servicers to service these mortgages and related real estate owned (“REO”) properties could negatively impact the value of these investments and our financial performance. In addition, while we have contracted, and will continue to contract, with unaffiliated servicing companies to carry out the actual servicing of the loans we purchase together with the related MSRs (including all direct interface with the borrowers), we are nevertheless ultimately responsible, vis-à-vis the borrowers and state and federal regulators, for ensuring that the loans are serviced in accordance with the terms of the related notes and mortgages and applicable law and regulation. In light of the current regulatory environment, such exposure could be significant even though we might have contractual claims against our servicers for any failure to service the loans to the required standard.
When a residential whole loan we own is foreclosed upon, title to the underlying property would be taken by one of our subsidiaries. The foreclosure process, especially in judicial foreclosure states such as New York, Florida and New Jersey can be lengthy and expensive, and the delays and costs involved in completing a foreclosure, and then liquidating the property through
ANNALY CAPITAL MANAGEMENT, INC. AND SUBSIDIARIES
Item 1A. Risk Factors
sale, may materially increase any related loss. Finally, at such time as title is taken to a foreclosed property, it may require more extensive rehabilitation than we estimated at acquisition or a previously unknown environmental liability may be discovered that would require expensive and time-consuming remediation.
The COVID-19 pandemic and the resulting economic disruption it has caused may result in liquidity pressures on servicers and other third-party vendors that we rely upon. For instance, as a result of an increase in mortgagors requesting relief in the form of forbearance plans and/or other loss mitigation, servicers and other parties responsible in capital markets securitization transactions for funding advances with respect to delinquent mortgagor payments of principal and interest may begin to experience financial difficulties if mortgagors do not make monthly payments as a result of the COVID-19 pandemic. The negative impact on the business and operations of such servicers or other parties responsible for funding such advances could be significant. Sources of liquidity typically available to servicers and other relevant parties for the purpose of funding advances of monthly mortgage payments, especially entities that are not depository institutions, may not be sufficient to meet the increased need that could result from significantly higher delinquency and/or forbearance rates. The extent of such liquidity pressures in the future is not known at this time and is subject to continual change.
Challenges to the MERS® System could materially and adversely affect our business, results of operations and financial condition.
MERSCORP, Inc. is a privately held company that maintains an electronic registry, referred to as the MERS System, that tracks ownership of residential mortgage loans in the U.S., as well as the identity of the associated servicer and subservicer. Mortgage Electronic Registration Systems, Inc., or MERS, a wholly-owned subsidiary of MERSCORP, Inc., can serve as a nominee for the owner of a mortgage loan and in that role initiate foreclosures and/or become the mortgagee of record for the loan in local land records. We, or other parties with whom we contract to do business or from whom we acquire assets, may choose to use MERS as a nominee. The MERS System is widely used by participants throughout the mortgage finance industry. The MERS System allows us to foreclose on delinquent loans more efficiently than we otherwise could ourselves.
Over the last several years, there have been legal challenges disputing MERS’s legal standing to initiate foreclosures and/or act as nominee in local land records.
It is possible that these challenges could negatively affect MERS’s ability to serve as the mortgagee of record in some jurisdictions. In addition, where MERS is the mortgagee of record, it must execute assignments of mortgages, affidavits and other legal documents in connection with foreclosure proceedings. As a result, investigations by governmental authorities and others into a servicer’s possible foreclosure process deficiencies may impact MERS. Failures by MERS to apply prudent and effective process controls and to comply with legal and other requirements in the foreclosure process could pose operational, reputational and legal risks that may materially and adversely affect our business, results of operations and financial condition.
With respect to mortgage loans we own, or which we have purchased and subsequently sold, we may be subject to liability for potential violations of truth-in-lending or other similar consumer protection laws and regulations, which could adversely impact our business and financial results.
Federal consumer protection laws and regulations regulate residential mortgage loan underwriting and originators’ lending processes, standards, and disclosures to borrowers. These laws and regulations include, among others, the Consumer Financial Protection Bureau’s “ability-to-repay” and “qualified mortgage” regulations. In addition, there are various other federal, state, and local laws and regulations that are intended to discourage predatory lending practices by residential mortgage loan originators. For example, the federal Home Ownership and Equity Protection Act of 1994 (“HOEPA”) which was expanded under the Dodd Frank Act, prohibits inclusion of certain provisions in residential mortgage loans that have mortgage rates or origination costs in excess of prescribed levels and requires that borrowers be given certain disclosures prior to origination. Some states have enacted, or may enact, similar laws or regulations, which in some cases may impose restrictions and requirements greater than those in place under federal laws and regulations. In addition, under the anti-predatory lending laws of some states, the origination of certain residential mortgage loans, including loans that are classified as “high cost” loans under applicable law, must satisfy a net tangible benefits test with respect to the borrower. This test, as well as certain standards set forth in the “ability-to-repay” and “qualified mortgage” regulations, may be highly subjective and open to interpretation. As a result, a court may determine that a residential mortgage loan did not meet the applicable standard or test even if the originator reasonably believed such standard or test had been satisfied. Failure of residential mortgage loan originators or servicers to comply with federal consumer protection laws and regulations could subject us, as an assignee or purchaser of these loans (or as an investor in securities backed by these loans), to monetary penalties and defenses to foreclosure, including by recoupment or setoff of damages and costs, which for some violations included the sum of all finance charges and fees paid by the consumer, and could result in rescission of the affected residential mortgage loans, which could adversely impact our business and financial results. On December 10, 2020, the Consumer Financial Protection Bureau adopted a set of “bright-line” loan pricing thresholds to replace the previous qualified mortgage 43% debt-to-income threshold calculated in accordance with “Appendix
ANNALY CAPITAL MANAGEMENT, INC. AND SUBSIDIARIES
Item 1A. Risk Factors
Q”. The Consumer Financial Protection Bureau also created a new category of a qualified mortgage, referred to as a “Seasoned QM”, which consists of first-lien, fixed rate loans that met certain performance requirements over a seasoning period of at least 36 months, are held in portfolio until the end of the seasoning period by the originating creditor or first purchaser, comply with general restrictions on product features and points and fees, and meet certain underwriting requirements. At this time, however, there can be no assurance what impact the final rules will have on the mortgage market and the “ability-to-repay” rules. Furthermore, the temporary qualified mortgage provision applicable to certain mortgage loans eligible for purchase or guarantee by the GSEs under the ability-to-repay, commonly referred to as the “GSE patch,” is scheduled to expire on the earlier of (i) the mandatory compliance date of the final rule amending the general qualified mortgage definition described above (which is July 1, 2021) or (ii) the date that the GSEs exit conservatorship. We cannot predict the impact of its expiration on the mortgage market.
We may not be able to obtain or maintain the governmental licenses required to operate our Residential Credit business and we may fail to comply with various state and federal laws and regulations applicable to our business of acquiring residential mortgage loans and servicing rights.
While we are not required to obtain licenses to purchase mortgage-backed securities, the purchase of residential mortgage loans and certain business purpose mortgage loans in the secondary market may, in some circumstances, require us to maintain various state licenses. Acquiring the right to service residential mortgage loans and certain business purpose mortgage loans may also, in some circumstances, require us to maintain various state licenses even though we currently do not expect to directly engage in loan servicing ourselves. As a result, we could be delayed in conducting certain business if we were first required to obtain a state license. We cannot assure you that we will be able to obtain all of the licenses we need or that we would not experience significant delays in obtaining these licenses. Furthermore, once licenses are issued we are required to comply with various information reporting and other regulatory requirements to maintain those licenses, and there is no assurance that we will be able to satisfy those requirements or other regulatory requirements applicable to our business of acquiring mortgage loans on an ongoing basis. Our failure to obtain or maintain required licenses or our failure to comply with regulatory requirements that are applicable to our business of acquiring mortgage loans may restrict our residential credit business and investment options and could harm our business and expose us to penalties or other claims.
Our ability to profitably execute or participate in future securitizations transactions, including, in particular, securitizations of residential mortgage loans, is dependent on numerous factors and if we are not able to achieve our desired level of profitability or if we are unable to execute or participate in future securitizations, or incur losses in connection therewith, it could have a material adverse impact on our business and financial results.
There are a number of factors that can have a significant impact on whether we are able to execute or participate in a securitization transaction, and whether such a transaction is profitable to us or results in a loss. One of these factors is the price we pay for the mortgage loans that we securitize, which, in the case of residential mortgage loans, is impacted by the level of competition in the marketplace for acquiring mortgage loans and the relative desirability to originators of retaining mortgage loans as investments or selling them to third parties such as us. As such, we can provide no assurance that we will be able to identify and make investments in residential mortgage loans at attractive levels and pricing, which could adversely affect our ability to execute future securitizations in this space. Another factor that impacts the profitability of a securitization transaction is the cost to us of the short-term warehouse financing facilities that we use to finance our holdings of mortgage loans prior to securitization, which cost is affected by a number of factors including the availability of this type of financing to us, the interest rate on this type of financing, the duration of the financing we incur, and the percentage of our mortgage loans for which third parties are willing to provide short-term financing. After we acquire mortgage loans that we intend to securitize, we can also suffer losses if the value of those loans declines prior to securitization. Declines in the value of a mortgage loan, for example, can be due to, among other things, changes in interest rates, changes in the credit quality of the loan, changes in the projected yields required by investors to invest in securitization transactions and changes in the mark-to-market value of the loan. To the extent we seek to hedge against a decline in loan value due to changes in interest rates, there is a cost of hedging that also affects whether a securitization is profitable. Other factors that can significantly affect whether a securitization transaction is profitable to us include the criteria and conditions that rating agencies apply and require when they assign ratings to the mortgage-backed securities issued in our securitization transactions, including the percentage of mortgage-backed securities issued in a securitization transaction that the rating agencies will assign a triple-A rating to, which is also referred to as a rating agency subordination level. Rating agency subordination levels can be impacted by numerous factors, including, without limitation, the credit quality of the loans securitized, the geographic distribution of the loans to be securitized, and the structure of the securitization transaction and other applicable rating agency criteria. All other factors being equal, the greater the percentage of the mortgage-backed securities issued in a securitization transaction that the rating agencies will assign a triple-A rating to, the more profitable the transaction will be to us.
The price that investors in mortgage-backed securities will pay for securities issued in our securitization transactions also has a significant impact on the profitability of the transactions to us, and these prices are impacted by numerous market forces and factors. In addition, the underwriter(s) or placement agent(s) we select for securitization transactions, and the terms of their
ANNALY CAPITAL MANAGEMENT, INC. AND SUBSIDIARIES
Item 1A. Risk Factors
engagement, can also impact the profitability of our securitization transactions. Also, transaction costs incurred in executing transactions impact the profitability of our securitization transactions and any liability that we may incur, or may be required to reserve for, in connection with executing a transaction can cause a loss to us. To the extent that we are not able to profitably execute future securitizations of residential mortgage loans or other assets, including for the reasons described above or for other reasons, it could have a material adverse impact on our business and financial results.
Risks Related to Our Business Structure
On June 30, 2020, we closed our Internalization. Pursuant to the Internalization Agreement, we acquired the equity interests of our Former Manager and its affiliates, which were owned by certain of our executive officers, for a nominal cash purchase price ($1.00), and transitioned from an externally-managed REIT to an internally-managed REIT.
We may be exposed to risks to which we have not historically been exposed as a result of the Internalization.
The Internalization which closed on June 30, 2020, may expose us to risks to which we have not historically been exposed. Pursuant to the Internalization Agreement, we acquired our Former Manager, including any potential future liabilities our Former Manager may have, which may be unforeseen. As a result of the Internalization, we now employ all the personnel who provide services to the Company, the majority of whom were previously employed by our Former Manager. Following the closing of the Internalization, we assumed responsibility for all employee compensation costs. In addition, we are now subject to those potential liabilities that are commonly faced by employers, such as workers’ disability and compensation claims, potential labor disputes and other employee-related liabilities and grievances, and we bear the costs of the establishment and maintenance of employee benefit plans.
The departure of any of our key personnel could materially and adversely affect us.
Our success and our ability to manage anticipated future growth depend, in large part, upon the efforts of our key personnel. Our executive officers have extensive experience and strong reputations in the sectors in which we operate and have been instrumental in setting our strategic direction, operating our business, identifying, recruiting, and training our key personnel, and arranging necessary financing. The departure of any of our executive officers, or our inability to attract and retain highly qualified personnel, could adversely affect our business, diminish our investment opportunities, and weaken our relationships with lenders, business partners and industry personnel, which could materially and adversely affect us.
Risks Related toof Ownership of Our Taxation as a REIT
Our failure to maintain our qualification as a REIT would have adverse tax consequences.Common Stock
We believe that since 1997 we have qualified for taxation as a REIT for U.S. federal income tax purposes under Sections 856 through 860•Our charter does not permit ownership of the Code. We plan to continue to meet the requirements for taxation as a REIT. The determination that we are a REIT requires an analysisover 9.8% in number of various factual matters and circumstances that may not be totally within our control. For example, to maintain our qualification as a REIT, at least 75% of our gross income must come from real estate sources and 95% of our gross income must come from real estate sources and certain other sources that are itemized in the REIT tax laws. Additionally, our ability to satisfy the REIT asset tests depends upon our analysis of the characterization and fair market values of our assets, some of which are not susceptible to precise determination, and for which we will not obtain independent appraisals. The proper classification of an instrument as debtshares or equity for U.S. federal income tax purposes may be uncertain in some circumstances, which could affect the application of the REIT asset requirements. We are also required to distribute to stockholders at least 90% of our REIT taxable income (determined without regard to the deduction for dividends paid and by excluding any net capital gain). Even a technical or inadvertent mistake could jeopardize our REIT status. Furthermore, Congress and the Internal Revenue Service (“IRS”) might make changes to the tax laws and regulations, and the courts might issue new rulings that make it more difficult or impossible for us to remain qualified as a REIT.
We also indirectly own interests in entities that have elected to be taxed as REITs under the U.S. federal income tax laws, or “Subsidiary REITs.” Subsidiary REITs are subject to the various REIT qualification requirements that are applicable to us. If any Subsidiary REIT were to fail to qualify as a REIT, then (i) that Subsidiary REIT would become subject to regular U.S. federal, state, and local corporate income tax, (ii) our interest in such Subsidiary REIT would cease to be a qualifying asset for purposes of the REIT asset tests, and (iii) it is possible that we would fail certain of the REIT asset tests, in which event we also would fail to maintain our qualification as a REIT unless we could avail ourselves of certain relief provisions. While we believe that the Subsidiary REITs have qualified as REITs under the Code, we have joined each Subsidiary REIT in filing “protective” TRS elections under Section 856(l) of the Code. We cannot assure you that such “protective” TRS elections would
ANNALY CAPITAL MANAGEMENT, INC. AND SUBSIDIARIES
Item 1A. Risk Factors
be effective to avoid adverse consequences to us. Moreover, even if the “protective” elections were to be effective, the Subsidiary REITs would be subject to regular corporate income tax, and we cannot assure you that we would not fail to satisfy the requirement that not more than 20% of the value of our total assets may be represented by the securities of onecommon stock or more TRSs. If we fail to maintain our qualification as a REIT, we would be subject to U.S. federal income tax at regular corporate rates. Also, unless the IRS were to grant us relief under certain statutory provisions, we would remain disqualified as a REIT for four years following the year we first fail to qualify. If we fail to maintain our qualification as a REIT, we would have to pay significant income taxes and would therefore have less money available for investments or for distributions to our stockholders. This would likely have a significant adverse effect on the valueany class of our equity. In addition, the tax law would no longer require us to make distributions to our stockholders.
A REIT that fails the quarterly asset tests for one or more quarters will not lose its REIT status as a result of such failure if either (i) the failure is regarded as a de minimis failure under standards set out in the Code, or (ii) the failure is greater than a de minimis failure but is attributable to reasonable cause and not willful neglect. In the case of a greater than de minimis failure, however, the REIT must pay a tax and must remedy the failure within six months of the close of the quarter in which the failure was identified. In addition, the Code provides relief for failures of other tests imposed as a condition of REIT qualification, as long as the failures are attributable to reasonable cause and not willful neglect. A REIT would be required to pay a penalty of $50,000, however, in the case of each failure.
We have certain distribution requirements, which could adversely affect our ability to execute our business plan.
As a REIT, we must distribute at least 90% of our REIT taxable income (determined without regard to the deduction for dividends paid and by excluding any net capital gain). The required distribution limits the amount we have available for other business purposes, including amounts to fund our growth. Also, it is possible that because of the differences between the time we actually receive revenue or pay expenses and the period we report those items for distribution purposes, we may have to borrow funds on a short-term basis to meet the 90% distribution requirement.
To the extent that we satisfy this distribution requirement, but distribute less than 100% of our taxable income, we will be subject to U.S. federal corporate income tax on our undistributed taxable income. In addition, we will be subject to a non-deductible 4% excise tax if the actual amount that we pay out to our stockholders in a calendar year is less than a minimum amount specified under U.S. federal tax laws. We intend to make distributions to our stockholders to comply with the REIT qualification requirements of the Code.
From time to time, we may generate taxable income greater than our income for financial reporting purposes prepared in accordance with GAAP, or differences in timing between the recognition of taxable income and the actual receipt of cash may occur. For example, if we purchase Agency or non-Agency securities at a discount, we generally are required to accrete the discount into taxable income prior to receiving the cash proceeds of the accreted discount at maturity, and in some cases, potentially recognize the discount in taxable income once such amounts are reflected in our financial statements. If we do not have other funds available in these situations we could be required to (i) borrow funds on unfavorable terms, (ii) sell investments at disadvantageous prices, (iii) distribute our own stock, see below, or (iv) distribute amounts that would otherwise be invested in future acquisitions to make distributions sufficient to enable us to pay out enough of our taxable income to satisfy the REIT distribution requirement and to avoid the corporate income tax and 4% excise tax in a particular year. Also, we or our subsidiaries may hold debt investments that could require subsequent modifications. If an amendment to an outstanding debt is a “significant modification” for U.S. federal income tax purposes, the modified debt may be deemed to have been reissued in a debt-for-debt taxable exchange with the borrower. This deemed reissuance could result in a portion of the modified debt not qualifying as a good REIT asset if the underlying security has declined in value, and would cause us to recognize income to the extent the principal amount of the modified debt exceeds our adjusted tax basis in the unmodified debt. These scenarios could increase our costs or reduce our stockholders’ equity. Thus, compliance with the REIT requirements may hinder our ability to grow, which could adversely affect the value of ourpreferred stock.
Conversely, from time to time, we may generate taxable income less than our income for financial reporting purposes due to GAAP and tax accounting differences or, as mentioned above, the timing between the recognition of taxable income and the actual receipt of cash. In such circumstances we may make distributions according to our business plan that are within our wherewithal from an economic or cash management perspective, but that are labeled as return of capital for tax reporting purposes, as they are in excess of taxable income in that period.
Distributions to tax-exempt investors may be classified as unrelated business taxable income.
Neither ordinary nor capital gain distributions with respect to our stock nor gain from the sale of our stock are anticipated to constitute unrelated business taxable income to a tax-exempt investor. However, there are certain exceptions to this rule. In particular:
ANNALY CAPITAL MANAGEMENT, INC. AND SUBSIDIARIES
Item 1A. Risk Factors
•part of the income and gain recognized by certain qualified employee pension trusts with respect to our stock may be treated as unrelated business taxable income if shares of our stock are predominantly held by qualified employee pension trusts, and we are required to rely on a special look-through rule for purposes of meeting one of the REIT ownership tests, and we are not operated in a manner to avoid treatment of such income or gain as unrelated business taxable income;
•part of the income and gain recognized byProvisions contained in Maryland law may have anti-takeover effects, potentially preventing investors from receiving a tax-exempt investor with respect to our stock would constitute unrelated business taxable income if the investor incurs debt in order to acquire the stock;“control premium” for their shares.
•part or allWe have not established a minimum dividend payment level and cannot assure stockholders of the income or gain recognized with respect to our stock by social clubs, voluntary
employee benefit associations, supplemental unemployment benefit trusts and qualified group legal services plans which are exempt from U.S. federal income taxation under the Code may be treated as unrelated business taxable income;
•to the extent that we (or a part of us, or a disregarded subsidiary of ours) are a “taxable mortgage pool,” or if we hold residual interests in a real estate mortgage investment conduit or a CLO;
•a portion of the distributions paid to a tax-exempt stockholder that is allocable to excess inclusion income may be treated as unrelated business taxable income.
We may in the future chooseability to pay dividends in our own stock, in which case the stockholders may be required to pay income taxes in excess of the cash dividends they receive.
We may in the future distribute taxable dividends that are payable in cash or shares of our stock at the election of each stockholder. Taxable stockholders receiving such dividends will be required to include the full amount of the dividend as ordinary income to the extent of our current and accumulated earnings and profits for U.S. federal income tax purposes. As a result, stockholders may be required to pay income taxes with respect to such dividends in excess of the cash dividends received. If a U.S. stockholder sells the stock that it receives as a dividend in order to pay this tax, the sales proceeds may be less than the amount included in income with respect to the dividend, depending on the market price of our stock at the time of the sale. Furthermore, with respect to certain non-U.S. stockholders, we may be required to withhold U.S. tax with respect to such dividends, including in respect to all or a portion of such dividend that is payable in stock. In addition, if a significant number of our stockholders determine to sell shares of our stock in order to pay taxes owed on dividends, it may put downward pressure on the trading price of our stock.future.
Our inability to deduct for tax purposes certain compensation paid to our executives could require us to increase our distributions to stockholders or pay entity level taxes to maintain our REIT status.
Our inability to deduct for tax purposes certain compensation paid to our executives could require us to increase our distributions to stockholders or pay entity level taxes to maintain our REIT status. Section 162(m) of the Code prohibits publicly held corporations from taking a tax deduction for annual compensation in excess of $1 million paid to any of the corporation’s “covered employees,” which, under current law, includes a corporation’s chief executive officer, chiefreported GAAP financial officer and the three other most highly compensated executive officers. In addition, under the Tax Cuts and Jobs Act of 2017 (“TCJA”), once an individual becomes a covered employee after December 31, 2016, that individual will remain a covered employee for all future years including after termination or death. If we were to pay compensation to “covered employees” in excess of the Section 162(m) deductibility limit, then our taxable income would be greater than it otherwise would have been had the compensation been fully deductible, and, as a result, we would be required to distribute a larger amount of dividends to our stockholders to maintain our REIT status and/or to avoid U.S. federal and state income tax, which could adversely affect our financial condition.
Limits on ownership of our stock could have adverse consequences to you and could limit your opportunity to receive a premium on our stock.
To maintain our qualification as a REIT for U.S. federal income tax purposes, not more than 50% in value of the outstanding shares of our capital stockresults may be owned, directly or indirectly, by five or fewer individuals (as defined in the federal tax laws to include certain entities). Primarily to facilitate maintenance of our qualification as a REIT for U.S. federal income tax purposes, our charter prohibits ownership, directly or by the attribution provisions of the federal tax laws, by any person of more than 9.8% of the lesser of the number or value of the issued and outstanding shares of any class of our capital stock. Our Board, in its sole and absolute discretion, may waive or modify the ownership limit with respect to one or more persons who would not be treated as “individuals” if it is satisfied that ownership in excessan accurate indicator of this limit will not otherwise jeopardize our status as a REIT for U.S. federal income tax purposes.
ANNALY CAPITAL MANAGEMENT, INC. AND SUBSIDIARIES
Item 1A. Risk Factors
The ownership limit may have the effect of delaying, deferring or preventing a change in control and, therefore, could adversely affect our stockholders’ ability to realize a premium over the then-prevailing market price for our stock in connection with a change in control.
A REIT cannot invest more than 20% of its total assets in the stock or securities of one or more TRSs; therefore, our TRSs cannot constitute more than 20% of our total assets.
A TRS is a corporation, other than a REIT or a qualified REIT subsidiary, in which a REIT owns stock and with which the REIT jointly elects TRS status. The term also includes a corporate subsidiary in which the TRS owns more than a 35% interest.
A REIT may own up to 100% of the stock of one or more TRSs. A TRS may earn income that would not be qualifying income if it was earned directly by the parent REIT. Overall, at the close of any calendar quarter, no more than 20%of the value of a REIT’s assets may consist of stock or securities of one or more TRSs.
The stock and securities of our TRSs are expected to represent less than 20% of the value of our total assets. Furthermore, we intend to monitor the value of our investments in the stock and securities of our TRSs to ensure compliance with the above-described limitation. We cannot assure you, however, that we will always be able to comply with the limitation so as to maintain REIT status.
TRSs are subject to tax at the regular corporate rates, are not required to distribute dividends, and the amount of dividends a TRS can pay to its parent REIT may be limited by REIT gross income tests.
A TRS must pay income tax at regular corporate rates on any income that it earns. In certain circumstances, the ability of our TRSs to deduct interest expenses for U.S. federal income tax may be limited. Such income, however, is not required to be distributed. Our TRSs will pay corporate income tax on theirfuture taxable income and their after-tax net income will be available for distributiondividend distributions.
Compliance, Regulatory & Legal Risks
•Accounting rules related to us.
Moreover, the annual gross income tests that must be satisfied to maintain our REIT qualification may limit the amount of dividends that we can receive from our TRSs. Generally, not more than 25%certain of our gross income cantransactions are highly complex and involve significant judgment and assumptions. Our application of GAAP may produce financial results that fluctuate from one period to another.
•New laws may be derived from non-real estate related sources, such as dividends from a TRS. If, for any taxable year,passed affecting the dividends we receive from our TRSs, when added to our other items of non-real estate related income, were to represent more than 25% of our total gross income forrelationship between Fannie Mae, Freddie Mac and the year, we could be denied REIT status, unless we were able to demonstrate, among other things, that our failure of the gross income test was due to reasonable cause and not willful neglect.
The limitations imposed by the REIT gross income tests may impede our ability to distribute assets from our TRSs to us in the form of dividends. Certain asset transfers may, therefore, have to be structured as purchase and sale transactions upon which our TRSs recognize a taxable gain.federal government.
If interest accrues on indebtedness owed by a TRS to its parent REIT at a rate in excess of a commercially reasonable rate, or if transactions between a REIT and a TRS are entered into on other than arm’s-length terms, then the REITWe may be subject to a penalty tax.liability for potential violations of truth-in-lending or other similar consumer protection laws and regulations.
If interest accrues on an indebtedness owed by a TRS to its parent REIT at a rate in excess of a commercially reasonable rate, then the REIT would be subject to tax at a rate of 100% on the excess of (i) interest payments made by a TRS to its parent REIT over (ii) the amount of interest that would have been payable had interest accrued on the indebtedness at a commercially reasonable rate. A tax at a rate of 100% is also imposed on any transaction between a TRS and its parent REIT to the extent the transaction gives rise to deductions to the TRS that are in excess of the deductions that would have been allowable had the transaction been entered into on arm’s-length terms. While we will scrutinize all of our transactions with our TRSs in an effort to ensure that we do not become subject to these taxes, there is no assurance that we will be successful. •We may not be able to avoid application of these taxes.
Even ifmaintain compliance with laws and regulations applicable to our Residential Credit and MSR businesses, including through the manner in which we remain qualified as a REIT, we may face other tax liabilities that reduce our cash flow.
Even if we remain qualified for taxation as a REIT, we may be subject to certain federal, state and local taxes on our income and assets, including taxes on any undistributed income, tax on income from some activities conducted as a result of a foreclosure, excise taxes, state or local income, property and transfer taxes, such as mortgage recording taxes, and other taxes. In addition, in order to meetoversee the REIT qualification requirements, prevent the recognition of certain types of non-cash income, or to avert the imposition of a 100% tax that applies to certain gains derived by a REIT from dealer property or inventory, we
ANNALY CAPITAL MANAGEMENT, INC. AND SUBSIDIARIES
Item 1A. Risk Factors
may hold somecompliance obligations of our assets through our TRSs or other subsidiary corporations that will be subject to corporate level income tax at regular rates.third party service providers.
Complying with REIT requirements may cause us to forgo otherwise attractive opportunities.
To remain qualified as a REIT for U.S. federal income tax purposes, we must continually satisfy tests concerning, among other things, the sources of our income, the nature and diversification of our assets, the amounts that we distribute to our stockholders and the ownership of our stock. We may be required to make distributions to stockholders at disadvantageous times or when we do not have funds readily available for distribution, and may be unable to pursue investments that would be otherwise advantageous to us in order to satisfy the source-of-income or asset-diversification requirements for qualifying as a REIT. Thus, compliance with the REIT requirements may hinder our ability to make and, in certain cases, to maintain ownership of, certain attractive investments.
Complying with REIT requirements may force us to liquidate otherwise attractive investments.
To remain qualified as a REIT, we must ensure that at the end of each calendar quarter, at least 75% of the value of our assets consists of cash, cash items, U.S. Government securities and qualified real estate assets. The remainder of our investment in securities (other than U.S. Government securities, qualified real estate assets and securities issued by a TRS) generally cannot include more than 10% of the outstanding voting securities of any one issuer or more than 10% of the total value of the outstanding securities of any one issuer. In addition, in general, no more than 5% of the value of our assets (other than U.S. Government securities, qualified real estate assets and securities issued by a TRS) can consist of the securities of any one issuer, and no more than 20% of the value of our total assets can be represented by securities of one or more TRSs. Changes in the valueslaws or other features ofregulations governing our assets could cause inadvertent violations of the REIT requirements. If we failoperations or our failure to comply with the REIT requirements at the end of any calendar quarter, we must correct the failure within 30 days after the end of the calendar quarterthose laws or qualify for certain statutory relief provisions to avoid losing our REIT qualification and suffering adverse tax consequences. As a result, weregulations may be required to liquidate from our investment portfolio otherwise attractive investments. These actions could have the effect of reducing our income and amounts available for distribution to our stockholders.
Liquidation of assets may jeopardize our REIT qualification or create additional tax liability for us.
To remain qualified as a REIT, we must comply with requirements regarding the composition of our assets and our sources of income. If we are compelled to liquidate our investments to repay obligations to our lenders, we may be unable to comply with these requirements, ultimately jeopardizing our qualification as a REIT, or we may be subject to a 100% tax on any resultant gain if we sell assets that are treated as dealer property or inventory.
The failure of assets subject to repurchase agreements to qualify as real estate assets could adversely affect our abilitybusiness.
•The increased focus on ESG and climate change issues by investors, governmental bodies and other stakeholders, as well as existing and proposed laws and regulations related to remain qualified as a REIT.
We enter into certain financing arrangements that are structured as salethese topics, may adversely affect our business and repurchase agreements pursuant to which we nominally sell certain offinancial results and damage our assets to a counterparty and simultaneously enter into an agreement to repurchase these assets at a later date in exchange for a purchase price. Economically, these agreements are financings that are secured by the assets sold pursuant thereto, and we treat them as such for U.S. federal income tax purposes. We believe that we would be treated for REIT asset and income test purposes as the owner of the assets that are the subject of any such sale and repurchase agreement notwithstanding that such agreement may transfer record ownership of the assets to the counterparty during the term of the agreement. It is possible, however, that the IRS could assert that we did not own the assets during the term of the sale and repurchase agreement, in which case we could fail to remain qualified as a REIT.reputation.
Complying with REIT requirements may limit our abilityWe are subject to hedge effectivelycomplex and may cause us to incur tax liabilities.
The REIT provisions of the Code could substantially limit our ability to hedge our liabilities. Any income from a properly designated hedging transaction we enter into to manage risk of interest rate changes with respect to borrowings made or to be made, or ordinaryevolving laws, regulations, rules, standards and contractual obligations incurred or to be incurred, to acquire or carry real estate assets generally does not constitute “gross income” for purposes of the 75% or 95% gross income tests. To the extent that we enter into other types of hedging transactions, the income from those transactions is likely to be treated as non-qualifying income for purposes of both of the gross income tests. As a result of these rules, we may have to limit our use of advantageous hedging techniques or implement those hedges through our TRSs. Thisregarding data privacy and security, which could increase the cost of our hedging activities because our TRSs would bedoing business, compliance risks and potential liability.
•We are subject to tax on gains or expose us to greater risks associated with changes in interest rates than we would otherwise want to bear. In addition, losses in our TRSs generally will not provide any tax benefit, except for being carried back for up to five years (for
ANNALY CAPITAL MANAGEMENT, INC. AND SUBSIDIARIES
Item 1A. Risk Factors
losses incurred after 2017 but prior to 2021) or carried forward potentially to offset taxable income in the TRSs for such periods.
The failure of a mezzanine loan or similar debt to qualify as a real estate asset could adversely affect our ability to qualify as a REIT.
We invest in mezzanine loans and similar debt (including preferred equity investments that we treat as mezzanine loans for U.S. federal income tax purposes), for which the IRS has provided a safe harbor but not rules of substantive law. Pursuant to the safe harbor, if a mezzanine loan meets certain requirements, it will be treated by the IRS as a real estate asset for purposes of the REIT asset tests, and interest derived from the mezzanine loan will be treated as qualifying mortgage interest for purposes of the REIT 75% income test. We may acquire mezzanine loans or similar debt that do not meet all of the requirements of this safe harbor. In the event we own a mezzanine loan or similar debt that does not meet the safe harbor, the IRS could challenge such loan’s treatment as a real estate asset for purposes of the REIT asset and income tests and, if such a challenge were sustained, we could fail to maintain our qualification as a REIT.
Qualifying as a REIT involves highly technical and complex provisions of the Code.
Qualification as a REIT involves the application of highly technical and complex Code provisions for which only limited judicial and administrative authorities exist. Even a technical or inadvertent violation could jeopardize our REIT qualification. Our continued qualification as a REIT depends on our satisfaction of certain asset, income, organizational, distribution, stockholder ownership and other requirements on a continuing basis. In addition, our ability to satisfy the REIT qualification requirements depends in part on the actions of third parties over which we have no control or only limited influence, including in cases where we own an equity interest in an entity that is classified as a partnership for U.S. federal income tax purposes.
The tax on prohibited transactions will limit our ability to engage in transactions, including certain methods of structuring CMOs.
The 100% tax on prohibited transactions will limit our ability to engage in transactions, including certain methods of structuring CMOs, which would be treated as prohibited transactions for U.S. federal income tax purposes.
The term “prohibited transaction” generally includes a sale or other disposition of property (including mortgage loans, but other than foreclosure property, as discussed below) that is held primarily for sale to customers in the ordinary course of a trade or business by us or by a borrower that has issued a shared appreciation mortgage or similar debt instrument to us. We could be subject to this tax if we were to dispose of or structure CMOs in a manner that was treated as a prohibited transaction for U.S. federal income tax purposes.
We intend to conduct our operations at the REIT level so that no asset that we own (or are treated as owning) will be treated as or as having been, held for sale to customers, and that a sale of any such asset will not be treated as having been in the ordinary course of our business. As a result, we may choose not to engage in certain transactions at the REIT level, and may limit the structures we utilize for our CMO transactions, even though the sales or structures might otherwise be beneficial to us. In addition, whether property is held “primarily for sale to customers in the ordinary course of a trade or business” depends on the particular facts and circumstances. No assurance can be given that any property that we sell will not be treated as property held for sale to customers, or that we can comply with certain safe-harbor provisions of the Code that would prevent such treatment. The 100% tax does not apply to gains from the sale of property that is held through a TRS or other taxable corporation, although such income will be subject to tax in the hands of the corporation at regular corporate rates. We intend to structure our activities to avoid the prohibited transaction tax.
Certain financing activities may subject us to U.S. federal income tax and could have negative tax consequences for our stockholders.
We may enter into securitization transactions and other financing transactions that could result in us, or a portion of our assets, being treated as a taxable mortgage pool for U.S. federal income tax purposes. If we enter into such a transaction in the future, we could be taxable at the highest corporate income tax rate on a portion of the income arising from a taxable mortgage pool, referred to as "excess inclusion income," that is allocable to the percentage of our shares held in record name by disqualified organizations (generally tax-exempt entities that are exempt from the tax on unrelated business taxable income, such as state pension plans and charitable remainder trusts and government entities). In that case, we could reduce distributions to such stockholders by the amount of tax paid by us that is attributable to such stockholder's ownership.
ANNALY CAPITAL MANAGEMENT, INC. AND SUBSIDIARIES
Item 1A. Risk Factors
If we were to realize excess inclusion income, IRS guidance indicates that the excess inclusion income would be allocated among our stockholders in proportion to the dividends paid. Excess inclusion income cannot be offset by losses of a stockholder. If the stockholder is a tax-exempt entity and not a disqualified organization, then this income would be fully taxable as unrelated business taxable income under Section 512 of the Code. If the stockholder is a foreign person, it would be subject to U.S. federal income tax at the maximum tax rate and withholding will be required on this income without reduction or exemption pursuant to any otherwise applicable income tax treaty.
The lease of qualified healthcare properties to a TRS is subject to special requirements.
We lease certain qualified healthcare properties we acquired from MTGE Investment Corp. (“MTGE”) to a TRS, which hires a manager to manage the healthcare operations at these properties. The lease revenues from this structure are treated as rents from real property if (1) they are paid pursuant to an arms-length lease of a qualified healthcare property with a TRS and (2) the manager qualifies as an “eligible independent contractor,” as defined in the Code. If any of these conditions is not satisfied, then the rents may not be treated as revenues from real property for purposes of the REIT gross income tests.
Uncertainty exists with respect to the treatment of our TBAs for purposes of the REIT asset and income tests.
We purchase and sell Agency mortgage-backed securities through TBAs and recognize income or gains from the disposition of those TBAs, through dollar roll transactions or otherwise, and may continue to do so in the future. While there is no direct authority with respect to the qualification of TBAs as real estate assets or U.S. Government securities for purposes of the 75% asset test or the qualification of income or gains from dispositions of TBAs as gains from the sale of real property (including interests in real property and interests in mortgages on real property) or other qualifying income for purposes of the 75% gross income test, we treat our TBAs as qualifying assets for purposes of the REIT asset tests, and we treat income and gains from our TBAs as qualifying income for purposes of the 75% gross income test, based on an opinion of counsel substantially to the effect that (i) for purposes of the REIT asset tests, our ownership of a TBA should be treated as ownership of real estate assets, and (ii) for purposes of the 75% REIT gross income test, any gain recognized by usliabilities in connection with the settlementsponsoring, investing in and managing new funds and other investment accounts, including potential regulatory risks.
•Loss of our TBAs should be treated as gainInvestment Company Act exemption from the sale or disposition of an interest in mortgages on real property. Opinions of counsel are not binding on the IRS, and no assurance can be given that the IRS will not successfully challenge the conclusions set forth in such opinions. In addition, it must be emphasized that the opinion of counsel is based on various assumptions relating to our TBAs and is conditioned upon fact-based representations and covenants made by our management regarding our TBAs. No assurance can be given that the IRSregistration would not assert that such assets or income are not qualifying assets or income. If the IRS were to successfully challenge the opinion of counsel, we could be subject to a penalty tax or we could fail to remain qualified as a REIT if a sufficient portion of our assets consists of TBAs or a sufficient portion of our income consists of income or gains from the disposition of TBAs.
Dividends payable by REITs generally receive different tax treatment than dividend income from regular corporations.
Qualified dividend income payable to U.S. stockholders that are individuals, trusts and estates is subject to the reduced maximum tax rate applicable to capital gains. Dividends payable by REITs, however, generally are not eligible for the reduced qualified dividend rates. Under current law, non-corporate taxpayers may deduct up to 20% of certain pass-through business income, including “qualified REIT dividends” (generally, dividends received by a REIT shareholder that are not designated as capital gain dividends or qualified dividend income), subject to certain limitations, resulting in an effective maximum U.S. federal income tax rate of 29.6% on such income. Although the reduced U.S. federal income tax rate applicable to qualified dividend income does not adversely affect the taxation of REITs or dividends payable by REITs, the more favorable rates applicable to regular corporate qualified dividends could cause investors who are individuals, trusts and estates to perceive investments in REITs to be relatively less attractive than investments in the stocks of non-REIT corporations that pay dividends, which could adversely affect the value of the shares of REITs, including our stock. Tax rates could be changed in future legislation.
New legislation or administrative or judicial action, in each instance potentially with retroactive effect, could make it more difficult or impossible for us to remain qualified as a REIT.
The present U.S. federal income tax treatment of REITs may be modified, possibly with retroactive effect, by legislative, judicial or administrative action at any time, which could affect the U.S. federal income tax treatment of an investment in us. The U.S. federal income tax rules dealing with REITs constantly are under review by persons involved in the legislative process, the IRS and the U.S. Treasury, which results in statutory changes as well as frequent revisions to regulations and
ANNALY CAPITAL MANAGEMENT, INC. AND SUBSIDIARIES
Item 1A. Risk Factors
interpretations. Additional future revisions in federal tax laws and interpretations thereof could affect or cause us to change our investments and commitments and affect the tax considerations of an investment in us.
Risks of Ownership of Our Common Stock
•Our charter does not permit ownership of over 9.8% in number of shares or value of our common stock or any class of our preferred stock.
•Provisions contained in Maryland law may have anti-takeover effects, potentially preventing investors from receiving a “control premium” for their shares.
•We have not established a minimum dividend payment level and cannot assure stockholders of our ability to pay dividends in the future.
•Our reported GAAP financial results may not be an accurate indicator of future taxable income and dividend distributions.
Compliance, Regulatory & Legal Risks
•Accounting rules related to certain of our transactions are highly complex and involve significant judgment and assumptions. Our application of GAAP may produce financial results that fluctuate from one period to another.
•New laws may be passed affecting the relationship between Fannie Mae, Freddie Mac and the federal government.
•We may be subject to liability for potential violations of truth-in-lending or other similar consumer protection laws and regulations.
•We may not be able to maintain compliance with laws and regulations applicable to our Residential Credit and MSR businesses, including through the manner in which we oversee the compliance obligations of our third party service providers.
•Changes in laws or regulations governing our operations or our failure to comply with those laws or regulations may adversely affect our business.
•The increased focus on ESG and climate change issues by investors, governmental bodies and other stakeholders, as well as existing and proposed laws and regulations related to these topics, may adversely affect our business and financial results and damage our reputation.
•We are subject to complex and evolving laws, regulations, rules, standards and contractual obligations regarding data privacy and security, which could increase the cost of doing business, compliance risks and potential liability.
•We are subject to risks and liabilities in connection with sponsoring, investing in and managing new funds and other investment accounts, including potential regulatory risks.
•Loss of our Investment Company Act exemption from registration would adversely affect us.
Risks Related to Our Taxation as a REIT
•Our failure to maintain our qualification as a REIT would have adverse tax consequences.
•Our distribution requirements could adversely affect our ability to execute our business plan.
•Distributions to tax-exempt investors may be classified as unrelated business taxable income.
•We may choose to pay dividends in our own stock.
•Our TRSs cannot constitute more than 20% of our total assets.
•TRSs are subject to tax at the regular corporate rates, are not required to distribute dividends, and the amount of dividends a TRS can pay to its parent REIT may be limited by REIT gross income tests.
•If transactions between a REIT and a TRS are entered into on other than arm’s-length terms, the REIT may be subject to a penalty tax.
•Even if we remain qualified as a REIT, we may face other tax liabilities that reduce our cash flow.
•Complying with REIT requirements may cause us to forgo otherwise attractive opportunities and may force us to liquidate otherwise attractive investments.
•Liquidation of assets may jeopardize our REIT qualification or create additional tax liability for us.
ANNALY CAPITAL MANAGEMENT, INC. AND SUBSIDIARIES
Item 1A. Risk Factors
•The failure of assets subject to repurchase agreements to qualify as real estate assets could adversely affect our ability to remain qualified as a REIT.
•Complying with REIT requirements may limit our ability to hedge effectively and may cause us to incur tax liabilities.
•Qualifying as a REIT involves highly technical and complex provisions of the Code.
•The tax on prohibited transactions limits our ability to engage in certain transactions.
•Certain financing activities may subject us to U.S. federal income tax and could have negative tax consequences for our stockholders.
•Uncertainty exists with respect to the treatment of our TBAs for purposes of the REIT asset and income tests.
•Dividends payable by REITs generally receive different tax treatment than dividend income from regular corporations.
•New legislation or administrative or judicial action, in each instance potentially with retroactive effect, could make it more difficult or impossible for us to remain qualified as a REIT.
Counterparty Risks
•The soundness of our counterparties and other financial institutions could adversely affect us.
•We are subject to counterparty risk and may be unable to seek indemnity or require counterparties to repurchase residential whole loans if they breach representations and warranties, which could cause us to suffer losses.
•Our rights under our repurchase and derivative agreements are subject to the effects of the bankruptcy laws in the event of the bankruptcy or insolvency of us or our lenders.
Investment and Market Related Risks
•We may experience declines in the market value of our assets.
•Investments in MSR may expose us to additional risks.
•A prolonged economic slowdown or declining real estate values could impair the assets we may own.
•An increase in interest rates may adversely affect the market value of our interest earning assets and, therefore, also our book value.
•Actions by the Federal Reserve may affect the price and returns of our assets.
•We invest in securities that are subject to mortgage credit risk.
•Our investments in real estate and other securities are subject to changes in credit spreads as well as available market liquidity, which could adversely affect our ability to realize gains on the sale of such investments.
•Geographic concentration exposes investors to greater risk of default and loss.
•Inadequate property insurance coverage could have an adverse impact on our operating results.
•Our assets may become non-performing or sub-performing assets in the future.
•We may be required to repurchase residential mortgage loans or indemnify investors if we breach representations and warranties.
•Our and our third party service providers’ and servicers’ due diligence of potential assets may not reveal all of the weaknesses in such assets.
•When we foreclose on an asset, we may come to own the property securing the loan.
•Proposals to acquire mortgage loans by eminent domain may adversely affect the value of our assets.
•Subordinated tranches of non-Agency mortgage-backed securities are subordinate in right of payment to more senior securities.
•Our hedging strategies may be costly, and may not hedge our risks as intended.
•We are subject to risks of loss from weather conditions, man-made or natural disasters and the direct and indirect effects of climate change.
Operational and Cybersecurity Risks
•Inaccurate models or the data used by models may expose us to risk.
•We are highly dependent on information systems and networks, many of which are operated by third parties, and any failure of these systems or networks could materially and adversely affect our business.
•Cyberattacks or other information security breaches could adversely affect our business, reputation and financial condition.
•We depend on third party service providers, including mortgage loan servicers and sub-servicers, for a variety of services related to our business.
•Our investments in residential whole loans subject us to servicing-related risks.
•The performance of loans underlying our MSR related assets may be adversely affected by the performance of the related mortgage servicer.
•An increase or decrease in prepayment rates may adversely affect our profitability.
•We are subject to reinvestment risk.
•Competition may affect availability and pricing of our target assets.
•We may enter into new lines of business, acquire other companies or engage in other strategic initiatives.
•Some of our investments, including those related to non-prime loans, involve credit risk.
•If we are unable to attract, motivate and retain qualified talent, including our key personnel, it could materially and adversely affect us.
Other Risks
•The market price and trading volume of our shares of common stock may be volatilevolatile.
•We may change our policies without stockholder approval.
ANNALY CAPITAL MANAGEMENT, INC. AND SUBSIDIARIES
Item 1A. Risk Factors
Risks Related to Our Liquidity and issuancesFunding
Our strategy involves the use of large amountsleverage, which increases the risk that we may incur substantial losses.
We expect our leverage to vary with market conditions and our assessment of sharesrisk/return on investments. We incur this leverage by borrowing against a substantial portion of the market value of our common stock could cause assets. Leverage, which is fundamental to our investment strategy, creates significant risks. The risks associated with leverage are more acute during periods of economic slowdown or recession.
Because of our leverage, we may incur substantial losses if our borrowing costs increase, and we may be unable to execute our investment strategy if leverage is unavailable or is unavailable on attractive terms. The reasons our borrowing costs may increase or our ability to borrow may decline include, but are not limited to, the following:
•short-term interest rates increase;
•the market pricevalue of our common stockinvestments available to decline.collateralize borrowings decreases;
•the “haircut” applied to our assets under the repurchase agreements or other secured financing arrangements increases;
•interest rate volatility increases;
•disruption in the repo market generally or the infrastructure, including technology infrastructure, that supports it; or
•the availability of financing in the market decreases.
Our use of leverage may result in margin calls and defaults and force us to sell assets under adverse market conditions.
Because of our leverage, a decline in the value of our interest earning assets may result in our lenders initiating margin calls. A margin call means that the lender requires us to pledge additional collateral to re-establish the ratio of the value of the collateral to the amount of the borrowing. Borrowings secured by our fixed-rate mortgage-backed securities generally are more susceptible to margin calls as increases in interest rates tend to more negatively affect the market value of fixed-rate securities. Margin calls are most likely in market conditions in which the unencumbered assets that we would use to meet the margin calls have also decreased in value. The risks associated with margin calls are more acute during periods of economic slowdown or recession.
If we issue a significant number of shares of common stockare unable to satisfy margin calls, our lenders may foreclose on our collateral. This could force us to sell our interest earning assets under adverse market conditions, or securities convertible into common stock in a short period of time, thereallow lenders to sell those assets on our behalf at prices that could be a dilutionbelow our estimation of their value. Additionally, in the event of our bankruptcy, our borrowings, which are generally made under repurchase agreements, may qualify for special treatment under the U.S. Bankruptcy Code. This special treatment would allow the lenders under these agreements to avoid the automatic stay provisions of the U.S. Bankruptcy Code and to liquidate the collateral under these agreements without delay.
We may exceed our target leverage ratios.
We generally expect to maintain an economic leverage ratio of less than 10:1. However, we are not required to stay below this economic leverage ratio. We may exceed this ratio by incurring additional debt without increasing the amount of equity we have. For example, if we increase the amount of borrowings under our master repurchase agreements with our existing common stockor new counterparties or the market value of our portfolio declines, our economic leverage ratio would increase. If we increase our economic leverage ratio, the adverse impact on our financial condition and results of operations from the types of risks associated with the use of leverage would likely be more severe. Our target economic leverage ratio is set for the portfolio as a decreasewhole, rather than separately for each asset type. The economic leverage ratio on Agency mortgage-backed securities may exceed the target ratio for the portfolio as a whole. Because credit assets are generally less levered than Agency mortgage-backed securities, at a given economic leverage ratio an increased allocation to credit assets generally means an increase in economic leverage on Agency mortgage-backed securities. The economic leverage on our Agency mortgage-backed securities is the primary driver of the risk of being unable to meet margin calls discussed above.
We may not be able to achieve our optimal leverage.
We use leverage as a strategy to increase the return to our investors. However, we may not be able to achieve our desired leverage if we determine that the leverage would expose us to excessive risk; our lenders do not make funding available to us at acceptable rates; or our lenders require that we provide additional collateral to cover our borrowings.
ANNALY CAPITAL MANAGEMENT, INC. AND SUBSIDIARIES
Item 1A. Risk Factors
Failure to procure or renew funding on favorable terms, or at all, would adversely affect our results and financial condition.
One or more of our lenders could be unwilling or unable to provide us with financing. This could potentially increase our financing costs and reduce our liquidity. Furthermore, if any of our potential lenders or existing lenders is unwilling or unable to provide us with financing or if we are not able to renew or replace maturing borrowings, we could be forced to sell our assets at an inopportune time when prices are depressed. Our business, results of operations and financial condition may be materially adversely affected by disruptions in the market price of the common stock.
The market price of our shares of common stock may be highly volatile and could be subject to wide fluctuations. In addition, the trading volume in our shares of common stock may fluctuate and cause significant price variations to occur.financial markets. We cannot assure you that, the market priceunder such extreme conditions, these markets will remain an efficient source of financing for our assets. If our strategy is not viable, we will have to find alternative forms of financing for our assets, which may not be available. Further, as a REIT, we are required to distribute annually at least 90% of our shares of common stock willREIT taxable income (subject to certain adjustments) to our stockholders and are, therefore, not fluctuate or decline significantly in the future. Some of the factors that could negatively affect our share price or result in fluctuations in the price or trading volumeable to retain significant amounts of our shares of common stock include those set forth under “Special Note Regarding Forward-Looking Statements” as well as:
•actual or anticipated variations in our quarterly operating results or business prospects;
•changes in our earnings estimates or publication of research reports about us or the real estate industry;
•an inability to meet or exceed securities analysts’ estimates or expectations;
•increases in market interest rates;
•hedging or arbitrage trading activity in our shares of common stock;
•capital commitments;
•changes in market valuations of similar companies;
•adverse market reaction to any increased indebtedness we incur in the future;
•additions or departures of management personnel;
•actions by institutional stockholders or activist investors;
•speculation in the press or investment community;
•changes in our distribution policy;
•government action or regulation;
•general market and economic conditions;
•market dislocations related to the COVID-19 pandemic; and
•future sales of our shares of common stock or securities convertible into, or exchangeable or exercisable for our shares of common stock.
Holders of our shares of common stock will be subject to the risk of volatile market prices and wide fluctuations in the market price of our shares of common stock. These factors may cause the market price of our shares of common stock to decline, regardless of our financial condition, results of operations, business or prospects. It is impossible tonew investments. We cannot assure you that the market prices of our shares of common stockany, or sufficient, funding or capital will not fallbe available to us in the future.
Under our charter,future on terms that are acceptable to us. If we have 3,000,000,000 authorized shares of capital stock, par value of $0.01 per share. Sales ofcannot obtain sufficient funding on acceptable terms, there may be a substantial number of shares of our common stock or other equity-related securities in the public market, or any hedging or arbitrage trading activity that may develop involving our common stock, could depressnegative impact on the market price of our common stock and impair our ability to make distributions to our stockholders. Moreover, our ability to grow will be dependent on our ability to procure additional funding. To the extent we are not able to raise additional funds through the issuance of additional equity or borrowings, our growth will be constrained.
Failure to effectively manage our liquidity would adversely affect our results and financial condition.
Our ability to meet cash needs depends on many factors, several of which are beyond our control. Ineffective management of liquidity levels could cause us to be unable to meet certain financial obligations. Potential conditions that could impair our liquidity include: unwillingness or inability of any of our potential lenders to provide us with or renew financing, margin calls, additional capital requirements applicable to our lenders, a disruption in the financial markets or declining confidence in our creditworthiness or in financial markets in general. These conditions could force us to sell our assets at inopportune times or otherwise cause us to potentially revise our strategic business initiatives.
Volatile market conditions for our assets can result in contraction in liquidity for those assets and the related financing.
Our results of operations are materially affected by conditions in the markets for mortgages and mortgage-related assets, including Agency mortgage-backed securities, as well as the broader financial markets and the economy generally.
Significant adverse changes in financial market conditions can result in a deleveraging of the global financial system and the forced sale of large quantities of mortgage-related and other financial assets. Concerns over economic recession, pandemic diseases, geopolitical issues including events such as the war in Ukraine, trade wars, unemployment, inflation, government actions to combat inflation, rising interest rates, the availability and cost of financing, the mortgage market, the repurchase agreement market and a declining real estate market or prolonged government shutdown may contribute to increased volatility and diminished expectations for the economy and markets.
For example, as a result of the financial crises beginning in the summer of 2007 and through the subsequent credit and housing crisis, many traditional mortgage investors suffered severe losses in their residential mortgage portfolios and several major market participants failed or were impaired, resulting in a significant contraction in market liquidity for mortgage-related assets. This illiquidity negatively affected both the terms and availability of financing for all mortgage-related assets.
Further increased volatility and deterioration in the markets for mortgages and mortgage-related assets as well as the broader financial markets may adversely affect the performance and market value of our Agency mortgage-backed securities. If these conditions exist, institutions from which we seek financing for our investments may tighten their lending standards or become insolvent, which could make it more difficult for us to obtain financing on favorable terms or at all. Our profitability and financial condition may be adversely affected if we are unable to obtain cost-effective financing for our investments.
An increase in the interest payments on our borrowings relative to the interest we earn on our interest earning assets may adversely affect our profitability.
We generally earn money based upon the spread between the interest payments we earn on our interest earning assets and the interest payments we must make on our borrowings. If the interest payments on our borrowings increase relative to the interest we earn on our interest earning assets, our profitability may be adversely affected. A significant portion of our assets are longer-term, fixed-rate interest earning assets, and a significant portion of our borrowings are shorter-term, floating-rate borrowings. Periods of rising interest rates or a relatively flat or inverted yield curve could decrease or eliminate the spread between the interest payments we earn on our interest earning assets and the interest payments we must make on our borrowings.
ANNALY CAPITAL MANAGEMENT, INC. AND SUBSIDIARIES
Item 1A. Risk Factors
Differences in timing of interest rate adjustments on our interest earning assets and our borrowings may adversely affect our profitability.
We rely primarily on short-term borrowings to acquire interest earning assets with long-term maturities. Some of the interest earning assets we acquire are adjustable-rate interest earning assets. This means that their interest rates may vary over time based upon changes in an objective index, such as:
•Treasury Rate. A monthly or weekly average yield of benchmark U.S. Treasury securities, as published by the Federal Reserve Board.
•Secured Overnight Financing Rate. A measure of the cost of borrowing cash overnight collateralized by U.S. Treasury securities, as published by the Federal Reserve Bank of New York.
•Term SOFR. A benchmark based on Secured Overnight Financing Rate futures, administered by CME Group.
These indices generally reflect short-term interest rates. The interest rates on our borrowings similarly reflect short-term interest rates. Nevertheless, the interest rates on our borrowings generally adjust more frequently than the interest rates on our adjustable-rate interest earning assets, which are also typically subject to periodic and lifetime interest rate caps. Accordingly, in a period of rising interest rates, we could experience a decrease in net income or a net loss because the interest rates on our borrowings adjust faster than the interest rates on our adjustable-rate interest earning assets.
It may be uneconomical to “roll” our TBA dollar roll transactions or we may be unable to meet margin calls on our TBA contracts.
From time to time, we enter into TBAs as an alternate means of investing in and financing Agency mortgage-backed securities. A TBA contract is an agreement to purchase or sell, for future delivery, an Agency mortgage-backed security with a specified issuer, term and coupon. A TBA dollar roll represents a transaction where TBA contracts with the same terms but different settlement dates are simultaneously bought and sold. The TBA contract settling in the later month typically prices at a discount to the earlier month contract with the difference in price commonly referred to as the “drop”. The drop is a reflection of the expected net interest income from an investment in similar Agency mortgage-backed securities, net of an implied financing cost, that would be foregone as a result of settling the contract in the later month rather than in the earlier month. The drop between the current settlement month price and the forward settlement month price occurs because in the TBA dollar roll market, the party providing the implied financing is the party that would retain all principal and interest payments accrued during the financing period. Accordingly, TBA dollar roll income generally represents the economic equivalent of the net interest income earned on the underlying Agency mortgage-backed security less an implied financing cost. Consequently, dollar roll transactions and such forward purchases of Agency securities represent a form of off-balance sheet financing and increase our “at risk” leverage.
The economic return of a TBA dollar roll generally equates to interest income on a generic TBA-eligible security less an implied financing cost, and there may be situations in which the implied financing cost exceeds the interest income, resulting in a negative carry on the position. If we roll our TBA dollar roll positions when they have a negative carry, the positions would decrease net income and amounts available for distributions to shareholders.
There may be situations in which we are unable or unwilling to roll our TBA dollar roll positions. The TBA transaction could have a negative carry or otherwise be uneconomical, we may be unable to find counterparties with whom to trade in sufficient volume, or we may be required to collateralize the TBA positions in a way that is uneconomical. Because TBA dollar rolls represent implied financing, an inability orunwillingness to roll has effects similar to any other loss of financing. If we do not roll our TBA positions prior to the settlement date, we would have to take physical delivery of the underlying securities and settle our obligations for cash. We may not have sufficient funds or alternative financing sources available to settle such obligations. Counterparties may also make margin calls as the value of a generic TBA-eligible security (and therefore the value of the TBA contract) declines. Margin calls on TBA positions or failure to roll TBA positions could have the effects described in the liquidity risks described above.
Our use of derivatives may expose us to counterparty and liquidity risks.
Most swaps that we enter into must be executed on a Swap Extension Facility and/or be cleared by a Derivatives Clearing Organization (“DCO”), both of which are regulated by the CFTC. DCOs are subject to regulatory oversight and use extensive risk management processes, which result in additional expenses and collateral requirements for our swaps relative to uncleared swaps. We access the DCO through several Futures Commission Merchants (“FCMs”). For any cleared swap, we bear the credit risk of both the DCO and the relevant FCM, in the form of potential late or unrecoverable payments, potential difficulty
ANNALY CAPITAL MANAGEMENT, INC. AND SUBSIDIARIES
Item 1A. Risk Factors
or delay in accessing collateral that we have posted, and potential loss of any positive market value of the swap position. In the event of a default by the DCO or FCM, we also bear market risk, if the asset or liability being hedged is no longer effectively hedged.
We also bear fees for use of the DCO and Swap Execution Facility, as well as risks associated with trade errors. Because the standardized swaps available on Swap Execution Facilities and cleared through DCOs are not as customizable as uncleared swaps, we may bear additional basis risk from hedge positions that do not exactly reflect the interest rate risk on the asset being hedged.
Futures transactions are subject to risks analogous to those of cleared swaps, except that for futures transactions we bear a higher risk that collateral we have posted is unavailable to us if the FCM defaults.
Some derivatives transactions, such as swaptions, are not currently required to be cleared through a DCO. Therefore, we bear the credit risk of the dealer with which we executed the swaption or other uncleared transaction. TBA contracts and swaps on CMBX indexes are also not cleared, and we bear the credit risk of the dealer.
Certain derivative transactions are subject to margin requirements. The relevant contract or clearinghouse rules dictate the method of determining the required amount of margin, the types of collateral accepted and the timing required to meet margin calls. Additionally, for cleared swaps and futures, FCMs may have the right to require more margin than the clearinghouse requires. The requirement to meet margin calls can create liquidity risks, and we bear the cost of funding the margin that we post. Also, as discussed above, we bear credit risk if a dealer, FCM, or clearinghouse is holding collateral we have posted.
Generally, we attempt to retain the ability to close out of a hedging position or create an offsetting position. However, in some cases we may not be able to do so at economically viable prices, or we may be unable to do so without consent of the counterparty. Therefore, in some situations a derivative position can be illiquid, forcing us to hold it to its maturity or scheduled termination date.
It is possible that new regulations could be issued governing the derivatives market, including requiring additional types of derivatives to be executed on Swap Execution Facilities or cleared through a DCO. Ongoing regulatory change in this area could increase costs, increase risks, and adversely affect our business and results of operations.
Securitizations expose us to additional risks.
In a securitization structure, we convey a pool of assets to a special purpose vehicle, the issuing entity, and in turn the issuing entity issues one or more classes of non-recourse notes pursuant to the terms of an indenture. The notes are secured by the pool of assets. In exchange for the transfer of assets to the issuing entity, we receive the cash proceeds of the sale of additional equity securities.non-recourse notes and a 100% interest in certain subordinate interests of the issuing entity. The securitization of all or a portion of our residential loan portfolio might magnify our exposure to losses because any subordinate interest we retain in the issuing entity would be subordinate to the notes issued to investors and we would, therefore, absorb all of the losses sustained with respect to a securitized pool of assets before the owners of the notes experience any losses. Moreover, we cannot assure you that we will be able to access the securitization market or be able to do so at favorable rates. The inability to securitize our portfolio could adversely affect our performance and our ability to grow our business.
Our use of non-recourse securitizations may expose us to risks which could result in losses to us.
We utilize non-recourse securitizations of our assets in mortgage loans, especially loans that we originate, when they are available. Prior to any such financing, we may seek to finance assets with relatively short-term facilities until a sufficient portfolio is accumulated. As a result, we would be subject to the risk that we would not be able to acquire, during the period that any short-term facilities are available, sufficient eligible assets to maximize the efficiency of a securitization. We also would bear the risk that we would not be able to obtain a new short-term facility or would not be able to renew any short-term facilities after they expire should we need more time to seek and acquire sufficient eligible assets for a securitization. In addition, conditions in the capital markets, including potential volatility and disruption in the capital and credit markets, may not permit a non-recourse securitization at any particular time or may make the issuance of any such securitization less attractive to us even when we do have sufficient eligible assets. While we would intend to retain the non-investment grade tranches of securitizations and, therefore, still have exposure to any assets included in such securitizations, our inability to enter into such securitizations would increase our overall exposure to risks associated with direct ownership of such assets, including the risk of default. Our inability to refinance any short-term facilities would also increase our risk because borrowings thereunder would likely be recourse to us as an entity. If we are unable to obtain and renew short-term facilities or to consummate securitizations to finance our assets on a long-term basis, we may be required to seek other forms of potentially less attractive financing or to liquidate assets at an inopportune time or price. To the extent that we are unable to obtain
ANNALY CAPITAL MANAGEMENT, INC. AND SUBSIDIARIES
Item 1A. Risk Factors
financing for our assets, to the extent that we retain such assets in our portfolio, our returns on investment and earnings will be negatively impacted.
Counterparties may require us to enter into covenants that restrict our investment strategy.
If or when we obtain debt financing, lenders (especially in the case of credit facilities) may impose restrictions on us that would affect our ability to incur additional debt, make certain allocations or acquisitions, reduce liquidity below certain levels, make distributions to our stockholders, or redeem debt or equity securities, and may impact our flexibility to determine our operating policies and strategies. We may sell assets or reduce leverage at an inopportune time to avoid breaching these restrictions. If we fail to meet or satisfy any of these covenants, we would be in default under these agreements, and our lenders could elect to declare outstanding amounts due and payable, terminate their commitments, require the posting of additional collateral and enforce their interests against existing collateral. We may also be subject to cross-default and acceleration rights and, with respect to collateralized debt, the posting of additional collateral and foreclosure rights upon default. A default and resulting repayment acceleration could significantly reduce our liquidity, which could require us to sell our assets to repay amounts due and outstanding. This could also significantly harm our business, financial condition, results of operations and ability to make distributions, which could cause our share price to decline. A default could also significantly limit our financing alternatives such that we would be unable to pursue our leverage strategy, which could adversely affect our returns.
We may be unable to profitably execute or participate in future securitization transactions.
There are a number of factors that can have a significant impact on whether we are able to execute or participate in a securitization transaction, and whether such a transaction is profitable to us or results in a loss. One of these factors is the price we pay for the mortgage loans that we securitize, which, in the case of residential mortgage loans, is impacted by the level of competition in the marketplace for acquiring mortgage loans and the relative desirability to originators of retaining mortgage loans as investments or selling them to third parties such as us. As such, we can provide no assurance that we will be able to identify and make investments in residential mortgage loans at attractive levels and pricing, which could adversely affect our ability to execute future securitizations in this space. Another factor that impacts the profitability of a securitization transaction is the cost to us of the short-term warehouse financing facilities that we use to finance our holdings of mortgage loans prior to securitization, which cost is affected by a number of factors including the availability of this type of financing to us, the interest rate on this type of financing, the duration of the financing we incur, and the percentage of our mortgage loans for which third parties are willing to provide short-term financing. After we acquire mortgage loans that we intend to securitize, we can also suffer losses if the value of those loans declines prior to securitization. Declines in the value of a mortgage loan, for example, can be due to, among other things, changes in interest rates, changes in the credit quality of the loan, and changes in the projected yields required by investors to invest in securitization transactions. To the extent we seek to hedge against a decline in loan value due to changes in interest rates, there is a cost of hedging that also affects whether a securitization is profitable. Other factors that can significantly affect whether a securitization transaction is profitable to us include the criteria and conditions that rating agencies apply and require when they assign ratings to the mortgage-backed securities issued in our securitization transactions, including the percentage of mortgage-backed securities issued in a securitization transaction that the rating agencies will assign a triple-A rating to, which is also referred to as a rating agency subordination level. Rating agency subordination levels can be impacted by numerous factors, including, without limitation, the credit quality of the loans securitized, the geographic distribution of the loans to be securitized, the structure of the securitization transaction and other applicable rating agency criteria. All other factors being equal, the greater the percentage of the mortgage-backed securities issued in a securitization transaction that the rating agencies will assign a triple-A rating to, the more profitable the transaction will be to us.
The price that investors in mortgage-backed securities will pay for securities issued in our securitization transactions also has a significant impact on the profitability of the transactions to us, and these prices are impacted by numerous market forces and factors. In addition, the underwriter(s) or placement agent(s) we select for securitization transactions, and the terms of their engagement, can also impact the profitability of our securitization transactions. Also, transaction costs incurred in executing transactions impact the profitability of our securitization transactions and any liability that we may incur, or may be required to reserve for, in connection with executing a transaction can cause a loss to us. To the extent that we are not able to profitably execute future securitizations of residential mortgage loans or other assets, including for the reasons described above or for other reasons, it could have a material adverse impact on our business and financial results.
ANNALY CAPITAL MANAGEMENT, INC. AND SUBSIDIARIES
Item 1A. Risk Factors
Risks of Ownership of Our Common Stock
Our charter does not permit ownership of over 9.8%, in number of shares or value of our common stock or any class of our preferred stock and attempts to acquirestock.
To maintain our common stock or preferred stockqualification as a REIT for U.S. federal income tax purposes, not more than 50% in excessvalue of the 9.8% limit without prior approval fromoutstanding shares of our Board are void.
capital stock may be owned, directly or indirectly, by five or fewer individuals (as defined in the federal tax laws to include certain entities). For the purpose of preserving our REIT qualification and for other reasons, our charter prohibits direct or constructive ownership by any person of more than 9.8% of the total number or value of any class of our outstanding common stock or any class of our preferred stock. Our charter’s constructive ownership rules are complex and may cause the outstanding stock owned by a group of related individuals or entities to be deemed to be constructively owned by one individual or entity. As a result, the acquisition of less than 9.8% of the outstanding shares of any class of common stock or any class of our preferred stock by an individual or entity could cause that individual or entity to own constructively in excess of 9.8% of the outstanding shares of such class of stock and thus be subject to our charter’s ownership limit. Any attempt to own or transfer shares of our common stock or preferred stock in excess of the ownership limit without the consent of the Board shall be void, or, alternatively, will result in the shares being transferred by operation of law to a charitable trust. Our Board, in its sole and absolute discretion, may waive or modify the ownership limit with respect to one or more persons who would not be treated as “individuals” if it is satisfied that ownership in excess of this limit will not otherwise jeopardize our status as a REIT for U.S. federal income tax purposes. The ownership limit may have the effect of delaying, deferring or preventing a change in control and, therefore, could adversely affect our stockholders’ ability to realize a premium over the then-prevailing market price for our stock in connection with a change in control.
Provisions contained in Maryland law that are reflected in our charter and bylaws may have anti-takeover effects, potentially preventing investors from receiving a “control premium” for their shares.
ANNALY CAPITAL MANAGEMENT, INC. AND SUBSIDIARIES
Item 1A. Risk Factors
Provisions contained in our charter and bylaws, as well as the Maryland General Corporation Law (the “MGCL”) corporate law,, may have anti-takeover effects that delay, defer or prevent a takeover attempt, which may prevent stockholders from receiving a “control premium” for their shares. For example, these provisions may defer or prevent tender offers for our common stock or purchases of large blocks of our common stock, thereby limiting the opportunities for our stockholders to receive a premium for their common stock over then-prevailing market prices. These provisions include the following:
•Ownership limit. The ownership limit in our charter limits related investors including, among other things, any voting group, from acquiring over 9.8% of any class our common stock or of our preferred stock, in each case, in number of shares or value, without the consent of our Board.
•Preferred Stock. Our charter authorizes our Board to issue preferred stock in one or more classes and to establish the preferences and rights of any class of preferred stock issued. These actions can be taken without soliciting stockholder approval.
•Maryland Business Combination Act. The Maryland Business Combination Act provides that, subject to certain exceptions and limitations, certain business combinations between a Maryland corporation and an “interested stockholder” (defined generally as any person who beneficially owns 10% or more of the voting power of our outstanding voting stock or an affiliate or associate of ours who, at any time within the two-year period immediately prior to the date in question, was the beneficial owner of 10% or more of the voting power of our then outstanding shares of stock) or an affiliate of any interested stockholder are prohibited for five years after the most recent date on which the stockholder becomes an interested stockholder, and thereafter imposes two super-majority stockholder voting requirements on these combinations, unless, among other
conditions, our common stockholders receive a minimum price, as defined in the MGCL, for their shares of stock and the consideration is received in cash or in the same form as previously paid by the interested stockholder for its shares of stock. We have opted out of the Maryland Business Combination Act in our charter. However, if we
amend our charter to opt back in to the statute, subject to stockholder approval, the Maryland Business Combination Act could have the effect of discouraging offers to acquire us and of increasing the difficulty of consummating any such offers, even if our acquisition would be in our stockholders’ best interests.
•Maryland Control Share Acquisition Act. The Maryland Control Share Acquisition Act provides that, subject to certain exceptions, holders of “control shares” (defined as voting shares that, when aggregated with all other shares controlled by the stockholder, entitle the stockholder to exercise one of three increasing ranges of voting power in electing directors) acquired in a “control share acquisition” (defined as the direct or indirect acquisition of ownership or control of issued and outstanding “control shares”) have no voting rights except to the extent approved by our stockholders by the affirmative vote of at least two-thirds of all the votes entitled to be cast on the matter, excluding
ANNALY CAPITAL MANAGEMENT, INC. AND SUBSIDIARIES
Item 1A. Risk Factors
shares owned by the acquirer, by our officers, or by our employees who are also directors of our company. We are currently subject to the Maryland Control Share Acquisition Act.
•Title 3, Subtitle 8 of the MGCL: These provisions of the MGCL permit our boardBoard of directors,Directors, without stockholder approval and regardless of what
is provided in our charter or bylaws, to implement certain takeover defenses, including adopting a classified board or increasing the vote required to remove a director.
Broad market fluctuations could negatively impact the market price of our shares of common stock.
The stock market has experienced extreme price and volume fluctuations that have affected the market price of many companies in industries similar or related to ours and that have been unrelated to these companies’ operating performance. These broad market fluctuations could reduce the market price of our shares of common stock. Furthermore, our operating results and prospects may be below the expectations of public market analysts and investors or may be lower than those of companies with comparable market capitalizations, which could lead to a material decline in the market price of our shares of common stock.
We have not established a minimum dividend payment level and cannot assure stockholders of our ability to pay dividends in the future.
We intend to pay quarterly dividends and to make distributions to our stockholders in amounts such that all or substantially all of our taxable income in each year (subject to certain adjustments) is distributed. This enables us to qualify for the tax benefits accorded to a REIT under the Code. We have not established a minimum dividend payment level and our ability to pay dividends may be adversely affected for the reasons described in this section. All distributions will be made at the discretion of our Board and will depend on our earnings, our financial condition, maintenance of our REIT status and such other factors as our Board may deem relevant from time to time.
ANNALY CAPITAL MANAGEMENT, INC. AND SUBSIDIARIES
Item 1A. Risk Factors
Our reported GAAP financial results differ from the taxable income results that impact our dividend distribution requirements and, therefore, our GAAP results may not be an accurate indicator of future taxable income and dividend distributions.
Generally, the cumulative net income we report over the life of an asset will be the same for GAAP and tax purposes, although the timing of this income recognition over the life of the asset could be materially different. Differences exist in the accounting for GAAP net income and REIT taxable income that can lead to significant variances in the amount and timing of when income and losses are recognized under these two measures. Due to these differences, our reported GAAP financial results could materially differ from our determination of taxable income.
Compliance, Regulatory & Legal Risks
Accounting rules related to certain of our transactions are highly complex and involve significant judgment and assumptions. Our application of GAAP may produce financial results that fluctuate from one period to another.
Accounting rules for valuations of investments, mortgage loan sales and securitizations, investment consolidations, acquisitions of real estate and other aspects of our operations are highly complex and involve significant judgment and assumptions. These complexities could lead to a delay in preparation of financial information and the delivery of this information to our stockholders. Changes in accounting interpretations or assumptions could impact our financial statements and our ability to prepare our financial statements in a timely fashion. Our inability to prepare our financial statements in a timely fashion in the future would likely adversely affect our share price significantly. The fair value at which our assets may be recorded may not be an indication of their realizable value. Ultimate realization of the value of an asset depends to a great extent on economic and other conditions. Further, fair value is only an estimate based on good faith judgment of the price at which an investment can be sold since market prices of investments can only be determined by negotiation between a willing buyer and seller. If we were to liquidate a particular asset, the realized value may be more than or less than the amount at which such asset was recorded. Accordingly, the value of our common shares could be adversely affected by our determinations regarding the fair value of our investments, whether in the applicable period or in the future. Additionally, such valuations may fluctuate over short periods of time.
We have made certain accounting elections which may result in volatility in our periodic net income, as computed in accordance with GAAP. For example, changes in fair value of certain instruments are reflected in GAAP net income (loss) while others are reflected in Other comprehensive income (loss).
New laws may be passed affecting the relationship between Fannie Mae, Freddie Mac and the federal government.
The interest and principal payments we expect to receive on the Agency mortgage-backed securities in which we invest are guaranteed by Fannie Mae, Freddie Mac or Ginnie Mae. Principal and interest payments on Ginnie Mae certificates are directly guaranteed by the U.S. government. Principal and interest payments relating to the securities issued by Fannie Mae and Freddie Mac are only guaranteed by each respective Agency.
In September 2008, Fannie Mae and Freddie Mac were placed into the conservatorship of the FHFA, their federal regulator, pursuant to its powers under The Federal Housing Finance Regulatory Reform Act of 2008, a part of the Housing and
ANNALY CAPITAL MANAGEMENT, INC. AND SUBSIDIARIES
Item 1A. Risk Factors
Economic Recovery Act of 2008. In addition to FHFA becoming the conservator of Fannie Mae and Freddie Mac, the U.S. Department of the Treasury entered into Preferred Stock Purchase Agreements with the FHFA and have taken various actions intended to provide Fannie Mae and Freddie Mac with additional liquidity in an effort to ensure their financial stability. In September 2019, FHFA and the U.S. Treasury Department agreed to modifications to the Preferred Stock Purchase Agreements that will permit Fannie Mae and Freddie Mac to maintain capital reserves of $25 billion and $20 billion, respectively.
Shortly after Fannie Mae and Freddie Mac were placed in federal conservatorship, the Secretary of the U.S. Treasury suggested that the guarantee payment structure of Fannie Mae and Freddie Mac in the U.S. housing finance market should be re-examined. The future roles of Fannie Mae and Freddie Mac could be significantly reduced and the nature of their guarantees could be eliminated or considerably limited relative to historical measurements. The U.S. Treasury could also stop providing credit support to Fannie Mae and Freddie Mac in the future. Any changes to the nature of the guarantees provided by Fannie Mae and Freddie Mac could redefine what constitutes an Agency mortgage-backed security and could have broad adverse market implications. While the likelihood that major mortgage finance system reform will be enacted in the short term remains uncertain, it is possible that the adoption of any such reforms could adversely affect the types of assets we can buy, the costs of these assets and our business operations. A reduction in the ability of mortgage loan originators to access Fannie Mae and Freddie Mac to sell their mortgage loans may adversely affect the mortgage markets generally and adversely affect the ability of mortgagors to refinance their mortgage loans. In addition, any decline in the value of securities issued by Fannie Mae and Freddie Mac may affect the value of MBS in general. If Fannie Mae or Freddie Mac was eliminated, or their structures were to change in a material manner that is not compatible with our business model, we would not be able to acquire Agency mortgage-backed securities from these entities, which could adversely affect our business operations.
We may be subject to liability for potential violations of truth-in-lending or other similar consumer protection laws and regulations.
Residential mortgage loan originators and servicers are required to comply with various federal, state and local laws and regulations, including anti-predatory lending laws and laws and regulations imposing certain restrictions on requirements on high-cost loans. For example, the federal Home Ownership and Equity Protection Act of 1994 (“HOEPA”), prohibits inclusion of certain provisions in residential mortgage loans that have mortgage rates or origination costs in excess of prescribed levels and requires that borrowers be given certain disclosures prior to origination. Failure of residential mortgage loan originators or servicers to comply with these laws, to the extent any of their residential mortgage loans become part of our investment portfolio, could subject us, as an assignee or purchaser of the related residential mortgage loans, to reputational harm, monetary penalties and the risk of the borrowers rescinding the affected residential mortgage loans. Lawsuits have been brought in various states making claims against assignees or purchasers of high-cost loans for violations of state law. Named defendants in these cases have included numerous participants within the secondary mortgage market. If loans in our portfolio are found to have been originated in violation of predatory or abusive lending laws, we could incur losses that would materially adversely affect our business.
Our business is subject to, or affected by, numerous regulations, including regulations regarding mortgage loan servicing, underwriting, and loan originator compensation and others that could be issued in the future. For example, the CFPB’s “ability-to-repay” and “qualified mortgage” regulations impact the terms and conditions of all originated residential mortgage loans. Additionally, the CFPB has enforcement authority and broad discretionary regulatory authority to prohibit or condition terms, acts or practices relating to residential mortgage loans that the CFPB finds abusive, unfair, deceptive, or predatory, as well as to take other actions that the CFPB finds are necessary or proper to ensure responsible affordable mortgage credit remains available to consumers. These requirements can and do change as statutes and regulations are enacted, promulgated, amended, and interpreted, and the recent trends among federal and state lawmakers and regulators have been toward increasing compliance obligations in laws, regulations, and investigative procedures concerning the mortgage industry generally. As a result, we are unable to fully predict how laws or regulations that may be adopted in the future, will affect our business, results of operations and financial condition, or the environment for repurchase financing and other forms of borrowing, the investing environment for Agency MBS, non-Agency mortgage-backed securities and/or residential mortgage, and MSR.
Some states have enacted, or may enact, similar laws or regulations, which in some cases may impose restrictions and requirements greater than those in place under federal laws and regulations. In addition, under the anti-predatory lending laws of some states, the origination of certain residential mortgage loans, including loans that are classified as “high cost” loans under applicable law, must satisfy a net tangible benefits test with respect to the borrower. This test, as well as certain standards set forth in the “ability-to-repay” and “qualified mortgage” regulations, may be highly subjective and open to interpretation. As a result, a court may determine that a residential mortgage loan did not meet the applicable standard or test even if the originator reasonably believed such standard or test had been satisfied. Failure of residential mortgage loan originators or servicers to comply with federal consumer protection laws and regulations could subject us, as an assignee or purchaser of these loans (or as an investor in securities backed by these loans), to monetary penalties and defenses to foreclosure, including by recoupment or setoff of damages and costs, which for some violations included the sum of all finance charges and fees paid by the consumer,
ANNALY CAPITAL MANAGEMENT, INC. AND SUBSIDIARIES
Item 1A. Risk Factors
and could result in rescission of the affected residential mortgage loans, which could adversely impact our business and financial results.
The CFPB and other regulators (including the Federal Trade Commission) have provided multiple forms of guidance on the general subject of “junk fees.” As there has been no formal definition of “junk fees” proposed with respect to mortgage lending or servicing, it is possible that industry standard charges could be impacted through future regulatory action. The cost of whole loans and the servicing income derived from owning MSR could be affected by the CFPB categorizing any currently permissible fee or charge as “junk.”
We may not be able to maintain compliance with laws and regulations applicable to our Residential Credit or MSR businesses, including through the manner in which we oversee the compliance obligations of our third party service providers.
While we are not required to obtain licenses to purchase mortgage-backed securities, the purchase of residential mortgage loans and certain business purpose mortgage loans in the secondary market may, in some circumstances, require us to maintain various state licenses. Acquiring the right to service residential mortgage loans and certain business purpose mortgage loans may also, in some circumstances, require us to maintain various state licenses even though we currently do not expect to directly engage in loan servicing ourselves. As a result, we could be delayed in conducting certain business if we were first required to obtain a state license. We cannot assure you that we will be able to obtain all of the licenses we need or that we would not experience significant delays in obtaining these licenses. Furthermore, once licenses are issued we are required to comply with various information reporting and other regulatory requirements to maintain those licenses, and there is no assurance that we will be able to satisfy those requirements or other regulatory requirements applicable to our business of acquiring mortgage loans on an ongoing basis. Our failure to obtain or maintain required licenses or our failure to comply with regulatory requirements that are applicable to our business of acquiring mortgage loans may restrict our residential credit business and investment options and could harm our business and expose us to penalties or other claims.
Although we utilize unaffiliated servicing companies to carry out the actual servicing of MSR and the loans we purchase together with the related MSR (including all direct interface with the borrowers), we are ultimately responsible, vis-à-vis the borrowers and state and federal regulators, for ensuring that the loans and MSR are serviced in accordance with the terms of the related notes and mortgages and applicable law and regulation. To manage this risk, we have a robust oversight process that monitors the activities of the third party servicers. This oversight process is also subject to regulatory requirements and expectations that we are expected to meet.
Changes in laws or regulations governing our operations or our failure to comply with those laws or regulations may adversely affect our business.
We are subject to regulation by laws at the local, state and federal level, including securities and tax laws and financial accounting and reporting standards. These laws and regulations, as well as their interpretation, may be changed from time to time and result in enhanced disclosure obligations, including with respect to climate change or other environmental, social, or governance (“ESG”) topics, increasing our regulatory burden.
Accordingly, any change in these laws or regulations or the failure to comply with these laws or regulations could have a material adverse impact on our business. Certain of these laws and regulations pertain specifically to REITs.
The increased focus on ESG and climate change issues by investors, governmental bodies and other stakeholders, as well as existing and proposed laws and regulations related to these topics, may adversely affect our business and financial results and damage our reputation.
Our business faces increasing public scrutiny related to ESG activities, which are increasingly considered to contribute to reducing a company’s operational risk, market risk and reputational risk, which may in turn impact the long-term sustainability of a company’s performance. A variety of organizations measure the performance of companies on ESG topics, and the results of these assessments are widely publicized. Major institutional investors have publicly emphasized the importance of such ESG measures to their investment decisions. ESG and climate change issues are also increasingly important to the general public and the media, and actual or perceived underperformance with respect to these topics could result in negative press or sentiment with respect to our business. In addition, actual or perceived effects of climate change could negatively impact house prices, housing-related costs, and borrower behavior.
There is also growing governmental and regulatory interest across jurisdictions in improving the definition, measurement and disclosure of ESG factors in order to allow investors to validate and better understand ESG-related claims. To the extent we communicate ESG or climate-related statements, initiatives, commitments or goals in our SEC filings or in other disclosures,
ANNALY CAPITAL MANAGEMENT, INC. AND SUBSIDIARIES
Item 1A. Risk Factors
we face the risk of being accused of “greenwashing” to the extent our practices and policies do not match such claims. In addition, the SEC has established a climate and ESG task force to develop initiatives to identify ESG-related misconduct consistent with increased investor reliance on climate and ESG-related disclosure and investment. As a result, the SEC has started to bring enforcement actions based on ESG disclosures not matching actual investment processes.
In addition, the SEC is working on proposals for mandatory disclosure of certain ESG-related matters, including with respect to greenhouse gas emissions and climate change-related risks, and similar laws and regulations related to the disclosure and/or diligence of ESG and climate change-related risks have been enacted or proposed in U.S. states such as California, as well as the European Union and other jurisdictions. Compliance with any such new laws or regulations increases our regulatory burden and could make compliance more difficult and expensive, affect the manner in which we conduct our business and adversely affect our profitability and returns to our investors.
We are subject to complex and evolving laws, regulations, rules, standards and contractual obligations regarding data privacy and security, which could increase the cost of doing business, compliance risks and potential liability.
We are subject to complex and evolving laws, regulations, rules, standards and contractual obligations relating to data privacy and the security of personal information, and any failure to comply with these laws, regulations, rules, standards and contractual obligations could expose us to liability and/or reputational damage. The legal and regulatory environment surrounding data privacy and security in the U.S. and international jurisdictions is constantly evolving. New business initiatives have increased, and may continue to increase, the extent to which we are subject to such U.S. and international data privacy and security regulations. As new data privacy and security-related laws, regulations, rules and standards are implemented, the time and resources needed for us to comply with such laws, regulations, rules and standards, as well as our potential liability for non-compliance and reporting obligations in the case of cyberattacks, information security breaches or other similar incidents, may significantly increase. Compliance with these laws, regulations, rules and standards may require us to change our policies, procedures and technology for information security, which could, among other things, make us more vulnerable to operational failures and to monetary penalties for breach of such laws, regulations, rules and standards.
In the U.S., there are numerous federal, state and local data privacy and security laws and regulations governing the collection, sharing, use, retention, disclosure, security, storage, transfer and other processing of personal information. At the federal level, we are subject to, among other laws and regulations, the Gramm Leach Bliley Act (which regulates the confidentiality and security of customer information obtained by financial institutions and certain other types of financial services businesses) and regulations under it. Additionally, numerous states have enacted, or are in the process of enacting or considering, comprehensive state-level data privacy and security laws and regulations. Moreover, laws in all 50 U.S. states require businesses to provide notice under certain circumstances to consumers whose personal information has been disclosed as a result of a data breach.
Further, when required by applicable laws, regulations, rules and industry standards, we strive to provide or cause our service providers to provide privacy policies which are accurate and comprehensive. We cannot, however, ensure that the disclosure of these privacy policies and other statements regarding our practices will be sufficient to protect us from claims, proceedings, liability or adverse publicity relating to data privacy and security or with respect to the legally permissible sharing of data. Although we endeavor to comply with our privacy policies and to ensure our service providers do the same, occurrence of noncompliance or allegations of noncompliance are possible and could subject us to potential government or legal action, including action based on argument that the publication of these policies were deceptive, unfair, or misrepresentative of our actual practices. Any concerns about our data privacy and security practices, even if unfounded, could damage our reputation and adversely affect our business.
Any failure or perceived failure by us to comply with our privacy policies, or applicable data privacy and security laws, regulations, rules, standards or contractual obligations, or any compromise of security that results in unauthorized access to, or unauthorized loss, destruction, use, modification, acquisition, disclosure, release or transfer of personal information, may result in requirements to modify or cease certain operations or practices, the expenditure of substantial costs, time and other resources, proceedings or actions against us, legal liability, governmental investigations, enforcement actions, claims, fines, judgments, awards, penalties, sanctions and costly litigation (including class actions). Any of the foregoing could harm our reputation, distract our management and technical personnel, increase our costs of doing business, adversely affect the demand for our products and services, and ultimately result in the imposition of liability, any of which could have a material adverse effect on our business, financial condition and results of operations.
ANNALY CAPITAL MANAGEMENT, INC. AND SUBSIDIARIES
Item 1A. Risk Factors
We are subject to risks and liabilities in connection with sponsoring, investing in and managing new funds and other investment accounts, including potential regulatory risks.
We have, and may in the future, sponsor, manage and serve as general partner and/or manager of new funds or investment accounts. Such sponsorship and management of, and investment in, such funds and accounts may involve risks not otherwise present with a direct investment in such funds’ and accounts’ target investments, including, for example:
•the possibility that investors in the funds/accounts might become bankrupt or otherwise be unable to meet their capital commitment obligations;
•that operating and/or management agreements of a fund/account may restrict our ability to transfer or liquidate our interest when we desire or on advantageous terms;
•that our relationships with the investors will be generally contractual in nature and may be terminated or dissolved under the terms of the agreements, or we may be removed as general partner and/or manager (with or without cause), and
in such event, we may not continue to manage or invest in the applicable fund/account;
•that disputes between us and the investors may result in litigation or arbitration that would increase our expenses and prevent our officers and directors from focusing their time and effort on our business and result in subjecting the investments owned by the applicable fund/account to additional risk; and
•that we may incur liability for obligations of a fund/account by reason of being its general partner or manager.
We have a subsidiary that is registered with the SEC as an investment adviser under the Investment Advisers Act. As a result, we are subject to the anti-fraud provisions of the Investment Advisers Act and to fiduciary duties derived from these provisions that apply to our relationships with that subsidiary’s clients. These provisions and duties impose restrictions and obligations on us with respect to our dealings with our subsidiary’s clients, including, for example, restrictions on agency, cross and principal transactions. Our registered investment adviser subsidiary is subject to periodic SEC examinations and other requirements under the Investment Advisers Act and related regulations primarily intended to benefit advisory clients. These additional requirements relate to, among other things, maintaining an effective and comprehensive compliance program, recordkeeping and reporting requirements and disclosure requirements. The Investment Advisers Act generally grants the SEC broad administrative powers, including the power to limit or restrict an investment adviser from conducting advisory activities in the event it fails to comply with federal securities laws. Additional sanctions that may be imposed for failure to comply with applicable requirements under the Investment Advisers Act include the prohibition of individuals from associating with an investment adviser, the revocation of registrations and other censures and fines. We may in the future be required to register one or more entities as a commodity pool operator or commodity trading adviser, subjecting those entities to the regulations and oversight of the Commodity Futures Trading Commission and the National Futures Association. We may also become subject to various international regulations on the asset management industry.
Loss of our Investment Company Act exemption from registration would adversely affect us.
We intend to conduct our business so as not to become regulated as an investment company under the Investment Company Act. If we were to become subject to the Investment Company Act, our ability to use leverage would be substantially reduced, and we would be unable to conduct our business as we currently conduct it.
We currently rely on the exemption from registration provided by Section 3(c)(5)(C) of the Investment Company Act. Section 3(c)(5)(C), as interpreted by the staff of the SEC, requires us to invest at least 55% of our assets in “mortgages and other liens on and interest in real estate” (“Qualifying Real Estate Assets”) and at least 80% of our assets in Qualifying Real Estate Assets plus our interests in MSRsMSR and other real estate related assets. The assets that we acquire, therefore, are limited by this provision of the Investment Company Act and the rules and regulations promulgated under the Investment Company Act.
We rely on aan SEC interpretation that “whole pool certificates” that are issued or guaranteed by Fannie Mae, Freddie Mac or Ginnie Mae (“Agency Whole Pool Certificates”) are Qualifying Real Estate Assets under Section 3(c)(5)(C). This interpretation was promulgated by the SEC staff in a no-action letter over 30 years ago,in the 1980s, was reaffirmed by the SEC in 1992 and has been commonly relied upon by mortgage REITs.
On August 31, 2011, the SEC issued a concept release titled “Companies Engaged in the Business of Acquiring Mortgages and Mortgage-Related Instruments” (SEC Release No. IC-29778). In this concept release, the SEC announced it was reviewing interpretive issues related to the Section 3(c)(5)(C) exemption. Among other things, the SEC requested comments on whether it should revisit whether Agency Whole Pool Certificates may be treated as interests in real estate (and presumably Qualifying Real Estate Assets) and whether companies, such as us, whose primary business consists of investing in Agency Whole Pool Certificates are the type of entities that Congress intended to be encompassed by the exclusion provided by Section 3(c)(5)(C). The potential outcomes of the SEC’s actions are unclear as is the SEC’s timetable for its review and actions.
If the SEC changes its views regarding which securities are Qualifying Real Estate Assets or real estate related assets, adopts a contrary interpretation with respect to Agency Whole Pool Certificates or otherwise believes we do not satisfy the exemption under Section 3(c)(5)(C), we could be required to restructure our activities or sell certain of our assets. The net effect of these
ANNALY CAPITAL MANAGEMENT, INC. AND SUBSIDIARIES
Item 1A. Risk Factors
factors will be to lower our net interest income.income, which could negatively affect the market price of shares of our capital stock and our ability to distribute dividends. If we fail to qualify for exemption from registration as an investment company, our ability to use leverage would be substantially reduced, and we would not be able to conduct our business as described. Our business will be materially and adversely affected if we fail to qualify for this exemption.
Changes
Risks Related to Our Taxation as a REIT
Our failure to maintain our qualification as a REIT would have adverse tax consequences.
We believe that since 1997 we have qualified for taxation as a REIT for U.S. federal income tax purposes under Sections 856 through 860 of the Code. We plan to continue to meet the requirements for taxation as a REIT. The determination that we are a REIT requires an analysis of various factual matters and circumstances that may not be totally within our control. For example, to maintain our qualification as a REIT, at least 75% of our gross income must come from real estate sources and 95% of our gross income must come from real estate sources and certain other sources that are itemized in the REIT tax laws. Additionally, our ability to satisfy the REIT asset tests depends upon our analysis of the characterization and fair market values of our assets, some of which are not susceptible to precise determination, and for which we will not obtain independent appraisals. The proper classification of an instrument as debt or equity for U.S. federal income tax purposes may be uncertain in some circumstances, which could affect the application of the REIT asset requirements. We are also required to distribute to stockholders at least 90% of our REIT taxable income (determined without regard to the deduction for dividends paid and by excluding any net capital gain). Even a technical or inadvertent mistake could jeopardize our REIT status. Furthermore, Congress and the Internal Revenue Service (“IRS”) might make changes to the tax laws and regulations, and the courts might issue new rulings that make it more difficult or impossible for us to remain qualified as a REIT.
We also indirectly own interests in entities that have elected to be taxed as REITs under the U.S. federal income tax laws, or regulations governing“Subsidiary REITs.” Subsidiary REITs are subject to the various REIT qualification requirements that are applicable to us. If any Subsidiary REIT were to fail to qualify as a REIT, then (i) that Subsidiary REIT would become subject to regular U.S. federal, state, and local corporate income tax, (ii) our operationsinterest in such Subsidiary REIT would cease to be a qualifying asset for purposes of the REIT asset tests, and (iii) it is possible that we would fail certain of the REIT asset tests, in which event we also would fail to maintain our qualification as a REIT unless we could avail ourselves of certain relief provisions. While we believe that the Subsidiary REITs have qualified as REITs under the Code, we have joined each Subsidiary REIT in filing “protective” TRS elections under Section 856(l) of the Code. We cannot assure you that such “protective” TRS elections would be effective to avoid adverse consequences to us. Moreover, even if the “protective” elections were to be effective, the Subsidiary REITs would be subject to regular corporate income tax, and we cannot assure you that we would not fail to satisfy the requirement that not more than 20% of the value of our total assets may be represented by the securities of one or more TRSs. If we fail to maintain our qualification as a REIT, we would be subject to U.S. federal income tax at regular corporate rates. Also, unless the IRS were to grant us relief under certain statutory provisions, we would remain disqualified as a REIT for four years following the year we first fail to qualify. If we fail to maintain our qualification as a REIT, we would have to pay significant income taxes and would therefore have less money available for investments or for distributions to our stockholders. This would likely have a significant adverse effect on the value of our equity. In addition, the tax law would no longer require us to make distributions to our stockholders.
A REIT that fails the quarterly asset tests for one or more quarters will not lose its REIT status as a result of such failure if either (i) the failure is regarded as a de minimis failure under standards set out in the Code, or (ii) the failure is greater than a de minimis failure but is attributable to reasonable cause and not willful neglect. In the case of a greater than de minimis failure, however, the REIT must pay a tax and must remedy the failure within six months of the close of the quarter in which the failure was identified. In addition, the Code provides relief for failures of other tests imposed as a condition of REIT qualification, as long as the failures are attributable to reasonable cause and not willful neglect. A REIT would be required to pay a penalty of $50,000, however, in the case of each failure.
Our distribution requirements could adversely affect our ability to execute our business plan.
As a REIT, we must distribute at least 90% of our REIT taxable income (determined without regard to the deduction for dividends paid and by excluding any net capital gain). The required distribution limits the amount we have available for other business purposes, including amounts to fund our growth. Also, it is possible that because of the differences between the time we actually receive revenue or pay expenses and the period we report those items for distribution purposes, we may have to borrow funds on a short-term basis to meet the 90% distribution requirement.
To the extent that we satisfy this distribution requirement, but distribute less than 100% of our taxable income, we will be subject to U.S. federal corporate income tax on our undistributed taxable income. In addition, we will be subject to a non-deductible 4% excise tax if the actual amount that we pay out to our stockholders in a calendar year is less than a minimum
ANNALY CAPITAL MANAGEMENT, INC. AND SUBSIDIARIES
Item 1A. Risk Factors
amount specified under U.S. federal tax laws. We intend to make distributions to our stockholders to comply with those lawsthe REIT qualification requirements of the Code.
From time to time, we may generate taxable income greater than our income for financial reporting purposes prepared in accordance with GAAP, or regulationsdifferences in timing between the recognition of taxable income and the actual receipt of cash may occur. For example, if we purchase Agency or non-Agency securities at a discount, we generally are required to accrete the discount into taxable income prior to receiving the cash proceeds of the accreted discount at maturity, and in some cases, potentially recognize the discount in taxable income once such amounts are reflected in our financial statements. If we do not have other funds available in these situations we could be required to (i) borrow funds on unfavorable terms, (ii) sell investments at disadvantageous prices, (iii) distribute our own stock, or (iv) distribute amounts that would otherwise be invested in future acquisitions to make distributions sufficient to enable us to pay out enough of our taxable income to satisfy the REIT distribution requirement and to avoid the corporate income tax and 4% excise tax in a particular year. Also, we or our subsidiaries may hold debt investments that could require subsequent modifications. If an amendment to an outstanding debt is a “significant modification” for U.S. federal income tax purposes, the modified debt may be deemed to have been reissued in a debt-for-debt taxable exchange with the borrower. This deemed reissuance could result in a portion of the modified debt not qualifying as a good REIT asset if the underlying security has declined in value, and would cause us to recognize income to the extent the principal amount of the modified debt exceeds our adjusted tax basis in the unmodified debt. These scenarios could increase our costs or reduce our stockholders’ equity. Thus, compliance with the REIT requirements may hinder our ability to grow, which could adversely affect the value of our stock.
Conversely, from time to time, we may generate taxable income less than our income for financial reporting purposes due to GAAP and tax accounting differences or, as mentioned above, the timing between the recognition of taxable income and the actual receipt of cash. In such circumstances we may make distributions according to our business plan that are within our wherewithal from an economic or cash management perspective, but that are labeled as return of capital for tax reporting purposes, as they are in excess of taxable income in that period.
Distributions to tax-exempt investors may be classified as unrelated business taxable income.
Neither ordinary nor capital gain distributions with respect to our stock nor gain from the sale of our stock are anticipated to constitute unrelated business taxable income to a tax-exempt investor. However, there are certain exceptions to this rule. In particular:
•part of the income and gain recognized by certain qualified employee pension trusts with respect to our stock may be treated as unrelated business taxable income if shares of our stock are predominantly held by qualified employee pension trusts, and we are required to rely on a special look-through rule for purposes of meeting one of the REIT ownership tests, and we are not operated in a manner to avoid treatment of such income or gain as unrelated business taxable income;
•part of the income and gain recognized by a tax-exempt investor with respect to our stock would constitute unrelated business taxable income if the investor incurs debt in order to acquire the stock;
•part or all of the income or gain recognized with respect to our stock by social clubs, voluntary employee benefit associations, supplemental
unemployment benefit trusts and qualified group legal services plans which are exempt from U.S. federal income taxation under the Code may be treated as unrelated business taxable income;
•to the extent that we (or a part of us, or a disregarded subsidiary of ours) are a “taxable mortgage pool,” or if we hold residual interests in a real estate mortgage investment conduit or a CLO;
•a portion of the distributions paid to a tax-exempt stockholder that is allocable to excess inclusion income may be treated as unrelated business taxable income.
We may choose to pay dividends in our own stock.
We may in the future distribute taxable dividends that are payable in cash or shares of our stock at the election of each stockholder. Taxable stockholders receiving such dividends will be required to include the full amount of the dividend as ordinary income to the extent of our current and accumulated earnings and profits for U.S. federal income tax purposes. As a result, stockholders may be required to pay income taxes with respect to such dividends in excess of the cash dividends received. If a U.S. stockholder sells the stock that it receives as a dividend in order to pay this tax, the sales proceeds may be less than the amount included in income with respect to the dividend, depending on the market price of our stock at the time of the sale. Furthermore, with respect to certain non-U.S. stockholders, we may be required to withhold U.S. tax with respect to
ANNALY CAPITAL MANAGEMENT, INC. AND SUBSIDIARIES
Item 1A. Risk Factors
such dividends, including in respect to all or a portion of such dividend that is payable in stock. In addition, if a significant number of our stockholders determine to sell shares of our stock in order to pay taxes owed on dividends, it may put downward pressure on the trading price of our stock.
Our TRSs cannot constitute more than 20% of our total assets.
A TRS is a corporation, other than a REIT or a qualified REIT subsidiary, in which a REIT owns stock and with which the REIT jointly elects TRS status. The term also includes a corporate subsidiary in which the TRS owns more than a 35% interest.
A REIT may own up to 100% of the stock of one or more TRSs. A TRS may earn income that would not be qualifying income if it was earned directly by the parent REIT. Overall, at the close of any calendar quarter, no more than 20%of the value of a REIT’s assets may consist of stock or securities of one or more TRSs.
The stock and securities of our TRSs are expected to represent less than 20% of the value of our total assets. Furthermore, we intend to monitor the value of our investments in the stock and securities of our TRSs to ensure compliance with the above-described limitation. We cannot assure you, however, that we will always be able to comply with the limitation so as to maintain REIT status.
TRSs are subject to tax at the regular corporate rates, are not required to distribute dividends, and the amount of dividends a TRS can pay to its parent REIT may be limited by REIT gross income tests.
A TRS must pay income tax at regular corporate rates on any income that it earns. In certain circumstances, the ability of our TRSs to deduct interest expenses for U.S. federal income tax may be limited. Such income, however, is not required to be distributed. Our TRSs will pay corporate income tax on their taxable income, and their after-tax net income will be available for distribution to us.
Moreover, the annual gross income tests that must be satisfied to maintain our REIT qualification may limit the amount of dividends that we can receive from our TRSs. Generally, not more than 25% of our gross income can be derived from non-real estate related sources, such as dividends from a TRS. If, for any taxable year, the dividends we receive from our TRSs, when added to our other items of non-real estate related income, were to represent more than 25% of our total gross income for the year, we could be denied REIT status, unless we were able to demonstrate, among other things, that our failure of the gross income test was due to reasonable cause and not willful neglect.
The limitations imposed by the REIT gross income tests may impede our ability to distribute assets from our TRSs to us in the form of dividends. Certain asset transfers may, therefore, have to be structured as purchase and sale transactions upon which our TRSs recognize a taxable gain.
If transactions between a REIT and a TRS are entered into on other than arm’s-length terms, the REIT may be subject to a penalty tax.
If interest accrues on an indebtedness owed by a TRS to its parent REIT at a rate in excess of a commercially reasonable rate, then the REIT would be subject to tax at a rate of 100% on the excess of (i) interest payments made by a TRS to its parent REIT over (ii) the amount of interest that would have been payable had interest accrued on the indebtedness at a commercially reasonable rate. A tax at a rate of 100% is also imposed on any transaction between a TRS and its parent REIT to the extent the transaction gives rise to deductions to the TRS that are in excess of the deductions that would have been allowable had the transaction been entered into on arm’s-length terms. While we will scrutinize all of our transactions with our TRSs in an effort to ensure that we do not become subject to these taxes, there is no assurance that we will be successful. We may not be able to avoid application of these taxes.
Even if we remain qualified as a REIT, we may face other tax liabilities that reduce our cash flow.
Even if we remain qualified for taxation as a REIT, we may be subject to certain federal, state and local taxes on our income and assets, including taxes on any undistributed income, tax on income from some activities conducted as a result of a foreclosure, excise taxes, state or local income, property and transfer taxes, such as mortgage recording taxes, and other taxes. In addition, in order to meet the REIT qualification requirements, prevent the recognition of certain types of non-cash income, or to avert the imposition of a 100% tax that applies to certain gains derived by a REIT from dealer property or inventory, we may hold some of our assets through our TRSs or other subsidiary corporations that will be subject to corporate level income tax at regular rates.
ANNALY CAPITAL MANAGEMENT, INC. AND SUBSIDIARIES
Item 1A. Risk Factors
Complying with REIT requirements may cause us to forgo otherwise attractive opportunities and may force us to liquidate otherwise attractive investments.
To remain qualified as a REIT for U.S. federal income tax purposes, we must continually satisfy tests concerning, among other things, the sources of our income, the nature and diversification of our assets, the amounts that we distribute to our stockholders and the ownership of our stock. Our ability to acquire and hold our investments is subject to the applicable REIT qualification tests. We must ensure that at the end of each calendar quarter, at least 75% of the value of our assets consists of cash, cash items, U.S. Government securities and qualified real estate assets. The remainder of our investment in securities (other than U.S. Government securities, qualified real estate assets and securities issued by a TRS) generally cannot include more than 10% of the outstanding voting securities of any one issuer or more than 10% of the total value of the outstanding securities of any one issuer. In addition, in general, no more than 5% of the value of our assets (other than U.S. Government securities, qualified real estate assets and securities issued by a TRS) can consist of the securities of any one issuer, and no more than 20% of the value of our total assets can be represented by securities of one or more TRSs.
Changes in the values or other features of our assets could cause inadvertent violations of the REIT requirements. If we fail to comply with the REIT requirements at the end of any calendar quarter, we must correct the failure within 30 days after the end of the calendar quarter or qualify for certain statutory relief provisions to avoid losing our REIT qualification and suffering adverse tax consequences. Additionally, we may be required to make distributions to stockholders at disadvantageous times or when we do not have funds readily available for distribution.
Accordingly we may be unable to pursue investments that would be otherwise advantageous to us or be required to liquidate from our investment portfolio otherwise attractive investments if we feel it is necessary to satisfy the source-of-income, asset-diversification or distribution requirements for qualifying as a REIT. These actions could have the effect of reducing our income and amounts available for distribution to our stockholders.
Liquidation of assets may jeopardize our REIT qualification or create additional tax liability for us.
To remain qualified as a REIT, we must comply with requirements regarding the composition of our assets and our sources of income. If we are compelled to liquidate our investments to repay obligations to our lenders, we may be unable to comply with these requirements, ultimately jeopardizing our qualification as a REIT, or we may be subject to a 100% tax on any resultant gain if we sell assets that are treated as dealer property or inventory.
The failure of assets subject to repurchase agreements to qualify as real estate assets could adversely affect our ability to remain qualified as a REIT.
We enter into certain financing arrangements that are structured as sale and repurchase agreements pursuant to which we nominally sell certain of our assets to a counterparty and simultaneously enter into an agreement to repurchase these assets at a later date in exchange for a purchase price. Economically, these agreements are financings that are secured by the assets sold pursuant thereto, and we treat them as such for U.S. federal income tax purposes. We believe that we would be treated for REIT asset and income test purposes as the owner of the assets that are the subject of any such sale and repurchase agreement notwithstanding that such agreement may transfer record ownership of the assets to the counterparty during the term of the agreement. It is possible, however, that the IRS could assert that we did not own the assets during the term of the sale and repurchase agreement, in which case we could fail to remain qualified as a REIT.
Complying with REIT requirements may limit our ability to hedge effectively and may cause us to incur tax liabilities.
The REIT provisions of the Code could substantially limit our ability to hedge our liabilities. Any income from a properly designated hedging transaction we enter into to manage risk of interest rate changes with respect to borrowings made or to be made, or ordinary obligations incurred or to be incurred, to acquire or carry real estate assets generally does not constitute “gross income” for purposes of the 75% or 95% gross income tests. To the extent that we enter into other types of hedging transactions, the income from those transactions is likely to be treated as non-qualifying income for purposes of both of the gross income tests. As a result of these rules, we may have to limit our use of advantageous hedging techniques or implement those hedges through our TRSs. This could increase the cost of our hedging activities because our TRSs would be subject to tax on gains or expose us to greater risks associated with changes in interest rates than we would otherwise want to bear. In addition, losses in our TRSs generally will not provide any tax benefit, except for being carried forward potentially to offset taxable income in the TRSs for future periods.
ANNALY CAPITAL MANAGEMENT, INC. AND SUBSIDIARIES
Item 1A. Risk Factors
Qualifying as a REIT involves highly technical and complex provisions of the Code.
Qualification as a REIT involves the application of highly technical and complex Code provisions for which only limited judicial and administrative authorities exist. Even a technical or inadvertent violation could jeopardize our REIT qualification. Our continued qualification as a REIT depends on our satisfaction of certain asset, income, organizational, distribution, stockholder ownership and other requirements on a continuing basis. In addition, our ability to satisfy the REIT qualification requirements depends in part on the actions of third parties over which we have no control or only limited influence, including in cases where we own an equity interest in an entity that is classified as a partnership for U.S. federal income tax purposes.
The tax on prohibited transactions limits our ability to engage in certain transactions.
The 100% tax on prohibited transactions will limit our ability to engage in transactions, including certain methods of structuring CMOs, which would be treated as prohibited transactions for U.S. federal income tax purposes.
The term “prohibited transaction” generally includes a sale or other disposition of property (including mortgage loans, but other than foreclosure property, as discussed below) that is held primarily for sale to customers in the ordinary course of a trade or business by us or by a borrower that has issued a shared appreciation mortgage or similar debt instrument to us. We could be subject to this tax if we were to dispose of or structure CMOs in a manner that was treated as a prohibited transaction for U.S. federal income tax purposes.
We intend to conduct our operations at the REIT level so that no asset that we own (or are treated as owning) will be treated as or as having been, held for sale to customers, and that a sale of any such asset will not be treated as having been in the ordinary course of our business. As a result, we may choose not to engage in certain transactions at the REIT level, and may limit the structures we utilize for our CMO transactions, even though the sales or structures might otherwise be beneficial to us. In addition, whether property is held “primarily for sale to customers in the ordinary course of a trade or business” depends on the particular facts and circumstances. No assurance can be given that any property that we sell will not be treated as property held for sale to customers, or that we can comply with certain safe-harbor provisions of the Code that would prevent such treatment. The 100% tax does not apply to gains from the sale of property that is held through a TRS or other taxable corporation, although such income will be subject to tax in the hands of the corporation at regular corporate rates. We intend to structure our activities to avoid the prohibited transaction tax.
Certain financing activities may subject us to U.S. federal income tax and could have negative tax consequences for our stockholders.
We may enter into securitization transactions and other financing transactions that could result in us, or a portion of our assets, being treated as a taxable mortgage pool for U.S. federal income tax purposes. If we enter into such a transaction in the future, we could be taxable at the highest corporate income tax rate on a portion of the income arising from a taxable mortgage pool, referred to as “excess inclusion income,” that is allocable to the percentage of our shares held in record name by disqualified organizations (generally tax-exempt entities that are exempt from the tax on unrelated business taxable income, such as state pension plans and charitable remainder trusts and government entities). In that case, we could reduce distributions to such stockholders by the amount of tax paid by us that is attributable to such stockholder's ownership.
If we were to realize excess inclusion income, IRS guidance indicates that the excess inclusion income would be allocated among our stockholders in proportion to the dividends paid. Excess inclusion income cannot be offset by losses of a stockholder. If the stockholder is a tax-exempt entity and not a disqualified organization, then this income would be fully taxable as unrelated business taxable income under Section 512 of the Code. If the stockholder is a foreign person, it would be subject to U.S. federal income tax at the maximum tax rate and withholding will be required on this income without reduction or exemption pursuant to any otherwise applicable income tax treaty.
Uncertainty exists with respect to the treatment of our TBAs for purposes of the REIT asset and income tests.
We purchase and sell Agency mortgage-backed securities through TBAs and recognize income or gains from the disposition of those TBAs, through dollar roll transactions or otherwise, and may continue to do so in the future. While there is no direct authority with respect to the qualification of TBAs as real estate assets or U.S. Government securities for purposes of the 75% asset test or the qualification of income or gains from dispositions of TBAs as gains from the sale of real property (including interests in real property and interests in mortgages on real property) or other qualifying income for purposes of the 75% gross income test, we treat our TBAs as qualifying assets for purposes of the REIT asset tests, and we treat income and gains from our TBAs as qualifying income for purposes of the 75% gross income test, based on an opinion of counsel substantially to the effect that (i) for purposes of the REIT asset tests, our ownership of a TBA should be treated as ownership of real estate assets,
ANNALY CAPITAL MANAGEMENT, INC. AND SUBSIDIARIES
Item 1A. Risk Factors
and (ii) for purposes of the 75% REIT gross income test, any gain recognized by us in connection with the settlement of our TBAs should be treated as gain from the sale or disposition of an interest in mortgages on real property. Opinions of counsel are not binding on the IRS, and no assurance can be given that the IRS will not successfully challenge the conclusions set forth in such opinions. In addition, it must be emphasized that the opinion of counsel is based on various assumptions relating to our TBAs and is conditioned upon fact-based representations and covenants made by our management regarding our TBAs. No assurance can be given that the IRS would not assert that such assets or income are not qualifying assets or income. If the IRS were to successfully challenge the opinion of counsel, we could be subject to a penalty tax or we could fail to remain qualified as a REIT if a sufficient portion of our assets consists of TBAs or a sufficient portion of our income consists of income or gains from the disposition of TBAs.
Dividends payable by REITs generally receive different tax treatment than dividend income from regular corporations.
Qualified dividend income payable to U.S. stockholders that are individuals, trusts and estates is subject to the reduced maximum tax rate applicable to capital gains. Dividends payable by REITs, however, generally are not eligible for the reduced qualified dividend rates. Non-corporate taxpayers may deduct up to 20% of certain pass-through business income, including “qualified REIT dividends” (generally, dividends received by a REIT shareholder that are not designated as capital gain dividends or qualified dividend income), subject to certain limitations, resulting in an effective maximum U.S. federal income tax rate of 29.6% on such income. Although the reduced U.S. federal income tax rate applicable to qualified dividend income does not adversely affect the taxation of REITs or dividends payable by REITs, the more favorable rates applicable to regular corporate qualified dividends could cause investors who are individuals, trusts and estates to perceive investments in REITs to be relatively less attractive than investments in the stocks of non-REIT corporations that pay dividends, which could adversely affect the value of the shares of REITs, including our stock. Tax rates could be changed in future legislation.
New legislation or administrative or judicial action, in each instance potentially with retroactive effect, could make it more difficult or impossible for us to remain qualified as a REIT.
The present U.S. federal income tax treatment of REITs may be modified, possibly with retroactive effect, by legislative, judicial or administrative action at any time, which could affect the U.S. federal income tax treatment of an investment in us. The U.S. federal income tax rules dealing with REITs constantly are under review by persons involved in the legislative process, the IRS and the U.S. Treasury, which results in statutory changes as well as frequent revisions to regulations and interpretations. Future revisions in federal tax laws and interpretations thereof could affect or cause us to change our investments and commitments and affect the tax considerations of an investment in us.
Counterparty Risks
The soundness of our counterparties and other financial institutions could adversely affect us.
Financial services institutions are interrelated as a result of trading, clearing, counterparty, borrower, or other relationships. We have exposure to many different counterparties, and routinely execute transactions with counterparties in the financial services industry, including brokers and dealers, commercial banks, investment banks, mutual and hedge funds, mortgage companies, and other financial institutions. Many of these transactions expose us to credit or counterparty risk in the event of default of our counterparty or, in certain instances, our counterparty’s customers. There is no assurance that any such losses would not materially and adversely impact our revenues, financial condition and earnings.
We are subject to regulationcounterparty risk and may be unable to seek indemnity or require counterparties to repurchase residential whole loans if they breach representations and warranties, which could cause us to suffer losses.
When selling or securitizing mortgage loans, sellers typically make customary representations and warranties about such loans. Residential mortgage loan purchase agreements may entitle the purchaser of the loans to seek indemnity or demand repurchase or substitution of the loans in the event the seller of the loans breaches a representation or warranty given to the purchaser. There can be no assurance that a mortgage loan purchase agreement will contain appropriate representations and warranties, that we or the trust that purchases the mortgage loans would be able to enforce a contractual right to repurchase or substitution, or that the seller of the loans will remain solvent or otherwise be able to honor its obligations under its mortgage loan purchase agreements. The inability to obtain or enforce an indemnity or require repurchase of a significant number of loans could adversely affect our results of operations, financial condition and business.
Our rights under our repurchase and derivative agreements are subject to the effects of the bankruptcy laws in the event of the bankruptcy or insolvency of us or our lenders.
ANNALY CAPITAL MANAGEMENT, INC. AND SUBSIDIARIES
Item 1A. Risk Factors
In the event of our insolvency or bankruptcy, certain repurchase and derivative agreements may qualify for special treatment under the U.S. Bankruptcy Code, the effect of which, among other things, would be to allow the lender to avoid the automatic stay provisions of the U.S. Bankruptcy Code and to foreclose on and/or liquidate the collateral pledged under such agreements without delay. In the event of the insolvency or bankruptcy of a lender during the term of a repurchase or derivative agreement, the lender may be permitted, under applicable insolvency laws, to repudiate the contract, and our claim against the lender for damages (after any permitted collateral liquidation and setoff) may be treated as an unsecured claim. Net claims in our favor after application of setoff would be subject to significant delay and costs to us and, if and when received, may be substantially less than the damages we actually incur.
Investment and Market Related Risks
We may experience declines in the market value of our assets.
We may experience declines in the market value of our assets due to interest rate changes, deterioration of the credit of the borrower or counterparty, or other reasons described in other risk factors. These declines can result in fair value adjustments, impairments, decreases in reported asset and earnings, margin calls, liquidity risks, and other adverse impacts.
Investments in MSR may expose us to additional risks.
We invest in MSR and financial instruments whose cash flows are considered to be largely dependent on underlying MSR that either directly or indirectly act as collateral for the investment. We expect to increase our exposure to MSR-related investments in 2024. Generally, we have the right to receive certain cash flows from the MSR that are generated from the servicing fees and/or excess servicing spread associated with the MSR. Our investments in MSR-related assets expose us to risks associated with MSR, including the following:
•Investments in MSR are highly illiquid and subject to numerous restrictions on transfer and, as a result, there is risk that we would be unable to locate a willing buyer or get required approval to sell MSR in the future should we desire to do so.
•Our rights to the excess servicing spread are subordinate to the interests of Fannie Mae, Freddie Mac and Ginnie Mae, and are subject to extinguishment. Fannie Mae and Freddie Mac each require approval of the sale of excess servicing spreads pertaining to their respective MSR. We have entered into acknowledgment agreements or subordination of interest agreements with them, which acknowledge our subordinated rights.
•Changes in minimum servicing compensation for agency loans could occur at any time and could negatively impact the value of the income derived from MSR.
•The value of MSR is highly sensitive to changes in prepayment rates. Decreasing market interest rates are generally associated with increases in prepayment rates as borrowers are able to refinance their loans at lower costs. Prepayments result in the partial or complete loss of the cash flows from the related MSR. Accordingly, an increase in prepayments can result in a reduction in the value and income we may earn of our MSR related assets and negatively affect our profitability.
•While we have executed recapture agreements with our subservicers to attempt to retain the MSR investment resulting from a refinance transaction, the effectiveness of these efforts is impacted by laws atborrower, subservicer, and unaffiliated lender behavior.
•Servicers are responsible for advancing the local, statepayment of principal, interest, and federal level, includingescrow items on mortgage loans when those payments are not timely made by the borrower (including during periods of forbearance) and the timing and amount of recovery of those advances is unpredictable.
If we are not able to successfully manage these and other risks related to investing in MSR, it may adversely affect the value of our MSR-related assets.
A prolonged economic slowdown or declining real estate values could impair the assets we may own.
Our non-Agency mortgage-backed securities, mortgage loans, and MSR may be susceptible to economic slowdowns or recessions, which could lead to financial losses in our assets and a decrease in revenues, net income and asset values.
Owners of Agency mortgage-backed securities are protected from the risk of default on the underlying mortgages by guarantees from Fannie Mae, Freddie Mac or, in the case of the Ginnie Mae, the U.S. Government. A default on those underlying mortgages exposes us to prepayment risk described above, but not a credit loss. However, we also acquire CRTs, non-Agency mortgage-backed securities and tax lawsresidential loans, which are backed by residential real property but, in contrast to Agency
ANNALY CAPITAL MANAGEMENT, INC. AND SUBSIDIARIES
Item 1A. Risk Factors
mortgage-backed securities, the principal and financial accountinginterest payments are not guaranteed by GSEs or the U.S. Government. Our CRT, non-Agency mortgage-backed securities and reporting standards. These lawsresidential loan investments are therefore particularly sensitive to recessions and regulations,declining real estate values.
In the event of a default on one of the residential mortgage loans that we hold in our portfolio or a mortgage loan underlying CRT or non-Agency mortgage-backed securities in our portfolio, we bear the risk of loss as a result of the potential deficiency between the value of the collateral and the debt owed, as well as the costs and delays of foreclosure or other remedies, and the costs of maintaining and ultimately selling a property after foreclosure. Delinquencies and defaults on mortgage loans for which we own the servicing rights will adversely affect the amount of servicing fee income we receive and may result in increased servicing costs and operational risks due to the increased complexity of servicing delinquent and defaulted mortgage loans.
An increase in interest rates may adversely affect the market value of our interest earning assets and, therefore, also our book value.
Increases in interest rates may negatively affect the market value of our interest earning assets because in a period of rising interest rates, the value of certain interest earning assets may fall and reduce our book value. For example, our fixed-rate interest earning assets are generally negatively affected by increases in interest rates because in a period of rising rates, the coupon we earn on our fixed-rate interest earning assets would not change. Our book value would be reduced by the amount of a decline in the market value of our interest earning assets.
Actions by the Federal Reserve may affect the price and returns of our assets.
The Federal Reserve (the “Fed”) owns approximately $2.4 trillion of Agency mortgage-backed securities as of December 31, 2023. Certain actions taken by the U.S. government, including the Fed, may have a negative a impact on our results. For example, rising short-term interest rates as the Fed lifts its monetary policy rate to slow the currently elevated rate of inflation may have a negative impact on our results. Meanwhile, any potential future reduction of the Fed’s balance sheet might lead to higher interest rate volatility and wider mortgage-backed security spreads that could negatively impact Annaly’s portfolio.
We invest in securities that are subject to mortgage credit risk.
We invest in securities in the credit risk transfer CRT sector. The CRT sector is comprised of the risk sharing transactions issued by Fannie Mae (“CAS”) and Freddie Mac (“STACR”), and similarly structured transactions arranged by third party market participants. The securities issued in the CRT sector are designed to synthetically transfer mortgage credit risk from Fannie Mae and Freddie Mac to private investors. The holder of the securities in the CRT sector has the risk that the borrowers may default on their interpretation,obligations to make full and timely payments of principal and interest. Investments in securities in the CRT sector could cause us to incur losses of income from, and/or losses in market value relating to, these assets if there are defaults of principal and/or interest on the pool of mortgages referenced in the transaction. The holder of the CRT may also bear the risk of the default of the issuer of the security.
Changes in credit spreads may affect the market price of credit-sensitive investments.
A significant component of the fair value of CRT and non-Agency securities and other credit risk-oriented investments is attributable to the credit spread, or the difference between the value of the credit instrument and the value of a financial instrument with similar interest rate exposure, but with no credit risk, such as a U.S. Treasury note. Credit spreads can be highly volatile and may fluctuate due to changes in economic conditions, liquidity, investor demand and other factors. Credit spreads typically widen in times of increased market uncertainty or when economic conditions have or are expected to deteriorate. Credit spreads may also widen due to actual or anticipated rating downgrades on the securities or similar securities. Hedging fair value changes associated with credit spreads can be inefficient and our hedging strategies are not primarily designed to mitigate credit spread risk. Widening credit spreads could net unrealized gains to decrease or result in net losses.
Geographic concentration exposes investors to greater risk of default and loss.
Repayments by borrowers and the market value of the related assets could be affected by economic conditions generally or specific to geographic areas or regions of the United States, and concentrations of mortgaged residential properties in particular geographic areas may increase the risk that adverse economic or other developments or natural or man-made disasters affecting a particular region of the country could increase the frequency and severity of losses on mortgage loans or other real estate debt secured by those properties. From time to time, regions of the United States experience significant real estate downturns when
ANNALY CAPITAL MANAGEMENT, INC. AND SUBSIDIARIES
Item 1A. Risk Factors
others do not. Regional economic declines or conditions in regional real estate markets could adversely affect the income from, and market value of, the mortgaged properties. In addition, local or regional economies may be changedadversely affected to a greater degree than other areas of the country by developments affecting industries concentrated in such area. A decline in the general economic condition in the region in which mortgaged properties securing the related mortgage loans are located would result in a decrease in consumer demand in the region, and the income from and market value of the mortgaged properties may be adversely affected.
Other regional factors – e.g., rising sea levels, earthquakes, floods, forest fires, hurricanes or changes in governmental rules or fiscal policies – also may adversely affect the mortgaged properties. Assets in certain regional areas may be more susceptible to certain hazards (such as earthquakes, widespread fires, floods or hurricanes) than properties in other parts of the country and collateral properties located in coastal states may be more susceptible to hurricanes than properties in other parts of the country. As a result, areas affected by such events often experience disruptions in travel, transportation and tourism, loss of jobs and an overall decrease in consumer activity, and often a decline in real estate-related investments. These types of occurrences may increase over time or become more severe due to changes in weather patterns and other climate changes. There can be no assurance that the economies in such impacted areas will recover sufficiently to support income producing real estate at pre-event levels or that the costs of the related clean-up will not have a material adverse effect on the local or national economy.
Inadequate property insurance coverage could have an adverse impact on our operating results.
Residential real estate assets may suffer casualty losses due to risks (including acts of terrorism) that are not covered by insurance or for which insurance coverage requirements have been contractually limited by the related loan documents. Moreover, if reconstruction or major repairs are required following a casualty, changes in laws that have occurred since the time of original construction may materially impair the borrower’s ability to effect such reconstruction or major repairs or may materially increase the cost thereof.
There is no assurance that borrowers have maintained or will maintain the insurance required under the applicable loan documents or that such insurance will be adequate. In addition, the effects of climate change have made, and may continue to make, certain types of insurance, such as flood insurance, increasingly difficult and/or expensive to obtain in certain areas.In addition, since the residential mortgage loans generally do not require maintenance of terrorism insurance, we cannot assure you that any property will be covered by terrorism insurance. Therefore, damage to a collateral property that is not adequately insured or damage to a collateral property caused by acts of terror may not be covered by insurance and may result in substantial losses to us.
Our assets may become non-performing or sub-performing assets in the future.
Our assets may in the near or the long term become non-performing or sub-performing assets, which are subject to increased risks relative to performing assets. Residential mortgage loans may become non-performing or sub-performing for a variety of reasons that result in the borrower being unable to meet its debt service and/or repayment obligations, such as the underlying property being too highly leveraged or the financial distress of the borrower. Such non-performing or sub-performing assets may require a substantial amount of workout negotiations and/or restructuring, which may involve substantial cost and divert the attention of our management from other activities and may entail, among other things, a substantial reduction in interest rate, the capitalization of interest payments and/or a substantial write-down of the principal of the loan. Even if a restructuring were successfully accomplished, the borrower may not be able or willing to maintain the restructured payments or refinance the restructured loan upon maturity.
From time to time.time we may find it necessary or desirable to foreclose the liens of loans we acquire or originate, and the foreclosure process may be lengthy and expensive. Borrowers may resist foreclosure actions by asserting numerous claims, counterclaims and defenses to payment against us (such as lender liability claims and defenses) even when such assertions may have no basis in fact or law, in an effort to prolong the foreclosure action and force the lender into a modification of the loan or a favorable buy-out of the borrower’s position. In some states, foreclosure actions can take several years or more to litigate. At any time prior to or during the foreclosure proceedings, the borrower may file for bankruptcy, which would have the effect of staying the foreclosure actions and further delaying the resolution of our claims. Foreclosure may create a negative public perception of the related property, resulting in a diminution of its value. Even if we are successful in foreclosing on a loan, the liquidation proceeds upon sale of the underlying real estate may not be sufficient to recover our cost basis in the loan, resulting in a loss to us. Furthermore, any costs or delays involved in the foreclosure of a loan or a liquidation of the underlying property will further reduce the proceeds and thus increase our loss. Any such reductions could materially and adversely affect the value of the residential mortgage loans in which we invest.
Accordingly, any changeWhether or not we have participated in these lawsthe negotiation of the terms of a loan, there can be no assurance as to the adequacy of the protection of the terms of the loan, including the validity or regulationsenforceability of the loan and the maintenance of the anticipated
ANNALY CAPITAL MANAGEMENT, INC. AND SUBSIDIARIES
Item 1A. Risk Factors
priority and perfection of the applicable security interests. Furthermore, claims may be asserted that might interfere with enforcement of our rights. In the event of a foreclosure, we may assume direct ownership of the underlying real estate. The liquidation proceeds upon sale of that real estate may not be sufficient to recover our cost basis in the loan, resulting in a loss to us. Any costs or delays involved in the failureeffectuation of a foreclosure of the loan or a liquidation of the underlying property will further reduce the proceeds and increase our loss.
Whole loan mortgages are also subject to comply with these laws“special hazard” risk (property damage caused by hazards, such as earthquakes or regulationsenvironmental hazards, not covered by standard property insurance policies), and to bankruptcy risk (reduction in a borrower’s mortgage debt by a bankruptcy court). In addition, claims may be assessed against us on account of our position as mortgage holder or property owner, as applicable, including responsibility for tax payments, environmental hazards and other liabilities, which could have a material adverse impacteffect on our business. Certainresults of operations, financial condition and our ability to make distributions to our stockholders.
We may be required to repurchase residential mortgage loans or indemnify investors if we breach representations and warranties.
When we sell or securitize loans, we will be required to make customary representations and warranties about such loans to the loan purchaser. Our mortgage loan sale agreements will require us to repurchase or substitute loans in the event we breach a representation or warranty given to the loan purchaser. In addition, we may be required to repurchase loans as a result of borrower fraud or in the event of early payment default on a mortgage loan. Likewise, we may be required to repurchase or substitute loans if we breach a representation or warranty in connection with our securitizations. The remedies available to a purchaser of mortgage loans are generally broader than those available to us against the originating broker or correspondent. Further, if a purchaser enforces its remedies against us, we may not be able to enforce the remedies we have against the sellers. The repurchased loans typically can only be financed at a steep discount to their repurchase price, if at all. They are also typically sold at a significant discount to the unpaid principal balance. Significant repurchase activity could adversely affect our cash flow, results of operations, financial condition and business prospects.
Our and our third party service providers’ and servicers’ due diligence of potential assets may not reveal all weaknesses in such assets.
Before acquiring a residential real estate debt asset, we will assess the strengths and weaknesses of the borrower, originator or issuer of the asset as well as other factors and characteristics that are material to the performance of the asset. In making the assessment and otherwise conducting customary due diligence, we will rely on resources available to us, including our third party service providers and servicers. This process is particularly important with respect to newly formed originators or issuers because there may be little or no information publicly available about these lawsentities and regulations pertain specificallyassets. There can be no assurance that our due diligence process will uncover all relevant facts or that any asset acquisition will be successful.
When we foreclose on an asset, we may come to REITs.own the property securing the loan.
When we foreclose on a residential real estate asset, we may take title to the property securing that asset, and if we do not or cannot sell the property, we would then come to own and operate it as “real estate owned.” Owning and operating real property involves risks that are different (and in many ways more significant) than the risks faced in owning a debt instrument secured by that property. In addition, we may end up owning a property that we would not otherwise have decided to acquire directly at the price of our original investment or at all. If we foreclose on and come to own property, our financial performance and returns to investors could suffer.
Proposals to acquire mortgage loans by eminent domain may adversely affect the value of our assets.
Local governments have taken steps to consider how the power of eminent domain could be used to acquire residential mortgage loans. There can be no certainty whether any mortgage loans sought to be purchased will be mortgage loans held in securitization trusts and what purchase price would be paid for any such mortgage loans. Any such actions could have a material adverse effect on the market value of our mortgage-backed securities, mortgage loans and MSR. There is also no certainty as to whether any such action without the consent of investors would face legal challenge, and, if so, the outcome of any such challenge.
ANNALY CAPITAL MANAGEMENT, INC. AND SUBSIDIARIES
Item 1A. Risk Factors
Subordinated tranches of non-Agency mortgage-backed securities are subordinate in right of payment to more senior securities.
Our investments may include subordinated tranches of non-Agency mortgage-backed securities, which are subordinated classes of securities in a structure of securities collateralized by a pool of mortgage loans and, accordingly, are the first or among the first to bear the loss upon a restructuring or liquidation of the underlying collateral and the last to receive payment of interest and principal. Additionally, estimated fair values of these subordinated interests tend to be more sensitive to changes in economic conditions than more senior securities. As a result, such subordinated interests generally are not actively traded and may not be liquid investments.
Our hedging strategies may be costly, and may not hedge our risks as intended.
Our policies permit us to enter into interest rate swaps, caps and floors, interest rate swaptions, interest rate futures, and other derivative transactions to help us mitigate our interest rate and prepayment risks described above subject to maintaining our qualification as a REIT and our Investment Company Act exemption. We have used interest rate swaps and options to enter into interest rate swaps (commonly referred to as interest rate swaptions) to provide a level of protection against interest rate risks. We may also purchase or sell TBAs on Agency mortgage-backed securities, purchase or write put or call options on TBAs, invest in other types of mortgage derivatives, such as interest-only securities, and hold short positions in U.S. Treasury securities. No hedging strategy can protect us completely. Interest rate hedging may fail to protect or could adversely affect us because, among other things: interest rate hedging can be expensive, particularly during periods of volatile interest rates; available hedges may not correspond directly with the risk for which protection is sought; and the duration of the hedge may not match the duration of the related asset or liability.
We are subject to risks of loss from weather conditions, man-made or natural disasters and the direct and indirect effects of climate change.
Assets in which we hold a direct or indirect interest could experience severe weather, including hurricanes, severe winter storms, and flooding (including as a result of sea level rise), all of which may become more severe as a result of climate change, which among other effects could impact house prices and housing-related costs and/or disrupt borrowers’ ability to pay their mortgage and or loan. In addition, such events, particularly if they are not adequately covered by insurance or have a broader negative impact on the local economy, may decrease the value of land and property secured by mortgages. Moreover, long term climate change could trigger extreme weather conditions that result in macroeconomic and demographic shifts. Over time, these conditions could result in repricing of the assets (land, property, securities) that we hold. There can be no assurance that climate change and severe weather will not have a material adverse effect on our financial performance.
Operational and Cybersecurity Risks
Inaccurate models or the data used by models may expose us to risk.
Given our strategies and the complexity of the valuation of our assets, we must rely heavily on analytical models (both proprietary models developed by us and those supplied by third parties) and information and data supplied by our third party vendors and servicers. Models and data are used to value assets or potential asset purchases and also in connection with hedging our assets. When models and data prove to be incorrect, misleading or incomplete, any decisions made in reliance thereon expose us to potential risks. For example, by relying on models and data, especially valuation models, we may be induced to buy certain assets at prices that are too high, to sell certain other assets at prices that are too low or to miss favorable opportunities altogether. Similarly, any hedging based on faulty models and data may prove to be unsuccessful. Furthermore, despite our valuation validation processes our models may nevertheless prove to be incorrect.
Some of the risks of relying on analytical models and third party data are particular to analyzing tranches from securitizations, such as commercial or residential mortgage-backed securities. These risks include, but are not limited to, the following: (i) collateral cash flows and/or liability structures may be incorrectly modeled in all or only certain scenarios, or may be modeled based on simplifying assumptions that lead to errors; (ii) information about collateral may be incorrect, incomplete, or misleading; (iii) collateral or bond historical performance (such as historical prepayments, defaults, cash flows, etc.) may be incorrectly reported, or subject to interpretation (e.g., different issuers may report delinquency statistics based on different definitions of what constitutes a delinquent loan); or (iv) collateral or bond information may be outdated, in which case the models may contain incorrect assumptions as to what has occurred since the date information was last updated.
Some of the analytical models used by us, such as mortgage prepayment models or mortgage default models, are predictive in nature. The use of predictive models has inherent risks. For example, such models may incorrectly forecast future behavior, leading to potential losses on a cash flow and/or a mark-to-market basis. In addition, the predictive models used by us may differ substantially from those models used by other market participants, with the result that valuations based on these
ANNALY CAPITAL MANAGEMENT, INC. AND SUBSIDIARIES
Item 1A. Risk Factors
predictive models may be substantially higher or lower for certain assets than actual market prices. Furthermore, since predictive models are usually constructed based on historical data supplied by third parties, the success of relying on such models may depend heavily on the accuracy and reliability of the supplied historical data and the ability of these historical models to accurately reflect future periods.
All valuation models rely on correct market data inputs. If incorrect market data is entered into even a well-founded valuation model, the resulting valuations will be incorrect. However, even if market data is inputted correctly, “model prices” will often differ substantially from market prices, especially for securities with complex characteristics, such as derivative instruments or structured notes.
We are highly dependent on information systems and networks, many of which are operated by third parties, and any failure of these systems or networks could materially and adversely affect our business.
Our business is highly dependent on communications and information systems and networks. Any failure or interruption of our systems or networks or cyberattacks or other information security breaches of our networks or systems could cause delays or other problems in our securities trading activities, including mortgage-backed securities trading activities. In addition, we also face the risk of operational failure, termination or capacity constraints of any of the third parties with which we do business or that facilitate our business activities, including clearing agents or other financial intermediaries we use to facilitate our securities transactions, if their respective systems experience failure, interruption, cyberattacks, or other information security breaches. Certain third parties provide information needed for our financial statements that we cannot obtain or verify from other sources. If one of those third parties experiences a system or network failure or cybersecurity incident, we may not have access to that information or may not have confidence in its accuracy.
Any failure to maintain performance, reliability and security of our technical infrastructure, systems or networks, or any such failure by third parties upon whom we rely, could materially and adversely affect our business.
Cyberattacks or other information security breaches could adversely affect our business, reputation and financial condition.
Cybersecurity risks for financial services businesses have significantly increased in recent years in part because of the proliferation of new technologies, including generative artificial intelligence, and the increased sophistication and activities of organized crime, hackers, terrorists, nation-states, state-sponsored actors and other external parties. Computer malware, ransomware, viruses, computer hacking, denial-of-service attacks, and social engineering attacks (including phishing attacks) have become more prevalent in our industry and we are subject to such attempted attacks. Cybersecurity risks also may derive from fraud or malice on the part of our employees or third parties, or may result from human error, software bugs, server malfunctions, software or hardware failure or other technological failure. Such threats may be difficult to detect for long periods of time and also may be further enhanced in frequency or effectiveness through threat actors’ use of artificial intelligence.
We rely heavily on our financial, accounting and other data processing systems. A cyberattack or other information security breach of such systems could lead to unauthorized access to and release, misuse, loss or destruction of our confidential information or personal or confidential information of our clients, employees or third parties, which could lead to regulatory fines, costs of remediating the breach, reputational harm, financial losses, litigation and increased difficulty doing business with third parties that rely on us to meet their own data protection requirements.
While we generally perform cybersecurity diligence on our key service providers, we do not control our service providers and our ability to monitor their cybersecurity is limited. Some of our service providers may store or have access to our data and may not have effective controls, processes, or practices to protect our information from loss, unauthorized disclosure, unauthorized use or misappropriation, cyberattacks or other information security breach. A vulnerability in our service providers’ software or systems, a failure of our service providers’ safeguards, policies or procedures, or a cyberattack or other information security breach affecting any of these third parties could harm our business.
Although we have not detected a material cybersecurity breach to date, other financial institutions have reported material breaches of their systems, some of which have been significant. Even with all reasonable security efforts, not every breach can be prevented or even detected. It is possible that we have experienced an undetected breach. There is no assurance that we, or the third parties that facilitate our business activities, have not or will not experience a breach. We may be held responsible if certain third parties that facilitate our business activities experience a breach. Additionally, we cannot be certain that our insurance coverage will be adequate for cybersecurity liabilities actually incurred, that insurance will continue to be available to us on economically reasonable terms, or at all, or that our insurer will not deny coverage as to any future claim.
We may face increased costs as we continue to evolve our cyber defenses in order to contend with changing risks, and possible increased costs of complying with cybersecurity laws and regulations. These costs and losses associated with these risks are difficult to predict and quantify, but could have a significant adverse effect on our operating results.
ANNALY CAPITAL MANAGEMENT, INC. AND SUBSIDIARIES
Item 1A. Risk Factors
It is difficult to determine what, if any, negative impact may directly result from any specific interruption or cyberattacks or other information security breaches of our networks or systems (or the networks or systems of third parties that facilitate our business activities), but any cyberattack or other information security breach may negatively affect our operations. Further, we could be exposed to litigation, regulatory enforcement, investigations or other legal action as a result of an incident, carrying the potential for damages, fines, sanctions or other penalties, injunctive relief requiring costly compliance measures, and reputational damage.
We depend on third party service providers, including mortgage loan servicers and sub-servicers, for a variety of services related to our business.
We depend on a variety of services provided by third party service providers related to our investments in MSR as well as for general operating purposes. For example, we rely on the mortgage servicers who service the mortgage loans underlying our MSR to, among other things, collect principal and interest payments on such mortgage loans and perform loss mitigation services in accordance with applicable laws and regulations. Mortgage servicers and other service providers, such as trustees, bond insurance providers, due diligence vendors and document custodians, may fail to perform or otherwise not perform in a manner that promotes our interests.
For example, any legislation or regulation intended to reduce or prevent foreclosures through, among other things, loan modifications may reduce the value of mortgage loans, including those underlying our MSR. Mortgage servicers may be required or otherwise incentivized by the Federal or state governments to pursue actions designed to assist mortgagors, such as loan modifications, forbearance plans and other actions intended to prevent foreclosure even if such loan modifications and other actions are not in the best interests of the beneficial owners of the mortgage loans. Similarly, legislation delaying the initiation or completion of foreclosure proceedings on specified types of residential mortgage loans or otherwise limiting the ability of mortgage servicers to take actions that may be essential to preserve the value of the mortgage loans may also reduce the value of mortgage loans underlying our MSR. Any such limitations are likely to cause delayed or reduced collections from mortgagors and generally increase servicing costs. As a consequence of the foregoing matters, our business, financial condition and results of operations may be adversely affected.
Our investments in residential whole loans subject us to servicing-related risks.
In connection with the acquisition and securitization of residential whole loans, we rely on unaffiliated servicing companies to service and manage the mortgages underlying our non-Agency mortgage-backed securities and our residential whole loans. If a servicer is not vigilant in seeing that borrowers make their required monthly payments, borrowers may be less likely to make these payments, resulting in a higher frequency of default. If a servicer takes longer to liquidate non-performing mortgages, our losses related to those loans may be higher than originally anticipated.
Any failure by servicers to service these mortgages and related real estate owned (“REO”) properties could negatively impact the value of these investments and our financial performance. In addition, while we have contracted, and will continue to contract, with unaffiliated servicing companies to carry out the actual servicing of the loans we purchase together with the related MSR (including all direct interface with the borrowers), we are nevertheless ultimately responsible, vis-à-vis the borrowers and state and federal regulators, for ensuring that the loans are serviced in accordance with the terms of the related notes and mortgages and applicable law and regulation. In light of the current regulatory environment, such exposure could be significant even though we might have contractual claims against our servicers for any failure to service the loans to the required standard.
A default by the mortgage servicer in its capacity as servicer and/or failure of the mortgage servicer to perform its obligations related to any MSR could result in a loss of value of servicing fees and/or excess servicing spread. Mortgage servicers are subject to extensive federal, state and local laws, regulations and administrative decisions and failure to comply with such regulations can expose the servicer to fines, damages and losses. In the capacity of servicer, mortgage servicers operate in a highly litigious industry that subject it to potential lawsuits related to billing and collections practices, modification protocols or foreclosure practices.
When a residential whole loan we own is foreclosed upon, title to the underlying property would be taken by one of our subsidiaries. The foreclosure process, especially in judicial foreclosure states such as New York, Florida and New Jersey can be lengthy and expensive, and the delays and costs involved in completing a foreclosure, and then liquidating the property through sale, may materially increase any related loss. Finally, at such time as title is taken to a foreclosed property, it may require more extensive rehabilitation than we estimated at acquisition or a previously unknown environmental liability may be discovered that would require expensive and time-consuming remediation.
Additionally, given the magnitude of the 2008-2009 housing crisis, and in response to the well-publicized failures of many servicers to follow proper foreclosure procedures, mortgage servicers are being held to much higher foreclosure-related
ANNALY CAPITAL MANAGEMENT, INC. AND SUBSIDIARIES
Item 1A. Risk Factors
documentation standards than they previously were. However, because many mortgages have been transferred and assigned multiple times (and by means of varying assignment procedures) throughout the origination, warehouse, and securitization processes, mortgage servicers have generally had much more difficulty furnishing the requisite documentation to initiate or complete foreclosures. In addition, unexpected macro-level events such as the COVID-19 pandemic or natural disasters have led, and could continue to lead, to delays in the foreclosure process, both by operation of state law (e.g., foreclosure moratoriums in certain states) and by delays in the judicial system. These circumstances have led to stalled or suspended foreclosure proceedings, and ultimately additional foreclosure-related costs. Foreclosure-related delays also tend to increase ultimate loan loss severities as a result of property deterioration, amplified legal and other costs, and other factors. Many factors delaying foreclosure, such as borrower lawsuits and judicial backlog and scrutiny, are outside of a servicer's control and have delayed, and will likely continue to delay, foreclosure processing in both judicial states (where foreclosures require court involvement) and non-judicial states. The concerns about deficiencies in foreclosure practices of servicers and related delays in the foreclosure process may impact our loss assumptions and has affected and may continue to affect the values of, and our returns on, our investments in residential whole loans.
The performance of loans underlying our MSR related assets may be adversely affected by the performance of the related mortgage servicer.
The performance of the loans underlying our MSR related assets is subject to risks associated with inadequate or untimely servicing. If our mortgage servicers commit a material breach of their obligations as a servicer, we may be subject to damages if the breach is not cured within a specified period of time following notice. In addition, poor performance by a mortgage servicer may result in greater than expected delinquencies and foreclosures and losses on the mortgage loans underlying our MSR related assets. A substantial increase in our delinquency or foreclosure rate or the inability to process claims could adversely affect our ability to access the capital and secondary markets for our financing needs.
Similarly to the way in which we service residential whole loans, we have also contracted, and will continue to contract, with unaffiliated servicing companies to carry out the actual servicing activities (including all direct interface with the borrowers). However, we are nevertheless ultimately responsible, vis-à-vis the borrowers and state and federal regulators, for ensuring that these activities are performed in accordance with the terms of the related notes and mortgages and applicable laws and regulations. In light of the current regulatory environment, such exposure could be significant even though we might have contractual claims against our servicers for any failure to service the loans to the required standard.
A default by the mortgage servicer in its capacity as servicer and/or failure of the mortgage servicer to perform its obligations related to any MSR could result in a loss of value of servicing fees and/or excess servicing spread. Mortgage servicers are subject to extensive federal, state and local laws, regulations and administrative decisions and failure to comply with such regulations can expose the servicer to fines, damages and losses. In the capacity of servicer, mortgage servicers operate in a highly litigious industry that subject them to potential lawsuits related to billing and collections practices, modification protocols or foreclosure practices.
An increase or decrease in prepayment rates may adversely affect our profitability.
The mortgage-backed securities we acquire are backed by pools of mortgage loans. We receive payments, generally, from the payments that are made on the underlying mortgage loans. We often purchase mortgage-backed securities that have a higher coupon rate than the prevailing market interest rates. In exchange for a higher coupon rate, we typically pay a premium over par value to acquire these mortgage-backed securities. In accordance with U.S. generally accepted accounting principles (“GAAP”), we amortize the premiums on our mortgage-backed securities over the expected life of the related mortgage-backed securities. If the mortgage loans securing these mortgage-backed securities prepay at a more rapid rate than anticipated, we will have to amortize our premiums on an accelerated basis that may adversely affect our profitability.
Defaults on mortgage loans underlying Agency mortgage-backed securities typically have the same effect as prepayments because of the underlying Agency guarantee.
Prepayment rates generally increase when interest rates fall and decrease when interest rates rise, but changes in prepayment rates are difficult to predict. Prepayment rates also may be affected by conditions in the housing and financial markets, general economic conditions and the relative interest rates on fixed-rate and adjustable-rate mortgage loans. We may seek to minimize prepayment risk to the extent practical, and in selecting investments we must balance prepayment risk against other risks and the potential returns of each investment. No strategy can completely insulate us from prepayment risk. We may choose to bear increased prepayment risk if we believe that the potential returns justify the risk.
Conversely, a decline in prepayment rates on our investments will reduce the amount of principal we receive and therefore reduce the amount of cash we otherwise could have reinvested in higher yielding assets at that time, which could negatively impact our future operating results.
ANNALY CAPITAL MANAGEMENT, INC. AND SUBSIDIARIES
Item 1A. Risk Factors
We are subject to reinvestment risk.
We are subject to reinvestment risk as a result of changes in interest rates. Declines in interest rates are generally accompanied by increased prepayments of mortgage loans, which in turn results in a prepayment of the related mortgage-backed securities. An increase in prepayments could result in the reinvestment of the proceeds we receive from such prepayments into lower yielding assets. Conversely, increases in interest rates are generally accompanied by decreased prepayments of mortgage loans, which could reduce our capital available to reinvest into higher-yielding assets.
Competition may affect ability and pricing of our target assets.
We operate in a highly competitive market for investment opportunities. Our profitability depends, in large part, on our ability to acquire our target assets at attractive prices. In acquiring our target assets, we compete with a variety of institutional investors, including other REITs, specialty finance companies, public and private funds, government entities, commercial and investment banks, commercial finance and insurance companies and other financial institutions. Many of our competitors are substantially larger and have considerably greater financial, technical, technological, marketing and other resources than we do. Other REITs with investment objectives that overlap with ours may elect to raise significant amounts of capital, which may create additional competition for investment opportunities. Some competitors may have a lower cost of funds and access to funding sources that may not be available to us. Many of our competitors are not subject to the operating constraints associated with REIT compliance or maintenance of an exemption from the Investment Company Act. In addition, some of our competitors may have higher risk tolerances or different risk assessments, which could allow them to consider a wider variety of investments and establish more relationships than us. Furthermore, competition for investments in our target assets may lead to the price of such assets increasing, which may further limit our ability to generate desired returns. We cannot provide assurance that the competitive pressures we face will not have a material adverse effect on our business, financial condition and results of operations. Also, as a result of this competition, desirable investments in our target assets may be limited in the future and we may not be able to take advantage of attractive investment opportunities from time to time, as we can provide no assurance that we will be able to identify and make investments that are consistent with our investment objectives.
We may enter into new lines of business, acquire other companies or engage in other strategic initiatives, each of which may result in additional risks and uncertainties in our businesses.
We may pursue growth through acquisitions of other companies or other strategic initiatives. To the extent we pursue strategic investments or acquisitions, undertake other strategic initiatives or consider new lines of business, we will face numerous risks and uncertainties, including risks associated with:
•the availability of suitable opportunities;
•the level of competition from other companies that may have greater financial resources;
•our ability to assess the value, strengths, weaknesses, liabilities and potential profitability of potential acquisition opportunities accurately and negotiate acceptable terms for those opportunities;
•the required investment of capital and other resources;
•the lack of availability of financing and, if available, the terms of any financings;
•the possibility that we have insufficient expertise to engage in such activities profitably or without incurring inappropriate amounts of risk;
•the diversion of management’s attention from our core businesses;
•the potential loss of key personnel of an acquired business;
•assumption of liabilities in any acquired business;
•the disruption of our ongoing businesses;
•the increasing demands on or issues related to the combining or integrating operational and management systems and controls;
•compliance with additional regulatory requirements;
•costs associated with integrating and overseeing the operations of the new businesses;
•failure to realize the full benefits of an acquisition, including expected synergies, cost savings, or growth opportunities, within the anticipated timeframe or at all; and
•post-acquisition deterioration in an acquired business that could result in lower or negative earnings contribution and/or goodwill impairment charges.
ANNALY CAPITAL MANAGEMENT, INC. AND SUBSIDIARIES
Item 1A. Risk Factors
Entry into certain lines of business may subject us to new laws and regulations with which we are not familiar, or from which we are currently exempt, and may lead to increased litigation and regulatory risk. The decision to increase or decrease investments within a line of business may lead to additional risks and uncertainties. In addition, if a new or acquired business generates insufficient revenues or if we are unable to efficiently manage our expanded operations, our results of operations will be adversely affected. Our strategic initiatives may include joint ventures, in which case we will be subject to additional risks and uncertainties in that we may be dependent upon, and subject to liability for, losses or reputational damage relating to systems, controls and personnel that are not under our control.
Some of our investments, including those related to non-prime loans, involve credit risk.
Our current investment strategy includes seeking growth in our residential credit business. The holder of a mortgage or mortgage-backed securities assumes the risk that the related borrowers may default on their obligations to make full and timely payments of principal and interest. Under our investment policy, we have the ability to acquire non-Agency mortgage-backed securities, residential whole loans, MSR and other investment assets of lower credit quality. In general, non-Agency mortgage-backed securities carry greater investment risk than Agency mortgage-backed securities because they are not guaranteed as to principal or interest by the U.S. Government, any federal agency or any federally chartered corporation. Non-investment grade, non-Agency securities tend to be less liquid, may have a higher risk of default and may be more difficult to value than investment grade bonds. Higher-than-expected rates of default and/or higher-than-expected loss severities on the mortgages underlying our non-Agency mortgage-backed securities, MSR or on our residential whole loan investments may adversely affect the value of those assets. Accordingly, defaults in the payment of principal and/or interest on our non-Agency mortgage-backed securities, residential whole loan investments, MSR and other investment assets of lower credit quality would likely result in our incurring losses of income from, and/or losses in market value relating to, these assets.
We have certain investments in non-Agency mortgage-backed securities backed by collateral pools containing mortgage loans that were originated under underwriting standards that were less strict than those used in underwriting “prime mortgage loans.” These lower standards permitted mortgage loans, often with LTV ratios in excess of 80%, to be made to borrowers having impaired credit histories, lower credit scores, higher debt-to-income ratios and/or unverified income. Difficult economic conditions, including increased interest rates and lower home prices, can result in non-prime and subprime mortgage loans having increased rates of delinquency, foreclosure, bankruptcy and loss (including such as during the credit crisis of 2007-2008 and the housing crisis that followed), and are likely to otherwise experience delinquency, foreclosure, bankruptcy and loss rates that are higher, and that may be substantially higher, than those experienced by mortgage loans underwritten in a more traditional manner. Thus, because of higher delinquency rates and losses associated with non-prime and subprime mortgage loans, the performance of our non-Agency mortgage-backed securities that are backed by these types of loans could be correspondingly adversely affected, which could materially adversely impact our results of operations, financial condition and business.
If we are unable to attract, motivate and retain qualified talent, including our key personnel, it could materially and adversely affect us.
Our success and our ability to manage anticipated future growth depend, in large part, upon the efforts of our highly skilled employees, and particularly on our key personnel, including our executive officers. Our executive officers have extensive experience and strong reputations in the sectors in which we operate and have been instrumental in setting our strategic direction, operating our business, identifying, recruiting, and training our other key personnel, and arranging necessary financing. The departure of any of our executive officers or other key personnel, or our inability to attract, motivate and retain highly qualified employees at all levels of the firm in light of the intense competition for talent, could adversely affect our business, operating results or financial condition; diminish our investment opportunities; or weaken our relationships with lenders, business partners and industry personnel.
Other Risks
The market price and trading volume of our shares of common stock may be volatile and issuances of large amounts of shares of our common stock could cause the market price of our common stock to decline.
If we issue a significant number of shares of common stock or securities convertible into common stock in a short period of time, there could be a dilution of the existing common stock and a decrease in the market price of the common stock.
The market price of our shares of common stock may be highly volatile and could be subject to wide fluctuations. In addition, the trading volume in our shares of common stock may fluctuate and cause significant price variations to occur. We cannot assure you that the market price of our shares of common stock will not fluctuate or decline significantly in the future. Some of
ANNALY CAPITAL MANAGEMENT, INC. AND SUBSIDIARIES
Item 1A. Risk Factors
the factors that could negatively affect our share price or result in fluctuations in the price or trading volume of our shares of common stock include those set forth under “Special Note Regarding Forward-Looking Statements” as well as:
•actual or anticipated variations in our quarterly operating results or business prospects;
•changes in our earnings estimates or publication of research reports about us or the real estate industry;
•an inability to meet or exceed securities analysts’ estimates or expectations;
•increases in market interest rates;
•hedging or arbitrage trading activity in our shares of common stock;
•capital commitments;
•changes in market valuations of similar companies;
•adverse market reaction to any increased indebtedness we incur in the future;
•additions or departures of management personnel;
•actions by institutional stockholders or activist investors;
•speculation in the press or investment community;
•changes in our distribution policy;
•government action or regulation;
•general market and economic conditions; and
•future sales of our shares of common stock or securities convertible into, or exchangeable or exercisable for, our shares of common stock.
Holders of our shares of common stock will be subject to the risk of volatile market prices and wide fluctuations in the market price of our shares of common stock. These factors may cause the market price of our shares of common stock to decline, regardless of our financial condition, results of operations, business or prospects. It is impossible to assure you that the market prices of our shares of common stock will not fall in the future.
Under our charter, we have 1,531,750,000 authorized shares of capital stock, par value of $0.01 per share. Sales of a substantial number of shares of our common stock or other equity-related securities in the public market, or any hedging or arbitrage trading activity that may develop involving our common stock, could depress the market price of our common stock and impair our ability to raise capital through the sale of additional equity securities.
We may change our policies without stockholder approval.
Our Board has established very broad investment guidelines that may be amended from time to time. Our Board and management determine all of our significant policies, including our investment, financing, capital and asset allocation and distribution policies. They may amend or revise these policies at any time without a vote of our stockholders, or otherwise initiate a change in asset allocation. Policy changes could adversely affect our financial condition, results of operations, the market price of our common stock or our ability to pay dividends or distributions.
ANNALY CAPITAL MANAGEMENT, INC. AND SUBSIDIARIES
| | |
| ITEM 1B. UNRESOLVED STAFF COMMENTS |
|
None.
For a full discussion of our cybersecurity risk management process and policies, please refer to the subsection titled “Operational Risk Management” within the “Risk Management” section of Part II, Item 7. “Management’s Discussion and Analysis of Financial Condition and Results of Operations.”
Our executive and administrative office is located at 1211 Avenue of the Americas New York, New York 10036, telephone 212-696-0100. This office is leased under a non-cancelable lease expiring September 30, 2025.
For a description of the commercial real estate properties we own as part of our investment portfolio, refer to the section titled “Schedule III – Real Estate and Accumulated Depreciation” of Item 15. “Exhibits, Financial Statement Schedules.”
| | |
| ITEM 3. LEGAL PROCEEDINGS |
|
From time to time, we are involved in various claims and legal actions arising in the ordinary course of business. AtAs of December 31, 2020,2023, we were not party to any pending material legal proceedings.proceedings and we are not aware of any contemplated material proceedings by governmental authorities.
| | |
| ITEM 4. MINE SAFETY DISCLOSURES |
|
None.
ANNALY CAPITAL MANAGEMENT, INC. AND SUBSIDIARIES
Item 5. Market for Registrant’s Common Equity, Related Stockholder Matters And Issuer Purchases Of Equity Securities
PART II
| | |
| ITEM 5. MARKET FOR REGISTRANT’S COMMON EQUITY, RELATED STOCKHOLDER MATTERS AND ISSUER PURCHASES OF EQUITY SECURITIES |
|
Our common stock began trading publicly on October 8, 1997 and is traded on the New York Stock Exchange under the trading symbol “NLY.” As of February 2, 2021,January 31, 2024, we had 1,398,502,906500,080,287 shares of common stock issued and outstanding which were held by approximately 433,000approximately 480,324 beneficial holders. The equity compensation plan information called for by Item 201(d) of Regulation S-K is set forth in Item 12 of Part III of this Form 10-K under the heading “Equity Compensation Plan Information.”
Dividends
We intend to pay quarterly dividends and to distribute to our stockholders all or substantially all of our taxable income in each year (subject to certain adjustments) consistent with the distribution requirements applicable to REITs. This will enable us to qualify for the tax benefits accorded to a REIT under the Code. We have not established a minimum dividend payment level and our ability to pay dividends may be adversely affected by factors beyond our control. In addition, unrealized changes in the estimated fair value of available-for-sale investments may have a direct effect on dividends. All distributions will be made at the discretion of our Board and will depend on our earnings, our financial condition, maintenance of our REIT status and such other factors as our Board may deem relevant from time to time. See also Item 1A. “Risk Factors.” No dividends can be paid on our common stock unless we have paid full cumulative dividends on our preferred stock. From the date of issuance of our preferred stock through December 31, 2020,2023, we have paid full cumulative dividends on our preferred stock.
Share Performance Graph
The following graph and table set forth certain information comparing the yearly percentage change in cumulative total return on our common stock to the cumulative total return of the Standard & Poor’s Composite 500 stock Index or S&P 500 Index, and the Bloomberg Mortgage REIT Index, or BBG REIT index, an industry index of mortgage REITs. The comparison is for the five-year period ended December 31, 20202023 and assumes the reinvestment of dividends. The graph and table assume that $100 was invested in our common stock and the two other indices on the last trading day of the initial year shown in the graph. Upon written request we will provide stockholders with a list of the REITs included in the BBG REIT Index.
ANNALY CAPITAL MANAGEMENT, INC. AND SUBSIDIARIES
Item 5. Market for Registrant’s Common Equity, Related Stockholder Matters And Issuer Purchases Of Equity Securities
Five-Year Share Performance
| | | | 12/31/2015 | | 12/31/2016 | | 12/31/2017 | | 12/31/2018 | | 12/31/2019 | | 12/31/2020 | | 12/31/2018 | | 12/31/2019 | | 12/31/2020 | | 12/31/2021 | | 12/31/2022 | | 12/31/2023 |
| Annaly Capital Management, Inc. | Annaly Capital Management, Inc. | 100 | | 119 | | 157 | | 146 | | 156 | | 160 | Annaly Capital Management, Inc. | 100 | | 107 | | 110 | | 113 | | 89 | | 93 |
| S&P 500 Index | S&P 500 Index | 100 | | 112 | | 136 | | 130 | | 171 | | 203 | S&P 500 Index | 100 | | 131 | | 156 | | 200 | | 164 | | 207 |
| BBG REIT Index | BBG REIT Index | 100 | | 122 | | 147 | | 143 | | 177 | | 137 | BBG REIT Index | 100 | | 124 | | 96 | | 113 | | 86 | | 98 |
The information in the share performance graph and table has been obtained from sources believed to be reliable, but neither the accuracy nor completeness can be guaranteed. The historical information set forth above is not necessarily indicative of future performance. Accordingly, we do not make or endorse any predictions as to future share performance.
The above performance graph and related information shall not be deemed to be “soliciting material” or to be “filed” with the SEC or subject to Regulation 14A or 14C under the Securities Exchange Act or to the liabilities of Section 18 of the Securities Exchange Act, and shall not be deemed to be incorporated by reference into any filing under the Securities Act of 1933 or the Securities Exchange Act, except to the extent that we specifically incorporate it by reference into such a filing.
Share Repurchase
In June 2019, we announced that our Board authorized the repurchase of up to $1.5 billion of our outstanding common shares, which expired on December 31, 2020 (the “Prior Share Repurchase Program”). In December 2020,January 2022, we announced that our Board authorized the repurchase of up to $1.5 billion of our outstanding common shares through December 31, 2021 (the “New Share2024. The new share repurchase program replaces our previous $1.5 billion share repurchase program, which expired on December 31, 2021. No shares were repurchased with respect to this share repurchase program during the year ended December 31, 2023. As of December 31, 2023, the maximum dollar value of shares that may yet be purchased under this program was $1.5 billion.
In November 2022, we announced that our Board authorized a repurchase plan for all of our existing outstanding Preferred Stock (as defined below, the “Preferred Stock Repurchase Program”). Under the terms of the plan, we are authorized to repurchase up to an aggregate of 63,500,000 shares of Preferred Stock, comprised of up to (i) 28,800,000 shares of our 6.95% Series F Fixed-to-Floating Rate Cumulative Redeemable Preferred Stock, par value $0.01 per share (the “Series F Preferred Stock”), (ii) 17,000,000 shares of our 6.50% Series G Fixed-to-Floating Rate Cumulative Redeemable Preferred Stock, par value $0.01 per share (the “Series G Preferred Stock”), and (iii) 17,700,000 shares of our 6.75% Series I Fixed-to-Floating Rate Cumulative Redeemable Preferred Stock, par value $0.01 per share (the “Series I Preferred Stock”, and together with Series F Preferred Stock and Series G Preferred Stock, the “Preferred Stock”). The New Shareaggregate liquidation value of the Preferred Stock that may be repurchased by us pursuant to the Preferred Stock Repurchase Program, replaced the Prior Shareas of November 3, 2022, was approximately $1.6 billion. The Preferred Stock Repurchase Program. The following table sets forth informationProgram became effective on November 3, 2022, and shall expire on December 31, 2024. No shares were repurchased to with respect to the Prior SharePreferred Stock Repurchase Program forduring the quarteryear ended December 31, 2020.2023. As of December 31, 2023, the maximum dollar value of shares that may yet be purchased under this plan was $1.6 billion.
ANNALY CAPITAL MANAGEMENT, INC. AND SUBSIDIARIES
Item 5. Market for Registrant’s Common Equity, Related Stockholder Matters And Issuer Purchases Of Equity Securities
| | | | | | | | | | | | | | |
| Total Number of Shares Purchased | Average Price Paid Per Share (1) | The Total Number of Shares Purchased as Part of a Publicly Announced Repurchase Program | Maximum Dollar Value of Shares That May Yet Be Purchased Under The Plan (1) |
| (dollars in thousands) |
| October 1, 2020 - October 31, 2020 | 4,699,987 | | $ | 7.29 | | 4,699,987 | | $ | 1,067,886 | |
| Total | 4,699,987 | | | 4,699,987 | | $ | 1,067,886 | |
| | | | |
(1) Excludes commission costs. |
| | | | |
ANNALY CAPITAL MANAGEMENT, INC. AND SUBSIDIARIES
Item 6. Selected Financial Data
| | |
ITEM 6. SELECTED FINANCIAL DATA[Reserved] |
|
Not required.
ANNALY CAPITAL MANAGEMENT, INC. AND SUBSIDIARIES
Item 7. Management’s Discussion and Analysis
| | |
| ITEM 7. MANAGEMENT’S DISCUSSION AND ANALYSIS OF FINANCIAL CONDITION AND RESULTS OF OPERATIONS |
|
Special Note Regarding Forward-Looking Statements
Certain statements contained in this annual report, and certain statements contained in our future filings with the SEC, in our press releases or in our other public or stockholder communications contain or incorporate by reference certain forward-looking statements which are based on various assumptions (some of which are beyond our control) and may be identified by reference to a future period or periods or by the use of forward-looking terminology, such as “may,” “will,” “believe,” “expect,” “anticipate,” “continue,” or similar terms or variations on those terms or the negative of those terms. Actual results could differ materially from those set forth in forward-looking statements due to a variety of factors, including, but not limited to, changes in interest rates; changes in the yield curve; changes in prepayment rates; the availability of mortgage-backed securities and other securities for purchase; the availability of financing and, if available, the terms of any financing; changes in the market value of our assets; changes in business conditions and the general economy; our ability to grow our commercial, residential credit and middle market businesses; credit risks related to our investments in credit risk transfer securities, residential mortgage-backed securities and related residential mortgage credit assets, commercial real estate assets and corporate debt; risks related to investments in MSRs; our ability to consummate any contemplated investment opportunities; changes in government regulations or policy affecting our business; our ability to maintain our qualification as a REIT for U.S. federal income tax purposes; our ability to maintain our exemption from registration under the Investment Company Act; and risks and uncertainties related to Coronavirus Disease 2019 (“COVID-19”), including as related to adverse economic conditions on real-estate related assets and financing conditions. For a discussion of the risks and uncertainties which could cause actual results to differ from those contained in the forward-looking statements, see “Risk Factors” in this annual report on Form 10-K and any subsequent quarterly reports on Form 10-Q or current reports on Form 8-K. We do not undertake, and specifically disclaim any obligation, to publicly release the result of any revisions which may be made to any forward-looking statements to reflect the occurrence of anticipated or unanticipated events or circumstances after the date of such statements.
All references to “Annaly,” “we,” “us,” or “our” mean Annaly Capital Management, Inc. and all entities owned by us, except where it is made clear that the term means only the parent company. Refer to the section titled “Glossary of Terms” located at the end of this Item 7 for definitions of commonly used terms in this annual report on Form 10-K.
This section of our Form 10-K generally discusses 20202023 and 20192022 items and year-to-year comparisons between 20202023 and 2019.2022. Discussions of 20182021 items and year-to-year comparisons between 20192022 and 20182021 that are not included in this Form 10-K can be found in Part II, Item 7. “Management’s Discussion and Analysis of Financial Condition and Results of Operations” of our annual report on Form 10-K for the year ended December 31, 2019.2022.
ANNALY CAPITAL MANAGEMENT, INC. AND SUBSIDIARIES
Item 7. Management’s Discussion and Analysis
| | | | | |
| INDEX TO ITEM 7. MANAGEMENT’S DISCUSSION AND ANALYSIS OF FINANCIAL CONDITION AND RESULTS OF OPERATIONS |
| | Page |
| |
| |
| |
| |
| |
| |
| |
| |
| |
| |
| |
| |
| |
| |
| |
| |
| |
| |
| |
| |
| |
| |
| |
| |
| |
| |
| |
| |
| |
| |
| |
| |
| |
| |
| |
| |
| |
| |
| |
| |
| |
| |
| |
| |
| |
| |
| |
| |
MSRs | |
| |
| |
| |
| |
| |
| |
ANNALY CAPITAL MANAGEMENT, INC. AND SUBSIDIARIES
Item 7. Management’s Discussion and Analysis
Overview
We are a leading diversified capital manager that invests in and finances residential and commercial assets.with investment strategies across mortgage finance. Our principal business objective is to generate net income for distribution to our stockholders and optimize our returns through prudent management of our diversified investment strategies. We are an internally-managed Maryland corporation founded in 1997 that has elected to be taxed as a REIT. Prior to the closing of the Internalization (as defined in Item 1 under “Closing of the Internalization and Termination of the Management Agreement”) on June 30, 2020, we were externally managed by Annaly Management Company LLC (our “Former Manager”). Our common stock is listed on the New York Stock Exchange under the symbol “NLY.”
We use our capital coupled with borrowed funds to invest primarily in real estate related investments, earning the spread between the yield on our assets and the cost of our borrowings and hedging activities.
For a full discussion of our business, refer to the section titled “Business Overview” of Part I, Item 1. “Business.”
Reverse Stock Split
On September 8, 2022, we announced that our Board had unanimously approved a reverse stock split of our common stock at a ratio of 1-for-4 (the “Reverse Stock Split”). The Reverse Stock Split was effective following the close of business on September 23, 2022 (the “Effective Time”). Accordingly, at the Effective Time, every four issued and outstanding shares of our common stock were converted into one share of our common stock. No fractional shares were issued in connection with the Reverse Stock Split. Instead, each stockholder that would have held fractional shares as a result of the Reverse Stock Split received cash in lieu of such fractional shares. The par value per share of our common stock remained unchanged at $0.01 per share after the Reverse Stock Split. Accordingly, for all historical periods presented, an amount equal to the par value of the reduced number of shares resulting from the Reverse Stock Split was reclassified from Common stock to Additional paid in capital in our Consolidated Statements of Financial Condition. All references made to share or per share amounts in the accompanying consolidated financial statements and disclosures have been retroactively adjusted, where applicable, to reflect the effects of the Reverse Stock Split.
Business Environment
Financial markets saw meaningful volatility in 2023, marking a second consecutive year in which fixed income markets were more broadly impacted by elevated uncertainty around the outlook for the economy and COVID-19the macroeconomic landscape. The volatility was driven by a combination of factors, including bank earnings and liquidity pressures that emerged in March 2023 following the sudden failure of Silicon Valley Bank. Fears over the health of the broader banking system ultimately proved disproportionate, evidenced by a normalization in interest rates as the economy remained robust. However, interest rates then rose sharply between August and October with the ten-year Treasury note reaching the 5% yield mark as market participants appeared increasingly concerned about the outlook for the fiscal trajectory. The total deficit reached $1.78 trillion for the full calendar year, representing another year of large fiscal deficits despite healthy economic growth.
The themesbroader economy continued to expand, labor markets remained robust and inflation moderated throughout the year. While many observers had expected the economy to enter into a recession in 2023, data thus far has suggested that inflation moderated without a meaningful deterioration in economic activity, setting up a scenario in which parts of the economy moved into better balances without a sharp contraction in economic output or a significantly weaker labor market (a so-called “soft landing”). The increased likelihood of a soft landing appears to have dominated financial marketsbeen driven by numerous factors, including fewer price pressures on the supply side of the economy as shipping of goods normalized following earlier disruptions from the pandemic and the Russian invasion of the Ukraine. In addition, U.S. consumers continue to find employment and enjoy healthy balance sheets, while growing wages afford them the ability to continue to spend on goods and services, thereby supporting broader economic growth. Private sector investment activity rebounded somewhat in 2023 relative to 2022, while government spending and investment incentives created by federal legislation supported economic growth as well.
Following the rapid tightening in monetary policy in 2022, the Federal Reserve (the “Fed”) raised interest rates an additional one percentage point in 2023 and ultimately kept the Federal Funds Target Rate at 5.25% – 5.50% since late July. Meanwhile, the elevated volatility seenFed maintained the pace it set in March2022 in the reduction of its balance sheet throughout the year, effectively letting up to $60 billion in Treasury and April 2020 remain unchanged. Fiscal stimulus has supported businesses and consumers most negatively impactedup to $35 billion in Agency MBS runoff per month in 2023. Driven by COVID-19 whilethe continued maturities, the Federal Reserve’s (“Fed”) unprecedented monetary policy actions eased financial conditions and contained interest rate volatility. These factors drove our strong performancebalance sheet declined by $838 billion to close out$7.7 trillion over the year, delivering an economic return of 5.1% for the fourth quarter and 1.8% for 2020. Throughout the year, we returned $1.4 billion aggregate in common and preferred dividends to our shareholders, signaling meaningful resilience following the historic disruption seen in March and April.
Interest rates ended 2020 near their highest levels since the onsetcourse of the COVID-19 pandemic reflecting optimism aboutyear.
In this environment, home prices outperformed the post-COVID recoverymarket’s expectations despite mortgage rates reaching 20-year highs, resulting in spite of negative developments of record U.S. virus cases, tighter restrictions and resulting lackluster economic growth particularly in the U.S. service sector. The rapid COVID-19 vaccine development and planshistorically low affordability for deployment, combined with the relatively healthy consumer balance sheets, suggest that the U.S. economy may rebound at a faster pace than during traditional economic downturns once a majority of the population reaches immunity, though meaningful uncertainties remain about both the timing of immunity and the subsequent recovery pace.
At the end of 2020, our capital allocation remained tilted towards Agency mortgage-backed securities (“MBS”), representing 78% of the aggregate portfolio, compared to 74% one year ago. However, this year-over-year snapshot masks more recent increases in activity in our residential credit and middle market lending businesses, which saw strong investor sponsorship and improving fundamentals as markets signal a cyclical recovery. As Agency MBS spreadsprospective homeowners. Home prices have continued to tighten given Fed and bank sectorbenefit from existing homeowners’ inability to move homes absent a meaningful increase in housing costs (the so called “lock in effect”), resulting in low availability of inventory for sale as borrowers locked into below-market mortgage rates are less willing to move or trade up. Housing activity remains depressed, although we have seen modest signs of an uptick in demand forfollowing the product, select credit sectors have allowed for targeted, attractive opportunities. While opportunistic, Annaly continues with its disciplined and defensive-minded credit focus, which is necessary given overall tight asset spreads.
Somewhat offsetting the effect from tight asset spreads, current financing conditions are among the most favorable seen in Annaly’s history. The liquidity created through the Fed’s monetary policy actions have led to absolute low level of rates and a flat term structure of the repo curve. Favorable financing conditions have allowed us to increase our net interest margin (excluding PAA) from 1.41% at the end of 2019 to 1.98% at the end of 2020, as cheaper financing more than offset therecent decline in asset yields driven bymortgage rates. Ultimately, we are constructive on the aforementioned spread compression. Additionally, securitization markets have rebounded substantially, resultinghousing market outlook should the labor market and consumers remain resilient in better execution levels than one year ago, and provide attractive non-recourse term financing to bolster our residential credit asset investment strategy and diversify financing for our whole loan business.
Business Continuity
Our well-established Business Continuity Planning (“BCP”) was designed to ensure continued, effective operations through a variety of scenarios including natural disasters and disease pandemics. It identifies critical systems, processes, roles and third parties, and can be adjusted on a real-time basis to address situations as they arise.
The BCP is regularly updated and tested. Annual testing includes extensive, remote Disaster Recovery testing and tabletop exercise scenarios with management. Key tenets of the planning include active communication between our Crisis Response Team, which is comprised of senior leaders across a number of functions, and our internal and external stakeholders to afford efficient, thoughtful, effective responses to evolving emergency situations.
Historical tabletop exercises have included use of CDC Influenza Pandemic exercise materials. That exercise documented our response and possible impacts to a variety of scenarios, including those in which “shelter in place orders” were required and response/ impact assessments to those scenarios. Regular meetings were commenced to implement and review active internal and external communications planning. These exercises, along with regulatory and industry guidance, informed our staged response to the conditions created by COVID-19. We took proactive actions, which included canceling non-essential travel and instituting 100% remote working, ahead of New York State-mandated requirements. To protect the health and well-being of our employees, their families and communities remote work requirements began in phases in early March, culminatingline with a “soft landing” economic scenario.
ANNALY CAPITAL MANAGEMENT, INC. AND SUBSIDIARIES
Item 7. Management’s Discussion and Analysis
company-wide exerciseOver the course of the year, we generated a +6.0% economic return, which demonstrates the efficacy of our diversified housing finance model, as well as our disciplined portfolio and risk management. In light of the volatile environment, we continued to proactively manage our leverage profile throughout the year, in turn reducing our economic leverage from 6.3x at the end of the 2022 to 5.7x at the end of 2023. A part of the reduced leverage is driven by further diversification into our Residential Credit and MSR businesses, which are less levered than Agency MBS. Of note, the combined capital allocation to the two businesses increased by five percentage points to 38% at the end of 2023.
Turning to the Agency MBS portfolio, our aggregate portfolio declined modestly, falling from $72.9 billion in assets at the end of 2022 to $65.7 billion at the end of 2023. The lower portfolio balance is largely driven by asset sales throughout the year to accommodate the shift in capital allocation, as well as a somewhat lower leverage in the strategy as interest rate markets and mortgage spreads remained very volatile throughout most of the year. In addition to somewhat lower aggregate holdings, we focused on March 13, 2020shifting the coupon distribution higher throughout the year, bringing the share of 5.0% coupons or higher to test connectivity48%, up 17 percentage points from the 2022 year-end levels. In addition, we rotated out of “to be announced” (“TBA”) security holdings, in turn reducing our holdings from $10.6 billion at the end of 2022 to ($0.6) billion at the end of 2023. This reduction was driven by the combination of reduced advantageous financing of TBA securities relative to specified pool ownership and functionality. All employees were ablethe desire to successfully performadd prepayment protection in higher coupon purchases. Finally, given attractive relative value opportunities with respect to Agency MBS, we increased our portfolio of Agency CMBS to $3.5 billion market value, as the asset class offered an attractive stable cash flow in volatile interest rate markets.
The residential credit sector benefited from the strong economic environment and the resilience of the housing market, enabling us to continue to achieve progress in building out the business. Our Residential Credit portfolio ended the year at $5.7 billion market value, having grown 14% year over year, and representing 20% of the firm’s capital. The business growth continued to be driven by our residential whole loan acquisition strategy, through which our Residential Credit business acquired $4.7 billion in loans, with a vast majority coming through our correspondent channel, which allows us to control all aspects of the loan making process, including asset selection, counterparties and loss mitigation.
Finally, we also continued to grow our MSR portfolio, further increasing assets through purchases predominantly of low-coupon bulk MSR packages, in turn growing the portfolio by 50% throughout 2023, to $2.7 billion market value. Similar to 2022, bulk trading activity of MSR packages remained at historically elevated levels as mortgage originators looked to monetize MSR holdings to offset low profit margins in their duties in this testingmortgage origination businesses. Meanwhile, demand for MSR also remained strong, as a broad investor base sought MSR as purely financial investments or to acquire escrow deposits and we have operated largely remotely sincecustomers that time.can later be refinanced. We opportunistically bought MSR packages as a strategic partner to originators given our complementary business strategy as a financial investor. Our MSR portfolio continued to consist predominantly of low coupon, high quality conventional MSR, which at the weighted average coupon of 3.06% at the end of 2023, remained far from having a refinancing incentive considering prevailing mortgage rates.
Economic leverage is a non-GAAP financial measure. Refer to the “Non-GAAP Financial Measures” section for additional information, including reconciliations to its most directly comparable GAAP results.
A majority of our business activities continues to be performed remotely, though we have seen a limited number of employees return to the office on a voluntary and periodic basis. We continue to monitor guidance from federal, state and local authorities to gauge how to further proceed in any efforts to return to the office.
Economic Environment
The pace ofU.S. real economic growth accelerated in 2020 slowed sharply, not only in the United States but worldwide, as the outbreak of the COVID-19 pandemic affected nearly all ways of life and disrupted many aspects of the economy. The far-reaching consequences of the COVID-19 pandemic led2023, with U.S. gross domestic product (“GDP”) rising 2.5% on a year-over-year basis, above the 1.9% recorded for 2022. Economic activity continued to declinestrengthen throughout the year, led by 3.5% year-over-yearsizeable increases in 2020,consumption. Consumer balance sheets remained healthy and benefited from further income growth, leading retail sales data to notably increase in turn marking the largest declinefourth quarter. Increased government spending spread across state, local and federal levels, as well as higher exports, also boosted the GDP. Meanwhile, fixed business investment was more muted throughout the year, while residential housing started to move sideways and home sales continued to fall in economic activity during a calendar year in more than 70 years. The disruptions causedlight of higher mortgage rates. Heading into 2024, recession risks appear relatively low given the upbeat picture of consumer and business spending, although the impact of the Fed’s monetary policy tightening continues to flow through to the real economy and credit conditions have tightened.
Meanwhile, the supply and demand for labor moved into better balance by the pandemic were unique in that they primarily impactedend of 2023. The unemployment rate ended the service sector of the economy, a sector that has been a source of relative stability during prior economic downturns. Other parts of the economy, including goods consumption and housing, have recoveredyear at 3.7%, increasing 0.2 percentage points from the initial pandemic-driven downturn and these sectors are now above 2019 output levels. Allhistoric low of this suggests that the economy is currently relatively bifurcated, requiring U.S. health officials to work to defeat the virus before economic activity can return to pre-pandemic levels in aggregate.
The sharp economic contraction led the unemployment rate to rise to 6.7%3.5% reported in December 2020, nearly twice as high2022. Total nonfarm payroll employment expanded at a slower pace in 2023, totaling 3.1 million added jobs, relative to 4.5 million added jobs seen in 2022. Strong job creation was accompanied by an increase in the supply of workers, as the unemploymentlabor force participation rate seen in December 2019 according toincreased gradually throughout the Bureau of Labor Statistics. The rise in the unemployment rate likely understates the number of jobs lost in 2020 asyear and the employment-to-population ratio fellrose slightly. At the same time, job openings trended lower, although they remained elevated relative to 57.4%, suggesting that 3.5%pre-pandemic averages. As a result of the population, or roughly 9 million people, no longer held a job at the end of 2020 compared to one year ago. Wage growth, as measured by the year-over-year change in private sector average hourly earnings rose sharply, reading 5.1% in the month of December 2020 compared to 3.0% in December 2019. The sharp increase in wages, however, appears to be driven by changes in the underlying composition of employees by industry, as sectors with generally lower wages, such as leisure and hospitality services, have seen outsized job losses relative to sectors with higher wages. Alternative measures ofmore balanced labor market, wage growth suchslowed as the Employment Cost Index orwages rose 4.3% over the Federal Reserve Bank of Atlanta’s Wage Tracker show meaningfully less wage growth.12 months ending in December, well below the 5.1% shown by the same metric a year earlier.
ANNALY CAPITAL MANAGEMENT, INC. AND SUBSIDIARIES
Item 7. Management’s Discussion and Analysis
Price pressures remained muted intoat elevated levels throughout the economic downturn as measured byyear although they have shown notable signs of progress toward the year-over-year changes in theFed’s 2% target. The headline Personal Consumption Expenditure Chain Price Index (“PCE”). The headline PCE measure increased by 1.3% year-over-year, the Fed’s preferred inflation gauge, measured 2.6% in December 2020.2023, after peaking at 7.0% on a year-over-year basis in June 2022. The more stable core PCE measure, which excludes volatiledoes not include price changes in food and energy sectors, measured 2.9% year-over year, the first time that the core PCE has been below 3.0% on a year-over-year basis since March 2021. Additionally, recent survey measures of short-run inflation expectations have declined meaningfully and longer-term inflation expectations appear well anchored. The disinflationary pressures are mostly attributed to lower goods prices, registered a similar 1.5% year-over-year increase. Although both inflationwhile the service sector remains elevated, particularly in measures remain somewhat below the Fed’s 2.0% inflation target, the Fed expects inflation to recover towards its target in coming yearssuch as the economy begins to recover from the economic downturn.
The Fed conducts monetary policy with a dual mandate: full employment and price stability. Given the contractioneasing of inflation pressures, the Fed slowed its tightening campaign at the beginning of 2023 and remained on pause in economic activity witnessed following the outbreaksecond half of the COVID-19 pandemic, the Fed increased its monetary policy support at unprecedented speed and size.year. The target range for the Federal Funds rate was cutincreased 100 basis points from 1.50%4.25% - 1.75%4.50% in December 20192022 to 0.0%5.25% - 0.25% in March 2020. Following5.50% by the interest rate cuts, the Fed provided guidance that short-term interest rates will remain near current levels “until labor market conditions have reached levels consistent with the Fed assessmentsend of maximum employment and inflation has risen to 2 percent and is on track to moderately exceed 2 percent for some time” as stated in2023. At the December 2020meeting of the Federal Open Market Committee meeting statement. In addition to(“FOMC”), Federal Reserve Chair Jerome Powell stated that the zero-interestpolicy rate is at or near its peak in the Fed’s tightening cycle and signaled an potentially easier monetary policy over the course of 2024. Regarding the FOMC’s balance sheet policy, the Fed restarteddecline in their securities portfolio, which started in 2022, continued uninterrupted throughout all of 2023. The amount of quantitative tightening – the process in which the Federal Reserve lets securities in its asset purchase programs, increasing its holdings of Treasury securitiesportfolio mature, thereby lowering bank reserves and other liquidity in the financial system – continues at $95 billion per month across U.S. Treasuries and Agency MBS, by a totalalmost twice the runoff rate of $2.0 trillionthe prior quantitative tightening period between 2017 and $631 billion, respectively. Asset purchases continued at the end of 2020 at a pace of $80 billion per month in Treasury securities and $40 billion per month in MBS. Beyond rate policy and asset purchases, the Fed also announced several lending programs to various other market sectors, such as corporate bonds, municipals, and small businesses, among others. These lending programs largely concluded their activities at the end of December 2020 but could be revived should the economic situation deteriorate.2019.
During 2023, U.S. Treasury rates were volatile as market participants adjusted expectations for economic conditions and monetary policy. Despite the year ended December 31, 2020, yieldsvolatility, the yield on the 10-year U.S. Treasury note declined by 101 bps primarily in the first half ofended the year effectively unchanged at 3.88%. The 10-year Treasury Inflation Protected Security (“TIPS”), which subtracts the expected inflation rate from the bond’s nominal yield, fell 13 basis points, as a sharp slowdownmarket participants have started to price in global economic growth and heightened uncertainties aroundan easing cycle for the economic recovery led to strong demand for interest rate products andFed. Meanwhile, the aforementioned unprecedented fiscal and monetary stimulus. The mortgage basis, or the spread between the 30-year Agency MBS coupon and 10-year U.S. Treasury rate, had a volatiletightened slightly, ending the year rising meaningfully in the first quarter before retracing given strong demand for MBS in the second half of the year.12 basis points tighter than December 2022.
The following table below presents interest rates and spreads at each date presented:
ANNALY CAPITAL MANAGEMENT, INC. AND SUBSIDIARIES | | | | | | | | | | | | | | | | | |
| | As of December 31, |
| | 2023 | | 2022 | | 2021 |
| 30-Year mortgage current coupon | 5.25% | | 5.39% | | 2.07% |
| Mortgage basis | 137 bps | | 152 bps | | 56 bps |
| 10-Year U.S. Treasury rate | 3.88% | | 3.87% | | 1.51% |
| | | | | |
| | | | | |
| | | | | |
| OIS SOFR Swaps | | | | | |
| 1-Month | 5.35% | | 4.36% | | 0.05% |
| 6-Month | 5.15% | | 4.80% | | 0.19% |
Item 7. Management’s Discussion and Analysis
| | | | | | | | | | | | | | | | | |
| | As of December 31, |
| | 2020 | | 2019 | | 2018 |
| 30-Year mortgage current coupon | 1.34% | | 2.71% | | 3.50% |
| Mortgage basis | 43 bps | | 79 bps | | 82 bps |
| 10-Year U.S. Treasury rate | 0.91% | | 1.92% | | 2.68% |
| LIBOR | | | | | |
| 1-Month | 0.14% | | 1.76% | | 2.50% |
| 6-Month | 0.26% | | 1.91% | | 2.88% |
London Interbank Offered Rate (“LIBOR”) Transition Working Group
We have established a cross-functional LIBOR transition committee to determine our transition plan and facilitate an orderly transition to alternative reference rates. Our plan includes steps to evaluate exposure, review contracts, assess impact to our business, process and technology and define a communication strategy with shareholders, regulators and other stakeholders. The committee also continues to engage with industry working groups and other market participants regarding the transition. In October 2020, as part of the transition from LIBOR, we participated in the Chicago Mercantile Exchange (“CME”) Group’s transitioning for price alignment and discounting for USD OTC cleared swaps from the daily effective federal funds rate to the secured overnight financing rate (“SOFR”). As a result of this activity, our existing swap and swaption positions have been updated with the new SOFR discounting curve and basis swaps entered into during this transition were sold in the CME Group’s auction on October 19, 2020. We continue to remain on track with our LIBOR transition plan, which requires different solutions depending on the underlying asset or liability. Most U.S.All LIBOR tenors have been extended from December 31, 2021relevant to June 2023. Similar to the rest of the market, the bulkus either are no longer published or are no longer representative. All of our exposure is in derivatives contracts. Certain contracts, such as interest rate swaps,LIBOR-linked instruments have an orderly market transition already in process, whereas other contracts, such as loan agreements require bilateral amendments with transition currently in process and adequate time leftfallen back to resolve. See “Risks Related to Our Investing, Portfolio Management and Financing Activities-Changes in the methoda non-LIBOR-based index, either by their contractual terms, pursuant to which LIBOR is determined and potential discontinuation of LIBOR may affect our results.”U.S. federal legislation, through clearinghouse action, or otherwise.
Results of Operations
The results of our operations are affected by various factors, many of which are beyond our control. Certain of such risks and uncertainties are described herein (see “Special Note Regarding Forward-Looking Statements” above) and in Part I, Item 1A. “Risk Factors”.
This Management Discussion and Analysis section contains analysis and discussion of financial results computed in accordance with U.S. generally accepted accounting principles (“GAAP”) and non-GAAP measurements. To supplement our consolidated financial statements, which are prepared and presented in accordance with GAAP, we provide non-GAAP financial measures to enhance investor understanding of our period-over-period operating performance and business trends, as well as for assessing our performance versus that of industry peers.
Refer to the “Non-GAAP Financial Measures” section for additional information.
ANNALY CAPITAL MANAGEMENT, INC. AND SUBSIDIARIES
Item 7. Management’s Discussion and Analysis
Net Income (Loss) Summary
The following table presents financial information related to our results of operations as of and for the years ended December 31, 2020, 20192023, 2022 and 2018.2021.
| | | |
| | |
| | |
| | |
| | |
| | | | As of and for the Years Ended December 31, | |
| | | 2020 | | 2019 | | 2018 | |
| | | (dollars in thousands, except per share data) | |
| Interest income | Interest income | $ | 2,229,625 | | | $ | 3,787,297 | | | $ | 3,332,563 | | |
| Interest income | |
| Interest income | |
| Interest expense | |
| Interest expense | |
| Interest expense | Interest expense | 899,112 | | | 2,784,875 | | | 1,897,860 | | |
| Net interest income | Net interest income | 1,330,513 | | | 1,002,422 | | | 1,434,703 | | |
| Realized and unrealized gains (losses) | (2,062,824) | | | (3,011,127) | | | (1,162,984) | | |
| Net interest income | |
| Net interest income | |
| Servicing and related income | |
| Servicing and related income | |
| Servicing and related income | |
| Servicing and related expense | |
| Servicing and related expense | |
| Servicing and related expense | |
| Net servicing income | |
| Net servicing income | |
| Net servicing income | |
| Other income (loss) | |
| Other income (loss) | |
| Other income (loss) | Other income (loss) | 53,314 | | | 136,413 | | | 109,927 | | |
| Less: Total general and administrative expenses | Less: Total general and administrative expenses | 239,198 | | | 301,634 | | | 329,873 | | |
| Less: Total general and administrative expenses | |
| Less: Total general and administrative expenses | |
| Income (loss) before income taxes | |
| Income (loss) before income taxes | |
| Income (loss) before income taxes | Income (loss) before income taxes | (918,195) | | | (2,173,926) | | | 51,773 | | |
| Income taxes | Income taxes | (28,423) | | | (10,835) | | | (2,375) | | |
| | Income taxes | |
| Income taxes | |
| Net income (loss) | |
| Net income (loss) | |
| Net income (loss) | Net income (loss) | (889,772) | | | (2,163,091) | | | 54,148 | | |
| Less: Net income (loss) attributable to noncontrolling interests | Less: Net income (loss) attributable to noncontrolling interests | 1,391 | | | (226) | | | (260) | | |
| Less: Net income (loss) attributable to noncontrolling interests | |
| Less: Net income (loss) attributable to noncontrolling interests | |
| Net income (loss) attributable to Annaly | |
| Net income (loss) attributable to Annaly | |
| Net income (loss) attributable to Annaly | Net income (loss) attributable to Annaly | (891,163) | | | (2,162,865) | | | 54,408 | | |
| Less: Dividends on preferred stock | Less: Dividends on preferred stock | 142,036 | | | 136,576 | | | 129,312 | | |
| Less: Dividends on preferred stock | |
| Less: Dividends on preferred stock | |
| Net income (loss) available (related) to common stockholders | |
| Net income (loss) available (related) to common stockholders | |
| Net income (loss) available (related) to common stockholders | Net income (loss) available (related) to common stockholders | $ | (1,033,199) | | | $ | (2,299,441) | | | $ | (74,904) | | |
| Net income (loss) per share available (related) to common stockholders | Net income (loss) per share available (related) to common stockholders | | | | | | |
| Net income (loss) per share available (related) to common stockholders | |
| Net income (loss) per share available (related) to common stockholders | |
| Basic | |
| Basic | |
| Basic | Basic | $ | (0.73) | | | $ | (1.60) | | | $ | (0.06) | | |
| Diluted | Diluted | $ | (0.73) | | | $ | (1.60) | | | $ | (0.06) | | |
| Diluted | |
| Diluted | |
| Weighted average number of common shares outstanding | |
| Weighted average number of common shares outstanding | |
| Weighted average number of common shares outstanding | Weighted average number of common shares outstanding | | | |
| Basic | Basic | 1,414,659,439 | | | 1,434,912,682 | | | 1,209,601,809 | | |
| Basic | |
| Basic | |
| Diluted | |
| Diluted | |
| Diluted | Diluted | 1,414,659,439 | | | 1,434,912,682 | | | 1,209,601,809 | | |
| Other information | Other information | | | |
| Asset portfolio at period-end | $ | 86,403,446 | | | $ | 127,402,106 | | | $ | 102,340,249 | | |
| Other information | |
| Other information | |
| Investment portfolio at period-end | |
| Investment portfolio at period-end | |
| Investment portfolio at period-end | |
| Average total assets | |
| Average total assets | |
| Average total assets | Average total assets | $ | 99,663,704 | | | $ | 123,202,411 | | | $ | 102,544,922 | | |
| Average equity | Average equity | $ | 14,103,589 | | | $ | 15,325,340 | | | $ | 14,332,404 | | |
Leverage at period-end (1) | 5.1:1 | | 7.1:1 | | 6.3:1 | |
Economic leverage at period-end (2) | 6.2:1 | | 7.2:1 | | 7.0:1 | |
Capital ratio (3) | 13.6 | % | | 12.0 | % | | 12.1 | % | |
| Average equity | |
| Average equity | |
GAAP leverage at period-end (1) | |
GAAP leverage at period-end (1) | |
GAAP leverage at period-end (1) | |
GAAP capital ratio at period-end (2) | |
GAAP capital ratio at period-end (2) | |
GAAP capital ratio at period-end (2) | |
| Annualized return on average total assets | |
| Annualized return on average total assets | |
| Annualized return on average total assets | Annualized return on average total assets | (0.89) | % | | (1.76) | % | | 0.05 | % | |
| Annualized return on average equity | Annualized return on average equity | (6.31) | % | | (14.11) | % | | 0.38 | % | |
| Net interest margin (4) | 1.46 | % | | 0.83 | % | | 1.39 | % | |
Average yield on interest earning assets (5) | 2.44 | % | | 3.15 | % | | 3.23 | % | |
Average GAAP cost of interest bearing liabilities (6)
| 1.09 | % | | 2.57 | % | | 2.15 | % | |
| Annualized return on average equity | |
| Annualized return on average equity | |
Net interest margin (3) | |
Net interest margin (3) | |
Net interest margin (3) | |
Average yield on interest earning assets (4) | |
Average yield on interest earning assets (4) | |
Average yield on interest earning assets (4) | |
Average GAAP cost of interest bearing liabilities (5) | |
Average GAAP cost of interest bearing liabilities (5) | |
Average GAAP cost of interest bearing liabilities (5) | |
| Net interest spread | |
| Net interest spread | |
| Net interest spread | Net interest spread | 1.35 | % | | 0.58 | % | | 1.08 | % | |
| Weighted average experienced CPR for the period | Weighted average experienced CPR for the period | 20.2 | % | | 12.7 | % | | 9.3 | % | |
| Weighted average experienced CPR for the period | |
| Weighted average experienced CPR for the period | |
| Weighted average projected long-term CPR at period-end | |
| Weighted average projected long-term CPR at period-end | |
| Weighted average projected long-term CPR at period-end | Weighted average projected long-term CPR at period-end | 16.4 | % | | 13.9 | % | | 10.1 | % | |
| Common stock book value per share | Common stock book value per share | $ | 8.92 | | | $ | 9.66 | | | $ | 9.39 | | |
Non-GAAP metrics (7) | | | |
| Common stock book value per share | |
| Common stock book value per share | |
| Non-GAAP metrics * | |
| Non-GAAP metrics * | |
| Non-GAAP metrics * | |
| Interest income (excluding PAA) | Interest income (excluding PAA) | $ | 2,645,069 | | | $ | 4,042,191 | | | $ | 3,270,542 | | |
| Economic interest expense | $ | 1,106,989 | | | $ | 2,433,500 | | | $ | 1,797,307 | | |
| Interest income (excluding PAA) | |
| Interest income (excluding PAA) | |
Economic interest expense (5) | |
Economic interest expense (5) | |
Economic interest expense (5) | |
| Economic net interest income (excluding PAA) | |
| Economic net interest income (excluding PAA) | |
| Economic net interest income (excluding PAA) | Economic net interest income (excluding PAA) | $ | 1,538,080 | | | $ | 1,608,691 | | | $ | 1,473,235 | | |
| Premium amortization adjustment cost (benefit) | Premium amortization adjustment cost (benefit) | $ | 415,444 | | | $ | 254,894 | | | $ | (62,021) | | |
Core earnings (excluding PAA) (8) | $ | 1,696,167 | | | $ | 1,575,396 | | | $ | 1,574,920 | | |
| Core earnings (excluding PAA) per common share | $ | 1.10 | | | $ | 1.00 | | | $ | 1.20 | | |
| Annualized core return on average equity (excluding PAA) | 12.03 | % | | 10.28 | % | | 10.99 | % | |
| Premium amortization adjustment cost (benefit) | |
| Premium amortization adjustment cost (benefit) | |
Earnings available for distribution (6) | |
Earnings available for distribution (6) | |
Earnings available for distribution (6) | |
| Earnings available for distribution per average common share | |
| Earnings available for distribution per average common share | |
| Earnings available for distribution per average common share | |
| Annualized EAD return on average equity (excluding PAA) | |
| Annualized EAD return on average equity (excluding PAA) | |
| Annualized EAD return on average equity (excluding PAA) | |
Economic leverage at period-end (1) | |
Economic leverage at period-end (1) | |
Economic leverage at period-end (1) | |
Economic capital ratio at period-end (2) | |
Economic capital ratio at period-end (2) | |
Economic capital ratio at period-end (2) | |
Net interest margin (excluding PAA) (4)(3) | |
Net interest margin (excluding PAA) (4)(3) | |
Net interest margin (excluding PAA) (4)(3) | Net interest margin (excluding PAA) (4)(3) | 1.74 | % | | 1.32 | % | | 1.52 | % | |
Average yield on interest earning assets (excluding PAA) (5)(4) | Average yield on interest earning assets (excluding PAA) (5)(4) | 2.90 | % | | 3.36 | % | | 3.17 | % | |
Average yield on interest earning assets (excluding PAA) (5)(4) | |
Average yield on interest earning assets (excluding PAA) (5)(4) | |
Average economic cost of interest bearing liabilities (6)(5) | |
Average economic cost of interest bearing liabilities (6)(5) | |
Average economic cost of interest bearing liabilities (6)(5) | Average economic cost of interest bearing liabilities (6)(5) | 1.34 | % | | 2.25 | % | | 2.04 | % | |
| Net interest spread (excluding PAA) | Net interest spread (excluding PAA) | 1.56 | % | | 1.11 | % | | 1.13 | % | |
(1) Debt consists of repurchase agreements, other secured financing, debt issued by securitization vehicles, participations issued and mortgages payable. Certain credit facilities (included within other secured financing), debt issued by securitization vehicles, participations issued and mortgages payable are non-recourse to us. (2) Computed as the sum of Recourse Debt, cost basis of TBA and CMBX derivatives outstanding and net forward purchases (sales) of investments divided by total equity. (3) Calculated as total stockholders’ equity divided by total assets inclusive of outstanding market value of TBA positions and exclusive of consolidated VIEs. (4) Net interest margin represents our interest income less interest expense divided by the average interest earning assets. Net interest margin (excluding PAA) represents the sum of our interest income (excluding PAA) plus TBA dollar roll income and CMBX coupon income less interest expense and the net interest component of interest rate swaps divided by the sum of average interest earning assets plus average outstanding TBA contract and CMBX balances. (5) Average yield on interest earning assets represents annualized interest income divided by average interest earning assets. Average interest earning assets reflects the average amortized cost of our investments during the period. Average yield on interest earning assets (excluding PAA) is calculated using annualized interest income (excluding PAA). (6) Average GAAP cost of interest bearing liabilities represents annualized interest expense divided by average interest bearing liabilities. Average interest bearing liabilities reflects the average balances during the period. Average economic cost of interest bearing liabilities represents annualized economic interest expense divided by average interest bearing liabilities. Economic interest expense is comprised of GAAP interest expense and the net interest component of interest rate swaps. (7) Represents a non-GAAP financial measure. Refer to the “Non-GAAP Financial Measures” section for additional information. (8) Excludes dividends on preferred stock. | |
| Net interest spread (excluding PAA) | |
| Net interest spread (excluding PAA) | |
* Represents a non-GAAP financial measure. Refer to the “Non-GAAP Financial Measures” section for additional information. (1) GAAP leverage is computed as the sum of repurchase agreements, other secured financing, debt issued by securitization vehicles, participations issued, and U.S. Treasury securities sold, not yet purchased divided by total equity. Economic leverage is computed as the sum of recourse debt, cost basis of to-be-announced (“TBA”) and CMBX derivatives outstanding, and net forward purchases (sales) of investments divided by total equity. Recourse debt consists of repurchase agreements, other secured financing (excluding certain non-recourse credit facilities), and U.S. Treasury securities sold, not yet purchased. Certain credit facilities (included within other secured financing), debt issued by securitization vehicles, and participations issued are non-recourse to us and are excluded from economic leverage. (2) GAAP capital ratio is computed as total equity divided by total assets. Economic capital ratio is computed as total equity divided by total economic assets. Total economic assets include the implied market value of TBA derivatives and net of debt issued by securitization vehicles. (3) Net interest margin represents our interest income less interest expense divided by the average interest earning assets. Net interest margin does not include net interest component of interest rate swaps. Net interest margin (excluding PAA) represents the sum of our interest income (excluding PAA) plus TBA dollar roll income and CMBX coupon income less interest expense and the net interest component of interest rate swaps divided by the sum of average interest earning assets plus average outstanding TBA contract and CMBX balances. (4) Average yield on interest earning assets represents annualized interest income divided by average interest earning assets. Average interest earning assets reflects the average amortized cost of our investments during the period. Average yield on interest earning assets (excluding PAA) is calculated using annualized interest income (excluding PAA). (5) Average GAAP cost of interest bearing liabilities represents annualized interest expense divided by average interest bearing liabilities. Average interest bearing liabilities reflects the average balances during the period. Average economic cost of interest bearing liabilities represents annualized economic interest expense divided by average interest bearing liabilities. Economic interest expense is comprised of GAAP interest expense and the net interest component of interest rate swaps. (6) Excludes dividends on preferred stock. | |
* Represents a non-GAAP financial measure. Refer to the “Non-GAAP Financial Measures” section for additional information. (1) GAAP leverage is computed as the sum of repurchase agreements, other secured financing, debt issued by securitization vehicles, participations issued, and U.S. Treasury securities sold, not yet purchased divided by total equity. Economic leverage is computed as the sum of recourse debt, cost basis of to-be-announced (“TBA”) and CMBX derivatives outstanding, and net forward purchases (sales) of investments divided by total equity. Recourse debt consists of repurchase agreements, other secured financing (excluding certain non-recourse credit facilities), and U.S. Treasury securities sold, not yet purchased. Certain credit facilities (included within other secured financing), debt issued by securitization vehicles, and participations issued are non-recourse to us and are excluded from economic leverage. (2) GAAP capital ratio is computed as total equity divided by total assets. Economic capital ratio is computed as total equity divided by total economic assets. Total economic assets include the implied market value of TBA derivatives and net of debt issued by securitization vehicles. (3) Net interest margin represents our interest income less interest expense divided by the average interest earning assets. Net interest margin does not include net interest component of interest rate swaps. Net interest margin (excluding PAA) represents the sum of our interest income (excluding PAA) plus TBA dollar roll income and CMBX coupon income less interest expense and the net interest component of interest rate swaps divided by the sum of average interest earning assets plus average outstanding TBA contract and CMBX balances. (4) Average yield on interest earning assets represents annualized interest income divided by average interest earning assets. Average interest earning assets reflects the average amortized cost of our investments during the period. Average yield on interest earning assets (excluding PAA) is calculated using annualized interest income (excluding PAA). (5) Average GAAP cost of interest bearing liabilities represents annualized interest expense divided by average interest bearing liabilities. Average interest bearing liabilities reflects the average balances during the period. Average economic cost of interest bearing liabilities represents annualized economic interest expense divided by average interest bearing liabilities. Economic interest expense is comprised of GAAP interest expense and the net interest component of interest rate swaps. (6) Excludes dividends on preferred stock. | |
* Represents a non-GAAP financial measure. Refer to the “Non-GAAP Financial Measures” section for additional information. (1) GAAP leverage is computed as the sum of repurchase agreements, other secured financing, debt issued by securitization vehicles, participations issued, and U.S. Treasury securities sold, not yet purchased divided by total equity. Economic leverage is computed as the sum of recourse debt, cost basis of to-be-announced (“TBA”) and CMBX derivatives outstanding, and net forward purchases (sales) of investments divided by total equity. Recourse debt consists of repurchase agreements, other secured financing (excluding certain non-recourse credit facilities), and U.S. Treasury securities sold, not yet purchased. Certain credit facilities (included within other secured financing), debt issued by securitization vehicles, and participations issued are non-recourse to us and are excluded from economic leverage. (2) GAAP capital ratio is computed as total equity divided by total assets. Economic capital ratio is computed as total equity divided by total economic assets. Total economic assets include the implied market value of TBA derivatives and net of debt issued by securitization vehicles. (3) Net interest margin represents our interest income less interest expense divided by the average interest earning assets. Net interest margin does not include net interest component of interest rate swaps. Net interest margin (excluding PAA) represents the sum of our interest income (excluding PAA) plus TBA dollar roll income and CMBX coupon income less interest expense and the net interest component of interest rate swaps divided by the sum of average interest earning assets plus average outstanding TBA contract and CMBX balances. (4) Average yield on interest earning assets represents annualized interest income divided by average interest earning assets. Average interest earning assets reflects the average amortized cost of our investments during the period. Average yield on interest earning assets (excluding PAA) is calculated using annualized interest income (excluding PAA). (5) Average GAAP cost of interest bearing liabilities represents annualized interest expense divided by average interest bearing liabilities. Average interest bearing liabilities reflects the average balances during the period. Average economic cost of interest bearing liabilities represents annualized economic interest expense divided by average interest bearing liabilities. Economic interest expense is comprised of GAAP interest expense and the net interest component of interest rate swaps. (6) Excludes dividends on preferred stock. | |
GAAP
Net income (loss) was ($889.8) million,1.6) billion, which includes $1.4$4.7 million attributable to noncontrolling interests, or ($0.73)$(3.61) per average basic common share, for the year ended December 31, 20202023 compared to ($2.2)$1.7 billion, which includes ($0.2)$1.1 million attributable to noncontrolling interests, or ($1.60)$3.93 per average basic common share, for the same period in 2019.2022. We attribute the majority of the change in net income (loss) to an unfavorable change in net gains (losses) on derivatives and net interest income, partially offset by favorable changes in net gains (losses) on other derivatives, net gains (losses) on disposal of investments and other, higher net servicing income, higher other, net and net interest income, partially offset by unfavorable changes in the net interest component of interest rate swaps and net unrealized gains (losses) on instruments measured at fair value through earnings and realized gains (losses) on termination or maturity of interest rate swaps.lower business divestiture-related losses. Net gains (losses) on other derivatives was $756.3 million for the year ended December 31, 20202023 was $0.4 billion compared to ($680.8) million$4.9 billion for the same period in 2019. Net gains (losses) on disposal of investments and other was $661.5 million for the year ended December 31, 2020 compared to ($47.9) million for the same period in 2019.2022. Net interest income for the year ended December 31, 20202023 was $1.3 billion($111.4) million compared to $1.0$1.5 billion for the same period in 2019. The net interest component of interest rate swaps was ($207.9) million2022. Net gains (losses) on investments and other for the year ended December 31, 20202023 was ($2.1) billion compared to $351.4($4.6) billion for the same period in 2022. Net servicing income for the year ended December 31, 2023 was $326.5 million compared to $221.8 million for the same period in 2019. Realized gains (losses) on termination or maturity of interest rate swaps was ($1.9) billion2022. Other, net for the year ended December 31, 20202023 was $73.7 million compared to ($1.4) billion$6.7 million for the same period in 2019.2022. Business divestiture-related gains (losses) for the year ended December 31, 2023 was $0.0 million compared to ($40.3) million for the same period in 2022. Refer to the section titled “Realized and Unrealized Gains (Losses)“Other income (loss)” located within this Item 7 for additional information related to these changes.
Non-GAAP
Core earnings (excluding premium amortization adjustment (“PAA”))Earnings available for distribution were $1.7$1.6 billion, or $1.10$2.86 per average common share, for the year ended December 31, 2020,2023, compared to $1.6$1.9 billion, or $1.00$4.23 per average common share, for the same period in 2019.2022. The changeschange in core earnings (excluding PAA)available for distribution for the year ended December 31, 20202023 compared to the same period in 2019 were2022 was primarily due to loweran higher interest expense from loweran increase in average borrowing rates and average interest bearing liabilities, and higherbalances, a decline in TBA dollar roll income on reduced specialness partially offset by lower coupon income resulting from a decrease in the average yield on interest earnings assets and lower average interest earning assets, and unfavorable changesfavorable change in the net interest component of interest rate swaps.swaps, higher coupon income and lower premium amortization expense, excluding PAA, resulting from an increase in interest rates, purchasing assets with lower cost bases, and lower prepayment speeds, combined with higher servicing income and other, net.
ANNALY CAPITAL MANAGEMENT, INC. AND SUBSIDIARIES
Item 7. Management’s Discussion and Analysis
Non-GAAP Financial Measures
To supplement our consolidated financial statements, which are prepared and presented in accordance with GAAP, we provide the following non-GAAP financial measures:
•core earnings (excluding PAA)available for distribution (“EAD”);
•core earnings (excluding PAA)available for distribution attributable to common stockholders;
•core earnings (excluding PAA)available for distribution per average common share;
•annualized coreEAD return on average equity (excluding PAA);equity;
•economic leverage;
•economic capital ratio;
•interest income (excluding PAA);
•economic interest expense;
•economic net interest income (excluding PAA);
•average yield on interest earning assets (excluding PAA);
•average economic cost of interest bearing liabilities;
•net interest margin (excluding PAA); and
•net interest spread (excluding PAA).
These measures should not be considered a substitute for, or superior to, financial measures computed in accordance with GAAP. While intended to offer a fuller understanding of our results and operations, non-GAAP financial measures also have limitations. For example, we may calculate our non-GAAP metrics, such as core earnings (excluding PAA),available for distribution, or the PAA, differently than our peers making comparative analysis difficult. Additionally, in the case of non-GAAP measures that exclude the PAA, the amount of amortization expense excluding the PAA is not necessarily representative of the amount of future periodic amortization nor is it indicative of the term over which we will amortize the remaining unamortized premium. Changes to actual and estimated prepayments will impact the timing and amount of premium amortization and, as such, both GAAP and non-GAAP results.
These non-GAAP measures provide additional detail to enhance investor understanding of our period-over-period operating performance and business trends, as well as for assessing our performance versus that of industry peers. Additional information pertaining to our use of these non-GAAP financial measures, including discussion of how each such measure may be useful to investors, and reconciliations to their most directly comparable GAAP results are provided below.
Core earnings (excluding PAA), core earnings (excluding PAA) attributableEarnings Available for Distribution, Earnings Available for Distribution Attributable to common stockholders, core earnings (excluding PAA) per average common shareCommon Stockholders, Earnings Available for Distribution Per Average Common Share and annualized core returnAnnualized EAD Return on average equity (excluding PAA)
ANNALY CAPITAL MANAGEMENT, INC. AND SUBSIDIARIES
Item 7. Management’s Discussion and Analysis
Average EquityOur principal business objective is to generate net income for distribution to our stockholders and optimize our returns through prudent management of our diversified investment strategies. We generate net income by earning a net interest spread on our investment portfolio, which is a function of interest income from our investment portfolio less financing, hedging and operating costs. Core earnings (excluding PAA),Earnings available for distribution, which is defined as the sum of (a) economic net interest income, (b) TBA dollar roll income and CMBX coupon income, (c) net servicing income less realized amortization of MSRs,MSR, (d) other income (loss) (excluding depreciation and amortization expense on real estate and related intangibles, non-corenon-EAD income allocated to equity method investments and other non-corenon-EAD components of other income (loss)), (e) general and administrative expenses (excluding transaction expenses and non-recurring items), and (f) income taxes (excluding the income tax effect of non-corenon-EAD income (loss) items), and excludes (g) the premium amortization adjustment (“PAA”) representing the cumulative impact on prior periods, but not the current period, of quarter-over-quarter changes in estimated long-term prepayment speeds related to our Agency mortgage-backed securities, is used by management and, we believe, used by analysts and investors to measure our progress in achieving our principal business objective.
We seek to fulfill our principal business objective through a variety of factors including portfolio construction, the degree of market risk exposure and related hedge profile, and the use and forms of leverage, all while operating within the parameters of our capital allocation policy and risk governance framework.
We believe these non-GAAP measures provide management and investors with additional details regarding our underlying operating results and investment portfolio trends by (i) making adjustments to account for the disparate reporting of changes in fair value where certain instruments are reflected in GAAP net income (loss) while others are reflected in other comprehensive income (loss), and (ii) by excluding certain unrealized, non-cash or episodic components of GAAP net income (loss) in order to provide additional transparency into the operating performance of our portfolio. In addition, EAD serves as a useful indicator for investors in evaluating our performance and ability to pay dividends. Annualized coreEAD return on average equity, (excluding PAA), which is calculated by dividing core earnings (excluding PAA)available for distribution over average stockholders’ equity, provides investors with additional detail on the core earnings available for distribution generated by our invested equity capital.
The following table presents a reconciliation of GAAP financial results to non-GAAP core earnings for the periods presented:
| | | | | | | | | | | | | | | | | |
| | For the Years Ended December 31, |
| | 2020 | | 2019 | | 2018 |
| | (dollars in thousands, except per share data) |
| GAAP net income (loss) | $ | (889,772) | | | $ | (2,163,091) | | | $ | 54,148 | |
| Net income (loss) attributable to noncontrolling interests | 1,391 | | | (226) | | | (260) | |
| Net income (loss) attributable to Annaly | (891,163) | | | (2,162,865) | | | 54,408 | |
| Adjustments to exclude reported realized and unrealized (gains) losses | | | | |
| Realized (gains) losses on termination or maturity of interest rate swaps | 1,917,628 | | | 1,442,964 | | | (1,409) | |
| Unrealized (gains) losses on interest rate swaps | 904,532 | | | 1,210,276 | | | (424,081) | |
| Net (gains) losses on disposal of investments and other | (661,513) | | | 47,944 | | | 1,124,448 | |
| Net (gains) losses on other derivatives | (756,305) | | | 680,770 | | | 403,001 | |
| Net unrealized (gains) losses on instruments measured at fair value through earnings | 303,024 | | | (36,021) | | | 158,082 | |
Loan loss provision (1) | 151,188 | | | 16,569 | | | 3,496 | |
| | | | | |
| | | | | |
| | | | | |
| | | | | |
| Other adjustments | | | | |
Depreciation expense related to commercial real estate and amortization of intangibles (2) | 39,108 | | | 40,058 | | | 20,278 | |
Non-core (income) loss allocated to equity method investments (3) | 22,493 | | | 21,385 | | | (12,665) | |
Non-core other (income) loss (4) | — | | | — | | | 44,525 | |
|
Transaction expenses and non-recurring items (5) | 11,293 | | | 19,284 | | | 65,416 | |
| Income tax effect of non-core income (loss) items | (17,603) | | | (5,961) | | | 4,220 | |
| | |
TBA dollar roll income and CMBX coupon income (6) | 355,547 | | | 123,818 | | | 276,986 | |
MSR amortization (7) | (97,506) | | | (77,719) | | | (79,764) | |
| | | | | |
| Plus: | | | | | |
| Premium amortization adjustment cost (benefit) | 415,444 | | | 254,894 | | | (62,021) | |
Core earnings (excluding PAA) (8) | $ | 1,696,167 | | | $ | 1,575,396 | | | $ | 1,574,920 | |
| Dividends on preferred stock | 142,036 | | | 136,576 | | | 129,312 | |
Core earnings (excluding PAA) attributable to common stockholders (8) | $ | 1,554,131 | | | $ | 1,438,820 | | | $ | 1,445,608 | |
| GAAP net income (loss) per average common share | $ | (0.73) | | | $ | (1.60) | | | $ | (0.06) | |
Core earnings (excluding PAA) per average common share (8) | $ | 1.10 | | | $ | 1.00 | | | $ | 1.20 | |
| GAAP return (loss) on average equity | (6.31) | % | | (14.11) | % | | 0.38 | % |
Core return on average equity (excluding PAA) (8) | 12.03 | % | | 10.28 | % | | 10.99 | % |
| | | | | |
| | | | | |
| | | | | |
| | | | | |
| | | | | |
(1) Includes $3.6 million of loss provision on the Company’s unfunded loan commitments for the year ended December 31, 2020, which is reported in Other income (loss) in the Consolidated Statements of Comprehensive Income (Loss).
ANNALY CAPITAL MANAGEMENT, INC. AND SUBSIDIARIES
Item 7. Management’s Discussion and Analysis
(2) Includes depreciation and amortization expense relatedThe following table presents a reconciliation of GAAP financial results to equity method investments.
(3) Represents unrealized (gains) losses allocated to equity interests in a portfolio of MSR which is a component of Other income (loss).
(4) Represents the amount of consideration paidnon-GAAP earnings available for distribution for the acquisition of MTGE in excess of the fair value of net assets acquired. This amount is primarily attributable to a decline in portfolio valuation between the pricing and closing dates of the transaction and is consistent with changes in market values observed for similar instruments over the same period.periods presented:
(5) Includes costs incurred in connection with securitizations of residential whole loans. The year ended December 31, 2020 also includes costs incurred in connection with the Internalization, the CEO search process and a securitization of Agency mortgage-backed securities. The year ended December 31, 2019 also includes costs incurred in connection with the securitization of commercial loans and Agency mortgage-backed securities. The year ended December 31, 2018 also includes costs incurred in connection with the acquisition of MTGE Investment Corp.
(6) TBA dollar roll income and CMBX coupon income each represent a component of Net gains (losses) on other derivatives. CMBX coupon income totaled $5.8 million, $4.6 million and $2.3 million for the years ended December 31, 2020, 2019 and 2018, respectively.
(7) MSR amortization represents the portion of changes in fair value that is attributable to the realization of estimated cash flows on the Company’s MSR portfolio and is reported as a component of Net unrealized gains (losses) on instruments measured at fair value.
(8) Represents a non-GAAP financial measure. Refer to disclosures within this section above for additional information on non-GAAP financial measures.
| | | | | | | | | | | | | | | | | |
| | For the Years Ended December 31, |
| | 2023 | | 2022 | | 2021 |
| | (dollars in thousands, except per share data) |
| GAAP net income (loss) | $ | (1,638,457) | | | $ | 1,726,420 | | | $ | 2,396,280 | |
| Adjustments to exclude reported realized and unrealized (gains) losses | | | | |
Net (gains) losses on investments and other (1) | 2,137,538 | | | 4,602,456 | | | (120,958) | |
Net (gains) losses on derivatives (2) | 1,184,961 | | | (4,493,013) | | | (1,083,872) | |
Loan loss provision (reversal) (3) | (219) | | | (22,923) | | | (148,632) | |
| Business divestiture-related (gains) losses | — | | | 40,258 | | | 278,559 | |
| | | | | |
| | | | | |
| | | | | |
| | | | | |
| Other adjustments | | | | |
| Amortization of intangibles | 4,573 | | | 3,948 | | | 15,225 | |
Non-EAD (income) loss allocated to equity method investments (4) | 354 | | | (15,499) | | | (10,930) | |
| | | | | |
Transaction expenses and non-recurring items (5) | 8,209 | | | 7,620 | | | 5,579 | |
| Income tax effect of non-EAD income (loss) items | 31,570 | | | 46,070 | | | 13,325 | |
TBA dollar roll income and CMBX coupon income (6) | 20,621 | | | 431,475 | | | 445,768 | |
MSR amortization (7) | (182,151) | | | (114,992) | | | (72,727) | |
| EAD attributable to noncontrolling interests | (14,639) | | | (1,095) | | | (6,384) | |
| Premium amortization adjustment cost (benefit) | 1,654 | | | (360,587) | | | 57,158 | |
| Earnings available for distribution * | 1,554,014 | | | 1,850,138 | | | 1,768,391 | |
| Dividends on preferred stock | 141,676 | | | 110,623 | | | 107,532 | |
| Earnings available for distribution attributable to common stockholders * | $ | 1,412,338 | | | $ | 1,739,515 | | | $ | 1,660,859 | |
| GAAP net income (loss) per average common share | $ | (3.61) | | | $ | 3.93 | | | $ | 6.40 | |
| Earnings available for distribution per average common share * | $ | 2.86 | | | $ | 4.23 | | | $ | 4.65 | |
| GAAP return (loss) on average equity | (14.33) | % | | 14.86 | % | | 17.45 | % |
| EAD return on average equity (excluding PAA) * | 13.71 | % | | 16.02 | % | | 12.90 | % |
* Represents a non-GAAP financial measure. Refer to the disclosure within this section above for additional information on non-GAAP financial measures. (1) Includes write-downs or recoveries which are reported in Other, net in the Company's Consolidated Statement of Comprehensive Income (Loss). (2) The adjustment to add back Net (gains) losses on derivatives does not include the net interest component of interest rate swaps which is reflected in earnings available for distribution. The net interest component of interest rate swaps totaled $1.6 billion, $366.2 million and ($276.1) million for the years ended December 31, 2023, 2022 and 2021, respectively. (3) Includes $0.0 million, ($2.3) million, and $(3.6) million of loss provision (reversal) on unfunded loan commitments for the years ended December 31, 2023, 2022 and 2021, respectively, which is reported in Other, net in the Consolidated Statements of Comprehensive Income (Loss). (4) Represents unrealized (gains) losses allocated to equity interests in a portfolio of MSR, which is a component of Other, net in the Consolidated Statements of Comprehensive Income (Loss). (5) Represents costs incurred in connection with securitizations of residential whole loans. (6) TBA dollar roll income and CMBX coupon income each represent a component of Net gains (losses) on derivatives in the Consolidated Statements of Comprehensive Income (Loss). CMBX coupon income totaled $1.5 million, $4.4 million and $5.2 million for the years ended December 31, 2023, 2022 and 2021, respectively. (7) MSR amortization utilizes purchase date cash flow assumptions and actual unpaid principal balances and is calculated as the difference between projected MSR yield income and net servicing income for the period. |
| | | | | |
| | | | | |
| | | | | |
| | | | | |
From time to time, we enter into TBA forward contracts as an alternate means of investing in and financing Agency mortgage-backed securities.MBS. A TBA contract is an agreement to purchase or sell, for future delivery, an Agency mortgage-backed securityMBS with a specified issuer, term and coupon. A TBA dollar roll represents a transaction where TBA contracts with the same terms but different settlement dates are simultaneously bought and sold. The TBA contract settling in the later month typically prices at a discount to the earlier month contract with the difference in price commonly referred to as the “drop”. The drop is a reflection of the expected net interest income from an investment in similar Agency mortgage-backed securities,MBS, net of an implied financing cost, that would be foregone as a result of settling the contract in the later month rather than in the earlier month. The drop between the current settlement month price and the forward settlement month price occurs because in the TBA dollar roll market, the party providing the financing is the party that would retain all principal and interest payments accrued during the financing period. Accordingly, TBA dollar roll income generally represents the economic equivalent of the net interest income earned on the underlying Agency mortgage-backed securityMBS less an implied financing cost.
TBA dollar roll transactions are accounted for under GAAP as a series of derivatives transactions. The fair value of TBA derivatives is based on methods similar to those used to value Agency mortgage-backed securities.MBS. We record TBA derivatives at fair value on our Consolidated Statements of Financial Condition and recognize periodic changes in fair value in Net gains (losses) on other derivatives in our Consolidated Statements of Comprehensive Income (Loss), which includes both unrealized and realized gains and losses on derivatives (excluding interest rate swaps).derivatives.
ANNALY CAPITAL MANAGEMENT, INC. AND SUBSIDIARIES
Item 7. Management’s Discussion and Analysis
TBA dollar roll income is calculated as the difference in price between two TBA contracts with the same terms but different settlement dates multiplied by the notional amount of the TBA contract. Although accounted for as derivatives, TBA dollar rolls capture the economic equivalent of net interest income, or carry, on the underlying Agency mortgage-backed securityMBS (interest income less an implied cost of financing). TBA dollar roll income is reported as a component of Net gains (losses) on other derivatives in the Consolidated Statements of Comprehensive Income (Loss).
The CMBX index is a synthetic tradable index referencing a basket of 25 commercial mortgage-backed securities of a particular rating and vintage. The CMBX index allows investors to take a long position (referred to as selling protection) or short position (referred to as purchasing protection) on the respective basket of commercial mortgage-backed securities and is structured as a “pay-as-you-go” contract whereby the protection seller receives and the protection buyer pays a standardized running coupon on the contracted notional amount. Additionally, the protection seller is obligated to pay to the protection buyer the amount of principal losses and/or coupon shortfalls on the underlying commercial mortgage-backed securities as they occur. We report income (expense) on CMBX positions in Net gains (losses) on other derivatives in the Consolidated Statements of Comprehensive Income (Loss). The coupon payments received or paid on CMBX positions is equivalent to interest income (expense) and therefore included in core earnings (excluding PAA).available for distribution.
Premium Amortization Expense
In accordance with GAAP, we amortize or accrete premiums or discounts into interest income for our Agency mortgage-backed securities,MBS, excluding interest-only securities, multifamily and reverse mortgages, taking into account estimates of future principal prepayments in the calculation of the effective yield. We recalculate the effective yield as differences between anticipated and actual prepayments occur. Using third-party modelthird party models and market information to project future cash flows and expected remaining lives of securities, the effective interest rate determined for each security is applied as if it had been in place from the date of the security’s acquisition. The amortized cost of the security is then adjusted to the amount that would have existed had the new effective yield been applied since the acquisition date. The adjustment to amortized cost is offset with a charge or credit to interest income. Changes in interest rates and other market factors will impact prepayment speed projections and the amount of premium amortization recognized in any given period.
ANNALY CAPITAL MANAGEMENT, INC. AND SUBSIDIARIES
Item 7. Management’s Discussion and Analysis
Our GAAP metrics include the unadjusted impact of amortization and accretion associated with this method. Certain of our non-GAAP metrics exclude the effect of the PAA, which quantifies the component of premium amortization representing the cumulative impact on prior periods, but not the current period, of quarter-over-quarter changes in estimated long-term Constant Prepayment Rate (“CPR”).
The following table illustrates the impact of the PAA on premium amortization expense for our Residential Securities portfolio and residential securities transferred or pledged to securitization vehicles, for the periods presented:
| | | | For the Years Ended December 31, | | For the Years Ended December 31, |
| | | 2020 | | 2019 | | 2018 | | 2023 | | 2022 | | 2021 |
| | | (dollars in thousands) | | (dollars in thousands) |
| Premium amortization expense | Premium amortization expense | $ | 1,375,461 | | | $ | 1,113,786 | | | $ | 705,926 | |
| Less: PAA cost (benefit) | Less: PAA cost (benefit) | 415,444 | | | 254,894 | | | (62,021) | |
| Premium amortization expense (excluding PAA) | Premium amortization expense (excluding PAA) | $ | 960,017 | | | $ | 858,892 | | | $ | 767,947 | |
|
Economic Leverage and Economic Capital Ratios
We use capital coupled with borrowed funds to invest primarily in real estate related investments, earning the spread between the yield on our assets and the cost of our borrowings and hedging activities. Our capital structure is designed to offer an efficient complement of funding sources to generate positive risk-adjusted returns for our stockholders while maintaining appropriate liquidity to support our business and meet our financial obligations under periods of market stress. To maintain our desired capital profile, we utilize a mix of debt and equity funding. Debt funding may include the use of repurchase agreements, loans, securitizations, participations issued, lines of credit, asset backed lending facilities, corporate bond issuance, convertible bonds, mortgages payable or other liabilities. Equity capital primarily consists of common and preferred stock.
Our economic leverage ratio is computed as the sum of recourse debt, cost basis of TBA and CMBX derivatives outstanding, and net forward purchases (sales) of investments divided by total equity. Recourse debt consists of repurchase agreements, other secured financing (excluding certain non-recourse credit facilities), and U.S. Treasury securities sold, not yet purchased. Certain credit facilities (included within other secured financing), debt issued by securitization vehicles, and participations issued are non-recourse to us and are excluded from economic leverage.
ANNALY CAPITAL MANAGEMENT, INC. AND SUBSIDIARIES
Item 7. Management’s Discussion and Analysis
The following table presents a reconciliation of GAAP debt to economic debt for purposes of calculating our economic leverage ratio for the periods presented:
| | | | | | | | | | | | | |
| As of | | |
| December 31, 2023 | | December 31, 2022 | | |
| Economic leverage ratio reconciliation | (dollars in thousands) | | |
| Repurchase agreements | $ | 62,201,543 | | | $ | 59,512,597 | | | |
| Other secured financing | 500,000 | | | 250,000 | | | |
| Debt issued by securitization vehicles | 11,600,338 | | | 7,744,160 | | | |
| Participations issued | 1,103,835 | | | 800,849 | | | |
| | | | | |
| | | | | |
| U.S. Treasury securities sold, not yet purchased | 2,132,751 | | | — | | | |
| Total GAAP debt | $ | 77,538,467 | | | $ | 68,307,606 | | | |
| Less Non-Recourse Debt: | | | | | |
| | | | | |
| Debt issued by securitization vehicles | (11,600,338) | | | (7,744,160) | | | |
| Participations issued | (1,103,835) | | | (800,849) | | | |
| | | | | |
| | | | | |
| Total recourse debt | $ | 64,834,294 | | | $ | 59,762,597 | | | |
| Plus / (Less): | | | | | |
| Cost basis of TBA and CMBX derivatives | (555,221) | | | 11,050,351 | | | |
| Payable for unsettled trades | 3,249,389 | | | 1,157,846 | | | |
| Receivable for unsettled trades | (2,710,224) | | | (575,091) | | | |
Economic debt * | $ | 64,818,238 | | | $ | 71,395,703 | | | |
| Total equity | $ | 11,345,091 | | | $ | 11,369,426 | | | |
Economic leverage ratio * | 5.7:1 | | 6.3:1 | | |
| | | | | |
| * Represents a non-GAAP financial measure. Refer to the disclosure within this section above for additional information on non-GAAP financial measures. |
The following table presents a reconciliation of GAAP total assets to economic total assets for purposes of calculating our economic capital ratio for the periods presented:
| | | | | | | | | | | |
| As of |
| December 31, 2023 | | December 31, 2022 |
| Economic capital ratio reconciliation | (dollars in thousands) |
| Total GAAP assets | $ | 93,227,236 | | | $ | 81,850,712 | |
| Less: | | | |
Gross unrealized gains on TBA derivatives (1) | (20,689) | | | (17,056) | |
| Debt issued by securitization vehicles | (11,600,338) | | | (7,744,160) | |
| Plus: | | | |
| Implied market value of TBA derivatives | (573,602) | | | 10,578,676 | |
| Total economic assets * | $ | 81,032,607 | | | $ | 84,668,172 | |
| Total equity | $ | 11,345,091 | | | $ | 11,369,426 | |
Economic capital ratio (2)* | 14.0% | | 13.4% |
| | | |
* Represents a non-GAAP financial measure. Refer to the disclosure within this section above for additional information on non-GAAP financial measures. (1) Included in Derivative assets in the Consolidated Statements of Financial Condition. (2) Economic capital ratio is computed as total equity divided by total economic assets. |
Interest incomeIncome (excluding PAA), economic interest expenseEconomic Interest Expense and economic net interest incomeEconomic Net Interest Income (excluding PAA)
Interest income (excluding PAA) represents interest income excluding the effect of the premium amortization adjustment, and serves as the basis for deriving average yield on interest earning assets (excluding PAA), net interest spread (excluding PAA) and net interest margin (excluding PAA), which are discussed below. We believe this measure provides management and investors with additional detail to enhance their understanding of our operating results and trends by excluding the component of premium amortization expense representing the cumulative effect of quarter-over-quarter changes in estimated long-term prepayment speeds related to our Agency mortgage-backed securitiesMBS (other than interest-only securities, multifamily and reverse mortgages), which can obscure underlying trends in the performance of the portfolio.
Economic interest expense is comprised of GAAP interest expense and the net interest component of interest rate swaps. We use interest rate swaps to manage our exposure to changing interest rates on repurchase agreements by economically hedging cash flows associated with these borrowings. Accordingly, adding the net interest component of interest rate swaps to interest
ANNALY CAPITAL MANAGEMENT, INC. AND SUBSIDIARIES
Item 7. Management’s Discussion and Analysis
expense, as computed in accordance with GAAP, reflects the total contractual interest expense and thus, provides investors with additional information about the cost of our financing strategy. We may use market agreed coupon (“MAC”) interest rate swaps in which we may receive or make a payment at the time of entering into such interest rate swap to compensate for the off-market nature of such interest rate swap. In accordance with GAAP, upfront payments associated with MAC interest rate swaps are not reflected in the net interest component of interest rate swaps, which is presented in Net gains (losses) on derivatives in the Consolidated Statements of Comprehensive Income (Loss). We did not enter into any MAC interest rate swaps during the years ended December 31, 2020 and December 31, 2019.
Similarly, economic net interest income (excluding PAA), as computed below, provides investors with additional information to enhance their understanding of the net economics of our primary business operations.
The following tables providepresent a reconciliation of GAAP measures ofinterest income and GAAP interest expense to non-GAAP interest income (excluding PAA), economic interest expense and economic net interest income and details with respect to reconciling(excluding PAA), respectively, for the aforementioned line items on a non-GAAP basis for each respective period:periods presented:
Interest Income (excluding PAA)
| | | | | | | | | | | | | | | | | |
| | GAAP Interest Income | | PAA Cost
(Benefit) | | Interest Income (excluding PAA) (1) |
| For the years ended | (dollars in thousands) |
| December 31, 2020 | $ | 2,229,625 | | | $ | 415,444 | | | $ | 2,645,069 | |
| December 31, 2019 | $ | 3,787,297 | | | $ | 254,894 | | | $ | 4,042,191 | |
| December 31, 2018 | $ | 3,332,563 | | | $ | (62,021) | | | $ | 3,270,542 | |
(1) Represents a non-GAAP financial measure. Refer to disclosures within this section above for additional information on non-GAAP financial measures. |
| | | | | | | | | | | | | | | | | |
| | GAAP Interest Income | | PAA Cost
(Benefit) | | Interest Income (excluding PAA) * |
| For the years ended | (dollars in thousands) |
| December 31, 2023 | $ | 3,731,581 | | | $ | 1,654 | | | $ | 3,733,235 | |
| December 31, 2022 | $ | 2,778,887 | | | $ | (360,587) | | | $ | 2,418,300 | |
| December 31, 2021 | $ | 1,983,036 | | | $ | 57,158 | | | $ | 2,040,194 | |
| * Represents a non-GAAP financial measure. Refer to disclosures within this section above for additional information on non-GAAP financial measures. |
ANNALY CAPITAL MANAGEMENT, INC. AND SUBSIDIARIES
Item 7. Management’s Discussion and Analysis
Economic Interest Expense and Economic Net Interest Income (excluding PAA)
| | | | | | | | | | | | | | | | | | | | | | | | | | | | | | | | | | | | | | | | | | | | | | | |
| | GAAP
Interest
Expense | | Add: Net Interest Component of Interest Rate Swaps | | Economic Interest Expense (1) | | GAAP Net
Interest
Income | | Less: Net Interest Component
of Interest Rate Swaps | | Economic Net Interest Income (1) | | Add: PAA
Cost
(Benefit) | | Economic Net Interest Income (excluding PAA) (1) |
| For the years ended | (dollars in thousands) |
| December 31, 2020 | $ | 899,112 | | | $ | 207,877 | | | $ | 1,106,989 | | | $ | 1,330,513 | | | $ | 207,877 | | | $ | 1,122,636 | | | $ | 415,444 | | | $ | 1,538,080 | |
| December 31, 2019 | $ | 2,784,875 | | | $ | (351,375) | | | $ | 2,433,500 | | | $ | 1,002,422 | | | $ | (351,375) | | | $ | 1,353,797 | | | $ | 254,894 | | | $ | 1,608,691 | |
| December 31, 2018 | $ | 1,897,860 | | | $ | (100,553) | | | $ | 1,797,307 | | | $ | 1,434,703 | | | $ | (100,553) | | | $ | 1,535,256 | | | $ | (62,021) | | | $ | 1,473,235 | |
(1) Represents a non-GAAP financial measure. Refer to disclosures within this section above for additional information on non-GAAP financial measures. |
| | | | | | | | | | | | | | | | | | | | | | | | | | | | | | | | | | | | | | | | | | | | | | | |
| | GAAP
Interest
Expense | | Add: Net Interest Component of Interest Rate Swaps | | Economic Interest Expense * | | GAAP Net
Interest
Income | | Less: Net Interest Component
of Interest Rate Swaps | | Economic
Net Interest
Income * | | Add: PAA
Cost
(Benefit) | | Economic Net Interest Income (excluding PAA) * |
| For the years ended | (dollars in thousands) |
| December 31, 2023 | $ | 3,842,965 | | | $ | (1,585,053) | | | $ | 2,257,912 | | | $ | (111,384) | | | $ | (1,585,053) | | | $ | 1,473,669 | | | $ | 1,654 | | | $ | 1,475,323 | |
| December 31, 2022 | $ | 1,309,735 | | | $ | (366,161) | | | $ | 943,574 | | | $ | 1,469,152 | | | $ | (366,161) | | | $ | 1,835,313 | | | $ | (360,587) | | | $ | 1,474,726 | |
| December 31, 2021 | $ | 249,243 | | | $ | 276,142 | | | $ | 525,385 | | | $ | 1,733,793 | | | $ | 276,142 | | | $ | 1,457,651 | | | $ | 57,158 | | | $ | 1,514,809 | |
| * Represents a non-GAAP financial measure. Refer to disclosures within this section above for additional information on non-GAAP financial measures. |
Experienced and Projected Long-Term CPR
Prepayment speeds, as reflected by the CPR and interest rates vary according to the type of investment, conditions in financial markets, competition and other factors, none of which can be predicted with any certainty. In general, as prepayment speeds and expectations of prepayment speeds on our Agency mortgage-backed securitiesMBS portfolio increase, related purchase premium amortization increases, thereby reducing the yield on such assets. The following table presents the weighted average experienced CPR and weighted average projected long-term CPR on our Agency mortgage-backed securitiesMBS portfolio as of and for the periods presented.
| | | | | | | | | | | |
| | Experienced CPR (1) | | Long-term CPR (2) |
| For the years ended | | | |
| December 31, 2020 | 20.2% | | 16.4% |
| December 31, 2019 | 12.7% | | 13.9% |
| December 31, 2018 | 9.3% | | 10.1% |
(1) For the years ended December 31, 2020, 2019 and 2018, respectively.
(2) At December 31, 2020, 2019 and 2018, respectively.
| | | | | | | | | | | |
| | Experienced CPR (1) | | Long-term CPR (2) |
| For the years ended | | | |
| December 31, 2023 | 6.5% | | 9.4% |
| December 31, 2022 | 12.2% | | 7.8% |
| December 31, 2021 | 23.7% | | 12.7% |
(1) For the years ended December 31, 2023, 2022 and 2021, respectively. (2) At December 31, 2023, 2022 and 2021, respectively. |
Average Yield on Interest Earning Assets (excluding PAA), Net Interest Spread (excluding PAA), Net Interest Margin (excluding PAA) and Average Economic Cost of Interest Bearing Liabilities
Net interest spread (excluding PAA), which is the difference between the average yield on interest earning assets (excluding PAA) and the average economic cost of interest bearing liabilities, which represents annualized economic interest expense divided by average interest bearing liabilities, and net interest margin (excluding PAA), which is calculated as the sum of interest income (excluding PAA) plus TBA dollar roll income and CMBX coupon income less interest expense and the net interest component of interest rate swaps divided by the sum of average interest earning assets plus average TBA contract and
ANNALY CAPITAL MANAGEMENT, INC. AND SUBSIDIARIES
Item 7. Management’s Discussion and Analysis
CMBX balances, provide management with additional measures of our profitability that management relies upon in monitoring the performance of the business.
Disclosure of these measures, which are presented below, provides investors with additional detail regarding how management evaluates our performance.
Net Interest Spread (excluding PAA)
ANNALY CAPITAL MANAGEMENT, INC. AND SUBSIDIARIES
Item 7. Management’s Discussion and Analysis
| | | | | | | | | | | | | | | | | | | | | | | | | | | | | | | | | | | | | | | | | | | | | | | | | |
| | Average Interest Earning Assets (1) | | Interest Income (excluding PAA) (2) | | Average Yield on Interest Earning Assets (excluding PAA) (2) | | Average Interest Bearing Liabilities | | Economic Interest Expense (2)(3) | | Average Economic Cost of Interest Bearing Liabilities (2)(3) | | Economic Net Interest Income (excluding PAA) (2) | | Net Interest Spread (excluding PAA) (2) | | |
| For the years ended | (dollars in thousands) | | |
| December 31, 2020 | $91,198,821 | | $2,645,069 | | 2.90% | | $82,719,182 | | $1,106,989 | | 1.34% | | $1,538,080 | | 1.56 | % | | |
| December 31, 2019 | $120,389,507 | | $4,042,191 | | 3.36% | | $108,355,575 | | $2,433,500 | | 2.25% | | $1,608,691 | | 1.11 | % | | |
| December 31, 2018 | $103,227,574 | | $3,270,542 | | 3.17% | | $88,216,125 | | $1,797,307 | | 2.04% | | $1,473,235 | | 1.13 | % | | |
(1) Based on amortized cost. (2) Represents a non-GAAP financial measure. Refer to the “Non-GAAP Financial Measures” section for additional information. (3) Average economic cost of interest bearing liabilities represents annualized economic interest expense divided by average interest bearing liabilities. Average interest bearing liabilities reflects the average balances during the period. Economic interest expense is comprised of GAAP interest expense and the net interest component of interest rate swaps. | | |
| | | | | | | | | | | | | | | | | | | | | | | | | | | | | | | | | | | | | | | | | | | | | | | | | |
| | Average Interest Earning Assets (1) | | Interest Income (excluding PAA) * | | Average Yield on Interest Earning Assets (excluding PAA) * | | Average Interest Bearing Liabilities | | Economic Interest Expense * (2) | | Average Economic Cost of Interest Bearing Liabilities * (2) | | Economic Net Interest Income (excluding PAA) * | | Net Interest Spread (excluding PAA) * | | |
| For the years ended | (dollars in thousands) | | |
| December 31, 2023 | $86,305,249 | | $3,733,235 | | 4.33% | | $74,962,858 | | $2,257,912 | | 3.01% | | $1,475,323 | | 1.32 | % | | |
| December 31, 2022 | $76,429,267 | | $2,418,300 | | 3.16% | | $64,512,269 | | $943,574 | | 1.46% | | $1,474,726 | | 1.70 | % | | |
| December 31, 2021 | $76,079,589 | | $2,040,194 | | 2.68% | | $66,607,057 | | $525,385 | | 0.79% | | $1,514,809 | | 1.89 | % | | |
* Represents a non-GAAP financial measure. Refer to the “Non-GAAP Financial Measures” section for additional information. (1) Based on amortized cost. (2) Average interest bearing liabilities reflects the average balances during the period. Economic interest expense is comprised of GAAP interest expense and the net interest component of interest rate swaps. Average economic cost of interest bearing liabilities represents annualized economic interest expense divided by average interest bearing liabilities. | | |
Net Interest Margin (excluding PAA)
| | | | | | | | | | | | | | | | | | | | | | | | | | | | | | | | | | | | | | | | | | | | | | | | | | | | | |
| | Interest Income (excluding PAA) (1) | | TBA Dollar Roll and CMBX Coupon Income (2) | | Interest Expense | | Net Interest Component of Interest Rate Swaps | | Subtotal | | Average Interest Earnings Assets | | Average TBA Contract and CMBX Balances | | Subtotal | | Net Interest Margin (excluding PAA) (1) |
| For the years ended | | (dollars in thousands) |
| December 31, 2020 | $2,645,069 | | 355,547 | | (899,112) | | (207,877) | | $1,893,627 | | $91,198,821 | | 17,442,023 | | $108,640,844 | | 1.74% |
| December 31, 2019 | $4,042,191 | | 123,818 | | (2,784,875) | | 351,375 | | $1,732,509 | | $120,389,507 | | 10,953,117 | | $131,342,624 | | 1.32% |
| December 31, 2018 | $3,270,542 | | 276,986 | | (1,897,860) | | 100,553 | | $1,750,221 | | $103,227,574 | | 12,115,869 | | $115,343,443 | | 1.52% |
(1)Represents a non-GAAP financial measure. Refer to the “Non-GAAP Financial Measures” section for additional information.
(2)TBA dollar roll income and CMBX coupon income each represent a component of Net gains (losses) on other derivatives. CMBX coupon income totaled $5.8 million, $4.6 million and $2.3 million for the years ended December 31, 2020, December 31, 2019 and December 31, 2018, respectively.
| | | | | | | | | | | | | | | | | | | | | | | | | | | | | | | | | | | | | | | | | | | | | | | |
| | Interest Income (excluding PAA) * | | TBA Dollar Roll and CMBX Coupon Income (1) | | Economic Interest Expense * | | Subtotal | | Average Interest Earnings Assets | | Average TBA Contract and CMBX Balances | | Subtotal | | Net Interest Margin (excluding PAA) * |
| For the years ended | | (dollars in thousands) |
| December 31, 2023 | $3,733,235 | | 20,621 | | (2,257,912) | | $1,495,944 | | $86,305,249 | | 6,010,685 | | $92,315,934 | | 1.62% |
| December 31, 2022 | $2,418,300 | | 431,475 | | (943,574) | | $1,906,201 | | $76,429,267 | | 17,533,362 | | $93,962,629 | | 2.03% |
| December 31, 2021 | $2,040,194 | | 445,768 | | (525,385) | | $1,960,577 | | $76,079,589 | | 21,131,344 | | $97,210,933 | | 2.02% |
* Represents a non-GAAP financial measure. Refer to the “Non-GAAP Financial Measures” section for additional information. (1) TBA dollar roll income and CMBX coupon income each represent a component of Net gains (losses) on derivatives. CMBX coupon income totaled $1.5 million, $4.4 million and $5.2 million for the years ended December 31, 2023, 2022 and 2021, respectively. |
Economic Interest Expense and Average Economic Cost of Interest Bearing Liabilities
Typically, our largest expense is the cost of interest bearing liabilities and the net interest component of interest rate swaps. The following table below shows our average interest bearing liabilities and average economic cost of interest bearing liabilities as compared to average one-month and average six-month LIBORSOFR for the periods presented.
Average Economic Cost of Funds on Average Interest Bearing Liabilities
| | | | | | | | | | | | | | | | | | | | | | | | | | | | | | | | | | | | | | | | | | | | | | | | | | | | | |
| | Average
Interest Bearing
Liabilities | | Interest Bearing Liabilities at
Period End | | Economic
Interest
Expense | | Average Cost of Interest Bearing Liabilities (1) | | Average
One-
Month
LIBOR | | Average
Six-
Month
LIBOR | | Average
One-Month LIBOR
Relative to
Average Six-
Month LIBOR | | Average Cost
of Interest
Bearing
Liabilities
Relative to
Average One-
Month LIBOR | | Average Cost
of Interest
Bearing
Liabilities
Relative to
Average Six-Month LIBOR |
| For the years ended | (dollars in thousands) |
| December 31, 2020 | $ | 82,719,182 | | | $ | 71,435,295 | | | $ | 1,106,989 | | | 1.34 | % | | 0.52 | % | | 0.69 | % | | (0.17 | %) | | 0.82 | % | | 0.65 | % |
| December 31, 2019 | $ | 108,355,575 | | | $ | 111,819,229 | | | $ | 2,433,500 | | | 2.25 | % | | 2.22 | % | | 2.32 | % | | (0.10 | %) | | 0.03 | % | | (0.07 | %) |
| December 31, 2018 | $ | 88,216,125 | | | $ | 88,646,247 | | | $ | 1,797,307 | | | 2.04 | % | | 2.02 | % | | 2.49 | % | | (0.47 | %) | | 0.02 | % | | (0.45 | %) |
(1) Represents a non-GAAP financial measure. Refer to the “Non-GAAP Financial Measures” section for additional information. |
| | | | | | | | | | | | | | | | | | | | | | | | | | | | | | | | | | | | | | | | | | | | | | | | | | | | | |
| | Average
Interest Bearing
Liabilities | | Interest Bearing Liabilities at
Period End | | Economic Interest Expense * (1) | | Average Economic
Cost of
Interest
Bearing
Liabilities * | | Average
One-
Month
Term SOFR | | Average
Six-
Month
Term SOFR | | Average
One-Month Term SOFR
Relative to
Average Six-
Month Term SOFR | | Average Economic Cost
of Interest
Bearing
Liabilities
Relative to
Average One-
Month Term SOFR | | Average Economic Cost
of Interest
Bearing
Liabilities
Relative to
Average Six-Month Term SOFR |
| For the years ended | (dollars in thousands) |
| December 31, 2023 | $ | 74,962,858 | | | $ | 77,038,467 | | | $ | 2,257,912 | | | 3.01 | % | | 5.07 | % | | 5.22 | % | | (0.15 | %) | | (2.06 | %) | | (2.21 | %) |
| December 31, 2022 | $ | 64,512,269 | | | $ | 68,307,606 | | | $ | 943,574 | | | 1.46 | % | | 1.85 | % | | 2.52 | % | | (0.67 | %) | | (0.39 | %) | | (1.06 | %) |
| December 31, 2021 | $ | 66,607,057 | | | $ | 61,877,597 | | | $ | 525,385 | | | 0.79 | % | | 0.04 | % | | 0.06 | % | | (0.02 | %) | | 0.75 | % | | 0.73 | % |
* Represents a non-GAAP financial measure. Refer to the “Non-GAAP Financial Measures” section for additional information. (1) Economic interest expense is comprised of GAAP interest expense and the net interest component of interest rate swaps. |
ANNALY CAPITAL MANAGEMENT, INC. AND SUBSIDIARIES
2020Item 7. Management’s Discussion and Analysis
2023 Compared with 20192022
Economic interest expense decreasedincreased by $1.3 billion for the year ended December 31, 20202023 compared to the same period in 2019.2022. The change was primarily due to lower borrowing rates and decreases inhigher average interest bearing liabilities from an increase in repurchase agreement balances and higher borrowing rates. This was partially offset by the change in the net interest component of interest rate swaps, which was ($207.9) million$1.6 billion for the year ended December 31, 20202023 compared to $351.4$366.2 million for the same period in 2019.
ANNALY CAPITAL MANAGEMENT, INC. AND SUBSIDIARIES
Item 7. Management’s Discussion and Analysis
2022.We do not manage our portfolio to have a pre-designated amount of borrowings at quarter or year end. Our borrowings at period end are a snapshot of our borrowings as of a date, and this number may differ from average borrowings over the period for a number of reasons. The mortgage-backed securities we own pay principal and interest towards the end of each month and the mortgage-backed securities we purchase are typically settled during the beginning of the month. As a result, depending on the amount of mortgage-backed securities we have committed to purchase, we may retain the principal and interest we receive in the prior month, or we may use it to pay down our borrowings. Moreover, we generally use interest rate swaps, swaptions and other derivative instruments to hedge our portfolio, and as we pledge or receive collateral under these agreements, our borrowings on any given day may be increased or decreased. Our average borrowings during a quarter may differ from period end borrowings as we implement our portfolio management strategies and risk management strategies over changing market conditions by increasing or decreasing leverage. Additionally, these numbers may differ during periods when we conduct equity capital raises, as in certain instances we may purchase additional assets and increase leverage in anticipation of an equity capital raise. Since our average borrowings and period end borrowings can be expected to differ, we believe our average borrowings during a period provide a more accurate representation of our exposure to the risks associated with leverage than our period end borrowings.
At December 31, 2020 and 2019,2023 the majority of our debt represented repurchase agreements and other secured financing arrangements collateralized by a pledge of our Residential Securities, residential mortgage loans, commercial real estate investments and corporate loans.MSR. At December 31, 2022, the majority of our debt represented repurchase agreements and other secured financing arrangements collateralized by a pledge of our Residential Securities, residential mortgage loans, and MSR. All of our Residential Securities are currently accepted as collateral for these borrowings. However, we limit our borrowings, and thus our potential asset growth, in order to maintain unused borrowing capacity and maintain the liquidity and strength of our balance sheet.
Realized and Unrealized
Other Income (Loss)
2023 Compared with 2022
Net Gains (Losses) on Investments and Other
Realized and unrealized gains (losses) is comprised of net gains (losses) on interest rate swaps, netNet gains (losses) on disposal of investments and other was ($2.9) billion for the year ended December 31, 2023 compared with ($3.5) billion for the same period in 2022. For the year ended December 31, 2023, we disposed of Residential Securities with a carrying value of $36.4 billion for an aggregate net gains (losses) on other derivativesloss of ($2.9) billion. For the same period in 2022, we disposed of Residential Securities with a carrying value of $28.9 billion for an aggregate net loss of ($3.6) billion and netwe recognized a realized gain of $33.4 million as a result of deconsolidating a multifamily VIE.
Net unrealized gains (losses) on instruments measured at fair value through earnings. These components of realized andearnings was $797.6 million for the year ended December 31, 2023 compared to ($1.1) billion for the same period in 2022, primarily due to favorable changes in unrealized gains (losses) for the years ended December 31, 2020, 2019on securitized residential whole loans of consolidated VIEs of $1.5 billion, Agency MBS of $1.5 billion, non-Agency MBS of $334.1 million, residential whole loans of $252.2 million, and 2018 were as follows:
| | | | | | | | | | | | | | | | | |
| | For the Years Ended December 31, |
| | 2020 | | 2019 | | 2018 |
| | (dollars in thousands) |
Net gains (losses) on interest rate swaps (1) | $ | (3,030,037) | | | $ | (2,301,865) | | | $ | 526,043 | |
| Net gains (losses) on disposal of investments and other | 661,513 | | | (47,944) | | | (1,124,448) | |
| Net gains (losses) on other derivatives | 756,305 | | | (680,770) | | | (403,001) | |
| Net unrealized gains (losses) on instruments measured at fair value through earnings | (303,024) | | | 36,021 | | | (158,082) | |
| Loan loss provision | (147,581) | | | (16,569) | | | (3,496) | |
| | | | | |
| | | | | |
| Total | $ | (2,062,824) | | | $ | (3,011,127) | | | $ | (1,162,984) | |
| | | | | |
(1) Includes the net interest component of interest rate swaps, realized gains (losses) on termination or maturity of interest rate swaps and unrealized gains (losses) on interest rate swaps. |
2020 Compared with 2019Net Gains (Losses) on Derivatives
Net gains (losses) on interest rate swaps for the year ended December 31, 20202023 was ($3.0)$0.7 billion compared to ($2.3)$3.6 billion for the same period in 2019,2022, attributable to an unfavorable changechanges in unrealized gains (losses) on interest rate swaps, partially offset by the changes in net interest component of interest rate swaps and higher realized lossesgains (losses) on termination or maturity of interest rate swaps, partially offset by lower unrealized lossesswaps. Unrealized gains (losses) on interest rate swaps. The net interest component of interest rate swaps was ($207.9)815.6) million for the year ended December 31, 2020,2023, reflecting quarters of rate rallies and sell-offs in forward interest rates during the current period, compared to $351.4 million$3.5 billion for the same period in 2019,2022, reflecting a decreasesharper rise in forward interest rates combined with the timing of rate resets during the period and changes in notional balance.prior period. Realized gains (losses) on termination or maturity of interest rate swaps was ($1.9) billion resulting from interest rate swaps with a notional amount of $104.1 billion for the year ended December 31, 2020 compared to ($1.4) billion74.8) million resulting from the termination or maturity of interest rate swaps with a notional amount of $88.6 billion for the same period in 2019. Unrealized gains (losses) on interest rate swaps was ($0.9)$12.7 billion for the year ended December 31, 20202023 compared to ($1.2)266.4) million resulting from the termination or maturity of interest rate swaps with a notional amount of $21.3 billion for the same period in 2019, which reflected a steeper decline in forward2022. Net interest rates during the earlier period.
Net gains (losses) on disposalcomponent of investments and otherinterest rate swaps was $661.5 million$1.6 billion for the year ended December 31, 20202023 compared with ($47.9)to $366.2 million for the same period in 2019. For the2022 due to an increase in average notional complemented by a full year ended December 31, 2020, we disposed of Residential Securities with a carrying value of $51.8 billion for an aggregate net gain of $637.0 million. For the same period in 2019, we disposed of Residential Securities with a carrying value of $25.5 billion for an aggregate net loss of ($37.8) million.receive rates.
ANNALY CAPITAL MANAGEMENT, INC. AND SUBSIDIARIES
Item 7. Management’s Discussion and Analysis
Net gains (losses) on other derivatives was $756.3($294.6) million for the year ended December 31, 20202023 compared to ($680.8) million$1.3 billion for the same period in 2019.2022. The change in net gains (losses) on other derivatives was primarily comprised ofdue to unfavorable changes in net gains (losses) on futures contracts, which was ($280.1)6.8) million for the year ended December 31, 20202023 compared to ($962.7) million$4.0 billion for the same period in 20192022 and higher net gains (losses) on TBA derivatives,interest rate swaptions, which was $985.4($148.8) million for the year ended December 31, 20202023 compared to $326.8$152.0 million for the same period in 2019.
Net unrealized2022, partially offset by a favorable change in net gains (losses) on instruments measured at fair value through earningsTBA derivatives, which was ($303.0)140.8) million for the year ended December 31, 20202023 compared to $36.0 million($2.8) billion for the same period in 2019, primarily due to unfavorable changes in unrealized gains (losses) on Agency interest-only securities, non-Agency mortgage-backed securities, commercial securitized loans of consolidated VIEs and residential credit risk transfer securities, partially offset by favorable changes in unrealized gains (losses) on commercial debt issued by securitization vehicles for the year ended December 31, 2020 compared to the same period in 2019.2022.
Loan Loss (Provision) Reversal
For the year ended December 31, 2020,2023, a loan loss provision(provision) reversal of ($147.6)$0.2 million was recorded on commercial mortgage and corporate loans compared to ($16.6)$20.7 million for the same period in 2019.2022. Refer to the “Loans” Note located within Item 15 for additional information related to these loan loss provisions.
Business Divestiture-Related Gains (Losses)
For the year ended December 31, 2023, there were no business divestiture-related gains (losses). For the year ended December 31, 2022, the majority of business divestiture-related gain (losses) were associated with the sale of our corporate loan interests. Refer to the “Sale of Middle Market Lending Portfolio” Note located within Item 15 for additional information related to the transaction.
Other, Income (Loss)Net
Other, income (loss)net includes certain revenuesbrokerage and commission fees, due diligence costs, associated with our investments in commercial real estate, including rental incomesecuritization expenses, and recoveries, net servicing incomeinterest on MSRs, operating costs as well as depreciation and amortization expense.custodial balances. We also report in Other, income (loss)net items whose amounts, either individually or in the aggregate, would not, in the opinion of management, be meaningful to readers of the financial statements. Given the nature of certain components of this line item, balances may fluctuate from period to period.
General and Administrative Expenses
General and administrative (“G&A”) expenses consist of compensation and management fee (until closing of the Internalization on June 30, 2020) and other expenses. The following table shows our total G&A expenses as compared to average total assets and average equity for the periods presented.
G&A Expenses and Operating Expense Ratios
| | | | | | | | | | | | | | | | | |
| | Total G&A Expenses (1) | | Total G&A Expenses/Average Assets (1) | | Total G&A Expenses/Average Equity (1) |
| For the years ended | (dollars in thousands) |
| December 31, 2020 | $ | 239,198 | | | 0.24 | % | | 1.70 | % |
| December 31, 2019 | $ | 301,634 | | | 0.24 | % | | 1.97 | % |
| December 31, 2018 | $ | 329,873 | | | 0.32 | % | | 2.30 | % |
(1) Includes $11.3 million of transaction costs incurred in connection with securitizations of residential whole loans and Agency mortgage-backed securities as well as costs incurred in connection with the Internalization and costs incurred in connection with the CEO search process for the year ended December 31, 2020. Includes $19.3 million of transaction costs incurred in connection with securitizations of residential whole loans, commercial loans and Agency mortgage-backed securities for the year ended December 31, 2019. Excluding these transaction costs, G&A expenses as a percentage of average total assets and as a percentage of average equity were 0.23% and 1.62%, respectively, and 0.23% and 1.84%, respectively, for the years ended December 31, 2020 and 2019, respectively. | | | | | | | | | | | | | | | | | |
| | Total G&A
Expenses | | Total G&A Expenses/Average Assets | | Total G&A Expenses/Average Equity |
| For the years ended | (dollars in thousands) |
| December 31, 2023 | $ | 162,553 | | | 0.18 | % | | 1.42 | % |
| December 31, 2022 | $ | 162,729 | | | 0.21 | % | | 1.40 | % |
| December 31, 2021 | $ | 186,014 | | | 0.23 | % | | 1.35 | % |
|
20202023 Compared with 20192022
G&A expenses decreased $62.4$0.2 million to $239.2$162.6 million for the year ended December 31, 20202023 compared to the same period in 2019.2022. The changeincrease in compensation expense was primarilyalmost fully offset by the decrease in other general and administrative expense due to lower compensation costs, reflecting cost savings related toexpenses resulting from the Internalization and lower management fees and expense reimbursements todivestiture of our Former ManagerMML assets, which was announced in the first halfsecond quarter of 2020 reflecting lower adjusted stockholders’ equity balances compared to the same period in 2019,2022.
ANNALY CAPITAL MANAGEMENT, INC. AND SUBSIDIARIES
Item 7. Management’s Discussion and lower transaction costs during the year ended December 31, 2020 compared to the same period in 2019.Analysis
Return on Average Equity
The following table shows the components of our annualized return on average equity for the periods presented.
Components of Annualized Return on Average Equity
ANNALY CAPITAL MANAGEMENT, INC. AND SUBSIDIARIES
Item 7. Management’s Discussion and Analysis
| | | | | | | | | | | | | | | | | | | | | | | | | | | | | | | | | | | |
| | Economic Net Interest Income/ Average Equity (1) | | Realized and Unrealized Gains and Losses/Average Equity (2) | | Other Income (Loss)/Average Equity | | G&A Expenses/ Average Equity | | Income
Taxes/ Average Equity | | Return on
Average Equity |
| For the years ended | | | | | | | | | | | |
| December 31, 2020 | 7.96 | % | | (13.15 | %) | | 0.38 | % | | (1.70 | %) | | 0.20 | % | | (6.31 | %) |
| December 31, 2019 | 8.83 | % | | (21.93 | %) | | 0.89 | % | | (1.97 | %) | | 0.07 | % | | (14.11 | %) |
| December 31, 2018 | 10.71 | % | | (8.81 | %) | | 0.76 | % | | (2.30 | %) | | 0.02 | % | | 0.38 | % |
(1) Economic net interest income includes the net interest component of interest rate swaps. (2) Realized and unrealized gains and losses excludes the net interest component of interest rate swaps. |
| | | | | | | | | | | | | | | | | | | | | | | | | | | | | | | | | | | |
| | Economic Net Interest Income/ Average Equity (1) | | Net Servicing Income/Average Equity | | Other Income (Loss)/Average Equity (2) | | G&A Expenses/ Average Equity | | Income
Taxes/ Average Equity | | Return on
Average Equity |
| For the years ended | | | | | | | | | | | |
| December 31, 2023 | 12.88 | % | | 2.85 | % | | (28.30) | % | | (1.42 | %) | | (0.34 | %) | | (14.33 | %) |
| December 31, 2022 | 15.80 | % | | 1.91 | % | | (1.06) | % | | (1.40 | %) | | (0.39 | %) | | 14.86 | % |
| December 31, 2021 | 10.62 | % | | 0.41 | % | | 7.81 | % | | (1.35 | %) | | (0.04 | %) | | 17.45 | % |
(1) Economic net interest income includes the net interest component of interest rate swaps. (2) Other income (loss) excludes the net interest component of interest rate swaps. |
Unrealized Gains and Losses - Available-for-Sale Investments
With our available-for-sale accounting treatment on our Agency mortgage-backed securities, which represent the largest portion of assets on balance sheet, as well as certain commercial mortgage-backed securities,The unrealized fluctuations in market values of assetsour available-for-sale Agency MBS, for which the fair value option is not elected, do not impact our GAAP net income (loss) but rather are reflected on our balance sheet by changing the carrying value of the asset and stockholders’ equity under accumulated other comprehensive income (loss). As a result of this fair value accounting treatment, our book value and book value per share are likely to fluctuate far more than if we used amortized cost accounting. As a result, comparisons with companies that use amortized cost accounting for some or all of their balance sheet may not be meaningful.
The following table below shows cumulative unrealized gains and losses on our available-for-sale investments reflected in the Consolidated Statements of Financial Condition.
| | | | | | | | | | | |
| | December 31, 2020 | | December 31, 2019 |
| | (dollars in thousands) |
| Unrealized gain | $ | 3,378,523 | | | $ | 2,267,577 | |
| Unrealized loss | (4,188) | | | (129,386) | |
| Accumulated other comprehensive income (loss) | $ | 3,374,335 | | | $ | 2,138,191 | |
| | | |
| | | | | | | | | | | |
| | December 31, 2023 | | December 31, 2022 |
| | (dollars in thousands) |
| Unrealized gain | $ | 5,051 | | | $ | 5,910 | |
| Unrealized loss | (1,340,451) | | | (3,714,806) | |
| Accumulated other comprehensive income (loss) | $ | (1,335,400) | | | $ | (3,708,896) | |
| | | |
Unrealized changes in the estimated fair value of available-for-sale investments may have a direct effect on our potential earnings and dividends: positive changes will increase our equity base and allow us to increase our borrowing capacity while negative changes tend to reduce borrowing capacity. A very large negative change in the net fair value of our available-for-sale Residential Securities might impair our liquidity position, requiring us to sell assets with the potential result of realized losses upon sale.
The fair value of these securities being less than amortized cost at December 31, 20202023 is solely due to market conditions and not the quality of the assets. Substantially all of the Agency mortgage-backed securities are “AAA” ratedMBS have an actual or carry an implied “AAA” rating.credit rating that is the same as that of the U.S. government. The investments aredo not considered to be other-than-temporarily impairedrequire an allowance for credit losses because we currently have the ability and intent to hold the investments to maturity or for a period of time sufficient for a forecasted market price recovery up to or beyond the cost of the investments, and it is not more likely than not that we will be required to sell the investments before recovery of the amortized cost bases, which may be maturity. Also, we are guaranteed payment of the principal and interest amounts of the securities by the respective issuing Agency.
ANNALY CAPITAL MANAGEMENT, INC. AND SUBSIDIARIES
Item 7. Management’s Discussion and Analysis
Financial Condition
Total assets were $88.5$93.2 billion and $130.3$81.9 billion at December 31, 20202023 and 2019,2022, respectively. The change consistent with our portfolio repositioning to strengthen our balance sheet in the first quarter of 2020, was primarily due to a decreaseincreases in Agency mortgage-backed securitiesMBS of $39.3$4.0 billion, residential mortgage loans, including assets transferred or pledged to securitization vehicles, residential mortgage loans of $0.7$4.7 billion, MSR of $0.4 billion, receivable for unsettled trades of $2.1 billion, and commercial real estate debt investmentsprincipal and interest receivable of $0.4$0.6 billion, partially offset by decreases in CMBS of $0.3 billion and derivative assets of $0.2 billion. Our portfolio composition, net equity allocation and debt-to-net equity ratio by asset class were as follows at December 31, 2020:2023:
| | | |
| | | | | Residential | Commercial | | | |
| | | Agency MBS and MSRs | | TBAs (1) | | Residential CRTs | | Non-Agency MBS and Residential Mortgage Loans (2) | | CRE Debt &
Preferred
Equity
Investments | | Investments in CRE | | Corporate Debt | | Total (3) | |
| Assets | Assets | (dollars in thousands) | |
| Fair value/carrying value | $ | 74,788,301 | | | $ | 20,373,197 | | | $ | 532,403 | | | $ | 4,567,253 | | | $ | 3,619,245 | | | $ | 656,314 | | | $ | 2,239,930 | | | $ | 86,403,446 | | |
| Assets | |
| Assets | |
| Fair value | |
| Fair value | |
| Fair value | |
Implied market value of derivatives (2) | |
Implied market value of derivatives (2) | |
Implied market value of derivatives (2) | |
| Debt | |
| Debt | |
| Debt | Debt | | |
| Repurchase agreements | Repurchase agreements | 62,744,910 | | | 20,277,088 | | 245,686 | | | 1,235,162 | | | 599,481 | | | — | | | — | | | 64,825,239 | | |
| Repurchase agreements | |
| Repurchase agreements | |
Implied cost basis of derivatives (2) | |
Implied cost basis of derivatives (2) | |
Implied cost basis of derivatives (2) | |
| Other secured financing | |
| Other secured financing | |
| Other secured financing | Other secured financing | 4,434 | | | — | | | — | | | 25,987 | | | — | | | — | | | 887,455 | | | 917,876 | | |
| Debt issued by securitization vehicles | Debt issued by securitization vehicles | 573,413 | | | — | | | — | | | 2,617,000 | | | 2,462,569 | | | — | | | — | | | 5,652,982 | | |
| Debt issued by securitization vehicles | |
| Debt issued by securitization vehicles | |
| Participations issued | Participations issued | — | | | — | | | — | | | 39,198 | | | — | | | — | | | — | | | 39,198 | | |
| Participations issued | |
| Participations issued | |
| U.S. Treasury securities sold, not yet purchased | |
| U.S. Treasury securities sold, not yet purchased | |
| U.S. Treasury securities sold, not yet purchased | |
| Net forward purchases | Net forward purchases | 865,081 | | | — | | | — | | | 3,076 | | | — | | | — | | | — | | | 868,157 | | |
| | Mortgages payable | — | | | — | | | — | | | — | | | — | | | 426,256 | | | — | | | 426,256 | | |
| Net forward purchases | |
| Net forward purchases | |
| Other | |
| Other | |
| Other | |
| Net other assets / liabilities | |
| Net other assets / liabilities | |
| Net other assets / liabilities | |
| Net equity allocated | |
| Net equity allocated | |
| Net equity allocated | Net equity allocated | $ | 10,600,463 | | | $ | 96,109 | | | $ | 286,717 | | | $ | 646,830 | | | $ | 557,195 | | | $ | 230,058 | | | $ | 1,352,475 | | | $ | 13,673,738 | | (4) |
| | Net equity allocated (%) | Net equity allocated (%) | 78 | % | | 1 | % | | 2 | % | | 5 | % | | 4 | % | | 1 | % | | 10 | % | | 100 | % | |
| | Net equity allocated (%) | |
| | Net equity allocated (%) | |
Debt/net equity ratio | |
Debt/net equity ratio | |
Debt/net equity ratio | Debt/net equity ratio | 6.1:1 | | NM | | 0.9:1 | | 6.1:1 | | 5.5:1 | | 1.9:1 | | 0.7:1 | | 5.1:1 | (5) | 8.4:1 | | 0.3:1 | | 7.0:1 | | 2.2:1 | | | | 6.8:1 |
|
| (1) Fair value/carrying value represents implied market value and repurchase agreements represent the cost basis. (2) Includes loans held for sale, net. (3) Excludes the TBA asset, debt and equity balances. (4) Net Equity Allocated, as disclosed in the above table, excludes non-portfolio related activity and may differ from stockholders’ equity per the Consolidated Statements of Financial Condition. (5) Represents the debt/net equity ratio as determined using amounts on the Consolidated Statements of Financial Condition. NM Not meaningful. | (1) Fair value includes residential loans held for sale, and assets and liabilities associated with non-controlling interests. (2) Derivatives include TBA contracts under Agency MBS. (3) Represents the debt/net equity ratio as determined using amounts on the Consolidated Statements of Financial Condition. | |
(1) Fair value includes residential loans held for sale, and assets and liabilities associated with non-controlling interests. (2) Derivatives include TBA contracts under Agency MBS. (3) Represents the debt/net equity ratio as determined using amounts on the Consolidated Statements of Financial Condition. | |
(1) Fair value includes residential loans held for sale, and assets and liabilities associated with non-controlling interests. (2) Derivatives include TBA contracts under Agency MBS. (3) Represents the debt/net equity ratio as determined using amounts on the Consolidated Statements of Financial Condition. | |
Residential Securities
Substantially all of our Agency mortgage-backed securitiesMBS at December 31, 20202023 and December 31, 20192022 were backed by single-family residential mortgage loans and were secured with a first lien position on the underlying single-family properties. Our mortgage-backed securities were largely Fannie Mae, Freddie Mac Fannie Mae or Ginnie Mae pass through certificates or CMOs, which carryhave an actual or implied “AAA” rating.credit rating that is the same as that of the U.S. government. We carry all of our Agency mortgage-backed securitiesMBS at fair value on the Consolidated Statements of Financial Condition.
We accrete discount balances as an increase to interest income over the expected life of the related interest earning assets and we amortize premium balances as a decrease to interest income over the expected life of the related interest earning assets. At December 31, 20202023 and December 31, 20192022 we had on our Consolidated Statements of Financial Condition a total of $88.3 million$1.4 billion and $156.9 million,$1.1 billion, respectively, of unamortized discount (which is the difference between the remaining principal value and current amortized cost of our Residential Securities excluding securities transferred or pledged to securitization vehicles, acquired at a price below principal value) and a total of $4.0$2.4 billion and $5.3$2.9 billion, respectively, of unamortized premium (which is the difference between the remaining principal value and the current amortized cost of our Residential Securities excluding securities transferred or pledged to securitization vehicles, acquired at a price above principal value).
The weighted average experienced prepayment speed on our Agency mortgage-backed securitiesMBS portfolio for the years ended December 31, 20202023 and 20192022 was 20.2%6.5% and 12.7%12.2%, respectively. The weighted average projected long-term prepayment speed on our Agency mortgage-backed securitiesMBS portfolio as of December 31, 20202023 and 20192022 was 16.4%9.4% and 13.9%7.8%, respectively.
Given our current portfolio composition, if mortgage principal prepayment rates were to increase over the life of our mortgage-backed securities, all other factors being equal, our net interest income would decrease during the life of these mortgage-backed securities as we would be required to amortize our net premium balance into income over a shorter time period. Similarly, if mortgage principal prepayment rates were to decrease over the life of our mortgage-backed securities, all other factors being equal, our net interest income would increase during the life of these mortgage-backed securities as we would amortize our net premium balance over a longer time period.
ANNALY CAPITAL MANAGEMENT, INC. AND SUBSIDIARIES
Item 7. Management’s Discussion and Analysis
The following table presents our Residential Securities that were carried at fair value at December 31, 2023 and December 31, 2022.
| | | | | | | | | | | | | | | | | | | | | | | |
| | | | | | | | | | | | | | December 31, 2023 | | December 31, 2022 |
| | | | | | | | | | | | | | Estimated Fair Value |
| Agency | | | | | | | | | | | | | (dollars in thousands) |
| Fixed-rate pass-through | | | | | | | | | | | | | $ | 62,198,941 | | | $ | 60,029,758 | |
| Adjustable-rate pass-through | | | | | | | | | | | | | 191,489 | | | 234,387 | |
| CMO | | | | | | | | | | | | | 82,972 | | | 89,610 | |
| Interest-only | | | | | | | | | | | | | 264,005 | | | 218,077 | |
| Multifamily | | | | | | | | | | | | | 3,544,528 | | | 1,674,165 | |
| Reverse mortgages | | | | | | | | | | | | | 26,853 | | | 28,898 | |
| Total agency securities | | | | | | | | | | | | | $ | 66,308,788 | | | $ | 62,274,895 | |
| Residential credit | | | | | | | | | | | | | | | |
| Credit risk transfer | | | | | | | | | | | | | $ | 974,059 | | | $ | 997,557 | |
| Alt-A | | | | | | | | | | | | | 150,235 | | | 91,216 | |
| Prime | | | | | | | | | | | | | 180,647 | | | 197,870 | |
| | | | | | | | | | | | | | | |
| Subprime | | | | | | | | | | | | | 235,605 | | | 156,313 | |
| NPL/RPL | | | | | | | | | | | | | 1,197,555 | | | 1,317,154 | |
| Prime jumbo (>= 2010 vintage) | | | | | | | | | | | | | 344,232 | | | 228,593 | |
| | | | | | | | | | | | | | | |
| Total residential credit securities | | | | | | | | | | | | | $ | 3,082,333 | | | $ | 2,988,703 | |
| Total Residential Securities | | | | | | | | | | | | | $ | 69,391,121 | | | $ | 65,263,598 | |
| | | | | | | | | | | | | | | |
| | | | | | | | | | | | | | | |
| | | | | | | | | | | | | | | |
| | | | | | | | | | | | | | | |
| | | | | | | | | | | | | | | |
| | | | | | | | | | | | | | | |
| | | | | | | | | | | | | | | |
| | | | | | | | | | | | | | | |
| | | | | | | | | | | | | | | |
| | | | | | | | | | | | | | | |
| | | | | | | | | | | | | | | |
| | | | | | | | | | | | | | | |
| | | | | | | | | | | | | | | |
| | | | | | | | | | | | | | | |
| | | | | | | | | | | | | | | |
| | | | | | | | | | | | | | | |
| | | | | | | | | | | | | | | |
| | | | | | | | | | | | | | | |
| | | | | | | | | | | | | | | |
| | | | | | | | | | | | | | | |
| | | | | | | | | | | | | | | |
| | | | | | | | | | | | | | | |
| | | | | | | | | | | | | | | |
| | | | | | | | | | | | | | | |
| | | | | | | | | | | | | | | |
| | | | | | | | | | | | | | | |
| | | | | | | | | | | | | | | |
The following table summarizes certain characteristics of our Residential Securities (excluding interest-only mortgage-backed securities) and interest-only mortgage-backed securities at December 31, 2023 and December 31, 2022.
| | | | | | | | | | | |
| | December 31, 2023 | | December 31, 2022 |
Residential Securities (1) | (dollars in thousands) |
| Principal amount | $ | 70,078,626 | | | $ | 68,290,976 | |
| Net premium | 63,902 | | | 1,049,253 | |
| Amortized cost | 70,142,528 | | | 69,340,229 | |
| Amortized cost / principal amount | 100.09 | % | | 101.54 | % |
| Carrying value | 68,701,769 | | | 64,736,220 | |
| Carrying value / principal amount | 98.04 | % | | 94.79 | % |
| Weighted average coupon rate | 4.68 | % | | 4.03 | % |
| Weighted average yield | 4.64 | % | | 3.76 | % |
Adjustable-rate Residential Securities (1) | | | |
| Principal amount | $ | 1,206,700 | | | $ | 1,407,295 | |
| Weighted average coupon rate | 8.79 | % | | 7.16 | % |
| Weighted average yield | 8.09 | % | | 7.01 | % |
Weighted average term to next adjustment (2) | 8 Months | | 9 Months |
Weighted average lifetime cap (3) | 9.34 | % | | 9.30 | % |
| Principal amount at period end as % of total residential securities | 1.72 | % | | 2.06 | % |
Fixed-rate Residential Securities (1) | | | |
| Principal amount | $ | 68,871,926 | | | $ | 66,883,681 | |
| Weighted average coupon rate | 4.61 | % | | 3.96 | % |
| Weighted average yield | 4.58 | % | | 3.70 | % |
| Principal amount at period end as % of total residential securities | 98.28 | % | | 97.94 | % |
| Interest-only Residential Securities | | | |
| Notional amount | $ | 25,918,105 | | | $ | 17,346,307 | |
| Net premium | 865,467 | | | 785,532 | |
| Amortized cost | 865,467 | | | 785,532 | |
| Amortized cost / notional amount | 3.34 | % | | 4.53 | % |
| Carrying value | 689,352 | | | 527,378 | |
| Carrying value / notional amount | 2.66 | % | | 3.04 | % |
| Weighted average coupon rate | 0.43 | % | | 0.56 | % |
| Weighted average yield | NM | | NM |
(1) Excludes interest-only MBS. (2) Excludes non-Agency MBS and CRT securities. (3) Excludes non-Agency MBS and CRT securities as this attribute is not applicable to these asset classes. NM Not meaningful. |
ANNALY CAPITAL MANAGEMENT, INC. AND SUBSIDIARIES
Item 7. Management’s Discussion and Analysis
The following tables present our Residential Securities, excluding securities transferred or pledged to securitization vehicles, that were carried at fair value at December 31, 2020 and December 31, 2019.
| | | | | | | | | | | | | | | | | | | | | | | |
| | | | | | | | | | | | | | December 31, 2020 | | December 31, 2019 |
| | | | | | | | | | | | | | Estimated Fair Value |
| Agency | | | | | | | | | | | | | (dollars in thousands) |
| Fixed-rate pass-through | | | | | | | | | | | | | $ | 71,302,578 | | | $ | 108,723,414 | |
| Adjustable-rate pass-through | | | | | | | | | | | | | 477,516 | | | 1,524,331 | |
| CMO | | | | | | | | | | | | | 149,767 | | | 160,016 | |
| Interest-only | | | | | | | | | | | | | 421,909 | | | 708,562 | |
| Multifamily | | | | | | | | | | | | | 1,663,507 | | | 1,717,197 | |
| Reverse mortgages | | | | | | | | | | | | | 51,782 | | | 59,847 | |
| Total agency securities | | | | | | | | | | | | | $ | 74,067,059 | | | $ | 112,893,367 | |
| Residential credit | | | | | | | | | | | | | | | |
| Residential CRT | | | | | | | | | | | | | $ | 532,403 | | | $ | 531,322 | |
| Alt-A | | | | | | | | | | | | | 80,328 | | | 151,383 | |
| Prime | | | | | | | | | | | | | 181,509 | | | 276,257 | |
| Prime Interest-only | | | | | | | | | | | | | 1,240 | | | 3,167 | |
| Subprime | | | | | | | | | | | | | 188,433 | | | 348,979 | |
| NPL/RPL | | | | | | | | | | | | | 475,847 | | | 164,268 | |
| Prime jumbo (>= 2010 vintage) | | | | | | | | | | | | | 43,283 | | | 184,664 | |
| Prime jumbo (>= 2010 vintage) interest-only | | | | | | | | | | | | | 1,552 | | | 7,150 | |
| Total residential credit securities | | | | | | | | | | | | | $ | 1,504,595 | | | $ | 1,667,190 | |
| Total Residential Securities | | | | | | | | | | | | | $ | 75,571,654 | | | $ | 114,560,557 | |
| | | | | | | | | | | | | | | |
| | | | | | | | | | | | | | | |
| | | | | | | | | | | | | | | |
| | | | | | | | | | | | | | | |
| | | | | | | | | | | | | | | |
| | | | | | | | | | | | | | | |
| | | | | | | | | | | | | | | |
| | | | | | | | | | | | | | | |
| | | | | | | | | | | | | | | |
| | | | | | | | | | | | | | | |
| | | | | | | | | | | | | | | |
| | | | | | | | | | | | | | | |
| | | | | | | | | | | | | | | |
| | | | | | | | | | | | | | | |
| | | | | | | | | | | | | | | |
| | | | | | | | | | | | | | | |
| | | | | | | | | | | | | | | |
| | | | | | | | | | | | | | | |
| | | | | | | | | | | | | | | |
| | | | | | | | | | | | | | | |
| | | | | | | | | | | | | | | |
| | | | | | | | | | | | | | | |
| | | | | | | | | | | | | | | |
| | | | | | | | | | | | | | | |
| | | | | | | | | | | | | | | |
| | | | | | | | | | | | | | | |
| | | | | | | | | | | | | | | |
The following table summarizes certain characteristics of our Residential Securities (excluding interest-only mortgage-backed securities) and interest-only mortgage-backed securities, excluding securities transferred or pledged to securitization vehicles, at December 31, 2020 and December 31, 2019.
ANNALY CAPITAL MANAGEMENT, INC. AND SUBSIDIARIES
Item 7. Management’s Discussion and Analysis
| | | | | | | | | | | |
| | December 31, 2020 | | December 31, 2019 |
Residential Securities (1) | (dollars in thousands) |
| Principal amount | $ | 68,521,464 | | | $ | 107,412,143 | |
| Net premium | 3,280,439 | | | 4,309,668 | |
| Amortized cost | 71,801,903 | | | 111,721,811 | |
| Amortized cost / principal amount | 104.79 | % | | 104.01 | % |
| Carrying value | 75,116,466 | | | 113,841,402 | |
| Carrying value / principal amount | 109.62 | % | | 105.99 | % |
| Weighted average coupon rate | 3.58 | % | | 3.91 | % |
| Weighted average yield | 2.86 | % | | 3.07 | % |
Adjustable-rate Residential Securities (1) | | | |
| Principal amount | $ | 1,257,966 | | | $ | 2,513,310 | |
| Weighted average coupon rate | 3.20 | % | | 4.13 | % |
| Weighted average yield | 5.20 | % | | 3.52 | % |
| Weighted average term to next adjustment | 15 Months | | 13 Months |
Weighted average lifetime cap (2) | 0.41 | % | | 8.24 | % |
| Principal amount at period end as % of total residential securities | 1.84 | % | | 2.34 | % |
Fixed-rate Residential Securities (1) | | | |
| Principal amount | $ | 67,263,498 | | | $ | 104,898,833 | |
| Weighted average coupon rate | 3.58 | % | | 3.90 | % |
| Weighted average yield | 2.82 | % | | 3.06 | % |
| Principal amount at period end as % of total residential securities | 98.16 | % | | 97.66 | % |
| Interest-only Residential Securities | | | |
| Notional amount | $ | 3,642,143 | | | $ | 5,447,193 | |
| Net premium | 602,790 | | | 876,129 | |
| Amortized cost | 602,790 | | | 876,129 | |
| Amortized cost / notional amount | 16.55 | % | | 16.08 | % |
| Carrying value | 455,188 | | | 719,155 | |
| Carrying value / notional amount | 12.50 | % | | 13.20 | % |
| Weighted average coupon rate | 3.99 | % | | 3.29 | % |
| Weighted average yield | NM | | 1.73 | % |
(1) Excludes interest-only mortgage-backed securities. (2) Excludes non-Agency mortgage-backed securities and CRT securities as this attribute is not applicable to these asset classes. NM Not meaningful. |
The following tables summarize certain characteristics of our Residential Credit portfolio at December 31, 2020.2023.
| | | | | | | | | | | | | | | | | | | | | | | | | | | | | | | | | | | | | | | | | |
| | | Payment Structure | Investment Characteristics (1) |
| Product | Estimated Fair Value | | Senior | | Subordinate | | Coupon | | Credit Enhancement | | 60+
Delinquencies | | 3M VPR (2) |
| (dollars in thousands) |
| Credit risk transfer | $ | 974,059 | | | $ | — | | | $ | 974,059 | | | 9.66 | % | | 1.73 | % | | 0.81 | % | | 4.40 | % |
| | | | | | | | | | | | | |
| Alt-A | 150,235 | | | 54,038 | | | 96,197 | | | 5.55 | % | | 14.69 | % | | 2.68 | % | | 8.66 | % |
| Prime | 180,647 | | | 43,332 | | | 137,315 | | | 3.43 | % | | 8.29 | % | | 0.40 | % | | 3.38 | % |
| | | | | | | | | | | | | |
| Subprime | 235,605 | | | 72,016 | | | 163,589 | | | 7.15 | % | | 23.13 | % | | 8.74 | % | | 5.67 | % |
| Re-performing loan securitizations | 796,711 | | | 412,365 | | | 384,346 | | | 5.25 | % | | 28.24 | % | | 19.73 | % | | 4.61 | % |
| Non-performing loan securitizations | 400,844 | | | 346,867 | | | 53,977 | | | 4.32 | % | | 40.80 | % | | 66.32 | % | | 15.24 | % |
| Prime jumbo (>=2010 vintage) | 344,232 | | | 94,452 | | | 249,780 | | | 4.13 | % | | 3.13 | % | | 0.46 | % | | 3.06 | % |
| | | | | | | | | | | | | |
| Total/weighted average | $ | 3,082,333 | | | $ | 1,023,070 | | | $ | 2,059,263 | | | 6.35 | % | | 16.86 | % | | 14.97 | % | | 5.79 | % |
| | | | | | | | | | | | | |
(1) Investment characteristics exclude the impact of interest-only securities. (2) Represents the 3 month voluntary prepayment rate (“VPR”). |
| | | | | | | | | | | | | | | | | | | | | | | | | | | | | | | | | | | | | | | | | |
| | | Payment Structure | Investment Characteristics |
| Product | Total | | Senior | | Subordinate | | Coupon | | Credit Enhancement | | 60+
Delinquencies | | 3M VPR (1) |
| (dollars in thousands) |
| Agency credit risk transfer | $ | 508,685 | | | $ | — | | | $ | 508,685 | | | 4.03 | % | | 1.28 | % | | 4.66 | % | | 44.40 | % |
| Private label credit risk transfer | 23,718 | | | — | | | 23,718 | | | 4.81 | % | | 0.97 | % | | 0.86 | % | | 43.63 | % |
| Alt-A | 80,328 | | | 25,286 | | | 55,042 | | | 3.73 | % | | 9.70 | % | | 17.40 | % | | 18.86 | % |
| Prime | 181,509 | | | 12,128 | | | 169,381 | | | 4.44 | % | | 7.02 | % | | 8.94 | % | | 30.73 | % |
| Prime interest-only | 1,240 | | | 1,240 | | | — | | | 0.47 | % | | — | % | | 5.21 | % | | 45.03 | % |
| Subprime | 188,433 | | | 96,468 | | | 91,965 | | | 1.85 | % | | 17.95 | % | | 14.08 | % | | 8.80 | % |
| Re-performing loan securitizations | 467,702 | | | 227,558 | | | 240,144 | | | 4.34 | % | | 30.93 | % | | 28.12 | % | | 9.95 | % |
| Non-performing loan securitizations | 8,145 | | | 8,145 | | | — | | | 3.67 | % | | 32.18 | % | | 82.18 | % | | 3.70 | % |
| Prime jumbo (>=2010 vintage) | 43,283 | | | — | | | 43,283 | | | 3.87 | % | | 3.35 | % | | 4.23 | % | | 51.33 | % |
| Prime jumbo (>=2010 vintage) interest-only | 1,552 | | | 1,552 | | | — | | | 0.35 | % | | — | | | 4.59 | % | | 53.22 | % |
Total/weighted average (2) | $ | 1,504,595 | | | $ | 372,377 | | | $ | 1,132,218 | | | 3.88 | % | | 13.86 | % | | 14.62 | % | | 28.20 | % |
| | | | | | | | | | | | | |
(1) Represents the 3 month voluntary prepayment rate (“VPR”). |
(2) Total investment characteristics exclude the impact of IOs. |
ANNALY CAPITAL MANAGEMENT, INC. AND SUBSIDIARIES
Item 7. Management’s Discussion and Analysis
| | Bond Coupon | | |
| Bond Coupon | |
| Product | |
| Product | |
| Product | Product | ARM | | Fixed | | Floater | | Interest-Only | | Estimated Fair Value | ARM | | Fixed | | Floater | | Interest-Only | | Estimated Fair Value |
| (dollars in thousands) | (dollars in thousands) | (dollars in thousands) |
| Agency credit risk transfer | $ | — | | | $ | — | | | $ | 508,594 | | | $ | 91 | | | $ | 508,685 | |
| Private label credit risk transfer | — | | | — | | | 23,718 | | | — | | | 23,718 | |
| Credit risk transfer | |
| | Alt-A | |
| Alt-A | |
| Alt-A | Alt-A | 18,133 | | | 48,629 | | | 13,566 | | | — | | | 80,328 | |
| Prime | Prime | 40,859 | | | 135,887 | | | 4,763 | | | — | | | 181,509 | |
| Prime interest-only | — | | | — | | | — | | | 1,240 | | | 1,240 | |
| | Subprime | |
| Subprime | |
| Subprime | Subprime | 7,486 | | | 71,776 | | | 108,939 | | | 232 | | | 188,433 | |
| Re-performing loan securitizations | Re-performing loan securitizations | — | | | 467,702 | | | — | | | — | | | 467,702 | |
| Non-performing loan securitizations | Non-performing loan securitizations | — | | | 8,145 | | | — | | | — | | | 8,145 | |
| Prime jumbo (>=2010 vintage) | Prime jumbo (>=2010 vintage) | — | | | 43,283 | | | — | | | — | | | 43,283 | |
| Prime jumbo (>=2010 vintage) interest-only | — | | | — | | | — | | | 1,552 | | | 1,552 | |
| | Total | |
| Total | |
| Total | Total | $ | 66,478 | | | $ | 775,422 | | | $ | 659,580 | | | $ | 3,115 | | | $ | 1,504,595 | |
|
Contractual Obligations
The following table summarizes the effect on our liquidity and cash flows from contractual obligations at December 31, 2020.2023. The table does not include the effect of net interest rate payments on our interest rate swap agreements. The net swap payments will fluctuate based on monthly changes in the receive rate. At December 31, 2020,2023, the interest rate swaps had a net fair value of ($1.0) billion.56.7) million.
| | | | | | | | | | | | | | | | | | | | | | | | | | | | | |
| | Within One
Year | | One to Three
Years | | Three to Five
Years | | More than
Five Years | | Total |
| | (dollars in thousands) |
| Repurchase agreements | $ | 64,641,177 | | | $ | 184,062 | | | $ | — | | | $ | — | | | $ | 64,825,239 | |
Interest expense on repurchase agreements (1) | 41,588 | | | 2,861 | | | — | | | — | | | 44,449 | |
| Other secured financing | 30,420 | | | — | | | 887,456 | | | — | | | 917,876 | |
Interest expense on other secured financing (1) | 20,112 | | | 39,190 | | | 15,868 | | | — | | | 75,170 | |
| Debt issued by securitization vehicles (principal) | — | | | — | | | 167,670 | | | 5,481,520 | | | 5,649,190 | |
| Interest expense on debt issued by securitization vehicles | 133,669 | | | 267,338 | | | 267,338 | | | 2,833,063 | | | 3,501,408 | |
| Participations issued (principal) | — | | | — | | | — | | | 37,365 | | | 37,365 | |
| Interest expense on participations issued | 1,669 | | | 3,338 | | | 3,338 | | | 44,989 | | | 53,334 | |
| Mortgages payable (principal) | 9,706 | | | 41,325 | | | 289,124 | | | 89,495 | | | 429,650 | |
| Interest expense on mortgages payable | 18,426 | | | 34,211 | | | 26,184 | | | 58,885 | | | 137,706 | |
| Long-term operating lease obligations | 3,918 | | | 7,724 | | | 6,757 | | | — | | | 18,399 | |
| Total | $ | 64,900,685 | | | $ | 580,049 | | | $ | 1,663,735 | | | $ | 8,545,317 | | | $ | 75,689,786 | |
| | | | | | | | | |
(1) Interest expense on repurchase agreements and other secured financing calculated based on rates at December 31, 2020. |
| | | | | | | | | | | | | | | | | | | | | | | | | | | | | |
| | Within One
Year | | One to Three
Years | | Three to Five
Years | | More than
Five Years | | Total |
| | (dollars in thousands) |
| Repurchase agreements | $ | 62,201,543 | | | $ | — | | | $ | — | | | $ | — | | | $ | 62,201,543 | |
Interest expense on repurchase agreements (1) | 431,816 | | | — | | | — | | | — | | | 431,816 | |
| Other secured financing | 250,000 | | | 250,000 | | | — | | | — | | | 500,000 | |
Interest expense on other secured financing (1) | 30,685 | | | 1,742 | | | — | | | — | | | 32,427 | |
| Debt issued by securitization vehicles (principal) | — | | | — | | | — | | | 12,623,492 | | | 12,623,492 | |
| Interest expense on debt issued by securitization vehicles | 565,573 | | | 1,131,146 | | | 1,131,146 | | | 16,757,967 | | | 19,585,832 | |
| Participations issued (principal) | — | | | — | | | — | | | 1,086,538 | | | 1,086,538 | |
| Interest expense on participations issued | 82,964 | | | 165,927 | | | 165,927 | | | 2,051,321 | | | 2,466,139 | |
| | | | | | | | | |
| | | | | | | | | |
| Long-term operating lease obligations | 4,107 | | | 3,410 | | | 291 | | | — | | | 7,808 | |
| Total | $ | 63,566,688 | | | $ | 1,552,225 | | | $ | 1,297,364 | | | $ | 32,519,318 | | | $ | 98,935,595 | |
| | | | | | | | | |
(1) Interest expense on repurchase agreements and other secured financing calculated based on rates at December 31, 2023. |
In the coming periods, we expect to continue to finance our Residential Securities in a manner that is largely consistent with our current operations via repurchase agreements. We may use securitization structures, credit facilities, mortgages payable or other term financing structures to finance certain of our assets. During the year ended December 31, 2020,2023, we received $19.6$6.2 billion from principal repayments and $52.6$31.3 billion in cash from disposal of Residential Securities. During the year ended December 31, 2019,2022, we received $17.2$9.5 billion from principal repayments and $25.5$25.0 billion in cash from disposal of Residential Securities.
Off-Balance Sheet Arrangements
We do not have any relationships with unconsolidated entities or financial partnerships which would have been established for the sole purpose of facilitating off-balance sheet arrangements or other contractually narrow or limited purposes.
We have limited future funding commitments related to certain of our unconsolidated joint ventures. In addition, we have provided customary non-recourse carve-out and environmental guarantees (or underlying indemnities with respect thereto) with respect to mortgage loans held by subsidiaries of these unconsolidated joint ventures. We believe that the likelihood of making any payments under these guarantees is remote, and have not accrued a related liability at December 31, 2020.
ANNALY CAPITAL MANAGEMENT, INC. AND SUBSIDIARIES
Item 7. Management’s Discussion and Analysis
Commitments and Contractual Obligations with Unconsolidated Entities
We do not have any commitments or contractual obligations arising from arrangements with unconsolidated entities that have or are reasonably likely to have a material effect on our financial condition, revenues or expenses, results of operations, liquidity, cash requirements or capital resources.
Maintaining a strong balance sheet that can support the business even in times of economic stress and market volatility is of critical importance to our business strategy. A strong and robust capital position is essential to executing our investment strategy. Our capital strategy is predicated on a strong capital position, which enables us to execute our investment strategy regardless of the market environment. Our capital policy defines the parameters and principles supporting a comprehensive capital management practice.
The major risks impacting capital are capital, liquidity and funding risk, investment/market risk, credit risk, counterparty risk, operational risk and compliance, regulatory and legal risk. For further discussion of the risks we are subject to, please see Part I, Item 1A. “Risk Factors” of this annual report on Form 10-K.
Capital requirements are based on maintaining levels above approved thresholds, ensuring the quality of our capital appropriately reflects our asset mix, market and funding structure. In the event we fall short of our internal thresholds, we will consider appropriate actions which may include asset sales, changes in asset mix, reductions in asset purchases or originations, issuance of capital or other capital enhancing or risk reduction strategies.
Stockholders’ Equity
The following table provides a summary of total stockholders’ equity at December 31, 20202023 and 2019:2022:
| | | | December 31, 2020 | | December 31, 2019 | | December 31, 2023 | | December 31, 2022 |
| Stockholders’ equity | Stockholders’ equity | (dollars in thousands) | Stockholders’ equity | (dollars in thousands) |
| | 7.50% Series D cumulative redeemable preferred stock | — | | | 445,457 | |
| | 6.95% Series F fixed-to-floating rate cumulative redeemable preferred stock | |
| | 6.95% Series F fixed-to-floating rate cumulative redeemable preferred stock | |
| | | 6.95% Series F fixed-to-floating rate cumulative redeemable preferred stock | 6.95% Series F fixed-to-floating rate cumulative redeemable preferred stock | 696,910 | | | 696,910 | |
| 6.50% Series G fixed-to-floating rate cumulative redeemable preferred stock | 6.50% Series G fixed-to-floating rate cumulative redeemable preferred stock | 411,335 | | | 411,335 | |
| | 6.75% Series I fixed-to-floating rate cumulative redeemable preferred stock | |
| 6.75% Series I fixed-to-floating rate cumulative redeemable preferred stock | |
| 6.75% Series I fixed-to-floating rate cumulative redeemable preferred stock | 6.75% Series I fixed-to-floating rate cumulative redeemable preferred stock | 428,324 | | | 428,324 | |
| Common stock | Common stock | 13,982 | | | 14,301 | |
| Additional paid-in capital | Additional paid-in capital | 19,750,818 | | | 19,966,923 | |
| Accumulated other comprehensive income (loss) | Accumulated other comprehensive income (loss) | 3,374,335 | | | 2,138,191 | |
| Accumulated deficit | Accumulated deficit | (10,667,388) | | | (8,309,424) | |
| Total stockholders’ equity | Total stockholders’ equity | $ | 14,008,316 | | | $ | 15,792,017 | |
|
ANNALY CAPITAL MANAGEMENT, INC. AND SUBSIDIARIES
Item 7. Management’s Discussion and Analysis
Capital Stock
Common Stock
The following table provides activity related to our Direct Purchase and Dividend Reinvestment Program for the periods presented:
| | | | | | | | | | | | | | |
| | For the Years Ended |
| | | December 31, 2020 | | December 31, 2019 |
| | (dollars in thousands) |
| Shares issued through direct purchase and dividend reinvestment program | | 166,000 | | | 180,000 | |
| Amount raised from direct purchase and dividend reinvestment program | | $ | 1,175 | | | $ | 1,795 | |
During the year ended December 31, 2019, we closed the public offering of an original issuance of 75.0 million shares of common stock for proceeds of $730.5 million before deducting offering expenses. In connection with the offering, we granted the underwriters a thirty-day option to purchase up to an additional 11.3 million shares of common stock, which the underwriters exercised in full resulting in an additional $109.6 million in proceeds before deducting offering expenses.
In June 2019, we announced that our Board authorized the repurchase of up to $1.5 billion of our outstanding shares of common stock, which expired on December 31, 2020 (“the Prior Share Repurchase Program”). In December 2020, we announced that our Board authorized the repurchase of up to $1.5 billion of our outstanding common shares, throughwhich expired on December 31, 2021 (the “New“Prior Share Repurchase Program”). In January 2022, we announced that our Board authorized the repurchase of up to $1.5 billion of our outstanding shares of common stock through December 31, 2024 (the “Current Share Repurchase Program”). The NewCurrent Share Repurchase Program replaced the Prior Share Repurchase Program. During the years ended December 31, 2023 and 2022, no shares were repurchased under the Current Share Repurchase Program or Prior Share Repurchase Program.
On August 6, 2020, we entered into separate Amended and 2019,Restated Distribution Agency Agreements (as amended by Amendment No. 1 to the Amended and Restated Distribution Agency Agreements on August 6, 2021, and Amendment No. 2 to the Amended and Restated Distribution Agency Agreements on November 3, 2022, collectively, the “Sales Agreements”) with each of Barclays Capital Inc., BofA Securities, Inc., Citigroup Global Markets Inc., Goldman Sachs & Co. LLC, Keefe, Bruyette & Woods, Inc., J.P. Morgan Securities LLC, RBC Capital Markets, LLC, UBS Securities LLC and Wells Fargo Securities, LLC (collectively, the “Sales Agents”). Pursuant to the Sales Agreements, we repurchased 32.4 millionmay offer and 26.2 millionsell shares of our common stock, forhaving an aggregate amountoffering price of $208.9 million and $223.2 million, excluding commission costs, respectively. All common shares purchased were partup to $1.5 billion, from time to time through any of a publicly announced plans in open-market transactions.the Sales Agents (the “at-the-market sales program”).
No shares were issuedDuring the year ended December 31, 2023, under the at-the-market sales program, duringwe issued 31.4 million shares for proceeds of $0.7 billion, net of commissions and fees. During the year ended December 31, 2020. 2022, under the at-the-market sales program,
ANNALY CAPITAL MANAGEMENT, INC. AND SUBSIDIARIES
Item 7. Management’s Discussion and Analysis
we issued 45.7 million shares for proceeds of $1.1 billion, net of commissions and fees. The foregoing share amounts have been retroactively adjusted to reflect the effects of the Reverse Stock Split.
During the yearsyear ended December 31, 2019,2022, we issued 56.0closed two public offerings for an aggregate original issuance of 50 million shares of common stock for aggregate proceeds of $569.1$1.31 billion before deducting offering expenses. In connection with each offering, we granted the underwriters a thirty-day option to purchase up to an additional 3.75 million netshares of commissions and fees, undercommon stock, which the at-the-market sales program.
No options wereunderwriters exercised duringin full in both instances, resulting in an additional $196.5 million in proceeds before deducting offering expenses for the yearsyear ended December 31, 2020, and 2019.2022. The 2022 share amounts have been retroactively adjusted to reflect the effects of the Reverse Stock Split.
Preferred Stock
DuringOn November 3, 2022, our Board approved a repurchase plan for all of our existing outstanding Preferred Stock (as defined below, the year ended December 31, 2020,“Preferred Stock Repurchase Program”). Under the Company redeemed all 18.4 millionterms of its issued and outstandingthe plan, we are authorized to repurchase up to an aggregate of 63,500,000 shares of 7.50%Preferred Stock, comprised of up to (i) 28,800,000 shares of our 6.95% Series DF Fixed-to-Floating Rate Cumulative Redeemable Preferred Stock, (“Series Dpar value $0.01 per share (the “Series F Preferred Stock”) for $460.0 million. The cash redemption amount for each share of Series D Preferred Stock was $25.00.
During the year ended December 31, 2019, we redeemed all 7.0 million, (ii) 17,000,000 shares of our issued and outstanding shares of 7.625%6.50% Series CG Fixed-to-Floating Rate Cumulative Redeemable Preferred Stock, (“Series Cpar value $0.01 per share (the “Series G Preferred Stock”) for $175.0 million. The cash redemption amount for each share of Series C Preferred Stock was $25.00 plus accrued, and unpaid dividends to, but not including, the redemption date of July 21, 2019.
During the year ended December 31, 2019, we redeemed all 2.2 million of our issued and outstanding shares of 8.125% Series H Cumulative Redeemable Preferred Stock (“Series H Preferred Stock”) for $55.0 million. The cash redemption amount for each share of Series H Preferred Stock was $25.00 plus accrued and unpaid dividends to, but not including, the redemption date of May 31, 2019.
During the year ended December 31, 2019, we issued 17.7 million(iii) 17,700,000 shares of our 6.750%6.75% Series I Fixed-to-Floating Rate Cumulative Redeemable Preferred Stock, for gross proceedspar value $0.01 per share (the “Series I Preferred Stock”, and together with Series F Preferred Stock and Series G Preferred Stock, the “Preferred Stock”). The aggregate liquidation value of $442.5 million before deducting the underwriting discountPreferred Stock that may be repurchased by us pursuant to the Preferred Stock Repurchase Program, as of November 3, 2022, was approximately $1.6 billion. The Preferred Stock Repurchase Program became effective on November 3, 2022, and shall expire on December 31, 2024. No shares were repurchased with respect to the Preferred Stock Repurchase Program during the year ended December 31, 2023.
Purchases made pursuant to the Preferred Stock Repurchase Program will be made in either the open market or in privately negotiated transactions from time to time as permitted by securities laws and other estimated offering costs.
Leverage and Capital
We believe that it is prudent to maintain conservative debt-to-equityGAAP leverage ratios and economic leverage ratios as there may be continued volatility in the mortgage and credit markets. Our capital policy governs our capital and leverage position including setting limits. Based on the guidelines, we generally expect to maintain an economic leverage ratio of less than 10:1. Our actual economic leverage ratio varies from time to time based upon various factors, including our management’s opinion of the level of risk of our assets and liabilities, our liquidity position, our level of unused borrowing capacity, the availability of credit, over-collateralization levels required by lenders when we pledge assets to secure borrowings and our assessment of domestic and
ANNALY CAPITAL MANAGEMENT, INC. AND SUBSIDIARIES
Item 7. Management’s Discussion and Analysis
international market conditions.
Our debt-to-equityGAAP leverage ratio at December 31, 20202023 and 20192022 was 5.1:6.8:1 and 7.1:6.0:1, respectively. Our economic leverage ratio, which is computed as the sum of Recourse Debt, cost basis of TBA derivative and CMBX notionalderivatives outstanding, and net forward purchases (sales) of investments divided by total equity was 5.7:1 and 6.3:1, at December 31, 20202023 and 20192022, respectively. Our GAAP capital ratio at December 31, 2023 and 2022 was 6.2:112.2% and 7.2:1,13.9%, respectively. Our economic capital ratio, which represents our ratio of stockholders’ equity to total economic assets (inclusive of totalthe implied market value of TBA derivatives and shown net of debt issued by securitization vehicles), was 13.6%14.0% and 12.0%13.4% at December 31, 20202023 and 2019,2022, respectively.
Economic leverage ratio and economic capital ratio are non-GAAP financial measures. Refer to the “Non-GAAP Financial Measures” section for additional information, including reconciliations to their most directly comparable GAAP results.
Risk Management
For more information on COVID-19, including actions we have taken in response, please refer to the section titled “Business Environment and COVID-19” within this Item 7.
We are subject to a variety of risks in the ordinary conduct of our business. The effective management of these risks is of critical importance to the overall success of Annaly. The objective of our risk management framework is to identify, measure and monitor these risks.
Our risk management framework is intended to facilitate a holistic, enterprise wideenterprise-wide view of risk. We believe we have built a strong and collaborative risk management culture throughout Annaly focused on awareness which supports appropriate understanding and management of our key risks. Each employee is accountable for identifying, monitoring and managing risk within their area of responsibility.
ANNALY CAPITAL MANAGEMENT, INC. AND SUBSIDIARIES
Item 7. Management’s Discussion and Analysis
Risk Appetite
We maintain a firm-wide risk appetite statement which defines the types and levels of risk we are willing to take in order to achieve our business objectives, and reflects our risk management philosophy. We engage in risk activities based on our core expertise that aim to enhance value for our stockholders. Our activities focus on income generation and capital preservation through proactive portfolio management, supported by a conservative liquidity and leverage posture.
The risk appetite statement asserts the following key risk parameters to guide our investment management activities:
| | | | | | | | |
| Risk Parameter | | Description |
| Portfolio Composition | | We will maintain a portfolio comprised of target assets approved by our Board and in accordance with our capital allocation policy. |
| Leverage | | We generally expect to maintain an economic leverage ratio no greater than 10:1.1 considerate of our overall capital allocation framework. |
| Liquidity Risk | | We will seek to maintain an unencumbered asset portfolio sufficient to meet our liquidity needs under adverse market conditions. |
| Interest Rate Risk | | We will seek to manage interest rate risk to protect the portfolio from adverse rate movements utilizing derivative instruments targeting both income and capital preservation. |
| Credit Risk | | We will seek to manage credit risk by making investments which conform withinto our specific investment policy parameters and optimize risk-adjusted returns. |
| Capital Preservation | | We will seek to protect our capital base through disciplined risk management practices. |
ComplianceOperational Risk | We will seek to limit impacts to our business through disciplined operational risk management practices addressing areas including but not limited to, management of key third party relationships (i.e. originators, sub-servicers), human capital management, cybersecurity and technology related matters, business continuity and financial reporting risk. |
| Compliance, Regulatory and Legal | We will seek to comply with regulatory requirements needed to maintain our REIT status and our exemption from registration under the Investment Company Act.Act and the licenses and approvals of our regulated and licensed subsidiaries. |
Governance
Risk management begins with our Board, through the review and oversight of the risk management framework, and executive management, through the ongoing formulation of risk management practices and related execution in managing risk. The Board exercises its oversight of risk management primarily through the Board Risk Committee (“BRC”) and Board Audit Committee (“BAC”) with support from the other Board Committees. The BRCRisk Committee is responsible for oversight of our risk governance structure, risk management (operational and market risk) and risk assessment guidelines and policies and our risk appetite. The BACAudit Committee is responsible for oversight of the quality and integrity of our accounting, internal controls and financial reporting practices, including independent auditor selection, evaluation and review, and oversight of the internal audit function. The Risk Committee and the Audit Committee jointly oversee practices and policies related to cybersecurity and receive regular reports from management throughout the year on cybersecurity and related risks. The Management Development and Compensation Committee is responsible for oversight of risk related to our compensation policies and practices.practices and other human capital matters such as succession and culture. The Nominating/Corporate Governance Committee assists the Board in its oversight of our corporate governance framework and the annual self-evaluation of the Board, and the Corporate Responsibility Committee assists the Board in its oversight of any matters that may present reputational or ESG risk to us, and
ANNALY CAPITAL MANAGEMENT, INC. AND SUBSIDIARIES
Item 7. Management’s Discussion and Analysis
the Nominating/us. The Corporate GovernanceResponsibility Committee assists the Board in itsshares oversight of our corporate governance frameworkspecific ESG-related matters with other Board Committees and meets jointly with the annual self-evaluation ofManagement Development and Compensation Committee on the Board.Company's human capital management and culture and with the Risk Committee on ESG-related regulatory and policy risks.
Risk assessment and risk management are the responsibility of our management. A series of management committees has oversight or decision-making responsibilities for risk management activities. Membership of these committees is reviewed regularly to ensure the appropriate personnel are engaged in the risk management process. FourThree primary management committees have been established to provide a comprehensive framework for risk management. The management committees responsible for our risk management include the Enterprise Risk Committee (“ERC”), Asset and/ Liability Committee (“ALCO”), Investment Committee and the Financial Reporting and Disclosure Committee (“FRDC”). Each of these committees reports to our management Operating Committee, which is responsible for oversight and management of our operations, including oversight and approval authority over all aspects of our enterprise risk management.
Audit Services is an independent function with reporting lines to the BAC.Audit Committee. Audit Services is responsible for performing our internal audit activities, which includes independently assessing and validating key controls within the risk management framework.
ANNALY CAPITAL MANAGEMENT, INC. AND SUBSIDIARIES
Item 7. Management’s Discussion and Analysis
Our compliance group is responsible for oversight of our regulatory compliance. Our Chief Compliance Officer has reporting lines to the BAC.Audit Committee.
Description of Risks
We are subject to a variety of risks due to the business we operate. Risk categories are an important component of a robust enterprise wideenterprise-wide risk management framework.
We have identified the following primary categories that we utilize to identify, assess, measure and monitor risk.
ANNALY CAPITAL MANAGEMENT, INC. AND SUBSIDIARIES
Item 7. Management’s Discussion and Analysis
| | | | | | | | |
| Risk | | Description |
Capital, Liquidity and Funding Risk | | Risk to earnings, capital or business resulting from our inability to meet our obligations when they come due without incurring unacceptable losses because of inability to liquidate assets or obtain adequate funding. |
| Investment/Market Risk | | Risk to earnings, capital or business resulting in the decline in value of our assets or an increase in the costs of financing caused by changes in market variables, such as interest rates, which affect the values of investment securities and other investment instruments. |
| Credit Risk | | Risk to earnings, capital or business resulting from an obligor’s failure to meet the terms of any contract or otherwise failure to perform as agreed. This risk is present in lending and investing activities. |
| Counterparty Risk | | Risk to earnings, capital or business resulting from a counterparty’s failure to meet the terms of any contract or otherwise failure to perform as agreed. This risk is present in funding, hedging and investing activities. |
| Operational Risk | | Risk to earnings, capital, reputation or business arising from inadequate or failed internal processes or systems (including proprietary and third party models)business continuity planning), human factors or external events. This risk also applies to our use of proprietary and third party models, software vendors and data providers, and oversight of third party service providers such as sub-servicers, due diligence firms etc. |
| Compliance, Regulatory and Legal Risk | | Risk to earnings, capital, reputation or conduct of business arising from violations of, or nonconformance with internal and external applicable rules and regulations, losses resulting from lawsuits or adverse judgments, or from changes in the regulatory environment that may impact our business model. |
Capital,
ANNALY CAPITAL MANAGEMENT, INC. AND SUBSIDIARIES
Item 7. Management’s Discussion and Analysis
Liquidity and Funding Risk Management
Our capital, liquidity and funding risk management strategy is designed to ensure the availability of sufficient resources to support our business and meet our financial obligations under both normal and adverse market and business environments. Our capital, liquidity and funding risk management practices consist of the following primary elements:
| | | | | | | | |
| Element | | Description |
| Funding | | Availability of diverse and stable sources of funds. |
| Excess Liquidity | | Excess liquidity primarily in the form of unencumbered assets and cash. |
| Maturity Profile | | Diversity and tenor of liabilities and modest use of leverage. |
| Stress Testing | | Scenario modeling to measure the resiliency of our liquidity position. |
| Liquidity Management Policies | | Comprehensive policies including monitoring, risk limits and an escalation protocol. |
Funding
Our primary financing sources are repurchase agreements provided through counterparty arrangements and through Arcola, other secured financing, debt issued by securitization vehicles, mortgages, credit facilities, note sales and various forms of equity. We maintain excess liquidity by holding unencumbered liquid assets that could be either used to collateralize additional borrowings or sold.
We seek to conservatively manage our repurchase agreement funding position through a variety of methods including diversity, breadth and depth of counterparties and maintaining a staggered maturity profile.
Our wholly-owned subsidiary, Arcola, provides direct access to third party funding as a FINRA member broker-dealer. Arcola borrows funds through the General Collateral Finance Repo service offered by the FICC, with FICC acting as the central counterparty. In addition, Arcola has borrowedmay borrow funds through direct repurchase agreements.
To reduce our liquidity risk we maintain a laddered approach to our repurchase agreements. At December 31, 20202023 and December 31, 2019,2022, the weighted average days to maturity was 6444 days and 6527 days, respectively.
Our repurchase agreements generally provide that in the event of a margin call we must provide additional securities or cash on the same business day that a margin call is made. Should prepayment speeds on the mortgages underlying our Agency and Residential mortgage-backed securities and/or market interest rates or other factors move suddenly and cause declines in the market value of assets posted as collateral, resulting margin calls may cause an adverse change in our liquidity position.
At December 31, 2020,2023, we had total financial assets and cash pledged against existing liabilities of $71.7$67.5 billion. The weighted average haircut was approximately 4%3% on repurchase agreements. The quality and character of the Residential Securities and commercial real estate investments that we pledge as collateral under the repurchase agreements and interest rate swaps did not materially change at December 31, 20202023 compared to the same period in 2019. While haircut2022, and marginour counterparties did not materially alter any requirements, including required haircuts, related to the Agency collateral we pledge under repurchase agreements and interest rate swaps were largely unchanged during the year
ANNALY CAPITAL MANAGEMENT, INC. AND SUBSIDIARIES
Item 7. Management’s Discussion and Analysis
ended December 31, 2020, our counterparties did increase haircuts and margin requirements on credit assets beginning in March 2020, as a result of market disruptions brought on by COVID-19, which have since returned closer to pre-pandemic levels.2023.
The following table presents our quarterly average and quarter-end repurchase agreement and reverse repurchase agreement balances outstanding for the periods presented:
| | | | | | | | | | | | | | | | | | | | | | | |
| | Repurchase Agreements | Reverse Repurchase Agreements |
| | Average Daily
Amount Outstanding | | Ending Amount Outstanding | | Average Daily
Amount Outstanding | | Ending Amount Outstanding |
| For the three months ended | (dollars in thousands) |
| December 31, 2020 | $ | 65,528,297 | | | $ | 64,825,239 | | | $ | 210,484 | | | $ | — | |
| September 30, 2020 | 67,542,187 | | | 64,633,447 | | | 286,792 | | | — | |
| June 30, 2020 | 68,468,813 | | | 67,163,598 | | | 183,423 | | | — | |
| March 31, 2020 | 96,756,341 | | | 72,580,183 | | | 461,123 | | | — | |
| December 31, 2019 | 102,760,107 | | | 101,740,728 | | | 1,006,487 | | | — | |
| September 30, 2019 | 108,389,796 | | | 102,682,104 | | | 1,459,070 | | | — | |
| June 30, 2019 | 101,983,828 | | | 105,181,241 | | | 3,478,510 | | | — | |
| March 31, 2019 | 87,781,404 | | | 88,554,170 | | | 3,937,769 | | | 523,449 | |
| December 31, 2018 | 83,984,254 | | | 81,115,874 | | | 2,741,022 | | | 650,040 | |
| | | | | | | | | | | | | | | | | | | | | | | |
| | Repurchase Agreements | Reverse Repurchase Agreements |
| | Average Daily
Amount Outstanding | | Ending Amount Outstanding | | Average Daily
Amount Outstanding | | Ending Amount Outstanding |
| For the three months ended | (dollars in thousands) |
| December 31, 2023 | $ | 61,924,576 | | | $ | 62,201,543 | | | $ | 1,340,204 | | | $ | — | |
| September 30, 2023 | 66,020,036 | | | 64,693,821 | | | 257,097 | | | — | |
| June 30, 2023 | 64,591,463 | | | 61,637,600 | | | 600,968 | | | — | |
| March 31, 2023 | 60,477,833 | | | 60,993,018 | | | 371,429 | | | — | |
| December 31, 2022 | 59,946,810 | | | 59,512,597 | | | 102,025 | | | — | |
| September 30, 2022 | 56,354,310 | | | 54,160,731 | | | 139,991 | | | — | |
| June 30, 2022 | 51,606,720 | | | 51,364,097 | | | 117,903 | | | — | |
| March 31, 2022 | 53,961,689 | | | 52,626,503 | | | 39,535 | | | — | |
| December 31, 2021 | 56,977,019 | | | 54,769,643 | | | 39,247 | | | — | |
ANNALY CAPITAL MANAGEMENT, INC. AND SUBSIDIARIES
Item 7. Management’s Discussion and Analysis
The following table provides information on our repurchase agreements and other secured financing by maturity date at December 31, 2020.2023. The weighted average remaining maturity on our repurchase agreements and other secured financing was 8246 days at December 31, 2020:2023:
| | | | | | | | | | | | | | | | | |
| | December 31, 2023 |
| | Principal
Balance | | Weighted
Average Rate | | % of Total |
| | (dollars in thousands) |
| 1 day | $ | — | | | — | % | | — | % |
| 2 to 29 days | 32,811,903 | | | 5.75 | % | | 52.3 | % |
| 30 to 59 days | 18,618,606 | | | 5.57 | % | | 29.7 | % |
| 60 to 89 days | 7,198,769 | | | 5.64 | % | | 11.5 | % |
| 90 to 119 days | 247,306 | | | 7.09 | % | | 0.4 | % |
Over 119 days (1) | 3,824,959 | | | 6.20 | % | | 6.1 | % |
| Total | $ | 62,701,543 | | | 5.72 | % | | 100.0 | % |
| | | | | |
(1) Less than 1% of the total repurchase agreements and other secured financing had a remaining maturity over 1 year. |
| | | | | | | | | | | | | | | | | |
| | December 31, 2020 |
| | Principal
Balance | | Weighted
Average Rate | | % of Total |
| | (dollars in thousands) |
| 1 day | $ | — | | | — | % | | — | % |
| 2 to 29 days | 30,841,837 | | | 0.29 | % | | 46.9 | % |
| 30 to 59 days | 10,567,655 | | | 0.42 | % | | 16.1 | % |
| 60 to 89 days | 8,568,836 | | | 0.30 | % | | 13.0 | % |
| 90 to 119 days | 2,154,733 | | | 0.23 | % | | 3.3 | % |
Over 119 days (1) | 13,610,054 | | | 0.49 | % | | 20.7 | % |
| Total | $ | 65,743,115 | | | 0.35 | % | | 100.0 | % |
| | | | | |
(1) Approximately 2%We also finance our investments in residential mortgage loans through the issuance of securitization transactions sponsored by our wholly-owned subsidiary Onslow Bay Financial LLC (“Onslow Bay”) under the total repurchase agreements and other secured financing had a remaining maturity over 1 year.
The following table below presents our outstanding debt balances and associated weighted average rates and days to maturity at December 31, 2020:2023:
| | | | | | | | | | | | | | | | | | | | | | | |
| | | | Weighted Average Rate | | |
| | Principal Balance | | As of Period End | | For the Quarter | | Weighted Average Days to Maturity (1) |
| | (dollars in thousands) |
| Repurchase agreements | $ | 64,825,239 | | | 0.32 | % | | 0.35 | % | | 64 |
Other secured financing (2) | 917,876 | | | 2.22 | % | | 2.96 | % | | 1,353 |
Debt issued by securitization vehicles (3) | 5,649,190 | | | 2.13 | % | | 1.95 | % | | 9,013 |
Participations issued (3) | 37,365 | | | 4.47 | % | | 4.70 | % | | 11,664 |
Mortgages payable (3) | 429,650 | | | 4.41 | % | | 4.07 | % | | 2,982 |
| Total indebtedness | $ | 71,859,320 | | | | | | | |
| | | | | | | |
(1) Determined based on estimated weighted-average lives of the underlying debt instruments.
(2) Includes financing under credit facilities.
(3) Non-recourse to Annaly. | | | | | | | | | | | | | | | | | | | | | | | |
| | | | Weighted Average Rate | | |
| | Principal Balance | | As of Period End | | For the Quarter | | Weighted Average Days to Maturity (1) |
| | (dollars in thousands) |
| Repurchase agreements | $ | 62,201,543 | | | 5.70 | % | | 5.56 | % | | 44 |
| Other secured financing | 500,000 | | | 8.09 | % | | 8.08 | % | | 289 |
Debt issued by securitization vehicles (2) | 12,623,492 | | | 4.48 | % | | 4.43 | % | | 12,467 |
Participations issued (2) | 1,086,538 | | | 7.64 | % | | 6.97 | % | | 10,850 |
| | | | | | | |
| Total indebtedness | $ | 76,411,573 | | | | | | | |
| | | | | | | |
(1) Determined based on estimated weighted-average lives of the underlying debt instruments. (2) Non-recourse to Annaly. |
ANNALY CAPITAL MANAGEMENT, INC. AND SUBSIDIARIES
Item 7. Management’s Discussion and Analysis
Excess Liquidity
Our primary source of liquidity is the availability of unencumbered assets which may be provided as collateral to support additional funding needs. We target minimum thresholds of available, unencumbered assets to maintain excess liquidity. The following table illustrates our asset portfolio available to support potential collateral obligations and funding needs.
Assets are considered encumbered if pledged as collateral against an existing liability, and therefore are no longer available to support additional funding. An asset is considered unencumbered if it has not been pledged or securitized. The following table also provides the carrying amount of our encumbered and unencumbered financial assets at December 31, 2020:2023:
ANNALY CAPITAL MANAGEMENT, INC. AND SUBSIDIARIES
| | | | | | | | | | | | | | | | | |
| | Encumbered
Assets | | Unencumbered Assets | | Total |
| Financial assets | (dollars in thousands) |
| Cash and cash equivalents | $ | 1,137,809 | | | $ | 105,894 | | | $ | 1,243,703 | |
| | | | | |
Investments, at carrying value (1) | | | | | |
Agency mortgage-backed securities (2) | 66,929,821 | | | 6,874,366 | | | 73,804,187 | |
| Credit risk transfer securities | 349,323 | | | 183,080 | | | 532,403 | |
| Non-agency mortgage-backed securities | 735,420 | | | 236,772 | | | 972,192 | |
Residential mortgage loans (2) | 3,438,972 | | | 156,089 | | | 3,595,061 | |
| MSRs | 5,541 | | | 95,354 | | | 100,895 | |
Commercial real estate debt investments (2) | 2,052,642 | | | 194,173 | | | 2,246,815 | |
Commercial real estate debt and preferred equity, held for investment (2) | 1,217,329 | | | 155,101 | | | 1,372,430 | |
| | | | | |
| Corporate debt | 1,596,536 | | | 643,394 | | | 2,239,930 | |
| | | | | |
Other assets (3) | — | | | 69,472 | | | 69,472 | |
| Total financial assets | $ | 77,463,393 | | | $ | 8,713,695 | | | $ | 86,177,088 | |
| | | | | |
(1) The amounts reflected in the table above are on a settlement date basis and may differ from the total positions reported on the
Consolidated Statements of Financial Condition.
(2) Includes assets transferred or pledged to securitization vehicles
(3) Includes interests in certain joint ventures and equity instruments.
| | | | | | | | | | | | | | | | | |
| | Encumbered
Assets | | Unencumbered Assets | | Total |
| Financial assets | (dollars in thousands) |
| Cash and cash equivalents | $ | 1,136,298 | | | $ | 275,850 | | | $ | 1,412,148 | |
| | | | | |
Investments, at carrying value (1) | | | | | |
| Agency mortgage-backed securities | 62,707,010 | | | 3,553,285 | | | 66,260,295 | |
| Credit risk transfer securities | 918,662 | | | 55,397 | | | 974,059 | |
| Non-agency mortgage-backed securities | 1,554,090 | | | 554,184 | | | 2,108,274 | |
| Commercial mortgage-backed securities | 220,486 | | | 1,958 | | | 222,444 | |
Residential mortgage loans (2) | 15,329,539 | | | 331,167 | | | 15,660,706 | |
| MSR | 1,781,279 | | | 340,917 | | | 2,122,196 | |
| | | | | |
| | | | | |
| | | | | |
| | | | | |
| | | | | |
| | | | | |
Other assets (3) | — | | | 56,165 | | | 56,165 | |
| Total financial assets | $ | 83,647,364 | | | $ | 5,168,923 | | | $ | 88,816,287 | |
| | | | | |
(1) The amounts reflected in the table above are on a settlement date basis and may differ from the total positions reported on the Consolidated Statements of Financial Condition. (2) Includes assets transferred or pledged to securitization vehicles. (3) Includes commercial real estate investments and interests in certain joint ventures. |
We maintain liquid assets in order to satisfy our current and future obligations in normal and stressed operating environments. These are held as the primary means of liquidity risk mitigation. The composition of our liquid assets is also considered and is subject to certain parameters. The composition is monitored for concentration risk, including in respect of our deposits of our cash and cash equivalents, and asset type. We believe the assets we consider liquid can be readily converted into cash, through liquidation or by being used as collateral in financing arrangements (including as additional collateral to support existing financial arrangements). Our balance sheet also generates liquidity on an on-going basis through mortgage principal and interest repayments and net earnings held prior to payment of dividends. The following table presents our liquid assets as a percentage of total assets at December 31, 2020:2023:
| | | | | |
| Carrying Value (1) |
| Liquid assets | (dollars in thousands) |
| Cash and cash equivalents | $ | 1,243,7031,412,148 | |
| |
Residential Securities (2) (3) | 74,688,20369,342,531 | |
| Commercial mortgage-backed securities | 222,444 | |
Residential mortgage loans (4)(3) | 345,8102,353,084 | |
| Commercial real estate debt investments (5)
| 80,742 |
| Commercial real estate debt and preferred equity, held for investment (6)
| 498,081 |
| Corporate debt, held for investment (7)
| 1,724,789 |
| |
| |
| Total liquid assets | $ | 78,581,32873,330,207 | |
Percentage of liquid assets to carrying amount of encumbered and unencumbered financial assets (8)(4) | 99.1397.14 | % |
(1) Carrying value approximates the market value of assets. The assets listed in this table include $67.5 billion of assets that have been pledged as collateral against existing liabilities at December 31, 2023. Please refer to the Encumbered and Unencumbered Assets table for related information. (2) The amounts reflected in the table above are on a settlement date basis and may differ from the total positions reported on the Consolidated Statements of Financial Condition. (3) Excludes securitized residential mortgage loans transferred or pledged to consolidated VIEs carried at fair value of $13.3 billion. (4) Denominator is computed based on the carrying amount of encumbered and unencumbered financial assets, excluding assets transferred or pledged to securitization vehicles, of $13.3 billion. |
(1)Carrying value approximates the market value of assets. The assets listed in this table include $71.7 billion of assets that have been pledged as collateral against existing liabilities at December 31, 2020. Please refer to the Encumbered and Unencumbered Assets table for related information.
(2)The amounts reflected in the table above are on a settlement date basis and may differ from the total positions reported on the Consolidated Statements of Financial Condition.
(3)Excludes securitized Agency mortgage-backed securities of consolidated VIEs carried at fair value of $0.6 billion
(4)Excludes securitized residential mortgage loans transferred or pledged to consolidated VIEs carried at fair value of $3.2 billion.
(5)Excludes securitized commercial mortgage loans of consolidated VIEs carried at fair value of $2.2 billion.
(6)Excludes senior securitized commercial mortgage loans of consolidated VIEs carried at fair value of $0.9 billion.
(7)Excludes certain second lien loans.
(8)Denominator is computed based on the carrying amount of encumbered and encumbered financial assets, excluding assets transferred or pledged to securitization vehicles of $6.9 billion.
ANNALY CAPITAL MANAGEMENT, INC. AND SUBSIDIARIES
Item 7. Management’s Discussion and Analysis
Maturity Profile
We consider the profile of our assets, liabilities and derivatives when managing both liquidity risk as well as investment/market risk employing a measurement of both the maturity gap and interest rate sensitivity gap. We determine the amount of liquid assets that are required to be held by monitoring several liquidity metrics. We utilize several modeling techniques to analyze our current and potential obligations including the expected cash flows from our assets, liabilities and derivatives. The following table illustrates the expected final maturities and cash flows of our assets, liabilities and derivatives. The table is based on a static portfolio and assumes no reinvestment of asset cash flows and no future liabilities are entered into. In assessing the maturity of our assets, liabilities and off balanceoff-balance sheet obligations, we use the stated maturities, or our prepayment expectations for assets and liabilities that exhibit prepayment characteristics. Cash and cash equivalents are included in the ‘Less than 3 Months’ maturity bucket, as they are typically held for a short period of time.
With respect to each maturity bucket, our maturity gap is considered negative when the amount of maturing liabilities exceeds the amount of maturing assets. A negative gap increases our liquidity risk as we must enter into future liabilities.
Our interest rate sensitivity gap is the difference between interest earning assets and interest bearing liabilities maturing or re-pricing within a given time period. Unlike the calculation of maturity gap, interest rate sensitivity gap includes the effect of our
ANNALY CAPITAL MANAGEMENT, INC. AND SUBSIDIARIES
Item 7. Management’s Discussion and Analysis
interest rate swaps. A gap is considered positive when the amount of interest-rate sensitive assets exceeds the amount of interest-rate sensitive liabilities. A gap is considered negative when the amount of interest-rate sensitive liabilities exceeds interest-rate sensitive assets. During a period of rising interest rates, a negative gap would tend to adversely affect net interest income, while a positive gap would tend to result in an increase in net interest income. During a period of falling interest rates, a negative gap would tend to result in an increase in net interest income, while a positive gap would tend to affect net interest income adversely. Because different types of assets and liabilities with the same or similar maturities may react differently to changes in overall market rates or conditions, changes in interest rates may affect net interest income positively or negatively even if assets and liabilities were perfectly matched in each maturity category. The amount of assets and liabilities utilized to compute our interest rate sensitivity gap was determined in accordance with the contractual terms of the assets and liabilities, except that adjustable-rate loans and securities are included in the period in which their interest rates are first scheduled to adjust and not in the period in which they mature. The effects of interest rate swaps, whereby we generally pay a fixed rate and receive a floating rate and effectively lock in our financing costs for a longer term, are also reflected in our interest rate sensitivity gap.
The interest rate sensitivity of our assets and liabilities in the following table at December 31, 20202023 could vary substantially based on actual prepayment experience.
ANNALY CAPITAL MANAGEMENT, INC. AND SUBSIDIARIES
Item 7. Management’s Discussion and Analysis
| | | | Less than 3
Months | | 3-12 Months | | More than 1 Year to 3 Years | | 3 Years and Over | | Total | | Less than 3
Months | | 3-12 Months | | More than 1 Year to 3 Years | | 3 Years and Over | | Total |
| Financial assets | Financial assets | (dollars in thousands) | Financial assets | (dollars in thousands) |
| Cash and cash equivalents | Cash and cash equivalents | $ | 1,243,703 | | | $ | — | | | $ | — | | | $ | — | | | $ | 1,243,703 | |
| | Agency mortgage-backed securities (principal) | |
| Agency mortgage-backed securities (principal) | |
| Agency mortgage-backed securities (principal) | Agency mortgage-backed securities (principal) | — | | | 8,621 | | | 1,726,132 | | | 65,264,228 | | | 66,998,981 | |
| Residential credit risk transfer securities (principal) | Residential credit risk transfer securities (principal) | — | | | 12,954 | | | 219,121 | | | 301,972 | | | 534,047 | |
| Non-agency mortgage-backed securities (principal) | Non-agency mortgage-backed securities (principal) | — | | | 87,746 | | | 475,874 | | | 424,816 | | | 988,436 | |
| Commercial mortgage-backed securities (principal) | Commercial mortgage-backed securities (principal) | — | | | — | | | — | | | 89,858 | | | 89,858 | |
| Total securities | Total securities | — | | | 109,321 | | | 2,421,127 | | | 66,080,874 | | | 68,611,322 | |
| Residential mortgage loans (principal) | Residential mortgage loans (principal) | — | | | — | | | — | | | 336,525 | | | 336,525 | |
| | Commercial real estate debt and preferred equity (principal) | 63,890 | | | 81,460 | | | 423,035 | | | — | | | 568,385 | |
| Corporate debt (principal) | — | | | 30,686 | | | 408,983 | | | 1,869,188 | | | 2,308,857 | |
| | Total loans | |
| | Total loans | |
| | Total loans | Total loans | 63,890 | | | 112,146 | | | 832,018 | | | 2,205,713 | | | 3,213,767 | |
| Assets transferred or pledged to securitization vehicles (principal) | Assets transferred or pledged to securitization vehicles (principal) | — | | | — | | | — | | | 6,916,406 | | | 6,916,406 | |
| Total financial assets - maturity | Total financial assets - maturity | 1,307,593 | | | 221,467 | | | 3,253,145 | | | 75,202,993 | | | 79,985,198 | |
Effect of utilizing reset dates (1) | Effect of utilizing reset dates (1) | 8,179,336 | | | 1,276,252 | | | (976,713) | | | (8,478,875) | | | |
| Total financial assets - interest rate sensitive | Total financial assets - interest rate sensitive | $ | 9,486,929 | | | $ | 1,497,719 | | | $ | 2,276,432 | | | $ | 66,724,118 | | | $ | 79,985,198 | |
| Financial liabilities | Financial liabilities | | | | | | | | | |
| Repurchase agreements | Repurchase agreements | $ | 49,978,329 | | | $ | 14,662,848 | | | $ | 184,062 | | | $ | — | | | $ | 64,825,239 | |
| Other secured financing | — | | | 30,420 | | | — | | | 887,456 | | | 917,876 | |
| Repurchase agreements | |
| Repurchase agreements | |
| | Debt issued by securitization vehicles (principal) | |
| Debt issued by securitization vehicles (principal) | |
| Debt issued by securitization vehicles (principal) | Debt issued by securitization vehicles (principal) | — | | | — | | | — | | | 5,649,190 | | | 5,649,190 | |
| Participations issued (principal) | Participations issued (principal) | — | | | — | | | — | | | 37,365 | | | 37,365 | |
| U.S. Treasury securities sold, not yet purchased | |
| Total financial liabilities - maturity | Total financial liabilities - maturity | 49,978,329 | | | 14,693,268 | | | 184,062 | | | 6,574,011 | | | 71,429,670 | |
Effect of utilizing reset dates (1)(2) | Effect of utilizing reset dates (1)(2) | (29,253,956) | | | (241,423) | | | 23,235,886 | | | 6,259,493 | | | |
| Total financial liabilities - interest rate sensitive | Total financial liabilities - interest rate sensitive | $ | 20,724,373 | | | $ | 14,451,845 | | | $ | 23,419,948 | | | $ | 12,833,504 | | | $ | 71,429,670 | |
| | Maturity gap | Maturity gap | $ | (48,670,736) | | | $ | (14,471,801) | | | $ | 3,069,083 | | | $ | 68,628,982 | | | $ | 8,555,528 | |
| Maturity gap | |
| Maturity gap | |
| | Cumulative maturity gap | |
| Cumulative maturity gap | |
| Cumulative maturity gap | Cumulative maturity gap | $ | (48,670,736) | | | $ | (63,142,537) | | | $ | (60,073,454) | | | $ | 8,555,528 | | | |
| | Interest rate sensitivity gap | Interest rate sensitivity gap | $ | (11,237,444) | | | $ | (12,954,126) | | | $ | (21,143,516) | | | $ | 53,890,614 | | | $ | 8,555,528 | |
| | Interest rate sensitivity gap | |
| | Interest rate sensitivity gap | |
| | Cumulative rate sensitivity gap | |
| Cumulative rate sensitivity gap | |
| Cumulative rate sensitivity gap | Cumulative rate sensitivity gap | $ | (11,237,444) | | | $ | (24,191,570) | | | $ | (45,335,086) | | | $ | 8,555,528 | | | |
| (1) Maturity gap utilizes stated maturities, or prepayment expectations for assets that exhibit prepayment characteristics, while interest rate sensitivity gap utilizes reset dates, if applicable. (2) Includes effect of interest rate swaps. | | (1) Maturity gap utilizes stated maturities, or prepayment expectations for assets that exhibit prepayment characteristics, while interest rate sensitivity gap utilizes reset dates, if applicable. (2) Includes effect of interest rate swaps. | |
| (1) Maturity gap utilizes stated maturities, or prepayment expectations for assets that exhibit prepayment characteristics, while interest rate sensitivity gap utilizes reset dates, if applicable. (2) Includes effect of interest rate swaps. | |
The methodologies we employ for evaluating interest rate risk include an analysis of our interest rate “gap,” measurement of the duration and convexity of our portfolio and sensitivities to interest rates and spreads.
Stress Testing
We utilize liquidity stress testing to ensure we have sufficient liquidity under a variety of scenarios and stresses. These stress tests assist with the management of our pool of liquid assets and influence our current and future funding plans. Our stress tests are modeled over both short term and longer time horizons. The stresses applied include market-wide and firm-specific stresses.
ANNALY CAPITAL MANAGEMENT, INC. AND SUBSIDIARIES
Item 7. Management’s Discussion and Analysis
Liquidity Management Policies
We utilize a comprehensive liquidity policy structure to inform our liquidity risk management practices including monitoring and measurement, along with well-defined key risk indicators. Both quantitative and qualitative targets are utilized to measure the ongoing stability and condition of the liquidity position, and include the level and composition of unencumbered assets, as well as both short-term and long-termthe sustainability of the funding composition under stress conditions.
We also monitor early warning metrics designed to measure the quality and depth of liquidity sources based upon both company-specific and market conditions. The metrics assist in assessing our liquidity conditions and are integrated into our escalation protocol.
ANNALY CAPITAL MANAGEMENT, INC. AND SUBSIDIARIES
Item 7. Management’s Discussion and Analysis
Investment/Market Risk Management
One of the primary risks we are subject to is investment/market risk. Changes in the level of interest rates can affect our net interest income, which is the difference between the income we earn on our interest earning assets and the interest expense incurred from interest bearing liabilities and derivatives. Changes in the level of interest rates and spreads can also affect the value of our securitiesassets and potential realization of gains or losses from the sale of these assets. We may utilize a variety of financial instruments, including interest rate swaps, swaptions, options, futures and other hedges, in order to limit the adverse effects of interest rates on our results. In the case of interest rate swaps, we utilize contracts linked to LIBORSOFR but may also enter into interest rate swaps where the floating leg is linked to the overnight index swap rate or another index, particularly in light of a potential transition away from LIBOR.index. In addition, we may use MAC interest rate swaps in which we may receive or make a payment at the time of entering such interest rate swap to compensate for the off-market nature of such interest rate swap. MAC interest rate swaps offer price transparency, flexibility and more efficient portfolio administration through compression which is the process of reducing the number of unique interest rate swap contracts and replacing them with fewer contracts containing market defined terms. Our portfolio and the value of our portfolio, including derivatives, may be adversely affected as a result of changing interest rates and spreads.
We simulate a wide variety of interest rate scenarios in evaluating our risk. Scenarios are run to capture our sensitivity to changes in interest rates, spreads and the shape of the yield curve. We also consider the assumptions affecting our analysis such as those related to prepayments. In addition to predefined interest rate scenarios, we utilize Value-at-Risk measures to estimate potential losses in the portfolio over various time horizons utilizing various confidence levels. The following tables estimate the potential changes in economic net interest income over a twelve month period and the immediate effect on our portfolio market value (inclusive of derivative instruments), should interest rates instantaneously increase or decrease by 25, 50 or 75 basis points, and the effect of portfolio market value if mortgage option-adjusted spreads instantaneously increase or decrease by 5, 15 or 25 basis points (assuming shocks are parallel and instantaneous). All changes to income and portfolio market value are measured as percentage changes from the projected net interest income and portfolio value at the base interest rate scenario. The net interest income simulations incorporate the interest expense effect of rate resets on liabilities and derivatives as well as the amortization expense and reinvestment of principal based on the prepayments on our securities, which varies based on the level of rates. The results assume no management actions in response to the rate or spread changes. The following table presents estimates at December 31, 2020.2023. Actual results could differ materially from these estimates.
| | | | | | | | | | | | | | | | | |
Change in Interest Rate (1) | Projected Percentage Change in Economic Net Interest Income (2) | | Estimated Percentage Change in Portfolio Value (3) | | Estimated Change as a % on NAV (3)(4) |
| -75 Basis points | (34.3%) | | (0.2)% | | (1.3%) |
| -50 Basis points | (22.7%) | | —% | | (0.2)% |
| -25 Basis points | (11.2%) | | 0.1% | | 0.7% |
| | | | | |
| +25 Basis points | 7.1% | | (0.1%) | | (0.5%) |
| +50 Basis points | 13.5% | | (0.2%) | | (1.3%) |
| +75 Basis points | 20.2% | | (0.4%) | | (2.7%) |
MBS Spread Shock (1) | Estimated Change in
Portfolio Market Value | | Estimated Change as a % on NAV (3)(4) | | |
| -25 Basis points | 1.5% | | 9.0% | | |
| -15 Basis points | 0.9% | | 5.4% | | |
| -5 Basis points | 0.3% | | 1.8% | | |
| | | | | |
| +5 Basis points | (0.3%) | | (1.8%) | | |
| +15 Basis points | (0.9%) | | (5.3%) | | |
| +25 Basis points | (1.5%) | | (8.9%) | | |
(1) Interest rate and MBS spread sensitivity are based on results from third party models in conjunction with inputs from our internal investment professionals. Actual results could differ materially from these estimates. (2) Scenarios include Residential Securities, commercial real estate investments, corporate debt, repurchase agreements, other secured financing and interest rate swaps. Economic net interest income includes the net interest component of interest rate swaps. (3) Scenarios include Residential Securities, residential mortgage loans, MSRs and derivative instruments. (4) NAV represents book value of equity. |
ANNALY CAPITAL MANAGEMENT, INC. AND SUBSIDIARIES
Item 7. Management’s Discussion and Analysis
| | | | | | | | | | | | | | | | | |
Change in Interest Rate (1) | Estimated Percentage Change in Portfolio Value (2) | | Estimated Change as a % on NAV (2)(3) | | Projected Percentage Change in Economic Net Interest Income (4) |
| -75 Basis points | (0.3%) | | (2.2%) | | 8.1% |
| -50 Basis points | (0.1)% | | (0.9)% | | 5.7% |
| -25 Basis points | —% | | (0.2)% | | 3.0% |
| | | | | |
| +25 Basis points | —% | | (0.4%) | | (3.2%) |
| +50 Basis points | (0.1%) | | (1.2%) | | (6.7%) |
| +75 Basis points | (0.3%) | | (2.4%) | | (10.5%) |
MBS Spread Shock (1) | Estimated Change in Portfolio Market Value (2) | | Estimated Change as a % on NAV (2)(3) | | |
| -25 Basis points | 1.3% | | 10.1% | | |
| -15 Basis points | 0.8% | | 6.0% | | |
| -5 Basis points | 0.3% | | 2.0% | | |
| | | | | |
| +5 Basis points | (0.3%) | | (2.0%) | | |
| +15 Basis points | (0.7%) | | (6.0%) | | |
| +25 Basis points | (1.2%) | | (9.9%) | | |
(1) Interest rate and MBS spread sensitivity are based on results from third party models in conjunction with inputs from our internal investment professionals. Actual results could differ materially from these estimates. (2) Scenarios include securities, residential mortgage loans, MSR and derivative instruments. (3) NAV represents book value of equity. (4) Scenarios include securities, residential mortgage loans, repurchase agreements, other secured financing and interest rate swaps. Economic net interest income includes the net interest component of interest rate swaps. |
Credit Risk Management
Key risk parameters have been established to specify our credit risk appetite. We seek to manage credit risk by making investments which conform withinto the firm’s specific investment policy parameters and optimize risk-return attributes.
While we do not expect to encounter credit risk in our Agency mortgage-backed securities, we face credit risk on the non-Agency mortgage-backed securities and CRT securities in our portfolio. In addition, we are also exposed to credit risk on
ANNALY CAPITAL MANAGEMENT, INC. AND SUBSIDIARIES
Item 7. Management’s Discussion and Analysis
residential mortgage loans and commercial real estate investments and corporate debt.investments. MSR values may also be impacted if overallthrough reduced servicing fees and higher costs to service the underlying mortgage loans increase due to borrower performance. WeGenerally, we are subject to risk of loss if an issuer or borrower fails to perform its contractual obligations. We have established policies and procedures for mitigating credit risk, including establishing and reviewing limits for credit exposure. We will originate or purchase commercial investmentsIn the case of residential mortgage loans and MSR, we may engage a third party to perform due diligence on a sample of loans that meet our comprehensive underwriting process and credit standards and are approved bywe believe sufficiently represents the appropriate committee.entire pool. Once a commercialan investment is made, our ongoing surveillance process includes regular reviews, analysis and oversight of investments by our investment personnel and appropriate committee. We review credit and other risks of loss associated with each investment. Our management monitors the overall portfolio risk and determines estimates of provision for loss. Additionally, ALCO has oversight of our credit risk exposure.
Our portfolio composition, based on balance sheet values, at December 31, 20202023 and 20192022 was as follows:
| | December 31, 2020 | | December 31, 2019 |
| December 31, 2023 | | | December 31, 2023 | | December 31, 2022 |
| Category | Category | | |
| Agency mortgage-backed securities | |
| Agency mortgage-backed securities | |
| Agency mortgage-backed securities | Agency mortgage-backed securities | 86.4 | % | | 89.5 | % | 75.9 | % | | 79.4 | % |
| Credit risk transfer securities | Credit risk transfer securities | 0.6 | % | | 0.4 | % | Credit risk transfer securities | 1.1 | % | | 1.3 | % |
| Non-agency mortgage-backed securities | Non-agency mortgage-backed securities | 1.1 | % | | 0.9 | % | Non-agency mortgage-backed securities | 2.4 | % | | 2.5 | % |
Residential mortgage loans(1) | Residential mortgage loans(1) | 4.2 | % | | 3.3 | % | Residential mortgage loans (1) | 17.9 | % | | 13.9 | % |
| Mortgage servicing rights | Mortgage servicing rights | 0.1 | % | | 0.3 | % | Mortgage servicing rights | 2.4 | % | | 2.2 | % |
Commercial real estate (1) (2) | 5.0 | % | | 3.9 | % |
| Corporate debt | 2.6 | % | | 1.7 | % |
(1) Includes assets transferred or pledged to securitization vehicles. (2) Net of unamortized origination fees. | | Commercial real estate (1) | |
Commercial real estate (1) | |
Commercial real estate (1) | | 0.3 | % | | 0.7 | % |
| (1) Includes assets transferred or pledged to securitization vehicles. | |
(1) Includes assets transferred or pledged to securitization vehicles. | |
(1) Includes assets transferred or pledged to securitization vehicles. | |
ANNALY CAPITAL MANAGEMENT, INC. AND SUBSIDIARIES
Item 7. Management’s Discussion and Analysis
Counterparty Risk Management
Our use of repurchase and derivative agreements and trading activities create exposure to counterparty risk relating to potential losses that could be recognized if the counterparties to these agreements fail to perform their obligations under the contracts. In the event of default by a counterparty, we could have difficulty obtaining our assets pledged as collateral. A significant portion of our investments are financed with repurchase agreements by pledging our Residential Securities and certain commercial real estate investments as collateral to the
ANNALY CAPITAL MANAGEMENT, INC. AND SUBSIDIARIES
Item 7. Management’s Discussion and Analysis
applicable lender. The collateral we pledge generally exceeds the amount of the borrowings under each agreement. If the counterparty to the repurchase agreement defaults on its obligations and we are not able to recover our pledged asset, we are at risk of losing the over-collateralization or haircut. The amount of this exposure is the difference between the amount loaned to us plus interest due to the counterparty and the fair value of the collateral pledged by us to the lender including accrued interest receivable on such collateral.
We also use interest rate swaps and other derivatives to manage interest rate risk. Under these agreements, we pledge securities and cash as collateral or settle variation margin payments as part of a margin arrangement.
If a counterparty were to default on its obligations, we would be exposed to a loss to a derivative counterparty to the extent that the amount of our securities or cash pledged exceeded the unrealized loss on the associated derivative and we were not able to recover the excess collateral. Additionally, we would be exposed to a loss to a derivative counterparty to the extent that our unrealized gains on derivative instruments exceeded the amount of the counterparty’s securities or cash pledged to us.
We monitor our exposure to counterparties across several dimensions including by type of arrangement, collateral type, counterparty type, ratings and geography. Additionally, ALCO has oversight of our counterparty exposure.
The following table summarizes our exposure to counterparties by geography at December 31, 2020:2023:
| | Number of Counterparties | | Secured Financing (1) | | Interest Rate Swaps at Fair Value | | Exposure - Secured Financing (2) | | Exposure - Interest Rate Swaps (2) |
| Number of Counterparties | | | Number of Counterparties | | Secured Financing (1) | | Interest Rate Swaps at Fair Value | | Exposure (2) |
| Geography | Geography | (dollars in thousands) | Geography | (dollars in thousands) |
| North America | North America | 24 | | | $ | 52,983,020 | | | $ | (361,964) | | | $ | 3,920,875 | | | $ | (1,620,846) | |
| Europe | Europe | 10 | | | 9,044,400 | | | (644,528) | | | 1,894,424 | | | (905,245) | |
| | Asia (non-Japan) | |
| Japan | Japan | 4 | | | 3,715,695 | | | — | | | 205,019 | | | — | |
| Total | Total | 38 | | | $ | 65,743,115 | | | $ | (1,006,492) | | | $ | 6,020,318 | | | $ | (2,526,091) | |
| (1) Includes repurchase agreements and other secured financing. | (2) Represents the amount of cash and/or securities pledged as collateral to each counterparty less the aggregate of repurchase agreement and other secured financing and unrealized loss on swaps for each counterparty. | (1) Includes repurchase agreements and other secured financing. (2) Represents the amount of cash and/or securities pledged as collateral to each counterparty less the aggregate of repurchase agreement and other secured financing and derivatives for each counterparty. | |
(1) Includes repurchase agreements and other secured financing. (2) Represents the amount of cash and/or securities pledged as collateral to each counterparty less the aggregate of repurchase agreement and other secured financing and derivatives for each counterparty. | |
(1) Includes repurchase agreements and other secured financing. (2) Represents the amount of cash and/or securities pledged as collateral to each counterparty less the aggregate of repurchase agreement and other secured financing and derivatives for each counterparty. | |
Operational Risk Management
We are subject to operational risk in each of our business and support functions. Operational risk may arise from internal or external sources including human error, fraud, systems issues, process change, vendors, business interruptions and other external events. Model risk considers potential errors with a model’s results due to uncertainty in model parameters and inappropriate methodologies used. The result of these risks may include financial loss and reputational damage. We manage operational risk through a variety of tools including processes, policies and procedures that cover topics such as business continuity, personal conduct, cybersecurity and vendor management. Other tools include Risk and Control Self Assessment (“RCSA”) testing, including disaster recovery recovery/testing; systems controls, including access controls; training, including phishing exercises and cybersecurity awareness training; and monitoring, which includes the use of key risk indicators. Our Operational Risk Management team conducts a disaster recovery exercise on an annual basis and periodically conducts other operational risk tabletop exercises. Employee-level lines of defense against operational risk include proper segregation of incompatible duties, activity-level internal controls over financial reporting, the empowerment of business units to identify and mitigate operational risk sources, testing by our internal audit staff, and our overall governance framework.
We have established a CybersecurityOperational Risk Management responsibilities are overseen by the ERC. The ERC is responsible for supporting the Operating Committee to help mitigate cybersecurity risks. The rolein the implementation, ongoing monitoring, and evaluation of the committeeeffectiveness of the enterprise-wide risk management framework. This oversight authority includes review of the strategies, processes, policies, and practices established by management to identify, assess, measure, and manage enterprise-wide risk.
Cybersecurity is to oversee cyberpart of our enterprise-wide risk management framework. Processes for assessing, identifying, and managing cybersecurity risks include cybersecurity risk assessments, monitor applicableuse of key risk indicators, reviewvendor cybersecurity risk management, employee training, procedures, overseeincluding phishing exercises and cybersecurity awareness training, penetration testing, evaluation of cybersecurity insurance and periodic engagements by our internal audit department, which determines whether our cybersecurity program and information security practices align with relevant parts of the National Institute of Standards and Technology (“NIST”) framework. We periodically engage penetration testing companies and law firms to assist in these processes. When we do so, we hire reputable companies, limit their access to only information necessary for the specific purpose and maintain security controls around confidential information, including personal information. We also maintain a Cybersecurity Incident Response Plan (“Response Plan”) with processes to identify, contain, mitigate and engage third partiesescalate cybersecurity incidents, utilizing cross-functional expertise and external resources as needed. We conduct tabletop exercises to conduct periodic penetration testing. Our cybersecurity risk assessment includes an evaluationtest our Response Plan and our reaction to various business disruption events, and the results of cyber risk relatedthese tabletop exercises are reported to sensitive data held by third parties on their systems. Thethe Cybersecurity Committee periodically reports to the ERC, and the Board via the BRC and the BAC. There is no assurance that these efforts will effectively mitigate cybersecurity risk and mitigation efforts are not an assurance that no cybersecurity incidents will occur. We currently maintain cybersecurity insurance, however, there is no assurance that the insurance policy will cover all cybersecurity breaches or that the policy will cover all losses.ERC.
ANNALY CAPITAL MANAGEMENT, INC. AND SUBSIDIARIES
Item 7. Management’s Discussion and Analysis
We also have processes in place to oversee and identify material risks from cybersecurity threats associated with our use of third party service providers, including mortgage loan servicers and sub-servicers, upon which we depend on to perform various business processes related to our operations. Our vendor management policy establishes procedures for engaging, onboarding and monitoring the performance of third party vendors. For mortgage loan servicers and sub-servicers, these procedures include assessing a vendor’s financial health as well as oversight of its compliance with applicable laws and regulations, cybersecurity and business continuity programs and security of personally identifiable information. We also have processes to evaluate and classify cybersecurity risk related to sensitive data held by key third party service providers on their systems.
The Cybersecurity Committee has primary responsibility for these processes to manage cybersecurity risks, under the oversight of the ERC. Daily monitoring of cybersecurity defenses is performed by the IT Infrastructure Team and any issues are escalated to the Cybersecurity Committee as needed. The Cybersecurity Committee regularly meets to discuss both routine oversight of cybersecurity processes, policies and procedures and management of any cyber-specific events, including escalation to the ERC, the executive leadership team and/or the Board as appropriate.
The Cybersecurity Committee includes representatives from Operational Risk Management, Information Technology, Legal, Mortgage Operations and Internal Control. Certain members of the Cybersecurity Committee have relevant qualifications such as extensive work experience implementing data security measures, developing cybersecurity policies and procedures, and assessing, managing and reporting cybersecurity risk. Members also participate in cybersecurity-related professional organizations that discuss industry threats, challenges and solutions to cybersecurity issues. Our Head of IT Infrastructure has completed the "Cybersecurity: Managing Risk in the Information Age" certificate program from Harvard University.
The Cybersecurity Committee regularly discusses cybersecurity risk management and best practices with the ERC and with the Audit and Risk Committees of our Board. The Audit and Risk Committees jointly oversee processes, practices and policies related to cybersecurity and receive joint and individual presentations from management and external experts on cyber and technology-related risks. Two members of our Board have completed the Carnegie Mellon/NACD Cyber-Risk Oversight Program and earned the CERT Certificate in Cybersecurity Oversight and one member of our Board has completed the NACD Master Class: Cyber-Risk Oversight Program.
To date, we have not detected any risks from cybersecurity threats that have materially affected us. However, even though we take steps to employ reasonable cybersecurity efforts, not every cybersecurity incident can be prevented or detected. We also may be held responsible for cybersecurity threats affecting our third party service providers, including mortgage sub-servicers. Therefore, while we believe there are currently no risks from any potential cybersecurity threat or cybersecurity incident that are reasonably likely to have a material effect on our business strategy, results of operations or financial condition, the likelihood or severity of such risks are difficult to predict. For further discussion, please see the risk factors titled "We are highly dependent on information systems and networks, many of which are operated by third parties, and any failure of these systems or networks could materially and adversely affect our business" and "Cyberattacks or other information security breaches could adversely affect our business, reputation and financial condition" in Part I, Item 1A. “Risk Factors” in this Annual Report on Form 10-K.
Compliance, Regulatory and Legal Risk Management
Our business is organized as a REIT, and we seek to continue to meet the requirements for taxation as a REIT. The determination that we are a REIT requires an analysis of various factual matters and circumstances. Accordingly, we closely monitor our REIT status within our risk management program. We also regularly assess our risk management in respect of our regulated and licensed subsidiaries, which include our registered broker-dealer subsidiary Arcola, and our subsidiary that is registered with the SEC as an investment adviser under the Investment Advisers Act.Act and our subsidiary that operates as a licensed mortgage aggregator and master servicer.
The financial services industry is highly regulated and receives significant attention from regulators, which may impact both our company as well asand our business strategy. Our investments in residential whole loans and MSR require us to comply with applicable state and federal laws and regulations and maintain appropriate governmental licenses, approvals and exemptions. We proactively monitor the potential impact regulation may have both directly and indirectly on us. We maintain a process to actively monitor both actual and potential legal action that may affect us. Our risk management framework is designed to identify, measure and monitor these risks under the oversight of the ERC.
We currently rely on the exemption from registration provided by Section 3(c)(5)(C) of the Investment Company Act, and we seek to continue to meet the requirements for this exemption from registration. The determination that we qualify for this exemption from registration depends on various factual matters and circumstances. Accordingly, in conjunction with our legal department, we closely monitor our compliance with Section 3(c)(5)(C) within our risk management program. The monitoringCompliance with Section 3(c)(5)(C) of this riskthe Investment Company Act is alsomonitored by the FRDC under the oversight of the ERC.
As a result of the Dodd-Frank Act, the U.S. Commodity Futures Trading Commission (“CFTC”) gained jurisdiction over the regulation of interest rate swaps. The CFTC has asserted that this causes the operators of mortgage real estate investment trusts that use swaps as part of their business model to fall within the statutory definition of Commodity Pool Operator (“CPO”), and, absent relief from the Division of Swap Dealer and Intermediary Oversight or the CFTC, to register as CPOs. On December 7, 2012, as a result of numerous requests for no-action relief from the CPO registration requirement for operators of mortgage real estate investment trusts, the Division of Swap Dealer and Intermediary Oversight of the CFTC issued no-action relief entitled “No-Action Relief from the Commodity Pool Operator Registration Requirement for Commodity Pool Operators of Certain Pooled Investment Vehicles Organized as Mortgage Real Estate Investment Trusts” that permits a CPO to receive relief by filing a claim to perfect the use of the relief. A claim submitted by a CPO will be effective upon filing, so long as the claim is materially complete. The conditions that must be met relate to initial margin and premiums requirements, net income derived annually from commodity interest positions that are not qualifying hedging transactions, marketing of interests in the mortgage real estate investment trust to the public, and identification of the entity as a mortgage real estate investment trust in its federal tax filings with the Internal Revenue Service. While we disagree with the CFTC’s position that mortgage REITs that use swaps as part of their business model fall within the statutory definition of a CPO, we have submitted a claim for the relief set forth in the no-action relief entitled “No-Action Relief from the Commodity Pool Operator Registration Requirement for Commodity Pool Operators of Certain Pooled Investment Vehicles Organized as Mortgage Real Estate Investment Trusts” and believe we meet the criteria for such relief set forth therein.
ANNALY CAPITAL MANAGEMENT, INC. AND SUBSIDIARIES
Item 7. Management’s Discussion and Analysis
Critical Accounting PoliciesEstimates
The preparation of our consolidated financial statement in accordance with generally accepted accounting principles in the United States requires us to make estimates, judgments and Estimates
assumptions that affect the reported amounts of assets, liabilities, revenues and expenses. Actual results may differ materially from these estimates and changes in assumptions could have a significant effect on the consolidated financial statements. Our critical accounting policies that require us to make significant judgments or estimates are described below. For more information on these critical accounting policies and other significant accounting policies, seerefer to the Note titled “Significant Accounting Policies” in the Notes to the Consolidated Financial Statements.Statements included in Item 15. “Exhibits, Financial Statement Schedules.”
Valuation of Financial Instruments
Residential Securities
Description: We carry residential securities at estimated fair value. There is an active market for our Agency mortgage-backed securities, CRT securities and non-Agency mortgage-backed securities.
Judgments and Uncertainties: Since we primarily invest in securities that can be valued using actively quoted prices for actively traded assets, there is a high degree of observable inputs and less subjectivity in measuring fair value. Internal fair values are determined using quoted prices from the TBA securities market, the Treasury curve and the underlying characteristics of the individual securities, which may include coupon, periodic and life caps, reset dates and the expected life of the security. While prepayment rates may be difficult to predict and require estimation and judgment in the valuation of Agency mortgage-backed securities, we use several third party models to validate prepayment speeds used in fair value measurements of residential securities. All internal fair values are compared to external pricing sources and/or dealer quotes to determine reasonableness. Additionally, securities used as collateral for repurchase agreements are priced daily by counterparties to ensure sufficient collateralization, providing additional verification of our internal pricing.
ANNALY CAPITAL MANAGEMENT, INC. AND SUBSIDIARIES
Item 7. Management’s Discussion and Analysis
Residential Mortgage Loans
Description: We elected to account for Residential Mortgage Loans at fair value. There is an active market for the residential whole loans in which we invest.
Judgments and Uncertainties: Since we primarily invest in residential loans that can be valued using actively quoted prices for similar assets, there are observable inputs in measuring fair value. Internal fair values are determined using quoted prices for similar market transactions, the swap curve and the underlying characteristics of the individual loans, which may include loan term, coupon, and reset dates. While prepayment rates may be difficult to predict and are a significant estimate requiring judgment in the valuation of residential whole loans, we validate prepayment speeds against those provided by independent pricing analytic providers specializing in residential mortgage loans. Internal fair values are generally compared to external pricing sources to determine reasonableness.
Sensitivity of Estimates to Change: Changes to model assumptions, including prepayment speeds may significantly impact the fair value estimate of residential mortgage loans as well as unrealized gains and losses and yield on these assets. Our valuations are most sensitive to changes in interest rate, which also impacts prepayment speeds. Refer to the interest rate sensitivity and interest rate shock analysis and discussions within this Item 7. for further information.
MSRs
Fair
MSR
Description: We elected to account for MSR at fair value. The market for MSR is considered less active and transparent compared to securities. As such fair value estimates for our investment in MSRsMSR are obtained from models, which use significant unobservable inputs in their valuations.
Judgments and Uncertainties: These valuations primarily utilize discounted cash flow models that incorporate unobservable market data inputs including prepayment rates, delinquency levels, costs to service and discount rates. Model valuations are then compared to valuations obtained from third-partythird party pricing providers. Management reviews the valuations received from third-party
ANNALY CAPITAL MANAGEMENT, INC. AND SUBSIDIARIES
Item 7. Management’s Discussion and Analysis
third party pricing providers and uses them as a point of comparison to modeled values. The valuation of MSRsMSR requires significant judgment by management and the third-partythird party pricing providers.
Commercial Real Estate Investments
The fair valueSensitivity of commercial mortgage-backed securities classified as available-for-sale is determined based upon quoted prices of similar assets in recent market transactions and requires the application of judgment dueEstimates to differencesChange: Changes in the underlying collateral. These securities must also be evaluated for impairment ifassumptions used to estimate the fair value of MSR impact the security is lower than its amortized cost. Determining whether there is an other-than-temporary impairment may require us to exercise significant judgmentcarrying value as well as the related unrealized gains and make estimates to determine expected cash flows incorporating assumptions such as changes in interest rates and loss expectations.losses recognized. For commercial real estate loans and preferred equity investments classified as held for investment, we apply significant judgment in evaluating the need for a loss reserve. Estimated net recoverable valuefurther discussion of the commercial real estate loans and preferred equity investments and other factors such as the fair value of any collateral, the amount and status of senior debt, the prospectssensitivity of the borrower andmodel inputs refer to the competitive landscape whereNote titled “Fair Value Measurements” in the borrower conducts business must be consideredNotes to the Consolidated Financial Statements included in determining the allowance for loan losses. For commercial real estate loans held for sale, significant judgment may need to be applied in determining the fair value of the loans and whether a valuation allowance is necessary. Factors that may need to be considered to determine the fair value of a loan held for sale include the borrower’s credit quality, liquidity and other market factors and the fair value of the underlying collateral.Item 15. “Exhibits, Financial Statement Schedules.”
Interest Rate Swaps
Description: We are required to account for derivative assets and liabilities at fair value, which may or may not be cleared through a derivative clearing organization. We value our cleared interest rate swaps using the prices provided by the derivatives clearing organization. We value uncleared derivatives using internal models with prices compared to counterparty marks.
Judgments and Uncertainties: We use the overnight indexed swap (“OIS”) curve, the SOFR curve, or SOFR forward rates as an input to value substantially all of our uncleared interest rate swaps. We believe using the OIS curve, which reflects the interest rate typically paid on cash collateral, enables us to most accurately determine the fair value of uncleared interest rate swaps. Consistent with market practice, we exchange collateral (also called margin) based on the fair values of our interest rate swaps. Through this margining process, we may be able to compare our recorded fair value with the fair value calculated by the counterparty or derivatives clearing organization, providing additional verification of our recorded fair value of the uncleared interest rate swaps. We
Sensitivity of Estimates to Change: Changes in the OIS curve will impact the carrying value of our cleared interest rate swaps usingswap assets and liabilities. Our valuations are most sensitive to changes in interest rate, which also impacts prepayment speeds. See the prices provided by the derivatives clearing organization.interest rate sensitivity and interest rate shock analysis and discussions within this Item 7. for further information.
Revenue Recognition
Description: Interest income from coupon payments is accrued based on the outstanding principal amounts of the Residential Securities and their contractual terms. Premiums and discounts associated with the purchase of the Residential Securities are amortized or accreted into interest income over the projected lives of the securities using the interest method. Gains or losses on sales of Residential Securities are recorded on trade date based on the specific identification method.
Judgments and Uncertainties: To aid in determining projected lives of the securities, we use third-partythird party model and market information to project prepayment speeds. Our prepayment speed projections incorporate underlying loan characteristics (i.e., coupon, term, original loan size, original loan-to-value ratio, etc.) and market data, including interest rate and home price index forecasts and expert judgment. Prepayment speeds vary according to the type of investment, conditions in the financial markets and other factors and cannot be predicted with any certainty.
Sensitivity of Estimates to Change: Changes to model assumptions, including interest rates and other market data, as well as periodic revisions to the model will cause changes in the results. Adjustments are made for actual prepayment activity as it relates to calculating the effective yield. Gains or losses on salesThe sensitivity of Residential Securities are recorded on trade date based onchanges in interest rates to our economic net interest income is included in the specific identification method.interest rate shock analysis and discussions within this Item 7 for further information.
ANNALY CAPITAL MANAGEMENT, INC. AND SUBSIDIARIES
Item 7. Management’s Discussion and Analysis
Consolidation of Variable Interest Entities
Description: We are required to determine if it is required to consolidate entities in which it holds a variable interest.
Judgments and Uncertainties: Determining whether an entity has a controlling financial interest in a VIE requires significant judgment related to assessing the purpose and design of the VIE and determination of the activities that most significantly impact its economic performance. We must also identify explicit and implicit variable interests in the entity and consider our involvement in both the design of the VIE and its ongoing activities. To determine whether consolidation of the VIE is required, we must apply judgment to assess whether we have the power to direct the most significant activities of the VIE and whether we have either the rights to receive benefits or the obligation to absorb losses that could be potentially significant to the VIE.
Use of Estimates
The use of GAAP requires management to make estimates and assumptions that affect the reported amounts of assets and liabilities and disclosure of contingent assets and liabilities at the date of the financial statements and the reported amounts of revenues and expenses during the reporting period. Actual results could differ materially from those estimates.
ANNALY CAPITAL MANAGEMENT, INC. AND SUBSIDIARIES
Item 7. Management’s Discussion and Analysis
Adjustable-Rate Loan / Security
A loan / security on which interest rates are adjusted at regular intervals according to predetermined criteria. The adjustable interest rate is tied to an objective, published interest rate index.
Agency
Refers to a federally chartered corporation, such as the Federal National Mortgage Association, or the Federal Home Loan Mortgage Corporation, or an agency of the U.S. Government, such as the Government National Mortgage Association.
Agency Mortgage-Backed Securities
Refers to residential mortgage-backed securities that are issued or guaranteed by an Agency.
Amortization
Liquidation of a debt through installment payments. Amortization also refers to the process of systematically reducing a recognized asset or liability (e.g., a purchase premium or discount for a debt security) with an offset to earnings.
Average GAAP Cost of Interest Bearing Liabilities and Average Economic Cost of Interest Bearing Liabilities
Average GAAP cost of interest bearing liabilities represents annualized interest expense divided by average interest bearing liabilities. Average interest bearing liabilities is a non-GAAP financial measure that reflects the average balances during the period. Average economic cost of interest bearing liabilities represents annualized economic interest expense divided by average interest bearing liabilities.
Average Life
On a mortgage-backed security, the average time to receipt of each dollar of principal, weighted by the amount of each principal prepayment, based on prepayment assumptions.
Average Yield on Interest Earnings Assets and Average Yield on Interest Earnings Assets (excluding PAA)
Average yield on interest earning assets represents annualized interest income divided by average interest earning assets. Average interest earning assets reflects the average amortized cost of our investments during the period. Average yield on interest earning assets (excluding PAA) is a non-GAAP financial measure that is calculated using annualized interest income (excluding PAA).
Basis Point (“bp” or “bps”)
One hundredth of one percent, used in expressing differences in interest rates. One basis point is 0.01% of
yield. For example, a bond’s yield that changed from 3.00% to 3.50% would be said to have moved 50 basis points.
Benchmark
A bond or an index referencing a basket of bonds whose terms are used for comparison with other bonds of similar maturity. The global financial market typically looks to U.S. Treasury securities as benchmarks.
Beneficial Owner
One who benefits from owning a security, even if the security’s title of ownership is in the name of a broker or bank.
B-Note
Subordinate mortgage notes and/or subordinate mortgage loan participations.
B-Piece
The most subordinate commercial mortgage-backed security bond class.
Board
Refers to the board of directors of Annaly.
Bond
The written evidence of debt, bearing a stated rate or stated rates of interest, or stating a formula for determining that rate, and maturing on a date certain, on which date and upon presentation a fixed sum of money plus interest (usually represented by interest coupons attached to the bond) is payable to the holder or owner. Bonds are long-term securities with an original maturity of greater than one year.
Book Value Per Share
Calculated by summing common stock, additional paid-in capital, accumulated other comprehensive income (loss) and accumulated deficit and dividing that number by the total common shares outstanding.
Broker
Generic name for a securities firm engaged in both buying and selling securities on behalf of customers or its own account.
Capital Buffer
Includes unencumbered financial assets which can be either sold or utilized as collateral to meet liquidity needs.
Calculated as total stockholders’ equity divided by total assets.
ANNALY CAPITAL MANAGEMENT, INC. AND SUBSIDIARIES
Item 7. Management’s Discussion and Analysis
Capital Ratio
Calculated as total stockholders’ equity divided by total assets inclusive of outstanding market value of TBA positions and exclusive of consolidated VIEs.
Carry
The amount an asset earns over its hedging and financing costs. A positive carry happens when the rate on the securities being financed is greater than the rate on the funds borrowed. A negative carry is when the rate on the funds borrowed is greater than the rate on the securities that are being financed.
CMBX
The CMBX index is a synthetic tradable index referencing a basket of 25 CMBS of a particular rating and vintage. The CMBX index allows investors to take a long position (referred to as selling protection) or short position (referred to as purchasing protection) on the respective basket of CMBS securities and is structured as a “pay-as-you-go” contract whereby the protection seller receives and the protection buyer pays a standardized running coupon on the contracted notional amount. Additionally, the protection seller is obligated to pay to the protection buyer the amount of principal losses and/or coupon shortfalls on the underlying CMBS securities as they occur.
Collateral
Securities, cash or property pledged by a borrower or party to a derivative contract to secure payment of a loan or derivative. If the borrower fails to repay the loan or defaults under the derivative contract, the secured party may take ownership of the collateral.
Collateralized Loan Obligation (“CLO”)
A securitization collateralized by loans and other debt instruments.
Collateralized Mortgage Obligation (“CMO”)
A multiclass bond backed by a pool of mortgage pass-through securities or mortgage loans.
Commodity Futures Trading Commission (“CFTC”)
An independent U.S. federal agency established by the Commodity Futures Trading Commission Act of 1974. The CFTC regulates the swaps, commodity futures and options markets. Its goals include the promotion of competitive and efficient futures markets and the protection of investors against manipulation, abusive trade practices and fraud.
Commercial Mortgage-Backed Security (“CMBS” or “Commercial Securities”)
Securities collateralized by a pool of mortgages on commercial real estate in which all principal and interest from the mortgages flow to certificate holders in a defined sequence or manner.
Constant Prepayment Rate (“CPR”)
The percentage of outstanding mortgage loan principal that prepays in one year, based on the annualization of the
Single Monthly Mortality, which reflects the outstanding mortgage loan principal that prepays in one month.
Convexity
A measure of the change in a security’s duration with respect to changes in interest rates. The more convex a security is, the more its duration will change with interest rate changes.
Core Earnings (excluding PAA) and Core Earnings (excluding PAA) Per Average Common Share
Core earnings (excluding PAA) is defined as the sum of (a) economic net interest income, (b) TBA dollar roll income and CMBX coupon income, (c) realized amortization of MSRs, (d) other income (loss) (excluding depreciation expense related to commercial real estate and amortization of intangibles, non-core income allocated to equity method investments and other non-core components of other income (loss)), (e) general and administrative expenses (excluding transaction expenses and non-recurring items), and (f) income taxes (excluding the income tax effect of non-core income (loss) items) and excludes (g) the premium amortization adjustment representing the cumulative impact on prior periods, but not the current period, of quarter-over-quarter changes in estimated long-term prepayment speeds related to our Agency mortgage-backed securities. Core earnings (excluding PAA) per average common share is calculated by dividing core earnings (excluding PAA) by average basic common shares for the period.
Corporate Debt
Non-government debt instruments issued by corporations. Long-term corporate debt can be issued as bonds or loans.
Counterparty
One of two entities in a transaction. For example, in the bond market a counterparty can be a state or local government, a broker-dealer or a corporation.
Coupon
The interest rate on a bond that is used to compute the amount of interest due on a periodic basis.
Credit and Counterparty Risk
Risk to earnings, capital or business, resulting from an obligor’s or counterparty’s failure to meet the terms of any contract or otherwise failure to perform as agreed. Credit and counterparty risk is present in lending, investing, funding and hedging activities.
Credit Derivatives
Derivative instruments that have one or more underlyings related to the credit risk of a specified entity (or group of entities) or an index that exposes the seller to potential loss from specified credit-risk related events. An example is credit derivatives referencing the commercial mortgage-backed securities index.
ANNALY CAPITAL MANAGEMENT, INC. AND SUBSIDIARIES
Item 7. Management’s Discussion and Analysis
Credit Risk Transfer (“CRT”) Securities
Credit Risk Transfer securities are risk sharing transactions issued by Fannie Mae and Freddie Mac and similarly structured transactions arranged by third party market participants. The securities issued in the CRT sector are designed to synthetically transfer mortgage credit risk from Fannie Mae, Freddie Mac and/or third parties to private investors.
Current Face
The current remaining monthly principal on a mortgage security. Current face is computed by multiplying the original face value of the security by the current principal balance factor.
Dealer
Person or organization that underwrites, trades and sells securities, e.g., a principal market-maker in securities.
Default Risk
Possibility that a bond issuer will fail to pay principal or interest when due.
ANNALY CAPITAL MANAGEMENT, INC. AND SUBSIDIARIES
Item 7. Management’s Discussion and Analysis
Derivative
A financial product that derives its value from the price, price fluctuations and price expectations of an underlying instrument, index or reference pool (e.g. futures contracts, options, interest rate swaps, interest rate swaptions and certain to-be-announced securities).
Discount Price
When the dollar price is below face value, it is said to be selling at a discount.
Duration
The weighted maturity of a fixed-income investment’s cash flows, used in the estimation of the price sensitivity of fixed-income securities for a given change in interest rates.
Earnings available for distribution (“EAD”) and Earnings available for distribution Per Average Common Share
Non-GAAP financial measure defined as the sum of (a) economic net interest income, (b) TBA dollar roll income and CMBX coupon income, (c) net servicing income less realized amortization of MSR, (d) other income (loss) (excluding depreciation expense related to commercial real estate and amortization of intangibles, non-EAD income allocated to equity method investments and other non-EAD components of other income (loss)), (e) general and administrative expenses (excluding transaction expenses and non-recurring items), and (f) income taxes (excluding the income tax effect of non-EAD income (loss) items) and excludes (g) the premium amortization adjustment representing the cumulative impact on prior periods, but not the current period, of quarter-over-quarter changes in estimated long-term prepayment speeds related to our Agency mortgage-backed securities. Earnings available for distribution per average common share is a non-GAAP financial measure calculated by dividing earnings available for distribution by average basic common shares for the period.
This metric was previously labeled Core Earnings (excluding PAA) and Core Earnings (excluding PAA) Per Average Common Share). The definition of EAD is identical to the definition of Core Earnings (excluding PAA) from prior reporting periods.
Economic Capital
A measure of the risk a firm is subject to. It is the amount of capital a firm needs as a buffer to protect against risk. It is a probabilistic measure of potential future losses at a given confidence level over a given time horizon.
Economic Capital Ratio
Non-GAAP financial measure that is calculated as total stockholders’ equity divided by total economic assets. Total economic assets includes the implied market value of TBA derivatives and are net of debt issued by securitization vehicles .
Economic Interest Expense
Non-GAAP financial measure that is comprised of GAAP interest expense and the net interest component of interest rate swaps.
Economic Leverage Ratio (Economic Debt-to-Equity Ratio)
CalculatedNon-GAAP financial measure that is calculated as the sum of recourse debt, cost basis of TBA and CMBX derivatives outstanding and net forward
purchases (sales) of investments divided by total equity. Recourse debt consists of repurchase agreements, and other secured financing (excluding certain non-recourse credit facilities). Certain credit facilities (included within other secured financing), debtand U.S. Treasury securities sold, not yet purchased. Debt issued by securitization vehicles and participations issued, and mortgages payable are non-recourse to us and are excluded from this measure.
Economic Net Interest Income
Non-GAAP financial measure that is composed of GAAP net interest income less Economic Interest Expense.
Economic Return
Refers to the Company’s change in book value plus dividends declared divided by the prior period’s book value.
Encumbered Assets
Assets on the company’s balance sheet which have been pledged as collateral against a liability.
EurodollarESG
A U.S. dollar deposit held in Europe or elsewhere outside the United States.Environmental, social, and governance.
Face Amount
The par value (i.e., principal or maturity value) of a security appearing on the face of the instrument.
Factor
A decimal value reflecting the proportion of the outstanding principal balance of a mortgage security, which changes over time, in relation to its original principal value.
Fannie Mae
Federal National Mortgage Association.
ANNALY CAPITAL MANAGEMENT, INC. AND SUBSIDIARIES
Item 7. Management’s Discussion and Analysis
Federal Deposit Insurance Corporation (“FDIC”)
An independent agency created by the U.S. Congress to maintain stability and public confidence in the nation’s financial system by insuring deposits, examining and supervising financial institutions for safety and soundness and consumer protection, and managing receiverships.
Federal Funds Rate
The interest rate charged by banks on overnight loans of their excess reserve funds to other banks.
Federal Home Loan Banks (“FHLB”)
U.S. Government-sponsored banks that generally provide reliable liquidity to member financial institutions to support housing finance and community investment.
Federal Housing Financing Agency (“FHFA”)
The FHFA is an independent regulatory agency that oversees vital components of the secondary mortgage market including Fannie Mae, Freddie Mac and the Federal Home Loan Banks.
ANNALY CAPITAL MANAGEMENT, INC. AND SUBSIDIARIES
Item 7. Management’s Discussion and Analysis
Financial Industry Regulatory Authority, Inc. (“FINRA”)
FINRA is a non-governmental organization tasked with regulating all business dealings conducted between dealers, brokers and all public investors.
Fixed-Rate Mortgage
A mortgage featuring level monthly payments, determined at the outset, which remain constant over the life of the mortgage.
Fixed Income Clearing Corporation (“FICC”)
The FICC is an agency that deals with the confirmation, settlement and delivery of fixed-income assets in the U.S. The agency ensures the systematic and efficient settlement of U.S. Government securities and mortgage-backed security transactions in the market.
Floating Rate Bond
A bond for which the interest rate is adjusted periodically according to a predetermined formula, usually linked to an index.
Floating Rate CMO
A CMO tranche which pays an adjustable rate of interest tied to a representative interest rate index such as the LIBOR,SOFR, the Constant Maturity Treasury or the Cost of Funds Index.
Freddie Mac
Federal Home Loan Mortgage Corporation.
Futures Contract
A legally binding agreement to buy or sell a commodity or financial instrument in a designated future month at a price agreed upon at the initiation of the contract by the buyer and seller. Futures contracts are standardized according to the quality, quantity, and delivery time and location for each commodity. A futures contract differs from an option in that an option gives one of the counterparties a right and the other an obligation to buy or sell, while a futures contract represents an obligation of both counterparties, one to deliver and the other to accept delivery. A futures contract is part of a class of financial instruments called derivatives.
GAAP
U.S. generally accepted accounting principles.
Ginnie Mae
Government National Mortgage Association.
Hedge
An investment made with the intention of minimizing the impact of adverse movements in interest rates or securities prices.
In-the-Money
Description for an option that has intrinsic value and can be sold or exercised for a profit; a call option is in-the-money when the strike price (execution price) is below the market price of the underlying security.
Interest Bearing Liabilities
Refers to repurchase agreements, debt issued by securitization vehicles, U.S. Treasury securities sold, not yet purchased, and credit facilities. Average interest bearing liabilities is based on daily balances.
Interest Earning Assets
Refers to Residential Securities, U.S. Treasury securities, reverse repurchase agreements, commercial real estate debt and preferred equity interests, residential mortgage loans and corporate debt. Average interest earning assets is based on daily balances.
Interest-Only (IO) Bond
The interest portion of mortgage, Treasury or bond payments, which is separated and sold individually from the principal portion of those same payments.
ANNALY CAPITAL MANAGEMENT, INC. AND SUBSIDIARIES
Item 7. Management’s Discussion and Analysis
Interests in MSR
Represents agreements to purchase all, or a component of, net servicing cash flows.
Interest Rate Risk
The risk that an investment’s value will change due to a change in the absolute level of interest rates, in the spread between two rates, in the shape of the yield curve or in any other interest rate relationship. As market interest rates rise, the value of current fixed income investment holdings declines. Diversifying, deleveraging and hedging techniques are utilized to mitigate this risk. Interest rate risk is a form of market risk.
Interest Rate Swap
A binding agreement between counterparties to exchange periodic interest payments on some predetermined dollar principal, which is called the notional principal amount. For example, one party will pay fixed and receive a variable rate.
Interest Rate Swaption
Options on interest rate swaps. The buyer of a swaption has the right to enter into an interest rate swap agreement at some specified date in the future. The swaption agreement will specify whether the buyer of the swaption will be a fixed-rate receiver or a fixed-rate payer.
ANNALY CAPITAL MANAGEMENT, INC. AND SUBSIDIARIES
Item 7. Management’s Discussion and Analysis
International Swaps and Derivatives Association (“ISDA”) Master Agreement
Standardized contract developed by ISDA used as an umbrella under which bilateral derivatives contracts are entered into.
Inverse IO Bond
An interest-only bond whose coupon is determined by a formula expressing an inverse relationship to a benchmark rate, such as LIBOR.SOFR. As the benchmark rate changes, the IO coupon adjusts in the opposite direction. When the benchmark rate is relatively low, the IO pays a relatively high coupon payment, and vice versa.
Investment/Market Risk
Risk to earnings, capital or business resulting in the decline in value of our assets caused from changes in market variables, such as interest rates, which affect the values of Residential Securities and other investment instruments.
Investment Advisers Act
Refers to the Investment Advisers Act of 1940, as amended.
Investment Company Act
Refers to the Investment Company Act of 1940, as amended.
Leverage
The use of borrowed money to increase investing power and economic returns.
Leverage Ratio (Debt-to-Equity(GAAP Leverage Ratio or Debt-to-Equity Ratio)
Calculated as total debt to total stockholders’ equity. For purposes of calculating this ratio total debt includes repurchase agreements, other secured financing, debt issued by securitization vehicles, participations issued, and mortgages payable. Certain credit facilities (included within other secured financing), debtU.S. Treasury securities sold, not yet purchased. Debt issued by securitization vehicles and participations issued and mortgages payable are non-recourse to us.
LIBOR (London Interbank Offered Rate)
TheA rate banks charge each other for short-term Eurodollar loans. LIBOR is frequentlypreviously used as the basea benchmark for resetting rates on floating-rate securities and the floating-rate legsfinancial transactions. All tenors of interest rate swaps.LIBOR relevant to us are either no longer published or are no longer representative.
Liquidity Risk
Risk to earnings, capital or business arising from our inability to meet our obligations when they come due without incurring unacceptable losses because of inability to liquidate assets or obtain adequate funding.
Long-Term CPR
Our projected prepayment speeds for certain Agency mortgage-backed securities using third-partythird party model and market information. Our prepayment speed projections incorporate underlying loan characteristics (e.g., coupon, term, original loan size, original loan-to-value ratio, etc.) and market data, including interest rate and home price index forecasts. Changes to model assumptions, including interest rates and other market data, as well as periodic revisions to the model will cause changes in the results.
Long-Term Debt
Debt which matures in more than one year.
Market Agreed Coupon (“MAC”) Interest Rate Swap
An interest rate swap contract structure with pre-defined, market agreed terms, developed by SIFMA and ISDA with the purpose of promoting liquidity and simplified administration.
Monetary Policy
Action taken by the Federal Open Market Committee of the Federal Reserve System to influence the money supply or interest rates.
ANNALY CAPITAL MANAGEMENT, INC. AND SUBSIDIARIES
Item 7. Management’s Discussion and Analysis
Mortgage-Backed Security (“MBS”)
A security representing a direct interest in a pool of mortgage loans. The pass-through issuer or servicer collects the payments on the loans in the pool and “passes through” the principal and interest to the security holders on a pro rata basis.
Mortgage Loan
A mortgage loan granted by a bank, thrift or other financial institution that is based solely on real estate as security and is not insured or guaranteed by a government agency.
Mortgage Servicing Rights (“MSRs”MSR”)
Contractual agreements constituting the right to service an existing mortgage where the holder receives the benefits and bears the costs and risks of servicing the mortgage.
NAV
Net asset value.
Net Interest Income
Represents interest income earned on our portfolio investments, less interest expense paid for borrowings.
Net Interest Margin and Net Interest Margin (excluding PAA)
Net interest margin represents our interest income less interest expense divided by average interest earning assets. Net interest margin (excluding PAA) is a non-GAAP financial measure that represents the sum of
ANNALY CAPITAL MANAGEMENT, INC. AND SUBSIDIARIES
Item 7. Management’s Discussion and Analysis
our interest income (excluding PAA) plus TBA dollar roll income and CMBX coupon income less interest expense and the net interest component of interest rate swaps divided by the sum of average interest earning assets plus average outstanding TBA contract and CMBX balances.
Net Interest Spread and Net Interest Spread (excluding PAA)
Net interest spread represents the average yield on interest earning assets less the average GAAP cost of interest bearing liabilities. Net interest spread (excluding PAA) is a non-GAAP financial measure that represents the average yield on interest earning assets (excluding PAA) less the average economic cost of interest bearing liabilities.
Non-Performing Loan (“NPL”)
A loan that is close to defaulting or is in default.
Notional Amount
A stated principal amount in a derivative contract on which the contract is based.
Operational Risk
Risk to earnings, capital, reputation or business arising from inadequate or failed internal processes or systems, human factors or external events.
Option Contract
A contract in which the buyer has the right, but not the obligation, to buy or sell an asset at a set price on or before a given date. Buyers of call options bet that a security will be worth more than the price set by the option (the strike price), plus the price they pay for the option itself. Buyers of put options bet that the security’s price will drop below the price set by the option. An option is part of a class of financial instruments called derivatives, which means these financial instruments derive their value from the worth of an underlying investment.
Original Face
The face value or original principal amount of a security on its issue date.
Out-of-the-Money
Description for an option that has no intrinsic value and would be worthless if it expired today; for a call option, this situation occurs when the strike price is higher than the market price of the underlying security; for a put option, this situation occurs when the strike price is less than the market price of the underlying security.
Overnight Index Swaps (“OIS”)
An interest rate swap in which a fixed rate is exchanged for an overnight floating rate.
Over-The-Counter (“OTC”) Market
A securities market that is conducted by dealers throughout the country through negotiation of price rather than through the use of an auction system as represented by a stock exchange.
Par
Price equal to the face amount of a security; 100%.
Par Amount
The principal amount of a bond or note due at maturity. Also known as par value.
Pass-Through Security
A securitization structure where a GSE or other entity “passes” the amount collected from the borrowers every month to the investor, after deducting fees and expenses.
ANNALY CAPITAL MANAGEMENT, INC. AND SUBSIDIARIES
Item 7. Management’s Discussion and Analysis
Pool
A collection of mortgage loans assembled by an originator or master servicer as the basis for a security. In the case of Ginnie Mae, Fannie Mae, or Freddie Mac mortgage pass-through securities, pools are identified by a number assigned by the issuing agency.
Premium
The amount by which the price of a security exceeds its principal amount. When the dollar price of a bond is above its face value, it is said to be selling at a premium.
Premium Amortization Adjustment (“PAA”)
The cumulative impact on prior periods, but not the current period, of quarter-over-quarter changes in estimated long-term prepayment speeds related to our Agency mortgage-backed securities.
Prepayment
The unscheduled partial or complete payment of the principal amount outstanding on a mortgage loan or other debt before it is due.
Prepayment Risk
The risk that falling interest rates will lead to increased prepayments of mortgage or other loans, forcing the investor to reinvest at lower prevailing rates.
Prepayment Speed
The estimated rate at which mortgage borrowers will pay off the mortgages that underlie an MBS.
Primary Market
Market for offers or sales of new bonds by the issuer.
Prime Rate
The indicative interest rate on loans that banks quote to their best commercial customers.
ANNALY CAPITAL MANAGEMENT, INC. AND SUBSIDIARIES
Item 7. Management’s Discussion and Analysis
Principal and Interest
The term used to refer to regularly scheduled payments or prepayments of principal and payments of interest on a mortgage or other security.
Rate Reset
The adjustment of the interest rate on a floating-rate security according to a prescribed formula.
Real Estate Investment Trust (“REIT”)
A special purpose investment vehicle that provides investors with the ability to participate directly in the ownership or financing of real-estate related assets by pooling their capital to purchase and manage mortgage loans and/or income property.
Recourse Debt
Debt on which the economic borrower is obligated to repay the entire balance regardless of the value of the pledged collateral. By contrast, the economic borrower’s obligation to repay non-recourse debt is limited to the value of the pledged collateral. Recourse debt consists of repurchase agreements, and other secured financing (excluding certain non-recourse credit facilities). Certain credit facilities (included within other secured financing), debtand U.S. Treasury securities sold, not yet purchased. Debt issued by securitization vehicles and participations issued and mortgages payable are non-recourse to us and are excluded from this measure.
Reinvestment Risk
The risk that interest income or principal repayments will have to be reinvested at lower rates in a declining rate environment.
Re-Performing Loan (“RPL”)
A type of loan in which payments were previously delinquent by at least 90 days but have resumed.
Repurchase Agreement
The sale of securities to investors with the agreement to buy them back at a higher price after a specified time period; a form of short-term borrowing. For the party on the other end of the transaction (buying the security and agreeing to sell in the future) it is a reverse repurchase agreement.
Residential Credit Securities
Refers to CRT securities and non-Agency mortgage-backed securities.
Residential Securities
Refers to Agency mortgage-backed securities, CRT securities and non-Agency mortgage-backed securities.
Residual
In securitizations, the residual is the tranche that collects any cash flow from the collateral that remains after obligations to the other tranches have been met.
Return on Average Equity
Calculated by taking earnings divided by average stockholders’ equity.
Reverse Repurchase Agreement
Refer to Repurchase Agreement. The buyer of securities effectively provides a collateralized loan to the seller.
Risk Appetite Statement
Defines the types and levels of risk we are willing to take in order to achieve our business objectives, and reflects our risk management philosophy.
ANNALY CAPITAL MANAGEMENT, INC. AND SUBSIDIARIES
Item 7. Management’s Discussion and Analysis
Secondary Market
Ongoing market for bonds previously offered or sold in the primary market.
Secured Overnight Financing Rate (“SOFR”)
Broad measure of the cost of borrowing cash overnight collateralized by Treasury securities and was chosen by the Alternative Reference Rate Committee as the preferred benchmark rate to replace dollar LIBOR in coming years.LIBOR.
Settlement Date
The date securities must be delivered and paid for to complete a transaction.
Short-Term Debt
Generally, debt which matures in one year or less. However, certain securities that mature in up to three years may be considered short-term debt.
Spread
When buying or selling a bond through a brokerage firm, investors will be charged a commission or spread, which is the difference between the market price and cost of purchase, and sometimes a service fee. Spreads differ based on several factors including liquidity.
Target Assets
Includes Agency mortgage-backed securities, to-be-announced forward contracts, CRT securities, MSRs,MSR, non-Agency mortgage-backed securities, residential mortgage loans, and commercial real estate investments,investments.
Tangible Economic Return
Refers to the Company’s change in tangible book value (calculated by summing common stock, additional paid-in capital, accumulated other comprehensive income (loss) and corporate debt.accumulated deficit less intangible assets) plus dividends declared divided by the prior period’s tangible book value.
Taxable REIT Subsidiary (“TRS”)
An entity that is owned directly or indirectly by a REIT and has jointly elected with the REIT to be treated as a TRS for tax purposes. Annaly and certain of its direct and indirect subsidiaries have made separate joint elections to treat these subsidiaries as TRSs.
Term SOFR
The term secured overnight financing rate published by the Chicago Mercantile Exchange, which is used as a benchmark for financial transactions.
ANNALY CAPITAL MANAGEMENT, INC. AND SUBSIDIARIES
Item 7. Management’s Discussion and Analysis
To-Be-Announced (“TBA”) Securities (“TBAs”)
A contract for the purchase or sale of a mortgage-backed security to be delivered at a predetermined price, face amount, issuer, coupon and stated maturity on an agreed-upon future date but does not include a specified pool number and number of pools.
TBA Dollar Roll Income
TBA dollar roll income is defined as the difference in price between two TBA contracts with the same terms but different settlement dates. The TBA contract settling in the later month typically prices at a discount to the earlier month contract with the difference in price commonly referred to as the “drop”. TBA dollar roll income represents the equivalent of interest income on the underlying security less an implied cost of financing.
Total Return
Investment performance measure over a stated time period which includes coupon interest, interest on interest, and any realized and unrealized gains or losses.
Total Return Swap
A derivative instrument where one party makes payments at a predetermined rate (either fixed or variable) while receiving a return on a specific asset (generally an equity index, loan or bond) held by the counterparty.
Unencumbered Assets
Assets on our balance sheet which have not been pledged as collateral against an existing liability.
U.S. Government-Sponsored Enterprise (“GSE”) Obligations
Obligations of Agencies originally established or chartered by the U.S. government to serve public purposes as specified by the U.S. Congress, such as Fannie Mae and Freddie Mac; these obligations are not explicitly guaranteed as to the timely payment of principal and interest by the full faith and credit of the U.S. government.
Value-at-Risk (“VaR”)
A statistical technique which measures the potential loss in value of an asset or portfolio over a defined period for a given confidence interval.
Variable Interest Entity (“VIE”)
An entity in which equity investors (i) do not have the characteristics of a controlling financial interest, and/or (ii) do not have sufficient equity at risk for the entity to finance its activities without additional subordinated financial support from other parties.
ANNALY CAPITAL MANAGEMENT, INC. AND SUBSIDIARIES
Item 7. Management’s Discussion and Analysis
Variation Margin
Cash or securities provided by a party to collateralize its obligations under a transaction as a result of a change in value of such transaction since the trade was executed or the last time collateral was provided.
Volatility
A statistical measure of the variance of price or yield over time. Volatility is low if the price does not change very much over a short period of time, and high if there is a greater change.
Voting Interest Entity (“VOE”)
An entity that has sufficient equity to finance its activities without additional subordinated financial support from other parties and in which equity investors have a controlling financial interest.
Warehouse Lending
A line of credit extended to a loan originator to fund mortgages extended by the loan originators to property purchasers. The loan typically lasts from the time the mortgage is originated to when the mortgage is sold into the secondary market, whether directly or through a securitization. Warehouse lending can provide liquidity to the loan origination market.
Weighted Average Coupon
The weighted average interest rate of the underlying mortgage loans or pools that serve as collateral for a security, weighted by the size of the principal loan balances.
Weighted Average Life (“WAL”)
The assumed weighted average amount of time that will elapse from the date of a security’s issuance until each dollar of principal is repaid to the investor. The WAL will change as the security ages and depending on the actual realized rate at which principal, scheduled and unscheduled, is paid on the loans underlying the MBS.
Yield-to-Maturity
The expected rate of return of a bond if it is held to its maturity date; calculated by taking into account the current market price, stated redemption value, coupon payments and time to maturity and assuming all coupons are reinvested at the same rate; equivalent to the internal rate of return.
ANNALY CAPITAL MANAGEMENT, INC. AND SUBSIDIARIES
| | |
| ITEM 7A. QUANTITATIVE AND QUALITATIVE DISCLOSURES ABOUT MARKET RISK |
|
Quantitative and qualitative disclosures about market risk are contained within the section titled “Risk Management” of Item 7. “Management’s Discussion and Analysis of Financial Condition and Results of Operations.”
| | |
| ITEM 8. FINANCIAL STATEMENTS AND SUPPLEMENTARY DATA |
|
Our financial statements and the related notes, together with the Report of Independent Registered Public Accounting Firm thereon, are set forth beginning on page F-1 of this Form 10-K.
| | |
| ITEM 9. CHANGES IN AND DISAGREEMENTS WITH ACCOUNTANTS ON ACCOUNTING AND FINANCIAL DISCLOSURE |
|
None.
| | |
| ITEM 9A. CONTROLS AND PROCEDURES |
|
Our management, including our Chief Executive Officer (the CEO) and Chief Financial Officer (the CFO), reviewed and evaluated the effectiveness of the design and operation of our disclosure controls and procedures (as defined in Rule 13a-15(e) and 15d-15(e) of the Securities Exchange Act) as of the end of the period covered by this report. Based on that review and evaluation, the CEO and CFO have concluded that our current disclosure controls and procedures, as designed, (1) were effective in ensuring that information required to be disclosed by Annaly in reports it files or submits under the Securities Exchange Act is accumulated and communicated to our management, including our CEO and CFO, as appropriate to allow timely decisions regarding required disclosure and (2) were effective in ensuring that information required to be disclosed by Annaly in reports it files or submits under the Securities Exchange Act is recorded, processed, summarized and reported within the time periods specified by the SEC’s rules and forms.
There have been no changes in our internal controls over financial reporting that occurred during the three months ended December 31, 20202023 that have materially affected, or are reasonably likely to materially affect our internal control over financial reporting.
Management’s Annual Report On Internal Control Over Financial Reporting
Management of Annaly is responsible for establishing and maintaining adequate internal control over financial reporting. Internal control over financial reporting is defined in Rules 13a-15(f) or 15d-15(f) under the Securities Exchange Act. Our internal control over financial reporting is a process designed by, or under the supervision of, Annaly’s CEO and CFO and effected by the Annaly’s board of directors, management and other personnel to provide reasonable assurance regarding the reliability of financial reporting and the preparation of financial statements for external purposes in accordance with generally accepted accounting principles and includes those policies and procedures that:
•pertain to the maintenance of records that in reasonable detail accurately and fairly reflect the transactions and dispositions of the assets of Annaly;
•provide reasonable assurance that transactions are recorded as necessary to permit preparation of financial statements in accordance with generally accepted accounting principles, and that receipts and
expenditures of Annaly are being made only in
accordance with authorizations of management and directors of Annaly; and
•provide reasonable assurance regarding prevention or timely detection of unauthorized acquisition, use or disposition of Annaly’s assets that could have a material effect on the consolidated financial statements.
Because of its inherent limitations, internal control over financial reporting may not prevent or detect misstatements. As a result, even systems determined to be effective can provide only reasonable assurance regarding the preparation and presentation of financial statements. Moreover, projections of any evaluation of effectiveness to future periods are subject to the
ANNALY CAPITAL MANAGEMENT, INC. AND SUBSIDIARIES
risks that controls may become inadequate because of changes in conditions or that the degree of compliance with the policies or procedures may deteriorate.
ANNALY CAPITAL MANAGEMENT, INC. AND SUBSIDIARIES
Annaly’s management assessed the effectiveness of the Company’s internal control over financial reporting as of December 31, 2020.2023. In making this assessment, the Company’s management used criteria set forth by the Committee of Sponsoring Organizations of the Treadway Commission’s (“COSO”) Internal Control-Integrated Framework (2013).
Based on the Annaly’s management’s evaluation under the framework in Internal Control—Integrated Framework (2013), Annaly’s management concluded that its internal control over financial reporting was effective as of December 31, 2020.2023. Annaly’s independent registered public accounting firm, Ernst & Young LLP, has issued an attestation report on Annaly’s internal control over financial reporting, which is included herein.
ANNALY CAPITAL MANAGEMENT, INC. AND SUBSIDIARIES
Report of Independent Registered Public Accounting Firm
To the Stockholders and the Board of Directors of Annaly Capital Management, Inc. and Subsidiaries
Opinion on Internal Control Over Financial Reporting
We have audited Annaly Capital Management, Inc. and Subsidiaries’subsidiaries’ internal control over financial reporting as of December 31, 2020,2023, based on criteria established in Internal Control-Integrated Framework issued by the Committee of Sponsoring Organizations of the Treadway Commission (2013 framework) (the COSO criteria). In our opinion, Annaly Capital Management, Inc. and Subsidiariessubsidiaries (the Company) maintained, in all material respects, effective internal control over financial reporting as of December 31, 2020,2023, based on the COSO criteria.
We also have audited, in accordance with the standards of the Public Company Accounting Oversight Board (United States) (PCAOB), the consolidated statements of financial condition of the Company as of December 31, 20202023 and 2019,2022, the related consolidated statements of comprehensive income (loss), stockholders’ equity and cash flows for each of the three years in the period ended December 31, 2020,2023, and the related notes and financial statement schedules III and IV as of December 31, 2020, and our report dated February 18, 202115, 2024 expressed an unqualified opinion thereon.
Basis for Opinion
The Company’s management is responsible for maintaining effective internal control over financial reporting and for its assessment of the effectiveness of internal control over financial reporting included in the accompanying Management’s Annual Report on Internal Control Over Financial Reporting. Our responsibility is to express an opinion on the Company’s internal control over financial reporting based on our audit. We are a public accounting firm registered with the PCAOB and are required to be independent with respect to the Company in accordance with the U.S. federal securities laws and the applicable rules and regulations of the Securities and Exchange Commission and the PCAOB.
We conducted our audit in accordance with the standards of the PCAOB. Those standards require that we plan and perform the audit to obtain reasonable assurance about whether effective internal control over financial reporting was maintained in all material respects.
Our audit included obtaining an understanding of internal control over financial reporting, assessing the risk that a material weakness exists, testing and evaluating the design and operating effectiveness of internal control based on the assessed risk, and performing such other procedures as we considered necessary in the circumstances. We believe that our audit provides a reasonable basis for our opinion.
Definition and Limitations of Internal Control Over Financial Reporting
A company’s internal control over financial reporting is a process designed to provide reasonable assurance regarding the reliability of financial reporting and the preparation of financial statements for external purposes in accordance with generally accepted accounting principles. A company’s internal control over financial reporting includes those policies and procedures that (1) pertain to the maintenance of records that, in reasonable detail, accurately and fairly reflect the transactions and dispositions of the assets of the company; (2) provide reasonable assurance that transactions are recorded as necessary to permit preparation of financial statements in accordance with generally accepted accounting principles, and that receipts and expenditures of the company are being made only in accordance with authorizations of management and directors of the company; and (3) provide reasonable assurance regarding prevention or timely detection of unauthorized acquisition, use, or disposition of the company’s assets that could have a material effect on the financial statements.
Because of its inherent limitations, internal control over financial reporting may not prevent or detect misstatements. Also, projections of any evaluation of effectiveness to future periods are subject to the risk that controls may become inadequate because of changes in conditions, or that the degree of compliance with the policies or procedures may deteriorate.
/s/ Ernst & Young LLP
New York, NY
February 18, 202115, 2024
ANNALY CAPITAL MANAGEMENT, INC. AND SUBSIDIARIES
| | |
| ITEM 9B. OTHER INFORMATION |
|
None.During the quarter ended December 31, 2023, no director or officer of the Company adopted, modified or terminated any Rule 10b5-1 trading arrangement or non-Rule 10b5-1 trading arrangement, each as defined in Item 408 of Regulation S-K.
| | |
| ITEM 9C. DISCLOSURE REGARDING FOREIGN JURISDICTIONS THAT PREVENT INSPECTIONS |
|
Not applicable.
ANNALY CAPITAL MANAGEMENT, INC. AND SUBSIDIARIES
PART III
| | |
| ITEM 10. DIRECTORS, EXECUTIVE OFFICERS AND CORPORATE GOVERNANCE |
|
The information required by Item 10 as to our directors is incorporated herein by reference to the proxy statement to be filed with the SEC within 120 days after December 31, 2020.2023. The information regarding our executive officers required by Item 10 appears in Part I of this Form 10-K. The information required by Item 10 as to our compliance with Section 16(a) of the Securities Exchange Act of 1934 is incorporated by reference to the proxy statement to be filed with the SEC within 120 days after December 31, 2020.2023.
We have adopted a Code of Business Conduct and Ethics within the meaning of Item 406(b) of Regulation S-K. This Code of Business Conduct and Ethics applies to our principal executive officer, principal financial officer and principal accounting officer. This Code of Business Conduct and Ethics is publicly available on our website at www.annaly.com. We intend to satisfy the disclosure requirements regarding amendments to, or waivers from, certain provisions of this Code of Business Conduct and Ethics by posting on our website.
We have adopted an Insider Trading Policy within the meaning of Item 408(b) of Regulation S-K, which prohibits our directors, officers and employees, as well as those of our subsidiaries, from buying or selling our securities on the basis of material nonpublic information and prohibits communicating material nonpublic information about our company to others. Our Insider Trading Policy prohibits our directors, officers and employees from (1) holding our stock in a margin account as eligible collateral, or otherwise pledging our stock as collateral for a loan, or (2) engaging in any hedging transactions with respect to our equity securities held by them.
The information regarding certain matters pertaining to our corporate governance required by ItemItems 407(c)(3), (d)(4) and (d)(5) of Regulation S-K is incorporated by reference to the Proxy Statement to be filed with the SEC within 120 days after December 31, 2020.2023.
| | |
| ITEM 11. EXECUTIVE COMPENSATION |
|
The information required by Item 11 is incorporated herein by reference to the proxy statement to be filed with the SEC within 120 days after December 31, 2020.2023.
| | |
| ITEM 12. SECURITY OWNERSHIP OF CERTAIN BENEFICIAL OWNERS AND MANAGEMENT AND RELATED STOCKHOLDER MATTERS |
|
Equity Compensation Plan Information
On May 20, 2020, at our 2020 Annual Meeting of Stockholders, our stockholders approved the 2020 Equity Incentive Plan. The 2020 Equity Incentive Plan authorizes us to grant options, stock appreciation rights, dividend equivalent rights, or other share-based awards, including restricted shares up to an aggregate of 125,000,00031,250,000 shares, subject to adjustments for any awards that were outstanding under our 2010 Equity Incentive Plan (the “Prior Incentive Plan,” together with the 2020 Equity Incentive Plan, the “Incentive Plans”) on the effective date of the 2020 Equity Incentive Plan and subsequently expire, terminate, or are surrendered or forfeited.
Since the adoption of the 2020 Equity Incentive Plan, no further awards will behave been made under the Prior Incentive Plan, although existing awards will remainremained effective.
The following table provides information as of December 31, 20202023 concerning shares of our common stock authorized for issuance under the Incentive Plans.
| | | | | | | | | | | | | | | | | |
| | (a) | | (b) | | (c) |
| Plan Category | Number of securities to be issued upon exercise of outstanding options, warrants and rights | | Weighted-average exercise price of outstanding options, warrants and rights | | Number of securities remaining available for future issuance under the Incentive Plans (excluding securities in column ‘a’) |
| Equity compensation plans approved by security holders | — | | | $ | — | | | 124,798,98628,654,814 | |
| Equity compensation plans not approved by security holders | — | | | — | | | — | |
| Total | — | | | $ | — | | | 124,798,98628,654,814 | |
| | | | | |
Information with respect to security ownership of certain beneficial owners and management is incorporated herein by reference to the proxy statement to be filed with the SEC within 120 days after December 31, 2020.2023.
ANNALY CAPITAL MANAGEMENT, INC. AND SUBSIDIARIES
| | |
| ITEM 13. CERTAIN RELATIONSHIPS AND RELATED TRANSACTIONS, AND DIRECTOR INDEPENDENCE |
|
The information required by Item 13 is incorporated herein by reference to the proxy statement to be filed with the SEC within 120 days after December 31, 2020.2023.
| | |
| ITEM 14. PRINCIPAL ACCOUNTING FEES AND SERVICES |
|
The information required by Item 14 is incorporated herein by reference to the proxy statement to be filed with the SEC within 120 days after December 31, 2020.2023.
ANNALY CAPITAL MANAGEMENT, INC. AND SUBSIDIARIES
PART IV
| | |
| ITEM 15. EXHIBITS, FINANCIAL STATEMENT SCHEDULES |
|
(a) Documents filed as part of this report:
1. Financial Statements. See Index to Financial Statements below.
2. Schedules to Financial Statements. See Index to Financial Statements below
All financial istatementstatement schedules not included have been omitted because they are either inapplicable or the information required is provided in our Financial Statements and Notes thereto.
3. Exhibits. See Exhibit Index below.
EXHIBIT INDEX
| | | | | |
| Exhibit Number | Exhibit Description |
| | |
| |
| |
| |
| |
| |
| |
| |
| |
| |
| |
| |
| |
| |
| |
| |
| |
| |
ANNALY CAPITAL MANAGEMENT, INC. AND SUBSIDIARIES
ANNALY CAPITAL MANAGEMENT, INC. AND SUBSIDIARIES
| | | | | |
| Articles Supplementary reclassifying and designating (1) 7,412,500 authorized but unissued shares of the Registrant’s preferred stock, $0.01 par value per share, without designation as to series or class, as shares of undesignated Common Stock; (2) 650,000 authorized but unissued shares of the Registrant’s 7.625% Series C Cumulative Redeemable Preferred Stock, $0.01 par value per share, as shares of undesignated Common Stock; and (3) 3,400,000 authorized but unissued shares of the Registrant’s 6.95% Series F Fixed-to-Floating Rate Cumulative Redeemable Preferred Stock, $0.01 par value per share, as shares of undesignated Common Stock. (incorporated by reference to Exhibit 3.15 of the Registrant’s Quarterly Report on Form 10-Q filed November 3, 2017). |
| |
| Articles Supplementary reclassifying and designating (i) 11,500,000 authorized but unissued shares of the Registrant’s preferred stock, $0.01 par value per share, without designation as to series or class, as shares of Registrant’s undesignated common stock and (ii) 5,000,000 authorized but unissued shares of Registrant’s 7.625% Series C Cumulative Redeemable Preferred Stock, $0.01 par value per share, as shares of Registrant’s undesignated common stock (incorporated by reference to Exhibit 3.1 to the Registrant’s Quarterly Report on Form 10-Q filed August 3, 2018). |
|
|
| |
| |
| |
| |
| |
| |
| |
| |
| |
| |
| |
| |
| |
| |
| |
ANNALY CAPITAL MANAGEMENT, INC. AND SUBSIDIARIES
ANNALY CAPITAL MANAGEMENT, INC. AND SUBSIDIARIES
| | | | | |
| |
| |
| |
| |
| |
| |
| Internalization Agreement, dated February 12, 2020, by and among the Registrant, Annaly Management Company LLL, AMCO Acquisition LLC, AMCO Holding Management Company LLC, the Persons named on Schedule 1 thereto, AMCO OpCo Holding Company LLC, AMCO LP Holding Company LP and AMCO Manager Holdings LLC (incorporated by reference to Exhibit 10.1 to the Registrant’s Current Report on Form 8-K filed February 12, 2020). |
| |
| |
| |
| |
| |
| |
| |
| |
| |
| |
| |
| |
| |
| |
| |
| |
| |
| |
| |
ANNALY CAPITAL MANAGEMENT, INC. AND SUBSIDIARIES
| | | | | |
| |
| |
| 101.INS XBRL | The instance document does not appear in the interactive data file because its Extensible Business Reporting Language (XBRL) tags are embedded within the Inline XBRL document. The following documents are formatted in Inline XBRL: (i) Consolidated Statements of Financial Condition at December 31, 20202023 and 2019;2022; (ii) Consolidated Statements of Comprehensive Income (Loss) for the years ended December 31, 2020, 20192023, 2022 and 2018;2021; (iii) Consolidated Statements of Stockholders’ Equity for the years ended December 31, 2020, 20192023, 2022 and 2018;2021; (iv) Consolidated Statements of Cash Flows for the years ended December 31, 2020, 20192023, 2022 and 2018;2021; and (v) Notes to Consolidated Financial Statements. |
| 101.SCH XBRL | Taxonomy Extension Schema Document † |
| 101.CAL XBRL | Taxonomy Extension Calculation Linkbase Document † |
| 101.DEF XBRL | Additional Taxonomy Extension Definition Linkbase Document Created† |
ANNALY CAPITAL MANAGEMENT, INC. AND SUBSIDIARIES
| | | | | |
| 101.LAB XBRL | Taxonomy Extension Label Linkbase Document † |
| 101.PRE XBRL | Taxonomy Extension Presentation Linkbase Document † |
| 104 | The cover page for the Registrant’s Annual Report on Form 10-K for the year ended December 31, 20202023 (formatted in Inline XBRL and contained in Exhibit 101). |
* Exhibit Numbers 10.2, 10.3, 10.5, 10.6, 10.7, 10.8, 10.9, 10.10, 10.11 10.12, 10.13, 10.14, 10.15, 10.16 and 10.17 are management contracts or compensatory plans required to be filed as Exhibits to this Form 10-K.
† Submitted electronically herewith.
ANNALY CAPITAL MANAGEMENT, INC. AND SUBSIDIARIES
| | |
| ITEM 16. FORM 10-K SUMMARY |
|
None.
ANNALY CAPITAL MANAGEMENT, INC. AND SUBSIDIARIES
| | | | | | | | |
| Financial Statements | Page |
| |
| | | |
Consolidated Financial Statements as of December 31, 20202023 and 20192022 and for the Years Ended December 31, 2020, 20192023, 2022 and 20182021 |
| |
| |
| | | |
| |
| | | |
| |
| | | |
| |
| Notes To Consolidated Financial Statements | |
| | |
| | |
| | |
| | |
| | |
| | |
| | |
| | |
| Sale of Commercial Real Estate Business | |
| | |
| | |
| | |
| | |
| | |
| | |
| | |
| | |
| | |
Note 14. | | |
Note 15. | | |
| | |
| | |
| | |
| | |
| | |
| Note 20. | |
| | |
| | |
| | |
| | |
| | |
| | |
ANNALY CAPITAL MANAGEMENT, INC. AND SUBSIDIARIES
Financial Statements
Report of Independent Registered Public Accounting Firm
To the Stockholders and the Board of Directors of Annaly Capital Management, Inc. and Subsidiaries
Opinion on the Financial Statements
We have audited the accompanying consolidated statements of financial condition of Annaly Capital Management, Inc. and Subsidiariessubsidiaries (the Company) as of December 31, 20202023 and 2019,2022, the related consolidated statements of comprehensive income (loss), stockholders'stockholders’ equity and cash flows for each of the three years in the period ended December 31, 2020,2023, and the related notes and financial statement schedules III and IV as of December 31, 2020, (collectively referred to as the "consolidated“consolidated financial statements"statements”). In our opinion, the consolidated financial statements present fairly, in all material respects, the financial position of the Company at December 31, 20202023 and 2019,2022, and the results of its operations and its cash flows for each of the three years in the period ended December 31, 2020,2023, in conformity with U.S. generally accepted accounting principles.
We also have audited, in accordance with the standards of the Public Company Accounting Oversight Board (United States) (PCAOB), the Company'sCompany’s internal control over financial reporting as of December 31, 2020,2023, based on criteria established in Internal Control-Integrated Framework issued by the Committee of Sponsoring Organizations of the Treadway Commission (2013 framework), and our report dated February 18, 202115, 2024 expressed an unqualified opinion thereon.
Basis for Opinion
These financial statements are the responsibility of the Company'sCompany’s management. Our responsibility is to express an opinion on the Company'sCompany’s financial statements based on our audits. We are a public accounting firm registered with the PCAOB and are required to be independent with respect to the Company in accordance with the U.S. federal securities laws and the applicable rules and regulations of the Securities and Exchange Commission and the PCAOB.
We conducted our audits in accordance with the standards of the PCAOB. Those standards require that we plan and perform the audit to obtain reasonable assurance about whether the financial statements are free of material misstatement, whether due to error or fraud. Our audits included performing procedures to assess the risks of material misstatement of the financial statements, whether due to error or fraud, and performing procedures that respond to those risks. Such procedures included examining, on a test basis, evidence regarding the amounts and disclosures in the financial statements. Our audits also included evaluating the accounting principles used and significant estimates made by management, as well as evaluating the overall presentation of the financial statements. We believe that our audits provide a reasonable basis for our opinion.
Critical Audit MattersMatter
The critical audit mattersmatter communicated below are mattersis a matter arising from the current period audit of the financial statements that werewas communicated or required to be communicated to the audit committee and that: (1) relaterelates to accounts or disclosures that are material to the financial statements and (2) involved our especially challenging, subjective or complex judgments. The communication of the critical audit mattersmatter does not alter in any way our opinion on the consolidated financial statements, taken as a whole, and we are not, by communicating the critical audit mattersmatter below, providing a separate opinionsopinion on the critical audit mattersmatter or on the accountsaccount or disclosuresdisclosure to which they relate.it relates.
| | | | | | | | |
| Allowanceforloanlosses
|
| | |
Description of
the Matter | Allowance for loan losses on commercial real estate loans totaled $129.9 million and allowance for loan losses on corporate debt totaled $39.6 million as of December 31, 2020. As disclosed in Note 6 to the consolidated financial statements, the Company establishes an allowance at origination or acquisition that reflects management's estimate of the total expected credit loss over the expected life of the loan. In estimating the lifetime expected credit losses, management utilizes a probability of default and loss given default methodology, which considers projected economic conditions over the reasonable and supportable forecast period. For loans experiencing credit deterioration, management may use a different methodology such as discounted cash flow model analysis or fair value of the collateral to determine the expected credit losses.
|
|
|
| | |
ANNALY CAPITAL MANAGEMENT, INC. AND SUBSIDIARIES
Financial Statements
| | | | | | | | |
| Valuation of mortgage servicing rights |
| | |
Description of
the Matter | The Company invests in servicing related assets comprised of mortgage servicing rights (“MSR”) totaling $2.1 billion as of December 31, 2023 as included in Note 7 to the consolidated financial statements. The Company records MSR at fair value on a recurring basis with changes in fair value recognized in the statement of comprehensive income (loss). These fair value estimates are based on valuation techniques used to estimate future cash flows that incorporate unobservable assumptions, including discount rate, prepayment rate, delinquency rate and cost to service. |
| | |
| Auditing the allowance for loan losses on commercial real estate loansvaluation of MSR is complex and corporate debt is complexrequired the use of a specialist due to the high degree of judgment in management’s assumptions usedjudgement in the assumptions made by management which are unobservable in nature. Additionally, selecting and applying audit procedures to address the estimation processuncertainty involves auditor subjectivity and industry-specific knowledge of MSR, including borrower risk ratings, unemployment rate, certain indexes, and fair value of collateral for collateral-dependent loans, where foreclosure is probable. These factors could havethe current market conditions considered by a significant effect on the allowance for loan losses.market participant. |
|
|
| | |
How We
Addressed the
Matter in Our
Audit | We obtained an understanding, evaluated and tested the Company’s processes and the design and tested the operating effectiveness of internal controls addressing the valuation of MSR, comprising management’s governance over the Company’s processesfunctionality of the discounted cash flow model utilized to estimate the allowance for loan losses on its commercial real estate loans and corporate debt, including controls over management’s review of the loan losses methodology, the completeness and accuracy of key inputs used in the estimation process,fair value; management’s review of the reasonableness of the unobservable assumptions used in the estimation processdiscounted cash flow model (i.e., borrower risk ratings, unemploymentdiscount rate, certain indexes,prepayment rate, delinquency rate and cost to service); management’s comparison of the assumptions used to independent third-party data; and management’s evaluation of the internal fair value of collateral) based on current industry and market data, and management’s reviewmark to third-party independent valuation firms’ ranges, as well as their evaluation of the expected credit losses. |
|
|
| | |
| To test the allowance for loan losses, our audit procedures included, among others, utilizing the supportcompetence and objectivity of an internal specialistthose third-party independent valuation firms, to independently evaluateassess the reasonableness of the Company’s expected loan loss methodology, which considered the results of various sensitivity analyses and analytical procedures. We compared management’s inputs and assumptions related to borrower risk ratings, unemployment rate estimates and certain indexes to the inputs and assumptionsfair values developed by our specialists using internal and external data. In cases for loans for which an allowance has been developed based on fair value of the collateral, we engaged internal specialists to independently value the underlying collateral and compared that valuation to management’s valuation.Company. |
| | |
|
| | |
| Amortization of net premiums on residential securities |
| | |
Description of
the Matter | Amortization of net premiums on residential securities totaled $1.4 billion for the year ended December 31, 2020. As disclosed in Note 3 to the consolidated financial statements, the Company amortizes or accretes premiums or discounts into interest income for its residential mortgage-backed securities. Amortization or accretion is derived taking into account estimates of future principal prepayments, which are derived using third-party model and market information, in the calculation of the effective yield.
|
|
|
| | |
| Auditing the amortization of net premiums on Agency residential mortgage-backed securities is complex due to the high degree of judgment in management's assumptions used in the measurement process including prepayment rates which are uncertain in nature. These assumptions have a significant effect on the amortization of net premiums on securities.
|
|
|
| | |
How We
Addressed the
Matter in Our
Audit | We obtained an understanding, evaluated the design and tested the operating effectiveness of controls over the Company’s processes to calculate amortization of net premiums on its Agency mortgage-backed securities, including management’s review of third party models and assumptions (i.e., prepayment rates) and the completeness and accuracy of data used in the cash flow models and the calculation of projected cash flows. |
|
|
| | |
| To test the amortizationvaluation of net premiums,MSR, our audit procedures included, among others, evaluating the Company's methodologyCompany’s valuation techniques used to estimate future cash flows, validating the accuracy and utilizingcompleteness of model objective inputs by agreeing these inputs to the support of internal specialistsCompany’s underlying records and third-party data, evaluating the Company’s model, and testing the significant unobservable assumptions used by management by comparing them to independently develop ranges of prepayment rates for a sample of securities based on current industry, market and economic data.trends. We involved our valuation specialists to assist in our evaluation of the Company’s valuation techniques and the assumptions used by management, and to independently develop a range of fair values for the MSR. We compared the assumptions made by management and management’s prepayment ratesestimate of fair value to the assumptions and fair value ranges developed by the internal specialistmanagement’s valuation specialists and our independent ranges to assess management’s estimate.estimates of fair value. We also recalculatedassessed the competence and objectivity of management’s projected cash flows andindependent valuation firms engaged to evaluate the amortizationreasonableness of premiums or accretion of discounts for a sample of securities. |
|
| the fair values developed by the Company. |
/s/ Ernst & Young LLP
We have served as the Company’s auditor since 2012.
New York, NY
February 18, 202115, 2024
ANNALY CAPITAL MANAGEMENT, INC. AND SUBSIDIARIES
Financial Statements
| | | | | | | | | | | |
ANNALY CAPITAL MANAGEMENT, INC. AND SUBSIDIARIES
CONSOLIDATED STATEMENTS OF FINANCIAL CONDITION
(dollars in thousands, except per share data) |
| | December 31, | | December 31, |
| 2020 | | 2019 |
| Assets | | | |
Cash and cash equivalents (includes pledged assets of $1,137,809 and $1,648,545, respectively) (1) | $ | 1,243,703 | | | $ | 1,850,729 | |
Securities (includes pledged assets of $67,471,074 and $108,809,569, respectively) (2) | 75,652,396 | | | 114,833,580 | |
Loans, net (includes pledged assets of $2,231,035 and $3,240,583, respectively) (3) | 3,083,821 | | | 4,462,350 | |
| Mortgage servicing rights (includes pledged assets of $5,541 and $3,336, respectively) | 100,895 | | | 378,078 | |
| Assets transferred or pledged to securitization vehicles | 6,910,020 | | | 7,002,460 | |
| Real estate, net | 656,314 | | | 725,638 | |
| | | |
| | | |
| Derivative assets | 171,134 | | | 113,556 | |
| | | |
| | | |
| Receivable for unsettled trades | 15,912 | | | 4,792 | |
| Principal and interest receivable | 268,073 | | | 449,906 | |
| | | |
| | | |
| Goodwill and intangible assets, net | 127,341 | | | 92,772 | |
| Other assets | 225,494 | | | 381,220 | |
| | | |
| Total assets | $ | 88,455,103 | | | $ | 130,295,081 | |
| Liabilities and stockholders’ equity | | | |
| Liabilities | | | |
| Repurchase agreements | $ | 64,825,239 | | | $ | 101,740,728 | |
| Other secured financing | 917,876 | | | 4,455,700 | |
| | | |
| Debt issued by securitization vehicles | 5,652,982 | | | 5,622,801 | |
| Participations issued | 39,198 | | | 0 | |
| Mortgages payable | 426,256 | | | 485,005 | |
| | | |
| | | |
| Derivative liabilities | 1,033,345 | | | 803,866 | |
| Payable for unsettled trades | 884,069 | | | 463,387 | |
| Interest payable | 191,116 | | | 476,335 | |
| | | |
| Dividends payable | 307,613 | | | 357,527 | |
| Other liabilities | 155,613 | | | 93,388 | |
| Total liabilities | 74,433,307 | | | 114,498,737 | |
| Stockholders’ equity | | | |
| | | |
| | | |
| | | |
| | | |
| | | |
| | | |
| | | |
| Preferred stock, par value $0.01 per share, 85,150,000 authorized, 63,500,000 and 81,900,000 issued and outstanding, respectively | 1,536,569 | | | 1,982,026 | |
| Common stock, par value $0.01 per share, 2,914,850,000 authorized, 1,398,240,618 and 1,430,106,199 issued and outstanding, respectively | 13,982 | | | 14,301 | |
| Additional paid-in capital | 19,750,818 | | | 19,966,923 | |
| Accumulated other comprehensive income (loss) | 3,374,335 | | | 2,138,191 | |
| Accumulated deficit | (10,667,388) | | | (8,309,424) | |
| Total stockholders’ equity | 14,008,316 | | | 15,792,017 | |
| Noncontrolling interests | 13,480 | | | 4,327 | |
| Total equity | 14,021,796 | | | 15,796,344 | |
| Total liabilities and equity | $ | 88,455,103 | | | $ | 130,295,081 | |
| | | |
(1)Includes cash of consolidated Variable Interest Entities (“VIEs”) of $22.2 million and $67.5 million at December 31, 2020 and 2019, respectively.
(2)Excludes $81.5 million and $102.5 million at December 31, 2020 and 2019, respectively, of agency mortgage-backed securities, $576.6 million and $468.0 million at December 31, 2020 and 2019, respectively, of non-Agency mortgage-backed securities and $391.0 million and $500.3 million at December 31, 2020 and December 31, 2019, respectively, of commercial mortgage-backed securities in consolidated VIEs pledged as collateral and eliminated from the Company’s Consolidated Statements of Financial Condition.
(3)Includes $47.0 million and $66.7 million of residential mortgage loans held for sale.
See notes to consolidated financial statements. | | | | | | | | | | | |
ANNALY CAPITAL MANAGEMENT, INC. AND SUBSIDIARIES
CONSOLIDATED STATEMENTS OF FINANCIAL CONDITION
(dollars in thousands, except per share data) |
| | December 31, | | December 31, |
| 2023 | | 2022 |
| Assets | | | |
Cash and cash equivalents (includes pledged assets of $1,136,298 and $1,424,160, respectively) (1) | $ | 1,412,148 | | | $ | 1,576,714 | |
Securities (includes pledged assets of $65,400,248 and $60,660,121, respectively) (2) | 69,613,565 | | | 65,789,907 | |
Loans, net (includes pledged assets of $2,082,419 and $1,653,464, respectively) (3) | 2,353,084 | | | 1,809,832 | |
| Mortgage servicing rights (includes pledged assets of $1,781,279 and $684,703, respectively) | 2,122,196 | | | 1,748,209 | |
| | | |
| Assets transferred or pledged to securitization vehicles | 13,307,622 | | | 9,121,912 | |
| | | |
| | | |
| | | |
| | | |
| Derivative assets | 162,557 | | | 342,064 | |
| | | |
| | | |
| Receivable for unsettled trades | 2,710,224 | | | 575,091 | |
| Principal and interest receivable | 1,222,705 | | | 637,301 | |
| | | |
| | | |
| Intangible assets, net | 12,106 | | | 16,679 | |
| Other assets | 311,029 | | | 233,003 | |
| | | |
| Total assets | $ | 93,227,236 | | | $ | 81,850,712 | |
| Liabilities and stockholders’ equity | | | |
| Liabilities | | | |
| Repurchase agreements | $ | 62,201,543 | | | $ | 59,512,597 | |
| Other secured financing | 500,000 | | | 250,000 | |
| | | |
| Debt issued by securitization vehicles | 11,600,338 | | | 7,744,160 | |
| Participations issued | 1,103,835 | | | 800,849 | |
| U.S. Treasury securities sold, not yet purchased | 2,132,751 | | | — | |
| | | |
| | | |
| | | |
| Derivative liabilities | 302,295 | | | 204,172 | |
| Payable for unsettled trades | 3,249,389 | | | 1,157,846 | |
| Interest payable | 287,937 | | | 325,280 | |
| | | |
| Dividends payable | 325,052 | | | 412,113 | |
| Other liabilities | 179,005 | | | 74,269 | |
| Total liabilities | 81,882,145 | | | 70,481,286 | |
| Stockholders’ equity | | | |
| | | |
| | | |
| | | |
| | | |
| | | |
| | | |
| | | |
| Preferred stock, par value $0.01 per share, 63,500,000 authorized, issued and outstanding | 1,536,569 | | | 1,536,569 | |
| Common stock, par value $0.01 per share, 1,468,250,000 and 2,936,500,000 authorized, 500,080,287 and 468,309,810 issued and outstanding, respectively | 5,001 | | | 4,683 | |
| Additional paid-in capital | 23,672,391 | | | 22,981,320 | |
| Accumulated other comprehensive income (loss) | (1,335,400) | | | (3,708,896) | |
| Accumulated deficit | (12,622,768) | | | (9,543,233) | |
| Total stockholders’ equity | 11,255,793 | | | 11,270,443 | |
| Noncontrolling interests | 89,298 | | | 98,983 | |
| Total equity | 11,345,091 | | | 11,369,426 | |
| Total liabilities and equity | $ | 93,227,236 | | | $ | 81,850,712 | |
| | | |
(1) Includes cash of consolidated Variable Interest Entities (“VIEs”) of $2.0 million and $2.2 million at December 31, 2023 and 2022, respectively. |
(2) Excludes $1.5 billion and $1.0 billion at December 31, 2023 and 2022, respectively, of non-Agency mortgage-backed securities in consolidated VIEs pledged as collateral and eliminated from the Company’s Consolidated Statements of Financial Condition. |
(3) Includes $1.2 million and $1.3 million of residential mortgage loans held for sale at December 31, 2023 and 2022, respectively. |
| See notes to consolidated financial statements. |
ANNALY CAPITAL MANAGEMENT, INC. AND SUBSIDIARIES
Financial Statements
| | | | | | | | | | | | | | | | | |
ANNALY CAPITAL MANAGEMENT, INC. AND SUBSIDIARIES
CONSOLIDATED STATEMENTS OF COMPREHENSIVE INCOME (LOSS)
(dollars in thousands, except per share data) |
| For The Years Ended December 31, |
| | 2020 | | 2019 | | 2018 |
| Net interest income | | | | | |
| Interest income | $ | 2,229,625 | | | $ | 3,787,297 | | | $ | 3,332,563 | |
| Interest expense | 899,112 | | | 2,784,875 | | | 1,897,860 | |
| Net interest income | 1,330,513 | | | 1,002,422 | | | 1,434,703 | |
| Realized and unrealized gains (losses) | | | | | |
| Net interest component of interest rate swaps | (207,877) | | | 351,375 | | | 100,553 | |
| Realized gains (losses) on termination or maturity of interest rate swaps | (1,917,628) | | | (1,442,964) | | | 1,409 | |
| Unrealized gains (losses) on interest rate swaps | (904,532) | | | (1,210,276) | | | 424,081 | |
| Subtotal | (3,030,037) | | | (2,301,865) | | | 526,043 | |
| Net gains (losses) on disposal of investments | 661,513 | | | (47,944) | | | (1,124,448) | |
| Net gains (losses) on other derivatives | 756,305 | | | (680,770) | | | (403,001) | |
| Net unrealized gains (losses) on instruments measured at fair value through earnings | (303,024) | | | 36,021 | | | (158,082) | |
| Loan loss provision | (147,581) | | | (16,569) | | | (3,496) | |
| | | | | |
| | | | | |
| Subtotal | 967,213 | | | (709,262) | | | (1,689,027) | |
| Total realized and unrealized gains (losses) | (2,062,824) | | | (3,011,127) | | | (1,162,984) | |
| Other income (loss) | 53,314 | | | 136,413 | | | 109,927 | |
| General and administrative expenses | | | | | |
| Compensation and management fee | 131,685 | | | 170,628 | | | 179,841 | |
| Other general and administrative expenses | 107,513 | | | 131,006 | | | 150,032 | |
| Total general and administrative expenses | 239,198 | | | 301,634 | | | 329,873 | |
| Income (loss) before income taxes | (918,195) | | | (2,173,926) | | | 51,773 | |
| Income taxes | (28,423) | | | (10,835) | | | (2,375) | |
| Net income (loss) | (889,772) | | | (2,163,091) | | | 54,148 | |
| Net income (loss) attributable to noncontrolling interests | 1,391 | | | (226) | | | (260) | |
| Net income (loss) attributable to Annaly | (891,163) | | | (2,162,865) | | | 54,408 | |
| Dividends on preferred stock | 142,036 | | | 136,576 | | | 129,312 | |
| Net income (loss) available (related) to common stockholders | $ | (1,033,199) | | | $ | (2,299,441) | | | $ | (74,904) | |
| Net income (loss) per share available (related) to common stockholders | | | | | |
| Basic | $ | (0.73) | | | $ | (1.60) | | | $ | (0.06) | |
| Diluted | $ | (0.73) | | | $ | (1.60) | | | $ | (0.06) | |
| Weighted average number of common shares outstanding | | | | | |
| Basic | 1,414,659,439 | | | 1,434,912,682 | | | 1,209,601,809 | |
| Diluted | 1,414,659,439 | | | 1,434,912,682 | | | 1,209,601,809 | |
| | | | | |
| Other comprehensive income (loss) | | | | | |
| Net income (loss) | $ | (889,772) | | | $ | (2,163,091) | | | $ | 54,148 | |
| Unrealized gains (losses) on available-for-sale securities | 2,012,878 | | | 4,135,862 | | | (2,004,166) | |
| Reclassification adjustment for net (gains) losses included in net income (loss) | (776,734) | | | (17,806) | | | 1,150,321 | |
| Other comprehensive income (loss) | 1,236,144 | | | 4,118,056 | | | (853,845) | |
| Comprehensive income (loss) | 346,372 | | | 1,954,965 | | | (799,697) | |
| Comprehensive income (loss) attributable to noncontrolling interests | 1,391 | | | (226) | | | (260) | |
| Comprehensive income (loss) attributable to Annaly | 344,981 | | | 1,955,191 | | | (799,437) | |
| Dividends on preferred stock | 142,036 | | | 136,576 | | | 129,312 | |
| Comprehensive income (loss) attributable to common stockholders | $ | 202,945 | | | $ | 1,818,615 | | | $ | (928,749) | |
| | | | | |
See notes to consolidated financial statements. | | | | | | | | | | | | | | | | | |
ANNALY CAPITAL MANAGEMENT, INC. AND SUBSIDIARIES
CONSOLIDATED STATEMENTS OF COMPREHENSIVE INCOME (LOSS)
(dollars in thousands, except per share data) |
| For The Years Ended December 31, |
| | 2023 | | 2022 | | 2021 |
| Net interest income | | | | | |
| Interest income | $ | 3,731,581 | | | $ | 2,778,887 | | | $ | 1,983,036 | |
| Interest expense | 3,842,965 | | | 1,309,735 | | | 249,243 | |
| Net interest income | (111,384) | | | 1,469,152 | | | 1,733,793 | |
| Net servicing income | | | | | |
| Servicing and related income | 364,157 | | | 246,926 | | | 69,018 | |
| Servicing and related expense | 37,652 | | | 25,145 | | | 12,202 | |
| Net servicing income | 326,505 | | | 221,781 | | | 56,816 | |
| Other income (loss) | | | | | |
| Net gains (losses) on investments and other | (2,125,618) | | | (4,602,456) | | | 120,958 | |
| Net gains (losses) on derivatives | 400,092 | | | 4,859,174 | | | 807,730 | |
| Loan loss (provision) reversal | 219 | | | 20,660 | | | 145,066 | |
| Business divestiture-related gains (losses) | — | | | (40,258) | | | (278,559) | |
| | | | | |
| | | | | |
| Other, net | 73,716 | | | 6,667 | | | 1,165 | |
| Total other income (loss) | (1,651,591) | | | 243,787 | | | 796,360 | |
| | | | | |
| | | | | |
| | | | | |
| | | | | |
| | | | | |
| | | | | |
| | | | | |
| | | | | |
| | | | | |
| | | | | |
| | | | | |
| | | | | |
| | | | | |
| | | | | |
| | | | | |
| General and administrative expenses | | | | | |
| Compensation expense | 119,592 | | | 112,703 | | | 118,451 | |
| Other general and administrative expenses | 42,961 | | | 50,026 | | | 67,563 | |
| Total general and administrative expenses | 162,553 | | | 162,729 | | | 186,014 | |
| Income (loss) before income taxes | (1,599,023) | | | 1,771,991 | | | 2,400,955 | |
| Income taxes | 39,434 | | | 45,571 | | | 4,675 | |
| Net income (loss) | (1,638,457) | | | 1,726,420 | | | 2,396,280 | |
| Net income (loss) attributable to noncontrolling interests | 4,714 | | | 1,095 | | | 6,384 | |
| Net income (loss) attributable to Annaly | (1,643,171) | | | 1,725,325 | | | 2,389,896 | |
| Dividends on preferred stock | 141,676 | | | 110,623 | | | 107,532 | |
| Net income (loss) available (related) to common stockholders | $ | (1,784,847) | | | $ | 1,614,702 | | | $ | 2,282,364 | |
| Net income (loss) per share available (related) to common stockholders | | | | | |
| Basic | $ | (3.61) | | | $ | 3.93 | | | $ | 6.40 | |
| Diluted | $ | (3.61) | | | $ | 3.92 | | | $ | 6.39 | |
| Weighted average number of common shares outstanding | | | | | |
| Basic | 494,541,323 | | | 411,348,484 | | | 356,856,520 | |
| Diluted | 494,541,323 | | | 411,621,758 | | | 357,142,251 | |
| Other comprehensive income (loss) | | | | | |
| Net income (loss) | $ | (1,638,457) | | | $ | 1,726,420 | | | $ | 2,396,280 | |
| Unrealized gains (losses) on available-for-sale securities | 580,680 | | | (8,204,542) | | | (2,419,618) | |
| Reclassification adjustment for net (gains) losses included in net income (loss) | 1,792,816 | | | 3,537,236 | | | 3,693 | |
| Other comprehensive income (loss) | 2,373,496 | | | (4,667,306) | | | (2,415,925) | |
| Comprehensive income (loss) | 735,039 | | | (2,940,886) | | | (19,645) | |
| Comprehensive income (loss) attributable to noncontrolling interests | 4,714 | | | 1,095 | | | 6,384 | |
| Comprehensive income (loss) attributable to Annaly | 730,325 | | | (2,941,981) | | | (26,029) | |
| Dividends on preferred stock | 141,676 | | | 110,623 | | | 107,532 | |
| Comprehensive income (loss) attributable to common stockholders | $ | 588,649 | | | $ | (3,052,604) | | | $ | (133,561) | |
| | | | | |
| See notes to consolidated financial statements. |
ANNALY CAPITAL MANAGEMENT, INC. AND SUBSIDIARIES
Financial Statements
| | | | | | | | | | | | | | | | | | | | |
ANNALY CAPITAL MANAGEMENT, INC. AND SUBSIDIARIES
CONSOLIDATED STATEMENTS OF STOCKHOLDERS' EQUITY |
| (dollars in thousands) |
| | For The Years Ended December 31, |
| | 2020 | | 2019 | | 2018 |
| Preferred stock | | | | | | |
| Beginning of period | | $ | 1,982,026 | | | $ | 1,778,168 | | | $ | 1,720,381 | |
| Issuance | | 0 | | | 428,324 | | | 411,335 | |
| Acquisition of subsidiary | | 0 | | | 0 | | | 55,000 | |
| Redemption | | (445,457) | | | (224,466) | | | (408,548) | |
| End of period | | $ | 1,536,569 | | | $ | 1,982,026 | | | $ | 1,778,168 | |
| Common stock | | | | | | |
| Beginning of period | | $ | 14,301 | | | $ | 13,138 | | | $ | 11,596 | |
| Issuance | | 0 | | | 1,422 | | | 1,103 | |
| Buyback of common stock | | (324) | | | (261) | | | 0 | |
| Acquisition of subsidiary | | 0 | | | 0 | | | 436 | |
| Stock-based award activity | | 3 | | | 0 | | | 0 | |
| Direct purchase and dividend reinvestment | | 2 | | | 2 | | | 3 | |
| End of period | | $ | 13,982 | | | $ | 14,301 | | | $ | 13,138 | |
| Additional paid-in capital | | | | | | |
| Beginning of period | | $ | 19,966,923 | | | $ | 18,794,331 | | | $ | 17,221,265 | |
| | | | | | |
| Issuance | | (93) | | | 1,397,484 | | | 1,116,409 | |
| Buyback of common stock | | (209,094) | | | (223,313) | | | 0 | |
| Acquisition of subsidiary | | 0 | | | 0 | | | 455,507 | |
| Stock-based award activity | | 6,452 | | | 2,162 | | | 1,961 | |
| Redemption of preferred stock | | (14,543) | | | (5,534) | | | (3,952) | |
| Direct purchase and dividend reinvestment | | 1,173 | | | 1,793 | | | 3,141 | |
| End of period | | $ | 19,750,818 | | | $ | 19,966,923 | | | $ | 18,794,331 | |
| Accumulated other comprehensive income (loss) | | | | | | |
| Beginning of period | | $ | 2,138,191 | | | $ | (1,979,865) | | | $ | (1,126,020) | |
| Unrealized gains (losses) on available-for-sale securities | | 2,012,878 | | | 4,135,862 | | | (2,004,166) | |
| Reclassification adjustment for net gains (losses) included in net income (loss) | | (776,734) | | | (17,806) | | | 1,150,321 | |
| End of period | | $ | 3,374,335 | | | $ | 2,138,191 | | | $ | (1,979,865) | |
| Accumulated deficit | | | | | | |
| Beginning of period - unadjusted | | $ | (8,309,424) | | | $ | (4,493,660) | | | $ | (2,961,749) | |
| Cumulative effect of change in accounting principle for credit losses | | (39,641) | | | 0 | | | 0 | |
| Beginning of period - adjusted | | (8,349,065) | | | (4,493,660) | | | (2,961,749) | |
| Net income (loss) attributable to Annaly | | (891,163) | | | (2,162,865) | | | 54,408 | |
Dividends declared on preferred stock (1) | | (142,036) | | | (136,576) | | | (129,312) | |
Dividends and dividend equivalents declared on common stock and share-based awards (1) | | (1,285,124) | | | (1,516,323) | | | (1,457,007) | |
| | | | | | |
| End of period | | $ | (10,667,388) | | | $ | (8,309,424) | | | $ | (4,493,660) | |
| Total stockholder’s equity | | $ | 14,008,316 | | | $ | 15,792,017 | | | $ | 14,112,112 | |
| Noncontrolling interests | | | | | | |
| Beginning of period | | $ | 4,327 | | | $ | 5,689 | | | $ | 6,100 | |
| Net income (loss) attributable to noncontrolling interests | | 1,391 | | | (226) | | | (260) | |
| Equity contributions from (distributions to) noncontrolling interests | | 7,762 | | | (1,136) | | | (151) | |
| End of period | | $ | 13,480 | | | $ | 4,327 | | | $ | 5,689 | |
| Total equity | | $ | 14,021,796 | | | $ | 15,796,344 | | | $ | 14,117,801 | |
(1) Refer to the “Capital Stock” Note for dividends per share for each class of shares. |
See notes to consolidated financial statements.
| | | | | | | | | | | | | | | | | | | | |
ANNALY CAPITAL MANAGEMENT, INC. AND SUBSIDIARIES
CONSOLIDATED STATEMENTS OF STOCKHOLDERS' EQUITY |
| (dollars in thousands) |
| | For The Years Ended December 31, |
| | 2023 | | 2022 | | 2021 |
| Preferred stock | | | | | | |
| Beginning of period | | $ | 1,536,569 | | | $ | 1,536,569 | | | $ | 1,536,569 | |
| | | | | | |
| | | | | | |
| | | | | | |
| End of period | | $ | 1,536,569 | | | $ | 1,536,569 | | | $ | 1,536,569 | |
| Common stock | | | | | | |
| Beginning of period | | $ | 4,683 | | | $ | 3,649 | | | $ | 3,496 | |
| Issuance | | 315 | | | 1,031 | | | 152 | |
| | | | | | |
| | | | | | |
| Stock-based award activity | | 3 | | | 3 | | | 1 | |
| | | | | | |
| End of period | | $ | 5,001 | | | $ | 4,683 | | | $ | 3,649 | |
| Additional paid-in capital | | | | | | |
| Beginning of period | | $ | 22,981,320 | | | $ | 20,324,780 | | | $ | 19,761,304 | |
| | | | | | |
| Issuance | | 673,378 | | | 2,634,969 | | | 552,063 | |
| | | | | | |
| | | | | | |
| Stock-based award activity | | 17,693 | | | 21,571 | | | 11,413 | |
| | | | | | |
| | | | | | |
| End of period | | $ | 23,672,391 | | | $ | 22,981,320 | | | $ | 20,324,780 | |
| Accumulated other comprehensive income (loss) | | | | | | |
| Beginning of period | | $ | (3,708,896) | | | $ | 958,410 | | | $ | 3,374,335 | |
| Unrealized gains (losses) on available-for-sale securities | | 580,680 | | | (8,204,542) | | | (2,419,618) | |
| Reclassification adjustment for net gains (losses) included in net income (loss) | | 1,792,816 | | | 3,537,236 | | | 3,693 | |
| End of period | | $ | (1,335,400) | | | $ | (3,708,896) | | | $ | 958,410 | |
| Accumulated deficit | | | | | | |
| | | | | | |
| | | | | | |
| Beginning of period | | $ | (9,543,233) | | | $ | (9,653,582) | | | $ | (10,667,388) | |
| Net income (loss) attributable to Annaly | | (1,643,171) | | | 1,725,325 | | | 2,389,896 | |
Dividends declared on preferred stock (1) | | (141,676) | | | (110,623) | | | (107,532) | |
Dividends and dividend equivalents declared on common stock and stock-based awards (1) | | (1,294,688) | | | (1,504,353) | | | (1,268,558) | |
| | | | | | |
| End of period | | $ | (12,622,768) | | | $ | (9,543,233) | | | $ | (9,653,582) | |
| Total stockholder’s equity | | $ | 11,255,793 | | | $ | 11,270,443 | | | $ | 13,169,826 | |
| Noncontrolling interests | | | | | | |
| Beginning of period | | $ | 98,983 | | | $ | 25,499 | | | $ | 13,480 | |
| Net income (loss) attributable to noncontrolling interests | | 4,714 | | | 1,095 | | | 6,384 | |
| Equity contributions from (distributions to) noncontrolling interests | | (14,399) | | | 72,389 | | | 5,635 | |
| End of period | | $ | 89,298 | | | $ | 98,983 | | | $ | 25,499 | |
| Total equity | | $ | 11,345,091 | | | $ | 11,369,426 | | | $ | 13,195,325 | |
(1) Refer to the “Capital Stock” Note for dividends per share for each class of shares. |
| See notes to consolidated financial statements. |
ANNALY CAPITAL MANAGEMENT, INC. AND SUBSIDIARIES
Financial Statements
| | | | | | | | | | | | | | | | | |
ANNALY CAPITAL MANAGEMENT, INC. AND SUBSIDIARIES
CONSOLIDATED STATEMENTS OF CASH FLOWS |
| (dollars in thousands) |
| | For The Years Ended December 31, |
| | 2020 | | 2019 | | 2018 |
| Cash flows from operating activities | | | | | |
| Net income (loss) | $ | (889,772) | | | $ | (2,163,091) | | | $ | 54,148 | |
| Adjustments to reconcile net income (loss) to net cash provided by (used in) operating activities | | | | | |
| | | | | |
| | | | | |
| | | | | |
| | | | | |
| | | | | |
| | | | | |
| | | | | |
| | | | | |
| Amortization of premiums and discounts of investments, net | 1,371,178 | | | 1,113,273 | | | 692,811 | |
| Amortization of securitized debt premiums and discounts and deferred financing costs | (11,576) | | | (11,854) | | | (3,439) | |
| | | | | |
| Depreciation, amortization and other noncash expenses | 41,357 | | | 31,559 | | | 72,364 | |
| Net (gains) losses on disposals of investments and other | (661,513) | | | 47,944 | | | 1,123,969 | |
| Net (gains) losses on investments and derivatives | 2,368,879 | | | 1,855,025 | | | 136,673 | |
| Income from unconsolidated joint ventures | 7,072 | | | 6,893 | | | 2,840 | |
| | | | | |
| Loan loss provision | 147,581 | | | 16,569 | | | 3,496 | |
| | | | | |
| | | | | |
| | | | | |
| | | | | |
| | | | | |
| | | | | |
| | | | | |
| | | | | |
| | | | | |
| | | | | |
| | | | | |
| | | | | |
| | | | | |
| Payments on purchases of loans held for sale | (147,833) | | | (250,348) | | | (227,871) | |
| | | | | |
| | | | | |
| | | | | |
| | | | | |
| | | | | |
| | | | | |
| | | | | |
| | | | | |
| | | | | |
| Proceeds from sales and repayments of loans held for sale | 168,716 | | | 282,693 | | | 97,913 | |
| | | | | |
| | | | | |
| | | | | |
| | | | | |
| | | | | |
| | | | | |
| | | | | |
| | | | | |
| | | | | |
| | | | | |
| | | | | |
| | | | | |
| | | | | |
| | | | | |
| Net receipts (payments) on derivatives | (1,958,131) | | | (1,939,634) | | | 480,216 | |
| Net change in | | | | | |
| | | | | |
| Other assets | 249,778 | | | (39,880) | | | 98,104 | |
| | | | | |
| | | | | |
| | | | | |
| | | | | |
| Interest receivable | 159,320 | | | (85,951) | | | (19,563) | |
| Interest payable | (285,219) | | | (94,593) | | | 295,640 | |
| Other liabilities | (31,870) | | | 31,838 | | | (185,283) | |
| Net cash provided by (used in) operating activities | 527,967 | | | (1,199,557) | | | 2,622,018 | |
| Cash flows from investing activities | | | | | |
| Payments on purchases of securities | (32,676,856) | | | (63,465,822) | | | (44,795,176) | |
| Proceeds from sales of securities | 52,639,778 | | | 25,606,504 | | | 33,256,888 | |
| Principal payments on securities | 19,571,476 | | | 17,199,893 | | | 11,488,342 | |
| Payments on purchases and origination of loans | (2,257,314) | | | (4,126,123) | | | (3,149,224) | |
| Proceeds from sales of loans | 624,026 | | | 365,787 | | | 150,059 | |
| Principal payments on loans | 2,222,500 | | | 3,139,084 | | | 2,107,689 | |
| | | | | |
| | | | | |
| | | | | |
| | | | | |
| Payments on purchases of MSRs | 0 | | | 0 | | | (381) | |
| Proceeds from sales of MSRs | 72,160 | | | 0 | | | 0 | |
| | | | | |
| | | | | |
| | | | | |
| | | | | |
| | | | | |
| | | | | |
| | | | | |
| | | | | |
| | | | | |
| | | | | |
| | | | | |
| | | | | |
| | | | | |
| | | | | |
| | | | | |
| | | | | |
| | | | | |
| | | | | |
| | | | | |
| | | | | |
| | | | | |
| | | | | |
| Investments in real estate | (7,450) | | | (39,144) | | | (22,722) | |
| Proceeds from sales of real estate | 149,600 | | | 24,955 | | | 0 | |
| Proceeds from reverse repurchase agreements | 58,800,000 | | | 98,339,755 | | | 85,318,562 | |
| Payments on reverse repurchase agreements | (58,800,000) | | | (97,689,715) | | | (85,030,351) | |
| Distributions in excess of cumulative earnings from unconsolidated joint ventures | 7,590 | | | 3,155 | | | 26,228 | |
| | | | | |
| | | | | |
| | | | | |
| | | | | |
| Cash acquired (paid) in asset acquisition, net | 6,264 | | | 0 | | | (258,334) | |
| | | | | |
| | | | | |
| | | | | |
| Net cash provided by (used in) investing activities | 40,351,774 | | | (20,641,671) | | | (908,420) | |
| Cash flows from financing activities | | | | | |
| Proceeds from repurchase agreements and other secured financing | 2,776,331,362 | | | 5,470,733,256 | | | 5,117,155,986 | |
| | | | | |
| | | | | |
| Principal payments on repurchase agreements and other secured financing | (2,816,805,618) | | | (5,449,836,013) | | | (5,116,952,444) | |
| | | | | |
| | | | | |
| | | | | |
| Proceeds from issuances of securitized debt | 2,385,374 | | | 3,444,055 | | | 920,142 | |
| | | | | |
| Principal repayments on securitized debt | (1,238,962) | | | (2,031,959) | | | (1,384,333) | |
| Payment of deferred financing cost | (553) | | | (12,228) | | | (1,072) | |
| Net proceeds from stock offerings, direct purchases and dividend reinvestments | 1,175 | | | 1,829,025 | | | 1,532,356 | |
| Redemptions of preferred stock | (460,000) | | | (230,000) | | | (412,500) | |
| Proceeds from participations issued | 38,741 | | | 0 | | | 0 | |
| Net principal receipts (payments) on mortgages payable | (60,980) | | | (26,202) | | | (716) | |
| | | | | |
| | | | | |
| | | | | |
| Net contributions (distributions) from (to) noncontrolling interests | 7,762 | | | (1,136) | | | (971) | |
| | | | | |
| | | | | |
| | | | | |
| | | | | |
| | | | | |
| | | | | |
| Net payments on share repurchases | (209,418) | | | (223,574) | | | 0 | |
| Dividends paid | (1,475,650) | | | (1,689,016) | | | (1,540,886) | |
| Net cash provided by (used in) financing activities | (41,486,767) | | | 21,956,208 | | | (684,438) | |
| Net (decrease) increase in cash and cash equivalents | $ | (607,026) | | | $ | 114,980 | | | $ | 1,029,160 | |
| Cash and cash equivalents including cash pledged as collateral, beginning of period | 1,850,729 | | | 1,735,749 | | | 706,589 | |
| Cash and cash equivalents including cash pledged as collateral, end of period | $ | 1,243,703 | | | $ | 1,850,729 | | | $ | 1,735,749 | |
| Supplemental disclosure of cash flow information | | | | | |
| Interest received | $ | 3,681,826 | | | $ | 4,811,218 | | | $ | 3,894,478 | |
| Dividends received | $ | 4,643 | | | $ | 8,395 | | | $ | 7,564 | |
| | | | | |
| | | | | |
| Interest paid (excluding interest paid on interest rate swaps) | $ | 1,166,977 | | | $ | 2,902,644 | | | $ | 1,726,887 | |
| Net interest received (paid) on interest rate swaps | $ | 296,621 | | | $ | (323,028) | | | $ | (1,894) | |
| Taxes received (paid) | $ | 1,515 | | | $ | 2,284 | | | $ | (295) | |
| Noncash investing and financing activities | | | | | |
| Receivable for unsettled trades | $ | 15,912 | | | $ | 4,792 | | | $ | 68,779 | |
| Payable for unsettled trades | $ | 884,069 | | | $ | 463,387 | | | $ | 583,036 | |
| | | | | |
| | | | | |
| Net change in unrealized gains (losses) on available-for-sale securities, net of reclassification adjustment | $ | 1,236,144 | | | $ | 4,118,056 | | | $ | (853,845) | |
| | | | | |
| | | | | |
| | | | | |
| Dividends declared, not yet paid | $ | 307,613 | | | $ | 357,527 | | | $ | 394,129 | |
| Derecognition of assets of consolidated VIEs | $ | 1,222,221 | | | $ | 0 | | | $ | 0 | |
| Derecognition of securitized debt of consolidated VIEs | $ | 1,141,311 | | | $ | 0 | | | $ | 0 | |
| | | | | |
| | | | | |
| | | | | |
| | | | | |
| | | | | |
| | | | | |
| | | | | |
See notes to consolidated financial statements. | | | | | | | | | | | | | | | | | |
ANNALY CAPITAL MANAGEMENT, INC. AND SUBSIDIARIES
CONSOLIDATED STATEMENTS OF CASH FLOWS |
| (dollars in thousands) |
| | For The Years Ended December 31, |
| | 2023 | | 2022 | | 2021 |
| Cash flows from operating activities | | | | | |
| Net income (loss) | $ | (1,638,457) | | | $ | 1,726,420 | | | $ | 2,396,280 | |
| Adjustments to reconcile net income (loss) to net cash provided by (used in) operating activities | | | | | |
| Amortization of premiums and discounts of investments, net | 185,728 | | | 87,154 | | | 784,110 | |
| Amortization of securitized debt premiums and discounts and deferred financing costs | 13,824 | | | (4,733) | | | (6,620) | |
| Depreciation, amortization and other noncash expenses | 24,806 | | | 20,506 | | | 24,636 | |
| Net (gains) losses on investments and derivatives | 3,310,579 | | | 109,443 | | | (1,204,830) | |
| Business divestiture-related (gains) losses | — | | | 40,258 | | | 278,559 | |
| Income (loss) from unconsolidated joint ventures | 10,270 | | | (11,454) | | | 12,181 | |
| Loan loss provision (reversal) | (219) | | | (20,660) | | | (145,066) | |
| | | | | |
| Payments on purchases of loans held for sale | — | | | — | | | (51,403) | |
| | | | | |
| Proceeds from sales and repayments of loans held for sale | 1,577 | | | 4,597 | | | 90,020 | |
| | | | | |
| | | | | |
| | | | | |
| | | | | |
| Proceeds from U.S. Treasury securities | 2,015,608 | | | — | | | — | |
| | | | | |
| Net receipts (payments) on derivatives | (862,032) | | | 3,643,954 | | | 932,867 | |
| Net change in | | | | | |
| | | | | |
| Other assets | (136,804) | | | (11,437) | | | 31,044 | |
| Interest receivable | (585,817) | | | (403,613) | | | 32,926 | |
| Interest payable | (37,343) | | | 233,753 | | | (99,590) | |
| Other liabilities | 65,483 | | | (41,777) | | | 1,725 | |
| Net cash provided by (used in) operating activities | 2,367,203 | | | 5,372,411 | | | 3,076,839 | |
| Cash flows from investing activities | | | | | |
| Payments on purchases of securities | (41,036,338) | | | (45,474,466) | | | (22,344,751) | |
| Proceeds from sales of securities | 31,259,983 | | | 25,055,929 | | | 11,670,321 | |
| Principal payments on securities | 6,153,217 | | | 9,541,036 | | | 18,742,951 | |
| Payments on purchases and origination of loans | (5,503,696) | | | (6,137,067) | | | (7,715,200) | |
| Proceeds from sales of loans | 21,242 | | | 1,930,367 | | | 1,213,745 | |
| Principal payments on loans | 1,086,508 | | | 1,562,308 | | | 2,610,912 | |
| Payments on purchases of MSR | (396,806) | | | (1,009,349) | | | (473,035) | |
| Proceeds from sales of MSR | — | | | 9,085 | | | 82,175 | |
| Payments on purchases of interests in MSR | — | | | (4,913) | | | (65,107) | |
| Investments in real estate | — | | | — | | | (2,329) | |
| Proceeds from sales of real estate | — | | | — | | | 53,910 | |
| Proceeds from reverse repurchase agreements | 128,615,235 | | | 24,500,024 | | | 16,734,313 | |
| Payments on reverse repurchase agreements | (128,615,235) | | | (24,500,024) | | | (16,734,313) | |
| Distributions in excess of cumulative earnings from unconsolidated joint ventures | — | | | — | | | 290 | |
| | | | | |
| Proceeds from sale of equity securities | — | | | — | | | 6,957 | |
| | | | | |
| Net proceeds from business divestiture | — | | | — | | | 1,118,440 | |
| Net cash provided by (used in) investing activities | (8,415,890) | | | (14,527,070) | | | 4,899,279 | |
| Cash flows from financing activities | | | | | |
| Proceeds from repurchase agreements and other secured financing | 5,351,050,481 | | | 3,571,043,066 | | | 2,288,704,788 | |
| Payments on repurchase agreements and other secured financing | (5,348,111,535) | | | (3,566,953,367) | | | (2,298,775,005) | |
| | | | | |
| Proceeds from issuances of securitized debt | 4,480,804 | | | 5,473,311 | | | 3,719,027 | |
| Principal payments on securitized debt | (944,163) | | | (1,234,090) | | | (1,716,196) | |
| Payments on purchases of securitized debt | (2,504) | | | (8,495) | | | — | |
| Payment of deferred financing cost | (4,012) | | | — | | | (9,279) | |
| Net proceeds from stock offerings, direct purchases and dividend reinvestments | 673,693 | | | 2,636,000 | | | 552,215 | |
| | | | | |
| Proceeds from participations issued | 2,007,464 | | | 1,908,204 | | | 1,847,821 | |
| Payments on repurchases of participations issued | (1,674,650) | | | (1,973,666) | | | (818,575) | |
| Principal payments on participations issued | (52,635) | | | (50,712) | | | (23,374) | |
| Net principal receipts (payments) on mortgages payable | — | | | — | | | (2,237) | |
| Net contributions (distributions) from (to) noncontrolling interests | (14,399) | | | 72,389 | | | 5,635 | |
| | | | | |
| Settlement of stock-based awards in satisfaction of withholding tax requirements | (6,661) | | | (4,108) | | | (2,830) | |
| Dividends paid | (1,517,762) | | | (1,519,249) | | | (1,359,721) | |
| Net cash provided by (used in) financing activities | 5,884,121 | | | 9,389,283 | | | (7,877,731) | |
| Net (decrease) increase in cash and cash equivalents | (164,566) | | | 234,624 | | | 98,387 | |
| Cash and cash equivalents including cash pledged as collateral, beginning of period | 1,576,714 | | | 1,342,090 | | | 1,243,703 | |
| Cash and cash equivalents including cash pledged as collateral, end of period | $ | 1,412,148 | | | $ | 1,576,714 | | | $ | 1,342,090 | |
| Supplemental disclosure of cash flow information | | | | | |
| Interest received | $ | 3,278,519 | | | $ | 2,459,012 | | | $ | 2,701,381 | |
| Dividends received | $ | — | | | $ | — | | | $ | 51 | |
| | | | | |
| | | | | |
| Interest paid (excluding interest paid on interest rate swaps) | $ | 3,551,873 | | | $ | 866,829 | | | $ | 269,244 | |
| Net interest received (paid) on interest rate swaps | $ | 1,306,551 | | | $ | 15,621 | | | $ | (340,738) | |
| Taxes received (paid) | $ | 1,104 | | | $ | (492) | | | $ | (3,797) | |
| Noncash investing and financing activities | | | | | |
| Receivable for unsettled trades | $ | 2,710,224 | | | $ | 575,091 | | | $ | 2,656 | |
| Payable for unsettled trades | $ | 3,249,389 | | | $ | 1,157,846 | | | $ | 147,908 | |
| Net change in unrealized gains (losses) on available-for-sale securities, net of reclassification adjustment | $ | 2,373,496 | | | $ | (4,667,306) | | | $ | (2,415,925) | |
| | | | | |
| | | | | |
| Dividends declared, not yet paid | $ | 325,052 | | | $ | 412,113 | | | $ | 321,142 | |
| Derecognition of assets of consolidated VIEs | $ | — | | | $ | 424,005 | | | $ | 3,075,961 | |
| Derecognition of securitized debt of consolidated VIEs | $ | — | | | $ | 391,928 | | | $ | 2,506,799 | |
| Derecognition of mortgages payable | $ | — | | | $ | — | | | $ | 314,485 | |
| | | | | |
| | | | | |
| | | | | |
| See notes to consolidated financial statements. |
ANNALY CAPITAL MANAGEMENT, INC. AND SUBSIDIARIES
Financial Statements
ANNALY CAPITAL MANAGEMENT, INC. AND SUBSIDIARIES
NOTES TO CONSOLIDATED FINANCIAL STATEMENTS
FOR THE YEARS ENDED December 31, 2020, 20192023, 2022 and 20182021
| | |
| 1. DESCRIPTION OF BUSINESS |
|
Annaly Capital Management, Inc. (the “Company” or “Annaly”) is a Maryland corporation that commenced operations on February 18, 1997. The Company is a leading diversified capital manager that invests in and finances residential and commercial assets.with investment strategies across mortgage finance. The Company owns a portfolio of real estate related investments, including mortgage pass-through certificates, collateralized mortgage obligations, credit risk transfer (“CRT”) securities, other securities representing interests in or obligations backed by pools of mortgage loans, residential mortgage loans and mortgage servicing rights (“MSRs”MSR”), commercial real estate assets and corporate debt.. The Company’s principal business objective is to generate net income for distribution to its stockholders and optimize its returns through prudent management of its diversified investment strategies.
The Company’s 4 investment groups are primarily comprised of the following:
| | | | | |
Investment Groups | Description |
Annaly Agency Group | Invests in Agency mortgage-backed securities (“MBS”) collateralized by residential mortgages which are guaranteed by Fannie Mae, Freddie Mac or Ginnie Mae. |
Annaly Residential Credit Group | Invests primarily in non-Agency residential mortgage assets within securitized product and whole loan markets. |
Annaly Commercial Real Estate Group | Originates and invests in commercial mortgage loans, securities, and other commercial real estate debt and equity investments. |
Annaly Middle Market Lending Group | Provides financing to private equity-backed middle market businesses, focusing primarily on senior debt within select industries. |
The Company is an internally-managed company that has elected to be taxed as a Real Estate Investment Trust (“REIT”) as defined under the Internal Revenue Code of 1986, as amended, and regulations promulgated thereunder (the “Code”). Prior to the closing
The Company’s three investment groups are primarily comprised of the Internalization (as defined in Note 19) on June 30, 2020, the Company was externally managed by Annaly Management Company LLC (the “Former Manager”).following:
| | | | | |
| Investment Groups | Description |
| Annaly Agency Group | Invests in Agency mortgage-backed securities (“MBS”) collateralized by residential mortgages which are guaranteed by Fannie Mae, Freddie Mac or Ginnie Mae and complementary investments within the Agency market, including Agency commercial MBS. |
| Annaly Residential Credit Group | Invests primarily in non-Agency residential whole loans and securitized products within the residential and commercial markets. |
| Annaly Mortgage Servicing Rights Group | Invests in mortgage servicing rights ("MSR"), which provide the right to service residential mortgage loans in exchange for a portion of the interest payments made on the loans. |
The accompanying consolidated financial statements and related notes of the Company have been prepared in accordance with U.S. generally accepted accounting principles (“GAAP”).
The preparation of the consolidated financial statements requires management to make estimates and assumptions that affect the reported balance sheet amounts and/or disclosures at the date of the financial statements and the reported amounts of revenues and expenses during the reporting period. Actual results could differ materially from those estimates.
Certain line itemsBeginning with the quarter ended March 31, 2022, in light of the Company’scontinued growth of its mortgage servicing rights portfolio the Company enhanced its financial disclosures by separately reporting servicing income and servicing expense in its Consolidated Statements of Cash FlowsComprehensive Income (Loss). Servicing income and servicing expense were aggregated to simplify presentation. Priorpreviously included within Other income (loss). As a result of this change, prior periods have been adjusted to conform to the current presentation.
In addition, beginning with the quarter ended March 31, 2022, the Company consolidated certain line items in its Consolidated Statements of Comprehensive Income (Loss) in an effort to streamline and simplify its financial presentation. Amounts previously reported under Net interest component of interest rate swaps, Realized gains (losses) on termination or maturity of interest rate swaps, Unrealized gains (losses) on interest rate swaps and Net gains (losses) on other derivatives are combined into a single line item titled Net gains (losses) on derivatives. Similarly, amounts previously reported under Net gains (losses) on disposal of investments and other and Net unrealized gains (losses) on instruments measured at fair value through earnings are combined into a single line item titled Net gains (losses) on investments and other. As a result of these changes, prior periods have been adjusted to conform to the current presentation.
Reverse Stock Split
On September 8, 2022, the Company announced that its Board had unanimously approved a reverse stock split of the Company’s common stock at a ratio of 1-for-4 (the “Reverse Stock Split”). The Reverse Stock Split was effective following the close of business on September 23, 2022 (the “Effective Time”). Accordingly, at the Effective Time, every four issued and outstanding shares of the Company’s common stock were converted into one share of the Company’s common stock. No fractional shares were issued in connection with the Reverse Stock Split. Instead, each stockholder that would have held fractional shares as a result of the Reverse Stock Split received cash in lieu of such fractional shares. The par value per share of the Company’s common stock remained unchanged at $0.01 per share after the Reverse Stock Split. Accordingly, for all historical periods presented, an amount equal to the par value of the reduced number of shares resulting from the Reverse Stock Split was reclassified from Common stock to Additional paid in capital in the Company’s Consolidated Statements of Financial
ANNALY CAPITAL MANAGEMENT, INC. AND SUBSIDIARIES
Financial Statements
Condition. All references made to share or per share amounts in the accompanying consolidated financial statements and applicable disclosures have been retroactively adjusted to reflect the effects of the Reverse Stock Split.
| | |
| 3. SIGNIFICANT ACCOUNTING POLICIES |
|
The Company’s significant accounting policies are described below or are included elsewhere in these notes to the Consolidated Financial Statements.consolidated financial statements.
Principles of Consolidation – The consolidated financial statements include the accounts of the entities where the Company has a controlling financial interest. In order to determine whether the Company has a controlling financial interest, it first evaluates whether an entity is a voting interest entity (“VOE”) or a variable interest entity (“VIE”). All intercompany balances and transactions have been eliminated in consolidation.
Voting Interest Entities – A VOE is an entity that has sufficient equity and in which equity investors have a controlling financial interest. The Company consolidates VOEs where it has a majority of the voting equity of such VOE.
Variable Interest Entities – A VIE is defined as an entity in which equity investors (i) do not have the characteristics of a controlling financial interest, and/or (ii) do not have sufficient equity at risk for the entity to finance its activities without additional subordinated financial support from other parties. A VIE is required to be consolidated by its primary beneficiary, which is defined as the party that has both (i) the power to control the activities that most significantly impact the VIE’s
ANNALY CAPITAL MANAGEMENT, INC. AND SUBSIDIARIES
Financial Statements
economic performance and (ii) the obligation to absorb losses or the right to receive benefits from the VIE that could potentially be significant to the VIE.
The Company performs ongoing reassessments of whether changes in the facts and circumstances regarding the Company’s involvement with a VIE causes the Company’s consolidation conclusion to change. Refer to the “Variable Interest Entities” Note for further information.
Equity Method Investments - For entities that are not consolidated, but where the Company has significant influence over the operating or financial decisions of the entity, the Company accounts for the investment under the equity method of accounting. In accordance with the equity method of accounting, the Company will recognize its share of earnings or losses of the investee in the period in which they are reported by the investee. The Company also considers whether there are any indicators of other-than-temporary impairment of joint ventures accounted for under the equity method. These investments are included in real estate, net and Other assets with income or loss included in Other, income (loss).net.
Cash and Cash Equivalents – Cash and cash equivalents include cash on hand, cash held in money market funds on an overnight basis and cash pledged as collateral with counterparties. Cash deposited with clearing organizations is carried at cost, which approximates fair value. Cash and securities deposited with clearing organizations and collateral held in the form of cash on margin with counterparties to the Company’s interest rate swaps and other derivatives totaled $1.1 billion and $1.6$1.4 billion at December 31, 20202023 and December 31, 2019,2022, respectively.
Equity Securities – The Company may invest in equity securities that are not accounted for under the equity method or do not result in consolidation. These equity securities are required to be reported at fair value with unrealized gains and losses reported in the Consolidated Statements of Comprehensive Income (Loss) as Net unrealized gains (losses) on instruments measured at fair value through earnings, unless the securities do not have readily determinable fair values. For such equity securities without readily determinable fair values, the Company has elected to carry the securities at cost less impairment, if any, plus or minus changes resulting from observable price changes in orderly transactions for the identical or similar investment of the same issuer. For equity securities carried at fair value through earnings, dividends are recorded in earnings on the declaration date. Dividends from equity securities without readily determinable fair values are recognized as income when received to the extent they are distributed from net accumulated earnings.
Fair Value Measurements and the Fair Value Option – The Company reports various investments at fair value, including certain eligible financial instruments elected to be accounted for under the fair value option (“FVO”). The Company chooses to elect the fair value optionFVO in order to simplify the accounting treatment for certain financial instruments. Items for which the fair value optionFVO has been elected are presented at fair value in the Consolidated Statements of Financial Condition and any change in fair value is recorded in Net unrealized gains (losses) on instruments measured at fair value through earningsinvestments and other in the Consolidated Statements of Comprehensive Income (Loss). For additional information regarding financial instruments for which the Company has elected the fair value option seeFVO refer to the table in the “Financial Instruments” Note.
Refer to the “Fair Value Measurements” Note for a complete discussion on the methodology utilized by the Company to estimate the fair value of certain financial instruments.
Offsetting Assets and Liabilities - The Company elected to present all derivative instruments on a gross basis as discussed in the “Derivative Instruments” Note. Reverse repurchase and repurchase agreements are presented net in the Consolidated Statements of Financial Condition if they are subject to netting agreements and they meet the offsetting criteria. Please see below and referRefer to the “Secured Financing” Note for further discussion on reverse repurchase and repurchase agreements.
Derivative Instruments – Derivatives are accounted for in accordance with the Financial Accounting Standards Board (“FASB”) Accounting Standards Codification (“ASC”) 815, Derivatives and Hedging, which requires recognition of all derivativesrecognized as either assets or liabilities at fair value in the Consolidated Statements of Financial Condition with changes in fair value recognized in the Consolidated Statements of Comprehensive Income (Loss). The changes in the estimated fair value are presented within Net gains (losses) on other derivatives with the exception of interest rate swaps which are separately presented.derivatives. None of the Company’s derivative transactions have been designated as hedging instruments for accounting purposes. Refer to the “Derivative Instruments” Note for further discussion.
Stock-Based Compensation – The Company measures compensation expense for stock-based awards at fair value, which is generally based on the grant-date fair value of the Company’s common stock. Compensation expense is recognized ratably over
ANNALY CAPITAL MANAGEMENT, INC. AND SUBSIDIARIES
Financial Statements
the vesting or requisite service period of the award. Stock-based awards that contain market-based conditions are valued using a model.
Compensation expense for awards with performance conditions is recognized based on the probable outcome of the performance condition at each reporting date. Compensation expense for awards with market conditions is recognized irrespective of the probability of the market condition being achieved and is not reversed if the market condition is not met. Stock-based awards that do not require future service (i.e., vested awards) are expensed immediately. Forfeitures are recorded when they occur. The Company generally issues new shares of common stock upon delivery of stock-based awards.
ANNALY CAPITAL MANAGEMENT, INC. AND SUBSIDIARIES
Financial Statements
Interest Income - The Company recognizes interest income primarily on Residential Securities (as defined in the “Securities” Note), residential mortgage loans, commercial investments and reverse repurchase agreements. Interest accrued but not paidreceived is recognized as Interest receivable on the Consolidated Statements of Financial Condition. Interest income is presented as a separate line item on the Consolidated Statements of Comprehensive Income (Loss). Refer to the “Interest Income and Interest Expense” Note for further discussion.
For its securities, the Company recognizes coupon income, which is a component of interest income, based upon the outstanding principal amounts of the financial instruments and their contractual terms. In addition, the Company amortizes or accretes premiums or discounts into interest income for its Agency mortgage-backed securities (other than interest-only securities, multifamily and reverse mortgages), taking into account estimates of future principal prepayments in the calculation of the effective yield. The Company recalculates the effective yield as differences between anticipated and actual prepayments occur. Using third-partythird party model and market information to project future cash flows and expected remaining lives of securities, the effective interest rate determined for each security is applied as if it had been in place from the date of the security’s acquisition. The amortized cost of the security is then adjusted to the amount that would have existed had the new effective yield been applied since the acquisition date, which results in a cumulative premium amortization adjustment in each period. The adjustment to amortized cost is offset with a charge or credit to interest income. Changes in interest rates and other market factors will impact prepayment speed projections and the amount of premium amortization recognized in any given period.
Premiums or discounts associated with the purchase of Agency interest-only securities, reverse mortgages and residential credit securities are amortized or accreted into interest income based upon current expected future cash flows with any adjustment to yield made on a prospective basis.
Premiums or discounts associated with the purchase of multifamily securities are amortized or accreted into interest income based upon their contractual payment terms. If a prepayment occurs, an adjustment is made to the unpaid principal balance and unamortized premium or discount in the current period and the original effective yield continues to be applied.
Premiums and discounts associated with the purchase of residential mortgage loans and with those transferred or pledged to securitization trusts are primarily amortized or accreted into interest income over their estimated remaining lives using the effective interest rates inherent in the estimated cash flows from the mortgage loans. Amortization of premiums and accretion of discounts are presented in Interest income in the Consolidated Statements of Comprehensive Income (Loss).
If collection of a loan’s principal or interest is in doubt or the loan is 90 days or more past due, interest income is not accrued. For nonaccrual status loans carried at fair value or held for sale, interest is not accrued but is recognized on a cash basis. For nonaccrual status loans carried at amortized cost, if collection of principal is not in doubt but collection of interest is in doubt, interest income is recognized on a cash basis. If collection of principal is in doubt, any interest received is applied against principal until collectability of the remaining balance is no longer in doubt; at that point, any interest income is recognized on a cash basis. Generally, a loan is returned to accrual status when the borrower has resumed paying the full amount of the scheduled contractual obligation, if all principal and interest amounts contractually due are reasonably assured of repayment within a reasonable period of time and there is a sustained period of repayment performance by the borrower. Refer to the “Interest Income and Interest Expense” Note for further discussion on interest.
The Company has made an accounting policy election not to measure an allowance for loans losses for accrued interest receivable. If interest receivable is deemed to be uncollectible or not collected within 90 days of its contractual due date for commercial loans or 120 days for corporate debt carried at amortized cost, it is written off through a reversal of interest income. Any interest written off that is recovered is recognized as interest income.
Refer to the “Interest Income and Interest Expense” Note for further discussion of interest income.
Income Taxes – The Company has elected to be taxed as a REIT and intends to comply with the provisions of the Code, with respect thereto. As a REIT, the Company will not incur federal income tax to the extent that it distributes its taxable income to its stockholders. The Company and certain of its direct and indirect subsidiaries have made separate joint elections to treat these subsidiaries as taxable REIT subsidiaries (“TRSs”). As such, each of these TRSs is taxable as a domestic C corporation and subject to federal, state and local income taxes based upon its taxable income. Refer to the “Income Taxes” Note for further discussion on income taxes.
ANNALY CAPITAL MANAGEMENT, INC. AND SUBSIDIARIES
Financial Statements
Recent Accounting Pronouncements
The Company considershas early adopted ASU 2023-07, Improvements to Segment Reporting, as its Residential Credit and MSR operating segments have become a more significant component of consolidated results. Refer to the applicability“Segments” Note for more information.
The Company reviewed additional recently issued ASUs and impact of all Accounting Standards Updates (“ASUs”). ASUs not listed belowdetermined that they were not applicable, not expected to have a significant impact on the Company’s consolidated financial statements when adopted or did not have a significant impact on the Company’s consolidated financial statements upon adoption.
ANNALY CAPITAL MANAGEMENT, INC. AND SUBSIDIARIES
Financial Statements
| | | | | | | | | | | | | | |
Standard | Description | Effective Date | Effect on the Financial Statements or Other Significant Matters |
Standards that have been adopted |
ASU 2016-13 Financial instruments - Credit losses (Topic 326): Measurement of credit losses on financial instruments (“ASU 2016-13”)
| This ASU updates the existing incurred loss model to a current expected credit loss (“CECL”) model for financial assets and net investments in leases that are not accounted for at fair value through earnings. The amendments affect cash and cash equivalents, reverse repurchase agreements, certain loans, held-to-maturity debt securities, trade receivables, net investments in leases, off-balance sheet credit exposures and any other financial assets not excluded from the scope. There are also limited amendments to the impairment model for available-for-sale debt securities. | January 1, 2020 | The Company adopted ASU 2016-13 using the modified retrospective method for all financial assets and off-balance-sheet credit exposures in scope. The modified retrospective approach requires an adjustment to beginning retained earnings for the cumulative effect of adopting the standard. Results for reporting periods beginning after January 1, 2020 are presented in accordance with ASU 2016-13, while prior periods continue to be reported in accordance with previously applicable GAAP. As a result of the adoption, the Company recorded an increase to the loan loss allowance of $37.4 million and a liability of $2.2 million for unfunded loan commitments, which reduced beginning retained earnings by $39.6 million as of January 1, 2020.
|
ASU 2020-04
Reference Rate Reform (Topic 848): Facilitation of the Effects of Reference Rate Reform on Financial Reporting
| This ASU provides optional, temporary relief to accounting for contract modifications resulting from reference rate reform. | January 1, 2020 | The Company has elected to retrospectively apply the practical expedients to modifications of qualifying contracts as continuation of the existing contract rather than as a new contract. The adoption had no immediate impact and is not expected to have a material impact on the Company’s consolidated financial statements as the guidance continues to be applied to contract modifications until the ASU’s termination date. |
| | | |
|
| | | |
| | | |
ANNALY CAPITAL MANAGEMENT, INC. AND SUBSIDIARIES
Financial Statements
The following table presents characteristics for certain of the Company’s financial instruments at December 31, 20202023 and 2019.2022.
| Financial Instruments (1) | Financial Instruments (1) | Financial Instruments (1) |
| Balance Sheet Line Item | Balance Sheet Line Item | Type / Form | Measurement Basis | December 31, 2020 | | December 31, 2019 | Balance Sheet Line Item | Type / Form | Measurement Basis | December 31, 2023 | | December 31, 2022 |
| Assets | |
| | Assets | (dollars in thousands) | | |
| Securities | |
| | Securities | |
| | Securities | Securities | Agency mortgage-backed securities (2) | Fair value, with unrealized gains (losses) through other comprehensive income | $ | 73,562,972 | | | $ | 112,124,958 | |
| Securities | Securities | Agency mortgage-backed securities (3) | Fair value, with unrealized gains (losses) through earnings | 504,087 | | | 768,409 | |
| | Securities | Securities | Residential credit risk transfer securities | Fair value, with unrealized gains (losses) through earnings | 532,403 | | | 531,322 | |
| Securities | Securities | Non-agency mortgage-backed securities | Fair value, with unrealized gains (losses) through earnings | 972,192 | | | 1,135,868 | |
| Securities | Securities | Commercial real estate debt investments - CMBS | Fair value, with unrealized gains (losses) through other comprehensive income | 31,603 | | | 64,655 | |
| Securities | Securities | Commercial real estate debt investments - CMBS (4) | Fair value, with unrealized gains (losses) through earnings | 45,254 | | | 208,368 | |
| | Securities | |
| Securities | |
| Securities | |
| Securities | Securities | Commercial real estate debt investments - credit risk transfer securities | Fair value, with unrealized gains (losses) through earnings | 3,885 | | | 0 | |
| Total securities | Total securities | | 75,652,396 | | | 114,833,580 | |
| | Loans, net | Loans, net | Residential mortgage loans | Fair value, with unrealized gains (losses) through earnings | 345,810 | | | 1,647,787 | |
| Loans, net | Loans, net | Commercial real estate debt and preferred equity, held for investment | Amortized cost | 498,081 | | | 669,713 | |
| | Loans, net | Loans, net | Corporate debt held for investment, net | Amortized cost | 2,239,930 | | | 2,144,850 | |
| | | Total loans, net | Total loans, net | | 3,083,821 | | | 4,462,350 | |
| | Total loans, net | |
| | Total loans, net | |
| | Assets transferred or pledged to securitization vehicles | Assets transferred or pledged to securitization vehicles | Agency mortgage-backed securities | Fair value, with unrealized gains (losses) through other comprehensive income | 620,347 | | | 1,122,588 | |
| | Assets transferred or pledged to securitization vehicles | Assets transferred or pledged to securitization vehicles | Residential mortgage loans | Fair value, with unrealized gains (losses) through earnings | 3,249,251 | | | 2,598,374 | |
| | Assets transferred or pledged to securitization vehicles | Assets transferred or pledged to securitization vehicles | Commercial mortgage loans | Fair value, with unrealized gains (losses) through earnings | 2,166,073 | | | 2,345,120 | |
| Assets transferred or pledged to securitization vehicles | Commercial mortgage loans | Amortized cost | 874,349 | | | 936,378 | |
| | Total assets transferred or pledged to securitization vehicles | Total assets transferred or pledged to securitization vehicles | | 6,910,020 | | | 7,002,460 | |
| | Total assets transferred or pledged to securitization vehicles | |
| | Liabilities | | | | |
| Total assets transferred or pledged to securitization vehicles | |
| | Liabilities | |
| Liabilities | |
| Liabilities | |
| Repurchase agreements | |
| Repurchase agreements | |
| Repurchase agreements | Repurchase agreements | Repurchase agreements | Amortized cost | 64,825,239 | | | 101,740,728 | |
| Other secured financing | Other secured financing | Loans | Amortized cost | 917,876 | | | 4,455,700 | |
| Debt issued by securitization vehicles | Debt issued by securitization vehicles | Securities | Fair value, with unrealized gains (losses) through earnings | 5,652,982 | | | 5,622,801 | |
| Participations issued | Participations issued | Participations issued | Fair value, with unrealized gains (losses) through earnings | 39,198 | | | 0 | |
| Mortgages payable | Loans | Amortized cost | 426,256 | | | 485,005 | |
(1) Receivable for unsettled trades, Principal and interest receivable, Payable for unsettled trades, Interest payable and Dividends payable are accounted for at cost. (2) Includes Agency pass-through, collateralized mortgage obligation (“CMO”) and multifamily securities. (3) Includes interest-only securities and reverse mortgages. (4) Includes single-asset / single borrower CMBS. | | U.S. Treasury securities sold, not yet purchased | |
| (1) Receivable for unsettled trades, Principal and interest receivable, Payable for unsettled trades, Interest payable and Dividends payable are accounted for at cost. (2) Includes Agency pass-through, collateralized mortgage obligation (“CMO”) and multifamily securities purchased prior to July 1, 2022. (3) Includes interest-only securities and reverse mortgages and, effective July 1, 2022, newly purchased Agency pass-through, collateralized mortgage obligation (“CMO”) and multifamily securities. | |
(1) Receivable for unsettled trades, Principal and interest receivable, Payable for unsettled trades, Interest payable and Dividends payable are accounted for at cost. (2) Includes Agency pass-through, collateralized mortgage obligation (“CMO”) and multifamily securities purchased prior to July 1, 2022. (3) Includes interest-only securities and reverse mortgages and, effective July 1, 2022, newly purchased Agency pass-through, collateralized mortgage obligation (“CMO”) and multifamily securities. | |
(1) Receivable for unsettled trades, Principal and interest receivable, Payable for unsettled trades, Interest payable and Dividends payable are accounted for at cost. (2) Includes Agency pass-through, collateralized mortgage obligation (“CMO”) and multifamily securities purchased prior to July 1, 2022. (3) Includes interest-only securities and reverse mortgages and, effective July 1, 2022, newly purchased Agency pass-through, collateralized mortgage obligation (“CMO”) and multifamily securities. | |
The Company’s investments in securities include agency, credit risk transfer, non-agency and commercial mortgage-backed securities. All of the debt securities are classified as available-for-sale. Available-for-sale debt securities are carried at fair value, with changes in fair value recognized in other comprehensive income, unless the fair value option is elected in which case changes in fair value are recognized in Net unrealized gains (losses) on instruments measured at fair value through earningsinvestments and other in the Consolidated Statements of Comprehensive Income (Loss). Effective July 1, 2022, the Company elected the fair value option for any newly purchased Agency mortgage-backed securities in order to simplify the accounting for these securities. For the years ended December 31, 2023 and 2022, $611.5 million and ($665.6) million of unrealized gains (losses) on Agency mortgage-backed securities, for which the fair value option was elected effective July 1, 2022, were reported in Net gains (losses) on investments and other in the Company’s Consolidated Statements of Comprehensive Income (Loss). Agency mortgage-backed securities purchased prior to July 1, 2022, are still classified as available-for-sale with changes in fair value recognized in other comprehensive income. The Company has also elected the fair value option for CRT securities, interest only securities, Non-Agency and commercial mortgage-backed securities in order to simplify the accounting. Transactions for regular-way securities are recorded on trade date, including
ANNALY CAPITAL MANAGEMENT, INC. AND SUBSIDIARIES
Financial Statements
TBA to-be-announced (“TBA”) securities that meet the regular-way securities scope exception from derivative accounting. Gains and losses on disposals of securities are recorded on trade date based on the specific identification method.
Impairment – Management evaluates available-for-sale securities where the fair value option has not been elected and held-to-maturity debt securities for impairment at least quarterly, and more frequently when economic or market conditions warrant such evaluation. When the fair value of an available-for-sale security is less than its amortized cost, the security is considered impaired. For securities that are impaired, the Company determines if it (1) has the intent to sell the security, (2) is more likely
ANNALY CAPITAL MANAGEMENT, INC. AND SUBSIDIARIES
Financial Statements
than not that it will be required to sell the security before recovery of its amortized cost basis, or (3) does not expect to recover the entire amortized cost basis of the security. Further, the security is analyzed for credit loss (the difference between the present value of cash flows expected to be collected and the amortized cost basis). The credit loss, if any, will then be recognized in the Consolidated Statements of Comprehensive Income (Loss) as a Securities Loss Provisionsecurities loss provision and reflected as an Allowanceallowance for Credit Lossescredit losses on Securitiessecurities on the Consolidated Statements of Financial Condition, while the balance of losses related to other factors will be recognized as a component of Other comprehensive income (loss). For the year ended December 31, 2021, the Company recognized a $0.4 million impairment on a commercial mortgage-backed security that it intended to sell. There was no impairment recognized for the years ended December 31, 2023 and 2022. When the fair value of a held-to-maturity security is less than the cost, the Company performs an analysis to determine whether it expects to recover the entire cost basis of the security. There was no impairment recognized for the years ended December 31, 2020, 2019 and 2018.
Agency Mortgage-Backed Securities - The Company invests in mortgage pass-through certificates, collateralized mortgage obligations and other MBS representing interests in or obligations backed by pools of residential or multifamily mortgage loans and certificates. Many of the underlying loans and certificates are guaranteed by the Government National Mortgage Association (“Ginnie Mae”), the Federal Home Loan Mortgage Corporation (“Freddie Mac”) or the Federal National Mortgage Association (“Fannie Mae”) (collectively, “Agency mortgage-backed securities”).
Agency mortgage-backed securities may include forward contracts for Agency mortgage-backed securities purchases or sales of a generic pool, on a to-be-announced basis (“TBA securities”).basis. TBA securities without intent to accept delivery (“TBA derivatives”), are accounted for as derivatives as discussed in the “Derivative Instruments” Note.
CRT Securities - CRT securities are risk sharing instruments issued by Fannie Mae and Freddie Mac, and similarly structured transactions arranged by third party market participants. CRT securities are designed to synthetically transfer mortgage credit risk from Fannie Mae and Freddie Mac to private investors.
Non-Agency Mortgage-Backed Securities- The Company invests in non-Agency mortgage-backed securities such as those issued in prime loan, prime jumbo loan, Alt-A loan, subprime loan, non-performing loan (“NPL”) and re-performing loan (“RPL”) securitizations.
Agency mortgage-backed securities, non-Agency mortgage-backed securities and residential CRT securities are referred to herein as “Residential Securities.” Although the Company generally intends to hold most of its Residential Securities until maturity, it may, from time to time, sell any of its Residential Securities as part of the overall management of its portfolio.
Commercial Mortgage-Backed Securities (“Commercial Securities”) - Certain commercial mortgage-backed securities are classified as available-for-sale and reported at fair value with unrealized gains and losses reported as a component of Other comprehensive income (loss). Management evaluates suchThe Company invests in Commercial Securities for impairment at least quarterly. The Company elected the fair value option on certain Commercial Securities, includingsuch as conduit, commercial mortgage-backed securities, to simplify the accounting where the unrealized gainscredit CMBS, single-asset single borrower and losses on these financial instruments are recorded through earnings.collateralized loan obligations.
The following represents a rollforward of the activity for the Company’s securities excluding securities transferred or pledged to securitization vehicles, for the year ended December 31, 2020:2023:
| | Residential Securities | | Commercial Securities | | Total |
| (dollars in thousands) |
| Beginning balance January 1, 2020 | $ | 114,560,557 | | | $ | 273,023 | | | $ | 114,833,580 | |
| Agency Securities | | | Agency Securities | | Residential Credit Securities | | Commercial Securities | | Total |
| (dollars in thousands) | | | (dollars in thousands) |
| Beginning balance January 1, 2023 | |
| Purchases | Purchases | 33,082,119 | | | 25,285 | | | 33,107,404 | |
Sales and transfers (1) | (52,367,095) | | | (204,061) | | | (52,571,156) | |
| Sales | |
| Principal paydowns | Principal paydowns | (19,531,705) | | | (4,933) | | | (19,536,638) | |
| (Amortization) / accretion | (Amortization) / accretion | (1,374,490) | | | 652 | | | (1,373,838) | |
| Fair value adjustment | Fair value adjustment | 1,202,268 | | | (9,224) | | | 1,193,044 | |
| Ending balance December 31, 2020 | $ | 75,571,654 | | | $ | 80,742 | | | $ | 75,652,396 | |
| Ending balance December 31, 2023 | |
| (1) Includes transfers to securitization vehicles with a carrying value of $533.3 million during the year ended December 31, 2020. | |
ANNALY CAPITAL MANAGEMENT, INC. AND SUBSIDIARIES
Financial Statements
The following tables present the Company’s securities portfolio excluding securities transferred or pledged to securitization vehicles, that waswere carried at their fair value at December 31, 20202023 and 2019:2022:
| | | | December 31, 2020 | | December 31, 2023 |
| | | Principal /
Notional | | Remaining Premium | | Remaining Discount | | Amortized
Cost | | Unrealized
Gains | | Unrealized
Losses | | Estimated Fair Value | | Principal /
Notional | | Remaining Premium | | Remaining Discount | | Amortized
Cost | | Unrealized
Gains | | Unrealized
Losses | | Estimated Fair Value |
| Agency | Agency | (dollars in thousands) | Agency | (dollars in thousands) |
| Fixed-rate pass-through | Fixed-rate pass-through | $ | 64,800,235 | | | $ | 3,325,020 | | | $ | (22,143) | | | $ | 68,103,112 | | | $ | 3,200,542 | | | $ | (1,076) | | | $ | 71,302,578 | |
| Adjustable-rate pass-through | Adjustable-rate pass-through | 455,675 | | | 2,869 | | | (3,369) | | | 455,175 | | | 22,341 | | | 0 | | | 477,516 | |
| CMO | CMO | 139,664 | | | 2,177 | | | 0 | | | 141,841 | | | 7,926 | | | 0 | | | 149,767 | |
| Interest-only | Interest-only | 2,790,537 | | | 564,297 | | | 0 | | | 564,297 | | | 3,513 | | | (145,901) | | | 421,909 | |
Multifamily (1) | Multifamily (1) | 1,910,384 | | | 50,148 | | | (1,057) | | | 1,604,913 | | | 59,548 | | | (954) | | | 1,663,507 | |
| Reverse mortgages | Reverse mortgages | 47,585 | | | 4,183 | | | 0 | | | 51,768 | | | 252 | | | (238) | | | 51,782 | |
| Total agency securities | Total agency securities | $ | 70,144,080 | | | $ | 3,948,694 | | | $ | (26,569) | | | $ | 70,921,106 | | | $ | 3,294,122 | | | $ | (148,169) | | | $ | 74,067,059 | |
| Residential credit | Residential credit | | | | | | | | | | | | | | Residential credit | | | | | |
CRT (2) | $ | 544,780 | | | $ | 7,324 | | | $ | (2,430) | | | $ | 538,941 | | | $ | 3,062 | | | $ | (9,600) | | | $ | 532,403 | |
| Credit risk transfer | |
| Alt-A | Alt-A | 93,001 | | | 51 | | | (17,368) | | | 75,684 | | | 4,644 | | | 0 | | | 80,328 | |
| Prime | 177,852 | | | 5,126 | | | (15,999) | | | 166,979 | | | 14,607 | | | (77) | | | 181,509 | |
| Prime interest-only | 194,687 | | | 1,882 | | | 0 | | | 1,882 | | | 0 | | | (642) | | | 1,240 | |
Prime (2) | |
| | Subprime | |
| Subprime | |
| Subprime | Subprime | 197,779 | | | 584 | | | (18,181) | | | 180,182 | | | 8,312 | | | (61) | | | 188,433 | |
| NPL/RPL | NPL/RPL | 475,108 | | | 821 | | | (2,416) | | | 473,513 | | | 3,782 | | | (1,448) | | | 475,847 | |
| Prime jumbo (>=2010 vintage) | 44,696 | | | 207 | | | (5,300) | | | 39,603 | | | 3,680 | | | 0 | | | 43,283 | |
| Prime jumbo (>=2010 vintage) Interest-only | 291,624 | | | 6,803 | | | 0 | | | 6,803 | | | 0 | | | (5,251) | | | 1,552 | |
Prime jumbo (>=2010 vintage) (3) | |
| | Total residential credit securities | Total residential credit securities | $ | 2,019,527 | | | $ | 22,798 | | | $ | (61,694) | | | $ | 1,483,587 | | | $ | 38,087 | | | $ | (17,079) | | | $ | 1,504,595 | |
| Total Residential Securities | $ | 72,163,607 | | | $ | 3,971,492 | | | $ | (88,263) | | | $ | 72,404,693 | | | $ | 3,332,209 | | | $ | (165,248) | | | $ | 75,571,654 | |
| Total residential credit securities | |
| Total residential credit securities | |
| Total residential securities | |
| Commercial | Commercial | | | | | | | | | | | | | |
| Commercial Securities | $ | 89,858 | | | 0 | | | $ | (7,471) | | | $ | 82,387 | | | $ | 54 | | | $ | (1,699) | | | $ | 80,742 | |
| Commercial securities | |
| Commercial securities | |
| Commercial securities | |
| Total securities | Total securities | $ | 72,253,465 | | | $ | 3,971,492 | | | $ | (95,734) | | | $ | 72,487,080 | | | $ | 3,332,263 | | | $ | (166,947) | | | $ | 75,652,396 | |
| | | |
| | | | | | December 31, 2019 | December 31, 2022 |
| | | Principal /
Notional | | Remaining Premium | | Remaining Discount | | Amortized
Cost | | Unrealized
Gains | | Unrealized
Losses | | Estimated Fair Value | | Principal /
Notional | | Remaining Premium | | Remaining Discount | | Amortized
Cost | | Unrealized
Gains | | Unrealized
Losses | | Estimated Fair Value |
| Agency | Agency | (dollars in thousands) | Agency | (dollars in thousands) |
| Fixed-rate pass-through | Fixed-rate pass-through | $ | 102,448,565 | | | $ | 4,345,053 | | | $ | (46,614) | | | $ | 106,747,004 | | | $ | 2,071,583 | | | $ | (95,173) | | | $ | 108,723,414 | |
| Adjustable-rate pass-through | Adjustable-rate pass-through | 1,474,818 | | | 72,245 | | | (1,400) | | | 1,545,663 | | | 10,184 | | | (31,516) | | | 1,524,331 | |
| CMO | CMO | 156,937 | | | 2,534 | | | 0 | | | 159,471 | | | 545 | | | 0 | | | 160,016 | |
| | Interest-only | Interest-only | 4,486,845 | | | 862,905 | | | 0 | | | 862,905 | | | 2,787 | | | (157,130) | | | 708,562 | |
| Multifamily | 1,619,900 | | | 19,981 | | | (2,280) | | | 1,637,601 | | | 82,292 | | | (2,696) | | | 1,717,197 | |
| Interest-only | |
| Interest-only | |
Multifamily (1) | |
| Reverse mortgages | Reverse mortgages | 54,553 | | | 5,053 | | | 0 | | | 59,606 | | | 550 | | | (309) | | | 59,847 | |
| Total agency investments | Total agency investments | $ | 110,241,618 | | | $ | 5,307,771 | | | $ | (50,294) | | | $ | 111,012,250 | | | $ | 2,167,941 | | | $ | (286,824) | | | $ | 112,893,367 | |
| Residential credit | Residential credit | | | | | | | | | | | | | | Residential credit | | | | | |
CRT (2) | $ | 517,110 | | | $ | 15,850 | | | $ | (2,085) | | | $ | 515,950 | | | $ | 16,605 | | | $ | (1,233) | | | $ | 531,322 | |
| Credit risk transfer | |
| Alt-A | Alt-A | 160,957 | | | 250 | | | (22,306) | | | 138,901 | | | 12,482 | | | 0 | | | 151,383 | |
| Prime | 277,076 | | | 3,362 | | | (17,794) | | | 262,644 | | | 14,142 | | | (529) | | | 276,257 | |
| Prime interest-only | 391,234 | | | 3,757 | | | 0 | | | 3,757 | | | 0 | | | (590) | | | 3,167 | |
Prime (2) | |
| | Subprime | |
| Subprime | |
| Subprime | Subprime | 370,263 | | | 1,356 | | | (59,727) | | | 311,892 | | | 37,205 | | | (118) | | | 348,979 | |
| NPL/RPL | NPL/RPL | 164,180 | | | 351 | | | (440) | | | 164,091 | | | 191 | | | (14) | | | 164,268 | |
| Prime jumbo (>=2010 vintage) | 182,709 | | | 1,026 | | | (4,281) | | | 179,454 | | | 5,360 | | | (150) | | | 184,664 | |
| Prime jumbo (>=2010 vintage) Interest-only | 554,189 | | | 9,001 | | | 0 | | | 9,001 | | | 0 | | | (1,851) | | | 7,150 | |
Prime jumbo (>=2010 vintage) (3) | |
| | Total residential credit securities | Total residential credit securities | $ | 2,617,718 | | | $ | 34,953 | | | $ | (106,633) | | | $ | 1,585,690 | | | $ | 85,985 | | | $ | (4,485) | | | $ | 1,667,190 | |
| Total Residential Securities | $ | 112,859,336 | | | $ | 5,342,724 | | | $ | (156,927) | | | $ | 112,597,940 | | | $ | 2,253,926 | | | $ | (291,309) | | | $ | 114,560,557 | |
| Total residential credit securities | |
| Total residential credit securities | |
| Total residential securities | |
| Commercial | Commercial | | | | | | | | | | | | | |
| Commercial Securities | $ | 263,965 | | | $ | 10,873 | | | $ | (9,393) | | | $ | 265,445 | | | $ | 7,710 | | | $ | (132) | | | $ | 273,023 | |
| Commercial securities | |
| Commercial securities | |
| Commercial securities | |
| Total securities | Total securities | $ | 113,123,301 | | | $ | 5,353,597 | | | $ | (166,320) | | | $ | 112,863,385 | | | $ | 2,261,636 | | | $ | (291,441) | | | $ | 114,833,580 | |
| (1) Principal/Notional amount includes $14.0 billion and $8.4 billion of Agency Multifamly interest-only securities as of December 31, 2023 and December 31, 2022, respectively. (2) Principal/Notional amount includes $0.9 billion and $1.7 billion of Prime interest-only securities as of December 31, 2023 and December 31, 2022, respectively. (3) Principal/Notional amount includes $9.1 billion and $5.5 billion of Prime Jumbo interest-only securities as of December 31, 2023 and December 31, 2022, respectively. | |
(1) Principal/Notional amount includes $14.0 billion and $8.4 billion of Agency Multifamly interest-only securities as of December 31, 2023 and December 31, 2022, respectively. (2) Principal/Notional amount includes $0.9 billion and $1.7 billion of Prime interest-only securities as of December 31, 2023 and December 31, 2022, respectively. (3) Principal/Notional amount includes $9.1 billion and $5.5 billion of Prime Jumbo interest-only securities as of December 31, 2023 and December 31, 2022, respectively. | |
(1) Principal/Notional amount includes $14.0 billion and $8.4 billion of Agency Multifamly interest-only securities as of December 31, 2023 and December 31, 2022, respectively. (2) Principal/Notional amount includes $0.9 billion and $1.7 billion of Prime interest-only securities as of December 31, 2023 and December 31, 2022, respectively. (3) Principal/Notional amount includes $9.1 billion and $5.5 billion of Prime Jumbo interest-only securities as of December 31, 2023 and December 31, 2022, respectively. | |
(1)
Principal/Notional amount includes $354.6 million and $0 million of an Agency CMBS interest-only security as of December 31, 2020 and December 31, 2019, respectively.
ANNALY CAPITAL MANAGEMENT, INC. AND SUBSIDIARIES
Financial Statements
(2) Principal/Notional amount includes $10.7 million and $14.9 million of a CRT interest-only security as of December 31, 2020 and December 31, 2019, respectively.
The following table presents the Company’s Agency mortgage-backed securities portfolio excluding securities transferred or pledged to securitization vehicles, by issuing Agency at December 31, 20202023 and 2019:2022:
| | December 31, 2020 | | December 31, 2019 |
| December 31, 2023 | | | December 31, 2023 | | December 31, 2022 |
| Investment Type | Investment Type | (dollars in thousands) | Investment Type | (dollars in thousands) |
| Fannie Mae | Fannie Mae | $ | 56,218,033 | | | $ | 76,656,831 | |
| Freddie Mac | Freddie Mac | 17,735,041 | | | 36,087,100 | |
| Ginnie Mae | Ginnie Mae | 113,985 | | | 149,436 | |
| Total | Total | $ | 74,067,059 | | | $ | 112,893,367 | |
|
Actual maturities of the Company’s Residential Securities are generally shorter than stated contractual maturities because actual maturities of the portfolio are affected by periodic payments and prepayments of principal on the underlying mortgages.
The following table summarizes the Company’s Residential Securities excluding securities transferred or pledged to securitization vehicles, at December 31, 20202023 and 2019,2022, according to their estimated weighted average life classifications:
| | | | December 31, 2020 | | December 31, 2019 | | December 31, 2023 | | December 31, 2022 |
| Estimated Fair Value | | Amortized
Cost | | Estimated Fair Value | | Amortized
Cost |
| Estimated Fair Value | | | Estimated Fair Value | | Amortized
Cost | | Estimated Fair Value | | Amortized
Cost |
| Estimated weighted average life | Estimated weighted average life | (dollars in thousands) | Estimated weighted average life | (dollars in thousands) |
| Less than one year | Less than one year | $ | 110,203 | | | $ | 109,540 | | | $ | 3,997 | | | $ | 4,543 | |
| Greater than one year through five years | Greater than one year through five years | 45,643,138 | | | 43,404,877 | | | 36,290,254 | | | 35,581,833 | |
| Greater than five years through ten years | Greater than five years through ten years | 28,509,058 | | | 27,610,923 | | | 77,732,756 | | | 76,504,845 | |
| Greater than ten years | Greater than ten years | 1,309,255 | | | 1,279,353 | | | 533,550 | | | 506,719 | |
| Total | Total | $ | 75,571,654 | | | $ | 72,404,693 | | | $ | 114,560,557 | | | $ | 112,597,940 | |
|
The estimated weighted average lives of the Residential Securities at December 31, 20202023 and 20192022 in the table above are based upon projected principal prepayment rates. The actual weighted average lives of the Residential Securities could be longer or shorter than projected.
The following table presents the gross unrealized losses and estimated fair value of the Company’s Agency mortgage-backed securities, accounted for as available-for-sale where the fair value option has not been elected, by length of time that such securities have been in a continuous unrealized loss position at December 31, 20202023 and 2019.2022.
| | | | | | | | | | | | | | | | | | | | | | | | | | | | | | | | | | | |
| | December 31, 2020 | | December 31, 2019 |
| | Estimated Fair Value (1) | | Gross Unrealized Losses (1) | | Number of Securities (1) | | Estimated Fair Value (1) | | Gross Unrealized Losses (1) | | Number of Securities (1) |
| | (dollars in thousands) |
| Less than 12 months | $ | 777,586 | | | $ | (2,030) | | | 30 | | | $ | 7,388,239 | | | $ | (24,056) | | | 139 | |
| 12 Months or more | 0 | | | 0 | | | 0 | | | 11,619,280 | | | (105,329) | | | 352 | |
| Total | $ | 777,586 | | | $ | (2,030) | | | 30 | | | $ | 19,007,519 | | | $ | (129,385) | | | 491 | |
| | | | | | | | | | | |
(1) Excludes interest-only mortgage-backed securities and reverse mortgages.
|
| | | | | | | | | | | | | | | | | | | | | | | | | | | | | | | | | | | |
| | December 31, 2023 | | December 31, 2022 |
| | Estimated Fair Value (1) | | Gross Unrealized Losses (1) | | Number of Securities (1) | | Estimated Fair Value (1) | | Gross Unrealized Losses (1) | | Number of Securities (1) |
| | (dollars in thousands) |
| Less than 12 months | $ | 35,453 | | | $ | (418) | | | 16 | | | $ | 33,061,267 | | | $ | (3,448,120) | | | 2,481 | |
| 12 Months or more | 15,455,118 | | | (1,340,032) | | | 1,747 | | | 1,260,378 | | | (266,686) | | | 129 | |
| Total | $ | 15,490,571 | | | $ | (1,340,450) | | | 1,763 | | | $ | 34,321,645 | | | $ | (3,714,806) | | | 2,610 | |
| | | | | | | | | | | |
(1) Excludes interest-only mortgage-backed securities and reverse mortgages and, effective July 1, 2022, newly purchased Agency pass-through, collateralized mortgage obligation (“CMO”) and multifamily securities. |
The decline in value of these securities is solely due to market conditions and not the quality of the assets. Substantially all of the Agency mortgage-backed securities are “AAA” ratedhave an actual or carry an implied “AAA” rating. Thecredit rating that is the same as that of the U.S. government. An impairment has not been recognized in earnings related to these investments arebecause the decline in value is not consideredrelated to be impaired becausecredit quality, the Company currently has not made a decision to sell the ability and intent to hold the investments to maturity or for a period of time sufficient for a forecasted market price recovery up to or beyond the cost of the investments, andsecurities nor is it is not more likely than not that the Companysecurities will be required to sell the investmentsbe sold before recovery of the amortized cost bases, which may be maturity.recovery.
During the years ended December 31, 20202023 and 2019,2022, the Company disposed of $51.8$36.4 billion and $25.5$28.9 billion respectively,amortized cost basis of Residential Securities.Securities, respectively. The following table presents the Company’s net gains (losses) from the disposal of Residential Securities for the years ended December 31, 20202023 and 2019.2022, which is included in Net gains (losses) on investments and other in the Consolidated Statements of Comprehensive Income (Loss).
| | | | | | | | | | | | | | | | | |
| | Gross Realized Gains | | Gross Realized Losses | | Net Realized Gains (Losses) |
| For the year ended | (dollars in thousands) |
| December 31, 2023 | $ | 29,668 | | | $ | (2,920,487) | | | $ | (2,890,819) | |
| December 31, 2022 | $ | 66,587 | | | $ | (3,663,446) | | | $ | (3,596,859) | |
| | | | | |
| | | | | |
| | | | | |
ANNALY CAPITAL MANAGEMENT, INC. AND SUBSIDIARIES
Financial Statements
| | | | | | | | | | | | | | | | | |
| | Gross Realized Gains | | Gross Realized Losses | | Net Realized Gains (Losses) |
| For the year ended | (dollars in thousands) |
| December 31, 2020 | $ | 942,450 | | | $ | (305,449) | | | $ | 637,001 | |
| December 31, 2019 | $ | 172,518 | | | $ | (210,317) | | | $ | (37,799) | |
| | | | | |
| | | | | |
| | | | | |
The Company invests in residential commercial and corporate loans. Loans are classified as either held for investment or held for sale. Loans are also eligible to be accounted for under the fair value option. If loans are elected under the fair value option, they are carried at fair value with changes in fair value recognized in earnings. Otherwise, loans held for investment are carried at cost less impairment and loans held for sale are accounted for at the lower of cost or fair value.
Excluding loans transferred or pledged to securitization vehicles and loan warehouse facilities, as of December 31, 20202023 and 2019,2022, the Company reported $0.3$2.4 billion and $1.6$1.8 billion, respectively, of loans for which the fair value option was elected. If loans are held for investment and the fair value option has not been elected, they are accounted for at amortized cost less impairment. If the Company intends to sell or securitize the loans and the securitization vehicle is not expected to be consolidated, the loans are classified as held for sale. If loans are held for sale and the fair value option was not elected, they are accounted for at the lower of cost or fair value. Any origination fees and costs or purchase premiums or discounts are deferred and recognized upon sale. The Company determines the fair value of loans held for sale on an individual loan basis. The carrying value of the Company’s residential loans held for sale was $1.2 million and $1.3 million at December 31, 2023 and 2022, respectively.
Allowance for Losses – ThePrior to the sale of its corporate debt and commercial loan portfolios, the Company evaluatesevaluated the need for a loss reserve on each of its loans classified as held-for-investment where the fair value option is not elected. Allowance for loan losses are written off in the period the loans are deemed uncollectible.
Given the unique nature of each underlying borrowerheld-for investment and any collateral, the Company assesses an allowance for each individual loan held-for-investment. A provision is establishedcarried at origination or acquisition that reflects management’s estimate of the totalamortized cost based upon estimated current expected credit loss over the expected life of the loan. In estimating the lifetime expected credit losses, management utilizes a probability of default and loss given default methodology (“Loss Given Default methodology”), which considers projected economic conditions over the reasonable and supportable forecast period. The forecast incorporates primarily market-based assumptions including, but not limited to, forward interest rate curves, unemployment rate estimates and certain indexes sourced from third party vendors. For any remaining period of the expected life of the loan after the reasonable and supportable period, the Company reverts to historical losses on a straight-line basis. Management uses third-party vendors’ loan pool data for loans with similar risk characteristics to estimate historical losses given the limited loss history of the Company’s loan portfolio. Changes in the lifetime expected credit loss are reflected in Loan loss provision in the Consolidated Statements of Comprehensive Income (Loss).
For loans experiencing credit deterioration, the Company may use a different methodology to determine the expected credit losses such as a discounted cash flow analysis. For collateral-dependent loans, if foreclosure is probable, expected credit losses are based on the fair value of the collateral at the reporting date, adjusted for any selling costs, if applicable. Additionally, the Company may elect the practical expedient for a financial asset for which the repayment is expected to be provided substantially through the operation or sale of the collateral when the borrower is experiencing financial difficulty by measuring the allowance as the difference between the fair value of the collateral, less costs to sell, if applicable, and the amortized cost basis of the financial asset at the reporting date. The Company’s commercial loans are collateralized by commercial real estate including, but not limited to, multifamily real estate, office and retail space, hotels and industrial space. At origination, the fair value of the collateral generally exceeds the principal loan balance.
Management assesses the credit quality of the portfolio and adequacy of loan loss reserves on a quarterly basis, or more frequently as necessary. Significant judgment is required in this analysis. Depending on the expected recovery of its investment, the Company considers the estimated net recoverable value of the loans as well as other factors, including but not limited to the fair value of any collateral, the amount and the status of any senior debt, the prospects for the borrower and the competitive landscape where the borrower conducts business. To determine if loan loss allowances are required on investments in corporate debt, the Company reviews the monthly and/or quarterly financial statements of the borrowers, verifies loan compliance packages, if applicable, and analyzes current results relative to budgets and sensitivities performed at inception of the investment. Because these determinations are based upon projections of future economic events, which are inherently subjective, the amounts ultimately realized may differ materially from the carrying value as of the reporting date.
The Company may be exposed to various levels of credit risk depending on the nature of its investments and credit enhancements, if any, supporting its assets. The Company’s core investment process includes procedures related to the initial approval and periodic monitoring of credit risk and other risks associated with each investment. The Company’s investment underwriting procedures include evaluation of the underlying borrowers’ ability to manage and operate their respective properties or companies. Management reviews loan-to-value metrics at origination or acquisition of a new investment and if events occur that trigger re-evaluation by management.
ANNALY CAPITAL MANAGEMENT, INC. AND SUBSIDIARIES
Financial Statements
losses.The Company recorded net loan loss provisions(provisions) reversals of $147.6$0.2 million, $16.6$20.7 million and $3.5$145.1 million for the years ended December 31, 2020, 20192023, 2022 and 2018,2021, respectively. As of December 31, 20202023 and 2019,2022, the Company’s loan loss allowance was $169.5 million$0 and $20.1 million,$0, respectively.
The following table presents the activity of the Company’s loan investments, including loans held for sale and excluding loans transferred or pledged to securitization vehicles and loan warehouse facilities, for the year ended December 31, 2020:2023:
| | | | | | | | | | | | | | | | | | | | | | | |
| Residential | | Commercial | | Corporate | | Total |
| (dollars in thousands) |
| Beginning balance January 1, 2020 | $ | 1,647,787 | | | $ | 669,713 | | | $ | 2,144,850 | | | $ | 4,462,350 | |
| Impact of adopting CECL | 0 | | | (3,599) | | | (29,653) | | | (33,252) | |
| Purchases / originations | 1,168,830 | | | 217,329 | | | 1,061,644 | | | 2,447,803 | |
Sales and transfers (1) | (2,298,391) | | | (235,533) | | | (357,930) | | | (2,891,854) | |
| | | | | | | |
| | | | | | | |
| | | | | | | |
| Principal payments | (154,864) | | | (77,422) | | | (576,759) | | | (809,045) | |
Gains / (losses) (2) | (11,854) | | | (74,965) | | | (14,429) | | | (101,248) | |
| (Amortization) / accretion | (5,698) | | | 2,558 | | | 12,207 | | | 9,067 | |
| | | | | | | |
| Ending balance December 31, 2020 | $ | 345,810 | | | $ | 498,081 | | | $ | 2,239,930 | | | $ | 3,083,821 | |
| | | | | | | |
(1) Includes securitizations, syndications and transfers to securitization vehicles or REO. Includes transfer of residential loans to securitization vehicles with a carrying value of $1.9 billion during the year ended December 31, 2020. |
(2) Includes loan loss allowances. |
The carrying value of the Company’s residential loans held for sale was $47.0 million and $66.7 million at December 31, 2020 and 2019, respectively.
The Company also has off-balance-sheet credit exposures related to unfunded loan commitments, including revolvers, delayed draw term loans and future funding commitments that are not unconditionally cancelable by the Company. The Company utilizes the same methodology in calculating the liability related to the expected credit losses on these exposures as it does for the calculation of the allowance for loan losses. In determining the estimate of credit losses for off-balance-sheet credit exposures, the Company will consider the contractual period in which the entity is exposed to credit risk and the likelihood that funding will occur, if material. Estimated credit losses for off-balance-sheet credit exposures are included in Other liabilities on the Company’s Consolidated Statements of Financial Condition.
| | | | | | | | | | | | | |
| Residential Loans | | | | | | | | |
| (dollars in thousands) |
| Beginning balance January 1, 2023 | $ | 1,809,832 | | | | | | | | | |
| | | | | | | | | |
| Purchases / originations | 5,497,162 | | | | | | | | | |
Sales and transfers (1) | (4,905,106) | | | | | | | | | |
| | | | | | | | | |
| | | | | | | | | |
| | | | | | | | | |
| Principal payments | (118,932) | | | | | | | | | |
| Gains / (losses) | 78,315 | | | | | | | | | |
| (Amortization) / accretion | (8,187) | | | | | | | | | |
| | | | | | | | | |
| Ending balance December 31, 2023 | $ | 2,353,084 | | | | | | | | | |
| | | | | | | | | |
(1) Includes transfer of residential loans to securitization vehicles with a carrying value of $4.9 billion during the year ended December 31, 2023. |
Residential
The Company’s residential mortgage loans are primarily comprised of performing adjustable-rate and fixed-rate whole loans. The Company’s residential loans are accounted for under the fair value option with changes in fair value reflected in Net unrealized gains (losses) on instruments measured at fair value through earningsinvestments and other in the Consolidated Statements of Comprehensive Income. Additionally, the Company consolidates a collateralized financing entity that securitized prime adjustable-rate jumbo residential mortgage loans.Income (Loss). The Company also consolidates securitization trusts in which it had purchased subordinated securities because it also has certain powers and rights to direct the activities of such trusts. Refer to the “Variable Interest Entities” Note for further information related to the Company’s consolidated residential mortgage loan trusts.
The mortgage loans are secured by first liens on primarily one-to-four family residential properties. A subsidiary of the Company has engaged a third party to act as its custodian, agent and bailee for the purposes of receiving and holding certain documents, instruments and papers related to the residential mortgage loans it purchases. Pursuant to the Company’s custodial agreement, the custodian segregates and maintains continuous custody of all documents constituting the mortgage file with respect to each mortgage loan owned by the subsidiary in secure and fire resistant facilities and in a manner consistent with the standard of care employed by prudent mortgage loan document custodians. At or prior to the funding of any residential mortgage loan, the related seller, pursuant to the terms of our mortgage loan purchase agreement, must deliver to the custodian, the mortgage loan documents including the mortgage note, the mortgage and other related loan documents. In addition, a complete credit file for the related mortgage and borrower must be delivered to the subsidiary prior to the date of purchase.
ANNALY CAPITAL MANAGEMENT, INC. AND SUBSIDIARIES
Financial Statements
The following table presents the fair value and the unpaid principal balances of the residential mortgage loan portfolio, including loans transferred or pledged to securitization vehicles and excluding loan warehouse facilities, at December 31, 20202023 and 2019:2022:
| | | | | | | | |
| December 31, 2020 | December 31, 2019 |
| | (dollars in thousands) |
| Fair value | $ | 3,595,061 | | $ | 4,246,161 | |
| Unpaid principal balance | $ | 3,482,865 | | $ | 4,133,149 | |
ANNALY CAPITAL MANAGEMENT, INC. AND SUBSIDIARIES
Financial Statements
| | | | | | | | |
| December 31, 2023 | December 31, 2022 |
| | (dollars in thousands) |
| Fair value | $ | 15,660,706 | | $ | 10,931,744 | |
| Unpaid principal balance | $ | 16,611,204 | | $ | 12,247,346 | |
The following table provides information regarding the line items and amounts recognized in the Consolidated Statements of Comprehensive Income (Loss) for December 31, 20202023 and 20192022 for these investments:investments, excluding loan warehouse facilities:
| | | | | | | | | | | |
| For the Years Ended |
| December 31, 2020 | | December 31, 2019 |
| | (dollars in thousands) |
| Interest income | $ | 170,259 | | | $ | 150,066 | |
| Net gains (losses) on disposal of investments | (38,372) | | | (18,619) | |
| Net unrealized gains (losses) on instruments measured at fair value through earnings | 37,693 | | | 51,290 | |
| Total included in net income (loss) | $ | 169,580 | | | $ | 182,737 | |
| | | |
| | | | | | | | | | | |
| For the Years Ended |
| December 31, 2023 | | December 31, 2022 |
| | (dollars in thousands) |
| Interest income | $ | 703,838 | | | $ | 410,195 | |
Net gains (losses) on disposal of investments (1) | (5,049) | | | (12,842) | |
Net unrealized gains (losses) on instruments measured at fair value through earnings (1) | 374,764 | | | (1,420,645) | |
| Total included in net income (loss) | $ | 1,073,553 | | | $ | (1,023,292) | |
| | | |
(1) These amounts are presented in the line item Net gains (losses) on investments and other on the Consolidated Statements of Comprehensive Income (loss). |
The following table provides the geographic concentrations based on the unpaid principal balances at December 31, 20202023 and 20192022 for the residential mortgage loans, including loans transferred or pledged to securitization vehicles:
| | Geographic Concentrations of Residential Mortgage Loans | Geographic Concentrations of Residential Mortgage Loans | Geographic Concentrations of Residential Mortgage Loans |
| December 31, 2020 | | December 31, 2019 |
| December 31, 2023 | | December 31, 2023 | | December 31, 2022 |
| Property location | Property location | % of Balance | | Property location | % of Balance | Property location | % of Balance | | Property location | % of Balance |
| California | California | 48.9% | | California | 52.1% | California | 40.1% | | California | 44.8% |
| Florida | | Florida | 10.6% | | New York | 10.3% |
| New York | New York | 14.0% | | New York | 10.5% | New York | 10.5% | | Florida | 8.3% |
| Florida | 6.0% | | Florida | 5.3% |
| Texas | | Texas | 5.6% | | Texas | 5.1% |
| All other (none individually greater than 5%) | All other (none individually greater than 5%) | 31.1% | | All other (none individually greater than 5%) | 32.1% | All other (none individually greater than 5%) | 33.2% | | All other (none individually greater than 5%) | 31.5% |
| | Total | Total | 100.0% | | 100.0% |
| | Total | |
| | Total | | 100.0% | | | 100.0% |
|
The following table provides additional data on the Company’s residential mortgage loans, including loans transferred or pledged to securitization vehicles, at December 31, 20202023 and 2019:2022:
| | | | December 31, 2020 | | December 31, 2019 | | December 31, 2023 | | December 31, 2022 |
| | | Portfolio Range | Portfolio Weighted
Average | | Portfolio Range | Portfolio Weighted Average | | Portfolio Range | Portfolio Weighted
Average | | Portfolio Range | Portfolio Weighted Average |
| | | (dollars in thousands) | | (dollars in thousands) |
| Unpaid principal balance | Unpaid principal balance | $1 - $3,448 | | $473 | | $1 - $3,448 | | $459 | Unpaid principal balance | $1 - $4,396 | | $477 | | $3 - $4,396 | | $489 |
| Interest rate | Interest rate | 0.50% - 9.24% | | 4.89% | | 2.00% - 8.38% | | 4.94% | Interest rate | 2.00% - 13.25% | | 5.63% | | 2.00% - 15.00% | | 4.61% |
| Maturity | Maturity | 7/1/2029 - 1/1/2061 | | 4/17/2046 | | 1/1/2028 - 12/1/2059 | | 12/29/2047 | Maturity | 7/1/2029 - 12/1/2063 | | 4/22/2052 | | 7/1/2029 - 1/1/2063 | | 10/6/2051 |
| FICO score at loan origination | FICO score at loan origination | 505 - 829 | | 755 | | 505 - 829 | | 758 | FICO score at loan origination | 549 - 850 | | 758 | | 588 - 831 | | 759 |
| Loan-to-value ratio at loan origination | Loan-to-value ratio at loan origination | 8% - 104% | | 67% | | 8% - 105% | | 67% | Loan-to-value ratio at loan origination | 3% - 100% | | 68% | | 5% - 100% | | 68% |
At December 31, 20202023 and 2019,2022, approximately 37%11% and 36%11%, respectively, of the carrying value of the Company’s residential mortgage loans, including loans transferred or pledged to securitization vehicles, were adjustable-rate.
Commercial
The Company’s commercial real estate loans are comprised of adjustable-rateCompany participated in an arrangement that provided a residential mortgage loan warehouse facility to a third party originator. The arrangement was not renewed and fixed-rate loans.expired during the quarter-ended September 30, 2023. The difference between the principal amount of a loan and proceeds at acquisition is recorded as either a discount or premium. Commercial real estate loans and preferred equity interests that are designated as held for investment and are originated or purchased by the Company are carried at their outstanding principal balance, net of unamortized origination fees and costs, premiums or discounts, less an allowance for losses, if necessary. Origination fees and costs, premiums or discounts are amortized into interest income over the life of the loan.
Management generally reviews the most recent financial information and metrics derived therefrom produced by the borrower, which may include, but is not limitedhad elected to net operating income (“NOI”), debt service coverage ratios, property debt yields (net cash flow or NOI divided by the amount of outstanding indebtedness), loan per unit and rent rolls relating to each of the Company’s commercial real estate loans and preferred equity interests (“CRE Debt and Preferred Equity Investments”), and may consider other factors management deems important. Management also reviews market pricing to assess each borrower’s ability to refinance their respective assets at the maturity of each loan, in addition to economic trends (both macro and those affecting the property specifically), and the supply and demand of competing projects in the sub-market in which each subject
ANNALY CAPITAL MANAGEMENT, INC. AND SUBSIDIARIES
Financial Statements
property is located. Management monitors the financial condition and operating results of its borrowers and continually assesses the future outlook of the borrower’s financial performance in light of industry developments, management changes and company-specific considerations.
The Company’s internal loan risk ratings are based on the guidance provided by the Office of the Comptroller of the Currency for commercial real estate lending. The Company’s internal risk rating rubric for commercial loans has nine categories as depicted below:
| | | | | |
Risk Rating - Commercial Loans | Description |
1-4 / Performing | Meets all present contractual obligations. |
5 / Performing - Closely Monitored | Meets all present contractual obligations, but are transitional or could be exhibiting some weaknesses in both leverage and liquidity. |
6 / Performing - Special Mention | Meets all present contractual obligations, but exhibit potential weakness that deserves management’s close attention and, if uncorrected, may result in deterioration of repayment prospects. |
7 / Substandard | Inadequately protected by sound worth and paying capacity of the obligor or of the collateral pledged with a distinct possibility that loss will be sustained if some of the deficiencies are not corrected. |
8 / Doubtful | Substandard loans whereby collection of all contractual principal and interest is highly questionable or improbable. |
9 / Loss | Considered uncollectible. |
Management assesses each loan at least quarterly and assigns an internal risk rating based on its evaluation of the most recent financial information produced by the borrower and consideration of economic conditions. See below for a tabular disclosure of the amortized cost basis of the Company’s commercial loans by year of origination and internal risk rating.
The Company’s commercial loans are collateral-dependent and, as such, for loans experiencing credit deterioration, the Company is required to record an allowance based uponapply the fair value ofoption to this lending facility in order to simplify the underlying collateral if foreclosure is probable or ifaccounting and keep the practical expedient is elected. For the year endedaccounting consistent with other residential credit financial instruments with similar characteristics. At both December 31, 2020, the Company recorded a loan loss provision on impaired commercial loans of $78.4 million with a principal balance and carrying value, net of allowances of $181.2 million and $113.6 million, respectively, based upon the fair value of the underlying collateral. The Company uses a discounted cash flow or market based valuation technique based upon the underlying property to project property cash flows. In projecting these cash flows, the Company reviewed the borrower financial statements, rent rolls, economic trends and other factors management deems important. These nonrecurring fair value measurements are considered to be in level three of the fair value measurement hierarchy as there are unobservable inputs, which are significant to the overall fair value. For the year ended December 31, 2019, the Company recorded a loan loss provision of $9.2 million on commercial loans with a principal balance and carrying value, net of allowances of $43.6 million and $30.9 million, respectively.
As a result of the implementation of the Loss Given Default methodology under the modified retrospective method, a cumulative effect loan loss allowance of $7.8 million was recorded on January 1, 2020. For the year ended December 31, 2020, the Company recorded a net loan loss provision of $54.8 million based upon its Loss Given Default methodology recorded in Loan loss provision in the Consolidated Statements of Comprehensive Income (Loss).
During the year ended December 31, 2020, the Company modified 5 commercial loans with a carrying value of $243.8 million at December 31, 2020. The maturity dates on 4 commercial loans were extended and 1 commercial loan was granted a 120 day forbearance. Additionally, as part of the restructuring 2 loans had partial paydowns totaling $4.5 million. The loan loss allowance recorded for these commercial loans was $23.6 million at December 31, 2020. Future funding commitments on the restructured loans total $4.1 million.
At December 31, 20202023 and December 31, 2019, the amortized cost basis of commercial loans2022, there were no outstanding balances on nonaccrual status was $46.8 million and $175.2 million, respectively. For the years ended December 31, 2020 and 2019, the Company recognized interest income on commercial loans on nonaccrual status of $2.1 million and ($0.1) million, respectively.
At December 31, 2020 and December 31, 2019, the Company had unfunded commercial real estate loan commitments of $99.3 million and $181.4 million respectively. At December 31, 2020, the liability related to the expected credit losses on the unfunded commercial loan commitments was $5.1 million.
At December 31, 2020 and 2019, approximately 94% and 92%, respectively,of the carrying value of the Company’s CRE Debt and Preferred Equity Investments, including loans transferred or pledged to securitization vehicles and excluding commercial loans held for sale, were adjustable-rate.
ANNALY CAPITAL MANAGEMENT, INC. AND SUBSIDIARIES
Financial Statements
The sector attributes of the Company’s commercial real estate investments held for investment, including loans transferred or pledged to securitization vehicles, at December 31, 2020 and December 31, 2019 were as follows:
| | | | | | | | | | | | | | | | | | | | | | | |
| | Sector Dispersion |
| | December 31, 2020 | | December 31, 2019 |
| | Carrying Value | | % of Loan Portfolio | | Carrying Value | | % of Loan Portfolio |
| | (dollars in thousands) |
| Office | $ | 650,034 | | | 47.4 | % | | $ | 681,129 | | | 42.4 | % |
| Retail | 256,493 | | | 18.7 | % | | 389,076 | | | 24.2 | % |
| Multifamily | 250,095 | | | 18.2 | % | | 262,302 | | | 16.3 | % |
| Hotel | 115,536 | | | 8.4 | % | | 135,681 | | | 8.4 | % |
| Industrial | 60,097 | | | 4.4 | % | | 82,441 | | | 5.1 | % |
| Other | 20,302 | | | 1.5 | % | | 36,589 | | | 2.3 | % |
| Healthcare | 19,873 | | | 1.4 | % | | 18,873 | | | 1.3 | % |
| Total | $ | 1,372,430 | | | 100.0 | % | | $ | 1,606,091 | | | 100.0 | % |
|
At December 31, 2020 and 2019, commercial real estate investments held for investment were comprised of the following:
| | | | | | | | | | | | | | | | | | | | | | | | | | | | | | | | | | | |
| | December 31, 2020 | | December 31, 2019 |
| | Outstanding Principal | | Carrying
Value (1) | | Percentage
of Loan
Portfolio (2) | | Outstanding Principal | | Carrying
Value (1) | | Percentage
of Loan
Portfolio (2) |
| | (dollars in thousands) |
| Senior mortgages | $ | 387,124 | | | $ | 373,925 | | | 25.7 | % | | $ | 503,499 | | | $ | 499,690 | | | 30.9 | % |
Senior securitized mortgages (3) | 938,859 | | | 874,349 | | | 62.3 | % | | 940,546 | | | 936,378 | | | 57.8 | % |
| Mezzanine loans | 181,261 | | | 124,156 | | | 12.0 | % | | 183,064 | | | 170,023 | | | 11.3 | % |
| | | | | | | | | | | |
| Total | $ | 1,507,244 | | | $ | 1,372,430 | | | 100.0 | % | | $ | 1,627,109 | | | $ | 1,606,091 | | | 100.0 | % |
| | | | | | | | | | | |
(1) Carrying value includes unamortized origination fees of $4.9 million and $8.3 million at December 31, 2020 and 2019, respectively.
(2) Based on outstanding principal.
(3) Assets of consolidated VIEs.
The following tables represent a rollforward of the activity for the Company’s commercial real estate investments held for investment at December 31, 2020 and 2019:
| | | | | | | | | | | | | | | | | | | | | | | | | | |
| December 31, 2020 |
| | Senior
Mortgages | | | | Senior Securitized Mortgages (1) | | Mezzanine
Loans | | | Total |
| | (dollars in thousands) |
Beginning balance (January 1, 2020) (2) | $ | 499,690 | | | | | $ | 936,378 | | | $ | 182,726 | | | | $ | 1,618,794 | |
| Originations & advances (principal) | 206,090 | | | | | 0 | | | 12,374 | | | | 218,464 | |
| Principal payments | (77,344) | | | | | (144,308) | | | (78) | | | | (221,730) | |
| Principal write off | 0 | | | | | 0 | | | (7,000) | | | | (7,000) | |
Transfers (3) | (245,120) | | | | | 142,621 | | | (7,100) | | | | (109,599) | |
| | | | | | | | | | |
| Net (increase) decrease in origination fees | (1,055) | | | | | (653) | | | (80) | | | | (1,788) | |
| Realized gain | 204 | | | | | 0 | | | 0 | | | | 204 | |
| Amortization of net origination fees | 2,371 | | | | | 2,460 | | | 187 | | | | 5,018 | |
| Allowance for loan losses | | | | | | | | | | |
| Beginning allowance, prior to CECL adoption | 0 | | | | | 0 | | | (12,703) | | | | (12,703) | |
| Impact of adopting CECL | (2,263) | | | | | (4,166) | | | (1,336) | | | | (7,765) | |
| Current period allowance | (8,648) | | | | | (57,983) | | | (66,521) | | | | (133,152) | |
| Write offs | 0 | | | | | 0 | | | 23,687 | | | | 23,687 | |
| Ending allowance | (10,911) | | | | | (62,149) | | | (56,873) | | | | (129,933) | |
| Net carrying value (December 31, 2020) | $ | 373,925 | | | | | $ | 874,349 | | | $ | 124,156 | | | | $ | 1,372,430 | |
| | | | | | | | | | |
ANNALY CAPITAL MANAGEMENT, INC. AND SUBSIDIARIES
Financial Statements
| | | | | | | | | | | | | | | | | | | | | | | | | | |
| December 31, 2019 | |
| Senior
Mortgages | | Senior Securitized Mortgages (1) | | Mezzanine
Loans | | | | Total | |
| | (dollars in thousands) | |
| Net carrying value (January 1, 2019) | $ | 981,202 | | | $ | 0 | | | $ | 315,601 | | | | | $ | 1,296,803 | | |
| Originations & advances (principal) | 572,204 | | | 0 | | | 21,709 | | | | | 593,913 | | |
| Principal payments | (16,785) | | | (150,245) | | | (149,633) | | | | | (316,663) | | |
| | | | | | | | | | |
| | | | | | | | | | |
Transfers (3) | (1,034,754) | | | 1,083,487 | | | (8,675) | | | | | 40,058 | | |
| Net (increase) decrease in origination fees | (4,200) | | | 0 | | | (184) | | | | | (4,384) | | |
| Amortization of net origination fees | 2,023 | | | 3,136 | | | 412 | | | | | 5,571 | | |
| Net (increase) decrease in allowance | 0 | | | 0 | | | $ | (9,207) | | | | | (9,207) | | |
| | | | | | | | | | |
| | | | | | | | | | |
| | | | | | | | | | |
| | | | | | | | | | |
| | | | | | | | | | |
| Net carrying value (December 31, 2019) | $ | 499,690 | | | $ | 936,378 | | | $ | 170,023 | | | | | $ | 1,606,091 | | |
| | | | | | | | | | |
(1) Represents assets of consolidated VIEs. | |
(2) Excludes loan loss allowances. | |
(3) Includes transfers to securitization vehicles or REO. | |
The following table provides the internal loan risk ratings of commercial real estate investments held for investment as of December 31, 2020.
| | | | | | | | | | | | | | | | | | | | | | | | | | | | | | | | | | | | | | | | | |
Amortized Cost Basis by Risk Rating and Vintage (1) |
| Risk Rating | Vintage |
| Total | | 2020 | | 2019 | | 2018 | | 2017 | | 2016 | | Prior |
| (dollars in thousands) |
| 1-4 / Performing | $ | 300,623 | | | $ | 111,177 | | | $ | 134,923 | | | $ | 0 | | | $ | 12,972 | | | $ | 0 | | | $ | 41,551 | |
| 5 / Performing - Closely Monitored | 145,231 | | | 0 | | | 145,231 | | | 0 | | | 0 | | | 0 | | | 0 | |
| 6 / Performing - Special Mention | 628,224 | | | 58,648 | | | 135,868 | | | 267,555 | | | 96,982 | | | 69,171 | | | 0 | |
| 7 / Substandard | 205,026 | | | 9,368 | | | 78,407 | | | 66,294 | | | 0 | | | 0 | | | 50,957 | |
| 8 / Doubtful | 93,326 | | | 0 | | | 0 | | | 39,704 | | | 53,622 | | | 0 | | | 0 | |
9 / Loss (2) | 0 | | | 0 | | | 0 | | | 0 | | | 0 | | | 0 | | | 0 | |
| Total | $ | 1,372,430 | | | $ | 179,193 | | | $ | 494,429 | | | $ | 373,553 | | | $ | 163,576 | | | $ | 69,171 | | | $ | 92,508 | |
| | | | | | | | | | | | | |
(1) The amortized cost basis excludes accrued interest. As of December 31, 2020, the Company had $3.8 million of accrued interest receivable on
commercial loans which is reported in Principal and interest receivable in the Consolidated Statements of Financial Condition.
(2) Includes 2 commercial mezzanine loans for which the Company recorded a full loan loss allowance of $46.6 million.
Corporate Debt
The Company’s investments in corporate loans typically take the form of senior secured loans primarily in first or second lien positions. The Company’s senior secured loans generally have stated maturities of five to seven years. In connection with these senior secured loans, the Company receives a security interest in certain assets of the borrower and such assets support repayment of such loans. Senior secured loans are generally exposed to less credit risk than more junior loans given their seniority to scheduled principal and interest and priority of security in the assets of the borrower. Interest income from coupon payments is accrued based upon the outstanding principal amounts of the debt and its contractual terms. Premiums and discounts are amortized or accreted into interest income using the effective interest method.
ANNALY CAPITAL MANAGEMENT, INC. AND SUBSIDIARIES
Financial Statements
The Company’s internal risk rating rubric for corporate debt has nine categories as depicted below:
| | | | | |
Risk Rating - Corporate Debt | Description |
1-5 / Performing | Meets all present contractual obligations. |
6 / Performing - Closely Monitored | Meets all present contractual obligations but exhibits a defined weakness in either leverage or liquidity, but not both. Loans at this rating will require closer monitoring, but where we expect no loss of interest or principal. |
7 / Substandard | A loan that has a defined weakness in either leverage and/or liquidity, and which may require substantial changes to strengthen the asset. Loans at this rating level have a higher probability of loss, although no determination of the amount or timing of a loss is yet possible. |
8 / Doubtful | A loan that has missed a scheduled principal or interest payment or is otherwise deemed a non-earning account. The probability of loss is increasingly certain due to significant performance issues. |
9 / Loss | Considered uncollectible. |
Management assesses each loan at least quarterly and assigns an internal risk rating based on its evaluation of the most recent financial information produced by the borrower and consideration of economic conditions. See below for a tabular disclosure of the amortized cost basis of the Company’s corporate debt held for investment by year of origination and internal risk rating.
For the year ended December 31, 2020, the Company recorded a loan loss provision of $4.5 million on impaired corporate loans using a discounted cash flow methodology. During the year ended December 31, 2020, the loan was restructured and the Company received $2.8 million of second lien debt and $4.8 million of equity. As a result of the restructuring, $19.6 million of first lien debt was written off and the related allowance of $11.9 million was charged off. For the year ended December 31, 2019, the Company recorded a loan loss provision of $7.4 million on a corporate loan with a principal balance and carrying value of $19.6 million and $12.2 million, respectively. There was 0 provision for loan loss recorded for the year ended December 31, 2018.
As a result of the implementation of the Loss Given Default methodology under the modified retrospective method, a cumulative effect loan loss allowance on corporate loans of $29.7 million was recorded on January 1, 2020. For the year ended December 31, 2020, the Company recorded a net loan loss provision on corporate loans of $9.9 million, based upon its Loss Given Default methodology.
As of December 31, 2020 and December 31, 2019, the amortized cost basis of corporate loans on nonaccrual status was $0.0 and $12.2 million, respectively. For the years ended December 31, 2020 and 2019, the Company recognized interest income on corporate loans on nonaccrual status of $0.0 million and $1.5 million, respectively.
At December 31, 2020 and December 31, 2019, the Company had unfunded corporate loan commitments of $87.3 million and $81.2 million, respectively. At December 31, 2020, the liability related to the expected credit losses on the unfunded corporate loan commitments was $0.7 million.
ANNALY CAPITAL MANAGEMENT, INC. AND SUBSIDIARIES
Financial Statements
The Company invests in corporate loans through its Annaly Middle Market Lending Group. The industry and rate attributes of the portfolio at December 31, 2020 and 2019 are as follows:
| | | | | | | | | | | | | | | | | | | | | | | |
| | | | | Industry Dispersion |
| | | | | December 31, 2020 | | | | | December 31, 2019 |
| | | | | | Total (1) | | | | | | Total (1) |
| | | | | (dollars in thousands) |
Computer programming, data processing & other computer
related services | | | | | 483,142 | | | | | | | 394,193 | |
| Management and public relations services | | | | | 300,869 | | | | | | | 339,179 | |
| Industrial Inorganic Chemical | | | | | 156,391 | | | | | | | 0 | |
| Public warehousing and storage | | | | | 132,397 | | | | | | | 107,029 | |
| Metal cans & shipping containers | | | | | 115,670 | | | | | | | 118,456 | |
| Offices and clinics of doctors of medicine | | | | | 104,781 | | | | | | | 106,993 | |
| Surgical, medical, and dental instruments and supplies | | | | | 83,161 | | | | | | | 102,182 | |
| Electronic components & accessories | | | | | 78,129 | | | | | | | 24,000 | |
| Engineering, architectural & surveying | | | | | 77,308 | | | | | | | 124,201 | |
| Miscellaneous Industrial & Commercial | | | | | 77,163 | | | | | | | 78,908 | |
| Insurance agents, brokers and services | | | | | 67,193 | | | | | | | 75,410 | |
| Research, development and testing services | | | | | 62,008 | | | | | | | 45,610 | |
| Miscellaneous Food Preparations | | | | | 58,857 | | | | | | | 0 | |
| Telephone communications | | | | | 58,450 | | | | | | | 61,210 | |
| Miscellaneous equipment rental and leasing | | | | | 49,587 | | | | | | | 49,776 | |
| Electrical work | | | | | 41,128 | | | | | | | 43,175 | |
| Petroleum and petroleum products | | | | | 33,890 | | | | | | | 24,923 | |
| Medical and dental laboratories | | | | | 30,711 | | | | | | | 41,344 | |
| Schools and educational services, not elsewhere classified | | | | | 29,040 | | | | | | | 19,586 | |
| Home health care services | | | | | 28,587 | | | | | | | 29,361 | |
| Metal Forgings and Stampings | | | | | 27,523 | | | | | | | 0 | |
| Legal Services | | | | | 26,399 | | | | | | | 0 | |
| Grocery stores | | | | | 22,895 | | | | | | | 23,248 | |
| Coating, engraving and allied services | | | | | 19,484 | | | | | | | 47,249 | |
| Chemicals & Allied Products | | | | | 14,686 | | | | | | | 15,002 | |
| Miscellaneous business services | | | | | 12,980 | | | | | | | 164,033 | |
| Drugs | | | | | 12,942 | | | | | | | 15,923 | |
| Mailing, reproduction, commercial art and photography, and stenographic | | | | | 12,733 | | | | | | | 14,755 | |
| Machinery, Equipment & Supplies | | | | | 12,096 | | | | | | | 0 | |
| Offices of clinics and other health practitioners | | | | | 9,730 | | | | | | | 10,098 | |
| Nonferrous foundries (castings) | | | | | 0 | | | | | | | 30,191 | |
| Motor vehicles and motor vehicle parts and supplies | | | | | 0 | | | | | | | 28,815 | |
| Miscellaneous plastic products | | | | | 0 | | | | | | | 10,000 | |
| | | | | | | | | | | |
| | | | | | | | | | | |
| | | | | | | | | | | |
| | | | | | | | | | | |
| | | | | | | | | | | |
| | | | | | | | | | | |
| | | | | | | | | | | |
| | | | | | | | | | | |
| | | | | | | | | | | |
| | | | | | | | | | | |
| | | | | | | | | | | |
| | | | | | | | | | | |
| | | | | | | | | | | |
| | | | | | | | | | | |
| | | | | | | | | | | |
| | | | | | | | | | | |
| | | | | | | | | | | |
| | | | | | | | | | | |
| | | | | | | | | | | |
| | | | | | | | | | | |
| | | | | | | | | | | |
| | | | | | | | | | | |
| | | | | | | | | | | |
| | | | | | | | | | | |
| | | | | | | | | | | |
| | | | | | | | | | | |
| | | | | | | | | | | |
| | | | | | | | | | | |
| | | | | | | | | | | |
| | | | | | | | | | | |
| | | | | | | | | | | |
| | | | | | | | | | | |
| | | | | | | | | | | |
| | | | | | | | | | | |
| | | | | | | | | | | |
| | | | | | | | | | | |
| | | | | | | | | | | |
| | | | | | | | | | | |
| | | | | | | | | | | |
| | | | | | | | | | | |
| | | | | | | | | | | |
| | | | | | | | | | | |
| | | | | | | | | | | |
| | | | | | | | | | | |
| | | | | | | | | | | |
| | | | | | | | | | | |
| | | | | | | | | | | |
| | | | | | | | | | | |
| | | | | | | | | | | |
| | | | | | | | | | | |
| | | | | | | | | | | |
| Total | | | | | $ | 2,239,930 | | | | | | | $ | 2,144,850 | |
| | | | | | | | | | | |
(1) All middle market lending positions are floating rate. | | | |
The table below reflects the Company’s aggregate positions by their respective place in the capital structure of the borrowers at December 31, 2020 and 2019.
| | | | | | | | | | | |
| | December 31, 2020 | | December 31, 2019 |
| | (dollars in thousands) |
| First lien loans | $ | 1,489,125 | | | $ | 1,396,140 | |
| Second lien loans | 750,805 | | | 748,710 | |
| | | |
| | | |
| | | |
| Total | $ | 2,239,930 | | | $ | 2,144,850 | |
| | | |
ANNALY CAPITAL MANAGEMENT, INC. AND SUBSIDIARIES
Financial Statements
The following tables represent a rollforward of the activity for the Company’s corporate debt investments held for investment at December 31, 2020 and December 31, 2019:
| | | | | | | | | | | | | | | | | | | |
| December 31, 2020 |
| First Lien | | Second Lien | | | | Total |
| (dollars in thousands) |
Beginning balance (January 1, 2020) (1) | $ | 1,403,503 | | | $ | 748,710 | | | | | $ | 2,152,213 | |
| | | | | | | |
| Originations & advances | 834,211 | | | 227,433 | | | | | 1,061,644 | |
| Principal payments | (444,759) | | | (132,000) | | | | | (576,759) | |
| Amortization & accretion of (premium) discounts | 8,374 | | | 3,832 | | | | | 12,206 | |
| Loan restructuring | (19,550) | | | 2,818 | | | | | (16,732) | |
Sales (2) | (273,887) | | | (79,203) | | | | | (353,090) | |
| | | | | | | |
| Allowance for loan losses | | | | | | | |
| Beginning allowance, prior to CECL adoption | (7,363) | | | 0 | | | | | (7,363) | |
| Impact of adopting CECL | (10,787) | | | (18,866) | | | | | (29,653) | |
| Current period allowance | (12,510) | | | (1,919) | | | | | (14,429) | |
| Write offs | 11,893 | | | 0 | | | | | 11,893 | |
| Ending allowance | (18,767) | | | (20,785) | | | | | (39,552) | |
| | | | | | | |
| Net carrying value (December 31, 2020) | $ | 1,489,125 | | | $ | 750,805 | | | | | $ | 2,239,930 | |
(1) Excludes loan loss allowances.
(2) Includes syndications.
| | | | | | | | | | | | | | | | | | | |
| December 31, 2019 |
| First Lien | | Second Lien | | | | Total |
| (dollars in thousands) |
| Net carrying value (January 1, 2019) | $ | 1,346,356 | | | $ | 540,826 | | | | | $ | 1,887,182 | |
| Originations & advances | 542,463 | | | 345,573 | | | | | 888,036 | |
| Principal payments | (228,302) | | | (140,625) | | | | | (368,927) | |
| Amortization & accretion of (premium) discounts | 5,960 | | | 2,936 | | | | | 8,896 | |
| | | | | | | |
| Sales | (262,974) | | | 0 | | | | | (262,974) | |
| | | | | | | |
| | | | | | | |
| | | | | | | |
| Net (increase) decrease in allowance | (7,363) | | | 0 | | | | | (7,363) | |
| | | | | | | |
| | | | | | | |
| Net carrying value (December 31, 2019) | 1,396,140 | | | 748,710 | | | | | 2,144,850 | |
The following table provides the amortized cost basis of corporate debt held for investment as of December 31, 2020 by vintage year and internal risk rating.
| | | | | | | | | | | | | | | | | | | | | | | | | | | | | | | | | | | | | | | | | |
Amortized Cost Basis by Risk Rating and Vintage (1) |
| Risk Rating | Vintage |
| Total | | 2020 | | 2019 | | 2018 | | 2017 | | 2016 | | 2015 |
| (dollars in thousands) |
| 1-5 / Performing | $ | 1,760,669 | | | $ | 499,186 | | | $ | 400,873 | | | $ | 402,712 | | | $ | 355,369 | | | $ | 68,191 | | | $ | 34,338 | |
| 6 / Performing - Closely Monitored | $ | 337,386 | | | 38,495 | | | 0 | | | 283,464 | | | 15,427 | | | 0 | | | 0 | |
| 7 / Substandard | $ | 141,875 | | | 0 | | | 47,742 | | | 43,206 | | | 50,927 | | | 0 | | | 0 | |
| 8 / Doubtful | $ | 0 | | | 0 | | | 0 | | | 0 | | | 0 | | | 0 | | | 0 | |
| 9 / Loss | $ | 0 | | | 0 | | | 0 | | | 0 | | | 0 | | | 0 | | | 0 | |
| Total | $ | 2,239,930 | | | $ | 537,681 | | | $ | 448,615 | | | $ | 729,382 | | | $ | 421,723 | | | $ | 68,191 | | | $ | 34,338 | |
| | | | | | | | | | | | | |
(1) The amortized cost basis excludes accrued interest and includes deferred loan fees on unfunded loans. As of December 31, 2020, the Company had $11.0 million of accrued interest receivable on corporate loans, which is reported in Principal and interest receivable in the Consolidated Statements of Financial Condition, and $1.4 million of deferred loan fees on unfunded loans, which is reported in Loans, net in the Consolidated Statements of Financial Condition.
ANNALY CAPITAL MANAGEMENT, INC. AND SUBSIDIARIES
Financial Statements
| | |
| 7. MORTGAGE SERVICING RIGHTS |
|
The Company owns variable interests in an entity that invests in MSRs. Refer to the “Variable Interest Entities” Note for a detailed discussion on this topic.
MSRsMSR represent the rights and obligations associated with servicing pools of residential mortgage loans. The Company and its subsidiaries do not originate or directly service residential mortgage loans. Rather, these activities are carried out by duly licensed subservicers who perform substantially all servicing functions for the loans underlying the MSRs.MSR. The Company generally intends to hold the MSRsMSR as investments and elected to account for all of its investments in MSRsMSR at fair value. As such, they are recognized at fair value on the accompanying Consolidated Statements of Financial Condition with changes in the estimated fair value presented as a component of Net unrealized gains (losses) on instruments measured at fair value through earningsinvestments and other in the Consolidated Statements of Comprehensive Income (Loss). Servicing income,
Interests in MSR represent agreements to purchase all, or a component of, net servicing cash flows. A third party acted as a master servicer for the loans providing the net servicing cash flows represented by the Interests in MSR. The Company accounts for its Interests in MSR at fair value with change in fair value presented in Net gains (losses) on investments and other in the Consolidated Statements of servicing expenses, is reportedComprehensive Income (Loss). Cash flows received for Interests in MSR are recorded in Other, income (loss)net in the Consolidated Statements of Comprehensive Income (Loss).
The following table presentstables present activity related to MSRsMSR and Interests in MSR for the years ended December 31, 20202023 and 2019:2022:
| | | | | | | | | | | |
| Mortgage Servicing Rights | December 31, 2023 | | December 31, 2022 |
| | (dollars in thousands) |
| Fair value, beginning of period | $ | 1,748,209 | | | $ | 544,562 | |
Purchases (1) | 397,585 | | | 1,009,351 | |
| Transfers | — | | | 82,650 | |
| Sales | — | | | (9,084) | |
| Change in fair value due to | |
Changes in valuation inputs or assumptions (2) | 92,374 | | | 205,463 | |
| Other changes, including realization of expected cash flows | (115,972) | | | (84,733) | |
| Fair value, end of period | $ | 2,122,196 | | | $ | 1,748,209 | |
| | | |
(1) Includes adjustments to original purchase price from early payoffs, defaults, or loans that were delivered but were deemed to not be acceptable. (2) Principally represents changes in discount rates and prepayment speed inputs used in valuation model, primarily due to changes in interest rates. |
| | | | | | | | | | | |
| | December 31, 2020 | | December 31, 2019 |
| | (dollars in thousands) |
| Fair value, beginning of period | $ | 378,078 | | | $ | 557,813 | |
| | | |
| | | |
| Sales | (72,160) | | | 0 | |
| | | |
| Change in fair value due to | |
Changes in valuation inputs or assumptions (1) | (107,517) | | | (102,016) | |
| Other changes, including realization of expected cash flows | (97,506) | | | (77,719) | |
| Fair value, end of period | $ | 100,895 | | | $ | 378,078 | |
| | | |
(1) Principally represents changes in discount rates and prepayment speed inputs used in valuation model, primarily due to changes in interest rates. |
For the years ended December 31, 2020 and 2019, the Company recognized $66.6 million and $108.0 million of net servicing income from MSRs in Other income (loss) in the Consolidated Statements of Comprehensive Income (Loss).
| | | | | | | | |
| Interests in MSR | | December 31, 2022 | | |
| | (dollars in thousands) | | |
| Beginning balance | | $ | 69,316 | | | |
Purchases (1) | | 4,860 | | | |
| Transfers | | (82,650) | | | |
| Gain (loss) included in net income | | 8,474 | | | |
| | | | |
| | | | |
| Ending balance | | $ | — | | | |
| | | | |
(1) Includes adjustments to original purchase price from early payoffs, defaults, or loans that were delivered but were deemed to not be acceptable. | | |
| | |
| 8. VARIABLE INTEREST ENTITIES |
|
Commercial Trusts
The Company has invested in subordinate mortgage-backed securities issued by commercial securitization trusts (“Commercial Trusts”) and determined that it isCompany’s exposure to the primary beneficiary as a resultobligations of its abilityVIEs is generally limited to replace the special servicer without cause through its ownership of the subordinate securities and its current designation as the directing certificate holder. Information regarding these securitization trusts are summarizedCompany’s investment in the table below.
| | | | | | | | | | | |
| Type of Underlying Collateral | Settlement Date | Cut-off Date Principal Balance | Face Value of Company’s Variable Interest at Settlement Date |
| | (dollars in thousands) |
| Multifamily | April 2015 | $ | 1,192,607 | | $ | 89,446 | |
| Hotels | June 2018 | $ | 982,000 | | $ | 93,500 | |
| Multifamily | August 2019 | $ | 271,700 | | $ | 20,270 | |
| Office Building | October 2019 | $ | 60,000 | | $ | 60,000 | |
| Multifamily | October 2019 | $ | 415,000 | | $ | 75,359 | |
| Multifamily | December 2019 | $ | 394,000 | | $ | 110,350 | |
Upon consolidation, the Company elected the fair value option for the financial assets and liabilitiesVIEs of the Commercial Trusts in order to avoid an accounting mismatch, and to represent more faithfully the economics of its interest in the entities. The fair value option requires that changes in fair value be reflected in the Company’s Consolidated Statements of Comprehensive Income (Loss). The Company applied the practical expedient under ASU 2014-07, whereby the Company determines whether the fair value of the financial assets or financial liabilities is more observable as a basis for measuring the less observable financial instruments. The Company has determined that the fair value of the financial liabilities of the Commercial Trusts are more observable, since the prices for these liabilities are primarily available from third-party pricing services utilized for
ANNALY CAPITAL MANAGEMENT, INC. AND SUBSIDIARIES
Financial Statements
multifamily and commercial mortgage-backed securities, while the individual assets of the trusts are inherently less capable of precise measurement given their illiquid nature and the limitations on available information related to these assets. Given that the Company’s methodology for valuing the financial assets of the Commercial Trusts are an aggregate fair value derived from the fair value of the financial liabilities, the Company has determined that the fair value of each of the financial assets in their entirety should be classified in Level 2 of the fair value measurement hierarchy.
The Commercial Trusts mortgage loans had an aggregate unpaid principal balance of $2.3 billion and $2.3$1.4 billion at December 31, 2020 and 2019, respectively. At December 31, 2020 and 2019, there were 0 loans 90 days or more past due or on nonaccrual status. There is 0 gain or loss attributable to instrument-specific credit risk2023. Assets of the underlying loans or debt issued by securitization vehicles at December 31, 2020 and 2019 based uponVIEs may only be used to settle obligations of the Company’s processVIEs. Creditors of monitoring eventsthe VIEs have no recourse to the general credit of default on the underlying mortgage loans.
Commercial Securitizations
Company. The Company also invests in commercial mortgage-backed securities issued by entities that are VIEs because they do not have sufficient equity at risk for the entities to finance their activities without additional subordinated financial support from other parties, but the Company is not the primary beneficiary because it doescontractually required to provide and has not have the power to direct the activities that most significantly impact the VIEs’ economic performance. For these entities, the Company’s maximum exposure to loss is the amortized cost basisprovided any form of the securities it owns and it does not provide any liquidity arrangements, guarantees or other commitments to these VIEs. See the “Securities” Note for further information on Commercial Securities.
Collateralized Loan Obligation
In February 2019, the Company closed NLY 2019-FL2, a managed commercial real estate collateralized loan obligation (“CLO”) securitization with a face value of $857.3 million, which provides non-recourse financingfinancial support to the Company collateralized by certain commercial real estate mortgage loans originated byVIEs. No gains or losses were recognized upon consolidation of existing VIEs. Interest income and expense are recognized using the Company. As of December 31, 2020 a total of $625.8 million of notes were held by third parties and the Company retained or purchased $202.4 million of subordinated notes and preferred shares, which eliminate upon consolidation. The Company has determined that it is the primary beneficiary because it has the right to direct the servicer as well as remove the special servicer without cause and it holds variable interests that could be potentially significant to the CLO. The transfers of loans to the CLO did not qualify for sale accounting because the Company maintains effective control over the loans. The Company elected the fair value option for the financial liabilities issued by the CLO in order to simplify the accounting; however, the commercial loans continue to be carried at amortized cost as they were not eligible for the fair value option as it was not elected at origination of the loans. The Company incurred $8.3 million of costs in connection with the CLO that were expensed as incurred during the year ended December 31, 2019. The aggregate unpaid principal balance of loans in the CLO was $856.9 million at December 31, 2020 and there were no loans 90 days or more past due or on nonaccrual status. There is no gain or loss attributable to instrument-specific credit risk of the debt securities at December 31, 2020 based upon the Company’s process of monitoring events of default on the underlying mortgage loans. The contractual principal amount of the CLO debt held by third parties was $633.9 million at December 31, 2020.interest method.
Multifamily Securitization
In November 2019, the Company repackaged Fannie Mae guaranteed multifamily mortgage-backed securities with a principal cut-off balance of $1.0 billion and retained interest only securities with a notional balance of $1.0 billion and senior securities with a principal balance of $28.5 million. In March 2020, the Company repackaged Fannie Mae guaranteed multifamily mortgage-backed securities with a principal cut-off balance of $0.5 billion and retained interest onlyinterest-only securities with a notional balance of $0.5 billion. At the inception of the arrangements,this arrangement, the Company determined that it was the primary beneficiary based upon its involvement in the design of these VIEsthis VIE and through the retention of a significant variable interest in the VIEs.VIE. The Company elected the fair value option for the financial liabilities of these VIEsthis VIE in order to simplify the accounting; however, the financial assets were not eligible for the fair value option as it was not elected at purchase.
ANNALY CAPITAL MANAGEMENT, INC. AND SUBSIDIARIES
Financial Statements
During the year ended December 31, 2020,2022, the Company deconsolidated the 20192020 multifamily VIE since it sold all of its interest onlyinterest-only securities and no longer retains a significant variable interest in the entity. As a result of the deconsolidation of this VIE, the Company derecognized approximately $1.2 billion$424.0 million of securities and approximately $1.1 billion$391.9 million of debt issued by securitization vehicles and recognized a realized gain of $104.8$33.4 million, which is included in Net gains (losses) on disposal of investments and other in the Consolidated Statements of Comprehensive Income (Loss). The Company incurred $1.1 million of costs in connection with the 2020 multifamily securitization that were expensed as incurred during the year ended December 31, 2020.
Residential Trusts
The Company consolidates a securitization trust, which is included in “Residential Trusts” in the tables below, that issued residential mortgage-backed securities that are collateralized by residential mortgage loans that had been transferred to the trust by one of the Company’s subsidiaries. The Company owns the subordinate securities, and a subsidiary of the Company continues to be the master servicer. As such, the Company is deemed to be the primary beneficiary of the residential mortgage trust and consolidates the entity. The Company has elected the fair value option for the financial assets and liabilities of this
ANNALY CAPITAL MANAGEMENT, INC. AND SUBSIDIARIES
Financial Statements
VIE, but has not elected to apply the practical expedient under ASU 2014-13 as prices of both the financial assets and financial liabilities of the residential mortgage trust are available from third-party pricing services. The contractual principal amount of the residential mortgage trust’s debt held by third parties was $23.0 million and $57.3 million at December 31, 2020 and 2019, respectively.
Residential Securitizations
The Company also invests in residential mortgage-backed securities issued by entities that are VIEs because they do not have sufficient equity at risk for the entities to finance their activities without additional subordinated financial support from other parties, but theparties. The Company is not the primary beneficiary because it does not have the power to direct the activities that most significantly impact the VIEs’ economic performance. For these entities, the Company’s maximum exposure to loss is the amortized cost basis of the securities it owns and it does not provide any liquidity arrangements, guarantees or other commitments to these VIEs. SeeRefer to the “Securities” Note for further information on Residential Securities.
OBX Trusts
TheResidential securitizations are issued by entities in the table below aregenerally referred to collectively as the “OBX Trusts.” These securitizations represent financing transactions which provide non-recourse financing to the Company that are collateralized by residential mortgage loans purchased by the Company. Residential securitizations closed during the year are included in the table below.
| | | | | | | | |
| Securitization | Date of Closing | Face Value at Closing |
| | (dollars in thousands) |
| | |
| | |
| | |
| | |
| | |
| | |
| | |
| | |
| | |
| | |
| | |
| | |
| | |
| | |
| | |
| | |
| | |
| | |
| | |
| | |
| | |
| | |
| | |
| | |
| | |
| | |
| | |
| | |
| | |
| | |
| | |
| | |
| | |
| | |
| | |
| | |
| | |
| | |
OBX 2018-12023-NQM1 | March 2018January 2023 | $ | 327,162405,209 | |
OBX 2018-EXP12023-J1 | August 2018February 2023 | $ | 383,451305,755 | |
OBX 2018-EXP22023-NQM2 | October 2018February 2023 | $ | 384,027420,650 | |
OBX 2019-INV12023-NQM3 | January 2019April 2023 | $ | 393,961407,525 | |
OBX 2019-EXP12023-NQM4 | April 2019May 2023 | $ | 388,156394,291 | |
OBX 2019-INV22023-INV1 | June 2019May 2023 | $ | 383,760314,839 | |
OBX 2019-EXP22023-NQM5 | July 2019June 2023 | $ | 463,405390,271 | |
OBX 2019-EXP32023-NQM6 | October 2019July 2023 | $ | 465,492400,530 | |
OBX 2020-INV12023-NQM7 | January 2020September 2023 | $ | 374,609411,133 | |
OBX 2020-EXP12023-NQM8 | February 2020October 2023 | $ | 467,511406,663 | |
OBX 2020-EXP22023-J2 | July 2020November 2023 | $ | 489,352303,008 | |
OBX 2020-EXP32023-NQM9 | September 2020November 2023 | $ | 514,609393,507 | |
| OBX 2023-NQM10 | December 2023 | $ | 387,556 | |
As of December 31, 20202023 and 2019,2022, a total carrying value of $2.6$11.6 billion and $2.0$7.7 billion, respectively, of bonds were held by third parties and the Company retained $653.0 million$1.4 billion and $565.7 million,$1.0 billion, respectively, of mortgage-backed securities,MBS, which were eliminated in consolidation. The Company is deemed to be the primary beneficiary and consolidates the OBX Trusts because it has power to direct the activities that most significantly impact the OBX Trusts’ performance and holds a variable interest that could be potentially significant to these VIEs. Effective August 1, 2022, upon initial consolidation of new securitization entities, the Company elected to apply the measurement alternative for consolidated collateralized financing entities in order to simplify the accounting and valuation processes. The Company has electedliabilities of these securitization entities are deemed to be more observable and are used to measure the fair value option for the financial assets and liabilities of these VIEs, but has not elected the practical expedient under ASU 2014-13 as prices of both the financial assets and financial liabilities of the residential mortgage trusts are available from third-party pricing services.assets. During the years ended December 31, 20202023 and 2019,2022, the Company incurred $7.2$8.2 million and $9.0$7.6 million, respectively, of costs in connection with these securitizations that were expensed as incurred. The contractual principal amount of the OBX Trusts’ debt held by third parties was $2.5$12.6 billion and $1.9$9.0 billion at December 31, 20202023 and 2019,2022, respectively. During the years ended December 31, 2023 and 2022, the Company recorded ($305.2) million and $1.2 billion, respectively, of unrealized gains (losses) on debt held by third parties, which is reported in Net gains (losses) on investments and other in the Company's Consolidated Statements of Comprehensive Income (Loss).
Although the residential mortgage loans have been sold for bankruptcy and state law purposes, the transfers of the residential mortgage loans to the OBX Trusts did not qualify for sale accounting and are reflected as intercompany secured borrowings that are eliminated upon consolidation.
Credit Facility VIEs
In June 2016, a consolidated subsidiaryconnection with the sale of all of the Company entered into aassets that comprise the MML Portfolio, the credit facility with a third party financial institution. As offacilities which provided financing for the Company’s corporate debt were paid-off and terminated during the year ended December 31, 2020 and 2019, the borrowing limit on this facility was $625.0 million. The subsidiary was deemed to be a VIE and the Company was determined to be the primary beneficiary due to its role as collateral manager and because it holds a variable interest in the entity that could potentially be significant2022. Refer to the entity. The Company has pledged as collateral“Sale of Middle Market Lending Portfolio” Note for this facility corporate loans with a carrying amount of $786.9 million and $741.3 million at December 31, 2020 and 2019, respectively. The transfers did not qualify for sale accounting and are reflected as an intercompany secured borrowing that is eliminated upon consolidation. At December 31, 2020 and 2019,additional information on the subsidiary had an intercompany receivable of $441.1 million and $426.6 million, respectively, which eliminates upon consolidation and an Other secured financing of $441.1 million and $426.6 million, respectively, to the third party financial institution.transaction.
ANNALY CAPITAL MANAGEMENT, INC. AND SUBSIDIARIES
Financial Statements
In July 2017, a consolidated subsidiary of the Company entered into a credit facility with a third party financial institution. As of December 31, 2020 and 2019, the borrowing limit on this facility was $320.0 million. The subsidiary was deemed to be a VIE and the Company was determined to be the primary beneficiary due to its role as servicer and because it holds a variable interest in the entity that could potentially be significant to the entity. The Company has transferred corporate loans to the subsidiary with a carrying amount of $400.4 million and $413.7 million at December 31, 2020 and 2019, respectively, which continue to be reflected in the Company’s Consolidated Statements of Financial Condition under Loans, net. At December 31, 2020 and 2019, the subsidiary had an Other secured financing of $209.7 million and $244.2 million, respectively, to the third party financial institution.
In January 2019, a consolidated subsidiary of the Company (the “Borrower”) entered into a $300.0 million credit facility with a third party financial institution. At of December 31, 2020 and 2019, the Borrower had an Other secured financing of $236.6 million and $157.5 million, respectively, to the third party financial institution.
MSR SiloCorporate Debt Funds
The Company also owns variable interests in an entity that invests in MSRs and has structured its operations, funding and capitalization into pools of assets and liabilities, each referred to as a “silo.” Owners of variable interests in a given silo are entitled to all of the returns and subjected to the risk of loss on the investments and operations of that silo and have no substantive recourse to the assets of any other silo. While the Company previously held 100% of the voting interests in this entity, in August 2017, the Company sold 100% of such interests, and entered into an agreement with the entity’s affiliated portfolio manager giving the Company the power over the silo in which it owns all of the beneficial interests. As a result, the Company is considered to be the primary beneficiary and consolidates this silo.
The Company’s exposure to the obligations of its VIEs is generally limited to the Company’s investment in the VIEs of $2.5 billion at December 31, 2020. Assets of the VIEs may only be used to settle obligations of the VIEs. Creditors of the VIEs have no recourse to the general credit of the Company. The Company is not contractually required to provide and has not provided any form of financial support to the VIEs. No gains or losses were recognized upon consolidation of existing VIEs. Interest income and expense are recognized using the effective interest method.
The statements of financial condition of the Company’s VIEs, excluding the CLO, multifamily securitizations, credit facility VIEs and OBX Trusts as the transfers of loans or securities did not meet the criteria to be accounted for as sales, that are reflected in the Company’s Consolidated Statements of Financial Condition at December 31, 2020 and 2019 are as follows:
| | | | | | | | | | | | | | | | | |
| December 31, 2020 |
| | Commercial Trusts | | Residential Trusts | | MSR Silo |
| Assets | (dollars in thousands) |
| Cash and cash equivalents | $ | 0 | | | $ | 0 | | | $ | 22,241 | |
| Loans | 0 | | | 0 | | | 47,048 | |
| Assets transferred or pledged to securitization vehicles | 2,166,073 | | | 40,035 | | | 0 | |
| | | | | |
| | | | | |
| Mortgage servicing rights | 0 | | | 0 | | | 100,895 | |
| Principal and interest receivable | 5,509 | | | 226 | | | 0 | |
| | | | | |
| Other assets | 0 | | | 0 | | | 0 | |
| Total assets | $ | 2,171,582 | | | $ | 40,261 | | | $ | 170,184 | |
| Liabilities | | | | | |
| Debt issued by securitization vehicles (non-recourse) | $ | 1,836,785 | | | $ | 23,351 | | | $ | 0 | |
| Other secured financing | 0 | | | 0 | | | 30,420 | |
| Payable for unsettled trades | 0 | | | 0 | | | 3,076 | |
| | | | | |
| Interest payable | 1,697 | | | 55 | | | 0 | |
| Other liabilities | 0 | | | 246 | | | 13,345 | |
| Total liabilities | $ | 1,838,482 | | | $ | 23,652 | | | $ | 46,841 | |
| | | | | |
ANNALY CAPITAL MANAGEMENT, INC. AND SUBSIDIARIES
Financial Statements
| | | | | | | | | | | | | | | | | |
| December 31, 2019 |
| | Commercial Trusts | | Residential Trusts | | MSR Silo |
| Assets | (dollars in thousands) |
| Cash and cash equivalents | $ | 0 | | | $ | 0 | | | $ | 67,455 | |
| Loans | 0 | | | 0 | | | 66,722 | |
| Assets transferred or pledged to securitization vehicles | 2,345,120 | | | 75,924 | | | 0 | |
| | | | | |
| | | | | |
| Mortgage servicing rights | 0 | | | 0 | | | 378,078 | |
| Principal and interest receivable | 7,085 | | | 408 | | | 0 | |
| | | | | |
| Other assets | 0 | | | 0 | | | 27,021 | |
| Total assets | $ | 2,352,205 | | | $ | 76,332 | | | $ | 539,276 | |
| Liabilities | | | | | |
| Debt issued by securitization vehicles (non-recourse) | $ | 1,967,523 | | | $ | 57,905 | | | $ | 0 | |
| Other secured financing | 0 | | | 0 | | | 38,981 | |
| | | | | |
| Payable for unsettled trades | 0 | | | 0 | | | 18,364 | |
| Interest payable | 3,008 | | | 137 | | | 0 | |
| Other liabilities | 0 | | | 78 | | | 2,393 | |
| Total liabilities | $ | 1,970,531 | | | $ | 58,120 | | | $ | 59,738 | |
| | | | | |
The geographic concentrations of credit risk exceeding 5% of the total loan unpaid principal balances related to the Company’s VIEs, excluding the credit facility VIEs, multifamily securitizations, OBX Trusts and CLO, at December 31, 2020 are as follows:
Securitized Loans at Fair Value Geographic Concentration of Credit Risk
| | | | | | | | | | | | | | | | | | | | | | | | | | | | | |
| Commercial Trusts | | Residential Trusts |
| Property Location | Principal Balance | | % of Balance | | Property Location | | Principal Balance | | % of Balance |
| (dollars in thousands) |
| California | $ | 1,051,276 | | | 32.4 | % | | California | | $ | 18,692 | | | 47.4 | % |
| Texas | 459,256 | | | 14.2 | % | | Illinois | | 5,356 | | | 13.6 | % |
| New York | 369,691 | | | 11.4 | % | | Texas | | 4,972 | | | 12.6 | % |
| Florida | 196,865 | | | 6.1 | % | | Massachusetts | | 2,265 | | | 5.7 | % |
| Washington | 182,000 | | | 5.6 | % | | Other (1) | | 8,174 | | | 20.7 | % |
| Arizona | 171,102 | | | 5.3 | % | | | | | | |
Other (1) | 811,282 | | | 25.0 | % | | | | | | |
| Total | $ | 3,241,472 | | | 100.0 | % | | | | $ | 39,459 | | | 100.0 | % |
| | | | | | | | | |
(1) No individual state greater than 5%.
Corporate Debt Transfers
The Company managesmanaged parallel funds investing in senior secured first and second lien corporate loans (the “Fund Entities”). The Fund Entities arewere considered VIEs because the investors dodid not have substantive liquidation, kick-out or participating rights. The fees that the Company earns areearned were not considered variable interests of the VIE. The Company iswas not the primary beneficiary of the Fund Entities and therefore doesdid not consolidate the Fund Entities. DuringThe corporate loans in the yearFund Entities were assets managed for third parties and were part of the MML Portfolio transferred to Ares during the three months ended December 31, 2020,June 30, 2022. Refer to the Company transferred $159.3 million“Sale of loansMiddle Market Lending Portfolio” Note for cash. The loan transfers were accounted for as sales.additional information on the transaction.
Residential Credit Fund
The Company manages a fund investing in participations in residential mortgage loans. The residential credit fund is deemed to be a VIE because the entity does not have sufficient equity at risk to permit the legal entity to finance its activities without additional subordinated financial support provided by any parties, including equity holders, as capital commitments are not considered equity at risk. The Company is not the primary beneficiary and does not consolidate the residential credit fund as its only interest in the r fund is the management and performance fees that it earns, which are not considered variable interests in the entity. During the year endedAs of December 31, 20202023 and 2022 the Company issuedhad outstanding participating interests in residential mortgage loans of $39.2 million to the residential credit fund.$1.1 billion and $0.8 billion, respectively. These transfers do not meet the criteria for sale accounting and are accounted for as secured borrowing,borrowings, thus the residential loans are reported as Loans, net and the associated liability is reported as Participations issued in the Consolidated Statements of Financial Condition at December 31, 2020.Condition. The Company elected to fair value the participations issued through earnings to more accurately reflect the economics of the transfers as the underlying loans are carried at fair value through earnings.
ANNALY CAPITAL MANAGEMENT, INC. AND SUBSIDIARIES
Financial
| | |
| 9. SALE OF COMMERCIAL REAL ESTATE BUSINESS |
|
On March 25, 2021, the Company entered into a definitive agreement to sell substantially all of the assets that comprise its CRE business to Slate Asset Management L.P. and Slate Grocery REIT (together, “Slate”) for $2.33 billion. The transaction included equity interests, loan assets and associated liabilities, and CMBS (other than commercial CRTs). The Company also sold nearly all of the remaining CRE business assets that were not included in the transaction with Slate. Certain employees who primarily supported the CRE business joined Slate in connection with the sale. In connection with the execution of the definitive agreement to sell the CRE business, during the year ended December 31, 2021, the Company performed an assessment of goodwill, which was related to the Company’s 2013 acquisition of CreXus Investment Corp., and recognized an impairment of $71.8 million. During the year ended December 31, 2021, the Company reported Business divestiture-related gains (losses) of ($262.0) million, in its Consolidated Statements
| | |
| 10. SALE OF MIDDLE MARKET LENDING PORTFOLIO |
| 9. REAL ESTATE
|
Real estate investments are carried at historical cost less accumulated depreciation. Historical cost includesIn April 2022, the Company entered into a definitive agreement to sell substantially all costs necessary to bring the asset to the condition and location necessary for its intended use, including financing during the construction period. Costs directly related to acquisitions deemed to be business combinations are expensed. Ordinary repairs and maintenance are expensed as incurred. Major replacements and improvements that extend the useful life of the asset are capitalized and depreciated over their useful life.
Real estate investments are depreciated using the straight-line method over the estimated useful lives of the assets, summarized as follows:
| | | | | |
Category | Term |
Building and building improvements | 1 - 44 years |
Furniture and fixtures | 1 - 4 years |
There was 0 real estate acquired in settlement of residential mortgage loans at December 31, 2020 or December 31, 2019 other than real estatecorporate loan interests held by securitization trusts thatthe MML business operated by the Company, was requiredas well as assets managed for third parties (collectively, the “MML Portfolio”), to consolidate. The Company would be considered to have received physical possession of residential real estate property collateralizing a residential mortgage loan, so that the loan is derecognized and the real estate property would be recognized, if either (i) the Company obtains legal title to the residential real estate property upon completion of a foreclosure or (ii) the borrower conveys all interest in the residential real estate property to the Company to satisfy the loan through completion of a deed in lieu of foreclosure or through a similar legal agreement.
Real estate investments, including REO, that do not meet the criteria to be classified as heldAres Capital Management LLC (“Ares”) for sale are classified in the Consolidated Statements of Financial Condition as held for investment. Real estate held for sale is reported at the lower of its carrying value or its estimated fair value less estimated costs to sell. Once a property is determined to be held for sale, depreciation is no longer recorded.
$2.4 billion. The Company’s real estate portfolio (REOloans, having an unpaid principal balance of $1.9 billion, were transferred to Ares for cash proceeds of $1.9 billion and real estate held for investment) is reviewed on a quarterly basis, or more frequently as necessary, to assess whether there are any indicators that the valuerealized gain of its operating real estate may be impaired or that its carrying value may not be recoverable. A property’s value is considered impaired if the Company’s estimate of the aggregate future undiscounted cash flows to be generated by the property is less than the carrying value of the property. In conducting this review, the Company considers U.S. macroeconomic factors, including real estate sector conditions, together with asset specific and other factors. To the extent impairment has occurred and is considered to be other than temporary, the loss will be measured as the excess of the carrying amount of the property over the calculated fair value of the property.
During the year ended December 31, 2020, the Company took title of 2 commercial real estate properties for $79.8$20.4 million through foreclosure or deed-in-lieu of foreclosure. There were 0 new acquisitions of real estate holdingswas recorded during the year ended December 31, 2019. A portfolio2022. As of health care properties with a carrying value of $124.5 million, including intangible assets, was sold during the year ended December 31, 2020 and a gain on sale of $19.7 million was recognized. The Company sold 2 of its wholly owned triple net leased properties during the year ended December 31, 2019 for $25.2 million and recognized a gain on sale of $7.5 million.
The weighted average amortization period for intangible assets and liabilities at December 31, 2020 is 5.5 years. Above market leases and leasehold intangible assets are included in Intangible assets, net and below market leases are included in Other liabilities in the Consolidated Statements of Financial Condition.
| | | | | | | | | | | |
| | December 31, 2020 | | December 31, 2019 |
| Real estate, net | (dollars in thousands) |
| Land | $ | 164,240 | | | $ | 121,720 | |
| Buildings and improvements | 493,432 | | | 571,396 | |
| Furniture, fixtures and equipment | 6,240 | | | 11,238 | |
| Subtotal | 663,912 | | | 704,354 | |
| Less: accumulated depreciation | (100,147) | | | (87,532) | |
| Total real estate held for investment, at amortized cost, net | 563,765 | | | 616,822 | |
| Equity in unconsolidated joint ventures | 92,549 | | | 108,816 | |
| Total real estate, net | $ | 656,314 | | | $ | 725,638 | |
| | | |
ANNALY CAPITAL MANAGEMENT, INC. AND SUBSIDIARIES
Financial Statements
Depreciation expense was $22.7 million and $23.7 million for the years ended December 31, 2020 and 2019, respectively and is included in Other income (loss) in the Consolidated Statements of Comprehensive Income (Loss).
Rental Income
The minimum rental amounts due under leases are generally either subject2022, all loans were transferred to scheduled fixed increases or adjustments. The leases generally also require that the tenants reimburse the Company for certain operating costs. Rental income is included in Other income (loss) in the Company’s Consolidated Statements of Comprehensive Income (Loss).
Approximate future minimum rents to be received over the next five years and thereafter for non-cancelable operating leases in effect at December 31, 2020 for consolidated investments in real estate are as follows:
| | | | | |
| December 31, 2020 |
| (dollars in thousands) |
| 2021 | $ | 44,267 | |
| 2022 | 39,981 | |
| 2023 | 36,161 | |
| 2024 | 30,645 | |
| 2025 | 24,362 | |
| Later years | 60,971 | |
| Total | $ | 236,387 | |
| |
| | |
10.11. DERIVATIVE INSTRUMENTS |
|
Derivative instruments include, but are not limited to, interest rate swaps, options to enter into interest rate swaps (“swaptions”), TBA derivatives, options on TBA securities (“MBS options”), U.S. Treasury and EurodollarSOFR futures contracts and certain forward purchase commitments. The Company may also enter into other types of mortgage derivatives such as interest-only securities, credit derivatives referencing the commercial mortgage-backed securities index and synthetic total return swaps.
In connection with the Company’s investment/market rate risk management strategy, the Company economically hedges a portion of its interest rate risk by entering into derivative financial instrument contracts, which include interest rate swaps, swaptions and futures contracts. The Company may also enter into TBA derivatives, MBS options and U.S. Treasury or Eurodollar futures contracts, certain forward purchase commitments and credit derivatives to economically hedge its exposure to market risks. The purpose of using derivatives is to manage overall portfolio risk with the potential to generate additional income for distribution to stockholders. These derivatives are subject to changes in market values resulting from changes in interest rates, volatility, Agency mortgage-backed security spreads to U.S. Treasuries and market liquidity. The use of derivatives also creates exposure to credit risk relating to potential losses that could be recognized if the counterparties to these instruments fail to perform their obligations
ANNALY CAPITAL MANAGEMENT, INC. AND SUBSIDIARIES
Financial Statements
under the stated contract. Additionally, the Company may have to pledge cash or assets as collateral for the derivative transactions, the amount of which may vary based on the market value and terms of the derivative contract. In the case of market agreed coupon (“MAC”) interest rate swaps, the Company may make or receive a payment at the time of entering into such interest rate swaps, which represents fair value of these swaps, to compensate for the out of market nature of such interest rate swaps. Subsequent changes in fair value from inception of these interest rate swaps are reflected within UnrealizedNet gains (losses) on interest rate swapsderivatives in the Consolidated Statements of Comprehensive Income (Loss). Similar to other interest rate swaps, the Company may have to pledge cash or assets as collateral for the MAC interest rate swap transactions. In the event of a default by the counterparty, the Company could have difficulty obtaining its pledged collateral as well as receiving payments in accordance with the terms of the derivative contracts.
Derivatives are accounted for in accordance with FASB ASC 815, Derivatives and Hedging, which requires recognition of all derivativesrecognized as either assets or liabilities at fair value in the Consolidated Statements of Financial Condition with changes in fair value recognized in the Consolidated Statements of Comprehensive Income (Loss). The changes in the estimated fair value are presented within Net gains (losses) on other derivatives with the exception of interest rate swaps which are separately presented.derivatives. None of the Company’s derivative transactions have been designated as hedging instruments for accounting purposes.
The Company also maintains collateral in the form of cash on margin with counterparties to its interest rate swaps and other derivatives. In accordance with a clearing organization’s rulebook, the Company presents the fair value of centrally cleared interest rate swaps net of variation margin pledged or received under such transactions. At December 31, 20202023 and 2019, $1.52022, ($2.4) billion and $517.8 million,($3.2) billion, respectively, of variation margin was reported as an adjustment to interest rate swaps, at fair value.
Interest Rate Swap Agreements – Interest rate swap agreements are the primary instruments used to mitigate interest rate risk. In particular, the Company uses interest rate swap agreements to manage its exposure to changing interest rates on its repurchase
ANNALY CAPITAL MANAGEMENT, INC. AND SUBSIDIARIES
Financial Statements
agreements by economically hedging cash flows associated with these borrowings. The Company may enter intohave outstanding interest rate swap agreements where the floating leg is linked to the London Interbank Offered Rate (“LIBOR”),SOFR, the overnight index swap rate or another index. Interest rate swap agreements may or may not be cleared through a derivatives clearing organization (“DCO”). Uncleared interest rate swaps are fair valued using internal pricing models and compared to the counterparty market values. Centrally cleared interest rate swaps, including MAC interest rate swaps, are generally fair valued using the DCO’s market values. If an interest rate swap is terminated, the realized gain (loss) on the interest rate swap would be equal to the difference between the cash received or paid and fair value.
Swaptions – Swaptions are purchased or sold to mitigate the potential impact of increases or decreases in interest rates. Interest rate swaptions provide the option to enter into an interest rate swap agreement for a predetermined notional amount, stated term and pay and receive interest rates in the future. The Company’s swaptions are not centrally cleared. The premium paid or received for swaptions is reported as an asset or liability in the Consolidated Statements of Financial Condition. If a swaption expires unexercised, the realized gain (loss) on the swaption would be equal to the premium received or paid. If the Company sells or exercises a swaption, the realized gain (loss) on the swaption would be equal to the difference between the cash received or the fair value of the underlying interest rate swap received and the premium paid.
The fair value of swaptions are estimated using internal pricing models and compared to the counterparty market values.
TBA Dollar Rolls – TBA dollar roll transactions are accounted for as a series of derivative transactions. The fair value of TBA derivatives is based on methods similar to those used to value Agency mortgage-backed securities.
MBS Options – MBS options are generally options on TBA contracts, which help manage mortgage market risks and volatility while providing the potential to enhance returns. MBS options are over-the-counter traded instruments and those written on current-coupon mortgage-backed securities are typically the most liquid. MBS options are measured at fair value using internal pricing models and compared to the counterparty market value at the valuation date.
Futures Contracts – Futures contracts are derivatives that track the prices of specific assets or benchmark rates. Short sales of futures contracts help to mitigate the potential impact of changes in interest rates on the portfolio performance. The Company maintains margin accounts which are settled daily with Futures Commission Merchants (“FCMs”). The margin requirement varies based on the market value of the open positions and the equity retained in the account. Futures contracts are fair valued based on exchange pricing.
Forward Purchase Commitments – The Company may enter into forward purchase commitments with counterparties whereby the Company commits to purchasing residential mortgage loans at a particular price, provided the residential mortgage loans close with the counterparties. The counterparties are required to deliver the committed loans on a “best efforts” basis.
Credit Derivatives – The Company may enter into credit derivatives referencing a commercial mortgage-backed securities index, such as the CMBX index, and synthetic total return swaps.
The table below summarizes fair value information about our derivative assets and liabilities at December 31, 2020 and 2019:
| | | | | | | | | | | | | | | |
| Derivatives Instruments | | | December 31, 2020 | | December 31, 2019 |
| Assets | | | (dollars in thousands) |
| Interest rate swaps | | | $ | 0 | | | $ | 1,199 | |
| Interest rate swaptions | | | 74,470 | | | 11,580 | |
| TBA derivatives | | | 96,109 | | | 15,181 | |
| Futures contracts | | | 506 | | | 77,889 | |
| Purchase commitments | | | 49 | | | 2,050 | |
Credit derivatives (1) | | | 0 | | | 5,657 | |
| | | | $ | 171,134 | | | $ | 113,556 | |
| Liabilities | | | |
| Interest rate swaps | | | $ | 1,006,492 | | | $ | 706,862 | |
| | | | | |
| TBA derivatives | | | 0 | | | 11,316 | |
| Futures contracts | | | 19,413 | | | 84,781 | |
| Purchase commitments | | | 0 | | | 907 | |
Credit derivatives (1) | | | 7,440 | | | 0 | |
| | | | $ | 1,033,345 | | | $ | 803,866 | |
| | | | | |
(1)
The notional amount of the credit derivatives in which the Company purchased protection was $0.0 and $10.0 million at December 31, 2020 and December 31, 2019, respectively. The maximum potential amount of future payments is the notional amount of credit derivatives in which the Company sold protection of $504.0 million and $345.0 million at December 31, 2020 and December 31, 2019, respectively, plus any coupon shortfalls on the underlying tranche. As of December 31, 2020 and 2019, the credit derivative tranches referencing the basket of bonds had a range of ratings between AAA and A, and AA and BBB-, respectively.
ANNALY CAPITAL MANAGEMENT, INC. AND SUBSIDIARIES
Financial Statements
The following table summarizes fair value information about the Company’s derivative assets and liabilities at December 31, 2023 and 2022:
| | | | | | | | | | | | | | | |
| Derivatives Instruments | | | December 31, 2023 | | December 31, 2022 |
| Assets | | | (dollars in thousands) |
| Interest rate swaps | | | $ | 26,344 | | | $ | 33,006 | |
| Interest rate swaptions | | | 105,883 | | | 256,991 | |
| TBA derivatives | | | 20,689 | | | 17,056 | |
| Futures contracts | | | — | | | 33,179 | |
| Purchase commitments | | | 9,641 | | | 1,832 | |
| | | | | |
| Total derivative assets | | | $ | 162,557 | | | $ | 342,064 | |
| Liabilities | | | |
| Interest rate swaps | | | $ | 83,051 | | | $ | 108,724 | |
| | | | | |
| TBA derivatives | | | 39,070 | | | 69,270 | |
| Futures contracts | | | 179,835 | | | 11,919 | |
| Purchase commitments | | | 339 | | | 460 | |
Credit derivatives (1) | | | — | | | 13,799 | |
| Total derivative liabilities | | | $ | 302,295 | | | $ | 204,172 | |
| | | | | |
(1) The maximum potential amount of future payments is the notional amount of credit derivatives in which the Company sold protection of $420.0 million at December 31, 2022, respectively, plus any coupon shortfalls on the underlying tranche. As of December 31, 2022, the credit derivative tranches referencing the basket of bonds had a range of ratings between AAA and AA. |
The following table summarizestables summarize certain characteristics of the Company’s interest rate swaps at December 31, 20202023 and 2019:2022:
| | | | | | | | | | | | | | | | | | | | | | | |
| December 31, 2020 |
| Maturity | Current Notional (1)(2) | | Weighted Average Pay Rate | | Weighted Average Receive Rate | | Weighted Average Years to Maturity (3) |
| (dollars in thousands) |
| 0 - 3 years | $ | 23,680,150 | | | 0.27 | % | | 0.11 | % | | 1.96 |
| 3 - 6 years | 3,600,000 | | | 0.18 | % | | 0.09 | % | | 4.21 |
| 6 - 10 years | 5,565,500 | | | 1.40 | % | | 0.62 | % | | 7.76 |
| Greater than 10 years | 1,484,000 | | | 3.06 | % | | 0.36 | % | | 20.52 |
| Total / Weighted average | $ | 34,329,650 | | | 0.92 | % | | 0.37 | % | | 3.94 |
| | | | | | | |
| | | | | | | |
| December 31, 2019 |
| Maturity | Current Notional (1)(2) | | Weighted Average
Pay Rate | | Weighted Average Receive Rate | | Weighted Average Years to Maturity |
| (dollars in thousands) |
| 0 - 3 years | $ | 38,942,400 | | | 1.60 | % | | 1.84 | % | | 1.29 |
| 3 - 6 years | 16,097,450 | | | 1.77 | % | | 1.87 | % | | 4.30 |
| 6 - 10 years | 16,176,500 | | | 2.20 | % | | 2.02 | % | | 9.00 |
| Greater than 10 years | 2,930,000 | | | 3.76 | % | | 1.86 | % | | 17.88 |
| Total / Weighted average | $ | 74,146,350 | | | 1.84 | % | | 1.89 | % | | 4.23 |
| | | | | | | |
(1)As of December 31, 2020, 17%, 72% and 11% of the Company’s interest rate swaps were linked to LIBOR, the Federal funds rate
and the Secured Overnight Financing Rate, respectively. As of December 31, 2019, 75% and 25% of the Company’s interest rate
swaps were linked to LIBOR and the overnight index swap rate, respectively.
(2)There were 0 forward starting swaps at December 31, 2020 and December 31, 2019.
(3) As of December 31, 2020, the weighted average years to maturity of payer interest rate swaps is offset by the weighted average years to maturity
of receiver interest rate swaps. As such, the net weighted average years to maturity for each maturity bucket may fall outside of the range listed.
The following table presents swaptions outstanding at December 31, 2020 and 2019.
| | | | | | | | | | | | | | | | | | | | | | | | | | | | | | | | |
| December 31, 2020 |
| | Current Underlying Notional | | Weighted Average Underlying Fixed Rate | | Weighted Average Underlying Floating Rate | | Weighted Average Underlying Years to Maturity | | Weighted Average Months to Expiration |
| (dollars in thousands) |
| Long pay | | $8,050,000 | | 1.27% | | 3M LIBOR | | 10.40 | | 5.42 |
| Long receive | | $250,000 | | 1.66% | | 3M LIBOR | | 10.02 | | 0.13 |
| | | | | | | | | | |
| December 31, 2019 |
| | Current Underlying Notional | | Weighted Average Underlying Fixed Rate | | Weighted Average Underlying Floating Rate | | Weighted Average Underlying Years to Maturity | | Weighted Average Months to Expiration |
| (dollars in thousands) |
| Long pay | | $4,675,000 | | 2.53% | | 3M LIBOR | | 9.22 | | 4.66 |
| Long receive | | $2,000,000 | | 1.49% | | 3M LIBOR | | 10.29 | | 3.40 |
| | | | | | | | | | | | | | | | | | | | | | | |
| December 31, 2023 |
| Maturity | Current Notional (1)(2) | | Weighted Average Pay Rate | | Weighted Average Receive Rate | | Weighted Average Years to Maturity (3) |
| (dollars in thousands) |
| 0 - 3 years | $ | 21,397,358 | | | 3.17 | % | | 5.26 | % | | 1.23 |
| 3 - 6 years | 12,461,799 | | | 3.09 | % | | 5.37 | % | | 4.75 |
| 6 - 10 years | 22,949,150 | | | 2.85 | % | | 5.34 | % | | 8.02 |
| Greater than 10 years | 2,021,247 | | | 3.53 | % | | 5.27 | % | | 22.71 |
| Total / Weighted average | $ | 58,829,554 | | | 3.04 | % | | 5.31 | % | | 5.36 |
| | | | | | | |
| | | | | | | |
| December 31, 2022 |
| Maturity | Current Notional (1)(2) | | Weighted Average
Pay Rate | | Weighted Average Receive Rate | | Weighted Average Years to Maturity (3) |
| (dollars in thousands) |
| 0 - 3 years | $ | 26,355,700 | | | 0.88 | % | | 4.33 | % | | 0.75 |
| 3 - 6 years | 1,120,400 | | | 2.53 | % | | 3.95 | % | | 4.07 |
| 6 - 10 years | 22,492,200 | | | 2.54 | % | | 4.24 | % | | 8.76 |
| Greater than 10 years | 2,309,000 | | | 3.49 | % | | 4.26 | % | | 22.93 |
| Total / Weighted average | $ | 52,277,300 | | | 1.74 | % | | 4.28 | % | | 5.25 |
| | | | | | | |
(1) As of December 31, 2023, 94% and 6% of the Company’s interest rate swaps were linked to the Secured Overnight Financing Rate and the Federal funds rate, respectively. As of December 31, 2022, 60%, 23% and 17% of the Company’s interest rate swaps were linked to the Secured Overnight Financing Rate, the Federal funds rate and LIBOR, respectively. (2) There were no forward starting swaps at December 31, 2023 and December 31, 2022. (3) The weighted average years to maturity of payer interest rate swaps is offset by the weighted average years to maturity of receiver interest rate swaps. As such, the net weighted average years to maturity for each maturity bucket may fall outside of the range listed. |
ANNALY CAPITAL MANAGEMENT, INC. AND SUBSIDIARIES
Financial Statements
The following table summarizestables summarize certain characteristics of the Company’s swaptions at December 31, 2023 and 2022:
| | | | | | | | | | | | | | | | | | | | | | | | | | | | | | | | |
| December 31, 2023 |
| | Current Underlying Notional | | Weighted Average Underlying Fixed Rate | | Weighted Average Underlying Floating Rate | | Weighted Average Underlying Years to Maturity | | Weighted Average Months to Expiration |
| (dollars in thousands) |
| Long pay | | $1,250,000 | | 2.21% | | SOFR | | 7.69 | | 8.21 |
| Long receive | | $500,000 | | 1.65% | | SOFR | | 10.30 | | 3.53 |
| | | | | | | | | | |
| December 31, 2022 |
| | Current Underlying Notional | | Weighted Average Underlying Fixed Rate | | Weighted Average Underlying Floating Rate | | Weighted Average Underlying Years to Maturity | | Weighted Average Months to Expiration |
| (dollars in thousands) |
| Long pay | | $2,500,000 | | 2.02% | | 3M LIBOR | | 8.19 | | 14.28 |
| Long receive | | $750,000 | | 1.57% | | 3M LIBOR | | 11.07 | | 12.82 |
The following tables summarize certain characteristics of the Company’s TBA derivatives at December 31, 20202023 and 2019:2022:
| December 31, 2020 | | Purchase and sale contracts for derivative TBAs | Notional | | Implied Cost Basis | | Implied Market Value | | Net Carrying Value |
(dollars in thousands) | | Purchase contracts | $ | 19,635,000 | | | $ | 20,277,088 | | | $ | 20,373,197 | | | $ | 96,109 | |
| | December 31, 2019 | | December 31, 2023 | | December 31, 2023 |
| Purchase and sale contracts for derivative TBAs | Purchase and sale contracts for derivative TBAs | Notional | | Implied Cost Basis | | Implied Market Value | | Net Carrying Value | Purchase and sale contracts for derivative TBAs | Notional | | Implied Cost Basis | | Implied Market Value | | Net Carrying Value |
| (dollars in thousands) | (dollars in thousands) | (dollars in thousands) |
| Purchase contracts | Purchase contracts | $ | 10,043,000 | | | $ | 10,182,891 | | | $ | 10,192,038 | | | 9,147 | |
| Sale contracts | Sale contracts | (3,144,000) | | | (3,294,486) | | | (3,299,768) | | | (5,282) | |
| Net TBA derivatives | Net TBA derivatives | $ | 6,899,000 | | | $ | 6,888,405 | | | $ | 6,892,270 | | | $ | 3,865 | |
| | | December 31, 2022 | |
| | December 31, 2022 | |
| | December 31, 2022 | |
| Purchase and sale contracts for derivative TBAs | | Purchase and sale contracts for derivative TBAs | Notional | | Implied Cost Basis | | Implied Market Value | | Net Carrying Value |
| (dollars in thousands) | | (dollars in thousands) |
| Purchase contracts | |
| Sale contracts | |
| Net TBA derivatives | |
|
The following table summarizestables summarize certain characteristics of the Company’s futures derivatives at December 31, 20202023 and 2019:2022:
| December 31, 2020 | | December 31, 2023 | | December 31, 2023 |
| | | Notional - Long
Positions | | Notional - Short
Positions | | Weighted Average
Years to Maturity | | Notional - Long
Positions | | Notional - Short
Positions | | Weighted Average
Years to Maturity |
| | | (dollars in thousands) | | |
| | U.S. Treasury futures - 2 year | |
| | U.S. Treasury futures - 5 year | 0 | | | (1,240,000) | | | 4.40 |
| U.S. Treasury futures - 2 year | |
| | U.S. Treasury futures - 2 year | | $ | — | | | $ | (5,001,400) | | | 1.97 |
| | U.S. Treasury futures - 10 year and greater | |
| U.S. Treasury futures - 10 year and greater | |
| U.S. Treasury futures - 10 year and greater | U.S. Treasury futures - 10 year and greater | — | | | (9,183,800) | | | 6.90 | — | | | (1,733,600) | | (1,733,600) | | | 14.26 | | 14.26 |
| Total | Total | $ | 0 | | | $ | (10,423,800) | | | 6.60 | Total | $ | — | | | $ | | $ | (6,735,000) | | | 5.13 | | 5.13 |
| | December 31, 2019 | | December 31, 2022 | |
| | December 31, 2022 | |
| | December 31, 2022 | |
| | | Notional - Long
Positions | | Notional - Short
Positions | | Weighted Average
Years to Maturity | | Notional - Long
Positions | | Notional - Short
Positions | | Weighted Average
Years to Maturity |
| | | (dollars in thousands) | | |
| | U.S. Treasury futures - 2 year | |
| | U.S. Treasury futures - 2 year | |
| | U.S. Treasury futures - 2 year | U.S. Treasury futures - 2 year | $ | 0 | | | $ | (180,000) | | | 1.96 | $ | — | | | $ | | $ | (8,518,400) | | | 1.96 | | 1.96 |
| U.S. Treasury futures - 5 year | U.S. Treasury futures - 5 year | 0 | | | (2,953,300) | | | 4.42 | U.S. Treasury futures - 5 year | — | | | (5,803,400) | | (5,803,400) | | | 4.37 | | 4.37 |
| U.S. Treasury futures - 10 year and greater | U.S. Treasury futures - 10 year and greater | 2,600,000 | | | (5,806,400) | | | 9.74 | U.S. Treasury futures - 10 year and greater | — | | | (6,866,900) | | (6,866,900) | | | 8.15 | | 8.15 |
| Total | Total | $ | 2,600,000 | | | $ | (8,939,700) | | | 8.26 | Total | $ | — | | | $ | | $ | (21,188,700) | | | 4.63 | | 4.63 |
|
The Company presents derivative contracts on a gross basis onin the Consolidated Statements of Financial Condition. Derivative contracts may contain legally enforceable provisions that allow for netting or setting off receivables and payables with each counterparty.
ANNALY CAPITAL MANAGEMENT, INC. AND SUBSIDIARIES
Financial Statements
The following tables present information about derivative assets and liabilities that are subject to such provisions and can be offset on ourin the Company’s Consolidated Statements of Financial Condition at December 31, 20202023 and 2019,2022, respectively.
| December 31, 2020 | | December 31, 2023 | | December 31, 2023 |
| | | | Amounts Eligible for Offset | | | | | | Amounts Eligible for Offset | | |
| | | Gross Amounts | | Financial Instruments | | Cash Collateral | | Net Amounts | | Gross Amounts | | Financial Instruments | | Cash Collateral | | Net Amounts |
| Assets | Assets | (dollars in thousands) | Assets | (dollars in thousands) |
| Interest rate swaps, at fair value | |
| Interest rate swaptions, at fair value | |
| TBA derivatives, at fair value | |
| | Interest rate swaptions, at fair value | $ | 74,470 | | | $ | 0 | | | $ | 0 | | | $ | 74,470 | |
| Purchase commitments | |
| Purchase commitments | |
| Purchase commitments | |
| | Liabilities | |
| Liabilities | |
| Liabilities | | |
| Interest rate swaps, at fair value | |
| TBA derivatives, at fair value | TBA derivatives, at fair value | 96,109 | | | 0 | | | 0 | | | 96,109 | |
| Futures contracts, at fair value | Futures contracts, at fair value | 506 | | | (506) | | | 0 | | | 0 | |
| Purchase commitments | Purchase commitments | 49 | | | 0 | | | 0 | | | 49 | |
| | Liabilities | |
| Interest rate swaps, at fair value | $ | 1,006,492 | | | $ | 0 | | | $ | (108,757) | | | $ | 897,735 | |
| | Futures contracts, at fair value | 19,413 | | | (506) | | | (18,907) | | | 0 | |
| | Credit derivatives | 7,440 | | | 0 | | | (7,440) | | | 0 | |
| December 31, 2019 | | December 31, 2022 | | December 31, 2022 |
| | | | Amounts Eligible for Offset | | | | | | Amounts Eligible for Offset | | |
| | | Gross Amounts | | Financial Instruments | | Cash Collateral | | Net Amounts | | Gross Amounts | | Financial Instruments | | Cash Collateral | | Net Amounts |
| Assets | Assets | (dollars in thousands) | Assets | (dollars in thousands) |
| Interest rate swaps, at fair value | Interest rate swaps, at fair value | $ | 1,199 | | | $ | (951) | | | $ | 0 | | | $ | 248 | |
| Interest rate swaptions, at fair value | Interest rate swaptions, at fair value | 11,580 | | | 0 | | | 0 | | | 11,580 | |
| TBA derivatives, at fair value | TBA derivatives, at fair value | 15,181 | | | (5,018) | | | 0 | | | 10,163 | |
| Futures contracts, at fair value | Futures contracts, at fair value | 77,889 | | | (10,902) | | | 0 | | | 66,987 | |
| Purchase commitments | Purchase commitments | 2,050 | | | 0 | | | 0 | | | 2,050 | |
| Credit derivatives | 5,657 | | | 0 | | | 0 | | | 5,657 | |
| | Liabilities | |
| Liabilities | |
| Liabilities | Liabilities | | |
| Interest rate swaps, at fair value | Interest rate swaps, at fair value | $ | 706,862 | | | $ | (951) | | | $ | (104,205) | | | $ | 601,706 | |
| TBA derivatives, at fair value | TBA derivatives, at fair value | 11,316 | | | (5,018) | | | 0 | | | 6,298 | |
| Futures contracts, at fair value | Futures contracts, at fair value | 84,781 | | | (10,902) | | | (73,879) | | | 0 | |
| Purchase commitments | Purchase commitments | 907 | | | 0 | | | 0 | | | 907 | |
| | Credit derivatives | |
The effect of interest rate swaps onin the Consolidated Statements of Comprehensive Income (Loss) is as follows:
| | | | | | | | | | | | | | | | | |
| Location on Consolidated Statements of Comprehensive Income (Loss) |
| | Net Interest Component of Interest Rate Swaps (1) | | Realized Gains (Losses) on Termination of Interest Rate Swaps (1) | | Unrealized Gains (Losses) on Interest Rate Swaps (1) |
| For the years ended | (dollars in thousands) |
| December 31, 2023 | $ | 1,585,053 | | | $ | (74,757) | | | $ | (815,630) | |
| December 31, 2022 | $ | 366,161 | | | $ | (266,427) | | | $ | 3,480,708 | |
| December 31, 2021 | $ | (276,142) | | | $ | (1,236,349) | | | $ | 2,198,486 | |
(1) Included in Net gains (losses) on derivatives in the Consolidated Statements of Comprehensive Income (Loss). |
| | | | | | | | | | | | | | | | | |
| Location on Consolidated Statements of Comprehensive Income (Loss) |
| | Net Interest Component of Interest Rate Swaps | | Realized Gains (Losses) on Termination of Interest Rate Swaps | | Unrealized Gains (Losses) on Interest Rate Swaps |
| For the years ended | (dollars in thousands) |
| December 31, 2020 | $ | (207,877) | | | $ | (1,917,628) | | | $ | (904,532) | |
| December 31, 2019 | $ | 351,375 | | | $ | (1,442,964) | | | $ | (1,210,276) | |
| December 31, 2018 | $ | 100,553 | | | $ | 1,409 | | | $ | 424,081 | |
ANNALY CAPITAL MANAGEMENT, INC. AND SUBSIDIARIES
Financial Statements
The effect of other derivative contracts onin the Company’s Consolidated Statements of Comprehensive Income (Loss) is as follows:
| Year Ended December 31, 2020 | | Year Ended December 31, 2023 | | Year Ended December 31, 2023 |
| Derivative Instruments | Derivative Instruments | Realized Gain (Loss) | | Unrealized Gain (Loss) | | Amount of Gain/(Loss) Recognized in Net Gains (Losses) on Other Derivatives | Derivative Instruments | Realized Gain (Loss) | | Unrealized Gain (Loss) | | Amount of Gain/(Loss) Recognized in Net Gains (Losses) on Other Derivatives and Financial Instruments |
| (dollars in thousands) | (dollars in thousands) | (dollars in thousands) |
| Net TBA derivatives | Net TBA derivatives | $ | 893,120 | | | $ | 92,244 | | | $ | 985,364 | |
| Net interest rate swaptions | Net interest rate swaptions | 11,730 | | | 46,301 | | | 58,031 | |
| Futures | Futures | (268,084) | | | (12,015) | | | (280,099) | |
| Purchase commitments | Purchase commitments | 0 | | | (1,093) | | | (1,093) | |
| Credit derivatives | Credit derivatives | 6,068 | | | (11,966) | | | (5,898) | |
| Total | Total | | $ | 756,305 | |
| |
| | | | | | | | | | | | | | | | | |
| Year Ended December 31, 2019 |
| Derivative Instruments | Realized Gain (Loss) | | Unrealized Gain (Loss) | | Amount of Gain/(Loss) Recognized in Net Gains (Losses) on Other Derivatives |
| (dollars in thousands) |
| Net TBA derivatives | $ | 464,575 | | | $ | (137,823) | | | $ | 326,752 | |
| Net interest rate swaptions | (47,863) | | | (15,961) | | | (63,824) | |
| Futures | (1,418,143) | | | 455,417 | | | (962,726) | |
| Purchase commitments | 0 | | | 333 | | | 333 | |
| Credit derivatives | 8,077 | | | 10,618 | | | 18,695 | |
| Total | | | | | $ | (680,770) | |
| | | | | |
| | | | | | | | | | | | | | | | | |
| Year Ended December 31, 2022 |
| Derivative Instruments | Realized Gain (Loss) | | Unrealized Gain (Loss) | | Amount of Gain/(Loss) Recognized in Net Gains (Losses) on Other Derivatives and Financial Instruments |
| (dollars in thousands) |
| Net TBA derivatives | $ | (2,729,866) | | | $ | (100,990) | | | $ | (2,830,856) | |
| Net interest rate swaptions | (43,124) | | | 195,084 | | | 151,960 | |
| Futures | 3,825,072 | | | 141,366 | | | 3,966,438 | |
| Purchase commitments | — | | | 460 | | | 460 | |
| Credit derivatives | 3,657 | | | (12,927) | | | (9,270) | |
| Total | | | | | $ | 1,278,732 | |
| | | | | |
Certain of the Company’s derivative contracts are subject to International Swaps and Derivatives Association Master Agreements or other similar agreements which may contain provisions that grant counterparties certain rights with respect to the applicable agreement upon the occurrence of certain events such as (i) a decline in stockholders’ equity in excess of specified thresholds or dollar amounts over set periods of time, (ii) the Company’s failure to maintain its REIT status, (iii) the Company’s failure to comply with limits on the amount of leverage, and (iv) the Company’s stock being delisted from the New York Stock Exchange.
Upon the occurrence of any one of items (i) through (iv), or another default under the agreement, the counterparty to the applicable agreement has a right to terminate the agreement in accordance with its provisions. The aggregate fair value of all derivative instruments with the aforementioned features that are in a net liability position at December 31, 20202023 was approximately $0.9 billion,$184.9 million, which represents the maximum amount the Company would be required to pay upon termination. This amount is fully collateralized.
ANNALY CAPITAL MANAGEMENT, INC. AND SUBSIDIARIES
Financial Statements
| | |
11.12. FAIR VALUE MEASUREMENTS |
|
The Company follows fair value guidance in accordance with GAAP to account for its financial instruments and MSRsMSR that are accounted for at fair value. The fair value of a financial instrument and MSR is the amount that would be received to sell an asset or paid to transfer a liability in an orderly transaction between market participants at the measurement date.
GAAP requires classification of financial instruments and MSRsMSR into a three-level hierarchy based on the priority of the inputs to the valuation technique. The fair value hierarchy gives the highest priority to quoted prices in active markets for identical assets or liabilities (Level 1) and the lowest priority to unobservable inputs (Level 3).
If the inputs used to measure the financial instrumentsinstrument and MSRsMSR fall within different levels of the hierarchy, the categorization is based on the lowest priority input that is significant to the fair value measurement of the instrument. Financial assets and liabilities recorded at fair value on the Consolidated Statements of Financial Condition or disclosed in the related notes are categorized based on the inputs to the valuation techniques as follows:
Level 1 – inputs to the valuation methodology are quoted prices (unadjusted) for identical assets and liabilities in active markets.
ANNALY CAPITAL MANAGEMENT, INC. AND SUBSIDIARIES
Financial Statements
Level 2 – inputs to the valuation methodology include quoted prices for similar assets and liabilities in active markets, and inputs that are observable for the asset or liability, either directly or indirectly, for substantially the full term of the financial instrument.
Level 3 – inputs to the valuation methodology are unobservable and significant to overall fair value.
The Company designates its securities as trading, available-for-sale or held-to-maturity depending upon the type of security and the Company’s intent and ability to hold such security to maturity. Securities classified as available-for-sale and trading are reported at fair value on a recurring basis.
The following is a description of the valuation methodologies used for instruments carried at fair value. These methodologies are applied to assets and liabilities across the three-level fair value hierarchy, with the observability of inputs determining the appropriate level.
Futures contracts and U.S. Treasury securities are valued using quoted prices for identical instruments in active markets and are classified as Level 1.
Residential Securities, interest rate swaps, swaptions and other derivatives are valued using quoted prices or internally estimated prices for similar assets using internal models. The Company incorporates common market pricing methods, including a spread measurement to the Treasury curve as well as underlying characteristics of the particular security including coupon, prepayment speeds, periodic and life caps, rate reset period and expected life of the security in its estimates of fair value. Fair value estimates for residential mortgage loans are generated by a discounted cash flow model and are primarily based on observable market-based inputs including discount rates, prepayment speeds, delinquency levels, and credit losses. Management reviews and indirectly corroborates its estimates of the fair value derived using internal models by comparing its results to independent prices provided by dealers in the securities and/or third party pricing services. Certain liquid asset classes, such as Agency fixed-rate pass-throughs, may be priced using independent sources such as quoted prices for TBA securities.
Residential Securities, residential mortgage loans, interest rate swap and swaption markets and TBA derivatives and MBS options are considered to be active markets such that participants transact with sufficient frequency and volume to provide transparent pricing information on an ongoing basis. The liquidity of the Residential Securities, residential mortgage loans, interest rate swaps, swaptions and TBA derivatives and MBS options markets and the similarity of the Company’s securities to those actively traded enable the Company to observe quoted prices in the market and utilize those prices as a basis for formulating fair value measurements. Consequently, the Company has classified Residential Securities, residential mortgage loans, interest rate swaps, swaptions and TBA derivatives and MBS options as Level 2 inputs in the fair value hierarchy.
The fair value of commercial mortgage-backed securities classified as available-for-sale is determined based upon quoted prices of similar assets in recent market transactions and requires the application of judgment due to differences in the underlying collateral. Consequently, commercial real estate debt investments carried at fair value are classified as Level 2.
For the fair value of debt issued by securitization vehicles, refer to the Note titled “Variable Interest Entities” Note for additional information.
The Company classifies its investments in MSRsMSR and Interests in MSR as Level 3 in the fair value measurements hierarchy. Fair value estimates for these investments are obtained from models, which use significant unobservable inputs in their valuations. These valuations primarily utilize discounted cash flow models that incorporate unobservable market data inputs including discount rates, prepayment rates, delinquency levels and costs to service and discount rates.service. Model valuations are then compared to valuations
ANNALY CAPITAL MANAGEMENT, INC. AND SUBSIDIARIES
Financial Statements
obtained from third-partythird party pricing providers. Management reviews the valuations received from third-partythird party pricing providers and uses them as a point of comparison to modeled values. The valuation of MSRs requiresMSR and Interests in MSR require significant judgment by management and the third-partythird party pricing providers. Assumptions used for which there is a lack of observable inputs may significantly impact the resulting fair value and therefore the Company’s financial statements.
The following tables present the estimated fair values of financial instruments and MSRsMSR measured at fair value on a recurring basis. There were no transfers between levels of the fair value hierarchy during the periods presented.
| | | | | | | | | | | | | | | | | | | | | | | |
| December 31, 2023 |
| | Level 1 | | Level 2 | | Level 3 | | Total |
| Assets | (dollars in thousands) |
| Securities | | | | | | | |
| Agency mortgage-backed securities | $ | — | | | $ | 66,308,788 | | | $ | — | | | $ | 66,308,788 | |
| Credit risk transfer securities | — | | | 974,059 | | | — | | | 974,059 | |
| Non-Agency mortgage-backed securities | — | | | 2,108,274 | | | — | | | 2,108,274 | |
| Commercial mortgage-backed securities | — | | | 222,444 | | | — | | | 222,444 | |
| Loans | | | | | | | |
| Residential mortgage loans | — | | | 2,353,084 | | | — | | | 2,353,084 | |
| | | | | | | |
| Mortgage servicing rights | — | | | — | | | 2,122,196 | | | 2,122,196 | |
| | | | | | | |
| Assets transferred or pledged to securitization vehicles | — | | | 13,307,622 | | | — | | | 13,307,622 | |
| Derivative assets | | | | | | | |
| | | | | | | |
| Interest rate swaps | — | | | 26,344 | | | — | | | 26,344 | |
| Other derivatives | — | | | 136,213 | | | — | | | 136,213 | |
| Total assets | $ | — | | | $ | 85,436,828 | | | $ | 2,122,196 | | | $ | 87,559,024 | |
| Liabilities | | | | | | | |
| Debt issued by securitization vehicles | $ | — | | | $ | 11,600,338 | | | $ | — | | | $ | 11,600,338 | |
| Participations issued | — | | | 1,103,835 | | | — | | | 1,103,835 | |
| U.S. Treasury securities sold, not yet purchased | 2,132,751 | | | — | | | — | | | 2,132,751 | |
| Derivative liabilities | | | | | | | |
| Interest rate swaps | — | | | 83,051 | | | — | | | 83,051 | |
| Other derivatives | 179,835 | | | 39,409 | | | — | | | 219,244 | |
| Total liabilities | $ | 2,312,586 | | | $ | 12,826,633 | | | $ | — | | | $ | 15,139,219 | |
| | | | | | | |
| | | | | | | | | | | | | | | | | | | | | | | |
| December 31, 2022 |
| | Level 1 | | Level 2 | | Level 3 | | Total |
| Assets | (dollars in thousands) |
| Securities | | | | | | | |
| Agency mortgage-backed securities | $ | — | | | $ | 62,274,895 | | | $ | — | | | $ | 62,274,895 | |
| Credit risk transfer securities | — | | | 997,557 | | | — | | | 997,557 | |
| Non-Agency mortgage-backed securities | — | | | 1,991,146 | | | — | | | 1,991,146 | |
| Commercial mortgage-backed securities | — | | | 526,309 | | | — | | | 526,309 | |
| Loans | | | | | | | |
| Residential mortgage loans | — | | | 1,809,832 | | | — | | | 1,809,832 | |
| | | | | | | |
| Mortgage servicing rights | — | | | — | | | 1,748,209 | | | 1,748,209 | |
| | | | | | | |
| Assets transferred or pledged to securitization vehicles | — | | | 9,121,912 | | | — | | | 9,121,912 | |
| Derivative assets | | | | | | | |
| | | | | | | |
| Interest rate swaps | — | | | 33,006 | | | — | | | 33,006 | |
| Other derivatives | 33,179 | | | 275,879 | | | — | | | 309,058 | |
| Total assets | $ | 33,179 | | | $ | 77,030,536 | | | $ | 1,748,209 | | | $ | 78,811,924 | |
| Liabilities | | | | | | | |
| Debt issued by securitization vehicles | $ | — | | | $ | 7,744,160 | | | $ | — | | | $ | 7,744,160 | |
| Participations issued | — | | | 800,849 | | | — | | | 800,849 | |
| | | | | | | |
| Derivative liabilities | | | | | | | |
| Interest rate swaps | — | | | 108,724 | | | — | | | 108,724 | |
| Other derivatives | 11,919 | | | 83,529 | | | — | | | 95,448 | |
| Total liabilities | $ | 11,919 | | | $ | 8,737,262 | | | $ | — | | | $ | 8,749,181 | |
| | | | | | | |
ANNALY CAPITAL MANAGEMENT, INC. AND SUBSIDIARIES
Financial Statements
| | | | | | | | | | | | | | | | | | | | | | | |
| December 31, 2020 |
| | Level 1 | | Level 2 | | Level 3 | | Total |
| Assets | (dollars in thousands) |
| Securities | | | | | | | |
| Agency mortgage-backed securities | $ | 0 | | | $ | 74,067,059 | | | $ | 0 | | | $ | 74,067,059 | |
| Credit risk transfer securities | 0 | | | 532,403 | | | 0 | | | 532,403 | |
| Non-Agency mortgage-backed securities | 0 | | | 972,192 | | | 0 | | | 972,192 | |
| Commercial mortgage-backed securities | 0 | | | 80,742 | | | 0 | | | 80,742 | |
| Loans | | | | | | | |
| Residential mortgage loans | 0 | | | 345,810 | | | 0 | | | 345,810 | |
| Mortgage servicing rights | 0 | | | 0 | | | 100,895 | | | 100,895 | |
| Assets transferred or pledged to securitization vehicles | 0 | | | 6,035,671 | | | 0 | | | 6,035,671 | |
| Derivative assets | | | | | | | |
| | | | | | | |
| | | | | | | |
| Other derivatives | 506 | | | 170,628 | | | 0 | | | 171,134 | |
| Total assets | $ | 506 | | | $ | 82,204,505 | | | $ | 100,895 | | | $ | 82,305,906 | |
| Liabilities | | | | | | | |
| | | | | | | |
| Debt issued by securitization vehicles | 0 | | | 5,652,982 | | | 0 | | | 5,652,982 | |
| Participations issued | 0 | | | 39,198 | | | 0 | | | 39,198 | |
| Derivative liabilities | | | | | | | |
| Interest rate swaps | 0 | | | 1,006,492 | | | 0 | | | 1,006,492 | |
| Other derivatives | 19,413 | | | 7,440 | | | 0 | | | 26,853 | |
| Total liabilities | $ | 19,413 | | | $ | 6,706,112 | | | $ | 0 | | | $ | 6,725,525 | |
| | | | | | | |
| | | | | | | | | | | | | | | | | | | | | | | |
| December 31, 2019 |
| | Level 1 | | Level 2 | | Level 3 | | Total |
| Assets | (dollars in thousands) |
| Securities | | | | | | | |
| Agency mortgage-backed securities | $ | 0 | | | $ | 112,893,367 | | | $ | 0 | | | $ | 112,893,367 | |
| Credit risk transfer securities | 0 | | | 531,322 | | | 0 | | | 531,322 | |
| Non-Agency mortgage-backed securities | 0 | | | 1,135,868 | | | 0 | | | 1,135,868 | |
| Commercial mortgage-backed securities | 0 | | | 273,023 | | | 0 | | | 273,023 | |
| Loans | | | | | | | |
| Residential mortgage loans | 0 | | | 1,647,787 | | | 0 | | | 1,647,787 | |
| Mortgage servicing rights | 0 | | | 0 | | | 378,078 | | | 378,078 | |
| Assets transferred or pledged to securitization vehicles | 0 | | | 6,066,082 | | | 0 | | | 6,066,082 | |
| Derivative assets | | | | | | | |
| | | | | | | |
| Interest rate swaps | 0 | | | 1,199 | | | 0 | | | 1,199 | |
| Other derivatives | 77,889 | | | 34,468 | | | 0 | | | 112,357 | |
| Total assets | $ | 77,889 | | | $ | 122,583,116 | | | $ | 378,078 | | | $ | 123,039,083 | |
| Liabilities | | | | | | | |
| | | | | | | |
| Debt issued by securitization vehicles | $ | 0 | | | $ | 5,622,801 | | | $ | 0 | | | $ | 5,622,801 | |
| Derivative liabilities | | | | | | | |
| Interest rate swaps | 0 | | | 706,862 | | | 0 | | | 706,862 | |
| Other derivatives | 84,781 | | | 12,223 | | | 0 | | | 97,004 | |
| Total liabilities | $ | 84,781 | | | $ | 6,341,886 | | | $ | 0 | | | $ | 6,426,667 | |
| | | | | | | |
Qualitative and Quantitative Information about Level 3 Fair Value Measurements
The Company considers unobservable inputs to be those for which market data is not available and that are developed using the best information available to us about the assumptions that market participants would use when pricing the asset. Relevant inputs vary depending on the nature of the instrument being measured at fair value. The sensitivities of significant unobservable inputs along with interrelationships between and among the significant unobservable inputs and their impact on the fair value measurements are described below. The effect of a change in a particular assumption in the sensitivity analysis below is considered independently from changes in any other assumptions. In practice, simultaneous changes in assumptions may not always have a linear effect on the inputs discussed below. Interrelationships may also exist between observable and
ANNALY CAPITAL MANAGEMENT, INC. AND SUBSIDIARIES
Financial Statements
unobservable inputs. Such relationships have not been included in the discussion below. For each of the individual relationships described below, the inverse relationship would also generally apply. For MSRs,MSR and Interests in MSR, in general, increases in the discount, prepayment or delinquency rates or in annual servicing costs in isolation would result in a lower fair value measurement. A decline in interest rates could lead to higher-than-expected prepayments of mortgages underlying the Company’s investments in MSRs,MSR and Interests in MSR, which in turn could result in a decline in the estimated fair value of MSRs.MSR and Interests in MSR. Refer to the Note titled “Mortgage Servicing Rights” Note for additional information.information, including rollforwards.
The following table below presents information about the significant unobservable inputs used for recurring fair value measurements for Level 3 MSRs.MSR and Interests in MSR. The table does not give effect to the Company’s risk management practices that might offset risks inherent in these Level 3 investments.
| | | | | | | | | | | | | | | | | | | | | | | |
| December 31, 2020 | | December 31, 2019 |
| | | Range | | | | Range |
Valuation Technique | Unobservable Input (1) | | (Weighted Average ) (2)
| | Unobservable Input (1)
| | (Weighted Average )Range (Weighted Average) (2)
|
| Discounted cash flowDecember 31, 2023 | | December 31, 2022 |
| Discount rate | | 9.0%7.0% - 12.0% (9.4%(8.6%) | | Discount rate | | 9.0%8.4% - 12.0% (9.3%10.7% (9.7%) |
| Prepayment rate | Prepayment rate | | 19.3%4.8% - 55.5% (42.0%11.0% (5.6%) | | Prepayment rate | | 6.3%4.8% - 26.6% (13.7%8.1% (5.4%) |
| Delinquency rate | | 0.0%0.2% - 6.0% (2.5%4.2% (1.3%) | | Delinquency rate | | 0.0%0.2% - 4.0% (2.2%4.5% (1.3%) |
| Cost to service | | $8384 - $108$111 ($98)94) | | Cost to service | | $8186 - $135$118 ($107)95) |
(1) Represents rates, estimates and assumptions that the Company believes would be used by market participants when valuing these assets. |
(2)Weighted average discount rate computed based on the fair value of MSRs,MSR, weighted average prepayment rate, delinquency rate and cost to service based on unpaid principal balances of loans underlying the MSRs.MSR. |
The following table summarizes the estimated fair values for financial assets and liabilities that are not carried at fair value at December 31, 20202023 and 2019.2022.
| | | | | | | | | | | | | | | | | | | | | | | | | |
| | | | December 31, 2020 | | December 31, 2019 |
| | | | Carrying
Value | | Fair
Value | | Carrying
Value | | Fair
Value |
| Financial assets | | | (dollars in thousands) |
| | | | | | | | | |
| Loans | | | | | | | | | |
| | | | | | | | | |
| | | | | | | | | |
| | | | | | | | | |
| | | | | | | | | |
| | | | | | | | | |
| | | | | | | | | |
| | | | | | | | | |
Commercial real estate debt and preferred equity, held for investment (1) | | | $ | 1,372,430 | | | $ | 1,442,071 | | | $ | 1,606,091 | | | $ | 1,619,018 | |
| | | | | | | | | |
| Corporate debt held for investment | | | 2,239,930 | | | 2,226,045 | | | 2,144,850 | | | 2,081,327 | |
| | | | | | | | | |
| Assets transferred or pledged to securitization vehicles | | | 874,349 | | | 928,732 | | | 936,378 | | | 944,618 | |
| | | | | | | | | |
| | | | | | | | | |
| Financial liabilities | | | | | | | | | |
| Repurchase agreements | | | $ | 64,825,239 | | | $ | 64,825,239 | | | $ | 101,740,728 | | | $ | 101,740,728 | |
| Other secured financing | | | 917,876 | | | 917,876 | | | 4,455,700 | | | 4,455,700 | |
| | | | | | | | | |
| | | | | | | | | |
| Mortgage payable | | | 426,256 | | | 474,779 | | | 485,005 | | | 515,994 | |
(1) Includes assets of consolidated VIEs. |
| | | | | | | | | |
| | | | | | | | | |
| | | | | | | | | | | | | | | | | | | | | | | | | |
| | | | December 31, 2023 | | December 31, 2022 |
| | | | Carrying
Value | | Fair
Value | | Carrying
Value | | Fair
Value |
| | | |
| | | | | | | | | |
| | | | | | | | | |
| | | | | | | | | |
| | | | | | | | | |
| | | | | | | | | |
| | | | | | | | | |
| | | | | | | | | |
| | | | | | | | | |
| | | | | | | | | |
| | | | | | | | | |
| | | | | | | | | |
| | | | | | | | | |
| | | | | | | | | |
| | | | | | | | | |
| | | | | | | | | |
| | | | | | | | | |
| Financial liabilities | | | | | | | | | |
| Repurchase agreements | | | $62,201,543 | | $62,201,543 | | $59,512,597 | | $59,512,597 |
| Other secured financing | | | 500,000 | | 500,000 | | 250,000 | | 250,000 |
| | | | | | | | | |
| | | | | | | | | |
| | | | | | | | | |
|
| | | | | | | | | |
| | | | | | | | | |
Commercial real estate debt and preferred equity, held for investment, corporate debt, held for investment and mortgages payable are valued using Level 3 inputs. The carrying values of repurchase agreements and short term other secured financing approximatesapproximate fair value and are considered Level 2 fair value measurements. Long term other secured financing areis valued using Level 2 inputs.
| | |
12. GOODWILL AND INTANGIBLE ASSETS |
|
Goodwill
The Company’s acquisitions are accounted for using the acquisition method if the acquisition is deemed to be a business. Under the acquisition method, net assets and results of operations of acquired companies are included in the consolidated financial statements from the date of acquisition. The purchase prices are allocated to the assets acquired, including identifiable intangible assets, and the liabilities assumed based on their estimated fair values at the date of acquisition. The excess of the purchase price over the fair value of the net assets acquired is recognized as goodwill. Conversely, any excess of the fair value of the net assets acquired over the purchase price is recognized as a bargain purchase gain.
ANNALY CAPITAL MANAGEMENT, INC. AND SUBSIDIARIES
Financial Statements
The Company tests goodwill for impairment on an annual basis or more frequently when events or circumstances may make it more likely than not that an impairment has occurred. If a qualitative analysis indicates that there may be an impairment, a quantitative analysis is performed. The quantitative impairment test for goodwill compares the fair value of a reporting unit with its carrying value, including goodwill. If the carrying value of a reporting unit exceeds its fair value, an impairment loss is recognized in amount equal to that excess, limited to the total amount of goodwill allocated to that reporting unit. At December 31, 2020 and 2019, goodwill totaled $71.8 million.
Intangible assets, net
Finite life intangible assets are amortized over their expected useful lives. As part of the Company’s management internalization transaction, which closed on June 30, 2020, the Company recognized an intangible asset for the acquired assembled workforce of approximately $41.2 million based on the replacement cost of the employee base acquired by the Company.
The following table presents the activity of finite lived intangible assets for the year ended December 31, 2020.2023.
| | | | | |
| Intangible Assets, net |
| (dollars in thousands) |
Balance at December 31, 2019Beginning balance January 1, 2023 | $ | 20,95716,679 | |
| |
| |
Intangible assets acquiredImpairment | 50,360(1,626) | |
| Intangible assets divested | (5,320) |
| Less: amortization expense | (10,471)(2,947) | |
Balance atEnding balance December 31, 20202023 | $ | 55,52612,106 | |
| |
Reverse Repurchase and Repurchase Agreements – The Company finances a significant portion of its assets with repurchase agreements. At the inception of each transaction, the Company assessed each of the specified criteria in ASC 860, Transfers and Servicing, and has determined that each of the financing agreements meet the specified criteria in this guidance.should be treated as a secured financing.
The Company enters into reverse repurchase agreements to earn a yield on excess cash balances. The Company obtains collateral in connection with the reverse repurchase agreements in order toTo mitigate credit risk exposure, the Company monitors the market value of these securities and delivers or obtains additional collateral based on changes in market value of these securities. Generally, the Company receives or posts collateral with a fair value approximately equal to its counterparties.or greater than the value of the secured financing.
Reverse repurchase agreements and repurchase agreements with the same counterparty and the same maturity are presented net in the Consolidated Statements of Financial Condition when the terms of the agreements meet the criteria to permit netting. The Company reports cash flows on repurchase agreements as financing activities and cash flows on reverse repurchase agreements as investing activities in the Consolidated Statements of Cash Flows.
The Company had outstanding $64.8$62.2 billion and $101.7$59.5 billion of repurchase agreements with weighted average borrowing ratesremaining maturities of 0.82%44 days and 1.99%, after giving effect to the Company’s interest rate swaps used to hedge cost of funds,27 days and weighted average remaining maturitiesrates of 64 days5.70% and 65 days4.29% at December 31, 20202023 and 2019,2022, respectively. TheIn connection with its residential mortgage loans, the Company has select arrangements with counterparties to enter into repurchase agreements for $2.4 billion with remaining capacity of $1.9$1.5 billion at December 31, 2020.2023.
At December 31, 20202023 and 2019,2022, the repurchase agreements had the following remaining maturities and collateral types and weighted average rates:types:
| December 31, 2020 | | December 31, 2023 | |
| December 31, 2023 | |
| December 31, 2023 | |
| | | Agency Mortgage-Backed Securities | | CRTs | | Non-Agency Mortgage-Backed Securities | | Residential Mortgage Loans | | Commercial
Loans | | Commercial Mortgage-Backed Securities | | | Total Repurchase Agreements | | Weighted Average Rate | | Agency Mortgage-Backed Securities | | CRTs | | Non-Agency Mortgage-Backed Securities | | Residential Mortgage Loans | | | | Commercial Mortgage-Backed Securities | | | | Total Repurchase Agreements |
| | | (dollars in thousands) | | (dollars in thousands) |
| 1 day | 1 day | $ | 0 | | | $ | 0 | | | $ | 0 | | | $ | 0 | | | $ | 0 | | | $ | 0 | | | | $ | 0 | | | 0 | % |
| 2 to 29 days | 2 to 29 days | 30,151,875 | | | 129,993 | | | 354,904 | | | 76,799 | | | 0 | | | 128,267 | | | | 30,841,838 | | | 0.29 | % |
| 30 to 59 days | 30 to 59 days | 10,247,972 | | | 16,073 | | | 161,274 | | | 0 | | | 0 | | | 142,336 | | | | 10,567,655 | | | 0.42 | % |
| 60 to 89 days | 60 to 89 days | 8,181,410 | | | 99,620 | | | 259,401 | | | 0 | | | 0 | | | 28,406 | | | | 8,568,837 | | | 0.30 | % |
| 90 to 119 days | 90 to 119 days | 2,154,733 | | | 0 | | | 0 | | | 0 | | | 0 | | | 0 | | | | 2,154,733 | | | 0.23 | % |
Over 119 days (1) | Over 119 days (1) | 12,008,920 | | | 0 | | | 274,860 | | | 107,924 | | | 271,801 | | | 28,671 | | | | 12,692,176 | | | 0.36 | % |
| Total | Total | $ | 62,744,910 | | | $ | 245,686 | | | $ | 1,050,439 | | | $ | 184,723 | | | $ | 271,801 | | | $ | 327,680 | | | | $ | 64,825,239 | | | 0.32 | % |
| | Amounts offset in accordance with netting arrangements | |
| Amounts offset in accordance with netting arrangements | |
| Amounts offset in accordance with netting arrangements | |
| Net amounts of Repurchase agreements as presented in the Consolidated Statements of Financial Condition | |
|
ANNALY CAPITAL MANAGEMENT, INC. AND SUBSIDIARIES
Financial Statements
| | | | | | | | | | | | | | | | | | | | | | | | | | | | | | | | | | | | | | | | | | | | | | | |
| December 31, 2019 |
| | Agency Mortgage-Backed Securities | | CRTs | | Non-Agency Mortgage-Backed Securities | | Commercial
Loans | | Commercial Mortgage-Backed Securities | | U.S. Treasury Securities | | Total Repurchase Agreements | | Weighted Average Rate |
| | (dollars in thousands) |
| 1 day | $ | 0 | | | $ | 0 | | | $ | 0 | | | $ | 0 | | | $ | 0 | | | $ | 0 | | | $ | 0 | | | 0 | % |
| 2 to 29 days | 36,030,104 | | | 237,897 | | | 698,091 | | | 0 | | | 416,439 | | | 0 | | | 37,382,531 | | | 2.15 | % |
| 30 to 59 days | 15,079,989 | | | 0 | | | 115,805 | | | 0 | | | 104,363 | | | 0 | | | 15,300,157 | | | 2.00 | % |
| 60 to 89 days | 21,931,335 | | | 30,841 | | | 151,920 | | | 0 | | | 3,639 | | | 0 | | | 22,117,735 | | | 1.97 | % |
| 90 to 119 days | 9,992,914 | | | 0 | | | 0 | | | 0 | | | 0 | | | 0 | | | 9,992,914 | | | 1.97 | % |
Over 119 days (1) | 16,557,123 | | | 0 | | | 58,712 | | | 303,078 | | | 28,478 | | | 0 | | | 16,947,391 | | | 1.90 | % |
| Total | $ | 99,591,465 | | | $ | 268,738 | | | $ | 1,024,528 | | | $ | 303,078 | | | $ | 552,919 | | | $ | 0 | | | $ | 101,740,728 | | | 2.03 | % |
| | | | | | | | | | | | | | | |
(1) Less than 1% of the total repurchase agreements had a remaining maturity over 1 year at December 31, 2020. NaN repurchase agreements had a remaining maturity over one year at December 31, 2019.
| | | | | | | | | | | | | | | | | | | | | | | | | | | | | | | | | | | | | | | |
| December 31, 2022 |
| | Agency Mortgage-Backed Securities | | CRTs | | Non-Agency Mortgage-Backed Securities | | Residential Mortgage Loans | | | | Commercial Mortgage-Backed Securities | | | | Total Repurchase Agreements |
| | (dollars in thousands) |
| 1 day | $ | — | | | $ | — | | | $ | — | | | $ | — | | | | | $ | — | | | | | $ | — | |
| 2 to 29 days | 30,244,050 | | | 193,069 | | | 524,432 | | | 200,931 | | | | | 263,711 | | | | | 31,426,193 | |
| 30 to 59 days | 21,200,770 | | | 149,733 | | | 632,673 | | | — | | | | | 124,390 | | | | | 22,107,566 | |
| 60 to 89 days | 4,410,473 | | | — | | | 782,905 | | | — | | | | | 68,647 | | | | | 5,262,025 | |
| 90 to 119 days | — | | | 125,893 | | | 73,251 | | | 168,656 | | | | | — | | | | | 367,800 | |
Over 119 days (1) | — | | | — | | | — | | | 349,013 | | | | | — | | | | | 349,013 | |
| Total | $ | 55,855,293 | | | $ | 468,695 | | | $ | 2,013,261 | | | $ | 718,600 | | | | | $ | 456,748 | | | | | $ | 59,512,597 | |
| | | | | | | | | | | | | | | |
| Amounts offset in accordance with netting arrangements | | | | $ | — | |
| Net amounts of Repurchase agreements as presented in the Consolidated Statements of Financial Condition | | | | $ | 59,512,597 | |
|
(1) No repurchase agreements had a remaining maturity over 1 year at December 31, 2023 and 2022. |
The following table summarizes the gross amounts of reverse repurchase agreements and repurchase agreements, amounts offset in accordance with netting arrangements and net amounts of reverse repurchase agreements and reverse repurchase agreements as presented in the Consolidated Statements of Financial Condition at December 31, 20202023 and 2019.2022. Refer to the “Derivative Instruments” Note for information related to the effect of netting arrangements on the Company’s derivative instruments.
| | | | December 31, 2020 | | December 31, 2019 | | December 31, 2023 | | December 31, 2022 |
| | | Reverse Repurchase Agreements | | Repurchase Agreements | | Reverse Repurchase Agreements | | Repurchase Agreements | | Reverse Repurchase Agreements | | Repurchase Agreements | | Reverse Repurchase Agreements | | Repurchase Agreements |
| | | (dollars in thousands) | | (dollars in thousands) |
| Gross amounts | Gross amounts | $ | 250,000 | | | $ | 65,075,239 | | | $ | 100,000 | | | $ | 101,840,728 | |
| Amounts offset | Amounts offset | (250,000) | | | (250,000) | | | (100,000) | | | (100,000) | |
| Netted amounts | Netted amounts | $ | 0 | | | $ | 64,825,239 | | | $ | 0 | | | $ | 101,740,728 | |
|
The fair value of collateral received in connection with reverse repurchase agreements was $2.3 billion, of which the Company sold $2.1 billion as of December 31, 2023. The amount of collateral sold is reported at fair value in the Company’s Consolidated Statements of Financial Condition as U.S. Treasury securities sold, not yet purchased. There were no reverse repurchase agreements or related collateral sold as of December 31, 2022.
Other Secured Financing - TheAs of December 31, 2023, the Company previously financedhad $1.25 billion in committed credit facilities to finance a portion of its financial assetsMSR portfolio. Outstanding borrowings under this facility as of December 31, 2023 totaled $500.0 million with advances frommaturities ranging between six months to one year. The weighted average interest average rate of the Federal Home Loan Bankborrowings was 8.09% as of Des Moines (“FHLB Des Moines”).December 31, 2023. Borrowings from FHLB Des Moines are reported in Other secured financing in the Company’s Consolidated Statements of Financial Condition. At December 31, 2020, the Company did not hold advances from the FHLB Des Moines. At December 31, 2019, $1.4 billion of advances from the FHLB Des Moines matured in less than one year and $2.1 billion matured between one to three years. The weighted average rate of the advances from the FHLB Des Moines was 2.16% at December 31, 2019. The Company held $4.4 million and $147.9 million of stock in the FHLB Des Moines at December 31, 2020 and December 31, 2019, respectively, which is reported at cost and included in Other assets on the Company’s Consolidated Statements of Financial Condition.
Refer to the Note titled “Variable Interest Entities” Note for additional information on the Company’s other secured financing arrangements.
Investments pledged as collateral under secured financing arrangements and interest rate swaps, excluding residential and senior securitized commercial mortgage loans of consolidated VIEs, had an estimated fair value and accrued interest of $70.6$68.2 billion and $0.2 billion, respectively, at December 31, 2020 and $112.8 billion and $357.9$279.5 million, respectively, at December 31, 2019.
ANNALY CAPITAL MANAGEMENT, INC. AND SUBSIDIARIES
Financial Statements
Mortgage loans payable2023 and $62.2 billion and $226.4 million, respectively, at December 31, 2020 and 2019, were as follows:
| | | | | | | | | | | | | | | | | | | | | | | | | | | | | | | | | | | |
| December 31, 2020 |
| Property | Mortgage
Carrying Value | | Mortgage
Principal | | Interest Rate | | Fixed/Floating
Rate | | Maturity Date | | Priority |
| (dollars in thousands) |
| Joint Ventures | $ | 316,686 | | | $ | 318,302 | | | 4.03% - 4.96% | | Fixed | | 2024 - 2029 | | First liens |
| Joint Ventures | 16,607 | | | 16,325 | | | L+2.15% | | Floating | | 2/27/2022 | | First liens |
| | | | | | | | | | | |
| Virginia | 24,464 | | | 25,000 | | | L+2.85% | | Floating | | 5/1/2023 | | First liens |
| Texas | 31,127 | | | 32,582 | | | 3.28% | | Fixed | | 2048 - 2053 | | First liens |
| Utah | 9,706 | | | 9,706 | | | L+2.75% | | Floating | | 1/31/2021 | | First liens |
| Utah | 6,969 | | | 6,986 | | | 3.69% | | Fixed | | 6/1/2053 | | First liens |
| Minnesota | 13,039 | | | 13,072 | | | 3.69% | | Fixed | | 6/1/2053 | | First liens |
| | | | | | | | | | | |
| Wisconsin | 7,658 | | | 7,677 | | | 3.69% | | Fixed | | 6/1/2053 | | First liens |
| | | | | | | | | | | |
| | | | | | | | | | | |
| Total | $ | 426,256 | | | $ | 429,650 | | | | | | | | | |
| | | | | | | | | | | |
| | | | | | | | | | | | | | | | | | | | | | | | | | | | | | | | | | | |
| December 31, 2019 |
| Property | Mortgage
Carrying Value | | Mortgage
Principal | | Interest Rate | | Fixed/Floating
Rate | | Maturity Date | | Priority |
| (dollars in thousands) |
| Joint Ventures | $ | 316,566 | | | $ | 318,562 | | | 4.03% - 4.96% | | Fixed | | 2024 - 2029 | | First liens |
| Joint Ventures | 16,029 | | | 16,325 | | | L+2.15% | | Floating | | 2/27/2022 | | First liens |
| Virginia | 82,940 | | | 84,702 | | | 2.34% - 4.55% | | Fixed | | 2036 - 2053 | | First liens |
| Texas | 31,667 | | | 33,167 | | | 3.28% | | Fixed | | 2048 - 2053 | | First liens |
| Utah | 9,706 | | | 9,706 | | | L+3.50% | | Floating | | 1/31/2020 | | First liens |
| Utah | 7,077 | | | 7,096 | | | 3.69% | | Fixed | | 6/1/2053 | | First liens |
| Minnesota | 13,243 | | | 13,276 | | | 3.69% | | Fixed | | 6/1/2053 | | First liens |
| | | | | | | | | | | |
| Wisconsin | 7,777 | | | 7,797 | | | 3.69% | | Fixed | | 6/1/2053 | | First liens |
| | | | | | | | | | | |
| | | | | | | | | | | |
| Total | $ | 485,005 | | | $ | 490,631 | | | | | | | | | |
| | | | | | | | | | | |
The following table details future mortgage loan principal payments at December 31, 2020:
| | | | | |
| Mortgage Loan Principal Payments |
| (dollars in thousands) |
| 2021 | $ | 11,123 | |
| 2022 | 17,890 | |
| 2023 | 26,626 | |
| 2024 | 105,635 | |
| 2025 | 186,929 | |
| Later years | 81,447 | |
| Total | $ | 429,650 | |
| |
ANNALY CAPITAL MANAGEMENT, INC. AND SUBSIDIARIES
Financial Statements
(A) Common Stock
The following table provides a summary of the Company’s common shares authorized, and issued and outstanding at December 31, 20202023 and 2019.2022.
| | | | | | | | | | | | | | | | | | | | | | | | | | |
| Shares authorized | | Shares issued and outstanding | |
| December 31, 2020 | | December 31, 2019 | | December 31, 2020 | | December 31, 2019 | Par Value |
| Common stock | 2,914,850,000 | | | 2,914,850,000 | | | 1,398,240,618 | | | 1,430,106,199 | | $0.01 |
| | | | | | | | | | | | | | | | | | | | | | | | | | |
| Shares authorized | | Shares issued and outstanding | |
| December 31, 2023 | | December 31, 2022 | | December 31, 2023 | | December 31, 2022 | Par Value |
| Common stock | 1,468,250,000 | | | 2,936,500,000 | | | 500,080,287 | | | 468,309,810 | | $0.01 |
During the year ended December 31, 2019, the Company closed the public offering of an original issuance of 75.0 million shares of common stock for proceeds of $730.5 million before deducting offering expenses. In connection with the offering, the Company granted the underwriters a thirty-day option to purchase up to an additional 11.3 million shares of common stock, which the underwriters exercised in full resulting in an additional $109.6 million in proceeds before deducting offering expenses.
In June 2019, the Company announced that its board of directors (“Board”) had authorized the repurchase of up to $1.5 billion of its outstanding shares of common stock, which expired on December 31, 2020 (the “Prior Share Repurchase Program”). In December 2020, the Company announced that its Board authorized the repurchase of up to $1.5 billion of its outstanding common shares through December 31, 2021 (the “New“Prior Share Repurchase Program”). In January 2022, the Company announced that its Board authorized the repurchase of up to $1.5 billion of its outstanding shares of common stock through December 31, 2024 (the “Current Share Repurchase Program”). The NewCurrent Share Repurchase Program replaced the Prior Share Repurchase Program. During the yearyears ended December 31, 2020,2023 and 2022, no shares were repurchased under the Company repurchased 32.4 million shares of its common stock for an aggregate amount of $208.9 million, excluding commission costs. During the year ended December 31, 2019, the Company repurchased 26.2 million shares of its common stock for an aggregate amount of $223.2 million, excluding commission costs. All common shares purchased were part of a publicly announced plan in open-market transactions.
The following table provides a summary of activity related to the Company’s Direct Purchase and Dividend ReinvestmentCurrent Share Repurchase Program or Prior Share Repurchase Program.
| | | | | | | | | | | | | | |
| | December 31, 2020 | | December 31, 2019 |
| | (dollars in thousands) |
| Shares issued through direct purchase and dividend reinvestment program | | 166,000 | | | 180,000 | |
| Amount raised from direct purchase and dividend reinvestment program | | $ | 1,175 | | | $ | 1,795 | |
In January 2018,On August 6, 2020, the Company entered into separate Amended and Restated Distribution Agency Agreements (collectively,(as amended by Amendment No. 1 to the Amended and Restated Distribution Agency Agreements on August 6, 2021, and Amendment No. 2 to the Amended and Restated Distribution Agency Agreements on November 3, 2022, collectively, the “Sales Agreements”) with each of Wells Fargo Securities, LLC, Merrill Lynch, Pierce, Fenner & Smith, Incorporated, Barclays Capital Inc., BofA Securities, Inc., Citigroup Global Markets Inc., Credit Suisse Securities (USA) LLC, Goldman Sachs & Co. LLC, J.P. Morgan Securities LLC, Keefe, Bruyette & Woods, Inc., J.P. Morgan Securities LLC, RBC Capital Markets, LLC, and UBS Securities LLC (theand Wells Fargo Securities, LLC (collectively, the “Sales Agents”). ThePursuant to the Sales Agreements, the Company may offer and sell shares of its common stock, having an aggregate offering price of up to $1.5 billion, from time to time through any of the Sales Agents. NaN shares were issued under the at-the-marketAgents (the “at-the-market sales program during the year ended December 31, 2020. program”).
During the year ended December 31, 2019,2023, under the at-the-market sales program, the Company issued 56.031.4 million shares for proceeds of $0.7 billion, net of commissions and fees. During the year ended December 31, 2022, under the at-the-market sales program, the Company issued 45.7 million shares for proceeds of $1.1 billion, net of commissions and fees. The foregoing share amounts have been retroactively adjusted to reflect the effects of the Reverse Stock Split.
During the year ended December 31, 2022, the Company closed two public offerings for an aggregate original issuance of 50 million shares of common stock for aggregate proceeds of $569.1$1.31 billion before deducting offering expenses. In connection with each offering, the Company granted the underwriters a thirty-day option to purchase up to an additional 3.75 million netshares of commissions and fees, undercommon stock, which the at-the-market sales program.
(B) Preferred Stock
The following is a summary of the Company’s cumulative redeemable preferred stock outstanding at December 31, 20202023 and 2019.2022. In the event of a liquidation or dissolution of the Company, the Company’s then outstanding preferred stock takes precedence over the Company’s common stock with respect to payment of dividends and the distribution of assets.
| | | | | | | | | | | | | | | | | | | | | | | | | | | | | | | | | | | | | | | | | | | | | | | |
| Shares Authorized | | Shares Issued And Outstanding | | Carrying Value | Contractual Rate | Earliest Redemption Date (1) | Effective Date of Floating Rate Dividend Period | Floating Annual Rate (2) |
| December 31, 2023 | | December 31, 2022 | | December 31, 2023 | | December 31, 2022 | | December 31, 2023 | | December 31, 2022 |
| | |
| | | | | | | | | | | | | | | |
| | | | | | | | | | | | | | | |
| | | | | | | | | | | | | | | |
| | | | | | | | | | | | | | | |
| Fixed-to-floating rate |
| Series F | 28,800,000 | | | 28,800,000 | | | 28,800,000 | | | 28,800,000 | | | 696,910 | | | 696,910 | | 6.95% | 9/30/2022 | 9/30/2022 | 3M Term SOFR + 4.993% |
| Series G | 17,000,000 | | | 17,000,000 | | | 17,000,000 | | | 17,000,000 | | | 411,335 | | | 411,335 | | 6.50% | 3/31/2023 | 3/31/2023 | 3M Term SOFR + 4.172% |
| Series I | 17,700,000 | | | 17,700,000 | | | 17,700,000 | | | 17,700,000 | | | 428,324 | | | 428,324 | | 6.75% | 6/30/2024 | 6/30/2024 | 3M Term SOFR + 4.989% |
| Total | 63,500,000 | | | 63,500,000 | | | 63,500,000 | | | 63,500,000 | | | $ | 1,536,569 | | | $ | 1,536,569 | | | | | |
| | | | | | | | | | | | | | | |
(1) Subject to the Company’s right under limited circumstances to redeem preferred stock earlier in order to preserve its qualification as a REIT or under limited circumstances related to a change in control of the Company. (2) For each series of fixed-to-floating rate cumulative redeemable preferred stock, the floating rate is calculated as 3-month CME Term SOFR (plus a spread adjustment of 0.26161%) plus the spread specified in the prospectus. |
ANNALY CAPITAL MANAGEMENT, INC. AND SUBSIDIARIES
Financial Statements
| | | | | | | | | | | | | | | | | | | | | | | | | | | | | | | | | | | | | | | | | | | | | | | |
| Shares Authorized | | Shares Issued And Outstanding | | Carrying Value | Contractual Rate | Earliest Redemption Date (1) | Date At Which Dividend Rate Becomes Floating | Floating Annual Rate |
| December 31, 2020 | | December 31, 2019 | | December 31, 2020 | | December 31, 2019 | | December 31, 2020 | | December 31, 2019 |
| Fixed-rate | | (dollars in thousands) |
| | | | | | | | | | | | | | | |
| Series D | 18,400,000 | | | 18,400,000 | | | 0 | | | 18,400,000 | | | 0 | | | 445,457 | | 7.50% | 9/13/2017 | NA | NA |
| | | | | | | | | | | | | | | |
| | | | | | | | | | | | | | | |
| Fixed-to-floating rate |
| Series F | 28,800,000 | | | 28,800,000 | | | 28,800,000 | | | 28,800,000 | | | 696,910 | | | 696,910 | | 6.95% | 9/30/2022 | 9/30/2022 | 3M LIBOR + 4.993% |
| Series G | 19,550,000 | | | 19,550,000 | | | 17,000,000 | | | 17,000,000 | | | 411,335 | | | 411,335 | | 6.50% | 3/31/2023 | 3/31/2023 | 3M LIBOR + 4.172% |
| Series I | 18,400,000 | | | 18,400,000 | | | 17,700,000 | | | 17,700,000 | | | 428,324 | | | 428,324 | | 6.75% | 6/30/2024 | 6/30/2024 | 3M LIBOR + 4.989% |
| Total | 85,150,000 | | | 85,150,000 | | | 63,500,000 | | | 81,900,000 | | | $ | 1,536,569 | | | $ | 1,982,026 | | | | | |
| | | | | | | | | | | | | | | |
(1) Subject to the Company’s right under limited circumstances to redeem preferred stock earlier in order to preserve its qualification as a REIT or under limited circumstances related to a change in control of the Company. |
Each series of preferred stock has a par value of $0.01 per share and a liquidation and redemption price of $25.00, plus accrued and unpaid dividends through their redemption date. Through December 31, 2020,2023, the Company had declared and paid all required quarterly dividends on the Company’s preferred stock.
During the year ended December 31, 2020, the Company redeemed all 18.4 million of its issued and outstanding shares of 7.50% Series D Cumulative Redeemable Preferred Stock (“Series D Preferred Stock”) for $460.0 million. The cash redemption amount for each share of Series D Preferred Stock was $25.00.
During the year ended December 31, 2019, the Company redeemed all 7.0 million of its issued and outstanding shares of 7.625% Series C Cumulative Redeemable Preferred Stock (“Series C Preferred Stock”) for $175.0 million. The cash redemption amount for each share of Series C Preferred Stock was $25.00 plus accrued and unpaid dividends to, but not including, the redemption date of July 21, 2019.
During the year ended December 31, 2019, the Company redeemed all 2.2 million of its issued and outstanding shares of 8.125% Series H Cumulative Redeemable Preferred Stock (“Series H Preferred Stock”) for $55.0 million. The cash redemption amount for each share of Series H Preferred Stock was $25.00 plus accrued and unpaid dividends to, but not including, the redemption date of May 31, 2019.
During the year ended December 31, 2019, the Company issued 17.7 million shares of its 6.750% Series I Fixed-to-Floating Rate Cumulative Redeemable Preferred Stock (“Series I Preferred Stock”) for gross proceeds of $442.5 million before deducting the underwriting discount and other estimated offering expenses.
The Series D Cumulative Redeemable Preferred Stock, Series F Fixed-to-Floating Rate Cumulative Redeemable Preferred Stock, Series G Fixed-to-Floating Rate Cumulative Preferred Stock and Series I Fixed-to-Floating Rate Cumulative Preferred Stock rank senior to the common stock of the Company.
ANNALY CAPITAL MANAGEMENT, INC. AND SUBSIDIARIES
Financial Statements
(C) Distributions to Stockholders
The following table provides a summary of the Company’s dividend distribution activity for the periods presented:
| | | | | | | | | | | |
| | For the Years Ended |
| | December 31, 2020 | | December 31, 2019 |
| | (dollars in thousands, except per share data) |
| Dividends and dividend equivalents declared on common stock and share-based awards | $ | 1,285,124 | | | $ | 1,516,323 | |
| Distributions declared per common share | $ | 0.91 | | | $ | 1.05 | |
| Distributions paid to common stockholders after period end | $ | 307,613 | | | $ | 357,527 | |
| Distributions paid per common share after period end | $ | 0.22 | | | $ | 0.25 | |
| Date of distributions paid to common stockholders after period end | January 29, 2021 | | January 31, 2020 |
| | | |
| | | |
| Dividends declared to series C preferred stockholders | $ | 0 | | | $ | 7,414 | |
| Dividends declared per share of series C preferred stock | $ | 0 | | | $ | 1.060 | |
| Dividends declared to series D preferred stockholders | $ | 34,500 | | | $ | 34,500 | |
| Dividends declared per share of series D preferred stock | $ | 1.875 | | | $ | 1.875 | |
| | | |
| | | |
| Dividends declared to series F preferred stockholders | $ | 50,040 | | | $ | 50,040 | |
| Dividends declared per share of series F preferred stock | $ | 1.738 | | | $ | 1.738 | |
| Dividends declared to series G preferred stockholders | $ | 27,625 | | | $ | 27,624 | |
| Dividends declared per share of series G preferred stock | $ | 1.625 | | | $ | 1.625 | |
| Dividends declared to series H preferred stockholders | $ | 0 | | | $ | 1,862 | |
| Dividends declared per share of series H preferred stock | $ | 0 | | | $ | 0.846 | |
| Dividends declared to series I preferred stockholders | $ | 29,871 | | | $ | 15,135 | |
| Dividends declared per share of series I preferred stock | $ | 1.688 | | | $ | 0.86 | |
|
| | | | | | | | | | | |
| | For the Years Ended |
| | December 31, 2023 | | December 31, 2022 |
| | (dollars in thousands, except per share data) |
| Dividends and dividend equivalents declared on common stock and share-based awards | $ | 1,294,688 | | | $ | 1,504,353 | |
Distributions declared per common share (1) | $ | 2.60 | | | $ | 3.52 | |
| Distributions paid to common stockholders after period end | $ | 325,052 | | | $ | 412,113 | |
| Distributions paid per common share after period end | $ | 0.65 | | | $ | 0.88 | |
| Date of distributions paid to common stockholders after period end | January 31, 2024 | | January 31, 2023 |
| | | |
| | | |
| | | |
| | | |
| | | |
| | | |
| | | |
| | | |
| Dividends declared to series F preferred stockholders | $ | 73,892 | | | $ | 53,131 | |
Dividends declared per share of series F preferred stock (2) | $ | 2.566 | | | $ | 1.845 | |
| Dividends declared to series G preferred stockholders | $ | 37,916 | | | $ | 27,624 | |
Dividends declared per share of series G preferred stock (2) | $ | 2.230 | | | $ | 1.625 | |
| | | |
| | | |
| Dividends declared to series I preferred stockholders | $ | 29,868 | | | $ | 29,868 | |
Dividends declared per share of series I preferred stock (2) | $ | 1.688 | | | $ | 1.688 | |
(1) For the year ended December 31, 2023, 100.0% of common stock dividend distributions of $2.83 per share paid in calendar year 2023 and 0.65 per share paid on January 31, 2024 were taxable as ordinary income. For the year ended December 31, 2022, 86.5% and 13.5% of common stock dividend distributions of $3.52 per share paid in calendar year 2022 were taxable as ordinary income and a return of capital, respectively. (2) For the years ended December 31, 2023 and 2022, 100% of the preferred stock dividend distributions per share were taxable as ordinary income. |
|
| | |
15.16. LONG-TERM STOCK INCENTIVE PLAN |
|
Employees, Directors and other service providers of the Company are eligible to participate in the Company’s 2020 Equity Incentive Plan (the “Plan”), which provides for equity-based compensation in the form of stock options, share appreciation rights, dividend equivalent rights, restricted shares, restricted stock units (“RSUs”), and other share-based awards. The Company has the ability to award up to an aggregate of 125,000,00031,250,000 shares under the terms of the Plan, subject to adjustment for any awards that were outstanding under the Company’s 2010 Equity Incentive Plan (the “Prior Plan”, collectively the “Plans") on the effective date of the Plan and subsequently expire, terminate, or are surrendered or forfeited. No new awards are permitted to be made under the Prior Plan, although existing awards remain effective.
Restricted Stock Units
The Company grants RSUs (including RSUs subject to performance conditions (“PSUs”)) to employees, which are generally valued based on the closing price of the underlying shares on the date of grant. For RSUs that vest, the underlying shares of common stock are delivered (net of required withholding tax) as outlined in the applicable award agreements. PSUs are subject to the Company’s achievement of specified performance criteria and the number of awards that vest can range from 0zero to
ANNALY CAPITAL MANAGEMENT, INC. AND SUBSIDIARIES
Financial Statements
150% of the grant amount. Award agreements generally provide that vesting is accelerated in certain circumstances, such as death and disability. Delivery of the underlying shares of common stock, which generally occurs over a three-yearthree-year period, is conditioned on the grantees satisfying certain vesting and other requirements outlined in the award agreements.
ANNALY CAPITAL MANAGEMENT, INC. AND SUBSIDIARIES
Financial Statements
The following table sets forth activity related to the Company’s RSUs and PSUs awarded under the Plans:
| | | | | | | | | | | | | | |
| | For the year ended | | | |
| | December 31, 2020 | | |
| | Number of Shares | Weighted Average Grant Date Fair Value | | | |
| | (dollars in thousands) |
| Beginning balance | 0 | | $ | 0 | | | | |
| Granted (1) | 1,790,759 | | $7.24 | | | |
| | | | | | |
| Vested | (100,100) | | $9.99 | | | |
| Forfeited (1) | (19,921) | | $9.59 | | | |
| Ending balance (2) | 1,670,738 | | $7.05 | | | |
| | | | | | |
| | | | | | |
| (1) Includes dividend equivalent rights. | | | |
| (2) The ending balance includes 404,589 PSUs and related dividend equivalent rights subject to performance conditions and future service requirements, and represents the target amount of such PSUs that may be earned. | | | |
The Company recognized stock basedequity-based compensation expense of $3.7$17.3 million for the year ended December 31, 2020.2023. As of December 31, 2020,2023, there was $9.0$22.9 million of total unrecognized compensation cost related to non-vested share-based compensation arrangements. This cost is expected to be recognized over a weighted average period of 2.241.70 years.
| | |
16.17. INTEREST INCOME AND INTEREST EXPENSE |
|
Refer to the note titled “Significant Accounting Policies” Note for details surrounding the Company’s accounting policy related to net interest income on securities and loans.
The following table summarizes the interest income recognition methodology for Residential Securities:
| | | | | |
| | Interest Income Methodology |
| Agency | |
Fixed-rate pass-through (1) | Effective yield (3) |
Adjustable-rate pass-through (1) | Effective yield (3) |
Multifamily (1) | Contractual Cash Flows |
CMO (1) | Effective yield (3) |
| |
Reverse mortgages (2) | Prospective |
Interest-only (2) | Prospective |
| Residential credit | |
CRT (2) | Prospective |
Alt-A (2) | Prospective |
Prime (2) | Prospective |
Subprime (2) | Prospective |
| |
NPL/RPL (2) | Prospective |
Prime jumbo (2) | Prospective |
| Prime jumbo interest-only (2)
| Prospective
(1) Changes in fair value are recognized in Other comprehensive income (loss) on the accompanying Consolidated Statements of Comprehensive Income (Loss). for securities purchased prior to July 1, 2022. Effective July 1, 2022, changes in fair value are recognized in Net gains (losses) on investments and other on the accompanying Consolidated Statements of Comprehensive Income (Loss) for newly purchased securities. (2) Changes in fair value are recognized in Net unrealized gains (losses) on instruments measured at fair value through earningsinvestments and other on the accompanying Consolidated Statements of Comprehensive Income (Loss). (3) Effective yield is recalculated for differences between estimated and actual prepayments and the amortized cost is adjusted as if the new effective yield had been applied since inception. |
ANNALY CAPITAL MANAGEMENT, INC. AND SUBSIDIARIES
Financial Statements
The following table presents the components of the Company’s interest income and interest expense for the years ended December 31, 2020, 20192023, 2022 and 2018.2021.
| | | | For the Years Ended December 31, | | For the Years Ended December 31, |
| | | 2020 | | 2019 | | 2018 | | 2023 | | 2022 | | 2021 |
| Interest income | Interest income | (dollars in thousands) | Interest income | (dollars in thousands) |
Residential Securities (1) | $ | 1,718,960 | | | $ | 3,195,546 | | | $ | 2,830,521 | |
| Agency securities (1) | |
Agency securities (1) | |
Agency securities (1) | |
| Residential credit securities | |
Residential mortgage loans (1) | Residential mortgage loans (1) | 170,259 | | | 150,066 | | | 83,260 | |
Commercial investment portfolio (1) (2) | Commercial investment portfolio (1) (2) | 338,763 | | | 378,395 | | | 356,981 | |
| U.S. Treasury securities | 0 | | | 0 | | | 160 | |
| | Reverse repurchase agreements | |
| Reverse repurchase agreements | |
| Reverse repurchase agreements | Reverse repurchase agreements | 1,643 | | | 63,290 | | | 61,641 | |
| Total interest income | Total interest income | $ | 2,229,625 | | | $ | 3,787,297 | | | $ | 3,332,563 | |
| Interest expense | Interest expense | | | | | | Interest expense | | | | | |
| Repurchase agreements | Repurchase agreements | 705,218 | | | 2,513,282 | | | 1,698,930 | |
| | Debt issued by securitization vehicles | Debt issued by securitization vehicles | 142,602 | | | 141,981 | | | 98,013 | |
| | Debt issued by securitization vehicles | |
| Debt issued by securitization vehicles | |
| Participations issued | Participations issued | 78 | | | 0 | | | 0 | |
| U.S. Treasury securities sold, not yet purchased | |
| Other | Other | 51,214 | | | 129,612 | | | 100,917 | |
| Total interest expense | Total interest expense | 899,112 | | | 2,784,875 | | | 1,897,860 | |
| Net interest income | Net interest income | $ | 1,330,513 | | | $ | 1,002,422 | | | $ | 1,434,703 | |
| (1) Includes assets transferred or pledged to securitization vehicles. (2) Includes commercial real estate debt and preferred equity and corporate debt. | (1) Includes assets transferred or pledged to securitization vehicles. (2) Includes commercial real estate debt and preferred equity and corporate debt. | |
(1) Includes assets transferred or pledged to securitization vehicles. (2) Includes commercial real estate debt and preferred equity and corporate debt. | |
ANNALY CAPITAL MANAGEMENT, INC. AND SUBSIDIARIES
Financial Statements
| | |
17.18. NET INCOME (LOSS) PER COMMON SHARE |
|
The following table presents a reconciliation of net income (loss) and shares used in calculating basic and diluted net income (loss) per share for the years ended December 31, 2020, 20192023, 2022 and 2018.2021.
| | | | For the Years Ended | | For the Years Ended |
| | | December 31, 2020 | | December 31, 2019 | | December 31, 2018 | | December 31, 2023 | | December 31, 2022 | | December 31, 2021 |
| | | (dollars in thousands, except per share data) | | (dollars in thousands, except per share data) |
| Net income (loss) | Net income (loss) | $ | (889,772) | | | $ | (2,163,091) | | | $ | 54,148 | |
| Net income (loss) attributable to noncontrolling interests | Net income (loss) attributable to noncontrolling interests | 1,391 | | | (226) | | | (260) | |
| Net income (loss) attributable to Annaly | Net income (loss) attributable to Annaly | (891,163) | | | (2,162,865) | | | 54,408 | |
| Dividends on preferred stock | Dividends on preferred stock | 142,036 | | | 136,576 | | | 129,312 | |
| Net income (loss) available (related) to common stockholders | Net income (loss) available (related) to common stockholders | $ | (1,033,199) | | | $ | (2,299,441) | | | $ | (74,904) | |
| | Weighted average shares of common stock outstanding-basic | Weighted average shares of common stock outstanding-basic | 1,414,659,439 | | | 1,434,912,682 | | | 1,209,601,809 | |
| | Weighted average shares of common stock outstanding-basic | |
| | Weighted average shares of common stock outstanding-basic | |
| Add: Effect of stock awards, if dilutive | Add: Effect of stock awards, if dilutive | 0 | | | 0 | | | 0 | |
| Weighted average shares of common stock outstanding-diluted | Weighted average shares of common stock outstanding-diluted | 1,414,659,439 | | | 1,434,912,682 | | | 1,209,601,809 | |
| Net income (loss) per share available (related) to common share | Net income (loss) per share available (related) to common share | | | | | |
| Basic | Basic | $ | (0.73) | | | $ | (1.60) | | | $ | (0.06) | |
| Basic | |
| Basic | |
| Diluted | Diluted | $ | (0.73) | | | $ | (1.60) | | | $ | (0.06) | |
The computations of diluted net income (loss) per share available (related) to common share for the yearyears ended December 31, 2020 excludes 1.02023 and 2022 exclude 1.9 million and 0.7 million, respectively, of potentially dilutive restricted stock units and performance stock units because their effect would have been anti-dilutive.
For the year ended December 31, 20202023 the Company was qualified to be taxed as a REIT under Code Sections 856 through 860. As a REIT, the Company will not incur federal income tax to the extent that it distributes its taxable income to its stockholders. To maintain qualification as a REIT, the Company must distribute at least 90% of its annual REIT taxable income to its stockholders and meet certain other requirements that relate to, among other things, assets it may hold, income it may generate and its stockholder composition. It is generally the Company’s policy to distribute 100% of its REIT taxable income.
To the extent there is any undistributed REIT taxable income at the end of a year, the Company distributes such shortfall within the next year as permitted by the Code.
ANNALY CAPITAL MANAGEMENT, INC. AND SUBSIDIARIES
Financial Statements
The Company and certain of its direct and indirect subsidiaries, including Annaly TRS, Inc. and certain subsidiaries of Mountain Merger Sub Corp.,joint ventures, have made separate joint elections to treat these subsidiaries as TRSs. As such, each of these TRSs is taxable as a domestic C corporation and subject to federal, state and local income taxes based upon their taxable income.
The provisions of ASC 740, Income Taxes (“ASC 740”), clarify the accounting for uncertainty in income taxes recognized in financial statements and prescribe a recognition threshold and measurement attribute for uncertain tax positions taken or expected to be taken on a tax return. ASC 740 also requires that interest and penalties related to unrecognized tax benefits be recognized in the financial statements. The Company does not have any unrecognized tax benefits that would affect its financial position. Thus, no accruals for penalties and interest were deemed necessary at December 31, 20202023 and 2019.2022.
The state and local tax jurisdictions for which the Company is subject to tax-filing obligations recognize the Company’s status as a REIT and, therefore, the Company generally does not pay income tax in such jurisdictions. The Company may, however, be subject to certain minimum state and local tax filing fees as well as certain excise, franchise or business taxes. The Company’s TRSs are subject to federal, state and local taxes.
During the years ended December 31, 2020, 20192023, 2022 and 20182021 the Company recorded ($28.4)$39.4 million, ($10.8)$45.6 million and ($2.4)$4.7 million, respectively, of income tax benefitexpense (benefit) attributable to its TRSs. The Company’s federal, state and local tax returns from 20172020 and forward remain open for examination.
ANNALY CAPITAL MANAGEMENT, INC. AND SUBSIDIARIES
Financial Statements
The Company operates in three reportable segments further described in the “Description of Business” Note. The accounting policies applied to the segments are the same as those described in the summary of significant accounting policies, with the exception of allocations between segments related to net interest income and other comprehensive income (loss), which are reflected in Other income (loss), and allocations between segments related to investment balances, which are presented net of associated financings in Total Assets. These allocations are made to reflect the economic hedging relationship between investments within different operating segments. Activities that are not directly attributable or not allocated to any of the three current operating segments (such as investments in commercial mortgage-backed securities, preferred stock dividends and corporate existence costs) are reported under Corporate and Other as reconciling items to the Company’s consolidated financial statements. The tables below summarize the result of operations and total assets by segment that are provided to the Chief Operating Decision Maker (CODM), which is the Company’s Operating Committee. Comprehensive income is the measure of segment profit or loss that is determined in accordance with the measurement principles used in measuring the corresponding amounts in the consolidated financial statements and is a key determinant of the Company’s economic return (computed as the change in stockholders’ equity attributable to common shareholders plus common stock dividends declared divided by the prior period’s stockholders’ equity attributable to common shareholders), a measure which is used by the CODM to evaluate segment results and is one of the factors considered in determining capital allocation among the segments. The following table presents the results of operations of the Company’s reportable operating segments for the years ended December 31, 2023 and 2022:
| | | | | | | | | | | | | | | | | |
| December 31, 2023 |
| | Agency | Residential Credit | MSR | Corporate & Other | Consolidated |
| (dollars in thousands) |
| Interest income | $ | 2,772,963 | | $ | 930,232 | | $ | — | | $ | 28,386 | | $ | 3,731,581 | |
| Interest expense | 3,096,245 | | 728,273 | | — | | 18,447 | | 3,842,965 | |
| Net interest income | (323,282) | | 201,959 | | — | | 9,939 | | (111,384) | |
| Servicing and related income | — | | — | | 364,157 | | — | | 364,157 | |
| Servicing and related expense | — | | — | | 37,652 | | — | | 37,652 | |
| Net servicing income | — | | — | | 326,505 | | — | | 326,505 | |
| Other income (loss) | (1,824,323) | | 171,678 | | 13,975 | | (12,921) | | (1,651,591) | |
| Less: Total general and administrative expenses | 58,852 | | 49,021 | | 29,872 | | 24,808 | | 162,553 | |
| Income (loss) before income taxes | (2,206,457) | | 324,616 | | 310,608 | | (27,790) | | (1,599,023) | |
| Income taxes | 1,629 | | 17,121 | | 21,070 | | (386) | | 39,434 | |
| Net income (loss) | (2,208,086) | | 307,495 | | 289,538 | | (27,404) | | (1,638,457) | |
| Less: Net income (loss) attributable to noncontrolling interest | — | | 4,714 | | — | | — | | 4,714 | |
| Net income (loss) attributable to Annaly | (2,208,086) | | 302,781 | | 289,538 | | (27,404) | | (1,643,171) | |
| Dividends on preferred stock | — | | — | | — | | 141,676 | | 141,676 | |
| Net income (loss) available (related) to common stockholders | (2,208,086) | | 302,781 | | 289,538 | | (169,080) | | (1,784,847) | |
| Unrealized gains (losses) on available-for-sale securities | 580,680 | | — | | — | | — | | 580,680 | |
| Reclassification adjustment for net (gains) losses included in net income (loss) | 1,792,816 | | — | | — | | — | | 1,792,816 | |
| Other comprehensive income (loss) | 2,373,496 | | — | | — | | — | | 2,373,496 | |
| Comprehensive income (loss) | 165,410 | | 307,495 | | 289,538 | | (27,404) | | 735,039 | |
| Comprehensive income (loss) attributable to noncontrolling interests | — | | 4,714 | | — | | — | | 4,714 | |
| Comprehensive income (loss) attributable to Annaly | $ | 165,410 | | $ | 302,781 | | $ | 289,538 | | $ | (27,404) | | $ | 730,325 | |
| Noncash investing and financing activities: | |
| Receivable for unsettled trades | 2,709,398 | | — | | 826 | | — | | 2,710,224 | |
| Payable for unsettled trades | 3,232,941 | | 10 | | 16,438 | | — | | 3,249,389 | |
| Net change in unrealized gains (losses) on available-for-sale securities, net of reclassification adjustment | 2,373,496 | | — | | — | | — | | 2,373,496 | |
| Dividends declared, not yet paid | — | | — | | — | | 325,052 | | 325,052 | |
| Total assets | |
| Total assets | $ | 71,167,416 | | $ | 19,149,003 | | $ | 2,578,644 | | $ | 332,173 | | $ | 93,227,236 | |
| | | | | |
ANNALY CAPITAL MANAGEMENT, INC. AND SUBSIDIARIES
Financial Statements
| | | | | | | | | | | | | | | | | |
| December 31, 2022 |
| | Agency | Residential Credit | MSR | Corporate & Other | Consolidated |
| (dollars in thousands) |
| Interest income | $ | 2,146,583 | | $ | 550,449 | | $ | — | | $ | 81,855 | | $ | 2,778,887 | |
| Interest expense | 936,063 | | 344,669 | | 6,202 | | 22,801 | | 1,309,735 | |
| Net interest income | 1,210,520 | | 205,780 | | (6,202) | | 59,054 | | 1,469,152 | |
| Servicing and related income | — | | — | | 246,926 | | — | | 246,926 | |
| Servicing and related expense | — | | — | | 25,145 | | — | | 25,145 | |
| Net servicing income | — | | — | | 221,781 | | — | | 221,781 | |
| Other income (loss) | 480,383 | | (147,908) | | (47,510) | | (41,178) | | 243,787 | |
| Less: Total general and administrative expenses | 50,817 | | 47,005 | | 29,784 | | 35,123 | | 162,729 | |
| Income (loss) before income taxes | 1,640,086 | | 10,867 | | 138,285 | | (17,247) | | 1,771,991 | |
| Income taxes | (792) | | (10,485) | | 57,055 | | (207) | | 45,571 | |
| Net income (loss) | 1,640,878 | | 21,352 | | 81,230 | | (17,040) | | 1,726,420 | |
| Less: Net income (loss) attributable to noncontrolling interest | — | | 1,088 | | — | | 7 | | 1,095 | |
| Net income (loss) attributable to Annaly | 1,640,878 | | 20,264 | | 81,230 | | (17,047) | | 1,725,325 | |
| Dividends on preferred stock | — | | — | | — | | 110,623 | | 110,623 | |
| Net income (loss) available (related) to common stockholders | 1,640,878 | | 20,264 | | 81,230 | | (127,670) | | 1,614,702 | |
| Unrealized gains (losses) on available-for-sale securities | (8,204,542) | | — | | — | | — | | (8,204,542) | |
| Reclassification adjustment for net (gains) losses included in net income (loss) | 3,537,236 | | — | | — | | — | | 3,537,236 | |
| Other comprehensive income (loss) | (4,667,306) | | — | | — | | — | | (4,667,306) | |
| Comprehensive income (loss) | (3,026,428) | | 21,352 | | 81,230 | | (17,040) | | (2,940,886) | |
| Comprehensive income (loss) attributable to noncontrolling interests | — | | 1,088 | | — | | 7 | | 1,095 | |
| Comprehensive income (loss) attributable to Annaly | $ | (3,026,428) | | $ | 20,264 | | $ | 81,230 | | $ | (17,047) | | $ | (2,941,981) | |
| Noncash investing and financing activities: | |
| Receivable for unsettled trades | 572,089 | | — | | 3,002 | | — | | 575,091 | |
| Payable for unsettled trades | 1,108,386 | | 38 | | 49,422 | | — | | 1,157,846 | |
| Net change in unrealized gains (losses) on available-for-sale securities, net of reclassification adjustment | (4,667,306) | | — | | — | | — | | (4,667,306) | |
| Dividends declared, not yet paid | — | | — | | — | | 412,113 | | 412,113 | |
| Total assets | |
| Total assets | $ | 65,080,130 | | $ | 14,152,927 | | $ | 1,931,176 | | $ | 686,479 | | $ | 81,850,712 | |
| | | | | |
The primary risks to the Company are capital, liquidity and funding risk, investment/market risk, credit risk and creditoperational risk. Interest rates are highly sensitive to many factors, including governmental monetary and tax policies, domestic and international economic and political considerations and other factors beyond the Company’s control. Changes in the general level of interest rates can affect net interest income, which is the difference between the interest income earned on interest earning assets and the interest expense incurred in connection with the interest bearing liabilities, by affecting the spread between the interest earning assets and interest bearing liabilities. Changes in the level of interest rates can also affect the value of the interest earning assets and the Company’s ability to realize gains from the sale of these assets. A decline in the value of the interest earning assets pledged as collateral for borrowings under repurchase agreements and derivative contracts could result in the counterparties demanding additional collateral or liquidating some of the existing collateral to reduce borrowing levels.
The Company may seek to mitigate the potential financial impact by entering into interest rate agreements such as interest rate swaps, interest rate swaptions and other hedges.
Weakness in the mortgage market, the shape of the yield curve, and changes in the expectations for the volatility of future interest rates and deterioration of financial conditions in general may adversely affect the performance and market value of the Company’s investments. This could negatively impact the Company’s book value. Furthermore, if many of the Company’s lenders are unwilling or unable to provide additional financing, the Company could be forced to sell its investments at an inopportune time when prices are depressed. The Company has established policies and procedures for mitigating risks, including conducting scenario and sensitivity analyses and utilizing a range of hedging strategies.
ANNALY CAPITAL MANAGEMENT, INC. AND SUBSIDIARIES
Financial Statements
The payment of principal and interest on the Freddie Mac and Fannie Mae Agency mortgage-backed securities, which exclude CRT securities issued by Freddie Mac and Fannie Mae, is guaranteed by those respective agencies and the payment of principal and interest on Ginnie Mae Agency mortgage-backed securities is backed by the full faith and credit of the U.S. government. Substantially all of the Company’s Agency mortgage-backed securities have an actual or implied “AAA” rating.
The Company faces credit risk on the portions of its portfolio which are not guaranteed by the respective Agency or by the full faith and credit of the U.S. government. The Company is exposed to credit risk on CRE Debt and Preferred Equity Investments, real estate investments, commercial mortgage-backed securities, residential mortgage loans, CRT securities and other non-Agency mortgage-backed securities and corporate debt.securities. MSR values may also be adversely impacted ifby rising borrower delinquencies which would reduce servicing income and increase overall costs to service the underlying mortgage loans increase due to borrower performance.loans. The Company is exposed to risk of loss if an issuer, borrower tenant or counterparty fails to perform its obligations under contractual terms. The Company has established policies and procedures for mitigating credit risk, including reviewing and establishing limits for credit exposure, limiting transactions with specific counterparties, pre-purchase due diligence, maintaining qualifying collateral and continually assessing the creditworthiness of issuers, borrowers tenants and counterparties.counterparties, credit rating monitoring and active servicer oversight.
The Company depends on third party service providers to perform various business processes related to its operations, including mortgage loan servicers and sub-servicers. The Company’s vendor management policy establishes procedures for engaging, onboarding and monitoring the performance of third party vendors. For mortgage loan servicers and sub-servicers, these procedures include assessing a vendor’s financial health as well as oversight of its compliance with applicable laws and regulations, cybersecurity and business continuity programs and security of personally identifiable information.
ANNALY CAPITAL MANAGEMENT, INC. AND SUBSIDIARIES
Financial Statements
| | |
20. RELATED PARTY TRANSACTIONS |
|
Closing of the Internalization and Termination of Management Agreement
On February 12, 2020, the Company entered into an internalization agreement (the “Internalization Agreement”) with the Former Manager and certain affiliates of the Former Manager. Pursuant to the Internalization Agreement, the Company agreed to acquire all of the outstanding equity interests of the Former Manager and the Former Manager’s direct and indirect parent companies from their respective owners (the “Internalization”) for nominal cash consideration ($1.00). In connection with the closing of the Internalization, on June 30, 2020, the Company acquired all of the assets and liabilities of the Former Manager (the net effect of which was immaterial in amount), and the Company transitioned from an externally-managed real estate investment trust (“REIT”) to an internally-managed REIT. At the closing, all employees of the Former Manager became employees of the Company. The parties also terminated the Amended and Restated Management Agreement by and between the Company and the Former Manager (the “Management Agreement”) and therefore the Company no longer pays a management fee to, or reimburses expenses of, the Former Manager. Pursuant to the Internalization Agreement, the Former Manager waived any Acceleration Fee (as defined in the Management Agreement).
Prior to the closing of the Internalization, the Former Manager, under the Management Agreement and subject to the supervision and direction of the Board, was responsible for (i) the selection, purchase and sale of assets for the Company’s investment portfolio; (ii) recommending alternative forms of capital raising; (iii) supervising the Company’s financing and hedging activities; and (iv) day to day management functions. The Former Manager also performed such other supervisory and management services and activities relating to the Company’s assets and operations as appropriate. In exchange for the management services, the Company paid the Former Manager a monthly management fee, and the Former Manager was responsible for providing personnel to manage the Company. Prior to the closing of the Internalization, the Company had paid the Former Manager a monthly management fee for its management services in an amount equal to 1/12th of the sum of (i) 1.05% of Stockholders' Equity (as defined in the Management Agreement) up to $17.28 billion, and (ii) 0.75% of Stockholders' Equity (as defined in the Management Agreement) in excess of $17.28 billion. The Company did not pay the Former Manager any incentive fees.
For the six months ended June 30, 2020 prior to the closing of the Internalization, the compensation and management fee computed in accordance with the Management Agreement was $77.9 million. For the year ended December 31, 2019, the compensation and management fee was $170.6 million.
Prior to the closing of the Internalization, the Company reimbursed the Former Manager for certain services in connection with the management and operations of the Company and its subsidiaries as permitted under the terms of the Management Agreement. Such reimbursable expenses included the cost for certain legal, tax, accounting and other support and advisory services provided by employees of the Former Manager to the Company. Pursuant to the Management Agreement, until the closing of the Internalization, the Company reimbursed the Former Manager for the cost of such services, provided such costs were no greater than those that would be payable to comparable third party providers. Expense reimbursements and related waivers were routinely reviewed with the Audit Committee of the Board in conformance with established policies. For the years ended December 31, 2020 and December 31, 2019, reimbursement payments to the Former Manager were $14.2 million and $21.4 million, respectively. None of the reimbursement payments were attributable to compensation of the Company’s executive officers.
At December 31, 2020 and December 31, 2019 the Company had amounts payable to the Former Manager of $0 and $15.8 million, respectively.
ANNALY CAPITAL MANAGEMENT, INC. AND SUBSIDIARIES
Financial Statements
| | |
21.22. LEASE COMMITMENTS AND CONTINGENCIES |
|
The Company adopted ASU 2016-02, Leases (Topic 842) on January 1, 2019 with no impact to retained earnings or other components of equity. The Company’s operating leases are primarily comprised of a corporate office leaseleases with a remaining lease termterms of fiveapproximately two years and four years. The corporate office lease includes an optionleases include options to extend for up to five years, however the extension term wasterms were not included in the operating lease liability calculation. Leases with an initial term of 12 months or less are not recorded on the balance sheet. The Company recognizes lease expense for these leases on a straight-line basis over the lease term. The lease cost for the year ended December 31, 20202023 was $3.2$3.3 million.
Supplemental information related to leases as of and for the year ended December 31, 20202023 was as follows:
| | | | | | | | |
| Operating Leases | Classification | December 31, 20202023 |
|
| Assets | (dollars in thousands) |
| Operating lease right-of-use assets | Other assets | $ | 13,1675,945 | |
| | |
| Liabilities |
Operating lease liabilities (1) | Other liabilities | $ | 17,1847,511 | |
| | |
| Lease term and discount rate |
| Weighted average remaining lease term | | 4.72.0 years |
| | |
Weighted average discount rate (1) | | 2.9%3.3% |
|
| | |
| Cash paid for amounts included in the measurement of lease liabilities |
| Operating cash flows from operating leases | | $ | 3,7994,081 | |
(1) AsFor the Company’s leases that do not provide an implicit rate, the Company uses an incremental borrowing rate based on the information available at adoption date in determining the present value of lease payments. |
|
The following table provides details related to maturities of lease liabilities:
| | Maturity of Lease Liabilities | | | Maturity of Lease Liabilities |
| Years ended December 31, | | Years ended December 31, | (dollars in thousands) |
| | Maturity of Lease Liabilities |
| Years ended December 31, | (dollars in thousands) |
| 2021 | $ | 3,918 | |
| 2022 | 3,862 | |
| 2023 | 3,862 | |
| 2024 | |
| 2024 | |
| 2024 | 2024 | 3,862 | |
| 2025 | 2025 | 2,895 | |
| 2026 | |
| 2027 | |
| Later years | Later years | 0 | |
| Total lease payments | Total lease payments | $ | 18,399 | |
| Less imputed interest | Less imputed interest | 1,215 | |
| Present value of lease liabilities | Present value of lease liabilities | $ | 17,184 | |
|
ANNALY CAPITAL MANAGEMENT, INC. AND SUBSIDIARIES
Financial Statements
Contingencies
From time to time, the Company is involved in various claims and legal actions arising in the ordinary course of business. In the opinion of management, the ultimate disposition of these matters will not have a material effect on the Company’s consolidated financial statements. There were 0no material contingencies at December 31, 20202023 and 2019.2022.
| | |
| 23. SUBSEQUENT EVENTS |
| 22. ARCOLA REGULATORY REQUIREMENTS
|
Arcola isIn January 2024, the Company’s wholly ownedCompany completed and consolidated broker-dealer. Arcola is subjectclosed two securitization of residential mortgage loans, OBX 2024-NQM1, with a face value of $413.6 million, and OBX 2024-NQM2, with a face value of $496.0 million. In February 2024, the Company completed and closed one securitization of residential mortgage loans, OBX 2024-HYB1, with a face value of $412.1 million. These securitizations represent financing transactions which provided non-recourse financing to regulations of the securities business that include but are not limited to trade practices, use and safekeeping of funds and securities, capital structure, recordkeeping and conduct of directors, officers and employees.
ANNALY CAPITAL MANAGEMENT, INC. AND SUBSIDIARIES
Financial Statements
Arcola is a member of various clearing organizations with which it maintains cash required to conduct its day-to-day clearance activities. Arcola enters into reverse repurchase agreements and repurchase agreements as part of its matched book trading activity. Reverse repurchase agreements are recorded on settlement date at the contractual amount and areCompany collateralized by mortgage-backed or other securities. Arcola generates income fromresidential mortgage loans purchased by the spread between what is earned on the reverse repurchase agreements and what is paid on the matched repurchase agreements. Arcola’s policy is to obtain possession of collateral with a market value in excess of the principal amount loaned under reverse repurchase agreements. To ensure that the market value of the underlying collateral remains sufficient, collateral is valued daily, and Arcola will require counterparties to deposit additional collateral, when necessary. All reverse repurchase activities are transacted under master repurchase agreements or other documentation that give Arcola the right, in the event of default, to liquidate collateral held and in some instances, to offset receivables and payables with the same counterparty.
As a member of the Financial Industry Regulatory Authority (“FINRA”), Arcola is required to maintain a minimum net capital balance. At December 31, 2020, Arcola had a minimum net capital requirement of $0.3 million. Arcola consistently operates with capital in excess of its regulatory capital requirements. Arcola’s regulatory net capital as defined by SEC Rule 15c3-1 at December 31, 2020 was $422.3 million with excess net capital of $422.0 million.
Schedule III - Real Estate and Accumulated Depreciation
(dollars in thousands)
| | | | | | | | | | | | | | | | | | | | | | | | | | | | | | | | | | | | | | | | | | | | | | | | | | | | | | | | | | | | | | | | | | | | | | | | | | | | | | | | | |
| December 31, 2020 |
| | | | | | Initial Cost to Company | | | Cost Capitalized Subsequent to
Acquisition | | | | Gross Amounts Carried at
Close of Period 12/31/20 | | | | | | | | | | | |
| Location | Number of Properties | | Encumbrances | | Land | | Buildings and Improvements | | | Improvements | | | | | | | | Land | | Buildings and Improvements | | | Total (1) | | Accumulated Depreciation | | Year of Construction | | Date Acquired | | Weighted-Average Depreciable Life (in years) |
| Retail - Carrollton, TX | 1 | | | $ | 12,875 | | | $ | 3,961 | | | $ | 14,672 | | | | $ | 9 | | | | | | | | | $ | 3,970 | | | $ | 14,672 | | | | $ | 18,642 | | | $ | (3,546) | | | 1996 | | 11/25/2015 | | 38 |
| Retail - Plano, TX | 1 | | | 11,817 | | | 4,616 | | | 12,691 | | | | 205 | | | | | | | | | 4,616 | | | 12,896 | | | | 17,512 | | | (3,368) | | | 1994 | | 11/25/2015 | | 38 |
| Retail - Grapevine, TX | 1 | | | 12,692 | | | 4,713 | | | 13,888 | | | | 248 | | | | | | | | | 4,713 | | | 14,136 | | | | 18,849 | | | (3,123) | | | 1998 | | 11/25/2015 | | 38 |
| Retail - Flower Mound, TX | 1 | | | 13,085 | | | 4,963 | | | 14,477 | | | | 14 | | | | | | | | | 4,963 | | | 14,491 | | | | 19,454 | | | (3,461) | | | 1999 | | 11/25/2015 | | 38 |
| Retail - Grapevine, TX | 1 | | | 9,797 | | | 3,932 | | | 9,972 | | | | 11 | | | | | | | | | 3,932 | | | 9,983 | | | | 13,915 | | | (2,401) | | | 1994 | | 11/25/2015 | | 38 |
| Retail - Flower Mound, TX | 1 | | | 7,492 | | | 2,696 | | | 7,351 | | | | 209 | | | | | | | | | 2,696 | | | 7,560 | | | | 10,256 | | | (2,424) | | | 1992 | | 11/25/2015 | | 38 |
| Retail - Flower Mound, TX | 1 | | | 8,929 | | | 3,571 | | | 8,280 | | | | 219 | | | | | | | | | 3,571 | | | 8,499 | | | | 12,070 | | | (1,774) | | | 1996 | | 11/25/2015 | | 38 |
| Retail - Plano, TX | 1 | | | 4,637 | | | 1,459 | | | 4,533 | | | | 95 | | | | | | | | | 1,459 | | | 4,628 | | | | 6,087 | | | (2,046) | | | 1995 | | 11/25/2015 | | 38 |
| Retail - Largo, FL | 1 | | | 12,750 | | | 4,973 | | | 12,812 | | | | 286 | | | | | | | | | 4,973 | | | 13,098 | | | | 18,071 | | | (3,255) | | | 1988 | | 8/14/2015 | | 27 |
| Retail - Grass Valley, CA | 1 | | | 25,900 | | | 9,872 | | | 28,680 | | | | 479 | | | | | | | | | 9,872 | | | 29,159 | | | | 39,031 | | | (7,979) | | | 1988 | | 10/27/2015 | | 25 |
| Multifamily - Washington, DC | 1 | | | 57,500 | | | 31,999 | | | 42,623 | | | | 1,155 | | | | | | | | | 31,999 | | | 43,778 | | | | 75,777 | | | (8,575) | | | 1978, 2008 | | 10/20/2015 | | 28 |
| Retail - Penfield, NY | 1 | | | 23,558 | | | 4,121 | | | 22,413 | | | | 1,546 | | | | | | | | | 4,122 | | | 23,958 | | | | 28,080 | | | (8,037) | | | 1957 | | 11/10/2014 | | 24 |
| Retail - Orchard Park, NY | 1 | | | 12,888 | | | 4,204 | | | 20,617 | | | | 224 | | | | | | | | | 4,189 | | | 20,856 | | | | 25,045 | | | (5,344) | | | 1997, 2000 | | 11/10/2014 | | 32 |
| Retail - Cheektowaga, NY | 1 | | | 9,447 | | | 1,961 | | | 12,259 | | | | 245 | | | | | | | | | 1,939 | | | 12,526 | | | | 14,465 | | | (3,317) | | | 1978 | | 11/10/2014 | | 25 |
| Retail - Amherst, NY | 1 | | | 8,270 | | | 2,131 | | | 9,740 | | | | 1,193 | | | | | | | | | 2,132 | | | 10,932 | | | | 13,064 | | | (2,871) | | | 1986 | | 11/10/2014 | | 28 |
| Retail - Ontario, NY | 1 | | | 5,406 | | | 575 | | | 6,813 | | | | 27 | | | | | | | | | 574 | | | 6,841 | | | | 7,415 | | | (2,189) | | | 1998 | | 11/10/2014 | | 31 |
| Retail - Irondequoit, NY | 1 | | | 15,000 | | | 2,438 | | | 14,684 | | | | 1,936 | | | | | | | | | 2,438 | | | 16,620 | | | | 19,058 | | | (4,824) | | | 1972 | | 11/10/2014 | | 27 |
| Retail - LeRoy, NY | 1 | | | 3,492 | | | 374 | | | 4,922 | | | | 405 | | | | | | | | | 343 | | | 5,358 | | | | 5,701 | | | (1,729) | | | 1997 | | 11/10/2014 | | 29 |
| Retail - Jamestown, NY | 1 | | | 7,356 | | | 820 | | | 4,915 | | | | 0 | | | | | | | | | 820 | | | 4,915 | | | | 5,735 | | | (1,783) | | | 1997 | | 11/10/2014 | | 29 |
| Retail - Warsaw, NY | 1 | | | 3,415 | | | 407 | | | 4,117 | | | | 6 | | | | | | | | | 407 | | | 4,123 | | | | 4,530 | | | (1,216) | | | 1998 | | 11/10/2014 | | 31 |
| Retail - Chillicothe, OH | 1 | | | 7,887 | | | 1,262 | | | 10,819 | | | | 57 | | | | | | | | | 1,262 | | | 10,876 | | | | 12,138 | | | (2,872) | | | 1981, 1998 | | 11/10/2014 | | 26 |
| Retail - Loganville, GA | 1 | | | 7,230 | | | 3,217 | | | 8,386 | | | | 604 | | | | | | | | | 3,217 | | | 8,990 | | | | 12,207 | | | (2,464) | | | 1996 | | 11/10/2014 | | 28 |
| Retail - Chillicothe, OH | 1 | | | 7,700 | | | 2,282 | | | 9,566 | | | | 209 | | | | | | | | | 2,282 | | | 9,775 | | | | 12,057 | | | (2,407) | | | 1995 | | 7/22/2015 | | 25 |
| Retail - Knoxville, TN | 1 | | | 0 | | | 3,503 | | | 13,309 | | | | 400 | | | | | | | | | 3,503 | | | 13,709 | | | | 17,212 | | | (2,980) | | | 2002 | | 4/9/2014 | | 34 |
| Office - Falls Church, VA | 1 | | | 25,000 | | | 13,500 | | | 21,895 | | | | 374 | | | | | | | | | 13,500 | | | 22,269 | | | | 35,769 | | | (1,571) | | | 1990 | | 3/23/2020 | | 27 |
| Retail - Washington DC | 1 | | | 0 | | | 38,000 | | | 6,499 | | | | 0 | | | | | | | | | 38,000 | | | 6,499 | | | | 44,499 | | | (81) | | | 1977 | | 8/28/2020 | | 38 |
| Healthcare - Abingdon, VA | 1 | | | 0 | | | 370 | | | 15,061 | | | | (15,431) | | | | | | | | | 0 | | | 0 | | | | 0 | | | 0 | | | 2012 | | 9/7/2018 | | 44 |
| Healthcare - Chase City, VA | 1 | | | 0 | | | 160 | | | 11,894 | | | | (12,054) | | | | | | | | | 0 | | | 0 | | | | 0 | | | 0 | | | 2004 | | 9/7/2018 | | 36 |
| Healthcare - Fredericksburg, VA | 1 | | | 0 | | | 3,110 | | | 18,830 | | | | (21,940) | | | | | | | | | 0 | | | 0 | | | | 0 | | | 0 | | | 1983 | | 9/7/2018 | | 18 |
| Healthcare - Gainesville, VA | 1 | | | 0 | | | 1,470 | | | 13,894 | | | | (15,364) | | | | | | | | | 0 | | | 0 | | | | 0 | | | 0 | | | 2006 | | 9/7/2018 | | 38 |
| Healthcare - Pennington Gap, VA | 1 | | | 0 | | | 190 | | | 11,549 | | | | (11,739) | | | | | | | | | 0 | | | 0 | | | | 0 | | | 0 | | | 2001 | | 9/7/2018 | | 33 |
| Healthcare - Manassas, VA | 1 | | | 0 | | | 2,040 | | | 14,041 | | | | (16,081) | | | | | | | | | 0 | | | 0 | | | | 0 | | | 0 | | | 2006 | | 9/7/2018 | | 38 |
| Healthcare - Radford, VA | 1 | | | 0 | | | 370 | | | 12,623 | | | | (12,993) | | | | | | | | | 0 | | | 0 | | | | 0 | | | 0 | | | 2002 | | 9/7/2018 | | 34 |
| Healthcare - Hopewell, VA | 1 | | | 0 | | | 560 | | | 12,181 | | | | (12,741) | | | | | | | | | 0 | | | 0 | | | | 0 | | | 0 | | | 2005 | | 9/7/2018 | | 37 |
| Healthcare - Clifton Forge, VA | 1 | | | 0 | | | 710 | | | 5,368 | | | | (6,078) | | | | | | | | | 0 | | | 0 | | | | 0 | | | 0 | | | 1986 | | 9/7/2018 | | 18 |
| Healthcare - Allen, TX | 1 | | | 8,847 | | | 800 | | | 10,858 | | | | 0 | | | | | | | | | 800 | | | 10,858 | | | | 11,658 | | | (1,452) | | | 2000 | | 9/7/2018 | | 22 |
| Healthcare - Frisco, TX | 1 | | | 6,559 | | | 1,000 | | | 7,420 | | | | 0 | | | | | | | | | 1,000 | | | 7,420 | | | | 8,420 | | | (828) | | | 1999 | | 9/7/2018 | | 31 |
| Healthcare - Garland, TX | 1 | | | 8,999 | | | 740 | | | 10,705 | | | | 0 | | | | | | | | | 740 | | | 10,705 | | | | 11,445 | | | (1,000) | | | 2004 | | 9/7/2018 | | 36 |
| Healthcare - Denison, TX | 1 | | | 4,211 | | | 650 | | | 6,527 | | | | 0 | | | | | | | | | 650 | | | 6,527 | | | | 7,177 | | | (1,078) | | | 1992 | | 9/7/2018 | | 19 |
| Healthcare - Lewisville, TX | 1 | | | 3,966 | | | 870 | | | 7,020 | | | | 0 | | | | | | | | | 870 | | | 7,020 | | | | 7,890 | | | (887) | | | 2004 | | 9/7/2018 | | 26 |
| Healthcare - Kaukauna, WI | 1 | | | 7,677 | | | 240 | | | 8,904 | | | | 0 | | | | | | | | | 240 | | | 8,904 | | | | 9,144 | | | (797) | | | 2009, 2013 | | 9/7/2018 | | 34 |
| Healthcare - Mankato, MN | 1 | | | 7,372 | | | 660 | | | 9,040 | | | | 0 | | | | | | | | | 660 | | | 9,040 | | | | 9,700 | | | (1,108) | | | 2004 | | 9/7/2018 | | 21 |
| Healthcare - Mankato, MN | 1 | | | 5,700 | | | 410 | | | 6,618 | | | | 0 | | | | | | | | | 410 | | | 6,618 | | | | 7,028 | | | (579) | | | 2014 | | 9/7/2018 | | 31 |
| Healthcare - St. George, UT | 1 | | | 9,706 | | | 1,050 | | | 13,422 | | | | 0 | | | | | | | | | 1,050 | | | 13,422 | | | | 14,472 | | | (1,031) | | | 2014 | | 9/7/2018 | | 36 |
| Healthcare - St. George, UT | 1 | | | 6,986 | | | 690 | | | 7,670 | | | | 0 | | | | | | | | | 690 | | | 7,670 | | | | 8,360 | | | (665) | | | 2011 | | 9/7/2018 | | 33 |
| Healthcare - Covington, LA | 1 | | | 16,290 | | | 410 | | | 19,216 | | | | 402 | | | | | | | | | 410 | | | 19,618 | | | | 20,028 | | | (1,744) | | | 2009 | | 9/7/2018 | | 31 |
| Healthcare - Blue Ridge, GA | 1 | | | 12,889 | | | 630 | | | 15,576 | | | | 3,471 | | | | | | | | | 630 | | | 19,047 | | | | 19,677 | | | (1,407) | | | 7/8/1905 | | 9/7/2018 | | 38 |
| Healthcare - Mission, KS | 1 | | | 16,327 | | | 600 | | | 21,501 | | | | 173 | | | | | | | | | 598 | | | 21,676 | | | | 22,274 | | | (1,934) | | | 7/7/1905 | | 9/7/2018 | | 32 |
| 48 | | | $ | 429,652 | | | $ | 173,280 | | | $ | 600,851 | | | | $ | (110,219) | | | | | | | | | $ | 164,240 | | | $ | 499,672 | | | | $ | 663,912 | | | $ | (100,147) | | | | | | | |
| | | | | | | | | | | | | | | | | | | | | | | | | | | | | | | |
(1) The aggregate cost of land, buildings and improvements, before depreciation, for Federal income tax purposes at December 31, 2020 was$681.5 million (unaudited).
The following table presents our real estate activity during the periods presented:
| | | | | | | | | | | | | | | | | |
| 2020 | | 2019 | | 2018 |
| Real Estate | (dollars in thousands) |
| Beginning balance | $ | 704,354 | | | $ | 721,664 | | | $ | 441,971 | |
| Acquisitions and improvements | 83,979 | | | 5,811 | | | 279,693 | |
| Property sold | (124,421) | | | (23,121) | | | 0 | |
| | | | | |
| Ending balance | $ | 663,912 | | | $ | 704,354 | | | $ | 721,664 | |
| Accumulated Depreciation | |
| Beginning balance | $ | 87,532 | | | $ | 67,026 | | | $ | 48,920 | |
| Property sold | (10,098) | | | (3,166) | | | 0 | |
| Depreciation | 22,713 | | | 23,672 | | | 18,106 | |
| Ending balance | $ | 100,147 | | | $ | 87,532 | | | $ | 67,026 | |
| | | | | |
| | | | | | | | | | | | | | | | | | | | | | | | | | | | | | | | | | | | | | | | | | | | | | | |
| December 31, 2020 |
| Schedule IV - Mortgage Loans on Commercial Real Estate |
| Description | Location | | Prior Liens (1) | | Face Amount | | Carrying Amount | | Interest Rate (2) | | LIBOR Floor | | Payment Terms | | Maturity Date (3) |
| Mezzanine debt investments | (dollars in thousands) |
| Retail | MA | | $ | 61,329 | | | $ | 10,000 | | | $ | 0 | | | 10.14% | | N/A | | Interest Only | | 9/6/2023 |
| Office | LA | | 60,212 | | | 8,700 | | | 8,258 | | | 10.75% | | N/A | | Interest Only | | 10/1/2023 |
| Retail | OH | | 124,750 | | | 36,603 | | | 0 | | | 9.50% | | N/A | | Interest Only | | 12/1/2023 |
| Office | NJ | | 0 | | | 9,922 | | | 9,369 | | | LIBOR+10.48% | | 0.25% | | Interest Only | | 9/15/2020 |
| Office | CA | | 0 | | | 23,013 | | | 23,012 | | | LIBOR+4.84% | | 0.16% | | Interest Only | | 1/3/2022 |
| Office | CA | | 104,682 | | | 10,281 | | | 10,281 | | | LIBOR+6.79% | | 0.16% | | Interest Only | | 1/3/2022 |
| Hotel | LA | | 81,200 | | | 14,800 | | | 6,796 | | | LIBOR+9.75% | | 0.16% | | Interest Only | | 9/9/2022 |
| Retail | CO | | 0 | | | 3,436 | | | 3,405 | | | LIBOR+5.00% | | 1.20% | | Interest Only | | 11/8/2022 |
| Office | FL | | 0 | | | 18,363 | | | 18,052 | | | LIBOR+3.30% | | 1.90% | | Interest Only | | 5/9/2023 |
| Office | TX | | 0 | | | 19,436 | | | 19,064 | | | LIBOR+3.75% | | 1.25% | | Interest Only | | 8/9/2023 |
| Office | TX | | 0 | | | 15,000 | | | 14,884 | | | LIBOR+3.45% | | 2.25% | | Interest Only | | 3/5/2024 |
| Retail | NC | | 0 | | | 3,292 | | | 2,684 | | | LIBOR+3.40% | | 2.25% | | Interest Only | | 3/9/2024 |
| Office | CA | | 0 | | | 8,415 | | | 8,351 | | | LIBOR+3.00% | | 1.5% | | Interest Only | | 1/9/2026 |
| | | | | | | | | | | | | | | |
| | | | | | | | | | | | | | | |
| | | | | | | | | | | | | | | |
| | | | | | | | | | | | | | | |
| | | | | | | | | | | | | | | |
| | | | | | | | | | | | | | | |
| | | | | | | | | | | | | | | |
| | | | | | | | | | | | | | | |
| | | | | | | | | | | | | | | |
| | | | | | | | | | | | | | | |
| | | | | | | | | | | | | | | |
| | | | | | | | | | | | | | | |
| | | | | | | | | | | | | | | |
| | | | | | | | | | | | | | |
| | | | | | | | | | | | | | | |
| First mortgages | | | | | | | | | | | | | | |
| Office | NJ | | $ | 0 | | | $ | 53,968 | | | $ | 50,956 | | | LIBOR+3.40% | | 0.25% | | Interest Only | | 9/15/2020 |
| Office | TX | | 0 | | | 67,281 | | | 66,169 | | | LIBOR+3.75% | | 1.25% | | Interest Only | | 8/9/2023 |
| Hotel | TX | | 0 | | | 8,038 | | | 7,827 | | | LIBOR+3.75% | | 2.00% | | Interest Only | | 10/9/2023 |
| Office | TX | | 0 | | | 12,000 | | | 11,907 | | | LIBOR+3.45% | | 2.25% | | Interest Only | | 3/5/2024 |
| Retail | NC | | 0 | | | 393 | | | 330 | | | LIBOR+3.40% | | 2.25% | | Interest Only | | 3/9/2024 |
| Retail | CA | | 0 | | | 40,029 | | | 35,356 | | | LIBOR+3.40% | | 2.06% | | Interest Only | | 3/5/2024 |
| Healthcare | WA | | 0 | | | 20,152 | | | 19,873 | | | LIBOR+3.40% | | 1.75% | | Interest Only | | 10/1/2023 |
| Multifamily | DE | | 0 | | | 31,469 | | | 31,257 | | | LIBOR+2.90% | | 1.75% | | Interest Only | | 11/8/2023 |
| Industrial | AZ | | 0 | | | 15,212 | | | 14,872 | | | LIBOR+3.50% | | 1.60% | | Interest Only | | 12/9/2024 |
| Industrial | NC | | 0 | | | 15,874 | | | 14,641 | | | LIBOR+2.85% | | 1.85% | | Interest Only | | 12/9/2024 |
| Multifamily | NY | | 0 | | | 37,403 | | | 36,062 | | | LIBOR+3.25% | | 1.75% | | Interest Only | | 1/9/2025 |
| Multifamily | NY | | 0 | | | 238 | | | 232 | | | LIBOR+3.25% | | 1.75% | | Interest Only | | 1/9/2025 |
| Office | FL | | 0 | | | 85,067 | | | 84,443 | | | LIBOR+3.00% | | 1.50% | | Interest Only | | 1/9/2026 |
| | | | | | | | | | | | | | | |
| | | | | | | | | | | | | | | |
| | | | | | | | | | | | | | | |
| | | | | | | | | | | | | | | |
| | | | | | | | | | | | | | | |
| | | | | | | | | | | | | | | |
| | | | | | | | | | | | | | | |
| | | | | | | | | | | | | | | |
| | | | | | | | | | | | | | | |
| | | | | | | | | | | | | | | |
| | | | | | | | | | | | | | | |
| | | | | | | | | | | | | | |
| | | | | | | | | | | | | | | |
| | | | | | | | | | | | | | | |
| | | | | $ | 568,385 | | | $ | 498,081 | | | | | | | | | |
| | | | | | | | | | | | | | | |
(1) Represents third-party priority liens.
(2) LIBOR represents the one month London Interbank Offer Rate.
(3) Assumes all extension options are exercised.
SIGNATURES
Pursuant to the requirements of Section 13 or 15(d) of the Securities Exchange Act of 1934, the registrant has duly caused this report to be signed on its behalf by the undersigned, thereunto duly authorized, in the city of New York, State of New York.authorized.
| | | | | |
| | | ANNALY CAPITAL MANAGEMENT, INC.
| | |
Date: February 18, 202115, 2024 | By: /s/ David L. Finkelstein |
| | David L. Finkelstein |
| | Chief Executive Officer and Chief Investment Officer (Principal Executive Officer) |
Pursuant to the requirements of the Securities Exchange Act of 1934, this report has been signed below by the following persons on behalf of the registrant and in the capacities and on the date indicated.
| | | | | | | | |
| Signature | Title | Date |
| | |
| | |
/s/ David L. Finkelstein David L. Finkelstein | Chief Executive Officer, and Chief Investment Officer, and Director (Principal Executive Officer)
| February 18, 202115, 2024 |
/s/ Serena Wolfe Serena Wolfe | Chief Financial Officer
(Principal Financial Officer and Principal Accounting Officer) | February 18, 202115, 2024 |
| | |
/s/ Francine J. Bovich Francine J. Bovich | Director | February 18, 202115, 2024 |
| | |
/s/ Wellington J. Denahan
Wellington J. Denahan
| Director, Vice Chair of the Board | February 18, 2021 |
/s/ Katherine Beirne Fallon
Katherine Beirne Fallon
| Director | February 18, 2021 |
| | |
/s/ Thomas Edward Hamilton
Thomas Edward Hamilton | Director | February 18, 202115, 2024 |
| | |
/s/ Kathy Hopinkah Hannan
Kathy Hopinkah Hannan | Director | February 18, 202115, 2024 |
/s/ Michael E. Haylon Michael E. Haylon | Director, Chair of the Board | February 18, 202115, 2024 |
/s/ Martin Laguerre Martin Laguerre | Director | February 15, 2024 |
/s/ Manon Laroche Manon Laroche | Director | February 15, 2024 |
/s/ Eric A. Reeves Eric A. Reeves | Director | February 15, 2024 |
/s/ John H. Schaefer John H. Schaefer | Director | February 18, 2021 |
/s/ Donnell A. Segalas
Donnell A. Segalas
| Director | February 18, 202115, 2024 |
/s/ Glenn A. Votek
Glenn A. Votek | Director | February 18, 202115, 2024 |
/s/ Scott Wede
Scott Wede | Director | February 15, 2024 |
/s/ Vicki Williams Vicki Williams | Director | February 18, 202115, 2024 |
| | |
| | |