
Table of Contents
4 | ||||||||
16 | ||||||||
| ||||||||
36 | ||||||||
37 | ||||||||
37 | ||||||||
37 | ||||||||
39 | ||||||||
40 | ||||||||
41 | ||||||||
61 | ||||||||
62 | ||||||||
96 | ||||||||
96 | ||||||||
98 | ||||||||
98 | Disclosure Regarding Foreign Jurisdictions that Prevent Inspections | |||||||
100 | ||||||||
100 | ||||||||
100 | ||||||||
101 | ||||||||
101 | ||||||||
103 | ||||||||
106 | ||||||||
| ||||||||
UNITED STATES
SECURITIES AND EXCHANGE COMMISSION
Washington, D.C. 20549
Form 10-K
☒ | ANNUAL REPORT PURSUANT TO SECTION 13 OR 15(d) OF THE SECURITIES EXCHANGE ACT OF 1934 | ||||
For the fiscal year ended December 31 2020
or
☐ | TRANSITION REPORT PURSUANT TO SECTION 13 OR 15(d) OF THE SECURITIES EXCHANGE ACT OF 1934 |
For the transition period from from_________to_________.
to .
TAYLOR MORRISON HOME CORPORATION
(Exact name of registrant as specified in its charter)
Delaware | 83-2026677 | |
(State or other jurisdiction of incorporation or organization) | (I.R.S. Employer Identification No.) | |||||||
4900 N. Scottsdale Road, Suite 2000, Scottsdale, Arizona85251
(Address of principal executive offices) (Zip Code)
Registrant’s telephone number, including area code: (480) (480) 840-8100
Securities registered pursuant to Section 12(b) of the Act:
Title of each class | Trading Symbol(s) | Name of each exchange on which registered | ||||||
Common Stock, $0.00001 par value | TMHC | New York Stock Exchange |
Securities registered pursuant to Section 12(g) of the Act: None
Indicate by check mark if the registrant is a well-known seasoned issuer, as defined in Rule 405 of the Securities Act. Yes ýYes ☒ No ☐¨
Indicate by check mark if the registrant is not required to file reports pursuant to Section 13 or Section 15(d) of the Act. Yes ☐ ¨No No ☒ý
Indicate by check mark whether the registrant (1) has filed all reports required to be filed by Section 13 or 15(d) of the Securities Exchange Act of 1934 during the preceding 12 months (or for such shorter period that the registrant was required to file such reports), and (2) has been subject to such filing requirements for the past 90 days. Yes ýYes ☒ No ☐¨
Indicate by check mark whether the registrant has submitted electronically every Interactive Data File required to be submitted pursuant to Rule 405 of Regulation S-T (§232.405 of this chapter) during the preceding 12 months (or for such shorter period that the registrant was required to submit such files). Yes ýYes ☒ No ☐
¨
Large accelerated filer |
| Accelerated filer | ☐ | ||||||||
Non-accelerated filer | ☐ | Smaller reporting company | ☐ | ||||||||
Emerging growth company | ☐ |
If an emerging growth company, indicate by check mark if the registrant has elected not to use the extended transition period for complying with any new or revised financial accounting standards provided pursuant to Section 13(a) of the Exchange Act. ☐¨
Indicate by check mark whether the registrant has filed a report on and attestation to its management’s assessment of the effectiveness of its internal control over financial reporting under Section 404(b) of the Sarbanes-Oxley Act (15 U.S.C. 7262(b)) by the registered public accounting firm that prepared or issued its audit report. ý☒
Indicate by check mark whether any of those error corrections are restatements that required a recovery analysis of incentive-based compensation received by any of the registrant’s executive officers during the relevant recovery period pursuant to §240.10D-1(b). ☐
Indicate by check mark whether the registrant is a shell company (as defined in Rule 12b-2 of the Exchange Act). Yes ☐ No ☒
ý
The number of shares outstanding of the issuer’s common stock, as of February 24, 202121, 2024:
:
Class | Outstanding | |||||||
Common Stock, $0.00001 par value |
| |||||||
Documents Incorporated by Reference
Portions of Part III of this Form 10-K are incorporated by reference from the registrant’s definitive proxy statement for its 20212024 annual meeting of shareholders to be filed with the Securities and Exchange Commission no later than 120 days after the end of the registrant’s fiscal year.
TAYLOR MORRISON HOME CORPORATION
FORM 10-K
FOR THE YEAR ENDED DECEMBER 31, 2020
Table of Contents
4 | ||||||||
16 | ||||||||
| ||||||||
36 | ||||||||
37 | ||||||||
37 | ||||||||
37 | ||||||||
39 | ||||||||
40 | ||||||||
41 | ||||||||
61 | ||||||||
62 | ||||||||
96 | ||||||||
96 | ||||||||
98 | ||||||||
98 | Disclosure Regarding Foreign Jurisdictions that Prevent Inspections | |||||||
100 | ||||||||
100 | ||||||||
100 | ||||||||
101 | ||||||||
101 | ||||||||
103 | ||||||||
106 | ||||||||
| ||||||||
i
Available Information
TAYLOR MORRISON HOME CORPORATION 10-K
1
Summary ofOf Material Risks
As you read this Annual Report and other reports or public statements, you should understand that statements made herein are not guarantees of performance or results. They are subject to known and unknown risks, uncertainties and assumptions including those described under the heading “Risk Factors” in Part I, Item 1A and elsewhere in this Annual Report. Although we believe that our forward-looking statements are based upon reasonable assumptions, you should be aware that many factors, including those described under the heading “Risk Factors” in Part I, Item 1A, and elsewhere in this Annual Report, could affect our actual financial results or results of operations and could cause actual results to differ materially from those in the forward-looking statements. Such risks and uncertainties include, but are not limited to, the following:
• | changes in general and local economic conditions; | • | our concentration of significant operations in certain geographic areas; | |
• | slowdowns or severe downturns in the housing market; | • | risks associated with our unconsolidated joint venture arrangements; | |
• | increases in interest rates or government fees; | • | information technology failures and data security breaches; | |
• | tax increases and changes in tax rules; | • | costs to engage in and the success of future growth or expansion of our operations or acquisitions or disposals of businesses; | |
• | homebuyers’ ability to obtain suitable financing; | • | damages associated with any major health and safety incident; | |
• | shortages in, disruptions of and cost of labor; | • | our ownership, leasing or occupation of land and the use of hazardous materials, and any related liabilities; | |
• | higher cancellation rates of existing home sales contracts; | • | negative publicity or poor relations with the residents of our communities; | |
• | raw materials and building supply shortages and price fluctuations; | • | new or changing government regulations and legal challenges; | |
• | inflation or deflation; | • | existing or future litigation, arbitration or other claims; | |
• | competition in our industries; | • | our compliance with environmental laws and regulations regarding climate change; | |
• | any increase in unemployment or underemployment; | • | utility and resource shortages or rate fluctuations; | |
• | the seasonality of our business; | • | our ability to sell mortgages we originate and claims on mortgages sold to third parties; | |
• | the physical impacts of climate change and the increased focus by third-parties on sustainability issues; | • | governmental regulation applicable to our financial services and title services business; | |
• | our ability to obtain additional performance, payment and completion surety bonds and letters of credit; | • | the loss of any of our important commercial lender relationships; | |
• | significant home warranty and construction defect claims; | • | constriction of the capital markets; | |
• | our reliance on subcontractors; | • | risks related to our substantial debt ; | |
• | failure to manage land acquisitions, inventory and development and construction processes; | • | restrictive covenants in agreements governing our revolving credit facility; | |
• | availability of land and lots at competitive prices; | • | the discontinuation of LIBOR and its impact on our borrowing costs; | |
• | decreases in the market value of our land inventory; | • | provisions in our charter, bylaws and Delaware Law that may delay or prevent an acquisition by a third party; and | |
• | our ability to use deferred tax assets; | • | provision in our charter that provides that the Court of Chancery of the State of Delaware will be the exclusive forum for certain legal actions between us and our stockholders. |
•2the scale and scope of the novel coronavirus (“COVID-19”) global pandemic;
Part I | |||||||
4 | Item 1. | ||||||
16 | Item 1A. | ||||||
36 | Item 1B. | ||||||
36 | Item 1C. | ||||||
37 | Item 2. | ||||||
37 | Item 3. | ||||||
37 | Item 4. | ||||||
| |||||||
General Overview
We have historically operatedoperate under thevarious brand names including Taylor Morrison, Darling Homes Collection by Taylor Morrison, and Darling Homes brand names. During 2020, we completedEsplanade. We also leverage our core homebuilding and land development expertise in alternative ways by operating the acquisition of William Lyon Homes (“WLH”), and as a result we also operate under the William Lyon Signature brand name. As part of our acquisition, we also acquired Urban Form Development, LLC (“Urban Form”), which primarily develops and constructs multi-use properties consisting of commercial space, retail, and multi-family properties. In addition, we provide financial services to customers through our wholly owned mortgage subsidiary, Taylor Morrison Home Funding, INCfollowing strategic real estate related businesses:
• | We provide financial services to customers through our wholly owned mortgage subsidiary, Taylor Morrison Home Funding, Inc. (“TMHF”), title insurance and closing settlement services through our title company, Inspired Title Services, LLC (“Inspired Title”), and homeowner’s insurance policies through our insurance agency, Taylor Morrison Insurance Services, LLC (“TMIS”). | |
• | We operate a “Build-to-Rent” homebuilding business under the brand name Yardly. We serve as a land acquirer, developer, and homebuilder in addition to leasing and management functions. | |
• | Through a wholly-owned subsidiary, we also develop and construct multi-use properties consisting of commercial space, retail, and multi-family properties under the Urban Form brand name. |

TAYLOR MORRISON HOME CORPORATION 10-K
4
Our business is organized into multiple homebuilding operating components and a financial services component, which are managed as multiple reportable segments, as follows:

Business Strategy and corporate reorganization expenses on the Consolidated Statement of Operations for the year ended December 31, 2018.
• | strategic land initiatives to mitigate risk and enhance capital efficiency; | |
• | process and product optimization to promote operational effectiveness; | |
• | product innovation and standardization to drive operating efficiencies and cost reduction; | |
• | balancing sales pace and price on a community-by-community basis to maintain targeted sales volume; |
TAYLOR MORRISON HOME CORPORATION 10-K
5
ITEM 1 streamlining our processes to build operational effectiveness, including our recent acquisitions;
• | balancing our inventory of homes under construction and our pace of new construction starts; | |
• | optimizing, at a community level, the intentional balance of to-be-built and quick-move-in homes; | |
• | ability to swiftly adjust our pricing, discounts/incentives, or financial services product offerings based on our customers' needs; | |
• | continuing to enhance the customer experience; and | |
• | further scaling our Build-to-Rent operations to meet the need for rental households. |
•
continuing to enhance the customer experience; and
•
• | opportunistic land acquisition of prime assets in core locations; | |
• | building distinctive communities driven by consumer preferences; resulting in a balanced portfolio which can withstand multiple economic cycles; | |
• | consistent delivery of competitive financial metrics; | |
• | innovative digital marketing capabilities; | |
• | maintaining a cost-efficient operating structure and culture; and | |
• | disciplined capital allocation with a focus on strong liquidity and balance sheet stewardship. |
opportunistic land acquisition of prime assets in core locations;
•building distinctive communities driven by consumer preferences;
• | reinvest in core homebuilding operations; | |
• | seek additional growth opportunities through mergers, acquisitions, organic growth into adjacent markets, opportunistic land investment and joint venture strategies; | |
• | optimize debt leverage; | |
• | reinvest in ancillary business opportunities within the industry; and | |
• | returning capital to shareholders (i.e. share repurchase programs). |
•Optimizing our existing land supply through enhanced product offerings;
Community development includes the acquisition and development of land, which may include obtaining significant planning and entitlement approvals and completing construction of off-site and on-site utilities and infrastructure. We generally operate as community developers, buthowever in some communities we operate solely as merchant builders, in which case we acquire fully entitled and developed lots.
TAYLOR MORRISON HOME CORPORATION 10-K
6
In order to maximize our risk-adjusted return, the allocation of capital for land investment is performed at the corporate levelas part of a centralized process with a disciplined approach to overall portfolio management. Our portfolio investment committee of senior executives meets on a regular basis. Annually, our operating divisions prepare a strategic plan for their respective geographies. Macro and micro indices, including but not limited to employment, housing starts, new home sales, re-sales and foreclosures, along with market related shifts in competition, land availability and consumer preferences, are carefully analyzed to determine our land and homebuilding strategy. Supply and demand are analyzed on a consumer segment and submarket basis to ensure land investment is targeted appropriately. Our long-term plan is compared on an ongoing basis to current conditions in the marketplace as they evolve and is adjusted to the extent necessary. Strategic decisions regarding community positioning are included in the decision making and underwriting process and are made in consultation with senior executives of our management team.
As a party to various land banking arrangements, which allow us towe acquire land in staged takedowns, while limitingwhich limits risk and retaining cash.defers cash outflows. These third-party entities use equity contributions from their owners and/or incur debt to finance the acquisition and development of the land. Such lots are included in our controlled lots for the year ended December 31, 2020.
| As of December 31, 2020 | |||||||||||||||||||||||||||||||||||||||||||||||||||||||||||
| Owned Lots | Controlled Lots | Owned and Controlled Lots | |||||||||||||||||||||||||||||||||||||||||||||||||||||||||
| Raw | Partially Developed | Finished | Long- Term Strategic Assets | Total | Total | Total | |||||||||||||||||||||||||||||||||||||||||||||||||||||
| East | 5,900 | 10,223 | 6,822 | 158 | 23,103 | 3,937 | 27,040 | ||||||||||||||||||||||||||||||||||||||||||||||||||||
| Central | 3,162 | 4,658 | 5,734 | — | 13,554 | 9,650 | 23,204 | ||||||||||||||||||||||||||||||||||||||||||||||||||||
| West | 3,268 | 4,614 | 8,840 | — | 16,722 | 8,318 | 25,040 | ||||||||||||||||||||||||||||||||||||||||||||||||||||
| Total | 12,330 | 19,495 | 21,396 | 158 | 53,379 | 21,905 | 75,284 | ||||||||||||||||||||||||||||||||||||||||||||||||||||
| As of December 31, 2019 | |||||||||||||||||||||||||||||||||||||||||||||||||||||||||||
| Owned Lots | Controlled Lots | Owned and Controlled Lots | |||||||||||||||||||||||||||||||||||||||||||||||||||||||||
| Raw | Partially Developed | Finished | Long- Term Strategic Assets | Total | Total | Total | |||||||||||||||||||||||||||||||||||||||||||||||||||||
| East | 10,155 | 7,764 | 7,349 | — | 25,268 | 4,213 | 29,481 | ||||||||||||||||||||||||||||||||||||||||||||||||||||
| Central | 2,621 | 1,511 | 4,497 | — | 8,629 | 2,945 | 11,574 | ||||||||||||||||||||||||||||||||||||||||||||||||||||
| West | 1,028 | 4,023 | 3,658 | — | 8,709 | 4,115 | 12,824 | ||||||||||||||||||||||||||||||||||||||||||||||||||||
| Total | 13,804 | 13,298 | 15,504 | — | 42,606 | 11,273 | 53,879 | ||||||||||||||||||||||||||||||||||||||||||||||||||||
| (Dollars in thousands) | As of December 31, 2020 | As of December 31, 2019 | |||||||||||||||||||||
| Development Status | Owned Lots | Book Value of Land and Development | Owned Lots | Book Value of Land and Development | |||||||||||||||||||
| Raw | 12,330 | $ | 356,681 | 13,804 | $ | 477,997 | |||||||||||||||||
| Partially developed | 19,495 | 1,215,419 | 13,298 | 914,689 | |||||||||||||||||||
| Finished | 21,396 | 2,388,177 | 15,504 | 1,559,291 | |||||||||||||||||||
| Long-term strategic assets | 158 | 13,462 | — | — | |||||||||||||||||||
| Total | 53,379 | $ | 3,973,739 | 42,606 | $ | 2,951,977 | |||||||||||||||||
| Allocation of Lots in Land Portfolio, by Year Acquired | As of December 31, 2020 | As of December 31, 2019 | |||||||||
| Acquired in 2020 | 39 | % | — | % | |||||||
| Acquired in 2019 | 17 | % | 20 | % | |||||||
| Acquired in 2018 | 34 | % | 57 | % | |||||||
| Acquired in 2017 | 3 | % | 8 | % | |||||||
| Acquired in 2016 and earlier | 7 | % | 15 | % | |||||||
| Total | 100 | % | 100 | % | |||||||
|
| As of December 31, 2023 |
| As of December 31, 2022 |
Acquired in 2023 |
| 24% |
| 0% |
Acquired in 2022 |
| 16% |
| 18% |
Acquired in 2021 |
| 20% |
| 27% |
Acquired in 2020 |
| 7% |
| 12% |
Acquired in 2019 and prior |
| 33% |
| 43% |
|
| 100% |
| 100% |
| As of December 31, 2020 | As of December 31, 2019 | ||||||||||||||||||||||||||||||||||||||||||||||
Sold Homes in Backlog(1) | Models | Inventory to be Sold | Total | Sold Homes in Backlog(1) | Models | Inventory to be Sold | Total | ||||||||||||||||||||||||||||||||||||||||
| East | 2,835 | 230 | 473 | 3,538 | 1,816 | 223 | 1,076 | 3,115 | |||||||||||||||||||||||||||||||||||||||
| Central | 2,398 | 160 | 134 | 2,692 | 1,655 | 142 | 391 | 2,188 | |||||||||||||||||||||||||||||||||||||||
| West | 3,170 | 378 | 406 | 3,954 | 1,240 | 139 | 307 | 1,686 | |||||||||||||||||||||||||||||||||||||||
| Total | 8,403 | 768 | 1,013 | 10,184 | 4,711 | 504 | 1,774 | 6,989 | |||||||||||||||||||||||||||||||||||||||
TAYLOR MORRISON HOME CORPORATION 10-K
7
ITEM 1 | BUSINESS
Actual life cycle will vary based on the size of the community, the sales absorption rate, and whether we purchased the property as raw land or as developed lots.
Our dedication to service defines our customer experience and acknowledges homeowners’ suggestions to incorporate style, quality and sustainability into every community we completedevelop. We offer a range of award-winning and innovative designs with a number of features such as single-story, multi-story, multi-family, higher density living, ranch style living, split bedroom plans and first floor master bedroom suites to appeal to diverse buyer needs. We engage architectural firms and utilize internal architectural resources to develop and augment existing plans in order to ensure that our homes reflect current and local consumer tastes. We engineer our homes for energy-efficiency and cost savings to reduce the constructionimpact on the environment. Our TM LiveWell program provides homeowners with a robust suite of a typicalhealthy home in approximately six months.
Based on local market practices, we either directly, or indirectly through our subcontractors, purchase drywall, cement, steel, lumber, insulation and the other building materials necessary to construct a home. While these materials are generally widely available from a variety of sources, from time to time we experience material shortages on a localized basis which can substantially increase the price for such materials and our construction process can be slowed. As a result of the COVID-19 pandemic, we experienced a few supply chain disruptions with delays from certain national vendors on specific items and certain vendors in certain locations; however, such delays did not generally slow down or prevent our home closings schedule.
We operate a “Build-to-Rent” homebuilding business under the brand name Yardly. Taylor Morrison serves as a land acquirer, developer, and Construction
We source projects in multiple markets including Austin, Charlotte, Dallas, Houston, Orlando, Phoenix, Raleigh, Tampa, and Sarasota. These communities can be executed as wholly-owned or with capital partners and bank financing. We completed the lease-up process and associated asset sale for our initial community in late 2022. Sourcing, development and leasing related to our acquired companies. Any covered item will be repairednumerous communities is ongoing with continued evaluation of hold or replaced to conform to approximately the original quality standards of the home at the time of closing. We also currently provide third-party warranty coverage on homes where required by Federal Housing Administration (“FHA”) or Veterans Administration (“VA”) regulations. From time to time, we evaluate our warranty offerings, including third-party warranty coverage, taking into account market changes and regulatory requirements.exit investment strategies.
TAYLOR MORRISON HOME CORPORATION 10-K
8
Sales and Marketing
These tools have proved to be instrumental to our online/virtualonline sales success in 2020 and beyond.success. Shoppers can seamlessly continue their experience by visiting one of our quick-move-in and/or model homes via a self-guided or in-person tour. Customers may also use the website to make inquiriesschedule a phone appointment and to receive a prompt response from one of our “Internet Home Consultants.” This platform was centralized in 2020, providing coverage for all divisions seven days a week—improving our customers' experience and developing consistency across the
We also benefit from a centralized approach to in-house creative, paid and social media resulting in annual savings that is reinvested in additional media and high performing influencer campaigns to increase brand positioning and awareness campaign in 2019, in 2020,awareness. Additionally, we launched a national brand campaign aimed at consumers in the discovery phase. The objective of this campaign is to further raise brand awareness and to position Taylor Morrison as an industry leader.
TAYLOR MORRISON HOME CORPORATION 10-K
9
storefront that conveys the customer preferences we have identified. Our Canvas program includes curated design collections, which are created based on consumer preference, take rate analytics, and product procurement availability. This standardized approach not only allows us to create more predictable results, but also time synergies, cost benefits, and support of our digital online sales strategy. We also use our Canvas program in our quick-move-in homes. We shifted our strategy for quick-move-in homes by releasing them for sale further along in the build cycle which allowed us to maximize margins. As of December 31, 2023 and 2022 we had 3,225 and 2,288 quick-move-in homes in inventory, respectively. From a sales operations perspective, our focus on business simplification and standardization was paramount in 2023 and we intend to continue these efforts in 2024. Operational efficiencies have included standardized processes, disciplined strategic activities, and execution of national programs.
Our homes are sold by our commissioned team members who work from sales offices generally located within our model homes. During the pandemic, we employed many virtual tools and safety precautions so that home shoppers could safely view our model homes and communities. Our goal is to ensure our sales force has extensive knowledge of ourthe homes, including our energy efficientenergy-efficient features, sales strategies and incentives, mortgage options, and community dynamics. To achieve this goal, we have on-goingongoing training for our sales team and conduct regular meetings to keep them abreast of the latest promotions, options, and sales techniques, and discuss geographic competition. Our sales team members are licensed real estate agents, where required by law, and assist our customers in adding design features to their homes, which we believe appeal to local consumer preferences. Third-party brokers who sell our homes are generally paid a sales commission based on the price of the home. In some of our divisions, we contract with third-party design studios that specialize in assisting our homebuyers with options and upgrades to personalize their homes. Utilizing these third-party design studios allows us to manage our overhead and costs more efficiently. We may also offer various sales incentives, including price concessions, assistance with closing costs, interest rate locks, interest rate buy downs, and landscaping or interior upgrades. The use, types, and amount of incentives dependsdepend largely on existing economic and local competitive market conditions.
Competition
We operate in a very competitive environment and compete with large national and regional homebuilding business is highly competitivecompanies and fragmented.with smaller local homebuilders for land, financing and related services, raw materials, skilled management, volume discounts, and local realtor and labor resources. We also compete with the sale of existing homes, whether by a homeownerresale, or by a financial institution that has acquired a“previously owned,” home through a foreclosure or for investment. Numerous homebuilders of varying sizes, ranging from local to national, some of which have greater sales and financial resources than us, also provide competition. We compete primarily onmarket, as well as other housing alternatives such as the basis of location, design, quality, service, value and reputation.
• | the timing of the introduction and start of construction of new projects; | • | the condition of the real estate market and general economic conditions in the areas in which we operate; | ||
• | the timing of sales; | • | mix of homes closed; | ||
• | the timing of closings of homes, lots and parcels; | • | construction timetables; |
•10the timing of the introduction and start of construction of new projects;
• | the timing of receipt of regulatory approvals for development and construction; | • | the cost and availability of materials and labor; and | ||
• | weather conditions in the markets in which we build. |
•
the cost and availability of materials and labor; and
| Three Months Ended, | Three Months Ended, | |||||||||||||||||||||||||||||||||||||||||||||||||
| 2020 | 2019 | |||||||||||||||||||||||||||||||||||||||||||||||||
| March 31 | June 30 | September 30 | December 31 | March 31 | June 30 | September 30 | December 31 | |||||||||||||||||||||||||||||||||||||||||||
| Net homes sold | 23 | % | 23 | % | 29 | % | 25 | % | 25 | % | 27 | % | 24 | % | 24 | % | ||||||||||||||||||||||||||||||||||
| Home closings revenue | 22 | % | 25 | % | 28 | % | 25 | % | 19 | % | 27 | % | 23 | % | 31 | % | ||||||||||||||||||||||||||||||||||
Income before income taxes(1) | (9) | % | 26 | % | 46 | % | 37 | % | 21 | % | 34 | % | 28 | % | 17 | % | ||||||||||||||||||||||||||||||||||
Net income(1) | (12) | % | 27 | % | 46 | % | 39 | % | 20 | % | 32 | % | 26 | % | 22 | % | ||||||||||||||||||||||||||||||||||
for additional information.
|
| Three Months Ended | ||||||||||||||||||||||
|
| 2023 |
|
| 2022 | |||||||||||||||||||
|
| March 31 |
|
| June 30 |
|
| September 30 |
|
| December 31 |
|
| March 31 |
| June 30 |
| September 30 |
| December 31 | ||||
Net homes sold |
|
| 26 | % |
|
| 28 | % |
|
| 24 | % |
|
| 22 | % |
| 32% |
| 27% |
| 22% |
| 19% |
Home closings revenue |
|
| 22 | % |
|
| 28 | % |
|
| 23 | % |
|
| 27 | % |
| 21% |
| 24% |
| 25% |
| 30% |
Income before income |
|
| 25 | % |
|
| 31 | % |
|
| 22 | % |
|
| 22 | % |
| 17% |
| 28% |
| 29% |
| 26% |
Net income |
|
| 25 | % |
|
| 31 | % |
|
| 22 | % |
|
| 22 | % |
| 17% |
| 28% |
| 29% |
| 26% |
Financial Services
• | to utilize mortgage finance as a sales tool in the home sale process to ensure a consistent customer experience and assist in maintaining home production efficiency; and | |
• | to control and analyze our sales order backlog quality and to manage projected home closing and delivery dates for our customers. |
•
to utilize mortgage finance as a sales tool in the home sale process to ensure a consistent customer experience and assist in maintaining home production efficiency; and
TAYLOR MORRISON HOME CORPORATION 10-K
11
Regulation, Environmental, Health and Safety Matters
ENVIRONMENTAL LAWS | We are subject to a variety of local, state and federal statutes, ordinances, rules and regulations concerning protection of public health and the environment (collectively, “environmental laws”). For example, environmental laws may affect: how we manage stormwater runoff, wastewater discharges, and dust; how we develop or operate on properties on or affecting resources such as wetlands, endangered species, cultural resources, or areas subject to preservation laws; and how we address contamination. The particular environmental laws that apply to any given community vary greatly according to the location and environmental characteristics of the site and its present and former uses. Complying with these environmental laws may result in delays, may cause us to incur substantial compliance and other costs, and/or may prohibit or severely restrict development in certain environmentally sensitive regions or areas. Noncompliance with environmental laws could result in fines and penalties, obligations to remediate, permit revocation, and other sanctions; and contamination or other environmental conditions at or in the vicinity of our developments could result in claims against us for personal injury, property damage, or other costs. | |
EVALUATION | We manage compliance with environmental laws at the division level with assistance from the corporate and regional legal departments. As part of the land acquisition due diligence process, we utilize environmental assessments to identify environmental conditions that may exist on potential acquisition properties. To date, environmental site assessments conducted at our properties have not revealed any environmental liability or compliance concerns that we believe would have a material adverse effect on our business, liquidity or results of operations, nor are we aware of any material environmental liability or concerns. | |
COMMUNITY | We believe we have the responsibility of creating communities and neighborhoods which will have long-lasting, positive impacts on their environments and the people who live in them. As such, we are committed to integrating sustainable values into all aspects of our business. This commitment to sustainability, our communities and our team is highlighted in our latest Environmental, Social and Governance (ESG) Report available on our website. Our ESG report is not considered part of this Annual Report. | |
HEALTH AND SAFETY | We are committed to maintaining high standards in health and safety at all of our sites. We have a health and safety audit system that includes comprehensive twice-yearly independent third-party inspections of selected sites covering all aspects of health and safety. Key areas of focus are on site conditions meeting exacting health and safety standards, and on subcontractor performance throughout our operating areas meeting or exceeding expectations. All of our team members must complete an assigned curriculum of online safety courses each year. These courses vary according to job responsibility. In addition, groups such as construction and field personnel are required to attend additional health and safety related training programs. | |
13
ITEM 1 | BUSINESS
We have a centralized information technology organization with its core team located at our corporate headquarters in Scottsdale, Arizona, augmented with field support technicians in key locations across the U.S. Our approach to information technology is to continuously simplify our information technology platform and consolidate and standardize applications. We believe a common application platform enables the sharing of ideas and rapid implementation of process improvements and best practices across the entire company. Our back-office operations use a fully integrated, industry recognized enterprise resource planning package. Marketing and field sales utilize a leading CRM solution that tracks leads and prospects from all sources and manages the customer communication process from lead creation through the buying process and beyond the post-warranty period. Field operations teams collaborate with our supply chain management to schedule and manage development and construction projects with a set of standard and widely used homebuilding industry solutions.

As of December 31, 2020, we2023, none of our employees were not subject tocovered by collective bargaining agreements. We act solely as a general contractor, and all construction operations are supervised by our project managers and field superintendents who manage third party subcontractors. We use independent consultants and contractors for some architectural, engineering, advertising and legal services, and we strive to maintain good relationships with our subcontractors and independent consultants and contractors.
TAYLOR MORRISON HOME CORPORATION 10-K
14
ITEM 1 | BUSINESS
DEI, and our leadership team hosts town hall meetings within the organization to ensure employees have a voice awareness, and commitmentare aware and committed to DEI. In addition, we have established subcommittees consisting of diverse team members who meet quarterly to help inform our National DEI Committee’s agenda, as well as our overall DEI strategy. Our leadership team is committed to creating a collaborative and inclusive work environment and continues to develop initiatives, policies and procedures to foster greater DEI. At December 31, 2020,See below for highlights and key developments relating to our workforce consisted of approximately 46% females and of these 19% were in managerial roles. The Company has and will continue to demonstrate that there is an open door and a path to leadership for all team members at any level of our company. Accordingly, we are proud to have been included for the third consecutive year as one of only 380 companies, and the only U.S. homebuilder, on the 2021 Bloomberg Gender-Equality Index (GEI), fostering greater transparency and an inclusive work environment in a traditionally male-dominated industry.
|
KEY DEVELOPMENT The Company has and will continue to demonstrate that there is an open door and a path to leadership for all team members at any level of our company. Accordingly, we are proud to have been included for the sixth consecutive year as the only U.S. homebuilder on the 2024 Bloomberg Gender-Equality Index (GEI), fostering greater transparency and an inclusive work environment in a traditionally male-dominated industry. |
TAYLOR MORRISON HOME CORPORATION 10-K
15
• | increases in short- and long-term interest rates; |
• | high inflation; |
• | supply-chains and the cost or availability of building materials; |
• | the availability of subcontractors, vendors or other third parties; |
• | housing affordability; |
• | the cost and availability of suitable land and lots for the development of our communities; |
• | the availability and cost of financing for homebuyers; |
• | federal and state income and real estate tax laws, including limitations on, or the elimination of, the deduction of mortgage interest or property tax payments; |
• | employment levels, job and personal income growth and household debt-to-income levels; |
• | consumer confidence generally and the confidence of potential homebuyers in particular; |
• | the ability of homeowners to sell their existing homes at acceptable prices; |
• | the U.S. and global financial systems and credit markets, including stock market and credit market volatility; |
• | inclement weather and natural disasters, including risks associated with global climate change, such as increased frequency or intensity of adverse weather events; |
• | civil unrest, acts of terrorism, other acts of violence, threats to national security, escalating global trade tensions, the adoption of trade restrictions, or a public health issue such as COVID-19 or other major epidemic or pandemic; |
• | mortgage financing programs and regulation of lending practices; |
• | housing demand from population growth, household formations and demographic changes (including immigration levels and trends or other costs of home ownership in urban and suburban migration); |
• | demand from foreign buyers for our homes; |
• | the supply of available new or existing homes and other housing alternatives; |
• | energy prices; and |
• | the availability of developable land in our markets and in the United States generally. |
TAYLOR MORRISON HOME CORPORATION 10-K
16
ITEM 1A | RISK FACTORS
be able to recover these increased costs by raising prices because of weak market conditions and because the price of each home we sell is usually set several months before the home is delivered, as many customers sign their home purchase contracts before construction begins. The potential difficulties described above could impact our customers’ ability to obtain suitable financing and cause some homebuyers to cancel or refuse to honor their home purchase contracts altogether.
Increases in interest rates or government fees could prevent potential customers from buying our homes and adversely affect our business or financial results.
Increases in interest rates as a result of changes to monetary policy could significantly increase the costs of owning a home or result in existing homeowners with low interest rates choosing to remain in their current homes rather than purchase a new home in a higher interest rate environment. This, in turn, could adversely impact demand for, and sales prices of, homes and the ability of potential customers to obtain financing and adversely affect our business, financial condition and operating results. Interest rates had been at historic lows for the last several years, which had made the homes we sell more affordable. During 2020 and 2021, the Federal Reserve took several steps to protect the economy from the impact of COVID-19, including reducing interest rates to new historic lows. However, in 2022 and 2023, in light of increasing inflation, the Federal Reserve increased interest rates 11 times, which caused buyer apprehension and affordability concerns, resulting in an increase in cancellations and a negative impact on our net sales orders in 2022. To mitigate these impacts we began to adjust pricing, primarily by offering finance incentives, as well as home discounts and other pricing reductions during the second half of 2022. While these pricing adjustments and incentives helped drive an increase in sales orders and a gradual normalization in cancellations beginning in 2023, there is no guarantee that these adjustments will continue to be offered or be as effective in the future. Rising interest rates also negatively impact demand for mortgage financing, which may result in lower home mortgage originations for our TMHF business. In January 2024, the Federal Reserve announced that it decided to hold interest rates at the current level and has indicated that it expects to begin cutting interest rates in 2024. Any additional increases in interest rates could negatively affect mortgage rates, real estate property values, sales orders and increase cancellations which could adversely affect our business.
Tax increases and changes in tax rules may adversely affect our financial results.
We are exposed, both directly and indirectly, to the effects of changes in U.S., state and local tax rules. For example, if federal or state laws are changed to eliminate or reduce the income tax benefits associated with homeownership, such as personal tax deductions for mortgage loan interest costs and real estate taxes, the after-tax cost of homeownership could measurably increase and diminish interest in buying a home. Additionally, increases in property tax rates by local governmental authorities can adversely affect the ability of potential customers to obtain financing or their desire to purchase new homes. Fees imposed on developers to fund schools, open spaces, road improvements and/or provide low and moderate income housing, could increase our costs and have an adverse effect on our operations. In addition, increases in sales taxes could adversely affect our potential customers who may
TAYLOR MORRISON HOME CORPORATION 10-K
17
consider those costs in determining whether or not to make a new home purchase, potentially reducing our customer base and reducing sales revenue.
Recently, the Biden administration has announced, and in certain cases has enacted, a number of tax proposals to fund new government investments in infrastructure, healthcare, and education, among other things. Certain of these proposals involve an increase in the domestic corporate tax rate, which if implemented could have a material impact on our future results of operations and cash flows.
If homebuyers are not able to obtain suitable financing, our results of operationssales may decline.
TAYLOR MORRISON HOME CORPORATION 10-K
18
Labor shortages can be further exacerbated as demand for housing increases. Any of these circumstances could give rise to delays and increased costs developing one or more of our communities and building homes. In addition, the vast majority of our work carried out on site is performed by subcontractors. In the past, reduced levels of homebuilding in the United States has led to some skilled tradesmen leaving the industry to take jobs in other sectors. If subcontractors are not able to recruit sufficient numbers of skilled employees, our development and construction activities may suffer from delays and quality issues, which would also lead to reduced levels of customer satisfaction.satisfaction and increased home warranty and construction defect claims. Further, the cost of labor may also be adversely affected by inflation and changes in immigration laws and trends in labor migration. We may not be able to recover increased costs by raising our home prices because the price for each home is typically set months prior to its delivery pursuant to sales contracts with our homebuyers. In such circumstances, our operating results could be adversely affected. Additionally, market and competitive forces may also limit our ability to raise the sales prices of our homes.
TAYLOR MORRISON HOME CORPORATION 10-K
19
ITEM 1A | RISK FACTORS
cost inflation and negatively impact the timing of our closings and the pace of our sales. In particular, shortages and fluctuations in the price of concrete, drywall, lumber or other important raw materials could result in delays in the start or completion of, or increase the cost of, developing one or more of our residential communities. Our lumber needs are highly competitiveparticularly sensitive to shortages and ifrelated cost increases. We may also face increased future home warranty and construction defect claims associated with substitute products or materials used in some instances to address supply shortages in certain served markets or communities. See – “Homebuilding is subject to home warranty and construction defect claims in the ordinary course of business that can lead to significant costs for us” below. In addition, the cost of petroleum products, which are used both to deliver our competitors are more successful or offer better valuematerials and to transport workers to our customers, our business could decline.
We are particularly exposed to offer more attractive financing to potential customers.
The homebuilding and mortgage and title services industries are highly competitive and if our competitors are more successful or offer better value to our customers, our business could decline.
We operate in a very competitive environment with competition from a number of other homebuilders in each of our markets. We compete with large national and regional homebuilding companies and with smaller local homebuilders for land, financing and related services, raw materials, skilled management, volume discounts, local realtor and labor
TAYLOR MORRISON HOME CORPORATION 10-K
20
resources. We also compete with the resale, or “previously owned,” home market, as well as other housing alternatives such as the rental housing market. Additionally, some of our competitors have longstanding relationships with subcontractors and suppliers in markets in which we operate and others may have greater financial resources or lower costs than us. Competitive conditions in the homebuilding industry could make it difficult for us to acquire suitable land at acceptable prices, cause us to increase selling incentives, reduce prices and/or result in an oversupply of homes for sale. These factors have adversely affected demand for our homes and our results of our operations in the past and could do so again in the future.
Additionally, our mortgage and title services businesses compete with other mortgage lenders and title companies, including national, regional and local mortgage banks and other financial institutions, some of which may be subject to fewer government regulations or, in the case of mortgage lenders, may have a greater range of products, greater access to or a lower cost of capital or different lending criteria and may be able to offer more attractive financing to potential customers.
If we are unable to compete effectively in our homebuilding and mortgage and title services markets, our business could decline disproportionately to our competitors, and our results of operations and financial condition could be adversely affected.
Any increase in unemployment or underemployment may lead to an increase in the number of loan delinquencies and property repossessions and have an adverse impact on us.
According to the U.S. Bureau of Labor Statistics (“BLS”), the U.S. unemployment rate was 3.7% as of December 2023, and the labor force participation rate was 62.5% which is 0.9 percentage points lower than the participation rate in February 2020. While the relatively low unemployment rate is an encouraging sign, a substantial portion of new jobs created have been relatively low-wage jobs or part-time jobs. People who are not employed, are underemployed, who have left the labor force or are concerned about low wages or the loss of their jobs are less likely to purchase new homes, may be forced to try to sell the homes they own and may face difficulties in making required mortgage payments or qualifying for new mortgage financing. Therefore, any increase in unemployment or underemployment may lead to an increase in the number of loan delinquencies and property repossessions and have an adverse impact on us both by reducing demand for the homes we build and by increasing the supply of homes for sale.
Our quarterly operating results may fluctuate because of the seasonal nature of our business and other factors.
TAYLOR MORRISON HOME CORPORATION 10-K
21
ITEM 1A | RISK FACTORS
increasing stress on our supply chain and negatively impact the demand for new homes in affected areas, as well as slow down or otherwise impair the ability of utilities and local governmental authorities to provide approvals and service to new housing communities. Furthermore, if our insurance does not fully cover our costs and other losses from these events, including those arising out of related business interruptions, our earnings, liquidity, or capital resources could be adversely affected.
An inability to obtain additional performance, payment and completion surety bonds and letters of credit could limit our future growth.
TAYLOR MORRISON HOME CORPORATION 10-K
22
ITEM 1A | RISK FACTORS
changes in estimates to pre-existing reserves as needed. For the year ended December 31, 2019, we recorded a $43.1 million charge for construction defect remediation isolated to one specific community in the Central region. For the year ended December 31, 2020, no changes in estimates were necessary for this construction defect remediation. This reserve at December 31, 2020 and 2019 was $12.7 million and $36.3 million, respectively. The reserve estimate is based on assumptions, including but not limited to, the number of homes affected, the costs associated with each repair, and the effectiveness of the repairs. Due to the degree of judgment required in making these estimates and the inherent uncertainty in potential outcomes, it is reasonably possible that actual costs could differ from those recorded and such differences could be material, resulting in a change in future estimated reserves. In addition, contractual indemnities with our subcontractors can be difficult to enforce. We may also be responsible for applicable self-insured retentions and some types of claims may not be covered by insurance or may exceed applicable coverage limits. Additionally, the coverage offered by and the availability of products and completed operations excess liability insurance for construction defects is currently limited and costly. This coverage may be further restricted or become more costly in the future.
TAYLOR MORRISON HOME CORPORATION 10-K
23
ITEM 1A | RISK FACTORS
requirements resulting in additional costs. If the rate at which we sell and deliver homes slows or falls, or if our opening of new home communities for sale is delayed, we may incur additional costs, which would adversely affect our gross profit margins and will lead to a longer period of time for us to recover our costs, including those we incurred in acquiring and developing land.
TAYLOR MORRISON HOME CORPORATION 10-K
24
ITEM 1A | RISK FACTORS
number of factors, including applicable rules relating to the permitted carry back period for offsetting certain net operating losses against prior period earnings and the timing and amount of future taxable income. If we are unable to use our net operating losses, we may have to record charges to reduce our deferred tax assets, which could have an adverse effect on our results of operations.
To finance these activities,our joint ventures, our unconsolidated joint ventures often obtain loans from third-party lenders that are secured by the unconsolidated joint venture’s assets. To the extent
TAYLOR MORRISON HOME CORPORATION 10-K
25
ITEM 1A | RISK FACTORS
our best interests. In addition, as our relationships with our partners are contractual in nature and may be terminated or dissolved under the terms of the applicable joint venture agreements, including buy-sell provisions, we may not continue to own or operate the interests or assets underlying such relationship or may need to purchase additional interests or assets in the venture to continue ownership. In the event a joint venture is terminated or dissolved, we could also be exposed to lawsuits and legal costs.
Additionally, state governments, most notably California, Nevada, Texas and Colorado, have enacted or enhanced their data privacy regulations, and other governments are considering establishing similar or stronger protections. These regulations impose certain obligations for securing, and potentially removing, specified personal information in our systems, and for apprising individuals of the information we have collected about them. We have incurred costs in an effort to comply with these data privacy risks and requirements, and our costs may increase significantly as such risks become increasingly complex or if new or changing requirements are enacted, and ultimately based on how individuals choose to exercise their rights. For example, in November 2020, California voters approved Proposition 24 (Consumer Personal Information Law and Agency Initiative), which became effective as of January 1, 2023 and has increased data privacy requirements for our business. Despite our efforts, any noncompliance could result in our incurring substantial penalties and reputational damage.
TAYLOR MORRISON HOME CORPORATION 10-K
26
We may incur a variety of costs to engage in future growth or expansion of our operations or acquisitions of businesses, and the anticipated benefits may never be realized.
• | difficulties in assimilating the operations and personnel of acquired companies or businesses; |
• | diversion of our management’s attention from ongoing business concerns; |
• | our potential inability to maximize our financial and strategic position through the successful incorporation or disposition of operations; |
• | significant liabilities may not be identified in due diligence or may come to light after the expiry of warranty or indemnity periods; |
• | difficulties in the implementation of uniform standards, controls, procedures and policies; and |
• | impairment of existing relationships with employees, contractors, suppliers and customers as a result of the integration of new management personnel and cost-saving initiatives. |
•
difficulties in assimilating the operations and personnel of acquired companies or businesses;
TAYLOR MORRISON HOME CORPORATION 10-K
27
ITEM 1A | RISK FACTORS
hazardous substances) impose strict liability, which
TAYLOR MORRISON HOME CORPORATION 10-K
28
Further, government agencies routinely initiate audits, reviews or investigations of our business practices to ensure compliance with applicable laws and regulations, which can cause us to incur costs or create other disruptions in our business that can be significant. Further, we may experience delays and increased expenses as a result of legal challenges to our proposed communities, whether brought by governmental authorities or private parties.
We are involved in various litigation and legal claims, including actions brought on behalf of various classes of claimants. For example, in 2023 we paid $64.7 million resulting from a judgment in a case in Florida relating to our collection of club membership fees in connection with the use of our club amenities. See Note 14 - Commitments and Contingencies - Legal Proceedings in the Notes to the Consolidated financial statements included in this Annual Report for additional information. We establish liabilities for legal claims and regulatory matters when such matters are both probable of occurring and any potential loss is reasonably estimable. We accrue for such matters based on the facts and circumstances specific to each matter and revise these estimates as the matters evolve. In such cases, there may exist an exposure to loss in excess of any amounts currently accrued. In view of the inherent difficulty of predicting the outcome of these legal and regulatory matters, we generally cannot predict the ultimate resolution, the related timing or the amount of any eventual loss. To the extent the liability arising from the ultimate resolution of any matter exceeds the estimates reflected in the recorded reserves relating to such matter, we could incur additional charges that could be significant. Unfavorable litigation, arbitration or claims could also generate negative publicity in various media outlets that could be detrimental to our reputation.
Regulations regarding environmental matters and climate change may affect us by substantially increasing our costs and exposing us to potential liability.
TAYLOR MORRISON HOME CORPORATION 10-K
29
In addition, there is a growing concern from advocacy groups and the general public that the emission of greenhouse gases and other human activities have caused, or will cause,are causing significant changes in weather patterns and temperatures and the frequency and severity of weather events and natural disasters. There is a variety of legislation and other regulation being implemented or considered, at the federal, state and local level relating to energy and climate change. It involvesThis legislation and these regulations involve matters including carbon dioxide emissions control and building codes that impose energy efficiency standards, as well as standards to improve the resiliency of buildings to climate-related impacts such as flooding, storm surges, severe winds, wildfires and other extreme weather-related stress on buildings. Such requirements could significantly increase our cost to construct homes. Energy-related initiatives affect a wide variety of companies throughout the United States and the world and, because our operations are heavily dependent on significant amounts of raw materials, such as lumber, steel and concrete, they could also have an indirect adverse impact on our operations and profitability to the extent the manufacturers and suppliers of our materials are burdened with expensive cap and trade and similar energy related taxes and regulations.
TAYLOR MORRISON HOME CORPORATION 10-K
30
ITEM 1A | RISK FACTORS
additional capital resources to finance the loans that TMHF is extending. In addition, although mortgage lenders under the mortgage warehouse facilities TMHF currently uses to finance our lending operations normally purchase our mortgages within approximately 20-30 days of origination, if such mortgage lenders default under these warehouse facilities TMHF would be required to fund the mortgages then in the pipeline. In such case, amounts available under our $1 Billion Revolving Credit Facility and $100 Million Revolving Credit Facility (together, the "Revolving Credit Facilities") and cash from operations may not be sufficient to allow TMHF to provide financing required by our business during these times, and our ability to originate and sell mortgage loans at competitive prices could be limited, which could negatively affect our business. Further, an obligation to commit our own funds to long-term investments in mortgage loans could, among other things, delay the time when we recognize revenues from home sales on our statements of operations.
TAYLOR MORRISON HOME CORPORATION 10-K
31
and the market perception of our business. Additionally, if we are unable to originate mortgages for any reason going forward, our customers may experience significant mortgage loan funding issues, which could have a material impact on our homebuilding business and our consolidatedConsolidated financial statements.
• | making it more difficult for us to satisfy our obligations with respect to our debt or to our trade or other creditors; |
• | increasing our vulnerability to adverse economic or industry conditions; |
• | limiting our ability to obtain additional financing to fund capital expenditures and land acquisitions, particularly when the availability of financing in the capital markets is limited; |
requiring us to pay higher interest rates upon refinancing or on our variable rate indebtedness if interest rates rise; | |
• | requiring a substantial portion of our cash flows from operations and the proceeds of any capital markets offerings or loan borrowings for the payment of principal and interest on our debt thus reducing our ability to use our cash flows to fund working capital, capital expenditures, land acquisitions and general corporate requirements; |
TAYLOR MORRISON HOME CORPORATION 10-K
32
ITEM 1A making it more difficult for us to satisfy our obligations with respect to our debt or to our trade or other creditors;
• | limiting our flexibility in planning for, or reacting to, changes in our business and the industry in which we operate; and |
• | placing us at a competitive disadvantage to less leveraged competitors. |
•
limiting our ability to obtain additional financing to fund capital expenditures and land acquisitions, particularly when the availability of financing in the capital markets is limited;
• | incur or guarantee additional indebtedness; |
• | make certain investments; |
• | repurchase equity or subordinated indebtedness; |
• | pay dividends or make distributions on our capital stock; |
• | sell assets, including capital stock of restricted subsidiaries; |
• | agree to restrictions on distributions, transfers or dividends affecting our restricted subsidiaries; |
• | consolidate, merge, sell or otherwise dispose of all or substantially all of our assets; |
• | enter into transactions with our affiliates; |
• | incur liens; and |
• | designate any of our subsidiaries as unrestricted subsidiaries. |
•incur or guarantee additional indebtedness;
TAYLOR MORRISON HOME CORPORATION 10-K
33
The discontinuation of LIBOR could affect our borrowing costs.
The London Interbank Offered Rate (“LIBOR”) was the primary basis for determining interest payments on borrowings under each of our warehouse facilities and our Revolving Credit Facilities. On March 5, 2021, ICE Benchmark Administration (“IBA”) confirmed it would cease publication of Overnight, 1, 3, 6 and 12 month US Dollar LIBOR settings immediately following the LIBOR publication on June 30, 2023. The Alternative Reference Rates Committee, which was convened by the Federal Reserve Board and the New York Federal Reserve, has identified the Secured Overnight Financing Rate (“SOFR”) as the recommended risk-free alternative rate for US Dollar LIBOR. In response to the planned discontinuation of LIBOR, our warehouse facilities agreements as well as our Revolving Credit Facilities have been restructured to use SOFR as the primary basis for determining interest payments.
At this time, it is not possible to predict the full effect that the discontinuance of LIBOR, or the establishment of alternative reference rates such as SOFR, will have on us or our borrowing costs. SOFR is a relatively new reference rate and its composition and characteristics are not the same as LIBOR. Given the limited history of these rates and potential volatility as compared to other benchmark or market rates, the future performance of these rates cannot be predicted based on historical performance. The consequences of using SOFR could include an increase in the cost of our variable rate indebtedness.
Risks related to our organization and structure
• | the sole ability of the Board of Directors to fill a vacancy created by the expansion of the Board of Directors; |
• | advance notice requirements for stockholder proposals and director nominations; |
• | limitations on the ability of stockholders to call special meetings and to take action by written consent; |
• | in certain cases, the approval of holders of at least three-fourths of the shares entitled to vote generally on the making, alteration, amendment or repeal of our certificate of incorporation or by-laws will be required to adopt, amend or repeal our bylaws, or amend or repeal certain provisions of our certificate of incorporation; and |
• | the ability of our Board of Directors to designate the terms of and issue new series of preferred stock without stockholder approval, which could be used, among other things, to institute a rights plan that would have the effect of significantly diluting the stock ownership of a potential hostile acquirer, likely preventing acquisitions that have not been approved by our Board of Directors. |
•
the sole ability of the board of directors to fill a vacancy created by the expansion of the board of directors;
TAYLOR MORRISON HOME CORPORATION 10-K
34
Under our Revolving Credit Facility,Facilities, a change of control would be an event of default, which wouldcould therefore require a third-party acquirer to obtain a facility to refinance any outstanding indebtedness under the Revolving Credit Facility.Facilities. Under the indentures governing our Senior Notes, if a change of control were to occur, we would be required to make offers to repurchase the Senior Notes at prices equal to 101% of their respective principal amounts. These change of control provisions in our existing debt agreements may also delay or diminish the value of an acquisition by a third party.
Our charter provides to the fullest extent permitted by law that unless we consent in writing to the selection of an alternative forum, the Court of Chancery of the State of Delaware will be the sole and exclusive forum for any (i) derivative action or proceeding brought on behalf of the Company, (ii) any action or proceeding asserting a claim of breach of a fiduciary duty owed by any of our directors, officers, employees or stockholders, (iii) any action or proceeding asserting a claim arising pursuant to any provision of the General Corporation Law of the State of Delaware, as amended from time to time, or (iv) any action or proceeding asserting a claim governed by the internal affairs doctrine. The choice of forum provision may increase costs to bring a claim, discourage claims or limit a stockholder’s ability to bring a claim in a judicial forum that it finds favorable for disputes with the Company or our directors, officers or other employees, which may discourage such lawsuits against us or our directors, officers and other employees. Alternatively, if a court were to find the choice of forum provision contained in our charter to be inapplicable or unenforceable in an action, we may incur additional costs associated with resolving such action in other jurisdictions. The exclusive forum provision in our charter will not preclude or contract the scope of exclusive federal or concurrent jurisdiction for actions brought under the federal securities laws including the Exchange Act or the Securities Act or the respective rules and regulations promulgated thereunder.
Any of the above risks could have a material adverse effect on your investment in our Common Stock.common stock.
TAYLOR MORRISON HOME CORPORATION 10-K
35
ITEM 1B | UNRESOLVED STAFF COMMENTS
Cybersecurity Risk Management and Strategy
We maintain a comprehensive cybersecurity program, including policies and procedures designed to protect our systems, operations, and data. We perform risk assessments on a quarterly basis to identify and remediate potential cybersecurity threats and vulnerabilities. In connection with our assessment of potential cybersecurity risks, our Information Technology ("IT") team engages in threat modeling, vulnerability scanning and penetration testing. For each identified risk, our IT team will estimate the likelihood of occurrence and potential impact, which will guide the Company in assessing and prioritizing risks. We have also implemented a process to evaluate and review potential cybersecurity risks arising from our use of third-party vendors. As part of our vendor engagement protocols, we will consider, among other things, each potential vendor’s data backup procedures, incident reporting protocols and data privacy and encryption practices. Once a new vendor is onboarded, we monitor their cybersecurity posture utilizing a third-party cybersecurity ratings provider.
In addition to our internal exercises to test aspects of our cybersecurity program, we engage independent third parties semi-annually to assess the risks associated with our IT resources and information assets. Among other matters, these third parties analyze information on the interactions of users of our information technology resources, including employees, and conduct penetration tests and scanning exercises to assess the performance of our cybersecurity systems and processes. Annually, we examine our cybersecurity program with these third parties, evaluating its effectiveness in part by considering industry standards and established frameworks, such as the National Institute of Standards and Technology ("NIST"), as guidelines. As a mortgage company, we are also associated with the Federal Financial Institutions Examination Council.
For material cybersecurity risks, we’ve developed mitigation plans to reduce the risk’s likelihood of occurrence and/or its expected impact. Such mitigation plans have involved, among other things, implementing additional technology controls or policies, increased training for company personnel or obtaining additional insurance for the identified risk. Our IT team monitors material risks over time and updates the Company’s mitigation plans as appropriate. IT also regularly reports to the leadership team on the status of material risks, mitigation plans and incidents related to such risks.
We also maintain a data breach response plan, which is intended to be aligned with the NIST framework, and which is reviewed annually and conveyed to our team members through our mandatory cybersecurity training. We also retain experienced cybersecurity consultants that can assist us in the event of a serious breach, and maintain a cyber insurance policy.
For a discussion of how risks from cybersecurity threats affect our business, see “Part 1. Item 1A. Risk Factors – Risk Related to our Business – Information technology failures and data security breaches could harm our business” in this Annual Report on Form 10-K.
Cybersecurity Governance
Management is responsible for ongoing assessment and oversight of cybersecurity risks that could significantly impact our operations, finances or reputation. This includes identifying information assets and data systems that are
TAYLOR MORRISON HOME CORPORATION 10-K
36
ITEM 1B THROUGH ITEM 4
critical to business functions, determining the vulnerability of those systems to potential cyberattacks, and developing comprehensive protections and response plans.
To fulfill these responsibilities, management relies on IT and cybersecurity leadership who possess specialized expertise in relevant areas. Our cybersecurity team is led by our Chief Information Officer ("CIO"), who has more than 25 years of experience working in information technology, of which more than 20 have been with Taylor Morrison. With over ten years of experience developing cybersecurity programs, the CIO leads security control implementation, risk and compliance monitoring, security tool management, and incident response planning.
Reporting to the CIO, the Director of Information Security possesses expert knowledge in threat modeling and vulnerability testing methodologies. The Director of Information Security leads efforts to build security into all IT processes and procedures to protect against risks related to data leakage, broken authentication, injection flaws, improper encryption, and attacks on other application vulnerabilities.
Supporting the CIO and Director of Information Security is a team of IT Security professionals who collectively hold the following degrees and certifications: Master’s degree in cybersecurity; Certified Information Systems Security Professional; Certified Ethical Hacker; Security +; Microsoft Certified Professional; Microsoft Certified Solutions Associate; and Microsoft Certified Systems Engineer.
Supported by these skilled leaders, management conducts quarterly cyber risk reviews, maintains a cybersecurity risk register, authorizes risk mitigation budgets and activities, and ensures appropriate resources are devoted to protecting against rapidly evolving cyber threats. The Audit Committee and the Board of Directors are also regularly updated on cybersecurity risk assessments, policy changes, significant incidents, and preparedness levels. This enables management to provide oversight, set risk tolerances, and support a comprehensive cybersecurity program that manages material cyber risks to the organization.
The CIO updates the Board of Directors biannually on the state of the cybersecurity program, which includes a discussion of the most important cybersecurity risks facing the Company, an update on notable cybersecurity incidents and recent threats, and a summary of the results of the Company’s recent independent cybersecurity assessments, among other items. In addition, the Audit Committee of the Board of Directors receives quarterly cybersecurity updates, which include reports on key cybersecurity metrics, cybersecurity headlines, current risks and mitigation strategies.
ITEM 2 | PROPERTIES
We lease office facilities for our homebuilding and financial services operations. We lease our corporate headquarters, which is located in Scottsdale, Arizona. At December 31, 2020,2023, the lease on this facility covered a space of approximately 25,000 square feet and expires in December 2027. We have approximately 4946 other leases for our other division offices and design centers. For information on land owned and controlled by us for use in our homebuilding activities, please refer to Item 1 — Business — 1—Business—Business Strategy and Operations — Land and Development Strategies and Note 4—Real Estate Inventory .in the Notes to the Consolidated financial statements included in this Annual Report.
37
Part II | ||||||||
39 | Item 5. | |||||||
40 | Item 6. | |||||||
41 | Item 7. | Management’s Discussion and Analysis of Financial Condition and Results of Operations | ||||||
61 | Item 7A. | |||||||
62 | Item 8. | |||||||
96 | Item 9. | Changes in and Disagreements With Accountants on Accounting and Financial Disclosure | ||||||
96 | Item 9A. | |||||||
98 | Item 9B. | |||||||
98 | Item 9C. | Disclosure Regarding Foreign Jurisdictions that Prevent Inspections | ||||||
| ||||||||
ITEM 5 | | MARKET FOR REGISTRANT’S COMMON EQUITY, RELATED STOCKHOLDER MATTERS AND ISSUER PURCHASES OF EQUITY SECURITIES |
Stock Performance Graph

|
| 12/31/2018 |
|
| 12/31/2019 |
|
| 12/31/2020 |
|
| 12/31/2021 |
|
| 12/31/2022 |
|
| 12/31/2023 |
| ||||||
TMHC |
| $ | 100.00 |
|
| $ | 137.48 |
|
| $ | 161.32 |
|
| $ | 219.87 |
|
| $ | 190.88 |
|
| $ | 335.53 |
|
S&P 500 |
|
| 100.00 |
|
|
| 128.88 |
|
|
| 149.83 |
|
|
| 190.13 |
|
|
| 153.16 |
|
|
| 190.27 |
|
S&P Homebuilding Index |
|
| 100.00 |
|
|
| 139.94 |
|
|
| 177.24 |
|
|
| 263.78 |
|
|
| 185.49 |
|
|
| 294.16 |
|
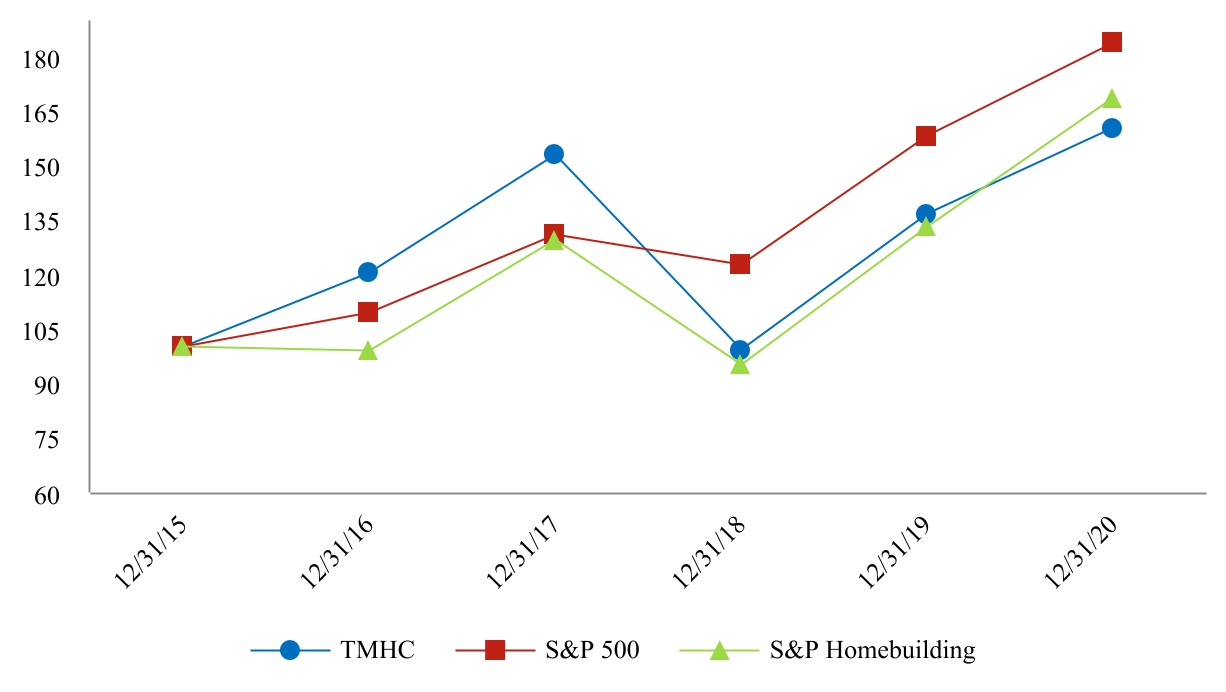
| 12/31/2015 | 12/31/2016 | 12/31/2017 | 12/31/2018 | 12/31/2019 | 12/31/2020 | ||||||||||||||||||||||||||||||
| TMHC | $ | 100.00 | $ | 120.38 | $ | 152.94 | $ | 99.38 | $ | 136.63 | $ | 160.31 | |||||||||||||||||||||||
| S&P 500 | 100.00 | 109.54 | 130.81 | 122.65 | 158.07 | 183.77 | |||||||||||||||||||||||||||||
| S&P Homebuilding Index | 100.00 | 99.03 | 129.49 | 95.14 | 133.15 | 168.64 | |||||||||||||||||||||||||||||
Dividends
We currently anticipate that we will retain all available fundsintend to use our future earnings to develop our business and for use in operationsworking capital needs and general corporate purposes, to fund our growth, to repay debt and possibly to repurchase shares of our common stock, and do not anticipate paying any cash dividends in the foreseeable future. See Item 7 — Management’s Discussion and Analysis of Financial Condition and Results of Operations. TMHC hasWe have not previously declared or paid any cash dividends on our Common Stock.common stock.
| Total number of shares purchased | Average price paid per share | Total number of shares purchased as part of a publicly announced plan or program | Approximate dollar value of shares that may yet be purchased under the plan or program | ||||||||||||||||||||
| (in thousands) | |||||||||||||||||||||||
| October 1 to October 31, 2020 | — | — | — | $ | 9,837 | ||||||||||||||||||
| November 1 to November 30, 2020 | — | — | — | $ | 9,837 | ||||||||||||||||||
December 1 to December 31, 2020(1) | 504,845 | 26.09 | 504,845 | $ | 96,668 | ||||||||||||||||||
| Total | 504,845 | ||||||||||||||||||||||
Period |
| Total number of shares purchased |
|
| Average price paid per share |
|
| Total number of shares purchased as part of publicly announced plans or programs(1) |
|
| Approximate dollar value of shares that may yet be purchased under the plans or programs |
| ||||
|
|
|
|
|
|
|
|
|
|
| (in thousands) |
| ||||
October 1 to October 31, 2023 |
|
| — |
|
|
| — |
|
|
| — |
|
| $ | 175,570 |
|
November 1 to November 30, 2023 |
|
| 397,557 |
|
|
| 43.73 |
|
|
| 397,557 |
|
|
| 158,186 |
|
December 1 to December 31, 2023 |
|
| 138,417 |
|
|
| 50.62 |
|
|
| 138,417 |
|
|
| 494,489 |
|
Total |
|
| 535,974 |
|
|
| 45.51 |
|
|
| 535,974 |
|
| $ | 494,489 |
|
ITEM 6 | [RESERVED]
TAYLOR MORRISON HOME CORPORATION 10-K
40
ITEM 7 | | MANAGEMENT’S DISCUSSION AND ANALYSIS OF FINANCIAL CONDITION AND RESULTS OF OPERATIONS |
ITEM 7 of this Annual Report.
| Year Ended December 31, | |||||||||||||||||||||||||||||
| (Dollars in thousands, except per share amounts) | 2020 | 2019 | 2018 | 2017 | 2016 | ||||||||||||||||||||||||
| Statements of Operations Data: | |||||||||||||||||||||||||||||
| Total revenue | $ | 6,129,320 | $ | 4,762,059 | $ | 4,227,393 | $ | 3,885,290 | $ | 3,550,029 | |||||||||||||||||||
| Gross margin | 1,044,219 | 824,090 | 738,193 | 738,929 | 680,279 | ||||||||||||||||||||||||
Income tax provision (1) | 74,590 | 67,358 | 63,036 | 179,006 | 107,643 | ||||||||||||||||||||||||
| Net income before allocation to non-controlling interests | 249,527 | 254,914 | 210,480 | 176,650 | 206,563 | ||||||||||||||||||||||||
| Net income attributable to non-controlling interests – joint ventures | (6,088) | (262) | (533) | (430) | (1,294) | ||||||||||||||||||||||||
| Net income before non-controlling interests – Former Principal Equityholders | 243,439 | 254,652 | 209,947 | 176,220 | 205,269 | ||||||||||||||||||||||||
| Net income from continuing operations attributable to non-controlling interests – Former Principal Equityholders | — | — | (3,583) | (85,000) | (152,653) | ||||||||||||||||||||||||
| Net income available to Taylor Morrison Home Corporation | $ | 243,439 | $ | 254,652 | $ | 206,364 | $ | 91,220 | $ | 52,616 | |||||||||||||||||||
| Earnings per common share: | |||||||||||||||||||||||||||||
| Basic | $ | 1.90 | $ | 2.38 | $ | 1.85 | $ | 1.47 | $ | 1.69 | |||||||||||||||||||
| Diluted | $ | 1.88 | $ | 2.35 | $ | 1.83 | $ | 1.47 | $ | 1.69 | |||||||||||||||||||
| Weighted average number of shares of common stock: | |||||||||||||||||||||||||||||
| Basic | 127,812 | 106,997 | 111,743 | 62,061 | 31,084 | ||||||||||||||||||||||||
| Diluted | 129,170 | 108,289 | 115,119 | 120,915 | 120,832 | ||||||||||||||||||||||||
| As of December 31, | |||||||||||||||||||||||||||||
| (Dollars in thousands) | 2020 | 2019 | 2018 | 2017 | 2016 | ||||||||||||||||||||||||
| Balance Sheet Data: | |||||||||||||||||||||||||||||
| Cash and cash equivalents | $ | 532,843 | $ | 326,437 | $ | 329,645 | $ | 573,925 | $ | 300,179 | |||||||||||||||||||
| Real estate inventory | 5,332,426 | 3,986,544 | 3,980,565 | 2,959,236 | 3,017,219 | ||||||||||||||||||||||||
| Total assets | 7,737,995 | 5,245,686 | 5,264,441 | 4,325,893 | 4,220,926 | ||||||||||||||||||||||||
| Total debt | 2,928,395 | 1,940,772 | 2,209,596 | 1,498,062 | 1,586,533 | ||||||||||||||||||||||||
| Total stockholders’ equity | 3,593,750 | 2,545,712 | 2,418,735 | 2,346,545 | 2,160,202 | ||||||||||||||||||||||||
| Year Ended December 31, | |||||||||||||||||||||||||||||
| (Dollars in thousands) | 2020 | 2019 | 2018 | 2017 | 2016 | ||||||||||||||||||||||||
| Operating Data: | |||||||||||||||||||||||||||||
| Average active selling communities | 386 | 351 | 307 | 297 | 309 | ||||||||||||||||||||||||
| Net sales orders (units) | 15,068 | 10,517 | 8,400 | 8,397 | 7,504 | ||||||||||||||||||||||||
| Home closings (units) | 12,524 | 9,964 | 8,760 | 8,032 | 7,369 | ||||||||||||||||||||||||
| Average sales price of homes closed | $ | 468 | $ | 464 | $ | 470 | $ | 473 | $ | 465 | |||||||||||||||||||
| Backlog value at end of period | $ | 4,227,446 | $ | 2,274,948 | $ | 2,079,569 | $ | 1,702,071 | $ | 1,531,910 | |||||||||||||||||||
| Backlog units at end of period | 8,403 | 4,711 | 4,158 | 3,496 | 3,131 | ||||||||||||||||||||||||
Our principal business is residential homebuilding and the development of lifestyle communities with operations geographically focused in Arizona, California, Colorado, Florida, Georgia, Nevada, North and South Carolina, Oregon, Texas, and Washington.across 11 states. We serveprovide an assortment of homes across a wide range of price points to appeal to an array of consumer groups from coast to coast, including entry-level, move-up,groups. We design, build and active adult buyers, buildingsell single and multi-family detached and attached homes in traditionally high growth markets for entry level, move-up, and detached homes. Our homebuilding company operatesresort lifestyle buyers. We operate under ourvarious brand names including Taylor Morrison, Darling Homes Collection by Taylor Morrison, and Darling Homes, and our recently acquired William Lyon Signature, brand names.Esplanade. We also have an exclusive partnership with Christopher Todd Communities in oura “Build-to-Rent” business. (Refer to Item 1. Business for additional discussion regarding Build-to-Rent.)homebuilding business which operates under the Yardly brand name. In addition, as part of our acquisition of WLH, we acquired Urban Form Development, LLC (“Urban Form”), which primarily developsdevelop and constructsconstruct multi-use properties consisting of commercial space, retail, and multi-family properties.properties under the Urban Form brand name. We also have operations which provide financial services to customers through our wholly owned mortgage subsidiary, Taylor Morrison Home Funding, INC (“TMHF”),TMHF, title services through our wholly owned title services subsidiary, Inspired Title, Services, LLC (“Inspired Title”), and homeowner’s insurance policies through our insurance agency, Taylor Morrison Insurance Services, LLC (“TMIS”).TMIS. Our business as of December 31, 2020, is organized into multiple homebuilding operating components, and a financial services component, all of which are managed as four reportable segments: East, Central, West and Financial Services, as follows:
East | Atlanta, Charlotte, Jacksonville, Naples, Orlando, Raleigh, Sarasota, and Tampa | |||||||
Central | Austin, Dallas, Denver, and Houston | |||||||
West | Bay Area, Las Vegas, Phoenix, Portland, Sacramento, Seattle, and Southern California | |||||||
Financial Services | Taylor Morrison Home Funding, Inspired Title Services, and Taylor Morrison Insurance Services |
We continuously adjusted pricing across our portfolio based on market conditions to drive sales while also protecting the value of our backlog. Pricing adjustments are utilized in a variety of ways including finance incentives, adjustments to the pricing of lot premiums, and options and upgrades, and in some instances base price increases to slow our net sales orders pace. Interest rates have remained low and ouradjustments. Each community’s buyer profile hasmix of adjustments is dependent on its backlog, inventory, duration, and competitive dynamics.
Our balance sheet remained strong driving demand even further.
TAYLOR MORRISON HOME CORPORATION 10-K
41
ITEM 7 | | MANAGEMENT’S DISCUSSION AND ANALYSIS OF FINANCIAL CONDITION AND RESULTS OF OPERATIONS |
For the year ended December 31, 2019,2023 we paid a $64.7 million legal settlement relating to an existing claim. The charge was recorded to Other expense, net on the Consolidated statement of operations. No similar substantial charges were recorded for the years ended December 31, 2022 and 2021.
For the years ended December 31, 2023, 2022, and 2021, we recognized aggregate costs$4.2 million, $33.2 million, and $7.6 million in pre-acquisition abandonment charges, respectively. These charges are recorded to Other expense, net on the Consolidated statement of $10.7 million relating to our acquisitions of WLH and AV Homes. operations.
For the year ended December 31, 2018,2022, we recognized $30.8a gain of $14.5 million of costs relatingrelated to the AV Homes Acquisition. Such costs are recognizedland transferred to unconsolidated joint ventures. This gain is recorded in Transaction and corporate reorganization expensesOther expense, net on the Consolidated Statementstatements of Operations.
For the years ended December 31, 2023 and 2022, we recognized $10.2 million and $5.8$0.3 million of expense relating to lossesloss on ourextinguishment of debt and a $13.9 million of gain on extinguishment of debt, respectively. For the year ended December 31, 2018,2021, we did not incur a gain or loss on extinguishment of debt.
For the years ended December 31, 20192023, 2022, and December 31, 2018,2021 we recognized an incremental $43.1$17.1 million, $4.8 million, and $39.3$9.6 million in insurance losses relating to Beneva Indemnity Company ("Beneva"), respectively. Such losses are included in Other expense, net on the Consolidated statement of warranty charges in our Central region, respectively, due to a construction defect issue which was isolated to one specific community. Although we believe we have identified substantially all homes impacted by the issue, it is reasonably possible that the estimated liability will change as a result of our evaluation of potential changes in the estimated repair costs and the number of homes impacted.operations.
For the year ended December 31, 2020,2022, we did not incur or recognize incremental warranty chargesrecognized $14.7 million of expense relating to this defect issue.
TAYLOR MORRISON HOME CORPORATION 10-K
42
ITEM 7 | | MANAGEMENT’S DISCUSSION AND ANALYSIS OF FINANCIAL CONDITION AND RESULTS OF OPERATIONS |
Revenue Recognition
Revenue is recognized in accordance with ASCAccounting Standards Codification (“ASC”) Topic 606, Revenue from Contracts with Customers. The standard'sstandard’s core principle requires an entity to recognize revenue when it transfers promised goods or services to customers in an amount that reflects the consideration to which an entity expects to be entitled in exchange for those goods or services.
Under ASC 606, the following steps are applied to determine the proper home closings revenue and land closings revenue recognition: (1) we identify the contract(s) with our customer; (2) we identify the performance obligations in the contract; (3) we determine the transaction price; (4) we allocate the transaction price to the performance obligations in the contract; and (5) we recognize revenue when (or as) we satisfy the performance obligation. For ourobligation(s) are satisfied. Our home sales transactions, we have one contract, with one performance obligation, with each customer to build and deliver a home (or develop and deliver land). Based on the application of the five steps, the following summarizes the timing and manner of home and land sales revenue:
•Revenue from closings of residential real estate is recognized when closings have occurred, the buyer has made the required minimum down payment, obtained necessary financing, the risks and rewards of ownership are transferred to the buyer, and we have no continuing involvement with the property, which is generally upon the close of escrow. Revenue is reported net of any discounts and incentives.
•Revenue from land sales is recognized when a significant down payment is received, title passes and collectability of the receivable, if any, is reasonably assured, and we have no continuing involvement with the property, which is generally upon the close of escrow.
We own and operate certain amenities such as golf courses, club houses, and fitness centers, which require us to provide club members with access to the facilities in exchange for the payment of club dues. We collect club dues and other fees from the club members, which are invoiced on a monthly basis. Revenue from our golf club operations is also included in amenity and other revenue. Amenity and other revenue also includes revenue from the sale of assets which include multi-use properties as part of our Urban Form operations and Build-to-Rent operations.
Mortgage operations and hedging activity related to financial services are not within the scope of Topic 606 and are recognized at the time the related real estate transactions are completed, usually upon the close of escrow. All ofGenerally, the loans TMHF originates are sold to third party investors within a short period of time, on a non-recourse basis. Gains and losses from the sale of mortgages are recognized in accordance with ASC Topic 860-20, Sales of Financial Assets.TMHF generally does not have continuing involvement with the transferred assets; therefore, we derecognize the mortgage loans at time of sale, based on the difference between the selling price and carrying value of the related loans upon sale, recording a gain/loss on
Real Estate Inventory Valuation and Costing
TAYLOR MORRISON HOME CORPORATION 10-K
43
ITEM 7 | | MANAGEMENT’S DISCUSSION AND ANALYSIS OF FINANCIAL CONDITION AND RESULTS OF OPERATIONS |
related direct overhead. Home verticalVertical construction costs are accumulated and charged to costCost of saleshome closings at the time of home closing using the specific identification method. Land acquisition, development, interest, and real estate taxes are allocated to homes and units generally using the relative sales value method. Generally, all overhead costs relating to purchasing,our materials procurement process, the vertical construction, of a home, and construction utilities are considered overhead costs and are allocated on a per unit basis. These costs are capitalized to inventory from the point development begins to the point construction is completed. Changes in estimated costs to be incurred in a community are generally allocated to the remaining lots on a prospective basis. For those communities that have been temporarily closed or development has been discontinued, we do not allocate interest or other costs to the community’s inventory until activity resumes. Such costs are expensed as incurred.
We assess the recoverability of our inventory in accordance with the provisions of ASC Topic 360, Property, Plant, and Equipment. We review our real estate inventory for indicators of impairment on a community-level basis during each reporting period. If indicators of impairment are present for a community, generally, an undiscounted cash flow analysis is generally prepared in order to determine if the carrying value of the assets in that community exceeds the estimated undiscounted cash flows. Generally, if the carrying value of the assets exceeds their estimated undiscounted cash flows, the assets are potentially impaired, requiring a fair value analysis. Our determination of fair value is primarily based on a discounted cash flow model which includes projections and estimates relating to sales prices, construction costs, sales pace, and other factors. However, fair value can be determined through other methods, such as appraisals, contractual purchase offers, and other third party opinions of value. Changes in these expectations may lead to a change in the outcome of our impairment analysis, and actual results may also differ from our assumptions.
In the ordinary course of business, we enter into land purchase agreements with various specific performance agreementssellers to acquire lots.Real estate not owned under these agreements is reflected in Consolidated real estate not owned with a corresponding liability in Liabilities attributable to consolidated real estate not owned in the Consolidated Balance Sheets.balance sheets. As a method of acquiring land in staged takedowns, while limiting risk and minimizing the use of funds from our available cash or other financing sources, we may transfer our right under certain specific performance agreements acquired in the acquisition of WLH to entities owned by third parties (“land banking arrangements”). These entities use equity contributions from their owners and/or incur debt to finance the acquisition and development of the land. We incur interest expense on these arrangements. Interest is based on remaining lots to be purchased and is capitalized for the percentage of lots in each project actively under development, with the remainder expensed and included in Interest (income)/expense,
TAYLOR MORRISON HOME CORPORATION 10-K
44
ITEM 7 | | MANAGEMENT’S DISCUSSION AND ANALYSIS OF FINANCIAL CONDITION AND RESULTS OF OPERATIONS |
net on the Consolidated statement of operations. The entities grant us an option to acquire lots in staged takedowns. In considerationtakedowns in return for this option, we make a non-significant, non-refundable deposit of 15% to 25% of the total purchase price.cash deposit. We are not legally obligated to purchase the balance of the lots, but would forfeit any existing deposits and could be subject to financial and other penalties if the lots wereare not purchased. We do not have an ownership interest in these entities or title to their assets and do not guarantee their liabilities. As such, these entities are not consolidated. These land banking arrangements help us manage the financial and market risk associated with land holdings.
INSURANCE COSTS, SELF-INSURANCE RESERVES AND WARRANTY RESERVES
We have certain deductible limits for each of our policies under our workers’ compensation, automobile, and general liability insurance policies, and we record warranty expense and liabilities for the estimated costs of potential claims for construction defects. The excess liability limits are $50 million per occurrence, aggregated annually and applied in excess of automobile liability, employer’s liability under workers compensation and general liability policies. We also generally require our subcontractors and design professionals to indemnify us and provide evidence of insurance for liabilities arising from their work, subject to certain limitations. We are the parent of Beneva, Indemnity Company (“Beneva”), which provides insurance coverage for construction defects discovered up to ten years following the close of a home, coverage for premise operations risk, and from time to time, property damage. We accrue for the expected costs associated with the deductibles and self-insured amounts under our various insurance policies based on historical claims, estimates for claims incurred but not reported, and potential for recovery of costs from insurance and other sources. The estimates are subject to significant variability due to factors, such as claim settlement patterns, litigation trends, and the extended period of time in which a construction defect claim might be made after the closing of a home.
We offer a one-year limited warranty to cover various defects in workmanship or materials, a two-year limited warranty on certain systems (such as electrical or cooling systems), and a ten-year limited warranty on structural defects. In addition, any outstanding warranties which were offered by our acquired companies are also honored. Warranty reserves are established as homes close in an amount estimated to be adequate to cover expected costs of materials and outside labor during warranty periods. Our warranty is not considered a separate deliverable in the sales arrangement since it is not priced apart from the home; therefore, it is accounted for in accordance with ASC Topic 450, Contingencies,which states that warranties that are not separately priced are generally accounted for by accruing the estimated costs to fulfill the warranty obligation. The amount of revenue related to the product is recognized in full upon the delivery of the home if all other criteria for revenue recognition have been met. As a result, we accrue the estimated costs to fulfill the warranty obligation at the time a home closes, as a component of Cost of home closings on the Consolidated Statementsstatements of Operations.operations.
TAYLOR MORRISON HOME CORPORATION 10-K
45
ITEM 7 | | MANAGEMENT’S DISCUSSION AND ANALYSIS OF FINANCIAL CONDITION AND RESULTS OF OPERATIONS |
We have not made any material changes in Unconsolidated Entitiesour methodology or significant assumptions used to establish our warranty reserves during these periods. In the event of a specific claim such as a construction defect for a community, we adjust our reserves accordingly, taking into consideration items such as the number of homes affected, the costs associated with each repair and Variable Interest Entities (VIEs)
We are involved in joint ventures with related and unrelatedindependent third parties for real estate development, homebuilding and developmentmortgage lending activities. We use the equity method of accounting for entities over which we exercise significant influence but do not have a controlling interest over the operating and financial policies of the investee. For unconsolidated entities in which we function as the managing member, we have evaluated the rights held by our joint venture partners and determined that they have substantive participating rights that preclude the presumption of control. For these unconsolidated joint ventures, accounted for using the equity method, our share of net earnings or losses is included in equity in incomeNet (income)/loss from unconsolidated entities on the Consolidated statement of unconsolidated entitiesoperations when earned and distributions are credited against its investment in the joint venture when received. These joint ventures are recorded in investmentsour Investment in unconsolidated entities on the Consolidated Balance Sheets.
TAYLOR MORRISON HOME CORPORATION 10-K
46
ITEM 7 | | MANAGEMENT’S DISCUSSION AND ANALYSIS OF FINANCIAL CONDITION AND RESULTS OF OPERATIONS |
earnings in the period when the changes are enacted.
In accordance with ASC Topic 740-10, Income Taxes, we evaluate our deferred tax assets by tax jurisdiction, including the benefit from net operating loss (“NOL”) carryforwards by tax jurisdiction, to determine if a valuation allowance is required. CompaniesWe must assess, using significant judgments, whether a valuation allowance should be established based on the consideration of all available evidence using a “more likely than not” standard with significant weight being given to evidence that can be objectively verified. This assessment considers, among other matters, the nature, frequency and severity of current and cumulative losses, forecasts of future profitability, the length of statutory carryforward periods, experience with operating losses and experience of utilizing tax credit carryforwards and tax planning alternatives. We have not made any material changes in our methodology used to establish our valuation allowance during these periods. If a specific event or transaction were to occur that impacts our valuation allowance, we would reassess the evidence and adjust the allowance accordingly. Although management believes our valuation allowance is reasonable, no assurance can be given that the final tax outcome of these matters will not be different from our current valuation of our deferred tax assets and it is reasonably possible that such differences could be material, resulting in a change in future valuations.
Results of Operations
| Year Ended December 31, | |||||||||||||||||
| (Dollars in thousands, except per share information) | 2020 | 2019 | 2018 | ||||||||||||||
| Statements of Operations Data: | |||||||||||||||||
| Home closings revenue, net | $ | 5,863,652 | $ | 4,623,484 | $ | 4,115,216 | |||||||||||
| Land closings revenue | 65,269 | 27,081 | 39,901 | ||||||||||||||
| Financial services revenue | 155,827 | 92,815 | 67,758 | ||||||||||||||
| Amenity and other revenue | 44,572 | 18,679 | 4,518 | ||||||||||||||
| Total revenue | $ | 6,129,320 | $ | 4,762,059 | $ | 4,227,393 | |||||||||||
| Cost of home closings | 4,887,757 | 3,836,857 | 3,410,853 | ||||||||||||||
| Cost of land closings | 64,432 | 32,871 | 33,458 | ||||||||||||||
| Financial services expenses | 88,910 | 51,086 | 41,469 | ||||||||||||||
| Amenity and other expenses | 44,002 | 17,155 | 3,420 | ||||||||||||||
| Total cost of revenues | $ | 5,085,101 | $ | 3,937,969 | $ | 3,489,200 | |||||||||||
| Gross margin | 1,044,219 | 824,090 | 738,193 | ||||||||||||||
| Sales, commissions and other marketing costs | 377,496 | 320,420 | 278,455 | ||||||||||||||
| General and administrative expenses | 194,879 | 169,851 | 138,488 | ||||||||||||||
| Equity in income of unconsolidated entities | (11,176) | (9,509) | (13,332) | ||||||||||||||
| Interest income, net | (1,606) | (2,673) | (1,639) | ||||||||||||||
| Other expense, net | 23,092 | 7,226 | 11,816 | ||||||||||||||
| Transaction and corporate reorganization expenses | 127,170 | 10,697 | 50,889 | ||||||||||||||
| Loss on extinguishment of debt, net | 10,247 | 5,806 | — | ||||||||||||||
| Income before income taxes | $ | 324,117 | $ | 322,272 | $ | 273,516 | |||||||||||
| Income tax provision | 74,590 | 67,358 | 63,036 | ||||||||||||||
| Net income before allocation to non-controlling interests | $ | 249,527 | $ | 254,914 | $ | 210,480 | |||||||||||
| Net income attributable to non-controlling interests – joint ventures | (6,088) | (262) | (533) | ||||||||||||||
| Net income before non-controlling interests – Former Principal Equityholders | $ | 243,439 | $ | 254,652 | $ | 209,947 | |||||||||||
| Net income attributable to non-controlling interests – Former Principal Equityholders | — | — | (3,583) | ||||||||||||||
| Net income available to Taylor Morrison Home Corporation | $ | 243,439 | $ | 254,652 | $ | 206,364 | |||||||||||
| Home closings gross margin | 16.6 | % | 17.0 | % | 17.1 | % | |||||||||||
| Average sales price per home closed | $ | 468 | $ | 464 | $ | 470 | |||||||||||
| Sales, commissions and other marketing costs as a percentage of home closings revenue, net | 6.4 | % | 6.9 | % | 6.8 | % | |||||||||||
| General and administrative expenses as a percentage of home closings revenue, net | 3.3 | % | 3.7 | % | 3.4 | % | |||||||||||
| Effective income tax rate | 23.0 | % | 20.9 | % | 23.0 | % | |||||||||||
| Earnings per common share - | |||||||||||||||||
| Basic | $ | 1.90 | $ | 2.38 | $ | 1.85 | |||||||||||
| Diluted | $ | 1.88 | $ | 2.35 | $ | 1.83 | |||||||||||
| Year Ended December 31, |
| ||||||||||
(Dollars in thousands, except per share information) |
| 2023 |
|
| 2022 |
|
| 2021 |
| |||
Statements of Operations Data: |
|
|
|
|
|
|
|
|
| |||
Home closings revenue, net |
| $ | 7,158,857 |
|
| $ | 7,889,371 |
|
| $ | 7,171,433 |
|
Land closings revenue |
|
| 60,971 |
|
|
| 81,070 |
|
|
| 99,444 |
|
Financial services revenue |
|
| 160,312 |
|
|
| 135,491 |
|
|
| 164,615 |
|
Amenity and other revenue |
|
| 37,691 |
|
|
| 118,985 |
|
|
| 65,773 |
|
Total revenue |
| $ | 7,417,831 |
|
| $ | 8,224,917 |
|
| $ | 7,501,265 |
|
Cost of home closings |
|
| 5,451,401 |
|
|
| 5,904,458 |
|
|
| 5,713,905 |
|
Cost of land closings |
|
| 55,218 |
|
|
| 63,644 |
|
|
| 83,853 |
|
Financial services expenses |
|
| 93,990 |
|
|
| 83,960 |
|
|
| 101,848 |
|
Amenity and other expenses |
|
| 34,149 |
|
|
| 80,489 |
|
|
| 53,778 |
|
Total cost of revenue |
| $ | 5,634,758 |
|
| $ | 6,132,551 |
|
| $ | 5,953,384 |
|
Gross margin |
|
| 1,783,073 |
|
|
| 2,092,366 |
|
|
| 1,547,881 |
|
Sales, commissions and other marketing costs |
|
| 418,134 |
|
|
| 398,074 |
|
|
| 400,376 |
|
General and administrative expenses |
|
| 280,573 |
|
|
| 245,138 |
|
|
| 267,966 |
|
Net (income)/loss from unconsolidated entities |
|
| (8,757 | ) |
|
| 14,184 |
|
|
| (11,130 | ) |
Interest (income)/expense, net |
|
| (12,577 | ) |
|
| 17,674 |
|
|
| 3,792 |
|
Other expense, net |
|
| 87,567 |
|
|
| 38,497 |
|
|
| 23,769 |
|
Loss/(gain) on extinguishment of debt, net |
|
| 295 |
|
|
| (13,876 | ) |
|
| — |
|
Income before income taxes |
| $ | 1,017,838 |
|
| $ | 1,392,675 |
|
| $ | 863,108 |
|
Income tax provision |
|
| 248,097 |
|
|
| 336,428 |
|
|
| 180,741 |
|
Net income before allocation to non-controlling interests |
| $ | 769,741 |
|
| $ | 1,056,247 |
|
| $ | 682,367 |
|
Net income attributable to non-controlling interests |
|
| (812 | ) |
|
| (3,447 | ) |
|
| (19,341 | ) |
Net income |
| $ | 768,929 |
|
| $ | 1,052,800 |
|
| $ | 663,026 |
|
Home closings gross margin |
|
| 23.9 | % |
|
| 25.2 | % |
|
| 20.3 | % |
Average sales price per home closed |
| $ | 623 |
|
| $ | 624 |
|
| $ | 524 |
|
Sales, commissions and other marketing costs as a percentage of |
|
| 5.9 | % |
|
| 5.1 | % |
|
| 5.6 | % |
General and administrative expenses as a percentage of home |
|
| 3.9 | % |
|
| 3.1 | % |
|
| 3.7 | % |
Effective income tax rate |
|
| 24.4 | % |
|
| 24.2 | % |
|
| 20.9 | % |
Earnings per common share- |
|
|
|
|
|
|
|
| ||||
Basic |
| $ | 7.09 |
|
| $ | 9.16 |
|
| $ | 5.26 |
|
Diluted |
| $ | 6.98 |
|
| $ | 9.06 |
|
| $ | 5.18 |
|
Adjusted net income, adjusted earnings per common share and adjusted income before income taxes and related margin are non-GAAP financial measures that reflect the net income/(loss) available to the Company excluding, to the extent applicable in a given period, the impact of inventory impairment charges, impairment of investment in unconsolidated entities, pre-acquisition abandonment charges, gains/losses on land transfers to joint ventures, extinguishment of debt, net, and legal settlements that the Company deems not to be in the ordinary course of business and in the case of adjusted net income and adjusted earnings per common share, (iv) net homebuilding debtthe tax impact due to capitalization ratio, and (v) adjusted home closings gross margin.
EBITDA and Adjusted EBITDA are non-GAAP financial measures that measure performance by adjusting net income before allocation to non-controlling interests to exclude interest income/(expense)expense/(income), net, amortization of capitalized interest, income taxes, depreciation and amortization (EBITDA), non-cash compensation expense, if any, purchase accounting adjustments relatinginventory impairment charges, impairment of investments in unconsolidated entities, pre-acquisition abandonment charges,
TAYLOR MORRISON HOME CORPORATION 10-K
48
ITEM 7 | | MANAGEMENT’S DISCUSSION AND ANALYSIS OF FINANCIAL CONDITION AND RESULTS OF OPERATIONS |
gains/losses on land transfers to the acquisition of WLH, transaction expenses, loss onjoint ventures, extinguishment of debt, inventory impairment and warranty charges and legal costs relating thereto and the write-off of our Chicago operations, as applicable.Adjusted net income and adjusted earnings per share are non-GAAP financial measuressettlements that reflect the net income available to the Company excludingdeems not to be in the impactordinary course of purchase accounting adjustments relating to the acquisition of WLH, transaction expenses, loss on extinguishment of debt, inventory impairment and warranty charges and legal costs relating thereto, the write-off of our Chicago operations and the tax impact due to such adjustments, as applicable. business.
Net homebuilding debt to capitalization ratio is a non-GAAP financial measure we calculate by dividing (i) total debt, lessplus unamortized debt issuance costs/premiumscost/(premium), net, and less mortgage warehouse borrowings, net of unrestricted cash and cash equivalents, by (ii) total capitalization (the sum of net homebuilding debt and total stockholders’ equity).
Adjusted home closings gross margin is a non-GAAP financial measure based on GAAP home closings gross margin (which is inclusive of capitalized interest), excluding purchase accounting adjustments relatinginventory impairment charges.
Beginning with the fourth quarter of 2023, we are excluding the impact of legal settlements that the Company deems not to be in the ordinary course of business from our calculation of Adjusted Net Income and Adjusted EBITDA, as we believe such legal settlements are not characteristic of our underlying operating performance. The Company believes the exclusion of such amounts is useful to investors as it assists in the comparison of our operational performance across different periods. While all previously reported periods have been conformed to the acquisition of WLH and inventory impairment and warranty charges, as applicable.
Management uses these non-GAAP financial measures to evaluate our performance on a consolidated basis, as well as the performance of our regions, and to set targets for performance-based compensation. We also use the ratio of net homebuilding debt to total capitalization as an indicator of overall leverage and to evaluate our performance against other companies in the homebuilding industry. In the future, we may include additional adjustments in the above-described non-GAAP financial measures to the extent we deem them appropriate and useful to management and investors.
| Adjusted Basic and Diluted Net Income and Earnings per Common Share | |||||||||||||||||
| Year Ended December 31, | |||||||||||||||||
| (Dollars in thousands, except per share data) | 2020 | 2019 | 2018 | ||||||||||||||
| Net income available to TMHC | $ | 243,439 | $ | 254,652 | $ | 206,364 | |||||||||||
| WLH related purchase accounting adjustments | 74,068 | — | — | ||||||||||||||
| Warranty charge | — | 43,133 | 39,300 | ||||||||||||||
| Inventory impairment charges | 9,611 | 8,928 | 9,600 | ||||||||||||||
| Write-off Chicago operations | — | 13,285 | — | ||||||||||||||
| Legal cost relating to warranty charge | — | 6,800 | 1,200 | ||||||||||||||
| Transaction and corporate reorganization expenses | 127,170 | 10,697 | 50,889 | ||||||||||||||
| Loss on extinguishment of debt, net | 10,247 | 5,806 | — | ||||||||||||||
| Tax impact due to significant and unusual items and corporate reorganization expenses | (46,120) | (20,578) | (1,874) | ||||||||||||||
| Adjustments to non-controlling interest - Former Principal Equityholders | — | — | (1,692) | ||||||||||||||
| Adjusted net income - Basic | $ | 418,415 | $ | 322,723 | $ | 303,787 | |||||||||||
| Basic weighted average shares | 127,812 | 106,997 | 111,743 | ||||||||||||||
| Adjusted earnings per common share - Basic | $ | 3.27 | $ | 3.02 | $ | 2.72 | |||||||||||
| Net income available to TMHC | $ | 243,439 | $ | 254,652 | $ | 206,364 | |||||||||||
| Net income attributable to non-controlling interests - Former Principal Equityholders | — | — | 3,583 | ||||||||||||||
| Loss fully attributable to public holding company | — | — | 540 | ||||||||||||||
| Net income - Diluted | 243,439 | 254,652 | 210,487 | ||||||||||||||
| WLH related purchase accounting adjustments | 74,068 | — | — | ||||||||||||||
| Warranty charge | $ | — | $ | 43,133 | $ | 39,300 | |||||||||||
| Inventory impairment charges | 9,611 | 8,928 | 9,600 | ||||||||||||||
| Write-off Chicago operations | — | 13,285 | — | ||||||||||||||
| Legal cost relating to warranty charge | — | 6,800 | 1,200 | ||||||||||||||
| Transaction and corporate reorganization expense | 127,170 | 10,697 | 50,889 | ||||||||||||||
| Loss on extinguishment of debt, net | 10,247 | 5,806 | — | ||||||||||||||
| Tax impact due to significant and unusual items, transaction and corporate reorganization expenses, and loss on extinguishment of debt | (46,120) | (20,578) | (1,874) | ||||||||||||||
| Adjusted net income - Diluted | $ | 418,415 | $ | 322,723 | $ | 309,602 | |||||||||||
| Diluted weighted average shares | 129,170 | 108,289 | 115,119 | ||||||||||||||
| Adjusted earnings per common share - Diluted | $ | 3.24 | $ | 2.98 | $ | 2.69 | |||||||||||
| Adjusted Income Before Income Taxes and Related Margin | ||||||||||||||||||||
| Year Ended December 31, | ||||||||||||||||||||
| (Dollars in thousands) | 2020 | 2019 | 2018 | |||||||||||||||||
| Income before income taxes | $ | 324,117 | $ | 322,272 | $ | 273,516 | ||||||||||||||
WLH related purchase accounting adjustments(1) | 74,068 | — | — | |||||||||||||||||
| Warranty charge | — | 43,133 | 39,300 | |||||||||||||||||
| Inventory impairment charges | 9,611 | 8,928 | 9,600 | |||||||||||||||||
| Write-off Chicago operations | — | 13,285 | — | |||||||||||||||||
| Legal cost relating to warranty charge | — | 6,800 | 1,200 | |||||||||||||||||
Transaction and corporate reorganization expenses(2) | 127,170 | 10,697 | 50,889 | |||||||||||||||||
| Loss on extinguishment of debt, net | 10,247 | 5,806 | — | |||||||||||||||||
| Adjusted income before income taxes | $ | 545,213 | $ | 410,921 | $ | 374,505 | ||||||||||||||
| Total revenues | $ | 6,129,320 | $ | 4,762,059 | $ | 4,227,393 | ||||||||||||||
| Income before income taxes margin | 5.3% | 6.8% | 6.5% | |||||||||||||||||
| Adjusted income before income taxes margin | 8.9% | 8.6% | 8.9% | |||||||||||||||||
| EBITDA and Adjusted EBITDA Reconciliation | ||||||||||||||||||||
| Three Months Ended December 31, | ||||||||||||||||||||
| (Dollars in thousands) | 2020 | 2019 | 2018 | |||||||||||||||||
| Net income before allocation to non-controlling interests | $ | 96,662 | $ | 54,709 | $ | 9,215 | ||||||||||||||
| Interest income, net | (362) | (423) | (350) | |||||||||||||||||
| Amortization of capitalized interest | 28,612 | 30,614 | 26,459 | |||||||||||||||||
| Income tax provision/(benefit) | 22,428 | (949) | 24,913 | |||||||||||||||||
| Depreciation and amortization | 2,042 | 1,436 | 2,089 | |||||||||||||||||
| EBITDA | $ | 149,382 | $ | 85,387 | $ | 62,326 | ||||||||||||||
| Non-cash compensation expense | 4,869 | 3,827 | 4,746 | |||||||||||||||||
| William Lyon Homes related purchase accounting adjustments | 300 | — | ||||||||||||||||||
| Inventory impairment charges | 9,611 | 8,928 | 9,600 | |||||||||||||||||
| Transaction expenses | 17,293 | 4,201 | 50,128 | |||||||||||||||||
| Warranty charge | 43,133 | 36,800 | ||||||||||||||||||
| Write off of Chicago operations | 13,285 | |||||||||||||||||||
| Legal cost relating to warranty charge | 6,800 | 500 | ||||||||||||||||||
| Adjusted EBITDA | $ | 181,455 | $ | 165,561 | $ | 164,100 | ||||||||||||||
| Total revenues | $ | 1,557,502 | $ | 1,466,436 | $ | 1,457,853 | ||||||||||||||
| EBITDA as a percentage of total revenues | 9.6% | 5.8% | 4.3% | |||||||||||||||||
| Adjusted EBITDA as a percentage of total revenues | 11.7% | 11.3% | 11.3% | |||||||||||||||||
December 31, 2020 | |||||
TAYLOR MORRISON HOME CORPORATION 10-K
49
ITEM 7 | | MANAGEMENT’S DISCUSSION AND ANALYSIS OF FINANCIAL CONDITION AND RESULTS OF OPERATIONS |
Adjusted Net Income and Adjusted Earnings Per Share
| Year ended December 31, |
| ||||||
(Dollars in thousands, except per share data) |
| 2023 |
|
| 2022 |
| ||
Net income |
| $ | 768,929 |
|
| $ | 1,052,800 |
|
Legal settlements(1) |
|
| 64,665 |
|
|
| — |
|
Inventory impairments (2) |
|
| 11,791 |
|
|
| 24,870 |
|
Impairment of investment in unconsolidated entities(3) |
|
| - |
|
|
| 14,714 |
|
Pre-acquisition abandonment charges(1) |
|
| 4,235 |
|
|
| 33,240 |
|
Gain on land transfers to joint ventures(1) |
|
| - |
|
|
| (14,508 | ) |
Loss/(gain) on extinguishment of debt, net(4) |
|
| 295 |
|
|
| (13,876 | ) |
Tax impact due to above non-GAAP reconciling items |
|
| (19,737 | ) |
|
| (10,654 | ) |
Adjusted net income |
| $ | 830,178 |
|
| $ | 1,086,586 |
|
Basic weighted average number of shares |
|
| 108,424 |
|
|
| 114,982 |
|
Adjusted earnings per common share - Basic |
| $ | 7.66 |
|
| $ | 9.45 |
|
Diluted weighted average number of shares |
|
| 110,145 |
|
|
| 116,221 |
|
Adjusted earnings per common share - Diluted |
| $ | 7.54 |
|
| $ | 9.35 |
|
Adjusted Income Before Income Taxes and Related Margin
| Year ended December 31, |
| ||||||
(Dollars in thousands) |
| 2023 |
|
| 2022 |
| ||
Income before income taxes |
| $ | 1,017,838 |
|
| $ | 1,392,675 |
|
Legal settlements(1) |
|
| 64,665 |
|
|
| - |
|
Inventory impairments(2) |
|
| 11,791 |
|
|
| 24,870 |
|
Impairment of investment in unconsolidated entities(3) |
|
| - |
|
|
| 14,714 |
|
Pre-acquisition abandonment charges(1) |
|
| 4,235 |
|
|
| 33,240 |
|
Gain on land transfers to joint ventures(1) |
|
| - |
|
|
| (14,508 | ) |
Loss/(gain) on extinguishment of debt, net(4) |
|
| 295 |
|
|
| (13,876 | ) |
Adjusted income before income taxes |
| $ | 1,098,824 |
|
| $ | 1,437,115 |
|
Total revenue |
| $ | 7,417,831 |
|
| $ | 8,224,917 |
|
Income before income taxes margin |
|
| 13.7 | % |
|
| 16.9 | % |
Adjusted income before income taxes margin |
|
| 14.8 | % |
|
| 17.5 | % |
Adjusted Home Closings Gross Margin
|
| Year Ended December 31, |
| |||||
(Dollars in thousands) |
| 2023 |
|
| 2022 |
| ||
Home closings revenue |
| $ | 7,158,857 |
|
| $ | 7,889,371 |
|
Cost of home closings |
|
| 5,451,401 |
|
|
| 5,904,458 |
|
Home closings gross margin |
| $ | 1,707,456 |
|
| $ | 1,984,913 |
|
Inventory impairment charges(2) |
|
| 11,791 |
|
|
| 24,870 |
|
Adjusted home closings gross margin |
| $ | 1,719,247 |
|
| $ | 2,009,783 |
|
Home closings gross margin as a percentage of home closings revenue |
|
| 23.9 | % |
|
| 25.2 | % |
Adjusted home closings gross margin as a percentage of home closings revenue |
|
| 24.0 | % |
|
| 25.5 | % |
ITEM 7 | | MANAGEMENT’S DISCUSSION AND ANALYSIS OF FINANCIAL CONDITION AND RESULTS OF OPERATIONS |
EBITDA and Adjusted EBITDA Reconciliation
|
| Twelve Months Ended December 31, |
| |||||
(Dollars in thousands) |
| 2023 |
|
| 2022 |
| ||
Net income before allocation to non-controlling interests |
| $ | 769,741 |
|
| $ | 1,056,247 |
|
Interest (income)/expense, net |
|
| (12,577 | ) |
|
| 17,674 |
|
Amortization of capitalized interest |
|
| 134,870 |
|
|
| 138,460 |
|
Income tax provision |
|
| 248,097 |
|
|
| 336,428 |
|
Depreciation and amortization |
|
| 8,976 |
|
|
| 7,565 |
|
EBITDA |
| $ | 1,149,107 |
|
| $ | 1,556,374 |
|
Legal settlements(1) |
|
| 64,665 |
|
|
| - |
|
Non-cash compensation expense |
|
| 26,095 |
|
|
| 26,901 |
|
Inventory impairments(2) |
|
| 11,791 |
|
|
| 24,870 |
|
Impairment of investment in unconsolidated entities(3) |
|
| — |
|
|
| 14,714 |
|
Pre-acquisition abandonment charges(1) |
|
| 4,235 |
|
|
| 33,240 |
|
Gain on land transfers to joint ventures(1) |
|
| — |
|
|
| (14,508 | ) |
Loss/(gain) on extinguishment of debt, net(4) |
|
| 295 |
|
|
| (13,876 | ) |
Adjusted EBITDA |
| $ | 1,256,188 |
|
| $ | 1,627,715 |
|
Total revenue |
| $ | 7,417,831 |
|
| $ | 8,224,917 |
|
Net income before allocation to non-controlling interests as a percentage of |
|
| 10.4 | % |
|
| 12.8 | % |
EBITDA as a percentage of total revenue |
|
| 15.5 | % |
|
| 18.9 | % |
Adjusted EBITDA as a percentage of total revenue |
|
| 16.9 | % |
|
| 19.8 | % |
Debt to Capitalization Ratios Reconciliation
|
| As of December 31, |
| |||||
(Dollars in thousands) |
| 2023 |
|
| 2022 |
| ||
Total debt |
| $ | 2,017,102 |
|
| $ | 2,483,861 |
|
Plus: unamortized debt issuance cost, net |
|
| 8,375 |
|
|
| 10,767 |
|
Less: mortgage warehouse borrowings |
|
| (153,464 | ) |
|
| (306,072 | ) |
Total homebuilding debt |
| $ | 1,872,013 |
|
| $ | 2,188,556 |
|
Total equity |
|
| 5,332,286 |
|
|
| 4,646,859 |
|
Total capitalization |
| $ | 7,204,299 |
|
| $ | 6,835,415 |
|
Total homebuilding debt to capitalization ratio |
|
| 26.0 | % |
|
| 32.0 | % |
Total homebuilding debt |
| $ | 1,872,013 |
|
| $ | 2,188,556 |
|
Less: cash and cash equivalents |
|
| (798,568 | ) |
|
| (724,488 | ) |
Net homebuilding debt |
| $ | 1,073,445 |
|
| $ | 1,464,068 |
|
Total equity |
|
| 5,332,286 |
|
|
| 4,646,859 |
|
Total capitalization |
| $ | 6,405,731 |
|
| $ | 6,110,927 |
|
Net homebuilding debt to capitalization ratio |
|
| 16.8 | % |
|
| 24.0 | % |
(1) Included in Other expense, net on the Consolidated statement of Contents operations
(3) Included in Net (income)/loss from unconsolidated entities on the Consolidated statement of operations
(4) Included in Loss/(gain) on extinguishment of debt, net on the Consolidated statement of operations
The following tables and related discussion set forth key operating and financial data for our operations as of and for the fiscal years ended December 31, 20202023 and 2019.2022. For similar operating and financial data and discussion of our fiscal 20192022 results compared to our fiscal 20182021 results, refer to Item 7, “Management’s Discussion and Analysis of Financial Condition and Results of Operations” under Part II of our Annual Report on Form 10-K for the fiscal year ended December 31, 2019,2022, which was filed with the SEC on February 19, 2020,22, 2023, and is incorporated herein by reference.
Demand for housing has fluctuated the last several years partially as a result of macro economic conditions relating to inflation, increasing mortgage interest rates, and industry constraints relating to labor and supply shortages. We believe these events had a series of impacts on us including affordability constraints for some consumers and reduced overall consumer confidence which led to an increase in cancellation rates and reduced sales during 2022. To mitigate these impacts we began to adjust pricing, primarily by offering finance incentives, as well as home
TAYLOR MORRISON HOME CORPORATION 10-K
51
ITEM 7 | | MANAGEMENT’S DISCUSSION AND ANALYSIS OF FINANCIAL CONDITION AND RESULTS OF OPERATIONS |
discounts and other pricing reductions during the second half of 2022 which continued into 2023. These pricing adjustments and incentives helped drive an increase in sales orders and a gradual normalization in cancellations beginning in 2023. Operational information related to each period is presented below:
Ending Active Selling Communities
| Year Ended December 31, | |||||||||||||||||
| 2020 | 2019 | Change | |||||||||||||||
| East | 145 | B | 159 | (8.8) | % | ||||||||||||
| Central | 124 | 134 | (7.5) | ||||||||||||||
| West | 117 | 58 | 101.7 | ||||||||||||||
| Total | 386 | 351 | 10.0 | % | |||||||||||||
| Year Ended December 31, |
|
| Change |
| |||||||
|
| 2023 |
|
| 2022 |
|
|
|
| |||
East |
|
| 108 |
|
|
| 106 |
|
|
| 1.9 | % |
Central |
|
| 93 |
|
|
| 104 |
|
|
| (10.6 | )% |
West |
|
| 126 |
|
|
| 114 |
|
|
| 10.5 | % |
Total |
|
| 327 |
|
|
| 324 |
|
|
| 0.9 | % |
Ending active selling communities for the year endedas of December 31, 20202023 increased by 10.0%3 outlets when compared to the same period in the prior year. The increase was primarily attributable to newthe timing of community openings, including master planned communities, from our acquisition of WLH,which were partially offset by scheduled and unscheduled, early community close outs. The unscheduled close outs were the result of our strong sales environment which drove certain communities to sell out ahead of schedule. The legacy WLH operations are primarily in the Western United States which drove the increases in the West region.
Net Sales Orders
| Year Ended December 31, |
| ||||||||||||||||||||||||||||||||||
| Net Sales Orders (1) |
|
| Sales Value (1) |
|
| Average Selling Price |
| ||||||||||||||||||||||||||||
(Dollars in thousands) |
| 2023 |
|
| 2022 |
|
| Change |
|
| 2023 |
|
| 2022 |
|
| Change |
|
| 2023 |
|
| 2022 |
|
| Change |
| |||||||||
East |
|
| 3,968 |
|
|
| 4,128 |
|
|
| (3.9 | )% |
| $ | 2,366,528 |
|
| $ | 2,504,696 |
|
|
| (5.5 | )% |
| $ | 596 |
|
| $ | 607 |
|
|
| (1.8 | )% |
Central |
|
| 2,725 |
|
|
| 2,289 |
|
|
| 19.0 | % |
|
| 1,588,169 |
|
|
| 1,478,528 |
|
|
| 7.4 | % |
|
| 583 |
|
|
| 646 |
|
|
| (9.8 | )% |
West |
|
| 4,137 |
|
|
| 3,070 |
|
|
| 34.8 | % |
|
| 2,784,803 |
|
|
| 2,212,999 |
|
|
| 25.8 | % |
|
| 673 |
|
|
| 721 |
|
|
| (6.7 | )% |
Total |
|
| 10,830 |
|
|
| 9,487 |
|
|
| 14.2 | % |
| $ | 6,739,500 |
|
| $ | 6,196,223 |
|
|
| 8.8 | % |
| $ | 622 |
|
| $ | 653 |
|
|
| (4.7 | )% |
| Year Ended December 31, | |||||||||||||||||||||||||||||||||||||||||||||||||||||
| (Dollars in thousands ) | Net Homes Sold | Sales Value | Average Selling Price | ||||||||||||||||||||||||||||||||||||||||||||||||||
| 2020 | 2019 | Change | 2020 | 2019 | Change | 2020 | 2019 | Change | |||||||||||||||||||||||||||||||||||||||||||||
| East | 5,469 | 4,893 | 11.8 | % | $ | 2,385,530 | $ | 1,979,100 | 20.5 | % | $ | 436 | $ | 404 | 7.9 | % | |||||||||||||||||||||||||||||||||||||
| Central | 3,866 | 3,019 | 28.1 | 1,828,183 | 1,434,406 | 27.5 | 473 | 475 | (0.4) | ||||||||||||||||||||||||||||||||||||||||||||
| West | 5,733 | 2,605 | 120.1 | 3,098,862 | 1,405,357 | 120.5 | 541 | 539 | 0.4 | ||||||||||||||||||||||||||||||||||||||||||||
| Total | 15,068 | 10,517 | 43.3 | % | $ | 7,312,575 | $ | 4,818,863 | 51.7 | % | $ | 485 | $ | 458 | 5.9 | % | |||||||||||||||||||||||||||||||||||||
| Year Ended December 31, | |||||||||||||||||||||||
Cancellation Rate (1) | |||||||||||||||||||||||
| 2020 | 2019 | ||||||||||||||||||||||
| East | 10.8 | % | 11.9 | % | |||||||||||||||||||
| Central | 15.1 | % | 13.2 | % | |||||||||||||||||||
| West | 12.1 | % | 12.9 | % | |||||||||||||||||||
| Total Company | 12.4 | % | 12.5 | % | |||||||||||||||||||
| Cancellation Rate(1) |
| ||||||
| Year Ended December 31, |
| ||||||
| 2023 |
|
| 2022 |
| |||
East |
|
| 8.2 | % |
|
| 8.5 | % |
Central |
|
| 15.3 | % |
|
| 18.5 | % |
West |
|
| 13.4 | % |
|
| 15.9 | % |
Total Company |
|
| 12.1 | % |
|
| 13.5 | % |
TAYLOR MORRISON HOME CORPORATION 10-K
52
ITEM 7 | | MANAGEMENT’S DISCUSSION AND ANALYSIS OF FINANCIAL CONDITION AND RESULTS OF OPERATIONS |
Sales Order Backlog
| As of December 31, | |||||||||||||||||||||||||||||||||||||||||||||||||||||
| (Dollars in thousands) | Sold Homes in Backlog (1) | Sales Value | Average Selling Price | ||||||||||||||||||||||||||||||||||||||||||||||||||
| 2020 | 2019 | Change | 2020 | 2019 | Change | 2020 | 2019 | Change | |||||||||||||||||||||||||||||||||||||||||||||
| East | 2,835 | 1,816 | 56.1 | % | $ | 1,320,436 | C | $ | 791,485 | 66.8 | % | $ | 466 | $ | 436 | 6.9 | % | ||||||||||||||||||||||||||||||||||||
| Central | 2,398 | 1,655 | 44.9 | 1,200,149 | 839,004 | 43.0 | 500 | 507 | (1.4) | ||||||||||||||||||||||||||||||||||||||||||||
| West | 3,170 | 1,240 | 155.6 | 1,706,861 | 644,459 | 164.9 | 538 | 520 | 3.5 | ||||||||||||||||||||||||||||||||||||||||||||
| Total | 8,403 | 4,711 | 78.4 | % | $ | 4,227,446 | $ | 2,274,948 | 85.8 | % | $ | 503 | $ | 483 | 4.1 | % | |||||||||||||||||||||||||||||||||||||
| As of December 31, |
| ||||||||||||||||||||||||||||||||||
| Sold Homes in Backlog (1) |
|
| Sales Value |
|
| Average Selling Price |
| ||||||||||||||||||||||||||||
(Dollars in thousands) |
| 2023 |
|
| 2022 |
|
| Change |
|
| 2023 |
|
| 2022 |
|
| Change |
|
| 2023 |
|
| 2022 |
|
| Change |
| |||||||||
East |
|
| 2,071 |
|
|
| 2,583 |
|
|
| (19.8 | )% |
| $ | 1,480,268 |
|
| $ | 1,733,062 |
|
|
| (14.6 | )% |
| $ | 715 |
|
| $ | 671 |
|
|
| 6.6 | % |
Central |
|
| 1,299 |
|
|
| 1,717 |
|
|
| (24.3 | )% |
|
| 864,162 |
|
|
| 1,211,493 |
|
|
| (28.7 | )% |
|
| 665 |
|
|
| 706 |
|
|
| (5.8 | )% |
West |
|
| 1,919 |
|
|
| 1,654 |
|
|
| 16.0 | % |
|
| 1,300,200 |
|
|
| 1,119,432 |
|
|
| 16.1 | % |
|
| 678 |
|
|
| 677 |
|
|
| 0.1 | % |
Total |
|
| 5,289 |
|
|
| 5,954 |
|
|
| (11.2 | )% |
| $ | 3,644,630 |
|
| $ | 4,063,987 |
|
|
| (10.3 | )% |
| $ | 689 |
|
| $ | 683 |
|
|
| 0.9 | % |
Home Closings Revenue,
| Year Ended December 31, | |||||||||||||||||||||||||||||||||||||||||||||||||||||
| (Dollars in thousands) | Homes Closed | Home Closings Revenue, Net | Average Selling Price | ||||||||||||||||||||||||||||||||||||||||||||||||||
| 2020 | 2019 | Change | 2020 | 2019 | Change | 2020 | 2019 | Change | |||||||||||||||||||||||||||||||||||||||||||||
| East | 4,450 | 4,715 | (5.6) | % | $ | 1,856,580 | $ | 1,912,179 | (2.9) | % | $ | 417 | $ | 406 | 2.7 | % | |||||||||||||||||||||||||||||||||||||
| Central | 3,548 | 2,784 | 27.4 | 1,618,978 | 1,327,197 | 22.0 | 456 | 477 | (4.4) | ||||||||||||||||||||||||||||||||||||||||||||
| West | 4,526 | 2,465 | 83.6 | 2,388,094 | 1,384,108 | 72.5 | 528 | 562 | (6.0) | ||||||||||||||||||||||||||||||||||||||||||||
| Total | 12,524 | 9,964 | 25.7 | % | $ | 5,863,652 | $ | 4,623,484 | 26.8 | % | $ | 468 | $ | 464 | 0.9 | % | |||||||||||||||||||||||||||||||||||||
| Year Ended December 31, |
| ||||||||||||||||||||||||||||||||||
| Homes Closed |
|
| Home Closings Revenue, Net |
|
| Average Selling Price |
| ||||||||||||||||||||||||||||
(Dollars in thousands) |
| 2023 |
|
| 2022 |
|
| Change |
|
| 2023 |
|
| 2022 |
|
| Change |
|
| 2023 |
|
| 2022 |
|
| Change |
| |||||||||
East |
|
| 4,480 |
|
|
| 4,764 |
|
|
| (6.0 | )% |
| $ | 2,619,322 |
|
| $ | 2,673,951 |
|
|
| (2.0 | )% |
| $ | 585 |
|
| $ | 561 |
|
|
| 4.3 | % |
Central |
|
| 3,143 |
|
|
| 3,359 |
|
|
| (6.4 | )% |
|
| 1,935,500 |
|
|
| 2,014,869 |
|
|
| (3.9 | )% |
|
| 616 |
|
|
| 600 |
|
|
| 2.7 | % |
West |
|
| 3,872 |
|
|
| 4,524 |
|
|
| (14.4 | )% |
|
| 2,604,035 |
|
|
| 3,200,551 |
|
|
| (18.6 | )% |
|
| 673 |
|
|
| 707 |
|
|
| (4.8 | )% |
Total |
|
| 11,495 |
|
|
| 12,647 |
|
|
| (9.1 | )% |
| $ | 7,158,857 |
|
| $ | 7,889,371 |
|
|
| (9.3 | )% |
| $ | 623 |
|
| $ | 624 |
|
|
| (0.2 | )% |
| Year Ended December 31, | |||||||||||||||||
| (Dollars in thousands) | 2020 | 2019 | Change | ||||||||||||||
| East | $ | 44,719 | C | $ | 19,884 | $ | 24,835 | ||||||||||
| Central | 14,450 | 7,192 | 7,258 | ||||||||||||||
| West | 6,100 | 5 | 6,095 | ||||||||||||||
| Total | $ | 65,269 | $ | 27,081 | $ | 38,188 | |||||||||||
| Year Ended December 31, |
| ||||||||||
(Dollars in thousands) |
| 2023 |
|
| 2022 |
|
| Change |
| |||
East |
| $ | 32,206 |
|
| $ | 44,305 |
|
| $ | (12,099 | ) |
Central |
|
| 28,765 |
|
|
| 9,861 |
|
|
| 18,904 |
|
West |
|
| — |
|
|
| 26,904 |
|
|
| (26,904 | ) |
Total |
| $ | 60,971 |
|
| $ | 81,070 |
|
| $ | (20,099 | ) |
TAYLOR MORRISON HOME CORPORATION 10-K
53
ITEM 7 | | MANAGEMENT’S DISCUSSION AND ANALYSIS OF FINANCIAL CONDITION AND RESULTS OF OPERATIONS |
as well as the sale of residential lots in our Florida market. Our West segment also had a land sale in our Oregon market for the Central and West regions were due to land sales from lots acquired through the WLH acquisition.
Amenity and Other Revenue
| Year Ended December 31, | |||||||||||||||||
| (Dollars in thousands) | 2020 | 2019 | Change | ||||||||||||||
| East | $ | 17,948 | $ | 18,679 | $ | (731) | |||||||||||
| Central | — | — | — | ||||||||||||||
| West | 1,907 | — | 1,907 | ||||||||||||||
| Corporate | 24,717 | — | 24,717 | ||||||||||||||
| Total | $ | 44,572 | $ | 18,679 | $ | 25,893 | |||||||||||
| Year Ended December 31, |
| ||||||||||
(Dollars in thousands) |
| 2023 |
|
| 2022 |
|
| Change |
| |||
East |
| $ | 23,102 |
|
| $ | 21,503 |
|
| $ | 1,599 |
|
Central |
|
| — |
|
|
| — |
|
|
| — |
|
West |
|
| 1,414 |
|
|
| 1,398 |
|
|
| 16 |
|
Corporate |
|
| 13,175 |
|
|
| 96,084 |
|
|
| (82,909 | ) |
Total |
| $ | 37,691 |
|
| $ | 118,985 |
|
| $ | (81,294 | ) |
| Year Ended December 31, |
| ||||||||||||||||||||||||||||||
| East |
|
| Central |
|
| West |
|
| Consolidated |
| |||||||||||||||||||||
(Dollars in thousands) |
| 2023 |
|
| 2022 |
|
| 2023 |
|
| 2022 |
|
| 2023 |
|
| 2022 |
|
| 2023 |
|
| 2022 |
| ||||||||
Home closings revenue, net |
| $ | 2,619,322 |
|
| $ | 2,673,951 |
|
| $ | 1,935,500 |
|
| $ | 2,014,869 |
|
| $ | 2,604,035 |
|
| $ | 3,200,551 |
|
| $ | 7,158,857 |
|
| $ | 7,889,371 |
|
Cost of home closings |
|
| 1,900,833 |
|
|
| 1,963,177 |
|
|
| 1,443,490 |
|
|
| 1,522,353 |
|
|
| 2,107,078 |
|
|
| 2,418,928 |
|
|
| 5,451,401 |
|
|
| 5,904,458 |
|
Home closings gross margin |
| $ | 718,489 |
|
| $ | 710,774 |
|
| $ | 492,010 |
|
| $ | 492,516 |
|
| $ | 496,957 |
|
| $ | 781,623 |
|
| $ | 1,707,456 |
|
| $ | 1,984,913 |
|
Inventory impairment charges |
| $ | — |
|
| $ | — |
|
| $ | — |
|
| $ | — |
|
| $ | 11,791 |
|
| $ | 24,870 |
|
| $ | 11,791 |
|
| $ | 24,870 |
|
Adjusted home closings gross margin |
| $ | 718,489 |
|
| $ | 710,774 |
|
| $ | 492,010 |
|
| $ | 492,516 |
|
| $ | 508,748 |
|
| $ | 806,493 |
|
| $ | 1,719,247 |
|
| $ | 2,009,783 |
|
Home closings gross margin as a percentage of home closings revenue |
|
| 27.4 | % |
|
| 26.6 | % |
|
| 25.4 | % |
|
| 24.4 | % |
|
| 19.1 | % |
|
| 24.4 | % |
|
| 23.9 | % |
|
| 25.2 | % |
Adjusted home closings gross margin as a percentage of home closings revenue |
|
| 27.4 | % |
|
| 26.6 | % |
|
| 25.4 | % |
|
| 24.4 | % |
|
| 19.5 | % |
|
| 25.2 | % |
|
| 24.0 | % |
|
| 25.5 | % |
| East | Central | West | Total | ||||||||||||||||||||||||||||||||||||||||||||
| For the Year Ended December 31, | |||||||||||||||||||||||||||||||||||||||||||||||
| (Dollars in thousands) | 2020 | 2019 | 2020 | 2019 | 2020 | 2019 | 2020 | 2019 | |||||||||||||||||||||||||||||||||||||||
| Home closings revenue, net | $ | 1,856,580 | $ | 1,912,179 | $ | 1,618,978 | $ | 1,327,197 | $ | 2,388,094 | $ | 1,384,108 | $ | 5,863,652 | $ | 4,623,484 | |||||||||||||||||||||||||||||||
| Cost of home closings | 1,537,677 | 1,597,389 | 1,313,448 | 1,141,866 | 2,036,632 | 1,097,602 | 4,887,757 | 3,836,857 | |||||||||||||||||||||||||||||||||||||||
| Home closings gross margin | $ | 318,903 | $ | 314,790 | $ | 305,530 | $ | 185,331 | $ | 351,462 | $ | 286,506 | $ | 975,895 | $ | 786,627 | |||||||||||||||||||||||||||||||
| Inventory impairment charges | 9,611 | 2,477 | — | 6,907 | — | — | 9,611 | 9,384 | |||||||||||||||||||||||||||||||||||||||
| Warranty charge | — | 213 | — | 43,133 | — | — | — | 43,346 | |||||||||||||||||||||||||||||||||||||||
| WLH Purchase accounting adjustments | — | — | 27,551 | — | 42,166 | — | 69,717 | — | |||||||||||||||||||||||||||||||||||||||
| Adjusted home closings gross margin | $ | 328,514 | $ | 317,480 | $ | 333,081 | $ | 235,371 | $ | 393,628 | $ | 286,506 | $ | 1,055,223 | $ | 839,357 | |||||||||||||||||||||||||||||||
| Home closings gross margin as a percentage of home closings revenue | 17.2 | % | 16.5 | % | 18.9 | % | 14.0 | % | 14.7 | % | 20.7 | % | 16.6 | % | 17.0 | % | |||||||||||||||||||||||||||||||
| Adjusted home closings gross margin as a percentage of home closings revenue | 17.7 | % | 16.6 | % | 20.6 | % | 17.7 | % | 16.5 | % | 20.7 | % | 18.0 | % | 18.2 | % | |||||||||||||||||||||||||||||||
TAYLOR MORRISON HOME CORPORATION 10-K
54
ITEM 7 | | MANAGEMENT’S DISCUSSION AND ANALYSIS OF FINANCIAL CONDITION AND RESULTS OF OPERATIONS |
demand for the year ended December 31, 2020 and 2019, respectively. Adjusted home closings gross margin decreased to 16.5% from 20.7% for the year ended December 31, 2020 and 2019, respectively. The decrease in home closings gross margin and adjusted home closings gross margin were primarily impacted by product and geographical mix within WLH communities which yielded a lower homebuilding gross margin than our legacy TMHC markets. In addition, home closings gross margin for the year ended December 31, 2020 was negatively impacted by 180 basis points as a result of purchase accounting adjustments from the acquisition of WLH in several of the marketsnew homes in the West.
| Year Ended December 31, | |||||||||||||||||
| (In thousands, except the number of loan originations) | 2020 | 2019 | Change | ||||||||||||||
| Financial services revenue | $ | 131,266 | $ | 75,822 | 73.1 | % | |||||||||||
| Title services revenue | 20,216 | 12,896 | 56.8 | % | |||||||||||||
| Financial services revenue - Other | 4,345 | 4,097 | 6.1 | % | |||||||||||||
| Total financial services revenue | 155,827 | 92,815 | 67.9 | % | |||||||||||||
| Financial services equity in income of unconsolidated entities | 10,470 | 6,021 | 73.9 | % | |||||||||||||
| Total income | 166,297 | 98,836 | 68.3 | % | |||||||||||||
| Financial services expenses | 88,910 | 51,086 | 74.0 | % | |||||||||||||
Financial services transaction expenses(1) | 8,970 | — | N/A | ||||||||||||||
| Financial services income before income taxes | $ | 68,417 | $ | 47,750 | 43.3 | % | |||||||||||
| Total originations: | |||||||||||||||||
| Loans | 8,412 | 5,605 | 50.1 | % | |||||||||||||
| Principal | $ | 2,950,302 | $ | 1,930,086 | 52.9 | % | |||||||||||
| Year Ended |
| ||||||||||
(Dollars in thousands) |
| 2023 |
|
| 2022 |
|
| Change |
| |||
Mortgage services revenue |
| $ | 120,337 |
|
| $ | 96,101 |
|
|
| 25.2 | % |
Title services and other revenues |
|
| 39,975 |
|
|
| 39,390 |
|
|
| 1.5 | % |
Total financial services revenue |
|
| 160,312 |
|
|
| 135,491 |
|
|
| 18.3 | % |
Financial services net income from unconsolidated entities |
|
| 9,149 |
|
|
| 5,271 |
|
|
| 73.6 | % |
Total revenue |
|
| 169,461 |
|
|
| 140,762 |
|
|
| 20.4 | % |
Financial services expenses |
|
| 93,990 |
|
|
| 83,960 |
|
|
| 11.9 | % |
Financial services income before income taxes |
| $ | 75,471 |
|
| $ | 56,802 |
|
|
| 32.9 | % |
Total originations: |
|
|
|
|
|
|
|
|
| |||
Number of Loans |
|
| 7,368 |
|
|
| 6,854 |
|
|
| 7.5 | % |
Principal |
| $ | 3,445,247 |
|
| $ | 3,087,465 |
|
|
| 11.6 | % |
Financial services transaction expenses represents the amount of one-time costs relating to the acquisition of WLH which are included in Transaction and corporate reorganization expenses on the Consolidated Statements of Operations.
| Year Ended December 31, | |||||||||||
| 2020 | 2019 | ||||||||||
| Supplemental data: | |||||||||||
| Average FICO score | 751 | 749 | |||||||||
| Funded origination breakdown: | |||||||||||
| Government (FHA, VA, USDA) | 17 | % | 15 | % | |||||||
| Other agency | 79 | % | 73 | % | |||||||
| Total agency | 96 | % | 88 | % | |||||||
| Non-agency | 4 | % | 12 | % | |||||||
| Total funded originations | 100% | 100% | |||||||||
| Year Ended |
| ||||||
| 2023 |
|
| 2022 |
| |||
Supplemental data: |
|
|
|
|
|
| ||
Average FICO score |
|
| 753 |
|
|
| 753 |
|
Funded origination breakdown: |
|
|
|
|
|
| ||
Government (FHA,VA,USDA) |
|
| 22 | % |
|
| 17 | % |
Other agency |
|
| 74 | % |
|
| 77 | % |
Total agency |
|
| 96 | % |
|
| 94 | % |
Non-agency |
|
| 4 | % |
|
| 6 | % |
Total funded originations |
|
| 100 | % |
|
| 100 | % |
Total financial services revenue increased by 67.9%18.3% for the year ended December 31, 2020,2023, compared to the same period in the prior year. The increase in total financial services revenue was due to increased mortgage closings primarily arising from the acquisitiona result of WLH and an increase in success rate.
Net (Income)/Loss from Unconsolidated Entities
55
Interest Income,(Income)/Expense, net
Loss/(Gain) on Extinguishment of Debt, net
We had a loss on extinguishment of debt, net for the year ended December 31, 2020 and 2019 was $23.12023 of $0.3 million, and $7.2 million, respectively. The current year included higher pre-acquisition costsa gain on abandoned land projects. In addition, our estimated development liability for the year ended December 31, 2020, was increased as a resultextinguishment of higher estimated costs to complete.
•Cash generated from operations;
•Borrowings under our Revolving Credit Facility;Facilities;
TAYLOR MORRISON HOME CORPORATION 10-K
56
ITEM 7 | | MANAGEMENT’S DISCUSSION AND ANALYSIS OF FINANCIAL CONDITION AND RESULTS OF OPERATIONS |
•Our various series of Senior Notes;
•Mortgage warehouse facilities;
•Project-level real estate financing (including non-recourse loans, land banking, and joint ventures); and
•Performance, payment and completion surety bonds, and letters of credit.
| As of December 31, | ||||||||||||||
| (Dollars in thousands) | 2020 | 2019 | ||||||||||||
| Total cash, excluding restricted cash | $ | 532,843 | $ | 326,437 | ||||||||||
| Total Revolving Credit Facility | 800,000 | 600,000 | ||||||||||||
| Letters of credit outstanding | (64,274) | (77,719) | ||||||||||||
| Revolving Credit Facility availability | 735,726 | 522,281 | ||||||||||||
| Total liquidity | $ | 1,268,569 | $ | 848,718 | ||||||||||
| As of |
| ||||||
(Dollars in thousands) |
| December 31, 2023 |
|
| December 31, 2022 |
| ||
Cash and cash equivalents |
| $ | 798,568 |
|
| $ | 724,488 |
|
$1 Billion Revolving Credit Facility availability |
|
| 1,000,000 |
|
|
| 1,000,000 |
|
$100 Million Revolving Credit Facility availability |
|
| 100,000 |
|
|
| 100,000 |
|
Letters of credit outstanding |
|
| (61,181 | ) |
|
| (69,249 | ) |
Revolving Credit Facilities availability |
|
| 1,038,819 |
|
|
| 1,030,751 |
|
Total liquidity |
| $ | 1,837,387 |
|
| $ | 1,755,239 |
|
| As of December 31, | |||||||||||
| (Dollars in thousands) | 2020 | 2019 | |||||||||
Letters of credit (1) | $ | 64,274 | $ | 80,440 | |||||||
| Surety bonds | 917,548 | 542,823 | |||||||||
| Total outstanding letters of credit and surety bonds | $ | 981,822 | $ | 623,263 | |||||||
Material Cash Requirements
We have various contractual obligations with commitments to pay third parties, including but not limited to our debt facilities, land purchase and land banking contracts, and leases. These obligations impact our liquidity and capital
TAYLOR MORRISON HOME CORPORATION 10-K
57
ITEM 7 | | MANAGEMENT’S DISCUSSION AND ANALYSIS OF FINANCIAL CONDITION AND RESULTS OF OPERATIONS |
resource needs and are presented in the table below. Our short-term demands are cash requirements for the next twelve months and long-term demands are cash requirements beyond twelve months.
|
| Cash Requirements |
| |||||||||
(Dollars in thousands) |
| Totals |
|
| Short-Term Demands |
|
| Long-Term Demands |
| |||
Lease obligations (1) |
| $ | 331,727 |
|
| $ | 23,983 |
|
| $ | 307,744 |
|
Lot options and land banking arrangements |
|
| 1,503,166 |
|
|
| 392,118 |
|
|
| 1,111,048 |
|
Senior notes |
|
| 1,477,070 |
|
|
| - |
|
|
| 1,477,070 |
|
Other debt outstanding |
|
| 548,407 |
|
|
| 357,962 |
|
|
| 190,445 |
|
Estimated interest expense (2) |
|
| 602,904 |
|
|
| 116,983 |
|
|
| 485,921 |
|
Totals |
| $ | 4,463,274 |
|
| $ | 891,046 |
|
| $ | 3,572,228 |
|
| (Dollars in thousands) | Payments Due by Period | ||||||||||||||||||||||||||||
| Totals | Less than 1 year | 1-3 years | 3-5 years | More than 5 years | |||||||||||||||||||||||||
| Lease obligations | $ | 342,188 | $ | 18,148 | $ | 29,102 | $ | 19,144 | $ | 275,794 | |||||||||||||||||||
| Unrecognized tax benefit obligations including interest and penalties | 2,153 | — | 2,153 | — | — | ||||||||||||||||||||||||
| Land purchase contracts and lot options and land banking arrangements | 760,412 | 409,456 | 275,478 | 63,320 | 12,158 | ||||||||||||||||||||||||
| Senior notes | 2,450,000 | — | 350,000 | 350,000 | 1,750,000 | ||||||||||||||||||||||||
| Other debt outstanding | 476,030 | 284,826 | 150,082 | 22,233 | 18,889 | ||||||||||||||||||||||||
Estimated interest expense (1) | 896,211 | 149,832 | 285,172 | 218,259 | 242,948 | ||||||||||||||||||||||||
| Totals | $ | 4,926,994 | $ | 862,262 | $ | 1,091,987 | $ | 672,956 | $ | 2,299,789 | |||||||||||||||||||
In addition to our contractual obligations, we also have forecasted operational cash outlays on items such as future land purchases or common stock repurchases, to maintain our strategic growth and returns to our investors. Management expects to invest approximately $2.3 billion to $2.5 billion in land acquisition and development during the next twelve months which is consistent with our spend during 2023. As of December 31, 2023 we had approximately $494.5 million remaining on our share repurchase authorization, which expires on December 31, 2025.
Cash Flow Activities
Operating Cash Flow Activities
Our net cash provided by operating activities was $806.2 million(1) for the year ended December 31, 2023 compared to $1.1 billion for the year ended December 31, 2022. The decrease in cash provided by operating activities was primarily attributable to a decrease in net income and an increase in accounts payable, accrued expenses, and other liabilities during fiscal 2023 compared to a decrease in fiscal 2022. In addition, the year ended December 31, 2022 included an asset sale of $42.0 million relating to our Urban Form operations.
Investing Cash Flow Activities
Net cash used in investing activities was $97.2 million for the year ended December 31, 2023 compared to $14.9 million for the year ended December 31, 2022. The increase in cash used in investing activities was primarily due to a net investment of $63.8 million of capital into unconsolidated entities in 2023 compared to a net distribution of $15.7 million of capital from unconsolidated entities in the prior year.
Financing Cash Flow Activities
Net cash used in financing activities was $628.5 million for the year ended December 31, 2023 compared to $1.2 billion for the year ended December 31, 2022. The decrease in cash used in financing activities was primarily due to lower net repayments of our Senior Notes during 2023 compared to the same period in the prior year. In addition, during 2023, we had significantly less repurchases of common stock compared to the prior year.
(1)On our earnings call held on February 14, 2024, we reported preliminary net cash provided by operating activities of approximately $827 million. However, net cash provided by operating activities in this Annual Report on Form 10-K reflects a final reported amount of $806.2 million.
TAYLOR MORRISON HOME CORPORATION 10-K
58
ITEM 7 | | MANAGEMENT’S DISCUSSION AND ANALYSIS OF FINANCIAL CONDITION AND RESULTS OF OPERATIONS |
Debt Instruments
For information regarding our debt instruments, including the terms governing our Senior Notes and our Revolving Credit Facilities, see Note 8—Debt in the Notes to the Consolidated financial statements included in this Annual Report.
Financial Guarantees
The following table summarizes our letters of credit and surety bonds as of the dates indicated:
|
| As of December 31, |
| |||||
(Dollars in thousands) |
| 2023 |
|
| 2022 |
| ||
Letters of credit (1) |
| $ | 61,181 |
|
| $ | 69,249 |
|
Surety bonds |
|
| 1,243,307 |
|
|
| 1,170,105 |
|
Total outstanding letters of credit and surety bonds |
| $ | 1,304,488 |
|
| $ | 1,239,354 |
|
(1) As of December 31, 2023 and 2022, there was $200.0 million total capacity of letters of credit available under our $1 Billion Revolving Credit Facility.
Off-Balance Sheet Arrangements as of December 31, 2020
Investments in Land Development and Homebuilding Joint Ventures or Unconsolidated Entities
We participate in strategic land development and homebuilding joint ventures with related and unrelated third parties. The use ofOur participation with these entities, in some instances, enables us to acquire land to which we could not otherwise obtain access, or
In certain of our unconsolidated joint ventures, wethe joint ventures enter into loan agreements, whereby we or one of our subsidiaries will provide the joint venture lenders with customary guarantees, including completion, indemnity and environmental guarantees subject to usual non-recourse terms.
For the years ended December 31, 2020,2023 and 2022, total cash contributed to unconsolidated joint ventures was $36.1$64.6 million
|
| As of December 31, |
| |||||
(Dollars in thousands) |
| 2023 |
|
| 2022 |
| ||
East |
| $ | 63,628 |
|
| $ | 46,629 |
|
Central |
| $ | 125,610 |
|
|
| 104,070 |
|
West |
| $ | 88,219 |
|
|
| 80,310 |
|
Financial Services / Corporate |
| $ | 68,735 |
|
|
| 51,891 |
|
Total |
| $ | 346,192 |
|
| $ | 282,900 |
|
TAYLOR MORRISON HOME CORPORATION 10-K
59
| As of December 31, | |||||||||||
| (Dollars in thousands) | 2020 | 2019 | |||||||||
| East | $ | — | $ | — | |||||||
| Central | 58,052 | 37,506 | |||||||||
| West | 65,395 | 86,996 | |||||||||
| Financial Services | 4,508 | 4,257 | |||||||||
| Total | $ | 127,955 | $ | 128,759 | |||||||
ITEM 7 | | MANAGEMENT’S DISCUSSION AND ANALYSIS OF FINANCIAL CONDITION AND RESULTS OF OPERATIONS |
We are subject to the usual obligations associated with entering into contracts (including land option contracts and land banking arrangements) for the purchase, development, and sale of real estate in theour routine conduct of our business. We have a number of land purchase option contracts and land banking agreements, generally through cash deposits, for the right to purchase land or lots at a future point in time with predetermined terms. We do not have title to the property and the creditors of the property owner generally have no recourse.recourse to the Company. Our obligations with respect to such contracts are generally limited to the forfeiture of the related non-refundable cash deposits.deposits and/or letters of credit provided to obtain the options. At both December 31, 20202023 and 2019,2022, the aggregate purchase price of these contracts was $760.4 million and $289.7 million, respectively.$1.5 billion.
TAYLOR MORRISON HOME CORPORATION 10-K
60
Interest Rate Risk
Our operations are interest rate sensitive. We monitor our exposure to changes in interest rates and incur both fixed rate and variable rate debt. At December 31, 2020, 95.6%2023, approximately 92% of our debt was fixed rate and 4.4%8% was variable rate. None of our market sensitive instruments were entered into for trading purposes. For fixed rate debt, changes in interest rates generally affect the fair value of the debt instrument, but not our earnings or cash flows. Conversely, for variable rate debt, changes in interest rates generally do not impact the fair value of the debt instrument but may affect our future earnings and cash flows, and may also impact our variable rate borrowing costs, which principally relate to any borrowings under our Revolving Credit FacilityFacilities and to any borrowings by TMHF under its various warehouse facilities. As of December 31, 2020,2023, we had no outstanding borrowings under our Revolving Credit Facility.Facilities. We had $735.7 millionapproximately $1.0 billion of additional availability for borrowings under the Credit Facilities including $135.7$138.8 million of additional availability for letters of credit under our $1 Billion Revolving Credit Facility as of December 31, 20202023 (giving effect to $64.3$61.2 million of letters of credit outstanding as of such date).
LIBOR was historically the primary basis for determining interest payments on borrowings under each of our mortgage warehouse facilities and our Revolving Credit Facilities. IBA no longer publishes the Overnight, 1, 3, 6 and 12 month US Dollar LIBOR. The Alternative Reference Rates Committee, which was convened by the Federal Reserve Board and the New York Federal Reserve, has identified SOFR as the recommended risk-free alternative rate for US Dollar LIBOR. In response to the discontinuation of LIBOR, our warehouse facilities agreements for facilities and our Revolving Credit Facilities have been restructured to begin using SOFR as the basis for determining interest rates. At this time, it is not possible to predict the full effect that the discontinuance of LIBOR, or the establishment of alternative reference rates such as SOFR, will have on us or our borrowing costs. SOFR is a relatively new reference rate and its composition and characteristics are not the same as LIBOR. Given the limited history of this rate and potential volatility as compared to other benchmark or market rates, the future performance of this rate cannot be predicted based on historical performance. The consequences of using SOFR could include an increase in the cost of our variable rate indebtedness.
We are required to offer to purchase all of our outstanding senior unsecured notes, as described in Note 9,8, Debt, at 101% of their aggregate principal amount plus accrued and unpaid interest upon the occurrence of specified change of control events. Other than in those circumstances, we do not have an obligation to prepay fixed rate debt prior to maturity and, as a result, we would not expect interest rate risk and changes in fair value to have a significant impact on our cash flows related to our fixed rate debt until such time as we are required to refinance, repurchase or repay such debt.
| Expected Maturity Date | Fair Value | ||||||||||||||||||||||||||||||||||||||||||||||
| (Dollars in millions, except percentage data) | 2021 | 2022 | 2023 | 2024 | 2025 | Thereafter | Total | ||||||||||||||||||||||||||||||||||||||||
| Fixed Rate Debt | $ | 157.5 | $ | 79.0 | $ | 421.1 | $ | 362.1 | $ | 10.1 | $ | 1,768.9 | $ | 2,798.7 | $ | 3,056.1 | |||||||||||||||||||||||||||||||
Weighted average interest rate (1) | 3.2 | % | 3.2 | % | 5.3 | % | 5.7 | % | 3.2 | % | 5.7 | % | 5.4 | % | — | % | |||||||||||||||||||||||||||||||
Variable rate debt (2) | $ | 127.3 | — | — | — | — | — | $ | 127.3 | $ | 127.3 | ||||||||||||||||||||||||||||||||||||
| Average interest rate | 2.4 | % | — | % | — | % | — | % | — | % | — | % | 2.4 | % | — | % | |||||||||||||||||||||||||||||||
| Expected Maturity Date |
|
|
|
| |||||||||||||||||||||||||||
(In millions, except percentage data) |
| 2024 |
|
| 2025 |
|
| 2026 |
|
| 2027 |
|
| 2028 |
|
| Thereafter |
|
| Total |
|
| Fair |
| ||||||||
Fixed Rate Debt |
| $ | 204.5 |
|
| $ | 103.8 |
|
| $ | 64.9 |
|
| $ | 547.5 |
|
| $ | 451.3 |
|
| $ | 500.1 |
|
| $ | 1,872.1 |
|
| $ | 1,859.2 |
|
Weighted average interest rate(1) |
|
| 2.7 | % |
|
| 2.7 | % |
|
| 2.7 | % |
|
| 5.5 | % |
|
| 5.6 | % |
|
| 5.6 | % |
|
| 5.0 | % |
|
|
| |
Variable Rate Debt(2) |
| $ | 153.5 |
|
| $ | — |
|
| $ | — |
|
| $ | — |
|
| $ | — |
|
| $ | — |
|
| $ | 153.5 |
|
| $ | 153.5 |
|
Weighted average interest rate |
|
| 6.9 | % |
|
| — |
|
|
| — |
|
|
| — |
|
|
| — |
|
|
| — |
|
|
| 6.9 | % |
|
|
| |
TAYLOR MORRISON HOME CORPORATION 10-K
61
Page Number | ||||||
|
| |||||
| 34) | 63 | |||||
65 | ||||||
66 | ||||||
67 | ||||||
68 | ||||||
69 | ||||||
70 | ||||||
Separate combined financial statements of our unconsolidated joint venture investments have been omitted because, if considered in the aggregate, they would not constitute a significant subsidiary as defined by Rule 3-09 of Regulation S-X.
62
REPORT OF INDEPENDENT REGISTERED PUBLIC ACCOUNTING FIRM
To the stockholders and the Board of Directors of Taylor Morrison Home Corporation
We have also audited, in accordance with the standards of the Public Company Accounting Oversight Board (United States) (PCAOB), the Company's internal control over financial reporting as of December 31, 2020,2023, based on criteria established in Internal Control — Integrated Framework (2013) issued by the Committee of Sponsoring Organizations of the Treadway Commission and our report dated February 24, 2021,21, 2024, expressed an unqualified opinion on the Company's internal control over financial reporting.
Basis for Opinion
We conducted our audits in accordance with the standards of the PCAOB. Those standards require that we plan and perform the audit to obtain reasonable assurance about whether the financial statements are free of material misstatement, whether due to error or fraud. Our audits included performing procedures to assess the risks of material misstatement of the financial statements, whether due to error or fraud, and performing procedures that respond to those risks. Such procedures included examining, on a test basis, evidence regarding the amounts and disclosures in the financial statements. Our audits also included evaluating the accounting principles used and significant estimates made by management, as well as evaluating the overall presentation of the financial statements. We believe that our audits provide a reasonable basis for our opinion.
TAYLOR MORRISON HOME CORPORATION 10-K
63
ITEM 8 | FINANCIAL STATEMENTS AND SUPPLEMENTARY DATA
community during each reporting period. If indicators of impairment are present for aan active selling community, management first performs an undiscounted cash flow analysis to determine if a fair value analysis is required to be performed. The Company’s undiscounted cash flow analysis includes projections and estimates relating to sales prices, construction costs, sales pace, and other factors. Changes in these expectations may lead to a change in the outcome of the Company’s impairment analysis, and actual results may also differ from management’s assumptions.
Given the subjectivity in determining whether further impairment analysis is required for aan active selling community, management exercises significant judgment when reviewing the indicators of impairment and the undiscounted cash flow analyses, as applicable. Accordingly, auditing management’s judgments regarding the identification of impairment indicators and the key assumptions used in the undiscounted cash flow analyses involved especially subjective auditor judgment.
We tested the operating effectiveness of controls over management’s impairment indicator analysis, including controls over key inputs into the analysis such as management’s forecast, and controls over management’s review of any undiscounted cash flows analyses for active selling communities identified with impairment indicators.
•
We evaluated the reasonableness of management’s impairment indicator analysis by evaluating management's process for identifying impairment indicators, including thresholds used for investigation, and whether management appropriately considered all potentialkey relevant indicators.
If applicable, we evaluated the reasonableness of the key projections and estimates used in management’s undiscounted cash flow analyses by comparing the assumptions to historical information. For any active selling communities without historical information available, we compared management’s estimates to historical estimates for similar communities, taking into consideration factors such as location, size, and type of community. We also inquired with management regarding trends and changing market conditions that were incorporated into management’s undiscounted cash flow projections in addition to consulting third-party analyst reports and projections that could identify factors that could affect aan active selling community’s recoverability.
Tempe, Arizona
February 24, 2021
64
ITEM 8 | FINANCIAL STATEMENTS AND SUPPLEMENTARY DATA
TAYLOR MORRISON HOME CORPORATION
CONSOLIDATED BALANCE SHEETS
(In thousands, except share amounts)
| December 31, | |||||||||||
| 2020 | 2019 | ||||||||||
| Assets | |||||||||||
| Cash and cash equivalents | $ | 532,843 | $ | 326,437 | |||||||
| Restricted cash | 1,266 | 2,135 | |||||||||
| Total cash, cash equivalents, and restricted cash | 534,109 | 328,572 | |||||||||
| Real estate inventory: | |||||||||||
| Owned inventory | 5,209,653 | 3,967,359 | |||||||||
| Consolidated real estate not owned | 122,773 | 19,185 | |||||||||
| Total real estate inventory | 5,332,426 | 3,986,544 | |||||||||
| Land deposits | 125,625 | 39,810 | |||||||||
| Mortgage loans held for sale | 201,177 | 190,880 | |||||||||
| Derivative assets | 5,294 | 2,099 | |||||||||
| Lease right of use assets | 73,222 | 36,663 | |||||||||
| Prepaid expenses and other assets, net | 242,744 | 86,152 | |||||||||
| Other receivables, net | 96,241 | 70,447 | |||||||||
| Investments in unconsolidated entities | 127,955 | 128,759 | |||||||||
| Deferred tax assets, net | 238,078 | 140,466 | |||||||||
| Property and equipment, net | 97,927 | 85,866 | |||||||||
| Goodwill | 663,197 | 149,428 | |||||||||
| Total assets | $ | 7,737,995 | $ | 5,245,686 | |||||||
| Liabilities | |||||||||||
| Accounts payable | $ | 215,047 | $ | 164,580 | |||||||
| Accrued expenses and other liabilities | 430,067 | 325,368 | |||||||||
| Lease liabilities | 83,240 | 42,317 | |||||||||
| Income taxes payable | 12,841 | 3,719 | |||||||||
| Customer deposits | 311,257 | 167,328 | |||||||||
| Estimated development liability | 40,625 | 36,705 | |||||||||
| Senior notes, net | 2,452,365 | 1,635,008 | |||||||||
| Loans payable and other borrowings | 348,741 | 182,531 | |||||||||
| Revolving credit facility borrowings | 0 | 0 | |||||||||
| Mortgage warehouse borrowings | 127,289 | 123,233 | |||||||||
| Liabilities attributable to consolidated real estate not owned | 122,773 | 19,185 | |||||||||
| Total liabilities | 4,144,245 | 2,699,974 | |||||||||
| COMMITMENTS AND CONTINGENCIES (Note 17) | 0 | 0 | |||||||||
| Stockholders’ Equity | |||||||||||
Common stock, $0.00001 par value, 400,000,000 shares authorized, 155,361,670 and 125,794,719 shares issued, 129,476,914 and 105,851,285 shares outstanding as of December 31, 2020 and December 31, 2019, respectively | 1 | 1 | |||||||||
| Additional paid-in capital | 2,926,773 | 2,097,995 | |||||||||
| Treasury stock at cost, 25,884,756 and 19,943,432 shares as of December 31, 2020 and December 31, 2019, respectively | (446,856) | (343,524) | |||||||||
| Retained Earnings | 1,025,789 | 782,350 | |||||||||
| Accumulated other comprehensive (loss)/income | (1,166) | 884 | |||||||||
| Total stockholders' equity attributable to TMHC | 3,504,541 | 2,537,706 | |||||||||
| Non-controlling interests — joint ventures | 89,209 | 8,006 | |||||||||
| Total stockholders’ equity | 3,593,750 | 2,545,712 | |||||||||
| Total liabilities and stockholders’ equity | $ | 7,737,995 | $ | 5,245,686 | |||||||
|
| December 31, |
| |||||
|
| 2023 |
|
| 2022 |
| ||
Assets |
|
|
|
|
|
| ||
Cash and cash equivalents |
| $ | 798,568 |
|
| $ | 724,488 |
|
Restricted cash |
|
| 8,531 |
|
|
| 2,147 |
|
Total cash |
|
| 807,099 |
|
|
| 726,635 |
|
Real estate inventory: |
|
|
|
|
|
| ||
Owned inventory |
|
| 5,473,828 |
|
|
| 5,346,905 |
|
Consolidated real estate not owned |
|
| 71,618 |
|
|
| 23,971 |
|
Total real estate inventory |
|
| 5,545,446 |
|
|
| 5,370,876 |
|
Land deposits |
|
| 203,217 |
|
|
| 263,356 |
|
Mortgage loans held for sale |
|
| 193,344 |
|
|
| 346,364 |
|
Lease right of use assets |
|
| 75,203 |
|
|
| 90,446 |
|
Prepaid expenses and other assets, net |
|
| 290,925 |
|
|
| 265,392 |
|
Other receivables, net |
|
| 184,518 |
|
|
| 191,504 |
|
Investments in unconsolidated entities |
|
| 346,192 |
|
|
| 282,900 |
|
Deferred tax assets, net |
|
| 67,825 |
|
|
| 67,656 |
|
Property and equipment, net |
|
| 295,121 |
|
|
| 202,398 |
|
Goodwill |
|
| 663,197 |
|
|
| 663,197 |
|
Total assets |
| $ | 8,672,087 |
|
| $ | 8,470,724 |
|
Liabilities |
|
|
|
|
|
| ||
Accounts payable |
| $ | 263,481 |
|
| $ | 269,761 |
|
Accrued expenses and other liabilities |
|
| 549,074 |
|
|
| 490,253 |
|
Lease liabilities |
|
| 84,999 |
|
|
| 100,174 |
|
Customer deposits |
|
| 326,087 |
|
|
| 412,092 |
|
Estimated development liabilities |
|
| 27,440 |
|
|
| 43,753 |
|
Senior notes, net |
|
| 1,468,695 |
|
|
| 1,816,303 |
|
Loans payable and other borrowings |
|
| 394,943 |
|
|
| 361,486 |
|
Revolving credit facility borrowings |
|
| — |
|
|
| — |
|
Mortgage warehouse borrowings |
|
| 153,464 |
|
|
| 306,072 |
|
Liabilities attributable to consolidated real estate not owned |
|
| 71,618 |
|
|
| 23,971 |
|
Total liabilities |
| $ | 3,339,801 |
|
| $ | 3,823,865 |
|
COMMITMENTS AND CONTINGENCIES (Note 14) |
|
|
|
|
|
| ||
Stockholders’ equity |
|
|
|
|
|
| ||
Common stock, $0.00001 par value, 400,000,000 shares authorized, 161,129,515 and 159,392,185 shares issued, 106,917,636 and 107,995,262 shares outstanding as of December 31, 2023 and December 31, 2022, respectively |
| 1 |
|
|
| 1 |
| |
Additional paid-in capital |
|
| 3,068,597 |
|
|
| 3,025,489 |
|
Treasury stock at cost, 54,211,879 and 51,396,923 shares as of December 31, 2023 |
|
| (1,265,097 | ) |
|
| (1,137,138 | ) |
Retained earnings |
|
| 3,510,544 |
|
|
| 2,741,615 |
|
Accumulated other comprehensive income |
|
| 896 |
|
|
| 359 |
|
Total stockholders’ equity attributable to TMHC |
|
| 5,314,941 |
|
|
| 4,630,326 |
|
Non-controlling interests |
|
| 17,345 |
|
|
| 16,533 |
|
Total stockholders’ equity |
|
| 5,332,286 |
|
|
| 4,646,859 |
|
Total liabilities and stockholders’ equity |
| $ | 8,672,087 |
|
| $ | 8,470,724 |
|
See accompanying Notes to the Consolidated Financial Statements
65
ITEM 8 | FINANCIAL STATEMENTS AND SUPPLEMENTARY DATA
TAYLOR MORRISON HOME CORPORATION
CONSOLIDATED STATEMENTS OF OPERATIONS
(In thousands, except per share amounts)
| Year Ended |
| ||||||||||
| 2023 |
|
| 2022 |
|
| 2021 |
| ||||
Home closings revenue, net |
| $ | 7,158,857 |
|
| $ | 7,889,371 |
|
| $ | 7,171,433 |
|
Land closings revenue |
|
| 60,971 |
|
|
| 81,070 |
|
|
| 99,444 |
|
Financial services revenue |
|
| 160,312 |
|
|
| 135,491 |
|
|
| 164,615 |
|
Amenity and other revenue |
|
| 37,691 |
|
|
| 118,985 |
|
|
| 65,773 |
|
Total revenue |
|
| 7,417,831 |
|
|
| 8,224,917 |
|
|
| 7,501,265 |
|
Cost of home closings |
|
| 5,451,401 |
|
|
| 5,904,458 |
|
|
| 5,713,905 |
|
Cost of land closings |
|
| 55,218 |
|
|
| 63,644 |
|
|
| 83,853 |
|
Financial services expenses |
|
| 93,990 |
|
|
| 83,960 |
|
|
| 101,848 |
|
Amenity and other expenses |
|
| 34,149 |
|
|
| 80,489 |
|
|
| 53,778 |
|
Total cost of revenue |
|
| 5,634,758 |
|
|
| 6,132,551 |
|
|
| 5,953,384 |
|
Gross margin |
|
| 1,783,073 |
|
|
| 2,092,366 |
|
|
| 1,547,881 |
|
Sales, commissions and other marketing costs |
|
| 418,134 |
|
|
| 398,074 |
|
|
| 400,376 |
|
General and administrative expenses |
|
| 280,573 |
|
|
| 245,138 |
|
|
| 267,966 |
|
Net (income)/loss from unconsolidated entities |
|
| (8,757 | ) |
|
| 14,184 |
|
|
| (11,130 | ) |
Interest (income)/expense, net |
|
| (12,577 | ) |
|
| 17,674 |
|
|
| 3,792 |
|
Other expense, net |
|
| 87,567 |
|
|
| 38,497 |
|
|
| 23,769 |
|
Loss/(gain) on extinguishment of debt, net |
|
| 295 |
|
|
| (13,876 | ) |
|
| — |
|
Income before income taxes |
|
| 1,017,838 |
|
|
| 1,392,675 |
|
|
| 863,108 |
|
Income tax provision |
|
| 248,097 |
|
|
| 336,428 |
|
|
| 180,741 |
|
Net income before allocation to non-controlling interests |
|
| 769,741 |
|
|
| 1,056,247 |
|
|
| 682,367 |
|
Net income attributable to non-controlling interests |
|
| (812 | ) |
|
| (3,447 | ) |
|
| (19,341 | ) |
Net income |
| $ | 768,929 |
|
| $ | 1,052,800 |
|
| $ | 663,026 |
|
Earnings per common share |
|
|
|
|
|
|
|
|
| |||
Basic |
| $ | 7.09 |
|
| $ | 9.16 |
|
| $ | 5.26 |
|
Diluted |
| $ | 6.98 |
|
| $ | 9.06 |
|
| $ | 5.18 |
|
Weighted average number of shares of common stock: |
|
|
|
|
|
|
|
|
| |||
Basic |
|
| 108,424 |
|
|
| 114,982 |
|
|
| 126,077 |
|
Diluted |
|
| 110,145 |
|
|
| 116,221 |
|
|
| 128,019 |
|
| Year Ended December 31, | |||||||||||||||||
| 2020 | 2019 | 2018 | |||||||||||||||
| Home closings revenue, net | $ | 5,863,652 | $ | 4,623,484 | $ | 4,115,216 | |||||||||||
| Land closings revenue | 65,269 | 27,081 | 39,901 | ||||||||||||||
| Financial services revenue | 155,827 | 92,815 | 67,758 | ||||||||||||||
| Amenity and other revenue | 44,572 | 18,679 | 4,518 | ||||||||||||||
| Total revenue | 6,129,320 | 4,762,059 | 4,227,393 | ||||||||||||||
| Cost of home closings | 4,887,757 | 3,836,857 | 3,410,853 | ||||||||||||||
| Cost of land closings | 64,432 | 32,871 | 33,458 | ||||||||||||||
| Financial services expenses | 88,910 | 51,086 | 41,469 | ||||||||||||||
| Amenity and other expenses | 44,002 | 17,155 | 3,420 | ||||||||||||||
| Total cost of revenues | 5,085,101 | 3,937,969 | 3,489,200 | ||||||||||||||
| Gross margin | 1,044,219 | 824,090 | 738,193 | ||||||||||||||
| Sales, commissions and other marketing costs | 377,496 | 320,420 | 278,455 | ||||||||||||||
| General and administrative expenses | 194,879 | 169,851 | 138,488 | ||||||||||||||
| Equity in income of unconsolidated entities | (11,176) | (9,509) | (13,332) | ||||||||||||||
| Interest income, net | (1,606) | (2,673) | (1,639) | ||||||||||||||
| Other expense, net | 23,092 | 7,226 | 11,816 | ||||||||||||||
| Transaction and corporate reorganization expenses | 127,170 | 10,697 | 50,889 | ||||||||||||||
| Loss on extinguishment of debt, net | 10,247 | 5,806 | 0 | ||||||||||||||
| Income before income taxes | 324,117 | 322,272 | 273,516 | ||||||||||||||
| Income tax provision | 74,590 | 67,358 | 63,036 | ||||||||||||||
| Net income before allocation to non-controlling interests | 249,527 | 254,914 | 210,480 | ||||||||||||||
| Net income attributable to non-controlling interests — joint ventures | (6,088) | (262) | (533) | ||||||||||||||
| Net income before allocation to non-controlling interests — Former Principal Equityholders | 243,439 | 254,652 | 209,947 | ||||||||||||||
| Net income attributable to non-controlling interests — Former Principal Equityholders | 0 | 0 | (3,583) | ||||||||||||||
| Net income available to Taylor Morrison Home Corporation | $ | 243,439 | $ | 254,652 | $ | 206,364 | |||||||||||
| Earnings per common share | |||||||||||||||||
| Basic | $ | 1.90 | $ | 2.38 | $ | 1.85 | |||||||||||
| Diluted | $ | 1.88 | $ | 2.35 | $ | 1.83 | |||||||||||
| Weighted average number of shares of common stock: | |||||||||||||||||
| Basic | 127,812 | 106,997 | 111,743 | ||||||||||||||
| Diluted | 129,170 | 108,289 | 115,119 | ||||||||||||||
66
ITEM 8 | FINANCIAL STATEMENTS AND SUPPLEMENTARY DATA
TAYLOR MORRISON HOME CORPORATION
CONSOLIDATED STATEMENTS OF COMPREHENSIVE INCOME
(In thousands)
| Year Ended December 31, | |||||||||||||||||
| 2020 | 2019 | 2018 | |||||||||||||||
| Income before non-controlling interests, net of tax | $ | 249,527 | $ | 254,914 | $ | 210,480 | |||||||||||
| Post-retirement benefits adjustments, net of tax | (2,050) | (1,117) | (81) | ||||||||||||||
| Comprehensive income | 247,477 | 253,797 | 210,399 | ||||||||||||||
| Comprehensive income attributable to non-controlling interests — joint ventures | (6,088) | (262) | (533) | ||||||||||||||
| Comprehensive income attributable to non-controlling interests — Former Principal Equityholders | 0 | 0 | (3,583) | ||||||||||||||
| Comprehensive income available to Taylor Morrison Home Corporation | $ | 241,389 | $ | 253,535 | $ | 206,283 | |||||||||||
|
| Year Ended December 31, |
| |||||||||
|
| 2023 |
|
| 2022 |
|
| 2021 |
| |||
Income before non-controlling interests, net of tax |
| $ | 769,741 |
|
| $ | 1,056,247 |
|
| $ | 682,367 |
|
Post-retirement benefits adjustments, net of tax |
|
| 537 |
|
|
| (330 | ) |
|
| 1,855 |
|
Comprehensive income |
|
| 770,278 |
|
|
| 1,055,917 |
|
|
| 684,222 |
|
Comprehensive income attributable to non-controlling interests |
|
| (812 | ) |
|
| (3,447 | ) |
|
| (19,341 | ) |
Comprehensive income available to Taylor Morrison Home Corporation |
| $ | 769,466 |
|
| $ | 1,052,470 |
|
| $ | 664,881 |
|
See accompanying Notes to the Consolidated Financial Statements
67
ITEM 8 | FINANCIAL STATEMENTS AND SUPPLEMENTARY DATA
TAYLOR MORRISON HOME CORPORATION
CONSOLIDATED STATEMENTS OF STOCKHOLDERS’ EQUITY
(In thousands, except share data)
| Common Stock | |||||||||||||||||||||||||||||||||||||||||||||||||||||||||||||||||||||||
| Class A | Class B | Additional Paid-in Capital | Treasury Stock | Stockholders' Equity | |||||||||||||||||||||||||||||||||||||||||||||||||||||||||||||||||||
| Shares | Amount | Shares | Amount | Amount | Shares | Amount | Retained Earnings | Accumulated Other Comprehensive (Loss) Income | Non-controlling Interest - Joint Venture | Non-controlling Interests | Total Stockholders’ Equity | ||||||||||||||||||||||||||||||||||||||||||||||||||||||||||||
| Balance — December 31, 2017 | 82,399,996 | $ | 1 | 37,179,616 | $ | 0 | $ | 1,341,873 | 3,049,257 | $ | (47,622) | $ | 319,833 | $ | (17,968) | $ | 1,663 | $ | 748,765 | $ | 2,346,545 | ||||||||||||||||||||||||||||||||||||||||||||||||||
| Cumulative-effect adjustment to retained Earnings related to adoption of ASU No. 2014-09 (see Note 2) | — | — | — | — | — | — | — | 1,501 | — | — | — | 1,501 | |||||||||||||||||||||||||||||||||||||||||||||||||||||||||||
| Net income | — | — | — | — | — | — | — | 206,364 | — | 533 | 3,583 | 210,480 | |||||||||||||||||||||||||||||||||||||||||||||||||||||||||||
| Other comprehensive (loss) income | — | — | — | — | — | — | — | — | (81) | — | — | (81) | |||||||||||||||||||||||||||||||||||||||||||||||||||||||||||
| Exchange of New TMM Units and corresponding number of Class B Common Stock | 20,487 | — | (20,487) | — | 1,293 | — | — | — | — | — | (1,293) | — | |||||||||||||||||||||||||||||||||||||||||||||||||||||||||||
| TMHC repurchase and cancellation of New TMM Units and corresponding Class B Common Stock from Former Principal Equityholders | — | — | (7,588,771) | — | (201,775) | — | — | — | — | — | — | (201,775) | |||||||||||||||||||||||||||||||||||||||||||||||||||||||||||
| Exercise of stock options | 118,992 | — | — | — | 1,887 | — | — | — | — | — | — | 1,887 | |||||||||||||||||||||||||||||||||||||||||||||||||||||||||||
Issuance of restricted stock units, net of shares withheld for tax(1) | 409,681 | — | — | — | (1,572) | — | — | — | — | — | — | (1,572) | |||||||||||||||||||||||||||||||||||||||||||||||||||||||||||
| Exchange of B shares from public offerings | 28,706,924 | — | — | — | 729,954 | — | — | — | — | — | — | 729,954 | |||||||||||||||||||||||||||||||||||||||||||||||||||||||||||
| Repurchase of New TMM Units from Former Principal Equityholders | — | — | (28,706,924) | — | — | — | — | — | — | — | (730,964) | (730,964) | |||||||||||||||||||||||||||||||||||||||||||||||||||||||||||
| Issuance of Class A common stock in connection with business acquisition | 8,951,169 | — | — | — | 158,704 | — | — | — | — | — | — | 158,704 | |||||||||||||||||||||||||||||||||||||||||||||||||||||||||||
| Repurchase of common stock | (8,504,827) | — | — | — | — | 8,504,827 | (138,465) | — | — | — | — | (138,465) | |||||||||||||||||||||||||||||||||||||||||||||||||||||||||||
| Stock based compensation | — | — | — | — | 20,703 | — | — | — | — | — | 421 | 21,124 | |||||||||||||||||||||||||||||||||||||||||||||||||||||||||||
| Changes in non-controlling interest in consolidated joint ventures | — | — | — | — | — | — | — | — | — | 1,347 | — | 1,347 | |||||||||||||||||||||||||||||||||||||||||||||||||||||||||||
| Realized loss on foreign currency translation | — | — | — | — | — | — | — | — | 20,050 | — | — | 20,050 | |||||||||||||||||||||||||||||||||||||||||||||||||||||||||||
| Liquidation of Class B common stock in connection with holding company reorganization | 863,434 | — | (863,434) | — | 20,512 | — | — | — | — | — | (20,512) | — | |||||||||||||||||||||||||||||||||||||||||||||||||||||||||||
| Balance — December 31, 2018 | 112,965,856 | $ | 1 | 0 | $ | 0 | $ | 2,071,579 | 11,554,084 | $ | (186,087) | $ | 527,698 | $ | 2,001 | $ | 3,543 | $ | 0 | $ | 2,418,735 | ||||||||||||||||||||||||||||||||||||||||||||||||||
| Net (loss)/income | — | — | — | — | — | — | — | 254,652 | — | 262 | — | 254,914 | |||||||||||||||||||||||||||||||||||||||||||||||||||||||||||
| Other comprehensive loss | — | — | — | (1,117) | — | (1,117) | |||||||||||||||||||||||||||||||||||||||||||||||||||||||||||||||||
| Exercise of stock options | 765,781 | — | — | — | 13,238 | — | — | — | — | — | — | 13,238 | |||||||||||||||||||||||||||||||||||||||||||||||||||||||||||
Issuance of restricted stock units, net of shares withheld for tax(1) | 508,996 | — | — | — | (1,585) | — | — | — | — | — | — | (1,585) | |||||||||||||||||||||||||||||||||||||||||||||||||||||||||||
| Repurchase of common stock | (8,389,348) | — | — | — | — | 8,389,348 | (157,437) | — | — | — | — | (157,437) | |||||||||||||||||||||||||||||||||||||||||||||||||||||||||||
| Stock compensation expense | — | — | — | — | 14,763 | — | — | — | — | — | — | 14,763 | |||||||||||||||||||||||||||||||||||||||||||||||||||||||||||
| Distributions to non-controlling interests of consolidated joint ventures | — | — | — | — | — | — | — | — | — | 2,196 | — | 2,196 | |||||||||||||||||||||||||||||||||||||||||||||||||||||||||||
| Common Stock |
| Additional Paid-In Capital |
| Treasury Stock |
| Stockholders’ Equity |
| |||||||||||||||||||
(In thousands, except share data) | Shares |
| Amount |
| Amount |
| Shares |
| Amount |
| Retained Earnings |
| Accumulated |
| Non- |
| Total |
| |||||||||
Balance — December 31, 2020 |
| 129,476,914 |
| $ | 1 |
| $ | 2,926,773 |
|
| 25,884,756 |
| $ | (446,856 | ) | $ | 1,025,789 |
| $ | (1,166 | ) | $ | 89,209 |
| $ | 3,593,750 |
|
Net income |
| — |
|
| — |
|
| — |
|
| — |
|
| — |
|
| 663,026 |
|
| — |
|
| 19,341 |
|
| 682,367 |
|
Other comprehensive loss |
| — |
|
| — |
|
| — |
|
| — |
|
| — |
|
| — |
|
| 1,855 |
|
| — |
|
| 1,855 |
|
Exercise of stock options and issuance of restricted stock, net of shares withheld for tax(1) |
| 1,596,333 |
|
| — |
|
| 17,911 |
|
| — |
|
| — |
|
| — |
|
| — |
|
| — |
|
| 17,911 |
|
Warrant exercises |
| 1,704,205 |
|
| — |
|
| 32,584 |
|
| — |
|
| — |
|
| — |
|
| — |
|
| — |
|
| 32,584 |
|
Repurchase of common stock |
| (9,918,104 | ) |
| — |
|
| — |
|
| 9,918,104 |
|
| (281,420 | ) |
| — |
|
| — |
|
| — |
|
| (281,420 | ) |
Common stock surrendered in |
| (1,025,699 | ) |
| — |
|
| — |
|
| 1,025,699 |
|
| (32,587 | ) |
| — |
|
| — |
|
| — |
|
| (32,587 | ) |
Stock compensation expense |
| — |
|
| — |
|
| 19,943 |
|
| — |
|
| — |
|
| — |
|
| — |
|
| — |
|
| 19,943 |
|
Distributions to non-controlling interests |
| — |
|
| — |
|
| — |
|
| — |
|
| — |
|
| — |
|
| — |
|
| (62,734 | ) |
| (62,734 | ) |
Changes in non-controlling interests of | — |
|
| — |
| — |
|
| — |
|
| — |
|
| — |
|
| — |
|
| (687 | ) |
| (687 | ) | ||
Balance — December 31, 2021 |
| 121,833,649 |
| $ | 1 |
| $ | 2,997,211 |
|
| 36,828,559 |
| $ | (760,863 | ) | $ | 1,688,815 |
| $ | 689 |
| $ | 45,129 |
| $ | 3,970,982 |
|
Net income |
| — |
|
| — |
|
| — |
|
| — |
|
| — |
|
| 1,052,800 |
|
| — |
|
| 3,447 |
|
| 1,056,247 |
|
Other comprehensive income |
| — |
|
| — |
|
| — |
|
| — |
|
| — |
|
| — |
|
| (330 | ) |
| — |
|
| (330 | ) |
Exercise of stock options and issuance of restricted stock, net of shares withheld for tax(1) |
| 729,977 |
|
| — |
|
| 1,377 |
|
| — |
|
| — |
|
| — |
|
| — |
|
| — |
|
| 1,377 |
|
Repurchase of common stock |
| (14,568,364 | ) |
| — |
|
| — |
|
| 14,568,364 |
|
| (376,275 | ) |
| — |
|
| — |
|
| — |
|
| (376,275 | ) |
Stock compensation expense |
| — |
|
| — |
|
| 26,901 |
|
| — |
|
| — |
|
| — |
|
| — |
|
| — |
|
| 26,901 |
|
Distributions to non-controlling |
| — |
|
| — |
|
| — |
|
| — |
|
| — |
|
| — |
|
| — |
|
| (31,261 | ) |
| (31,261 | ) |
Changes in non-controlling interests of |
| — |
|
| — |
|
| — |
|
| — |
|
| — |
|
| — |
|
| — |
|
| (782 | ) |
| (782 | ) |
Balance — December 31, 2022 |
| 107,995,262 |
| $ | 1 |
| $ | 3,025,489 |
|
| 51,396,923 |
| $ | (1,137,138 | ) | $ | 2,741,615 |
| $ | 359 |
| $ | 16,533 |
| $ | 4,646,859 |
|
Net income |
| — |
|
| — |
|
| — |
|
| — |
|
| — |
|
| 768,929 |
|
| — |
|
| 812 |
|
| 769,741 |
|
Other comprehensive loss |
| — |
|
| — |
|
| — |
|
| — |
|
| — |
|
| — |
|
| 537 |
|
| — |
|
| 537 |
|
Exercise of stock options and issuance of restricted stock, net of shares withheld for tax(1) |
| 1,737,330 |
|
| — |
|
| 17,013 |
|
| — |
|
| — |
|
| — |
|
| — |
|
| — |
|
| 17,013 |
|
Repurchase of common stock |
| (2,814,956 | ) |
| — |
|
| — |
|
| 2,814,956 |
|
| (127,959 | ) |
| — |
|
| — |
|
| — |
|
| (127,959 | ) |
Stock compensation expense |
| — |
|
| — |
|
| 26,095 |
|
| — |
|
| — |
|
| — |
|
| — |
|
| — |
|
| 26,095 |
|
Balance — December 31, 2023 |
| 106,917,636 |
| $ | 1 |
| $ | 3,068,597 |
|
| 54,211,879 |
| $ | (1,265,097 | ) | $ | 3,510,544 |
| $ | 896 |
| $ | 17,345 |
| $ | 5,332,286 |
|
| Common Stock | |||||||||||||||||||||||||||||||||||||||||||||||||||||||||||||||||||||||
| Class A | Class B | Additional Paid-in Capital | Treasury Stock | Stockholders' Equity | |||||||||||||||||||||||||||||||||||||||||||||||||||||||||||||||||||
| Shares | Amount | Shares | Amount | Amount | Shares | Amount | Retained Earnings | Accumulated Other Comprehensive (Loss) Income | Non-controlling Interest - Joint Venture | Non-controlling Interests | Total Stockholders’ Equity | ||||||||||||||||||||||||||||||||||||||||||||||||||||||||||||
| Changes in non-controlling interests of consolidated joint ventures | — | — | — | — | — | — | — | — | — | 2,005 | — | 2,005 | |||||||||||||||||||||||||||||||||||||||||||||||||||||||||||
| Balance — December 31, 2019 | 105,851,285 | $ | 1 | — | $ | — | $ | 2,097,995 | 19,943,432 | $ | (343,524) | $ | 782,350 | $ | 884 | $ | 8,006 | $ | — | $ | 2,545,712 | ||||||||||||||||||||||||||||||||||||||||||||||||||
| Net (loss)/income | — | — | — | — | — | — | — | 243,439 | — | 6,088 | — | 249,527 | |||||||||||||||||||||||||||||||||||||||||||||||||||||||||||
| Other comprehensive loss | — | — | — | — | — | — | — | — | (2,050) | — | — | (2,050) | |||||||||||||||||||||||||||||||||||||||||||||||||||||||||||
| Exercise of stock options | 551,845 | — | — | — | 9,579 | — | — | — | — | — | — | 9,579 | |||||||||||||||||||||||||||||||||||||||||||||||||||||||||||
Issuance of restricted stock units, net of shares withheld for tax(1) | 687,818 | — | — | — | (9,228) | — | — | — | — | — | — | (9,228) | |||||||||||||||||||||||||||||||||||||||||||||||||||||||||||
| Issuance of equity in connection with business combinations | 28,327,290 | — | — | — | 787,877 | — | — | — | — | — | — | 787,877 | |||||||||||||||||||||||||||||||||||||||||||||||||||||||||||
| Repurchase of common stock | (5,941,324) | — | — | — | — | 5,941,324 | (103,332) | — | — | — | — | (103,332) | |||||||||||||||||||||||||||||||||||||||||||||||||||||||||||
| Stock compensation expense | — | — | — | — | 27,023 | — | — | — | — | — | — | 27,023 | |||||||||||||||||||||||||||||||||||||||||||||||||||||||||||
| Stock compensation expense related to WLH acquisition | — | — | — | — | 5,106 | — | — | — | — | — | — | 5,106 | |||||||||||||||||||||||||||||||||||||||||||||||||||||||||||
| WLH equity award accelerations due to change in control | — | — | — | — | 8,421 | — | — | — | — | — | — | 8,421 | |||||||||||||||||||||||||||||||||||||||||||||||||||||||||||
| Distributions to non-controlling interests of consolidated joint ventures | — | — | — | — | — | — | — | — | — | (46,938) | — | (46,938) | |||||||||||||||||||||||||||||||||||||||||||||||||||||||||||
| Changes in non-controlling interests of consolidated joint ventures | — | — | — | — | — | — | — | — | — | 122,053 | — | 122,053 | |||||||||||||||||||||||||||||||||||||||||||||||||||||||||||
| Balance — December 31, 2020 | 129,476,914 | $ | 1 | — | $ | — | $ | 2,926,773 | 25,884,756 | $ | (446,856) | $ | 1,025,789 | $ | (1,166) | $ | 89,209 | $ | — | $ | 3,593,750 | ||||||||||||||||||||||||||||||||||||||||||||||||||
See accompanying Notes to the Consolidated Financial Statements
68
ITEM 8 | FINANCIAL STATEMENTS AND SUPPLEMENTARY DATA
TAYLOR MORRISON HOME CORPORATION
CONSOLIDATED STATEMENTS OF CASH FLOWS
(In thousands)
| For the Year ended December 31, | |||||||||||||||||||||||
| 2020 | 2019 | 2018 | |||||||||||||||||||||
| CASH FLOWS FROM OPERATING ACTIVITIES: | |||||||||||||||||||||||
| Net income before allocation to non-controlling interests | $ | 249,527 | $ | 254,914 | $ | 210,480 | |||||||||||||||||
| Adjustments to reconcile net income to net cash provided by operating activities: | |||||||||||||||||||||||
| Equity in income of unconsolidated entities | (11,176) | (9,509) | (13,332) | ||||||||||||||||||||
| Stock compensation expense | 32,129 | 14,763 | 21,124 | ||||||||||||||||||||
| Distributions of earnings from unconsolidated entities | 11,564 | 10,473 | 11,845 | ||||||||||||||||||||
| Loss on extinguishment of debt | 10,247 | 5,806 | 0 | ||||||||||||||||||||
| Depreciation and amortization | 37,336 | 31,424 | 26,391 | ||||||||||||||||||||
| Lease expense | 16,785 | 9,087 | 0 | ||||||||||||||||||||
| Debt issuance costs/premium amortization | (1,852) | 1,173 | 2,369 | ||||||||||||||||||||
| Realized loss on foreign currency translation | 0 | 0 | 20,050 | ||||||||||||||||||||
| Contingent consideration | 0 | 0 | 146 | ||||||||||||||||||||
| Deferred income taxes | 50,582 | 2,655 | 44,472 | ||||||||||||||||||||
| Inventory impairment charges | 9,611 | 9,384 | 9,631 | ||||||||||||||||||||
| Land held for sale impairments | 4,347 | — | — | ||||||||||||||||||||
| Chicago assets held for sale valuation adjustments | — | 9,942 | — | ||||||||||||||||||||
| Changes in operating assets and liabilities: | |||||||||||||||||||||||
| Real estate inventory and land deposits | 535,238 | 990 | (248,215) | ||||||||||||||||||||
| Mortgages held for sale, prepaid expenses and other assets | (35,878) | (26,614) | (27,256) | ||||||||||||||||||||
| Customer deposits | 132,446 | 1,896 | 18,773 | ||||||||||||||||||||
| Accounts payable, estimated development liability, and accrued expenses and other liabilities | 62,329 | 73,113 | 63,641 | ||||||||||||||||||||
| Income taxes payable | 20,047 | 3,719 | (4,525) | ||||||||||||||||||||
| Net cash provided by operating activities | 1,123,282 | 393,216 | 135,594 | ||||||||||||||||||||
| CASH FLOWS FROM INVESTING ACTIVITIES: | |||||||||||||||||||||||
| Purchase of property and equipment | (37,760) | (30,118) | (20,458) | ||||||||||||||||||||
| Payments for business acquisitions, net of cash acquired | (279,048) | 0 | (192,886) | ||||||||||||||||||||
| Distributions of capital from unconsolidated entities | 40,062 | 23,584 | 57,002 | ||||||||||||||||||||
| Investments of capital into unconsolidated entities | (36,058) | (12,766) | (3,376) | ||||||||||||||||||||
| Net cash used in investing activities | (312,804) | (19,300) | (159,718) | ||||||||||||||||||||
| CASH FLOWS FROM FINANCING ACTIVITIES: | |||||||||||||||||||||||
| Increase in loans payable and other borrowings | 93,440 | 26,740 | 29,937 | ||||||||||||||||||||
| Repayments of loans payable and other borrowings | (141,103) | (30,383) | (25,319) | ||||||||||||||||||||
| Borrowings on revolving credit facility | 830,000 | 315,000 | 350,000 | ||||||||||||||||||||
| Payments on revolving credit facility | (830,000) | (515,000) | (150,000) | ||||||||||||||||||||
| Borrowings on mortgage warehouse | 2,448,980 | 1,145,799 | 863,109 | ||||||||||||||||||||
| Repayment on mortgage warehouse | (2,489,867) | (1,152,919) | (851,578) | ||||||||||||||||||||
| Proceeds from issuance of senior notes | 500,000 | 950,000 | 0 | ||||||||||||||||||||
| Repayments on senior notes | (861,775) | (963,252) | 0 | ||||||||||||||||||||
| Payment of deferred financing costs | (6,351) | (11,603) | 0 | ||||||||||||||||||||
| Payment of contingent consideration | 0 | 0 | (265) | ||||||||||||||||||||
| Repayment of convertible notes | 0 | 0 | (95,816) | ||||||||||||||||||||
| Proceeds from stock option exercises | 9,579 | 13,238 | 1,887 | ||||||||||||||||||||
| Payment of principle portion of finance lease | (1,325) | 0 | 0 | ||||||||||||||||||||
| Proceeds from issuance of shares from public offerings | 0 | 0 | 767,115 | ||||||||||||||||||||
| TMHC repurchase and cancellation of New TMM Units from Former Principal Equityholders | 0 | 0 | (201,775) | ||||||||||||||||||||
| Repurchase of shares from Former Principal Equityholders | 0 | 0 | (768,125) | ||||||||||||||||||||
| Repurchase of common stock, net | (103,332) | (157,439) | (138,465) | ||||||||||||||||||||
| Payment of taxes related to net share settlement of equity awards | (9,228) | (1,585) | (1,572) | ||||||||||||||||||||
| Year Ended December 31, |
| ||||||||||
| 2023 |
|
| 2022 |
|
| 2021 |
| ||||
Cash Flows from Operating Activities |
|
|
|
|
|
|
|
|
| |||
Net income before allocation to non-controlling interests |
| $ | 769,741 |
|
| $ | 1,056,247 |
|
| $ | 682,367 |
|
Adjustments to reconcile net income to net cash provided by operating activities: |
|
|
|
|
|
|
|
|
| |||
Net (income)/loss from unconsolidated entities |
|
| (8,757 | ) |
|
| 14,184 |
|
|
| (11,130 | ) |
Stock compensation expense |
|
| 26,095 |
|
|
| 26,901 |
|
|
| 19,943 |
|
Loss/(gain) on extinguishment of debt, net |
|
| 295 |
|
|
| (13,876 | ) |
|
| — |
|
Gain on land transfers |
|
| — |
|
|
| (14,508 | ) |
|
| — |
|
Distributions of earnings from unconsolidated entities |
|
| 9,230 |
|
|
| 5,270 |
|
|
| 10,740 |
|
Depreciation and amortization |
|
| 33,406 |
|
|
| 33,839 |
|
|
| 39,980 |
|
Lease expense |
|
| 24,808 |
|
|
| 27,420 |
|
|
| 17,885 |
|
Debt issuance costs amortization |
|
| 3,315 |
|
|
| 2,260 |
|
|
| 539 |
|
Estimated development liability change in estimate |
|
| (14,829 | ) |
|
| — |
|
|
| — |
|
Deferred income taxes |
|
| (169 | ) |
|
| 83,584 |
|
|
| 86,838 |
|
Inventory impairment charges |
|
| 11,791 |
|
|
| 24,870 |
|
|
| — |
|
Change in Urban Form assets due to sale |
|
| — |
|
|
| 42,046 |
|
|
| 20,440 |
|
Land held for sale impairments |
|
| — |
|
|
| — |
|
|
| 4,663 |
|
Changes in operating assets and liabilities: |
|
|
|
|
|
|
|
|
| |||
Real estate inventory and land deposits |
|
| (78,575 | ) |
|
| (50,792 | ) |
|
| (343,127 | ) |
Mortgage loans held for sale, prepaid expenses and other assets |
|
| 31,012 |
|
|
| 5,789 |
|
|
| (511,220 | ) |
Customer deposits |
|
| (86,005 | ) |
|
| (73,613 | ) |
|
| 174,448 |
|
Accounts payable, accrued expenses and other liabilities |
|
| 84,811 |
|
|
| (61,849 | ) |
|
| 197,121 |
|
Income taxes payable |
|
| — |
|
|
| — |
|
|
| (12,841 | ) |
Net cash provided by operating activities |
|
| 806,169 |
|
|
| 1,107,772 |
|
|
| 376,646 |
|
Cash Flows from Investing Activities: |
|
|
|
|
|
|
|
|
| |||
Purchase of property and equipment |
|
| (33,426 | ) |
|
| (30,581 | ) |
|
| (21,199 | ) |
Distributions of capital from unconsolidated entities |
|
| 824 |
|
|
| 125,275 |
|
|
| 31,915 |
|
Investments of capital into unconsolidated entities |
|
| (64,589 | ) |
|
| (109,574 | ) |
|
| (74,976 | ) |
Payments to acquire investments and securities |
|
| — |
|
|
| — |
|
|
| (10,000 | ) |
Net cash used in investing activities |
|
| (97,191 | ) |
|
| (14,880 | ) |
|
| (74,260 | ) |
Cash Flows from Financing Activities |
|
|
|
|
|
|
|
|
| |||
Increase in loans payable and other borrowings |
|
| 7,103 |
|
|
| 38,202 |
|
|
| 130,493 |
|
Repayments on loans payable and other borrowings |
|
| (20,747 | ) |
|
| (71,172 | ) |
|
| (124,786 | ) |
Borrowings on revolving credit facilities |
|
| — |
|
|
| 381,019 |
|
|
| 131,529 |
|
Repayments on revolving credit facilities |
|
| — |
|
|
| (412,548 | ) |
|
| (100,000 | ) |
Borrowings on mortgage warehouse facilities |
|
| 3,007,682 |
|
|
| 2,662,241 |
|
|
| 3,327,954 |
|
Repayments on mortgage warehouse facilities |
|
| (3,160,290 | ) |
|
| (2,770,056 | ) |
|
| (3,041,356 | ) |
Repayments on senior notes |
|
| (350,000 | ) |
|
| (622,780 | ) |
|
| — |
|
Proceeds from stock option exercises and issuance of restricted stock, net |
|
| 17,013 |
|
|
| 1,377 |
|
|
| 17,911 |
|
Payment of principal portion of finance lease |
|
| (1,316 | ) |
|
| (1,344 | ) |
|
| (1,345 | ) |
Repurchase of common stock, net |
|
| (127,959 | ) |
|
| (376,275 | ) |
|
| (281,420 | ) |
Cash and distributions to non-controlling interests of consolidated joint ventures, net |
|
| — |
|
|
| (31,261 | ) |
|
| (59,135 | ) |
Net cash used in financing activities |
|
| (628,514 | ) |
|
| (1,202,597 | ) |
|
| (155 | ) |
Net Increase/Decrease in Cash and Cash Equivalents and Restricted Cash |
| $ | 80,464 |
|
| $ | (109,705 | ) |
| $ | 302,231 |
|
Cash, Cash Equivalents, and Restricted Cash — Beginning of period |
|
| 726,635 |
|
|
| 836,340 |
|
|
| 534,109 |
|
Cash, Cash Equivalents, and Restricted Cash — End of period |
| $ | 807,099 |
|
| $ | 726,635 |
|
| $ | 836,340 |
|
Supplemental Cash Flow Information |
|
|
|
|
|
|
|
|
| |||
Income tax payments |
| $ | (204,274 | ) |
| $ | (270,034 | ) |
| $ | (146,171 | ) |
Supplemental Non-Cash Investing and Financing Activities: |
|
|
|
|
|
|
|
|
| |||
Change in loans payable issued to sellers in connection with land purchase contracts |
| $ | 235,554 |
|
| $ | 231,027 |
|
| $ | 279,646 |
|
Change in inventory not owned |
| $ | 47,647 |
|
| $ | (31,343 | ) |
| $ | (67,459 | ) |
Investments of land in unconsolidated joint ventures, net |
| $ | — |
|
| $ | 146,649 |
|
| $ | — |
|
Impairment in unconsolidated joint ventures |
| $ | — |
|
| $ | (14,714 | ) |
| $ | — |
|
Net non-cash (distributions)/contributions (to)/from unconsolidated entities |
| $ | — |
|
| $ | — |
|
| $ | (3,599 | ) |
Common stock surrendered in connection with warrant exercise |
| $ | — |
|
| $ | — |
|
| $ | 32,587 |
|
Common stock issued in connection with warrant exercise |
| $ | — |
|
| $ | — |
|
| $ | (32,584 | ) |
| (Distributions)/Contributions to non-controlling interests of consolidated joint ventures, net | (8,291) | 4,201 | 1,347 | ||||||||||||||||||||
| Payment to acquire non-controlling interests | (35,668) | 0 | 0 | ||||||||||||||||||||
| Net cash used in financing activities | (604,941) | (377,203) | (219,520) | ||||||||||||||||||||
| NET (DECREASE)/INCREASE IN CASH AND CASH EQUIVALENTS | $ | 205,537 | $ | (3,287) | $ | (243,644) | |||||||||||||||||
| CASH, CASH EQUIVALENTS, AND RESTRICTED CASH — Beginning of period | 328,572 | 331,859 | 575,503 | ||||||||||||||||||||
| CASH, CASH EQUIVALENTS, AND RESTRICTED CASH — End of period | $ | 534,109 | $ | 328,572 | $ | 331,859 | |||||||||||||||||
| SUPPLEMENTAL CASH FLOW INFORMATION: | |||||||||||||||||||||||
| Income taxes paid, net | $ | (3,357) | $ | (20,129) | $ | (63,484) | |||||||||||||||||
| SUPPLEMENTAL NON-CASH INVESTING AND FINANCING ACTIVITIES: | |||||||||||||||||||||||
| Change in loans payable issued to sellers in connection with land purchase contracts | $ | 193,308 | $ | 94,186 | $ | 146,427 | |||||||||||||||||
| Change in inventory not owned | $ | (86,393) | $ | 3,926 | $ | 12,732 | |||||||||||||||||
| Change in Prepaid expenses and other assets, net due to adoption of ASU 2014-09 | $ | 0 | $ | 0 | $ | (32,004) | |||||||||||||||||
| Change in Property and equipment, net due to adoption of ASU 2014-09 | $ | 0 | $ | 0 | $ | 32,004 | |||||||||||||||||
| Change in Operating lease right of use assets due to adoption of ASU 2016-02 | $ | 0 | $ | 27,384 | $ | 0 | |||||||||||||||||
| Change in Operating lease right of use liabilities due to adoption of ASU 2016-02 | $ | 0 | $ | 30,331 | $ | 0 | |||||||||||||||||
| Issuance of common stock in connection with business acquisition | $ | 797,970 | $ | 0 | $ | 158,704 | |||||||||||||||||
| Net non-cash distributions from unconsolidated entities | $ | 5,002 | $ | 0 | $ | 29,510 | |||||||||||||||||
| Non-cash portion of loss on debt extinguishment | $ | 1,723 | $ | 0 | $ | 0 | |||||||||||||||||
69
TAYLOR MORRISON HOME CORPORATION
NOTES TO THE CONSOLIDATED FINANCIAL STATEMENTS
Description of the Business— Taylor Morrison Home Corporation (“TMHC”), through its subsidiaries (together with TMHC referred to herein as “we,” “our,” “the Company” and “us”), owns and operates a residential homebuilding business and is a developer of lifestyle communities.land developer. We operate in the states of Arizona, California, Colorado, Florida, Georgia, Nevada, North and South Carolina, Oregon, Texas, and Washington. Our Company servesWe provide an assortment of homes across a wide range of price points to appeal to an array of consumer groups from coast to coast, including entry-level, move-up,groups. We design, build and active adult. Our homebuilding segments operate under our Taylor Morrison, Darling Homes, and William Lyon Signature brand names. Our business is organized into multiple homebuilding operating components, and a financial services component, all of which are managed as 4 reportable segments: East, Central, West, and Financial Services. The communities in our homebuilding segments generally offersell single and multi-family detached and attached homes in traditionally high growth markets for entry level, move-up, and detached homes.resort- lifestyle buyers. We are the general contractors for all real estate projects and retainengage subcontractors for home construction and land development. Our homebuilding segments operate under various brand names including Taylor Morrison, Darling Homes Collection by Taylor Morrison, and Esplanade. We also have an exclusive partnership with Christopher Todd Communities, a growing Phoenix-based developer of innovative, luxury rental communities to operate a “Build-to-Rent” homebuilding business. We serve as a land acquirer, developer,business which operates under the Yardly brand name. In addition, we develop and homebuilder while Christopher Todd Communities provides community design and property management consultation. As part of our acquisition of William Lyon Homes (“WLH”), discussed below, we also acquired Urban Form Development, LLC (“Urban Form”), which primarily develops and constructsconstruct multi-use properties consisting of commercial space, retail, and multi-family properties. Our Financial Services segment providesproperties under the Urban Form brand. We also have operations which provide financial services to customers through our wholly owned mortgage subsidiary, operating as Taylor Morrison Home Funding, INC (“TMHF”), title services through our wholly owned title services subsidiary, Inspired Title Services, LLC (“Inspired Title”), and homeowner’s insurance policies through our insurance agency, Taylor Morrison Insurance Services, LLC (“TMIS”).
Basis of Presentation and Consolidation— The accompanying Consolidated Financial Statementsfinancial statements have been prepared in accordance with GAAP, include the accounts of TMHC and its consolidated subsidiaries other entities where we have a controlling financial interest, andas well as certain consolidated variable interest entities. Intercompany balances and transactions have been eliminated in consolidation.
| As of the year ended December 31, | |||||||||||
| (Dollars in millions) | 2020 | 2019 | |||||||||
| Weighted average discount rate | 6.1 | % | 5.8 | % | |||||||
| Weighted average remaining lease term (in years) | 5.2 | 6.0 | |||||||||
| Payments on lease liabilities | $16.8 | $9.4 | |||||||||
| Recorded lease expense | $14.8 | $9.1 | |||||||||
| Years Ending December 31, | Lease Payments | ||||
| 2021 | $ | 16,804 | |||
| 2022 | 14,447 | ||||
| 2023 | 11,991 | ||||
| 2024 | 9,409 | ||||
| 2025 | 7,085 | ||||
| Thereafter | 9,484 | ||||
| Total lease payments | $ | 69,220 | |||
| Less: Interest | $ | 9,560 | |||
Present value of lease liabilities(1) | $ | 59,660 | |||
| As of December 31, | |||||||||||
| (Dollars in thousands) | 2020 | 2019 | |||||||||
| Prepaid expenses | $ | 50,368 | $ | 48,674 | |||||||
| Other assets | 68,502 | 33,449 | |||||||||
| Build-to-rent assets | 16,137 | 4,029 | |||||||||
| Urban Form | 107,737 | 0 | |||||||||
| Total prepaid expenses and other assets, net | $ | 242,744 | $ | 86,152 | |||||||
Consolidated EntitiesArrangements — In the ordinary course of business, we enter into land purchase contracts, lot option contracts and land banking arrangements in order to procure land or lots for the construction of homes. Such contracts enable us to control significant lot positions with a minimal initial capital investment and substantially reduce the risksrisk associated with land ownership and development. In accordance with ASC Topic 810, Consolidation, we have concluded that when we enter into these agreements to acquire land or lots and pay a non-refundable deposit, we evaluate if a Variable Interest Entity (“VIE”) may beis created becauseif we are deemed to have provided subordinated financial support that will absorb some or all of an entity’s expected losses if they occur. If we are the primary beneficiary of the VIE, we will consolidate the VIE in our Consolidated Financial Statements and reflect such assets and liabilities as Consolidated real estate not owned within ourand Liabilities attributable to consolidated real estate inventory balancenot owned, respectively, in the Consolidated Balance Sheets.balance sheets.
TAYLOR MORRISON HOME CORPORATION 10-K
70
Unconsolidated Joint Ventures— We use the equity method of accounting for entities over which we exercise significant influence but do not have a controlling interest over the operating and financial policies of the investee. For unconsolidated entities in which we function as the managing member, we have evaluated the rights held by our joint venture partners and determined that theythe partners have substantive participating rights that preclude the presumption of control. Our share of net earnings or losses is included in Equity in incomeNet (income)/loss from unconsolidated entities on the Consolidated statement of unconsolidated entitiesoperations when earned and distributions are credited against our investment in the joint venture when received. Our share of the joint venture profit relating to lots we purchase from the joint ventures is deferred until homes are delivered by us and title passes to a third party. These joint ventures are recorded in InvestmentsInvestment in unconsolidated entities on the Consolidated Balance Sheets.balance sheets when received.
Use of Estimates — The preparation of financial statements in accordance with GAAP requires us to make estimates and assumptions that affect the amounts reported in the Consolidated financial statements and accompanying notes. Significant estimates include real estate development costs to complete, valuation of real estate, valuation of goodwill, valuation of estimated development liabilities, valuation of equity awards, valuation allowance on deferred tax assets and reserves for warranty and self-insured risks. Actual results could differ from those estimates.
Concentration of Credit Risk — Financial instruments that potentially subject us to concentrations of credit risk are primarily cash and cash equivalents and mortgage loans held for sale. Cash and cash equivalents include amounts on deposit with financial institutions in the U.S. that are in excess of the Federal Deposit Insurance Corporation federally insured limits of up to $250,000. Of the different types of mortgage loans held for sale, there was no concentration of mortgage loans with any one borrower for the year ended December 31, 2023. No material losses have been experienced to date.
In addition, the Company is exposed to credit risk to the extent that borrowers may fail to meet their contractual obligations. This risk is mitigated by collateralizing the home sold with a mortgage, and entering into forward commitments to sell our mortgage loans held for sale, generally within 30 days of origination.
Cash and Cash Equivalents — Cash and cash equivalents consist of cash on hand, demand deposits with financial institutions, and investments with original maturities of 90 days or 2018.less. At December 31, 2023, the majority of our cash and cash equivalents were invested in both highly liquid and high-quality money market funds or on deposit with major financial institutions.
Leases — We recognize leases in accordance with ASC Topic 842, Leases. Our operating leases primarily consist of office space, construction trailers, model home leasebacks, and equipment or storage units. Certain of our leases offer the option to renew or to increase rental square footage. The execution of such options are at our discretion and
TAYLOR MORRISON HOME CORPORATION 10-K
71
ITEM 8 | FINANCIAL STATEMENTS AND SUPPLEMENTARY DATA
may result in a lease modification. Operating and finance leases are recorded in Lease right of use asset and Lease liabilities on the Consolidated balance sheets.
A summary of our leases is shown below:
|
| Operating Leases |
|
| Finance Leases |
| ||||||||||||||||||
(Dollars in millions) |
| 2023 |
|
| 2022 |
|
| 2021 |
|
| 2023 |
|
| 2022 |
|
| 2021 |
| ||||||
Weighted average discount rate |
|
| 5.9 | % |
|
| 5.9 | % |
|
| 5.9 | % |
|
| 7.3 | % |
|
| 7.3 | % |
|
| 7.3 | % |
Weighted average remaining lease |
|
| 3.8 |
|
|
| 4.1 |
|
|
| 4.1 |
|
|
| 85.1 |
|
|
| 86.0 |
|
|
| 86.9 |
|
Payments on lease liabilities |
| $ | 28.1 |
|
| $ | 29.2 |
|
| $ | 20.7 |
|
| $ | 1.3 |
|
| $ | 1.3 |
|
| $ | 1.3 |
|
Recorded lease expense |
| $ | 22.8 |
|
| $ | 25.4 |
|
| $ | 15.9 |
|
| $ | 2.0 |
|
| $ | 2.0 |
|
| $ | 2.0 |
|
The future minimum lease payments required under our leases as of December 31, 2023 are as follows (dollars in thousands):
Years Ending December 31, |
| Operating |
|
| Finance |
|
|
| Total |
| |||
2024 |
| $ | 22,674 |
|
| $ | 1,309 |
|
|
| $ | 23,983 |
|
2025 |
|
| 16,741 |
|
|
| 1,300 |
|
|
|
| 18,041 |
|
2026 |
|
| 11,548 |
|
|
| 1,300 |
|
|
|
| 12,848 |
|
2027 |
|
| 8,285 |
|
|
| 1,300 |
|
|
|
| 9,585 |
|
2028 |
|
| 4,275 |
|
|
| 1,300 |
|
|
|
| 5,575 |
|
Thereafter |
|
| 4,309 |
|
|
| 257,386 |
| (1) |
|
| 261,695 |
|
Total lease payments |
| $ | 67,832 |
|
| $ | 263,895 |
|
|
| $ | 331,727 |
|
Less: Interest |
| $ | 7,096 |
|
| $ | 239,632 |
|
|
| $ | 246,728 |
|
Present value of future lease payments |
| $ | 60,737 |
|
| $ | 24,262 |
|
|
| $ | 84,999 |
|
Real Estate Inventory — Inventory consists of raw land, land under development, homes under construction, completed homes, and model homes, all of which are stated at cost. In addition to direct carrying costs, we also capitalize interest, real estate taxes, and related development costs that benefit the entire community, such as field construction supervision and related direct overhead. Home vertical construction costs are accumulated and charged to Cost of home closings at the time of home closing using the specific identification method. Land acquisition, development, interest, and real estate taxes are allocated generally using the relative sales value method. Generally, all overhead costs relating to purchasing, vertical construction, and construction utilities are considered overhead costs and allocated on a per unit basis. These costs are capitalized to inventory from the point development begins to the point construction is completed. Changes in estimated costs to be incurred in a community are generally allocated to the remaining lots on a prospective basis.
The life cycle of a typical community generally ranges from two to five years, commencing with the acquisition of unentitled or entitled land, continuing through the land development phase and concluding with the sale, construction and delivery of homes. Actual community duration will vary based on the size of the community, the sales absorption rate and whether we purchased the property as raw land or as finished lots.
We capitalize qualifying interest costs to inventory during the development and construction periods. Capitalized interest is charged to Cost of home closings when the related inventory is charged to Cost of home closings.
We assess the recoverability of our inventory in accordance with the provisions of ASC Topic 360, Property, Plant, and Equipment. We review our real estate inventory for indicators of impairment on a community-level basis during each reporting period. If indicators of impairment are present for a community, an undiscounted cash flow analysis is generally prepared in order to determine if the carrying value of the assets in that community exceeds the estimated undiscounted cash flows. Generally, if the carrying value of the assets exceeds their estimated undiscounted cash
TAYLOR MORRISON HOME CORPORATION 10-K
72
ITEM 8 | FINANCIAL STATEMENTS AND SUPPLEMENTARY DATA
flows, the assets are potentially impaired, requiring a fair value analysis. Our determination of fair value is primarily based on a discounted cash flow model which includes projections and estimates relating to sales prices, construction costs, sales pace, and other factors. However, fair value can be determined through other methods, such as appraisals, contractual purchase offers, and other third party opinions of value. Changes in these expectations may lead to a change in the outcome of our impairment analysis, and actual results may also differ from our assumptions. For the years ended December 31, 2023 and 2022, we recorded $11.8 million and $24.9 million of impairment charges, all of which related to our West reporting segment. For the year ended December 31, 2021, we recorded no impairment charges. Impairment charges are recorded to Cost of home closings or Cost of land closings on the Consolidated statement of operations.
In certain cases, we may elect to cease development and/or marketing of an existing community if we believe the economic performance of the community would be maximized by deferring development for a period of time to allow for market conditions to improve. We refer to such communities as long-term strategic assets. The decision may be based on financial and/or operational metrics as determined by us. For those communities that have been temporarily closed or development has been discontinued, we do not allocate interest or other costs to the community’s inventory until activity resumes and such costs are expensed as incurred. In addition, if we decide to cease development, we will evaluate the project for impairment and then cease future development and marketing activity until such a time when we believe that market conditions have improved and economic performance can be maximized. Our assessment of the carrying value of our long-term strategic assets typically includes estimates of future performance, including the timing of when development will recommence, the type of product to be offered, and the margin to be realized. In the future, some of these inactive communities may be re-opened while others may be sold. As of December 31, 2023 and 2022, we had no long-term strategic assets.
Land held for sale — In some locations where we act as a developer, we occasionally purchase land that includes commercially zoned parcels or areas designated for school or government use, which we typically sell to commercial developers or municipalities, as applicable. We also sell residential lots or land parcels to manage our land and lot supply on larger tracts of land. Land is considered held for sale once it meets all criteria in accordance with ASC 360 Property, Plant and Equipment. Land held for sale is recorded at the lower of cost or fair value less costs to sell. In determining the value of land held for sale, we consider recent offers received, prices for land in recent comparable sales transactions, and other factors. For the years ended December 31, 2023 and 2022 we had no material fair value adjustments for land held for sale. For the year ended December 31, 2021, we had $4.7 million of fair value adjustments for land held for sale which was recorded within Cost of land closings on the Consolidated statement of operations.
Land banking arrangements — We have land purchase agreements with various land sellers. As a method of acquiring land in staged takedowns, while limiting risk and minimizing the use of funds from our available cash or other financing sources, we transfer our right under certain specific performance agreements to entities owned by third parties (“land banking arrangements”). These entities use equity contributions from their owners and/or incur debt to finance the acquisition and development of the land. We incur interest expense on these arrangements. Interest is based on remaining lots to be purchased and is capitalized for the percentage of lots in each project actively under development, with the remainder expensed and included in Interest (income)/expense, net on the Consolidated statement of operations.The entities grant us an option to acquire lots in staged takedowns. In consideration for this option, we make a non-significant and non-refundable cash deposit. We are not legally obligated to purchase the lots, but would forfeit any existing deposits and could be subject to financial and other penalties if the lots were not purchased. We do not have an ownership interest in these entities or title to their assets and do not guarantee their liabilities. As such, these entities are not consolidated. These land banking arrangements help us manage the financial and market risk associated with land holdings which are not included in the Consolidated balance sheets.
Land Deposits — We make deposits related to land option contracts, land banking, and land purchase contracts. Non-refundable deposits are recorded as real estate inventory in the accompanying Consolidated balance sheets at
TAYLOR MORRISON HOME CORPORATION 10-K
73
ITEM 8 | FINANCIAL STATEMENTS AND SUPPLEMENTARY DATA
the time the deposit is applied to the acquisition price of the land based on the terms of the underlying agreements. To the extent the deposits are non-refundable, they are charged to Other expense, net if the land acquisition process is terminated or no longer determined probable.
Mortgage Loans Held for Sale — Mortgage loans held for sale consist of mortgages due from buyers of Taylor Morrison homes that are financed through our wholly-owned mortgage finance subsidiary, TMHF. Mortgage loans held for sale are carried at fair value, using observable market information, including pricing from actual market transactions, investor commitment prices, or broker quotations. The fair value for Mortgage loans held for sale covered by investor commitments is generally based on commitment prices. The fair value for Mortgage loans held for sale not committed to be purchased by an investor is generally based on current delivery prices using best execution pricing.
Derivative Assets — We enter into interest rate lock commitments (“IRLCs”) when originating residential mortgage loans held for sale, at specified interest rates and within a specified period of time (generally between 30 and 60 days), with customers who have applied for a loan and meet certain credit and underwriting criteria. We are exposed to interest rate risk as a result of these IRLCs and originated Mortgage loans held for sale until those loans are sold in the secondary market. The price risk related to changes in the fair value of IRLCs and Mortgage loans held for sale not committed to be purchased by investors are subject to change primarily due to changes in market interest rates. We manage the interest rate and price risk associated with our outstanding IRLCs and Mortgage loans held for sale not committed to be purchased by investors by entering into hedging instruments such as forward loan sales commitments and mandatory delivery commitments. We expect these instruments will experience changes in fair value inverse to changes in the fair value of the IRLCs and Mortgage loans held for sale not committed to investors, thereby reducing earnings volatility. Best effort sale commitments are also executed for certain loans at the time the IRLC is locked with the borrower. The fair value of the best effort IRLC and Mortgage loans held for sale are valued using the commitment price to the investor. We take into account various factors and strategies in determining what portion of the IRLCs and Mortgage loans held for sale to economically hedge.
The IRLCs meet the definition of a derivative and are reflected on the balance sheet at fair value in Prepaid expenses and other assets, net or Accrued expenses and other liabilities, with changes in fair value recognized in Financial Services revenue on the Consolidated statements of operations. Unrealized gains and losses on the IRLCs, reflected as derivative assets, are measured based on the fair value of the underlying mortgage loan, quoted Agency MBS prices, estimates of the fair value of the mortgage servicing rights and the probability that the mortgage loan will fund within the terms of the IRLC, net of commission expense and broker fees. The fair value of the forward loan sales commitment and mandatory delivery commitments being used to hedge the IRLCs and Mortgage loans held for sale not committed to be purchased by investors are based on quoted Agency MBS prices. Refer to Note 15—Mortgage Hedging Activities for additional information.
Prepaid Expenses and Other Assets, net — Prepaid expenses and other assets, net consist of the following:
|
| As of December 31, |
| |||||
(Dollars in thousands) |
| 2023 |
|
| 2022 |
| ||
Prepaid expenses |
| $ | 41,311 |
|
| $ | 45,872 |
|
Other assets |
|
| 104,210 |
|
|
| 154,279 |
|
Build-to-Rent assets |
|
| 145,405 |
|
|
| 65,241 |
|
Total prepaid expenses and other assets, net |
| $ | 290,925 |
|
| $ | 265,392 |
|
Prepaid expenses consist primarily of sales commissions, prepaid rent, impact fees and the unamortized issuance costs for the revolving credit facilities. Prepaid sales commissions are recorded on pre-closing sales activities, which are recognized on the ultimate closing of the homes to which they relate. Other assets consist primarily of various operating and escrow deposits, pre-acquisition costs, rebate receivables, income tax receivables, Urban Form
TAYLOR MORRISON HOME CORPORATION 10-K
74
ITEM 8 | FINANCIAL STATEMENTS AND SUPPLEMENTARY DATA
assets, and other deferred costs. Build-to-Rent assets consist primarily of land and development costs relating to projects under construction.
Other Receivables, net — Other receivables primarily consist of amounts expected to be recovered from various community development, municipality, and utility districts and utility deposits. Allowances are maintained for potential losses based on historical experience, present economic conditions, and other factors considered relevant. Allowances are recorded in Other expense, net, when it becomes likely uncollectible. Other receivables are written off when it is determined that collection efforts will no longer be pursued. Allowances at December 31, 2023 and 2022 were immaterial.
Income Taxes— We account for income taxes in accordance with ASC Topic 740, Income Taxes.Deferred tax assets and liabilities are recorded based on future tax consequences of temporary differences between the amounts reported for financial reporting purposes and the amounts deductible for income tax purposes, and are measured using enacted tax rates expected to apply in the years in which the temporary differences are expected to be recovered or settled. The effect on deferred tax assets and liabilities of a change in tax rates is recognized in earnings in the period when the changes are enacted.
Property and Equipment, net— Property and equipment are recorded at cost, less accumulated depreciation. Depreciation is generally computed using the straight-line basis over the estimated useful lives of the assets as follows:
Information systems: over the term of the license
Furniture, fixtures and computer and equipment: 5 – 7 years
Model and sales office improvements: lesser of 3 years or the life of the community
Goodwill— The excess of the purchase price of a business acquisition over the net fair value of assets acquired and liabilities assumed is capitalized as goodwill in accordance with ASC Topic 350, Intangibles — Goodwill and Other.
Insurance Costs, Self-Insurance Reserves and Warranty Reserves— We have certain deductible limits for each of our policies under our workers’ compensation, automobile, and general liability insurance policies, and we record warranty expense and liabilities for the estimated costs of potential claims for construction defects. The excess liability limits are $50 million per occurrence,is aggregated annually and applied in excess of automobile liability, employer’s liability under workers compensation and general liability policies. We also generally require our subcontractors and design professionals to indemnify us and provide evidence of insurance for liabilities arising from their work, subject to certain limitations. We are the parent of Beneva Indemnity Company (“Beneva”), a wholly-owned captive insurance company, which
TAYLOR MORRISON HOME CORPORATION 10-K
75
ITEM 8 | FINANCIAL STATEMENTS AND SUPPLEMENTARY DATA
provides insurance coverage for construction defects discovered up to ten years following the close of a home, coverage for premise operations risk, and property damage. We accrue for the expected costs associated with the deductibles and self-insured amounts under our various insurance policies based on historical claims, estimates for claims incurred but not reported, and potential for recovery of costs from insurance and other sources. The estimates are subject to significant variability due to factors, such as claim settlement patterns, litigation trends, and the extended period of time in which a construction defect claim might be made after the closing of a home.
We offer a one year limited warranty to cover various defects in workmanship or materials, two year limited warranty on certain systems (such as electrical or cooling systems), and a ten year limited warranty on structural defects. Warranty reserves are established as homes close in an amount estimated to be adequate to cover expected costs of materials and outside labor during warranty periods. Our warranty is not considered a separate deliverable in the sales arrangement since it is not priced separately from the home, therefore, it is accounted for in accordance with ASC Topic 450, Contingencies, which states that warranties that are not separately priced are generally accounted for by accruing the estimated costs to fulfill the warranty obligation. The amount of revenue related to the product is recognized in full upon the delivery of the home if all other criteria for revenue recognition have been met. As a result, we accrue the estimated costs to fulfill the warranty obligation at the time a home closes, as a component of Cost of home closings on the Consolidated statements of operations.
Stock Based Compensation — We have stock options, performance basedperformance-based restricted stock units ("PRSUs") and non-performance-based restricted stock units ("RSUs" or "Restricted stock"), which we account for in accordance with ASC Topic 718-10, Compensation — Stock Compensation. The fair value for stock options is measured and estimated on the date of grant using the Black-Scholes option pricing model and recognized evenly over the vesting period of the options. Performance-based restricted stock unitsPRSUs are measured using the closing price on the date of grant and expensed using a probability of attainment calculation which determines the likelihood of
Employee Benefit Plans— We maintain a defined contribution plan pursuant to Section 401(k) of the IRCInternal Revenue Code ("IRC") (“401(k) Plan”). Each eligible employee may elect to make before-tax contributions up to the current tax limits. WeAt December 31, 2023, we match 100%100% of employees’ voluntary contributions up to 2%4% of eligible compensation, and 50%50% for each dollar contributed between 2%4% and 6%5% of eligible compensation. During the year ended December 31, 2020, the employee match portion of the plan was paused for one quarter as part of our efforts to reduce spending during the early onset of the COVID-19 pandemic. We contributed $4.7$13.2 million, $10.7$13.6 million, and $9.3$11.3 million to the 401(k) Plan for the twelve monthsyears ended December 31, 2020, 2019,2023, 2022, and 2018,2021, respectively.
Treasury Stock — We account for treasury stock in accordance with ASC Topic 505-30, Equity - Equity—Treasury Stock.Repurchased shares are reflected as a reduction in stockholders'stockholders’ equity and subsequent sale of repurchased shares are recognized as a change in equity. When factored into our weighted average calculations for purposes of earnings per share, the number of repurchased shares is based on the settlement date.To date, we have not sold any treasury stock.
Revenue Recognition — Revenue is recognized in accordance with ASC Topic 606, Revenue from Contracts with Customers(“Topic 606”). The standard'sstandard’s core principle requires an entity to recognize revenue when it transfers promised goods or services to customers in an amount that reflects the consideration to which an entity expects to be entitled in exchange for those goods or services.
TAYLOR MORRISON HOME CORPORATION 10-K
76
Home and land closings revenue
Under Topic 606, the following steps are applied to determine the proper home closings revenue and land closings revenue recognition:
(1) we identify the contract(s) with our customer; (2) we identify the performance obligations in the contract; (3) we determine the transaction price; (4) we allocate the transaction price to the performance obligations in the contract; and (5) we recognize revenue when (or as) we satisfy the performance obligation. For ourobligation(s) are satisfied. Our home sales transactions, we have one contract, with one performance obligation, with each customer to build and deliver the home purchased (or develop and deliver land). Based on the application of the five steps, the following summarizes the timing and manner of home and land sales revenue:
• | Revenue from closings of residential real estate is recognized when the buyer has made the required minimum down payment, obtained necessary financing, the risks and rewards of ownership are transferred to the buyer, and we have no continuing involvement with the property, which is generally upon the close of escrow. Revenue is reported net of any discounts and incentives. |
• | Revenue from land sales is recognized when a significant down payment is received, title passes and collectability of the receivable, if any, is reasonably assured, and we have no continuing involvement with the property, which is generally upon the close of escrow. |
•Revenue from closings of residential real estate is recognized when closings have occurred, the buyer has made the required minimum down payment, obtained necessary financing, the risks and rewards of ownership are transferred to the buyer, and we have no continuing involvement with the property, which is generally upon the close of escrow. Revenue is reported net of any discounts and incentives.
We own and operate certain amenities such as golf courses, club houses, and fitness centers, which require us to provide club members with access to the facilities in exchange for the payment of club dues. We collect club dues and other fees from the club members, which are invoiced on a monthly basis. Revenue from our golf club operations is also included in amenity and other revenue. Amenity and other revenue also includes revenue from the sale of assets which include multi-use properties as part offrom our Urban Form operations and Build-to-Rent operations.
Mortgage operations and hedging activity related to financial services are not within the scope of Topic 606. Loan origination fees (including title fees, points, and closing costs) are recognized at the time the related real estate transactions are completed, which is usually upon the close of escrow. All of theGenerally, loans TMHF originates are sold to third party investors within a short period of time, on a non-recourse basis. Gains and losses from the sale of mortgages are recognized in accordance with ASC Topic 860-20, Sales of Financial Assets.TMHF does not have continuing involvement with the transferred assets; therefore, we derecognize the mortgage loans at time of sale, based on the difference between the selling price and carrying value of the related loans upon sale, recording a gain/loss on sale in the period of sale. Also included in Financial services revenue/expenses is the realized and unrealized gains and losses from hedging instruments. ASC Topic 815-25, Derivatives and Hedging, requires that all hedging instruments be recognized as assets or liabilities on the balance sheet at their fair value. We do not meet the criteria for hedge accounting; therefore, we account for these instruments as free-standing derivatives, with changes in fair value recognized in Financial services revenue/expenses on the statement of operations in the period in which they occur. See "Derivative Assets" above in this Note 2.
Advertising Costs— We expense advertising costs as incurred. For the years ended December 31, 2020, 20192023, 2022, and 2018,2021, advertising costs were $31.9$28.7 million, $32.0$33.9 million, and $30.7$30.4 million, respectively. Such costs are included in General and administrative expenses on the Consolidated Statementsstatement of Operations.operations.
Recently Issued Accounting Pronouncements— In December 2019,2023, the Financial Accounting Standards Board (“FASB”("FASB") issued ASU No. 2019-12,Accounting Standards Update ("ASU") 2023-09, Improvements to Income Taxes (Topic 740): Simplifying the Accounting for Income TaxesTax Disclosures (“ASU 2019-12”), which is intended to simplify various aspects related to accounting forestablishes new income taxes.tax disclosure requirements. Under the new guidance, entities must consistently categorize and provide greater disaggregation of information in the rate reconciliation as well as further disaggregate income taxes paid. This ASU 2019-12 removes certain exceptions to the general principles in Topic 740can be applied prospectively or retrospectively and also clarifies and amends existing guidance to improve consistent application. ASU 2019-12 is effective for the annual reporting period
TAYLOR MORRISON HOME CORPORATION 10-K
77
ITEM 8 | FINANCIAL STATEMENTS AND SUPPLEMENTARY DATA
ending December 31, 2025. The adoption of ASU 2023-09 will not impact our Consolidated financial statements but we are currently reviewing the impact that it may have on our disclosures.
In November 2023, FASB issued ASU 2023-07, Improvements to Reportable Segment Disclosures. ASU 2023-07 requires disclosure of significant segment expenses that are regularly provided to the chief operating decision maker ("CODM") and included within the segment measure of profit or loss, an amount and description of its composition for other segment items to reconcile to segment profit or loss, and the title and position of the entity’s CODM. This ASU will be effective for us in our fiscal year beginning January 1, 2021.for the annual reporting period ending December 31, 2024. We do not believeare currently reviewing the impact that the adoption of ASU 2019-12 will2023-07 may have a material impact on our consolidatedConsolidated financial statements and disclosures.
In accordance with ASC Topic 805August 2023, FASB issued ASU 2023-05, Business Combinations— Joint Venture Formations (Subtopic 805-60): Recognition and Initial Measurement, Business Combinations, allunder which an entity that qualifies as either a joint venture or a corporate joint venture, is required to apply a new basis of accounting upon the formation of the joint venture. Specifically, the ASU stipulates that a joint venture or a corporate joint venture must initially measure its assets acquired and liabilities assumed from our acquisitions of WLH and AV Homes were measured and recognized at fair value as of the date of the acquisition to reflect the purchase price paid.
| For the Year Ended December 31, | |||||||||||
| (Dollars in thousands except per share data) | 2020 | 2019 | |||||||||
| Total revenue | $ | 6,216,418 | $ | 6,751,846 | |||||||
| Net income before allocation to non-controlling interests | 309,022 | 171,114 | |||||||||
| Net (income)/loss attributable to non-controlling interests — joint ventures | 6,975 | 30,661 | |||||||||
| Net income available to TMHC | $ | 302,047 | $ | 140,453 | |||||||
| Weighted average shares - Basic | 131,011 | 135,661 | |||||||||
| Weighted average shares - Diluted | 132,370 | 136,952 | |||||||||
| Earnings per share - Basic | $ | 2.31 | $ | 1.04 | |||||||
| Earnings per share - Diluted | $ | 2.28 | $ | 1.03 | |||||||
| Year Ended December 31, |
| ||||||||||
| 2023 |
|
| 2022 |
|
| 2021 |
| ||||
Numerator: |
|
|
|
|
|
|
|
|
| |||
Net income |
| $ | 768,929 |
|
| $ | 1,052,800 |
|
| $ | 663,026 |
|
Denominator: |
|
|
|
|
|
|
|
|
| |||
Weighted average shares – basic |
|
| 108,424 |
|
|
| 114,982 |
|
|
| 126,077 |
|
Restricted stock |
|
| 925 |
|
|
| 707 |
|
|
| 920 |
|
Stock options |
|
| 796 |
|
|
| 532 |
|
|
| 771 |
|
Warrants |
|
| — |
|
|
| — |
|
|
| 251 |
|
Weighted average shares – diluted |
|
| 110,145 |
|
|
| 116,221 |
|
|
| 128,019 |
|
Earnings per common share – basic |
| $ | 7.09 |
|
| $ | 9.16 |
|
| $ | 5.26 |
|
Earnings per common share – diluted |
| $ | 6.98 |
|
| $ | 9.06 |
|
| $ | 5.18 |
|
| Year Ended December 31, | |||||||||||||||||
| (Dollars in thousands except per share data) | 2020 | 2019 | 2018 | ||||||||||||||
| Numerator: | |||||||||||||||||
| Net income available to TMHC— basic | $ | 243,439 | $ | 254,652 | $ | 206,364 | |||||||||||
| Net income attributable to non-controlling interest - Former Principal Equityholders | 0 | 0 | 3,583 | ||||||||||||||
| Loss fully attributable to public holding company | 0 | 0 | 540 | ||||||||||||||
| Net income — diluted | $ | 243,439 | $ | 254,652 | $ | 210,487 | |||||||||||
| Denominator: | |||||||||||||||||
| Weighted average shares — basic | 127,812 | 106,997 | 111,743 | ||||||||||||||
Weighted average shares — non-controlling interest (1) | 0 | 0 | 1,935 | ||||||||||||||
| Restricted stock units | 865 | 983 | 1,117 | ||||||||||||||
| Stock options | 319 | 309 | 324 | ||||||||||||||
| Warrants | 174 | 0 | 0 | ||||||||||||||
| Weighted average shares — diluted | 129,170 | 108,289 | 115,119 | ||||||||||||||
| Earnings per common share — basic: | |||||||||||||||||
| Net income available to Taylor Morrison Home Corporation | $ | 1.90 | $ | 2.38 | $ | 1.85 | |||||||||||
| Earnings per common share — diluted: | |||||||||||||||||
| Net income available to Taylor Morrison Home Corporation | $ | 1.88 | $ | 2.35 | $ | 1.83 | |||||||||||
78
ITEM 8 | FINANCIAL STATEMENTS AND SUPPLEMENTARY DATA
| As of December 31, | |||||||||||
| (Dollars in thousands) | 2020 | 2019 | |||||||||
| Real estate developed or under development | $ | 3,862,785 | $ | 2,805,506 | |||||||
Real estate held for development or held for sale (1) | 110,954 | 146,471 | |||||||||
Operating communities (2) | 1,072,134 | 899,789 | |||||||||
| Capitalized interest | 163,780 | 115,593 | |||||||||
| Total owned inventory | 5,209,653 | 3,967,359 | |||||||||
| Consolidated real estate not owned | 122,773 | 19,185 | |||||||||
| Total real estate inventory | $ | 5,332,426 | $ | 3,986,544 | |||||||
| As of December 31, |
| ||||||
(Dollars in thousands) |
| 2023 |
| 2022 |
| |||
Real estate developed and under development |
| $ | 3,855,534 |
|
| $ | 3,607,227 |
|
Real estate held for development or held for sale (1) |
|
| 29,317 |
|
|
| 43,314 |
|
Total land inventory |
|
| 3,884,851 |
|
|
| 3,650,541 |
|
Operating communities (2) |
|
| 1,414,528 |
|
|
| 1,506,241 |
|
Capitalized interest |
|
| 174,449 |
|
|
| 190,123 |
|
Total owned inventory |
|
| 5,473,828 |
|
|
| 5,346,905 |
|
Consolidated real estate not owned |
|
| 71,618 |
|
|
| 23,971 |
|
Total real estate inventory |
| $ | 5,545,446 |
|
| $ | 5,370,876 |
|
| As of December 31, | |||||||||||||||||||||||
| (Dollars in thousands) | 2020 | 2019 | |||||||||||||||||||||
| Owned Lots | Book Value of Land and Development | Owned Lots | Book Value of Land and Development | ||||||||||||||||||||
Raw(1) | 12,330 | $ | 356,681 | 13,804 | $ | 477,997 | |||||||||||||||||
| Partially developed | 19,495 | 1,215,419 | 13,298 | 914,689 | |||||||||||||||||||
| Finished | 21,396 | 2,388,177 | 15,504 | 1,559,291 | |||||||||||||||||||
| Long-term strategic assets | 158 | 13,462 | 0 | 0 | |||||||||||||||||||
| Total | 53,379 | $ | 3,973,739 | 42,606 | $ | 2,951,977 | |||||||||||||||||
A summary of owned and controlled lots is as follows:
| As of December 31, |
| ||||||
(Dollars in thousands) |
| 2023 |
|
| 2022 |
| ||
Owned lots: |
|
|
|
|
|
| ||
Undeveloped |
|
| 13,418 |
|
|
| 14,985 |
|
Under development |
|
| 8,848 |
|
|
| 10,716 |
|
Finished |
|
| 11,811 |
|
|
| 10,713 |
|
Total owned lots |
|
| 34,077 |
|
|
| 36,414 |
|
Controlled lots: |
|
|
|
|
|
| ||
Land option purchase contracts |
|
| 8,621 |
|
|
| 6,582 |
|
Land banking arrangements |
|
| 5,818 |
|
|
| 7,369 |
|
Other controlled lots(1) |
|
| 23,846 |
|
|
| 24,422 |
|
Total controlled lots |
|
| 38,285 |
|
|
| 38,373 |
|
Total owned and controlled lots |
|
| 72,362 |
|
|
| 74,787 |
|
Homes in inventory |
|
| 7,867 |
|
|
| 7,653 |
|
(1) Other controlled lots include agreements whereby the purchase of the lots must occur as a single transaction, as opposed to multiple take-downs. In addition, controlled lots from our unconsolidated JVs are also included.
As of December 31, 20202022, the owned lots and 2019,controlled lots presented above have been recast as a result of an operational change in classification in the current period. Lots which have started vertical construction have been excluded from total owned lots and controlled lots represent lots in which we had thehave a contractual right, generally through an option contract or land banking arrangement as well as paid a land deposit to purchase approximately 7,449 and 4,263 lots under land option purchase contracts, respectively,a seller for an aggregate purchase priceunderlying real estate asset. Homes in inventory include any lots with vertical construction. We believe these operational changes provide better transparency into the status of $485.4 million and $289.7 million, respectively. We do not have title to these properties, and the creditors generally have no recourse against us. As of December 31, 2020 and 2019, our exposure to loss related to our option contracts with third parties and unconsolidated entities consisted of non-refundable deposits totaling $65.3 million and $39.8 million, respectively.
Capitalized Interest— Interest capitalized, incurred and amortized is as follows:
| Year ended December 31, |
| ||||||||||
(Dollars in thousands) |
| 2023 |
|
| 2022 |
|
| 2021 |
| |||
Interest capitalized - beginning of period |
| $ | 190,123 |
|
| $ | 168,670 |
|
| $ | 163,780 |
|
Interest capitalized |
|
| 119,196 |
|
|
| 159,913 |
|
|
| 154,623 |
|
Interest amortized to cost of home closings |
|
| (134,870 | ) |
|
| (138,460 | ) |
|
| (149,733 | ) |
Interest capitalized - end of period |
| $ | 174,449 |
|
| $ | 190,123 |
|
| $ | 168,670 |
|
TAYLOR MORRISON HOME CORPORATION 10-K
79
ITEM 8 | FINANCIAL STATEMENTS AND SUPPLEMENTARY DATA
| Year Ended December 31, | |||||||||||||||||
| (Dollars in thousands) | 2020 | 2019 | 2018 | ||||||||||||||
| Interest capitalized — beginning of period | $ | 115,593 | $ | 96,031 | $ | 90,496 | |||||||||||
| Interest incurred | 164,085 | 113,301 | 87,957 | ||||||||||||||
| Interest amortized to cost of home closings | (115,898) | (93,739) | (82,422) | ||||||||||||||
| Interest capitalized — end of period | $ | 163,780 | $ | 115,593 | $ | 96,031 | |||||||||||
During the year ended December 31, 2022, we contributed land as part of two initial investments in existing unconsolidated joint ventures. In accordance with ASC 606, when the transferee obtains title, physical possession and maintains the risks and rewards of ownership of the property and the transferor has no continuing involvement, the contribution is considered a transfer. To recognize the transfer, the difference between the fair value of the land and carrying value at the time of the contribution is recorded as a gain/loss on transfer. For the year ended December 31, 2022, we recognized gains of $14.5 million in Other expense, net on the Consolidated statement of operations, related to land transferred to unconsolidated joint ventures.
| As of December 31, |
| ||||||
| 2023 |
|
| 2022 |
| |||
Assets: |
|
|
|
|
|
| ||
Real estate inventory |
|
| 952,223 |
|
| $ | 749,942 |
|
Other assets |
|
| 182,517 |
|
|
| 146,770 |
|
Total assets |
| $ | 1,134,740 |
|
| $ | 896,712 |
|
Liabilities: |
|
|
|
|
|
| ||
Debt |
| $ | 317,224 |
|
| $ | 238,263 |
|
Other liabilities |
|
| 50,739 |
|
|
| 31,824 |
|
Total liabilities |
| $ | 367,963 |
|
| $ | 270,087 |
|
Owners’ equity: |
|
|
|
|
|
| ||
TMHC |
| $ | 346,192 |
|
| $ | 282,900 |
|
Others |
|
| 420,585 |
|
|
| 343,725 |
|
Total owners’ equity |
| $ | 766,777 |
|
| $ | 626,625 |
|
Total liabilities and owners’ equity |
| $ | 1,134,740 |
|
| $ | 896,712 |
|
|
| Year ended December 31, |
| |||||||||||
|
| 2023 |
|
| 2022 |
|
|
| 2021 |
| ||||
Revenues |
|
| $ | 158,174 |
|
| $ | 168,695 |
|
|
| $ | 130,640 |
|
Costs and expenses |
|
|
| (135,007 | ) |
|
| (163,488 | ) |
|
|
| (97,596 | ) |
Net income from unconsolidated entities |
|
| $ | 23,166 |
|
| $ | 5,207 |
|
|
| $ | 33,044 |
|
TMHC’s share in net income/(loss) of unconsolidated entities |
|
| $ | 8,757 |
|
| $(14,184) |
| (1) |
| $ | 11,130 |
| |
Distributions to TMHC from unconsolidated entities |
|
| $ | 10,054 |
|
| $ | 130,545 |
|
|
| $ | 42,655 |
|
| As of December 31, | |||||||||||
| (Dollars in thousands) | 2020 | 2019 | |||||||||
| Assets: | |||||||||||
| Real estate inventory | $ | 342,451 | $ | 367,225 | |||||||
| Other assets | 133,903 | 132,812 | |||||||||
| Total assets | $ | 476,354 | $ | 500,037 | |||||||
| Liabilities and owners’ equity: | |||||||||||
| Debt | $ | 183,911 | $ | 178,686 | |||||||
| Other liabilities | 21,215 | 20,490 | |||||||||
| Total liabilities | $ | 205,126 | $ | 199,176 | |||||||
| Owners’ equity: | |||||||||||
| TMHC | 127,955 | 128,759 | |||||||||
| Others | 143,273 | 172,102 | |||||||||
| Total owners’ equity | 271,228 | 300,861 | |||||||||
| Total liabilities and owners’ equity | $ | 476,354 | $ | 500,037 | |||||||
| Year Ended December 31, | |||||||||||||||||
| (Dollars in thousands) | 2020 | 2019 | 2018 | ||||||||||||||
| Revenues | $ | 161,888 | $ | 277,263 | $ | 381,274 | |||||||||||
| Costs and expenses | (129,764) | (242,044) | (328,565) | ||||||||||||||
| Income of unconsolidated entities | $ | 32,124 | $ | 35,219 | $ | 52,709 | |||||||||||
| TMHC's share in income of unconsolidated entities | $ | 11,176 | $ | 9,509 | $ | 13,332 | |||||||||||
| Distributions from unconsolidated entities | $ | 51,626 | $ | 34,057 | $ | 68,847 | |||||||||||
TAYLOR MORRISON HOME CORPORATION 10-K
80
ITEM 8 | FINANCIAL STATEMENTS AND SUPPLEMENTARY DATA
quarter of 2023 and remained held for investment at December 31, 2023. As of December 31, 2022, the assets of the consolidated joint ventures totaled $277.6 million, of which $38.9 million was cash and cash equivalents, $72.0 million was owned real estate inventory, and $123.2 million was property and equipment, net. The liabilities of the consolidated joint ventures totaled $216.4$133.8 million and $155.5 million as of December 31, 2023 and December 31, 2022, respectively, and were primarily comprised of notesloans payable and other borrowings, accounts payable and accrued expenses and other liabilities.
|
| As of December 31, |
| |||||
| 2023 |
|
| 2022 |
| |||
Real estate development costs to complete |
| $ | 46,114 |
|
| $ | 53,155 |
|
Compensation and employee benefits |
|
| 149,095 |
|
|
| 112,294 |
|
Self-insurance and warranty reserves |
|
| 184,448 |
|
|
| 161,675 |
|
Interest payable |
|
| 31,042 |
|
|
| 37,434 |
|
Property and sales taxes payable(1) |
|
| 30,887 |
|
|
| 30,046 |
|
Other accruals |
|
| 107,488 |
|
|
| 95,649 |
|
Total accrued expenses and other liabilities |
| $ | 549,074 |
|
| $ | 490,253 |
|
(1) Property and sales tax payable as of December 31, 2023 includes a $7.8 million reserve related to an ongoing state sales tax audit in the state of Washington covering tax years 2017 through 2021. The reserve was based in part on the unfavorable outcome of a prior Washington sales tax audit cycle which concluded in December 2023.
| As of December 31, | |||||||||||
| (Dollars in thousands) | 2020 | 2019 | |||||||||
| Real estate development costs to complete | $ | 38,935 | $ | 20,598 | |||||||
| Compensation and employee benefits | 113,896 | 95,585 | |||||||||
| Self-insurance and warranty reserves | 118,116 | 120,048 | |||||||||
| Interest payable | 45,917 | 23,178 | |||||||||
| Property and sales taxes payable | 28,523 | 12,537 | |||||||||
| Other accruals | 84,680 | 53,422 | |||||||||
| Total accrued expenses and other liabilities | $ | 430,067 | $ | 325,368 | |||||||
| Year Ended December 31, | |||||||||||||||||
| (Dollars in thousands) | 2020 | 2019 | 2018 | ||||||||||||||
| Reserve — beginning of period | $ | 120,048 | $ | 93,790 | $ | 51,010 | |||||||||||
| Net additions to reserves due to WLH acquisition | 9,984 | 0 | 0 | ||||||||||||||
| Additions to reserves | 62,722 | 44,093 | 51,674 | ||||||||||||||
| Costs and claims incurred | (82,137) | (67,554) | (42,433) | ||||||||||||||
Change in estimates to pre-existing reserves (1) | 7,499 | 49,719 | 33,539 | ||||||||||||||
| Reserve — end of period | $ | 118,116 | $ | 120,048 | $ | 93,790 | |||||||||||
| Year Ended |
| ||||||||||
| 2023 |
|
| 2022 |
|
| 2021 |
| ||||
Reserve - beginning of period |
| $ | 161,675 |
|
| $ | 141,839 |
|
| $ | 118,116 |
|
Additions to reserves |
|
| 83,226 |
|
|
| 76,643 |
|
|
| 77,827 |
|
Cost of claims incurred |
|
| (80,646 | ) |
|
| (76,994 | ) |
|
| (67,704 | ) |
Changes in estimates to pre-existing reserves |
|
| 20,193 |
|
|
| 20,187 |
|
|
| 13,600 |
|
Reserve - end of period(1) |
| $ | 184,448 |
|
| $ | 161,675 |
|
| $ | 141,839 |
|
(1)Changes in estimates to pre-existing reserves for the years ended December 31, 2019 and 2018 included a $43.1 million and $39.3 million charge, respectively, for construction defect remediation isolated to one specific communityThe increase in the Central region. There was no charge for the year ended December 31, 2020 relating to this defect remediation.end of period reserves is a result of year-to-date net losses generated in Beneva. The reserve balances for the specific construction defect issue as of December 31, 2020, 2019, and 2018 were $12.7 million, $36.3 million, and $27.6 million, respectively. The reserve estimate isestimates utilize actuarial assumptions which are based on assumptions, including but not limited tohistorical and recent claims data. Both the numberfrequency of homes affected, the costs associated with each repair,claims and the effectiveness ofcost to remediate the repairs. claims have increased in recent years, causing increases in reserves.
Due to the degree of judgementjudgment required in making these estimates and the inherent uncertainty in potential
outcomes, it is reasonably possible that actual costs could differ from those recordedreserved and such differences could be material, resulting in a change in future estimated reserves.
TAYLOR MORRISON HOME CORPORATION 10-K
81
ITEM 8 | FINANCIAL STATEMENTS AND SUPPLEMENTARY DATA
This change in estimate was a result of a change in policy, consistent with the terms of the 1974 Judgment, to perform infrastructure work for only lot owners that meet specific criteria, such as having privity of contract with the original sale documents. Management considered many factors in connection with this policy change, including the number of lots estimated to be owned by the original owners after bulk sales and foreclosures. Cost increases as a result of inflation or other economic factors were also taken into consideration.
The change in estimates resulted in a reduction of the estimated development liabilities of $14.8 million at December 31, 2023 from December 31, 2022. This reduction equates to an increase of approximately $0.10 per diluted share for the year ended December 31, 2023. Unforeseen changes in claim activity, future increases or decreases of costs for construction, material and labor, as well as other land development and utilities infrastructure costs, may have a significant effect on the estimated development liability.liabilities.
Total debt consists of the following:following (in thousands):
| As of December 31, |
| ||||||||||||||||||||||
| 2023 |
|
| 2022 |
| |||||||||||||||||||
| Principal |
|
| Unamortized |
|
| Carrying |
|
| Principal |
|
| Unamortized |
|
| Carrying |
| |||||||
5.625% Senior Notes due 2024(1) |
|
| — |
|
|
| — |
|
|
| — |
|
|
| 350,000 |
|
|
| (628 | ) |
|
| 349,372 |
|
5.875% Senior Notes due 2027 |
|
| 500,000 |
|
|
| (2,672 | ) |
|
| 497,328 |
|
|
| 500,000 |
|
|
| (3,459 | ) |
|
| 496,541 |
|
6.625% Senior Notes due 2027(2) |
|
| 27,070 |
|
|
| 1,022 |
|
|
| 28,092 |
|
|
| 27,070 |
|
|
| 1,310 |
|
|
| 28,380 |
|
5.75% Senior Notes due 2028 |
|
| 450,000 |
|
|
| (2,551 | ) |
|
| 447,449 |
|
|
| 450,000 |
|
|
| (3,183 | ) |
|
| 446,817 |
|
5.125% Senior Notes due 2030 |
|
| 500,000 |
|
|
| (4,174 | ) |
|
| 495,826 |
|
|
| 500,000 |
|
|
| (4,807 | ) |
|
| 495,193 |
|
Senior Notes subtotal |
| $ | 1,477,070 |
|
| $ | (8,375 | ) |
| $ | 1,468,695 |
|
| $ | 1,827,070 |
|
| $ | (10,767 | ) |
| $ | 1,816,303 |
|
Loans payable and other borrowings |
|
| 394,943 |
|
|
| — |
|
|
| 394,943 |
|
|
| 361,486 |
|
|
| — |
|
|
| 361,486 |
|
$1 Billion Revolving Credit Facility(3)(4) |
|
| — |
|
|
| — |
|
|
| — |
|
|
| — |
|
|
| — |
|
|
| — |
|
$100 Million Revolving Credit Facility(3)(4) |
|
| — |
|
|
| — |
|
|
| — |
|
|
| — |
|
|
| — |
|
|
| — |
|
Mortgage warehouse borrowings |
|
| 153,464 |
|
|
| — |
|
|
| 153,464 |
|
|
| 306,072 |
|
|
| — |
|
|
| 306,072 |
|
Total debt |
| $ | 2,025,477 |
|
| $ | (8,375 | ) |
| $ | 2,017,102 |
|
| $ | 2,494,628 |
|
| $ | (10,767 | ) |
| $ | 2,483,861 |
|
| As of December 31, | |||||||||||||||||||||||||||||||||||
| 2020 | 2019 | ||||||||||||||||||||||||||||||||||
| (Dollars in thousands) | Principal | Unamortized Debt Issuance (Costs) / Premium | Carrying Value | Principal | Unamortized Debt Issuance (Costs) / Premium | Carrying Value | |||||||||||||||||||||||||||||
| 5.875% Senior Notes due 2023 | 350,000 | (1,300) | 348,700 | 350,000 | (1,867) | 348,133 | |||||||||||||||||||||||||||||
| 5.625% Senior Notes due 2024 | 350,000 | (1,705) | 348,295 | 350,000 | (2,244) | 347,756 | |||||||||||||||||||||||||||||
| 5.875% Senior Notes due 2027 | 500,000 | (5,026) | 494,974 | 500,000 | (5,808) | 494,192 | |||||||||||||||||||||||||||||
6.625% Senior Notes due 2027(1) | 300,000 | 20,915 | 320,915 | 0 | 0 | 0 | |||||||||||||||||||||||||||||
| 5.750% Senior Notes due 2028 | 450,000 | (4,445) | 445,555 | 450,000 | (5,073) | 444,927 | |||||||||||||||||||||||||||||
| 5.125% Senior Notes due 2030 | 500,000 | (6,074) | 493,926 | 0 | 0 | 0 | |||||||||||||||||||||||||||||
| Senior Notes subtotal | 2,450,000 | 2,365 | 2,452,365 | 1,650,000 | (14,992) | 1,635,008 | |||||||||||||||||||||||||||||
| Loans payable and other borrowings | 348,741 | 0 | 348,741 | 182,531 | 0 | 182,531 | |||||||||||||||||||||||||||||
| Revolving Credit Facility | 0 | 0 | 0 | 0 | 0 | 0 | |||||||||||||||||||||||||||||
| Mortgage warehouse borrowings | 127,289 | 0 | 127,289 | 123,233 | 0 | 123,233 | |||||||||||||||||||||||||||||
| Total debt | $ | 2,926,030 | $ | 2,365 | $ | 2,928,395 | $ | 1,955,764 | $ | (14,992) | $ | 1,940,772 | |||||||||||||||||||||||
Senior Notes
All of our senior notes (the “Senior Notes”) described below and the related guarantees are senior unsecured obligations and are not subject to registration rights. The majority of indentures governing our senior notes (except for the William Lyon Notes as defined below) contain covenants that limit our ability to incur debt secured by liens and enter into certain sale and leaseback transactions and contain customary events of default. None of the indentures for the senior notes have financial maintenance covenants.
Our 5.625% Senior Notes due 2024 (the “2024 Senior Notes”) were redeemed in full on September 1, 2023 using cash on hand at a price equal to 100% of par, plus the accrued and unpaid interest up to, but excluding, the redemption date. As a result of the redemption, we recorded a net loss on extinguishment of debt of $0.3 million for the year ended December 31, 2023 to Loss/(gain) on extinguishment of debt, net, on the Consolidated statement of operations, which included the write-off of net unamortized deferred financing fees.
TAYLOR MORRISON HOME CORPORATION 10-K
82
ITEM 8 | FINANCIAL STATEMENTS AND SUPPLEMENTARY DATA
5.875% Senior Notes due 2027
On April 16, 2015, June 5, 2019, Taylor Morrison Communities, Inc. ("TM CommunitiesCommunities") issued $350.0$500.0 million aggregate principal amount of 5.875%5.875% Senior Notes due 20232027 (the “2023 5.875%“2027 5.875% Senior Notes”), which mature on AprilJune 15, 2023.2027. The 2023 5.875%2027 5.875% Senior Notes are guaranteed by Taylor Morrison Home III Corporation, Taylor Morrison Holdings, Inc. and their homebuilding subsidiaries (collectively, the “Guarantors”"Guarantors"). We are required to offer to repurchase the 20232027 5.875% Senior Notes at a price equal to 101%101% of their aggregate principal amount (plus accrued and unpaid interest) upon certain change of control events where there is a credit rating downgrade that occurs in connection with the change ofin control.
On June 13, 2022, TM Communities announced a cash tender offer to purchase any and all of control provisions in the indenture governing$290.4 million outstanding aggregate principal amount of the 2027 6.625%6.625% TM Communities Notes are similar(the “Tender Offer”), which expired July 12, 2022. TM Communities purchased $264.1 million and an additional approximately $0.9 million of the 2027 6.625% TM Communities Notes pursuant to those containedthe Tender Offer using cash on hand and borrowings on our $1 Billion Revolving Credit Facility at a price equal to 100% and 97%, respectively, of the principal amounts, plus accrued and unpaid interest up to, but excluding, the settlement date. As a result of the Tender Offer, TM Communities repurchased a total of $265.0 million in aggregate principal amount of outstanding 2027 6.625% TM Communities Notes and we recorded a net gain on extinguishment of debt of approximately $13.6 million for the indentures governingyear ended December 31, 2022 to Loss/(gain) on extinguishment of debt, net, on the Consolidated statement of operations.
On November 3, 2022, we purchased $8.0 million of the 2027 6.625% WLH Notes using cash on hand and borrowings on our other Senior Notes.
The remaining 2027 6.625%6.625% Senior Notes mature on July 15, 2027. Prior to July 15, 2022,As of December 31, 2023, the remaining 2027 6.625% Senior Notes may be redeemed in whole or in part at a redemption price equal to 100% of the principal amount plus a “make-whole” premium, and accrued and unpaid interest, if any, to, but not including, the redemption date. On or after July 15, 2022, the 2027 6.625%6.625% Senior Notes are redeemable at a price equal to 103.313% of principal (plus accrued and unpaid interest). On or after July 15, 2023, the 2027 6.625% Senior Notes are redeemable at a price equal to 102.208%102.208% of principal (plus accrued and unpaid interest). On or after July 31, 2024, the 2027 6.625%6.625% Senior Notes are redeemable at a price equal to a 101.104%101.104% of principal (plus accrued and unpaid interest). On or after July 15, 2025, the remaining 2027 6.625%6.625% Senior Notes are redeemable at a price equal to 100%100% of principal (plus accrued and unpaid interest).
On August 1, 2019, TM Communities issued $450.0$450.0 million aggregate principal amount of 5.75%5.75% Senior Notes due 2028 (the “2028 Senior Notes”), which mature on January 15, 2028. The 2028 Senior Notes are guaranteed by the
TAYLOR MORRISON HOME CORPORATION 10-K
83
ITEM 8 | FINANCIAL STATEMENTS AND SUPPLEMENTARY DATA
same Guarantors that guarantee our other Senior Notes. The change of control provisions in the indenture governing the 2028 Senior Notes are similar to those contained in the indentures governing our other Senior Notes.
On July 22, 2020, TM Communities issued $500.0 million aggregate principal amount of 5.125%5.125% Senior Notes due 2030 (the “2030 Senior Notes”). In September 2020, we redeemed the remaining $83.1 million and $103.8 million of 2023 and 2025Notes), which mature on August 1, 2030. The 2030 Senior Notes respectively, using cash on hand. Forare guaranteed by the 2023 6.00%same Guarantors that guarantee our other Senior Notes. The change of control provisions in the indenture governing the 2030 Senior Notes the redemption price was equalare similar to 100.0% of the principal amount, plus a make-whole premium of 0.11% plus 50 basis points, plus accrued and unpaid interest to, but excluding the redemption date. For the 2025 Senior Notes, the redemption price was equal to 102.938% of the principal amount, plus accrued and unpaid interest to, but excluding the redemption date. As a result of the early redemption of the 2023 and 2025 Senior Notes, we recorded a total net loss on extinguishment of debt of approximately $10.2 million in Loss on extinguishment of debt, netthose contained in the Consolidated Statement of Operations for the year ended December 31, 2020
On February 6, 2020September 9, 2022, we terminatedentered into an agreement to exercise the accordion feature under our $600.0existing Amended and Restated Credit Agreement increasing the aggregate commitments from $800 million to $1.0 billion.
Our $1 Billion Revolving Credit Facility writing off $1.7 million of debt issuance costs during the first quarter of 2020 to Transaction and corporate reorganization expenses on the Consolidated Statement of
As of December 31, 2020, such borrowings have been repaid,2023 and there was no outstanding amount due.
The Revolving Credit$1 Billion Facility contains certain “springing” financial covenants, requiring us and our subsidiaries to comply with a maximum debt to capitalization ratio of not more than 0.60 to 1.00 and a minimum consolidated tangible net worth level, currently of at least $2.1$3.3 billion. The financial covenants would be in effect for any fiscal quarter during which any (a) loans under the Revolving Credit$1 Billion Facility are outstanding during the last day of such fiscal quarter or on more than five separate days during such fiscal quarter or (b) undrawn letters of credit (except to the extent cash collateralized) issued under the Revolving Credit$1 Billion Facility in an aggregate amount greater than $40.0$40.0 million or unreimbursed letters of credit issued under the Revolving Credit$1 Billion Facility are outstanding on the last day of such fiscal quarter or for more than fiveconsecutive days during such fiscal quarter. For purposes of determining compliance with the financial covenants for any fiscal quarter, the Revolving Credit$1 Billion Facility provides that we may exercise an equity cure by issuing certain permitted securities for cash or otherwise recording cash contributions to our capital that will, upon the contribution of such cash to the borrower, be included in the calculation of consolidated tangible net worth and consolidated total capitalization. The equity cure right is exercisable up to twice in any
The Revolving Credit$1 Billion Facility contains certain restrictive covenants including limitations on incurrence of liens, the payment of dividends and other distributions, asset dispositions and investments in entities that are not guarantors, limitations on prepayment of subordinated indebtedness and limitations on fundamental
TAYLOR MORRISON HOME CORPORATION 10-K
84
ITEM 8 | FINANCIAL STATEMENTS AND SUPPLEMENTARY DATA
customary events of default, subject to applicable grace periods, including for nonpayment of principal, interest or other amounts, violation of covenants (including financial covenants, subject to the exercise of an equity cure), incorrectness of representations and warranties in any material respect, cross default and cross acceleration, bankruptcy, material monetary judgments, ERISA events with material adverse effect, actual or asserted invalidity of material guarantees and change of control.
$100 Million Revolving Credit Facility
Our $100 Million Revolving Credit Facility ($100 Million Facility) matures on September 17, 2024 and is guaranteed by the Guarantors.
As of December 31, 2023 and December 31, 2022, we had $0.2 million and $0.5 million, respectively, of unamortized debt issuance costs relating to our $100 Million Facility, which are included in Prepaid expenses and other assets, net, on the Consolidated balance sheets. We had no utilized letters of credit as of December 31, 2023 and December 31, 2022, resulting in $100.0 million of availability.
The $100 Million Facility contains substantially the same “springing” financial covenants and equity cure rights as the $1 Billion Facility.
Mortgage Warehouse Borrowings
The following is a summary of our TMHF mortgage subsidiary warehouse borrowings:
| (Dollars in thousands) | December 31, 2020 | ||||||||||||||||||||||||||||
| Facility | Amount Drawn | Facility Amount | Interest Rate(1) | Expiration Date | Collateral (2) | ||||||||||||||||||||||||
| Warehouse A | $ | 40,958 | $ | 55,000 | LIBOR + 1.75% | On Demand | Mortgage Loans | ||||||||||||||||||||||
| Warehouse B | 19,457 | 85,000 | LIBOR + 1.75% | On Demand | Mortgage Loans | ||||||||||||||||||||||||
| Warehouse C | 43,148 | 75,000 | LIBOR + 2.05% | On Demand | Mortgage Loans and Restricted Cash | ||||||||||||||||||||||||
| Warehouse D | 23,726 | 80,000 | LIBOR + 1.65% | November 15, 2021 | Mortgage Loans | ||||||||||||||||||||||||
| Total | $ | 127,289 | $ | 295,000 | |||||||||||||||||||||||||
| December 31, 2019 | |||||||||||||||||||||||||||||
| Facility | Amount Drawn | Facility Amount | Interest Rate(1) | Expiration Date | Collateral (2) | ||||||||||||||||||||||||
| Warehouse A | $ | 25,074 | $ | 45,000 | LIBOR + 1.75% | On Demand | Mortgage Loans | ||||||||||||||||||||||
| Warehouse B | 38,481 | 85,000 | LIBOR + 1.75% | On Demand | Mortgage Loans | ||||||||||||||||||||||||
| Warehouse C | 59,678 | 100,000 | LIBOR + 1.70% | On Demand | Mortgage Loans and Restricted Cash | ||||||||||||||||||||||||
| Total | $ | 123,233 | $ | 230,000 | |||||||||||||||||||||||||
| As of December 31, 2023 | |||||||||||||
Facility |
| Amount |
|
| Facility |
|
| Interest |
| Expiration |
| Collateral (1) | ||
Warehouse A |
| $ | 13,477 |
|
| $ | 60,000 |
|
| Term SOFR + 1.70% |
| on Demand |
| Mortgage Loans |
Warehouse B(2) |
|
| — |
|
|
| — |
|
| N/A |
| N/A |
| N/A |
Warehouse C |
|
| 25,567 |
|
|
| 100,000 |
|
| Term SOFR + 1.65% |
| on Demand |
| Mortgage Loans |
Warehouse D |
|
| 56,745 |
|
|
| 100,000 |
|
| Daily SOFR + 1.50% |
| September 4, 2024 |
| Mortgage Loans |
Warehouse E |
|
| 57,675 |
|
|
| 100,000 |
|
| Term SOFR + 1.60% |
| on Demand |
| Mortgage Loans |
Total |
| $ | 153,464 |
|
| $ | 360,000 |
|
|
|
|
|
|
|
|
|
|
|
|
|
|
|
|
|
|
|
| ||
| As of December 31, 2022 | |||||||||||||
Facility |
| Amount |
|
| Facility |
|
| Interest |
| Expiration |
| Collateral (1) | ||
Warehouse A |
| $ | 29,066 |
|
| $ | 60,000 |
|
| Daily SOFR + 1.70% |
| on Demand |
| Mortgage Loans |
Warehouse B |
|
| 94,258 |
|
|
| 150,000 |
|
| BSBY 1M + 1.65% |
| on Demand |
| Mortgage Loans |
Warehouse C |
|
| 53,607 |
|
|
| 75,000 |
|
| Term SOFR + 1.65% |
| on Demand |
| Mortgage Loans & Pledged Cash |
Warehouse D |
|
| 83,259 |
|
|
| 140,000 |
|
| Daily SOFR + 1.50% |
| September 6, 2023 |
| Mortgage Loans |
Warehouse E |
|
| 45,882 |
|
|
| 70,000 |
|
| Term SOFR + 1.60% |
| on Demand |
| Mortgage Loans |
Total |
| $ | 306,072 |
|
| $ | 495,000 |
|
|
|
|
|
|
|
Loans Payable and Other Borrowings
Loans payable and other borrowings as of December 31, 20202023 and 20192022 consist of project-level debt due to various land sellers and seller financing notes from current and prior year acquisitions. The debt is obtainedfinancial institutions for specific communities that contain land banking, profit participation, and joint ventures.communities. Project-level debt is generally secured by the land that was
TAYLOR MORRISON HOME CORPORATION 10-K
85
ITEM 8 | FINANCIAL STATEMENTS AND SUPPLEMENTARY DATA
acquired and the principal payments generally coincide with corresponding project lot salesclosings or a principal reduction schedule. Loans payableThese borrowings bear interest at rates that ranged from 0%0% to 8%9% and 0% to 8% at each of December 31, 20202023 and 2019.
Future Minimum Principal Payments on Total Debt
Principal maturities of total debt for the year ended December 31, 20202023 are as follows (in thousands):
(Dollars in thousands) |
| Year Ended |
| |
2024 |
| $ | 357,962 |
|
2025 |
|
| 103,790 |
|
2026 |
|
| 64,904 |
|
2027 |
|
| 547,456 |
|
2028 |
|
| 451,263 |
|
Thereafter |
|
| 500,102 |
|
Total debt |
| $ | 2,025,477 |
|
| (Dollars in thousands) | Year Ended December 31, | ||||
| 2021 | $ | 284,826 | |||
| 2022 | 78,964 | ||||
| 2023 | 421,118 | ||||
| 2024 | 362,143 | ||||
| 2025 | 10,090 | ||||
| Thereafter | 1,768,889 | ||||
| Total debt | $ | 2,926,030 | |||
Level 1— Fair value is based on quoted prices for identical assets or liabilities in active markets.
Level 2— Fair value is determined using quoted prices for similar assets or liabilities in active markets or quoted prices for identical or similar assets or liabilities in markets that are not active or are directly or indirectly observable.
Level 3— Fair value is determined using one or more significant inputs that are unobservable in active markets at the measurement date, such as a pricing model, discounted cash flow, or similar technique.
86
ITEM 8 | FINANCIAL STATEMENTS AND SUPPLEMENTARY DATA
The carrying value and fair value of our financial instruments are as follows:
|
|
| As of December 31,2023 |
|
| As Of December 31,2022 |
| |||||||||||
(Dollars in thousands) |
| Level in Fair |
| Carrying |
|
| Estimated |
|
| Carrying |
|
| Estimated |
| ||||
Description: |
|
|
|
|
|
|
|
|
|
|
|
|
|
| ||||
Mortgage loans held for sale |
| 2 |
| $ | 193,344 |
|
| $ | 193,344 |
|
| $ | 346,364 |
|
| $ | 346,364 |
|
IRLCs |
| 3 |
|
| 1,489 |
|
|
| 1,489 |
|
|
| 2,386 |
|
|
| 2,386 |
|
MBSs |
| 2 |
|
| (5,055 | ) |
|
| (5,055 | ) |
|
| 1,090 |
|
|
| 1,090 |
|
Mortgage warehouse borrowings |
| 2 |
|
| 153,464 |
|
|
| 153,464 |
|
|
| 306,072 |
|
|
| 306,072 |
|
Loans payable and other borrowings |
| 2 |
|
| 394,943 |
|
|
| 394,943 |
|
|
| 361,486 |
|
|
| 361,486 |
|
5.625% Senior Notes due 2024 (1) |
| 2 |
|
| — |
|
|
| — |
|
|
| 349,372 |
|
|
| 347,375 |
|
5.875% Senior Notes due 2027 (1) |
| 2 |
|
| 497,328 |
|
|
| 502,500 |
|
|
| 496,541 |
|
|
| 480,060 |
|
6.625% Senior Notes due 2027 (1) |
| 2 |
|
| 28,092 |
|
|
| 26,529 |
|
|
| 28,380 |
|
|
| 26,123 |
|
5.75% Senior Notes due 2028 (1) |
| 2 |
|
| 447,449 |
|
|
| 451,571 |
|
|
| 446,817 |
|
|
| 421,358 |
|
5.125% Senior Notes due 2030 (1) |
| 2 |
|
| 495,826 |
|
|
| 483,690 |
|
|
| 495,193 |
|
|
| 434,330 |
|
Equity security |
| 1 |
|
| 460 |
|
|
| 460 |
|
|
| 460 |
|
|
| 460 |
|
| As of December 31, 2020 | As of December 31, 2019 | ||||||||||||||||||||||||||||
| (Dollars in thousands) | Level in Fair Value Hierarchy | Carrying Value | Estimated Fair Value | Carrying Value | Estimated Fair Value | ||||||||||||||||||||||||
| Description: | |||||||||||||||||||||||||||||
| Mortgage loans held for sale | 2 | $ | 201,177 | $ | 201,177 | $ | 190,880 | $ | 190,880 | ||||||||||||||||||||
| IRLCs | 3 | 5,294 | 5,294 | 2,099 | 2,099 | ||||||||||||||||||||||||
| MBSs | 2 | (1,847) | (1,847) | (167) | (167) | ||||||||||||||||||||||||
| Mortgage warehouse borrowings | 2 | 127,289 | 127,289 | 123,233 | 123,233 | ||||||||||||||||||||||||
| Loans payable and other borrowings | 2 | 348,741 | 348,741 | 182,531 | 182,531 | ||||||||||||||||||||||||
5.875% Senior Notes due 2023 (1) | 2 | 348,700 | 371,000 | 348,133 | 378,669 | ||||||||||||||||||||||||
5.625% Senior Notes due 2024 (1) | 2 | 348,295 | 375,830 | 347,756 | 379,453 | ||||||||||||||||||||||||
5.875% Senior Notes due 2027 (1) | 2 | 494,974 | 566,650 | 494,192 | 548,870 | ||||||||||||||||||||||||
6.625% Senior Notes due 2027 (1) | 2 | 320,915 | 324,240 | 0 | 0 | ||||||||||||||||||||||||
5.750% Senior Notes due 2028 (1) | 2 | 445,555 | 509,625 | 444,927 | 491,913 | ||||||||||||||||||||||||
5.125% Senior Notes due 2030 (1) | 2 | 493,926 | 560,000 | 0 | 0 | ||||||||||||||||||||||||
| (Dollars in thousands) | For the Year Ended December 31, | ||||||||||||||||
| Description: | Level in Fair Value Hierarchy | 2020 | 2019 | ||||||||||||||
| Inventories | 3 | 22,556 | 16,509 | ||||||||||||||
(Dollars in thousands) |
| Level in Fair |
|
| As of |
|
| As of |
| |||
Description: |
|
|
|
|
|
|
|
|
| |||
Real estate inventories |
|
| 3 |
|
|
| 19,263 |
|
|
| 48,360 |
|
|
| Year Ended December 31, |
| |||||||||
(Dollars in thousands) |
| 2023 |
|
| 2022 |
|
| 2021 |
| |||
Current: |
|
|
|
|
|
|
|
|
| |||
Federal |
| $ | 196,464 |
|
| $ | 203,119 |
|
| $ | 73,087 |
|
State |
|
| 51,009 |
|
|
| 48,134 |
|
|
| 23,493 |
|
Current tax provision |
| $ | 247,473 |
|
| $ | 251,253 |
|
| $ | 96,580 |
|
Deferred: |
|
|
|
|
|
|
|
|
| |||
Federal |
| $ | (1,003 | ) |
| $ | 66,667 |
|
| $ | 75,044 |
|
State |
|
| 1,627 |
|
|
| 18,508 |
|
|
| 9,117 |
|
Deferred tax provision |
| $ | 624 |
|
| $ | 85,175 |
|
| $ | 84,161 |
|
Total income tax provision |
| $ | 248,097 |
|
| $ | 336,428 |
|
| $ | 180,741 |
|
| Year Ended December 31, | |||||||||||||||||
| (Dollars in thousands) | 2020 | 2019 | 2018 | ||||||||||||||
| Domestic | $ | 74,590 | $ | 67,358 | $ | 37,731 | |||||||||||
| Foreign | 0 | 0 | 25,305 | ||||||||||||||
| Total income tax provision | $ | 74,590 | $ | 67,358 | $ | 63,036 | |||||||||||
| Current: | |||||||||||||||||
| Federal | $ | 11,621 | $ | 54,372 | $ | (10,568) | |||||||||||
| State | 11,733 | 9,839 | 4,104 | ||||||||||||||
| Foreign | 0 | 0 | 25,482 | ||||||||||||||
| Current tax provision | $ | 23,354 | $ | 64,211 | $ | 19,018 | |||||||||||
| Deferred: | |||||||||||||||||
| Federal | $ | 45,594 | $ | (1,811) | $ | 40,037 | |||||||||||
| State | 5,642 | 4,958 | 4,158 | ||||||||||||||
| Foreign | 0 | 0 | (177) | ||||||||||||||
| Deferred tax provision | $ | 51,236 | $ | 3,147 | $ | 44,018 | |||||||||||
| Total income tax provision | $ | 74,590 | $ | 67,358 | $ | 63,036 | |||||||||||
87
| Year Ended December 31, | |||||||||||||||||
| (Dollars in thousands) | 2020 | 2019 | 2018 | ||||||||||||||
| Domestic | $ | 324,117 | $ | 322,272 | $ | 271,017 | |||||||||||
| Foreign | 0 | 0 | 2,499 | ||||||||||||||
| Income before income taxes | $ | 324,117 | $ | 322,272 | $ | 273,516 | |||||||||||
|
| Year Ended December 31, |
| |||||||||
| 2023 |
|
| 2022 |
|
| 2021 |
| ||||
Tax at federal statutory rate |
|
| 21.0 | % |
|
| 21.0 | % |
|
| 21.0 | % |
State income taxes (net of federal benefit) |
|
| 4.1 |
|
| 3.9 |
|
|
| 3.8 |
| |
Non-controlling interest |
|
| (0.3 | ) |
| (0.1) |
|
|
| (0.6 | ) | |
Uncertain tax positions |
|
| — |
|
|
| — |
|
|
| (0.2 | ) |
Energy tax credits |
|
| (0.4 | ) |
|
| (1.3 | ) |
|
| (1.4 | ) |
Disallowed compensation expense |
|
| 0.6 |
|
|
| 0.4 |
|
|
| 0.2 |
|
Excess stock compensation benefit |
|
| (0.5 | ) |
|
| — |
|
|
| — |
|
Impact of CARES Act |
|
| — |
|
|
| — |
|
|
| (1.3 | ) |
Other |
|
| (0.1 | ) |
|
| 0.3 |
|
|
| (0.6 | ) |
Effective Rate |
|
| 24.4 | % |
|
| 24.2 | % |
|
| 20.9 | % |
| Year Ended December 31, | |||||||||||||||||
| 2020 | 2019 | 2018 | |||||||||||||||
| Tax at federal statutory rate | 21.0 | % | 21.0 | % | 21.0 | % | |||||||||||
| State income taxes (net of federal benefit) | 4.6 | 3.9 | 4.4 | ||||||||||||||
| Foreign income taxed at a different rate | 0 | 0 | 0.5 | ||||||||||||||
| Uncertain tax positions | (0.1) | (0.2) | (2.9) | ||||||||||||||
| Deferred tax adjustments | 0 | 0.2 | 0 | ||||||||||||||
| Energy tax credits | (2.9) | (4.6) | (1.7) | ||||||||||||||
| Subpart F dividend | 0 | 0 | 1.7 | ||||||||||||||
| Corporate reorganization/Canada unwind | 0 | 0 | 9.3 | ||||||||||||||
| Foreign tax credit | 0 | 0 | (2.4) | ||||||||||||||
| Disallowed compensation expense | 0.9 | 0.3 | (0.1) | ||||||||||||||
| Disallowed M&A expenses | 2.1 | 0 | 0 | ||||||||||||||
| Tax reform | 0 | 0 | (6.9) | ||||||||||||||
| Impact of CARES Act | (2.2) | 0 | 0 | ||||||||||||||
| Other | (0.4) | 0.3 | 0.1 | ||||||||||||||
| Effective Rate | 23.0 | % | 20.9 | % | 23.0 | % | |||||||||||
Our effective tax rate for the year ended December 31, 2019 included our provisional estimate2023 and 2022 was affected by a number of the energy credits we expected to obtain related to homes closed during 2018factors including state income taxes and 2019. On December 27, 2020, legislation was enacted making the energy efficient home credits available through 2021.
| Year Ended December 31, | |||||||||||
| (Dollars in thousands) | 2020 | 2019 | |||||||||
| Deferred tax assets: | |||||||||||
| Real estate inventory | $ | 91,499 | $ | 22,232 | |||||||
| Accruals and reserves | 47,536 | 39,029 | |||||||||
| Other | 22,914 | 15,827 | |||||||||
Net operating losses (1) | 87,940 | 69,815 | |||||||||
| Capital loss carryforward | 36,054 | 35,340 | |||||||||
| Total deferred tax assets | $ | 285,943 | $ | 182,243 | |||||||
| Deferred tax liabilities: | |||||||||||
| Real estate inventory, intangibles, other | (11,811) | (6,437) | |||||||||
| Valuation allowance | (36,054) | (35,340) | |||||||||
| Total net deferred tax assets | $ | 238,078 | $ | 140,466 | |||||||
|
| Year Ended December 31, |
| |||||
(Dollars in thousands) |
| 2023 |
|
| 2022 |
| ||
Deferred tax assets: |
|
|
|
|
|
| ||
Real estate inventory |
| $ | 41,660 |
|
| $ | 62,990 |
|
Accruals and reserves |
|
| 58,864 |
|
|
| 48,391 |
|
Other |
|
| — |
|
|
| 5,425 |
|
Net operating losses (1) |
|
| 54,845 |
|
|
| 62,150 |
|
Capital loss carryforward |
|
| — |
|
|
| 36,054 |
|
Total deferred tax assets |
| $ | 155,369 |
|
| $ | 215,010 |
|
Deferred tax liabilities: |
|
|
|
|
|
| ||
Real estate inventory, intangibles, other |
|
| (8,414 | ) |
|
| (10,632 | ) |
Valuation allowance |
|
| — |
|
|
| (36,054 | ) |
Other |
|
| (2,274 | ) |
|
| — |
|
Deferred income |
|
| (76,856 | ) |
|
| (100,668 | ) |
Total net deferred tax assets |
| $ | 67,825 |
|
| $ | 67,656 |
|
TAYLOR MORRISON HOME CORPORATION 10-K
88
ITEM 8 | FINANCIAL STATEMENTS AND SUPPLEMENTARY DATA
expire in 2026.2026. On an ongoing basis, we will continue to review all available evidence to determine if we expect to realize our deferred tax assets and federal and state NOL carryovers or if a valuation allowance is necessary.
We account for uncertain tax positions in accordance with ASC 740. ASC 740 requires a company to recognize the financial statement effect of a tax position when it is more likely than not based on the technical merits of the position that the position will be sustained upon examination. A tax position that meets the more-likely-than-not recognition threshold is measured to determine the amount of benefit to be recognized in the financial statements based upon the largest amount of benefit that is greater than 50% likely of being realized upon ultimate settlement with a taxing authority that has full knowledge of all relevant information. Our inabilityInterest and penalties related to determine thatuncertain tax positions are recognized as a component of income tax position meets the more-likely-than-not recognition threshold does not mean that the Internal Revenue Service (“IRS”) or any other taxing authority will disagree with the position thatexpense. We believe we have taken.
| Year Ending December 31, | |||||||||||||||||
| (Dollars in thousands) | 2020 | 2019 | 2018 | ||||||||||||||
| Beginning of the period | $ | 6,158 | $ | 7,391 | $ | 12,936 | |||||||||||
| Increases from current year acquisitions | 0 | 0 | 4,216 | ||||||||||||||
| Increases of prior year items | 0 | 15 | 475 | ||||||||||||||
| Settlement with tax authorities | 0 | (977) | 0 | ||||||||||||||
| Decreased for tax positions of prior years | 0 | (76) | (9,818) | ||||||||||||||
| Decreased due to statute of limitations | (396) | (195) | (418) | ||||||||||||||
| End of the period | $ | 5,762 | $ | 6,158 | $ | 7,391 | |||||||||||
As of December 31, 2020 were to be recognized,
We are currently under exam by the IRS for certain federal income tax returns for tax years 2015 through 2018 and subtracting the tax benefit associated with state taxes and interest. These amounts are included in income taxes payable and as a reduction to deferred tax assets in the Consolidated Balance Sheets at December 31, 2020 and December 31, 2019.
Year Ended December 31, | |||||||||||
| (Dollars in thousands) | 2020 | 2019 | |||||||||
| Amount available for repurchase — beginning of period | $ | 0 | $ | 57,437 | |||||||
Additional amount authorized for repurchase(1) | 200,000 | 100,000 | |||||||||
| Amount repurchased at cost, 5,941,324 and 8,389,348 shares as of December 31, 2020 and December 31, 2019, respectively | (103,332) | (157,437) | |||||||||
| Amount available for repurchase — end of period | $ | 96,668 | $ | 0 | |||||||
|
|
| ||||||
(Dollars in thousands) |
| 2023 |
|
| 2022 |
| ||
Amount available for repurchase — beginning of period |
| $ | 279,138 |
|
| $ | 230,413 |
|
Amount cancelled from expired or unused authorizations |
|
| (156,690 | ) |
|
| (75,000 | ) |
Additional amount authorized for repurchase(1) |
|
| 500,000 |
|
|
| 500,000 |
|
Amount repurchased (2,814,956 and 14,568,364 shares as of December 31, 2023 |
|
| (127,959 | ) |
|
| (376,275 | ) |
Amount available for repurchase — end of period |
| $ | 494,489 |
|
| $ | 279,138 |
|
TAYLOR MORRISON HOME CORPORATION 10-K
89
ITEM 8 2020 in addition to our Board| FINANCIAL STATEMENTS AND SUPPLEMENTARY DATA
The Inflation Reduction Act was enacted on August 16, 2022 and includes a one percent excise tax on the net repurchase of Director's authorization announced on February 28, 2020 for $100.0 million renewal of our stock repurchase program. The authorization from February 28, 2020company stock. This act was fully exhaustedeffective as of January 1, 2023 and did not have a material impact on our financial statements for the twelve months ended December 31, 2020.
The following table provides information regarding the amount and components of stock-based compensation expense, which is included in generalGeneral and administrative expenses in the Consolidated Statementsstatement of Operations:
| (Dollars in thousands) | Year Ended December 31, | ||||||||||||||||
| 2020 | 2019 | 2018 | |||||||||||||||
Restricted stock units (1) (2) | $ | 19,938 | $ | 10,989 | $ | 17,130 | |||||||||||
| Stock options | 7,085 | 3,774 | 3,994 | ||||||||||||||
| Total stock compensation | $ | 27,023 | $ | 14,763 | $ | 21,124 | |||||||||||
| Year Ended December 31, |
| ||||||||||
| 2023 |
|
| 2022 |
|
| 2021 |
| ||||
Restricted stock (1) |
| $ | 21,977 |
|
| $ | 22,464 |
|
| $ | 15,856 |
|
Stock options |
|
| 4,118 |
|
|
| 4,437 |
|
|
| 4,087 |
|
Total stock compensation |
| $ | 26,095 |
|
| $ | 26,901 |
|
| $ | 19,943 |
|
(2) Stock-based compensation expense in 2020 includes expense recognized for equity awards associated with the acquisition of WLH, which were converted from WLH to TMHC equity awards. An additional $5.1 million of stock based compensation expense relating to the accelerations of awards from the WLH acquisition were charged to Transaction and corporate reorganization expenses on the Consolidated Statement of Operations. Stock-based compensation expense in 2018 includes expense recognized for the acceleration of equity awards as part of the acquisition of AV Homes.
Stock Optionsoptions —Options granted to employees generally vest and become exercisable ratably on the first, second, third, and fourth anniversary of the date of grant. Options granted to members of the Board of Directors vest and become exercisable ratably on the first, second and third anniversary of the date of grant. Vesting of the options is subject to continued employment, with TMHC or continued service on the Board of Directors, through the applicable vesting dates, and options expire within ten years from the date of grant.
| Year Ended December 31, | |||||||||||||||||||||||||||||||||||
| 2020 | 2019 | 2018 | |||||||||||||||||||||||||||||||||
| Number of Options | Weighted Average Exercise/Grant Price | Number of Options | Weighted Average Exercise/Grant Price | Number of Options | Weighted Average Exercise/Grant Price | ||||||||||||||||||||||||||||||
| Outstanding, beginning | 3,339,244 | $ | 18.98 | 3,239,995 | $ | 18.87 | 2,854,213 | $ | 17.50 | ||||||||||||||||||||||||||
Granted(1) | 830,306 | 21.95 | 997,924 | 18.15 | 726,473 | 23.86 | |||||||||||||||||||||||||||||
Exercised(2) | (456,984) | 17.91 | (765,781) | 17.29 | (118,992) | 15.85 | |||||||||||||||||||||||||||||
Cancelled/forfeited(1) | (154,207) | 20.93 | (132,894) | 19.86 | (221,699) | 18.71 | |||||||||||||||||||||||||||||
| Balance, ending | 3,558,359 | $ | 19.73 | 3,339,244 | $ | 18.98 | 3,239,995 | $ | 18.87 | ||||||||||||||||||||||||||
| Options exercisable, at December 31, | 1,719,912 | $ | 18.73 | 1,400,974 | $ | 19.09 | 1,537,977 | $ | 18.80 | ||||||||||||||||||||||||||
|
| Year Ended December 31, |
| |||||||||||||||||||||
|
| 2023 |
|
| 2022 |
|
| 2021 |
| |||||||||||||||
|
| Number Of |
|
| Weighted Average Exercise/ Grant Price |
|
| Number Of |
|
| Weighted Average Exercise/ Grant Price |
|
| Number Of |
|
| Weighted Average Exercise/ Grant Price |
| ||||||
Outstanding, beginning |
|
| 3,273,258 |
|
| $ | 23.35 |
|
|
| 3,165,612 |
|
| $ | 22.02 |
|
|
| 3,772,775 |
|
| $ | 19.73 |
|
Granted(1) |
|
| 359,768 |
|
|
| 35.18 |
|
|
| 519,799 |
|
|
| 29.30 |
|
|
| 712,910 |
|
|
| 28.64 |
|
Exercised |
|
| (1,252,516 | ) |
|
| 21.07 |
|
|
| (323,625 | ) |
|
| 20.69 |
|
|
| (1,204,283 | ) |
|
| 19.37 |
|
Cancelled/forfeited(1) |
|
| (126,368 | ) |
|
| 28.29 |
|
|
| (88,528 | ) |
|
| 24.64 |
|
|
| (115,790 | ) |
|
| 21.53 |
|
Balance, ending |
|
| 2,254,142 |
|
| $ | 26.84 |
|
|
| 3,273,258 |
|
| $ | 23.35 |
|
|
| 3,165,612 |
|
| $ | 22.02 |
|
Options exercisable, |
|
| 1,133,734 |
|
| $ | 23.48 |
|
|
| 1,775,881 |
|
| $ | 20.50 |
|
|
| 1,407,618 |
|
| $ | 19.12 |
|
|
| As of December 31, |
| |||||||||
(Dollars in thousands) |
| 2023 |
|
| 2022 |
|
| 2021 |
| |||
Unamortized value of unvested stock options (net of estimated forfeitures) |
| $ | 7,861 |
|
| $ | 7,712 |
|
| $ | 7,515 |
|
Weighted-average period (in years) expense expected to be |
|
| 2.5 |
|
|
| 2.5 |
|
|
| 2.5 |
|
Weighted-average remaining contractual life (in years) for options |
|
| 6.4 |
|
|
| 6.6 |
|
|
| 7.0 |
|
Weighted-average remaining contractual life (in years) for options |
|
| 4.8 |
|
|
| 5.2 |
|
|
| 5.3 |
|
TAYLOR MORRISON HOME CORPORATION 10-K
90
(2)ITEM 8 Amount excludes 94,861 of options exercised relating to| FINANCIAL STATEMENTS AND SUPPLEMENTARY DATA
The following table summarizes the acquisition of WLH.
| As of December 31, | |||||||||||||||||
| (Dollars in thousands) | 2020 | 2019 | 2018 | ||||||||||||||
| Unamortized value of unvested stock options (net of estimated forfeitures) | $ | 6,847 | $ | 6,759 | $ | 6,470 | |||||||||||
| Weighted-average period (in years) that expense is expected to be recognized | 2.5 | 2.5 | 2.5 | ||||||||||||||
Weighted-average remaining contractual life (in years) for options outstanding(1) | 6.6 | 6.9 | 6.9 | ||||||||||||||
Weighted-average remaining contractual life (in years) for options exercisable(1) | 4.9 | 5.1 | 5.6 | ||||||||||||||
|
| Year Ended December 31, |
| |||||||||
| 2023 |
|
| 2022 |
|
| 2021 |
| ||||
Expected dividend yield |
|
| — | % |
|
| — | % |
|
| — | % |
Expected volatility(1) |
|
| 50.87 | % |
|
| 30.46 | % |
|
| 24.65 | % |
Risk-free interest rate(1) |
|
| 3.90 | % |
|
| 1.91 | % |
|
| 0.75 | % |
Expected term (in years)(1) |
|
| 6.25 |
|
|
| 6.25 |
|
|
| 6.25 |
|
Weighted average fair value of options granted during the period |
| $ | 14.50 |
|
| $ | 9.94 |
|
| $ | 7.45 |
|
| Year Ended December 31, | |||||||||||||||||
| 2020 | 2019 | 2018 | |||||||||||||||
| Expected dividend yield | 0% | 0% | 0% | ||||||||||||||
| Expected volatility | 24.19% | 19.33% | 21.31% | ||||||||||||||
| Risk-free interest rate | 1.19% | 2.49% | 2.68% | ||||||||||||||
| Expected term (in years) | 6.25 | 6.25 | 6.25 | ||||||||||||||
| Weighted average fair value of options granted during the period | $5.89 | $4.69 | $6.68 | ||||||||||||||
|
| As of December 31, |
| |||||||||
(Dollars in thousands) |
| 2023 |
|
| 2022 |
|
| 2021 |
| |||
Aggregate intrinsic value of options outstanding |
| $ | 59,758 |
|
| $ | 21,439 |
|
| $ | 38,190 |
|
Aggregate intrinsic value of options exercisable |
| $ | 33,861 |
|
| $ | 15,385 |
|
| $ | 18,897 |
|
| As of December 31, | |||||||||||||||||
| (Dollars in thousands) | 2020 | 2019 | 2018 | ||||||||||||||
| Aggregate intrinsic value of options outstanding | $ | 21,399 | $ | 10,935 | $ | 3,432 | |||||||||||
| Aggregate intrinsic value of options exercisable | $ | 11,903 | $ | 4,283 | $ | 1,540 | |||||||||||
Performance-Based Restricted Stock Units – – We issued PRSUs to certain employees of the Company. These awards will vest in full based on the achievement of certain performance goals over a threethree-year-year performance period, subject to the employee’s continued employment through the last date of the performance period and will be settled in shares of our Common Stock.common stock. The number of shares that may be issued in settlement of the PRSUs to the award recipients may be greater or lesser than the target award amount depending on actual performance achieved as compared to the performance targets set forth in the awards.
|
| Year Ended December 31, |
| |||||||||
| 2023 |
|
| 2022 |
|
| 2021 |
| ||||
Balance, beginning |
|
| 802,379 |
|
|
| 926,193 |
|
|
| 930,633 |
|
Granted |
|
| 229,164 |
|
|
| 272,716 |
|
|
| 289,308 |
|
Vested |
|
| (245,306 | ) |
|
| (380,632 | ) |
|
| (275,286 | ) |
Forfeited |
|
| (62,114 | ) |
|
| (15,898 | ) |
|
| (18,462 | ) |
Balance, ending |
|
| 724,123 |
|
|
| 802,379 |
|
|
| 926,193 |
|
|
| Year Ended December 31, |
| |||||||||
(Dollars in thousands): |
| 2023 |
|
| 2022 |
|
| 2021 |
| |||
PRSU expense recognized |
| $ | 12,619 |
|
| $ | 12,642 |
|
| $ | 8,125 |
|
Unamortized value of PRSUs |
| $ | 8,122 |
|
| $ | 8,911 |
|
| $ | 8,419 |
|
Weighted-average period expense is expected to be recognized (in years) |
|
| 1.8 |
|
|
| 1.8 |
|
|
| 1.8 |
|
| Year Ended December 31, | |||||||||||||||||
| 2020 | 2019 | 2018 | |||||||||||||||
| Balance, beginning | 998,639 | 1,155,723 | 1,190,740 | ||||||||||||||
| Granted | 295,405 | 416,874 | 338,472 | ||||||||||||||
| Vested | (319,732) | (511,984) | (61,343) | ||||||||||||||
| Forfeited | (43,679) | (61,974) | (312,146) | ||||||||||||||
| Balance, ending | 930,633 | 998,639 | 1,155,723 | ||||||||||||||
| Year Ended December 31, | |||||||||||||||||
| (Dollars in thousands): | 2020 | 2019 | 2018 | ||||||||||||||
| PRSU expense recognized | $ | 5,692 | $ | 5,866 | $ | 5,779 | |||||||||||
| Unamortized value of PRSUs | $ | 7,848 | $ | 7,912 | $ | 7,501 | |||||||||||
| Weighted-average period expense is expected to be recognized (in years) | 1.8 | 1.8 | 1.8 | ||||||||||||||
Non-Performance-Based Restricted Stock Units— Our RSUs consist of shares of our Common Stockcommon stock that have been awarded to our employees and members of our Board of Directors. Vesting of RSUs is subject to continued employment with TMHC or continued service on the Board of Directors, through the applicable vesting dates. Time-based RSUs granted to employees generally vest ratably over a three to four year period, based on the grant date.
TAYLOR MORRISON HOME CORPORATION 10-K
91
ITEM 8 | FINANCIAL STATEMENTS AND SUPPLEMENTARY DATA
Time-based RSUs granted to members of the Board of Directors generally vest on the first anniversary of the grant date.
| Year Ended December 31, | |||||||||||||||||||||||||||||||||||
| 2020 | 2019 | 2018 | |||||||||||||||||||||||||||||||||
| (Dollars in thousands except per share data): | Number of RSUs | Weighted Average Grant Date Fair Value | Number of RSUs | Weighted Average Grant Date Fair Value | Number of RSUs | Weighted Average Grant Date Fair Value | |||||||||||||||||||||||||||||
| Outstanding, beginning | 709,754 | $ | 18.11 | 769,641 | $ | 16.73 | 698,819 | $ | 15.65 | ||||||||||||||||||||||||||
| Granted | 437,262 | 23.07 | 299,481 | 18.42 | 333,397 | 20.35 | |||||||||||||||||||||||||||||
| Vested | (320,372) | 16.83 | (320,701) | 15.25 | (181,904) | 13.01 | |||||||||||||||||||||||||||||
| Forfeited | (52,483) | 19.65 | (38,667) | 16.91 | (80,671) | 16.90 | |||||||||||||||||||||||||||||
Balance, ending(1) | 774,161 | $ | 21.33 | 709,754 | $ | 18.11 | 769,641 | $ | 16.73 | ||||||||||||||||||||||||||
The balance as of December 31, 2020 excludes 107,111 unvested RSUs relating to the acquisition of WLH.
|
| Year Ended December 31, |
| |||||||||||||||||||||
|
| 2023 |
|
| 2022 |
|
| 2021 |
| |||||||||||||||
|
| Number Of |
|
| Weighted Average Grant Date Fair Value |
|
| Number Of |
|
| Weighted Average Grant Date Fair Value |
|
| Number Of |
|
| Weighted Average Grant Date Fair Value |
| ||||||
Outstanding, beginning |
|
| 814,834 |
|
| $ | 26.74 |
|
|
| 804,465 |
|
| $ | 24.73 |
|
|
| 881,272 |
|
| $ | 21.33 |
|
Granted |
|
| 297,317 |
|
|
| 35.96 |
|
|
| 359,993 |
|
|
| 29.04 |
|
|
| 370,762 |
|
|
| 28.62 |
|
Vested |
|
| (301,359 | ) |
|
| 27.52 |
|
|
| (319,595 | ) |
|
| 24.32 |
|
|
| (390,358 | ) |
|
| 21.28 |
|
Forfeited |
|
| (43,576 | ) |
|
| 29.81 |
|
|
| (30,029 | ) |
|
| 26.90 |
|
|
| (57,211 | ) |
|
| 23.68 |
|
Balance, ending |
|
| 767,216 |
|
| $ | 29.87 |
|
|
| 814,834 |
|
| $ | 26.74 |
|
|
| 804,465 |
|
| $ | 24.73 |
|
|
| Year Ended December 31, |
| |||||||||
(Dollars in thousands): |
| 2023 |
|
| 2022 |
|
| 2021 |
| |||
RSU expense recognized |
| $ | 9,357 |
|
| $ | 9,822 |
|
| $ | 7,731 |
|
Unamortized value of RSUs |
| $ | 10,496 |
|
| $ | 10,486 |
|
| $ | 10,561 |
|
Weighted-average period expense is expected to be recognized (in years) |
|
| 1.7 |
|
|
| 1.7 |
|
|
| 1.7 |
|
| Year Ended December 31, | |||||||||||||||||
| (Dollars in thousands): | 2020 | 2019 | 2018 | ||||||||||||||
RSU expense recognized(1) | $ | 7,116 | $ | 5,123 | $ | 4,854 | |||||||||||
Unamortized value of RSUs(1) | $ | 8,116 | $ | 6,176 | $ | 6,435 | |||||||||||
Weighted-average period expense is expected to be recognized (in years)(1) | 1.8 | 1.7 | 1.9 | ||||||||||||||
(1)RSUs relating to the WLH acquisition are excluded from the table above. As of December 31, 2020, we recognized $7.1 million of RSU expense and approximately $1.0 million remains unamortized and will be expensed through the first quarter of 2022.
| Year Ended December 31, | |||||||||||||||||||||||||||||||||||
| 2018 | |||||||||||||||||||||||||||||||||||
| Number of Awards | Weighted Average Grant Date Fair Value | ||||||||||||||||||||||||||||||||||
| Outstanding, beginning | 883,921 | $ | 5.24 | ||||||||||||||||||||||||||||||||
Exchanges (1) | (883,921) | 5.24 | |||||||||||||||||||||||||||||||||
| Forfeited | 0 | 0 | |||||||||||||||||||||||||||||||||
| Balance, ending | 0 | 0 | |||||||||||||||||||||||||||||||||
| Unvested TMM Units included in ending balance | 0 | 0 | |||||||||||||||||||||||||||||||||
| (Shares presented in thousands) | |||||||||||
| Closing date | Number of shares | Net purchase price per share | |||||||||
| January 8, 2018 | 11,000 | 26.05 | |||||||||
January 17,2018 (1) | 19,207 | 27.14 | |||||||||
East | Atlanta, Charlotte, Jacksonville, Naples, Orlando, Raleigh, Sarasota, and Tampa | |||||||
Central | Austin, Dallas, Denver, and Houston | |||||||
West | Bay Area, Las Vegas, Phoenix, Portland, Sacramento, Seattle, and Southern California | |||||||
Financial Services | Taylor Morrison Home Funding, Inspired Title Services, and Taylor Morrison Insurance Services |
Operating results for each segment may not be indicative of the results for such segment had it been an independent, stand-alone entity. Segment information is as follows:follows (in thousands):
TAYLOR MORRISON HOME CORPORATION 10-K
92
| Year Ended December 31, 2020 | |||||||||||||||||||||||||||||||||||
| (Dollars in thousands) | East | Central | West | Financial Services (1) | Corporate and Unallocated (2) | Total | |||||||||||||||||||||||||||||
| Total revenues | $ | 1,919,247 | $ | 1,633,428 | $ | 2,396,101 | $ | 155,827 | $ | 24,717 | $ | 6,129,320 | |||||||||||||||||||||||
| Gross margin | $ | 319,361 | $ | 306,158 | $ | 352,648 | $ | 66,918 | $ | (866) | $ | 1,044,219 | |||||||||||||||||||||||
| Selling, general and administrative expense | (160,222) | (132,796) | (165,682) | 0 | (113,675) | (572,375) | |||||||||||||||||||||||||||||
| Equity in income of unconsolidated entities | 0 | 23 | 683 | 10,470 | 0 | 11,176 | |||||||||||||||||||||||||||||
Interest and other expense, net (3) | (574) | (4,471) | (37,600) | (8,971) | (97,040) | (148,656) | |||||||||||||||||||||||||||||
| Loss on extinguishment of debt | 0 | 0 | 0 | 0 | (10,247) | (10,247) | |||||||||||||||||||||||||||||
| Income/(loss) before income taxes | $ | 158,565 | $ | 168,914 | $ | 150,049 | $ | 68,417 | $ | (221,828) | $ | 324,117 | |||||||||||||||||||||||
ITEM 8 | FINANCIAL STATEMENTS AND SUPPLEMENTARY DATA
| Year Ended December 31, 2023 |
| ||||||||||||||||||||||
| East |
|
| Central |
|
| West |
|
| Financial |
|
| Corporate |
|
| Total |
| |||||||
Total revenue |
| $ | 2,674,630 |
|
| $ | 1,964,265 |
|
| $ | 2,605,449 |
|
| $ | 160,312 |
|
| $ | 13,175 |
|
| $ | 7,417,831 |
|
|
|
|
|
|
|
|
|
|
|
|
|
|
|
|
|
|
| |||||||
Gross margin |
|
| 721,319 |
|
|
| 495,929 |
|
|
| 496,318 |
|
|
| 66,323 |
|
|
| 3,184 |
|
|
| 1,783,073 |
|
Selling, general and administrative expenses |
|
| (185,324 | ) |
|
| (158,807 | ) |
|
| (178,828 | ) |
|
| — |
|
|
| (175,748 | ) |
|
| (698,707 | ) |
Net income/(loss) from unconsolidated entities |
|
| — |
|
|
| (98 | ) |
|
| (217 | ) |
|
| 9,148 |
|
|
| (76 | ) |
|
| 8,757 |
|
Interest and other (expense)/income, net(2) |
|
| (73,205 | ) |
|
| (7,608 | ) |
|
| 3,981 |
|
|
| — |
|
|
| 1,842 |
|
|
| (74,990 | ) |
Gain on extinguishment of debt, net |
|
| — |
|
|
| — |
|
|
| — |
|
|
| — |
|
|
| (295 | ) |
|
| (295 | ) |
Income/(loss) before income taxes |
| $ | 462,790 |
|
| $ | 329,416 |
|
| $ | 321,254 |
|
| $ | 75,471 |
|
| $ | (171,093 | ) |
| $ | 1,017,838 |
|
| Year Ended December 31, 2019 | |||||||||||||||||||||||||||||||||||
| (Dollars in thousands) | East | Central | West | Financial Services (1) | Corporate and Unallocated | Total | |||||||||||||||||||||||||||||
| Total revenues | $ | 1,950,742 | $ | 1,334,389 | $ | 1,384,113 | $ | 92,815 | $ | 0 | $ | 4,762,059 | |||||||||||||||||||||||
| Gross margin | $ | 307,893 | $ | 187,957 | $ | 286,511 | $ | 41,729 | $ | 0 | $ | 824,090 | |||||||||||||||||||||||
| Selling, general and administrative expense | (168,928) | (121,962) | (94,609) | 0 | (104,772) | (490,271) | |||||||||||||||||||||||||||||
| Equity in (loss)/income of unconsolidated entities | 0 | (215) | 3,562 | 6,021 | 141 | 9,509 | |||||||||||||||||||||||||||||
Interest and other expense, net (2) | (5,545) | (1,024) | (3,273) | 0 | (5,408) | (15,250) | |||||||||||||||||||||||||||||
| Loss on extinguishment of debt | 0 | 0 | 0 | 0 | (5,806) | (5,806) | |||||||||||||||||||||||||||||
| Income/(loss) before income taxes | $ | 133,420 | $ | 64,756 | $ | 192,191 | $ | 47,750 | $ | (115,845) | $ | 322,272 | |||||||||||||||||||||||
| Year Ended December 31, 2022 |
| ||||||||||||||||||||||
| East |
|
| Central |
|
| West |
|
| Financial |
|
| Corporate |
|
| Total |
| |||||||
Total revenue |
| $ | 2,739,759 |
|
| $ | 2,024,730 |
|
| $ | 3,228,853 |
|
| $ | 135,491 |
|
| $ | 96,084 |
|
| $ | 8,224,917 |
|
|
|
|
|
|
|
|
|
|
|
|
|
|
|
|
|
|
| |||||||
Gross margin |
|
| 718,223 |
|
|
| 493,006 |
|
|
| 791,944 |
|
|
| 51,531 |
|
|
| 37,662 |
|
|
| 2,092,366 |
|
Selling, general and administrative expenses |
|
| (180,177 | ) |
|
| (137,824 | ) |
|
| (167,751 | ) |
|
| - |
|
|
| (157,460 | ) |
|
| (643,212 | ) |
Net income/(loss) from unconsolidated entities |
|
| - |
|
|
| (55 | ) |
|
| (18,445 | ) |
|
| 5,271 |
|
|
| (955 | ) |
|
| (14,184 | ) |
Interest and other (expense)/income, net(2) |
|
| (6,725 | ) |
|
| (10,364 | ) |
|
| (23,881 | ) |
|
| - |
|
|
| (15,201 | ) |
|
| (56,171 | ) |
Gain on extinguishment of debt, net |
|
| - |
|
|
| - |
|
|
| - |
|
|
| - |
|
|
| 13,876 |
|
|
| 13,876 |
|
Income/(loss) before income taxes |
| $ | 531,321 |
|
| $ | 344,763 |
|
| $ | 581,867 |
|
| $ | 56,802 |
|
| $ | (122,078 | ) |
| $ | 1,392,675 |
|
| Year Ended December 31, 2021 |
| ||||||||||||||||||||||
| East |
|
| Central |
|
| West |
|
| Financial |
|
| Corporate |
|
| Total |
| |||||||
Total revenue |
| $ | 2,423,948 |
|
| $ | 1,741,689 |
|
| $ | 3,126,621 |
|
| $ | 164,615 |
|
| $ | 44,392 |
|
| $ | 7,501,265 |
|
|
|
|
|
|
|
|
|
|
|
|
|
|
|
|
|
|
| |||||||
Gross margin |
|
| 522,721 |
|
|
| 336,896 |
|
|
| 614,130 |
|
|
| 62,767 |
|
|
| 11,367 |
|
|
| 1,547,881 |
|
Selling, general and administrative expenses |
|
| (184,744 | ) |
|
| (133,991 | ) |
|
| (187,515 | ) |
|
| — |
|
|
| (162,092 | ) |
|
| (668,342 | ) |
Net income/(loss) from unconsolidated entities |
|
| — |
|
|
| 306 |
|
|
| 2,190 |
|
|
| 8,644 |
|
|
| (10 | ) |
|
| 11,130 |
|
Interest and other (expense)/income, net(2) |
|
| (923 | ) |
|
| (3,103 | ) |
|
| (7,228 | ) |
|
| — |
|
|
| (16,307 | ) |
|
| (27,561 | ) |
Income/(loss) before income taxes |
| $ | 337,054 |
|
| $ | 200,108 |
|
| $ | 421,577 |
|
| $ | 71,411 |
|
| $ | (167,042 | ) |
| $ | 863,108 |
|
| Year Ended December 31, 2018 | |||||||||||||||||||||||||||||||||||
| (Dollars in thousands) | East | Central | West | Financial Services (1) | Corporate and Unallocated | Total | |||||||||||||||||||||||||||||
| Total revenues | $ | 1,666,423 | $ | 1,139,622 | $ | 1,353,590 | $ | 67,758 | $ | 0 | $ | 4,227,393 | |||||||||||||||||||||||
| Gross margin | $ | 281,306 | $ | 161,323 | $ | 269,276 | $ | 26,289 | $ | (1) | $ | 738,193 | |||||||||||||||||||||||
| Selling, general and administrative expense | (138,720) | (104,295) | (82,940) | 0 | (90,988) | (416,943) | |||||||||||||||||||||||||||||
| Equity in income of unconsolidated entities | 464 | 876 | 6,450 | 5,316 | 226 | 13,332 | |||||||||||||||||||||||||||||
Interest and other expense, net (2) | (5,615) | (3,259) | (526) | 0 | (51,666) | (61,066) | |||||||||||||||||||||||||||||
| Income/(loss) before income taxes | $ | 137,435 | $ | 54,645 | $ | 192,260 | $ | 31,605 | $ | (142,429) | $ | 273,516 | |||||||||||||||||||||||
| As of December 31, 2023 |
| ||||||||||||||||||||||
| East |
|
| Central |
|
| West |
|
| Financial Services |
|
| Corporate |
|
| Total |
| |||||||
Real estate inventory and land deposits |
| $ | 1,909,084 |
|
| $ | 1,181,014 |
|
| $ | 2,658,565 |
|
| $ | — |
|
| $ | — |
|
| $ | 5,748,663 |
|
Investments in unconsolidated entities |
|
| 63,628 |
|
|
| 125,610 |
|
|
| 88,219 |
|
|
| 5,483 |
|
|
| 63,252 |
|
|
| 346,192 |
|
Other assets |
|
| 177,739 |
|
|
| 214,685 |
|
|
| 616,210 |
|
|
| 298,451 |
|
|
| 1,270,147 |
|
|
| 2,577,232 |
|
Total assets |
| $ | 2,150,451 |
|
| $ | 1,521,309 |
|
| $ | 3,362,994 |
|
| $ | 303,934 |
|
| $ | 1,333,399 |
|
| $ | 8,672,087 |
|
| As of December 31, 2020 | |||||||||||||||||||||||||||||||||||||||||
| (Dollars in thousands) | East | Central | West | Financial Services | Corporate and Unallocated(1) | Total | |||||||||||||||||||||||||||||||||||
| Real estate inventory and land deposits | $ | 1,712,852 | $ | 1,176,604 | $ | 2,568,595 | $ | 0 | $ | 0 | $ | 5,458,051 | |||||||||||||||||||||||||||||
| Investments in unconsolidated entities | 0 | 58,052 | 65,395 | 4,498 | 10 | 127,955 | |||||||||||||||||||||||||||||||||||
| Other assets | 170,382 | 192,981 | 578,231 | 284,265 | 926,130 | 2,151,989 | |||||||||||||||||||||||||||||||||||
| Total assets | $ | 1,883,234 | $ | 1,427,637 | $ | 3,212,221 | $ | 288,763 | $ | 926,140 | $ | 7,737,995 | |||||||||||||||||||||||||||||
(1) Includes the assets from our Build-To-Rent and Urban Form operations. | |||||||||||||||||||||||||||||||||||||||||
| As of December 31, 2019 | |||||||||||||||||||||||||||||||||||||||||
| (Dollars in thousands) | East | Central | West | Financial Services | Corporate and Unallocated | Total | |||||||||||||||||||||||||||||||||||
| Real estate inventory and land deposits | $ | 1,841,904 | $ | 965,039 | $ | 1,219,411 | $ | 0 | $ | 0 | $ | 4,026,354 | |||||||||||||||||||||||||||||
| Investments in unconsolidated entities | 0 | 37,506 | 86,996 | 4,015 | 242 | 128,759 | |||||||||||||||||||||||||||||||||||
| Other assets | 165,777 | 121,724 | 60,060 | 257,760 | 485,252 | 1,090,573 | |||||||||||||||||||||||||||||||||||
| Total assets | $ | 2,007,681 | $ | 1,124,269 | $ | 1,366,467 | $ | 261,775 | $ | 485,494 | $ | 5,245,686 | |||||||||||||||||||||||||||||
| As of December 31, 2018 | |||||||||||||||||||||||||||||||||||||||||
| (Dollars in thousands) | East | Central | West | Financial Services | Corporate and Unallocated | Total | |||||||||||||||||||||||||||||||||||
| Real estate inventory and land deposits | $ | 1,862,756 | $ | 1,011,659 | $ | 1,164,079 | $ | 0 | $ | 0 | $ | 4,038,494 | |||||||||||||||||||||||||||||
| Investments in unconsolidated entities | 0 | 35,476 | 100,693 | 4,015 | 357 | 140,541 | |||||||||||||||||||||||||||||||||||
| Other assets | 162,339 | 118,187 | 55,433 | 236,291 | 513,156 | 1,085,406 | |||||||||||||||||||||||||||||||||||
| Total assets | $ | 2,025,095 | $ | 1,165,322 | $ | 1,320,205 | $ | 240,306 | $ | 513,513 | $ | 5,264,441 | |||||||||||||||||||||||||||||
:
| As of December 31, 2022 |
| ||||||||||||||||||||||
| East |
|
| Central |
|
| West |
|
| Financial |
|
| Corporate |
|
| Total |
| |||||||
Real estate inventory and land deposits |
| $ | 1,820,765 |
|
| $ | 1,359,805 |
|
| $ | 2,453,662 |
|
| $ | — |
|
| $ | — |
|
| $ | 5,634,232 |
|
Investments in unconsolidated entities |
|
| 46,629 |
|
|
| 104,070 |
|
|
| 80,310 |
|
|
| 5,283 |
|
|
| 46,608 |
|
|
| 282,900 |
|
Other assets |
|
| 216,816 |
|
|
| 251,727 |
|
|
| 613,029 |
|
|
| 431,535 |
|
|
| 1,040,485 |
|
|
| 2,553,592 |
|
Total assets |
| $ | 2,084,210 |
|
| $ | 1,715,602 |
|
| $ | 3,147,001 |
|
| $ | 436,818 |
|
| $ | 1,087,093 |
|
| $ | 8,470,724 |
|
TAYLOR MORRISON HOME CORPORATION 10-K
93
| (Dollars in thousands except per share data) | First Quarter 2020 | Second Quarter 2020 | Third Quarter 2020 | Fourth Quarter 2020 | |||||||||||||||||||
| Total revenues | $ | 1,345,699 | $ | 1,526,685 | $ | 1,699,434 | $ | 1,557,502 | |||||||||||||||
| Gross margin | 197,756 | 244,178 | 309,689 | 292,596 | |||||||||||||||||||
| (Loss)/income before income taxes | (28,775) | 84,844 | 148,958 | 119,090 | |||||||||||||||||||
Net (loss)/income before allocation to non-controlling interests | (29,556) | 67,222 | 115,199 | 96,662 | |||||||||||||||||||
| Net (loss)/income available to Taylor Morrison Home Corporation | (31,431) | 65,674 | 114,777 | 94,419 | |||||||||||||||||||
| Basic (loss)/earnings per share | $ | (0.26) | $ | 0.51 | $ | 0.88 | $ | 0.73 | |||||||||||||||
| Diluted (loss)/earnings per share | $ | (0.26) | $ | 0.50 | $ | 0.87 | $ | 0.72 | |||||||||||||||
| (Dollars in thousands except per share data) | First Quarter 2019 | Second Quarter 2019 | Third Quarter 2019 | Fourth Quarter 2019 | |||||||||||||||||||
| Total revenues | $ | 925,092 | $ | 1,265,426 | $ | 1,105,105 | $ | 1,466,436 | |||||||||||||||
| Gross margin | 172,040 | 233,774 | 211,074 | 207,202 | |||||||||||||||||||
| Income before income taxes | 68,072 | 110,019 | 90,421 | 53,760 | |||||||||||||||||||
| Net income before allocation to non-controlling interests | 51,281 | 81,888 | 67,036 | 54,709 | |||||||||||||||||||
| Net income available to Taylor Morrison Home Corporation | 51,131 | 81,851 | 67,012 | 54,658 | |||||||||||||||||||
| Basic earnings per share | $ | 0.46 | $ | 0.77 | $ | 0.64 | $ | 0.52 | |||||||||||||||
| Diluted earnings per share | $ | 0.46 | $ | 0.76 | $ | 0.63 | $ | 0.51 | |||||||||||||||
| As of December 31, 2021 |
| ||||||||||||||||||||||
| East |
|
| Central |
|
| West |
|
| Financial |
|
| Corporate |
|
| Total |
| |||||||
Real estate inventory and land deposits |
| $ | 1,781,948 |
|
| $ | 1,282,024 |
|
| $ | 2,665,084 |
|
| $ | — |
|
| $ | — |
|
| $ | 5,729,056 |
|
Investments in unconsolidated entities |
|
| — |
|
|
| 87,600 |
|
|
| 79,531 |
|
|
| 4,275 |
|
|
| — |
|
|
| 171,406 |
|
Other assets |
|
| 196,126 |
|
|
| 221,906 |
|
|
| 588,520 |
|
|
| 559,233 |
|
|
| 1,261,530 |
|
|
| 2,827,315 |
|
Total assets |
| $ | 1,978,074 |
|
| $ | 1,591,530 |
|
| $ | 3,333,135 |
|
| $ | 563,508 |
|
| $ | 1,261,530 |
|
| $ | 8,727,777 |
|
Letters of Credit and Surety Bonds— We are committed, under various letters of credit and surety bonds, to perform certain development and construction activities and provide certain guarantees in the normal course of business. Outstanding letters of credit and surety bonds under these arrangements totaled $981.8 million$1.3 billion and $623.3 million as of$1.2 billion at December 31, 20202023 and 2019,December 31, 2022, respectively. Although significant development and construction activities have been completed related to these site improvements, the bonds are generally not released until all development and construction activities are completed. We do not believe that it is probable that any outstanding bonds as of December 31, 20202023 will be drawn upon.
Purchase Commitments— We are subject to the usual obligations associated with entering into contracts (including land option contracts and land banking arrangements) for the purchase, development, and sale of real estate in the routine conduct of itsour business. We have a number of land purchase option contracts and land banking agreements, generally through cash deposits, for the right to purchase land or lots at a future point in time with predetermined terms. We do not have title to the property and the creditors generally have no recourse. Our obligations with respect to such contracts are generally limited to the forfeiture of the related non-refundable cash deposits. At both December 31, 20202023 and 2019,2022, the aggregate purchase price of these contracts was $760.4 million and $289.7 million respectively.$
Legal Proceedings— We are involved in various litigation and legal claims in the normal course of business, including actions brought on behalf of various classes of claimants. We are also subject to a variety of local, state, and federal laws and regulations related to land development activities, house construction standards, sales practices, mortgage lending
On April 26, 2017, a class action complaint was filed in the Circuit Court of the Tenth Judicial Circuit in and for Polk County, Florida by Norman Gundel, William Mann, and Brenda Taylor against Avatar Properties, Inc., (an acquired AV Homes entity) ("Avatar"), generally alleging that our collection of club membership fees in connection with the use of one of our amenities in our East homebuilding segment violates various laws relating to homeowner associations and other Florida-specific laws (the "Solivita litigation"). The class action complaint sought an injunction to prohibit future collection of club membership fees. On November 2, 2021, the court determined that the club membership fees
ITEM 8 | FINANCIAL STATEMENTS AND SUPPLEMENTARY DATA
were improper and that plaintiffs were entitled to $35.0 million in fee reimbursements. We appealed the court’s ruling to the Sixth District Court of Appeal on November 29, 2021, and the plaintiffs agreed to continue to pay club membership fees pending the outcome of the appeal. On June 23, 2023 the District Court affirmed the trial court judgment in a split decision, with three separate opinions. Recognizing the potential “far-reaching effects on homeowners associations throughout the State,” the District Court certified a question of great public importance to the Florida Supreme Court, and we filed a notice to invoke the discretionary review of the Florida Supreme Court. On November 2, 2023, the Florida Supreme Court declined to exercise jurisdiction.
Following the Florida Supreme Court’s decision, we paid $64.7 million to the plaintiffs during the quarter ended December 31, 2023, which includes the amount of the trial court’s judgment, club membership fees received during the pendency of our appeal, pre-judgment interest and post-judgment interest. We expect to incur additional costs with respect to the plaintiff’s legal fees and costs; however, such amount cannot be reasonably estimated.
After reviewing our amenity arrangements in our Florida communities to determine whether such arrangements might subject the Company to liability in light of the outcome of the Solivita litigation described above, we identified one additional community with similar claims. On August 13, 2020, Slade Chelbian, a resident of our Bellalago community in Kissimmee, Florida, filed a purported class action suit against Avatar, AV Homes, Inc. and Taylor Morrison Home Corporation in the Circuit Court of the Ninth Circuit in and for Osceola County, Florida, generally alleging that Avatar cannot earn profits from community members for use of club amenities where membership in the club is mandatory for all residents and failure to pay club membership fees could result in the foreclosure of their homes by Avatar. On February 25, 2022, the court stayed the action pending the resolution of the Solivita litigation. There is currently no class action certification in this claim and there has been no change in the status of the claim since the November 2, 2023 Supreme Court decision in the Solivita litigation. While the ultimate outcome and the costs associated with litigation are inherently uncertain and difficult to predict, management has recorded a reserve based on management’s best estimate of losses related to the resolution of this matter, which is reflected in our legal accruals as of December 31, 2023.
| As of | ||||||||||||||||||||||||||
| December 31, 2020 | December 31, 2019 | |||||||||||||||||||||||||
| (Dollars in thousands) | Fair Value | Notional Amount(1) | Fair Value | Notional Amount(1) | ||||||||||||||||||||||
| IRLCs | $ | 5,294 | $ | 260,954 | $ | 2,099 | $ | 86,434 | ||||||||||||||||||
| MBSs | (1,847) | 376,000 | (167) | 158,000 | ||||||||||||||||||||||
| Total, net | $ | 3,447 | $ | 1,932 | ||||||||||||||||||||||
| As of |
| ||||||||||||||
| December 31, 2023 |
|
| December 31, 2022 |
| |||||||||||
(Dollars in thousands) |
| Fair Value |
|
| Notional Amount (1) |
|
| Fair Value |
|
| Notional Amount (1) |
| ||||
IRLCs |
| $ | 1,489 |
|
| $ | 219,129 |
|
| $ | 2,386 |
|
| $ | 375,030 |
|
MBSs |
|
| (5,055 | ) |
|
| 285,000 |
|
|
| 1,090 |
|
|
| 504,000 |
|
Total |
| $ | (3,566 | ) |
|
|
|
| $ | 3,476 |
|
|
|
| ||
95
ITEM 9 | | CHANGES IN AND DISAGREEMENTS WITH ACCOUNTANTS ON ACCOUNTING AND FINANCIAL DISCLOSURE |
ITEM 9.9 | CHANGES IN AND DISAGREEMENTS WITH ACCOUNTANTS ON ACCOUNTING AND FINANCIAL DISCLOSURE
As of the end of the period covered by this Form 10-K, we carried out an evaluation, under the supervision and with the participation of our principal executive officer, principal financial officer and principal accounting officer, of the effectiveness of the design and operation of our disclosure controls and procedures (as such term is defined in Rules 13a-15(e) and 15d-15(e) under the Exchange Act). Based on this evaluation as of December 31, 2020,2023, our principal executive officer, principal financial officer and principal accounting officer concluded that our disclosure controls and procedures were effective in alerting them in a timely manner to material information required to be disclosed in our periodic reports filed or submitted with the SEC. The scope of management’s assessment of the effectiveness of the Company’s disclosure controls and procedures did not include the internal controls over financial reporting of WLH, which was acquired on February 6, 2020 and represented
30.4% of the Company's consolidated total assets and 24.7% of the Company's consolidated homebuilding revenues as of and for the year ended December 31, 2020.
In order to ensure that the Company’s internal control over financial reporting is effective, management regularly assesses such controls and did so most recently for its financial reporting as of December 31, 2020.2023. Management’s assessment was based on criteria for effective internal control over financial reporting described in Internal Control – Integrated Framework (2013) issued by the Committee of Sponsoring Organizations of the Treadway Commission (2013 Framework). Consistent with guidance issued by the SEC that an assessment of a recently acquired business may be omitted from management's report on internal control over financial reporting, management excluded an assessment of the effectiveness of the Company's internal control over financial reporting related to WLH, as described above. Based on its assessment, management concluded that the Company'sCompany’s internal control over financial reporting was effective as of December 31, 2020.2023.
Changes in Internal Control over Financial Reporting
TAYLOR MORRISON HOME CORPORATION 10-K
96
Report of Independent Registered Public Accounting Firm
To the Stockholders and the Board of Directors of Taylor Morrison Home Corporation
Opinion on Internal Control over Financial Reporting
We have audited the internal control over financial reporting of Taylor Morrison Home Corporation and subsidiaries (the “Company”) as of December 31, 2020,2023, based on criteria established in Internal Control — Integrated Framework (2013) issued by the Committee of Sponsoring Organizations of the Treadway Commission (COSO). In our opinion, the Company maintained, in all material respects, effective internal control over financial reporting as of December 31, 2020,2023, based on criteria established in Internal Control — Integrated Framework (2013) issued by COSO.
We have also audited, in accordance with the standards of the Public Company Accounting Oversight Board (United States) (PCAOB), the consolidated financial statements as of and for the year ended December 31, 2020,2023, of the Company and our report dated February 24, 2021,21, 2024, expressed an unqualified opinion on those financial statements.
The Company’s management is responsible for maintaining effective internal control over financial reporting and for its assessment of the effectiveness of internal control over financial reporting, included in the accompanying Management’sManagement's Annual Report on Internal Control over Financial Reporting.Reporting. Our responsibility is to express an opinion on the Company’s internal control over financial reporting based on our audit. We are a public accounting firm registered with the PCAOB and are
We conducted our audit in accordance with the standards of the PCAOB. Those standards require that we plan and perform the audit to obtain reasonable assurance about whether effective internal control over financial reporting was maintained in all material respects. Our audit included obtaining an understanding of internal control over financial reporting, assessing the risk that a material weakness exists, testing and evaluating the design and operating effectiveness of internal control based on the assessed risk, and performing such other procedures as we considered necessary in the circumstances. We believe that our audit provides a reasonable basis for our opinion.
Because of its inherent limitations, internal control over financial reporting may not prevent or detect misstatements. Also, projections of any evaluation of effectiveness to future periods are subject to the risk that controls may become inadequate because of changes in conditions, or that the degree of compliance with the policies or procedures may deteriorate.
February 24, 202121, 2024
TAYLOR MORRISON HOME CORPORATION 10-K
97
ITEM 9B | OTHER INFORMATION
During the three months ended December 31, 2023, none of the Company’s other directors or officers (as defined in Rule 16a-1(f) of the Securities Exchange Act of 1934) adopted, terminated or modified a Rule 10b5-1 trading arrangement or non-Rule 10b5-1 trading arrangement (as such terms are defined in Item 408 of Regulation S-K).
ITEM 9C | DISCLOSURE REGARDING FOREIGN JURISDICTIONS THAT PREVENT INSPECTIONS
Not applicable.
98
Part III | |||||||
100 | ITEM 10. | ||||||
100 | ITEM 11. | ||||||
100 | ITEM 12. | Security Ownership of Certain Beneficial Owners and Management and Related Stockholder Matters | |||||
101 | ITEM 13. | Certain Relationships and Related Transactions, and Director Independence | |||||
101 | ITEM 14. | ||||||
| |||||||
ITEM 10. 10 | DIRECTORS, EXECUTIVE OFFICERS AND CORPORATE GOVERNANCE
The information required by Items 401, 405, 406 and 407(c)(3), (d)(4), and (d)(5) of Regulation S-K will be set forth in our 20212024 Annual Meeting Proxy Statement, which will be filed with the Securities and Exchange Commission not later than 120 days after December 31, 20202023 (the “Proxy Statement”). For the limited purpose of providing the information necessary to comply with this Item 10, the Proxy Statement is incorporated herein by this reference. All references to the Proxy Statement in this Part III are exclusive of the information set forth under the captions “Compensation Committee Report” and “Audit Committee Report.”
| Plan Category | Number of securities to be issued upon exercise of outstanding options, warrants and rights (a) | Weighted-average exercise price of outstanding options, warrants and rights (b) | Number of securities remaining available for future issuance under equity compensation plans (excluding securities reflected in column (a)) (c) | |||||||||||||||||||||||
Equity compensation plans approved by security holders(1) | 5,263,153 | (2) | $ | 19.73 | (3) | 5,838,497 | (4) | |||||||||||||||||||
| Equity compensation plans not approved by security holders | — | — | — | |||||||||||||||||||||||
Plan Category |
| Number Of Securities To Be Issued Upon Exercise Of Outstanding Options, Warrants And Rights (A) |
| Weighted- Average Exercise Price Of Outstanding Options, Warrants And Rights (B) |
| Number Of Securities Remaining Available For Future Issuance Under Equity Compensation Plans (Excluding Securities Reflected In Column (A)) (C) | ||||||||||||
Equity compensation plans approved by |
|
|
| 3,745,481 |
| (2) |
|
| $ | 26.84 |
| (3) |
|
|
| 5,116,214 |
| (4) |
Equity compensation plans not approved |
|
|
| — |
|
|
|
|
| — |
|
|
|
|
| — |
|
|
TAYLOR MORRISON HOME CORPORATION 10-K
100
ITEM 12 | | SECURITY OWNERSHIP OF CERTAIN BENEFICIAL OWNERS AND MANAGEMENT AND RELATED STOCKHOLDER MATTERS |
ITEM 13.13 | CERTAIN RELATIONSHIPS AND RELATED TRANSACTIONS, AND DIRECTOR INDEPENDENCE
This information required by Item 9(e) of Schedule 14A will be set forth in the Proxy Statement. For the limited purpose of providing the information necessary to comply with this Item 14, the Proxy Statement is incorporated herein by this reference.
TAYLOR MORRISON HOME CORPORATION 10-K
101
Part IV | |||||||
103 | Item 15. | ||||||
106 | Item 16. | ||||||
| |||||||
STATEMENT SCHEDULES
TAYLOR MORRISON HOME CORPORATION 10-K
103
ITEM 15 | EXHIBITS AND FINANCIAL STATEMENT SCHEDULES
| ||||||||
| ||||||||
| ||||||||
TAYLOR MORRISON HOME CORPORATION 10-K
104
ITEM 15 | EXHIBITS AND FINANCIAL STATEMENT SCHEDULES
TAYLOR MORRISON HOME CORPORATION 10-K
105
| ||||||||
** Furnished herewith.
† Management contract or compensatory plan in which directors and/or executive officers are eligible to participate.
The agreements and other documents filed as exhibits to this report are not intended to provide factual information or other disclosure other than with respect to the terms of the agreements or other documents themselves, and you should not rely on them for that purpose. In particular, any representations and warranties made by us in these agreements or other documents were made solely within the specific context of the relevant agreement or document and may not describe the actual state of affairs as of the date they were made or at any other time.
None.
SIGNATURES
|
| TAYLOR MORRISON HOME CORPORATION | ||||||||||||
|
| Registrant | ||||||||||||
DATE: February |
|
| ||||||||||||
|
| /s/ Sheryl D. Palmer | ||||||||||||
|
| Sheryl D. Palmer | ||||||||||||
|
| Chairman of the Board of Directors and Chief Executive Officer | ||||||||||||
(Principal Executive Officer) | ||||||||||||||
|
| /s/ | ||||||||||||
|
|
| Curt VanHyfte | |||||||||||
|
| Executive Vice President and Chief Financial Officer | ||||||||||||
(Principal Financial Officer) | ||||||||||||||
|
| /s/ Joseph Terracciano | ||||||||||||
|
| Joseph Terracciano | ||||||||||||
|
| Chief Accounting Officer (Principal Accounting Officer) | ||||||||||||
KNOW ALL MEN BY THESE PRESENTS, that each person whose signature appears below constitutes and appoints Sheryl D. Palmer, C. David Cone and Darrell C. Sherman, and each of them, his or her true and lawful attorneys-in-fact and agents, with full power of substitution and re-substitution, for him or her and in his or her name, place and stead, in any and all capacities, to sign any and all amendments to this Annual Report on Form 10-K, and to file the same, with all exhibits thereto and other documents in connection therewith the Securities and Exchange Commission, granting unto said attorneys-in-fact and agents, and each of them, full power and authority to do and perform each and every act and thing requisite and necessary to be done in and about the premises, as fully and to all intents and purposes as he or she might or could do in person hereby ratifying and confirming all that said attorneys-in-fact and agents, or his or her substitute or substitutes, may lawfully do or cause to be done by virtue hereof.
SIGNATURE | TITLE | DATE | ||||||||||||
| ||||||||||||||
/s/ William H. Lyon |
|
| ||||||||||||
William H. Lyon | Director | February 21, 2024 | ||||||||||||
/s/ Peter Lane |
|
|
| |||||||||||
Peter Lane |
| Director | February 21, 2024 | |||||||||||
/s/ David Merritt |
|
|
| |||||||||||
David Merritt |
| Director | February 21, 2024 | |||||||||||
/s/ Anne L. Mariucci |
|
|
| |||||||||||
Anne L. Mariucci |
| Director | February 21, 2024 | |||||||||||
/s/ Andrea Owen |
|
|
| |||||||||||
Andrea Owen | Director | February 21, 2024 | ||||||||||||
/s/ Denise Warren |
|
|
| |||||||||||
Denise Warren | Director | February 21, 2024 | ||||||||||||
/s/ Christopher Yip | ||||||||||||||
Christopher Yip | Director | February 21, 2024 | ||||||||||||
TAYLOR MORRISON HOME CORPORATION 10-K
107


